Washington, D.C. 20549
Item 1. Reports to Stockholders.
| |
AEGIS Value Fund (AVALX) |
| |
| |
| |
| ANNUAL REPORT |
| AUGUST 31, 2012 |
| |
| |
| |
| |
| |
| |
| |
| |
| |
| |
| |
| |
| |
| |
| |
| |
| |
| |
| |
| |
| |
| |
| |
| |
| |
| |
| |
| |
| |
| |
| |
| |
| |
| |
| |
| |
| |
| |
Shareholders’ Letter
October 18, 2012
To the Shareholders of the Aegis Value Fund:
We are pleased to present the Aegis Value Fund’s Annual Report for the year ended August 31, 2012.
We take this opportunity to provide a brief overview of the objectives and strategy of the Fund.
The Aegis Value Fund seeks to achieve long-term, capital appreciation while minimizing risk of capital loss. Our strategy is to invest in a well-researched portfolio of small-cap equities trading at a fraction of their intrinsic worth. We believe the equity markets are often inefficient, and we employ a contrarian, company-focused approach, selecting each stock individually on its own merit. We purchase shares in companies when we judge share prices to be significantly undervalued relative to our assessment of fundamental value, focusing on stocks trading at low price-to-book or price-to- future cash flow ratios, segments of the market where academic research shows historical returns have significantly outpaced the overall market. We often invest in companies when they are misunderstood, out of favor, or neglected, and generally hold these companies until share prices reach our estimate of intrinsic value.
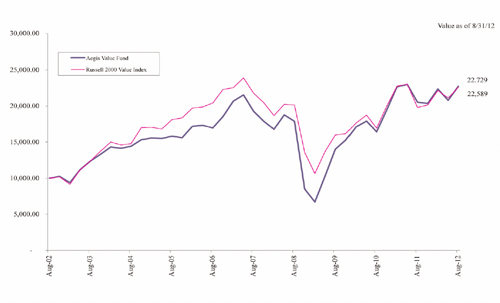
From inception of the Aegis Value Fund on May 15, 1998 through September 30, 2012, the Fund has posted a cumulative gain of 321.0 percent, compared to a cumulative gain of 155.8 percent in our primary small-cap benchmark, the Russell 2000 Value Index. During the same period, the Russell 2000 Index of small-cap stocks posted a cumulative gain of 114.0 percent, and the S&P 500 Index of large cap stocks posted a cumulative gain of 68.4 percent.*
For the year ended August 31, 2012, the Fund gained 10.6 percent, underperforming the Russell 2000 Value Index, which increased 14.1 percent. The Fund’s gains were driven by strong investment performance by the Fund’s holdings in energy companies such as Tesoro Corp., EPL Oil & Gas, Inc. and Hornbeck Offshore Services along with bank holding company BofI Holding, Inc., home furniture retailer Bassett Furniture Industries, Inc., and specialty chemicals maker American Pacific Corp. The Russell 2000 Index gained 13.4 percent while the S&P 500 Index gained 18.0 percent for the year ended August 31, 2012.*
*Aegis Value Fund’s one-year, three-year, five-year, ten-year and since inception (5/15/1998) average annual returns for the period ending September 30, 2012 are 31.2%, 16.1%, 4.6%, 9.5%, and 10.5% respectively. Returns include reinvestment of dividends and capital gains. Russell 2000 Value Index one-year, three-year, five-year, ten-year, and since inception (5/15/1998) average annual returns for the period ending September 30, 2012 are 32.6%, 11.7%, 1.4%, 9.7%, and 6.8%. S&P 500 Index one-year, three-year, five-year, ten-year, and since inception (5/15/1998) average annual returns for the period ending September 30, 2012 are 30.2%, 13.2%, 1.1%, 8.0%, and 3.7%. Russell 2000 Index one-year, three-year, five-year, ten-year, and since inception (5/15/1998) average annual returns for the period ending September 30, 2012 are 31.9%, 13.0%, 2.2%, 10.2%, and 5.4%. The Fund has an annualized gross expense ratio of 1.48% per its December 29, 2011 prospectus.
All historical performance returns shown in this shareholders’ letter for the Aegis Value Fund Inc. are pre-tax returns. This report does not constitute an offer or solicitation of any transaction in any securities. The Aegis Value Fund is offered by prospectus only.
Performance data quoted represents past performance. Past performance does not guarantee future results. Investment return and principal value of an investment will fluctuate so that an investor’s shares, when redeemed, may be worth more or less than their original cost. Current performance may be lower or higher than the performance data quoted. Please call 800-528-3780 to obtain performance data current to the most recent month-end.
For the most recent performance information, please call us directly at 800-528-3780 or consult your financial advisor. We strongly recommend that you read our second quarter 2012 and other quarterly manager’s letters, which provide additional commentary. For those of you who do not automatically receive our manager’s letter in the mail from your broker, it is available on our website at www.aegisvaluefund.com or by calling us at 800-528-3780. Please be aware that the manager’s letter is not a part of the SEC-mandated Annual Report contained in this booklet.
We look forward to the opportunity to serve as your investment partner in the coming year.
Aegis Financial Corporation
Scott L. Barbee, CFA
Managing Director, Portfolio Manager
Must be preceded or accompanied by Prospectus.
Any recommendation made in this report may not be suitable for all investors. This presentation does not constitute a solicitation or offer to purchase or sell any securities. Its use in connection with any offering of fund shares is authorized only in the case of a concurrent or prior delivery of a prospectus.
Mutual fund investing involves risk. Principal loss is possible. Investments in foreign securities involve greater volatility and political, economic and currency risks and differences in accounting methods. Investments in smaller companies involve additional risks such as limited liquidity and greater volatility. Value stocks may fall out of favor with investors and underperform growth stocks during given periods. Investments in Real Estate Investment Trusts (REITs) involve additional risks such as declines in the value of real estate and increased susceptibility to adverse economic or regulatory developments.
Russell 2000 Value Index: A market-capitalization weighted equity index maintained by the Russell Investment Group and based on the Russell 2000 Index, which measures how U.S. stocks in the equity value segment perform.
Russell 2000 Index: An index of approximately 2,000 of the smallest securities based on a combination of their market cap and current index membership, which measures the performance of the small-cap segment of the U.S. equity universe.
S&P 500 Index: An index of 500 stocks chosen for market size, liquidity and industry grouping, among other factors. The S&P 500 is designed to be a leading indicator of U.S. equities and is meant to reflect the risk/return characteristics of the large cap universe. One cannot invest directly in an index.
Price-to-Book: A ratio used to compare a stock’s market value to its book value. It is calculated by dividing the current closing price of the stock by the latest quarter’s book value per share.
Price-to-Future Cash Flow: A measure of the market’s expectations of a firm’s future financial health. Because this measure deals with cash flow, the effects of depreciation and other non-cash factors are removed.
An investment cannot be made directly in an index.
Fund holdings, sector allocations, and geographic allocations are subject to change and are not a recommendation to buy or sell any security. Please see the schedule of investments provided in this report for the complete listing of Fund holdings.
Fund Distributor: Quasar Distributors, LLC. Quasar Distributors, LLC is affiliated with U.S. Bancorp Fund Services, LLC.
Disclosure of Fund Expenses
August 31, 2012
(Unaudited)
As a shareholder of the Fund, you incur ongoing costs, including management fees and other Fund expenses. This example is intended to help you understand your ongoing costs (in dollars) of investing in the Fund and to compare these costs with ongoing costs of investing in other mutual funds. The example is based on an investment of $1,000 invested and held for the entire semi-annual period, March 1, 2012 – August 31, 2012.
Actual expenses
The table below provides information about actual account values and actual expenses.
| | | | | | | | | | | | Expenses Paid |
| | | Beginning | | Ending | | | | | During Period (2) |
| | | Account Value | | Account Value(1) | | Annualized | | 3/1/2012 – |
| Fund | | 3/1/2012 | | 8/31/2012 | | Expense Ratio | | 8/31/2012 |
| Aegis Value Fund | | | | | | | | | | | | | | | | |
| | $ | 1,000.00 | | | $ | 1,016.80 | | | | 1.49 | % | | $ | 7.57 | |
| Hypothetical | | | 1,000.00 | | | | 1,025.14 | | | | 1.49 | % | | | 7.60 | |
| (1) | The actual ending account value is based on the actual total return of the Fund for the period March 1, 2012 to August 31, 2012 after actual expenses and will differ from the hypothetical ending account value which is based on the Fund’s actual expense ratio and a hypothetical annual return of 5% before expenses. The actual cumulative return at net asset value for the period March 1, 2012 to August 31, 2012 was 1.68%. |
| (2) | Expenses are equal to the Fund’s annualized expense ratio (1.49%) multiplied by the average account value over the period, multiplied by 184/366 (to reflect the period between 3/1/2012 and 8/31/2012). |
Please see performance data disclosure on page 2.
You may use the information in this table, together with the amount you invested, to estimate the expenses that you paid over the period. Simply divide your account value by $1,000 (for example, an $8,600 account value divided by $1,000 = 8.6), then multiply the result by the number in the table under the heading entitled “Expenses Paid During Period” to estimate the expenses you paid on your account during this period.
Hypothetical example for comparison purposes
The table above also provides information about hypothetical account values and hypothetical expenses based on the Fund’s actual expense ratio and an assumed rate of return of 5% per year before expenses, which is not the Fund’s actual return. The hypothetical account values and expenses may not be used to estimate the actual ending account balance or expenses you paid for the period. You may use this information to compare the ongoing costs of investing in the Fund and other funds. To do so, compare this 5% hypothetical example with the 5% hypothetical examples that appear in the shareholder reports of the other funds. Please note that the expenses shown in the table are meant to highlight your ongoing costs only. The Fund is a pure no-load fund and does not charge any sales charges (loads), distribution or service fees.
Key Statistics
Average Annual Total Returns (As of August 31, 2012)
| | | AVALX | | Russell 2000 Val. |
| Trailing 1 Year | | | 10.64 | % | | | 14.08 | % |
| Trailing 3 Year | | | 17.46 | % | | | 12.24 | % |
| Trailing 5 Year | | | 3.35 | % | | | 0.73 | % |
| Trailing 10 Year | | | 8.56 | % | | | 8.49 | % |
See performance data disclosure on page 2.
Returns on both Aegis Value Fund and Russell 2000 Value Index assume reinvestment of all dividends and distributions. Fund returns are after all expenses. Past performance is not predictive of future results. The returns shown do not reflect the deduction of taxes a shareholder would pay on the redemption of Fund shares or Fund distributions.
Portfolio Characteristics
August 31, 2012
(Unaudited)
Industry Breakdown
| | | % of the Fund’s |
| | | Net Assets |
| Common Stock | | | | | | 97.8 | % |
| Aerospace & Defense | | | 3.0 | % | | | |
| Airlines | | | 1.9 | % | | | |
| Auto Components | | | 1.3 | % | | | |
| Capital Markets | | | 1.3 | % | | | |
| Chemicals | | | 4.4 | % | | | |
| Commercial Banks | | | 0.0 | % | | | |
| Commercial Services & Supplies | | | 0.4 | % | | | |
| Construction & Engineering | | | 0.2 | % | | | |
| Distributors | | | 1.8 | % | | | |
| Diversified Financial Services | | | 3.8 | % | | | |
| Electronic Equipment, Instruments & Components | | | 5.9 | % | | | |
| Energy Equipment & Services | | | 4.3 | % | | | |
| Food & Staples Retailing | | | 1.0 | % | | | |
| Food Products | | | 0.2 | % | | | |
| Hotels, Restaurants & Leisure | | | 2.9 | % | | | |
| Household Durables | | | 6.5 | % | | | |
| Independent Power Producers & Energy Traders | | | 1.9 | % | | | |
| Insurance | | | 11.9 | % | | | |
| IT Services | | | 0.9 | % | | | |
| Machinery | | | 5.0 | % | | | |
| Marine | | | 0.6 | % | | | |
| Media | | | 0.2 | % | | | |
| Metals & Mining | | | 2.5 | % | | | |
| Multiline Retail | | | 1.1 | % | | | |
| Oil, Gas & Consumable Fuels | | | 13.4 | % | | | |
| Paper & Forest Products | | | 2.3 | % | | | |
| Real Estate Investment Trusts | | | 2.8 | % | | | |
| Textiles, Apparel & Luxury Goods | | | 4.2 | % | | | |
| Thrifts & Mortgage Finance | | | 2.4 | % | | | |
| Tobacco | | | 5.5 | % | | | |
| Trading Companies & Distributors | | | 4.2 | % | | | |
| Preferred Stock | | | | | | | 0.0 | % |
| Oil, Gas & Consumable Fuels | | | 0.0 | % | | | | |
| Warrants | | | | | | | 1.2 | % |
| Oil, Gas & Consumable Fuels | | | 0.0 | % | | | | |
| Insurance | | | 1.2 | % | | | | |
| Other Assets in Excess of Liabilities | | | | | | | 1.0 | % |
| Total Net Assets | | | | | | | 100.0 | % |
Aegis Value Fund
Schedule of Portfolio Investments
August 31, 2012
| | | Shares | | | Value | |
| Common Stocks – 97.8% | | | | | | |
| | | | | | | |
| Consumer Discretionary – 18.0% | | | | | | |
| | | | | | | |
| Auto Components – 1.3% | | | | | | |
| Superior Industries International, Inc. | | | 109,003 | | | $ | 1,862,861 | |
| | | | | | | | | |
| Distributors – 1.8% | | | | | | | | |
| Core-Mark Holding Co., Inc. | | | 57,971 | | | | 2,639,999 | |
| | | | | | | | | |
| Hotels, Restaurants & Leisure – 2.9% | | | | | | | | |
| Bowl America, Inc. Class A | | | 9,481 | | | | 118,512 | |
Century Casinos, Inc.(1) | | | 805,044 | | | | 2,117,266 | |
| Frisch’s Restaurants, Inc. | | | 18,486 | | | | 610,223 | |
Luby’s, Inc.(1) | | | 230,603 | | | | 1,379,006 | |
| | | | | | | | 4,225,007 | |
| | | | | | | | | |
| Household Durables – 6.5% | | | | | | | | |
| American Greetings Corp. – Class A | | | 136,963 | | | | 1,970,898 | |
| Bassett Furniture Industries, Inc. | | | 533,612 | | | | 6,451,369 | |
Retail Holdings N.V.(2) | | | 57,305 | | | | 1,174,179 | |
| | | | | | | | 9,596,446 | |
| | | | | | | | | |
| Media – 0.2% | | | | | | | | |
Ballantyne Strong Inc.(1) | | | 60,293 | | | | 258,657 | |
| | | | | | | | | |
| Multiline Retail – 1.1% | | | | | | | | |
ALCO Stores, Inc.(1)(4) | | | 231,978 | | | | 1,649,363 | |
| | | | | | | | | |
| Textiles, Apparel & Luxury Goods – 4.2% | | | | | | | | |
Delta Apparel, Inc.(1) | | | 356,162 | | | | 5,046,815 | |
Tandy Brands Accessories, Inc(1) | | | 348,892 | | | | 488,449 | |
Unifi, Inc.(1) | | | 51,248 | | | | 567,828 | |
| | | | | | | | 6,103,092 | |
| Total Consumer Discretionary | | | | | | | 26,335,425 | |
| | | | | | | | | |
| Consumer Staples – 6.7% | | | | | | | | |
| | | | | | | | | |
| Food & Staples Retailing – 1.0% | | | | | | | | |
| Nash Finch Co. | | | 72,637 | | | | 1,430,224 | |
| | | | | | | | | |
| Food Products – 0.2% | | | | | | | | |
Thorntons PLC(2) | | | 710,000 | | | | 287,481 | |
The accompanying notes are an integral part of these financial statements.
Aegis Value Fund
Schedule of Portfolio Investments
August 31, 2012
| | | Shares | | | Value | |
| Common Stocks – Continued | | | | | | |
| | | | | | | |
| Consumer Staples – Continued | | | | | | |
| | | | | | | |
| Tobacco – 5.5% | | | | | | |
Alliance One International, Inc.(1) | | | 2,780,608 | | | $ | 8,063,763 | |
| Total Consumer Staples | | | | | | | 9,781,468 | |
| | | | | | | | | |
| Energy – 17.7% | | | | | | | | |
| | | | | | | | | |
| Energy Equipment & Services – 4.3% | | | | | | | | |
Leader Energy Services Ltd.(1) | | | 204,333 | | | | 89,133 | |
Noble Corp.(2) | | | 29,800 | | | | 1,136,572 | |
| Patterson-UTI Energy, Inc. | | | 335,150 | | | | 5,090,929 | |
| | | | | | | | 6,316,634 | |
| | | | | | | | | |
| Oil, Gas & Consumable Fuels – 13.4% | | | | | | | | |
Endeavour International Corp.(1) | | | 50,058 | | | | 422,990 | |
Energy Partners Ltd.(1) | | | 360,701 | | | | 6,211,271 | |
Magnum Hunter Resources, Corp.(1) | | | 579,150 | | | | 2,490,345 | |
Questerre Energy Corp. – Class A(1) | | | 1,593,800 | | | | 1,067,114 | |
| Tesoro Corp. | | | 191,687 | | | | 7,617,641 | |
| Western Refining, Inc. | | | 64,450 | | | | 1,802,667 | |
| | | | | | | | 19,612,028 | |
| Total Energy | | | | | | | 25,928,662 | |
| | | | | | | | | |
| Financials – 22.2% | | | | | | | | |
| Capital Markets – 1.3% | | | | | | | | |
BKF Capital Group, Inc.(1) | | | 63,176 | | | | 75,811 | |
SWS Group, Inc.(1) | | | 306,613 | | | | 1,830,480 | |
| | | | | | | | 1,906,291 | |
| Commercial Banks – 0.0% | | | | | | | | |
| Citizens Bancshares Corp. | | | 3,024 | | | | 11,370 | |
| | | | | | | | | |
| Diversified Financial Services – 3.8% | | | | | | | | |
| California First National Bancorp. | | | 342,311 | | | | 5,613,900 | |
| | | | | | | | | |
| Insurance – 11.9% | | | | | | | | |
American Safety Insurance Holdings Ltd.(1)(2) | | | 317,415 | | | | 5,469,061 | |
Aspen Insurance Holdings Ltd.(2) | | | 211,200 | | | | 6,141,696 | |
MBIA Inc.(1) | | | 193,300 | | | | 2,103,104 | |
White Mountains Insurance Group Ltd(2) | | | 7,100 | | | | 3,694,414 | |
| | | | | | | | 17,408,275 | |
The accompanying notes are an integral part of these financial statements.
Aegis Value Fund
Schedule of Portfolio Investments
August 31, 2012
| | | Shares | | | Value | |
| Common Stocks – Continued | | | | | | |
| | | | | | | |
| Financials – Continued | | | | | | |
| | | | | | | |
| Real Estate Investment Trusts (REITs) – 2.8% | | | | | | |
BRT Realty Trust(1) | | | 472,798 | | | $ | 2,962,079 | |
| CommonWealth REIT | | | 57,775 | | | | 864,892 | |
KEYreit(2) | | | 11,000 | | | | 70,637 | |
Vestin Realty Mortgage I, Inc.(1) | | | 26,809 | | | | 32,975 | |
| | | | | | | | 3,930,583 | |
| | | | | | | | | |
| Thrifts & Mortgage Finance – 2.4% | | | | | | | | |
B of I Holding, Inc.(1) | | | 142,412 | | | | 3,353,803 | |
First Federal of Northern Michigan Bancorp, Inc.(1) | | | 35,640 | | | | 125,096 | |
| | | | | | | | 3,478,899 | |
| Total Financials | | | | | | | 32,349,318 | |
| | | | | | | | | |
| Industrials – 15.3% | | | | | | | | |
| | | | | | | | | |
| Aerospace & Defense – 3.0% | | | | | | | | |
The Allied Defense Group, Inc.(1)(5) | | | 1,599 | | | | 5,037 | |
Sparton Corp.(1) | | | 100,473 | | | | 1,004,730 | |
| Sypris Solutions, Inc. | | | 496,880 | | | | 3,383,753 | |
| | | | | | | | 4,393,520 | |
| | | | | | | | | |
| Airlines – 1.9% | | | | | | | | |
Dart Group PLC(2) | | | 1,681,578 | | | | 1,966,972 | |
Republic Airways Holdings, Inc.(1) | | | 190,000 | | | | 845,500 | |
| | | | | | | | 2,812,472 | |
| | | | | | | | | |
| Commercial Services & Supplies – 0.4% | | | | | | | | |
Versar, Inc.(1) | | | 156,015 | | | | 480,526 | |
| | | | | | | | | |
| Construction & Engineering – 0.2% | | | | | | | | |
Integrated Electrical Services, Inc.(1) | | | 112,101 | | | | 334,061 | |
| | | | | | | | | |
| Machinery – 5.0% | | | | | | | | |
| Hardinge, Inc. | | | 262,597 | | | | 2,360,747 | |
Tecumseh Products Co. Class A(1)(4) | | | 513,842 | | | | 2,718,224 | |
Tecumseh Products Co. Class B(1)(4) | | | 400,369 | | | | 2,238,063 | |
| | | | | | | | 7,317,034 | |
The accompanying notes are an integral part of these financial statements.
Aegis Value Fund
Schedule of Portfolio Investments
August 31, 2012
| | | Shares | | | Value | |
| Common Stocks – Continued | | | | | | |
| | | | | | | |
| Industrials – Continued | | | | | | |
| | | | | | | |
| Marine – 0.6% | | | | | | |
Baltic Trading Ltd.(2) | | | 100,691 | | | $ | 310,128 | |
Globus Maritime Ltd.(2) | | | 179,992 | | | | 493,178 | |
Ultrapetrol (Bahamas) Ltd. (1)(2) | | | 122,617 | | | | 90,737 | |
| | | | | | | | 894,043 | |
| | | | | | | | | |
| Trading Companies & Distributors – 4.2% | | | | | | | | |
Aircastle Ltd.(2) | | | 521,728 | | | | 5,958,134 | |
Huttig Building Products, Inc.(1) | | | 90,033 | | | | 134,149 | |
| | | | | | | | 6,092,283 | |
| Total Industrials | | | | | | | 22,323,939 | |
| | | | | | | | | |
| Information Technology – 6.8% | | | | | | | | |
| | | | | | | | | |
Electronic Equipment, Instruments & Components – 5.9% | | | | | | | | |
| Frequency Electronics, Inc. (1) | | | 198,265 | | | | 1,720,940 | |
| Ingram Micro, Inc. Class A (1) | | | 245,900 | | | | 3,754,893 | |
Sanmina-SCI Corp.(1) | | | 371,490 | | | | 3,209,674 | |
| | | | | | | | 8,685,507 | |
| | | | | | | | | |
| IT Services – 0.9% | | | | | | | | |
StarTek, Inc.(1) | | | 433,035 | | | | 1,277,453 | |
| Total Information Technology | | | | | | | 9,962,960 | |
| | | | | | | | | |
| Materials – 9.2% | | | | | | | | |
| | | | | | | | | |
| Chemicals – 4.4% | | | | | | | | |
American Pacific Corp.(1)(4) | | | 534,150 | | | | 6,447,191 | |
| | | | | | | | | |
| Metals & Mining – 2.5% | | | | | | | | |
Amerigo Resources Ltd.(2) | | | 2,663,300 | | | | 1,547,377 | |
Horsehead Holding Corp.(1) | | | 78,466 | | | | 693,639 | |
Mercator Minerals Ltd(1)(2) | | | 9,500 | | | | 4,370 | |
| Olympic Steel, Inc. | | | 89,968 | | | | 1,417,896 | |
| | | | | | | | 3,663,282 | |
The accompanying notes are an integral part of these financial statements.
Aegis Value Fund
Schedule of Portfolio Investments
August 31, 2012
| | | Shares | | | Value | |
| Common Stocks – Continued | | | | | | |
| | | | | | | |
| Materials – Continued | | | | | | |
| | | | | | | |
| Paper & Forest Products – 2.3% | | | | | | |
Resolute Forest Products(1) | | | 271,824 | | | $ | 3,416,828 | |
| Total Materials | | | | | | | 13,527,301 | |
| | | | | | | | | |
| Utilities – 1.9% | | | | | | | | |
| | | | | | | | | |
Independent Power Producers & Energy Traders – 1.9% | | | | | | | | |
GenOn Energy, Inc.(1) | | | 719,646 | | | | 1,820,704 | |
Maxim Power Corp.(1) | | | 493,200 | | | | 975,643 | |
| Total Utilities | | | | | | | 2,796,347 | |
| Total Common Stocks (Cost $140,703,683) | | | | | | | 143,005,420 | |
| | | | | | | | | |
| Preferred Stocks – 0.0% | | | | | | | | |
| | | | | | | | | |
| Energy – 0.0% | | | | | | | | |
| Oil, Gas & Consumable Fuels – 0.0% | | | | | | | | |
ATP Oil & Gas Corp.(3) | | | 10,600 | | | | 23,850 | |
| Total Preferred Stocks (Cost $1,094,550) | | | | | | | 23,850 | |
| | | | | | | | | |
| Warrants – 1.2% | | | | | | | | |
| | | | | | | | | |
| Energy – 0.0% | | | | | | | | |
| Oil, Gas & Consumable Fuels – 0.0% | | | | | | | | |
| Magnum Hunter Resources, Corp., Exercise Price: | | | | | | | | |
$10.50, 10/14/2013(1) | | | 11,515 | | | | — | |
| Total Energy | | | | | | | — | |
| | | | | | | | | |
| Financials – 1.2% | | | | | | | | |
| | | | | | | | | |
| Insurance – 1.2% | | | | | | | | |
| American International Group, Inc., Exercise Price: | | | | | | | | |
$45.00, 01/19/2021(1) | | | 135,279 | | | | 1,758,627 | |
| Total Financials | | | | | | | 1,758,627 | |
| | | | | | | | | |
| Total Warrants (Cost $839,944) | | | | | | | 1,758,627 | |
| | | | | | | | | |
The accompanying notes are an integral part of these financial statements.
Aegis Value Fund
Schedule of Portfolio Investments
August 31, 2012
| | | Value | |
| Total Investments – 99.0% (Cost $142,638,177) | | $ | 144,787,897 | |
| Other Assets in Excess of Liabilities – 1.0% | | | 1,493,517 | |
| Net Assets – 100.0% | | $ | 146,281,414 | |
| (1) | Non-income producing securities. |
| (2) | Foreign security denominated in U.S. Dollars. |
| (3) | 144A – Represents a security sold under Rule 144A which is exempt from registration and may be resold to qualified institutional buyers under provisions of Rule 144A under the Securities Act of 1933, as amended. |
| (4) | Affiliated Company – The Fund is owner of more than 5% of the outstanding voting securities. See Notes to the Financial Statements for additional information on Investments in Affiliated Companies. |
| (5) | Security was fair valued in accordance with the policies and procedures approved by the Board of Directors. |
The Global Industry Classification Standard (GICS®) was developed by and/or is the exclusive property of MSCI, Inc. and Standard & Poor Financial Services LLC (“S&P”). GICS is a service mark of MSCI and S&P and has been licensed for use by U.S. Bancorp Fund Services, LLC.
The accompanying notes are an integral part of these financial statements.
| Aegis Value Fund |
| Statement of Assets and Liabilities |
| August 31, 2012 |
| Assets | | | |
Investments in unaffiliated companies/securities,
at value (cost $127,751,896) | | $ | 131,735,056 | |
Investments in affiliated companies*/securities, at value
(cost $14,886,281) | | | 13,052,841 | |
| Total investments in securities, at value (cost $142,638,177) | | $ | 144,787,897 | |
| Receivable for investment securities sold | | | 1,817,363 | |
| Cash | | | 1,340,556 | |
| Interest and dividends receivable | | | 118,726 | |
| Prepaid assets | | | 34,264 | |
| Total Assets | | | 148,098,806 | |
| | | | | |
| Liabilities | | | | |
| Payable for investment securities purchased | | | 1,435,839 | |
| Payable for Fund shares redeemed | | | 96,135 | |
| Payable to investment advisor | | | 158,430 | |
| Other payables | | | 126,988 | |
| Total Liabilities | | | 1,817,392 | |
| Net Assets | | $ | 146,281,414 | |
| | | | | |
| Net assets consist of: | | | | |
| Paid-in capital | | | 171,556,567 | |
| Undistributed net investment income | | | 52,741 | |
Accumulated net realized loss on investments and foreign
currency transactions | | | (27,477,614 | ) |
Net unrealized appreciation on investments and foreign currency
translations | | | 2,149,720 | |
| Net Assets | | $ | 146,281,414 | |
| | | | | |
| Capital Shares | | | | |
| Authorized (Par value $0.001 per share) | | | 100,000,000 | |
| Outstanding | | | 10,048,419 | |
| | | | | |
| Net asset value per share | | $ | 14.56 | |
| * | Please refer to Note 6 for additional details. |
The accompanying notes are an integral part of these financial statements.
| Aegis Value Fund |
| Statement of Operations |
| For The Year Ended August 31, 2012 |
| Investment Income | | | |
| Dividends from unaffiliated companies # | | $ | 1,615,608 | |
| Dividends from affiliated companies (Note 6) | | | 586,516 | |
| Interest income | | | 1,290 | |
| Total investment income | | | 2,203,414 | |
| | | | | |
| Expenses | | | | |
| Investment advisory fees (Note 3) | | | 1,773,797 | |
| Fund servicing fees | | | 133,241 | |
| Transfer agent & custody fees | | | 80,508 | |
| Printing and postage fees | | | 47,101 | |
| Ragistration fees | | | 36,274 | |
| Directors & chief compliance officer fees | | | 33,739 | |
| Audit fees | | | 23,131 | |
| Legal fees | | | 18,203 | |
| Insurance fees | | | 19,342 | |
| Miscellaneous fees | | | 2,197 | |
| Total expenses | | | 2,167,533 | |
| Net investment income | | | 35,881 | |
Realized and unrealized gain (loss) on investments and foreign
currency transactions: | | | | |
| Net realized gain (loss) from: | | | | |
| Investments in unaffiliated companies | | | 1,871,028 | |
| Investments in affiliated companies (Note 6) | | | (5,790,316 | ) |
Net realized loss on investments and foreign currency
transactions | | | (3,919,288 | ) |
| Change in net unrealized appreciation/depreciation on: | | | | |
| Investments in unaffiliated companies | | | 9,680,266 | |
| Investments in affiliated companies | | | 8,844,696 | |
Net change in unrealized appreciation/depreciation on
investments and foreign currency translations | | | 18,524,962 | |
Net realized and unrealized gain on investments and foreign
currency transactions | | | 14,605,674 | |
| Net increase in net assets resulting from operations | | | 14,641,555 | |
| # | Net of foreign tax withholding of $20,425. |
The accompanying notes are an integral part of these financial statements.
| Aegis Value Fund |
| Statement of Changes in Net Assets |
For the Year Ended August 31st |
| | | 2012 | | | 2011 | |
| Operations: | | | | | | |
| Net investment income (loss) | | $ | 35,881 | | | $ | (1,182,039 | ) |
Net realized gain (loss) on investments and
foreign currency transactions | | | (3,919,288 | ) | | | 11,638,861 | |
Change in unrealized appreciation/depreciation
on investments and foreign currency
translations | | | 18,524,962 | | | | 24,125,448 | |
Net increase in net assets resulting from
operations | | | 14,641,555 | | | | 34,582,270 | |
| | | | | | | | | |
| Capital share transactions* | | | | | | | | |
| Subscriptions | | | 15,653,786 | | | | 26,754,009 | |
| Redemptions | | | (36,111,349 | ) | | | (54,062,679 | ) |
Net decrease in net assets resulting from
capital share transactions | | | (20,457,563 | ) | | | (27,308,670 | ) |
| | | | | | | | | |
| Total Increase (Decrease) in Net Assets | | | (5,816,008 | ) | | | 7,273,600 | |
| | | | | | | | | |
| Net Assets | | | | | | | | |
| Beginning of year | | | 152,097,422 | | | | 144,823,822 | |
| End of year | | $ | 146,281,414 | | | $ | 152,097,422 | |
Undistributed net investment income at
end of year | | $ | 52,741 | | | $ | — | |
| | | | | | | | | |
| *Share information | | | | | | | | |
| Subscriptions | | | 1,165,718 | | | | 1,980,431 | |
| Redemptions | | | (2,678,153 | ) | | | (4,183,245 | ) |
| Net decrease in shares | | | (1,512,435 | ) | | | (2,202,814 | ) |
| Beginning shares | | | 11,560,854 | | | | 13,763,668 | |
| Ending shares | | | 10,048,419 | | | | 11,560,854 | |
The accompanying notes are an integral part of these financial statements.
Aegis Value Fund
Financial Highlights
The table below sets forth financial data for a share outstanding in the Fund throughout each year:
| | | Years Ended August 31st | |
| | | 2012 | | | 2011 | | | 2010 | | | 2009 | | | 2008 | |
| Per Share Data | | | | | | | | | | | | | | | |
| Net asset value, beginning of year | | $ | 13.16 | | | $ | 10.52 | | | $ | 8.99 | | | $ | 12.49 | | | $ | 14.53 | |
| | | | | | | | | | | | | | | | | | | | | |
| Income from investment operations: | | | | | | | | | | | | | | | | | | | | |
| Net investment income (loss)* | | | 0.00 | | | | (0.10 | ) | | | (0.05 | ) | | | 0.05 | | | | 0.33 | |
Net realized and unrealized gain
(loss) on investments and
foreign currency transactions | | | 1.40 | | | | 2.74 | | | | 1.59 | | | | (3.05 | ) | | | (1.37 | ) |
Total from investment
operations | | | 1.40 | | | | 2.64 | | | | 1.54 | | | | (3.00 | ) | | | (1.04 | ) |
| | | | | | | | | | | | | | | | | | | | | |
Less distributions to shareholders
from: | | | | | | | | | | | | | | | | | | | | |
| Net investment income | | | — | | | | — | | | | (0.01 | ) | | | (0.34 | ) | | | (0.12 | ) |
| Net realized capital gains | | | — | | | | — | | | | — | | | | (0.16 | ) | | | (0.88 | ) |
| Total Distributions | | | — | | | | — | | | | (0.01 | ) | | | (0.50 | ) | | | (1.00 | ) |
| Net asset value, end of year | | $ | 14.56 | | | $ | 13.16 | | | $ | 10.52 | | | $ | 8.99 | | | $ | 12.49 | |
| | | | | | | | | | | | | | | | | | | | | |
| Total investment return | | | 10.64 | % | | | 25.10 | % | | | 17.08 | % | | | (21.60 | )% | | | (7.17 | )% |
| | | | | | | | | | | | | | | | | | | | | |
Ratios (to average net assets)/
Supplemental data: | | | | | | | | | | | | | | | | | | | | |
Expenses after reimbursement/
recapture and fees paid | | | 1.47 | % | | | 1.48 | % | | | 1.45 | % | | | 1.50 | % | | | 1.43 | % |
Expenses before reimbursement/
recapture and fees paid | | | 1.47 | % | | | 1.48 | % | | | 1.43 | % | | | 1.53 | % | | | 1.43 | % |
| Net investment income/(loss) | | | 0.02 | % | | | (0.72 | )% | | | (0.50 | )% | | | 0.25 | % | | | 2.10 | % |
| Portfolio turnover | | | 20 | % | | | 29 | % | | | 50 | % | | | 31 | % | | | 35 | % |
| Net assets at end of period (000’s) | | $ | 146,281 | | | $ | 152,097 | | | $ | 144,824 | | | $ | 124,146 | | | $ | 205,739 | |
| * | Per share net investment income/(loss) was calculated prior to tax adjustments. |
The accompanying notes are an integral part of these financial statements.
Notes to Financial Statements
August 31, 2012
1. The Organization
Aegis Value Fund, Inc. (the “Fund”) is registered under the Investment Company Act of 1940 as a diversified open-end management company. The Fund was incorporated October 22, 1997 in the State of Maryland and commenced operations May 15, 1998. The Fund’s principal investment goal is to seek long-term capital appreciation by investing primarily in common stocks that are believed to be significantly undervalued relative to the market based on a company’s book value, revenues, or cash flow. Refer to the current Prospectus for additional information about the Fund.
2. Summary of Significant Accounting Policies
Security valuation. Investments in securities traded on a national securities exchange (or reported on the NASDAQ National Market) are stated at the last reported sales price or a market’s official close price on the day of valuation; other securities traded in the over-the-counter market and listed securities for which no sale was reported on that date are stated at the last close price, or the average of bid and ask price for NASDAQ National Market securities. Short-term notes are stated at amortized cost, which is equivalent to value. Restricted securities, securities for which market quotations are not readily available, and securities with market quotations that Aegis Financial Corporation (the “Advisor”) does not believe are reflective of market value are valued at fair value as determined by the Advisor under the supervision of the Board of Directors. The valuation assigned to fair valued securities for purposes of calculating the Fund’s net asset value (“NAV”) may differ from the security’s most recent closing market price and from the prices used by other mutual funds to calculate their NAVs. Where a security is traded in more than one market, which may include foreign markets, the securities are generally valued on the market considered by the Advisor to be the primary market. The Fund will value its foreign securities in U.S. dollars on the basis of the then-prevailing currency exchange rates.
In accordance with the Financial Accounting Standard Board (“FASB”) Accounting Standard Codification (“ASC”) 820, Fair Value Measurements and Disclosure, fair value is defined as the price that a fund would receive to sell an investment or pay to transfer a liability in an orderly transaction with an independent buyer in the principal market, or in the absence of a principal market, the most advantageous market for the investment or liability. ASC 820 establishes a three-tier hierarchy to distinguish between (1) inputs that reflect the assumptions market participants would use in pricing an asset or liability developed based on market data obtained from sources independent of the reporting entity (observable inputs) and (2) inputs that reflect the reporting entity’s own assumptions about the assumptions market participants would use in pricing an asset or liability developed based on the best information available in the circumstances (unobservable inputs) and to establish classification of fair value measurements for disclosure purposes. Various inputs
Notes to Financial Statements – (continued)
August 31, 2012
2. Summary of Significant Accounting Policies – (continued)
are used in determining the value of the Fund’s investments. The inputs are summarized in the three broad levels listed below:
| | | |
| | ● | Level 1 – quoted prices in active markets for identical securities. An active market for the security is a market in which transactions occur with sufficient frequency and volume to provide pricing information on an ongoing basis. A quoted price in an active market provides the most reliable evidence of fair value. |
| | | |
| | ● | Level 2 – other significant observable inputs (including quoted prices for similar securities, interest rates, prepayment speeds, credit risk, etc.) Quoted prices for identical or similar assets in markets that are not active. Inputs that are derived principally from or corroborated by observable market data. An adjustment to any observable input that is significant to the fair value may render the measurement a Level 3 measurement. |
| | | |
| | ● | Level 3 – significant unobservable inputs, including the Fund’s own assumptions in determining the fair value of investments. |
Common stocks, Preferred stocks, and Warrants. Securities traded on a national exchange (or reported on the NASDAQ national market) are stated at the last reported sales price on the day of valuation. To the extent these securities are actively traded and valuation adjustments are not applied, they are categorized in Level 1 of the fair value hierarchy. Stocks traded on inactive markets or valued by reference to similar instruments are categorized in Level 2. Certain securities, such as Warrants, whose absence of an active market and whose value is determined by terms of issuance or a relationship to other securities or indexes is consistent with a modeled approach to observable inputs. Such valuation is generally characterized as a Level 2 of the fair value hierarchy.
Short-term investments. Short-term investments are valued using amortized cost which approximates fair value. To the extent the inputs are observable and timely, the values would be categorized in Level 2 of the fair value hierarchy.
In May 2011, the Financial Accounting Standards Board (“FASB”) issued Accounting Standards Update (“ASU”) No. 2011-04 “Amendments to Achieve Common Fair Value Measurement and Disclosure Requirements in U.S. GAAP and the International Financial Reporting Standards (“IFRSs”)”. ASU No. 2011-04 amends FASB ASC Topic 820, Fair Value Measurements and Disclosures, to establish common requirements for measuring fair value and for disclosing information about fair value measurements in accordance with GAAP and IFRSs. ASU No. 2011-04 is effective for fiscal years beginning after December 15, 2011 and for interim periods within those fiscal years. The Fund has disclosed the applicable requirements of this accounting standard in the financial statements.
Notes to Financial Statements – (continued)
August 31, 2012
2. Summary of Significant Accounting Policies – (continued)
The inputs or methodology used for valuing securities are not necessarily an indication of the risk associated with investing in those securities. The following is a summary of the inputs used to value the Fund’s investments as of August 31, 2012:
| | | Level 1 | | | Level 2 | | | Level 3 | | | Total | |
| Common Stocks | | | | | | | | | | | | |
| Consumer Discretionary | | | 25,161,247 | | | | 1,174,179 | | | | — | | | | 26,335,426 | |
| Consumer Staples | | | 9,781,467 | | | | — | | | | — | | | | 9,781,467 | |
| Energy | | | 25,928,662 | | | | — | | | | — | | | | 25,928,662 | |
| Financials | | | 29,375,869 | | | | 2,973,449 | | | | — | | | | 32,349,318 | |
| Industrials | | | 21,838,376 | | | | 480,526 | | | | 5,037 | | | | 22,323,939 | |
| Information Technology | | | 9,962,960 | | | | — | | | | — | | | | 9,962,960 | |
| Materials | | | 13,527,301 | | | | — | | | | — | | | | 13,527,301 | |
| Utilities | | | 2,796,347 | | | | — | | | | — | | | | 2,796,347 | |
| | | — | | | | 23,850 | | | | — | | | | 23,850 | |
| Warrants | | | | | | | | | | | | | | | | |
| Financials | | | 1,758,627 | | | | — | | | | — | | | | 1,758,627 | |
| Total | | | 140,130,856 | | | | 4,652,004 | | | | 5,037 | | | | 144,787,897 | |
Following is a reconciliation of assets in which significant unobservable inputs (Level 3) were used in determining fair value:
| Fair Value Measurement Using Significant Unobservable Inputs (Level 3) | | Amount | |
| Beginning Balance as of 8/31/11 | | $ | 3,083 | |
| Change in unrealized appreciation/depreciation | | | (3,083 | ) |
| Realized gain | | | 3,083 | |
| Purchase | | | — | |
| Sales | | | (3,083 | ) |
| Transfer into Level 3 during the year | | | 5,037 | |
| Transfer out of Level 3 during the year | | | — | |
| Ending Balance as of 8/31/12 | | $ | 5,037 | |
The amount of total gains or losses for the period included in
net increase (decrease) in net assets applicable to outstanding
shares attributed to the change in unrealized gains or losses | | | | |
| relating to assets still held at the reporting date | | $ | (732 | ) |
Notes to Financial Statements – (continued)
August 31, 2012
2. Summary of Significant Accounting Policies – (continued)
During the year, there was a transfer of $4,652,004 into Level 2 from Level 1 and there was a transfer of $5,037 into Level 3 from Level 1. The transfer into Level 2 from Level 1 was due to certain securities switching from a direct quote in an active market to an evaluated price obtained from the pricing vendor. The transfer into Level 3 from Level 1 took place as a result of a security whose trading was halted. The security was fair valued in accordance with the policies and procedures approved by the Board of Directors. Such a valuation is based on a review if inputs such as, but not limited to, similar securities, company specific financial information and company specific news. The basis for recognizing and valuing transfers is as of the end of the period in which the transfers occur.
Foreign risk and currency translation. The Fund may invest directly in foreign securities. Financial market fluctuations in any country where the Fund has investments will likely affect the value of the securities that the Fund owns in that country. These movements will affect the Fund’s share price and investment performance. The political, economic, and social structures of some countries may be less stable and more volatile than those in the United States. The risks of foreign markets include currency fluctuations, possible nationalization or expropriation of assets, extraordinary taxation or exchange controls, political or social instability, unfavorable diplomatic developments, and certain custody and settlement risks. In addition to these risks, many foreign markets have less trading volume and less liquidity than the U.S. markets, and therefore prices in foreign markets can be highly volatile.
Foreign markets may also have less protection for investors than the U.S. markets. Foreign issuers may be subject to less government supervision. It may also be difficult to enforce legal and shareholder/bondholder rights in foreign countries. There is no assurance that the Fund will be able to anticipate these risks or counter their effects.
The accounting records of the Fund are maintained in U.S. dollars. Foreign currency amounts are translated into U.S. dollars at the current rate of exchange to determine the value of investments, assets and liabilities. Purchases and sales of securities, and income and expenses are translated at the prevailing rate of exchange on the respective date of these transactions. The Fund does not isolate that portion of the results of operations resulting from changes in foreign exchange rates on investments from fluctuations arising from changes in market prices of securities held. These fluctuations are included with the net realized and unrealized gains or losses from investments.
Reported net realized foreign exchange gains or losses arise from sales and maturities of short-term securities, sales of foreign currencies, currency gains or losses realized between the trade and settlement dates on securities transactions and the difference between the amounts of dividends, interest and foreign withholding taxes recorded on the Fund’s books
Notes to Financial Statements – (continued)
August 31, 2012
2. Summary of Significant Accounting Policies – (continued)
and the U.S. dollar equivalent of the amounts actually received or paid. Net unrealized foreign currency gains and losses arise from changes in the fair values of assets and liabilities, other than investments in securities at each reporting period, resulting from changes in the exchange rate.
Federal income and excise taxes. The Fund’s policy is to comply with the requirements of Subchapter M of the Internal Revenue Code that are applicable to regulated investment companies and to distribute substantially all investment company taxable income and net capital gain to shareholders in a manner which results in no tax cost to the Fund. Therefore, no federal income tax provision is required.
Distributions to shareholders. Distributions to Fund shareholders, which are determined in accordance with income tax regulations, are recorded on the ex-dividend date. Distributions of net investment income, if any, are made at least annually. Net realized gains from investment transactions, if any, will be distributed to shareholders at least annually. The character of distributions made during the year from net investment income or net realized gain may differ from the characterization for federal income tax purposes due to differences in the recognition of income, expense, and gain/(loss) items for financial statement and tax purposes. Where appropriate, reclassifications between net asset accounts are made for such differences that are permanent in nature.
Use of estimates. The preparation of financial statements in conformity with accounting principles generally accepted in the United States of America (“GAAP”) requires management to make estimates and assumptions that affect the reported amounts of assets and liabilities and disclosure of contingent assets and liabilities at the date of the financial statements and the reported amounts of revenues and expenses during the period. Actual results could differ from those estimates.
Other. The Fund records security transactions based on the trade date. Gains and losses on security transactions are determined on a specific identification basis. Dividend income is recognized on the ex-dividend date, and interest income is recognized on the accrual basis and includes accretion of discounts and amortization of premiums. Withholding taxes on foreign dividends have been provided for in accordance with the Fund’s understanding of the applicable country’s tax rules and rates.
In the normal course of business, the Fund enters into contracts that contain a variety of representations, which provide general indemnifications. The Fund’s maximum exposure under these arrangements is unknown as this would involve future claims that may be made against the Fund that have not yet occurred. However, based on experience, the Fund expects the risk of loss to be remote.
Notes to Financial Statements – (continued)
August 31, 2012
3. Advisory Fees and Other Transactions with Affiliates
The Fund entered into an investment management and advisory services agreement (the “Agreement”) with the Advisor that provides for fees to be computed at an annual rate of 1.20% of the Fund’s average daily net assets. The Agreement provides for an expense reimbursement from the Advisor if the Fund’s expenses, exclusive of taxes, interest, fees incurred in acquiring or disposing of portfolio securities, and extraordinary expenses, exceed 1.50% of the Fund’s average daily net assets. The Agreement shall remain in force through December 31, 2012. Either party may terminate the Agreement anytime upon sixty (60) days written notice to the other party.
As part of the expense limitation agreement, the Fund has agreed to repay the Advisor for amounts waived or reimbursed by the Advisor provided that such repayment does not cause the Fund’s expenses, exclusive of taxes, interest, fees incurred in acquiring or disposing of portfolio securities, and extraordinary expenses, to exceed 1.50% and the repayment is made within three years after the year in which the Advisor incurred the expense. There are no allowable recapturable amounts as of August 31, 2012.
Certain officers and directors of the Fund are also officers and directors of the Advisor. The Fund pays each director not affiliated with the Advisor fees in cash or Fund shares of $1,000 for each attended board meeting and $500 for each attended committee meeting. In addition, the Fund pays the chief compliance officer a yearly amount of $20,000, paid on a quarterly basis.
4. Investment Transactions
Purchases and sales of long-term investment securities (excluding short-term investments) were $28,439,205 and $51,243,517, respectively, for the year ended August 31, 2012.
5. Distributions to Shareholders and Tax Components of Net Assets
At August 31, 2012, gross unrealized appreciation and depreciation of investments, based on cost for federal income tax purposes were as follows:
| Tax cost of investments | | $ | 142,761,168 | |
| Unrealized appreciation | | | 29,673,129 | |
| Unrealized depreciation | | | (27,646,400 | ) |
| Net unrealized appreciation | | $ | 2,026,729 | |
| | | | | |
The difference between cost amounts for financial statement and federal income tax purposes is due primarily to timing differences in recognizing certain gains and losses in security transactions.
Notes to Financial Statements – (continued)
August 31, 2012
5. Distributions to Shareholders and Tax Components of Net Assets – (continued)
The Fund did not pay any distributions during the tax years ended August 31, 2012 and 2011.
As of August 31, 2012, the Fund had the following capital loss carryover and expirations. To the extent that the Fund realizes future net capital gains, those gains will be offset by any unused capital loss carryforwards in the character noted below.
| Year Recognized | | Expires | | Short Term | | | Long Term | |
| August 2011 | | 8/31/2018 | | | 22,972,112 | | | | — | |
| August 2012 | | Unlimited | | | — | | | | 3,823,520 | |
| Total | | | | | 22,972,112 | | | | 3,823,520 | |
| | | | | | | | | | | |
At August 31, 2012, the Fund deferred, on a tax basis, qualified late year losses, consisting of post-October losses, as follows:
| Currency | | Capital | |
| — | | (558,991) | |
For the tax year ended August 31, 2012, the components of accumulated earnings (deficit) on a tax basis were as follows:
| Undistributed ordinary income | | $ | 52,741 | |
| Distributable earnings | | $ | 52,741 | |
| | | | | |
| Other accumulated gain/(loss) | | $ | (27,354,623 | ) |
| Unrealized appreciation on investments | | | 2,026,729 | |
| Total accumulated earnings/(deficit) | | $ | (25,275,153 | ) |
On the statement of assets and liabilities, as a result of permanent book to tax differences, certain amounts have been reclassified for the year ended August 31, 2012. The following reclassifications were primarily a result of the differing book/tax treatment of distributions from real estate investment trusts and net operating losses and had no impact on the net assets of the Fund.
| Undistributed net investment income/(loss) | | $ | 16,860 | |
| Accumulated realized gains/(losses) | | | (37,872 | ) |
| Paid-in Capital | | $ | 21,012 | |
Notes to Financial Statements – (continued)
August 31, 2012
5. Distributions to Shareholders and Tax Components of Net Assets – (continued)
GAAP requires an evaluation of tax positions taken (or expected to be taken) in the course of preparing a Fund’s tax returns to determine whether these positions meet a “more-likely-than-not” standard that, based on technical merits, have a more than fifty percent likelihood of being sustained by a taxing authority upon examination. A tax position that meets the “more-likely-than-not” recognition threshold is measured to determine the amount of benefit to recognize in the financial statements. The Fund recognizes interest and penalties, if any, related to unrecognized tax benefits as other expense in the Statement of Operations.
GAAP requires management of the Fund to analyze all open tax years, as defined by IRS statute of limitations for all major jurisdictions, including federal tax authorities and certain state tax authorities. As of and during the year ended August 31, 2012, the Fund did not have a liability for any unrecognized tax benefits. The Fund files a U.S. Federal Income and excise tax return and required. A Fund’s Federal income tax returns are subject to examination by the IRS for a period of three fiscal years after they are filed. The Fund has no examination in progress and is not aware of any tax positions for which it is reasonably possible that the total amounts of unrecognized tax benefits will significantly change in the next twelve months.
On December 22, 2010, the Regulated Investment Company Modernization Act of 2010 (the “Act”) was enacted, which changed various technical rules governing the tax treatment of regulated investment Companies. The changes are generally effective for taxable years beginning after the date of enactment. One of the more prominent changes addresses capital loss carryforwards. Under the Act, each Fund will be permitted to carry forward losses incurred in taxable years beginning after the date of enactment for an unlimited period. However, any losses incurred during those future years will be required to be utilized prior to the losses incurred in pre-enactment years, which carry an expiration date. As a result of this ordering rule, pre-enactment capital loss carryforwards may be more likely to expire unused. Additionally, post-enactment capital loss carryforward will retain their characteristics as either short-term or long-term capital losses rather than being considered all short-term as permitted under previous regulations.
6. Investments in Affiliated Companies
An affiliated company is a company in which the Fund has ownership of at least 5% of the voting securities. Companies which are affiliates of the Fund at year-end are noted in the Fund’s schedule of portfolio investments. Transactions during the year ended August 31, 2012 with companies which are or were affiliates are as follows:
Notes to Financial Statements – (continued)
August 31, 2012
6. Investments in Affiliated Companies – (continued)
| | | | | | | | | | | | | | | | | | | |
| | | Value Beginning of Year | | | Purchases | | | Sale Proceeds | | | Realized Gain/Loss | | | Dividends Credited to Income | | | Value End of Year | |
| ALCO Stores Inc.* | | $ | 2,201,471 | | | $ | — | | | $ | — | | | $ | — | | | $ | — | | | $ | 1,649,363 | |
| American Pacific Corp. | | | 3,952,710 | | | | — | | | | — | | | | — | | | | — | | | | 6,447,191 | |
Bassett Furniture Industries Inc. | | | 6,747,233 | | | | — | | | | 3,771,417 | | | | (1,449,113 | ) | | | 586,516 | | | | — | |
| MAIR Holdings, Inc. | | | — | | | | — | | | | 36,064 | | | | (4,341,213 | ) | | | — | | | | — | |
Tecumseh Products Co. Class A** | | | 1,137,796 | | | | 1,299,846 | | | | — | | | | — | | | | — | | | | 2,718,224 | |
Tecumseh Products Co. Class B | | | 3,179,783 | | | | 6,472 | | | | — | | | | — | | | | — | | | | 2,238,063 | |
| | | $ | 17,218,993 | | | $ | 1,306,318 | | | $ | 3,807,481 | | | $ | (5,790,326 | ) | | $ | 586,516 | | | $ | 13,052,841 | |
| * | Effective 7/6/2012 Duckwall-ALCO Stores Inc. changed its name to ALCO Stores Inc. |
| ** | Class A shares of Tecumseh Products Co. did not reflect affiliated status as of August 31, 2011 or August 31, 2012. Holdings in Class B shares represent more than 5% of the outstanding shares of that class, and more than 5% of the voting control of the company, therefore Tecumseh Products Co. remains an affiliated company of Aegis Value Fund. |
7. Subsequent Events
In connection with the preparation of the financial statements of the Fund as of and for the year ended August 31, 2012, events and transactions subsequent to August 31, 2012, have been evaluated by management for possible adjustment and/or disclosure. Management has determined that there were no material events that would require disclosure in the Fund’s financial statements.
REPORT OF INDEPENDENT REGISTERED PUBLIC ACCOUNTING FIRM
To the Shareholders and Board of Directors
Aegis Value Fund, Inc.
We have audited the accompanying statement of assets and liabilities of Aegis Value Fund, Inc. (the “Fund”), including the schedule of portfolio investments, as of August 31, 2012, and the related statement of operations for the year then ended, the statements of changes in net assets for each of the two years in the period then ended, and the financial highlights for each of the five years in the period then ended. These financial statements and financial highlights are the responsibility of the Fund’s management. Our responsibility is to express an opinion on these financial statements and financial highlights based on our audits.
We conducted our audits in accordance with the standards of the Public Company Accounting Oversight Board (United States). Those standards require that we plan and perform the audits to obtain reasonable assurance about whether the financial statements and financial highlights are free of material misstatement. An audit includes examining, on a test basis, evidence supporting the amounts and disclosures in the financial statements. Our procedures included confirmation of securities owned as of August 31, 2012 by correspondence with the custodian and brokers. An audit also includes assessing the accounting principles used and significant estimates made by management, as well as evaluating the overall financial statement presentation. We believe that our audits provide a reasonable basis for our opinion.
In our opinion, the financial statements and financial highlights referred to above present fairly, in all material respects, the financial position of Aegis Value Fund, Inc. as of August 31, 2012, the results of its operations for the year then ended, the changes in its net assets for each of the two years in the period then ended, and its financial highlights for each of the five years in the period then ended, in conformity with accounting principles generally accepted in the United States of America.
Philadelphia, Pennsylvania
October 22, 2012
Directors and Officers
(Unaudited)
| | | | | | | | | |
Name, Year of Birth, and Address | | Position(s) | | Principal Occupation During Past Five Years | | Number of Portfolios in Fund Complex Overseen by Director | | Other Directorships Held by Director |
| Interested Director* | | | | | | | | |
Scott L. Barbee Born: 1971 6862 Elm Street, Suite 830 McLean, VA 22101 | | President, Director | | Treasurer and Managing Director of Aegis Financial Corporation since 1997; Secretary of Aegis Financial Corporation since 2007; Treasurer and Director of the Aegis Value Fund since 1997; Trustee of the Aegis Funds since 2003; Secretary of the Aegis Funds 2006-2009; Treasurer of the Aegis Funds 2003-2009; President of Aegis Financial Corporation, the Aegis Funds and the Fund since 2009. | | 2 | | None |
| | | | | | | | | |
| Non-Interested Directors | | | | | | | | |
Eskander Matta Born: 1970 50 Beale Street San Francisco, CA 4105 | | Director | | Vice President of ebusiness, Blue Shield of California since 2008; Senior Vice President of Internet Services Group, Wells Fargo & Co., 2002-2008; Director of the Fund since 1997; Trustee of the Aegis Funds since 2003. | | 2 | | None |
| | | | | | | | | |
David A. Giannini Born: 1953 30 Rockefeller Plaza Suite 4250 New York, NY 10112 | | Director | | Institutional equity sales and research with Scarsdale Equities since 2006; Director of the Fund since 2006; Trustee of the Aegis Funds since 2006. | | 2 | | None |
| | | | | | | | | |
V. Scott Soler Born: 1969 7500 San Felipe, Suite 340 Houston, TX 77063 | | Director | | Partner at Limestone Value Partners and Strategic Consultant at Quantum Energy Partners since 2011; Managing Director of Quantum Energy Partners, 2006-2011; Director of the Fund since 2007; Trustee of the Aegis Funds since 2007. | | 2 | | Action Energy, Inc. |
| | | | | | | | | |
| Officer of the Fund | | | | | | | | |
Sarah Q. Zhang Born: 1970 6862 Elm Street, Suite 830 McLean, VA 22101 | | Chief Compliance Officer; Treasurer/ Secretary of the Fund | | Chief Compliance Officer of Aegis Financial Corp., the Aegis Funds and the Fund since 2008; Treasurer / Secretary of Aegis Financial Corp., the Aegis Funds and the Fund since 2009; Chief Financial Operations Officer, Larkspur Services, Inc. 2005-2007; | | N/A | | N/A |
*Indicates persons who are affiliated with Aegis Financial Corporation, the Fund’s investment advisor, and are therefore considered to be “interested persons” under the Investment Company Act of 1940, Section (2)(a).
The Fund’s Statement of Additional Information includes additional information about Fund directors and is available, without charge, by calling the Fund’s toll-fee phone number, (800) 528-3780.
Other Information
Fund Holdings:
The complete schedules of Fund holdings for the second and fourth quarters of each fiscal year are contained in the Fund’s semi-annual and annual shareholder reports, respectively. The Fund files complete schedules of Fund holdings with the SEC for the first and third quarters of each fiscal year on Form N-Q within 60 days after the end of the period. Copies of the Fund’s Form N-Q are available without charge, upon request, by contacting the Fund at 1-800-528-3780 and on the SEC’s website at http://www.sec.gov. You may also review and copy Form N-Q at the SEC’s Public Reference Room in Washington, D.C. For more information about the operation of the Public Reference Room, please call the SEC at 1-800-SEC-0330.
Code of Ethics:
The Fund has adopted a code of ethics applicable to its principal executive officer and principal financial officer. A copy of this code is available without charge, by calling the Fund at 800-528-3780.
Proxy Voting:
A description of the policies and procedures that the Fund uses to determine how to vote proxies relating to portfolio securities is available without charge, by calling the Fund at 800-528-3780. Information regarding how the Fund voted proxies, if any, relating to portfolio securities during the most recent 12-month period ended June 30 is available upon request, without charge, by calling 800-528-3780. The Fund’s proxy voting policies and procedures and voting record are also available on the Commission’s website at http://www.sec.gov.
AEGIS MUTUAL FUNDS PRIVACY NOTICE
(This information is not part of the Annual Report)
The Aegis Mutual Funds consider protecting the confidentiality of nonpublic personal information of our shareholders to be of the utmost importance. This privacy notice describes the information that we may collect, when we may disclose that information, and how we maintain the security and confidentiality of your nonpublic personal information.
Information We Collect
The Aegis Mutual Funds collect and retain information about you only when we reasonably believe that the information will assist us in managing your accounts. We collect certain information to protect your account, to ensure accuracy in reporting and recordkeeping, and to identify you when we conduct transactions for you. The information is also used to comply with certain laws and regulations that may apply to us and to help us understand your financial needs as we design or improve our products and services. We will also use your information to administer your account and transactions. We collect nonpublic personal information about you from the following sources:
| | ● | Your application or other forms, correspondence or conversations (examples include name, date of birth, address and Social Security Number); and |
| | ● | Your transactions with us (examples include account activity and balances). |
Information We Disclose
We understand that you expect the personal information you have entrusted to us to be handled with great care. We may share information about you under agreements with our service providers in order for our service providers to provide shareholder services and administer the funds, to process transactions, or to manage accounts for you. We share only information about our recordkeeping or transactions involving you or your account, such as your name, address, Social Security Number, account activity and account balances. We do not sell your nonpublic personal information. The Aegis Mutual Funds do not disclose nonpublic personal information about our shareholders to nonaffiliated third parties, except as permitted by applicable law. In all cases, your information is strictly protected. Each agreement requires that service providers keep the personal nonpublic information strictly confidential and use it only for the purpose for which it was intended.
Former Shareholders
The personal nonpublic information of former shareholders is treated in the same manner as the information of current shareholders.
Confidentiality and Security
The Aegis Mutual Funds restrict access to your nonpublic personal information to those individuals who need to know the information in order to provide product and services to you. We maintain physical, electronic and procedural safeguards that comply with federal standards to guard your nonpublic personal information. We recommend that you carefully protect your personal information and not provide your account name or number to anyone for any reason. If you choose to provide this information to a third party, you do so at your own risk.
 ��
��
| | | |
| | | |
| | | |
| | | |
| | | |
| | | |
| | Aegis Value Fund | Administrator, Transfer Agent and |
| | U.S. Bancorp Fund Services, LLC | Fund Accountant |
| | 615 East Michigan Street | U.S. Bancorp Fund Services, LLC |
| | Milwaukee, Wisconsin 53202 | 615 East Michigan Street |
| | Phone: (800) 528-3780 | Milwaukee, Wisconsin 53202 |
| | www.aegisvaluefund.com | |
| | | Independent Registered Public |
| | Board of Directors | Accounting Firm |
| | Scott L. Barbee | BBD, LLP |
| | David A. Giannini | 1835 Market Street, 26th Floor |
| | Eskander Matta | Philadelphia, Pennsylvania 19103 |
| | V. Scott Soler | |
| | | Counsel |
| | Officers | Seward & Kissel, LLP |
| | Scott L. Barbee, President | 901 K. Street N.W. |
| | Sarah Q. Zhang, Treasurer/Secretary/ | Washington, D.C. 20001 |
| | Chief Compliance Officer | |
| | | |
| | Investment Advisor | |
| | Aegis Financial Corporation | |
| | 6862 Elm Street, Suite 830 | |
| | McLean, VA 22101 | |
| | | |
| | Custodian | |
| | U.S. Bank, N.A. | |
| | Custody Operations | |
| | 1555 North RiverCenter Drive, Suite 302 | |
| | Milwaukee, Wisconsin 53212 | |
| | | |
| | | |
| | | |
| | | |
| | | |
Item 2. Code of Ethics.
The registrant has adopted a code of ethics that applies to the registrant’s principal executive officer and principal financial officer. The registrant has not made any amendments to its code of ethics during the period covered by this report. The registrant has not granted any waivers from any provisions of the code of ethics during the period covered by this report. A copy of the Registrant’s Code of Ethics is incorporated by reference to the Registrant’s Form N-CSR filed on November 6, 2008
Item 3. Audit Committee Financial Expert.
The registrant’s board of directors has determined that it does not have an audit committee financial expert serving on its audit committee. At this time, the registrant believes that the experience provided by each member of the audit committee together offers the registrant adequate oversight for the registrant’s level of financial complexity.
Item 4. Principal Accountant Fees and Services.
The registrant has engaged its principal accountant to perform audit services, audit-related services, tax services and other services during the past two fiscal years. “Audit services” refer to performing an audit of the registrant’s annual financial statements or services that are normally provided by the accountant in connection with statutory and regulatory filings or engagements for those fiscal years. “Audit-related services” refer to the assurance and related services by the principal accountant that are reasonably related to the performance of the audit. “Tax services” refer to professional services rendered by the principal accountant for tax compliance, tax advice, and tax planning. There were no “Other services” provided by the principal accountant. The following table details the aggregate fees billed or expected to be billed for each of the last two fiscal years for audit fees, audit-related fees, tax fees and other fees by the principal accountant.
The audit committee has adopted pre-approval policies and procedures that require the audit committee to pre-approve all audit and non-audit services of the registrant, including services provided to any entity affiliated with the registrant.
The percentage of fees billed by BBD, LLP applicable to non-audit services pursuant to waiver of pre-approval requirement were as follows:
All of the principal accountant’s hours spent on auditing the registrant’s financial statements were attributed to work performed by full-time permanent employees of the principal accountant.
Item 5. Audit Committee of Listed Registrants.
Not applicable to registrants who are not listed issuers (as defined in Rule 10A-3 under the Securities Exchange Act of 1934).
Item 6. Investments.
Schedule of Investments is included as part of the report to shareholders filed under Item 1 of this Form.
Item 7. Disclosure of Proxy Voting Policies and Procedures for Closed-End Management Investment Companies.
Not applicable to open-end investment companies.
Item 8. Portfolio Managers of Closed-End Management Investment Companies.
Not applicable to open-end investment companies.
Item 9. Purchases of Equity Securities by Closed-End Management Investment Company and Affiliated Purchasers.
Not applicable to open-end investment companies.
Item 10. Submission of Matters to a Vote of Security Holders.
Not Applicable.
Item 12. Exhibits.
(3) Any written solicitation to purchase securities under Rule 23c-1 under the Act sent or given during the period covered by the report by or on behalf of the registrant to 10 or more persons.
Not applicable to open-end investment companies.
Pursuant to the requirements of the Securities Exchange Act of 1934 and the Investment Company Act of 1940, the registrant has duly caused this report to be signed on its behalf by the undersigned, thereunto duly authorized.
Pursuant to the requirements of the Securities Exchange Act of 1934 and the Investment Company Act of 1940, this report has been signed below by the following persons on behalf of the registrant and in the capacities and on the dates indicated.