                                  UNITED STATES
                       SECURITIES AND EXCHANGE COMMISSION
                             WASHINGTON, D. C. 20549

                                   FORM N-CSR

Investment Company Act file number 811-08599

                              SCUDDER EQUITY TRUST
                             ----------------------
               (Exact Name of Registrant as Specified in Charter)

                  222 South Riverside Plaza, Chicago, IL 60606
                  --------------------------------------------
               (Address of Principal Executive Offices) (Zip Code)

        Registrant's Telephone Number, including Area Code: (617) 295-2663
                                                            --------------

                               Salvatore Schiavone
                             Two International Place
                           Boston, Massachusetts 02110
                     ---------------------------------------
                     (Name and Address of Agent for Service)

Date of fiscal year end:        11/30

Date of reporting period:       11/30/04


ITEM 1.  REPORT TO STOCKHOLDERS
Scudder-Dreman
Financial Services Fund
|
| |
| Annual Report to Shareholders |
| November 30, 2004 |
|
This report must be preceded or accompanied by a prospectus. To obtain a prospectus for any of our funds, refer to the Account Management Resources information provided in the back of this booklet. We advise you to consider the fund's objectives, risks, charges and expenses carefully before investing. The prospectus contains this and other important information about the fund. Please read the prospectus carefully before you invest.
Investments in mutual funds involve risk. Some funds have more risk than others. This fund is subject to stock market risk. It may focus its investments on certain economic sectors, thereby increasing its vulnerability to any single economic, political or regulatory development. This may result in greater share price volatility. Additionally, this fund is nondiversified and can take larger positions in fewer companies, increasing its overall potential risk. Please read this fund's prospectus for specific details regarding its investments and risk profile.
Scudder Investments is part of Deutsche Asset Management, which is the marketing name in the US for the asset management activities of Deutsche Bank AG, Deutsche Investment Management Americas Inc., Deutsche Asset Management Inc., Deutsche Asset Management Investment Services Ltd., Deutsche Bank Trust Company Americas and Scudder Trust Company.
Fund shares are not FDIC-insured and are not deposits or other obligations of, or guaranteed by, any bank. Fund shares involve investment risk, including possible loss of principal.
Performance Summary November 30, 2004 |
|
All performance shown is historical, assumes reinvestment of all dividends and capital gains, and does not guarantee future results. Investment return and principal value fluctuate with changing market conditions so that, when redeemed, shares may be worth more or less than their original cost. Current performance may be lower or higher than the performance quoted. Please visit scudder.com for the product's most recent month-end performance.
The maximum sales charge for Class A shares is 5.75%. For Class B shares, the maximum contingent deferred sales charge (CDSC) is 4% within the first year after purchase, declining to 0% after six years. Class C shares have no adjustment for front-end sales charges but redemptions within one year of purchase may be subject to a CDSC of 1%. Unadjusted returns do not reflect sales charges and would have been lower if they had.
Returns and rankings during the Life of Fund periods shown reflect a fee waiver and/or expense reimbursement. Without this waiver/reimbursement, returns and rankings would have been lower.
Performance figures do not reflect the deduction of taxes that a shareholder would pay on fund distributions or the redemption of fund shares. Returns and rankings may differ by share class.
Average Annual Total Returns (Unadjusted for Sales Charge) as of 11/30/04 |
Scudder-Dreman Financial Services Fund | 1-Year | 3-Year | 5-Year | Life of Fund* |
Class A | 10.70% | 7.52% | 6.34% | 5.22% |
Class B | 9.73% | 6.62% | 5.46% | 4.34% |
Class C | 9.84% | 6.69% | 5.51% | 4.41% |
S&P 500 Index+ | 12.86% | 2.74% | -1.83% | 2.46% |
S&P Financial Index++ | 11.57% | 6.72% | 5.94% | 5.24% |
Sources: Lipper Inc. and Deutsche Investment Management Americas Inc.
* The Fund commenced operations on March 9, 1998. Index returns begin March 31, 1998.
Net Asset Value and Distribution Information |
| Class A | Class B | Class C |
Net Asset Value: 11/30/04 | $ 12.47 | $ 12.32 | $ 12.36 |
11/30/03 | $ 11.46 | $ 11.33 | $ 11.36 |
Distribution Information Twelve Months: Income Dividends as of 11/30/04 | $ .20 | $ .11 | $ .11 |
Growth of an Assumed $10,000 Investment (Adjusted for Maximum Sales Charge) |
[] Scudder-Dreman Financial Services Fund — Class A [] S&P 500 Index+ [] S&P Financial Index++ |
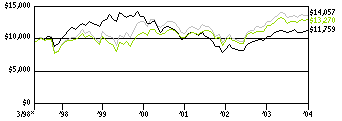 |
Yearly periods ended November 30 |
The Fund's growth of an assumed $10,000 investment is adjusted for the maximum sales charge of 5.75%. This results in a net initial investment of $9,425. The growth of $10,000 is cumulative.
Comparative Results (Adjusted for Maximum Sales Charge) as of 11/30/04 |
Scudder-Dreman Financial Services Fund | 1-Year | 3-Year | 5-Year | Life of Fund* |
Class A | Growth of $10,000 | $10,433 | $11,716 | $12,814 | $13,270 |
Average annual total return | 4.33% | 5.42% | 5.08% | 4.29% |
Class B | Growth of $10,000 | $10,673 | $11,920 | $12,946 | $13,312 |
Average annual total return | 6.73% | 6.03% | 5.30% | 4.34% |
Class C | Growth of $10,000 | $10,984 | $12,143 | $13,075 | $13,371 |
Average annual total return | 9.84% | 6.69% | 5.51% | 4.41% |
S&P 500 Index+ | Growth of $10,000 | $11,286 | $10,844 | $9,117 | $11,759 |
Average annual total return | 12.86% | 2.74% | -1.83% | 2.46% |
S&P Financial Index++ | Growth of $10,000 | $11,157 | $12,154 | $13,344 | $14,057 |
Average annual total return | 11.57% | 6.72% | 5.94% | 5.24% |
The growth of $10,000 is cumulative.
* The Fund commenced operations on March 9, 1998. Index returns begin March 31, 1998.
+ The Standard & Poor's (S&P) 500 Index is a capitalization-weighted index of 500 stocks. The index is designed to measure performance of the broad domestic economy through changes in the aggregate market value of 500 stocks representing all major industries.
++ The Standard & Poor's (S&P) Financial Index is an unmanaged index that gauges the performance of financial companies within the S&P 500 Index.
Index returns assume reinvestment of dividends and, unlike Fund returns, do not reflect any fees or expenses. It is not possible to invest directly into an index.
Class A Lipper Rankings — Financial Services Funds Category as of 11/30/04 |
Period | Rank | | Number of Funds Tracked | Percentile Ranking |
1-Year | 83 | of | 107 | 77 |
3-Year | 54 | of | 95 | 57 |
5-Year | 54 | of | 68 | 79 |
Source: Lipper Inc. Rankings are historical and do not guarantee future results. Rankings are based on total return unadjusted for sales charges with distributions reinvested. If sales charges had been included, rankings might have been less favorable. Rankings are for Class A shares; other share classes may vary.
Information About Your Fund's Expenses |
|
 As an investor of the Fund, you incur two types of costs: ongoing expenses and transaction costs. Ongoing expenses include management fees, distribution and service (12b-1) fees and other Fund expenses. Examples of transaction costs include sales charges (loads), redemption fees and account maintenance fees, which are not shown in this section. The following tables are intended to help you understand your ongoing expenses (in dollars) of investing in the Fund and to help you compare these expenses with the ongoing expenses of investing in other mutual funds. The tables are based on an investment of $1,000 made at the beginning of the six-month period ended November 30, 2004.
The tables illustrate your Fund's expenses in two ways:
Actual Fund Return. This helps you estimate the actual dollar amount of ongoing expenses (but not transaction costs) paid on a $1,000 investment in the Fund using the Fund's actual return during the period. To estimate the expenses you paid over the period, simply divide your account value by $1,000 (for example, an $8,600 account value divided by $1,000 = 8.6), then multiply the result by the number in the "Expenses Paid per $1,000" line under the share class you hold.
Hypothetical 5% Fund Return. This helps you to compare your Fund's ongoing expenses (but not transaction costs) with those of other mutual funds using the Fund's actual expense ratio and a hypothetical rate of return of 5% per year before expenses. Examples using a 5% hypothetical fund return may be found in the shareholder reports of other mutual funds. The hypothetical account values and expenses may not be used to estimate the actual ending account balance or expenses you paid for the period.
Please note that the expenses shown in these tables are meant to highlight your ongoing expenses only and do not reflect any transaction costs. The "Expenses Paid per $1,000" line of the tables is useful in comparing ongoing expenses only and will not help you determine the relative total expense of owning different funds. If these transaction costs had been included, your costs would have been higher.
Expenses and Value of a $1,000 Investment
for the six months ended November 30, 2004 |
Actual Fund Return | Class A | Class B | Class C |
Beginning Account Value 6/1/04 | $ 1,000.00 | $ 1,000.00 | $ 1,000.00 |
Ending Account Value 11/30/04 | $ 1,049.60 | $ 1,045.10 | $ 1,045.10 |
Expenses Paid per $1,000* | $ 7.84 | $ 11.79 | $ 11.96 |
Hypothetical 5% Fund Return | Class A | Class B | Class C |
Beginning Account Value 6/1/04 | $ 1,000.00 | $ 1,000.00 | $ 1,000.00 |
Ending Account Value 11/30/04 | $ 1,017.42 | $ 1,013.54 | $ 1,013.37 |
Expenses Paid per $1,000* | $ 7.72 | $ 11.61 | $ 11.78 |
* Expenses are equal to the Fund's annualized expense ratio for each share class, multiplied by the average account value over the period, multiplied by the number of days in the most recent six-month period, then divided by 365.
Annualized Expense Ratios | Class A | Class B | Class C |
Scudder-Dreman Financial Services Fund | 1.53% | 2.30% | 2.33% |
For more information, please refer to the Fund's prospectus.
Portfolio Management Review |
|
 Scudder-Dreman Financial Services Fund:
A Team Approach to Investing
Deutsche Investment Management Americas Inc. ("DeIM" or the "Advisor"), which is part of Deutsche Asset Management, is the investment advisor for Scudder-Dreman Financial Services Fund. DeIM and its predecessors have more than 80 years of experience managing mutual funds and DeIM provides a full range of investment advisory services to institutional and retail clients.
Deutsche Asset Management is a global asset management organization that offers a wide range of investing expertise and resources. This well-resourced global investment platform brings together a wide variety of experience and investment insight across industries, regions, asset classes and investing styles.
DeIM is an indirect, wholly owned subsidiary of Deutsche Bank AG. Deutsche Bank AG is a major global banking institution that is engaged in a wide range of financial services, including investment management, mutual funds, retail, private and commercial banking, investment banking and insurance.
Dreman Value Management, LLC ("DVM"), Aspen, Colorado, is the subadvisor for the fund. DVM was founded in 1977 and currently manages over $12 billion in assets as of November 30, 2004.
Portfolio Manager
Dreman Value Management, LLC is the subadvisor for the fund.
David N. Dreman
Lead Portfolio Manager
Began investment career in 1957.
Joined the fund in 1998.
Founder and Chairman, Dreman Value Management, LLC since 1977.
F. James Hutchinson
Portfolio Manager
Began investment career in 1986.
Joined the fund team in 2001.
Prior to that, President and CEO, The Bank of New York, investment management product development and portfolio manager.
In the following interview, Lead Portfolio Manager David N. Dreman addresses the economy, the management team's approach and the resulting performance of Scudder-Dreman Financial Services Fund for the year ended November 30, 2004.
Q: Will you provide an overview of the market environment during the year?
A: Robust growth in the US economy and corporate earnings helped buoy the market early in the period. Through the end of 2003, interest rates and inflation remained relatively low. And the weak US dollar was a boon to many large US multi-national companies, which benefited from increased export business.
The market grew volatile as we entered the new year, when more muted economic growth disappointed and caused many to question the strength and long-term viability of economic recovery. The continued conflict in Iraq, historically high energy prices and a closer-than-expected US presidential campaign further tested investor sentiment. Confused and nervous, investors rotated into and out of traditionally defensive and more economically-sensitive stocks and industry sectors, creating a challenging investment environment.
Short-term interest rates rose during the period. While rising rates hampered performance of certain sub-sectors, the financial services industry as a whole, as measured by the Standard & Poor's Financial Index (S&P Financial Index), advanced 11.57%.1 Industry performance slightly trailed the 12.86% return of the broader market, as measured by the Standard & Poor's 500 Index (S&P 500).2
1 The Standard & Poor's (S&P) Financial Index is an unmanaged index that gauges the performance of financial companies within the S&P 500 Index.
2 The Standard & Poor's (S&P) 500 Index is a capitalization-weighted index of 500 stocks. The index is designed to measure performance of the broad domestic economy through changes in the aggregate market value of 500 stocks representing all major industries.
Index returns assume reinvestment of dividends and, unlike fund returns, do not reflect any fees or expenses. It is not possible to invest directly into an index.
Q: How did the fund perform?
A: Scudder-Dreman Financial Services Fund's Class A shares posted a 10.70% total return for the year ended November 30, 2004. (Returns are for Class A shares, unadjusted for sales charges. If sales charges had been included, returns would have been lower. Past performance is no guarantee of future results. Please see pages 4 through 6 for performance of other share classes and more complete performance information.) This compares with the 12.86% return of the fund's Standard & Poor's 500 index benchmark and the 11.57% total return of its financial benchmark, the S&P Financial Index and the 14.18% average total return of its peers in the Financial Services Funds category, as tracked by Lipper Inc., for the same period.3
3 The Lipper Financial Services Funds category includes those mutual funds that invest a significant portion of their assets in financial stocks.
Index returns represent the reinvestment of all distributions, and unlike fund returns, do not reflect any fees or expenses. It is not possible to invest directly into an index or category.
The primary reason behind the fund's underperformance was its substantially overweight position (proportionally larger) relative to the benchmark index in mortgage provider Fannie Mae. In September, the stock — the fourth-largest holding in the portfolio — was charged with violating accounting rules and misrepresenting its earnings.
Q: Will you explain your "contrarian" value investing philosophy and how it informs investment management decisions for the fund?
A: The classic contrarian value investing philosophy is based on our contention that consensus opinion, especially when it comes to investing, is often wrong. Using a process of "bottom-up" analysis, which takes into account the individual merits of each stock, we seek financial services companies that we believe are fundamentally sound and that have, for one reason or another, fallen out of favor with the investing public. We look for stocks that are trading below what we determine to be their intrinsic values, with prices that are low relative to their earnings (P/E) (the most common measure of how expensive a stock is), book value (P/B) and cash flow (P/CF).4 We also seek companies with dividends greater than the overall market or financial stock average. Typically, these types of companies provide potential for above-market returns over time.
4 P/E is equal to a stock's market capitalization divided by its after-tax earnings over the most recent 12-month period. P/B is equal to a stock's market capitalization divided by its book value. (This ratio compares the market's valuation of a company with the value of that company as indicated on its financial statements.) P/CF is equal to a stock's capitalization divided by its cash flow for the latest fiscal year.
We're always looking for breaks in the market that will enable us to add quality companies to the portfolio when their stock prices have reached, or are on their way to reaching, what we believe are temporary lows.
Q: Which portfolio management strategies or stocks contributed most to performance during the period?
A: Individual stock selection proved more important than sub-sector positioning during the period. The portfolio's top performers all were among its 10 largest holdings, including: Bank of America Corp., American Express Co. and Freddie Mac.
Bank of America Corp.'s stock price soared during the period, and we believe there's room for greater growth. The stock has rebounded steadily from temporary lows sustained after the company's ultimately successful bid to acquire FleetBoston at a substantial premium was announced in October 2003. Even at current levels (as of November 30, 2004), Bank of America Corp. remains among the lowest-priced major money center banks, and earnings growth is robust.
American Express Co., through its three operating segments, provides travel, financial advisory and international banking services throughout the world. Increased customer credit card spending, higher balances and improved travel sales helped support earnings growth during the period. The company's businesses gained strength as the year progressed, and we would expect this momentum to continue for the foreseeable future.
The portfolio's largest holding, mortgage giant Freddie Mac, continued to recover from losses suffered after an investigation into the company's accounting practices was launched by regulators nearly two years ago. The charges badly damaged the company, turning away investors, who today are acutely sensitive to any suggestion of wrongdoing. After intensive analysis, no evidence of illegal action of any kind has been found. While Freddie Mac has not been formally vindicated, investors now appear to be more favorably inclined toward the company, which we believe offers significant value, characterized by low P/E ratios relative to the benchmark average and strong earnings growth.
Freddie Mac, along with Fannie Mae (another core holding, with which the company tends to trade in tandem) remained locked in a battle with the Bush administration during the period. In response to the allegations against Freddie Mac, the administration — which tends to disfavor government-sponsored enterprise — introduced tough, new regulatory guidelines, which have yet to be approved by Congress. We believe that a compromise on somewhat less stringent regulations soon will be reached.
Despite its impact on the fund's short-term performance, we have maintained the stock's heavy overweight relative to the benchmark throughout this ordeal. We believed all along that our patience and fortitude would be rewarded in time. We are pleased to see the stock rebounding and we look forward to its continued advance. We believe Freddie Mac is poised to benefit from its proven management of interest rate risk, which should help the company increase its mortgage portfolio holdings and earnings growth.
Q: Were there strategies or specific stocks that disappointed?
A: Allegations of wrongdoing roiled the financial services industry. Fannie Mae took its turn under the media microscope, becoming a target of investigation, while three of the world's largest financial services providers — Citigroup, Inc., Marsh & McLennan Companies, Inc. and American International Group, Inc. (AIG) — suffered severe losses after breaches of securities regulations were revealed.
In September 2004, the Office of Federal Housing Enterprise Oversight accused Fannie Mae of violating accounting rules and misrepresenting its earnings. A damaging report, released to the public, hit the stock hard.
After the close of the fiscal period, the SEC agreed that Fannie Mae's accounting was improper. As a result, the company's chief executive officer has retired and its chief financial officer resigned.
No strangers to controversy, we intend to maintain the stock's prominent position in the portfolio, despite its cost to the fund's short-term performance. We believe that Fannie Mae, like Freddie Mac, continues to offer shareholders potential value, with remarkably low relative P/E ratios and strong earnings growth. Also like Freddie Mac, Fannie Mae is, in our view, poised to benefit from its proven management of interest rate risk. We are confident that the stock will recover as the controversy abates and the media cloud is lifted.
In September 2004, Japan's Financial Services Agency ordered Citigroup, Inc. to shut down its private banking business in that country after it was discovered that the company had breached securities regulations. Citigroup, Inc. admitted the infraction, saying that its Japanese private banking division had weak internal controls and lax corporate governance due in part to the division's emphasis on revenue.
The fund held a significantly underweight position (proportionally smaller) in the stock than compared with the benchmark S&P Financial Index. While the portfolio suffered losses on an absolute basis, losses relative to the index were somewhat less.
Citigroup, Inc. is working diligently to "clean up its act." A number of senior executives have been fired or asked to leave and the remaining senior staff is working with regulators and others to rebuild trust. Citigroup, Inc. is a highly diversified global company. While we are, of course, disappointed by this incident and with the problems endemic to this division, we believe the company is working to prevent such issues from recurring and that it will continue to prosper.
In October 2004, New York Attorney General Eliot Spitzer charged Marsh & McLennan Companies, Inc., the world's largest insurance broker, with allegedly rigging bids and accepting payments, known as "contingent commissions," in return for steering business to favored insurers. The company's chairman and chief executive officer resigned in response. The newly appointed chairman and CEO is working to reach a settlement agreement with Spitzer, who would like to see the company give back some portion of the $1.8 billion it received in contingent commissions during the past three years. Most experts agree that Marsh & McLennan Companies, Inc., which also is facing other legal actions, likely will be forced to pay back at least $500 million.
At the time charges were filed, the fund held a relatively small stake in Marsh & McLennan Companies, Inc. We sold just less than half of the portfolio's position when the stock began to regain value. Marsh & McLennan Companies, Inc. accounted for 0.30% of the portfolio's total market value as of the period's end.
American International Group, Inc. (AIG), which has long been among the fund's core holdings, also suffered losses due to the controversy, as some of the company's insurance products were implicated in the complaint. We took advantage of weakness in that stock to add to our position and have already recognized gains for the fund. AIG has relatively little brokerage exposure and continues to exhibit fundamental strength, broad risk diversification and tremendous prospects for growth.
Dealing with events like these is always difficult. Even first-rate research and analysis — which we believe we have — can provide no forewarning, and a stock's value can drop quickly and dramatically when news of wrongdoing breaks. The most we can do is to consider each case on its own merits, as we have here, and act in what we believe is the shareholder's best interest. Often we have found negative news has resulted in a major price overreaction from which patient investors can sometimes benefit from.
Q: Do you have any closing comments for shareholders?
A: Given today's interest rate environment and historically high commodities prices, investors are more reluctant to pay the high multiples of growth stocks, which bodes well for value investing in general. In terms of the fund, we are pleased with the portfolio's composition and believe it is positioned to perform well in today's interest rate environment.
At the end of the period, the portfolio had less exposure than the benchmark S&P Financial Index to the consumer finance industry, which we believe is threatened by high levels of consumer debt. The current interest rate environment, we believe, threatens the performance of investment banks and brokers, despite a recent flurry of activity. Consequently, the fund is less exposed to brokers and investment banks than its financial benchmark. Finally, we maintained the fund's underweight position relative to the index in real estate investment trusts.
As always, we are thankful for the continued support of our shareholders. We believe that our time-tested contrarian approach can help our shareholders achieve their long-term investment goals. We look forward to serving their needs in the days ahead.
The views expressed in this report reflect those of the portfolio managers only through the end of the period of the report as stated on the cover. The managers' views are subject to change at any time based on market and other conditions and should not be construed as a recommendation.
Portfolio Summary November 30, 2004 |
|
Asset Allocation (Excludes Cash Equivalents and Securities Lending Collateral) | 11/30/04 | 11/30/03 |
|
Common Stocks | 100% | 100% |
Industry Diversification (Excludes Cash Equivalents and Securities Lending Collateral) | 11/30/04 | 11/30/03 |
|
Banks | 42% | 45% |
Diversified Financial Services | 33% | 37% |
Insurance | 12% | 14% |
Capital Markets | 9% | 1% |
Consumer Finance | 4% | 3% |
| 100% | 100% |
Asset allocation and sector diversification are subject to change.
Ten Largest Equity Holdings at November 30, 2004 (63.2% of Net Assets) |
1. Freddie Mac Supplier of mortgage credit | 10.8% |
2. American International Group, Inc. Provider of insurance services | 8.9% |
3. Citigroup, Inc. Provider of diversified financial services | 8.0% |
4. Fannie Mae Facilitator of mortgages and issuer of mortgage-backed securities | 8.0% |
5. Bank of America Corp. Provider of commercial banking services | 7.7% |
6. Washington Mutual, Inc. Provider of diversified financial services | 5.1% |
7. KeyCorp Provider of commercial banking services | 4.2% |
8. National Bank of Canada Provider of general banking and trust services | 4.0% |
9. US Bancorp Provider of diversified financial services | 3.5% |
10. American Express Co. Provider of travel-related, financial advisory and international banking services | 3.0% |
Portfolio holdings are subject to change.
For more complete details about the Fund's investment portfolio, see page 20. A quarterly Fact Sheet is available upon request. Information concerning portfolio holdings of the Fund as of month end will be posted to scudder.com on the 15th of the following month. Please see the Account Management Resources section for contact information.
Following the Fund's fiscal first and third quarter-end, a complete portfolio holdings listing is filed with the SEC on Form N-Q. The form will be available on the SEC's Web site at www.sec.gov, and it also may be reviewed and copied at the SEC's Public Reference Room in Washington, D.C. Information on the operation of the SEC's Public Reference Room may be obtained by calling (800) SEC-0330.
Investment Portfolio as of November 30, 2004 |  |  |
|
|
Shares
| Value ($) |
| |
Common Stocks 99.7% |
Financials 99.7% |
Banks 41.6% |
Bank of America Corp. | 203,756 | 9,427,790 |
Banknorth Group, Inc. | 42,900 | 1,543,113 |
Golden West Financial Corp. | 15,200 | 1,812,448 |
Independence Community Bank Corp. | 13,700 | 581,976 |
KeyCorp | 152,900 | 5,090,041 |
Mercantile Bankshares Corp. | 29,500 | 1,519,250 |
National Bank of Canada | 125,000 | 4,918,189 |
National City Corp. | 49,025 | 1,817,847 |
PNC Financial Services Group | 51,200 | 2,785,280 |
Popular, Inc. | 79,500 | 2,106,750 |
Regions Financial Corp. | 21,500 | 752,285 |
Sovereign Bancorp, Inc. | 98,700 | 2,156,595 |
Sterling Financial Corp.* | 836 | 33,398 |
US Bancorp | 146,500 | 4,340,795 |
Wachovia Corp. | 65,800 | 3,405,150 |
Washington Mutual, Inc. | 154,300 | 6,281,553 |
Wells Fargo & Co. | 39,700 | 2,452,269 |
| 51,024,729 |
Capital Markets 9.0% |
Bear Stearns Companies, Inc. | 19,200 | 1,873,536 |
Franklin Resources, Inc. | 22,600 | 1,483,238 |
Goldman Sachs Group, Inc. | 16,000 | 1,676,160 |
Lehman Brothers Holdings, Inc. | 16,100 | 1,348,858 |
Merrill Lynch & Co., Inc. | 40,200 | 2,239,542 |
Morgan Stanley | 45,900 | 2,329,425 |
Piper Jaffray Companies, Inc.* | 1,802 | 82,910 |
| 11,033,669 |
Consumer Finance 4.0% |
American Express Co. | 67,000 | 3,732,570 |
SLM Corp. | 23,800 | 1,217,846 |
| 4,950,416 |
Diversified Financial Services 32.9% |
Allied Capital Corp. (d) | 62,900 | 1,737,298 |
CIT Group, Inc. | 53,400 | 2,282,850 |
Citigroup, Inc. | 218,300 | 9,768,925 |
Fannie Mae | 142,000 | 9,755,400 |
Freddie Mac | 193,700 | 13,221,962 |
JPMorgan Chase & Co. | 94,584 | 3,561,087 |
| 40,327,522 |
Insurance 12.1% |
Allstate Corp. | 32,800 | 1,656,400 |
American International Group, Inc. | 171,550 | 10,867,692 |
Chubb Corp. | 21,300 | 1,623,273 |
Marsh & McLennan Companies, Inc. | 12,950 | 370,241 |
St. Paul Travelers Companies, Inc. | 7,000 | 255,360 |
| 14,772,966 |
Real Estate 0.1% |
Government Properties Trust, Inc. (REIT) | 13,000 | 137,800 |
Total Common Stocks (Cost $83,815,940) | 122,247,102 |
|
Securities Lending Collateral 1.3% |
Daily Assets Fund Institutional, 2.01% (c) (e) (Cost $1,590,475) | 1,590,475 | 1,590,475 |
|
Cash Equivalents 0.3% |
Scudder Cash Management QP Trust, 1.97% (b) (Cost $321,244) | 321,244 | 321,244 |
| % of Net Assets | Value ($) |
| |
Total Investment Portfolio (Cost $85,727,659) (a) | 101.3 | 124,158,821 |
Other Assets and Liabilities, Net | (1.3) | (1,586,756) |
Net Assets | 100.0 | 122,572,065 |
* Non-income producing security
(a) The cost for federal income tax purposes was $86,527,701. At November 30, 2004, net unrealized appreciation for all securities based on tax cost was $37,631,120. This consisted of aggregate gross unrealized appreciation for all securities in which there was an excess of value over tax cost of $37,634,759 and aggregate gross unrealized depreciation for all securities in which there was an excess of tax cost over value of $3,639.
(b) Scudder Cash Management QP Trust is managed by Deutsche Investment Management Americas Inc. The rate shown is the annualized seven-day yield at period end.
(c) Daily Assets Fund Institutional, an affiliated fund, is managed by Deutsche Asset Management, Inc. The rate shown is the annualized seven-day yield at period end.
(d) A portion of the security was on loan. The value of the security loaned at November 30, 2004 amounted to $1,555,006, which is 1.3% of net assets.
(e) Represents collateral held in connection with securities lending.
REIT: Real Estate Investment Trust
The accompanying notes are an integral part of the financial statements.
Statement of Assets and Liabilities as of November 30, 2004 |
Assets |
Investments: Investments in securities, at value (cost $83,815,940) — including $1,555,006 of securities loaned | $ 122,247,102 |
Investment in Scudder Cash Management QP Trust (cost $321,244) | 321,244 |
Investment in Daily Asset Fund Institutional (cost $1,590,475)* | 1,590,475 |
Total investments in securities, at value (cost $85,727,659) | 124,158,821 |
Cash | 98,771 |
Receivable for investments sold | 352,179 |
Dividends receivable | 108,227 |
Interest receivable | 11,919 |
Receivable for Fund shares sold | 33,719 |
Other assets | 23,456 |
Total assets | 124,787,092 |
Liabilities |
Payable for Fund shares redeemed | 285,583 |
Payable upon return of securities loaned | 1,590,475 |
Accrued management fee | 82,288 |
Other accrued expenses and payables | 256,681 |
Total liabilities | 2,215,027 |
Net assets, at value | $ 122,572,065 |
Net Assets |
Net assets consist of: Undistributed net investment income | 555,205 |
Net unrealized appreciation (depreciation) on investments | 38,431,162 |
Accumulated net realized gain (loss) | (12,082,813) |
Paid-in capital | 95,668,511 |
Net assets, at value | $ 122,572,065 |
* Represents collateral on securities loaned.
The accompanying notes are an integral part of the financial statements.
Statement of Assets and Liabilities as of November 30, 2004 (continued) |
Net Asset Value |
Class A Net Asset Value and redemption price per share ($81,627,066 ÷ 6,545,983 outstanding shares of beneficial interest, $.01 par value, unlimited number of shares authorized) | $ 12.47 |
Maximum offering price per share (100 ÷ 94.25 of $12.47) | $ 13.23 |
Class B Net Asset Value, offering and redemption price (subject to contingent deferred sales charge) per share ($29,180,816 ÷ 2,368,050 outstanding shares of beneficial interest, $.01 par value, unlimited number of shares authorized) | $ 12.32 |
Class C Net Asset Value, offering and redemption price (subject to contingent deferred sales charge) per share ($11,764,183 ÷ 951,857 outstanding shares of beneficial interest, $.01 par value, unlimited number of shares authorized) | $ 12.36 |
The accompanying notes are an integral part of the financial statements.
Statement of Operations for the year ended November 30, 2004 |
Investment Income |
Dividends (net of foreign taxes withheld of $27,190) | $ 3,451,577 |
Securities lending income, including income from Daily Assets Fund Institutional | 64,522 |
Interest — Scudder Cash Management QP Trust | 4,906 |
Total Income | 3,521,005 |
Expenses: Management fee | 992,095 |
Services to shareholders | 369,299 |
Custodian and accounting fees | 94,215 |
Distribution service fees | 757,782 |
Auditing | 45,465 |
Legal | 16,534 |
Trustees' fees and expenses | 23,319 |
Reports to shareholders | 32,305 |
Registration fees | 23,208 |
Other | 9,710 |
Total expenses, before expense reductions | 2,363,932 |
Expense reductions | (1,131) |
Total expenses, after expense reductions | 2,362,801 |
Net investment income (loss) | 1,158,204 |
Realized and Unrealized Gain (Loss) on Investment Transactions |
Net realized gain (loss) from: Investments | 6,339,740 |
Foreign currency related transactions | 654 |
| 6,340,394 |
Net unrealized appreciation (depreciation) during the period on: Investments | 5,371,947 |
Foreign currency related transactions | (9) |
| 5,371,938 |
Net gain (loss) on investment transactions | 11,712,332 |
Net increase (decrease) in net assets resulting from operations | $ 12,870,536 |
The accompanying notes are an integral part of the financial statements.
Statement of Changes in Net Assets |
Increase (Decrease) in Net Assets | Years Ended November 30, |
2004 | 2003 |
Operations: Net investment income (loss) | $ 1,158,204 | $ 1,199,005 |
Net realized gain (loss) on investment transactions | 6,340,394 | 593,411 |
Net unrealized appreciation (depreciation) on investment transactions during the period | 5,371,938 | 19,365,341 |
Net increase (decrease) in net assets resulting from operations | 12,870,536 | 21,157,757 |
Distributions to shareholders from: Net investment income: Class A | (1,200,985) | (681,095) |
Class B | (460,710) | (12,507) |
Class C | (115,455) | (4,610) |
Fund share transactions: Proceeds from shares sold | 41,980,537 | 16,249,149 |
Reinvestment of distributions | 1,616,202 | 625,595 |
Cost of shares redeemed | (69,127,646) | (35,322,575) |
Net increase (decrease) in net assets from Fund share transactions | (25,530,907) | (18,447,831) |
Increase (decrease) in net assets | (14,437,521) | 2,011,714 |
Net assets at beginning of period | 137,009,586 | 134,997,872 |
Net assets at end of period (including undistributed net investment income of $555,205 and $1,173,497, respectively) | $ 122,572,065 | $ 137,009,586 |
The accompanying notes are an integral part of the financial statements.
Class A |
Years Ended November 30, | 2004 | 2003 | 2002 | 2001 | 2000 |
Selected Per Share Data |
Net asset value, beginning of period | $ 11.46 | $ 9.79 | $ 10.36 | $ 10.27 | $ 9.74 |
Income (loss) from investment operations: Net investment income (loss)a | .14 | .14 | .09 | .06 | .16 |
Net realized and unrealized gain (loss) on investment transactions | 1.07 | 1.65 | (.62) | .16 | .52 |
Total from investment operations | 1.21 | 1.79 | (.53) | .22 | .68 |
Less distributions from: Net investment income | (.20) | (.12) | (.04) | (.13) | (.15) |
Net asset value, end of period | $ 12.47 | $ 11.46 | $ 9.79 | $ 10.36 | $ 10.27 |
Total Return (%)b | 10.70 | 18.44 | (5.19) | 2.08 | 7.14 |
Ratios to Average Net Assets and Supplemental Data |
Net assets, end of period ($ millions) | 82 | 63 | 59 | 75 | 81 |
Ratio of expenses before expense reductions (%) | 1.45 | 1.36 | 1.36 | 1.45 | 1.47c |
Ratio of expenses after expense reductions (%) | 1.45 | 1.36 | 1.36 | 1.45 | 1.46c |
Ratio of net investment income (loss) (%) | 1.21 | 1.36 | .94 | .58 | 1.69 |
Portfolio turnover rate (%) | 4 | 5 | 16 | 17 | 9 |
a Based on average shares outstanding during the period. b Total return does not reflect the effect of any sales charges. c The ratios of operating expenses excluding costs incurred in connection with a fund complex reorganization before and after expense reductions were 1.42% and 1.41%, respectively. |
|
Class B |
Years Ended November 30, | 2004 | 2003 | 2002 | 2001 | 2000 |
Selected Per Share Data |
Net asset value, beginning of period | $ 11.33 | $ 9.64 | $ 10.26 | $ 10.19 | $ 9.65 |
Income (loss) from investment operations: |
Net investment income (loss)a | .05 | .06 | .02 | (.02) | .08 |
Net realized and unrealized gain (loss) on investment transactions | 1.05 | 1.63 | (.64) | .15 | .54 |
Total from investment operations | 1.10 | 1.69 | (.62) | .13 | .62 |
Less distributions from: Net investment income | (.11) | —b | — | (.06) | (.08) |
Net asset value, end of period | $ 12.32 | $ 11.33 | $ 9.64 | $ 10.26 | $ 10.19 |
Total Return (%)c | 9.73 | 17.55 | (6.04) | 1.28 | 6.28 |
Ratios to Average Net Assets and Supplemental Data |
Net assets, end of period ($ millions) | 29 | 62 | 64 | 82 | 85 |
Ratio of expenses (%) | 2.22 | 2.15 | 2.16 | 2.23 | 2.27d |
Ratio of net investment income (loss) (%) | .44 | .57 | .14 | (.20) | .92 |
Portfolio turnover rate (%) | 4 | 5 | 16 | 17 | 9 |
a Based on average shares outstanding during the period. b Amount is less than $.005. c Total return does not reflect the effect of any sales charges. d The ratio of operating expenses excluding costs incurred in connection with a fund complex reorganization was 2.22%. |
|
Class C |
Years Ended November 30, | 2004 | 2003 | 2002 | 2001 | 2000 |
Selected Per Share Data |
Net asset value, beginning of period | $ 11.36 | $ 9.67 | $ 10.28 | $ 10.22 | $ 9.69 |
Income (loss) from investment operations: Net investment income (loss)a | .05 | .06 | .02 | (.02) | .09 |
Net realized and unrealized gain (loss) on investment transactions | 1.06 | 1.63 | (.63) | .15 | .52 |
Total from investment operations | 1.11 | 1.69 | (.61) | .13 | .61 |
Less distributions from: Net investment income | (.11) | —b | — | (.07) | (.08) |
Net asset value, end of period | $ 12.36 | $ 11.36 | $ 9.67 | $ 10.28 | $ 10.22 |
Total Return (%)c | 9.84 | 17.52 | (5.93) | 1.22 | 6.38 |
Ratios to Average Net Assets and Supplemental Data |
Net assets, end of period ($ millions) | 12 | 12 | 12 | 18 | 18 |
Ratio of expenses before expense reductions (%) | 2.22 | 2.11 | 2.13 | 2.19 | 2.23d |
Ratio of expenses after expense reductions (%) | 2.22 | 2.11 | 2.13 | 2.19 | 2.20d |
Ratio of net investment income (loss) (%) | .44 | .61 | .16 | (.16) | .99 |
Portfolio turnover rate (%) | 4 | 5 | 16 | 17 | 9 |
a Based on average shares outstanding during the period. b Amount is less than $.005. c Total return does not reflect the effect of any sales charges. d The ratios of operating expenses excluding costs incurred in connection with a fund complex reorganization before and after expense reductions were 2.17% and 2.14%, respectively. |
Notes to Financial Statements |
|
 A. Significant Accounting Policies
Scudder-Dreman Financial Services Fund (the ``Fund'') is a nondiversified series of Scudder Equity Trust (the ``Trust'') which is registered under the Investment Company Act of 1940, as amended (the ``1940 Act''), as an open-end management investment company organized as a Massachusetts business trust.
The Fund offers multiple classes of shares which provide investors with different purchase options. Class A shares are offered to investors subject to an initial sales charge. Class B shares are offered without an initial sales charge but are subject to higher ongoing expenses than Class A shares and a contingent deferred sales charge payable upon certain redemptions. Class B shares automatically convert to Class A shares six years after issuance. Class C shares are offered without an initial sales charge but are subject to higher ongoing expenses than Class A shares and a contingent deferred sales charge payable upon certain redemptions within one year of purchase. Prior to March 1, 2004, Class C shares were offered with an initial sales charge. Class C shares do not convert into another class.
Investment income, realized and unrealized gains and losses, and certain fund-level expenses and expense reductions, if any, are borne pro rata on the basis of relative net assets by the holders of all classes of shares, except that each class bears certain expenses unique to that class such as distribution service fees, services to shareholders and certain other class-specific expenses. Differences in class-level expenses may result in payment of different per share dividends by class. All shares of the Fund have equal rights with respect to voting subject to class-specific arrangements.
The Fund's financial statements are prepared in accordance with accounting principles generally accepted in the United States of America which require the use of management estimates. Actual results could differ from those estimates. The policies described below are followed consistently by the Fund in the preparation of its financial statements.
Security Valuation. Investments are stated at value determined as of the close of regular trading on the New York Stock Exchange on each day the exchange is open for trading. Equity securities are valued at the most recent sale price or official closing price reported on the exchange (US or foreign) or over-the-counter market on which the security is traded most extensively. Securities for which no sales are reported are valued at the calculated mean between the most recent bid and asked quotations on the relevant market or, if a mean cannot be determined, at the most recent bid quotation.
Money market instruments purchased with an original or remaining maturity of sixty days or less, maturing at par, are valued at amortized cost. Investments in open-end investment companies and Scudder Cash Management QP Trust are valued at their net asset value each business day.
Securities and other assets for which market quotations are not readily available or for which the above valuation procedures are deemed not to reflect fair value are valued in a manner that is intended to reflect their fair value as determined in accordance with procedures approved by the Trustees.
Securities Lending. The Fund may lend securities to financial institutions. The Fund retains beneficial ownership of the securities it has loaned and continues to receive interest and dividends paid by the securities and to participate in any changes in their market value. The Fund requires the borrowers of the securities to maintain collateral with the Fund consisting of liquid, unencumbered assets having a value at least equal to the value of the securities loaned. The Fund may invest the cash collateral into a joint trading account in an affiliated money market fund pursuant to Exemptive Orders issued by the SEC. The Fund receives compensation for lending its securities either in the form of fees or by earning interest on invested cash collateral net of fees paid to a lending agent. Either the Fund or the borrower may terminate the loan. The Fund is subject to all investment risks associated with the value of any cash collateral received, including, but not limited to, interest rate, credit and liquidity risk associated with such investments.
Foreign Currency Translations. The books and records of the Fund are maintained in US dollars. Investment securities and other assets and liabilities denominated in a foreign currency are translated into US dollars at the prevailing exchange rates at period end. Purchases and sales of investment securities, income and expenses are translated into US dollars at the prevailing exchange rates on the respective dates of the transactions.
Net realized and unrealized gains and losses on foreign currency transactions represent net gains and losses between trade and settlement dates on securities transactions, the disposition of forward foreign currency exchange contracts and foreign currencies, and the difference between the amount of net investment income accrued and the US dollar amount actually received. That portion of both realized and unrealized gains and losses on investments that results from fluctuations in foreign currency exchange rates is not separately disclosed but is included with net realized and unrealized gains and losses on investment securities.
Federal Income Taxes. The Fund's policy is to comply with the requirements of the Internal Revenue Code, as amended, which are applicable to regulated investment companies, and to distribute all of its taxable income to its shareholders. Accordingly, the Fund paid no federal income taxes and no federal income tax provision was required.
At November 30, 2004, the Fund had a net tax basis capital loss carryforward of approximately $11,283,000 which may be applied against any realized net taxable capital gains of each succeeding year until fully utilized or until November 30, 2010, the expiration date, whichever occurs first.
Distribution of Income and Gains. Distributions of net investment income, if any, are made semiannually. Net realized gains from investment transactions, in excess of available capital loss carryforwards, would be taxable to the Fund if not distributed, and, therefore, will be distributed to shareholders at least annually.
The timing and characterization of certain income and capital gains distributions are determined annually in accordance with federal tax regulations which may differ from accounting principles generally accepted in the United States of America. These differences primarily relate to certain securities sold at a loss. As a result, net investment income (loss) and net realized gain (loss) on investment transactions for a reporting period may differ significantly from distributions during such period. Accordingly, the Fund may periodically make reclassifications among certain of its capital accounts without impacting the net asset value of the Fund.
At November 30, 2004, the Fund's components of distributable earnings (accumulated losses) on a tax-basis were as follows:
Undistributed ordinary income* | $ 556,139 |
Undistributed net long-term capital gains | $ — |
Capital loss carryforwards | $ (11,283,000) |
Net unrealized appreciation (depreciation) on investments | $ 37,631,120 |
In addition, the tax character of distributions paid to shareholders by the Fund is summarized as follows:
| Years Ended November 30, |
| 2004 | 2003 |
Distributions from ordinary income | $ 1,777,150 | $ 698,212 |
* For tax purposes short-term capital gains distributions are considered ordinary income distributions.
Other. Investment transactions are accounted for on a trade date plus one basis for daily net asset value calculations. However, for financial reporting purposes, investment transactions are reported on trade date. Interest income is recorded on the accrual basis. Dividend income is recorded on the ex-dividend date net of foreign withholding taxes. Certain dividends from foreign securities may be recorded subsequent to the ex-dividend date as soon as the Fund is informed of such dividends. Realized gains and losses from investment transactions are recorded on an identified cost basis.
B. Purchases and Sales of Securities
During the year ended November 30, 2004, purchases and sales of investment securities (excluding short-term investments) aggregated $5,635,293 and $31,791,912, respectively.
C. Related Parties
Management Agreement. Under the Management Agreement with Deutsche Investment Management Americas Inc. ("DeIM" or the "Advisor") an indirect, wholly owned subsidiary of Deutsche Bank AG, the Advisor directs the investments of the Fund in accordance with its investment objectives, policies and restrictions. The Advisor determines the securities, instruments and other contracts relating to investments to be purchased, sold or entered into by the Fund. In addition to portfolio management services, the Advisor provides certain administrative services in accordance with the Management Agreement. The management fee payable under the Management Agreement is equal to an annual rate of 0.75% of the first $250,000,000 of the Fund's average daily net assets, 0.72% of the next $750,000,000 of such net assets, 0.70% of the next $1,500,000,000 of such net assets, 0.68% of the next $2,500,000,000 of such net assets, 0.65% of the next $2,500,000,000 of such net assets, 0.64% of the next $2,500,000,000 of such net assets, 0.63% of the next $2,500,000,000 of such net assets and 0.62% of such net assets in excess of $12,500,000,000, computed and accrued daily and payable monthly. Accordingly, for the year ended November 30, 2004, the fee pursuant to the Management Agreement was equivalent to an annual effective rate of 0.75% of the Fund's average daily net assets. Dreman Value Management, L.L.C. ("DVM") serves as subadvisor with respect to the investment and reinvestment of assets in the Fund. DVM is paid by the Advisor for its services.
In addition, for the year ended November 30, 2004, the Advisor agreed to reimburse the Fund $1,096, which represents a portion of the fee savings expected to be realized by the Advisor related to the outsourcing by the Advisor of certain administrative services to an unaffiliated service provider.
Effective October 1, 2003 through September 30, 2005, the Advisor has agreed to contractually waive all or a portion of its management fee and reimburse or pay certain operating expenses of the Fund to the extent necessary to maintain the operating expenses of each class at 1.40% average daily net assets for Class A, B and C shares, respectively (excluding certain expenses such as extraordinary expenses, taxes, brokerage, interest, Rule 12b-1 distribution and/or service fees, trustees and trustee counsel fees and organizational and offering expenses).
Service Provider Fees. Scudder Investments Service Company ("SISC"), an affiliate of the Advisor, is the transfer, dividend-paying and shareholder service agent. Pursuant to a sub-transfer agency agreement between SISC and DST Systems, Inc. ("DST"), SISC has delegated certain transfer agent and dividend paying agent functions to DST. The costs and expenses of such delegation are borne by SISC, not by the Fund. For the year ended November 30, 2004, the amounts charged to the Fund by SISC were as follows:
Services to Shareholders | Total Aggregated | Unpaid at November 30, 2004 |
Class A | $ 168,010 | $ 56,753 |
Class B | 112,177 | 32,845 |
Class C | 29,578 | 10,210 |
| $ 309,765 | $ 99,808 |
Scudder Fund Accounting Corporation ("SFAC"), an affiliate of the Advisor, is responsible for computing the daily net asset value per share and maintaining the portfolio and general accounting records of the Fund. SFAC has retained State Street Bank and Trust Company to provide certain administrative, fund accounting and record-keeping services to the Fund. For the year ended November 30, 2004, the amount charged to the Fund by SFAC for accounting services aggregated $79,875, of which $30,306 is unpaid at November 30, 2004.
Distribution Service Agreement. Under the Distribution Service Agreement, in accordance with Rule 12b-1 under the 1940 Act, Scudder Distributors, Inc. ("SDI"), an affiliate of the Advisor, receives a fee ("Distribution Fee") of 0.75% of average daily net assets of Class B and C shares. Pursuant to the agreement, SDI enters into related selling group agreements with various firms at various rates for sales of Class B and C shares. For the year ended November 30, 2004, the Distribution Fee was as follows:
Distribution Fee | Total Aggregated | Unpaid at November 30, 2004 |
Class B | $ 341,521 | $ 20,532 |
Class C | 93,077 | 7,943 |
| $ 434,598 | $ 28,475 |
In addition, SDI provides information and administrative services ("Service Fee") to Class A, B and C shareholders at an annual rate of up to 0.25% of average daily net assets for each such class. SDI in turn has various agreements with financial services firms that provide these services and pays these fees based upon the assets of shareholder accounts the firms service. For the year ended November 30, 2004, the Service Fee was as follows:
Service Fee | Total Aggregated | Unpaid at November 30, 2004 | Annual Effective Rate |
Class A | $ 179,374 | $ 14,057 | .24% |
Class B | 113,361 | 4,240 | .25% |
Class C | 30,449 | 1,451 | .25% |
| $ 323,184 | $ 19,748 | |
Underwriting Agreement and Contingent Deferred Sales Charge. SDI is the principal underwriter for the Fund. Underwriting commissions paid by shareholders in connection with the distribution of Class A and C shares for the year ended November 30, 2004 aggregated $11,182 and $131, respectively.
In addition, SDI receives any contingent deferred sales charge ("CDSC") from Class B share redemptions occurring within six years of purchase and Class C share redemptions occurring within one year of purchase. There is no such charge upon redemption of any share appreciation or reinvested dividends. The CDSC is based on declining rates ranging from 4% to 1% for Class B and 1% for Class C, of the value of shares redeemed. For the year ended November 30, 2004, the CDSC for Class B and C shares aggregated $91,523 and $3,718, respectively. A deferred sales charge of up to 1% is assessed on certain redemptions of Class A shares. For the year ended November 30, 2004, SDI received $54.
Trustees' Fees and Expenses. The Fund pays each Trustee not affiliated with the Advisor retainer fees plus specified amounts for attended board and committee meetings.
Scudder Cash Management QP Trust. Pursuant to an Exemptive Order issued by the SEC, the Fund may invest in the Scudder Cash Management QP Trust (the
"QP Trust") and other affiliated funds managed by the Advisor. The QP Trust seeks to provide as high a level of current income as is consistent with the preservation of capital and the maintenance of liquidity. The QP Trust does not pay the Advisor a management fee for the affiliated funds' investments in the QP Trust.
D. Expense Off-Set Arrangement
The Fund has entered into an arrangement with its custodian whereby credits realized as a result of uninvested cash balances were used to reduce a portion of the Fund's custodian expenses. During the year ended November 30, 2004, the custodian fee was reduced by $35 for custodian credits earned.
E. Line of Credit
The Fund and several other affiliated funds (the ``Participants'') share in a $1.25 billion revolving credit facility administered by J.P. Morgan Chase Bank for temporary or emergency purposes, including the meeting of redemption requests that otherwise might require the untimely disposition of securities. The Participants are charged an annual commitment fee which is allocated based upon net assets, among each of the Participants. Interest is calculated at the Federal Funds Rate plus 0.5 percent. The Fund may borrow up to a maximum of 33 percent of its net assets under the agreement.
F. Share Transactions
The following table summarizes share and dollar activity in the Fund:
| Year Ended
November 30, 2004 | Year Ended
November 30, 2003 |
| Shares | Dollars | Shares | Dollars |
Shares sold |
Class A | 3,034,204 | $ 36,516,393 | 1,020,383 | $ 10,420,187 |
Class B | 223,753 | 2,676,472 | 423,542 | 4,231,162 |
Class C | 232,599 | 2,787,672 | 157,533 | 1,597,800 |
| | $ 41,980,537 | | $ 16,249,149 |
Shares issued to shareholders in reinvestment of distributions |
Class A | 93,127 | $ 1,089,268 | 62,557 | $ 610,230 |
Class B | 36,648 | 421,586 | 1,196 | 11,303 |
Class C | 9,076 | 105,348 | 428 | 4,062 |
| | $ 1,616,202 | | $ 625,595 |
Shares redeemed |
Class A | (2,059,543) | $ (24,781,620) | (1,641,963) | $ (16,476,237) |
Class B | (3,372,737) | (40,091,792) | (1,584,594) | (15,705,357) |
Class C | (358,613) | (4,254,234) | (317,183) | (3,140,981) |
| | $ (69,127,646) | | $ (35,322,575) |
Net increase (decrease) |
Class A | 1,067,788 | $ 12,824,041 | (559,023) | $ (5,445,820) |
Class B | (3,112,336) | (36,993,734) | (1,159,856) | (11,462,892) |
Class C | (116,938) | (1,361,214) | (159,222) | (1,539,119) |
| | $ (25,530,907) | | $ (18,447,831) |
G. Regulatory Matters and Litigation
Since at least July 2003, federal, state and industry regulators have been conducting ongoing inquiries and investigations ("inquiries") into the mutual fund industry, and have requested information from numerous mutual fund companies, including Scudder Investments. It is not possible to determine what the outcome of these inquiries will be or what the effect, if any, would be on the funds or their advisors. Publicity about mutual fund practices arising from these industry-wide inquiries serves as the general basis of a number of private lawsuits against the Scudder funds. These lawsuits, which previously have been reported in the press, involve purported class action and derivative lawsuits, making various allegations and naming as defendants various persons, including certain Scudder funds, the funds' investment advisors and their affiliates, certain individuals, including in some cases fund Trustees/Directors, officers, and other parties. Each Scudder fund's investment advisor has agreed to indemnify the applicable Scudder funds in connection with these lawsuits, or other lawsuits or regulatory actions that may be filed making allegations similar to these lawsuits regarding market timing, revenue sharing, fund valuation or other subjects arising from or related to the pending inquiries. Based on currently available information, the funds' investment advisors believe the likelihood that the pending lawsuits will have a material adverse financial impact on a Scudder fund is remote and such actions are not likely to materially affect their ability to perform under their investment management agreements with the Scudder funds.
Report of Independent Registered Public Accounting Firm |
|
To the Board of Trustees and Shareholders of Scudder-Dreman Financial Services Fund:
We have audited the accompanying statement of assets and liabilities, including the investment portfolio, of the Scudder-Dreman Financial Services Fund, one of a series of Scudder Equity Trust (the "Trust"), as of November 30, 2004, and the related statement of operations for the year then ended, the statements of changes in net assets for each of the two years in the period then ended, and the financial highlights for each of the five years in the period then ended. These financial statements and financial highlights are the responsibility of the Trust's management. Our responsibility is to express an opinion on these financial statements and financial highlights based on our audits.
We conducted our audits in accordance with the standards of the Public Company Accounting Oversight Board (United States). Those standards require that we plan and perform the audit to obtain reasonable assurance about whether the financial statements and financial highlights are free of material misstatement. An audit includes examining, on a test basis, evidence supporting the amounts and disclosures in the financial statements and financial highlights. Our procedures included confirmation of securities owned as of November 30, 2004, by correspondence with the custodian. An audit also includes assessing the accounting principles used and significant estimates made by management, as well as evaluating the overall financial statement presentation. We believe that our audits provide a reasonable basis for our opinion.
In our opinion, the financial statements and financial highlights referred to above present fairly, in all material respects, the financial position of the Scudder-Dreman Financial Services Fund at November 30, 2004, the results of its operations for the year then ended, the changes in its net assets for each of the two years in the period then ended, and the financial highlights for each of the five years in the period then ended, in conformity with U.S. generally accepted accounting principles.
Boston, Massachusetts
January 24, 2005 |  |
Tax Information (Unaudited) |
|
For corporate shareholders, 100% of the income dividends paid during the Fund's fiscal year ended November 30, 2004 qualified for the dividends received deduction.
For federal income tax purposes, the Fund designates approximately $3,800,000, or the maximum amount allowable under tax law, as qualified dividend income.
Please consult a tax advisor if you have questions about federal or state income tax laws, or on how to prepare your tax returns. If you have specific questions about your account, please call 1-800-SCUDDER.
 The following table presents certain information regarding the Trustees and Officers of the fund as of November 30, 2004. Each individual's year of birth is set forth in parentheses after his or her name. Unless otherwise noted, (i) each individual has engaged in the principal occupation(s) noted in the table for at least the most recent five years, although not necessarily in the same capacity, and (ii) the address of each individual is c/o Deutsche Asset Management, 222 South Riverside Plaza, Chicago, Illinois, 60606. Each Trustee's term of office extends until the next shareholder's meeting called for the purpose of electing Trustees and until the election and qualification of a successor, or until such Trustee sooner dies, retires, resigns or is removed as provided in the governing documents of the fund.
Independent Trustees |
Name, Year of Birth, Position(s) Held with the Fund and Length of Time Served1 | Principal Occupation(s) During Past 5 Years and
Other Directorships Held | Number of Funds in Fund Complex Overseen |
Shirley D. Peterson (1941) Chairman, 2004-present Trustee, 1995-present | Retired; formerly, President, Hood College (1995-2000); prior thereto, Partner, Steptoe & Johnson (law firm); Commissioner, Internal Revenue Service; Assistant Attorney General (Tax), US Department of Justice. Directorships: Federal Mogul Corp. (supplier of automotive components and subsystems); AK Steel (steel production); Goodyear Tire & Rubber Co. (April 2004-present); Champion Enterprises, Inc.; Trustee, Bryn Mawr College. Former Directorship: Bethlehem Steel Corp. | 87 |
John W. Ballantine (1946) Trustee, 1999-present | Retired; formerly, Executive Vice President and Chief Risk Management Officer, First Chicago NBD Corporation/The First National Bank of Chicago (1996-1998); Executive Vice President and Head of International Banking (1995-1996). Directorships: First Oak Brook Bancshares, Inc.; Oak Brook Bank; American Healthways, Inc. (provider of disease and care management services); Portland General Electric (utility company) | 87 |
Lewis A. Burnham (1933) Trustee, 1977-present | Retired; formerly, Director of Management Consulting, McNulty & Company (1990-1998); prior thereto, Executive Vice President, Anchor Glass Container Corporation | 87 |
Donald L. Dunaway (1937) Trustee, 1980-present | Retired; formerly, Executive Vice President, A.O. Smith Corporation (diversified manufacturer) (1963-1994) | 87 |
James R. Edgar (1946) Trustee, 1999-present | Distinguished Fellow, University of Illinois, Institute of Government and Public Affairs (1999-present); formerly, Governor, State of Illinois (1991-1999). Directorships: Kemper Insurance Companies; John B. Sanfilippo & Son, Inc. (processor/packager/marketer of nuts, snacks and candy products); Horizon Group Properties, Inc.; Youbet.com (online wagering platform); Alberto-Culver Company (manufactures, distributes and markets health and beauty care products) | 87 |
Paul K. Freeman (1950) Trustee, 2002-present | President, Cook Street Holdings (consulting); Senior Visiting Research Scholar, Graduate School of International Studies, University of Denver; Consultant, World Bank/Inter-American Development Bank; formerly, Project Leader, International Institute for Applied Systems Analysis (1998-2001); Chief Executive Officer, The Eric Group, Inc. (environmental insurance) (1986-1998) | 87 |
Robert B. Hoffman (1936) Trustee, 1981-present | Retired; formerly, Chairman, Harnischfeger Industries, Inc. (machinery for the mining and paper industries) (1999-2000); prior thereto, Vice Chairman and Chief Financial Officer, Monsanto Company (agricultural, pharmaceutical and nutritional/food products) (1994-1999). Directorships: RCP Advisors, LLC (a private equity investment advisory firm) | 87 |
Fred B. Renwick (1930) Trustee, 1988-present | Retired; Professor Emeritus of Finance, New York University, Stern School of Business (2001-present); formerly, Professor, New York University Stern School of Business (1965-2001). Directorships: The Wartburg Foundation; Chairman, Finance Committee of Morehouse College Board of Trustees; formerly, Director of Board of Pensions, Evangelical Lutheran Church in America; member of the Investment Committee of Atlanta University Board of Trustees; Chair of the Investment Committee, American Bible Society Board of Trustees | 87 |
John G. Weithers (1933) Trustee, 1993-present | Retired; formerly, Chairman of the Board and Chief Executive Officer, Chicago Stock Exchange. Directorships: Federal Life Insurance Company; Chairman of the Members of the Corporation and Trustee, DePaul University; formerly, International Federation of Stock Exchanges; Records Management Systems | 87 |
Interested Trustee and Officers2 |
Name, Year of Birth, Position(s) Held with the Fund and Length of Time Served1 | Principal Occupation(s) During Past 5 Years and
Other Directorships Held | Number of Funds in Fund Complex Overseen |
William N. Shiebler3 (1942) Trustee, 2004-present | Chief Executive Officer in the Americas for Deutsche Asset Management ("DeAM") and a member of the DeAM Global Executive Committee (since 2002); Vice Chairman of Putnam Investments, Inc. (1999); Director and Senior Managing Director of Putnam Investments, Inc. and President, Chief Executive Officer, and Director of Putnam Mutual Funds Inc. (1990-1999) | 142 |
Julian F. Sluyters4 (1960) President and Chief Executive Officer, 2004-present | Managing Director, Deutsche Asset Management (since May 2004); President and Chief Executive Officer of The Germany Fund, Inc., The New Germany Fund, Inc., The Central Europe and Russia Fund, Inc., The Brazil Fund, Inc., The Korea Fund, Inc., Scudder Global High Income Fund, Inc. and Scudder New Asia Fund, Inc. (since May 2004); President and Chief Executive Officer, UBS Fund Services (2001-2003); Chief Administrative Officer (1998-2001) and Senior Vice President and Director of Mutual Fund Operations (1991-1998) UBS Global Asset Management | n/a |
Philip J. Collora (1945) Vice President and Assistant Secretary, 1986-present | Director, Deutsche Asset Management | n/a |
Kenneth Murphy5 (1963) Vice President, 2002-present | Vice President, Deutsche Asset Management (2000-present); formerly, Director, John Hancock Signature Services (1992-2000) | n/a |
Paul H. Schubert4 (1963) Chief Financial Officer, 2004-present | Managing Director, Deutsche Asset Management (since July 2004); formerly, Executive Director, Head of Mutual Fund Services and Treasurer for UBS Family of Funds at UBS Global Asset Management (1994-2004) | n/a |
Charles A. Rizzo5 (1957) Treasurer, 2002-present | Managing Director, Deutsche Asset Management (since April 2004); formerly, Director, Deutsche Asset Management (April 2000-March 2004); Vice President and Department Head, BT Alex. Brown Incorporated (now Deutsche Bank Securities Inc.) (1998-1999); Senior Manager, Coopers & Lybrand L.L.P. (now PricewaterhouseCoopers LLP) (1993-1998) | n/a |
John Millette5 (1962) Secretary, 2001-present | Director, Deutsche Asset Management | n/a |
Lisa Hertz4 (1970) Assistant Secretary, 2003-present | Assistant Vice President, Deutsche Asset Management | n/a |
Daniel O. Hirsch6 (1954) Assistant Secretary, 2002-present | Managing Director, Deutsche Asset Management (2002-present) and Director, Deutsche Global Funds Ltd. (2002-present); formerly, Director, Deutsche Asset Management (1999-2002); Principal, BT Alex. Brown Incorporated (now Deutsche Bank Securities Inc.) (1998-1999); Assistant General Counsel, United States Securities and Exchange Commission (1993-1998) | n/a |
Caroline Pearson5 (1962) Assistant Secretary, 1998-present | Managing Director, Deutsche Asset Management | n/a |
Kevin M. Gay5 (1959) Assistant Treasurer, 2004-present | Vice President, Deutsche Asset Management | n/a |
Salvatore Schiavone5 (1965) Assistant Treasurer, 2003-present | Director, Deutsche Asset Management | n/a |
Kathleen Sullivan D'Eramo5 (1957) Assistant Treasurer, 2003-present | Director, Deutsche Asset Management | n/a |
1 Length of time served represents the date that each Trustee was first elected to the common board of Trustees which oversees a number of investment companies, including the fund, managed by the Advisor. For the Officers of the fund, the length of time served represents the date that each Officer was first elected to serve as an Officer of any fund overseen by the aforementioned common board of Trustees.
2 As a result of their respective positions held with the Advisor, these individuals are considered "interested persons" of the Advisor within the meaning of the 1940 Act. Interested persons receive no compensation from the fund.
3 Address: 280 Park Avenue, New York, New York
4 Address: 345 Park Avenue, New York, New York
5 Address: Two International Place, Boston, Massachusetts
6 Address: One South Street, Baltimore, Maryland
The fund's Statement of Additional Information ("SAI") includes additional information about the Trustees. The SAI is available, without charge, upon request. If you would like to request a copy of the SAI, you may do so by calling the following toll-free number: 1-800-621-1048.
Account Management Resources |
|
For shareholders of Classes A, B and C
Automated Information Lines | ScudderACCESS (800) 972-3060 Personalized account information, information on other Scudder funds and services via touchtone telephone and for Classes A, B, and C only, the ability to exchange or redeem shares. |
Web Site | scudder.com View your account transactions and balances, trade shares, monitor your asset allocation, and change your address, 24 hours a day. Obtain prospectuses and applications, blank forms, interactive worksheets, news about Scudder funds, subscription to fund updates by e-mail, retirement planning information, and more. |
For More Information | (800) 621-1048 To speak with a Scudder service representative. |
Written Correspondence | Scudder Investments PO Box 219356
Kansas City, MO 64121-9356 |
Proxy Voting | A description of the fund's policies and procedures for voting proxies for portfolio securities and information about how the fund voted proxies related to its portfolio securities during the 12-month period ended June 30 is available on our Web site — scudder.com (type "proxy voting" in the search field) — or on the SEC's Web site — www.sec.gov. To obtain a written copy of the fund's policies and procedures without charge, upon request, call us toll free at (800) 621-1048. |
Principal Underwriter | If you have questions, comments or complaints, contact: Scudder Distributors, Inc. 222 South Riverside Plaza
Chicago, IL 60606-5808 (800) 621-1148 |
| Class A | Class B | Class C |
Nasdaq Symbol | KDFAX | KDFBX | KDFCX |
CUSIP Number | 81114P-107 | 81114P-206 | 81114P-305 |
Fund Number | 084 | 284 | 384 |


ITEM 2.         CODE OF ETHICS.

As of the end of the period, November 30, 2004, Scudder Equity Trust has
adopted a code of ethics, as defined in Item 2 of Form N-CSR, that applies to
its Principal Executive Officer and Principal Financial Officer.

There have been no amendments to, or waivers from, a provision of the code of
ethics during the period covered by this report that would require disclosure
under Item 2.

A copy of the code of ethics is filed as an exhibit to this Form N-CSR.


ITEM 3.         AUDIT COMMITTEE FINANCIAL EXPERT.

The Fund's Board of Directors/Trustees has determined that the Fund has at least
one "audit committee financial expert" serving on its audit committee: Mr.
Donald L. Dunaway. This audit committee member is "independent," meaning that he
is not an "interested person" of the Fund (as that term is defined in Section
2(a)(19) of the Investment Company Act of 1940) and he does not accept any
consulting, advisory, or other compensatory fee from the Fund (except in the
capacity as a Board or committee member).

An "audit committee financial expert" is not an "expert" for any purpose,
including for purposes of Section 11 of the Securities Act of 1933, as a result
of being designated as an "audit committee financial expert." Further, the
designation of a person as an "audit committee financial expert" does not mean
that the person has any greater duties, obligations, or liability than those
imposed on the person without the "audit committee financial expert"
designation. Similarly, the designation of a person as an "audit committee
financial expert" does not affect the duties, obligations, or liability of any
other member of the audit committee or board of directors.

ITEM 4.         PRINCIPAL ACCOUNTANT FEES AND SERVICES.


                     SCUDDER DREMAN FINANCIAL SERVICES FUND
                      FORM N-CSR DISCLOSURE RE: AUDIT FEES

The  following  table  shows the  amount of fees that  Ernst  &  Young,  LLP
("E&Y"),  the Fund's auditor,  billed to the Fund during the Fund's last two
fiscal years. For engagements with E&Y entered into on or after May 6, 2003,
the Audit  Committee  approved  in  advance  all audit  services  and  non-audit
services that E&Y provided to the Fund.

The Audit Committee has delegated certain  pre-approval  responsibilities to its
Chairman (or, in his absence, any other member of the Audit Committee).

               Services that the Fund's Auditor Billed to the Fund

- --------------------------------------------------------------------------------
  Fiscal Year                         Audit-Related     Tax Fees    All Other
     Ended       Audit Fees Billed     Fees Billed       Billed    Fees Billed
  November 30,        to Fund           to Fund          to Fund     to Fund
- --------------------------------------------------------------------------------
2004                $37,760              $0              $6,663          $0
- --------------------------------------------------------------------------------
2003                $34,802              $0              $6,056          $0
- --------------------------------------------------------------------------------

The above "Tax Fees" were  billed for  professional  services  rendered  for tax
compliance and tax return preparation.


           Services that the Fund's Auditor Billed to the Adviser and
                        Affiliated Fund Service Providers

The  following  table  shows the amount of fees  billed by  E&Y to  Deutsche
Investment Management Americas,  Inc. ("DeIM" or the "Adviser"),  and any entity
controlling,   controlled  by  or  under  common  control  with  DeIM  ("Control
Affiliate") that provides ongoing services to the Fund ("Affiliated Fund Service
Provider"),  for  engagements  directly  related  to the Fund's  operations  and
financial reporting, during the Fund's last two fiscal years.

- --------------------------------------------------------------------------------
                     Audit-Related            Tax Fees            All Other
    Fiscal           Fees Billed to          Billed to          Fees Billed
     Year            Adviser and            Adviser and         to Adviser and
    Ended          Affiliated Fund        Affiliated Fund      Affiliated Fund
 November 30,     Service Providers      Service Providers    Service Providers
- --------------------------------------------------------------------------------
2004                  $281,500                 $0                    $0
- --------------------------------------------------------------------------------
2003                  $112,900                 $0                    $0
- --------------------------------------------------------------------------------

The  "Audit-Related  Fees"  were  billed for  services  in  connection  with the
assessment of internal controls and additional related procedures.


                               Non-Audit Services

The  following  table shows the amount of fees that  E&Y  billed  during the
Fund's last two fiscal years for non-audit  services.  For  engagements  entered
into on or after May 6, 2003,  the Audit  Committee  pre-approved  all non-audit
services that E&Y  provided to the Adviser and any  Affiliated  Fund Service
Provider that related directly to the Fund's operations and financial reporting.
The Audit Committee  requested and received  information  from E&Y about any
non-audit  services that E&Y  rendered during the Fund's last fiscal year to
the Adviser and any Affiliated Fund Service Provider.  The Committee  considered
this information in evaluating E&Y's independence.

- --------------------------------------------------------------------------------
                                    Total
                                  Non-Audit
                                 Fees billed
                                  to Adviser
                                and Affiliated
                                 Fund Service          Total
                                  Providers          Non-Audit
                                 (engagements          Fees
                                   related          billed to
                                 directly to       Adviser and
                 Total          the operations   Affiliated Fund
                Non-Audit       and financial    Service Providers
               Fees Billed        reporting         (all other        Total of
Fiscal Year     to Fund          of the Fund)      engagements)       (A), (B)
   Ended
November 30,      (A)                 (B)               (C)            and (C)
- --------------------------------------------------------------------------------
2004           $6,663                $0              $386,601        $393,264
- --------------------------------------------------------------------------------
2003           $6,056                $0             $3,759,685      $3,765,741
- --------------------------------------------------------------------------------


All other  engagement  fees were  billed for  services in  connection  with risk
management  and  process  improvement  initiatives  for DeIM and  other  related
entities that provide support for the operations of the fund.

                                       ***

The Fund's independent accountant, Ernst & Young LLP ("E&Y"), recently
advised the Fund's Audit Committee that E&Y's member firms in China and
Japan ("E&Y China" and "E&Y Japan," respectively) provided certain
non-audit services to Deutsche Bank entities and affiliates (collectively, the
"DB entities") during 2003 and 2004 that raise issues under the SEC auditor
independence rules. The DB entities are within the "Investment Company Complex"
(as defined by SEC rules) and therefore covered by the SEC auditor independence
rules applicable to the Fund.

E&Y advised the Audit Committee that in connection with providing permitted
expatriate tax compliance services during 2003 and 2004, E&Y China and
E&Y Japan received funds from the DB entities into E&Y "representative
bank trust accounts" that were used to pay the foreign income taxes of the
expatriates. E&Y has advised the Audit Committee that handling those funds
was in violation of Rule 2-01 of Regulation S-X. (Rule 2-01(c)4(viii)), which
states that


"... an accountant's independence will be impaired if the accountant has ...
custody of client assets.")

The Audit Committee was informed that E&Y China received approximately
$1,500 in fees for these services, while E&Y Japan received approximately
$41,000. E&Y advised the Audit Committee that it conducted an internal
review of the situation and, in view of the fact that similar activities
occurred vis-a-vis a number of E&Y audit clients unrelated to DB or the
Fund, E&Y has advised the SEC and the PCAOB of the matter. E&Y advised
the Audit Committee that E&Y believes its independence as auditors for the
Fund was not impaired during the period the services were provided. In reaching
this conclusion, E&Y noted a number of factors, including that none of the
E&Y personnel who provided the non-audit services to the DB entities were
involved in the provision of audit services to the Fund, the E & Y
professionals responsible for the Fund's audits were not aware that these
non-audit services took place until October, 2004, and that the fees charged are
not significant to E&Y overall or to the fees charged to the Investment
Company Complex.

ITEM 5.         AUDIT COMMITTEE OF LISTED REGISTRANTS

                Not Applicable

ITEM 6.         SCHEDULE OF INVESTMENTS

                Not Applicable

ITEM 7.         DISCLOSURE OF PROXY VOTING POLICIES AND PROCEDURES FOR
                CLOSED-END MANAGEMENT INVESTMENT COMPANIES.

                Not Applicable

ITEM 8.         PURCHASES OF EQUITY SECURITIES BY CLOSED-END MANAGEMENT
                INVESTMENT COMPANY AND AFFILIATED PURCHASERS

                Not Applicable.

ITEM 9.         SUBMISSION OF MATTERS TO A VOTE OF SECURITY HOLDERS.

The primary function of the Nominating and Governance Committee is to identify
and recommend individuals for membership on the Board and oversee the
administration of the Board Governance Procedures and Guidelines. Shareholders
may recommend candidates for Board positions by forwarding their correspondence
by U.S. mail or courier service to the Fund's Secretary for the attention of the
Chairman of the Nominating and Governance Committee, Two International Place,
Boston, MA 02110. Suggestions for candidates must include a resume of the
candidate.

ITEM 10.        CONTROLS AND PROCEDURES.

(a) The Chief Executive and Financial Officers concluded that the Registrant's
Disclosure Controls and Procedures are effective based on the evaluation of the
Disclosure Controls and Procedures as of a date within 90 days of the filing
date of this report.

(b) There have been no changes in the registrant's internal control over
financial reporting that occurred during the registrant's last half-year (the
registrant's second fiscal half-year in the case of the annual report) that has
materially affected, or is reasonably likely to materially affect, the
registrant's internal controls over financial reporting.

ITEM 11.        EXHIBITS.

(a)(1)   Code of Ethics  pursuant to Item 2 of Form N-CSR is filed and  attached
         hereto as EX-99.CODE ETH.

(a)(2)   Certification  pursuant to Rule 30a-2(a) under the  Investment  Company
         Act of 1940 (17 CFR  270.30a-2(a))  is filed  and  attached  hereto  as
         Exhibit 99.CERT.

(b)      Certification  pursuant to Rule 30a-2(b) under the  Investment  Company
         Act of 1940 (17 CFR  270.30a-2(b))  is furnished and attached hereto as
         Exhibit 99.906CERT.


Form N-CSR Item F

                                   SIGNATURES

Pursuant to the requirements of the Securities Exchange Act of 1934 and the
Investment Company Act of 1940, the registrant has duly caused this report to be
signed on its behalf by the undersigned, thereunto duly authorized.

Registrant:                         Scudder-Dreman Financial Services Fund


By:                                 /s/Julian Sluyters
                                    ---------------------------
                                    Julian Sluyters
                                    Chief Executive Officer

Date:                               January 31, 2005


Pursuant to the requirements of the Securities Exchange Act of 1934 and the
Investment Company Act of 1940, this report has been signed below by the
following persons on behalf of the registrant and in the capacities and on the
dates indicated.

Registrant:                         Scudder-Dreman Financial Services Fund


By:                                 /s/Julian Sluyters
                                    ---------------------------
                                    Julian Sluyters
                                    Chief Executive Officer

Date:                               January 31, 2005


By:                                 /s/Paul Schubert
                                    ---------------------------
                                    Paul Schubert
                                    Chief Financial Officer

Date:                               January 31, 2005