FORM 6-K
SECURITIES AND EXCHANGE COMMISSION
Washington, D.C. 20549
Report of Foreign Private Issuer
Pursuant to Rule 13a-16 or 15d-16 of
the Securities Exchange Act of 1934
For the month of August 2003
CLP Holdings Limited
(Registrant’s name in English)
147 Argyle Street
Kowloon, Hong Kong
(Address of Registrant’s principal executive office)
Indicate by check mark whether the Registrant files or will file annual reports under cover Form 20-F or Form 40-F.
| Form 20-F X | Form 40-F |
Indicate by check mark whether the Registrant by furnishing this information contained in this Form is also thereby furnishing information to the Commission pursuant to Rule 12g3-2(b) under the Securities Exchange Act of 1934.
| Yes | No X |
If “Yes” is marked, indicate below the file number assigned to the Registrant in connection with Rule 12g3-2(b): 82-_________
Registrant hereby incorporates by reference in the report on Form 6-K the following Exhibit:
Exhibit
The Interim Report 2003 (January — June) which was despatched to shareholders on 29 August 2003.
2
SIGNATURES
Pursuant to the requirements of the Securities Exchange Act of 1934, the Registrant has duly caused this report to be signed on its behalf by the undersigned, thereunto duly authorized.
| CLP HOLDINGS LIMITED | ||||
| By: | / s / April Chan | |||
| Name: | April Chan | |||
| Title: | Deputy Company Secretary | |||
| Date: 2 September 2003 |
3
Exhibit
| CONTENTS | ||
| 1 | Performance Highlights | |
| 5 | Chairman’s Statement | |
| 7 | Management’s Discussion and Analysis | |
| 19 | Condensed Consolidated Profit and Loss Account | |
| 20 | Condensed Consolidated Balance Sheet | |
| 21 | Condensed Statement of Changes in Equity | |
| 22 | Condensed Consolidated Cash Flow Statement | |
| 23 | Notes to the Condensed Interim Accounts | |
| 41 | Scheme of Control Statement | |
| 42 | Independent Review Report | |
| 43 | Disclosure of Interests | |
| 43 | - Interests of Directors and Chief Executive Officer | |
| 45 | - Interests of Substantial Shareholders | |
| 46 | - Interests of Any Other Persons | |
| 47 | Corporate Governance | |
| 47 | Purchase, Sale or Redemption of the Company’s Listed Shares | |
| 48 | Information for our Investors |
Page 1
Performance Highlights
| Increase/ | |||||||||||||
| 6 months ended 30 June | (Decrease) | ||||||||||||
| 2003 | 2002 | (%) | |||||||||||
Per share | |||||||||||||
| Earnings per share, HK$ | |||||||||||||
| Including Hok Un redevelopment profit | 1.54 | 1.42 | 8.2 | ||||||||||
| Excluding Hok Un redevelopment profit | 1.52 | 1.37 | 11.1 | ||||||||||
| Dividends per share, HK$ | 0.82 | 0.76 | 7.9 | ||||||||||
Dividend, HK$M | 1,974 | 1,830 | 7.9 | ||||||||||
For the period | |||||||||||||
| Turnover, HK$M | 11,871 | 11,804 | 0.6 | ||||||||||
| Earnings, HK$M | |||||||||||||
| Scheme of Control earnings | 3,045 | 2,829 | 7.6 | ||||||||||
| Non-Scheme of Control operating earnings | 710 | 568 | 25.0 | ||||||||||
| Unallocated net finance costs | (33 | ) | (41 | ) | |||||||||
| Unallocated Group expenses | (59 | ) | (59 | ) | |||||||||
| Total operating earnings | 3,663 | 3,297 | 11.1 | ||||||||||
| Hok Un redevelopment profit | 51 | 134 | |||||||||||
| Total earnings | 3,714 | 3,431 | 8.2 | ||||||||||
Interest cover1 | 14.5 times | 30.5 times | |||||||||||
| Capital expenditure, HK$M | |||||||||||||
| Scheme of Control business | 2,295 | 1,857 | |||||||||||
| Associated Hong Kong generating companies | 606 | 288 | |||||||||||
| Non-Scheme of Control business | 97 | 9 | |||||||||||
| Sales analysis (Scheme of Control), millions of kWh | |||||||||||||
| Commercial | 4,936 | 4,984 | (1.0 | ) | |||||||||
| Manufacturing | 1,348 | 1,459 | (7.6 | ) | |||||||||
| Residential | 2,857 | 2,791 | 2.4 | ||||||||||
| Infrastructure and Public Services | 3,340 | 3,265 | 2.3 | ||||||||||
| Local | 12,481 | 12,499 | (0.1 | ) | |||||||||
| Chinese mainland | 1,153 | 1,197 | (3.7 | ) | |||||||||
| Total electricity sales | 13,634 | 13,696 | (0.5 | ) | |||||||||
Page 2
As at the balance sheet date | ||||||||||||||
| 30 June | 31 December | Increase/ | ||||||||||||
| 2003 | 2002 | (Decrease) | ||||||||||||
| Fixed assets, HK$M | ||||||||||||||
| Scheme of Control business | 37,604 | 36,273 | 1,331 | |||||||||||
| Non-Scheme of Control business | 13,689 | 277 | 13,412 | |||||||||||
| 51,293 | 36,550 | 14,743 | ||||||||||||
| Shareholders’ funds per share, HK$ | 15.79 | 15.32 | ||||||||||||
| Total shareholders’ funds, HK$M | 38,020 | 36,888 | 1,132 | |||||||||||
| Total indebtedness, HK$M | ||||||||||||||
| Scheme of Control business | 6,565 | 6,742 | (177 | ) | ||||||||||
| Non-Scheme of Control business | ||||||||||||||
| - Yallourn Energy & GPEC | 7,458 | — | 7,458 | |||||||||||
| - Other projects | 4,554 | 2,555 | 1,999 | |||||||||||
| 18,577 | 9,297 | 9,280 | ||||||||||||
Total debt to total capital2, % | 32.8 | 20.1 | ||||||||||||
| 1 | Interest cover = Profit before taxation and interest / (interest charges + capitalised interest) | |
| 2 | Total debt to total capital = debt / (shareholders’ funds + debt) |
Page 3

Page 4
Page 5
Chairman’s Statement
I am pleased to present our Interim Report for the half year ended 30 June 2003 and to record a satisfactory performance by the CLP Group over that period.
Financial Results for the Six-month Period
During the first half of 2003, CLP completed the acquisition of Powergen’s remaining interests in Yallourn Energy Pty Limited, Australia (Yallourn Energy) and Gujarat Paguthan Energy Corporation Private Limited, India (GPEC), which had previously been held through an 80:20 joint venture between CLP and Powergen. CLP now holds 92% and 100% of Yallourn Energy and GPEC respectively. As a result, these two major businesses are, for the first time, consolidated in CLP Holdings’ Report and Accounts.
The operating earnings of CLP Holdings for the six months ended 30 June 2003 increased by 11.1% to HK$3,663 million as compared with earnings for the corresponding period in 2002. Satisfactory growth was achieved from both the Scheme of Control and the non-Scheme of Control businesses. Total earnings, which include Hok Un redevelopment profit for this interim period, were HK$3,714 million (HK$1.54 per share), an increase of 8.2%, compared to HK$3,431 million (HK$1.42 per share) in 2002.
Earnings from the Scheme of Control electricity business in Hong Kong increased by 7.6% to HK$3,045 million. CLP Power’s capital expenditure on the transmission and distribution networks and other facilities totalled HK$2,295 million (2002: HK$1,857 million), whilst capital expenditure by associated Hong Kong generating companies was HK$606 million (2002: HK$288 million).
Operating earnings from non-Scheme of Control activities grew from HK$568 million to HK$710 million, an increase of 25% compared to the same period in 2002. This was mainly due to strong earnings contribution from power projects in the Chinese mainland and incorporation of a full six months profits from Ho-Ping Power Station in Taiwan which was commissioned in 2002.
Directors today declared the second interim dividend of HK$0.41 per share (2002: HK$0.38 per share) which will be payable on 15 September 2003 to shareholders registered as at 1 September 2003. The Register of Shareholders will be closed on 2 September 2003.
Business Performance
Our major businesses in Hong Kong, the Chinese mainland and the Asia-Pacific region (outside the Mainland) performed satisfactorily during the first six months of 2003. The Scheme of Control electricity business in Hong Kong remained the main source of revenue, contributing 81% of our operating earnings (2002: 83%), while the non-Scheme of Control businesses generated 19% (2002: 17%).
Sales of electricity in Hong Kong in the first half of 2003 decreased slightly by 0.1% compared with the same period last year. Despite the 3.9% growth in the first quarter, our electricity sales were adversely affected by the cooler weather and the outbreak of severe acute respiratory syndrome (SARS) during the second quarter. However, local sales are now improving. On 15 July 2003, our local and system demand reached historical peaks of 5,874MW and 7,646MW respectively.
Page 6
Earnings from our electricity business in the Chinese mainland recorded strong growth. This is mainly attributable to the earnings from our joint venture power projects in Shandong, Beijing, Tianjin and Hebei.
Profit from our electricity business in the Asia-Pacific region was slightly lower than the same period last year, due to additional provision being made for higher tax requirement and on certain receivables, and development costs incurred for various projects.
Whilst more volatile than the Hong Kong Scheme of Control business, our activities in the Chinese mainland and the Asia-Pacific region are reaching the position to contribute meaningful income to the Group. This indicates that useful progress has been made in diversifying our business beyond the Hong Kong electricity business. We will continue to explore opportunities for greenfield developments and for acquisitions that increase shareholder value and take forward our development strategy in target markets.
The operational/financial performances and outlook for our businesses are reviewed in the “Management’s Discussion and Analysis” section of this Interim Report.
Challenges after the SARS Outbreak
The SARS outbreak has been a major challenge for Hong Kong and, indeed, in other places where CLP carries on business, notably the Chinese mainland and Taiwan. The situation has improved, recovery is taking place, and we do not believe that the longer-term effects on our business will be material.
In Hong Kong, where the majority of our business is based, the dramatic decline in the activities of some industries, especially the tourism and restaurant sectors, has had a negative effect on the economy. As a result, we have joined forces with the business community to help stimulate the economic recovery of Hong Kong. This was done, most notably, through a special, one-off rebate package, amounting to HK$460 million in total, to all our customers in Hong Kong that we announced in May 2003. We have also supported and participated in a number of activities which aimed to draw the Hong Kong community together in the fight against SARS.
I would like to take this opportunity to thank all our employees for their continued dedication and application, during the SARS outbreak, in maintaining electricity supply to all our customers, both in Hong Kong and elsewhere in the region, and in ensuring that the Group’s affairs continued to be conducted effectively and without disruption.
The Hon. Michael D. Kadoorie
Hong Kong, 4 August 2003
Page 7
Management’s Discussion and Analysis
This section describes CLP’s major activities in Hong Kong, the Chinese mainland and elsewhere in the Asia-Pacific region, as well as the Group’s financial results, funding and obligations during the first half of 2003.
BUSINESS OVERVIEW
The CLP Group includes a vertically integrated electricity generation, transmission and distribution business in Hong Kong. The Group also invests in energy businesses in the Chinese mainland and the Asia-Pacific region and continues to explore selective opportunities in electricity-related businesses, which make use of existing assets, expertise and relationships. An outline of these activities is set out below:
Page 8
| CLP Group's Investments | ||||||||||
| 30.6.2003 | 31.12.2002 | |||||||||
| Business Description | Assets | HK$M | % | HK$M | % | |||||
| Electricity Business in Hong Kong | ||||||||||
l Electricity supplier since 1903 l Owner and operator of a vertically integrated electricity supply business, comprising: o Generation: 6,283 megawatts (MW) of installed generating capacity; o Transmission: over 11,000 kilometres of transmission and distribution lines; and o Distribution: 2.1 million customer accounts (about 80% of Hong Kong’s total population) l 8.5% of electricity sales up to 30 June 2003 was for distribution to customers in Guangdong Province | l 40% each of Black Point Power Station (2,500MW, when completed), Castle Peak Power Station (4,108MW) and Penny’s Bay Power Station (300MW) l 100% of Transmission and Distribution System | 42,884 | 64 | 42,395 | 72 | |||||
| Electricity Business in the Chinese Mainland and Asia-Pacific Region | ||||||||||
| Chinese Mainland | 5,992 | 9 | 6,337 | 11 | ||||||
l Developer and investor in power projects since 1985 l Largest external investor in the Mainland electricity industry l Interests in generating assets in the Chinese mainland (3,163 equity MW) | l 49% of CLP Guohua Power Company Limited, Beijing, Tianjin and Hebei (2,100MW) l 49% of CLP Guohua Shenmu Power Company Limited, Shaanxi (200MW) l 29.4% of Shandong Zhonghua Power Company, Shandong (3,000MW) l 70% of Guizhou CLP Power Company Limited, Guizhou (600MW) l 25% of Guangdong Nuclear Power Joint Venture Company, Limited, Guangdong (1,968MW) l 49% of Hong Kong Pumped Storage Development Company, Limited, Guangdong (1,200MW) l 41.5% of Huaiji Power Project, Guangdong (98MW) | |||||||||
| Asia-Pacific Region | 16,285 | 25 | 8,030 | 14 | ||||||
l Developer, operator and investor in power projects since 1994 l Building a balanced portfolio of interests in generating assets in Australia, India, Taiwan and Thailand (3,729 equity MW) | l 100% of Gujarat Paguthan Energy Corporation Private Limited, India (655MW) l 92% of Yallourn Energy Pty Limited, Australia (1,450MW) l 40% of Ho-Ping Power Company, Taiwan (1,320MW) l 22.4% of Electricity Generating Public Company Limited, Thailand (2,207MW) l 50% of BLCP Power Limited, Thailand (1,434MW) | |||||||||
| Electricity-Related Business | ||||||||||
l Developer of electricity-related activities which use CLP’s existing assets and skills | l Property redevelopment, engineering services, telecommunications, information technology and research and development | 1,442 | 2 | 1,621 | 3 | |||||
Page 9
OPERATIONAL PERFORMANCE AND OUTLOOK
Electricity Business in Hong Kong
Total sales, including sales to the Chinese mainland, decreased by 0.5% in comparison with the same period last year.
Despite a very challenging economic environment in the first half of 2003, electricity sales to customers in Hong Kong decreased by only 0.1% compared to the same period in 2002. The decline was mainly due to a reduction of sales by 1% to the Commercial sector as a result of the cooler weather and the outbreak of the severe acute respiratory syndrome (SARS) in the second quarter. The most affected segments within this sector were tourism related services, retail, restaurants and transportation. Sales to the Manufacturing sector also recorded a 7.6% decrease, due to Hong Kong’s continuing transformation from a manufacturing to a services-based economy. Electricity sales to the Residential sector increased by 2.4%, in line with the increase in the number of customers. Sales to the Infrastructure and Public Services sector (formerly described as Government and Others sector) recorded sales growth of 2.3%, which was supported by continuing investment in Hong Kong’s infrastructure.
Our local and system demand reached historical peaks of 5,874MW and 7,646MW respectively in July.
The Infrastructure and Public Services sector has registered the largest growth among all our customer sectors during recent years. It is expected that demand from this sector will remain steady in the near future. For the Residential and Commercial sectors, future increase in demand will remain moderate. In particular, the Commercial sector still needs time to recover fully from the effect of SARS. Government and business initiatives to promote tourism should have a positive effect on the Commercial sector in the second half of the year. It is expected that demand for electricity in the Manufacturing sector will continue to weaken.
Sales to the Chinese mainland totalled 1,153GWh. Shekou’s demand grew by 14% in the first six months of the year. However, Guangdong Guang-Dian Power Grid Group Company Limited reduced its electricity purchase from CLP during the period.
In May 2003, CLP announced a special, one-off rebate package, amounting to HK$460 million in total, to be provided to all CLP’s customers in Hong Kong, as a move to support the local economy during the SARS outbreak. The Company was able to bring forward this rebate from the normal year-end cycle due to its excellent performance in managing costs. The rebate package resulted in about 95% of CLP’s customers receiving a full half-month electricity rebate.
To enhance supply quality and reliability, as well as to provide for demand created by new towns and infrastructure development projects in our supply area, CLP invested HK$2,295 million in the transmission and distribution networks as well as in customer services and other supporting facilities during the period.
Our unwavering commitment to a high standard of safety and health in the workplace continues to be recognised by the community. In June 2003, CLP received a total of eight awards in the Hong Kong Occupational Safety & Health Award 2003, jointly organised by the Hong Kong Occupational Safety & Health Council and the Labour Department.
Page 10
CLP attaches great importance to environmental protection. Over the years, CLP has successfully implemented initiatives such as the marketing of ash as combustion by-products, reduction of energy wastage, control of industrial and chemical wastes, energy saving in power stations, and energy efficiency advice to customers. Recently, initiatives have been extended from the operational environment to the office environment — “green office” programmes. CLP has been awarded four Gold Wastewi$e Logos and the Certificate of Merit from the Hong Kong Eco-Business Award in recognition of its efforts in this respect.
The current Scheme of Control Agreement, which regulates our Hong Kong electricity business, will expire in 2008. CLP is devoting considerable management resources to a thorough understanding of the implications of different regulatory systems for our Hong Kong electricity business. Working closely with all stakeholders, CLP aims to develop an outcome which will balance the legitimate interests of the Company, shareholders, employees and the community we serve. CLP and the Government have commenced discussions on the 2003 Scheme of Control Interim Review. We do not expect any major changes to the Scheme of Control Agreement arising from this regular five-yearly review process.
Electricity Business in the Chinese Mainland and Asia-Pacific Region
The Group continues to grow its business through diversification and through investment in the electricity sector in selected markets outside Hong Kong. Significant strides towards this goal have been made in recent years through our subsidiaries, CLP Power International and CLP Power China. In order to improve organisational effectiveness, optimise resource allocation, and enhance synergies, the operations of these two subsidiaries have been integrated into a single business unit, CLP Power Asia, with effect from 1 July 2003.
Chinese Mainland
CLP has a long history of successful investment in the Chinese mainland, dating back to the 1980’s. Currently the largest foreign power investor in the Mainland, investment in the Chinese mainland continues to be an integral part of our business strategy.
The four power stations, operated by CLP Guohua Power Company Limited (CLP Guohua), namely, Beijing Yire (2 x 200MW), Panshan (2 x 500MW) and Sanhe (2 x 350MW) and Shenmu II (2 x 100MW), have been operating satisfactorily and achieved higher than budget electricity sales in the first six months. Approved tariffs for all the four power stations have been implemented. CLP Guohua accomplished a new milestone in the area of environmental protection with all four stations achieving full accreditation of ISO14001.
The 3,000MW joint venture in Shandong Province continues to make good progress. Unit 1 of Heze II (2 x 300MW) entered into commercial operation in February 2003, and Unit 2 completed performance and environmental tests. Unit 1 of Liaocheng (2 x 600MW) is targeted to commence performance tests in the third quarter, while initial firing of Unit 2 was achieved in April 2003. Shiheng I and II (4 x 300MW) have been operating satisfactorily.
Construction of the 2 x 300MW coal-fired Anshun II Power Station of Guizhou CLP Power Company Limited (Guizhou CLP Power) in Guizhou Province is ahead of schedule and within budget. Full commercial operation is anticipated in 2004. The station is one of the projects designated by the State Development and Reform Commission to provide electricity to Guangdong.
Page 11
The Guangdong Daya Bay Nuclear Power Station operated smoothly with high level of safety and reliability in the first six months. The Station participated in and was awarded first place in Industrial Safety and Radiation Protection in the annual Reactor Safety Challenge Competition for 2002 organised by sister plants in France. It was also the first power station to attain ISO14001 accreditation in the electric power industry in the Chinese mainland.
Progress continues in the Huaiji joint venture, a hydroelectric project in Guangdong Province. The Chiangdiao Power Station was successfully commissioned, bringing the aggregate generating capacity of the joint venture to 82MW. The collection of electricity charges from the offtaker remains slow and requires intense monitoring. The Huaiji Project is an example of CLP’s initiatives to support renewable energy development. CLP has also commenced feasibility studies for the development of a 100MW wind power station on Hailing Island, Yangjiang in Guangdong Province and a 100MW wind farm on Nanao Island off the Guangdong coast.
Following the approval of power sector reform and the restructuring of the State Power Corporation, the future direction of the power industry in the Chinese Mainland is becoming clearer. The promotion of the Mainland power sector, including the continued introduction of modern management methods, together with increasing electricity demand resulting from China’s strong economic growth, presents opportunities for further development of our electricity business in the Mainland. Building on our long-standing presence and experience in the Mainland electricity industry, we are well positioned to take advantage of such opportunities.
Asia-Pacific Region
CLP has a significant presence in Australia, India, Taiwan and Thailand. With the completion of the acquisition of the remaining interests of Powergen UK plc (Powergen) in the joint venture companies relating to BLCP Power Limited (BLCP) (10%), Yallourn Energy (18.4%) and GPEC (20%) in January, April and June 2003 respectively, CLP now owns 100% of GPEC, 92% of Yallourn Energy and 50% of BLCP. As a consequence, GPEC and Yallourn Energy are now consolidated into the Group’s accounts as subsidiary companies.
GPEC’s 655 MW combined cycle power station has continued to operate well on the new supply of natural gas. It has achieved a high level of availability and has followed dispatch instructions from the Gujarat Electricity Board (GEB). In our Annual Report 2002, we noted GEB’s difficulties in making timely payments to GPEC. We have since entered discussions with GEB on the power purchase agreement to secure a more stable and sustainable billing environment. These discussions are making progress and we hope that the position will improve this year.
Longer-term business prospects in India depend on the Government’s ability to address the financial position of the State Electricity Boards and structural issues in the electricity supply industry. The Electricity Act that came into effect in June is a significant step in that direction.
In Australia, recently commissioned new generation capacity in Queensland has depressed pool prices in the National Electricity Market. However, Yallourn Energy’s revenue is substantially protected from short-term pool price fluctuations by its forward contract position, and business performance to date has been in line with expectations. Major capital projects to upgrade the power station control and instrumentation systems and to develop new areas of the captive coal mine are progressing well.
Page 12
Performance of the 2 x 660 MW coal-fired units at Ho-Ping in Taiwan, which entered commercial operation last year, has been satisfactory and met the guaranteed generation required under the power purchase agreement with the offtaker, Taipower. Since full commissioning of the two units, management effort has been directed towards risk mitigation, rectification of start-up technical problems, and continuous training of operation and maintenance staff.
As noted in our Annual Report 2002, CLP has been reviewing the strategic rationale of its shareholding in YTL Power International Berhad (YTL Power) in the absence of any movement towards privatization of the Malaysian power industry. Agreement has now been reached on the disposal of our 5% shareholding in YTL Power to its parent, YTL Corporation.
BLCP, which is developing a 1,434 MW coal-fired project at Map Ta Phut, Thailand, has reached the final stages of the financing arrangements for the project. Reclamation of the project site is near completion and construction of a 2 x 717MW coal-fired power station will commence in the third quarter of 2003. Upon commencement of commercial operation of the two units, which is expected to occur in 2006 and 2007 respectively, all power generated is to be supplied to the Electricity Generating Authority of Thailand under a 25-year power purchase agreement.
CLP is concentrating on building meaningful and sustainable businesses in those countries in which we already have an established presence.
Electricity-Related Business
The Group’s overriding focus is on the electricity business. However, where appropriate, CLP makes use of its existing assets and skills to explore opportunities to develop electricity-related activities in Hong Kong and the Chinese mainland.
In this respect, CLP’s major project is the residential redevelopment of the former power station site at Hok Un, Kowloon, named Laguna Verde. This 50:50 joint venture project, between CLP and a wholly-owned subsidiary of Cheung Kong (Holdings) Limited, comprises 4,735 flats, 1,692 parking spaces and 270,000 sq. ft. of commercial space. Over 90% of the residential units in the redevelopment had been sold by the end of June 2003.
CLP maintained steady momentum in its engineering service businesses, with a number of contracts secured in railway projects, power engineering, lighting projects, energy services, facility maintenance and customer installation services. Major customers tend to focus on their core businesses and outsource the maintenance services. CLP has made use of these opportunities to provide total engineering solutions to hotels, hospitals and other institutions to reduce energy spending.
CLP continues to own and operate “ChinaLink”, which provides cross-border communications services to Hong Kong corporations operating in the Chinese mainland. PowerCom Network Hong Kong Limited, our joint venture with Cheung Kong Enterprises Limited, has made good progress in the roll-out of broadband services to Hong Kong customers using powerline telecommunications technology.
As a result of a strategic review on our 40% investment in Precision Marketing Inc. (PMI), a market research company which provides CLP with access to database management skills and technology, CLP sold all our shareholding in PMI in June 2003. The skill transfer from PMI to CLP has been substantially completed.
Page 13
CLP Research Institute is sponsoring a new research project on the co-combustion of bamboo scaffolding and wood debris with coal. The research team at the Hong Kong University of Science and Technology will study the effects of these materials on emissions of particulates into the air.
OUR PEOPLE
With the addition of 359 employees of Yallourn Energy and GPEC, as a result of these companies being consolidated into the Group, we had a total of 4,694 employees (2002: 4,205) on 30 June 2003. Of these, 3,895 (2002: 3,747) were employed by our Scheme of Control business in Hong Kong. Total remuneration for the six months ended 30 June 2003 was HK$1,117 million (2002: HK$1,049 million), including retirement benefit costs of HK$85 million.
During the recent SARS outbreak in Hong Kong and in some Chinese cities, every effort was made to ensure all employees in these locations were given appropriate protection against possible infection. In addition to providing face masks for employees, we put in place special arrangements such as an in-house education campaign, including information on personal hygiene, restricting business travel and allowing at-risk workers (for example pregnant employees) more flexible working arrangements. An internal website on SARS was launched in mid-March, shortly after the start of the outbreak, to ensure that employees were receiving accurate and reliable information so as to guard against the spread of the virus.
FINANCIAL PERFORMANCE
Consolidated Financial Results
The financial results for the six-month period to 30 June 2003, which are unaudited but have been reviewed by the auditors, incorporate two significant changes from the corresponding period in 2002 and from the financial year ended 31 December 2002:
| l | The consolidation of Yallourn Energy and GPEC into these interim results as a result of their reclassification as subsidiaries of CLP Holdings following the acquisition of Powergen’s remaining shares in these two companies in the first half of 2003. | |
| l | The adoption of Hong Kong Statement of Standard Accounting Practice (SSAP) No. 12 (Revised) “Income Taxes”, which became effective from 1 January 2003. |
Page 14
Earnings Attributable to Shareholders
The contribution of each major activity to the Group earnings is analysed as follows:
| 6 months ended 30 June | 2003 | 2002 | Increase/ | ||||||||||||||||||
| (Decrease) | |||||||||||||||||||||
| HK$M | HK$M | HK$M | HK$M | % | |||||||||||||||||
| Scheme of Control earnings | 3,045 | 2,829 | 7.6 | ||||||||||||||||||
| Non-Scheme of Control operating earnings | |||||||||||||||||||||
| Income from power projects outside Hong Kong | 706 | 618 | |||||||||||||||||||
| Sales to the Chinese mainland | 30 | 35 | |||||||||||||||||||
| Other businesses | (26 | ) | 710 | (85 | ) | 568 | 25.0 | ||||||||||||||
| Unallocated net finance costs | (33 | ) | (41 | ) | |||||||||||||||||
| Unallocated Group expenses | (59 | ) | (59 | ) | |||||||||||||||||
| 3,663 | 3,297 | 11.1 | |||||||||||||||||||
| Hok Un redevelopment profit | 51 | 134 | |||||||||||||||||||
| Group earnings attributable to shareholders | 3,714 | 3,431 | 8.2 | ||||||||||||||||||
| Earnings per share, HK$ | 1.54 | 1.42 | 8.2 | ||||||||||||||||||
| Earnings per share excluding Hok Un redevelopment profit, HK$ | 1.52 | 1.37 | 11.1 | ||||||||||||||||||
| 6 months ended 30 June | |||||||||||||||||||||
| 2003 | 2002 | % | |||||||||||||||||||
EBITDA1, HK$M | |||||||||||||||||||||
| Including Hok Un redevelopment profit | 6,150 | 5,364 | 14.6 | ||||||||||||||||||
| Excluding Hok Un redevelopment profit | 6,087 | 5,201 | 17.0 | ||||||||||||||||||
| 1 | EBITDA = earnings before interest (including interest on borrowed capital and development fund, and a charge based on non-shareholders’ investments financing net fixed assets under the Scheme of Control), taxation borne by the shareholders, depreciation and amortisation. |
During the six-month period to 30 June 2003, the Scheme of Control (SoC) electricity unit sales to local customers dropped by 0.1% while total unit sales, which included sales to the Chinese Mainland, decreased by 0.5% as compared to same period last year. Turnover registered a 0.6% increase due to consolidation of revenue from Yallourn Energy and GPEC.
The operating earnings were HK$3,663 million, which was HK$366 million higher than the corresponding period last year, representing an increase of 11.1%. Total earnings, which include Hok Un redevelopment profit increased by 8.2% to HK$3,714 million.
SoC earnings increased by 7.6% to HK$3,045 million as a combined effect of lower interest borne by shareholders and investments in fixed assets to meet new customer demand and to improve quality of services. The non-SoC operating earnings increased by HK$142 million. The increase in non-SoC operating earnings was mainly due to full six months operation of Ho-Ping Power Station, and improved performance from CLP Guohua and Yallourn Energy.
Earnings per share increased by 8.2%, the same as the increase in total group earnings. Excluding the Hok Un redevelopment profit, earnings per share increased by 11.1%.
Page 15
Significant Investments
Fixed assets of the Group of HK$36,550 million at 31 December 2002 mainly consisted of investment in the transmission and distribution network for the core Hong Kong electricity business. With the consolidation of Yallourn Energy and GPEC, electricity generation and related fixed assets amounting to HK$13,438 million are included into the balance of the fixed assets at 30 June 2003. During the six months, the Group also invested HK$2,392 million (2002: HK$1,866 million), of which HK$2,295 million (2002: HK$1,857 million) was made by CLP Power, in various fixed assets. As a result, after deducting depreciation and disposal, the Group’s fixed assets increased to HK$51,293 million, an increase of 40.3% compared to 31 December 2002. Capital expenditure by associated Hong Kong generating companies for the six months was HK$606 million (2002: HK$288 million).
The Group’s investments in each geographical segment are shown below:
| 30 June 2003 | 31 December 2002 | |||||||||||||||||
| HK$M | % | HK$M | % | |||||||||||||||
| Electricity Business | ||||||||||||||||||
| Hong Kong | 42,884 | 64 | 42,395 | 72 | ||||||||||||||
| Chinese mainland | 5,992 | 9 | 6,337 | 11 | ||||||||||||||
| Asia-Pacific region | 16,285 | 25 | 8,030 | 14 | ||||||||||||||
| 65,161 | 98 | 56,762 | 97 | |||||||||||||||
| Property and other businesses | 1,442 | 2 | 1,621 | 3 | ||||||||||||||
| 66,603 | 100 | 58,383 | 100 | |||||||||||||||
Liquidity and Capital Resources
As at 30 June 2003, the Group had liquid funds of HK$572 million. About 80% of these liquid funds were denominated in foreign currency mainly held by subsidiaries in Australia and India. The remainder was in Hong Kong dollars.
Financing facilities totalling HK$26.6 billion were available to the Group, including HK$9 billion for Yallourn Energy and GPEC. Out of the facilities available, HK$18.6 billion had been drawn down, out of which HK$7.5 billion were incurred by Yallourn Energy and GPEC. Financing facilities totalling HK$15.8 billion were available to CAPCO of which HK$11.1 billion were drawn down.
Total debt to total capital of the Group at 30 June 2003 was 32.8% and interest cover was 14.5 times. The increase in gearing ratio is due to the consolidation of the debts of Yallourn Energy and GPEC, which are without recourse to CLP Holdings.
Page 16
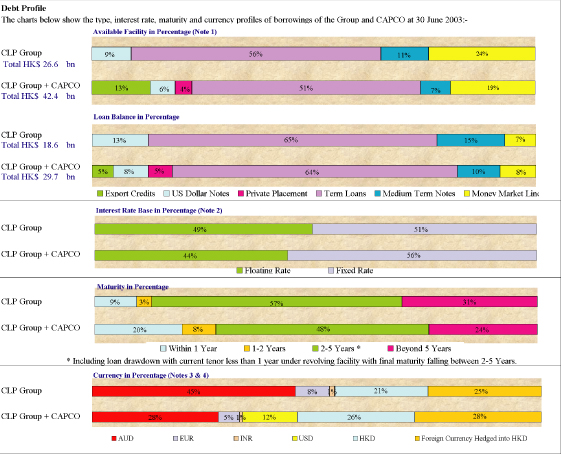
| Notes: | (1) | For the Medium Term Note Programme, only the amount (HK$2,840 million) of the Notes issued was included in the total amount of Available Facility. | ||||
| (2) | 75% of Yallourn Energy and GPEC’s combined loans are at fixed rates. With the consolidation of these two subsidiaries, the percentage of fixed rate loans in the CLP Group is 51%, compared to 35% if Yallourn Energy and GPEC were not consolidated. | |||||
| (3) | The Australian dollar loans were mainly incurred by Yallourn Energy to refinance its project debts in 2001 and by CLP Holdings to hedge against currency exposure of the Group’s investment in Yallourn Energy. | |||||
| (4) | The loans in Euros and Indian Rupees were drawn by GPEC. |
Financing
The business expansion of the Group, in particular, the capital expenditure programmes of CLP Power and CAPCO, are funded by bank loans, issuance of debt securities and cash flow from operations.
The Group adopts a prudent approach to all our financial arrangements, while at the same time aiming to achieve cost efficient funding. In June 2003, CLP Power issued HK$500 million 4.45% fixed rate notes due 2013, through its wholly-owned subsidiary, CLP Power Hong Kong Financing Limited. The issue was made under the Medium Term Note Programme set up by CLP Power Hong Kong Financing Limited in 2002. Under the Programme, notes in an aggregate amount of up to US$1.5 billion may be issued and will be unconditionally and irrevocably guaranteed by CLP Power. As at 30 June 2003, about HK$2,840 million notes have been issued under the Programme.
Page 17
Credit Rating
The Group’s financial strength is reflected in its ratings assigned by Standard & Poor’s (S&P) and Moody’s. The current credit ratings of CLP Holdings and CLP Power are set out below:
| CLP Holdings | CLP Power | HKSAR | |||||||||||||||||||||||
| Government | |||||||||||||||||||||||||
| S&P | Moody’s | S&P | Moody’s | S&P | Moody’s | ||||||||||||||||||||
Long-term Rating | |||||||||||||||||||||||||
| Foreign currency | A+ | A3 | A+ | A3 | A+ | A3 | |||||||||||||||||||
| Outlook | Stable | Positive | Stable | Positive | Stable | Positive | |||||||||||||||||||
| Local currency | A+ | Aa2 | A+ | Aa1 | AA- | Aa3 | |||||||||||||||||||
| Outlook | Stable | Stable | Stable | Stable | Negative | Stable | |||||||||||||||||||
Short-term Rating | |||||||||||||||||||||||||
| Foreign currency | A-1 | P-1 | A-1 | P-1 | A-1 | P-1 | |||||||||||||||||||
| Local currency | A-1 | — | A-1 | — | A-1+ | — | |||||||||||||||||||
These credit ratings are supported by the strong cash flow generating ability and prudent financial structure of the Group. Our premier credit ratings can facilitate and enhance our position in various local and overseas business activities, including fund raising, investment and new business opportunities of the Group.
Risk Management
The Group uses different derivative instruments to manage its exposure to foreign currency, interest rate risks and the price risk associated with the sales and purchases of electricity in Australia, with an objective to minimise the impact of exchange rate, interest rate and electricity price fluctuations on earnings, reserves and tariff charges to customers. All transactions are made with counterparties with acceptable credit quality and a limit is assigned to each counterparty for monitoring the credit exposure. Other than certain energy trading activities engaged by Yallourn Energy, all derivative instruments are employed solely for hedging purposes.
Interest Rate Risks
The Group mainly utilises interest rate swaps to manage its interest rate risks. Our Australian subsidiary, Yallourn Energy, also employs forward rate agreements and interest rate swaptions to adjust the interest rate mix within pre-determined parameters. All these forward rate agreements and interest rate swaption contracts will mature within one year.
Foreign Currency Risks
The Group’s foreign currency exposures mainly arise from the loan repayment/interest payment obligations, purchases of goods and services, fuel-related payments and overseas investment activities. Apart from using forward foreign exchange contracts, currency swaps and options to manage our currency exposure, the Group also adopts an approach of financing its investments by borrowings of matching currency where appropriate to mitigate the currency risk.
Page 18
Electricity Sales and Purchases Risks
In Australia, Yallourn Energy uses hedging contracts to manage its exposure to price fluctuations in the electricity market. It also engages in limited energy trading activities.
Off-Balance Sheet Financial Instruments
As at 30 June 2003, the Group had gross outstanding derivative instruments amounting to HK$46.7 billion (HK$49 billion for the Group and CAPCO combined), out of which HK$0.4 billion were energy trading contracts. The breakdown by types and maturity profile of the Group and CAPCO’s derivative instruments are shown in the charts below:
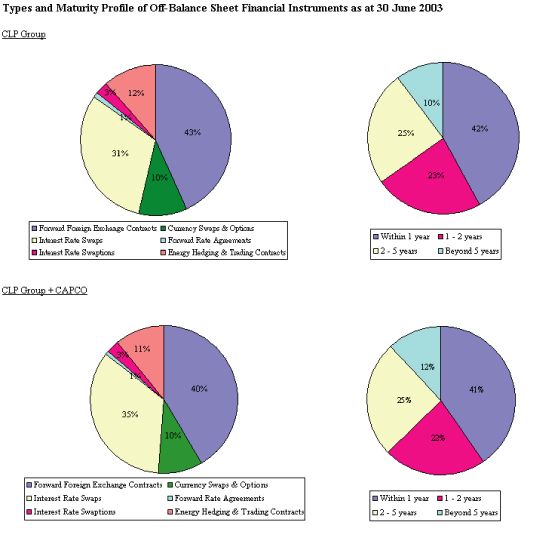
The fair value of the Group’s outstanding derivative instruments at 30 June 2003 was HK$137.2 million (HK$41.1 million for the Group and CAPCO combined), which represents the net proceeds we would receive if these contracts were closed out at 30 June 2003. Out of the total fair value, HK$0.6 million was related to energy trading activities engaged by Yallourn Energy.
The Group has no significant operating lease commitments or sale and leaseback arrangements.
Page 19
Condensed Consolidated Profit And Loss Account
| (Unaudited) | |||||||||||||
| 6 months ended 30 June | |||||||||||||
| Note | 2003 | 2002 | |||||||||||
| HK$M | HK$M | ||||||||||||
| (Restated) | |||||||||||||
TURNOVER | 2,4 | 11,871 | 11,804 | ||||||||||
| Expenses | |||||||||||||
| Purchases of electricity | 3 | 7,112 | 7,093 | ||||||||||
| Staff expenses | 4 | 525 | 480 | ||||||||||
| Fuel and other net operating costs | 4 | 643 | 499 | ||||||||||
| Depreciation | 4 | 1,005 | 842 | ||||||||||
| 9,285 | 8,914 | ||||||||||||
| Operating profit | 2,5 | 2,586 | 2,890 | ||||||||||
| Finance costs | 6 | (223 | ) | (88 | ) | ||||||||
| Finance income | 6 | 35 | 11 | ||||||||||
| Hok Un redevelopment profit | 63 | 163 | |||||||||||
| Share of profits less losses of jointly controlled entities | 1,711 | 1,495 | |||||||||||
| Share of profits less losses of associated companies | 53 | 84 | |||||||||||
| Profit before taxation | 4,225 | 4,555 | |||||||||||
| Taxation | 7 | (728 | ) | (684 | ) | ||||||||
| Profit after taxation | 3,497 | 3,871 | |||||||||||
| Transfers under Scheme of Control from/(to) | 23 | ||||||||||||
| Development Fund | 263 | (336 | ) | ||||||||||
| Special provision account | 102 | 54 | |||||||||||
| Rate reduction reserve | (148 | ) | (158 | ) | |||||||||
| 217 | (440 | ) | |||||||||||
EARNINGS | |||||||||||||
| Scheme of Control earnings | 3,045 | 2,829 | |||||||||||
| Non-Scheme of Control operating earnings | 8 | 710 | 568 | ||||||||||
| Unallocated net finance costs | (33 | ) | (41 | ) | |||||||||
| Unallocated Group expenses | (59 | ) | (59 | ) | |||||||||
| Total operating earnings | 3,663 | 3,297 | |||||||||||
| Hok Un redevelopment profit | 51 | 134 | |||||||||||
| Total earnings | 3,714 | 3,431 | |||||||||||
DIVIDENDS | 9 | ||||||||||||
| First interim paid | 987 | 915 | |||||||||||
| Second interim | 987 | 915 | |||||||||||
| 1,974 | 1,830 | ||||||||||||
| Earnings per share | 10 | HK$1.54 | HK$1.42 | ||||||||||
| Earnings per share excluding Hok Un redevelopment profit | 10 | HK$1.52 | HK$1.37 | ||||||||||
| Note: | The comparative figures for the 6 months ended 30 June 2002 have been restated as a result of the adoption of SSAP No. 12 (Revised) “Income Taxes” as explained in Note 1(A) to the Condensed Interim Accounts. |
Page 20
Condensed Consolidated Balance Sheet
| 30 June | 31 December | ||||||||||||
| 2003 | 2002 | ||||||||||||
| (Unaudited) | (Restated) | ||||||||||||
| Note | HK$M | HK$M | |||||||||||
CAPITAL EMPLOYED | |||||||||||||
| Fixed assets | 11 | 51,293 | 36,550 | ||||||||||
| Goodwill | 12 | (768 | ) | — | |||||||||
| Investments in jointly controlled entities | 13 | 13,693 | 18,982 | ||||||||||
| Investments in associated companies | 14 | 1,487 | 1,426 | ||||||||||
| Investment securities | 15 | 26 | 287 | ||||||||||
| Deferred tax assets | 16(A) | 872 | — | ||||||||||
| Employee retirement benefit plan assets | 17 | — | 1,138 | ||||||||||
| 66,603 | 58,383 | ||||||||||||
| Current assets | |||||||||||||
| Deposits, bank balances and cash | 18 | 572 | 516 | ||||||||||
| Other investments | 19 | 659 | 671 | ||||||||||
| Inventories — stores and fuel | 211 | 67 | |||||||||||
| Trade and other receivables | 20 | 4,870 | 1,256 | ||||||||||
| 6,312 | 2,510 | ||||||||||||
| Current liabilities | |||||||||||||
| Customers’ deposits | (2,762 | ) | (2,684 | ) | |||||||||
| Short-term loans and current portion of long-term loans and borrowings | 22 | (1,759 | ) | (570 | ) | ||||||||
| Fuel clause account | (479 | ) | (512 | ) | |||||||||
| Taxation payable | (317 | ) | (196 | ) | |||||||||
| Trade and other payables | 21 | (3,809 | ) | (3,206 | ) | ||||||||
| (9,126 | ) | (7,168 | ) | ||||||||||
| Net current liabilities | (2,814 | ) | (4,658 | ) | |||||||||
| Total assets less current liabilities | 63,789 | 53,725 | |||||||||||
REPRESENTED BY | |||||||||||||
| Share capital | 12,041 | 12,041 | |||||||||||
| Share premium | 1,164 | 1,164 | |||||||||||
| Reserves | 23,828 | 21,901 | |||||||||||
| Proposed dividend | 987 | 1,782 | |||||||||||
| Shareholders’ funds | 38,020 | 36,888 | |||||||||||
| Long-term loans and other borrowings | 22 | 16,818 | 8,727 | ||||||||||
| Other non-current liabilities | 392 | — | |||||||||||
| Deferred tax liabilities | 16(B) | 4,348 | 3,610 | ||||||||||
| Scheme of Control reserve accounts | 23 | 3,894 | 4,500 | ||||||||||
| Minority interest | 317 | — | |||||||||||
| 63,789 | 53,725 | ||||||||||||
| /s/ W.E. Mocatta | /s/ Andrew Brandler | /s/ Peter P.W. Tse | ||
| W.E. Mocatta Vice Chairman Hong Kong, 4 August 2003 | Andrew Brandler Group Managing Director | Peter P.W. Tse Executive Director & Chief Financial Officer |
Page 21
Condensed Statement of Changes in Equity
| Capital | ||||||||||||||||||||||||||
| (Unaudited) | Share | Share | Redemption | Other | Retained | |||||||||||||||||||||
| Capital | Premium | Reserve | Reserves | Profit | Total | |||||||||||||||||||||
| HK$M | HK$M | HK$M | HK$M | HK$M | HK$M | |||||||||||||||||||||
| Balance at 1 January 2003, as previously reported | 12,041 | 1,164 | 2,482 | (76 | ) | 21,176 | 36,787 | |||||||||||||||||||
| Tax adjustments (Note (a)) | — | — | — | 13 | 88 | 101 | ||||||||||||||||||||
| Balance at 1 January 2003, restated | 12,041 | 1,164 | 2,482 | (63 | ) | 21,264 | 36,888 | |||||||||||||||||||
| Exchange differences arising on translation of : | ||||||||||||||||||||||||||
| subsidiaries | — | — | — | 93 | — | 93 | ||||||||||||||||||||
| jointly controlled entities | — | — | — | 49 | — | 49 | ||||||||||||||||||||
| associated companies | — | — | — | 33 | — | 33 | ||||||||||||||||||||
| Net gains and losses not recognised in the profit and loss account | — | — | — | 175 | — | 175 | ||||||||||||||||||||
| Earnings for the period | — | — | — | — | 3,714 | 3,714 | ||||||||||||||||||||
| Dividends declared:2002 final | — | — | — | — | (1,782 | ) | (1,782 | ) | ||||||||||||||||||
| 2003 interim | — | — | — | — | (987 | ) | (987 | ) | ||||||||||||||||||
| Appropriation to non-distributable statutory reserve | — | — | — | 22 | (22 | ) | — | |||||||||||||||||||
| Reserves of associated company | — | — | — | 12 | — | 12 | ||||||||||||||||||||
Balance at 30 June 2003 | 12,041 | 1,164 | 2,482 | 146 | 22,187 | 38,020 | ||||||||||||||||||||
| Company and subsidiary companies | 12,041 | 1,164 | 2,482 | 107 | 18,388 | 34,182 | ||||||||||||||||||||
| Jointly controlled entities | — | — | — | 23 | 3,503 | 3,526 | ||||||||||||||||||||
| Associated companies | — | — | — | 16 | 296 | 312 | ||||||||||||||||||||
| 12,041 | 1,164 | 2,482 | 146 | 22,187 | 38,020 | |||||||||||||||||||||
| Balance at 1 January 2002, as previously reported | 12,107 | 11,281 | 2,416 | (287 | ) | 9,651 | 35,168 | |||||||||||||||||||
| Tax adjustments (Note (a)) | — | — | — | 1 | 63 | 64 | ||||||||||||||||||||
| Balance at 1 January 2002, restated | 12,107 | 11,281 | 2,416 | (286 | ) | 9,714 | 35,232 | |||||||||||||||||||
| Exchange differences arising on translation of : | ||||||||||||||||||||||||||
| jointly controlled entities | — | — | — | 200 | — | 200 | ||||||||||||||||||||
| associated company | — | — | — | 81 | — | 81 | ||||||||||||||||||||
| Net gains and losses not recognised in the profit and loss account | — | — | — | 281 | — | 281 | ||||||||||||||||||||
| Repurchase of ordinary shares | (66 | ) | — | 66 | — | (397 | ) | (397 | ) | |||||||||||||||||
| Transfer of share premium to retained profit | — | (10,117 | ) | — | — | 10,117 | — | |||||||||||||||||||
| Earnings for the period, restated | — | — | — | — | 3,431 | 3,431 | ||||||||||||||||||||
| Dividends declared: 2001 final | — | — | — | — | (2,528 | ) | (2,528 | ) | ||||||||||||||||||
| 2002 interim | — | — | — | — | (915 | ) | (915 | ) | ||||||||||||||||||
| Reserves of associated company | — | — | — | 4 | — | 4 | ||||||||||||||||||||
| Note (c) | ||||||||||||||||||||||||||
| Balance at 30 June 2002 | 12,041 | 1,164 | 2,482 | (1 | ) | 19,422 | 35,108 | |||||||||||||||||||
| Company and subsidiary companies | 12,041 | 1,164 | 2,482 | (10 | ) | 15,709 | 31,386 | |||||||||||||||||||
| Jointly controlled entities | — | — | — | 2 | 3,461 | 3,463 | ||||||||||||||||||||
| Associated companies | — | — | — | 7 | 252 | 259 | ||||||||||||||||||||
| 12,041 | 1,164 | 2,482 | (1 | ) | 19,422 | 35,108 | ||||||||||||||||||||
Notes:
| (a) | The profits tax adjustments are required for the adoption of SSAP No. 12 (Revised) “Income Taxes” (Note 1(A) to the Condensed Interim Accounts). The adjustments mainly relate to temporary differences in respect of property, plant and equipment, the revaluation of assets on acquisition, withholding taxation on retained earnings of overseas investments, and carried forward tax losses. | ||
| (b) | The proposed interim dividend at 30 June 2003 and balance of retained profits after the proposed interim dividend were HK$987 million and HK$21,200 million respectively. | ||
| (c) | The proposed interim dividend at 30 June 2002 and balance of retained profits after the proposed interim dividend were HK$915 million and HK$18,507 million respectively. | ||
|
Page 22
Condensed Consolidated Cash Flow Statement
| 6 months ended 30 June | ||||||||||||||
| (Unaudited) | ||||||||||||||
| 2003 | 2002 | |||||||||||||
| Note | HK$M | HK$M | ||||||||||||
OPERATING ACTIVITIES | ||||||||||||||
| Cash generated from operations | 24(a) | 2,800 | 2,912 | |||||||||||
| Operating interest paid | (197 | ) | (49 | ) | ||||||||||
| Interest received | 23 | 11 | ||||||||||||
| Profits tax paid | (203 | ) | (207 | ) | ||||||||||
NET CASH INFLOW FROM OPERATING ACTIVITIES | 2,423 | 2,667 | ||||||||||||
INVESTING ACTIVITIES | ||||||||||||||
| Capital expenditure | (2,524 | ) | (2,198 | ) | ||||||||||
| Capitalised interest paid | (139 | ) | (86 | ) | ||||||||||
| Proceeds from disposal of fixed assets | 3 | 21 | ||||||||||||
| Net cash outflow from acquisition of subsidiary undertakings | 24(b) | (354 | ) | — | ||||||||||
| Investments in, loans and advances to, jointly controlled entities | (110 | ) | (2,272 | ) | ||||||||||
| Purchase of investment securities | (438 | ) | (14 | ) | ||||||||||
| Realisation of employee retirement benefit plan assets | 1,155 | — | ||||||||||||
| Dividends received from investments | ||||||||||||||
| - jointly controlled entities | 1,183 | 1,054 | ||||||||||||
| - associated company | 27 | 27 | ||||||||||||
| - other investment | 34 | 17 | ||||||||||||
| Cash received from Hok Un joint venture | 168 | 1,150 | ||||||||||||
NET CASH OUTFLOW FROM INVESTING ACTIVITIES | (995 | ) | (2,301 | ) | ||||||||||
NET CASH INFLOW BEFORE FINANCING | 1,428 | 366 | ||||||||||||
FINANCING | ||||||||||||||
| Proceeds from long-term borrowings | 1,500 | 4,519 | ||||||||||||
| Repayment of long-term borrowings | (855 | ) | (956 | ) | ||||||||||
| Increase/(decrease) in short-term borrowings | 738 | (60 | ) | |||||||||||
| Repurchase of ordinary shares | — | (397 | ) | |||||||||||
| Dividends paid | (2,769 | ) | (3,443 | ) | ||||||||||
NET CASH OUTFLOW FROM FINANCING | (1,386 | ) | (337 | ) | ||||||||||
| Effect of exchange rate changes | 14 | — | ||||||||||||
| Net increase in cash and cash equivalents | 56 | 29 | ||||||||||||
| Cash and cash equivalents at beginning of the period | 516 | 80 | ||||||||||||
CASH AND CASH EQUIVALENTS AT END OF THE PERIOD | 572 | 109 | ||||||||||||
| Analysis of cash and cash equivalents | ||||||||||||||
| Trust fund for unclaimed dividends | 24 | 23 | ||||||||||||
| Trust fund for trade creditors | — | 3 | ||||||||||||
| Deposits, bank balances and cash | 548 | 83 | ||||||||||||
| 572 | 109 | |||||||||||||
Page 23
Notes to the Condensed Interim Accounts
| 1. | Basis of Preparation and Accounting Policies |
| (A) | The unaudited condensed interim accounts are prepared in accordance with Hong Kong Statement of Standard Accounting Practice (SSAP) No. 25 “Interim Financial Reporting” issued by the Hong Kong Society of Accountants. The accounting policies used in the preparation of the unaudited condensed interim accounts are consistent with those set out in the 2002 Annual Report except that the Group has changed its accounting policy for taxation following the adoption of SSAP No. 12 (Revised) “Income Taxes”, which became effective from 1 January 2003. The change to the Group’s accounting policies and the effect of adopting this new policy are set out below: | ||
| Deferred Taxation Deferred taxation is provided in full, using the liability method, on temporary differences arising between the tax bases of assets and liabilities and their carrying amounts in the financial statements. Taxation rates enacted or substantially enacted by the balance sheet date are used to determine deferred taxation. | |||
| Deferred tax assets are recognised to the extent that it is probable that future taxable profit will be available against which the temporary differences can be utilised. | |||
| Deferred taxation is provided on temporary difference arising on investments in subsidiaries, associates and joint ventures, except where the timing of the reversal of the temporary difference can be controlled and it is probable that the temporary difference will not reverse in the foreseeable future. | |||
| Previously, the Group accounted for deferred tax in the SoC business on a full provision basis in respect of timing differences attributable to accelerated depreciation at the taxation rate in force in the year in which the difference arose. In the non-SoC businesses, deferred taxation was accounted for at the current taxation rate in respect of timing differences between profit as computed for taxation purposes and profit as stated in the accounts to the extent that a liability or an asset was expected to be payable or recoverable in the foreseeable future. | |||
| The adoption of the new SSAP No. 12 (Revised) represents a change in accounting policy which has been applied retrospectively so that the comparative figures presented have been restated to conform to the changed policy. | |||
| The main effects of the adoption of the new SSAP No. 12 (Revised) on the Group arise from revaluation of assets on acquisition, withholding taxation on retained earnings of overseas investments, and losses carried forward. | |||
| The deferred tax liabilities at 31 December 2002 have been reduced by HK$111 million (2001: HK$112 million) with corresponding adjustments to i) increase the share of net asset value of jointly controlled entities by HK$557 million (2001: HK$427 million), ii) reduce positive goodwill and create negative goodwill on jointly controlled entities by HK$56 million and HK$396 million, respectively, (2001: increase HK$9 million and create HK$369 million), iii) increase other payables by HK$115 million (2001: HK$115 million) and iv) increase retained earnings by HK$101 million (2001: HK$64 million). The impact of the SSAP No. 12 (Revised) on the profit and loss account for the period ended 30 June 2003 has been a reduction in reported net profit of HK$50 million. |
Page 24
| (B) | Pursuant to an agreement entered into with Powergen UK plc in November 2002 to acquire all of its remaining interests in BLCP Power Limited in Thailand (BLCP), Yallourn Energy Pty Limited in Australia (Yallourn Energy) and Gujarat Paguthan Energy Corporation Private Limited in India (GPEC), the acquisitions of these additional interests were completed on 10 January 2003, 16 April 2003 and 11 June 2003 respectively. After these acquisitions, the Group owns 50% of BLCP, 92% of Yallourn Energy and 100% of GPEC. BLCP remains as a jointly controlled entity. The Group gained control of Yallourn Energy and GPEC from the date when the additional interest acquisitions were completed. As a result, the description of some accounting policies of the Group has been expanded to reflect consolidation of Yallourn Energy and GPEC into the Group as shown below: |
| i) | Turnover | ||
| Turnover represents sale of electricity, other electricity-related revenue, property income, supply and maintenance services. Sale of electricity is based on either actual and accrued consumption derived from meters read or amount billed in accordance with the terms of the contractual agreements where applicable during the period. Other revenue is recognised when services are rendered or sales are completed. | |||
| ii) | Fixed Assets and Depreciation | ||
| Depreciation of fixed assets are accounted according to the following range of useful lives: |
| Description | Years | ||||
SoC fixed assets | |||||
| Buildings | 33 | ||||
| Overhead line (132 kV and above) | 35 | ||||
| Overhead line (below 132 kV) and cables | 30 | ||||
| Generating plant, switchgear and transformer | 25 | ||||
| Meters, system control equipment, furniture, tools, communication and office equipment | 10 | ||||
| Computers and office automation equipment other than those forming part of the generating plant | 5 | ||||
| Motor vehicles | 5 | ||||
Non-SoC fixed assets | |||||
| Buildings | 30-32 | ||||
| Generating plant, switchgear and transformers | 17-32 | ||||
| Office equipment | 2-7 | ||||
| Motor vehicles | 3-8 | ||||
| Mining machine and equipment | 10-30 | ||||
| Freehold land is not depreciated | |||||
Page 25
| 2. | Turnover and Segment Information | |
| An analysis of the Group’s turnover, contribution to operating profit and profits before financing and taxation for the period by principal activities is as follows: |
| Profit/(Loss) Before | ||||||||||||||||||||||||
| Operating | Financing and | |||||||||||||||||||||||
| 6 months ended 30 June | Turnover | Profit/(Loss) (A) | Taxation (B) | |||||||||||||||||||||
| 2003 | 2002 | 2003 | 2002 | 2003 | 2002 | |||||||||||||||||||
| HK$M | HK$M | HK$M | HK$M | HK$M | HK$M | |||||||||||||||||||
| SoC business | 11,333 | 11,692 | 2,609 | 3,118 | 3,436 | 3,901 | ||||||||||||||||||
| Power projects outside Hong Kong | 470 | — | 47 | (91 | ) | 995 | 709 | |||||||||||||||||
| Other businesses | 68 | 112 | (11 | ) | (78 | ) | 41 | 81 | ||||||||||||||||
| Unallocated Group expenses | — | — | (59 | ) | (59 | ) | (59 | ) | (59 | ) | ||||||||||||||
| 11,871 | 11,804 | 2,586 | 2,890 | 4,413 | 4,632 | |||||||||||||||||||
| (A): | Operating Profit/(Loss) is stated before taking into account the Group’s share of the results of jointly controlled entities and associated companies. | ||
| (B): | Profit/(Loss) Before Financing and Taxation is stated after taking into account the Group’s share of the results of jointly controlled entities and associated companies. |
| The Group operates, through its subsidiary companies, jointly controlled entities and associated companies, in three major geographical regions — Hong Kong, the Chinese mainland and the Asia-Pacific region. Information about the Group’s operations by geographical destination is as follows: |
| 6 months ended | Chinese | Asia-Pacific | Unallocated | |||||||||||||||||
| 30 June 2003 | Hong Kong | Mainland | Region | Items | Total | |||||||||||||||
| HK$M | HK$M | HK$M | HK$M | HK$M | ||||||||||||||||
| Turnover | 10,922 | 479 | 470 | — | 11,871 | |||||||||||||||
| Segment results | 2,575 | (31 | ) | 101 | (59 | ) | 2,586 | |||||||||||||
| Hok Un redevelopment profit | 63 | — | — | — | 63 | |||||||||||||||
| Share of profits less losses of jointly controlled entities | 814 | 672 | 225 | — | 1,711 | |||||||||||||||
| Share of profits less losses of associated companies | (9 | ) | — | 62 | — | 53 | ||||||||||||||
| Profit/(Loss) before financing and taxation | 3,443 | 641 | 388 | (59 | ) | 4,413 | ||||||||||||||
| Finance costs | (223 | ) | ||||||||||||||||||
| Finance income | 35 | |||||||||||||||||||
| Taxation | (728 | ) | ||||||||||||||||||
| Profit after taxation | 3,497 | |||||||||||||||||||
| Transfers under SoC | 217 | |||||||||||||||||||
| Earnings for the period | 3,714 | |||||||||||||||||||
| Amortisation of goodwill and cost of investment | 9 | 17 | 6 | — | 32 | |||||||||||||||
Page 26
| 6 months ended | Chinese | Asia-Pacific | Unallocated | |||||||||||||||||
| 30 June 2002 | Hong Kong | Mainland | Region | Items | Total | |||||||||||||||
| HK$M | HK$M | HK$M | HK$M | HK$M | ||||||||||||||||
| Turnover | 11,285 | 518 | 1 | — | 11,804 | |||||||||||||||
| Segment results | 3,014 | (26 | ) | (39 | ) | (59 | ) | 2,890 | ||||||||||||
| Hok Un redevelopment profit | 163 | — | — | — | 163 | |||||||||||||||
| Share of profits less losses of jointly controlled entities | 764 | 537 | 194 | — | 1,495 | |||||||||||||||
| Share of profit of associated company | — | — | 84 | — | 84 | |||||||||||||||
| Profit/(Loss) before financing and taxation | 3,941 | 511 | 239 | (59 | ) | 4,632 | ||||||||||||||
| Finance costs | (88 | ) | ||||||||||||||||||
| Finance income | 11 | |||||||||||||||||||
| Taxation | (684 | ) | ||||||||||||||||||
| Profit after taxation | 3,871 | |||||||||||||||||||
| Transfers under SoC | (440 | ) | ||||||||||||||||||
| Earnings for the period | 3,431 | |||||||||||||||||||
| Amortisation of goodwill and cost of investment | 2 | 22 | 2 | — | 26 | |||||||||||||||
| 3. | Purchases of Electricity | |
| This represents the purchases of electricity for the Hong Kong SoC business. Further details are shown below: |
| 6 months ended 30 June | ||||||||
| 2003 | 2002 | |||||||
| HK$M | HK$M | |||||||
| Purchases of electricity from CAPCO | 4,962 | 5,105 | ||||||
| Purchases of nuclear electricity | 2,029 | 1,784 | ||||||
| Pumped storage service fee | 121 | 204 | ||||||
| 7,112 | 7,093 | |||||||
| 4. | Yallourn Energy and GPEC | |
| The operating profit of existing operations and the post-acquisition operating profit of Yallourn Energy and GPEC are analysed as follows: |
| 6 months ended 30 June 2003 | |||||||||||||
| Existing | Acquisitions | Total | |||||||||||
| HK$M | HK$M | HK$M | |||||||||||
TURNOVER | 11,401 | 470 | 11,871 | ||||||||||
| Expenses | |||||||||||||
| Purchases of electricity | (7,112 | ) | — | (7,112 | ) | ||||||||
| Staff expenses | (501 | ) | (24 | ) | (525 | ) | |||||||
| Fuel | — | (71 | ) | (71 | ) | ||||||||
| Other net operating costs | (462 | ) | (110 | ) | (572 | ) | |||||||
| Depreciation | (928 | ) | (77 | ) | (1,005 | ) | |||||||
| Operating profit | 2,398 | 188 | 2,586 | ||||||||||
Page 27
| 5. | Operating Profit |
| 6 months ended 30 June | |||||||||
| 2003 | 2002 | ||||||||
| HK$M | HK$M | ||||||||
| Operating profit is stated after charging / (crediting) the following: | |||||||||
Charging | |||||||||
| Staff costs (A) | |||||||||
| Salaries and other costs | 687 | 610 | |||||||
| Retirement benefits costs | 54 | 49 | |||||||
| Loss on disposal of fixed assets | 44 | 25 | |||||||
| Impairment loss on other investments | 12 | — | |||||||
| Amortisation of positive goodwill and cost of investment | 42 | 33 | |||||||
Crediting | |||||||||
| Net rental income from properties | (8 | ) | (8 | ) | |||||
| Capital gains on disposal of properties | — | (5 | ) | ||||||
| Investment gain on realisation of retirement benefit plan asset | (17 | ) | — | ||||||
| Exchange gain | (13 | ) | (20 | ) | |||||
| Amortisation of negative goodwill | (10 | ) | (7 | ) | |||||
| (A) | Staff costs include amounts recharged to jointly controlled entities for services provided. |
| 6. | Finance Costs and Income |
| 6 months ended 30 June | |||||||||
| 2003 | 2002 | ||||||||
| HK$M | HK$M | ||||||||
| Finance costs: | |||||||||
| Interest on bank loans and overdrafts | 177 | 55 | |||||||
| Interest on other loans | |||||||||
| wholly repayable within five years | 82 | 82 | |||||||
| not wholly repayable within five years | 46 | 14 | |||||||
| Interest on customers’ deposits and others | 13 | 10 | |||||||
| Finance charges | 13 | 30 | |||||||
| Exchange loss on foreign currency loan | 12 | — | |||||||
| 343 | 191 | ||||||||
| Less amount capitalised within fixed assets | (120 | ) | (103 | ) | |||||
| 223 | 88 | ||||||||
| Finance income: | |||||||||
| Net interest income from investment securities (Note (A)) | 20 | 4 | |||||||
| Interest income on bank deposits | 15 | 7 | |||||||
| 35 | 11 | ||||||||
| Note (A) | The net interest income relates to interest income of 100% (A$160 million) of the floating rate notes issued by Mezzco Pty Ltd. This is a wholly-owned subsidiary company of AusPower Holdings Pty Ltd., which is the immediate holding company of Yallourn Energy. This interest income relates to the period during which Yallourn Energy was accounted for as a jointly controlled entity. |
Page 28
| 7. | Taxation |
| 6 months ended 30 June | ||||||||||
| 2003 | 2002 | |||||||||
| HK$M | HK$M | |||||||||
| Company and subsidiary companies | ||||||||||
| - Hong Kong | ||||||||||
| current | 247 | 512 | ||||||||
| deferred | 163 | 105 | ||||||||
| - outside Hong Kong | ||||||||||
| current | 4 | — | ||||||||
| deferred | 20 | — | ||||||||
| 434 | 617 | |||||||||
| Share of jointly controlled entities | ||||||||||
| - Hong Kong | ||||||||||
| current | 143 | 130 | ||||||||
| deferred | (16 | ) | (159 | ) | ||||||
| - outside Hong Kong | ||||||||||
| current | 125 | 69 | ||||||||
| deferred | 30 | 16 | ||||||||
| 282 | 56 | |||||||||
| Share of associated companies | ||||||||||
| - outside Hong Kong | ||||||||||
| current | 12 | 11 | ||||||||
| 728 | 684 | |||||||||
| Hong Kong profits tax has been provided at the rate of 17.5% (2002: 16%) on the estimated assessable profit for the period. Taxation on profits assessable outside Hong Kong has been provided at the rates prevailing in the respective jurisdictions. | ||
| 8. | Non-Scheme of Control Operating Earnings |
| 6 months ended 30 June | |||||||||
| 2003 | 2002 | ||||||||
| HK$M | HK$M | ||||||||
| Income from power projects outside Hong Kong | 706 | 618 | |||||||
| Chinese mainland | 516 | 391 | |||||||
| Asia-Pacific Region | 190 | 227 | |||||||
| Sales to the Chinese mainland | 30 | 35 | |||||||
| Other businesses | (26 | ) | (85 | ) | |||||
| 710 | 568 | ||||||||
Page 29
9. Dividends
| 6 months ended 30 June | |||||||||||||||||
| 2003 | 2002 | ||||||||||||||||
| HK$ per share | HK$M | HK$ per share | HK$M | ||||||||||||||
| First interim dividend paid | 0.41 | 987 | 0.38 | 915 | |||||||||||||
| Second interim dividend | 0.41 | 987 | 0.38 | 915 | |||||||||||||
| 0.82 | 1,974 | 0.76 | 1,830 | ||||||||||||||
| At the Board meeting held on 4 August 2003 the directors declared a second interim dividend of HK$0.41 per share. The second interim dividend is not reflected as dividends payable in these accounts, but as a separate component of the shareholders’ funds for the period ended 30 June 2003. | ||
| 10. | Earnings per Share | |
| The earnings per share is based on earnings of HK$3,714 million (2002: HK$3,431 million) and the number of shares in issue of 2,408,245,900 shares (2002: 2,409,329,601 weighted average number of shares in issue). To enable investors to understand better the Group’s results, an additional earnings per share figure has been calculated excluding the Hok Un redevelopment profit of HK$51 million (2002: HK$134 million). | ||
| Fully diluted earnings per share is not included as the Company does not have any diluting equity instruments as at 30 June 2003. | ||
| 11. | Fixed Assets |
| Plant, | ||||||||||||
| Land | Machinery | |||||||||||
| and | and | |||||||||||
| Buildings | Equipment | Total | ||||||||||
| HK$M | HK$M | HK$M | ||||||||||
| Net book amount at 1 January 2003 | 6,560 | 29,990 | 36,550 | |||||||||
| Acquisition of subsidiaries | 359 | 12,145 | 12,504 | |||||||||
| Additions | 490 | 1,902 | 2,392 | |||||||||
| Transfers and disposals | (2 | ) | (45 | ) | (47 | ) | ||||||
| Depreciation | (72 | ) | (933 | ) | (1,005 | ) | ||||||
| Translation difference | 19 | 880 | 899 | |||||||||
Net book amount at 30 June 2003 | 7,354 | 43,939 | 51,293 | |||||||||
| The fixed assets employed for the SoC business at 30 June 2003 amounted to HK$37,604 million (December 2002: HK$36,273 million). |
Page 30
| 12. | Goodwill |
| 31 December | ||||||||||||||||
| 30 June 2003 | 2002 | |||||||||||||||
| Positive | Negative | |||||||||||||||
| Goodwill | Goodwill | Total | Total | |||||||||||||
| HK$M | HK$M | HK$M | HK$M | |||||||||||||
Gross Amount : | ||||||||||||||||
| Balance at beginning of period | — | — | — | — | ||||||||||||
| Transfer from jointly controlled entities | 289 | — | 289 | — | ||||||||||||
| Adjustment on adoption of SSAP No. 12 | (69 | ) | (419 | ) | (488 | ) | — | |||||||||
| Balance after transfer, restated | 220 | (419 | ) | (199 | ) | |||||||||||
| Fair value adjustment | (46 | ) | — | (46 | ) | |||||||||||
| Acquisition of subsidiaries | — | (457 | ) | (457 | ) | — | ||||||||||
| Translation difference | 9 | (99 | ) | (90 | ) | — | ||||||||||
| Balance at end of period | 183 | (975 | ) | (792 | ) | — | ||||||||||
Accumulated Amortisation : | ||||||||||||||||
| Balance at beginning of period | — | — | — | — | ||||||||||||
| Transfer from jointly controlled entities | (15 | ) | — | (15 | ) | — | ||||||||||
| Adjustment on adoption of SSAP No. 12 | 4 | 23 | 27 | — | ||||||||||||
| Balance after transfer, restated | (11 | ) | 23 | 12 | — | |||||||||||
| (Charge)/credit for the period | (4 | ) | 10 | 6 | — | |||||||||||
| Translation difference | — | 6 | 6 | — | ||||||||||||
| Balance at end of period | (15 | ) | 39 | 24 | — | |||||||||||
| Net carrying value | 168 | (936 | ) | (768 | ) | — | ||||||||||
| The goodwill arises due to the acquisition of additional interests in Yallourn Energy and GPEC and consequently the reclassification of goodwill on these companies from jointly controlled entities to goodwill in the consolidated balance sheet during the period ended 30 June 2003. | ||
| 13. | Investments in Jointly Controlled Entities |
| 30 June | 31 December | ||||||||
| 2003 | 2002 | ||||||||
| HK$M | HK$M | ||||||||
| Investments in : | |||||||||
| Castle Peak Power Company Limited | 5,280 | 5,109 | |||||||
| Guangdong Nuclear Power Joint Venture Company, Limited | 2,707 | 3,071 | |||||||
| CLP Powergen joint ventures | |||||||||
| - - Yallourn Energy Pty Limited, Australia (A) | — | 2,425 | |||||||
| - Gujarat Paguthan Energy Corporation Private Limited, India (GPEC) (B) | — | 2,807 | |||||||
| Hok Un Joint Venture | 738 | 825 | |||||||
| Shandong Zhonghua Power Company Limited | 1,322 | 1,373 | |||||||
| Ho-Ping Power Company Limited | 1,322 | 1,210 | |||||||
| CLP Guohua Power Company Limited | 1,035 | 966 | |||||||
| Hong Kong Pumped Storage Development Company, Limited | 315 | 312 | |||||||
| Other jointly controlled entities | 974 | 884 | |||||||
| 13,693 | 18,982 | ||||||||
Page 31
| The amount of investments in the above jointly controlled entities include loan and advances as follows: |
| 30 June | 31 December | ||||||||
| 2003 | 2002 | ||||||||
| HK$M | HK$M | ||||||||
| Castle Peak Power Company Limited | 4,984 | 4,934 | |||||||
| CLP Powergen joint ventures | |||||||||
| - - Yallourn Energy Pty Limited, Australia | — | 221 | |||||||
| Hong Kong Pumped Storage Development Company, Limited | 296 | 300 | |||||||
| Other jointly controlled entities | 311 | 313 | |||||||
| 5,591 | 5,768 | ||||||||
| (A) | On 16 April 2003, the Group acquired Powergen UK plc’s (Powergen) remaining interest (18.4%) in Yallourn Energy for a consideration of HK$508 million. The Group’s total interest in Yallourn Energy increased to 92% and the participation of Powergen in the operation and management of Yallourn Energy ceased. As a result, Yallourn Energy has been consolidated from that date. | ||
| (B) | On 11 June 2003, the Group acquired Powergen’s remaining interest (20%) in GPEC for a consideration of HK$328 million. On this date, GPEC became a wholly-owned subsidiary company of the Group and the participation of Powergen in the operation and management of GPEC ceased. As a result, GPEC has been consolidated from that date. |
| 14. | Investments in Associated Companies |
| 30 June | 31 December | ||||||||
| 2003 | 2002 | ||||||||
| HK$M | HK$M | ||||||||
| Electricity Generating Public Company Limited | 1,346 | 1,276 | |||||||
| (market value HK$1,236 million, 2002: HK$800 million) | |||||||||
| PowerCom Network Hong Kong Limited | 141 | 150 | |||||||
| 1,487 | 1,426 | ||||||||
| 15. | Investment Securities |
| 30 June | 31 December | |||||||
| 2003 | 2002 | |||||||
| HK$M | HK$M | |||||||
| Equity securities listed in Hong Kong | 14 | 14 | ||||||
| Unlisted shares | 4 | 4 | ||||||
| Held-to-maturity securities (A) | — | 264 | ||||||
| Fixed-income securities | 8 | 5 | ||||||
| 26 | 287 | |||||||
Page 32
| (A) | The Group holds 100% (A$160 million) of the floating rate notes issued by Mezzco Pty Ltd. This is a wholly-owned subsidiary company of AusPower Holdings Pty Ltd., which is the immediate holding company of Yallourn Energy. During the period, the Group acquired an additional interest in Yallourn Energy and has subsequently consolidated both Yallourn Energy and Mezzco Pty Ltd. For the consolidated accounts, the Group’s investment in the floating rates notes was eliminated against the liability of Mezzco Pty Ltd. |
| 16. | (A) Deferred Tax Assets |
| The movement on the deferred tax assets account is as follows: |
| 30 June | 31 December | |||||||
| 2003 | 2002 | |||||||
| HK$M | HK$M | |||||||
| At 1 January | — | — | ||||||
| Acquisition of subsidiaries | 808 | — | ||||||
| Charged to profit and loss account | (9 | ) | — | |||||
| Translation difference | 73 | — | ||||||
| 872 | — | |||||||
| Analysis of Deferred Tax Assets |
| Accelerated | ||||||||||||||||||||
| tax | ||||||||||||||||||||
| Provisions | Tax losses | depreciation | Others | Total | ||||||||||||||||
| HK$M | HK$M | HK$M | HK$M | HK$M | ||||||||||||||||
| At 1 January 2003 | — | — | — | — | — | |||||||||||||||
| (Charged) / credited to profit and loss account | 1 | 44 | (68 | ) | 14 | (9 | ) | |||||||||||||
| Acquisition of subsidiaries | 70 | 2,909 | (2,194 | ) | 23 | 808 | ||||||||||||||
| Translation difference | 3 | 279 | (205 | ) | (4 | ) | 73 | |||||||||||||
| At 30 June 2003 | 74 | 3,232 | (2,467 | ) | 33 | 872 | ||||||||||||||
| No comparative figures are shown because all the deferred tax assets are related to Yallourn Energy and GPEC which are consolidated in 2003 and not in 2002. | |||
| (B) | Deferred Tax Liabilities | ||
| The movement on the deferred tax liabilities account is as follows: | |||
| 30 June | 31 December | |||||||
| 2003 | 2002 | |||||||
| HK$M | HK$M | |||||||
| At 1 January | 3,610 | 3,279 | ||||||
| Acquisition of subsidiaries | 222 | — | ||||||
| Charge for the period | 174 | 331 | ||||||
| Taxation adjustment due to change in tax rate | 337 | — | ||||||
| Translation difference | 5 | — | ||||||
| 4,348 | 3,610 | |||||||
Page 33
| The deferred tax liabilities are due to temporary difference caused by accelerated tax depreciation of HK$4,110 million (December 2002: HK$3,610 million) and tax on dividend distribution of HK$238 million (December 2002: nil). | ||
| 17. | Employee Retirement Benefit Plan Assets | |
| Prior to 25 June 2003, the Group operated two retirement schemes, one for professional and general staff and the other for industrial staff employed by Group Companies in Hong Kong. To streamline operations and enhance administration efficiency, the Group decided to wind up the two retirement schemes and established the new CLP Group Provident Fund Scheme (GPFS) on 25 June 2003. All the members in the old schemes automatically become members of the GPFS. The transfer is based on the principle that there is no change in benefits (past and future) for members. | ||
| Pursuant to the Deeds of Termination dated 30 April 2003, the two old retirement schemes were terminated on 24 June 2003. In accordance with their Trust Deeds, upon winding up of the retirement schemes, any surplus assets after meeting the obligation to the members are to be returned to the Group. The surplus assets realised were HK$1,155 million. | ||
| 18. | Deposits, Bank Balances and Cash |
| 30 June | 31 December | ||||||||
| 2003 | 2002 | ||||||||
| HK$M | HK$M | ||||||||
| Trust fund for unclaimed dividends | 24 | 25 | |||||||
| Deposits, bank balances and cash | 548 | 491 | |||||||
| 572 | 516 | ||||||||
| 19. | Other Investments |
| 30 June | 31 December | ||||||||
| 2003 | 2002 | ||||||||
| HK$M | HK$M | ||||||||
| Investment in YTL Power, at fair value | 659 | 671 | |||||||
| The investment in YTL Power is carried at fair value. On 23 July 2003, the Group reached an agreement to sell the shares at MYR 2.75 per share. Since this offer was made prior to 30 June 2003, the directors have therefore used this sales price as the fair value. |
Page 34
| 20. | Trade and Other Receivables |
| 30 June | 31 December | |||||||
| 2003 | 2002 | |||||||
| HK$M | HK$M | |||||||
| Trade receivables (ageing analysis is shown below) | 3,229 | 605 | ||||||
| Dividend receivable from jointly controlled entities | 384 | — | ||||||
| Deposits and prepayments | 1,179 | 601 | ||||||
| Current accounts with jointly controlled entities | 78 | 50 | ||||||
| 4,870 | 1,256 | |||||||
| The Group has established credit policies for customers in each of its core businesses. The average credit period granted for trade receivables ranges from 13 to 60 days. | ||
| The ageing analysis of the trade receivables is as follows: |
| 30 June | 31 December | |||||||
| 2003 | 2002 | |||||||
| HK$M | HK$M | |||||||
| Below 30 days | 2,672 | 573 | ||||||
| 31-60 days | 38 | 17 | ||||||
| 61-90 days | 159 | 6 | ||||||
| Over 90 days | 360 | 9 | ||||||
| 3,229 | 605 | |||||||
| 21. | Trade and Other Payables |
| 30 June | 31 December | |||||||
| 2003 | 2002 | |||||||
| HK$M | HK$M | |||||||
| Trade payables (ageing analysis is shown below) | 1,272 | 1,404 | ||||||
| Other payables | 1,465 | 752 | ||||||
| Current accounts with jointly controlled entities | 1,072 | 1,050 | ||||||
| 3,809 | 3,206 | |||||||
| The ageing analysis of the trade payables is as follows: |
| 30 June | 31 December | |||||||
| 2003 | 2002 | |||||||
| HK$M | HK$M | |||||||
| Below 30 days | 1,204 | 1,341 | ||||||
| 31-60 days | 2 | 5 | ||||||
| 61-90 days | — | 1 | ||||||
| Over 90 days | 66 | 57 | ||||||
| 1,272 | 1,404 | |||||||
Page 35
| 22. | Bank Overdrafts, Bank Loans and Other Borrowings |
| 30 June | 31 December | |||||||||
| 2003 | 2002 | |||||||||
| HK$M | HK$M | |||||||||
| Total facilities available | 26,647 | 17,212 | ||||||||
| Facilities utilised | ||||||||||
| Bank loans | 13,397 | 4,617 | ||||||||
| Other borrowings | 5,180 | 4,680 | ||||||||
| 18,577 | 9,297 | |||||||||
| Short-term loans | 1,305 | 567 | ||||||||
| Current portion of long-term loans and borrowings | 454 | 3 | ||||||||
| 1,759 | 570 | |||||||||
| Long-term loans and borrowings, repayable | ||||||||||
| within one year | 454 | 3 | ||||||||
| between one and two years | 631 | 2 | ||||||||
| between two and five years | 10,510 | 6,385 | ||||||||
| after five years | 5,677 | 2,340 | ||||||||
| 17,272 | 8,730 | |||||||||
| Less current portion of long-term loans and borrowings | (454 | ) | (3 | ) | ||||||
| 16,818 | 8,727 | |||||||||
| 18,577 | 9,297 | |||||||||
| Borrowings at 30 June 2003 include HK$7,458 million in respect of Yallourn Energy and GPEC, which became subsidiary companies during the period. | ||
| Of the total facilities available at 30 June 2003, HK$23,658 million are committed (December 2002: HK$14,224 million). | ||
| 23. | Scheme of Control Reserve Accounts | |
| The Scheme of Control reserve accounts comprise the Development Fund, special provision account and rate reduction reserve of CLP Power as follows: |
| 30 June | 31 December | |||||||
| 2003 | 2002 | |||||||
| HK$M | HK$M | |||||||
| Development Fund (A) | 2,799 | 3,372 | ||||||
| Special provision account (B) | 568 | 670 | ||||||
| Rate reduction reserve (C) | 527 | 458 | ||||||
| 3,894 | 4,500 | |||||||
Page 36
| (A) | Development Fund |
| 30 June | 31 December | |||||||
| 2003 | 2002 | |||||||
| HK$M | HK$M | |||||||
| Balance at beginning of period / year | 3,372 | 3,177 | ||||||
| Transfer (to)/from profit and loss account | (263 | ) | 1,420 | |||||
| One-off rebate | (8 | ) | (558 | ) | ||||
| Business relief rebate | (19 | ) | (41 | ) | ||||
| Special rebates to customers | (283 | ) | (626 | ) | ||||
| Balance at end of period / year | 2,799 | 3,372 | ||||||
| A special rebate of HK¢2.2 per unit (2002: HK¢2.2 per unit) was made to customers during the period. In addition, a business relief rebate of HK¢0.2 per unit (2002: HK¢0.2 per unit) was made to non-residential customers. | ||
| (B) | Special Provision Account |
| 30 June | 31 December | |||||||
| 2003 | 2002 | |||||||
| HK$M | HK$M | |||||||
| Balance at beginning of period / year | 670 | 766 | ||||||
| Transfer to profit and loss account | (102 | ) | (96 | ) | ||||
| Balance at end of period / year | 568 | 670 | ||||||
| CLP Power Hong Kong Limited (CLP Power) and its jointly controlled generating company, Castle Peak Power Company Limited (CAPCO), agreed with the Government in December 1999 to further defer construction of units 7 & 8 of the Black Point Power Station. It was also agreed that a total of HK$803 million be set aside from the Development Fund to a special provision account to which the deferral premium would be charged. The deferral premium is a contractual obligation that corresponds to additional costs incurred by the vendors for delayed delivery of the two generating units. Under the arrangement, there is no permitted return to be earned on the deferral premium. | ||
| (C) | Rate Reduction Reserve |
| 30 June | 31 December | |||||||
| 2003 | 2002 | |||||||
| HK$M | HK$M | |||||||
| Balance at beginning of period / year | 458 | 411 | ||||||
| Transfer from profit and loss account | 148 | 319 | ||||||
| One-off rebate | (2 | ) | (101 | ) | ||||
| Rebates to customers | (77 | ) | (171 | ) | ||||
| Balance at end of period / year | 527 | 458 | ||||||
| A rebate of HK¢0.6 per unit (2002: HK¢0.6 per unit) was made to customers during the period. |
Page 37
| 24. | Notes to the Condensed Consolidated Cash Flow Statement | |
| (a) | Reconciliation of profit before taxation to cash generated from operations |
| 6 months ended 30 June | |||||||||||
| 2003 | 2002 | ||||||||||
| HK$M | HK$M | ||||||||||
| Profit before taxation | 4,225 | 4,555 | |||||||||
| Adjustments for: | |||||||||||
| Operating interests | 198 | 64 | |||||||||
| Finance income | (35 | ) | (11 | ) | |||||||
| Hok Un redevelopment profit | (63 | ) | (163 | ) | |||||||
| Share of profits less losses of other jointly controlled entities | (1,711 | ) | (1,495 | ) | |||||||
| Share of profits less losses of associated companies | (53 | ) | (84 | ) | |||||||
| Exchange gain | (27 | ) | (20 | ) | |||||||
| Depreciation | 1,005 | 842 | |||||||||
| Loss on disposal of fixed assets | 44 | 25 | |||||||||
| Impairment loss on other investments | 12 | — | |||||||||
| Capital gains on disposal of properties | — | (5 | ) | ||||||||
| Investment gain on realisation of retirement benefit plan asset | (17 | ) | — | ||||||||
| Hong Kong SoC items: | |||||||||||
| Increase in customers’ deposits | 78 | 110 | |||||||||
| Increase in fuel clause account | 427 | 118 | |||||||||
| One-off rebate | (1,286 | ) | (439 | ) | |||||||
| Rebates to customers under Scheme of Control | (77 | ) | (77 | ) | |||||||
| Business relief rebate | (19 | ) | (19 | ) | |||||||
| Special rebate | (283 | ) | (282 | ) | |||||||
| (1,160 | ) | (589 | ) | ||||||||
| Operating profit before working capital changes | 2,418 | 3,119 | |||||||||
| Decrease/(Increase) in debtors and prepayments | 808 | (638 | ) | ||||||||
| (Decrease)/Increase in creditors | (420 | ) | 337 | ||||||||
| (Decrease)/Increase in current accounts due to jointly controlled entities | (6 | ) | 94 | ||||||||
| Cash generated from operations | 2,800 | 2,912 | |||||||||
| (b) | Acquisition of Yallourn Energy and GPEC |
| At acquisition | ||||||||
| 2003 | 2002 | |||||||
| HK$M | HK$M | |||||||
| Cash and cash equivalents | 482 | — | ||||||
| Accounts receivable | 1,460 | — | ||||||
| Other current assets | 940 | — | ||||||
| Property, plant and equipment, net of depreciation | 12,419 | — | ||||||
| Land | 85 | — | ||||||
| Deferred tax assets | 808 | — | ||||||
| Current liabilities | (1,339 | ) | — | |||||
| Long-term loans | (6,726 | ) | — | |||||
| Deferred tax liabilities | (222 | ) | ||||||
| Long-term liabilities | (1,209 | ) | — | |||||
| Minority interest | (227 | ) | — | |||||
Page 38
| At acquisition | ||||||||
| 2003 | 2002 | |||||||
| HK$M | HK$M | |||||||
| Net assets previously recorded as jointly controlled entities | (5,178 | ) | — | |||||
| Fair value of net assets acquired | 1,293 | — | ||||||
| Goodwill attributable to subsidiary undertakings | (457 | ) | — | |||||
| Total consideration paid | 836 | — | ||||||
| Cash and cash equivalents of subsidiary undertaking | (482 | ) | — | |||||
| Net cash outflow from acquisition of subsidiary undertakings | 354 | — | ||||||
| 25. | Commitments |
| (A) | Capital expenditure on fixed assets authorised but not brought into the unaudited condensed interim accounts are as follows: |
| 30 June | 31 December | |||||||
| 2003 | 2002 | |||||||
| HK$M | HK$M | |||||||
| Contracted but not provided for | 3,032 | 3,056 | ||||||
| Authorised but not contracted for | 7,205 | 8,402 | ||||||
| 10,237 | 11,458 | |||||||
| (B) | In respect of the investment in the Anshun II Power Project in Guizhou, the Group is required to contribute share capital of RMB440 million (approximately HK$414 million). The amount already paid up to June 2003 was RMB154 million (approximately HK$145 million). The remainder of the share capital will be paid by April 2004. |
| 26. | Contingent Liabilities |
| (A) | China Energy Investment Company Limited (CEIC), a wholly-owned subsidiary company of the Group, is a shareholder of Shandong Zhonghua Power Company Limited, a company formed to develop, own and operate the Shiheng I, Shiheng II, Heze II and Liaocheng Power Stations totalling 3,000 MW in the Shandong Province of the Chinese mainland. As part of the security package for the project, the Company has provided a Letter of Support to the finance parties to procure that CEIC will perform its contractual obligations. The contingent financial liabilities at 30 June 2003 to be assumed by the Group for performance of its contractual obligations relating to the Shandong joint venture are estimated to be HK$3,923 million (at 31 December 2002: HK$3,792 million). | ||
| (B) | The refinancing of Yallourn Energy Pty Limited (Yallourn Energy) was completed on 27 February 2001. Pursuant to the relevant loan agreements all the relevant shareholders of AusPower Holdings Pty Limited, the immediate holding company of Yallourn Energy, agreed to provide the lenders with contingent equity support on a pro rata basis up to the sum of A$200 million in respect of a senior debt facility. The contribution of contingent equity depends on certain minimum requirements regarding the availability of cash flows for debt service within five years from 27 February 2001. As at 30 June 2003, CLP Group’s 92% share of the contingent equity support is approximately A$184 million after acquiring Powergen remaining stake in the investment, see Note 13(A). |
| The Directors are of the opinion that no provision is required to be made in the financial statements in respect of the matters described in (A) and (B) above. |
Page 39
| 27. | Related Party Transactions | |
| In the normal course of business the Group undertakes on an arms-length basis a wide variety of transactions with related parties. The more significant of such transactions during the period ended 30 June are described below: |
| 6 months ended 30 June | ||||||||
| 2003 | 2002 | |||||||
| HK$M | HK$M | |||||||
| Purchases of electricity from CAPCO (A) | 4,962 | 5,105 | ||||||
| Purchases of nuclear electricity (B) | 2,029 | 1,784 | ||||||
| Pumped storage service fee (C) | 121 | 204 | ||||||
| 7,112 | 7,093 | |||||||
| (A) | Under the Electricity Supply Contract between CLP Power and CAPCO, CLP Power is obligated to purchase all of CAPCO’s generating capacity. The Electricity Supply Contract provides that the price paid by CLP Power to CAPCO is sufficient to cover all of CAPCO’s operating expenses, including fuel cost, depreciation, interest expenses and current and deferred taxes, as well as CAPCO’s share of the return permitted under the Scheme of Control. | ||
| (B) | Under the offtake and resale contracts, CLP Power is obligated to purchase the Group’s 25% equity share of the output from Guangdong Daya Bay Nuclear Power Station (GNPS) at Daya Bay and an additional 45% of such output from Guangdong Nuclear Investment Company, Limited. The price paid by CLP Power for electricity generated by GNPS throughout the terms of the power purchase agreements is determined by a formula based on GNPS’s operating costs and a calculation of profits by reference to shareholders’ funds and the capacity factor for that year. | ||
| (C) | Under a capacity purchase contract, Hong Kong Pumped Storage Development Co., Ltd. (PSDC) has the right to use 50% of the 1,200MW capacity of Phase 1 of the Guangzhou Pumped Storage Power Station. CLP Power has entered into a contract with PSDC to make use of this capacity. The price paid by CLP Power to PSDC is sufficient to cover all of PSDC’s operating expenses and net return. PSDC’s net return is based on a percentage of its net fixed assets in a manner analogous to the Scheme of Control. |
| 28. | Statement of the Indebtedness, Contingent Liabilities and Capital Commitments — Affiliated Companies | |
| The Company has obtained a waiver from the Stock Exchange of Hong Kong under Paragraph 3.10 of Practice Note 19 of the Listing Rules from disclosing a proforma combined balance sheet of affiliated companies. Affiliated companies include the Group’s jointly controlled entities and associated companies. Instead, in accordance with Practice Note 19, the Company discloses the following alternative information in relation to the affiliated companies as at 30 June 2003. This information has been extracted from the relevant management accounts of all affiliated companies. |
Page 40
| 30 June | 31 December | ||||||||
| 2003 | 2002 | ||||||||
| HK$M | HK$M | ||||||||
| The Group’s share of total indebtedness of affiliated companies analysed as follows: | |||||||||
| Bank borrowings | 14,497 | 18,468 | |||||||
| Other borrowings including loans from shareholders | 1,709 | 3,074 | |||||||
| 16,206 | 21,542 | ||||||||
| The Group’s share of contingent liabilities of affiliated companies | 125 | 667 | |||||||
| The Group’s share of capital commitments of affiliated companies | |||||||||
| Contracted but not provided for | 2,013 | 1,934 | |||||||
| Authorised but not contracted for | 1,312 | 2,943 | |||||||
| 3,325 | 4,877 | ||||||||
| The significant reduction in bank borrowings and other borrowings including loans from shareholders is mainly due to the exclusion at 30 June 2003 of borrowings of Yallourn Energy and GPEC which were consolidated into the Group balance sheet as both were reclassified from jointly controlled entities to subsidiary companies. |
Page 41
Scheme of Control Statement
The calculations shown below are in accordance with the SoC and the agreements between the SoC Companies. The calculations are extracted from the management accounts of CLP Power for the six months ended 30 June 2003.
| 6 months ended 30 June | ||||||||||
| (Unaudited) | ||||||||||
| 2003 | 2002 | |||||||||
| HK$M | HK$M | |||||||||
SoC Revenue | 11,333 | 11,692 | ||||||||
Expenses | ||||||||||
| Operating costs | 1,394 | 1,325 | ||||||||
| Fuel | 1,393 | 1,696 | ||||||||
| Purchases of nuclear electricity | 2,029 | 1,784 | ||||||||
| Depreciation | 1,652 | 1,544 | ||||||||
| Operating interest | 249 | 313 | ||||||||
| Taxation | 739 | 744 | ||||||||
| 7,456 | 7,406 | |||||||||
Profit after Taxation | 3,877 | 4,286 | ||||||||
| Interest on long-term financing | 372 | 421 | ||||||||
| Adjustments required under the SoC: | ||||||||||
| China Sales profit | (47 | ) | (54 | ) | ||||||
| Special provision account charge | 102 | 54 | ||||||||
Profit for SoC | 4,304 | 4,707 | ||||||||
| Transfer from / (to) Development Fund | 263 | (336 | ) | |||||||
Permitted Return | 4,567 | 4,371 | ||||||||
Deduct Interest | ||||||||||
| On long-term financing as above | 372 | 421 | ||||||||
| On Development Fund and special provision account transferred to rate reduction reserve | 148 | 158 | ||||||||
| 520 | 579 | |||||||||
Net Return | 4,047 | 3,792 | ||||||||
| Divisible as follows: | ||||||||||
| CLP Power | 2,373 | 2,184 | ||||||||
| CAPCO | 1,674 | 1,608 | ||||||||
| 4,047 | 3,792 | |||||||||
CLP Power’s Share of Net Return | ||||||||||
| CLP Power | 2,373 | 2,184 | ||||||||
| Interest in CAPCO | 672 | 645 | ||||||||
| 3,045 | 2,829 | |||||||||
Page 42
Independent Review Report
INDEPENDENT REVIEW REPORT TO THE BOARD OF DIRECTORS OF CLP HOLDINGS LIMITED
(incorporated in Hong Kong with limited liability)
Introduction
We have been instructed by the Company to review the condensed interim accounts set out on pages 1 to 26.
Directors’ Responsibilities
The Rules Governing the Listing of Securities on the Stock Exchange of Hong Kong Limited require the preparation of condensed interim accounts to be in compliance with SSAP No. 25 “Interim Financial Reporting” issued by the Hong Kong Society of Accountants. The condensed interim accounts are the responsibility of, and have been approved by, the directors.
Review Work Performed
We conducted our review in accordance with SAS 700 “Engagements to review interim financial reports” issued by the Hong Kong Society of Accountants. A review consists principally of making enquiries of group management and applying analytical procedures to the condensed interim accounts and, based thereon, assessing whether the accounting policies and presentation have been consistently applied unless otherwise disclosed. A review excludes audit procedures such as tests of controls and verification of assets, liabilities and transactions. It is substantially less in scope than an audit and therefore provides a lower level of assurance than an audit. Accordingly we do not express an audit opinion on the condensed interim accounts.
Review Conclusion
On the basis of our review, which does not constitute an audit, we are not aware of any material modifications that should be made to the condensed interim accounts for the six months ended 30 June 2003.
/s/ PricewaterhouseCoopers
PricewaterhouseCoopers
Certified Public Accountants
Hong Kong, 4 August 2003
Page 43
Disclosure of Interests
Interests of Directors and Chief Executive Officer
The interests/short positions of each of the Directors and Chief Executive Officer in the shares, underlying shares and debentures of the Company or any of the Company’s associated corporations (within the meaning of the Securities and Futures Ordinance) as at 30 June 2003, as recorded in the register required to be kept under Section 352 of Part XV of the Securities and Futures Ordinance, are set out below:
| 1. | Aggregate long position in the shares, underlying shares and debentures of the Company and its associated corporations | |
| The interests of Directors and Chief Executive Officer in the shares of the Company (other than pursuant to equity derivatives such as shares options, warrants to subscribe or convertible bonds) as at 30 June 2003 were as follows: |
| Number of | % of the Issued | |||||||||||
| Ordinary Shares | Share Capital of | |||||||||||
| Directors | Capacity | Held | the Company | |||||||||
| The Hon. Michael D. Kadoorie | Note (a) | 472,424,960 | 19.6170 | |||||||||
| W. E. Mocatta | Interest of controlled | 250,000 | 0.0104 | |||||||||
| corporation | ||||||||||||
| J. S. Dickson Leach | Beneficial owner | 3,436 | 0.0001 | |||||||||
| R. J. McAulay | Note (b) | 439,800,565 | 18.2623 | |||||||||
| The Hon. Sir S. Y. Chung | Beneficial owner | 393,789 | 0.0164 | |||||||||
| William K. Fung | Beneficial owner | 120,000 | 0.0050 | |||||||||
| R. Bischof | Beneficial owner | 35,000 | 0.0015 | |||||||||
| P. C. Tan | Interests held | 5,000 | 0.0002 | |||||||||
| jointly with spouse | ||||||||||||
| Andrew Brandler (Chief Executive Officer) | Note (c) | 20,600 | 0.0009 | |||||||||
| Peter P. W. Tse | Note (c) | 20,600 | 0.0009 | |||||||||
| Peter W. Greenwood | Personal | 5,600 | 0.0002 | |||||||||
Page 44
Notes:
| (a) | The Hon. Michael D. Kadoorie was deemed (by virtue of the Securities and Futures Ordinance) to be interested in 472,424,960 shares in the Company. These shares were held in the following capacity: |
| i) | 1,243 shares were interest of his spouse. | ||
| ii) | 233,379,505 shares were held by discretionary trusts, of which The Hon. Michael D. Kadoorie is one of the beneficiaries. | ||
| iii) | 239,044,212 shares were held by a discretionary trust, of which The Hon. Michael D. Kadoorie is a beneficiary and the founder. |
| (b) | Mr. R. J. McAulay was deemed (by virtue of the Securities and Futures Ordinance) to be interested in 439,800,565 shares in the Company. These shares were held in the following capacity: |
| i) | 13,141 shares were held in personal capacity. | ||
| ii) | 233,379,505 shares were held by discretionary trusts, of which Mr. R. J. McAulay is one of the beneficiaries. | ||
| iii) | 206,407,919 shares were held by discretionary trusts, of which Mr. R. J. McAulay, his wife and members of his family are beneficiaries. |
| (c) | 600 shares were held in personal capacity and 20,000 shares were held in beneficial owner capacity. |
Messrs. J. A. H. Leigh, I. D. Boyce, V. F. Moore, Hansen C. H. Loh and Paul M. L. Kan who are Directors of the Company and Ms. L. J. Ryerkerk who is an Alternate Director have each confirmed that they had no interests in the shares of the Company as at 30 June 2003.
None of the Directors had interests in debentures, under equity derivatives or in underlying shares of the Company and its associated corporations.
| 2. | Aggregate short position in shares, underlying shares and debentures of the Company and its associated corporations. | |
| None of the Directors had short positions in respect of shares, debentures, under equity derivatives or interests in underlying shares of the Company and its associated corporations. |
At no time during the period was the Company, its subsidiaries or its associated companies a party to any arrangement to enable the Directors and the Chief Executive Officer of the Company (including their spouse and children under 18 years of age) to acquire benefits by an acquisition of shares or underlying shares in, or debentures of, the Company or its associated corporations.
Page 45
Interests of Substantial Shareholders
The interests/short positions of Substantial Shareholders in the shares and underlying shares of the Company as at 30 June 2003, as recorded in the register required to be kept under Section 336 of Part XV of the Securities and Futures Ordinance, are set out below:
| 1. | Aggregate long position in the shares and underlying shares of the Company | |
| The Company had been notified of the following substantial shareholders’ interests in the shares (other than pursuant to equity derivatives such as share options, warrants to subscribe or convertible bonds) as at 30 June 2003: |
| Number of | % of the Issued | |||||||||||
| Substantial | Ordinary Shares | Share Capital of | ||||||||||
| Shareholders | Capacity | Held | the Company | |||||||||
| Bermuda Trust | Interest of controlled | 682,978,836 | 28.36 | |||||||||
| Company Limited | corporation | Notes (a)&(b) | ||||||||||
| Esko Limited | Interest of controlled | 233,379,505 | 9.69 | |||||||||
| corporation | Notes (b)&(c) | |||||||||||
| Hesko Limited | Interest of controlled | 233,379,505 | 9.69 | |||||||||
| corporation | Notes (b)&(c) | |||||||||||
| Mikado Holding Inc. | Trustee | 239,044,212 | 9.93 | |||||||||
| Notes (b)&(d) | ||||||||||||
| Mikado Investments | Interest of controlled | 239,044,212 | 9.93 | |||||||||
| Limited | corporation | Notes (b)&(d) | ||||||||||
| New Boron Holding | Trustee | 193,512,472 | 8.04 | |||||||||
| Corporation | Note (c) | |||||||||||
| The Hon. Michael D | Note (e) | 472,424,960 | 19.62 | |||||||||
| Kadoorie | Notes (b)&(e) | |||||||||||
Notes:
| a. | The interests of Bermuda Trust Company Limited in shares of the Company include the shares held by discretionary trusts of which The Hon. Michael D. Kadoorie and/or Mr. R. J. McAulay are among the beneficiaries as disclosed in “Interests of Directors and Chief Executive Officer”. | |
| b. | The interests of Esko Limited, Hesko Limited, Mikado Holding Inc., Mikado Investments Limited and New Boron Holding Corporation in the Company are duplicated by the interests in the Company held by Bermuda Trust Company Limited which effectively controls them. The attributable interests held by The Hon. Michael D. Kadoorie are those identified in “Interests of Directors and Chief Executive Officer”, and apart from the interest of spouse so identified therein, they are also duplicated by the interests in the Company held by Bermuda Trust Company Limited. | |
| c. | Esko Limited and Hesko Limited jointly own the interests in the Company through the following companies: |
Page 46
| % of Issued Share | % of Issued Share | |||||||||||
| Name of Controlled | Capital Owned by | Capital Owned by | ||||||||||
| Corporation | Number of Shares | Esko Limited | Hesko Limited | |||||||||
| New Boron Holding Corporation | 193,512,472 | 50 | 50 | |||||||||
| Mercury Holding Corporation | 4,980,787 | 50 | 50 | |||||||||
| Cobalt Holding Corporation | 34,886,246 | 50 | 50 | |||||||||
| The interests of New Boron Holding Corporation are duplicated by the interests of Esko Limited and Hesko Limited. They are also duplicated by the interests in the Company held by Bermuda Trust Company Limited. | ||
| d. | Mikado Investments Limited owns the interests in the Company through Mikado Holding Inc. The interests of Mikado Holding Inc. are duplicated by the interests of Mikado Investments Limited. They are also duplicated by the interests in the Company held by Bermuda Trust Company Limited. | |
| e. | The aggregate long position in shares of the Company of The Hon. Michael D. Kadoorie are listed below: |
| Interests in Ordinary Shares | Capacity | |
| of the Company | ||
| 1,243 | - Interest of spouse | |
| 239,044,212 | - Founder of a discretionary trust | |
| 472,423,717 | - Beneficiary of various discretionary trusts |
| The interests of The Hon. Michael D. Kadoorie as a founder of a discretionary trust and a beneficiary of one of the discretionary trusts are duplicated amongst each other. His interests, apart from the interest of spouse, are also duplicated by the interests in the Company held by Bermuda Trust Company Limited and certain discretionary trusts of which Mr. R. J. McAulay is one of the beneficiaries as disclosed in “Interests of Directors and Chief Executive Officer.” |
As at 30 June 2003, the Company had not been notified of any substantial shareholders’ interests under equity derivatives or in underlying shares of the Company.
| 2. | Aggregate short position in the shares and underlying shares of the Company | |
| As at 30 June 2003, the Company had not been notified of any short positions being held by any substantial shareholder in the shares or underlying shares of the Company. |
Interests of Any Other Persons
As at 30 June 2003, the Company had not been notified of any persons other than the substantial shareholders who had interests or short positions in the shares or underlying shares of the Company, which are required to be recorded in the register required to be kept under Section 336 of Part XV of the Securities and Futures Ordinance.
Page 47
Corporate Governance
The Audit Committee has reviewed the accounting principles and practices adopted by the Group and the unaudited condensed accounts for the six months ended 30 June 2003. All of the Audit Committee members are appointed from the Independent Non-executive Directors, with the Chairman having appropriate professional qualifications and experience in financial matters.
None of the Directors of the Company is aware of any information that would reasonably indicate that the Company is not, or was not for any part of the six months ended 30 June 2003, in compliance with the Code of Best Practice contained in Appendix 14 of the Rules Governing the Listing of Securities on The Stock Exchange of Hong Kong Limited.
Purchase, Sale Or Redemption Of the Company’s Listed Shares
There was no purchase, sale or redemption of the Company’s listed shares by the Company or any of its subsidiaries during the six months ended 30 June 2003.
Page 48
Information for our Investors
Financial Diary
| Announcement of interim results | 4 August 2003 | |
| Interim report posted to shareholders | 29 August 2003 | |
| Last day to register for second interim dividend | 1 September 2003 | |
| Book close day | 2 September 2003 | |
| Payment of second interim dividend | 15 September 2003 | |
| Financial year end | 31 December 2003 |
Shareholder Enquiries
| Share transfer and registration | Computershare Hong Kong Investor Services Limited 19th Floor, Hopewell Centre 183 Queen’s Road East Wanchai Hong Kong Telephone: (852) 2862 8628 Facsimile : (852) 2865 0990 | |
| Enquires from investors and securities analysts | Donald Shang Investor Relations Manager CLP Holdings Limited 147 Argyle Street Kowloon Hong Kong Telephone: (852) 2678 8322 Facsimile : (852) 2678 8530 E-mail: shangdon@clp.com.hk | |
| General information, comments and suggestions | Shareholder hotline: (852) 2678 8228 E-mail: cosec@clp.com.hk |
Share Listing
CLP Holdings shares are listed on the Stock Exchange of Hong Kong and are traded over the counter in the United States in the form of American Depositary Receipts.
Our Stock Code
The Stock Exchange of Hong Kong: 002
Bloomberg: 2 HK
Reuters: 0002.HK
Ticker Symbol for ADR Code: CLPHY
CUSIP reference number: 18946Q101
Our Website
www.clpgroup.com
Page 49
The English and Chinese versions of CLP Holdings Interim Report 2003 are now available in printed form and on the Company’s website at www.clpgroup.com. Those Shareholders who:
| (a) | received our Interim Report 2003 electronically and would like to receive a printed copy; or | |
| (b) | received our Interim Report 2003 in either English or Chinese language version only and would like to receive a printed copy of the other language version, |
are requested to write to:
| Company Secretary, CLP Holdings Limited, 147 Argyle Street, Kowloon, Hong Kong fax: 852-2678 8390 e-mail: cosec@clp.com.hk |
or the Company’s Registrars,
| Computershare Hong Kong Investor Services Limited, Rooms 1901-1905, Hopewell Centre, 183 Queen’s Road East, Hong Kong fax: 852-2865 0990 e-mail: hkinfo@computershare.com.hk |
Shareholders may at any time choose to change their choice of the language or means of receipt of the Company’s corporate communication free of charge by notice in writing to the Company Secretary or the Company’s Registrars.