Table of Contents
FORM 6-K
SECURITIES AND EXCHANGE COMMISSION
Washington, D.C. 20549
Report of Foreign Private Issuer
Pursuant to Rule 13a-16 or 15d-16 of
the Securities Exchange Act of 1934
For the month of August 2004
CLP Holdings Limited
(Registrant’s name in English)
147 Argyle Street
Kowloon, Hong Kong
(Address of Registrant’s principal executive office)
Indicate by check mark whether the Registrant files or will file annual reports under cover Form 20-F or Form 40-F.
Form 20-F X Form 40-F
Indicate by check mark whether the Registrant by furnishing this information contained in this Form is also thereby furnishing information to the Commission pursuant to Rule 12g3-2(b) under the Securities Exchange Act of 1934.
Yes No X
If “Yes” is marked, indicate below the file number assigned to the Registrant in connection with Rule 12g3-2(b): 82-
Table of Contents
Registrant hereby incorporates by reference in the report on Form 6-K the following Exhibit:
Exhibit
The Interim Report 2004 which was despatched to shareholders on 30 August 2004.
Table of Contents
SIGNATURES
Pursuant to the requirements of the Securities Exchange Act of 1934, the Registrant has duly caused this report to be signed on its behalf by the undersigned, thereunto duly authorized.
| For and on behalf of | ||
| CLP HOLDINGS LIMITED | ||
| By: | / s / April Chan | |
| Name: | April Chan | |
| Title: | Deputy Company Secretary | |
Date:30 August 2004
Table of Contents
Table of Contents
Page 1
| 6 months ended 30 June | Increase/ (Decrease) % | ||||||||
| 2004 | 2003 | ||||||||
Per share | |||||||||
Earnings per share, HK$ | |||||||||
Including Hok Un redevelopment profit | 1.72 | 1.54 | 11.4 | ||||||
Excluding Hok Un redevelopment profit | 1.67 | 1.52 | 9.6 | ||||||
Dividends per share, HK$ | |||||||||
First interim | 0.45 | 0.41 | |||||||
Second interim | 0.45 | 0.41 | |||||||
Total interim dividends | 0.90 | 0.82 | 9.8 | ||||||
For the period | |||||||||
Turnover, HK$M | |||||||||
Scheme of Control (SoC) revenue | 11,870 | 11,333 | 4.7 | ||||||
Total turnover | 13,922 | 11,871 | 17.3 | ||||||
Earnings, HK$M | |||||||||
SoC earnings | 3,337 | 3,045 | 9.6 | ||||||
Non-SoC operating earnings | 791 | 710 | 11.4 | ||||||
Unallocated net finance costs | (39 | ) | (33 | ) | |||||
Unallocated Group expenses | (75 | ) | (59 | ) | |||||
Total operating earnings | 4,014 | 3,663 | 9.6 | ||||||
Hok Un redevelopment profit | 124 | 51 | |||||||
Total earnings | 4,138 | 3,714 | 11.4 | ||||||
SoC capital expenditure, HK$M | |||||||||
CLP Power Hong Kong | 2,313 | 2,295 | 0.8 | ||||||
CAPCO | 829 | 599 | 38.4 | ||||||
Electricity sales (SoC), millions of kWh | |||||||||
Residential | 2,875 | 2,857 | 0.6 | ||||||
Commercial | 5,093 | 4,936 | 3.2 | ||||||
Infrastructure & Public Services | 3,497 | 3,340 | 4.7 | ||||||
Manufacturing | 1,333 | 1,348 | (1.1 | ) | |||||
Total local sales | 12,798 | 12,481 | 2.5 | ||||||
Export sales | 1,085 | 1,153 | (5.9 | ) | |||||
Total electricity sales | 13,883 | 13,634 | 1.8 | ||||||
Interest cover1 , times | 9 | 102 | |||||||
Table of Contents
Page 2
As at the balance sheet date | 30 June 2004 | 31 December 2003 | Increase % | |||
Total assets, HK$M | 76,641 | 75,832 | 1.1 | |||
Total borrowings, HK$M | 19,637 | 18,697 | 5.0 | |||
Shareholders’ funds, HK$M | 41,403 | 40,241 | 2.9 | |||
Total debt to total capital3, % | 32.2 | 31.5 | ||||
| 1 | Interest cover = Profit before taxation and interest / (interest charges + capitalised interest) |
| 2 | Yallourn Energy and GPEC were reclassified from jointly controlled entities to subsidiaries of the Group in April and June 2003 respectively. For meaningful comparison, the 2003 figure has been calculated by including the Group’s share of interest charges of Yallourn Energy and GPEC during the period when they were jointly controlled entities. |
| 3 | Total debt to total capital = debt / (shareholders’ funds + debt + minority interest) |
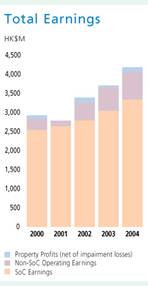 | 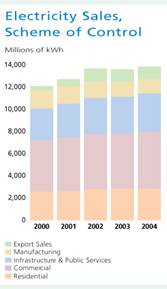 | 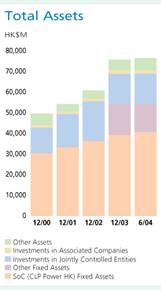 |
Table of Contents
Page 3
Dear Shareholders,
I am pleased to present our Interim Report for the half year ended 30 June 2004 and to record a satisfactory performance by the CLP Group over this period.
Financial Results for the six-month period
The operating earnings of CLP Holdings for the six months ended 30 June 2004 increased by 9.6% to HK$4,014 million, as compared with the corresponding period in 2003. It was encouraging to see that this growth in earnings came from both our Hong Kong electricity business (regulated by the Government of the Hong Kong Special Administrative Region under the Scheme of Control) and our non-Scheme of Control businesses, notably our investments in the electricity sector in the Asia-Pacific region.
Total earnings (which include Hok Un redevelopment profit) for this interim period were HK$4,138 million (HK$1.72 per share), an increase of 11.4%, compared to HK$3,714 million (HK$1.54 per share) in 2003.
Earnings from our electricity business in Hong Kong increased by 9.6% to HK$3,337 million, whilst operating earnings from non-Scheme of Control activities grew by 11.4% to HK$791 million, an increase of HK$81 million compared to the same period in 2003.
Hong Kong
The Hong Kong electricity business remained the main source of the Group’s earnings, contributing 81% of our operating earnings before deduction of unallocated expenses (2003: 81%). Overall, sales of electricity in Hong Kong in the first half of 2004 grew by 2.5% compared with the same period last year. Slow growth earlier in the period was attributable to temperatures being cooler than normal. However, the strength of underlying demand, and Hong Kong’s gradual economic recovery, was dramatically illustrated on 2 July 2004, when our local demand reached a historical peak of 6,329MW. This represented an increase of 7.7% from the previous maximum demand of 5,874MW in summer 2003.
In my Chairman’s Statement to our 2003 Annual Report, I commented on the likelihood that discussions with the Hong Kong Government on the future electricity regulatory regime would move forward during the course of this year. I also noted that any regulatory regime which is introduced after the expiry of the present Scheme of Control in 2008 should be on terms which ensure that the quality of electricity supply is maintained in Hong Kong and that the necessary investments continue to be made.
The sharp and significant growth in maximum electricity demand which has occurred in summer 2004 shows the importance of making the necessary investment in our electricity infrastructure in advance of demand. It also demonstrates that increases in demand can be steep and unexpected and that, even for a mature economy such as Hong Kong, it is unwise to assume that demand in growth will be slow and predictable, and to under-invest accordingly. The increase in maximum demand compared to 2003 was 455MW. To put this in context, this increase alone is equivalent to almost a quarter of the current generating capacity at our Black Point Power Station. On an overall basis, our reserve margin of generating capacity to meet local demand has now fallen from 40.7% to 30.6%.
Table of Contents
Page 4
Increases in electricity demand bear not only upon our generating capacity, but also upon the adequacy and reliability of our transmission and distribution network in Hong Kong. The weather during the last week in June was continually hot and humid. Consequently some significant incremental load increases, up to 38% in some locations, were observed in a variety of residential areas, particularly over the evening periods. Such sharp increases present challenges to any electricity network, yet reliability and availability of electricity supplies were maintained at the customary high levels.
These figures illustrate the straightforward point that present demand can only be met by past investment. CLP’s policy of prudent and continuing investment, backed by certainty in the regulatory regime which enables those investments to be made and for reasonable returns to be earned by our investors, continues to provide the foundation for ensuring that Hong Kong has an electricity infrastructure which meets the needs of our community.
Chinese Mainland and Asia Pacific
The performance of the Group’s investments in the Mainland and the Asia-Pacific region is described in more detail later in this Interim Report.
I wish to note that these activities, whilst more volatile in nature than the Hong Kong Scheme of Control business, are now contributing sustainable and significant income to the Group. This indicates the progress that has been made in CLP’s policy of diversifying its investments, such that we no longer solely rely on the earnings from our Hong Kong electricity business.
The increase in Hong Kong’s domestic demand reflects economic trends that extend across much of the Asia region, including some of the countries where CLP has a presence and is ready to consider further investment. There is very considerable activity in new projects in the Chinese mainland, due to high demand growth, and opportunities for CLP to maintain its position in this market. Similarly, the economic growth in India, Thailand and Taiwan is increasing pressure for further private sector power projects to support the state utilities. Whilst sustainable economic growth creates the basis for expanding our business outside Hong Kong, we will approach all such opportunities cautiously to ensure that any new investment is supported by strong fundamentals of providing power at affordable and competitive prices, and delivering an acceptable return.
This Interim Report explains not only our financial and operational performance, but also the broader environmental and social aspects of our activities. Your Board and I remain committed to the careful stewardship of your Company’s affairs and to overseeing a performance in the second half of this year, and beyond, which builds upon the good results achieved in the first half of 2004.
/s/ The Hon. Michael D. Kadoorie |
| The Hon. Michael D. Kadoorie |
Hong Kong, 4 August 2004 |
Table of Contents
Page 5
Management’s Discussion and Analysis
This section describes CLP’s major activities in Hong Kong, the Chinese mainland and elsewhere in the Asia-Pacific region, as well as the Group’s financial results, funding and obligations during the first half of 2004.
Business Overview
CLP follows a clear, consistent and focused strategy to realise our vision of being a leading investor-operator in the Asia-Pacific electricity power sector. We aim continuously to enhance our core Hong Kong electricity business and to develop a portfolio of electricity businesses in the Chinese mainland and the Asia-Pacific region. An outline of our investments is set out below:
Hong Kong
| Investments | Equity Interest | Description | ||||
CLP Power Hong Kong Limited (CLP Power Hong Kong) | 100% | CLP Power Hong Kong owns and operates the transmission and distribution system, covering a supply area of approximately 1,000 sq. km, which includes: | ||||
• • • • • • • | 552 km of 400kV lines; 1,124 km of 132kV lines; 417 km of 33kV lines; 9,863 km of 11kV lines; 54,697 MVA transformers; 205 primary substations in operation; and 12,077 secondary substations in operation. | |||||
| Castle Peak Power Company Limited (CAPCO), 6,283 megawatts (MW) of installed generating capacity | 40% | CAPCO owns: Black Point Power Station (2,500MW, when completed) | ||||
| • | Gas-fired power station (with distillate as back-up) comprising eight combined cycle turbines of 312.5MW each. | |||||
| • | Six units in operation, plus two final units to be commissioned in 2005 and 2006 respectively. | |||||
| Castle Peak Power Station (4,108MW) | ||||||
| • | Commissioned between 1982 and 1990. | |||||
| • | One of the world’s largest coal-fired power station complexes, comprising eight units ranging from 350MW to 677MW. | |||||
| • | Two of the 677MW units are capable of burning gas and oil as alternative fuels. | |||||
| Penny’s Bay Power Station (300MW) | ||||||
| • | Three diesel oil-fired units of 100MW each, commissioned in 1992. | |||||
Table of Contents
Page 6
| Note: | CLP Power Hong Kong operates CAPCO’s power stations and purchases its power from CAPCO and Guangdong Daya Bay Nuclear Power Station. These sources of power, together with CLP’s right to use 50% of the capacity of Phase 1 of the Guangzhou Pumped Storage Power Station, amount to a total installed capacity of 8,263MW. |
Chinese
| ||||
Investments (Gross/ | Equity Interest | Description | ||
CLP Guohua Power Company Limited (CLP Guohua) 2,100/630MW | 49% | CLP Guohua holds interests in three coal-fired power stations, namely Beijing Yire in Beijing, Panshan in Tianjin, and Sanhe in Hebei, with a combined installed capacity of 2,100MW. | ||
Shandong Zhonghua Power Company, Ltd. (SZPC) 3,000/882MW | 29.4% | SZPC owns four coal-fired power stations, Shiheng I and II (totalling 1,200MW), Liaocheng (1,200MW) and Heze II (600MW). | ||
CLP Guohua Shenmu Power Company Limited (Shenmu) 200/98MW | 49% | Shenmu II Power Station, in Shaanxi, has two 100MW coal-fired units. It is managed as part of CLP Guohua. | ||
Guizhou CLP Power Company Limited (Guizhou CLP Power) 600/420MW | 70% | Guizhou CLP Power develops, constructs and operates two 300MW coal-fired generating units to supply the Guizhou power grid and, through it, to supply Guangdong Province. | ||
Guangdong Nuclear Power Joint Venture Company, Limited (GNPJVC) 1,968/492MW | 25% | GNPJVC was established in 1985 to construct and operate Guangdong Daya Bay Nuclear Power Station (GNPS) at Daya Bay. GNPS is equipped with two 984MW Pressurised Water Reactors. The majority of the GNPS equipment was imported from France and the United Kingdom. The two units at GNPS commenced commercial operation in 1994. 70% of electricity generated is supplied to Hong Kong, with the remaining 30% sold to Guangdong. | ||
Hong Kong Pumped Storage Development Company, Limited (PSDC) 1,200/600MW | 49% | CLP has the right to use half of the 1,200MW pumped storage capacity of Phase I of the Guangzhou Pumped Storage Power Station until 2034. | ||
Huaiji Power Project (Huaiji) 98/41MW | 41.5% | Eight small hydro power stations are in operation, with one under construction, amounting to a total of 98MW. | ||
Table of Contents
Page 7
Asia-Pacific Region
Investments (Gross/ | Equity Interest | Description | ||
Gujarat Paguthan Energy Corporation Private Limited (GPEC), India 655MW | 100% | GPEC operates a 655MW gas-fired combined cycle power station in Gujarat, India. | ||
Ho-Ping Power Company (Ho-Ping), Taiwan 1,320/528MW | 40% | Ho-Ping owns a 1,320MW coal-fired power station at Ho-Ping, Taiwan, which started operations in 2002. | ||
Electricity Generating Public Company Limited (EGCO), Thailand 3,014/541MW | 22.4% | EGCO operates two gas-fired combined cycle power stations in Thailand (2,056MW). It has also invested in a number of small power projects in Thailand and the Philippines, totalling 958MW. | ||
BLCP Power Limited (BLCP), Thailand 1,434/717MW | 50% | BLCP is the developer of a 1,434MW coal-fired power station now under construction at Map Ta Phut, Thailand. | ||
Yallourn Energy Pty Limited (Yallourn Energy), Australia 1,480MW | 100% | Yallourn Energy owns and operates a 1,480MW coal-fired plant and a dedicated coal mine in Victoria, Australia. | ||
Operational Performance and Outlook
Electricity Business in Hong Kong
During the first six months of 2004 the Hong Kong economy continued to improve, with GDP growth of 6.8% in the first quarter compared to the corresponding period in 2003. However, local electricity sales increased at a slower pace than GDP, recording growth of 2.5%. Such sales were affected by the weather, which on average was cooler during the first six months of the year, compared to 2003.
Sales to the Residential Sector increased slightly, whereas sales to the Commercial Sector grew noticeably, reflecting the economic recovery. The Infrastructure & Public Services Sector had stronger growth, attributable in part to increased investment in Hong Kong’s railway infrastructure. The decline of sales to the Manufacturing Sector slowed down as a result of robust export performance.
A breakdown of the local unit sales growth by sector during the period is as follows:
Increase/(Decrease) % | Total Local Sales in % | ||||
Residential | 0.6 | 22.5 | |||
Commercial | 3.2 | 39.8 | |||
Infrastructure & Public Services | 4.7 | 27.3 | |||
Manufacturing | (1.1 | ) | 10.4 | ||
Table of Contents
Page 8
With respect to sales to the Chinese mainland, demand from Shekou remained strong but sales to the Guangdong Guang-Dian Power Grid Group Company Limited (GPG) dropped approximately 12.6%. Overall sales to the Mainland decreased by 5.9% in comparison to the same period in 2003 as the then sales contract with GPG approached completion. With the renewal of the sales contract in late June 2004, sales to GPG are expected to return to a high level during the rest of the year.
Total unit sales, including both local sales and sales to the Chinese mainland, rose 1.8% over the same period in 2003.
Tariffs to our local customers remained unchanged. The HK$500 million rebate to our customers, announced in December 2003, was implemented in March when the rebates began to be credited to customer accounts.
To enhance supply quality and reliability, as well as to provide for demand created by new towns and infrastructure development projects in our supply area, CLP continued to invest in the transmission and distribution networks during the period. Major projects included Hung Hom Bay Bulk Substation, Yuen Long to Fanling 300MVA 132kV circuit and the establishment of San Shek Wan Substation.
Pursuant to the Scheme of Control Agreement with the Government of the Hong Kong Special Administrative Region (HKSAR), the current Financial Plan will expire in December 2004. The 2005 Financial Plan, setting out CLP’s projected sales, capital and operating expenditure and tariff levels for the period from January 2005 to September 2008, was submitted to the HKSAR Government in June and is now under review.
To enhance customer service quality, we have introduced new value added services in response to increasing customer demand. The new services include “Home Advisory Services”, “Electrical Appliances Consultancy Services”, “Registered Electrical Contractors Referral Services” as well as expanded product sales to all market segments and extended operation hours of certain customer centres. Customer traffic (meaning the number of walk-in customers requesting service) in the first three months increased 22% compared with the same period last year.
Our efforts and commitment in quality management were recognised in the Hong Kong Management Association’s (HKMA) 2004 Quality Awards, when CLP Power Hong Kong was named as the Overall Winner.
In line with our commitment to responsible corporate citizenship, CLP partnered with St. James’ Settlement to launch a “Fulfil A Wish” campaign from February to March. The programme aimed at encouraging the community to reduce wastage and reuse electrical appliances. A total of 2,421 electrical appliances were donated by customers and more than 800 less privileged families benefited from the campaign by receiving appliances. We are also pleased that CLP’s volunteers team marks its 10th anniversary this year. The team is currently made up of 600 staff members serving the community in their own time and is one of the largest corporate volunteer teams in Hong Kong.
Table of Contents
Page 9
The current Scheme of Control Agreement, which regulates our Hong Kong electricity business, will expire in 2008. The HKSAR Government has previously indicated that later this year there will be a public consultation on the way forward for the electricity sector. Given the importance of electricity in our daily lives, CLP will be engaging all stakeholders – customers, shareholders, employees, and other members of the Hong Kong community – to promote a better understanding of the industry and a more informed and balanced discussion of the complex issues involved.
Electricity Business in the Chinese Mainland
The 3,000MW joint venture in Shandong Province continued to make good progress. Both units at Liaocheng (2 x 600MW) have now been taken over for commercial operation. New tariffs have been approved for Liaocheng as well as Heze II stations. A new lending consortium comprising entirely Mainland banks refinanced both the RMB and US$ loans. Although there were a number of charges associated with the refinancing, the result was to increase the loan tenors at a lower effective borrowing rate.
Last year we signed a letter of intent to undertake a feasibility study on a 2 x 600MW greenfield project at Fangchenggang in Guangxi, in which CLP may take a 70% interest. We have continued to work with our joint venture partner, Guangxi Water & Power Engineering (Group) Co. Ltd., a subsidiary of the Guangxi Electric Power Co. Ltd., on this project, including the regulatory approvals necessary to allow it to proceed.
Unit 1 of the 2 x 300MW Anshun II Power Station was taken over for commercial operation in March 2004, with Unit 2 envisaged for takeover in November 2004. An increased tariff, which took into account recent coal price increases, was approved in July 2004.
The Guangdong Daya Bay Nuclear Power Station continued to operate well, with good safety and environmental performance. In May, whilst Unit 2 was on a scheduled outage, an incident resulting in a bent fuel assembly, which had no safety or environmental impact, led to the outage being extended by approximately 2 months, with the Unit returning to service on 24 July.
During the first half of 2004, increased demand for electricity in the Mainland led to pressure on domestic coal supplies. Although generation at the power stations in which CLP holds an interest was occasionally constrained by coal supply difficulties, there was no significant adverse effect on production.
Electricity Business in the Asia-Pacific Region
CLP has a significant presence in Australia, India, Taiwan and Thailand. Our focus is on optimising the performance of our existing assets and, where market conditions and investment opportunities permit, continuing to build meaningful and sustainable businesses in those countries.
Table of Contents
Page 10
The acquisition of the remaining 8% shareholding in Yallourn Energy in Australia was completed in March 2004. CLP now owns 100% of Yallourn Energy. During the first half of the year our Yallourn Energy power station performed largely in line with budget. The Morwell River Diversion project, which will secure access to a long-term coal reserve, and the upgrade of the station’s instrumentation and control systems remain on schedule and within budget. Good progress has been made towards a new enterprise bargaining agreement to replace the present three-year agreement which ends in September 2004.
High reliability and safety levels were maintained at our wholly-owned power station, GPEC, in India. An amended power purchase agreement (PPA) with the offtaker, Gujarat Electricity Board, was entered into at the end of 2003. To date, the implementation of the PPA has proceeded satisfactorily with significant improvement in the monthly collections of payments to GPEC, as compared to previous years.
The Ho-Ping power station in Taiwan was commissioned in 2002. Plant performance during the six-month period to 30 June 2004 was characterised by continuing improvement in reliability, as remaining technical issues were steadily resolved. The recent surge in coal prices and sea freight costs did have an operational and financial impact and has required ongoing and close attention from management. In July 2004 we completed a partial refinancing of the project in order to reduce interest costs.
In Thailand, a key task has been to take forward the construction of the BLCP project which is managed by CLP. Progress has been satisfactory and to a schedule which would see the two generating units entering service in 2006/07. The lender base for this project was widened by the participation of the Asian Development Bank and the Japan Bank for International Cooperation.
Electricity-Related Business
Property Business
CLP redevelops sites in Hong Kong which are no longer required for electricity purposes.
Our major project is the residential redevelopment of the former power station site at Hok Un, Kowloon. This 50/50 joint venture project, known as Laguna Verde, led by CLP and a wholly-owned subsidiary of Cheung Kong (Holdings) Limited, comprises 4,735 flats, 1,692 parking spaces and 270,000 sq. ft. of commercial space. About 99% of the residential units in the redevelopment had been sold by the end of June 2004.
Public Lighting and Engineering Services
CLP offers contracting and consultancy services in power engineering, building services, telecommunications, road lighting, energy services and facility management for customers in Hong Kong and neighbouring areas. Our energy services include energy audit, fuel switching and power quality improvement. Power engineering, building services and telecommunications services are normally provided through infrastructure projects. Road lighting and facility management services are provided under maintenance contracts.
Table of Contents
Page 11
Telecommunications
CLP had previously held a 19% stake in PowerCom Network Hong Kong Limited (PowerCom), a joint venture with Cheung Kong Enterprises Limited (CKE) to provide broadband services to Hong Kong customers using powerline telecommunications technology. In line with our strategic focus on our electricity business, we participated in a sale of PowerCom by CKE to Vanda Systems & Communications Holdings Limited (renamed as Hutchison Global Communications Holdings Limited (HGCH)) in January 2004 in exchange for the issue of shares in HGCH. We subsequently placed 37.7% of those shares in March 2004 and sold the remaining shares in July 2004.
Human Resources
On 30 June 2004, the Group employed 4,678 staff (2003: 4,694), of whom 3,897 (2003: 3,895) were employed in the electricity business in Hong Kong and 359 (2003 : 359) by Yallourn Energy and GPEC. Total remuneration for the six months ended 30 June 2004 was HK$1,246 million (2003: HK$1,117 million), including retirement benefit costs of HK$99 million.
During the first half of 2004, we have undertaken a number of key human resources initiatives.
In addition to the internal identification of talent, we maintain programmes that support the introduction of new talent into the CLP Group. As part of this, four new entrants into the CLP Executive Programme (CEP) will join us later this year.
We have also continued the CLP Internship Programme (CIP) which encourages students to join CLP for a summer or a 12 month secondment. The CIP has an excellent reputation with local universities and 51 students are participating in this year’s programme.
On 1 July 2004 we completed the implementation of a new performance-based remuneration system for CLP’s Hong Kong workforce, which had been started in 2001. All permanent staff now have an appropriate percentage of their pay related to individual and company performance, and the 13th month bonus has been completely phased out.
Safety
Safety is of utmost importance across the CLP Group. During the first half of 2004, good performance continued in our wholly-owned subsidiaries in Australia and India. However, the safety performance of our Hong Kong business did not meet our standards. As previously reported in our Annual Report, there were two fatal accidents in February and March. These led to the loss of life of an employee of a CLP contractor at Black Point Power Station and a CLP employee working on an overhead line tower near Tseung Kwan O. In addition, an incident in June at Black Point Power Station injured 3 CLP employees, two of them seriously. This level of safety performance is unacceptable. Each accident is subject to investigation by panels comprising representatives of senior management. In addition to implementing the specific recommendations of the panels, a range of initiatives are being implemented to reinforce our safety culture. We are looking to significant improvement during the second half of 2004.
Table of Contents
Page 12
Environment
A new Boiler Optimisation System, which makes use of Neural Network Technology (Artificial Intelligence), has been installed on a 677MW generating unit at the Castle Peak Power Station. Results show a reduction in Nitrogen Oxide emission and improvement in Boiler Efficiency. We plan to apply this system to other generating units.
CLP is assessing the application of wind energy in Hong Kong through a commercial grade wind turbine demonstration project. In June 2004, we engaged expert consultants to carry out the site selection, wind measurement and environmental studies necessary for bringing this project forward. This project should enable a better understanding of the potential role of renewable energy in Hong Kong.
In March 2004, CLP set new targets to improve our environmental performance, particularly with respect to emissions of sulphur dioxide (SO2). Among these is our commitment to incorporate SO2 emissions reduction capabilities at all new greenfield coal-fired projects in which we have a controlling interest. At the same time, we stated our intent to pursue, in conjunction with the HKSAR Government, the possibility of retrofitting flue gas desulphurisation (FGD) units at our Castle Peak Power Station in Hong Kong.
CLP recognises its responsibility towards future generations, and contributes regularly to educational activities for school children. This year, we are working with overseas science curriculum experts, Hong Kong teachers, and a US Fulbright Scholar to develop a bilingual curriculum on sustainable energy. Government advisors help us ensure that the curriculum will meet educational needs in Hong Kong. Dozens of local science teachers have indicated their interest in participating in the pilot test of the set of teaching material in Autumn 2004.
Table of Contents
Page 13
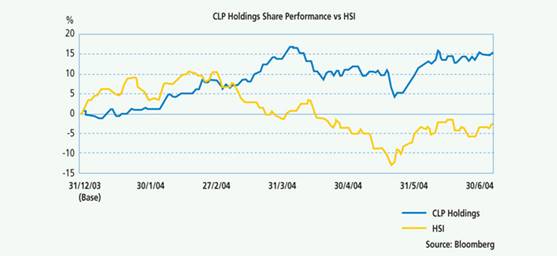
Shareholder Value
During the first half of 2004 CLP’s share price rose 15.4%, whereas the Hang Seng Index (HSI) decreased by 2.3%.
The final dividend of HK$0.65 per share and special final dividend of HK$0.10 per share for 2003 were paid to Shareholders on 23 April 2004. The first interim dividend for 2004 of HK$0.45 per share was paid on 23 June 2004 and the second interim dividend of HK$0.45 per share will be paid on 15 September 2004.
Financial Performance
Consolidated Financial Results
Turnover
During the six-month period to 30 June 2004, our turnover registered a 17.3% increase to HK$13,922 million (2003: HK$11,871 million). This resulted from higher revenue from the Scheme of Control (SoC) electricity business in Hong Kong, as well as incorporation of the full six-month turnover of Yallourn Energy and GPEC which became subsidiaries of the Group in April and June 2003 respectively.
Under the SoC business, electricity unit sales to local customers increased by 2.5% while total unit sales, which include sales to the Chinese mainland, increased by 1.8%, compared to the same period last year. As there was no tariff increase in 2004, the increase in SoC revenue by 4.7% to HK$11,870 million (2003: HK$11,333 million) was mainly due to fuel clause adjustment as a result of higher composite fuel price for the period.
Turnover of Yallourn Energy and GPEC amounted to HK$1,958 million (2003: HK$470 million).
Table of Contents
Page 14
Group Earnings
Total operating earnings were HK$4,014 million, which was HK$351 million higher than the corresponding period last year, representing an increase of 9.6%. Total earnings, which include Hok Un redevelopment profit, increased by 11.4% to HK$4,138 million.
The SoC business continues to provide stable earnings growth, with earnings increasing by 9.6% to HK$3,337 million. This resulted from the combined effect of on-going investments in fixed assets to meet new customer demand and to improve quality of services and lower interest borne by shareholders.
Non-SoC operating earnings rose 11.4% to HK$791 million, reflecting improved contribution from our investments in the Asia-Pacific region. Earnings from power projects in the Chinese mainland decreased from HK$516 million to HK$423 million primarily due to a one-off swap breakage cost and the write-off of unamortised financing cost associated with the refinancing of the Shandong project loans. Our electricity business in the Asia-Pacific region achieved an earnings growth of 112.6% to HK$404 million. Contribution mainly came from GPEC with improved collection of receivables. The effect of increased coal prices and low coal reserve was not significant in the first six months, but may intensify in the second half of the year.
Earnings per share increased by 11.4% when compared to the corresponding period in 2003. Excluding the Hok Un redevelopment profit, earnings per share increased by 9.6%.
The contribution of each major activity to the Group earnings is analysed as follows:
| 6 months ended 30 June | ||||||||||||||
| 2004 | 2003 | Increase | ||||||||||||
| HK$M | HK$M | HK$M | HK$M | % | ||||||||||
SoC earnings | 3,337 | 3,045 | 9.6 | |||||||||||
Non-SoC operating earnings | ||||||||||||||
Sales to Chinese mainland | 30 | 30 | ||||||||||||
Power projects in Chinese mainland | 423 | 516 | ||||||||||||
Power projects in Asia-Pacific region | 404 | 190 | ||||||||||||
Other businesses | (66 | ) | (26 | ) | ||||||||||
| 791 | 710 | 11.4 | ||||||||||||
Unallocated net finance costs | (39 | ) | (33 | ) | ||||||||||
Unallocated Group expenses | (75 | ) | (59 | ) | ||||||||||
Total operating earnings | 4,014 | 3,663 | 9.6 | |||||||||||
Hok Un redevelopment profit | 124 | 51 | ||||||||||||
Group earnings attributable to shareholders | 4,138 | 3,714 | 11.4 | |||||||||||
Weighted average number of shares in issue, million shares | 2,408.25 | 2,408.25 | ||||||||||||
Earnings per share, HK$ | ||||||||||||||
Including Hok Un redevelopment profit | 1.72 | 1.54 | 11.4 | |||||||||||
Excluding Hok Un redevelopment profit | 1.67 | 1.52 | 9.6 | |||||||||||
Table of Contents
Page 15
Significant Investments
In March 2004, we completed the acquisition of the remaining 8% interest in Yallourn Energy managed by Deutsche Asset Management (Australia) Limited for a consideration of HK$376 million. Yallourn Energy has now become a wholly-owned subsidiary of the Group. In respect of our investment in Anshun II, we made the final share capital contribution of RMB286 million (approximately HK$269 million) in April 2004.
Fixed assets of the Group amounted to HK$54,569 million as at 30 June 2004, comprising mainly the investments in the transmission and distribution network for the core Hong Kong electricity business of HK$40,567 million (December 2003: HK$39,258 million) and in the generating facilities of Yallourn Energy and GPEC of HK$13,830 million (December 2003: HK$14,687 million). During the six-month period, we invested HK$2,637 million (2003: HK$2,392 million), of which HK$2,313 million (2003: HK$2,295 million) was made by CLP Power Hong Kong, in various fixed assets. Capital expenditure by CAPCO for the six months was HK$829 million (2003: HK$599 million).
Our total assets, which comprise primarily fixed assets and investments in jointly controlled entities and associated companies, analysed by principal activities, are as follows:
| 30 June 2004 | 31 December 2003 | |||||||
HK$M
| %
| HK$M
| %
| |||||
Electricity Business | ||||||||
Hong Kong | 48,994 | 64 | 46,718 | 62 | ||||
Asia-Pacific region | 20,163 | 26 | 21,254 | 28 | ||||
Chinese mainland | 6,643 | 9 | 6,416 | 8 | ||||
| 75,800 | 99 | 74,388 | 98 | |||||
Property and other businesses | 841 | 1 | 1,444 | 2 | ||||
| 76,641 | 100 | 75,832 | 100 | |||||
Capital expenditure contracted but not provided for in the accounts as at 30 June 2004 amounted to HK$2,771 million (December 2003: HK$2,984 million). These contracted amounts are primarily for enhancing our transmission and distribution systems in Hong Kong. The recent hot and humid weather in Hong Kong in late June and early July has triggered significant increases in demand for electricity. On the generation side, the local demand recorded a historical peak of 6,329MW, an increase of 7.7% from last year, whilst load increases of up to 38% were observed in some parts of our supply area. These sharp increases illustrate the importance of making the necessary investment in our electricity infrastructure in advance of demand in order to maintain and enhance supply reliability.
Owing primarily to continued high capital expenditure requirements and a slightly lower than expected revenue so far this year, Yallourn Energy forecasts that, in order to meet the debt service cover ratios as stipulated in the relevant loan agreements, further contingent equity support of about A$40 million may need to be provided in the second half of 2004.
Pursuant to the Equity Contribution Agreement and its amendment agreement relating to the BLCP power project, we are required to make further equity contributions of US$148 million by 2007.
Table of Contents
Page 16
Liquidity and Capital Resources
As at 30 June 2004, we had liquid funds of HK$1,265 million (December 2003: HK$787 million), of which 92% (December 2003: 64%) were denominated in foreign currency mainly held by GPEC and Yallourn Energy. The remainder was in Hong Kong dollars.
Financing facilities totalling HK$26.3 billion were available to the Group, including HK$7.4 billion for Yallourn Energy and GPEC. Of the available facilities, HK$19.6 billion had been drawn down, of which HK$7.2 billion was by Yallourn Energy and GPEC. Facilities totalling HK$11.0 billion were available to CAPCO, of which HK$10.2 billion had been drawn down. The debts of Yallourn Energy and GPEC are without recourse to CLP Holdings. Of these borrowings, HK$5,746 million and HK$539 million as at 30 June 2004 are secured by fixed and floating charges over the assets of Yallourn Energy and GPEC respectively.
Our total debt to total capital as at 30 June 2004 was 32.2% and interest cover was 9 times.
Financing
Our business expansion, in particular, capital expenditure programmes by CLP Power Hong Kong and CAPCO for our Hong Kong electricity business, is funded by bank loans, debt securities and cash flow from operations.
We adopt a prudent approach to all our financial arrangements, while at the same time aiming to achieve cost efficient funding. In January 2004, CLP Power Hong Kong issued HK$500 million 4.93% fixed rate notes due 2014 through the Medium Term Note (MTN) Programme set up by its wholly-owned subsidiary CLP Power Hong Kong Financing Limited. Under the MTN Programme, notes in an aggregate amount of up to US$1.5 billion may be issued and will be unconditionally and irrevocably guaranteed by CLP Power Hong Kong. As at 30 June 2004, about HK$3,840 million notes have been issued under the MTN Programme.
Table of Contents
Page 17
Debt Profile
The charts below show the type, interest rate, maturity and currency profiles of borrowings of the Group and CAPCO at 30 June 2004

Notes:
| (1) | For the Medium Term Note Programme, only the amount (HK$3,840 million) of the Notes issued as at 30 June 2004 was included in the total amount of Available Facility. |
| (2) | 77% of Yallourn Energy and GPEC’s combined loans are at fixed or swapped to fixed rates. With the consolidation of these two subsidiaries, the percentage of fixed rate loans in CLP Group is 53%, compared to 39% if borrowings of Yallourn Energy and GPEC were not included. |
| (3) | The Australian dollar loans were mainly incurred by Yallourn Energy to refinance its project debts in 2001 and by CLP Holdings to hedge against currency exposure of the Group’s investment in Yallourn Energy. |
| (4) | The loans in Euros and Indian Rupees were drawn by GPEC. |
Credit Rating
There has been no change in credit ratings of CLP Holdings and CLP Power Hong Kong since the upgrade of both companies’ foreign currency ratings from A3 to A1 by Moody’s in October 2003. These credit ratings are supported by the strong cash flow generating ability and prudent financial structure of the Group. Our premier credit ratings can facilitate and enhance our position in local and overseas business activities, including fund raising, investment and new business opportunities of the Group.
Table of Contents
Page 18
The current credit ratings of CLP Holdings and CLP Power Hong Kong are set out below:
| CLP Holdings | CLP Power Hong Kong | Hong Kong Government | ||||||||||
| S&P | Moody’s | S&P | Moody’s | S&P | Moody’s | |||||||
Long-term Rating | ||||||||||||
Foreign currency | A+ | A1 | A+ | A1 | A+ | A1 | ||||||
Outlook | Stable | Stable | Stable | Stable | Stable | Stable | ||||||
Local currency | A+ | Aa2 | A+ | Aa1 | AA- | Aa3 | ||||||
Outlook | Stable | Stable | Stable | Stable | Stable | Stable | ||||||
Short-term Rating | ||||||||||||
Foreign currency | A-1 | P-1 | A-1 | P-1 | A-1 | P-1 | ||||||
Local currency | A-1 | — | A-1 | — | A-1+ | — | ||||||
Risk Management
The Group uses different derivative instruments to manage its exposure to foreign currency, interest rate risks, and price risks associated with the sales and purchases of electricity in Australia, with an objective to minimise the impact of exchange rate, interest rate and electricity price fluctuations on earnings, reserves and tariff charges to customers. All transactions are made with counter-parties with acceptable credit quality and a limit is assigned to each counter-party for monitoring the credit exposure. Other than certain limited electricity trading activities engaged by Yallourn Energy, all derivative instruments are employed solely for hedging purposes.
Foreign Currency Risks
The Group’s foreign currency exposures mainly arise from the loan repayment/interest payment obligations, purchases of goods and services, fuel-related payments and overseas investment activities. During the period, CLP Power Hong Kong continued to take advantage of market opportunity to arrange further US dollar forward purchases to hedge its US dollar exposure. Apart from using forward foreign exchange contracts, currency swaps and options to manage the currency exposure, we also adopt an approach of financing our investments by borrowings of matching currency, where appropriate, to mitigate the currency risk.
Interest Rate Risks
The Group utilises interest rate swaps to manage its interest rate risk within a preferred interest rate mix. We closely monitor the market conditions and review our preferred interest rate mix periodically to ensure an appropriate interest rate mix is adopted and that the Group’s interest rate exposure is minimised.
Electricity Sales and Purchases Risks
Yallourn Energy’s revenue is predominantly derived from the sale of electricity into the Australia’s National Electricity Market (NEM). Electricity energy contracts, including forward electricity pricing contracts, swaps and options contracts, are entered into to help reduce the impact of the volatility of NEM pool prices on earnings. Yallourn Energy also engages in limited energy trading activities in accordance with the approved policy. We have strengthened controls and procedures within Yallourn Energy to ensure trading and marketing activities are conducted within a clear and appropriate framework.
Table of Contents
Page 19
Off-Balance Sheet Financial Instruments
As at 30 June 2004, we had gross outstanding derivative instruments amounting to HK$71.1 billion (HK$75.5 billion for the Group and CAPCO combined), out of which HK$0.2 billion were energy trading contracts. A breakdown by type and maturity profile of the Group’s derivative instruments are shown in the charts below:
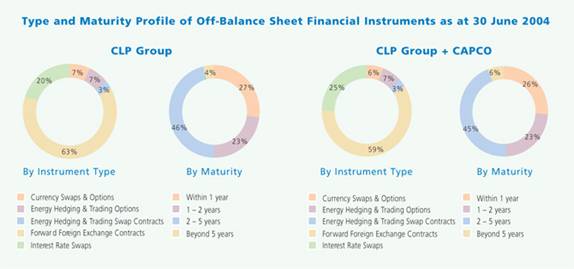
The fair value of the Group’s outstanding derivative instruments as at 30 June 2004 was at deficit of HK$281 million (HK$376 million deficit for the Group and CAPCO combined), which represents the net amount we would pay if these contracts were closed out on 30 June 2004. The deficit was largely caused by the weakening in the forward market for the US dollar against HK dollar. The fair market value of Yallourn Energy’s energy trading activities was at surplus of HK$0.8 million.
Contingent Liabilities
GPEC has obtained payment for some of its receivables from Gujarat Electricity Board (GEB) through bill discounting with recourse. There is no recourse to the Group beyond GPEC from these arrangements and to date there has been no incident where recourse to GPEC has been necessary. The potential effect if these financing arrangements are not settled by GEB as at 30 June 2004 was HK$597 million.
In respect of the Shandong joint venture, our contingent obligations in relation to the undertakings given to the project finance lenders effectively lapsed upon refinancing and arrangements are being made to obtain formal release from the lenders.
Table of Contents
Page 20
Condensed Consolidated Profit and Loss Account
(Unaudited) 6 months ended 30 June | ||||||||
Note
| 2004
| 2003
| ||||||
Turnover | 3 | 13,922 | 11,871 | |||||
Expenses | ||||||||
Purchases of electricity | 25(A) | 7,630 | 7,112 | |||||
Staff expenses | 648 | 525 | ||||||
Fuel and other net operating costs | 1,470 | 643 | ||||||
Depreciation | 1,242 | 1,005 | ||||||
| 10,990 | 9,285 | |||||||
Operating profit | 3, 4 | 2,932 | 2,586 | |||||
Finance costs | 5 | (483 | ) | (223 | ) | |||
Finance income | 5 | 23 | 35 | |||||
Hok Un redevelopment profit | 147 | 63 | ||||||
Share of profits less losses of jointly controlled entities | 6 | 1,587 | 1,711 | |||||
Share of profits less losses of associated companies | 6 | 143 | 53 | |||||
Profit before taxation | 4,349 | 4,225 | ||||||
Taxation | 7 | (792 | ) | (728 | ) | |||
Profit after taxation | 3,557 | 3,497 | ||||||
Transfers under Scheme of Control (SoC) | 8 | 581 | 217 | |||||
Earnings | ||||||||
SoC earnings (page 40) | 3,337 | 3,045 | ||||||
Non-SoC operating earnings | 9 | 791 | 710 | |||||
Unallocated net finance costs | (39 | ) | (33 | ) | ||||
Unallocated Group expenses | (75 | ) | (59 | ) | ||||
Total operating earnings | 4,014 | 3,663 | ||||||
Hok Un redevelopment profit | 124 | 51 | ||||||
Total earnings | 4,138 | 3,714 | ||||||
Dividends | 10 | |||||||
First interim paid | 1,084 | 987 | ||||||
Second interim | 1,084 | 987 | ||||||
| 2,168 | 1,974 | |||||||
Earnings per share | 11 | |||||||
Including Hok Un redevelopment profit | HK$1.72 | HK$1.54 | ||||||
Excluding Hok Un redevelopment profit | HK$1.67 | HK$1.52 | ||||||
Table of Contents
Page 21
Condensed Consolidated Balance Sheet
| (Unaudited) 30 June | (Audited) 31 December | |||||||
Note
| 2004 HK$M
| 2003 HK$M
| ||||||
Capital employed | ||||||||
Fixed assets | 12 | 54,569 | 54,157 | |||||
Goodwill | 13 | (958 | ) | (1,017 | ) | |||
Investments in jointly controlled entities | 14 | 14,330 | 14,687 | |||||
Investments in associated companies | 15 | 1,523 | 1,593 | |||||
Investment securities | 9 | 9 | ||||||
Deferred tax assets | 870 | 952 | ||||||
| 70,343 | 70,381 | |||||||
Current assets | ||||||||
Bank balances, cash and other liquid funds | 16 | 1,265 | 787 | |||||
Other investments | 17 | 24 | 10 | |||||
Inventories – stores and fuel | 243 | 230 | ||||||
Trade and other receivables | 18 | 4,766 | 4,424 | |||||
| 6,298 | 5,451 | |||||||
Current liabilities | ||||||||
Customers’ deposits | (2,993 | ) | (2,878 | ) | ||||
Short-term loans and current portion of long-term loans and other borrowings | 20 | (2,328 | ) | (1,095 | ) | |||
Fuel clause account | (748 | ) | (874 | ) | ||||
Taxation payable | (274 | ) | (64 | ) | ||||
Trade and other payables | 19 | (3,341 | ) | (3,994 | ) | |||
| (9,684 | ) | (8,905 | ) | |||||
Net current liabilities | (3,386 | ) | (3,454 | ) | ||||
Total assets less current liabilities | 66,957 | 66,927 | ||||||
Represented by | ||||||||
Share capital | 21 | 12,041 | 12,041 | |||||
Share premium | 1,164 | 1,164 | ||||||
Reserves | 27,114 | 25,230 | ||||||
Proposed dividends | 1,084 | 1,806 | ||||||
Shareholders’ funds | 41,403 | 40,241 | ||||||
Minority interest | — | 393 | ||||||
Long-term loans and other borrowings | 20 | 17,309 | 17,602 | |||||
Deferred tax liabilities | 4,826 | 4,614 | ||||||
SoC reserve accounts | 8 | 2,940 | 3,607 | |||||
Other non-current liabilities | 479 | 470 | ||||||
| 66,957 | 66,927 | |||||||
/s/W. E. Mocatta | /s/ Andrew Brandler | /s/ Peter P. W. Tse | ||
W. E. Mocatta Vice Chairman | Andrew Brandler Group Managing Director & Chief Executive Officer | Peter P. W. Tse Group Executive Director & Chief Financial Officer | ||
Hong Kong, 4 August 2004
Table of Contents
Page 22
Condensed Consolidated Statement of Changes in Equity
(Unaudited)
Share | Share | Capital Redemption Reserve HK$M | Other | Retained | Total | |||||||||||||||||||||||||||
Balance as at 1 January 2004 | 12,041 | 1,164 | 2,482 | 387 | 24,167 | 40,241 | ||||||||||||||||||||||||||
Exchange differences arising on translation of: | ||||||||||||||||||||||||||||||||
subsidiary companies | — | — | — | (341 | ) | — | (341 | ) | ||||||||||||||||||||||||
jointly controlled entities | — | — | — | 49 | — | 49 | ||||||||||||||||||||||||||
associated company | — | — | — | (49 | ) | — | (49 | ) | ||||||||||||||||||||||||
designated hedges | — | — | — | 279 | (a) | — | 279 | |||||||||||||||||||||||||
Net losses not recognised in the profit and loss account | — | — | — | (62 | ) | — | (62 | ) | ||||||||||||||||||||||||
Earnings for the period | — | — | — | — | 4,138 | 4,138 | ||||||||||||||||||||||||||
Dividends | ||||||||||||||||||||||||||||||||
2003 finals | — | — | — | — | (1,806 | ) | (1,806 | ) | ||||||||||||||||||||||||
2004 interim | — | — | — | — | (1,084 | ) | (1,084 | ) | ||||||||||||||||||||||||
Share of other reserves of | ||||||||||||||||||||||||||||||||
jointly controlled entities | — | — | — | 20 | (19 | ) | 1 | |||||||||||||||||||||||||
associated company | — | — | — | (25 | ) | — | (25 | ) | ||||||||||||||||||||||||
Balance as at 30 June 2004 | 12,041 | 1,164 | 2,482 | 320 | 25,396 | (b) | 41,403 | |||||||||||||||||||||||||
Company and subsidiary companies | 12,041 | 1,164 | 2,482 | 238 | 21,943 | 37,868 | ||||||||||||||||||||||||||
Jointly controlled entities | — | — | — | 62 | 2,956 | 3,018 | ||||||||||||||||||||||||||
Associated company | — | — | — | 20 | 497 | 517 | ||||||||||||||||||||||||||
Balance as at 30 June 2004 | 12,041 | 1,164 | 2,482 | 320 | 25,396 | 41,403 | ||||||||||||||||||||||||||
Balance as at 1 January 2003 | 12,041 | 1,164 | 2,482 | (63 | ) | 21,264 | 36,888 | |||||||||||||||||||||||||
Exchange differences arising on translation of: | ||||||||||||||||||||||||||||||||
subsidiary companies | — | — | — | 621 | — | 621 | ||||||||||||||||||||||||||
jointly controlled entities | — | — | — | (96 | ) | — | (96 | ) | ||||||||||||||||||||||||
associated company | — | — | — | 33 | — | 33 | ||||||||||||||||||||||||||
designated hedges | — | — | — | (383 | )(a) | — | (383 | ) | ||||||||||||||||||||||||
Net gains not recognised in the profit and loss account | — | — | — | 175 | — | 175 | ||||||||||||||||||||||||||
Earnings for the period | — | — | — | — | 3,714 | 3,714 | ||||||||||||||||||||||||||
Dividends | ||||||||||||||||||||||||||||||||
2002 finals | — | — | — | — | (1,782 | ) | (1,782 | ) | ||||||||||||||||||||||||
2003 interim | — | — | — | — | (987 | ) | (987 | ) | ||||||||||||||||||||||||
Share of other reserves of | ||||||||||||||||||||||||||||||||
jointly controlled entities | — | — | — | 22 | (22 | ) | — | |||||||||||||||||||||||||
associated company | — | — | — | 12 | — | 12 | ||||||||||||||||||||||||||
Balance as at 30 June 2003 | 12,041 | 1,164 | 2,482 | 146 | 22,187 | (c) | 38,020 | |||||||||||||||||||||||||
Company and subsidiary companies | 12,041 | 1,164 | 2,482 | 107 | 18,388 | 34,182 | ||||||||||||||||||||||||||
Jointly controlled entities | — | — | — | 23 | 3,503 | 3,526 | ||||||||||||||||||||||||||
Associated companies | — | — | — | 16 | 296 | 312 | ||||||||||||||||||||||||||
Balance as at 30 June 2003 | 12,041 | 1,164 | 2,482 | 146 | 22,187 | 38,020 | ||||||||||||||||||||||||||
| Notes: |
| (a) | Included a net gain of HK$150 million (2003: a net loss of HK$333 million) arising from designated hedges using foreign currency borrowings and a net gain of HK$129 million (2003: a net loss of HK$50 million) using forward contracts. |
| (b) | The proposed interim dividend as at 30 June 2004 and balance of retained profits after the proposed interim dividend were HK$1,084 million and HK$24,312 million respectively. |
| (c) | The proposed interim dividend as at 30 June 2003 and balance of retained profits after the proposed interim dividend were HK$987 million and HK$21,200 million respectively. |
Table of Contents
Page 23
Condensed Consolidated Cash Flow Statement
(Unaudited) 6 months ended 30 June | ||||||||||||||
| 2004 | 2003 | |||||||||||||
| Note | HK$M | HK$M | HK$M | HK$M | ||||||||||
Operating activities | ||||||||||||||
Net cash inflow from operations | 22 | 3,826 | 3,046 | |||||||||||
Operating interest paid | (405 | ) | (197 | ) | ||||||||||
Interest received | 19 | 23 | ||||||||||||
Profits tax paid | (139 | ) | (203 | ) | ||||||||||
Net cash inflow from operating activities | 3,301 | 2,669 | ||||||||||||
Investing activities | ||||||||||||||
Capital expenditure | (2,825 | ) | (2,524 | ) | ||||||||||
Capitalised interest paid | (150 | ) | (139 | ) | ||||||||||
Proceeds from disposal of fixed assets | 10 | 3 | ||||||||||||
Proceeds from disposal of other investments | 31 | — | ||||||||||||
Net cash outflow for acquisition of subsidiaries | (376 | ) | (354 | ) | ||||||||||
Net cash inflow/(outflow) on settlement of forward contracts for investment hedging | 86 | (246 | ) | |||||||||||
Investments in and advances to jointly controlled entities | (220 | ) | (110 | ) | ||||||||||
Purchase of investment securities | — | (438 | ) | |||||||||||
Proceeds from realisation of employee retirement benefit plan assets | — | 1,155 | ||||||||||||
Dividends received from investments | ||||||||||||||
- jointly controlled entities | 1,416 | 1,183 | ||||||||||||
- associated company | 30 | 27 | ||||||||||||
- other investments | — | 34 | ||||||||||||
Profit received from Hok Un joint venture | 439 | 168 | ||||||||||||
Net cash outflow from investing activities | (1,559 | ) | (1,241 | ) | ||||||||||
Net cash inflow before financing activities | 1,742 | 1,428 | ||||||||||||
Financing activities | ||||||||||||||
Proceeds from long-term borrowings | 2,200 | 1,500 | ||||||||||||
Repayment of long-term borrowings | (1,692 | ) | (855 | ) | ||||||||||
Increase in short-term borrowings | 1,127 | 738 | ||||||||||||
Dividends paid | (2,890 | ) | (2,769 | ) | ||||||||||
Net cash outflow from financing activities | (1,255 | ) | (1,386 | ) | ||||||||||
Increase in cash and cash equivalents | 487 | 42 | ||||||||||||
Cash and cash equivalents at beginning of the period | 787 | 516 | ||||||||||||
Effect of exchange rate changes | (9 | ) | 14 | |||||||||||
Cash and cash equivalents at end of the period | 1,265 | 572 | ||||||||||||
Analysis of balances of cash and cash equivalents | ||||||||||||||
Short-term investments | 46 | 11 | ||||||||||||
Deposits with banks | 742 | 491 | ||||||||||||
Cash at banks and on hand | 477 | 70 | ||||||||||||
| 1,265 | 572 | |||||||||||||
Table of Contents
Page 24
Notes to the Condensed Interim Accounts
| 1. | Basis of Preparation and Accounting Policies |
The unaudited condensed consolidated interim accounts are prepared in accordance with the Statement of Standard Accounting Practice (SSAP) No. 25 “Interim Financial Reporting” issued by the Hong Kong Society of Accountants. The accounting policies used in the preparation of these condensed accounts are consistent with those set out in the 2003 Annual Report.
During the 2003 Scheme of Control (SoC) Interim Review, agreement was reached with the Hong Kong Government to extend the useful life of the following fixed assets employed for the SoC business:
| Original Life | Revised Life | |||
Buildings | 33 years | 35 years | ||
Cable tunnels | 33 years | 100 years | ||
Switchgear and transformers | 25 years | 35 years | ||
Meters | 10 years | 15 years | ||
Leasehold land | not depreciable | unexpired terms of the leases | ||
The net book value of the above assets as at 31 December 2003 are being written off uniformly over the remainder of their extended useful lives.
The net decrease in depreciation charge as a result of the above changes for the six months ended 30 June 2004 was approximately HK$110 million.
| 2. | Acquisition of Remaining Shareholding in Yallourn Energy |
In March 2004, the Group completed the acquisition of the remaining 8% interest in Yallourn Energy Pty Limited (Yallourn Energy) managed by Deutsche Asset Management (Australia) Limited. Following completion, the Group owns 100% of Yallourn Energy, the owner-operator of a 1,480MW coal-fired power station and a coal mine in Victoria, Australia.
The total cost of acquisition was HK$376 million. The fair value of the net assets acquired was HK$397 million, resulting in negative goodwill of HK$21 million to be amortised on a straight-line basis over the remaining plant life of 28 years.
Table of Contents
Page 25
| 3. | Turnover and Segment Information |
An analysis of the Group’s turnover, contribution to operating profit and profit before financing and taxation for the period, by principal activities, is as follows:
| 6 months ended 30 June | Turnover | Operating Profit/(Loss) (A) | Profit/(Loss) Before Financing and Taxation (B) | |||||||||
2004
| 2003
| 2004
| 2003
| 2004
| 2003 HK$M
| |||||||
SoC business | 11,870 | 11,333 | 2,542 | 2,609 | 3,420 | 3,436 | ||||||
Power projects outside Hong Kong | 1,966 | 470 | 526 | 47 | 1,380 | 995 | ||||||
Other businesses | 86 | 68 | (61) | (11) | 84 | 41 | ||||||
Unallocated Group expenses | — | — | (75) | (59) | (75) | (59) | ||||||
| 13,922 | 11,871 | 2,932 | 2,586 | 4,809 | 4,413 | |||||||
| (A) | Operating Profit/(Loss) is stated before taking into account the Group’s share of profits less losses of jointly controlled entities and associated companies. |
| (B) | Profit/(Loss) Before Financing and Taxation is stated after taking into account the Group’s share of profits less losses of jointly controlled entities and associated companies. |
Table of Contents
Page 26
| 3. | Turnover and Segment Information (continued) |
The Group operates, through its subsidiary companies, jointly controlled entities and associated companies, in three major geographical regions - Hong Kong, the Chinese mainland and the Asia-Pacific region. Information about the Group’s operations by geographical regions is as follows:
| 6 months ended 30 June 2004 | Hong Kong HK$M | Chinese Mainland HK$M | Asia-Pacific HK$M | Unallocated HK$M | Total HK$M | |||||
Turnover | 11,956 | — | 1,966 | — | 13,922 | |||||
Segment results | 2,481 | (98) | 624 | (75) | 2,932 | |||||
Hok Un redevelopment profit | 147 | — | — | — | 147 | |||||
Share of profits less losses of jointly controlled entities | 878 | 610(a) | 99 | — | 1,587 | |||||
Share of profits less losses of associated companies | (2) | — | 145 | — | 143 | |||||
Profit/(Loss) before financing and taxation | 3,504 | 512 | 868 | (75) | 4,809 | |||||
Finance costs | (483) | |||||||||
Finance income | 23 | |||||||||
Taxation | (792) | |||||||||
Profit after taxation | 3,557 | |||||||||
Transfers under SoC | 581 | |||||||||
Earnings for the period | 4,138 | |||||||||
| 6 months ended 30 June 2003 | Hong Kong HK$M | Chinese Mainland HK$M | Asia-Pacific Region HK$M | Unallocated HK$M | Total HK$M | |||||
Turnover | 11,401 | — | 470 | — | 11,871 | |||||
Segment results | 2,598 | (54) | 101 | (59) | 2,586 | |||||
Hok Un redevelopment profit | 63 | — | — | — | 63 | |||||
Share of profits less losses of jointly controlled entities | 825 | 661(a) | 225 | — | 1,711 | |||||
Share of profits less losses of associated companies | (9) | — | 62 | — | 53 | |||||
Profit/(Loss) before financing and taxation | 3,477 | 607 | 388 | (59) | 4,413 | |||||
Finance costs | (223) | |||||||||
Finance income | 35 | |||||||||
Taxation | (728) | |||||||||
Profit after taxation | 3,497 | |||||||||
Transfers under SoC | 217 | |||||||||
Earnings for the period | 3,714 | |||||||||
| Note (a): | Out of the HK$610 million (2003: HK$661 million), HK$427 million (2003: HK$388 million) was attributed to investments in Guangdong Nuclear Power Joint Venture Company, Limited and Hong Kong Pumped Storage Development Company, Limited, whose generating facilities serve Hong Kong. |
Table of Contents
Page 27
| 4. | Operating Profit |
| 6 months ended 30 June | ||||
2004 HK$M
| 2003 HK$M
| |||
Operating profit is stated after charging/(crediting) the following: | ||||
Charging | ||||
Staff costs (A) | ||||
Salaries and other costs | 777 | 687 | ||
Retirement benefits costs | 69 | 54 | ||
Loss on disposal of fixed assets | 83 | 44 | ||
Unrealised loss on other investments | 33 | 12 | ||
Crediting | ||||
Other net exchange gains | (10) | (13) | ||
Net rental income from properties | (7) | (8) | ||
Gain on realisation of retirement benefit plan asset | — | (17) | ||
Amortisation of goodwill and negative goodwill | (23) | (6) | ||
| (A) | Staff costs include amounts recharged to jointly controlled entities for services provided. |
| 5. | Finance Costs and Income |
| 6 months ended 30 June | ||||
2004
| 2003 HK$M
| |||
Finance costs: | ||||
Interest expenses on bank loans and overdrafts | 373 | 177 | ||
Interest expenses on other borrowings | ||||
wholly repayable within five years | 82 | 82 | ||
not wholly repayable within five years | 73 | 46 | ||
Interest expenses on customers’ deposits and others | 20 | 13 | ||
Finance charges | 14 | 13 | ||
Exchange losses | 62 | 12 | ||
| 624 | 343 | |||
Less: amount capitalised | (141) | (120) | ||
| 483 | 223 | |||
Finance income: | ||||
Net interest income from investment securities | — | 20 | ||
Interest income on short-term investments and bank deposits | 23 | 15 | ||
| 23 | 35 | |||
Table of Contents
Page 28
| 6. | Share of Results of Affiliated Companies |
The share of profits less losses of jointly controlled entities and associated companies is determined based upon the management accounts of the respective affiliated companies, after making adjustments to conform with the Group’s significant accounting policies, for the periods ended 30 June.
| 7. | Taxation |
| 6 months ended 30 June | ||||||
2004 HK$M | 2003 HK$M | |||||
Taxation in the condensed consolidated profit and loss account represents: | ||||||
Company and subsidiary companies | ||||||
- Hong Kong | ||||||
current | 333 | 247 | ||||
deferred | 165 | 163 | ||||
- outside Hong Kong | ||||||
current | 15 | 4 | ||||
deferred | 59 | 20 | ||||
| 572 | 434 | |||||
Jointly controlled entities | ||||||
- Hong Kong | ||||||
current | 144 | 143 | ||||
deferred | (44 | ) | (16 | ) | ||
- outside Hong Kong | ||||||
current | 110 | 125 | ||||
deferred | (17 | ) | 30 | |||
| 193 | 282 | |||||
Associated company | ||||||
- outside Hong Kong | ||||||
current | 10 | 1 | ||||
deferred | 17 | 11 | ||||
| 27 | 12 | |||||
| 792 | 728 | |||||
Hong Kong profits tax has been provided at the rate of 17.5% (2003: 17.5%) on the estimated assessable profits for the period. Taxation on profits assessable outside Hong Kong has been provided at the rates prevailing in the respective jurisdictions.
Table of Contents
Page 29
| 8. | Transfers under Scheme of Control |
The financial operations of CLP Power Hong Kong are governed by the SoC Agreement. In accordance with the Agreement, transfers required under the SoC are shown below:
| 6 months ended 30 June | ||||||
| 2004 | 2003 | |||||
| HK$M | HK$M | |||||
Transfers under SoC | ||||||
From Development Fund | 597 | 263 | ||||
From special provision account | 96 | 102 | ||||
To rate reduction reserve | (112 | ) | (148 | ) | ||
| 581 | 217 | |||||
The Development Fund, special provision account and rate reduction reserve of CLP Power Hong Kong are collectively referred to as SoC reserve accounts in the condensed consolidated balance sheet and the respective balances at the end of the period/year are:
30 June 2004 HK$M | 31 December 2003 HK$M | |||
SoC reserve accounts | ||||
Development Fund (A) | 2,355 | 2,960 | ||
Special provision account (B) | 80 | 176 | ||
Rate reduction reserve (C) | 505 | 471 | ||
| 2,940 | 3,607 | |||
Table of Contents
Page 30
| 8. | Transfers under Scheme of Control (continued) |
Movements in the SoC reserve accounts are as follows:
30 June HK$M | 31 December HK$M | |||||
(A) Development Fund | ||||||
At beginning of period/year | 2,960 | 3,372 | ||||
Transfer (to)/from profit and loss account | (597 | ) | 572 | |||
One-off rebates | 8 | (308 | ) | |||
Business relief rebate | (1 | ) | (42 | ) | ||
Special rebate to customers | (15 | ) | (634 | ) | ||
At end of period/year | 2,355 | 2,960 | ||||
(B) Special provision account | ||||||
At beginning of period/year | 176 | 670 | ||||
Transfer to profit and loss account | (96 | ) | (494 | ) | ||
At end of period/year | 80 | 176 | ||||
(C) Rate reduction reserve | ||||||
At beginning of period/year | 471 | 458 | ||||
Transfer from profit and loss account | 112 | 287 | ||||
One-off rebates | 2 | (101 | ) | |||
Rebate to customers (note a) | (80 | ) | (173 | ) | ||
At end of period/year | 505 | 471 | ||||
| Note | (a): A rebate of HK¢0.6 per unit (2003: HK¢0.6 per unit) was made to customers during the period. |
Table of Contents
Page 31
| 9. | Non-SoC Operating Earnings |
| 6 months ended 30 June | ||||||
| 2004 HK$M | 2003 HK$M | |||||
Income from power projects outside Hong Kong | ||||||
Chinese mainland | 423 | 516 | ||||
Asia-Pacific region | 404 | 190 | ||||
| 827 | 706 | |||||
Sales to Chinese mainland | 30 | 30 | ||||
Other businesses | (66 | ) | (26 | ) | ||
| 791 | 710 | |||||
| 10. | Dividends |
| 6 months ended 30 June | ||||||||
| 2004 | 2003 | |||||||
| HK$ per share | HK$M | HK$ per share | HK$M | |||||
First interim dividend paid | 0.45 | 1,084 | 0.41 | 987 | ||||
Second interim dividend | 0.45 | 1,084 | 0.41 | 987 | ||||
| 0.90 | 2,168 | 0.82 | 1,974 | |||||
At the Board meeting held on 4 August 2004, the Directors declared the second interim dividend of HK$0.45 per share. The second interim dividend is not reflected as a dividend payable in these condensed accounts, but as a separate component of the shareholders’ funds for the period ended 30 June 2004.
| 11. | Earnings per Share |
The earnings per share is based on earnings of HK$4,138 million (2003: HK$3,714 million) and the number of shares in issue of 2,408,245,900 (2003: 2,408,245,900) during the period. To enable investors to understand better the Group’s results, an additional earnings per share figure, excluding the Hok Un redevelopment profit of HK$124 million (2003: HK$51 million), has been calculated.
Fully diluted earnings per share is not included as the Company did not have any diluting equity instruments as at 30 June 2004 (2003: nil).
Table of Contents
Page 32
| 12. | Fixed Assets |
Land and | Plant, Machinery and Equipment HK$M | Total HK$M | ||||
Net book value as at 1 January 2004 | 7,756 | 46,401 | 54,157 | |||
Additions(note a) | 326 | 2,311 | 2,637 | |||
Transfers and disposals | (14) | (108) | (122) | |||
Depreciation charge | (107) | (1,135) | (1,242) | |||
Exchange differences | (17) | (844) | (861) | |||
Net book value as at 30 June 2004 (note b) | 7,944 | 46,625 | 54,569 | |||
Notes:
| (a) | Capital expenditure incurred for the SoC business totalled HK$2,313 million (2003: HK$2,295 million). |
| (b) | Fixed assets employed for the SoC business and non-SoC business amounted to HK$40,567 million (December 2003: HK$39,258 million) and HK$14,002 million (December 2003: HK$14,899 million) respectively. For the non-SoC business, HK$13,830 million (December 2003: HK$14,687 million) was attributed to Yallourn Energy and Gujarat Paguthan Energy Corporation Private Limited (GPEC). |
| 13. | Goodwill |
Goodwill and negative goodwill arising from acquisition of interests in Yallourn Energy and GPEC are as follows:
| Goodwill HK$M | Negative Goodwill HK$M | Net Balance HK$M | ||||
Net carrying value as at 1 January 2004 | 25 | (1,042) | (1,017) | |||
Acquisition of subsidiary (Note 2) | — | (21) | (21) | |||
Amortisation (charge)/credit | (1) | 24 | 23 | |||
Exchange differences | — | 57 | 57 | |||
Net carrying value as at 30 June 2004 | 24 | (982) | (958) | |||
Table of Contents
Page 33
| 14. | Investments in Jointly Controlled Entities |
30 June HK$M | 31 December HK$M | |||
Castle Peak Power Company Limited | 6,080 | 5,983 | ||
Guangdong Nuclear Power Joint Venture Company, Limited | 2,740 | 3,075 | ||
Shandong Zhonghua Power Company, Ltd. | 1,233 | 1,341 | ||
Ho-Ping Power Company | 1,174 | 1,294 | ||
CLP Guohua Power Company Limited | 1,181 | 1,049 | ||
Guizhou CLP Power Company Limited | 404 | 140 | ||
Hok Un joint venture | 321 | 560 | ||
Hong Kong Pumped Storage Development Company, Limited | 322 | 318 | ||
Others | 875 | 927 | ||
| 14,330 | 14,687 | |||
The amount of investments in the above jointly controlled entities include loan and advances as follows:
30 June HK$M | 31 December HK$M | |||
Castle Peak Power Company Limited | 5,768 | 5,768 | ||
Hong Kong Pumped Storage Development Company, Limited | 303 | 306 | ||
Others | 282 | 302 | ||
| 6,353 | 6,376 | |||
| 15. | Investments in Associated Companies |
30 June HK$M | 31 December HK$M | |||
Electricity Generating Public Company Limited | 1,523 | 1,509 | ||
PowerCom Network Hong Kong Limited (A) | — | 84 | ||
| 1,523 | 1,593 | |||
| (A) | Through participation in the sale of PowerCom Network Hong Kong Limited (PowerCom) by Cheung Kong Enterprises Limited to Hutchison Global Communications Holdings Limited (HGCH, formerly known as Vanda Systems & Communications Holdings Limited) in exchange for the issue of shares in HGCH, the Group’s 19% equity interest in PowerCom was converted to an investment in HGCH in March 2004 and is therefore disclosed as Other Investments (Note 17) as at 30 June 2004. |
Table of Contents
Page 34
| 16. | Bank Balances, Cash and Other Liquid Funds |
30 June 2004 HK$M | 31 December 2003 HK$M | |||
Trust fund for unclaimed dividends | 19 | 21 | ||
Trust accounts under TRAA (A) | 567 | 131 | ||
Short-term investments and bank deposits | 288 | 549 | ||
Bank balances and cash | 391 | 86 | ||
| 1,265 | 787 | |||
| (A) | Pursuant to a Trust and Retention Account Agreement (TRAA) between GPEC and its lenders, GPEC is required to deposit receipts from its offtaker, Gujarat Electricity Board (GEB), to various trust accounts for fuel, operating and major maintenance expenses and debt service payments. |
| 17. | Other Investments |
30 June 2004 HK$M | 31 December 2003 HK$M | |||
Equity securities listed in Hong Kong, at fair value | 24 | 10 | ||
The 2004 figure represents the Group’s investment in HGCH. Further to the disposal of PowerCom in exchange for HGCH shares (Note 15), the Group placed 37.7% of those shares in March 2004 and sold its remaining interest in HGCH in July 2004. The Group’s investment in DataSys Technology Holdings Limited (valued at HK$10 million at the beginning of the period) has now been fully provided for.
Table of Contents
Page 35
| 18. | Trade and Other Receivables |
30 June HK$M | 31 December HK$M | |||
Trade receivables (ageing analysis is shown below) | 3,433 | 3,201 | ||
Deposits and prepayments | 983 | 1,161 | ||
Dividend receivable from jointly controlled entities | 343 | — | ||
Current accounts with jointly controlled entities | 7 | 62 | ||
| 4,766 | 4,424 | |||
Trade and other receivables attributed to GPEC and Yallourn Energy amounted to HK$2,254 million (2003: HK$3,153 million).
The Group has established credit policies for customers in each of its core businesses. The credit term for trade receivables ranges from 15 to 60 days.
The ageing analysis of the trade receivables, after provisions, is as follows:
30 June HK$M | 31 December HK$M | |||
Below 30 days | 2,823 | 2,011 | ||
31-60 days | 158 | 169 | ||
61-90 days | 179 | 40 | ||
Over 90 days | 273 | 981 | ||
| 3,433 | 3,201 | |||
| 19. | Trade and Other Payables |
30 June HK$M | 31 December HK$M | |||
Trade payables (ageing analysis is shown below) | 1,370 | 1,719 | ||
Other payables and accruals | 881 | 1,152 | ||
Current accounts with jointly controlled entities | 1,090 | 1,123 | ||
| 3,341 | 3,994 | |||
The ageing analysis of the trade payables is as follows:
30 June HK$M | 31 December HK$M | |||
Below 30 days | 1,358 | 1,671 | ||
31-60 days | 1 | 41 | ||
61-90 days | 1 | 7 | ||
Over 90 days | 10 | — | ||
| 1,370 | 1,719 | |||
Table of Contents
Page 36
| 20. | Bank Loans and Other Borrowings |
30 June HK$M | 31 December HK$M | |||||
Total facilities available | 26,289 | 27,993 | ||||
Facilities utilised | ||||||
Bank loans | 13,457 | 13,017 | ||||
Other borrowings | 6,180 | 5,680 | ||||
| 19,637 | 18,697 | |||||
Included in current liabilities | ||||||
Short-term loans | 1,694 | 567 | ||||
Current portion of long-term loans and borrowings | 634 | 528 | ||||
| 2,328 | 1,095 | |||||
Long-term loans and borrowings, repayable | ||||||
within one year | 634 | 528 | ||||
between one and two years | 4,726 | 770 | ||||
between two and five years | 6,606 | 10,696 | ||||
after five years | 5,977 | 6,136 | ||||
| 17,943 | 18,130 | |||||
Less: current portion of long-term loans and borrowings | (634 | ) | (528 | ) | ||
| 17,309 | 17,602 | |||||
| 19,637 | 18,697 | |||||
Of the total bank loan facilities available, HK$17,118 million (2003: HK$19,326 million) are committed facilities.
Bank loans totalling HK$7,167 million (2003: HK$8,051 million) were attributed to Yallourn Energy and GPEC. Part of the loans (HK$5,746 million at 2004 and HK$6,444 million at 2003 for Yallourn Energy and HK$539 million at 2004 and HK$620 million at 2003 for GPEC) are secured by fixed and floating charges over the assets of Yallourn Energy and GPEC respectively.
| 21. | Share Capital |
| 30 June 2004 | 31 December 2003 | |||||||
Number of Shares of HK$5 Each | Amount HK$M | Number of Shares of HK$5 Each | Amount HK$M | |||||
Authorised | ||||||||
At end of period/year | 3,000,000,000 | 15,000 | 3,000,000,000 | 15,000 | ||||
Issued and fully-paid | ||||||||
At end of period/year | 2,408,245,900 | 12,041 | 2,408,245,900 | 12,041 | ||||
There was no movement in the share capital of the Company during the period (year 2003: nil).
Table of Contents
Page 37
| 22. | Notes to the Condensed Consolidated Cash Flow Statement |
Reconciliation of profit before taxation to net cash inflow from operations:
| 6 months ended 30 June | ||||||||
| 2004 HK$M | 2003 HK$M | |||||||
Profit before taxation | 4,349 | 4,225 | ||||||
Adjustments for: | ||||||||
Operating interest | 409 | 198 | ||||||
Finance income | (23 | ) | (35 | ) | ||||
Hok Un redevelopment profit | (147 | ) | (63 | ) | ||||
Share of profits less losses of jointly controlled entities | (1,587 | ) | (1,711 | ) | ||||
Share of profits less losses of associated companies | (143 | ) | (53 | ) | ||||
Depreciation | 1,242 | 1,005 | ||||||
Amortisation of goodwill and negative goodwill | (23 | ) | (6 | ) | ||||
Loss on disposal of fixed assets | 83 | 44 | ||||||
Net loss on other investments | 38 | 12 | ||||||
Realised gain on retirement benefit plan assets | — | (17 | ) | |||||
Exchange losses/(gains) | 61 | (27 | ) | |||||
SoC items | ||||||||
Increase in customers’ deposits | 115 | 78 | ||||||
(Decrease)/Increase in fuel clause account | (149 | ) | 427 | |||||
One-off rebates | (479 | ) | (1,286 | ) | ||||
Business relief rebate | (1 | ) | (19 | ) | ||||
Special rebate | (15 | ) | (283 | ) | ||||
Rebate to customers under SoC | (80 | ) | (77 | ) | ||||
| (609 | ) | (1,160 | ) | |||||
Operating profit before working capital changes | 3,650 | 2,412 | ||||||
Decrease in debtors and prepayments | 457 | 808 | ||||||
Decrease in creditors and other liabilities | (303 | ) | (168 | ) | ||||
Increase/(Decrease) in current accounts due to jointly | 22 | (6 | ) | |||||
Net cash inflow from operations | 3,826 | 3,046 | ||||||
Table of Contents
Page 38
| 23. | Commitments |
| (A) | Capital expenditure authorised but not brought into the accounts is as follows: |
30 June HK$M | 31 December HK$M | |||
Contracted but not provided for | 2,771 | 2,984 | ||
Authorised but not contracted for | 7,205 | 9,411 | ||
| 9,976 | 12,395 | |||
| (B) | Under the Equity Contribution Agreement and its amendment agreement relating to the BLCP Power project, the Group is required to make equity contributions of US$165 million (approximately HK$1,287 million). As at 30 June 2004, the Group’s obligation as to US$17 million (approximately HK$132 million) had been fulfilled. The remainder will be contributed by 2007. |
| (C) | Pursuant to the relevant loan agreements for the refinancing of Yallourn Energy, shareholders of CLP AusPower Pty Limited (formerly known as AusPower Holdings Pty Limited), the immediate holding company of Yallourn Energy, agreed to provide the lenders with contingent equity support up to the sum of A$200 million in respect of a senior debt facility. The contribution of contingent equity depends on certain minimum requirements regarding the availability of cash flows for debt service within five years from 27 February 2001. As at 30 June 2004, A$44 million had been contributed by the Group. |
Owing primarily to continued high capital expenditure requirements and a slightly lower than expected revenue so far this year, Yallourn Energy forecasts that in order to meet the debt service cover ratios as stipulated in the loan agreements, further contingent equity support of about A$40 million may need to be provided in the six months to 31 December 2004.
| 24. | Contingent Liabilities |
| (A) | GPEC has obtained payment for some of its receivables from GEB through bill discounting with recourse. The potential effect on the Group as at 30 June 2004 if these financing arrangements are not settled by GEB is that GPEC would be required to pay HK$597 million (December 2003: HK$538 million). There is no recourse to the Group beyond GPEC from these arrangements and to date there has been no incident where recourse to GPEC has been necessary. |
The Directors are of the opinion that no provision is required to be made in the financial statements in respect of this matter.
| (B) | In June 2004, Shandong Zhonghua Power Company, Ltd. completed refinancing its loans procured in 1998 with new term loan facilities. The undertakings given by the Company to the finance parties under the previous facilities effectively lapsed upon refinancing and arrangements are being made to obtain formal release from the lenders. |
Table of Contents
Page 39
| 25. | Related Party Transactions |
In the normal course of business, the Group undertakes on an arm’s length basis a wide variety of transactions with related parties. The more significant of such transactions during the period ended 30 June are described below:
| (A) | Purchases of electricity |
| 6 months ended 30 June | ||||||
| 2004 | 2003 | |||||
| HK$M | HK$M | |||||
Purchases of electricity from CAPCO | 5,398 | 4,962 | ||||
Purchases of nuclear electricity | 2,046 | 2,029 | ||||
Pumped storage service fee | 186 | 121 | ||||
| 7,630 | 7,112 | |||||
| (B) | Pursuant to the CAPCO Operating Service Agreement, the charges from CLP Power Hong Kong to CAPCO for the services rendered during the period amounted to HK$541 million (2003: HK$505 million). |
| 26. | Statement of Indebtedness, Contingent Liabilities and Capital Commitments of Affiliated Companies |
The Company has obtained a waiver from The Stock Exchange of Hong Kong Limited under Rule 13.22 of the Listing Rules from disclosing a proforma combined balance sheet of affiliated companies. Affiliated companies include the Group’s jointly controlled entities and associated companies. Instead, in accordance with the Rule, the Company discloses the following alternative information in relation to the affiliated companies as at 30 June 2004. This information has been extracted from the relevant management accounts of all affiliated companies.
30 June 2004 HK$M | 31 December 2003 HK$M | |||||
The Group’s share of total indebtedness of affiliated | ||||||
Bank borrowings | 15,233 | 15,050 | ||||
Other borrowings including loans from shareholders | 1,263 | 1,352 | ||||
| 16,496 | 16,402 | |||||
The Group’s share of contingent liabilities of affiliated | 249 | 301 | ||||
The Group’s share of capital commitments of affiliated | ||||||
Contracted but not provided for | 4,171 | 4,129 | ||||
Authorised but not contracted for | 943 | 1,012 | ||||
| 5,114 | 5,141 | |||||
Table of Contents
Page 40
The calculations shown below are in accordance with the SoC and the agreements between the SoC Companies. The calculations are extracted from the management accounts of CLP Power Hong Kong for the six months ended 30 June 2004.
| (Unaudited) 6 months ended 30 June | ||||
| 2004 HK$M | 2003 HK$M | |||
SoC Revenue | 11,870 | 11,333 | ||
Expenses | ||||
Operating costs | 1,434 | 1,292 | ||
Fuel | 1,749 | 1,393 | ||
Purchases of nuclear electricity | 2,046 | 2,029 | ||
Depreciation | 1,681 | 1,652 | ||
Deferral premium | 96 | 102 | ||
Operating interest | 195 | 249 | ||
Taxation | 800 | 739 | ||
| 8,001 | 7,456 | |||
Profit after taxation | 3,869 | 3,877 | ||
Interest on long-term financing | 340 | 372 | ||
Adjustments required under the SoC | 49 | 55 | ||
Profit for SoC | 4,258 | 4,304 | ||
Transfer from Development Fund | 597 | 263 | ||
Permitted return | 4,855 | 4,567 | ||
Deduct interest | ||||
On long-term financing as above | 340 | 372 | ||
On Development Fund and special provision account | 112 | 148 | ||
| 452 | 520 | |||
Net return | 4,403 | 4,047 | ||
Divisible as follows: | ||||
CLP Power Hong Kong | 2,624 | 2,373 | ||
CAPCO | 1,779 | 1,674 | ||
| 4,403 | 4,047 | |||
CLP Power Hong Kong’s share of net return | ||||
CLP Power Hong Kong | 2,624 | 2,373 | ||
Interest in CAPCO | 713 | 672 | ||
| 3,337 | 3,045 | |||
Table of Contents
Page 41
To the Board of Directors of CLP Holdings Limited (the Company)
(Incorporated in Hong Kong with limited liability)
We have been instructed by the Company to review the condensed interim accounts set out on pages 20 to 39.
Directors’ responsibilities
The Rules Governing the Listing of Securities on The Stock Exchange of Hong Kong Limited require the preparation of condensed interim accounts to be in compliance with SSAP No. 25 “Interim Financial Reporting” issued by the Hong Kong Society of Accountants. The condensed interim accounts are the responsibility of, and have been approved by, the directors.
Review work performed
We conducted our review in accordance with SAS 700 “Engagements to review interim financial reports” issued by the Hong Kong Society of Accountants. A review consists principally of making enquiries of group management and applying analytical procedures to the condensed interim accounts and, based thereon, assessing whether the accounting policies and presentation have been consistently applied unless otherwise disclosed. A review excludes audit procedures such as tests of controls and verification of assets, liabilities and transactions. It is substantially less in scope than an audit and therefore provides a lower level of assurance than an audit. Accordingly we do not express an audit opinion on the condensed interim accounts.
Review conclusion
On the basis of our review, which does not constitute an audit, we are not aware of any material modifications that should be made to the condensed interim accounts for the six months ended 30 June 2004.
/s/ PricewaterhouseCoopers |
PricewaterhouseCoopers |
Certified Public Accountants |
Hong Kong, 4 August 2004 |
Table of Contents
Page 42
Interests of Directors and Chief Executive Officer
The interests/short positions of each of the Directors and Chief Executive Officer in the shares, underlying shares and debentures of the Company or any of the Company’s associated corporations (within the meaning of the Securities and Futures Ordinance) as at 30 June 2004, as recorded in the register required to be kept under Section 352 of Part XV of the Securities and Futures Ordinance, are set out below:
| 1. | Aggregate long position in the shares, underlying shares and debentures of the Company and its associated corporations |
The interests of Directors and Chief Executive Officer in the shares of the Company (other than pursuant to equity derivatives such as shares options, warrants to subscribe or convertible bonds) as at 30 June 2004 were as follows:
| Directors | Capacity | Number of Ordinary Shares Held | % of the Issued the Company | |||
The Hon. Michael D. Kadoorie | Note (a) | 475,381,026 | 19.7397 | |||
W. E. Mocatta | Founder of a | 250,000 | 0.0104 | |||
J. S. Dickson Leach | Beneficial owner | 3,436 | 0.0001 | |||
R. J. McAulay | Note (b) | 439,800,565 | 18.2623 | |||
The Hon. Sir S. Y. Chung | Beneficial owner | 393,789 | 0.0164 | |||
William K. Fung | Beneficial owner | 120,000 | 0.0050 | |||
J. A. H. Leigh | Beneficial owner | 22,000 | 0.0009 | |||
R. Bischof | Beneficial owner | 50,000 | 0.0021 | |||
P. C. Tan | Interests held jointly with spouse | 5,000 | 0.0002 | |||
Andrew Brandler (Chief Executive Officer) | Note (c) | 20,600 | 0.0009 | |||
Peter P. W. Tse | Note (c) | 20,600 | 0.0009 | |||
Peter W. Greenwood | Personal | 5,600 | 0.0002 | |||
Y. B. Lee | Note (d) | 15,806 | 0.0007 | |||
Table of Contents
Page 43
Notes:
| (a) | The Hon. Michael D. Kadoorie was deemed (by virtue of the Securities and Futures Ordinance) to be interested in 475,381,026 shares in the Company. These shares were held in the following capacity: |
| i) | 1,243 shares were an interest of his spouse. |
| ii) | 236,335,571 shares were held by discretionary trusts, of which The Hon. Michael D. Kadoorie is one of the beneficiaries. |
| iii) | 239,044,212 shares were held by a discretionary trust, of which The Hon. Michael D. Kadoorie is a beneficiary and the founder. |
| (b) | Mr. R. J. McAulay was deemed (by virtue of the Securities and Futures Ordinance) to be interested in 439,800,565 shares in the Company. These shares were held in the following capacity: |
| i) | 13,141 shares were held in a personal capacity. |
| ii) | 236,335,571 shares were held by discretionary trusts, of which Mr. R. J. McAulay is one of the beneficiaries. |
| iii) | 203,451,853 shares were held by a discretionary trust, of which Mr. R. J. McAulay, his wife and members of his family are beneficiaries. |
| (c) | 600 shares were held in a personal capacity and 20,000 shares were held in a beneficial owner capacity. |
| (d) | 600 shares were held in a personal capacity and 15,206 shares were held jointly with spouse. |
Messrs. I. D. Boyce, V. F. Moore, Hansen C. H. Loh and Paul M. L. Kan who are Directors of the Company and Mr. Bradley W. Corson who is an Alternate Director have each confirmed that they had no interests in the shares of the Company as at 30 June 2004.
None of the Directors had interests in debentures, under equity derivatives or in underlying shares of the Company and its associated corporations.
| 2. | Aggregate short position in the shares, underlying shares and debentures of the Company and its associated corporations |
None of the Directors had short positions in respect of shares, debentures, under equity derivatives or interests in underlying shares of the Company and its associated corporations.
At no time during the period was the Company, its subsidiaries or its associated companies a party to any arrangement to enable the Directors and the Chief Executive Officer of the Company (including their spouse and children under 18 years of age) to acquire benefits by an acquisition of shares or underlying shares in, or debentures of, the Company or its associated corporations.
Table of Contents
Page 44
Interests of Substantial Shareholders
The interests/short positions of Substantial Shareholders in the shares and underlying shares of the Company as at 30 June 2004, as recorded in the register required to be kept under Section 336 of Part XV of the Securities and Futures Ordinance, are set out below:
| 1. | Aggregate long position in the shares and underlying shares of the Company |
The Company had been notified of the following substantial shareholders’ interests in the shares (other than pursuant to equity derivatives such as share options, warrants to subscribe or convertible bonds) as at 30 June 2004.
Substantial Shareholders | Capacity | Total Interests in Number of Shares of the Company | % of the Issued Share Capital of the Company | |||
Bermuda Trust Company Limited | Interest of controlled corporation | 682,978,836 Notes (a) & (b) | 28.36
| |||
Esko Limited | Interest of controlled corporation | 236,335,571 Notes (b) & (c) | 9.81 | |||
Hesko Limited | Interest of controlled corporation | 236,335,571 Notes (b) & (c) | 9.81 | |||
Mikado Holding Inc. | Trustee | 239,044,212 Notes (b) & (d) | 9.93 | |||
Mikado Investments Limited | Interest of controlled corporation | 239,044,212 Notes (b) & (d) | 9.93 | |||
New Boron Holding Corporation | Trustee | 196,468,538 Note (c) | 8.16 | |||
The Hon. Michael D. Kadoorie | Note (e) | 475,381,026 Notes (b) & (e) | 19.74 | |||
Notes:
| (a) | The interests of Bermuda Trust Company Limited in the shares of the Company include the shares held by discretionary trusts of which The Hon. Michael D. Kadoorie and/or Mr. R. J. McAulay are among the beneficiaries as disclosed in “Interests of Directors and Chief Executive Officer”. |
| (b) | The interests of Esko Limited, Hesko Limited, Mikado Holding Inc., Mikado Investments Limited and New Boron Holding Corporation in the Company are duplicated by the interests in the Company held by Bermuda Trust Company Limited which effectively controls them. The attributable interests held by The Hon. Michael D. Kadoorie are those identified in “Interests of Directors and Chief Executive Officer”, and apart from the interest of spouse so identified therein, they are also duplicated by the interests in the Company held by Bermuda Trust Company Limited. |
Table of Contents
Page 45
| (c) | Esko Limited and Hesko Limited jointly own the interests in the Company through the following companies: |
Name of Controlled Corporation | Number of Shares | % of Issued Share | % of Issued Share by Hesko Limited | |||
New Boron Holding Corporation | 196,468,538 | 50 | 50 | |||
New Mercury Holding Corporation | 4,980,787 | 50 | 50 | |||
New Cobalt Holding Corporation | 34,886,246 | 50 | 50 | |||
The interests of New Boron Holding Corporation are duplicated by the interests of Esko Limited and Hesko Limited. They are also duplicated by the interests in the Company held by Bermuda Trust Company Limited.
| (d) | Mikado Investments Limited owns the interests in the Company through Mikado Holding Inc. The interests of Mikado Holding Inc. are duplicated by the interests of Mikado Investments Limited. They are also duplicated by the interests in the Company held by Bermuda Trust Company Limited. |
| (e) | The aggregate long position in the shares of the Company of The Hon. Michael D. Kadoorie are listed below: |
Interests in the Ordinary Shares of the Company
Number | Capacity | |
1,243 239,044,212 475,379,783 | Interest of spouse Founder of a discretionary trust Beneficiary of various discretionary trusts | |
The interests of The Hon. Michael D. Kadoorie as a founder of a discretionary trust and a beneficiary of one of the discretionary trusts are duplicated between each other. His interests, apart from the interest of spouse, are also duplicated by the interests in the Company held by Bermuda Trust Company Limited and certain discretionary trusts of which Mr. R. J. McAulay is one of the beneficiaries as disclosed above by Directors.
As at 30 June 2004, the Company had not been notified of any substantial shareholders’ interests under equity derivatives or in underlying shares of the Company.
Table of Contents
Page 46
| 2. | Aggregate short position in the shares and underlying shares of the Company |
As at 30 June 2004, the Company had not been notified of any short positions being held by any substantial shareholder in the shares or underlying shares of the Company.
Interests of Any Other Persons
As at 30 June 2004, the Company had not been notified of any persons other than the substantial shareholders who had interests or short positions in the shares or underlying shares of the Company, which are required to be recorded in the register required to be kept under Section 336 of Part XV of the Securities and Futures Ordinance.
Table of Contents
Page 47
The Audit Committee has reviewed the accounting principles and practices adopted by the Group and the unaudited condensed accounts for the six months ended 30 June 2004. All of the Audit Committee members are appointed from the Independent Non-executive Directors, with the Chairman having appropriate professional qualifications and experience in financial matters.
None of the Directors of the Company is aware of any information that would reasonably indicate that the Company is not, or was not for any part of the six months ended 30 June 2004, in compliance with the Code of Best Practice contained in Appendix 14 of the Rules Governing the Listing of Securities on The Stock Exchange of Hong Kong Limited (Listing Rules).
Since 1989, the Company has adopted its own Code for Securities Transactions by Directors (CLP Code), which is largely based on the Model Code set out in Appendix 10 of the Listing Rules. The CLP Code also applies to other “Specified Individuals” such as members of the CLP Group’s senior management. The CLP Code has been updated from time to time to reflect new regulatory requirements as well as CLP Holdings’ strengthened regime of disclosure of interests in its securities.
The current CLP Code is on terms no less exacting than the required standard set out in the Model Code.
All Directors have confirmed, following specific enquiry by the Company, that they have complied with the required standard set out in the Model Code and CLP Code throughout the period from 1 January to 30 June 2004.
Purchase, Sale or Redemption of the Company’s Listed Shares
There was no purchase, sale or redemption of the Company’s listed shares by the Company or any of its subsidiaries during the six months ended 30 June 2004.
Table of Contents
Page 48
Financial Diary
Announcement of interim results | 4 August 2004 | |
Interim report posted to shareholders | 30 August 2004 | |
Last day to register for second interim dividend | 2 September 2004 | |
Book close day | 3 September 2004 | |
Payment of second interim dividend | 15 September 2004 | |
Financial year end | 31 December 2004 |
Interim Report
Printed in English and Chinese language, available on our website at www.clpgroup.com under the “Investor Relations” section on 18 August 2004 and posted to Shareholders on 30 August 2004.
Those Shareholders who (a) received our Interim Report 2004 electronically and would like to receive a printed copy or vice versa ; or (b) received our Interim Report 2004 in either English or Chinese language version only and would like to receive a printed copy of the other language version or to receive printed copies of both language versions in future, are requested to write to the Company Secretary or the Company’s Registrars.
Shareholders may at any time choose to change their choice of the language or means of receipt of the Company’s corporate communications free of charge by notice in writing to the Company Secretary or the Company’s Registrars.
Our Contact Details
Address : | 147 Argyle Street, Kowloon, Hong Kong | |
Telephone : | (852) 2678 8228 (Shareholders’ hotline) | |
| (852) 2678 8322 (Investor Relations Manager) | ||
Facsimile : | (852) 2678 8390 (Company Secretary) | |
| (852) 2678 8530 (Investor Relations Manager) | ||
E-mail : | cosec@clp.com.hk (Company Secretary) | |
| IR_Dept@clp.com.hk (Investor Relations Manager) |
Company’s Registrars
Computershare Hong Kong Investor Services Limited
Address : | Rooms 1901-1905 Hopewell Centre, 183 Queen’s Road East, Hong Kong | |
Telephone : | (852)2862 8628 | |
Facsimile : | (852)2865 0990 | |
E-mail : | hkinfo@computershare.com.hk |
Share Listing
CLP Holdings shares are listed on the Stock Exchange of Hong Kong and are traded over the counter in the United States in the form of American Depositary Receipts.
Our Stock Code
The Stock Exchange of Hong Kong : | 002 | |
Bloomberg : | 2 HK | |
Reuters : | 0002.HK | |
Ticker Symbol for ADR Code : | CLPHY | |
CUSIP Reference Number : | 18946Q101 |