UNITED STATES
SECURITIES AND EXCHANGE COMMISSION
Washington, D.C. 20549
FORM 20-F
(Mark One)
| ¨ | Registration statement pursuant to Section 12(b) or (g) of the Securities Exchange Act of 1934 |
OR
| x | Annual report pursuant to Section 13 or 15(d) of the Securities Exchange Act of 1934 |
For the fiscal year endedDecember 31, 2004
OR
| ¨ | Transition report pursuant to Section 13 or 15(d) of the Securities Exchange Act of 1934 |
For the transition period from to
Commission file number333-08176
|
| CLP Holdings Limited |

|
(Exact name of Registrant as specified in its charter) |
|
Not Applicable |
(Translation of Registrant’s name into English) |
|
| Hong Kong Special Administrative Region, China |
(Jurisdiction of incorporation or organization) |
|
147 Argyle Street, Kowloon, Hong Kong Special Administrative Region, China |
(Address of principal executive offices) |
Securities registered or to be registered pursuant to Section 12(b) of the Act
| | |
Title of each class
| | Name of each exchange on which registered
|
| None | | None |
| |
|
Securities registered or to be registered pursuant to Section 12(g) of the Act
|
Ordinary shares of HK$5.00 each |
(Title of Class) |
Securities for which there is a reporting obligation pursuant to Section 15(d) of the Act
Indicate the number of outstanding shares of each of the issuer’s classes of capital or common stock as of the close of the period covered by the annual report.
|
2,408,245,900 Ordinary Shares of par value HK$5 each
|
Indicate by check mark whether the registrant (1) has filed all reports required to be filed by Section 13 or 15(d) of the Securities Exchange Act of 1934 during the preceding 12 months (or for such shorter period that the registrant was required to file such reports), and (2) has been subject to such filing requirements for the past 90 days.
Yes X No
Indicate by check mark which financial statement item the registrant has elected to follow.
Item 17 X Item 18
(APPLICABLE ONLY TO ISSUERS INVOLVED IN BANKRUPTCY PROCEEDINGS DURING THE PAST FIVE YEARS)
Indicate by check mark whether the registrant has filed all documents and reports required to be filed by Section 12, 13 or 15(d) of the Securities Exchange Act of 1934 subsequent to the distribution of securities under a plan confirmed by a court.
Yes No
TABLE OF CONTENTS
i
ii
iii
FORWARD LOOKING STATEMENTS IN THIS ANNUAL REPORT
MAY NOT BE ACCURATE
Our disclosure and analysis in this annual report contain or incorporate by reference some forward-looking statements. Our forward-looking statements contain information regarding, among other things, our financial condition, future expansion plans and business strategy. We have based these forward-looking statements on our current expectations and projections about future events. You can identify these statements by the fact that they do not relate strictly to historical or current facts. Although we believe that these expectations and projections are reasonable, such forward-looking statements are inherently subject to risks, uncertainties and assumptions about us, including, among other things:
| | • | | general economic and political conditions affecting Hong Kong; |
| | • | | possible disruptions in commercial activities caused by natural and human-induced disasters, including terrorist activity, that may impact the economy of Hong Kong; |
| | • | | natural disasters, such as earthquakes and droughts, which are beyond our control; |
| | • | | the introduction of new environmental regulations; |
| | • | | fluctuations in foreign currency exchange rates and the possible devaluation of the Hong Kong dollar; |
| | • | | additional disclosures we make in our previous and future Form 20-F annual reports and Form 6-K periodic reports to the U.S. Securities and Exchange Commission; and |
| | • | | those other risks identified in “Item 3. Key Information—D. Risk Factors” of this annual report. |
The words “anticipate,” “believe,” “estimate,” “expect,” “intend,” “plan” and similar expressions, as they relate to us, are intended to identify a number of these forward-looking statements. We undertake no obligation to update or revise any forward-looking statements whether as a result of new information, future events or otherwise. In light of these risks, uncertainties and assumptions, the forward-looking events discussed in this annual report might not occur and our actual results could differ materially from those anticipated in these forward-looking statements.
4
PART I
| Item 1. | Identity of Directors, Senior Management and Advisers |
Not applicable.
| Item 2. | Offer Statistics and Expected Timetable |
Not applicable.
5
A. Selected Financial Data
Since January 6, 1998, we became the holding company of a group of companies, consisting of CLP Power Hong Kong Limited and various other companies under a scheme of arrangement, referred to as the Scheme of Arrangement in this annual report. Effective from September 30, 1999, our financial year end date has been changed from September 30 to December 31. The table below sets forth our selected financial data for the years ended December 31, 2000, 2001, 2002, 2003 and 2004. The selected balance sheet data as of December 31, 2003 and 2004 and the selected income statement information for the years ended December 31, 2002, 2003 and 2004 are derived from our audited consolidated financial statements included elsewhere in this annual report. The selected balance sheet data as of December 31, 2000, 2001 and 2002 and the selected income statement information for the years ended December 31, 2000 and 2001 are derived from our audited consolidated financial statements not included in this annual report. Our financial statements have been prepared in conformity with accounting principles generally accepted in Hong Kong, or Hong Kong GAAP. In addition, such data have been reconciled with accounting principles generally accepted in the United States of America, or U.S. GAAP, described in Note 34 (pages F-53 to F-61) to our financial statements set forth in “Item 17. Financial Statements” and presented in compliance with Item 17 of Form 20-F under the U.S. Securities Exchange Act of 1934, as amended.
The current Scheme of Control Agreement, referred to as the Scheme of Control in this annual report, that governs our Hong Kong electricity-related financial affairs was entered into in March 1992 with the Hong Kong Government and certain other parties and became effective on October 1, 1993 with a duration of 15 years. The following information should be read in conjunction with “Item 5. Operating and Financial Review and Prospects” and the financial statements and the related notes to those statements included in “Item 17. Financial Statements” in this annual report.
6
| | | | | | | | | | | | | | | | | | |
| | | Year Ended December 31,
| |
| | | 2000
| | | 2001(1)
| | | 2002(1)
| | | 2003
| | | 2004
| | | 2004
| |
| | | HK$ | | | HK$ | | | HK$ | | | HK$ | | | HK$ | | | US$ | |
| | | (in millions, except for per share data) | |
Consolidated Income Statement Information: | | | | | | | | | | | | | | | | | | |
Hong Kong GAAP | | | | | | | | | | | | | | | | | | |
Turnover(2) | | 24,451 | | | 24,999 | | | 26,134 | | | 28,248 | | | 30,784 | | | 3,961 | |
| | |
|
| |
|
| |
|
| |
|
| |
|
| |
|
|
Expenses | | | | | | | | | | | | | | | | | | |
Purchases of electricity | | 14,779 | | | 15,252 | | | 15,586 | | | 15,873 | | | 16,055 | | | 2,066 | |
Staff expenses | | 827 | | | 929 | | | 945 | | | 1,157 | | | 1,284 | | | 165 | |
Fuel and other operating costs | | 1,180 | | | 1,246 | | | 1,331 | | | 2,249 | | | 3,026 | | | 389 | |
Depreciation | | 1,474 | | | 1,624 | | | 1,749 | | | 2,357 | | | 2,529 | | | 325 | |
| | |
|
| |
|
| |
|
| |
|
| |
|
| |
|
|
| | | 18,260 | | | 19,051 | | | 19,611 | | | 21,636 | | | 22,894 | | | 2,945 | |
| | |
|
| |
|
| |
|
| |
|
| |
|
| |
|
|
Property disposal gain | | – | | | – | | | 313 | | | – | | | 214 | | | 27 | |
| | |
|
| |
|
| |
|
| |
|
| |
|
| |
|
|
Operating profit | | 6,191 | | | 5,948 | | | 6,836 | | | 6,612 | | | 8,104 | | | 1,043 | |
Finance costs | | (204 | ) | | (187 | ) | | (189 | ) | | (688 | ) | | (1,046 | ) | | (134 | ) |
Finance income | | 110 | | | 29 | | | 33 | | | 48 | | | 63 | | | 8 | |
Hok Un redevelopment profit(3) | | 1,357 | | | 1,752 | | | 282 | | | 291 | | | 187 | | | 24 | |
Share of profits less losses of | | | | | | | | | | | | | | | | | | |
jointly controlled entities | | 2,216 | | | 2,348 | | | 2,992 | | | 3,399 | | | 3,181 | | | 409 | |
associated companies | | 5 | | | 71 | | | 86 | | | 102 | | | 236 | | | 30 | |
Impairment loss on investment in associated company(4) | | (900 | ) | | – | | | – | | | – | | | – | | | – | |
| | |
|
| |
|
| |
|
| |
|
| |
|
| |
|
|
Profit before taxation | | 8,775 | | | 9,961 | | | 10,040 | | | 9,764 | | | 10,725 | | | 1,380 | |
Taxation | | (1,378 | ) | | (1,128 | ) | | (1,293 | ) | | (1,712 | ) | | (1,815 | ) | | (234 | ) |
| | |
|
| |
|
| |
|
| |
|
| |
|
| |
|
|
Profit after taxation | | 7,397 | | | 8,833 | | | 8,747 | | | 8,052 | | | 8,910 | | | 1,146 | |
Transfers under Scheme of Control(5) | | (1,629 | ) | | (1,506 | ) | | (1,643 | ) | | (365 | ) | | (296 | ) | | (38 | ) |
| | |
|
| |
|
| |
|
| |
|
| |
|
| |
|
|
Net earnings | | 5,768 | | | 7,327 | | | 7,104 | | | 7,687 | | | 8,614 | | | 1,108 | |
| | |
|
| |
|
| |
|
| |
|
| |
|
| |
|
|
Earnings per share of common stock(6) | | 2.31 | | | 2.95 | | | 2.95 | | | 3.19 | | | 3.58 | | | 0.46 | |
Dividends per share of common stock(6) | | 1.867 | (7) | | 2.100 | (7) | | 1.880 | (7) | | 1.980 | (7) | | 2.230 | (7) | | 0.287 | (7) |
Dividends per share of common stock(6) (US$) | | 0.239 | (7) | | 0.269 | (7) | | 0.241 | (7) | | 0.255 | (7) | | 0.287 | (7) | | | |
U.S. GAAP: | | | | | | | | | | | | | | | | | | |
Net income | | 6,071 | | | 7,405 | | | 7,023 | | | 7,525 | | | 9,293 | | | 1,196 | |
| (1) | Comparative figures for 2001 and 2002 have been restated as a result of the initial adoption of Statement of Standard Accounting Practice (SSAP) No. 12 (Revised) “Income Taxes” in 2003. |
| (2) | Turnover represents sales of electricity based on either actual and accrued consumption derived from meter readings or the amount billed in accordance with the terms of the contractual agreements where applicable during the period, other electricity-related revenue, property income, and supply and maintenance services fees. |
| (3) | This represents our share of profit (Phase 3 in 2000 and Phases 4 & 5 in both 2001, 2002, 2003 and 2004) arising from Laguna Verde (the property development at Hok Un site in Hung Hom, Hong Kong), which is a joint venture undertaken with a subsidiary company of Cheung Kong (Holdings) Limited. |
| (4) | In 2000, we reviewed the carrying value of Electricity Generating Public Company Limited of Thailand, or EGCO, which included unamortized goodwill capitalized in accordance with our accounting policy. This review focused on the investment fundamentals and took into consideration a change in government policy on the privatization of the assets of Electricity Generating Authority of Thailand, as well as slower growth of electricity demand in Thailand. In reflecting the fair value of the investment, we wrote off HK$900 million of the unamortized goodwill of EGCO as an impairment loss. |
| (5) | Transfers under the Scheme of Control comprised (i) the difference between the permitted return and the Scheme of Control profit being transferred to or from the Scheme of Control development fund, or the Development Fund, (ii) the amount of deferral premium in relation to Units 7 and 8 of the Black Point Power Station charged to the special provision account, and (iii) a charge of 8% per annum on the sum of the average balances of the Development Fund and the special provision account, being credited to a rate reduction reserve to be applied as rebates to customers. See “Item 4. Information on the Company — B. Business Overview — Electricity Business in Hong Kong — Scheme of Control”. |
| (6) | Earnings and dividends per share for 2000 have been adjusted for the capitalization issue of one-for-five shares on April 23, 2001. |
| (7) | Excluding the special dividends, dividends per share would have been HK$1.417 (US$0.18) in 2000, HK$1.49 (US$0.19) in 2001, HK$1.65 (US$0.21) in 2002, HK$1.88 (US$0.24) in 2003 and HK$2.08 (US$0.26) in 2004. |
7
| | | | | | | | | | | | | | | |
| | | As of December 31,
| |
| | | 2000
| | 2001(1)
| | 2002(1)
| | 2003
| | | 2004
| | | 2004
| |
| | | HK$ | | HK$ | | HK$ | | HK$ | | | HK$ | | | US$ | |
| | | (in millions) | |
Consolidated Balance Sheet Information: | | | | | | | | | | | | | | | |
Hong Kong GAAP | | | | | | | | | | | | | | | |
Current assets | | 3,821 | | 1,704 | | 2,510 | | 5,451 | | | 6,383 | | | 821 | |
Fixed assets | | 30,692 | | 33,577 | | 36,550 | | 54,157 | | | 57,748 | | | 7,430 | |
Goodwill | | – | | – | | – | | (1,017 | ) | | (1,022 | ) | | (131 | ) |
Investments in | | | | | | | | | | | | | | | |
jointly controlled entities | | 12,155 | | 15,867 | | 18,982 | | 14,687 | | | 14,998 | | | 1,930 | |
associated companies | | 1,173 | | 1,216 | | 1,426 | | 1,593 | | | 1,640 | | | 211 | |
Other assets | | 1,837 | | 1,925 | | 1,425 | | 961 | | | 1,052 | | | 135 | |
| | |
| |
| |
| |
|
| |
|
| |
|
|
Total assets | | 49,678 | | 54,289 | | 60,893 | | 75,832 | | | 80,799 | | | 10,396 | |
| | |
| |
| |
| |
|
| |
|
| |
|
|
| | | | | | |
Current liabilities(2) | | 5,393 | | 7,356 | | 7,168 | | 8,905 | | | 9,678 | | | 1,245 | |
Minority interest | | – | | – | | – | | 393 | | | – | | | – | |
Term loans (long-term portion) | | 2,501 | | 4,068 | | 8,727 | | 17,602 | | | 17,596 | | | 2,264 | |
Deferred taxation | | 3,110 | | 3,279 | | 3,610 | | 4,614 | | | 5,084 | | | 654 | |
Other long-term liabilities | | 4,060 | | 4,354 | | 4,500 | | 4,077 | | | 4,242 | | | 546 | |
Shareholders’ funds | | 34,614 | | 35,232 | | 36,888 | | 40,241 | | | 44,199 | | | 5,687 | |
| | |
| |
| |
| |
|
| |
|
| |
|
|
Total liabilities and shareholders’ funds | | 49,678 | | 54,289 | | 60,893 | | 75,832 | | | 80,799 | | | 10,396 | |
| | |
| |
| |
| |
|
| |
|
| |
|
|
U.S. GAAP: | | | | | | | | | | | | | | | |
Shareholders’ equity | | 34,045 | | 34,615 | | 36,177 | | 39,397 | | | 44,052 | | | 5,668 | |
Number of shares in issue(3) (millions) | | 2,497.47 | | 2,421.49 | | 2,408.25 | | 2,408.25 | | | 2,408.25 | | | | |
| (1) | Comparative figures for 2001 and 2002 have been restated as a result of the initial adoption of SSAP No. 12 (Revised) “Income Taxes” in 2003. |
| (2) | Current liabilities include the current portion of term loans. |
| (3) | Number of shares in issue for 2000 has been adjusted for the capitalization issue of one-for-five shares on April 23, 2001. |
| | | | | | | | | | |
| | | Year Ended December 31,
|
| | | 2000
| | 2001
| | 2002
| | 2003
| | 2004
|
Other Information: | | | | | | | | | | |
Units of electricity sold by CLP Power Hong Kong | | | | | | | | | | |
Total (millions of kWh) | | 27,488 | | 28,531 | | 29,887 | | 31,043 | | 31,719 |
Local (Hong Kong) (millions of kWh) | | 26,307 | | 26,950 | | 27,712 | | 28,035 | | 28,632 |
Average local tariff(1) (HK¢ per kWh) | | 88.0 | | 88.0 | | 87.6 | | 87.5 | | 87.2 |
Group generating capacity (owned/operated)(2) | | | | | | | | | | |
Hong Kong (MW) | | 6,908 | | 6,908 | | 6,908 | | 6,908 | | 6,908 |
Chinese mainland (MW) | | 2,015 | | 2,743 | | 3,163 | | 3,163 | | 3,163 |
Other Asia-Pacific countries (MW) | | 1,048 | | 2,151 | | 2,675 | | 3,803 | | 4,088 |
| | |
| |
| |
| |
| |
|
| | | 9,971 | | 11,802 | | 12,746 | | 13,874 | | 14,159 |
| | |
| |
| |
| |
| |
|
Interest coverage(3) (times) | | 44 | | 44 | | 29 | | 12 | | 11 |
Total debt to total capitalization(4) (%) | | 6.9 | | 13.6 | | 20.1 | | 31.5 | | 29.8 |
Ratio of earnings to fixed charges(5) | | | | | | | | | | |
Hong Kong GAAP | | 21:1 | | 17:1 | | 27:1 | | 12:1 | | 10:1 |
U.S. GAAP | | 22:1 | | 17:1 | | 26:1 | | 12:1 | | 9:1 |
| (1) | Included special rebates which averaged 2.2 HK¢ per kWh for 2000, 2001, 2002 and 2003. |
| (2) | Group generating capacity (in MW) is incorporated on the following basis: (i) CAPCO on 100% capacity as stations are operated by us; (ii) PSDC on 100% as having the right to use and (iii) other stations on the proportion of our equity interests. |
| (3) | Interest coverage is calculated as profit before taxation and interest divided by interest charges. |
| (4) | Total debt to total capitalization is calculated as total debt divided by the sum of total debt and shareholders’ funds. |
| (5) | For the purpose of calculating ratio of earnings to fixed charges, earnings consist of (i) profit before taxation and fixed charges for us and our consolidated subsidiaries and (ii) distributed income received from investments accounted for under equity accounting method. Fixed charges consist of interest expense (including capitalized interest) and amortization of notes charges. |
8
Currency Translations and Exchange Rates
We publish our financial statements in Hong Kong dollars. For the convenience of the reader, we have translated Hong Kong dollar amounts into U.S. dollars in certain portions of this annual report at a rate of HK$7.7723 = US$1.00. This rate was the noon buying rate in New York City for cable transfers in foreign currencies, as certified for customs purposes by the Federal Reserve Bank of New York on December 31, 2004. The translation does not mean that Hong Kong dollars could actually be converted into U.S. dollars at that rate.
The following tables show the noon buying rates expressed in Hong Kong dollars per U.S. dollar for the periods indicated below.
| | | | |
Year Ended
| | Average
Rate(1)
| | At Period
End
|
| | | (HK$ per US$1.00) |
| | |
December 31, 2000 | | 7.7936 | | 7.7999 |
December 31, 2001 | | 7.7996 | | 7.7980 |
December 31, 2002 | | 7.7996 | | 7.7988 |
December 31, 2003 | | 7.7864 | | 7.7640 |
December 31, 2004 | | 7.7899 | | 7.7723 |
| | | | |
(1) These figures each represent the average of the noon buying rates on the last day of each month during the period. |
| | | | | | |
Month
| | High
| | Low
| | At Period
End
|
| | | (HK$ per US$1.00) |
| | | |
December 2004 | | 7.7821 | | 7.7698 | | 7.7723 |
January 2005 | | 7.7994 | | 7.7775 | | 7.7993 |
February 2005 | | 7.7999 | | 7.7984 | | 7.7992 |
March 2005 | | 7.7998 | | 7.7987 | | 7.7990 |
April 2005 | | 7.7995 | | 7.7946 | | 7.7946 |
May 2005 | | 7.7995 | | 7.7767 | | 7.7788 |
June 2005 (through June 10, 2005) | | 7.7842 | | 7.7781 | | 7.7781 |
9
B. Capitalization and Indebtedness
Not applicable.
C. Reasons for the Offer and Use of Proceeds
Not applicable.
10
D. Risk Factors
Our business and operations are subject to various risks, many of which are beyond our control. If any of the risks described below actually occurs, our business, financial condition or results of operations could be seriously harmed.
Changes in Hong Kong’s political situation may affect the manner in which our business is conducted, as well as business confidence and economic conditions in Hong Kong, which could adversely affect our results of operations.
From July 1, 1997, Hong Kong ceased to be a Crown Colony of the United Kingdom and became a Special Administrative Region of the People’s Republic of China, or China in accordance with the Sino-British Joint Declaration signed in Beijing in December 1984. The basic policies of China regarding Hong Kong are embodied in the Basic Law of the Hong Kong Special Administrative Region enacted by the National People’s Congress of China, or the Basic Law. The Basic Law provides that Hong Kong will have a high degree of legislative, legal and economic autonomy. We cannot assure you that China will not exercise direct influence over the political and economic affairs of Hong Kong, or that such influence will not affect business confidence and economic conditions in Hong Kong.
In Hong Kong, the administration of policies have always been the concern of the general public and business community, and some have led to large scale demonstration. The resignation of some Senior Government Officials, demand for early universal suffrage, delay of launching the Link Real Estate Investment Trust and the recent resignation of the Chief Executive created different levels of political uncertainties. There can be no assurance that future changes in the political situation of Hong Kong will not affect the economic climate in Hong Kong, which in turn could materially and adversely affect our results of operations.
We generate revenues primarily from the provision of electricity to Hong Kong residential, commercial, infrastructure and public services and manufacturing sectors within Hong Kong. Any material adverse developments in Hong Kong’s economy could impact our electricity revenue, reduce the growth in the electricity demand in Hong Kong, further defer our capital expenditures and adversely affect our business and results of operations.
Most of our revenues are derived from our business activities in Hong Kong, which are directly affected by the performance of Hong Kong’s economy. The economy of Hong Kong has in recent years experienced a decline from the high rates of growth experienced in the 1960s, 1970s and 1980s as businesses in Hong Kong have increasingly relocated manufacturing operations to the Chinese mainland and other regions, where labor and other fixed costs are generally lower. This has resulted, and is expected to continue to result, in a decline in electricity sales by us to the manufacturing sector and consequently, reduced growth in our sales of electricity in Hong Kong.
11
Hong Kong has experienced some years of economic difficulties since the Asian financial crisis. However, the economy largely recovered throughout 2004. Although Hong Kong is expected to maintain a solid economic growth in 2005, it is vulnerable to external factors because of its highly externally oriented economic structure. Persistent high oil prices, an upward interest rate cycle and continuous macroeconomic adjustment measures in China could impact the Hong Kong economy. More directly, outbreak of epidemics such as avian flu in the surrounding regions could take a toll on the regional economy. This could in turn slow the growth in electricity demand in Hong Kong, which might result in our further deferral of capital expenditures and limit our revenue growth. Furthermore, exceptional and major changes to social or economic circumstances in Hong Kong could also adversely affect our local electricity business in terms of volume of sales and, notwithstanding the Scheme of Control, tariff implementation.
Most of our revenues are derived from the operations of our subsidiary, CLP Power Hong Kong Limited, or CLP Power Hong Kong, and our affiliated company, Castle Peak Power Company Limited, or CAPCO. The electricity-related operations and financial affairs of CLP Power Hong Kong and CAPCO are governed by the current Scheme of Control which is effective until September 30, 2008. Any unfavorable modifications to the Scheme of Control by the Hong Kong Government following its expiry in 2008 may have an adverse effect on our financial performance.
Most of our revenues are derived from the operations of our subsidiary, CLP Power Hong Kong, and our affiliated company, CAPCO. The Scheme of Control governs the financial affairs of CLP Power Hong Kong and CAPCO insofar as such affairs relate to CLP Power Hong Kong’s and CAPCO’s core electricity-related operations in Hong Kong. The current Scheme of Control is effective until September 30, 2008. On January 31, 2005, the Hong Kong Government launched a process of public consultation on post-2008 electricity market arrangements. Recently, some companies have also expressed interest in electricity generation and electricity supply business in Hong Kong, but they have not disclosed any detailed plan to the public at the moment. Should there be any modification to the Scheme of Control by the Hong Kong Government following its expiration in 2008 in a manner which would be unfavorable to CLP Power Hong Kong and CAPCO, our financial condition could be seriously affected.
Our business outside Hong Kong may be adversely affected by factors beyond our control.
We have invested in power projects located in Australia, India, Taiwan, Thailand and the Chinese mainland. Apart from the power projects of our subsidiaries, Yallourn Energy Pty Limited and CLP Australia Energy Holdings located in Australia and Gujarat Paguthan Energy Corporation Private Limited located in India, other projects are in the form of jointly controlled entities where we share the control over these entities with our joint venture partners, or as an associated company where we can only exercise certain significant influence in its management. As we do not have unilateral control over these ventures, their operations may not follow the same policies and standards that are adopted by our subsidiaries.
12
In addition, the success and profitability of our investment activities depend largely on the following factors, which are beyond our control:
| | • | | performance of a particular foreign economy; |
| | • | | political and social stability; |
| | • | | unexpected changes in environmental and other regulatory requirements; |
| | • | | foreign exchange control; |
| | • | | tariffs adjustments and substantial increases in fuel and transportation costs which cannot be passed on to our customers for political or other reasons; |
| | • | | stability of interest and exchange rates; and |
Any unfavorable changes in the above factors will adversely affect the profitability of our investments and our operating results.
We have long-term commitments denominated in U.S. dollars and other foreign currencies for our operations and business expansion. A devaluation of the Hong Kong dollar may increase costs associated with our operations and business expansion, and materially and adversely affect our financial condition and results of operations.
Although the Hong Kong dollar has been officially linked to the U.S. dollar at the rate of approximately HK$7.80 to US$1.00 since October 17, 1983, we cannot assure you that this or any linked exchange rate will be maintained by the Hong Kong Government in the future. While most of our revenues are denominated in Hong Kong dollars and we have hedged a material portion of our foreign currency exposures through the use of derivative instruments, any devaluation of the Hong Kong dollar in the longer term beyond the available and practicable hedging time span would increase the Hong Kong dollar cost of our future expenditures denominated in U.S. dollars or other foreign currencies, which could materially and adversely affect our financial condition and results of operations.
Accidents and natural disasters could prevent the operation of our power generating and distribution facilities and prevent us from generating electricity-related revenues or reduce our operating flexibility.
Our power generating and distribution operations may be affected from time to time by equipment failures and natural disasters, such as typhoons or floods. Natural disasters could interrupt our power generating, transmission and distribution services leading to decreased revenues, increased maintenance and higher engineering costs. Accidents could interrupt our power generating, transmission and distribution services, subject us to increased liabilities or bring about pressure for greater regulation of our services. Although we have acquired insurance that is consistent with industry practice against such risks, our insurance is subject to market-wide exclusion, limitation and commercial availability.
13
Our power generating and distribution operations may be adversely affected by environmental regulations.
Our power generating and distribution operations in Hong Kong, as well as in the Chinese mainland and other Asia-Pacific countries, are subject to a number of laws and regulations relating to environmental protection and safety. The operations may, in particular, be affected by mitigation measures such as those required under the Kyoto Protocol addressing the rising concerns over greenhouse gas emission and global climate change. Although we believe we are in compliance in all material respects with existing environmental laws and regulations, it is possible that additional costs may be incurred or operations of some of our power assets may be affected as a result of new interpretation or revision of existing laws and regulations, enactment of new or more stringent requirements, or the evolution in mitigation measures for global environmental issues. As some risks of environmental costs and liabilities are inherent in our operations, we cannot assure you that material costs and liabilities will not be incurred in the future in this regard.
Technological advances in the electricity industry may create competitive pressure on our operations, which may adversely affect our financial condition and results of operations.
Development of alternative generating, delivering, storage and application technologies may not only affect the ways we supply our electricity to customers, but also create more competition in the electricity industry. For instance, distributed generation technologies such as fuel cells and microturbines, together with other waste heat conversion technologies, are being experimented to provide combined heat and power to electricity customers at a high level of fuel efficiency. Such technological developments may negatively affect our competitive strength, and in turn our business. New technologies take time and require heavy investment to develop and realize commercial operation. Although we have dedicated resources to monitor technological developments that are of potential relevance to our business, we cannot assure you that our efforts can clear all risks and uncertainties that may be caused by technological advances worldwide.
Our business may be harmed, and our financial condition and results of operations may be adversely affected, by changes in general economic and business conditions resulting from terrorist activities, political unrest and military actions that take place outside Hong Kong.
We are exposed to the risks of political unrest, war, acts of terrorism and other instability, which could result in increased volatility in or damage to the global markets and the Hong Kong economy, cause disruption to our business or the business of our customers, and may in turn adversely affect our business and results of operations.
14
Investor confidence and the market price of our securities may be adversely impacted if we or our independent registered public accountant is unable to attest to the adequacy of the internal control over financial reporting of our company as of December 31, 2006, as required by Section 404 of the Sarbanes-Oxley Act of 2002.
The SEC, as directed by Section 404 of the Sarbanes-Oxley Act of 2002, adopted rules requiring public companies to include in their Annual Report on Form 10-K or Form 20-F, as the case may be, a report of management on the company’s internal controls over financial reporting that contains an assessment by management of the effectiveness of the company’s internal control over financial reporting. In addition, the company’s independent registered public accountant must attest to and report on management’s assessment of the effectiveness of the company’s internal control over financial reporting. These requirements will first apply to our Annual Report on Form 20-F for the fiscal year ending December 31, 2006. Our management may not conclude that our internal control over financial reporting is effective. Moreover, even if our management does conclude that our internal control over financial reporting is effective, if our independent registered public accountant is not satisfied with our internal control, the level at which our control is documented, designed, operated or reviewed, or if the independent registered public accountant interprets the requirements, rules or regulations differently from us, then he/she may decline to attest to our management’s assessment or may issue a report that is qualified.
In preparation for our compliance with these assessment and attestation requirements, we are in the process of carrying out a review of the design, documentation and operating effectiveness of our internal control over financial reporting. In the course of this readiness project, some deficiencies in our internal control came to light, none of these are considered material. We are working to rectify these deficiencies and we anticipate that all of them will be rectified by December 31, 2006.
However, because of its inherent limitations, internal control over financial reporting may not prevent or detect all misstatements which may occur. Furthermore, current evaluations of internal controls may in the future become inaccurate due to changes in conditions, or deterioration in compliance with policies or procedures. To the extent that any material weakness in our internal control over financial reporting is discovered in the future and not rectified by the time our first assessment and attestation under Section 404 of the Sarbanes-Oxley Act of 2002 must be made, or our management or our independent registered public accountant are unable to attest to the adequacy of our controls, we could suffer an adverse reaction in the financial marketplace due to a loss of investor confidence in the reliability of our financial statements, which could negatively impact the market price of our securities.
15
| Item 4. | Information on the Company |
A. History and Development of the Company
Our legal and commercial name is CLP Holdings Limited. We were incorporated on October 24, 1997 in the Hong Kong Special Administrative Region, China. Under a Scheme of Arrangement with effect from January 6, 1998, we reorganized the companies in our business group and became the holding company of a group of companies, consisting of CLP Power Hong Kong Limited, or CLP Power Hong Kong, (formerly known as China Light & Power Company, Limited, which was the listed and holding company of the CLP Group before reorganization) and other companies. We are a company limited by shares and incorporated under the Hong Kong Companies Ordinance. We refer to our company and our consolidated subsidiaries as the CLP Group, or our Group, in this annual report. Effective July 1, 2003, a new wholly owned subsidiary, CLP Power Asia Limited was formed to be the immediate holding company of CLP Power China Limited and CLP Power International Limited. Our aim is to strengthen management, make best use of our core industry experience across our complete portfolio and to achieve better efficiency in support functions that were previously duplicated in the two subsidiaries.
We continue to work hard to make the most productive and effective use of our people, infrastructure and systems in Hong Kong. Our record in tariff management and supply reliability is a clear measure of our performance in this respect, as is our productivity which, in terms of electricity output per employee, has increased by 127% over the past 10 years. In 2004 we announced that tariffs would be frozen in 2005. There has now been no tariff increase since 1998 which has been a period of deflation in Hong Kong. During that period there have been six tariff rebates, totaling HK$3 billion (US$0.4 billion) from our Scheme of Control reserves accounts. See Note 11 to our financial statements set forth in “Item 17. Financial Statements” in this annual report. This is the equivalent of up to a 3.7% tariff reduction in the respective years.
For our electricity business in the Chinese mainland and other Asia-Pacific countries, in 2004, we have secured a 2x600MW coal-fired greenfield project at Fangchenggang in Guangxi Province, in which we will hold a 70% interest. The project was approved by the National Development and Reform Commission of China in March 2005. Establishment of Enterprises with Foreign Investment in the Chinese mainland was also approved by the Ministry of Commerce in May 2005. The joint venture company, CLP Guangxi Fangchenggang Power Company Limited, was then formed. As part of our continuous commitment to develop renewable energy projects, in December 2004, we established a joint venture with Huaneng New Energy Industrial Co. Ltd., to own and operate a 27MW wind farm in Changdao, Shandong Province, in which we own a 45% interest.
In March 2004, we completed the acquisition of the remaining 8% interest in Yallourn Energy from Deutsche Asset Management (Australia) Limited. Following completion, we now own 100% of Yallourn Energy.
16
The further pursuit of investment opportunities outside Hong Kong will depend on those opportunities meeting our criteria in terms of price, earnings and risk profile. Our policy of diversification will be selective, prudent and incremental. Details of our investments are described in “–– B. Business Overview” below.
Our registered address is 147 Argyle Street, Kowloon, Hong Kong Special Administrative Region, China. Our telephone and facsimile numbers are (852) 2678-8111 and (852) 2760-4448 respectively. Our website address iswww.clpgroup.com. Our authorized representative in the United States with respect to our American Depositary Receipt programme is Puglisi & Associates at 850 Library Avenue, suite 204, Newark, Delaware 19711. Their telephone and facsimile numbers are (302) 738-6680 and (302) 738-7210 respectively.
17
B. Business Overview
We follow a clear and consistent strategy to realize our vision of being a leading investor-operator in the Asia-Pacific electricity power sector.
The key elements of our strategy are to:
| | • | | continuously enhance our core Hong Kong electricity business; and |
| | • | | develop our portfolio of electricity businesses in the Chinese mainland and the Asia-Pacific region. |
The objective of our electricity business in Hong Kong is to provide reliable electricity supply and high quality services at competitive prices to our customers. The current Scheme of Control Agreement took effect on October 1, 1993 and will expire on September 30, 2008. The Agreement provides that, during the three years prior to that date, we and the Hong Kong Government will institute discussions regarding revision and extension of the Scheme of Control with a view to agreeing mutually acceptable terms and conditions. On January 31, 2005, the Hong Kong Government launched a process of public consultation on the future regulation of Hong Kong’s electricity industry. The first phase of the consultation, which solicited the public’s views on options for the future development of Hong Kong’s electricity market after 2008, was completed in April 2005, whilst the second phase will consult the public on the Hong Kong Government’s proposals for the post-2008 regulatory framework. There is a great deal at stake for us and our shareholders in the outcome of the Hong Kong Government’s review of the future regulatory regime. There is also a great deal at stake for Hong Kong as a whole – the continued provision of a quality electricity supply at reasonable cost is essential for our community’s social and economic well-being.
The performance of our investments in the electricity industry outside Hong Kong is improving and we will continue our focus on managing our existing joint ventures to further improve the quality and returns from these businesses. We continue to seek opportunities in other countries outside Hong Kong which meet our investment criteria in terms of price, earnings and risk profile. Our major challenges in the electricity industry outside Hong Kong come largely from political, economic and regulatory uncertainty. We will continue to manage these risks to achieve satisfactory returns on investment and meet safety, health and environmental objectives.
18
Electricity Business in Hong Kong
Through CLP Power Hong Kong, a wholly owned subsidiary, we are engaged in the electricity generation, transmission and distribution business in Hong Kong. We are one of the only two electricity providers in Hong Kong. Pursuant to several contracts described below in “— Power Purchase from CAPCO” and “— Non-CAPCO Power Purchases/Storage Facilities”, we purchase the electricity from CAPCO, our affiliated company incorporated in Hong Kong and from Guangdong Daya Bay Nuclear Power Station, located in Guangdong Province, China. These sources of power, together with CLP Power Hong Kong’s right to use 50% of the capacity of Phase 1 of the Guangzhou Pumped Storage Power Station, amount to a total installed capacity of 8,263 megawatts, or MW. We supply electricity to Kowloon, the New Territories and a number of outlying islands, including Lantau Island and Cheung Chau, which are collectively referred to as our supply area in this annual report. Our supply area extends to approximately 1,000 square kilometers and covers a population of approximately 5.5 million, equivalent to over 2.2 million customers. We supply approximately 73% of the electricity consumed in Hong Kong.
Since 1963, our electricity generation and supply business in Hong Kong has been regulated by the Hong Kong Government pursuant to a series of Scheme of Control Agreements. The current Scheme of Control, a contract between CLP Power Hong Kong, CAPCO, ExxonMobil Energy Limited (formerly known as Exxon Energy Limited) which is referred to as ExxonMobil in this annual report, and the Hong Kong Government, regulates CLP Power Hong Kong’s and CAPCO’s financial affairs for electricity related operations in Hong Kong. The Scheme of Control provides that we are obligated to meet electricity demand at the lowest reasonable cost. In return, the Hong Kong Government recognizes that we are entitled to receive a reasonable return on our investment. The 15-year term of the current Scheme of Control will expire on September 30, 2008 and cannot be amended prior to such date without the mutual agreement of the parties. See “— Scheme of Control” below.
19
CLP Power Hong Kong
China Light & Power Company, Limited (China Light) was incorporated in 1901 in Hong Kong to supply electricity to Guangzhou (formerly known as Canton) in the Chinese mainland and Kowloon. In 1903, China Light established its first power station in Kowloon. In 1918, a new company, The China Light & Power Company (1918), Limited was formed to take over the operations of China Light. Its company name was changed to China Light & Power Company, Limited in 1935 (which changed to the present name of CLP Power Hong Kong Limited in 1999). In 1964, we entered into a joint venture arrangement with ExxonMobil International Holdings Inc. (formerly known as Esso Eastern Inc.), a wholly owned subsidiary of Exxon Mobil Corporation (formerly known as Exxon Corporation), to help finance the substantial capital commitments required to build power stations needed in connection with the anticipated rapid economic expansion in Hong Kong in the 1960s and 1970s. The generating company, CAPCO, was formed under this joint venture arrangement, and was jointly owned by CLP Power Hong Kong (40%) and ExxonMobil Energy Limited (“ExxonMobil”) (an indirect subsidiary of ExxonMobil International Holdings Inc., and was formerly known as Exxon Energy Limited) (60%). Concurrently with the establishment of the joint venture arrangement, CLP Power Hong Kong, and ExxonMobil International Holdings Inc. negotiated a regulatory framework with the Hong Kong Government formally known as the “Scheme of Control”.
Relationship With CAPCO
General
We purchase a significant part of our electricity demand from CAPCO. We work closely with ExxonMobil, which owns 60% of CAPCO, in the financing, construction and management of CAPCO’s generating facilities. The affairs of CAPCO are managed by an eleven-member board of directors, of which six representatives are nominated by ExxonMobil and five representatives are nominated by us. While we act as the operator of CAPCO’s generating facilities, there are a number of key areas requiring the consent of both shareholders, including financing.
The joint venture relationship between us and ExxonMobil is governed by an agreement initially signed in 1964 and subsequently amended and supplemented by several contracts which, collectively, are referred to as the Basic Agreement in this annual report. The Basic Agreement provides, amongst other matters, that no facility expansion can be carried out independently by CAPCO without the approval of us and ExxonMobil. ExxonMobil also has an option to participate in any future generating capacity expansion undertaken by CAPCO to provide for CLP Power Hong Kong’s requirements for electricity. However, if ExxonMobil declines to participate in any such further expansion, their right to participate in succeeding expansions of generating capacity is deemed to be waived.
CAPCO’s balance sheets as of December 31, 2003 and 2004 and statements of income, cash flows and changes in equity for the years ended December 31, 2002, 2003 and 2004, audited by PricewaterhouseCoopers, Independent Registered Public Accounting Firm, are included in “Item 17. Financial Statements” in this annual report.
20
Electricity Purchases
Under the Basic Agreement, we purchase the total electricity output of CAPCO. We also pay all of CAPCO’s operating expenses, including fuel cost, depreciation, interest expenses, current and deferred taxes, as well as CAPCO’s share of the return permitted under the Scheme of Control. See “— Scheme of Control — Net and Permitted Returns” below.
Sales to the Chinese Mainland
Only spare generating capacity of CAPCO not used to serve customers in Hong Kong may be used for sales to the Chinese mainland. Pursuant to a separate agreement among CLP Power Hong Kong, CAPCO and the Hong Kong Government, 80% of the profit from our sales to the Chinese mainland is credited to a Scheme of Control development fund, which is referred to as the Development Fund in this annual report. The remaining 20% of the profit from such sales is shared between CLP Power Hong Kong and CAPCO for the account of our respective shareholders. See “— Sales to the Chinese Mainland” below.
CAPCO Financing
We and ExxonMobil have provided most of our funding to CAPCO in the form of interest-free shareholders’ advances. As at December 31, 2004, CAPCO’s paid-in-capital amounted to HK$50 million (US$6.4 million), while shareholders’ advances amounted to HK$15.2 billion (US$2.0 billion). Pursuant to a deed of subordination, shareholders’ advances are subordinated to certain debt financing of CAPCO and may be repaid to the extent that CAPCO’s ratio of borrowed moneys to shareholders’ funds (representing the sum of the issued share capital, deferred taxation, retained profits, proposed dividend, shareholders’ advances (excluding unrealized foreign exchange differences) and special advances) is not higher than 1.5:1. Borrowed moneys means moneys lent to CAPCO excluding fuel stock loans, obligations arising from swaps and currency exchange transactions, and unrealized foreign exchange differences. As at December 31, 2004 the borrowed moneys of CAPCO amounted to approximately HK$9.3 billion (US$1.2 billion), while shareholders’ funds totaled approximately HK$18.5 billion (US$2.4 billion), giving a ratio of 0.50:1, which is lower than the ratio of 0.54:1 as at December 31, 2003. The lower ratio reflects the combined effect of increased shareholders’ funds and reduced borrowed moneys.
If CAPCO requires additional financing, we and ExxonMobil may at our discretion provide such financing in proportion to our respective participations and, if either declines, the other has the right, but not the obligation, to provide all or any part of the required financing. In addition, if so requested by CAPCO, we are obliged to provide financing in the form of special advances, provided that the cumulative amount of such special advances does not exceed the balance of the Development Fund. CAPCO also has the ability to raise funds through borrowings and/or to reduce its dividend payments to us and ExxonMobil to finance its activities.
21
Scheme of Control
Overview
The electricity-related operations and financial affairs of CLP Power Hong Kong and CAPCO (including its predecessors) have been governed since October 1, 1963 by a series of Scheme of Control Agreements entered into with the Hong Kong Government. The current Scheme of Control became effective on October 1, 1993 and is for a term of 15 years until September 30, 2008.
The Scheme of Control contains provisions covering the obligations of the parties to the Scheme of Control, the tariff setting mechanism, calculation of the permitted and net return of CLP Power Hong Kong and CAPCO and the procedures for government monitoring. Our sales of electricity to the Chinese mainland are governed by a separate contract with the Hong Kong Government.
In accordance with the Scheme of Control, we are obliged to contribute to the development of Hong Kong by providing sufficient facilities to meet the demand for electricity at the lowest reasonable cost. In return, we, CAPCO and any future companies formed by us, alone or together with ExxonMobil or others, these companies being collectively referred to as the SoC Companies, are entitled to receive tariff revenue sufficient for a reasonable return on our investments. Costs are forecast by means of a financial review process described below and the rate of return is determined by means of a formula established by the Scheme of Control. See “— Tariffs” below.
The Scheme of Control provides for government monitoring of the SoC Companies’ financial affairs and operating performance through financial reviews and auditing reviews as described below.
The Hong Kong Government reviews the SoC Companies’ major capital expenditure and tariff rates. A financial review is conducted whenever a major system expansion is proposed, the period of the existing review is about to expire, or when adjustments in excess of 14% of the previously approved tariff rates for that particular year are proposed.
The results of a financial review, including basic tariff rates, are subject to the approval of the Executive Council of Hong Kong. Once the financial review has been approved by the Executive Council of Hong Kong, the basic tariff rates cannot be unilaterally reduced by the Hong Kong Government. However, if a financial review is not completed prior to the expiry of the previous approved financial review, we and CAPCO may increase the basic tariff rates by up to 7% above the level approved by the previous financial review.
22
Subsequent to the approval of a financial review, we and CAPCO may increase the basic tariff rates by up to 7% above the level approved in the financial review for a particular year. A further increase of 7% is permitted with the approval of the Executive Council of Hong Kong without a further financial review. If we and CAPCO have requested an increase in basic tariff rates requiring governmental approval or if we and CAPCO have requested revisions to the current financial review and an agreement has not yet been reached with the Hong Kong Government concerning such increase or revisions, we and CAPCO still have the right to increase the approved basic tariff rates up to 7% on an interim basis. Our financial plan for the period 2005 to 2008 which outlined our projected capital investments and tariff rates is currently being reviewed by the Hong Kong Government. See “D. Property, Plants and Equipment — Capital Investment Programme” below. A tariff review is conducted in October of each year to agree on the implementation of tariff adjustments for the next year.
An auditing review is conducted jointly each year by the SoC Companies and the Hong Kong Government. The auditing review is to provide information to the Hong Kong Government in connection with its monitoring of the SoC Companies’ activities under the Scheme of Control. The auditing review contains an analysis of the prior-year actual results and current-year projections of sales, capital and operating expenditures and other financial and operating data.
An interim review is conducted every five years during the 15-year term of the current Scheme of Control. During an interim review, the Hong Kong Government and the SoC Companies can request modifications to the Scheme of Control, subject to mutual agreement. The second five-year interim review of the current Scheme of Control took place in 2003. Changes to the Scheme of Control made as a result of that interim review included lengthening of depreciation periods for certain assets, providing for depreciation of land, the introduction of an upper limit to the Development Fund (which is now set at 12.5% of annual total revenues from sales of electricity to Hong Kong customers) and enhancements to the disclosure of capital and operating expenditure. The other key terms of the Scheme of Control remain unchanged.
23
Tariffs
We design the net tariff we charge to cover CLP Power Hong Kong’s and other SoC Companies’ operating costs and permitted return. See “— Tariff Rates” below. The net tariff consists of three components: (i) the basic tariff rate, (ii) a fuel clause recovery rebate or charge, and (iii) the Scheme of Control rebate.
We calculate our annual projected basic tariff rates by taking into account the SoC Companies’ permitted return and the annual forecasts of (a), (b), (c) and (d) below, using the formula “(a+b-c)/d”:
| | (a) | operating costs, which include, among other things, the standard cost of fuel; generation, transmission, distribution and administration expenses; depreciation; interest expenses; and tax; |
| | (b) | allowed net return, referred to as net return in this annual report, which is derived by subtracting from the Scheme of Control permitted return, referred to as permitted return in this annual report (i) interest up to a maximum of 8% per annum on borrowings to finance fixed assets; (ii) a charge of 8% per annum on the average balance of the sums of the Development Fund and the special provision account; (iii) an excess capacity adjustment of 13.5% on the average excess capacity expenditure less an allowed interest charge of up to 8% per annum on the average excess capacity expenditure after the Black Point Power Station Units 7 and 8 are commissioned; and (iv) interest up to a maximum of 8% per annum on the increase in average balance of the customers’ deposits in excess of the balance as at September 30, 1998. The permitted return is the sum of 13.5% of the SoC Companies’ average net fixed assets and 1.5% on the average net fixed assets financed by shareholders’ investments and acquired after September 30, 1978; |
| | (c) | revenue from sales to the Chinese mainland less 20% of the incremental profit before tax (this 20% of incremental profit from the sales to the Chinese mainland is shared between CLP Power Hong Kong (40%) and CAPCO (60%)); and |
| | (d) | local (i.e. excluding the Chinese mainland) unit sales in terms of kWh as determined by the load forecast. |
Under the Scheme of Control, all of our expenses relating to power purchases from Guangdong Daya Bay Nuclear Power Station (See “— Non-CAPCO Power Purchases/Storage Facilities —Guangdong Daya Bay Nuclear Power Station” below) and all payments to Hong Kong Pumped Storage Development Company, Limited (See “— Non-CAPCO Power Purchases/Storage Facilities —Guangzhou Pumped Storage Power Station” below) are included in the operating costs described in (a) above.
24
| | (ii) | Fuel Clause Recovery Rebate or Charge |
The standard cost of fuel is recovered through the basic tariff rates as an operating cost. The fuel clause recovery rebate or charge represents the difference between the actual cost of fuel (including natural gas, coal and oil) and the standard cost recovered through the basic tariff rate. The difference is charged or credited to a fuel clause recovery account maintained in our books. No approval from the Hong Kong Government is required to recover increases in the cost of fuel.
| | (iii) | Scheme of Control Rebate |
Any difference between our profit for Scheme of Control operations and our permitted return is required to be transferred to or from the Development Fund. The balance in the Development Fund represents a liability in our accounts. In addition, in relation to the deferral in constructing Units 7 and 8 of the Black Point Power Station, we and the Hong Kong Government agreed in 1999 that we set aside a total of HK$803 million from the Development Fund to a special provision account to pay for the additional costs incurred by the vendors for delayed delivery of the two generator units. See “D. Property, Plants and Equipment — Capital Investment Programme” below. We pay a charge of 8% per annum on the sum of the average balances of the Development Fund and the special provision account. The charge paid by us is credited to a rate reduction reserve and is applied as rebates to customers in the electricity bills.
Net and Permitted Returns
The Scheme of Control allows CLP Power Hong Kong and CAPCO a permitted return and net return as described above. The net return is divided between CLP Power Hong Kong and CAPCO in accordance with the Basic Agreement which provides that CAPCO will receive that proportion of the total net return represented by the net return CAPCO would receive if CAPCO were the only company under the Scheme of Control and the net return were calculated solely on the basis of CAPCO’s accounts. If the actual profit under the Scheme of Control, together with the amount available for transfer from the Development Fund, is less than the permitted return, CAPCO will not bear more than 20% of any such deficit. We believe that such limitation will not have a material effect on our business or financial condition in the foreseeable future.
Rate-Making Procedures
The revenue requirements of the SoC Companies, which are theoretically equal to the cost of supply of electricity, are computed in a financial model based on load forecast, projected operating expenses and return to shareholders. The overall cost of electricity supply is allocated to each class of customer based on consumption profiles, which are determined by load research. We use the cost of service to each class of customer to determine the revenue required and the unit rate. We then propose basic tariff rates to the Hong Kong Government for approval in accordance with the provisions of the Scheme of Control.
25
Power Generation
We do not directly own any generating facilities. Our sources of power supply comprise: (i) CAPCO’s power stations located at Castle Peak and Penny’s Bay and the six commissioned units at Black Point with a total installed capacity of 6,283MW; (ii) 70% share (approximate 1,380MW) of the output from Guangdong Daya Bay Nuclear Power Station under a 20-year contract beginning in 1994; and (iii) our right to use 50% (600MW) of the capacity of Phase I of Guangzhou Pumped Storage Power Station for a period of 40 years commencing in 1994. All of our sources of power supply provide us with a total installed capacity of 8,263MW.
Although we do not directly own any power generating facilities, we operate and maintain CAPCO’s power stations. In addition, we directly and through Hong Kong Nuclear Investment Company Limited, a wholly owned subsidiary, have seconded a number of staff to Guangzhou Pumped Storage Power Station and Guangdong Daya Bay Nuclear Power Station respectively to operate and maintain their power stations.
We met all demands for power during the year ended December 31, 2004 without any shortages. The amount of electricity supplied to the system for the year ended December 31, 2004 was 32,975 GWh, an increase of 2.1% over the year ended December 31, 2003. As at December 31, 2004, our system and local reserve margins were approximately 5% and 31% respectively.
26
The table below sets forth for the years ended December 31, 2003 and 2004, the amount of electricity purchased by us, as generated by CAPCO and other generating facilities, and the amount of power used or lost in connection with transmission and distribution:
| | | | | | |
| | | Year ended December 31,
| |
| | | 2003 | | | 2004 | |
| | |
| |
| | | (GWh) | |
CAPCO facilities: | | | | | | |
Castle Peak | | 15,961 | | | 13,802 | |
Black Point | | 7,728 | | | 11,304 | |
Gas turbines | | 1 | | | 3 | |
| | |
|
| |
|
|
| | | 23,690 | | | 25,109 | |
Auxiliary use(1) | | (1,358 | ) | | (1,300 | ) |
| | |
|
| |
|
|
Net CAPCO production | | 22,332 | | | 23,809 | |
| | |
Other power purchased: | | | | | | |
Nuclear | | 10,069 | | | 9,318 | |
Net transfer from/(to) | | | | | | |
Hongkong Electric | | (1 | ) | | – | |
Landfill gas generation | | 1 | | | 1 | |
| | |
|
| |
|
|
Total other power purchase | | 10,069 | | | 9,319 | |
| | |
Pumped Storage operation: | | | | | | |
Energy transferred | | 328 | | | 519 | |
Energy consumed for pumping | | (429 | ) | | (672 | ) |
| | |
|
| |
|
|
Net (loss) in pumped storage operation | | (101 | ) | | (153 | ) |
| | |
Total net generation | | 32,300 | | | 32,975 | |
| | |
|
| |
|
|
Transmission and distribution losses(2) | | 1,257 | | | 1,256 | |
| | |
|
| |
|
|
Note:
| (1) | Auxiliary use represents electricity consumed by generating units in the course of generation. |
| (2) | Losses including non-revenue items such as CLP Power Hong Kong’s office use and staff electricity allowances. |
The table below sets forth for the years ended December 31, 2003 and 2004, total capacity, total CAPCO capacity and peak load for power generated for our sale.
| | | | |
| | | Year Ended December 31,
|
| | | 2003 | | 2004 |
| | |
|
| | | (MW) |
| | |
Total CAPCO and Non-CAPCO capacity | | 8,263 | | 8,263 |
Total CAPCO capacity | | 6,283 | | 6,283 |
Peak load: | | | | |
Local (Hong Kong) | | 5,874 | | 6,329 |
System (Total) | | 7,646 | | 7,862 |
27
Power Purchase from CAPCO
Under the Basic Agreement, we have agreed to purchase, and CAPCO has agreed to sell, the total power produced by CAPCO. For the year ended December 31, 2004, we purchased approximately 72% of our power from CAPCO. CAPCO presently has three commissioned power stations with a combined installed capacity of 6,283MW as at December 31, 2004.
To ensure the reliability and security of power supply, CAPCO’s power generation system comprises a mix of different types of generating units, including gas-fired combined cycle units, coal-fired steam generators and gas turbines. The power stations at Black Point and Castle Peak provided almost all of CAPCO’s electricity supply to us during the year ended December 31, 2004.
Smaller capacity gas turbines are used as supplementary facilities to meet demand at peak periods and for emergency back-up because of their quick-start capability. CAPCO’s gas turbines have achieved 100% starting reliability, which is a key indicator of gas turbine performance.
CAPCO leases the properties on which all of its generating facilities are located from the Hong Kong Government. See “D. Property, Plants and Equipment” below. We are responsible for the overall management and control of construction at the site and operation of all of CAPCO’s generating facilities.
Black Point Power Station
Black Point Power Station commenced commercial operation in 1996 (Units 1 and 2) and is located at the western tip of the New Territories, approximately four kilometers north of the Castle Peak Power Station. It currently consists of six combined cycle units with a total capacity of 1,875MW. The commissioning of Units 7 and 8 is expected to occur in 2005 and 2006, respectively. See “D. Property, Plants and Equipment — Capital Investment Programme” below. Black Point Power Station, when completed, will be one of the largest combined cycle power plants in the world with an expected total capacity of 2,500MW.
Black Point Power Station is the first natural gas-fired plant in Hong Kong. The use of natural gas, a clean burning fuel which leaves no ash and emits negligible sulphur dioxide, allows the power station to operate with lower environmental impact and higher thermal efficiency. The current supply of natural gas comes from the Yacheng 13-1 field in the South China Sea. In view of the lengthy lead-time required for new gas projects and the possibility of increased promotion of gas-fired generation over time due to environmental considerations, we have commenced long-term planning of future arrangements for natural gas supply from other sources. As other South China gas reserves appear insufficient to supplement or replace Yacheng, the import of LNG through a Hong Kong LNG terminal is considered to be the most appropriate means for long-term supply. Terminal feasibility studies are underway with first deliveries targeted by 2011. This year, the project will enter Hong Kong’s statutory environmental impact assessment process.
28
Castle Peak Power Station
Castle Peak Power Station is one of the largest coal-fired power station complexes in the world, comprising eight coal-fired generating units with a total capacity of 4,108MW. Its first phase commenced operations in 1982. Its second phase, with four 677MW units, was completed in 1990. In April 1997, we and CAPCO agreed with the Hong Kong Government to decommission the gas turbines previously in operation at Tsing Yi and Castle Peak Power Stations and put such gas turbines into preservation. Castle Peak Power Station burns coal as its primary energy source, resulting in significantly lower electricity prices than burning oil. The coal-fired generating units achieved an overall availability of 87.81% for the year ended December 31, 2004, with a forced outage rate of 0.75%. We believe this rate corresponds to the highest world standards and reflects the high quality of the plant and its operation. The design of the Castle Peak Power Station also enables it to burn oil or natural gas as back-up fuel, should this be required.
The Castle Peak Power Station has achieved consistently high levels of compliance with air quality control standards. An energy saving programme has been in operation in each of the Black Point and Castle Peak Power Stations since 2000 to explore opportunities for auxiliary power reduction and resources conservation. As a consequence, energy savings of about 2.5% have been achieved as compared with the levels at the base year 1999.
Penny’s Bay Gas Turbine Power Station
The three 100MW gas turbines at Penny’s Bay Gas Turbine Power Station are utilized for peak load and emergency generation purposes. Total output by such units during the year ended December 31, 2004 was minimal.
Fuel
For the majority of the 1980’s, coal was our primary energy source. After the commissioning of the six natural gas-fired generating units at Black Point Power Station and the purchases from Guangdong Daya Bay Nuclear Power Station, we now operate with a diversified fuel mix of gas, coal and nuclear. Oil has been phased out as a fuel for base and intermediate power generation and is now used only for peak and standby generation. We believe diversification of energy sources will provide greater long-term security for customers and is beneficial to Hong Kong’s environment. For the year ended December 31, 2004, the fuel mix consisted of the following: natural gas (27%), coal (41%) and nuclear (32%). Our fuel costs are recovered through the basic tariff rates and the fuel clause recovery rebate or charge. See “— Scheme of Control — Tariffs” above.
Natural Gas
CAPCO purchases gas for the Black Point Power Station on a take-or-pay (if tendered) basis pursuant to a 20-year contract with BP China Exploration and Production Company (formerly Arco China Inc.), China National Offshore Oil Corporation (which transferred its interest to CNOOC China Limited (formerly known as Offshore Oil Limited) in 1999) and Kufpec (China) Inc. which commenced in January 1996. The base price under the contract was established when the contract was signed in December 1992. Changes in the contract price are determined annually by reference to certain market and economic indices.
29
Coal
For the year ended December 31, 2004, total coal consumption for the eight generating units of Castle Peak Power Station was approximately 5.9 million tones. Approximately 57% of CAPCO’s coal requirements are imported under long-term contracts from Indonesia. Prices are generally negotiated in line with market factors.
Nuclear
See “— Non-CAPCO Power Purchases/Storage Facilities — Guangdong Daya Bay Nuclear Power Station” below.
Non-CAPCO Power Purchases/Storage Facilities
Guangdong Daya Bay Nuclear Power Station
In addition to purchasing power from CAPCO, for the year ended December 31, 2004, we purchased approximately 9,318 GWh of power from Guangdong Daya Bay Nuclear Power Station located in Guangdong Province of the Chinese mainland, pursuant to power purchase agreements covering 70% of the output of Guangdong Daya Bay Nuclear Power Station. The agreements extend for 20 years from 1994 and contain a provision which permits us to continue to purchase 25% of the power generated by Guangdong Daya Bay Nuclear Power Station for an additional five years. Our wholly owned subsidiary, Hong Kong Nuclear Investment Company Limited, or HKNIC, owns a 25% equity interest in Guangdong Nuclear Power Joint Venture Company, Limited which owns Guangdong Daya Bay Nuclear Power Station. The other 75% equity interest is owned by Guangdong Nuclear Investment Company, Limited, a Chinese mainland enterprise. Guangdong Daya Bay Nuclear Power Station is one of the largest joint venture power projects in the Chinese mainland.
We are obliged to purchase HKNIC’s 25% equity share of Guangdong Daya Bay Nuclear Power Station’s total output and an additional 45% of such output from Guangdong Nuclear Investment Company, Limited. The price paid by us for electricity generated by Guangdong Daya Bay Nuclear Power Station throughout the terms of the power purchase agreements is determined by a formula based on Guangdong Daya Bay Nuclear Power Station’s operating costs and a profit calculated by reference to shareholders’ funds and the capacity factor for the year. We are allowed to treat all our payments for nuclear electricity generated by Guangdong Daya Bay Nuclear Power Station as part of our operating expenses permitted under the Scheme of Control. See “— Scheme of Control — Tariffs” above.
The design, construction, operation and maintenance of nuclear power plants involve significant safety measures because of the hazardous nature of radioactive materials. The use and disposal of nuclear fuels have the potential, albeit very low, to create substantial risks of liability arising from exposure to or release of radioactive materials. We believe that Guangdong Daya Bay Nuclear Power Station complies in all material respects with international safety standards. We also consider that HKNIC’s minority ownership interest and minor participation in Guangdong Daya Bay Nuclear Power Station limits its exposure to nuclear-related liabilities to the amount of its initial US$100 million investment and its share of undistributed retained profits in Guangdong Nuclear Power Joint Venture Company, Limited.
30
Guangdong Nuclear Investment Company, Limited, together with its parent company, also own Ling Ao Nuclear Power Station which was commissioned in 2002. Neither we, HKNIC nor CLP Power Hong Kong has any direct or indirect interest in Ling Ao Nuclear Power Station. The Ling Ao Nuclear Power Station is similar in design and situated very close to the Guangdong Daya Bay Nuclear Power Station. Guangdong Nuclear Power Joint Venture Company, Limited and Ling Ao Nuclear Power Company, Limited, as the direct owners of the Guangdong Daya Bay Nuclear Power Station and the Ling Ao Nuclear Power Station, respectively, have established a management company, Daya Bay Nuclear Power Operations and Management Company, Limited, or DNMC. DNMC is owned on a 50/50 basis and is responsible for the operation and maintenance of the two power stations.
The operating staff of the two nuclear power stations now perform their duties as employees of DNMC. The benefits of establishing DNMC include a pooling of resources, sharing of expertise and benefits of economy of scale. The documents for the establishment of DNMC are structured so as to ensure that neither Guangdong Nuclear Power Joint Venture Company, Limited nor HKNIC take on any additional risk or liability as a result of the establishment of DNMC or the operation of the Ling Ao Nuclear Power Station.
Guangzhou Pumped Storage Power Station
Hong Kong Pumped Storage Development Company, Limited, a joint venture company formed between CLP Power Hong Kong (49%) and ExxonMobil (51%), has the right to use 50% of the capacity of Phase 1 of the Guangzhou Pumped Storage Power Station for 40 years from 1994 pursuant to a capacity purchase contract. The Guangzhou Pumped Storage Power Station, owned by Guangdong Pumped Storage Company, Limited (formerly known as Guangzhou Pumped Storage Joint Venture Corporation), which in turn is owned by three Chinese government-owned entities, is located in Lu-Tien, Conghua County, which is about 90km north of Guangzhou. We are allowed to treat all payments to Hong Kong Pumped Storage Development Company, Limited for the pumped storage services provided as part of our operating expenses under the Scheme of Control. See “— Scheme of Control — Tariffs” above.
As electricity cannot be stored in large quantities, Guangzhou Pumped Storage Power Station indirectly stores electricity by way of pumping water to a high-level reservoir during periods of low demand such as at night. The water can then be released generating hydro-electric power at times of peak demand. Some energy is lost in this process, but the loss is more than offset by the savings from the reduction in use of high production cost plants during the day and the efficiency gains of running plants at a constant output level.
Interconnection with Hongkong Electric and Guangdong Grid
The interconnection of our systems with those of Hongkong Electric (the only other electricity supplier in Hong Kong) to the south and Guangdong Province to the north allows us to access other generating capacities to further enhance the reliability of our own supply system. See “— Power Systems — Security and Reliability” below. The interconnection with Guangdong Province allows us to sell our excess capacity to customers in the Chinese mainland. See “— Sales to the Chinese Mainland” below. We have an interconnection agreement with Hongkong Electric under which the two companies sell each other electricity to meet marginal demand when doing so is more economical than utilizing other sources. For the year ended December 31, 2004 about 430 MWh of power was sold to Hongkong Electric.
31
Power Systems
The Network
We transmit electricity to load centers through an advanced transmission network owned and operated by us. As at December 31, 2004, our transmission and distribution network comprised 11,955 kilometers of high voltage circuits, 202 primary substations and 12,215 secondary substations. Our system is interconnected with the transmission system of Hongkong Electric and the power system of neighboring Guangdong Province of the Chinese mainland.
Electricity generated from the steam turbine units at Castle Peak Power Station, the combined cycle units at Black Point Power Station, the nuclear units at Guangdong Daya Bay Nuclear Power Station and the pumped storage units at Guangzhou Pumped Storage Power Station is transmitted to the load centers via our 400kV transmission network. The 400kV network consists of two double-circuit 400kV transmission lines arranged in a ring encircling the New Territories together with cross-connection, and six 400kV underground cable circuits reaching into the densely populated Kowloon Peninsula. Continuity of supply is safeguarded even if one double-circuit power line is lost.
We continue to expand our distribution network to supply new customers, the number of whom increased by 42,573 during the year ended December 31, 2004, and to reinforce and upgrade supply to our 2.2 million existing customers. We are making additional investments to expand and reinforce our transmission network in order to maintain our high reliability standards as well as to accommodate the increasing demand for electricity especially in new development areas. In 2004, we invested HK$5 billion in our transmission and distribution network. Our financial plan for the period from 2005 to 2008 is currently under review by the Hong Kong Government.
Security and Reliability
To assure a high level of supply reliability to our customers, our network is carefully designed and built to allow for any probable failures of our equipment. The overall supply reliability for our transmission and distribution system was above 99.99% for the year ended December 31, 2004. The interconnection of our system with those of Hongkong Electric to the south and Guangdong Province to the north allows us to access other generating capacities to further improve the reliability of our own supply system. In case of a sudden loss of generation, the interconnectors allow emergency power transfers from Hongkong Electric and Guangdong systems, enabling us to avoid disruption of supply to our customers.
Customers and Sales
As at December 31, 2004, we were supplying electricity to 2,160,075 customers, an increase of 2.0% over December 31, 2003. For the year ended December 31, 2004, total sales increased by 2.2% to 31,719 GWh, and comprised 28,632 GWh sold to Hong Kong customers and 3,087 GWh sold to customers in the Chinese mainland. There was a rise of 2.1% in unit sales to local customers in 2004. Sales to the Chinese mainland, which consist of sales to Guangdong Guang-Dian Power Grid Group Company Limited and the Shekou Industrial Zone under short-term and long-term supply contracts, increased by 2.6% over 2003.
32
The table below sets forth our sales categorized by end user sector:
| | | | | | | | | | | | | |
End-user
| | Number of
Customers
as at
December
31, 2004
| | Annual
Sales for
2002
| | Annual
Sales for
2003
| | Annual
Sales for
2004
| | Percentage
of our total
electricity
sales for
2004
| | Average Annual
Sales
Change
over 2000 –
2004
| |
| | | (thousands) | | (GWh) | | (GWh) | | (GWh) | | (%) | | (%) | |
| | | | | | |
Residential | | 1,869 | | 6,930 | | 7,180 | | 7,149 | | 22.5 | | 2.1 | |
Commercial | | 180 | | 10,661 | | 10,698 | | 11,086 | | 35.0 | | 3.1 | |
Infrastructure and Public Services | | 75 | | 7,036 | | 7,301 | | 7,564 | | 23.9 | | 5.5 | |
Manufacturing | | 36 | | 3,085 | | 2,856 | | 2,833 | | 8.9 | | (3.7 | ) |
| | |
| |
| |
| |
| |
| | | |
Total Local Sales | | 2,160 | | 27,712 | | 28,035 | | 28,632 | | 90.3 | | 2.6 | |
Export Sales | | – | | 2,175 | | 3,008 | | 3,087 | | 9.7 | | 37.3 | |
| | |
| |
| |
| |
| |
| | | |
Total Sales | | 2,160 | | 29,887 | | 31,043 | | 31,719 | | 100.0 | | 4.2 | |
| | |
| |
| |
| |
| |
| | | |
Hong Kong Customer Base
Electricity demand varies within each year for a variety of reasons other than general growth in demand. Electricity demand tends to be highest during daylight hours due to commercial and industrial activities and electric appliance use during such periods. Due to air conditioner use, electricity demand is higher during summer than during other seasons. Variations in weather conditions may also cause significant variations in electricity demand.
Residential
As at December 31, 2004, we served approximately 1.87 million residential customers in our supply area. For 2004, residential customers accounted for approximately 22% of our total sales. As the Hong Kong Government has forecast that the population of the Hong Kong Special Administrative Region will grow to 7.4 million by 2013, it is estimated that around 40,000 new flats a year up to the year 2008 may be built to help accommodate this forecast increase in population. Around 90% of those new flats are expected to be built in our supply area which we expect would increase the demand for electricity in this customer sector.
Commercial
Commercial customers accounted for approximately 35% of our total sales in 2004. We anticipate that growth in sales in this sector will continue in the medium term, as supported by the boost in the local tourist industry attributed to the Individual Visit Scheme, and the scheduled opening and initial operation of Disney Theme Park expected in late 2005.
33
Infrastructure and Public Services
The other categories of Hong Kong customers include government accounts and utilities, such as Hong Kong Housing Authority, Water Supplies Department, Mass Transit Railway Corporation, Kowloon-Canton Railway Corporation, and Hong Kong’s telecommunications companies and container terminals. These categories together accounted for approximately 24% of total sales for 2004.
Manufacturing
Sales to the manufacturing sector have gradually declined as a percentage of total demand, and represented approximately 9% of total sales for 2004. While the demand in this sector has become steady, we believe that electricity sales to the manufacturing sector as a percentage of total sales in general will continue to decline due to Hong Kong’s transformation into a services-oriented economy.
Sales to the Chinese Mainland
In addition to sales to customers in Hong Kong, we sold approximately 10% of our electricity in 2004 to customers in Guangdong Province of the Chinese mainland. We sell electricity to the Chinese mainland through an exclusive agreement between CLP Power Hong Kong and China Merchants Steam Navigation Company covering the Shekou Industrial Zone. This agreement was renewed in 1996 for a term of 20 years. Sales to the Chinese mainland have also been made pursuant to short-term agreements between CLP Power Hong Kong and Guangdong Guang-Dian Power Grid Group Company Limited since May 2000.
We and CAPCO have entered into an agreement to govern the supply of electricity by CAPCO to us for sale to the Chinese mainland. Such sales are made to utilize CAPCO’s spare generating capacity. Pursuant to the Scheme of Control and another agreement among CLP Power Hong Kong, CAPCO and the Hong Kong Government, 20% of the profit derived from our sales to the Chinese mainland is credited to the profit of CAPCO and CLP Power Hong Kong in the ratio of 60% and 40% respectively. See “— Relationship with CAPCO - Sales to the Chinese Mainland” above. The remaining 80% of the profit derived from sales to the Chinese mainland is credited to the Development Fund.
Customer Service
We are committed to provide quality service and value to our customers. The needs and expectations of our customers, as the major drivers of customer service, are identified through various channels including our call centre, customer service centers, customer focus groups, customer consultative groups and local advisory committees. For our major commercial and industrial customers, we provide a one-stop service and technical services which include energy audits, technical seminars and safety workshops.
In 2004, we continued to improve the service to our customers, through system enhancements in our call centre and customer service processes and the introduction of credit card autopay service. 2004 was also the first full-year operation of the new Customer Care and Marketing System which supports the entire end-to-end service operations for customers, ranging from supply applications, meter reading and billing through to payment follow-up.
34
Tariff Rates
We normally implement changes in basic tariff rates, the fuel clause rebate or charge and the Scheme of Control rebate on January 1 of each year. The table below sets out our average net tariffs in Hong Kong for the years ended December 31, 2002, 2003 and 2004:
| | | | | | |
| | | Year ended December 31, 2002
| | Year ended December 31, 2003
| | Year ended December 31, 2004
|
| | | (HK¢ per kWh average) |
Basic Tariff | | 88.5 | | 88.4 | | 88.1 |
Fuel Clause Charge/(Rebate) | | 1.9 | | 1.9 | | (0.3) |
Scheme of Control Rebate | | (0.6) | | (0.6) | | (0.6) |
Special Rebate | | (2.2) | | (2.2) | | – |
Net Tariff | | 87.6 | | 87.5 | | 87.2 |
Published basic tariff rates did not change over the years ended December 31, 2002, 2003 and 2004 and the change in the basic tariff reported above was due to changes in consumption patterns. For 2005, we have announced a further freeze in basic tariffs, thus the basic tariff rates will effectively remain at 1998 levels.
35
Competition
We and Hongkong Electric are currently Hong Kong’s only suppliers of electricity. Our and their supply areas are divided geographically: we supply Kowloon, the New Territories, Lantau Island, Cheung Chau and some outlying islands, and Hongkong Electric supplies Hong Kong Island, Lamma Island and Ap Lei Chau Island. The number of customers for us and Hongkong Electric is approximately 2.2 million and 0.5 million respectively as at December 31, 2004. We and Hongkong Electric share the sales of electricity to Mass Transit Railway Corporation, which operates in both companies’ supply areas. Hongkong Electric’s electricity-related operations are also governed by a scheme of control. The two schemes of control are similar and do not give either we or Hongkong Electric the exclusive right to supply electricity in our respective supply areas. Recently, some companies have expressed interest in electricity generation and electricity supply business in Hong Kong, but they have not disclosed any detailed plan to the public at the moment. Some of them own power stations in the Chinese mainland. Nevertheless, we believe that we have a significant competitive advantage in Kowloon and the New Territories by virtue of our extensive transmission and distribution network.
The Hong Kong Government may, however, consider adopting alternative regulatory structures for the power industry in Hong Kong in the longer term. In November 1999, the Hong Kong Government published the findings of a consultancy study into the potential for increasing interconnection capacity between the two electricity systems in Hong Kong as well as the possibility of introducing competition amongst suppliers of electricity. On the subject of alternative market structures, those consultants concluded that no major reforms were advisable until 2009 at the earliest. They also acknowledged that much would depend on whether the power industry in Southern China has been sufficiently restructured to enable power producers located on the Chinese mainland to participate in some form of power pooling arrangements.
Subsequent to the consultancy study, the Hong Kong Government appointed another consultant to evaluate and establish a feasible route, if any, to install new additional interconnectors between us and Hongkong Electric. The main findings of the technical feasibility study were published in 2003. The technical study concluded that increasing the existing interconnection between Kowloon and Hong Kong Island is technically feasible. However, there are important and complicated issues which are beyond the technical considerations to be addressed. These include legal, business, investment, financial, liability and regulatory issues.
On January 31, 2005, the Hong Kong Government launched the Stage 1 public consultation on post-2008 electricity market arrangements. The Consultation Paper on Future Development of the Electricity Market in Hong Kong considers three key issues resulting from the initial phase of the review (1) how the existing regime might be improved and what new features might be introduced, (2) whether the future regulatory arrangement should be based on bilateral arrangements or a regulatory framework backed by legislation and (3) whether the Hong Kong Government to regulate the power sector or an independent regulatory authority established. Given the Consultation Paper constitutes the earliest stage of the public consultation process and is intended to initiate public debate, it discusses the relative benefits and disadvantages of a wide range of possible options for development of the future regulatory regime in Hong Kong. These options broadly fall into two approaches, (a) a modified Scheme of Control Agreement type regime and (b) a regime with new features.
36
The possible modifications to the Scheme of Control discussed, include (i) using either assets or equity as the rate base, (ii) adjusting returns to be in line with returns in comparable alternative investments or linking the rate of return to the cost of raising capital, (iii) providing performance incentives, and/or (iv) changing the tariff setting mechanism or increasing transparency in the tariff setting process.
The options discussed with regards to a regime with new features, include (i) increased interconnection between us and Hongkong Electric, with a view to providing customers with a choice of either supplier, enhancing system efficiency and/or optimizing the overall system’s planned and available resources, (ii) new supply sources from the Chinese mainland or alternative power sources, and (iii) grid access for third party users (voluntary or mandatory).
The Stage 1 public consultation ended on April 30, 2005. The Hong Kong Government will take into consideration views collected during the Stage 1 consultation to map out the broad framework for development of the post-2008 electricity market and enter into Stage 2 of the public consultation later this year. No date has yet been fixed for final determination of post-2008 arrangements.
Currently, our principal form of competition is from alternative power and heating sources. In the residential market, piped or cylinder gas are widely adopted for water heating and cooking. We have been making inroads into the traditional cooking market, which is currently dominated by gas, with a variety of high performance electrical products. Though practical substitutes for electricity in lighting and other traditional household appliances are rare, we are prepared for more intense competitions in domestic gas clothes drying and space heating applications.
In the commercial market, electricity is the dominant energy source for lighting, office equipment and air conditioning. Due to stringent environmental pollution regulations, we expect some existing diesel oil applications will be gradually phased out, which provides good opportunities for their replacement by electricity or gas. Also, efficient electric cooking appliances for the commercial sector are now available as an alternative to a market previously dominated by gas. In the industrial market, currently there is no practical substitute for electricity in a number of applications including lighting and power for many types of industrial machinery and processes.
37
Electricity Business in the Chinese Mainland
Investments in the Chinese Mainland
We were one of the first power companies from outside the Chinese mainland to invest in the electricity industry in the Chinese mainland and are currently one of the largest external investors in the Chinese mainland electricity industry. Our successful track record of developing projects in the Chinese mainland started in 1985 with our investment in Guangdong Nuclear Power Joint Venture Company, Limited. We currently own 3,163 equity MW generating capacity in the Chinese mainland, of which 3,156 equity MW are operational and 7 equity MW are under construction.
Our focus in the Chinese mainland is to build up a competitive presence in provincial and regional electricity markets, particularly (i) the South China Region, including Guangdong and Guangxi Provinces and investments in the western provinces for eastward supply to Guangdong; (ii) the North China area, including Beijing-Tianjin area and Shandong Province where we have already established a strong presence; and (iii) renewable energy, including hydropower and wind farms. In pursuit of this goal, we plan to continue to work with reputable Chinese mainland parties to pursue opportunities.
We have successfully developed a number of generation projects in the Chinese mainland and have actively participated in the management of our joint venture companies, including secondment of a number of staff to hold key managerial positions, in order to add value to the joint ventures, deliver satisfactory returns on the investments and meet safety, health and environmental objectives. During 2004, we have secured a 2x600MW coal-fired greenfield project at Fangchenggang in Guangxi Province, in which we will hold a 70% interest. This project was approved by the National Development and Reform Commission of China in March 2005. Establishment of Enterprises with Foreign Investment in the Chinese mainland was also approved by the Ministry of Commerce in May 2005. The joint venture company, CLP Guangxi Fangchenggang Power Company Limited, was then formed. This project is amongst the first lot of 24 projects approved by the National Development and Reform Commission in early 2005.
As part of our continuous commitment to protecting the environment and developing renewable energy projects, we have also established a joint venture with Huaneng New Energy Industrial Co. Ltd. to develop a 27MW wind farm in Changdao, Shandong Province. We have a 45% stake in the joint venture and the joint venture will continue to source and secure wind power projects. Our continued leadership in the power sector in the Chinese mainland reinforced our reputation for excellence in project management and efficient station operation through active participation in the safe and reliable performance of the operating power station in which we hold an interest.
Guangdong Nuclear Power Joint Venture Company, Limited
Guangdong Nuclear Power Joint Venture Company, Limited is 25% owned by us and 75% owned by Guangdong Nuclear Investment Company, Limited. It was established in 1985 to construct and operate Guangdong Daya Bay Nuclear Power Station in Guangdong Province. The power station is the first large-scale commercial nuclear power installation on the Chinese mainland.
38
Guangdong Daya Bay Nuclear Power Station is equipped with two 984MW pressurized water reactors. The majority of the key equipment was imported from France and the United Kingdom. Unit 1 and Unit 2 commenced commercial operation in February and May 1994 respectively. The station continues to operate safely and reliably and has received ISO14001 accreditation. It is also the first power station to attain ISO14001 accreditation in the electric power industry in China.
A total of 13,311GWh of electricity was sent out by Guangdong Daya Bay Nuclear Power Station in 2004, as compared to 14,384GWh in 2003, a decrease of 7%, mainly due to an incident occurring during Unit 2’s scheduled outage in May, which led to the outage being extended by about 2 months. The incident resulted in a bent fuel assembly, which had no safety or environmental impact. Unit 2 returned to service towards the end of July. The annual station capacity factor was 80%. 70% of the electricity generated is supplied to Hong Kong with the remaining 30% sold to Guangdong. See “— Electricity Business in Hong Kong — Non-CAPCO Power Purchases/Storage Facilities” above.
Hong Kong Pumped Storage Development Company, Limited
Hong Kong Pumped Storage Development Company, Limited is 49% owned by us and 51% owned by ExxonMobil and has the right to use 50% of the 1,200MW pumped storage capacity of Phase 1 of the Guangzhou Pumped Storage Power Station until 2034. In 2004, the pumped storage units at Conghua, Guangzhou generated 493GWh for us with an overall efficiency above 76.5%, slightly better than 2003. There were over 2,265 unit starts during the year to fulfill our system requirements, mainly during peak lopping and back up operations. See “— Electricity Business in Hong Kong — Non-CAPCO Power Purchases/Storage Facilities” above.
Shandong Zhonghua Power Company Limited
We own a 29.4% equity interest in Shandong Zhonghua Power Company Limited (“SZPC”), with the remaining interest owned by Shandong Electric Power Company (36.6%), Shandong International Trust and Investment Corporation (14.4%) and Electricite de France International S.A. (19.6%).
SZPC was formed in 1997 to develop, own and operate four coal-fired power stations with a total generating capacity of 3,000MW in Shandong Province, comprising two operating power stations, Shiheng I (2x300MW) and Shiheng II (2x300MW), and two new power stations, Liaocheng (2x600MW) and Heze II (2x300MW).
SZPC signed an Operation and Off-take Contract (“OOC”) with Shandong Electric Power Corporation (“SEPC”) who undertake to purchase all electricity generated from the power stations. In addition, the operation and maintenance and fuel supply of the plants are contracted to SEPC. The construction was also contracted to SZPC through a consortium formed by the four project sponsors.
39
Shiheng Power Stations (Phases 1 and 2) were awarded “International First Class Power Station” by the State Power Corporation of China in 2002, one of the only two power stations in China to win such an award. The stations have also achieved ISO14001, ISO9001 and OHSAS18000 accreditation. As part of their water resources conservation programme, the stations have completed a waste water-recycling scheme, which significantly reduces discharges while improving the station economics.
As for the new stations, construction works have been completed, meeting the quality requirements, within budget and ahead of schedule. Unit 1 and Unit 2 of Heze II commenced commercial operation in 2003 and Liaocheng Unit 1 and Unit 2 commenced commercial operation in early and mid 2004 respectively. Unlike Shiheng Power Stations where the major equipment was locally manufactured, the new units in Heze and Liaocheng use imported boilers capable of using low volatile anthracite coal mainly from Shanxi province. Competitive tariffs have also been approved by the Price Bureau for the new stations.
Electricity output from the operating power stations is sold to the Shandong power grid and amounted to 12,327 GWh in 2004 (2003: 7,991 GWh), which was slightly higher than the annual electricity generation quantity stipulated in the OOC. The increase in 2004 electricity sales over that of 2003 was mainly due to the commencement of commercial operation of the Liaocheng units in 2004.
Like other power projects in the mainland, SZPC was affected by the surging coal prices and shortage of supply in 2004, even though it was still able to generate slightly higher than the quantity stipulated in the power purchase agreement. We expect the difficult situation will continue into 2005 and we will work closely with our partners and the fuel supplier to mitigate the risks as far as is practicable.
Huaiji Hydroelectric Power Project
We own a 41.5% equity interest in the Huaiji hydroelectric power joint ventures which were formed in 1997 and 1998, respectively, with the remaining 8.5% owned by Sun Hung Kai China Development Fund Limited and 50.0% owned by Huaiji County Huilian Hydro-electric (Group) Co. Limited. This project is located in Huaiji County in northwestern Guangdong Province and involves building, owning and operating nine small-scale hydro power stations with a total installed capacity of 98MW. They are cascading hydropower stations installed along two river streams. Eight of the power stations are operational and one is under construction. The power is sold to the power grids of Huaiji County and Guangdong Province.
Generation from this group of small hydro-electric plants was severely affected by abnormally low rainfall, with the output reduced from 246GWh in 2003 to 205GWh in 2004. Plant performance itself was generally satisfactory.
The collection of electricity charges from the offtaker remains to be a challenge, though it shows sign of improvement. The project is technically and environmentally sound and we are actively pursuing a project restructuring to increase our shareholding and management control and to place the project on a sustainable economic footing.
40
CLP Guohua Power Company Limited
CLP Guohua Power Company Limited, or CLP Guohua, was established in January 2001 as an evergreen joint stock company and is 49% owned by us and 51% owned by Beijing Guohua Electric Power Corporation (Beijing Guohua), a wholly owned subsidiary of the Shenhua Group. CLP Guohua holds interests in three coal-fired power stations, namely Beijing Yire Power Station in Beijing, Panshan Power Station in Tianjin and Sanhe Power Station in Hebei, with a combined generating capacity of 2,100MW in the Beijing-Tianjin-Tangshan area, of which it owns 1,285 equity MW. This project extends our geographical presence into the North China market.
Beijing Yire Power Station is wholly owned by CLP Guohua. It has two 200MW coal-fired units located in Chaoyang District to the east of Tiananmen, Beijing. The station commenced operation in 1999 and supplies heat as well as electricity to Beijing city. In view of its proximity to the heart of Beijing, efforts have been made, since its operation, to continuously enhance environmental protection to minimize the impact on the environment in Beijing. Both units of the station are equipped with flue gas desulfurization facilities.
Sanhe Power Station is owned by three parties with CLP Guohua holding a majority interest of 55%. It has two 350MW coal-fired units located in the Yanjiao Economic and Technology Development Zone of Hebei at the junction of Beijing and Tianjin. It began operation in 2000 and has been operating with high availability and reliability.
Similar to Sanhe, Panshan Power Station is owned by three parties with CLP Guohua holding an interest of 50%. It has two 500MW coal-fired units and began operation in 1996. It forms part of an economic cooperation scheme between China and the former Soviet Union which supplied the major equipment, including the turbines and boilers.
The three power stations have already been rated under South Africa’s National Occupational Safety Association, or NOSA, 5 Star Safety Management System, with Panshan and Sanhe Power stations both achieving five stars, and Beijing Yire Power Station four stars. All power stations are committed to continuous environmental improvement and have obtained full accreditation to ISO14001. As part of their water resources conservation programme, both Beijing Yire and Panshan Power Stations have separately completed a waste water-recycling scheme which significantly reduces discharges as well as improves the station economics. Beijing Yire has also embarked on a NOx reduction program aimed at meeting the stringent NOx emission requirement imposed by the Beijing authorities. Panshan Power Station has also received the China’s National First Class Power Station Award.
All three stations sell their power to the North China power grid. The total electricity sold by the three power stations in 2004 was 12,666 GWh (2003: 11,565 GWh). Heat sales totaled 9.5 million gigajoules (2003: 8.9 million GJ). Regular tariffs have been approved and implemented in all three power stations.
Unlike most of the power stations in the Chinese mainland which were hit by the tight coal supply situation in 2004, all the three stations have been able to secure long term supply of coal from Shenhua Group, which is the largest coal producer in the PRC and the parent company of our partner, Beijing Guohua. We will continue to work closely with Beijing Guohua and Shenhua Group to ensure adequate coal supply to the three stations.
41
CLP Guohua Shenmu Power Company Limited
We acquired a 49% equity interest in CLP Guohua Shenmu Power Company Limited in November 2001, with the remaining 51% equity interest owned by Beijing Guohua. The joint venture owns and operates a coal-fired power station, namely Shenmu II Power Station, with a generating capacity of 200MW in Shaanxi Province. The power station is located in northern Shaanxi, adjacent to Inner Mongolia and is a mine-mouth power station supplying electricity to the Shaanxi power grid. It entered into commercial operation in 2000.
Shenmu II Power Station has been rated four stars under the NOSA 5 Star Safety Management System in 2004. In late 2002, the station obtained ISO14001 accreditation.
The station achieved high availability of 96% in 2004. Sales of electricity in 2004 were 1,524 GWh (2003: 1,419 GWh) with a capacity factor over 95%.
Guizhou CLP Power Company Limited
Guizhou CLP Power Company Limited, or Guizhou CLP Power, was established in 2002 with a term of 30 years to build and operate a coal-fired power station, Anshun II Power Station, with a generating capacity of 2x300MW in Guizhou Province. We are the majority owner with 70% equity interest, the other two shareholders are China Huadian Corporation (18%) (formerly owned by Guizhou Electric Power Corporation) and Guizhou Development and Investment Corporation (12%) (formerly known as Guizhou Infrastructure Investment Company). The power station supports the increasing electricity demand in Guizhou and the provincial government’s obligation to deliver electricity to Guangdong under the West-to-East Electricity Supply scheme. This is the first power project in the Chinese mainland in which we hold a majority share. Under the joint venture agreement, the company is a jointly controlled entity that none of the partners has unilateral control over the economic activity of Guizhou CLP Power.
Unit 1 and 2 of Anshun II Power Station started commercial operation in March 2004 and November 2004, respectively. Both units are fitted with flue gas desulfurization systems and the construction was undertaken by Guizhou Electric Power Corporation through an equipment purchase contract.
As the power station is the expansion phase of Anshun I (also 2x300MW) and was developed as an integral part of the whole Anshun power station, all 4 units of Anshun Power Stations I and II are operated as one power station. The operation and maintenance of Anshun II is contracted to Anshun I Power Station. To enhance control and ensure shareholders’ rights and interests are duly protected, Guizhou CLP Power assigned senior staff to the station to monitor the daily operation of Anshun II.
The new tariff for the power station was approved in July 2004 and sale of electricity was 3,086 GWh in 2004 (2003: 618 GWh).
42
Changdao Wind Power Company Limited
As part of our commitment to develop renewable energy projects, in December 2004 we established HNEEP-CLP Changdao Wind Power Company Limited, in which we own 45%, with our partner, Huaneng New Energy Industrial Co. Ltd., to own and operate a 27MW wind farm in Changdao, Shandong. The wind farm will be commissioned in 2005.
Competitive Environment and Regulatory Issues
The economy and the electricity market in the Chinese mainland continued to grow strongly during 2004. Electricity demand increased by 14.8% in 2004, 24 provinces/municipalities experienced supply shortages totaling some 30,000MW and demand growth is expected to continue in the coming years.
In response to the acute shortage situation, a number of new power projects are being constructed, including some which are not yet approved by the State Authorities. In order to control the situation, the State Council is reviewing the unauthorized projects and it is expected that some of these projects will be delayed and even stopped. Supply and demand balance is expected to be achieved in a couple of years followed by a period of over-capacity.
Stable coal supply remains a challenge to most of the coal-fired generation in the Chinese mainland. The increase in coal demand, combined with the closing of small coal mines and transportation restrictions has fueled the coal price increase in 2004 and the situation is expected to last for a while until coal supply-demand equilibrium is achieved. The tariff-coal price linking mechanism to be implemented in mid-2005 will help to reduce part of the burden on coal-fired generators.
The regulatory environment is opaque but evolving towards higher transparency and clarity. In 2005, tariff approval will remain the responsibility of the State and Provincial Authorities but is expected to become more objective and transparent. The new project approval process which was on stream since July 2004 is simpler and focuses mainly on environment, land and utilization of natural resources; whilst leaving the commercial risks to the investors.
The Chinese Government continues to take action to address environmental issues by setting plans to increase the proportion of gas-fired and hydro-electric generation to coal fired generation to 25% by 2010, closing small thermal generating units, installing desulphurization plants and setting stringent emission standards.
The power sector reform in the Chinese mainland has brought about a more competitive environment for generating companies and some form of more transparent pricing should gradually replace the current tariff setting mechanism. The regulatory environment in the Chinese mainland should gradually become more open and transparent to create a level playing field for all market participants, both local and foreign. We will closely monitor the progress of the reform and the changing market conditions in the Chinese mainland.
43
Electricity Business in Other Asia-Pacific Countries
We have established a significant presence in the private sector power industry in a number of countries in the Asia-Pacific region, notably Australia, India, Taiwan and Thailand. As of December 31, 2004, we own 4,088 equity MW generating capacity in the Asia-Pacific region outside Hong Kong and the Chinese mainland, of which 3,204 equity MW are operational and 884 equity MW are under construction.
We aim to become a leading international private sector power company in the Asia-Pacific region. This will be done through (i) developing effective investment partnerships and establishing a meaningful presence in each of our target markets; and (ii) building a balanced portfolio across our selected Asia-Pacific countries, with a suitable mix of plant and fuels and a combination of operating assets, projects under construction and a pipeline of development projects.
On March 7, 2005, we signed an agreement with SPI Electricity & Gas Australia Holdings Pty Limited, a wholly-owned subsidiary of Singapore Power to acquire its merchant energy business division in Australia. Prior to the acquisition, our investment in the Australian energy sector comprised a 1,480MW coal-fired power station at Yallourn Energy and the AusPower retail business, which sells electricity to large industrial and commercial customers. This acquisition is in line with our Group’s objective of building a diversified and integrated energy business in Australia, focusing on electricity and gas retail, with a portfolio of physical assets in support of that retail business. Details of the transaction are fully described in “Item 8B. Significant Changes”
Our position in India, Australia, Thailand and Taiwan is now supported by several years of successful operation. We have addressed risks to revenue where possible, put in place the necessary corporate policies, management and reporting systems and we have completed major capital project construction. We are now ready for further growth in these markets through careful selection of new opportunities where we can use our industry experience effectively to manage the underlying risks to provide high quality earnings.
Yallourn Energy Pty Limited, Australia
As at December 31, 2003 we owned an effective equity interest of 92% in Yallourn Energy. Since March 2004, following the completion of our acquisition of Yallourn Energy’s remaining 8% interest managed by Deutsche Asset Management (Australia) Limited, we hold 100% of Yallourn Energy.
44
Yallourn Energy has four generating units. The first two units, each initially rated at 350MW, commenced operation in 1974 and 1975, whilst the second two units, each initially rated at 375MW, commenced operation in 1981 and 1982. In 2003, each of the units was re-rated as a result of technical improvements and the power station is now registered as a 1,480MW facility, up from 1,450MW. The captive brown coal mine is within the Yallourn Energy site and its operations are integrated with the power station. In 2002, Yallourn Energy completed the process of contracting out its mine operations and maintenance activities and in 2003, new mining technology was successfully introduced. In 2004 most of the work to divert the Morwell River in order to secure access to a long-term coal reserve, was successfully completed, with handover anticipated in mid-2005. The original control and instrumentation equipment of the power plant is also being replaced and upgraded. Yallourn Energy is a low cost power producer within the National Electricity Market, or NEM, of Australia.
Yallourn Energy operates as a merchant plant in the NEM and bids its output into the pool. In order to provide volume and price stability, Yallourn Energy sells through the following range of electricity products:
| | • | | relationship contracts with electricity retailers, whereby there is a shared risk and benefit of end market pricing but full cost recovery; |
| | • | | retail contracts (under Yallourn Energy’s retail brand “AusPower”) by way of contracts of typically 2 to 5-year duration with relatively large customers, and at a price that reflects the wholesale market together with a cost margin and risk premium; and |
| | • | | wholesale market hedges, being a combination of traditional hedges and a small volume of trading. |
Yallourn Energy also maintains some direct exposure to the pool to provide potential upside during price peaks, reducing the cost of availability risk management and as an additional source of market intelligence.
Around 85% to 90% of its expected generation output is protected against pool volatility.
In 2004, Yallourn Energy suffered two significant unplanned outages which materially affected availability and adversely impacted on revenue. However, increased capacity and overall performance still allowed Yallourn Energy to achieve another record generation output of 11,402 GWh (2003: 11,368 GWh). Prices in the NEM remain low and following a mild summer we are not forecasting a recovery in prices in 2005.
The Morwell River Diversion project, which will secure access to a long-term coal reserve adjacent to the existing area of coal extraction, remains on schedule and within budget. Actual diversion was completed in May 2005, with some landscaping and residual work to be completed this year. The upgrade of the station’s instrumentation and control systems is progressing, although issues have arisen concerning the cost of the project and the timetable for completion. These are being addressed and the upgrade is currently expected to be completed in 2007.
45
Annual load in the NEM is forecast to increase by approximately 1.7% each year between 2005 and 2008 with maximum demand forecast to increase by approximately 2.6%. However, we forecast that prices will continue to soften due to a continuing oversupply in Victoria and South Australia, an excess of new generation in Queensland and additional volumes available between regions through interconnection projects.
Yallourn Energy’s exposure to the risks of industrial disputes is considerably reduced as a result of a culture change program introduced several years ago. One consequence of this program was the dispute-free negotiation of the 3-year Enterprise Bargaining Agreement with employees which was certified in August 2004 ahead of the expiry date of the arbitrated industrial award on September 2004.
Management at Yallourn Energy is also committed to the highest standards of safety and environmental protection. The Board of CLP AusPower Pty Ltd, the immediate holding company of Yallourn Energy, has established a sub-committee to supervise these activities. Yallourn Energy’s key achievements include National Safety Council Australia five-star recognition; Royal Society for Prevention of Accidents Gold Awards; Computational Solutions Incorporated Reliability Based Maintenance (USA) excellence award; and ISO14001 accreditation.
Gujarat Paguthan Energy Corporation Private Limited, India
As at December 31, 2003, we owned 100% of the equity interest in Gujarat Paguthan Energy Corporation Private Limited, or GPEC. GPEC owns a 655MW combined cycle power station in Gujarat, India. The plant was commissioned in open cycle in October 1997 and combined cycle in December 1998. It is dual-fuel fired using natural gas or naphtha.
High reliability and safety standards were maintained at GPEC in 2004, accompanied by improvements in the economic performance of this investment.
GPEC has entered into a 20-year power purchase agreement with the state-owned Gujarat Electricity Board, or GEB, to sell all of its output to GEB commencing in 1998. The power purchase agreement between GPEC and GEB enables GPEC to recover its fixed costs and profit irrespective of the availability of fuel and the level of dispatch from GEB. Despite this arrangement, GPEC aims to deliver electricity to GEB at a reasonable price through maximum usage of natural gas and reductions in pass-through costs.
GEB challenged the terms of GPEC’s power purchase agreement, or PPA, (together with all other independent power producers, or IPPs, in the State of Gujarat) by an application to the Regulator. Since the Regulator has the power to amend PPAs, we decided to enter into such a dialogue with GEB, rather than risk an outcome being imposed by the Regulator over which we had little control. The resulting negotiations with GEB were concluded at the end of 2003 and are viewed as satisfactory by both sides. This was intended to strike a more sustainable balance between the interests of GPEC and GEB by:
| | • | | producing a meaningful reduction in the cost of power supplied by GPEC to GEB; |
| | • | | maintaining an acceptable return on our investment in GPEC; and |
| | • | | promoting improved performance by GEB in meeting its obligations to pay GPEC on a timely basis. |
46
The implementation of this amended PPA proceeded satisfactorily with an improvement in the monthly collection of payments to GPEC, as compared to previous years. GEB also successfully issued a Rupee 3 billion bond (approximate US$69 million) and applied the proceeds of approximately HK$500 million to reduce overdue receivables. However, a number of outstanding amounts are still under dispute with GEB. Some issues though agreed in the amended PPA remain pending for implementation. GEB has recently raised some issues in relation to (a) items already agreed and settled previously; and (b) further renegotiation. GPEC has responded to GEB to the effect that it is not amenable to a review of issues already settled nor for any further renegotiation.
The improvement in GPEC’s financial performance and in the business environment generally in Gujarat is such that we have started to explore the possibility of developing a second phase to the GPEC plant. The feasibility of doing so clearly depends on being able to offer competitively priced energy, and our ability to obtain secure fuel and off-take commitments and payments.
GPEC has achieved an exceptionally high standard of safety and environmental protection. It was awarded the Royal Society for the Prevention of Accidents Gold Awards for safety each year from 2000 to 2004. It has also maintained a zero incident frequency rate for more than 2,400 days and has established a benchmark for safety management in the power generation sector in India. On environmental management, GPEC has been accredited ISO14001 certification for the past several years.
Ho-Ping Power Company and Ho-Ping Power Services Corporation, Taiwan
Ho-Ping Power Company, or Ho-Ping, and Ho-Ping Power Services Corporation are two joint venture companies formed between us (40%) and Taiwan Cement Corporation (60%). Ho-Ping, formed in 1997, has constructed and owns a 1,320MW coal-fired power station and an associated 53km of 345kV transmission line at Ho-Ping City in eastern Taiwan. Ho-Ping Power Services Corporation was established in 2000 to manage the operations and maintenance of the two units under a contract with Ho-Ping.
Ho-Ping achieved commercial operation of the power station on schedule and within budget, with Unit 1 and Unit 2 commencing operation in June and September 2002, respectively. Coal is procured internationally from Australia, Indonesia, South Africa and China, largely through long-term coal supply contracts. The station has established a Safety, Health and Environmental Protection Committee comprising management and staff representatives at various levels to devise and implement the various initiatives in relation to safety, health and environment.
The plant has been tested to comply with the emission limits. The reliability of the monitoring equipment needs to be improved but there is presently no major problem with controlling the plant emissions.
47
Ho-Ping sells all its output to Taiwan Power Company, or Taipower, the government-owned utility of Taiwan, under a 25-year power purchase agreement commencing in 2002. The power purchase agreement enables Ho-Ping to recover its fixed costs and generate profits if it achieves a certain availability level during periods defined as guaranteed days and guaranteed hours. For periods not within those guaranteed days and hours, Ho-Ping may be dispatched by Taipower, but no penalty will be imposed by Taipower if Ho-Ping cannot provide power at these times.
Our key objectives for the investment in Ho-Ping are to maximize the long-term profit of Ho-Ping and to achieve this in full compliance with environmental and safety requirements. Operation of the two units in Ho-Ping has gradually improved since commissioning as technical problems have been resolved and staff has matured in operating experience. With our experience in constructing and operating power plants, we have seconded staff to key positions in Ho-Ping and provided a range of support in areas including asset management, engineering and commercial operations.
Electricity Generating Public Company Limited, Thailand
Electricity Generating Public Company Limited, or EGCO, is incorporated in Thailand and listed on the Stock Exchange of Thailand. EGCO’s market capitalization is around HK$7 billion and it is included in the SET 50 comprising Thailand’s 50 largest publicly listed companies. The company is 22.4% owned by us and 25.4% owned by the Electricity Generating Authority of Thailand, or EGAT. Its principal activity is the generation of electricity for supply to EGAT under long-term power purchase agreements. In 2004, EGCO showed significant improvement in new business development with the start of construction of Kaeng Khoi 2, a 1,468MW combined cycle gas-fired station developed by EGCO’s 50% owned subsidiary, Gulf Electric. The 1,070MW Nam Theun 2 hydro-electric power project in Laos, in which EGCO holds a 25% stake, has also made progress.
There was mixed progress on broader issues relating to our investment in EGCO. We are represented on the EGCO Board and its subcommittees, with four directors out of a total of 15, and are able to participate meaningfully in supervising the existing assets and developing new business.
The reform of the Thai electricity industry which would have included the privatization of EGAT has been on hold for some time. However, following its re-election in February 2005 the Thai government has announced that it would proceed with the plan to privatize EGAT and other state-owned enterprises. In the meantime, relations with EGAT which is both the largest single shareholder in EGCO, as well as being its off-taker and potential major competitor in generation, have been affected by the position on the BLCP project. This project is fully described in the following paragraph. Under the terms of a Joint Development Agreement, EGCO may acquire half of our 50% interest in BLCP Power Limited in Thailand. To date no agreement has been reached regarding the price for any such transfer. We will respect our obligations under the Agreement and will make all efforts to resolve this matter amicably so as to transfer our shareholding in BLCP at a market value.
48
BLCP Power Limited, Thailand
We hold a 50% interest in BLCP Power Limited, or BLCP, in Thailand. BLCP is the owner and developer of a 1,434MW (2x717MW) coal-fired power project at Map Ta Phut in Rayong Province. Our other 50% equity partner is Banpu Public Co. Ltd.
The project’s financing arrangement was finalized in the second half of 2003 and the project is currently under construction. We are the construction manager on behalf of BLCP and we will own 60% of a company that will provide operation and maintenance services to the project throughout its life. Commencement of commercial operation of the two units is expected to occur in 2006 and 2007 respectively, and all power generated will be supplied to EGAT under a 25-year power purchase agreement.
A slight delay was caused by late shipping of major electrical equipment, but is not expected to affect the installation schedule. As at end-December 2004 the design and construction of the power station was 23.7% complete. Capital costs remain within the budgeted amount. Preparations for operations are well underway and key staff has been recruited.
Electricity-Related Business
We pursue selective opportunities in Hong Kong and the Chinese mainland beyond our conventional electricity business, by leveraging off our existing businesses, assets, expertise and relationships. These activities are carried out on a limited and selected basis, in line with our overriding focus on the electricity business.
Property Development
Our non-Scheme of Control property development is managed by our wholly owned subsidiary, CLP Properties Limited, or CLP Property. The objective of CLP Property is to redevelop sites in Hong Kong which are no longer required for electricity purposes. We do not acquire land and buildings for redevelopment.
Our major project is the residential redevelopment of the former power station site at Hok Un, Kowloon. This 50/50 joint venture project, known as Laguna Verde, led by CLP Property and a wholly-owned subsidiary of Cheung Kong (Holdings) Ltd., comprises 4,735 flats, 1,692 parking spaces and 270,000 sq. ft. of commercial space. About 99% of the residential units had been sold by the end of 2004.
During 2004, we have sold a former substation site at 305 Castle Peak Road for HK$221 million. This site, measuring 7,200 sq.ft. was formerly used as a 33kV substation, but had become surplus to the needs of our power network.
Following the completion of the Hok Un redevelopment and the sale of the site at 305 Castle Peak Road, we do not currently consider that there are other surplus sites in Hong Kong which would be made available for redevelopment on any significant scale.
49
Public Lighting and Engineering Services
Through our wholly owned subsidiary, CLP Engineering Limited, we offer contracting and consultancy services in power engineering, communications systems, building services, energy services, road lighting and facility management for customers in Hong Kong and neighboring areas.
Our railway-related work remained the base of our work on infrastructure projects. In 2004 we successfully completed one major project for the Mass Transit Railway Corporation with three further projects on schedule for completion in or after 2005. However, the gradual recovery of the economy did not lead to a significant upturn in our engineering contracting business.
Our energy services focus on opportunities to improve power quality and on fuel switching to produce energy savings and/or environmental benefits for our customers. In 2004, we have commissioned four centralized electric hot water systems, comprising heat pumps and electric heaters, for hotels and property management companies. We also broadened our power quality improvement services to leading banking and airline companies by using active harmonic filters to enhance reliability of their electrical systems.
We manage, operate and maintain the public lighting system in Kowloon and New Territories East under a four-year contract secured in October 2002. We have used our longstanding expertise in this field to develop private lighting activities in areas such as private estates and road infrastructure.
We have maintained the electrical systems in the Passenger Terminal Building for the Hong Kong Airport Authority since 2002, and have received a number of safety and customer service awards in the past year. In addition to having the existing contract extended for a further three years, another two contracts were awarded to us.
Telecommunications
Through CLP Telecommunications Limited, our wholly owned subsidiary, we had previously held a 19% stake in PowerCom Network Hong Kong Limited (PowerCom), a joint venture with Cheung Kong Enterprises Limited (CKE) to provide broadband services to Hong Kong customers using powerline telecommunications technology. In January 2004, we participated in a sale of PowerCom by CKE to Vanda Systems & Communications Holdings Limited (renamed as Hutchison Global Communications Holdings Limited – HGCH) in exchange for the issue of shares in HGCH. We subsequently placed 37.7% of those shares in March 2004 and sold the remaining shares in July 2004.
With the sale of our interest in PowerCom and the termination at the end of 2004 of “ChinaLink”, a small-scale operation which provided cross-border communications to Hong Kong corporations operating in China, we have now withdrawn entirely from an unsuccessful but limited involvement in the telecommunications sector.
50
Research and Development
The primary efforts of our research and development activities, which are led by our wholly owned subsidiary CLP Research Institute Limited, or CLP RI, centered on: (a) renewable energy and (b) technology innovations for an increasingly competitive and environmentally conscious business environment.
In 2004, we continued with a number of on-going projects for renewable energy, including wind and solar resource assessment (data and methodology), applications of renewable technology (solar and hybrids with wind and fuel cell), and energy efficiency. Projects on appliance load characteristics, biofuel co-combustion, solar resource assessment, fuel cell and review on the published studies regarding the impact of air quality on public health in Asia concluded in 2004, and we received the final reports, reflecting our feedback, in early 2005.
CLP RI also monitors emerging energy issues and technology, and conducts knowledge-sharing activities through its portal on the company intranet, as well as an electronic newsletter, internal and external briefings, and presentations by experts from the international community. Topics included technological advances in hydrogen economy and combined heating and power, as well as developments related to the issues of air quality and global climate change.
51
Capital Investment Programme
The sharp increases in electricity demand in Hong Kong in summer 2004 illustrate the importance of making the necessary investment in our electricity infrastructure in advance of demand in order to maintain and enhance supply reliability. We expect to finance our ongoing capital expenditure requirements under the electricity business in Hong Kong and the investment opportunities in the electricity business in the Chinese mainland and other Asia-Pacific countries by using our internal resources and/or additional borrowings or issuance of debt securities.
Electricity Business in Hong Kong
For the year ended December 31, 2004, we invested HK$5,278 million (US$679 million) in fixed assets, compared to HK$5,125 million for the year ended December 31, 2003 and HK$4,923 million for the year ended December 31, 2002. Capital expenditure incurred by CAPCO was HK$1,683 million (US$217 million) for the year ended December 31, 2004, compared with HK$2,148 million for the year ended December 31, 2003 and HK$938 million for the year ended December 31, 2002. A total of HK$6,961 million (US$896 million) capital expenditures were made by us and CAPCO in 2004.
We reached an agreement with the Hong Kong Government in December 1999 to defer the installation and commissioning of Units 7 and 8 of the Black Point Power Station by five years, and hence the commissioning dates for those units are expected to be 2005 and 2006 respectively. Following the agreement to defer Units 7 and 8 of the Black Point Power Station, we and CAPCO agreed to forgo the permitted return on the outstanding deferral premium of HK$803 million arising from the delayed commissioning of the units. The deferral premium is a contractual obligation that corresponds to additional costs incurred by the vendors for delayed delivery of the two generator units. We and the Hong Kong Government agreed that we would set aside a total of HK$803 million from the Development Fund by way of a special provision account to pay for the outstanding deferral premium. By the end of 2004, the amount under the special provision account was fully used up to absorb the deferral premium charges.
The financial plan for the period January 2005 to September 2008 is currently being reviewed by the Hong Kong Government before submission for approval by the Executive Council of Hong Kong under the Scheme of Control. The plan includes, among other matters, estimated operating and capital expenditures, projected level of the Development Fund and the projected tariff rates. Our projected capital expenditures are mainly required for keeping pace with growth in electricity demand, and improving reliability and quality of supply to customers for the longer-term future through investment in transmission and distribution facilities. The financial plan also provides for the retrofitting of some coal-fired generating units to bring the emission performance of these plants to better than the European Union standards, and the refurbishment and replacement of certain generating assets for meeting safety and regulatory requirements, while ensuring our availability and reliability.
52
Electricity Business in the Chinese Mainland and Other Asia-Pacific Countries
In March 2004, we completed the acquisition of the remaining 8% interest in Yallourn Energy managed by Deutsche Asset Management (Australia) Limited. Following completion, we own 100% of Yallourn Energy. During the year, we also made net shareholders’ advances of HK$347 million (US$45 million) to CAPCO.
In April 2004, we made the final share capital contribution of RMB286 million (US$34.5 million) to the Anshun II project.
Pursuant to the Equity Contribution Agreement and its amendment agreement relating to the BLCP Power project, we are required to make equity contributions of HK$1,282 million (US$165 million) by 2007. As at December 31, 2004, HK$132 million (US$17 million) had been fulfilled.
In respect of the investment in Changdao wind power project, we are required to contribute share capital of RMB 45 million (US$5.4 million). The first contribution of RMB 7 million (US$0.8 million) was made in early February 2005, with the remainder to be contributed by the end of 2005.
Pursuant to the relevant loan agreements entered into on February 27, 2001 for the refinancing of Yallourn Energy, shareholders of CLP AusPower Pty Limited (formerly known as AusPower Holdings Pty Limited), the immediate holding company of Yallourn Energy, agreed to provide the senior debt lenders with contingent equity support up to A$200 million for a five-year period from February 27, 2001. Mandatory contribution of contingent equity depends on certain minimum requirements regarding the availability of cash flows for debt service, measured every six months. As at December 31, 2004, A$80 million (US$62 million) had been contributed by us, with A$120 million of commitment still outstanding.
Owing primarily to continued high capital expenditure requirements and a slightly lower than expected revenue this year, Yallourn Energy forecasts that the additional contingent equity support will need to be provided in 2005. As at May 31, 2005, a total of A$161.7 million has been injected into Yallourn Energy.
53
Environmental Matters
We are committed to the principles of sustainable development and take pride in being a leader in environmental management. Our environmental management systems assure that our environmental performance is in line with our commitments and policies. We publish independently verified performance data annually within 90 days of year end in our Group Social and Environmental Report. We also won awards for our environmental reports issued in 2003 and 2004.
Our objective is 100% compliance with applicable laws and requirements. During 2004, there were a total of three cases of non-compliance at our facilities, one at Yire in China, and two at Yallourn Energy in Australia. We are taking steps to assure that these non-compliances are not repeated. The Yire facility is being retrofitted to bring it into compliance, and corrections and improvements were made to address the non-compliances at Yallourn. None of these cases affected our asset utilization.
We have a commitment to continuous improvement in environmental matters. Initiatives in our annual improvement plans bring new processes and technologies to enhance our environmental performance, particularly in the areas of energy efficiency and water conservation. We recently won awards for our initiatives in transformer oil regeneration in Hong Kong and water use reduction in India.
We monitor developments in environmental regulations and participate in public discussions. We anticipate that public expectations and regulatory requirements on environmental performance will continue to rise in all our service areas. We are prepared to take the steps necessary to keep our assets in compliance with new requirements, and to engage our stakeholders on the future directions of our business.
Our stakeholders are concerned about the impacts of our use of fossil fuels on air quality and global climate. We set forth our commitments on these issues in “Our Environmental Manifesto on Air Quality and Climate Change” in December 2004. We anticipate new climate-related regulations throughout our service areas. We are developing a Group-wide climate strategy this year, including a target of 5% of our generating capacity as renewables by 2010.
In Hong Kong, we have proposed a major retrofit of our coal-fired station with flue gas desulphurization (FGD) to reduce sulphur dioxide (SO2) emissions and formation of secondary sulphate particulates, selective catalytic reduction to reduce oxides of nitrogen (NOx) emissions, and enhancements to our electrostatic precipitators to reduce particulate matter emissions. Group-wide, we have made a commitment to incorporate FGD or equivalent SO2 emissions reduction capability into the planning of all new greenfield coal-fired projects in which we have a controlling interest, and to encourage our business partners to do likewise where we do not have a controlling interest.
54
Our fossil-fueled assets depend on a steady supply of fuel, much of which is purchased in the international marketplace. While fossil fuels remain plentiful, we must secure a replacement supply of natural gas for our Hong Kong facility. According to the most recent assessment, the remaining reserves at the dedicated Ya Cheng gas field are less than originally anticipated. Therefore we are assessing the feasibility to construct an LNG terminal in Hong Kong so that we can continue to supply our gas-fired station there.
Severe storms and variations in weather patterns have the potential to impact our utilization of our assets. Storms and lightning can cause outages of power delivery systems, and in generation systems. They also have the potential to interrupt fuel shipments. Reduced rainfall can reduce the flow of water for hydropower stations, and can adversely affect the quality and availability of cooling water for inland assets and hydropower stations. Low winds can affect the operations of wind farms. These weather factors can cause interruptions in service and reduction in plant outputs.
In 2004 we experienced storm damage at Ho-Ping in Taiwan, where the roof of a coal storage structure was severely damaged. We also experienced a decline in cooling water availability at our Yire power station in Beijing, and a decline in water flow at our hydropower stations at Huaiji. We were able to resume normal operations at Ho-Ping in a timely manner. The effects of low rainfall were confined to two of our smaller assets. Overall, while we did experience some adverse effects from storms and weather in 2004, their impacts on our asset were not significant.
Insurance
We maintain property and casualty insurance against risks of our business to the extent we consider appropriate. Our Insurance and Claims Branch, which arranges insurance for our business in Hong Kong, assesses prudent levels of risk retention in consultation with professional external insurance advisors. Insurance coverage for risk above our retention level is obtained from the market.
In respect of our investments outside Hong Kong, suitable insurance coverage is in place to ensure risks are appropriately transferred. Typical coverage includes property all risks, machinery breakdown, and/or business interruption for operating assets and construction all risks for plants under construction.
55
C. Organizational Structure
The diagram below sets forth our ownership relationships with our principal operating subsidiaries and affiliates as at December 31, 2004.
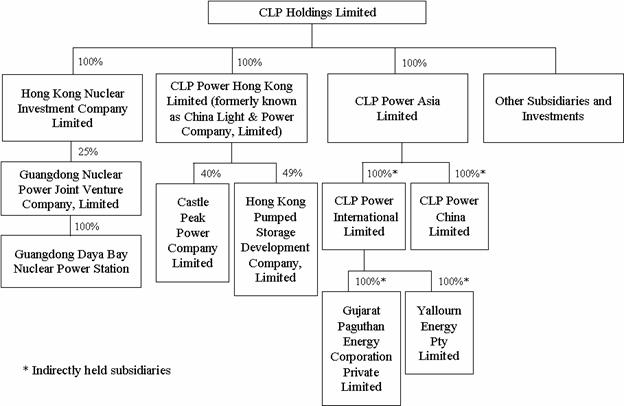
56
The table below sets forth for each of our principal subsidiaries, the name, year and country of incorporation/operation and our percentage holding and principal activities as of December 31, 2004.
| | | | | | | | |
| | | Year of Incorporation
| | Place of Incorporation /
Operation
| | Our
Percentage Holding
| | Principal Activities
|
CLP Power Hong Kong Limited | | 1918 | | Hong Kong | �� | 100% | | Generation and Supply of
Electricity |
| | | | |
Hong Kong Nuclear Investment Company Limited | | 1983 | | Hong Kong/Chinese
mainland | | 100% | | Power Project
Investment Holding |
| | | | |
CLP Engineering Limited | | 1985 | | Hong Kong | | 100% | | Engineering Services |
| | | | |
CLP Power Asia Limited | | 2003 | | British Virgin
Islands/International
and Chinese mainland | | 100% | | Power Projects
Investment Holding |
| | | | |
CLP Power China Limited | | 1998 | | British Virgin
Islands/Chinese
mainland | | 100%(2) | | Power Projects
Investment Holding |
| | | | |
CLP Power International Limited | | 1996 | | British Virgin
Islands/International | | 100%(2) | | Power Projects
Investment Holding |
| | | | |
CLP Properties Limited | | 1989 | | Hong Kong | | 100% | | Property Investment
Holding |
| | | | |
CLP Research Institute Limited | | 2000 | | British Virgin Islands/
Hong Kong | | 100% | | Research and
Development |
| | | | |
Yallourn Energy Pty Limited (A) | | 2003(1) | | Australia | | 100%(2) | | Generation and Supply of
Electricity |
| | | | |
Gujarat Paguthan Energy Corporation Private Limited | | 2003(1) | | India | | 100%(2) | | Generation and Supply of
Electricity |
| (A) | In March 2004, we completed the acquisition of the remaining 8% interest in Yallourn Energy managed by Deutsche Asset Management (Australia) Limited. Following completion, we own 100% of Yallourn Energy. |
| (1) | Year of the company becoming a subsidiary of the Group. |
57
D. Property, Plants and Equipment
Our fixed assets consist mainly of CLP Power Hong Kong’s transmission and distribution equipment and facilities in Hong Kong and the generating facilities in Yallourn Energy and GPEC. As at December 31, 2004, the net book value of our fixed assets was HK$57,748 million (US$7,430 million), and comprised HK$42,415 million (US$5,457 million) from the Scheme of Control business and HK$15,333 million (US$1,973 million) from the non-Scheme of Control business. For the non-Scheme of Control fixed assets, HK$15,147 million (US$1,949 million) was attributed to Yallourn Energy and GPEC. Included in the net book value of our fixed assets, HK$49,506 million (US$6,370 million) represented plant, machinery and equipment and HK$8,242 million (US$1,060 million) represented land and buildings. During the year, we invested HK$5,823 million (US$749 million) in fixed assets, of which HK$5,278 million (US$679 million) was invested by CLP Power Hong Kong and HK$523 million (US$67 million) by Yallourn Energy and GPEC.
As at December 31, 2004, land comprised leasehold land held in Hong Kong and leasehold and freehold land held outside Hong Kong. Leasehold land in Hong Kong is held under lease from the Hong Kong Government and many of our land leases are either long-term or contain an automatic right to renew for a specified fixed term. As of December 31, 2004, the aggregate net book value of our leased land held in Hong Kong was HK$2,239 million (US$288 million), of which HK$152 million (US$19.6 million) represented land with an unexpired lease period of over 50 years, HK$2,085 million (US$268.2 million) expiring between 10 to 50 years and HK$2 million (US$0.2 million) expiring in less than 10 years. The aggregate net book value of our land held outside Hong Kong was HK$106 million (US$13.6 million), of which HK$1 million (US$0.1 million) represented leased land with an unexpired lease term period of over 50 years situated in India, HK$105 million (US$13.5 million) represented freehold land situated in Australia and India.
Our investments, principally the electricity business in the Chinese mainland and other Asia-Pacific countries as well as in CAPCO, are accounted for as our interests in the jointly controlled entities, associated companies, investment securities and other investments in 2004. As of December 31, 2004, these interests amounted to HK$16,647 million (US$2,142 million), of which HK$16,040 million (US$2,064 million) was in the electricity business. Geographically, our interests in the affiliates engaging in the electricity business included HK$3,101 million (US$399 million) in the Asia-Pacific region excluding Hong Kong and the Chinese mainland, HK$6,643 million (US$855 million) in the Chinese mainland and HK$6,296 million (US$810 million) in Hong Kong.
58
| Item 5. | Operating and Financial Review and Prospects |
Unless stated otherwise, the discussion and analysis of our financial condition and results of operations in this section apply to our financial information as prepared in accordance with Hong Kong GAAP, which differs from U.S. GAAP in certain material aspects. You should read the following discussion of our financial condition and results of operations together with the financial statements and the notes to these statements included in “Item 17. Financial Statements” in this annual report, especially Note 34 for a discussion of the material differences between Hong Kong GAAP and U.S. GAAP.
References to us in this section for the relevant periods, unless the context otherwise requires, are to us and our consolidated subsidiaries, together with our share of the results of jointly controlled entities and associated companies.
Overview
Our Scheme of Control business accounted for approximately 78.8% of our net earnings in 2004. Excluding the property redevelopment profit and property disposal gain and unallocated expenses, 80.2% of our operating earnings were contributed by the Scheme of Control business and 19.8% by the non-Scheme of Control business, as compared to 79.7% by the Scheme of Control business and 20.3% by the non-Scheme of Control business in 2003.
Electricity Business in Hong Kong
Our major source of revenue is from CLP Power Hong Kong’s Scheme of Control business in Hong Kong. Therefore, our financial condition and results of operations are affected by economic activities and the regulatory environment in Hong Kong. Since the second half of 2003, the Hong Kong economy has seen a broad-based recovery. Deflation that had persisted for 68 months came to an end. Under the Individual Visit Scheme and the Closer Economic Partnership Arrangement (CEPA), the tourism industry performed strongly with visitor arrivals reaching a record high of 21.8 million. The labor market improved significantly with the unemployment rate dropping to a 3-year low of 6.5%. Exports of goods remained buoyant with a total growth of over 15%. The recovery was reflected in high electricity maximum demand in 2004 with an increase of 7.7% from 2003’s maximum demand, the strongest year on year growth since 1989. Local electricity sales, however, recorded a moderate growth of 2.1%, being affected by the weather which was cooler as compared to 2003 and partly due to more awareness among customers regarding energy conservation. The commercial sector registered a rebound of 3.6% growth in sales, reflecting the economic recovery. Sales to the infrastructure and public services sector also increased by 3.6%, attributable in part to new railway lines. The residential sector recorded a marginal decline of 0.4% as a result of the cooler summer weather. The decline in sales to the manufacturing sector slowed down due to improved export performance.
59
Despite the uncertainties posed by persistent high oil prices, the upward interest rate cycle and continuous macroeconomic adjustment measures in the Chinese mainland, the Hong Kong economy is expected to maintain solid growth with a pace slower than that in 2004 in the near term. Internally, the growth in the tourism industry, continuous improvement in unemployment situation and further liberalization of trade under CEPA are expected to fuel the economic growth. In addition, the improved fiscal account balance and the recovery of the property market should also strengthen consumer and investor confidence.
In view of the improved economic condition, local electricity sales are expected to grow at a rate faster than that of the average of the past few years. Directly benefiting from the economic rebound, the commercial sector is expected to be the main driver of electricity sales growth. The residential sector is supported by the housing supply and the growth of sales is expected to remain moderate. The sales growth in infrastructure and public services sector is supported by local public infrastructure developments. Growth momentum, however, is expected to drop slightly as a result of energy conservation activities. The process of transformation of Hong Kong into a services-oriented economy will continue, but the impact to the manufacturing sector will be offset by the recent improvement in domestic exports and weakening of the U.S. dollar.
Scheme of Control
Following the completion of the Scheme of Control interim review in 2003, we do not expect there to be any changes to the regulatory regime applying to our Hong Kong electricity business before the expiry of the current Scheme of Control Agreement on September 30, 2008. In preparation for the future, we have been devoting considerable management resources to a thorough understanding of the implications of different regulatory systems for our Hong Kong electricity business.
The Hong Kong Government has commenced a two-stage consultation on post-2008 electricity market arrangements. On January 1, 2005, the Hong Kong Government launched the Stage 1 public consultation, which ended on April 30, 2005. The objective of Stage 1 consultation is to seek public views on possible options for the development of the post-2008 electricity market. We will actively participate in the debate on the future regulation of our business. We have and will continue to respond clearly and with authority to the consultation launched by the Hong Kong Government and communicate widely with all sectors of our community regarding the right way forward for this essential industry.
As a result of general cost savings and productivity improvement, we have been able to freeze our tariff levels again in 2005, maintaining them at the 1998 levels.
60
Electricity Businesses in the Chinese Mainland
Throughout 2004, we have continued to promote excellence in project management and station operation in those assets in which we hold an interest. Overall those stations have performed well, with good levels of availability and reliability. Since 2002 when we acquired our interest in the Anshun II power station project, we have made only limited progress in sourcing new development projects and creating new partnerships in the Chinese mainland’s power sector. This remained so in 2004, reflecting our prudent approach to investment in additional generating assets in the Chinese mainland. We have been extremely selective in our choice of new investments in the Chinese mainland and we have been prepared to slow the pace of investments, rather than compromise on their quality. The result may have been that we missed opportunities, but we also avoided pitfalls. During 2004, we have secured a 2x600MW coal-fired greenfield project at Fangchenggang in Guangxi Province, PRC in which we will hold a 70% equity interest.
Electricity Businesses in Other Asia-Pacific Countries
Our portfolio of electricity assets in the Asia-Pacific region outside Hong Kong and the Chinese mainland grew significantly over the past couple of years. We now have a significant presence in Australia, India, Taiwan and Thailand. During 2004, we have continued to explore opportunities to develop greenfield projects, acquire further operating assets and develop further strategic partnerships, consistent with our objective to build meaningful and sustainable businesses in all our target countries. However, conditions were not yet favorable to bring any such opportunities to closure and the net result in terms of new business development in 2004 was disappointing. In 2004, our major focus was to optimize the performance and value of our existing assets.
Electricity-Related Business
We pursue selective opportunities in Hong Kong beyond our conventional electricity business, by leveraging off our existing business, assets, expertise and relationships. These activities are carried out on a limited and selected basis, in line with our overriding focus on our electricity business.
Share Premium Reduction and Share Repurchases
Following the approval by shareholders at the Extraordinary General Meeting in April 2002 and confirmation from the High Court of Hong Kong in June 2002, we undertook a restructuring of our balance sheet and transferred HK$10,117 million from our share premium account to our retained profits. We do not have immediate plans to use this increased distributable reserve. The share premium reduction will, however, provide greater flexibility for us in terms of our dividend or share repurchase policies.
We have undertaken share repurchases on an opportunistic basis to optimize our capital structure and enhance earnings per share. In 2002, we repurchased a total of 13,240,500 shares at an aggregate price of HK$396 million, as compared to 75,986,000 shares that we repurchased at an aggregate price of HK$2,273 million in 2001. We have not undertaken any share repurchases since then. All the shares we repurchased have been cancelled in accordance with the Hong Kong Companies Ordinance and the Rules Governing the Listing of Securities on the Stock Exchange of Hong Kong.
61
Critical Accounting Policies
Our financial statements have been prepared in conformity with Hong Kong GAAP. The financial statements also include a reconciliation to U.S. GAAP. In preparing these financial statements, management exercises judgment in the selection and application of accounting principles, including making estimates and assumptions. Critical accounting policies include those policies that could result in materially different operating results if our assumptions regarding application of accounting principles were different. The following is a summary of critical accounting policies that are impacted by judgments and uncertainties and for which different amounts may be reported under a different set of conditions or using different assumptions.
Accounting under the Scheme of Control
The financial operations of CLP Power Hong Kong and its jointly controlled generating company, CAPCO, are governed by the Scheme of Control. Under the Scheme of Control, CLP Power Hong Kong is allowed to charge tariffs designed to recover the operating costs (including tax) and allowed net return of CLP Power Hong Kong and CAPCO. The allowed net return is derived by subtracting from the permitted return (i) interest up to a maximum of 8% per annum on borrowings to finance fixed assets; (ii) a charge of 8% per annum on the sum of the average balances of the Development Fund and the special provision account; (iii) an excess capacity adjustment of 13.5% on the average excess capacity expenditure less an allowed interest charge of up to 8% per annum on the average excess capacity expenditure after the Black Point Units 7 and 8 are commissioned; and (iv) interest up to a maximum of 8% per annum on the increase in average balance of the customers’ deposits in excess of the balance at September 30, 1998. The annual permitted return is determined as 13.5% of the average net fixed assets of CLP Power Hong Kong and CAPCO relating to the electricity business plus a further 1.5% on the average net fixed assets financed by shareholders’ investments and acquired after September 30, 1978. Any difference between the permitted return and the profit for Scheme of Control operations is transferred to or from the Development Fund. The Development Fund represents a liability in the accounts of CLP Power Hong Kong. The allowed net return so derived is to be divided in accordance with the provisions of the agreements between CLP Power Hong Kong and CAPCO. See “Item 17. Financial Statements — Scheme of Control Statement”.
As of December 31, 2004, CLP Power Hong Kong and CAPCO together had a carrying value of net fixed assets of HK$69,882 million (US$8,991 million) which comprised primarily the generating facilities and transmission and distribution systems. This carrying amount reflects the application of our fixed assets accounting policy which complies with Hong Kong GAAP. Depreciation is based on the rates stipulated under the Scheme of Control Agreement which reflect the pattern in which the assets’ economic benefits are consumed.
The Scheme of Control stipulates the methodology in calculating the return of our electricity business in Hong Kong. Whilst the current Scheme of Control Agreement will expire on September 30, 2008, the accounts are prepared under the assumption that there will be no material changes to the current regulatory framework in the foreseeable future. Any modifications to the existing Scheme of Control following its expiry in 2008 may have an effect on our financial performance as they may affect the way we calculate our earnings from this business.
62
Turnover and Trade Receivables
Our turnover primarily consists of sales of electricity by CLP Power Hong Kong which are recognized based on actual and accrued consumption derived from meter readings during the period. Non-residential customers are billed on a monthly basis while residential customers are billed bi-monthly. The sales for residential customers who have not been billed in the month are estimated by taking into account the past trend of consumption as if their meters were read. Revenues earned outside Hong Kong are billed in accordance with the terms of the contractual agreements where applicable during the period.
Our credit policy in respect of electricity sales in Hong Kong is to allow customers to settle their electricity bills within 15 to 17 days after issue. Customers’ receivable balances are generally secured by cash deposits or bank guarantees. For electricity sales outside Hong Kong, the credit term ranges from 30 to 60 days. We continually assess the collectibility of our receivables and make provisions accordingly. In the event that any receivable is determined to be uncollectible, we write it off as a bad debt. Changes in the assumptions on the collectibility of our receivables may change the amount of provisions and bad debts written-off.
We use the equity method to recognize our pro rata share of the net income or loss of our unconsolidated investments. Accordingly, revenues from our joint ventures or associated companies are not consolidated in our turnover. We nevertheless review the collectibility of receivables of these business ventures. In 2004, our management considered that it was prudent to make additional provisions against our share of the receivables in some joint ventures.
Retirement Benefits
Prior to 2002, under Hong Kong GAAP, the periodic charge to our financial statements for costs arising from a defined benefit retirement scheme was represented by our contributions to the scheme in a given period, determined with reference to independent actuarial valuations.
On January 1, 2002, we adopted the new Hong Kong Statement of Standard Accounting Practice, or SSAP, No. 34 “Employee Benefits” in accounting for employee benefits which became effective for financial statements with periods beginning on or after January 1, 2002. On initial adoption of the new standard under Hong Kong GAAP, we carried out an actuarial valuation resulting in a surplus of plan assets over liabilities of HK$1,194 million. We are of the opinion that the surplus is not subject to taxation in Hong Kong. The new standard under Hong Kong GAAP is broadly consistent with Statement of Financial Accounting Standards, or SFAS, No. 87 “Employers’ Accounting for Pensions” under U.S. GAAP. The surplus, upon initial adoption of the new Hong Kong accounting standard has been recognized as a prior year adjustment against retained profits.
Under U.S. GAAP, the retirement scheme asset at January 1, 2002 differed from this surplus due to the existence of unrecognized actuarial gains and losses; under U.S. GAAP such actuarial gains and losses are amortized over the average remaining active employee service period.
63
The calculation of our pension expense and asset/liability for the defined benefit programmes requires the use of assumptions. These include assumptions about the discount rate, long-term expected return on plan assets and rate of future base compensation increases. In selecting the assumed discount rate, we make reference to market yields on high quality corporate bonds which have a similar term as the related liabilities. The expected rate of return on plan assets was derived based upon the asset model used by our actuarial consultants, Watson Wyatt Hong Kong Limited, which takes into account inflation, short and long-term interest rates, equity risk premium and changes to bond prices relating to changes in interest rates. Base compensation escalation took scale increments, promotions and cost of living increases into consideration. Changes in these assumptions can result in different expense and asset/liability amounts.
On December 31, 2002, the remaining members in our defined benefit programmes were transferred to our defined contribution programmes. At the same time, we obtained the relevant approvals in principle to enable the winding up of the trusts governing then existing programmes. This represented a curtailment and settlement of the retirement benefit programmes. Accordingly, all previously unrecognized gains and losses were credited to the profit and loss account in 2002 under U.S. GAAP. Our retirement benefit programmes were consolidated under a new trust in June 2003. The retirement fund under the new trust is a defined contribution scheme which provides benefits linked to contributions and investment returns made on the scheme. Contributions under the new scheme are recognized in the year to which the contributions relate.
Depreciation
Fixed assets employed for the electricity business in Hong Kong, also referred to as SoC fixed assets, represent a substantial portion of the assets of the Group. Depreciation of these assets is based on the rates authorized under the SoC. The economic lives are reviewed periodically to ensure the period of depreciation reflect the pattern in which the assets’ economic benefits are consumed. During the 2003 SoC interim review, the economic lives of certain fixed assets were reviewed, an agreement was reached with the Hong Kong Government to depreciate land on lease terms over the unexpired terms of the leases and to extend the depreciation period of the following assets with effect from January 1, 2004:
| | | | |
| | | Original Period
| | Revised Period
|
Buildings | | 33 years | | 35 years |
Cable tunnels | | 33 years | | 100 years |
Switchgear and transformers | | 25 years | | 35 years |
Meters | | 10 years | | 15 years |
In respect of the above assets that were commissioned before January 1, 2004, their net book value as at December 31, 2003 is being written off uniformly over the remainder of their useful lives. Assets commissioning after January 1, 2004 are depreciated on a straight-line basis over their revised lives.
64
Fixed assets used for the non-SoC business, which are primarily for the electricity business located outside Hong Kong, are also depreciated on a straight-line basis. Their estimated useful lives are similar to those of the SoC fixed assets.
For equipment awaiting installation and plant under construction, no depreciation is provided until the construction is completed and the assets are ready for their intended use.
Asset Impairment
Under both Hong Kong GAAP and U.S. GAAP, if a triggering event occurs indicating that the carrying amount of an asset may not be recoverable, an impairment assessment of that asset is required. Triggering events include significant adverse changes in the market value of an asset, legal factors and the business or regulatory environment. In addition, goodwill is subject to an annual impairment test under U.S. GAAP whereas, under Hong Kong GAAP, such an annual review is required only when its useful life is greater than 20 years or there is an indication of impairment.
Under Hong Kong GAAP, the recoverable amount is the higher of an asset’s net selling price and its value in use which is the present value of estimated future cash flows before tax and financing charges we expect to recover from the future use of the asset, discounted using a pre-tax rate. An impairment loss is the amount by which the carrying amount of the asset exceeds its recoverable amount. Under U.S. GAAP, an impairment loss is recognized only if the carrying amount of an asset is not recoverable from its undiscounted cash flows and is measured as the difference between the carrying amount and fair value of the asset. Fair value will generally be determined using valuation techniques such as discounted cash flows.
Under U.S. GAAP, negative goodwill is first to be allocated pro rata to all acquired assets other than cash and cash equivalents, trade receivables, inventory, financial instruments that are required to be carried on the balance sheet at fair value, assets to be disposed of by sale and deferred income tax assets. Any excess is to be recognized as an extraordinary gain in the period in which the business combination is initially recognized. Such allocation will affect the carrying value of long-lived, mostly depreciable, assets.
We review the carrying amounts of our long-lived assets, equity investments, goodwill and marketable debt and equity securities for impairment whenever events or changes in circumstances indicate that the carrying amount of these assets may not be recoverable or whenever it is required in accordance with relevant accounting standards. The interpretation of such triggering events requires judgment from management with respect to the circumstances as to whether the events have occurred and whether assessment of the value of the assets is required. Judgment is also exercised to estimate the future cash flows and the useful lives of these assets as well as the discount rates to be used. In 2004, after reviewing the business environment as well as our objectives and past performance of our investments, management decided to record impairment charge against goodwill arising from an investment in a jointly controlled entity in the amount of HK$15 million (US$2 million).
65
In view of the expiry of the current Scheme of Control Agreement on September 30, 2008, on January 31, 2005, the Hong Kong Government launched a process of public consultation on the future regulation of Hong Kong’s electricity business, the outcome of the consultation is not possible to predict. Should there be any modification to the Scheme of Control following its expiry in 2008 in a manner which would be unfavorable to CLP Power Hong Kong, our Scheme of Control assets may be impaired. Management will continue to review the carrying amounts of the Scheme of Control assets for impairment should there be events or changes in circumstances which indicate that the carrying amount of these assets may not be recoverable.
Non-consolidation of Majority-owned Joint Ventures
Under Hong Kong GAAP, consolidation is required if we have control over a company, i.e. the power to govern the financial and operating policies of the company. In cases where our ownership exceeds 50% but does not result in control, we account for the investment using the equity method. Under U.S. GAAP, if we own more than a 50% interest in a company, we are presumed to control this company and consolidation will be required, unless the minority shareholder(s) can exercise substantive participating rights in the company. Also, with the adoption of FASB Interpretation No. 46 (revised) (“FIN 46R”), certain variable interest entities, or VIE’s, are required to be consolidated by their primary beneficiary if the primary beneficiary is subject to a majority of the risk of losses from the VIE activities, or entitled to receive a majority of the VIE’s residual returns, or both. Details are further described below under “Variable Interest Entities”.
As of December 31, 2004, our effective interest in Guizhou CLP Power Company Limited was 70%. Under the joint venture agreement with respective parties, none of the joint venture partners has unilateral control over the economic activity of this entity. Accordingly, our interest is accounted for as jointly controlled entity under Hong Kong GAAP. For U.S. GAAP purposes, since the minority joint venture partners have substantive participating rights, our management is of the view that non-consolidation of this joint venture is appropriate and hence there is no difference in treatment between Hong Kong GAAP and U.S. GAAP.
Deferred Taxation
Prior to 2003, for the purposes of our Hong Kong consolidated financial statements, we have made full provision for deferred taxation for our Scheme of Control business using the deferral method which is computed using the tax rate enacted at the time the relevant provision was established. For our non-Scheme of Control business, Hong Kong GAAP has historically required a partial provision approach to deferred taxation such that timing differences are accounted for only to the extent that it is probable that a liability or asset will crystallize in the foreseeable future. On January 1, 2003, we have adopted the revised SSAP No. 12 (Revised) “Income Taxes”, which is broadly consistent with the U.S. accounting standards.
Deferred taxation is provided in full, using the liability method, on temporary differences arising between the tax bases of assets and liabilities and their carrying amounts in the accounts.
66
Deferred taxation is provided on temporary differences arising on investments in subsidiary companies, jointly controlled entities and associated companies, except where the timing of the reversal of the temporary difference can be controlled and it is probable that the temporary difference will not reverse in the foreseeable future.
Deferred tax assets are recognized to the extent that it is probable that future taxable profit will be available against which the temporary differences can be utilized. We have recognized deferred tax assets arising from tax losses and assets revaluations on acquisition of some of our businesses. Estimating the amount for deferred tax assets requires a process that involves determining appropriate provisions for taxation, forecasting future years’ taxable income and assessing our ability to utilize tax benefits through future earnings. Our current financial models indicate that the tax losses can be utilized in the future, but any changes in assumptions and estimates and in tax regulations can affect the recoverability of the deferred tax assets.
Derivative Instruments and Hedging Activities
We engage in forward foreign exchange transactions, cross currency swaps and options and interest rate swaps transactions to hedge the impact of foreign currency exposures and fluctuations in interest rates. Our subsidiary, Yallourn Energy in Australia, also uses energy-related derivative instruments to hedge the price risk of sales of electricity and the price risk of purchasing energy to satisfy retail sales contract obligations. We do not recognize such derivatives at fair value, nor do we account for the gains or losses relating to the fair value changes in these derivatives as this is not required under Hong Kong GAAP.
Under U.S. GAAP, we have adopted SFAS No. 133 “Accounting for Derivative Instruments and Hedging Activities” which, as amended by SFAS Nos. 137, 138 and 149, is referred to in this annual report as SFAS No. 133. Since its implementation in 2001, SFAS No. 133 requires that all qualifying derivatives be recognized on the balance sheet at fair value. The fair value of our forward foreign currency contracts is the present value of expected future cash flows related to the difference between the contract rates and the market forward rates. In measuring the swap transactions, the fair value is the net present value of each cash flow discounted at the market quoted swap rates.
Derivatives contracts under the SoC are recognized on the balance sheet as assets or liabilities at fair value. However, there will not be an impact on the Group’s retained profits nor reserves as it is considered to be ultimately recoverable under the SoC and therefore an offsetting amount due from customers has been recorded on the balance sheet.
We determine the fair value of derivative instruments under U.S. GAAP based on externally verifiable model inputs and quoted prices, and use market interest rates in determining discount rates. For certain derivative transactions which provide economic hedges but do not qualify for hedge accounting under SFAS No. 133, changes in fair value of the derivatives will impact our earnings.
67
Variable Interest Entities
Under U.S. GAAP, FIN 46R requires that certain VIE’s to be consolidated by their primary beneficiary. The primary beneficiary is the party that is subject to a majority of the risk of losses from the VIE activities, or entitled to receive a majority of the VIE’s residual returns, or both. An entity is subject to FIN 46R and is considered to be a VIE if it has (1) equity that is not sufficient to permit the entity to finance its activities without additional subordinated financial support from other parties, or (2) equity investors that cannot make significant decisions about the entity’s operations, or that do not absorb the expected losses or receive the expected returns of the entity, or (3) equity investors have voting rights that are not proportional to their obligations to absorb the expected losses or to receive the expected returns of the entity, and substantially all of the entity’s activities are conducted on behalf of an investor that has disproportionately few voting rights.
A Foreign Private Issuer must apply the provisions of FIN 46R to those entities considered as “special-purpose entities” on January 1, 2004, and to other entities no later than December 31, 2004. The Group has adopted FIN 46R for the current year and carried out assessment on our interest in CAPCO and other jointly controlled entities under the provisions of FIN 46R.
The Electricity Supply Contract between CLP Power, ExxonMobil and CAPCO stipulates that if the actual profit for the SoC business, when added to the amount available for transfer from the development fund, is less than the permitted return, the share of any deficit to be borne by CAPCO is limited to 20%. The remaining 80% is to be borne by CLP Power as the other party to the SoC Agreement. The shareholders of CAPCO, in their capacities as shareholders, are therefore sheltered from the losses of the company and, as such, CAPCO does meet the definition of a VIE as any shortfall in the expected return, which is deemed to be the permitted return, would be borne by CLP Power, and consequently, CLP Power is considered to be the primary beneficiary of CAPCO. The Group is therefore required to consolidate CAPCO in the U.S. GAAP accounts. This does not have any impact on net income or shareholders’ funds, as CAPCO was previously accounted for using the equity method, but does result in the requirement to disclose a summary income statement and balance sheet prepared under U.S. GAAP. Under Hong Kong GAAP, our investment in CAPCO is accounted for using the equity method. Our relationship with CAPCO is more fully described in “Item 4. Information on the Company — B. Business Overview — Relationship with CAPCO” above. Audited Hong Kong GAAP financial statements of CAPCO can be found on page F-64 to F-80 of our financial statements set forth in “Item 17. Financial Statements”.
68
The Group has consolidated CAPCO in the U.S. GAAP consolidated financial statements at December 31, 2004 in accordance with the provisions of FIN 46R. There was no impact on net income on consolidation of CAPCO under U.S. GAAP as CAPCO had previously been accounted for under the equity method. The income statement and balance sheet of the Group under Hong Kong GAAP and those prepared under U.S. GAAP, including the consolidation of CAPCO and other U.S. GAAP adjustments shown on F-59 to F-61 of our financial statements set forth in “Item 17. Financial Statements” in 2004, are presented below:
| | | | | | | | | |
| | | Hong Kong
GAAP | | | U.S. GAAP | | | U.S. GAAP | |
| | | 2004 | | | 2004 | | | 2004 | |
| | | HK$M | | | HK$M | | | US$M | |
| | | |
Turnover | | 30,784 | | | 30,784 | | | 3,961 | |
Operating expenses | | (22,894 | ) | | (17,209 | ) | | (2,213 | ) |
| | |
|
| |
|
| |
|
|
| | | 7,890 | | | 13,575 | | | 1,748 | |
Property disposal gain | | 214 | | | 214 | | | 28 | |
| | |
|
| |
|
| |
|
|
Operating profit | | 8,104 | | | 13,789 | | | 1,776 | |
Net finance costs | | (983 | ) | | (1,248 | ) | | (161 | ) |
Share of results of affiliates | | 3,604 | | | 1,854 | | | 237 | |
| | |
|
| |
|
| |
|
|
Profit before taxation | | 10,725 | | | 14,395 | | | 1,852 | |
Taxation | | (1,815 | ) | | (2,315 | ) | | (298 | ) |
| | |
|
| |
|
| |
|
|
Profit after taxation | | 8,910 | | | 12,080 | | | 1,554 | |
Transfers under Scheme of Control | | (296 | ) | | (296 | ) | | (38 | ) |
| | |
|
| |
|
| |
|
|
| | | 8,614 | | | 11,784 | | | 1,516 | |
Earnings attributable to non-controlling interest | | — | | | (2,491 | ) | | (320 | ) |
| | |
|
| |
|
| |
|
|
Net earnings | | 8,614 | | | 9,293 | | | 1,196 | |
| | |
|
| |
|
| |
|
|
| | | |
| | | Hong Kong
GAAP | | | U.S. GAAP | | | U.S. GAAP | |
| | | 2004 | | | 2004 | | | 2004 | |
| | | HK$M | | | HK$M | | | US$M | |
| | | |
Current assets | | 6,383 | | | 7,457 | | | 959 | |
Fixed assets | | 57,748 | | | 83,231 | | | 10,709 | |
Investments in affiliates | | 16,638 | | | 10,257 | | | 1,320 | |
Other assets | | 30 | | | 3,859 | | | 496 | |
| | |
|
| |
|
| |
|
|
Total assets | | 80,799 | | | 104,804 | | | 13,484 | |
Current liabilities(1) | | 9,678 | | | 13,192 | | | 1,697 | |
Term loans (long-term portion) | | 17,596 | | | 24,529 | | | 3,156 | |
Deferred taxation | | 5,084 | | | 7,938 | | | 1,021 | |
Other long-term liabilities | | 4,242 | | | 5,777 | | | 743 | |
Non-controlling interest | | — | | | 9,316 | | | 1,199 | |
Shareholders’ funds | | 44,199 | | | 44,052 | | | 5,668 | |
| | |
|
| |
|
| |
|
|
Total liabilities and shareholders’ funds | | 80,799 | | | 104,804 | | | 13,484 | |
| | |
|
| |
|
| |
|
|
| (1) | Current liabilities include the current portion of term loans. |
69
New Accounting Pronouncements
Hong Kong GAAP
HKAS 17
Hong Kong Accounting Standard (“HKAS”) 17 “Leases” prescribe the appropriate accounting policies and disclosure for lessees and lessors to apply in relation to leases. The adoption of HKAS 17 will result in a change in accounting policy relating to leasehold land. Under HKAS 17, a lease of land and building should be split into a lease of land and a lease of a building in proportion to the relative fair values of the leasehold interests in the land element and the building element of the lease at the inception of the lease. When the land has an indefinite economic life, the land element is normally classified as an operating lease unless title is expected to pass to the lessee by the end of the lease term. The building element is classified as a finance or operating lease in accordance with HKAS 17. An entity that has previously applied SSAP 14 (revised 2000) “Leases” shall apply the amendments made by HKAS 17 retrospectively for all leases or, if SSAP 14 (revised 2000) was not applied retrospectively, for all leases entered into since it first applied that Standard. We are still in the process of assessing the impact of HKAS 17 on our financial position and results of operations.
HKAS 32 and HKAS 39
HKAS 32 “Financial Instruments: Disclosure and Presentation” contains requirements for the presentation of financial instruments and identifies the information that should be disclosed about them. HKAS 32 requires disclosure of information about factors that affect the amount, timing and certainty of an entity’s future cash flows relating to financial instruments and the accounting policies applied to those instruments. It also requires the disclosure of the nature and extent of an entity’s use of financial instruments, the business purposes they serve, the risks associated with them, and management’s policies for controlling those risks. HKAS 39 “Financial Instruments: Recognition and Measurement” establishes the principles for recognizing and measuring financial assets, financial liabilities and some contracts to buy or sell non-financial items and the hedging requirements for financial instruments. The Group will adopt HKAS 39 in January 1, 2005 and recognizing the fair value of derivative contracts as assets or liabilities on the balance sheet. We are still in the process of assessing the impact of HKAS 39 on our financial position and results of operations.
70
HKFRS 3
Hong Kong Financial Reporting Standard (“HKFRS”) 3 “Business Combinations” specifies that all business combinations should be accounted for by applying the purchase method. Therefore, the acquirer recognizes the acquiree’s identifiable assets, liabilities and contingent liabilities at fair values at the acquisition date. HKFRS 3 prohibits the amortization of goodwill acquired in a business combination and instead requires the goodwill to be tested for impairment annually, or when there are indications of impairment. If, at the acquisition date, the acquirer’s interest in the net fair value of the acquiree’s identifiable assets, liabilities and contingent liabilities exceeds the cost of the combination, the excess referred to as negative goodwill must be recognized by the acquirer immediately in profit and loss. The adoption of HKFRS 3 will result in the Group’s cessation of goodwill amortization beginning January 1, 2005 and the derecognition of negative goodwill of HK$1,046 million (US$135 million) to retained profits on January 1, 2005.
HKFRS-Int 4
HKFRS-Int 4 “Determining whether an Arrangement contains a Lease” was issued in February 2005 to provide guidance for determining whether a transaction or a series of related transactions, that does not take the legal form of a lease but conveys a right to use an asset in return for a payment or series of payments are, or contain, leases that should be accounted for in accordance with HKAS 17. The interpretation addressed the issues of how to determine whether an arrangement is, or contains a lease as defined in HKAS 17, when the assessment or a reassessment should be made; and how the payments for the lease should be separated from payments for any other elements in the arrangement. The interpretation is effective for accounting periods beginning on or after January 1, 2006 and will be applied retrospectively. We are still in the process of assessing the impact of HKFRS-Int 4 on our financial position and results of operations.
US GAAP
FIN 47
In March 2005, the Financial Accounting Standards Board (“FASB”) issued Interpretation No. 47 (“FIN 47”), “Accounting for Conditional Asset Retirement Obligations”, an interpretation of SFAS No. 143, “Accounting for Asset Retirement Obligations”. FIN 47 clarifies that the term conditional asset retirement obligation, as used in SFAS No. 143 refers to a legal obligation to perform an asset retirement activity in which the timing and/or method of settlement are conditional on a future event that may or may not be within the control of the entity. This interpretation requires an entity to recognize a liability for the fair value of a conditional asset retirement obligation if the fair value of the liability can be reasonably estimated. It also clarifies when an entity would have sufficient information to reasonably estimate the fair value of an asset retirement obligation. FIN 47 is effective no later than the end of fiscal years ending after December 15, 2005 and December 31, 2005 for calendar year enterprises. We believe the adoption of FIN 47 does not have any significant impact on our financial position and results of operations.
71
SFAS No. 123 (Revised)
In December 2004, the FASB issued SFAS No. 123 (Revised) (“SFAS No. 123 (R)”) “Share-Based Payment”, which is a revision of SFAS No. 123 “Accounting for Stock-Based Compensation” and supersedes Accounting Principles Board Opinion No. 25 “Accounting for Stock Issued to Employees”. SFAS No. 123 (R) requires all share-based payments to employees, including grants of employee stock options, to be valued at fair value on the date of grant, and to be expensed over the applicable vesting period. SFAS No. 123 (R) is effective for all stock-based awards granted, modified, repurchased or cancelled in interim or annual periods of the fiscal year beginning on or after June 15, 2005. We believe the adoption of SFAS No. 123 (R) does not have any significant impact on our financial position and results of operations.
72
A. Operating Results
Overview
In 2004, the Group achieved appreciable earnings growth with total operating earnings increased by 10.7% to HK$8,241 million (US$1,060 million). The Scheme of Control (SoC) business continued to provide stable earnings growth, with earnings increased by 8.1% to HK$6,788 million (US$873 million). This was a result of our ongoing investment in our transmission and distribution network to expand and improve services to customers, as well as investment by CAPCO in generation facilities. Earnings from the non-SoC activities, primarily from our electricity businesses in the Chinese mainland and other Asia-Pacific region, recorded a moderate increase of 4.4% to HK$1,671 million (US$215 million), reflecting a growing contribution from overseas power project investments and the contribution of the first full year result from our subsidiaries, Yallourn Energy and GPEC, offset by higher coal costs and write-off of financing charges as a result of re-financing of project loans. After including the unallocated Group expenses and the Hok Un redevelopment profit, the Group total earnings in 2004 were HK$8,614 million (US$1,108 million), an increase of HK$927 million (US$119 million), as compared to HK$7,687 million in 2003. The increase was mainly contributed by the gain on the sale of a former substation site at Castle Peak Road, Hong Kong of HK$214 million (US$27 million)
Our total operating earnings in 2003 were HK$7,447 million, an increase of 13.6% as compared to HK$6,558 million in 2002. Earnings from our SoC business grew 8% to HK$6,281 million in 2003, reflecting a stable earnings growth in our electricity business in Hong Kong. Earnings from the non-SoC activities increased from HK$998 million in 2002 to HK$1,600 million in 2003, as a result of the growing contribution from overseas power project investments and the contribution of a full year result from our 40% interest in Ho Ping Power Station in Taiwan which was commissioned in 2002. Total earnings for 2003 were HK$7,687 million, an increase of 8.1% as compared to HK$7,104 million in 2002. The increase was mainly due to the increase in non-SoC earnings, offset by the further reduction from property sales. In 2003, profits from Hok Un redevelopment were HK$240 million, as compared to the Hok Un redevelopment profit and the sale of a former staff quarters site of HK$546 million in 2002.
Changes in the financial statement line items from year to year are described below.
Year Ended December 31, 2004 Compared to Year Ended December 31, 2003
Our turnover in 2004 increased to HK$30,784 million (US$3,961 million) from HK$28,248 million in 2003, representing a rise of 9%. The turnover mainly comprised electricity sales in Hong Kong which accounted for HK$25,290 million (US$3,254 million), increased by 3.5% from 2003 mainly due to fuel clause adjustment as a result of higher composite fuel price. Sales to the Chinese mainland increased from HK$1,240 million in 2003 to HK$1,371 million (US$176 million) in 2004. The total export sales of 3,087 GWh in 2004 represented our largest sales volume to the Chinese mainland in any one year since 1996. The high growth was the result of the persistent power shortage in Guangdong.
For the first time, the Group turnover included the full year revenue of Yallourn Energy and GPEC. Sales from Yallourn Energy and GPEC amounted to HK$3,813 million (US$491 million) in 2004.
73
Other revenue increased from HK$303 million in 2003 to HK$310 million (US$40 million) in 2004, an increase of 2.3%.
Total operating expenses increased to HK$22,894 million (US$2,945 million) in 2004 from HK$21,636 million in 2003, an increase of 5.8%. The main reasons for this increase were:
| | • | | A 4.7% increase in purchases of electricity from CAPCO in 2004 amounting to HK$10,923 million (US$1,405 million), from HK$10,431 million in 2003, mainly due to the increase in fuel expenses caused by higher average fuel price and more units generated, and the increase in operating costs and depreciation, partly offset by lower deferral premium and finance costs on lower loan balances and interest rates. See “Item 4. Information on the Company – B. Business Overview – Relationship with CAPCO” and “Item 7. Major Shareholders and Related Party Transactions – B. Related Party Transactions – CAPCO”. |
| | • | | Purchases of nuclear electricity in 2004 from Guangdong Daya Bay Nuclear Power Station, or GNPS, amounted to HK$4,763 million (US$613 million), a decrease of 7.2% from HK$5,134 million in 2003, primarily attributed to the decrease in units purchased. See “Item 4. Information on the Company – B. Business Overview – Guangdong Daya Bay Nuclear Power Station” and “Item 7. Major Shareholders and Related Party Transactions – B. Related Party Transactions – Guangdong Daya Bay Nuclear Power Station”. |
| | • | | Staff costs in 2004 were HK$1,284 million (US$165 million), an increase of 11% from HK$1,157 million in 2003, of which HK$70 million (US$9 million) was contributed by Yallourn Energy and GPEC, whilst for other Group companies the increase of HK$57 million (US$7.3 million) was mainly due to higher annual incentive provision and cost of “buying-out” previous work related allowances. |
| | • | | Increase in fuel and other operating costs to HK$3,026 million (US$389 million) in 2004 from HK$2,249 million in 2003, mainly due to the consolidation of the full year expenses of Yallourn Energy and GPEC in 2004, contributing an additional of HK$898 million (US$116 million), others include higher government rent and rates of HK$105 million (US$13.5 million) and higher disposal loss of HK$60 million (US$7.7 million), mainly due to renovation work and the phase out of obsolete cables and overhead lines and miscellaneous substation plant and equipment. |
| | • | | A 7.3% increase in depreciation charges to HK$2,529 million (US$325 million) in 2004 from HK$2,357 million in 2003. This increase was primarily due to the addition of assets to our transmission and distribution network in Hong Kong and the incorporation of the full year depreciation charges on Yallourn Energy and GPEC’s fixed assets, partly offset by the net decrease in depreciation charges due to the extension of the economic lives of certain fixed assets and the commencement of leasehold land depreciation of HK$234 million (US$30 million). |
As a result of the above, we recorded an operating profit in 2004 in the amount of HK$8,104 million (US$1,043 million), an increase of 22.6% from HK$6,612 million in 2003. Operating profit as a percentage of turnover increased from 23.4% in 2003 to 26.3% in 2004, mainly due to the increase in Hong Kong electricity sales revenue and the full year consolidation of Yallourn Energy and GPEC, partly offset by the increase in operating expenses.
74
Finance costs in 2004 were HK$1,046 million (US$134 million), an increase of HK$358 million (US$46 million) from HK$688 million in 2003, mainly due to the full year interest expense and write off of previously capitalized facility fee of Yallourn Energy. Finance income in 2004 was HK$63 million (US$8 million), an increase of 31.3% from HK$48 million, mainly due to the increase in interest income from GPEC. While there was an increase in total interest and finance charges in 2004, a similar capitalization amount was allowed, resulting in a net increase in operating finance costs in 2004.
In 2004, we recorded our share of profit (before tax) of HK$187 million (US$24 million) arising from the sale of the remaining units of Phases 4 and 5 and car parking spaces of Laguna Verde at Hok Un site, as compared to a HK$291 million profit recorded in 2003. About 99% of the residential units in the redevelopment had been sold by December 2004. We also recorded a capital gain of HK$214 million (US$27 million) from the sale of a former substation site at Castle Peak Road.
Our share of profits less losses (before tax) from jointly controlled entities and associated companies in 2004 were HK$3,417 million (US$439 million), 2.4% lower than in 2003. The contributions of our major investments were as follows:
| | • | | CAPCO contributed HK$1,773 million (US$228 million), 3.3% higher than in 2003 mainly due to lower interest expenses and deferral premium charges. |
| | • | | Contribution from Guangdong Nuclear Power Joint Venture Company Limited, or GNPJVC, amounted to HK$739 million (US$95 million), 10.6% lower than the 2003 level of HK$827 million due to lower generation as a result of an extended outage period of GNPS. |
| | • | | Share of profit from Hong Kong Pumped Storage Development Company Limited, or PSDC, was HK$76 million (US$10 million), a slight decrease from HK$79 million in 2003. |
| | • | | Contributions from CLP Guohua amounted to HK$312 million (US$40 million), 75.3% higher than the 2003 level of HK$178 million. This was mainly due to the increase in demand and the implementation of higher tariffs. |
| | • | | Contributions from other investments in the Chinese mainland amounted to HK$67 million (US$8.6 million), a decrease of 67.5% as a result of decreased contributions from Shandong Zhonghua Power Company Limited due to the higher coal costs and the write-off of previously capitalized financing charges upon re-financing of the project loans. |
| | • | | Contributions from investments in the Asia-Pacific region amounted to HK$451 million (US$58 million), a net decrease of HK$12 million from 2003, excluding the share of profit from Yallourn Energy and GPEC for the period before they became subsidiaries of the Group in April and June 2003, respectively. Share of profit from EGCO increased HK$70 million (US$9 million) from 2003, mainly due to the write back of previously expensed development costs and capital spares, offset by the decrease in share of profit in Ho-Ping of HK$82 million (US$11 million) from 2003. The decrease was mainly due to the surge in coal prices and freight costs. |
75
Taxation increased to HK$1,815 million (US$234 million) in 2004 from HK$1,712 million in 2003, an increase of 6% mainly due to the higher taxable profits for CLP Power Hong Kong. The increase is partly offset by the reduction in the dividend distribution taxes on retained profits of our overseas subsidiary. Our effective tax rate for 2004 was 16.9%, compared to 17.5% in 2003.
Transfers under the Scheme of Control amounted to HK$296 million (US$38 million) in 2004, compared to HK$365 million in 2003. These transfers comprised:
| | (i) | the difference between the Scheme of Control profit and the permitted return being transferred from/to the Development Fund; the difference being HK$219 million (US$28 million) transferred to the Development Fund in 2004, compared to HK$572 million in 2003; |
| | (ii) | a charge of 8% per annum on the sum of the average balances of the Development Fund and the special provision account, which is credited to a rate reduction reserve, and which amounted to HK$253 million (US$33 million) in 2004, compared to HK$287 million in 2003; and |
| | (iii) | the amount of deferral premium in relation to Units 7 and 8 of the Black Point Power Station charged to the special provision account, being HK$176 million (US$23 million) in 2004, compared to HK$494 million in 2003. |
As a result of the full consolidation of Yallourn Energy and GPEC for the year and the increase in property disposal gain, our total earnings increased by 12.1% to HK$8,614 million (US$1,108 million) in 2004 from HK$7,687 million in 2003. Our earnings per share of common stock, increased by 12.1% to HK$3.58 (US$0.46) in 2004 from HK$3.19 in 2003 as a result of an increase in total earnings for the year.
In 2004 we paid interim dividends of HK$1.35 (US$0.17) per share of common stock and declared a final dividend of HK$0.73 (US$0.09) per share and a special final dividend of HK$0.15 (US$0.02) per share. In 2003 we paid interim dividends of HK$1.23 per share of common stock and declared a final dividend of HK$0.65 per share and a special final dividend of HK$0.1 per share.
Year Ended December 31, 2003 Compared to Year Ended December 31, 2002
Our turnover in 2003 increased to HK$28,248 million from HK$26,134 million in 2002, representing a rise of 8.1%. The turnover mainly comprised electricity sales in Hong Kong which accounted for HK$24,437 million, lowered by 1.4% from 2002 mainly due to lower composite fuel price in 2003, but partly offset by a 1.2% increase in sales of electricity to customers in Hong Kong in 2003. Sales to the Chinese mainland increased from HK$977 million in 2002 to HK$1,240 million in 2003. The total export sales of 3,008 GWh in 2003 represented our highest sales to the Chinese mainland in any one year since 1996. The high growth was the result of the strong economic growth and hot weather in Guangdong Province during 2003.
76
For the first time, the Group turnover included the revenue of Yallourn Energy and GPEC as from April and June 2003 respectively, when each became a subsidiary company of the Group. Sales from Yallourn Energy and GPEC amounted to HK$2,268 million in 2003.
Other revenue decreased from HK$364 million in 2002 to HK$303 million in 2003, a decrease of 16.8%. The decrease was mainly attributable to the decline in our telecommunications business.
Total operating expenses increased to HK$21,636 million in 2003 from HK$19,611 million in 2002, an increase of 10.3%. The main reasons for this increase were:
| | • | | A 2.4% increase in purchases of electricity from CAPCO in 2003 amounting to HK$10,431 million, from HK$10,191 million in 2002, mainly due to higher deferral premium and higher taxation charges arising from the change of Hong Kong profits tax rate from 16.0% in 2002 to 17.5% in 2003, partly offset by less finance costs as a result of lower loan balances and interest rates, and less fuel expenses in CAPCO due to a lower composite fuel price. |
| | • | | Purchases of nuclear electricity in 2003 from Guangdong Daya Bay Nuclear Power Station, or GNPS, amounted to HK$5,134 million, an increase of 3.2% from HK$4,976 million in 2002, primarily as a result of an increase in units purchased and higher average unit price. |
| | • | | Staff costs in 2003 were HK$1,157 million, an increase of 22.4% from HK$945 million in 2002, of which HK$66 million was contributed by existing operations due to the increase in average in-post and provision for incentive bonus. The remaining increase of HK$146 million was due to the consolidation of Yallourn Energy and GPEC from the date of each becoming a subsidiary. |
| | • | | Increase in fuel and other net operating costs to HK$2,249 million in 2003 from HK$1,331 million in 2002 was mainly due to the consolidation of Yallourn Energy and GPEC contributing an additional HK$800 million, and the higher operation and maintenance cost and insurance premium. |
| | • | | A 34.8% increase in depreciation charges to HK$2,357 million in 2003 from HK$1,749 million in 2002. This increase was primarily due to the addition of assets to our transmission and distribution network in Hong Kong in 2003 that increased the depreciation charges, and the incorporation of the depreciation charges on Yallourn Energy and GPEC’s fixed assets from the date of each becoming a subsidiary. |
As a result of the above, we recorded an operating profit in 2003 in the amount of HK$6,612 million, a decrease of 3.3% from HK$6,836 million in 2002. Operating profit as a percentage of turnover decreased from 26.2% in 2002 to 23.4% in 2003, mainly due to the growth in turnover attributable to the consolidation of Yallourn Energy and GPEC, partly offset by the increase in operating expenses.
77
Finance costs in 2003 were HK$688 million, an increase of HK$499 million from HK$189 million in 2002, mainly due to the finance costs incurred for Yallourn Energy and GPEC’s borrowings. Finance income in 2003 was HK$48 million, an increase of 45% from HK$33 million, mainly due to the increase in the average bank deposit balances as a result of the consolidation of Yallourn Energy and GPEC. While there was an increase in total interest and finance charges in 2003, a similar capitalization amount was allowed, resulting in a net increase in operating finance costs in 2003.
In 2003, we recorded our share of profit (before tax) of HK$291 million arising from the sale of the remaining units of Phases 4 and 5 and car parking spaces of Laguna Verde at the Hok Un site, as compared to a HK$282 million profit recorded in 2002. Over 98% of the residential units in the redevelopment had been sold by December 2003.
Our share of profits less losses (before tax) from jointly controlled entities and associated companies in 2003 were HK$3,501 million, 13.7% higher than in 2002. The contributions of our major investments were as follows:
| | • | | CAPCO contributed HK$1,716 million, 9.2% higher than in 2002 mainly due to lower interest expenses. |
| | • | | Contribution from Guangdong Nuclear Power Joint Venture Company Limited, or GNPJVC, amounted to HK$827 million, 9.2% higher than the 2002 level of HK$757 million due to higher generation. |
| | • | | Share of profit from Hong Kong Pumped Storage Development Company Limited, or PSDC, was HK$79 million, a slight decrease from HK$87 million in 2002 due to the impact of depreciation on the fixed asset value. |
| | • | | Contributions from other investments in the Chinese mainland amounted to HK$384 million, an increase of 58% as a result of increased contributions from CLP Guohua and Shenmu due to higher sales volume. Earnings from Shandong Zhonghua Power Company Limited also increased from the 2002 level due to the commissioning of Heze II in 2003. |
| | • | | Share of profit from Yallourn Energy was only HK$61 million, as compared to HK$86 million in 2002, representing our share of the 4 months’ results of Yallourn Energy before it became a subsidiary. |
| | • | | GPEC also contributed a profit of HK$38 million for the 5 months’ results before it became a subsidiary. |
| | • | | Contributions from other investments in the Asia-Pacific region amounted to HK$463 million, an increase of HK$284 million as compared to the amount in 2002, mainly due to the first full year operation of Ho-Ping after commissioning and an increase in contribution from EGCO as a result of higher generation and exchange gain. |
Taxation increased to HK$1,712 million in 2003 from HK$1,293 million in 2002, an increase of 32.4% mainly due to the higher effective tax rate in 2003 which resulted from the change in Hong Kong profit tax rate from 16% to 17.5% in 2003, and increased provisions for withholding and dividend distribution taxes on retained profits of our overseas affiliates. Our effective tax rate for 2003 was 17.5%, compared to 12.9% in 2002.
78
Transfers under the Scheme of Control amounted to HK$365 million in 2003, compared to HK$1,643 million in 2002. These transfers comprised:
| | (i) | the difference between the Scheme of Control profit and the permitted return being transferred from/to the Development Fund; the difference being HK$572 million transferred to the Development Fund in 2003, compared to HK$1,420 million in 2002, the decrease being mainly due to higher operating expenses; |
| | (ii) | a charge of 8% per annum on the sum of the average balances of the Development Fund and the special provision account which is credited to a rate reduction reserve and amounted to HK$287 million in 2003, compared to HK$319 million in 2002; and |
| | (iii) | the amount of deferral premium in relation to Units 7 and 8 of the Black Point Power Station charged to the special provision account, being HK$494 million in 2003, compared to HK$96 million in 2002. |
As a result of the consolidation of Yallourn Energy and GPEC, partly offset by lower profit from property sales, our earnings increased by 8.1% to HK$7,687 million in 2003 from HK$7,104 million in 2002. Our earnings per share of common stock, increased by 8.1% to HK$3.19 in 2003 from HK$2.95 in 2002 as a result of an increase in total earnings for the year.
In 2003 we paid interim dividends of HK$1.23 per share of common stock and declared a final dividend of HK$0.65 per share and a special final dividend of HK$0.1 per share. In 2002 we paid interim dividends of HK$1.14 per share of common stock and declared a final dividend of HK$0.51 per share and a special final dividend of HK$0.23 per share.
U.S. GAAP Reconciliation
Our financial statements are prepared in accordance with Hong Kong GAAP. This accounting practice differs in certain material respects from U.S. GAAP. The following table sets out a comparison of our net earnings, or net income, and shareholders’ funds, or shareholders’ equity, in accordance with Hong Kong GAAP and U.S. GAAP.
| | | | | | | | | |
| | | For the year ended December 31,
|
| | | 2002
| | | 2003
| | 2004
| | 2004
|
| | | HK$ | | | HK$ | | HK$ | | US$ |
| | | (in millions) |
| | | | |
Net Income in accordance with | | | | | | | | | |
Hong Kong GAAP | | 7,104 | (1) | | 7,687 | | 8,614 | | 1,108 |
U.S. GAAP | | 7,023 | | | 7,525 | | 9,293 | | 1,196 |
Shareholders’ Equity in accordance with | | | | | | | | | |
Hong Kong GAAP | | 36,888 | (1) | | 40,241 | | 44,199 | | 5,687 |
U.S. GAAP | | 36,177 | | | 39,397 | | 44,052 | | 5,668 |
| (1) | The comparative figures for the Net Income and Shareholders’ Equity for the year ended December 31, 2002 have been restated as a result of the initial adoption of SSAP No. 12 (Revised) “Income Taxes” in 2003. |
The significant differences between Hong Kong GAAP and U.S. GAAP are described in Note 34 (pages F-53 to F-61) to our financial statements set forth in “Item 17. Financial Statements” in this annual report.
79
B. Liquidity and Capital Resources
Sources of Liquidity
We finance our operations and business expansions, in particular the capital expenditure programmes of CLP Power Hong Kong and CAPCO and strategic investments in the Chinese mainland and other Asia-Pacific countries, using cash flow generated from operations, bank loans and debt securities. Our cash flow generated from operations, especially from our Hong Kong electricity business, has been and is expected to continue to be our principal source of liquidity. In our opinion, our working capital is sufficient for present requirements. We expect that customer demand for our electricity will remain stable and may increase as the economy grows. We do not believe our customer demand in the near future is likely to be negatively affected by rapid technological changes. We have not relied, and we do not plan to rely in the foreseeable future, on off-balance sheet financing arrangements as our source of financing.
At December 31, 2004, we had liquid funds of HK$2,520 million (US$324 million), as compared to HK$787 million at December 31, 2003, of which 95% were denominated in foreign currency mainly held by GPEC and Yallourn Energy and deposited with highly-rated international or local banks. The remainder was in Hong Kong dollars. Pursuant to the requirement under a Trust and Retention Account Agreement between GPEC and its project financiers, GPEC has deposited receipts amounted to HK$549 million (US$71 million) from its off-taker, Gujarat Electricity Board (GEB), into various trust accounts for fuel, operating and major maintenance expenses and debt service payments.
Net cash provided by operating activities in 2004 amounted to HK$10,195 million (US$1,312 million), an increase of HK$3,759 million when compared to 2003. This reflected the higher electricity sales of CLP Power Hong Kong and improved collection of receivables by GPEC. Net cash used in investing activities was HK$3,250 million (US$418 million). This amount included capital expenditure of CLP Power Hong Kong and Yallourn Energy as well as investments in power projects outside Hong Kong and advances to CAPCO which were partly offset by dividends received from investments and profits received from the Hok Un joint venture. Net cash used in financing activities was HK$5,300 million (US$682 million) which was primarily for the payment of dividends.
We adopt a prudent approach to all our financial arrangements, while at the same time aiming to achieve cost efficient funding. In January and November 2004, CLP Power Hong Kong issued two tranches of fixed rate notes due 2014 of HK$500 million each, with coupon rates at 4.93% and 4.28% respectively, through its wholly owned subsidiary CLP Power Hong Kong Financing Limited. These issues were made under the Medium Term Note (MTN) Programme set up by CLP Power Hong Kong Financing Limited in 2002. Under the MTN Programme, notes in an aggregate amount of up to US$1.5 billion may be issued and will be unconditionally and irrevocably guaranteed by CLP Power Hong Kong. At December 31, 2004, about HK$4,340 million (US$558 million) notes have been issued under the MTN Programme. In January 2005, CLP Power Hong Kong issued another tranche of HK$500 million fixed rate notes due 2015 with coupon rate at 4.35% under the MTN Programme.
CLP Power Hong Kong also arranged HK$500 million revolving facilities with competitive interest rate margins in May 2004.
80
Credit Facilities
As of December 31, 2004, the total credit facilities, excluding the commercial paper facility mentioned below, available to us were HK$27,158 million (US$3,494 million). CLP Power Hong Kong established a U.S. dollar denominated commercial paper programme in the amount of US$500 million in 1996, which we have not utilized since March 1998. We did not and do not plan to rely on this commercial paper facility for our liquidity. The table below sets forth the committed and uncommitted credit facilities and the periods of maturity of these credit facilities available to us as of December 31, 2004.
| | | | | | | | | | |
| | | Maturity by Period
|
Credit Facilities – CLP Group
| | Total
| | Less than
1 year
| | 1-3
years
| | 4-5
years
| | After 5
years
|
| | | (in HK$ millions) |
| | | | | |
Committed credit facilities | | 24,168 | | 3,186 | | 10,312 | | 4,408 | | 6,262 |
Uncommitted credit facilities | | 2,990 | | 2,990 | | – | | – | | – |
| | |
| |
| |
| |
| |
|
Total | | 27,158 | | 6,176 | | 10,312 | | 4,408 | | 6,262 |
| | |
| |
| |
| |
| |
|
|
As of December 31, 2004, the total credit facilities available to CAPCO were HK$10,102 million (US$1,300 million). The table below sets forth the committed and uncommitted credit facilities and the periods of maturity of these credit facilities available to CAPCO as of December 31, 2004. |
| |
| | | Maturity by Period
|
Credit Facilities – CAPCO
| | Total
| | Less than
1 year
| | 1-3
years
| | 4-5
years
| | After 5
years
|
| | | (in HK$ millions) |
| | | | | |
Committed credit facilities | | 9,337 | | 2,566 | | 3,077 | | 2,286 | | 1,408 |
Uncommitted credit facilities | | 765 | | 765 | | – | | – | | – |
| | |
| |
| |
| |
| |
|
Total | | 10,102 | | 3,331 | | 3,077 | | 2,286 | | 1,408 |
| | |
| |
| |
| |
| |
|
Credit Facilities – CLP Group and CAPCO | | 37,260 | | 9,507 | | 13,389 | | 6,694 | | 7,670 |
| | |
| |
| |
| |
| |
|
The sources of credit facilities available to us, as well as those to us and CAPCO combined, are as follows:
| | | | |
| | | CLP Group
| | CLP Group
and CAPCO
|
| | | % | | % |
| | |
Export Credits | | – | | 3 |
U.S. Dollar Notes due 2006 | | 9 | | 6 |
Private Placement | | – | | 1 |
Term Loans | | 55 | | 59 |
Medium Term Notes due 2012 to 2014 | | 16 | | 12 |
Money Market Line (including bank overdraft) | | 20 | | 19 |
| | |
| |
|
| | | 100 | | 100 |
| | |
| |
|
81
The uncommitted credit facilities available to us and CAPCO were comprised of short-term money market lines and overdraft facilities. The financial market stability and individual banks’ funding position may affect the availability of these uncommitted short-term credit facilities. However, we adopt a prudent approach in determining the appropriate mix of committed and uncommitted facilities and solicit our facilities from a pool of strong credit based financial institutions.
Borrowings
Out of the total HK$27,158 million (US$3,494 million) credit facilities available to us, HK$18,774 million (US$2,416 million) were drawn down at December 31, 2004. Our borrowings with maturities of less than one year amounted to HK$1,178 million (US$152 million). Those with maturities of between one to five years and of longer than five years amounted to HK$11,340 million (US$1,459 million) and HK$6,256 million (US$805 million) respectively. The undrawn credit facilities are part of our source of liquidity for financing our operations and continuous business expansion.
For CAPCO, out of the total HK$10,102 million (US$1,300 million) credit facilities available, HK$9,585 million (US$1,233 million) were drawn down at December 31, 2004. CAPCO’s borrowings with maturities of less than one year amounted to HK$2,901 million (US$373 million). CAPCO’s borrowings with maturities of between one to five years and of longer than five years amounted to HK$4,980 million (US$641 million) and HK$1,704 million (US$219 million), respectively.
82
The type, interest rate, maturity and currency profile of our borrowings, as at December 31, 2004, as well as those for us and CAPCO combined, are summarized in the following tables:
| | | | |
| | | CLP Group
| | CLP Group And CAPCO
|
| | | % | | % |
Loan Balance in Percentage | | | | |
Export Credits | | – | | 4 |
U.S. Dollar Notes due 2006 | | 12 | | 8 |
Private Placement | | – | | 1 |
Term Loans | | 63 | | 66 |
Medium Term Notes due 2012 to 2014 | | 23 | | 15 |
Money Market Line (including bank overdraft) | | 2 | | 6 |
| | |
| |
|
| | | 100 | | 100 |
| | |
| |
|
Interest Rate Base in Percentage | | | | |
Floating Rate | | 41 | | 36 |
Fixed Rate | | 59 | | 64 |
| | |
| |
|
| | | 100 | | 100 |
| | |
| |
|
Maturity in Percentage | | | | |
Less than 1 year | | 6 | | 14 |
1-3 years | | 44 | | 40 |
4-5 years | | 17 | | 18 |
After 5 years | | 33 | | 28 |
| | |
| |
|
| | | 100 | | 100 |
| | |
| |
|
Currency in Percentage(1) & (2) | | | | |
HK Dollar Loans | | 34 | | 43 |
Foreign Currency Loans (Hedged into HK Dollar) | | 25 | | 30 |
EUR Loans | | 4 | | 2 |
INR Loans | | 4 | | 3 |
AUD Loans | | 33 | | 22 |
| | |
| |
|
| | | 100 | | 100 |
| | |
| |
|
| (1) | The Australian dollar loans were mainly incurred by Yallourn Energy to refinance its project debts in 2001. |
| (2) | The loans in Euros and Indian Rupees were drawn by GPEC. |
The weighted average interest rate for total borrowings for us and CAPCO were 5.51% and 4.13% respectively for 2004, as compared to 5.14% and 4.23% respectively, for 2003. The borrowing costs will be affected by the changes in our financial strength, credit rating and economic and political conditions.
Our ratio of total debt to total capitalization (i.e. total debt divided by the sum of total debt and shareholders’ funds) was 29.8% at December 31, 2004, as compared to 31.5% at December 31, 2003. Our ratios of earnings to fixed charges were 10:1 and 12:1 for 2004 and 2003, respectively. See “Item 3. Key Information — A. Selected Financial Data”.
83
We or our subsidiaries and affiliates, which are parties to our respective credit facilities, are required to comply with certain financial ratios and covenants. In particular, under certain loan agreements entered into by CAPCO, by which CAPCO is required to maintain the ratio of its borrowings to shareholders’ funds to be not more than 150%. At December 31, 2004, CAPCO’s ratio of borrowings to shareholders’ funds was 50%. Under some of our loan agreements, committed or uncommitted, a material adverse change in our business could give rise to the acceleration of our repayment obligations and/or cancellation of available commitments. Under the current outlook, we do not expect any material adverse change in our business and believe we will be able to comply with the financial covenants.
Financial Instruments for Hedging
We have, from time to time, entered into forward foreign exchange contracts, currency swaps and options to hedge our foreign currency exposure arising from loan repayment and interest payment obligations, purchase of goods and services, fuel related payments and overseas investment activities. We use interest rate swaps to manage our interest rate risk within a preferred interest rate mix. These derivative instruments are used with an objective to minimize the impact of exchange rate and interest rate fluctuations on earnings, reserves and tariff charges to customers. Our subsidiary in Australia, Yallourn Energy, has also entered into electricity energy contracts, including forward electricity pricing contracts, swaps and options to help reduce the impact on earnings of the volatility of electricity prices. Other than certain limited electricity trading activities engaged by Yallourn Energy, we employ these derivative instruments solely for hedging purposes.
As of December 31, 2004, our outstanding forward foreign exchange contracts, currency swaps, interest rate swaps, energy hedging and trading swaps and options amounted to HK$74,394 million (US$9,572 million), of which HK$266 million (US$34 million) were related to electricity trading activities.
The outstanding balance of CAPCO’s off-balance sheet financial instruments stood at HK$4,378 million (US$563 million) as of December 31, 2004, all of which are interest rate swaps.
The types of off-balance sheet financial instruments as of December 31, 2004 are as follows:
| | | | |
| | | CLP Group
| | CLP Group and CAPCO
|
| | | % | | % |
Types of Off-balance Sheet Financial Instruments | | | | |
Forward Foreign Exchange Contracts | | 61 | | 57 |
Interest Rate Swaps | | 22 | | 26 |
Currency Swaps | | 6 | | 6 |
Energy Hedging & Trading Swap Contracts | | 3 | | 3 |
Energy Hedging & Trading Options | | 8 | | 8 |
| | |
| |
|
| | | 100 | | 100 |
| | |
| |
|
84
The fair value of our Group’s off-balance sheet financial instruments as of December 31, 2004 was a deficit of HK$1,199 million (US$154 million), which represents the net amount we would pay if these outstanding derivative instruments were closed out on December 31, 2004. The deficit was largely caused by a significant decline in the forward currency markets of the U.S. dollar against the Hong Kong dollar over the year.
As of December 31, 2004 the fair value of the Group and CAPCO’s off-balance sheet financial instruments was at deficit of HK$1,452 million (US$187 million).
Capital Expenditure
As at December 31, 2004, we had contracted for capital expenditures in the amount of HK$2,207 million (US$284 million). The contracted amount for us and CAPCO combined was HK$2,440 million (US$314 million), of which the contracted amount for 2005 totaled HK$1,945 million (US$250 million). These expenditures will be used primarily for enhancing our transmission and distribution systems in Hong Kong. We expect to continue to make significant investments in fixed assets over the next several years which will be financed by internal resources, borrowings from banks and the issuance of debt securities.
85
C. Research and Development, Patents and Licenses, Etc.
Our research and development activities are led by our wholly owned subsidiary, CLP Research Institute Limited, which was set up with the mission to strengthen our innovation capabilities with the intent of increasing the economic, social and environmental value of our products, services and businesses in the communities we serve.
These activities are principally conducted in the form of trend monitoring, research concept development, project sponsorship and collaboration, and knowledge sharing throughout the CLP Group. Our current research topics focus on environmental policy, sustainable development and renewable energy. See “Item 4. Information on the Company — B. Business Overview — Electricity-Related Business — Research and Development”.
The amounts incurred for research activities have been immaterial to our business operations. In addition, patents and licenses are immaterial to our business operations.
D. Trend Information
Please see “— A. Operating Results” above for a discussion of the most significant recent trends in our operations, sales and revenues since the end of 2004. In addition, please refer to discussions included in that Item regarding known trends, uncertainties, demands, commitments or events that we believe are reasonably likely to have a material effect on our net operating revenues, income from continuing operations, profitability, liquidity or capital resources, or that would cause reported financial information not necessarily to be indicative of future operating results or financial condition.
86
E. Off-Balance Sheet Arrangements
Other than those disclosed in Notes 29 and 30 to our financial statements set forth in “Item 17. Financial Statements” and “Item 11. Quantitative and Qualitative Disclosures about Market Risk”, we have no other off-balance sheet arrangements that have or are reasonably likely to have a current or future effect on our financial condition, revenues or expenses, result of operations, liquidity, capital expenditure or capital resources that is material to investors.
F. Tabular disclosure of Contractual Obligations
The following table summarizes our contractual obligations in effect as of December 31, 2004.
| | | | | | | | | | |
| | | Payments Due by Period
|
Contractual Obligations – CLP Group(1)
| | Total
| | Less than
1 year
| | 1-3
years
| | 4-5
years
| | After 5
years
|
| | | (in HK$ millions) |
| | | | | |
Long-term debt obligations(2) | | 18,352 | | 756 | | 8,223 | | 3,117 | | 6,256 |
Purchase obligations(3) | | 148,782 | | 17,525 | | 26,748 | | 21,489 | | 83,020 |
| | |
| |
| |
| |
| |
|
Total | | 167,134 | | 18,281 | | 34,971 | | 24,606 | | 89,276 |
| | |
| |
| |
| |
| |
|
| (1) | We have no significant operating lease commitments or sale and leaseback arrangements as at December 31, 2004. |
| (2) | See Note 26 to our financial statements included in “Item 17. Financial Statements” in this annual report. |
| (3) | Amount excluded certain open purchase orders for services that are provided on demand and the timing and amount of the purchase cannot be determined. The amount mainly included our estimated minimum obligations that are anticipated to arise under (i) the Electricity Supply Contract between CLP Power Hong Kong and CAPCO, (ii) the offtake and resale contracts of HKNIC with Guangdong Nuclear Investment Company, Limited, respectively, and (iii) the capacity purchase contract between CLP Power Hong Kong and PSDC. (see “Item 7. Major Shareholders and Related Party Transactions — B. Related Party Transactions” below for details of these contracts). |
Also set out below are the aggregate amounts of contractual obligations of CAPCO as of December 31, 2004:
| | | | | | | | | | |
| | | Payments Due by Period
|
Contractual Obligations – CAPCO
| | Total
| | Less than
1 year
| | 1-3
years
| | 4-5
years
| | After 5
years
|
| | | (in HK$ millions) |
| | | | | |
Long-term debt obligations | | 8,350 | | 1,666 | | 3,065 | | 1,915 | | 1,704 |
Purchase obligations(1) | | 22,153 | | 3,627 | | 5,067 | | 3,845 | | 9,614 |
| | |
| |
| |
| |
| |
|
Total | | 30,503 | | 5,293 | | 8,132 | | 5,760 | | 11,318 |
| | |
| |
| |
| |
| |
|
| (1) | Amount includes the obligations on fuel-related payments. |
87
| Item 6. | Directors, Senior Management and Employees |
A. Directors and Senior Management
Under our Articles of Association, our business is managed under the direction of our Board of Directors, or the Board. Our Group Managing Director & Chief Executive Officer represents us and administers our day-to-day business in all matters not specifically designated as the responsibilities of our Board of Directors.
The presence of three Board members at a Board meeting constitutes a voting quorum and resolutions can be passed by a majority of the Board members then present. The Board met five times in 2004.
The following table shows information regarding all of our Directors and Executive Officers as of May 31, 2005.
| | | | | | | | |
Name
| | Age
| | Position
| | Year
Appointed
to Current
Title
| | Year
Appointed
as Director
of our
Company
|
Board of Directors | | | | | | | | |
| | | | |
Non-executive Directors | | | | | | | | |
| | | | |
Michael D. Kadoorie | | 63 | | Chairman | | 1997 | | 1997 |
W. E. Mocatta | | 52 | | Vice Chairman | | 1999 | | 1997 |
J. S. Dickson Leach | | 59 | | Vice Chairman | | 1999 | | 1997 |
R. J. McAulay | | 69 | | Director | | 1997 | | 1997 |
J. A. H. Leigh | | 51 | | Director | | 1997 | | 1997 |
R. Bischof | | 63 | | Director | | 1997 | | 1997 |
I. D. Boyce | | 60 | | Director | | 1999 | | 1999 |
P. C. Tan | | 58 | | Director | | 2003 | | 2003 |
| | | | |
Independent Non-executive Directors | | | | | | | | |
| | | | |
S. Y. Chung | | 87 | | Director | | 1997 | | 1997 |
William K. Fung | | 56 | | Director | | 1997 | | 1997 |
V. F. Moore | | 58 | | Director | | 2002 | | 1997 |
Hansen C. H. Loh | | 67 | | Director | | 2000 | | 2000 |
Paul M. L. Kan | | 58 | | Director | | 2001 | | 2001 |
Judy Tsui Lam Sin Lai(1) | | 50 | | Director | | 2005 | | 2005 |
| | | | |
Group Managing Director | | | | | | | | |
| | | | |
Andrew Brandler | | 49 | | Group Managing Director & Chief Executive Officer | | 2000 | | 2000 |
88
| | | | | | | | |
Name
| | Age
| | Position
| | Year
Appointed
to Current
Title
| | Year
Appointed
as Director
of our
Company
|
Executive Directors | | | | | | | | |
| | | | |
Peter P. W. Tse | | 54 | | Group Executive Director & Chief Financial Officer | | 2000 | | 2000 |
Peter W. Greenwood | | 48 | | Director & Company Secretary | | 2001 | | 2001 |
Y. B. Lee | | 58 | | Group Executive Director | | 2003 | | 2003 |
| | | | |
Alternate Director | | | | | | | | |
| | | | |
Bradley W. Corson (Alternate to P. C. Tan) | | 43 | | Chairman, ExxonMobil Energy Limited | | 2004 | | 2004 |
| | | | |
Executive Officers | | | | | | | | |
| | | | |
Andrew Brandler | | 49 | | Group Managing Director & Chief Executive Officer | | 2000 | | 2000 |
Peter P. W. Tse | | 54 | | Group Executive Director & Chief Financial Officer | | 2000 | | 2000 |
Peter W. Greenwood | | 48 | | Director & Company Secretary | | 2001 | | 2001 |
Y. B. Lee | | 58 | | Group Executive Director | | 2003 | | 2003 |
Betty Yuen | | 47 | | Managing Director, CLP Power Hong Kong | | 2002 | | – |
Richard McIndoe | | 40 | | Managing Director, CLP Power Asia | | 2003 | | – |
| (1) | Professor Judy Tsui Lam Sin Lai was appointed as an Independent Non-executive Director with effect from May 10, 2005. |
At the Annual General Meeting each year, one-third of the Directors for the time being or, if the number is not a multiple of three, the number nearest to but not greater than one-third (who have been longest in office since their last election or appointment) shall retire and are eligible for re-election in accordance with our Articles of Association. At the Annual General Meeting held on April 28, 2005, shareholders approved an amendment to the Articles of Association of our Company by passing a Special Resolution such that if the number of one-third of the Directors is not a multiple of three, the number nearest to but greater than one-third (who have been longest in office since their last election or appointment) shall retire and are eligible for re-election. Details of the amended Articles of Association of the Company are in Exhibit 1.1.
In accordance with Article 103 of our Articles of Association, Mr. Andrew Clifford Winawer Brandler, The Hon. Michael David Kadoorie, The Hon. Sir Chung Sze Yuen, Mr. John Andrew Harry Leigh and Mr. Kan Man Lok, Paul retired by rotation and, being eligible, were re-elected as our Directors at our Annual General Meeting held on April 28, 2005.
89
Non-executive Directors
The Hon. Michael D. Kadoorie, GBS, LLD (Hon.)
Dr. The Hon. Michael D. Kadoorie is an Officier de la Légion d’Honneur, Commandeur de l’Ordre de Léopold II and Commandeur de l’Ordre des Arts et des Lettres. He is the Chairman of The Hongkong and Shanghai Hotels, Ltd., Heliservices (Hong Kong) Ltd., CLP Research Institute Ltd. as well as a Director of Sir Elly Kadoorie & Sons Ltd., Hong Kong Aircraft Engineering Co. Ltd. and Hutchison Whampoa Ltd. He is the brother-in-law of a fellow Director, Mr. R. J. McAulay. Since 1967, Dr. The Hon. Michael D. Kadoorie had served on the Board of China Light & Power Company, Ltd., the holding company of the CLP Group prior to our Group reorganization in 1998.
W. E. Mocatta, FCA
Mr. Mocatta is a Fellow of The Institute of Chartered Accountants in England and Wales. He became an Executive Director of Sir Elly Kadoorie & Sons Ltd. in 1982. He is the Chairman of CLP Power Hong Kong Ltd. and CLP Properties Ltd. He is a Director of The Hongkong and Shanghai Hotels, Ltd. and other companies in Hong Kong. Since 1993, Mr. Mocatta had been a Director of China Light & Power Company, Ltd., the holding company of the CLP Group prior to our Group reorganization in 1998.
J. S. Dickson Leach, MBA, FCA
Mr. Dickson Leach holds an MBA degree from Columbia University and is a Fellow of The Institute of Chartered Accountants in England and Wales. He is the Chairman of CLP Power Asia Ltd. He is also Chairman of Sir Elly Kadoorie & Sons Ltd. He is a Director of Hong Kong Aircraft Engineering Co. Ltd. and The Hongkong & Shanghai Hotels, Ltd. Since 1978, Mr. Dickson Leach had been a Director of China Light & Power Company, Ltd., the holding company of the CLP Group prior to our Group reorganization in 1998.
R. J. McAulay, MA, CA
Mr. McAulay holds an MA degree from the University of Glasgow and is a Member of The Institute of Chartered Accountants in Scotland. He is the brother-in-law of Dr. The Hon. Michael D. Kadoorie, our Chairman. Mr. McAulay is a Director of Sir Elly Kadoorie & Sons Ltd. and The Hongkong and Shanghai Hotels, Ltd. He is also a trustee or council member of a number of commercial, artistic or charitable organizations, in Hong Kong and elsewhere. Since 1968, Mr. McAulay had served on the Board of China Light & Power Company, Ltd., the holding company of the CLP Group prior to our Group reorganization in 1998.
90
J. A. H. Leigh
Mr. Leigh is a lawyer by training. Prior to joining the CLP Group, Mr. Leigh was in private practice as a solicitor in Hong Kong and the United Kingdom. He was the Senior Legal Advisor, Company Secretary and General Manager - Corporate Affairs in the CLP Group between 1986 and 1996. Mr. Leigh is a Director of Sir Elly Kadoorie & Sons Ltd. overseeing a number of the Kadoorie Family’s interests in Hong Kong and overseas. Since 1997, Mr. Leigh had served on the Board of China Light & Power Company, Ltd., the holding company of the CLP Group prior to our Group reorganization in 1998.
R. Bischof
Educated in Switzerland, Mr. Bischof has been engaged in the field of asset management and private banking in Hong Kong since 1971, including several years with the former Swiss Bank Corporation. Prior to coming to Hong Kong, Mr. Bischof also worked for a leading British investment bank in London, Madrid and New York. He joined Sir Elly Kadoorie & Sons Ltd. as a Director in 1996. He is also a Director of Nanyang Holdings Ltd. Since 1997, Mr. Bischof had served on the Board of China Light & Power Company, Ltd., the holding company of the CLP Group prior to our Group reorganization in 1998.
I. D. Boyce, FCA
A chartered accountant from the United Kingdom, Mr. Boyce spent 18 years with the Warburg group, six years of which were as Managing Director of East Asia Warburg in Hong Kong; and nine years with Schroders Asia, also in Hong Kong. Mr. Boyce was Managing Director (Vice Chairman from April 1998) of Schroders Asia before joining Sir Elly Kadoorie & Sons Ltd. as a Director in 1999. Mr. Boyce is also the Deputy Chairman of The Hongkong and Shanghai Hotels, Ltd. and a Director of Tai Ping Carpets International Ltd.
P. C. Tan, BSc, MBA
Mr. Tan is the Chairman of ExxonMobil China Investment Co., Ltd. and ExxonMobil Hong Kong Ltd. with oversight responsibility for ExxonMobil’s businesses in the Chinese mainland and Hong Kong. Mr. Tan graduated from the University of Singapore with a Bachelor of Science (Applied Chemistry) and an MBA degree from New York University. He joined Mobil Oil in Singapore in 1970 and worked in Singapore, the United States and Australia. Mr. Tan is a member of the Board of Governors of the American Chamber of Commerce in Hong Kong.
91
Independent Non-executive Directors
The Hon. Sir S. Y. Chung, GBM, GBE, PhD, FREng., JP
Sir S. Y. is the Chairman and an Independent Non-executive Director of The Kowloon Motor Bus Holdings Ltd., a Director of Sun Hung Kai Properties Ltd. as well as other companies in Hong Kong. He has contributed significantly in Hong Kong’s political, industrial, social and tertiary education fields for over four decades. He was Senior Member of Hong Kong Legislative Council (1974-78), Executive Council (1980-88), and again Convenor of HKSAR Executive Council (1997-99). He was deeply involved in the Sino-British negotiations on Hong Kong’s future (1982-85) and the establishment of the HKSAR (1993-97). Since 1967, Sir S. Y. Chung had served on the Board of China Light & Power Company, Ltd., the holding company of the CLP Group prior to our Group reorganization in 1998.
William K. Fung, OBE, DBA, MBA, BSE, JP
Dr. Fung is Group Managing Director of Li & Fung Ltd., and has held key positions in major trade associations. He currently serves as a member of the Economic and Employment Council of the Hong Kong SAR. He holds a Bachelor of Science degree in Engineering from Princeton University, an MBA degree from the Harvard Graduate School of Business, and an Honorary Doctorate degree of Business Administration awarded by the Hong Kong University of Science and Technology. He is also a Non-executive Director of Integrated Distribution Services Group Ltd., Convenience Retail Asia Ltd., HSBC Holdings plc, chinadotcom corporation (now known as CDC Corporation) and VTech Holdings Ltd. Since 1994, Dr. Fung had served on the Board of China Light & Power Company, Ltd., the holding company of the CLP Group prior to our Group reorganization in 1998.
V. F. Moore, BBS, FCA, FCPA
Mr. Moore is an executive director of CITIC Pacific Ltd. and CITIC Hong Kong (Holdings) Ltd. In addition to CLP, he is a Non-executive director of Cathay Pacific Airways Ltd., Chairman of New Hong Kong Tunnel Company Ltd. and Western Harbour Tunnel Company Ltd., and Deputy Chairman of CITIC Capital Markets Holdings Ltd. Since 1997, Mr. Moore had served on the Board of China Light & Power Company, Ltd., the holding company of the CLP Group prior to our Group reorganization in 1998.
Hansen C. H. Loh
Mr. Loh is the Chairman of Farrington American Express Travel Services Ltd. He is also the Managing Director of Wyler Textiles Ltd. and a Non-executive Director of CITIC Pacific Ltd., of which he is also a member of the Audit Committee.
Paul M. L. Kan, MBA
Mr. Kan holds an MBA degree from the Chinese University of Hong Kong, and various professional qualifications with a number of computing and engineering societies and institutes in the U.K. and U.S.A. He is the founder and the Chairman of Champion Technology Holdings Ltd. and Kantone Holdings Ltd. He is also the Chairman of DIGITALHONGKONG.COM.
92
Judy Tsui Lam Sin Lai, PhD, MSc, BCom, FCPA, FCPA(Aust.), CA
Professor Judy Tsui is currently Dean of the Faculty of Business, Director of the Graduate School of Business and Chair Professor of Accounting at The Hong Kong Polytechnic University. She holds a Bachelor of Commerce in Accounting and Management Information Systems from the University of British Columbia, a Master of Science in Accounting and Finance from the London School of Economics and a Ph.D in Accounting from The Chinese University of Hong Kong. In addition to an outstanding academic career, Professor Tsui has a distinguished record of community service, above all in the fields of accounting and corporate governance. Amongst other appointments, Professor Tsui is a member of the Consultative Advisory Group of the Education Committee of the International Federation of Accountants representing the Confederation of Asian and Pacific Accountants and is a member of Hong Kong’s Inland Revenue Department Users’ Committee. Recently, she has also been appointed as an independent non-executive director in China Vanke Co. Ltd., a listed company on the Shenzhen Stock Exchange.
Group Managing Director & Chief Executive Officer
Andrew Brandler, MA, MBA, ACA
Mr. Brandler holds an MA degree from the University of Cambridge, MBA degree from Harvard Business School, and is a Member of The Institute of Chartered Accountants in England and Wales. He joined our Group as the Group Managing Director and Chief Executive Officer in May 2000. Prior to joining our Group, Mr. Brandler was an investment banker, specializing in the energy and utility sectors and was the Head of Asia-Pacific Corporate Finance with Schroders, based in Hong Kong.
Group Executive Director & Chief Financial Officer
Peter P. W. Tse, BSc (Eng.), MSc, FCA, FCPA
Mr. Tse holds a BSc degree in Mechanical Engineering from the University of Hong Kong, and an MSc degree from the University of Stirling in Scotland. He is a Fellow of The Institute of Chartered Accountants in England and Wales and a Fellow of The Hong Kong Institute of Certified Public Accountants. Mr. Tse is the Chief Financial Officer of the Group. Before joining our Group in 1981, he worked with Deloitte & Co. in London and Hong Kong, and the Swire Group.
Director & Company Secretary
Peter W. Greenwood, MA, FCS, FCIS
Mr. Greenwood holds an MA degree in law from the University of Cambridge. He is a Fellow of The Institute of Chartered Secretaries in England and a Fellow of The Hong Kong Institute of Company Secretaries. He is a solicitor in England and Wales and in Hong Kong as well as being qualified as an avocat in France. Mr. Greenwood is the Corporate Counsel and Company Secretary of the Group. Before joining our Group in 1995, he was a solicitor with leading corporate law firms in the United Kingdom, Hong Kong and France.
93
Group Executive Director
Y. B. Lee, BSc, MSc, PhD, DIC, C.Eng., MIEE, FHKIE
Dr. Lee holds a BSc degree in Electrical Engineering from the University of Hong Kong, an MSc degree from Imperial College, University of London and a PhD from the University of Bath. He is a Chartered Engineer and a Fellow of the Hong Kong Institution of Engineers. Dr. Lee is the Group Executive Director, Managing Director of Hong Kong Nuclear Investment Co. Ltd. and the Senior Advisor to the Group for China affairs. He first joined our Group in 1976 and has taught at the University of New South Wales, Australia.
Alternate Director
Bradley W. Corson, BS (Chemical Engineering)
Mr. Corson is the Chairman of ExxonMobil Energy Ltd., Castle Peak Power Co. Ltd. as well as Hong Kong Pumped Storage Development Co., Ltd. He is also a Director of CLP Power Hong Kong Ltd. and CLP Research Institute Ltd. Mr. Corson holds a Bachelor of Science degree in Chemical Engineering from Auburn University. He joined Exxon Mobil Corporation (then Exxon Corporation) in 1983 and has broad experience in the oil and gas industry including operations, technical, environmental, commercial, strategic planning and human resources. He was assigned to work in Hong Kong as the Chairman of ExxonMobil Energy Ltd. in April 2004.
Executive Officers
For the biographical details of Mr. Andrew Brandler, Mr. Peter P. W. Tse, Mr. Peter W. Greenwood and Dr. Y. B. Lee, please refer to the details shown above.
Betty Yuen, B.Comm., CA (Canada)
Managing Director, CLP Power Hong Kong
Mrs. Yuen has overall responsibility for CLP Power Hong Kong Ltd. Mrs. Yuen began her career in public accounting in Canada. She spent 13 years with ExxonMobil Energy Ltd. and her latest position there was Executive Director – Finance and Development before taking up the position in CLP Power Hong Kong Ltd. as Director – Finance and Planning in 1999. Mrs. Yuen assumed her current position in April 2002.
Richard McIndoe, MA, MBA
Managing Director, CLP Power Asia
Mr. Mclndoe joined our Group in 2002. He is responsible for the development and operations of the Group’s electricity business outside Hong Kong. He has extensive background in business development and commercial asset management in the regional electricity industry, as well as spending several years with a major international investment bank, based in Hong Kong. He holds an MA degree from the University of Cambridge and an MBA degree from INSEAD Business School in France.
94
B. Compensation
We have established policies to determine remuneration levels paid to our Non-executive Directors, Executive Directors and Senior Management. The main elements of our remuneration policies are:
| | • | | No individual should determine his or her own remuneration; |
| | • | | Remuneration should be broadly aligned with companies with whom we compete for human resources; and |
| | • | | Remuneration should reflect performance, complexity and responsibility with a view to attracting, motivating and retaining high performing individuals and promoting the enhancement of the value of our Company to the shareholders. |
Non-executive Directors’ Remuneration
Our fees paid to Non-executive Directors are set at levels in line with market practice, based on a formal independent review undertaken no less frequently than every three years.
The role of Non-executive Directors has become more complex and demanding – as a result of both regulatory change and the increasing part such directors play in the good governance of listed companies. In the U.K., the “Review of the Role and Effectiveness of Non-executive Directors” (commonly known as “The Higgs Report”) published in January 2003 discussed these trends. It concluded that “the level of remuneration for any particular non-executive director should reflect the likely workload, the scale and complexity of the business and the responsibility involved” and that “it may be helpful in assessing remuneration for non-executive directors to use as a benchmark the daily remuneration of a senior representative of the company’s professional advisors”. The U.K. Combined Code on Corporate Governance of July 2003 provides that levels of remuneration for non-executive directors should reflect the time commitments and responsibilities of the role, but should not include share options.
In view of the growing responsibilities of non-executive directors and market trends as illustrated by the Higgs Report and the U.K. Combined Code (which we expected to be reflected in the Hong Kong regulatory framework in due course), we undertook a review at the beginning of 2004 of the fees paid to our Non-executive Directors. The methodology adopted in this review was aligned with the recommendations of the Higgs Report and included:
| | • | | application of an hourly rate of HK$4,000 as an average of the partner rates charged by legal and financial advisors and accounting and consulting firms in providing professional services to us; |
| | • | | calculation of the time spent by Non-executive Directors on our affairs (including attendance at Board and Board Committee meetings, reading of papers, site visits etc.). This indicated that a Non-executive Director can be expected to spend approximately 50 hours per annum on Board matters (excluding additional time spent in serving on Board Committees); and |
| | • | | an additional fee of about 40% and 10% for chairmanship of the Board/Board Committees and vice-chairmanship of the Board respectively. |
95
The resulting fees were then benchmarked against comparable companies in Hong Kong (as far as possible, given the limitations of the information publicly available). The methodology and proposed fees were independently reviewed by Deloitte & Touche Enterprise Risk Services Limited (DTERS).
In line with our policy that no individual should determine his or her own remuneration, the proposed fees for Non-executive Directors were recommended by the Management, reviewed by DTERS and approved by our shareholders at the Annual General Meeting on April 22, 2004. The revised fees took effect as from July 1, 2004 and are as follows:
| | | | |
| | | Fees per annum (w.e.f. July 1, 2004) HK$
| | Fees per annum in 2003 HK$
|
Board | | | | |
Chairman | | 280,000 | | 225,000 |
Vice Chairman | | 220,000 | | 150,000 |
Non-executive Director | | 200,000 | | 100,000 |
| | |
Nomination Committee | | | | |
Chairman | | 10,000 | | — |
Member | | 10,000 | | — |
| | |
Audit Committee | | | | |
Chairman | | 140,000 | | 50,000 |
Member | | 100,000 | | 50,000 |
| | |
Finance & General Committee | | | | |
Chairman | | 110,000 | | — |
Member | | 80,000 | | — |
| | |
Human Resources & Remuneration Committee | | | | |
Chairman | | 14,000 | | — |
Member | | 10,000 | | — |
| | |
Regulatory Affairs Committee | | | | |
Chairman | | 30,000 | | — |
Member | | 20,000 | | — |
| | |
Provident & Retirement Fund Committee | | | | |
Chairman | | — | | — |
Member | | — | | — |
|
| Note: Executive Directors serving on the Board and Board Committees are not entitled to any Directors’ fees. There was no additional fee paid to the Chairman of the Nomination Committee, as this comprises only three members. |
96
Executive Directors’ Remuneration
In determining the remuneration of Executive Directors, the remuneration data of comparable positions in the market, including local and regional companies of comparable size, complexity and business scope, are referenced. This is consistent with our remuneration policy to align with companies with whom we compete for human resources. The Chairman of the Human Resources & Remuneration Committee has sought the views of institutional shareholders in CLP on the structure and reasonableness of the remuneration of the Executive Directors. Achievement of performance plays a significant part in individual rewards as part of our policy to attract, motivate and retain high performing individuals. There are three key components of Executive Directors’ remuneration, namely, base compensation, performance bonus and pension arrangements, details of which are set out in Note 7 to our financial statements included in “Item 17. Financial Statements” in this annual report.
The amount of remuneration and its breakdown paid to each of the individual Executive Directors in 2002, 2003 and 2004 and the total remuneration paid to all the Directors (Non-executive and Executive) in 2002, 2003 and 2004 are also set out in Note 7 to our financial statements included in “Item 17. Financial Statements” in this annual report.
Senior Management’s Remuneration
The Group’s Senior Management refers to the two Managing Directors of our major subsidiaries, CLP Power Hong Kong Limited and CLP Power Asia Limited, as well as the Executive Directors. These two individuals are subject to the same pay policies of the Group, i.e. market alignment and reward for performance, as those applied to the Executive Directors. Similarly, they are both eligible for the three components of total remuneration, as payable to the Executive Directors, namely, base compensation, incentive bonus and pension arrangements. The principles for the application of these three components are the same for all members of Senior Management.
For Senior Management, base compensation accounts for approximately 56% of total remuneration. It is reviewed annually taking into consideration the competitive market position, market practice and individual performance.
The “target” annual incentive accounts for 28% of total remuneration for Senior Management. An award was made in 2004, based on an assessment of the 2003 performance of the Group, the business units, the functions and the individuals concerned. The average payout to this group in 2004 was 51% above the target level as supported by the achievement of financial goals, operational performance targets and individual objectives for 2003.
Senior Management is also eligible to take part in the Long-Term Incentive Plan, which accounts for 9% of their remuneration at target performance.
The retirement benefits for Senior Management represent 7% of their target total remuneration.
The pay policies applied to the Senior Management also form the basis of the remuneration for leading managers across the Group.
97
Continued Scrutiny and Disclosure
The Human Resources & Remuneration Committee remains committed to continued scrutiny of remuneration levels, and to high standards of disclosure to shareholders on such matters.
We have expanded the information on the remuneration of Non-executive Directors, Executive Directors and Senior Management, as set out in Notes 7 and 8 to our financial statements included in “Item 17. Financial Statements” in this annual report.
98
C. Board Practices
For discussion of the term of office of members of our Board, see “Item 6A. Directors and Senior Management” above.
We and our subsidiaries have not signed any service contract with any of our Directors and Executive Officers in respect of provision of benefits upon termination of employment which exceeds one year’s salary and benefits in kind.
Our Board has appointed a number of Board Committees to oversee particular aspects of our affairs. Major terms of reference of these Committees are set out in the CLP Code on Corporate Governance (the “CLP Code”). Details of our corporate governance practices are covered in our Corporate Governance section below. The CLP Code is also available in full on our website atwww.clpgroup.comor upon request to the Company Secretary in writing.
The composition of our Board Committees during 2004 and up to May 31, 2005 is set out below.
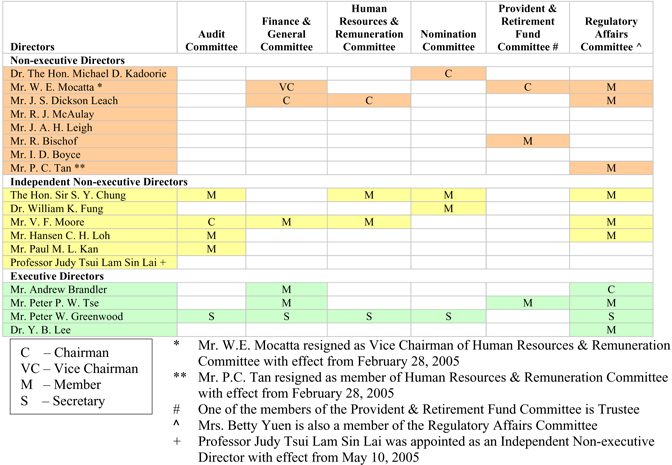
Audit Committee
The Audit Committee was established in 1981. All of its members are appointed from the Independent Non-executive Directors, with the Chairman having appropriate professional qualification and experience in financial matters.
Directors
Audit Committee
Finance & General Committee Human Resources & Remuneration Committee
Nomination Committee Provident & Retirement Fund Committee #
Regulatory Affairs Committee ^
Non-executive Directors
Dr. The Hon. Michael D. Kadoorie C
Mr. W. E. Mocatta * VC C M
Mr. J. S. Dickson Leach C C M
Mr. R. J. McAulay
Mr. J. A. H. Leigh
Mr. R. Bischof M
Mr. I. D. Boyce
Mr. P. C. Tan ** M
Independent Non-executive Directors
The Hon. Sir S. Y. Chung M M M M
Dr. William K. Fung M
Mr. V. F. Moore C M M M
Mr. Hansen C. H. Loh M M
Mr. Paul M. L. Kan M
Professor Judy Tsui Lam Sin Lai +
Executive Directors
Mr. Andrew Brandler M C
Mr. Peter P. W. Tse M M M
Mr. Peter W. Greenwood S S S S S
Dr. Y. B. Lee M
* Mr. W.E. Mocatta resigned as Vice Chairman of Human Resources & Remuneration
Committee with effect from February 28, 2005
** Mr. P.C. Tan resigned as member of Human Resources & Remuneration Committee with effect from February 28, 2005
# One of the members of the Provident & Retirement Fund Committee is Trustee
^ Mrs. Betty Yuen is also a member of the Regulatory Affairs Committee
+ Professor Judy Tsui Lam Sin Lai was appointed as an Independent Non-executive Director with effect from May 10, 2005
C – Chairman
VC – Vice Chairman M - Member
S – Secretary
99
The terms of reference of the Committee are aligned with the recommendations set out in “A Guide for Effective Audit Committee” issued by the Hong Kong Institute of Certified Public Accountants.
It is the practice of the Audit Committee to meet three times each year. Special meetings may be called at the discretion of the Chairman or at the request of our Group Managing Director or Group Internal Auditor to review significant control or financial issues. The Audit Committee Chairman gives an annual report to our Board covering the Committee’s activities for the year and highlighting any significant issues.
During 2004, the Audit Committee met on three occasions and discharged its responsibilities in its review of the half-yearly and annual results and system of internal control, and its other duties as set out in our CLP Code. The work performed by the Audit Committee in 2004 included reviews of:
| | • | | our Directors’ Report and Accounts for the year ended December 31, 2003 and the annual results announcement, with a recommendation to our Board for approval; |
| | • | | our Group Interim Accounts for the six months ended June 30, 2004 and the interim results announcement, with a recommendation to our Board for approval; |
| | • | | the compliance by the Company with the Code of Best Practice, the Rules Governing the Listing of Securities on The Stock Exchange of Hong Kong Limited (“Listing Rules”), Companies Ordinance and Securities and Futures Ordinance throughout the financial year ended December 31, 2003. No breaches were identified*; |
| | • | | the actions taken by Management regarding legal cases in which CLP Holdings or any member of the Group was a named defendant*; |
| | • | | the General Representation Letter signed jointly by our Group Managing Director & Chief Executive Officer (“CEO”) and Group Executive Director & Chief Financial Officer (“CFO”) regarding compliance with the internal control systems, disciplines and procedures for the year ended December 31, 2003*; |
| | • | | the report and management letter submitted by the External Auditors, which summarized matters arising from their audit on the Group for the year ended December 31, 2003 such as in respect of auditing and accounting matters, taxation issues and internal controls, together with the manner in which they had been addressed*; |
| | • | | the audit fees payable to External Auditors for the year ended December 31, 2003 for approval by our Board*; |
| | • | | the audit strategy submitted by the External Auditors for the year ended December 31, 2004 with a recommendation to our Board for them to be re-appointed for the financial year 2004 subject to final approval by the shareholders; |
| | • | | the audit related and permissible non-audit services including audit of provident funds (auditors appointed by trustee), tax advisory and filing services for staff working outside Hong Kong etc. and their related fees. For these matters, pre-approval was given in accordance with the set guidelines*; |
100
| | • | | 25 reports on the Group’s affairs submitted by Group Internal Audit during the course of 2003. Of these, two carried an unsatisfactory audit opinion. The issues arising from these have been addressed; |
| | • | | the staffing and resources of the Group Internal Audit Department; |
| | • | | the Group Internal Audit Plan for 2004 with areas of emphasis identified; |
| | • | | our Code of Conduct issues identified in 2003*; |
| | • | | the principal types of liability which were identified as not covered by the Company’s Directors’ and Officers’ Liability Insurance, together with the measures that we have taken to mitigate such risks and liability; and |
| | • | | the status of our procedures and internal controls with regard to customer complaints, in order to check that management disciplines and internal controls were in place to ensure maintenance of a high level of overall customer satisfaction. |
At its meeting on February 21, 2005 the Audit Committee reviewed our Directors’ Report and Accounts for the year ended December 31, 2004 and the annual results announcement, with a recommendation to our Board for approval. The Audit Committee was advised that two out of 28 reports on the Group’s affairs submitted by Group Internal Audit during the course of 2004 carried an unsatisfactory audit opinion, and the issues arising from these audits are being addressed. Other work performed by the Committee on that occasion included those marked ‘*’ in the above list, save that in each case the work related to the year ended December 31, 2004.
In addition, the Committee carried out other work during 2004 pertaining to the U.S. reporting requirements arising from the registration of the Company’s American Depositary Receipts with the U.S. Securities and Exchange Commission and the issue of Yankee Bonds by CLP Power Hong Kong Limited. This work included:
| | • | | approval of the Form 20-F of the Company for the financial year ended December 31, 2003 for filing with the U.S. Securities and Exchange Commission; |
| | • | | reviews of the status of our compliance with the Sarbanes-Oxley Act 2002; and |
| | • | | reviews of Management’s work to prepare for our compliance with the internal control requirements (Section 404) of the Sarbanes-Oxley Act. |
Finance and General Committee
The Finance and General Committee meets as and when required to review our financial operations. Such reviews include Group-wide financial, accounting, treasury and risk management policies, major financing transactions, corporate plans and budgets. The Committee also reviews major acquisitions of, or investments in, companies, businesses or projects and their funding requirements.
101
Human Resources & Remuneration Committee
Following the recent changes in its composition, a majority of the members of the Committee are now Independent Non-executive Directors. In line with good practice there are no Executive Directors on this Committee.
During 2004, the Committee met on one occasion. In performing its duties in accordance with its terms of reference, the work performed by the Committee during 2004 and at its subsequent meeting on January 31, 2005 included:
| | • | | the review of our performance for 2003 and 2004 and our Group Targets for 2004 and 2005; |
| | • | | the application of the 2001 Long-term Incentive Plan; |
| | • | | the approval of the 2003 and 2004 Remuneration Reports; and |
| | • | | the Group’s Base Pay Review for 2005. |
A particular responsibility of the Committee is the review and approval of the remuneration as set out in “B. Compensation” of this annual report, which includes a description of emolument policy and long-term incentive schemes as well as the basis of determining the emoluments payable to Directors.
Nomination Committee
During 2004, the Nomination Committee met on one occasion, in addition to a number of informal discussions, in furtherance of its duties with regard to the identification and recommendation to our Board of possible appointees as Directors of our Board. During the year under review, there were no resignations from our Board and all those Directors who retired by rotation at the 2004 AGM presented themselves for re-election by shareholders. In the circumstances, the Committee was not called upon to consider new appointees to fill Board vacancies.
Notwithstanding the existing size of our Board, which, throughout 2004 comprised 17 Directors, the Nomination Committee did consider the need for and possible appointments with regard to additional Independent Non-executive Directors. Although no such additional appointments have yet been recommended to our Board, the Committee has continued its deliberations in this respect, including with a view to meeting the objective, expressed in our CLP Code, that one-third of our Board should comprise Independent Non-executive Directors. This, in our case, would require the appointment of one additional Independent Non-executive Director, assuming that the remaining composition of our Board was unchanged. These considerations were reflected in the appointment of Professor Judy Tsui as an additional Independent Non-executive Director with effect from May 10, 2005.
In considering the appointment of Directors, the Committee applies the criteria set out in our CLP Code, notably the ability of potential appointees to contribute to the effective carrying out by our Board of the responsibilities set out in the Code.
102
At the 2005 AGM, five Directors retired by rotation and presented themselves for re-election and were elected by shareholders. The independence of those who are Independent Non-executive Directors has been reviewed by the Nomination Committee.
Provident & Retirement Fund Committee
The Committee advises the Trustee on investment policy and objectives for the Group’s retirement funds, namely, CLP Group Provident Fund Scheme and Mandatory Provident Fund Scheme. The Committee met on two occasions during 2004 and reviewed the position of the Funds, monitored the performance of the investment managers and considered and made recommendation to the Trustee on the appointment and removal of investment managers and on the investment of available funds outside the portfolios of the investment managers.
Regulatory Affairs Committee
The Regulatory Affairs Committee met on two occasions in 2004. It meets as and when required in order to review and advise upon matters in respect of the present or future regulation of CLP’s Hong Kong electricity business. During 2004, in light of the importance of these matters and the impending review by Government of the post-2008 regulatory regime for that business, the full Board itself paid particular attention to these matters.
CLP Values
Our vision of being a leading investor-operator in the Asia-Pacific electric power sector is underpinned by a broad set of values towards our stakeholders and key aspects of our operations. These ensure that we run our business in an honest and responsible manner.
Our overarching cultural and ethical standards are expressed in “From Vision to Reality” – a value framework drawn up in 2002 which sets out our vision, mission, strategy, values and policies. This framework is publicly disclosed, including on our website, so that stakeholders are aware of the standards which they can expect from us and whether these standards, and the manner in which we conduct ourselves in practice, meet their expectations.
The value framework is a major influence on our internal and external communications, including this annual report and our Social and Environmental Report, which is also available in full on our website atwww.clpgroup.com.
The value framework also includes a commitment to high standards of corporate governance, integrity and transparency. This reflects our view that corporate governance is not just a question of technical and regulatory compliance. It is, above all, a question of values or culture – a conscious decision to do the right thing as a company.
103
The value framework sets out the choices we have made. The following section describes some of the processes and systems we use to promote and monitor the respect of these values. The annual report as a whole seeks to explain to shareholders and other stakeholders how we live up to those values.

Corporate Governance
Maintaining a good, solid and sensible framework of corporate governance has been and remains one of our top priorities.
This involves, amongst others, two important commitments. First, to disclose our corporate governance practices openly and fully, so that our shareholders can form their own judgment on whether these meet their expectations. Secondly, to review our principles and practices in light of experience, regulatory requirements and international developments – recognizing that corporate governance is an evolving process and to move on a timely basis in response to incoming regulatory changes and developing corporate governance practices.
Our Corporate Governance Framework is used in the CLP Code to identify the key players involved in ensuring the application of good governance practices and policies within the Group and to give structure to our explanation of those practices and policies.
104
CLP’s Corporate Governance Framework
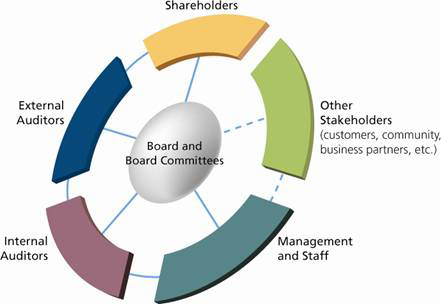
Shareholders
The Board and Senior Management recognize their responsibility to represent the interests of all shareholders and to maximize shareholder value.
We are incorporated in Hong Kong and we believe that it is appropriate to have chosen to be subject to the company law of the jurisdiction in which our business is based, where our shares are listed and where the vast majority of our shareholders are resident.
Further to the Hong Kong Companies Ordinance and our Articles of Association, an Extraordinary General Meeting (EGM) can be convened by a written request signed by shareholders holding not less than one-twentieth of the paid-up share capital of CLP, stating the objects of the meeting, and deposited at our registered office in Hong Kong at 147 Argyle Street, Kowloon.
The procedures for shareholders to put forward proposals at an Annual General Meeting (AGM) or EGM include a written notice of those proposals being submitted by shareholders, addressed to the Company Secretary at the registered office. The detailed procedures vary according to whether the proposal constitutes an ordinary resolution or a special resolution or whether the proposal relates to the election of a person other than a Director of the Company as a Director. The relevant procedures are set out in the Notice of AGM which accompanies the despatch of our annual report to shareholders and will be included with the notice to shareholders of any future AGM. The procedures for shareholders to convene and put forward proposals at an AGM or EGM are available on our website or on request to the Company Secretary.
105
At the AGM held on April 22, 2004 at the Peninsula Hotel, Kowloon, Hong Kong, the major items discussed and the percentage of votes cast in favor of the resolutions relating to those items were as follows:
| | • | | Re-election of Mr. Vernon F. Moore, Mr. Rudolf Bischof, Mr. Hansen Loh, Mr. William E. Mocatta and Mr. Peter P. W. Tse as Directors of our Company and the election of Dr. Y. B. Lee as a Director of our Company. (99.478% to 99.59% in respect of each individual resolution); |
| | • | | Amendments to the Articles of Association in order to make these consistent with the Companies (Amendment) Ordinance 2003 and amendments to Appendix 3 of the Listing Rules (99.782%). These were the only changes made to the Articles of Association during 2004; |
| | • | | Introduction of retirement by rotation for all Executive Directors (99.608%); |
| | • | | Revised levels of remuneration payable to the Non-executive Directors, effective from July 1, 2004 (99.972%); and |
| | • | | General mandate to Directors to issue additional shares in our Company, not exceeding 10% of the issued share capital (80.725%). |
In respect of the AGM held on April 28, 2005 at the Peninsula Hotel, Kowloon, Hong Kong, the major items discussed and the percentage of votes cast in favor of the resolutions relating to those items were as follows:
| | • | | Re-election of Mr. Andrew Clifford Winawer Brandler, The Hon. Michael David Kadoorie, The Hon. Sir Chung Sze Yuen, Mr. John Andrew Harry Leigh and Mr. Kan Man Lok, Paul as Directors of our Company (98.467% to 99.996% in respect of each individual resolution); |
| | • | | Approval of the term of appointment for Non-executive Director (99.665%); |
| | • | | Amendment to the Articles of Association so that every director will be subject to retirement by rotation at least once every three years (99.665%); |
| | • | | General mandate to Directors to issue additional shares in our Company, not exceeding 5% of the issued share capital (85.896%). |
All resolutions put to shareholders were passed at the 2004 and 2005 AGMs. The results of the voting by poll have been published on our website, the website of the Hong Kong Stock Exchange and also by notice in local newspapers. The full proceedings of the AGM can be viewed on the “Corporate Governance” section of our website. Minutes of each of the AGMs were sent to shareholders along with our first quarterly statement for 2004 and 2005 respectively.
We use a number of formal channels to account to shareholders for our performance and operations, particularly our annual and interim reports and quarterly statements. In addition, the AGM provides an opportunity for communication between our Board and shareholders. We regard the AGM as an important event in the corporate year and all Directors and Senior Management make an effort to attend. The Chairmen of the Audit Committee and Human Resources & Remuneration Committee will usually attend the AGM and answer questions. It is our policy to involve shareholders in our business affairs and to communicate with them face-to-face at the AGM and during visits to CLP about our activities and prospects.
106
We have also identified other information which is of particular interest to shareholders. Such information includes the details of our shareholders’ profile and aggregate shareholding, an explanation of the extent of our public float; and a calendar of important shareholders’ dates for 2005.
An analysis of the size of shareholdings and the distribution of share ownership by categories as at December 31, 2004 is provided in the following charts. Based on the information that is publicly available and within the knowledge of our directors, we have maintained a sufficient public float of our share capital in the Hong Kong stock market throughout the financial year ended December 31, 2004 and has continued to maintain such sufficiency as at February 28, 2005.
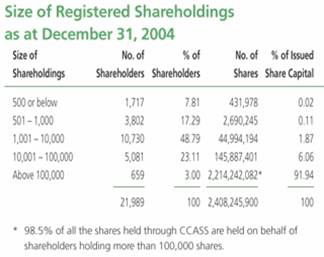
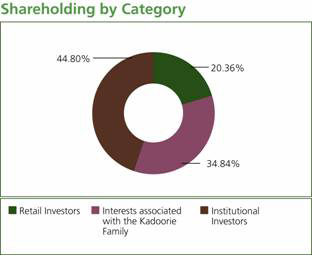
Size of Registered Shareholdings
as at December 31, 2004
Size of
Shareholdings
No. of
Shareholders
% of
Shareholders
No. of
Shares
% of Issued
Share Capital
500 or below
501 – 1,000
1,001 – 10,000
10,001 – 100,000
Above 100,000
1,717
3,802
10,730
5,081
659
21,989
7.81
17.29
48.79
23.11
3.00
100
431,978
2,690,245
44,994,194
145,887,401
2,214,242,082
2,408,245,900
0.02
0.11
1.87
6.06
91.94
100
* 98.5% of all the shares held through CCASS are held on behalf of shareholders holding more than 10,000 shares.
107
The important dates for shareholders in 2005 are set out in the table below. Any subsequent changes to these dates will be published on our website.
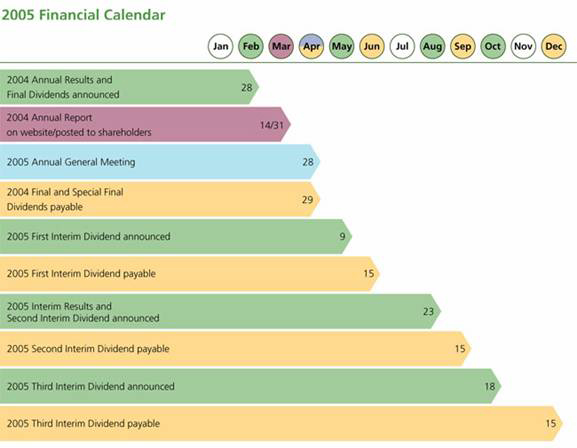
Enquiries may be put to our Board by contacting either the Company Secretary through our shareholders’ hotline 852-2678 8228, e-mail at cosec@clp.com.hk or directly by questions at an AGM or EGM. Questions on the procedures for convening or putting forward proposals at an AGM or EGM may also be put to the Company Secretary by the same means.
108
The Board
The Board is charged with promoting the success of our Company by directing and supervising its affairs in a responsible and effective manner. Each Director has a duty to act in good faith in the best interests of our Company. The Directors are aware of their collective and individual responsibilities to all shareholders for the manner in which the affairs of our Company are managed, controlled and operated.
The types of decisions which are to be taken by the Board include those relating to:
| | • | | The strategic direction of our Company; |
| | • | | The objectives of Management; |
| | • | | Monitoring the performance of Management; |
| | • | | Overseeing the management of our relationships with stakeholders, such as Government, customers, the community and others who have a legitimate interest in the responsible conduct of the Group’s business; |
| | • | | Ensuring that a framework of prudent and effective controls is in place to enable risks to be assessed and managed; and |
| | • | | Setting our Company’s values and standards. |
The Directors are responsible for the preparation of the accounts for each financial period which give a true and fair view of the state of affairs of the Group and of the results and cash flows for that period. In preparing these accounts for the year ended December 31, 2004, the Directors have selected suitable accounting policies and applied them consistently; made judgments and estimates that are prudent, fair and reasonable and prepared the accounts on a going concern basis. The Directors are responsible for keeping proper accounting records which disclose with reasonable accuracy at any time the financial position of the Group.
The Board comprises 18 Directors. All Directors (with the exception of the Group Managing Director and three Executive Directors) are non-executive and independent of Management, thereby promoting critical review and control of the management process. Our Board includes six influential and active Independent Non-executive Directors to whom shareholder concerns can be conveyed. The non-executive members of our Board also bring a wide range of business and financial experience to our Board, which contributes to the effective direction of the Group.
Details of all Directors, including the Chairman, Group Managing Director, Executive Directors, Non-executive Directors and Independent Non-executive Directors are included in “Item 6. Directors, Senior Management and Employees — A. Directors and Senior Management” of this annual report. The relationships (including financial, business, family or other material or relevant relationships) among Members of the Board are also disclosed. There is no such relationship as between the Chairman and the CEO.
109
During the year ended December 31, 2004, our Board at all times exceeded the minimum requirements of the Listing Rules relating to the appointment of at least three Independent Non-executive Directors, and complied with the requirement that these should include one such director with appropriate professional qualifications or accounting or related financial management expertise.
Pursuant to the requirement in the Listing Rules, our Company has received a written confirmation from each Independent Non-executive Director of his independence to our Company. We consider all of the Independent Non-executive Directors to be independent.
Our full Board meets in person at least quarterly and on other occasions when a Board decision is required on major issues. Details of Directors’ attendance at the AGM, Board and Board Committee Meetings held in 2004 are set out in the following table:
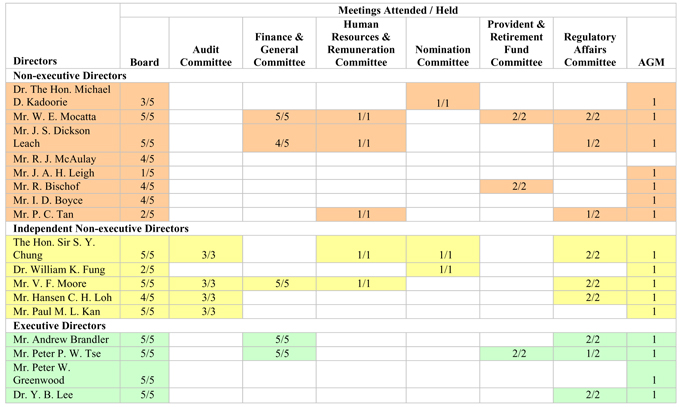
Meetings Attended / Held
Directors Board Audit Committee Finance & General Committee Human Resources & Remuneration Committee
Nomination Committee Provident & Retirement Fund Committee Regulatory Affairs Committee AGM
Non-executive Directors
Dr. The Hon. Michael D. Kadoorie
3/5 1/1 1
Mr. W. E. Mocatta 5/5 5/5 1/1 2/2 2/2 1
Mr. J. S. Dickson Leach 5/5 4/5 1/1 1/2 1
Mr. R. J. McAulay 4/5
Mr. J. A. H. Leigh 1/5 1
Mr. R. Bischof 4/5 2/2 1
Mr. I. D. Boyce 4/5 1
Mr. P. C. Tan 2/5 1/1 1/2 1
Independent Non-executive Directors
The Hon. Sir S. Y. Chung 5/5 3/3 1/1 1/1 2/2 1
Dr. William K. Fung 2/5 1/1 1
Mr. V. F. Moore 5/5 3/3 5/5 1/1 2/2 1
Mr. Hansen C. H. Loh 4/5 3/3 2/2 1
Mr. Paul M. L. Kan 5/5 3/3 1
Executive Directors
Mr. Andrew Brandler 5/5 5/5 2/2 1
Mr. Peter P. W. Tse 5/5 5/5 2/2 1/2 1
Mr. Peter W. Greenwood 5/5 1
Dr. Y. B. Lee 5/5 2/2 1
110
To indicate the attention given by our Board to the oversight of our affairs, we provide a further table summarizing the duration of those meetings and the volume of papers reviewed by Directors during 2004.
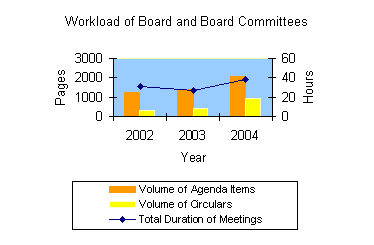
Directors ensure that they can give sufficient time and attention to the affairs of our Company. Directors have disclosed to our Company the number and nature of offices held in public companies or organizations and other significant commitments, with the identity of the public companies or organizations and an indication of the time involved. During the year ended December 31, 2004 no Director held directorships in more than seven public companies, including our Company. No Executive Directors hold any directorship in any other public companies, but they are encouraged to participate in professional, public and community organizations. Other details of Directors’ appointments are set out in “A. Directors and Senior Management” of this annual report and on our website.
Directors are requested to declare their direct or indirect interests, if any, in any proposals or transactions to be considered by our Board at Board Meetings and withdraw from the meetings as appropriate. Our Company follows guidelines (available at the “Corporate Governance” Section of our website) at each financial reporting period to seek confirmation from Directors in respect of any transactions of our Company or our subsidiaries which are related to Directors or their associates. The identified significant related party transactions are disclosed in Note 31 to the financial statements included in “Item 17. Financial Statements” in this annual report.
The interests in our securities held by Directors as at December 31, 2004 are included in “E. Share Ownership” below. Particular attention is given to dealings by Directors in shares in CLP. Since 1989, our Company has adopted our own Code for Securities Transactions by Directors, largely based on the Model Code for Securities Transactions by Directors of Listed Issuers set out in Appendix 10 of the Listing Rules (“Model Code”). Our Code for Securities Transactions also applies to other “Specified Individuals” such as Members of the Group’s senior management. Our Code is periodically updated to reflect new regulatory requirements, as well as our strengthened regime of disclosure of interests in our securities. This Code is on terms no less exacting than the required standard set out in the Model Code.
111
Good corporate governance demands honest disclosure of compliance and non-compliance alike. In December 2004, The Hon. Michael D. Kadoorie, Mr. R. J. McAulay, Mr. J. A. H. Leigh and Mr. I. D. Boyce advised our Company that due to an oversight, a number of filings required under the Securities and Futures Ordinance and related notifications to our Company were not made within the prescribed time limits. These filings primarily related to a complex trust restructuring, during the course of which no outside consideration was involved and the overall number of CLP shares held by Kadoorie Family interests and their associated individuals or entities remained the same.
As soon as the Directors became aware of this oversight, they brought the matter to the attention of our Company, the Hong Kong Stock Exchange and the Securities and Futures Commission. The relevant filings were made with the Hong Kong Stock Exchange and our Company. These were then placed on the Hong Kong Stock Exchange’s website (www.hkex.com.hk) and in the Company’s Registers of Interests of Directors and of Substantial Shareholders. An explanation of the differences between the interests as at December 31, 2003, June 30, 2004 and our 2003 Form 20-F for May 31, 2004, as compared to those previously disclosed by the Directors and Substantial Shareholders concerned, has been put on our website.
We have been informed that the Directors concerned are taking steps to prevent such late filings from happening in the future. An in-house legal advisor has been engaged by Sir Elly Kadoorie & Sons Ltd. and has been tasked with formalizing the disclosure process and developing a new system to support this.
The other Directors have all confirmed, following specific enquiry by our Company, that throughout the year ended December 31, 2004 they complied with the required standard set out in the Model Code and our own Code for Securities Transactions.
Appointment of Directors
We follow a formal, considered and transparent procedure for the appointment of new directors. Appointments are first considered by the Nomination Committee. The recommendations of the Committee are then put to the full Board for decision. Thereafter, all Directors are subject to election by shareholders at the AGM in their first year of appointment.
As approved by shareholders at the AGM in 2005, all Non-executive Directors are appointed for a term of not more than four years. This term is subject to curtailment upon that Director’s retirement by rotation and re-election by shareholders. One-third of the Directors, including both Executive and Non-executive Directors, are required to retire from office at the AGM in each year. A retiring director is eligible for re-election.
All Non-executive Directors have a formal letter of appointment, modeled on the letter of appointment in the “Higgs Report” in the U.K. on the “Review of the Role and Effectiveness of Non-Executive Directors”.
112
Chairman and Chief Executive Officer
The posts of Chairman and CEO are held separately by The Hon. Michael D. Kadoorie and Mr. Andrew Brandler respectively. This segregation ensures a clear distinction between the Chairman’s responsibility to manage the Board and the CEO’s responsibility to manage our Company’s business. The respective responsibilities of the Chairman and CEO are more fully set out in the CLP Code.
Management and Staff
The task of our Management and staff is the successful implementation of the strategy and direction as determined by our Board. In doing so, they must apply business principles and ethics which are consistent with those expected by our Board and shareholders and other stakeholders.
The division of responsibilities as between our Board, Board Committees, CEO and Management is aligned with the provisions of the CLP Code. The written procedures documenting the delegation by the Board of specific authorities, including those to Management, are expressed in the form of a “Company Management Authority Manual” (CMAM). Revisions to the CMAM which amend the approved authority delegated from the Board to Board Committees and the CEO require the approval of the Board. Revisions to delegation to Management and staff below the level of the CEO can be approved by the CEO.
All Management and staff, as well as Directors themselves, are subject to a formal Code of Conduct which places them under specific obligations as to the ethics and principles by which our business is conducted. Management and staff receive training on the Code and its implications. Management and staff above a designated level are required to sign annual statements confirming compliance with the Code. Disciplinary measures are decided by the relevant line management and reviewed by a Code of Conduct Committee comprising the CFO, Company Secretary and Group Human Resources Director in order to ensure consistency and fairness.
Senior Management (comprising the four Executive Directors and the Managing Directors of CLP Power Hong Kong Limited and CLP Power Asia Limited, whose biographies are set out in “A. Directors and Senior Management”) and Specified Individuals are subject to the CLP Code for Securities Transactions in the same manner as Directors with respect to the notification and reporting requirements to our Company for dealings in CLP Holdings’ securities and the prohibitions to deal. Save for the shareholdings disclosed by the four Executive Directors in “E. Share Ownership” below, Senior Management do not have any interests in CLP Holdings’ securities as at December 31, 2004.
113
Internal Auditors
We have a Group Internal Audit Department which plays a major role in monitoring the internal governance of the Group. The Department is led by the Group Internal Auditor and includes 15 other professional staff. The tasks of the Department are set out in the CLP Code and include:
| | • | | Unrestricted access to review all aspects of the Group’s activities and internal controls; |
| | • | | Comprehensive audits of the practices, procedures, expenditure and internal controls of all business and support units and subsidiaries on a regular basis; and |
| | • | | Special reviews of areas of concern identified by Management or the Audit Committee. |
Our Group Internal Auditor reports directly to the Audit Committee and Group Managing Director and has direct access to our Board through the Chairman of the Audit Committee. Our Group Internal Auditor has the right to consult the Committee without reference to Management.
During 2004, our Group Internal Audit Department issued reports to Senior Management covering various operational and financial units of the Group, including several joint venture activities outside Hong Kong. Group Internal Audit also conducted reviews of major projects and contracts as well as areas of concern identified by Management.
The Annual Audit Plan, which is reviewed by the Audit Committee, is based on a risk assessment methodology, which assists in determining business risks and establishing audit frequencies. Concerns which have been reported by Group Internal Audit are monitored quarterly by Management and by the Audit Committee until corrective measures have been implemented.
External Auditors
The Group’s External Auditors are PricewaterhouseCoopers, an Independent Registered Public Accounting Firm. In order to maintain their independence, PricewaterhouseCoopers will not be employed for non-audit work unless this constitutes permissible non-audit work as defined in the Sarbanes-Oxley Act and has been pre-approved by the Audit Committee. In addition, there must be clear efficiencies and value-added benefits to us from that work being undertaken by the External Auditors, with no adverse effect on the independence of their audit work, or the perception of such independence.
The Audit Committee has resolved the re-appointment of PricewaterhouseCoopers for statutory audits for the Financial Year 2005. This resolution has been endorsed by our Board and approved and authorized by the shareholders at the 2005 AGM.
The current lead audit partner of our External Auditors has now served in that capacity since 2001. By virtue of U.S. securities legislation to which our Company is subject, a lead audit partner may not serve for more than five consecutive years, starting from May 2003.
114
Other Stakeholders
Good governance requires due regard to the impact of business decisions (including their environmental impact), not only on shareholders, but also on other key stakeholders. This annual report and our Social and Environmental Report explain how we have discharged our responsibilities to shareholders, employees, customers, the environment and the communities in which we operate.
Internal Control
Internal control systems have been designed to allow our Board to monitor the Group’s overall financial position, to protect our assets and to assure against material financial misstatement or loss. Our Board is responsible for our system of internal control and for reviewing its effectiveness.
We have implemented an integrated framework of internal controls patterned on the COSO framework (the Committee of Sponsoring Organizations of the Treadway Commission). This framework was developed in the early 1990s for evaluating the effectiveness of an organization’s internal controls and is illustrated below:
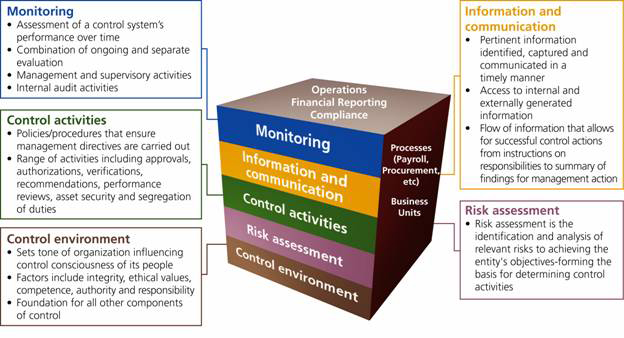
Our management and employees, assisted by external consultants with particular experience in the design and implementation of internal control systems, have evaluated our control environment, conducted risk assessments of businesses and processes and documented those processes which are critical to our performance.
As part of the documentation process, key risks have been identified along with the controls required to mitigate those risks. Starting in 2005, all key controls will be tested periodically by process owners and the internal auditors, based on the frequency of transactions.
115
Based on the results of those tests, process owners will be able to certify to Senior Management that their internal controls are working as intended or that necessary corrections have been made where control weaknesses have been found. Internal Auditors and External Auditors will also advise Senior Management whether controls have been working properly or changes are required to ensure the integrity of financial statements.
Senior Management will then review all of the certification documentation to determine whether our internal control compliance is acceptable and report on this to our Board, through the Audit Committee. Our Board assesses the effectiveness of the system of internal controls based on the results and criteria of the monitoring system included in the COSO framework. The monitoring system includes testing of key financial controls conducted by the process owners and the Internal Auditors. All key financial controls are tested each year. The results of those tests, including significant deficiencies or material weaknesses, are reported to our Board through the Audit Committee.
The CEO and CFO have a personal obligation to maintain the effectiveness of the disclosure controls and due diligence procedures, and to report any significant changes, deficiencies and material weaknesses in, and fraud related to, internal controls to the Audit Committee and the Group’s External Auditors.
The CEO and CFO submit an annual “General Representation Letter” to the Audit Committee, in which they give a personal certification of compliance by themselves and their subordinates with a range of key internal control systems, disciplines and procedures. These letters rest on similar letters of representation issued by individual managers across the CLP Group, which certify compliance with internal controls as to their particular businesses, departments and activities. These General Representation Letters reinforce personal responsibility for good governance and controls at all levels within the Group.
The Audit Committee and Management conduct a six-monthly review on the effectiveness of our system of internal control, including those of our subsidiaries. The Audit Committee then reports to our Board on the findings of that review.
In respect of the year ended December 31, 2004, including by regard to the report made by the Audit Committee, our Board considered the internal control system effective and adequate and that there were no significant areas of concern which might affect shareholders.
With respect to procedures and internal controls for the handling and dissemination of price-sensitive information, our Company
| | • | | is aware of our obligations under the Listing Rules and the overriding principle that information which is expected to be price-sensitive should be announced immediately if it is the subject of a decision; |
| | • | | conducts its affairs with close regard to the “Guide on disclosure of price-sensitive information” issued by the Hong Kong Stock Exchange in 2002; |
| | • | | has implemented and disclosed its own policy on fair disclosure; |
| | • | | has included in its Code of Conduct a strict prohibition on the unauthorized use of confidential or insider information; and |
116
| | • | | has established and implemented procedures for responding to external enquiries about the Group’s affairs. Senior managers of the Group are identified and authorized to act as our spokespersons and respond to enquiries in allocated areas of issues. |
Communication
We have a policy of open communication and fair disclosure. Disclosure is a key means to enhance our corporate governance standards, in that it provides our shareholders and other stakeholders with the information necessary for them to form their own judgment and to provide feedback to us. We understand that more disclosure does not necessarily result in increased transparency. The integrity of the information provided is essential for building market confidence.
Financial Reporting
We aim to present a clear and balanced assessment of our financial position and prospects. Financial results are announced as early as possible, and audited accounts are published within three months after the end of the financial year. Quarterly statements are issued to keep shareholders informed of the performance and operations of the Group.
In 2004, we have moved to early adoption of the Hong Kong Stock Exchange’s new requirements on financial disclosure in this annual report.
Social and Environmental Reporting
Our Social and Environmental Report 2004 gives a detailed description of our social and environmental performance on a group-wide basis for 2004. We are determined that our annual Social and Environmental Report should disclose our achievements and shortcomings in managing the social and environmental aspects of our business in a comprehensive, honest and accessible way. We shall continue to engage our stakeholders openly and report honestly on our progress in those areas. We welcome feedback, constructive or critical.
117
Reporting via Internet
Our website provides our shareholders and other stakeholders with information on our corporate governance structure, policies and systems. The “Corporate Governance” section of our website includes:
| | • | | CLP Code on Corporate Governance; |
| | • | | CLP Fair Disclosure Policy; |
| | • | | CLP Value Framework including Code of Conduct; |
| | • | | Policy and Guidelines on the Provision of Gifts and Entertainment; |
| | • | | General Representation Letter; |
| | • | | Guidelines on Disclosure of Related Party Transactions; |
| | • | | Code for Securities Transactions by CLP Holdings Directors and Specified Individuals; |
| | • | | Memorandum and Articles of Association; |
| | • | | Procedures for shareholders to convene, and put forward proposals at an AGM or EGM; |
| | • | | Biographical data on Directors and Senior Management; |
| | • | | Model Letter of Appointment for Non-executive Directors; |
| | • | | Terms of Reference of Board Committees as well as the frequency and length of meetings, volume of briefing papers considered and Members’ attendance; |
| | • | | Top 10 Shareholders of the Company; |
| | • | | Analysts’ briefings; and |
| | • | | Most frequently asked questions (regularly updated). |
We recognize that not all shareholders and stakeholders have ready access to the internet. For those who do not, hard copies of the CLP Group website information listed above are available free of charge upon request to the Company Secretary.
Corporate Governance – an Evolving Process
This year, evolving corporate governance practices and, most notably, the issue of the “Code on Corporate Governance Practices and Corporate Governance Report” by the Hong Kong Stock Exchange, have led to a significant review and revision of our corporate governance practices and the manner in which we report on these. This has been reflected in the issue of the CLP Code and this section of the annual report.
We will continue to review and, where appropriate, improve those practices in light of continuing experience, regulatory changes, international trends and developments and the views of our shareholders.
118
D. Employees
As of December 31, 2004, we had a total workforce of 4,633, a decrease from 4,705 at December 31, 2003; of which 3,873 were employed in the Scheme of Control business, a decrease from 3,915 at December 31, 2003. Of the total number of employees as of December 31, 2004, 4% were management and senior managers, 42% were managerial and professional staff, 22% were general staff and 32% were industrial workers. Of the 4,633 employees, 366 employees were employed by our overseas subsidiaries, Yallourn Energy and GPEC. Our employees located in Hong Kong do not have any unions or labor organizations. Our workforce is characterized by (a) stability and loyalty and (b) a high level of technical and professional skills. The employee total turnover rate in Hong Kong (including voluntary and other separations due to end of contract, retirement, dismissal etc.) was 5.8% in 2004.
Total remuneration for 2004 was HK$2,481 million (US$319 million). Our remuneration policies are to attract, retain and motivate high performing staff. Our “pay-for-performance” remuneration system consists of two components – base compensation and annual incentive. Base compensation is reviewed annually, taking into consideration the competitive market position, market practice and individual performance. Staff receives an annual incentive determined by the achievement of pre-set individual, functional, corporate and CLP Group objectives and the incentive award ranges from zero to twice the target award. At Yallourn, continuous efforts were made to drive organizational performance through performance-based remuneration measured by progress against posted development plans. GPEC has implemented a revised Performance Management System in line with Group principles.
Our retirement benefit scheme in Hong Kong is a defined contribution program. The CLP Group Provident Fund Scheme provides benefits linked to contributions and investment returns made on the scheme by the scheme members. The employees employed by subsidiary companies outside Hong Kong are covered by their local superannuation funds.
We are committed to nurturing a learning culture throughout the organization. In 2004, including Yallourn and GPEC, the investment in developing our workforce amounted to a total of 27,787 training man-days (2003: 40,066), i.e. an average of 5.76 man-days per employee. The reduction in total training man-days compared to the previous year is due to the successful implementation of two major IT system projects, both of which required a significant training investment in 2003.
119
E. Share Ownership
The following table sets forth the share ownership of our Directors and Executive Officers in our Company as of May 31, 2005.
| | | | | | | | |
Directors / Executive Officers
| | Capacity
| | | Total Interests in Number of Ordinary Shares Held of the Company
| | % of the Issued Share Capital of the Company
| |
| | | |
Dr. The Hon. Michael D. Kadoorie | | Note (a | ) | | 475,381,026 | | 19.7397 | % |
| | | |
Mr. W. E. Mocatta | | Founder of a
discretionary trust |
| | 250,000 | | Note (f | ) |
| | | |
Mr. J. S. Dickson Leach | | Beneficial owner | | | 3,436 | | Note (f | ) |
| | | |
Mr. R. J. McAulay | | Note (b | ) | | 439,800,565 | | 18.2623 | % |
| | | |
The Hon. Sir S. Y. Chung | | Beneficial owner | | | 393,789 | | Note (f | ) |
| | | |
Dr. William K. Fung | | Beneficial owner | | | 120,000 | | Note (f | ) |
| | | |
Mr. J. A. H. Leigh | | Beneficial owner | | | 22,000 | | Note (f | ) |
| | | |
Mr. R. Bischof | | Beneficial owner | | | 50,000 | | Note (f | ) |
| | | |
Mr. P. C. Tan | | Interests held
jointly with spouse |
| | 5,000 | | Note (f | ) |
| | | |
Mr. Andrew Brandler (Chief Executive Officer) | | Note (c | ) | | 10,600 | | Note (f | ) |
| | | |
Mr. Peter P. W. Tse | | Note (d | ) | | 20,600 | | Note (f | ) |
| | | |
Mr. Peter W. Greenwood | | Personal | | | 5,600 | | Note (f | ) |
| | | |
Dr. Y. B. Lee | | Note (e | ) | | 15,806 | | Note (f | ) |
Notes:
| (a) | The Hon. Michael D. Kadoorie was deemed (by virtue of the Securities and Futures Ordinance) to be interested in 475,381,026 shares in our Company. These shares were held in the following capacity: |
| | i) | 1,243 shares were an interest of his spouse. |
| | ii) | 236,335,571 shares were held by discretionary trusts, of which The Hon. Michael D. Kadoorie is one of the discretionary objects. |
| | iii) | 239,044,212 shares were held by a discretionary trust, of which The Hon. Michael D. Kadoorie is one of the discretionary objects and the founder. |
120
| | For the purpose of the Securities and Futures Ordinance, the spouse of The Hon. Michael D. Kadoorie was taken to have a discloseable duty in Hong Kong in relation to the 239,044,212 shares referred to in (iii) above. The spouse of The Hon. Michael D. Kadoorie was therefore deemed to be interested in 239,045,455 shares in our Company, of which 1,243 shares were held by her as beneficial owner and 239,044,212 shares were attributed to her pursuant to the Securities and Futures Ordinance for disclosure purposes. Nevertheless, she has no interest, legal or beneficial, in these 239,044,212 shares attributed to her for disclosure purposes. |
| (b) | Mr. R. J. McAulay was deemed (by virtue of the Securities and Futures Ordinance) to be interested in 439,800,565 shares in our Company. These shares were held in the following capacity: |
| | i) | 13,141 shares were held in a personal capacity. |
| | ii) | 236,335,571 shares were held by discretionary trusts, of which Mr. R. J. McAulay is one of the discretionary objects. |
| | iii) | 203,451,853 shares were held by a discretionary trust, of which Muriel, Lady Kadoorie, mother-in-law of Mr. R. J. McAulay, is the founder and a beneficiary and Mr. R. J. McAulay, his wife and members of his family are discretionary objects. |
| (c) | 600 shares were held in a personal capacity and 10,000 shares were held in a beneficial owner capacity. |
| (d) | 600 shares were held in a personal capacity and 20,000 shares were held in a beneficial owner capacity. |
| (e) | 600 shares were held in a personal capacity and 15,206 shares were held jointly with spouse. |
| (f) | None of the Directors and Executive Officers beneficially owns one percent or more of our outstanding shares. |
Messrs. I. D. Boyce, V. F. Moore, Hansen C. H. Loh and Paul M. L. Kan and Professor Judy Tsui Lam Sin Lai who are Directors of our Company, Mr. Bradley W. Corson who is an Alternate Director of our Company and Mrs. Betty Yuen and Mr. Richard McIndoe who are Executive Officers of our Company have each confirmed that they had no interests in the shares of our Company as at May 31, 2005.
None of the Directors and Executive Officers had interests in debentures, under equity derivatives or in underlying shares of our Company and its associated corporations.
We do not have, and have never had, a share option scheme. Accordingly, as of May 31, 2005, there were no options outstanding to purchase shares from us.
121
| Item 7. | Major Shareholders and Related Party Transactions |
A. Major Shareholders
The table below (including the following Notes) sets out certain information as of December 31, 2002, 2003, 2004 and May 31, 2005 with respect to major shareholders known to us to be the owner, including beneficial owner, of more than 5% of our ordinary shares.
| | | | | | | | | | | | | | | | | | | | | |
Name
| | As of December 31, 2002
| | | As of December 31, 2003
| | | As of December 31, 2004
| | | As of May 31, 2005
| |
| | | Number of
shares held | | % holding | | | Number of
shares held | | % holding | | | Number of
shares held | | % holding | | | Number of
shares held | | | % holding | |
| | | | | | | | |
| Acorn Holdings Corporation | | – | | – | | | – | | – | | | – | | – | | | 196,468,538 | (a) | | 8.16 | % |
| | | | | | | | |
Bermuda Trust Company Ltd | | 682,978,836 | | 28.36 | % | | 682,978,836 | | 28.36 | % | | 682,978,836 | | 28.36 | % | | 682,978,836 | (a) | | 28.36 | % |
| | | | | | | | |
| Bermuda Trust (Cayman) Limited | | – | | – | | | – | | – | | | 203,451,853 | | 8.45 | % | | 203,451,853 | (b) | | 8.45 | % |
| | | | | | | | |
| Esko Limited | | – | | – | | | 236,335,571 | | 9.81 | % | | 236,335,571 | | 9.81 | % | | 236,335,571 | (a) | | 9.81 | % |
| | | | | | | | |
| Hesko Limited | | – | | – | | | 236,335,571 | | 9.81 | % | | 236,335,571 | | 9.81 | % | | 236,335,571 | (a) | | 9.81 | % |
| | | | | | | | |
| HWR Trustees Limited | | – | | – | | | – | | – | | | – | | – | | | 240,482,771 | (a) | | 9.99 | % |
| | | | | | | | |
| Lakshmi Company Limited | | – | | – | | | – | | – | | | – | | – | | | 196,468,538 | (a) | | 8.16 | % |
| | | | | | | | |
| Lawrencium Corporation | | – | | – | | | – | | – | | | – | | – | | | 196,468,538 | (a) | | 8.16 | % |
| | | | | | | | |
| Merlin Investments Limited | | – | | – | | | – | | – | | | – | | – | | | 196,468,538 | (a) | | 8.16 | % |
| | | | | | | | |
| Mikado Holding Inc. | | – | | – | | | 239,044,212 | | 9.93 | % | | 239,044,212 | | 9.93 | % | | 239,044,212 | (a) | | 9.93 | % |
| | | | | | | | |
| Mikado Investments Limited | | – | | – | | | 239,044,212 | | 9.93 | % | | 239,044,212 | | 9.93 | % | | 239,044,212 | (a) | | 9.93 | % |
122
| | | | | | | | | | | | | | | | |
Name
| | As of December 31, 2002
| | As of December 31, 2003
| | As of December 31, 2004
| | As of May 31, 2005
|
| | | Number of
shares held | | % holding | | Number of
shares held | | % holding | | Number of
shares held | | % holding | | Number of shares held | | % holding |
| | | | | | | | |
| Muriel, Lady Kadoorie | | – | | – | | 203,451,853 | | 8.45% | | 203,451,853 | | 8.45% | | 203,451,853 (b) | | 8.45% |
| | | | | | | | |
| New Boron Holding Corporation | | – | | – | | 196,468,538 | | 8.16% | | 196,468,538 | | 8.16% | | 196,468,538 (a) | | 8.16% |
| | | | | | | | |
| Oak CLP Limited | | – | | – | | 203,451,853 | | 8.45% | | 203,451,853 | | 8.45% | | 203,451,853 (b) | | 8.45% |
| | | | | | | | |
| Oak (Unit Trust) Holdings Limited | | – | | – | | 203,451,853 | | 8.45% | | 203,451,853 | | 8.45% | | 203,451,853 (a)
& (b) | | 8.45% |
| | | | | | | | |
| Mr. R. Parsons | | – | | – | | 196,554,172 | | 8.16% | | 196,554,172 | | 8.16% | | 196,554,172 (c) | | 8.16% |
| | | | | | | | |
| Sir Sidney Gordon | | – | | – | | 241,294,165 | | 10.02% | | 241,294,165 | | 10.02% | | 205,525,453 (c) | | 8.53% |
| | | | | | | | |
| Dr. The Hon. Michael D. Kadoorie | | – | | – | | 475,381,026 | | 19.74% | | 475,381,026 | | 19.74% | | 475,381,026 (d) | | 19.74% |
| | | | | | | | |
| Mr. R. J. McAulay | | – | | – | | 236,348,712 | | 9.81% | | 439,800,565 | | 18.26% | | 439,800,565 (e) | | 18.26% |
| | | | | | | | |
| Guardian Limited | | – | | – | | 196,554,172 | | 8.16% | | 196,554,172 | | 8.16% | | 196,554,172 (c) | | 8.16% |
Notes:
| | (a) | The interests of Bermuda Trust Company Limited in the shares of our Company include the interests in our Company held by Esko Limited, Hesko Limited, Acorn Holdings Corporation, Lawrencium Corporation, Mikado Holding Inc, Mikado Investments Limited, Oak (Unit Trust) Holdings Limited and New Boron Holding Corporation. |
| | | The interests of Bermuda Trust Company Limited in the shares of our Company also include the shares held by discretionary trusts of which The Hon. Michael D. Kadoorie and/or Mr. R. J. McAulay are among the discretionary objects as disclosed in “Item 6. Directors, Senior Management and Employees –E. Share Ownership” above. |
123
| | | Bermuda Trust Company Limited was deemed to be interested in the shares in which Esko Limited, Hesko Limited, Mikado Holding Inc, Mikado Investments Limited and Oak (Unit Trust) Holdings Limited are interested, either in the capacity as trustee or by virtue of having direct or indirect control over such companies. |
| | | HWR Trustees Limited was deemed to be interested in the shares in which New Boron Holding Corporation was interested by virtue of having direct control over New Boron Holding Corporation. HWR Trustees Limited was also deemed to be interested in 4,147,200 shares in its capacity as trustee of certain trusts. |
| | | Lakshmi Company Limited and Merlin Investments Limited were deemed to be interested in the shares in which New Boron Holding Corporation was interested. |
| | | Esko Limited and Hesko Limited together controlled Acorn Holdings Corporation and Lawrencium Corporation which together in turn controlled New Boron Holding Corporation and were therefore deemed to be interested in the shares in which such company was deemed interested. |
| | (b) | The interests of Bermuda Trust (Cayman) Limited in the shares of our Company include the interests in our Company in which Oak CLP Limited, Oak (Unit Trust) Holdings Limited and Muriel, Lady Kadoorie were deemed to be interested. |
| | | The interests of Muriel, Lady Kadoorie in 203,451,853 shares of our Company include shares in which Mr. R. J. McAulay, Mr. R. Parsons and Sir Sidney Gordon were deemed to be interested. |
| | | Bermuda Trust (Cayman) Limited was interested in the 203,451,853 shares by virtue of its capacity as trustee of a trust of which Muriel, Lady Kadoorie is the founder and a beneficiary and Mr. R. J. McAulay is one of the discretionary objects. Bermuda Trust (Cayman) Limited, in its capacity as trustee of a discretionary trust, controlled Oak CLP Limited and was therefore deemed to be interested in the shares in which Oak CLP Limited was interested. |
| | (c) | Mr. R Parsons and Sir Sidney Gordon, in their capacities as trustees of certain trusts, jointly controlled Guardian Limited and therefore were deemed to be interested in the shares in which Guardian Limited was deemed to be interested. Accordingly, the 196,554,172 shares in which Guardian Limited was interested is duplicated within the interests attributed to each of Sir Sidney Gordon and Mr. R. Parsons. |
| | | Sir Sidney Gordon was also deemed to be interested in 2,073,600 shares in his capacity as trustee of certain trusts. |
| | (d) | The aggregate long position in the shares of the Company of The Hon. Michael D. Kadoorie is listed below: |
| | | Interests in the Ordinary Shares of the Company |
| | |
| Number | | Capacity |
| |
1,243 | | Interest of spouse |
239,044,212 | | Founder of a discretionary trust |
475,379,783 | | Discretionary object of various discretionary trusts |
| | | The interests of The Hon. Michael D. Kadoorie as a founder of a discretionary trust and a discretionary object of various discretionary trusts are duplicated between each other. His interests, apart from the interest of his spouse, are also duplicated by the interests in our Company held by Bermuda Trust Company Limited and certain discretionary trusts of which Mr. R. J. McAulay is one of the discretionary objects as disclosed in Note (e) below. |
124
| | | For the purpose of the Securities and Futures Ordinance, the spouse of The Hon. Michael D. Kadoorie was taken to have a discloseable duty in Hong Kong in relation to the 239,044,212 shares referred to above. The spouse of The Hon. Michael D. Kadoorie was therefore deemed to be interested in 239,045,455 shares in our Company, of which 1,243 shares were held by her as beneficial owner and 239,044,212 shares were attributed to her pursuant to the Securities and Futures Ordinance for disclosure purposes. Nevertheless, she has no interest, legal or beneficial, in these 239,044,212 shares attributed to her for disclosure purposes. |
| | (e) | See Note (b) in “Item 6. Directors, Senior Management and Employees — E. Share Ownership” above. |
As at December 31, 2004, our company had not been notified of any substantial shareholders’ interests under equity derivatives or in underlying shares of our company or any short positions being held by any substantial shareholder in the shares or underlying shares of our company.
None of our major shareholders has different voting rights from those of our other shareholders.
As of May 31, 2005, we had a total of 2,408,245,900 shares outstanding. Out of these 2,408,245,900 shares, 1,477,539 shares were held by holders with registered addresses in the United States. At the same date, 44,093,317 American Depositary Shares, or ADSs, were outstanding, representing 44,093,317 shares or approximately 1.8309% of the total number of our outstanding shares. These ADSs were held by 831 record holders, including nominee holders and out of the 831 record holders, a total of 825 had registered addresses in the United States. Save as the above, we have no further information as to common shares held, or beneficially owned, by U.S. persons.
125
B. Related Party Transactions
We from time to time have engaged in a variety of transactions with our affiliates in the normal course of business. Our policy is to encourage competition among suppliers that may include our affiliates. We usually select our suppliers through competitive bidding procedures. We believe that the transactions with our affiliates have been conducted on an arm’s length basis or on terms as favorable to us as would be obtainable at the time in a comparable arm’s length transaction with a non-affiliate. See Note 31 to the financial statements included in “Item 17. Financial Statements” in this annual report.
CAPCO
Under a contract between CLP Power Hong Kong and CAPCO, a company in which CLP Power Hong Kong holds a 40% equity interest, we, through CLP Power Hong Kong, are obligated to purchase all of the electricity generated by CAPCO. Pursuant to the contract, the price paid by CLP Power Hong Kong to CAPCO is sufficient to cover all of CAPCO’s operating expenses as well as CAPCO’s share of return permitted under the Scheme of Control. See “Item 4. Information on the Company — B. Business Overview — Electricity Business in Hong Kong — Scheme of Control and — Power Purchases from CAPCO”. In 2004, we purchased approximately 72% of our electricity from CAPCO at a price of HK$10,923 million (US$1,405 million), as compared to HK$10,431 million in 2003 and HK$10,191 million in 2002.
In accordance with the CAPCO Operating Service Agreement between CLP Power Hong Kong and CAPCO, CLP Power Hong Kong is responsible to CAPCO for the efficient and proper construction, commissioning, operation and maintenance of the electricity generating facilities of CAPCO. In return, CAPCO reimburses CLP Power Hong Kong for all costs incurred in performance of the agreement. In 2004, the charges from CLP Power Hong Kong to CAPCO amounted to HK$1,071 million (US$138 million), as compared to HK$1,025 million in 2003 and HK$970 million in 2002; and a portion of the charges which is accounted for as operating expenses by CAPCO is covered under the Electricity Supply Contract.
In addition, CLP Power Hong Kong has provided funds to CAPCO as shareholders’ advances and special loans in the form of interest-free loans. As at December 31, 2004, CLP Power Hong Kong’s advances to CAPCO amounted to HK$6,115 million (US$787 million), as compared to HK$5,768 million in 2003 and HK$4,934 million in 2002. The increase in CLP Power Hong Kong’s advances to CAPCO during 2004 was due to the new advances of HK$2,222 million (US$286 million) which was offset by the repayment of HK$1,876 million (US$241 million), and an unrealized exchange gain of HK$1 million (US$0.1 million). The largest amount of shareholders’ advances outstanding in 2004 was HK$6,324 million (US$814 million).
Pursuant to a deed of subordination, shareholders’ advances to CAPCO are subordinated to CAPCO’s certain debt financing and may be repaid to the extent that CAPCO’s ratio of borrowed moneys to shareholders’ funds (representing the sum of the issued share capital, shareholders’ advances and special advances excluding unrealized exchange differences, deferred taxation, retained profits and any proposed dividend) is not higher than 1.5:1. Such ratio has been kept below 1.5:1 and as at December 31, 2004, such ratio was 0.50:1, compared to 0.54:1 at 2003 and 0.75:1 in 2002.
126
See “Item 4. Information on the Company — B. Business Overview — Electricity Business in Hong Kong — Relationship with CAPCO – CAPCO Financing”.
Guangdong Daya Bay Nuclear Power Station
Pursuant to several offtake and resale contracts, we are obligated, through CLP Power Hong Kong, to purchase a total of 70% of the output of Guangdong Daya Bay Nuclear Power Station, or GNPS, in Guangdong Province, China. The contracts extend for 20 years from 1994. Upon expiry of the 20-year term, we have a right to purchase 25% of the electricity generated by GNPS for an additional five years under the contracts. The price for electricity generated by GNPS through the term of the contracts is determined by a formula based on GNPS’s operating costs and a calculation of profits by reference to shareholders’ funds and the capacity factor for a given year. In 2004, we purchased approximately 28% of our power from GNPS at a price of approximately HK$4,763 million (US$613 million), as compared to HK$5,134 million in 2003 and HK$4,976 million in 2002. Our wholly owned subsidiary, Hong Kong Nuclear Investment Company Limited, owns a 25% equity interest in GNPS. See “Item 4. Information on the Company — B. Business Overview —Electricity Business in Hong Kong — Non-CAPCO Power Purchases/Storage Facilities”.
Hong Kong Pumped Storage Development Company, Limited
Hong Kong Pumped Storage Development Company, Limited, or PSDC, in which, through CLP Power Hong Kong, we hold a 49% equity interest, has the right to use 50% of the 1,200 MW capacity of Phase 1 of Guangzhou Pumped Storage Power Station for 40 years from 1994. Pursuant to a contract between CLP Power Hong Kong and PSDC, we have the right to make use of that capacity. The price paid by us to PSDC is sufficient to cover all of PSDC’s operating expenses, taxation and net return. In 2004, we paid PSDC approximately HK$369 million (US$47 million) for the pumped storage service, as compared to HK$308 million in 2003 and HK$419 million in 2002. The higher charges for the current year were mainly due to the recognition of prior year’s deferred tax credit in 2003.
In addition, CLP Power Hong Kong has provided funds to PSDC as shareholders’ advances in the form of interest-free loans. As at December 31, 2004, CLP Power Hong Kong advances to PSDC amounted to HK$313 million (US$40 million), as compared to HK$306 million in 2003 and HK$300 million in 2002. The increase in CLP Power Hong Kong’s advances to PSDC during 2004 was due to new advances of HK$156 million (US$20 million), which was offset by the repayment of HK$149 million (US$19 million). The largest amount of shareholders’ advances outstanding in 2004 was HK$335 million (US$43 million). See “Item 4. Information on the Company — B. Business Overview —Electricity Business in Hong Kong — Non-CAPCO Power Purchases/Storage Facilities”.
C. Interests of Experts and Counsel
Not applicable.
127
| Item 8. | Financial Information |
A. Consolidated Statements and Other Financial Information
Consolidated Statements
Please refer to “Item 17. Financial Statements” for the financial statements which form an integral part of this annual report on Form 20-F.
Information on legal or arbitration proceedings
We are not aware that any of us, our Directors, any member of our senior management or any of our affiliates is a party to any current or pending legal or arbitration proceedings the outcome of which is expected to have a material adverse effect on us or any of our subsidiaries.
Dividend Policy
Our dividend policy is to provide consistent increases in ordinary dividends, linked to the underlying earnings performance of the business.
Since 1995, our ordinary dividend payout ratio, which is the ratio of ordinary dividends over operating earnings excluding Hok Un redevelopment profit and property disposal gain, has been between 58% and 63%. Earnings from the property development at Hok Un and other property disposals have been the subject of special dividends, ranging from 54% to 100% of such earnings in each financial year in which they have arisen. To date, 92% of all these property-related profits have been distributed to shareholders through special dividends.
We have normally declared interim dividends and final dividends each year to our shareholders. In line with our dividend policy, a final dividend and a special final dividend on our shares for 2004 were approved at our Annual General Meeting held on April 29, 2005. See “Item 5. Operating and Financial Review and Prospect — A. Operating Results”.
The form, frequency and amount of future dividends on our shares will depend upon our earnings, financial condition and other factors. Accordingly, we cannot assure you that we will continue to pay dividends on our shares or that future dividends will be comparable to historical dividends.
In response to our shareholders’ enquiries, our Board has reviewed the possibility of providing a scrip dividend option to our shareholders, particularly with regard to market practice in Hong Kong. The result of the review showed that a scrip dividend option is uncommon in Hong Kong and the take-up rate by shareholders of the scrip option, as opposed to receiving dividends in cash, is extremely low. Accordingly, it is not presently envisaged to move to providing our shareholders with a scrip dividend option.
128
B. Significant Changes
On May 31, 2005, we, through our wholly-owned Australia subsidiary CLP Australia Energy Holdings Pty Limited, completed the purchase of SPI Electricity & Gas Australia Holdings Pty Limited (“SPI E&G”), Singapore Power’s wholly-owned merchant energy business in Australia. Acquisition of Singapore Power’s interest in SPI Pipelines will occur separately if pre-emption rights are not exercised by other partners in the pipeline. Consideration for the entire acquisition (including the interest in SPI Pipelines) is A$2,128 million (HK$12,981 million).
Consideration for the acquisition was partly financed by a combination of CLP Group’s internal resources, additional borrowing at CLP Holdings and a new corporate finance facility in the amount of A$ 2.45 billion (on a non-recourse basis to CLP Holdings) to finance the balance of the consideration and re-finance existing facilities of Yallourn Energy. Entry into this new finance facility followed the announcement by Standard & Poor’s (“S&P”) on May 27, 2005 that CLP Australia Holdings (a wholly-owned subsidiary of CLP Power Asia) had obtained an investment grade rating of “A-”.
CLP Australia Holdings is now the fifth largest energy retailer in Australia and sells gas and electricity to over 1.1 million customers across Victoria, New South Wales, South Australia and Queensland. It also owns Yallourn Energy which is a 1,480 MW brown coal-fired power plant and the adjacent coal mine located in the Latrobe Valley, Victoria, a 1,280 MW gas-fired power station at Torrens Island, South Australia, an interest in a long-term hedge contract for up to 966 MW, and a gas storage facility. SPI Pipelines’ 33% interest in SEAGas, which owns a 685 kilometre natural gas transmission pipeline between Victoria and South Australia is currently the subject of pre-emption rights of other shareholders of SEAGas.
On May 26, 2005, S&P lowered the foreign currency and local currency corporate credit rating of CLP Holdings to “A” from “A+”. S&P’s downgrade of CLP Holdings’ rating reflects its view of CLP Holdings’ increasing business risk as a result of our international diversification efforts over the past few years and the increased level of debt following the acquisition of merchant energy assets in Australia from SPI Australia Group. At the same time S&P affirmed its “A+” foreign currency and local currency credit rating on CLP Power Hong Kong. The outlook for all the ratings is stable.
On May 31, 2005, Moody’s re-affirmed the foreign currency rating of CLP Holdings and CLP Power Hong Kong unchanged at “A1” and at the same time revised downward the local currency issuer rating of CLP Holdings and CLP Power Hong Kong to “A1” and “Aa3” from “Aa2” and “Aa1”. The outlook for the ratings is stable. Moody’s cited the increased overall business risk profile and financial leverage of CLP Holdings after the Australian merchant energy business and continued to recognize the key credit strengths of strong and highly predictable cash flow generated from CLP Power Hong Kong, management’s gradual approach to overseas expansion, and CLP Group’s strong access to bank and capital markets.
129
| Item 9. | The Offer and Listing |
Trading Market and Market Price Information for Our Shares
The principal trading market for our shares is the Stock Exchange of Hong Kong, where over 831 million of our shares were traded in 2004. The board lot for trading in our shares on the Stock Exchange of Hong Kong is 500 shares. Our shares are also traded in the over-the-counter market in the United States in the form of American Depositary Shares, or ADSs. The ADSs are not listed on any United States securities exchange and were originally issued pursuant to several unsponsored American Depositary Receipts, or ADR, programmes. In November 1997, we appointed JPMorgan Chase Bank (formerly known as Morgan Guaranty Trust Company of New York) as the depositary for a sponsored ADR programme which replaced the previous unsponsored programmes.
On the basis of a market capitalization of approximately HK$108 billion or approximately US$14 billion at the close of business on December 31, 2004, we were the 10th largest company, in terms of market capitalization, listed on the Stock Exchange of Hong Kong.
The table below shows, for the periods indicated, the high and low closing prices (adjusted with the one-for-five bonus issue in April 2001) and the average daily trading volume for our shares and the ADSs.
130
| | | | | | | | | | | | |
| | | Our Shares
| | ADSs
|
Period
| | Per Share | | Average Daily
Trading
Volume
| | Per ADS | | Average Daily
Trading
Volume
|
| | High
| | Low
| | | High
| | Low
| |
| | | (HK$) | | (HK$) | | (in shares) | | (US$) | | (US$) | | (in ADSs) |
| | | | | | |
2000 | | 32.417 | | 24.125 | | 3,238,031 | | 4.12500 | | 3.02083 | | 120,897 |
2001 | | 34.833 | | 29.350 | | 3,294,329 | | 4.50000 | | 3.40000 | | 351,106 |
2002 | | 33.000 | | 29.500 | | 3,473,000 | | 4.20000 | | 3.65000 | | 52,931 |
2003 | | 37.700 | | 31.300 | | 3,183,877 | | 4.95000 | | 3.95000 | | 27,050 |
2004 | | 45.300 | | 36.500 | | 3,338,860 | | 5.90000 | | 4.75000 | | 70,639 |
| | | | | | |
2003: | | | | | | | | | | | | |
First Quarter | | 32.900 | | 31.300 | | 3,106,234 | | 4.25000 | | 3.95000 | | 25,113 |
Second Quarter | | 34.100 | | 31.900 | | 3,351,549 | | 4.45000 | | 4.05000 | | 19,805 |
Third Quarter | | 34.600 | | 33.600 | | 3,161,489 | | 4.55000 | | 4.25000 | | 32,000 |
Fourth Quarter | | 37.700 | | 34.200 | | 3,122,109 | | 4.95000 | | 4.45000 | | 31,080 |
| | | | | | |
2004: | | | | | | | | | | | | |
First Quarter | | 43.300 | | 36.500 | | 4,024,472 | | 5.60000 | | 4.75000 | | 40,398 |
Second Quarter | | 43.200 | | 38.600 | | 3,511,202 | | 5.60000 | | 4.95000 | | 52,621 |
Third Quarter | | 45.300 | | 42.100 | | 2,492,659 | | 5.85000 | | 5.35000 | | 65,852 |
Fourth Quarter | | 45.100 | | 44.000 | | 3,359,626 | | 5.90000 | | 5.70000 | | 122,457 |
| | | | | | |
December 2004 | | 44.700 | | 44.100 | | 2,802,830 | | 5.85000 | | 5.70000 | | 133,014 |
January 2005 | | 44.600 | | 43.500 | | 3,130,640 | | 5.85000 | | 5.60000 | | 252,249 |
February 2005 | | 44.800 | | 43.900 | | 2,823,671 | | 5.80000 | | 5.65000 | | 255,208 |
March 2005 | | 44.800 | | 44.100 | | 3,216,126 | | 5.80000 | | 5.65000 | | 168,511 |
April 2005 | | 44.400 | | 42.800 | | 3,248,708 | | 5.75000 | | 5.50000 | | 211,796 |
May 2005 | | 44.700 | | 44.200 | | 2,281,945 | | 5.80000 | | 5.60000 | | 194,115 |
Source: Bloomberg.
131
| Item 10. | Additional Information |
A. Share Capital
Not applicable.
B. Memorandum and Articles of Association
Our current Memorandum and Articles of Association were adopted on October 8, 1997 and December 12, 1997, amended on October 8, 1999, April 25, 2002, May 5, 2003, April 22, 2004 and April 28, 2005.
Under Clause 3 of our Memorandum of Association, we have the capacity and the rights, powers and privileges of a natural person.
The full Memorandum and Articles of Association is at Exhibit 1.1 and also available in the Corporate Governance section of our websitewww.clpgroup.com. The following is a summary of certain provisions of our Articles of Association.
Directors
A Director of our Company or any of his associates who is directly or indirectly interested in a contract, transaction or arrangement with us shall declare the nature of his interest or the interest of any of his associates at a meeting of the Board of Directors. A Director shall not vote on any transaction in which he or any of his associates has a material interest and that Director shall not be counted in the quorum present at the meeting for such transaction. However, a Director may vote and be counted in the quorum regarding a transaction in which such Director or any of his associates has a non-material interest. The question of materiality or the question of the entitlement of any Director to vote at a meeting may be resolved by the interested Director voluntarily abstaining from voting or by the Chairman of the meeting. Directors may vote on any proposals or arrangements concerning the benefit of our employees which may relate both to our Directors, their associates and employees, so long as any Director, or any of his associates, does not have any privilege or advantage not generally granted to the class of persons to which such benefit scheme relates. In addition, any of our Directors may vote on any contract for the purchase or maintenance for any Director or Directors of our company of insurance against liability. Our Board of Directors may exercise all the powers of our Company to borrow any sum of money, to give guarantees or indemnities, to mortgage or charge our undertaking, property and uncalled capital, or to issue debentures or other securities for any debt, liability or obligation of our company.
The remuneration of our Non-executive Directors is determined by our shareholders in a General Meeting. The Directors’ remuneration shall be deemed to accrue from day to day.
Our Directors including the Group Managing Director and Executive Directors are subject to retirement by rotation. At the Annual General Meeting each year, one-third of our Directors for the time being who have been longest in office since their last election or appointment shall retire and are eligible for re-election in accordance with our Articles of Association. There is no provision for the retirement of our Directors at a specified age limit.
132
Our Directors are not required to hold any of our shares by way of qualification. A Director who is not a shareholder of us is nevertheless entitled to attend and speak at shareholders meetings.
Dividends
Our profits available for dividend and determined to be distributed shall be applied to pay dividends to shareholders according to their respective rights and priorities. Except for shares with special rights as to dividends, all dividends shall be declared and paid according to the amounts paid up or deemed paid up on shares.
Our Company may declare dividends by passing an ordinary resolution at an Annual General Meeting. Our Board of Directors may if they think fit from time to time declare and pay to the shareholders such interim dividends as appear to our Board to be justified by our profits.
All dividends unclaimed for one year after having been declared may be invested or otherwise made use of by our Board of Directors for our benefit until claimed. If any dividend has not been claimed for six years after becoming due for payment, our Board of Directors may forfeit such dividend. After such forfeiture no shareholder or other person shall have the right to claim such dividend, but our Board of Directors may determine to pay the whole or part of such dividend to the shareholder or other person who could have claimed that dividend immediately before it was forfeited. No dividend shall bear interest against us.
Liquidation Distribution
In the case of winding up our Company and in accordance with requirements of laws, our shareholders may pass a special resolution to authorize a liquidator to divide and distribute our assets to our shareholders or, authorize the liquidator to vest the whole or part of our assets in trustees upon such trusts for the benefit of the contributories so that no shareholder will be compelled to accept shares or other securities on which there is any liability.
Shareholders Meeting
We are required to hold our Annual General Meeting once a year. Our Board of Directors has the right to convene an Extraordinary General Meeting whenever it thinks fit. According to the applicable Hong Kong law, shareholders representing one-twentieth or more voting shares of our Company may request an Extraordinary General Meeting. If our Board of Directors fails to proceed to convene an Extraordinary General Meeting within 21 days from the date of the request, the original shareholders making the request or any of them representing more than one-half of the total voting rights of such shareholders may hold an Extraordinary General Meeting.
133
Subject to any special rights or restrictions as to voting attached to any shares, at any general meeting, on a show of hands every shareholder who is present in person or (being a corporation) represented by proxy shall have one vote and, on a poll every shareholder present in person or by proxy or (being a corporation) represented by proxy shall have one vote for every share which he holds. Where any shareholder, under the Listing Rules, is required to abstain from voting on any particular resolution or is restricted to voting only for or only against any particular resolution, any votes cast by or on behalf of such member in contravention of such requirement or restriction shall not be counted.
No shareholder has the right to attend or vote or otherwise exercise the rights of a shareholder in person or by proxy at a general meeting if he has not paid up his shares if already called or becoming payable by him.
Share Capital
We generally have the right by obtaining a general mandate at the Annual General Meeting to repurchase not more than 10% of our own shares in issue.
Our Board of Directors may make a capital call on our shareholders with respect to the amounts unpaid on their shares and the shareholders are required to pay the call in one sum or by installment to the person at the time and place as appointed by our Board of Directors. Our Board of Directors may revoke a call or postpone the time previously fixed for the call payment.
We have the right, by ordinary resolution, to increase our capital by such sum and number of shares as the resolution prescribes.
We may by ordinary resolution:
| | (i) | consolidate and divide some or all of our share capital into shares of a larger nominal value than our existing shares; upon such consolidation, our Board of Directors may determine, as between the holders of shares to be consolidated, which particular shares are to be consolidated into each consolidated share, and may appoint a third party to sell any fractions of shares resulting from such consolidation and distribute rateably the net proceeds of such sale to the shareholders who would otherwise be entitled to a fraction or fractions of shares; |
| | (ii) | subject to applicable law, sub-divide some or all of our shares into shares of a smaller nominal value than is fixed by our Memorandum of Association and determine that, as between the holders of the divided shares, different rights or restrictions which we may apply to new shares may apply to some of those divided shares; or |
| | (iii) | cancel any shares which have not been taken or agreed to be taken by any person at the date of the passing of the resolution and reduce the amount of our share capital by the amount of the shares so cancelled; |
We may also by special resolution reduce our share capital and any capital redemption reserve fund and any share premium account in any manner as authorized by law.
134
We are not required to provide any sinking fund pursuant to our Articles of Association. There is no provision discriminating against any existing or prospective holder of shares as a result of such shareholder owning a substantial number of our shares.
There is no limitation on the rights of non-resident or foreign shareholders to hold or exercise voting rights on the shares.
Modification of Rights
We may vary or abrogate any special rights attached to any class of our shares, with the consent in writing of the holders of three-fourths in nominal value of the issued shares of that class, or by a special resolution passed at a separate meeting of holders of the shares of that class.
Transfer of Shares
Any transfer of our shares shall be effected by instrument of transfer in any common form, or in such other form as approved by our Board of Directors. The instrument of transfer of a share is required to be executed by the transferor and the transferee in a manner and/or by such means as our Board of Directors may approve from time to time. The transferor is deemed to remain the holder of the share until the name of the transferee is entered in the register of members in respect of the shares transferred.
Our Board of Directors may, without assigning any reason, decline to register any transfer of any share, which is not fully paid up.
In addition, a transfer will not be registered if:
| | (i) | it purports to transfer more than one class of shares; |
| | (ii) | it is in favor of more than four joint holders; |
| | (iii) | it is not delivered to our registered office or to any other place decided on by our Board of Directors; |
| | (iv) | it is not accompanied by the relevant share certificate or other evidence reasonably asked for by our Board of Directors to show the entitlement of the transferor to make the transfer. |
If our Board of Directors decline to register a transfer of any share, they shall send to the transferor and the transferee a notice of the refusal within two months after the date on which the transfer was lodged with our share registrar.
We do not charge any fee of more than the maximum fee prescribed by the Stock Exchange of Hong Kong of any transfer, probate, letters of administration, certificate of marriage or death, power of attorney, stop notice, order of court or other document relating to or affecting the title to any share.
Our Board of Directors may decide to suspend the registration of transfers from time to time either generally or in respect of any class of shares. But such registration shall not be suspended for more than thirty days in any calendar year.
We will retain for six years all instruments of transfer which are registered.
135
Discloseable Ownership
Under Part XV of the Securities and Futures Ordinance, or SFO, of Hong Kong which became effective on April 1, 2003, a substantial shareholder, whether an individual or a company, is required to notify The Stock Exchange of Hong Kong Limited and the listed corporation on the occurrence of “relevant events” which include:
| | (i) | When he first becomes interested in 5% or more of the shares of the listed corporation. |
| | (ii) | When his interest drops below 5%. |
| | (iii) | When there is an increase or decrease in the percentage figure of his holding that results in his interest crossing over a whole percentage number which is above 5%. |
| | (iv) | When he has a notifiable interest and the nature of his interest in the shares changes. |
| | (v) | When he has a notifiable interest and he comes to have, or cease to have, a short position of more than 1%. |
| | (vi) | When he has a notifiable interest and there is an increase or decrease in the percentage figure of his short position that results in his short position crossing over a whole percentage number which is above 1%. |
| | (vii) | If he has an interest in 5% or more of the shares of a corporation that is being listed, shares of a class that is being listed, or shares of a class which are being given full voting rights. |
| | (viii) | If he has an interest in 5% or more of the shares of a listed corporation, or if he has a notifiable interest and a short position of 1% or more, which has not previously been disclosed. |
| | (ix) | If the 5% threshold is reduced or the 1% threshold for short position is reduced. |
A notification of relevant events (vii) to (ix) is referred to as an “Initial Notification”. In the case of an Initial Notification the time allowed for filing a notice is ten business days (including Saturday) as opposed to three business days in the case of the other relevant events.
Relevant event (iv) may not always give rise to a duty to give a notification. The change in the nature of the substantial shareholder’s interest is not required to be reported if the percentage level of his interest has not changed, and the percentage level of his interest at the last notification given by him are both the same.
136
The obligations of Directors and chief executives are more extensive than those of substantial shareholders, reflecting their greater involvement in the management of the affairs of the listed corporation. Directors have to disclose:
| | (i) | Interests and short positions in any shares of the listed corporation and any of its associated corporations of which they are a Director – not simply voting shares; and |
| | (ii) | Interests in debentures of the listed corporation and any of its associated corporations of which they are a Director. |
In addition, there is no disclosure threshold – Directors have to disclose all dealings even if they have an interest, or a short position, in a small number of shares or debentures.
The term “Director” is defined widely and includes a shadow director and any person occupying the position of director by whatever name called. The term “shadow director” means a person in accordance with whose directions or instructions the directors of a corporation are accustomed or obliged to act.
Mandatory Offer
Under the amended Hong Kong Code on Takeovers and Mergers, or Takeovers Code, which became effective on October 19, 2001, subject to the granting of a waiver by the Securities and Futures Commission of Hong Kong, or SFC, or the limited exceptions for a transitional period as specified in the Takeovers Code, a person is required to make a mandatory offer to acquire shares from the other shareholders of our company as soon as practicable after such person acquires 30% or more of the voting rights of our company.
Bermuda Trust Company Limited, The Hon. Michael D. Kadoorie, Mr. R. J. McAulay, The Sir Horace Kadoorie International Foundation and The Incorporated Trustees of the Kadoorie Foundation, or the Parties, had registered their aggregated interests in 839,028,074 ordinary shares in CLP Holdings with the SFC as holding for the purposes of the Takeovers Code, as at October 19, 2001, voting rights in respect of shares which in aggregate represented 33.96% of our issued share capital on that date. As at May 31, 2005, the Parties’ aggregated holdings in us for the Takeovers Code’s purposes had increased to 34.84% as a result of our repurchases of ordinary shares pursuant to our Share Repurchase Programme. See “Item 7. Major Shareholders and Related Party Transactions – A. Major Shareholders”. The Parties are entitled to the benefit of the transitional arrangements of the amended Takeovers Code, whereby the Parties are not required to make a mandatory offer to acquire shares from other shareholders of our company unless their aggregated interests in our issued capital reach the threshold of 35% on or before October 18, 2011. If the shareholding of the Parties drops below 30% at any time, the new 30% trigger will apply to the Parties who will generally, on their again reaching that level, be required to make a mandatory offer absent a waiver from the SFC.
137
On the basis of the Company’s issued share capital as at May 31, 2005, should our Company repurchase about a further 11 million shares (representing 0.46% of our issued share capital), the shareholdings in CLP of the Parties would thereby exceed 35%, the threshold at which they would be obliged to make a mandatory general offer for the remaining shares of our Company.
In last year’s annual report and on our website, we reported to shareholders on our unsuccessful application to the Securities and Futures Commission (SFC) and to the Takeovers and Mergers Panel for a ruling that the Takeovers and Mergers Code does not preclude a whitewash waiver application in respect of a mandatory general offer obligation triggered by on-market share repurchases. We made that application on the basis that, having consulted the Independent Non-executive Directors, it was in the interests of the Company and all its shareholders that the Company be able to continue its on-market share repurchases without creating a mandatory general offer obligation, or compelling the parties associated with the Kadoorie Family to sell down in anticipation of future share repurchases. We also noted that a whitewash waiver in such circumstances was in line with accepted practice in countries against which Hong Kong might benchmark itself, such as Australia, the UK and Singapore.
In November 2004 the SFC issued a Consultation Paper on a Review of the Codes on Takeovers and Mergers and Share Repurchases. This, amongst many other issues, invited views on whether the Codes should be amended to provide for whitewash waivers of general offer obligations triggered as a result of on-market share repurchases, accompanied by safeguards for shareholders. With the support of our Independent Non-executive Directors, CLP has made a strong submission to the SFC (available on our website) arguing in favor of the possibility of such waivers.
Pending amendment to the Codes (which remains quite uncertain) we will bear in mind other means which will enable share repurchases to be effected. However, we recognize that share repurchases are but one route by which shareholders’ value can be enhanced. For the time being, we have no specific plans with respect to share repurchases.
C. Material Contracts
We have not entered into any material contract other than those entered into in the ordinary course of business for the two years immediately preceding the publication of this annual report except for those described in “Item 8B. Significant Changes”.
D. Exchange Controls
Under existing Hong Kong law, there are no foreign exchange controls or other decrees or regulations (1) which restrict the import or export of capital and which affect the availability of cash and cash equivalents for use by us; and (2) that affect the remittance of dividends, interest or other payments to non-resident holders of our securities. There are also no limitations on the rights of non-resident or foreign owners to hold or vote the shares imposed by Hong Kong law or by our Memorandum and Articles of Association.
138
E. Taxation
The following summary of Hong Kong taxes and United States federal income tax is of general nature only and is based on the tax laws in effect on the date of this annual report. You, as investors in our shares or American Depository Shares, or ADSs, are advised to consult your own tax advisors with respect to your individual situation as to Hong Kong, United States or other tax consequences of the purchase, ownership and disposition of our shares or ADSs.
Hong Kong Taxation
The following is a brief summary of the Hong Kong taxes to which holders of our shares or ADSs are subject to current Hong Kong law.
Taxation of Dividends and Capital Gains
Under existing Hong Kong law, neither we nor any paying agent will be required to declare or withhold for or on account of any Hong Kong taxes in respect of dividends paid by us, except that holders of our shares or ADS carrying on a trade, profession or business in Hong Kong may be subject to Hong Kong taxation on the receipt of such payments.
Capital gains arising from the sale of our shares or ADSs are also not taxable in Hong Kong, except that Hong Kong profits tax may arise in the case of persons carrying on a trade, profession or business in Hong Kong.
Stamp Duty
Our shares constitute Hong Kong stock for the purposes of Hong Kong stamp duty. Effective September 1, 2001, any person who effects a sale or purchase of our shares, whether as principal or as agent, is required to execute a contract note evidencing such sale or purchase and to have that note stamped. Contract notes attract stamp duty at the rate of HK$2 per HK$1,000 or part thereof (of which half is payable by the seller and half by the purchaser) by reference to the value of the consideration or market value, whichever is greater. If, in the case of a sale or purchase of our shares by a person who is not resident in Hong Kong, the stamp duty on either or both of the contract notes is not paid, the transferee will be liable to pay stamp duty on the instrument of transfer in an amount equal to the unpaid duty. In addition, if the stamp duty is not paid on or before the due date, a penalty of up to 10 times the duty payable may be imposed.
Transfers of ADSs are generally not subject to Hong Kong stamp duty where the transfer is not required to be registered in Hong Kong. An ADS which confers on the holder an entitlement to specific shares (e.g. by linking the serial numbers of the shares to which it relates) would, however, attract Hong Kong stamp duty on transfer.
139
Estate Duty
Our shares are Hong Kong property for the purposes of the Estate Duty Ordinance (Chapter 111 of the Laws of Hong Kong, as amended) and accordingly Hong Kong estate duty may be payable in respect of our shares on the death of the owner of such shares. ADSs that are not physically located in Hong Kong may not, according to existing practice, be regarded as Hong Kong property for such purposes, in which event no Hong Kong estate duty would be payable in respect of such ADSs. However, we cannot assure you that the Hong Kong Inland Revenue Department will not treat the ADSs as Hong Kong property that may be subject to estate duty on the death of the beneficial owner of the ADSs even if the ADSs are located outside Hong Kong at the date of such death. The chances of the Hong Kong Inland Revenue Department treating the ADSs as Hong Kong property would be particularly high if an ADS confers on the holder an entitlement to specific shares (e.g. by linking the serial numbers of the shares to which it relates).
Where the shares, and possibly the ADSs, are owned by a controlled company which is defined under the Estate Duty Ordinance as a company under the control of not more than 5 persons, the death of a person who made at any time a transfer of property to such company and who received or could have received benefits from the company in the 3 years ending with that person’s death may expose the company to a liability to estate duty.
In the 2005-2006 Budget published in March 2005, the Financial Secretary has proposed to abolish the estate duty to promote the development of the asset management business. The relevant bill will need the approval of the Legislative Council.
United States Taxation
The following is a summary of the material United States federal income tax consequences for beneficial owners of our shares and ADSs that hold such shares or ADSs as capital assets and that are U.S. holders that do not carry on a trade, profession or business in Hong Kong.
A U.S. holder is a beneficial owner of shares or ADSs that is:
| | • | | an individual who is a citizen or resident of the United States; |
| | • | | a corporation or other entity taxable as a corporation for United States federal income tax purposes created or organized in or under the laws of the United States or any political subdivision thereof; |
| | • | | an estate the income of which is subject to United States federal income taxation regardless of its source; or |
| | • | | a trust if (a) it is subject to the primary supervision of a court within the United States and one or more United States persons have the authority to make all substantial decisions of the trust or (b) it has a valid election in effect under applicable U.S. Treasury regulations to be treated as a United States person. |
140
This summary does not represent a detailed description of all the federal income tax consequences to you in light of your particular circumstances and does not address the effects of any state, local or non-U.S. tax laws (or other U.S. federal tax consequences, such as U.S. federal estate or gift tax consequences). In addition, it does not deal with tax consequences to you if you are subject to special treatment under the United States federal income tax laws, including if:
| | • | | you are a dealer in securities or currencies; |
| | • | | you are a trader in securities and you elect to use a mark-to-market method of accounting for your securities holdings; |
| | • | | you are a financial institution, tax-exempt entity or insurance company; |
| | • | | you are a regulated investment company or a real estate investment trust; |
| | • | | you hold your shares or ADSs as part of a hedging, integrated, conversion or constructive sale transaction or a straddle; |
| | • | | you are liable for alternative minimum tax; |
| | • | | you own, actually or constructively, 10% or more of our voting stock or |
| | • | | your “functional currency” is not the United States dollar. |
Furthermore, the discussion below is based upon the provisions of the Internal Revenue Code of 1986, as amended, and regulations, rulings and judicial decisions thereunder as of the date of this annual report, and such authorities may be repealed, revoked or modified so as to result in United States federal income tax consequences different from those discussed below. It is for general purposes only and you should not consider it to be tax advice. In addition, this summary is based, in part, upon representations made by JPMorgan Chase Bank (formerly known as Morgan Guaranty Trust Company of New York), as depositary for the ADSs, to us and assumes that the Deposit Agreement made among us and JPMorgan Chase Bank, as depositary and holders of the ADSs, dated as of January 6, 1998, and all other related agreements, will be performed in accordance with their terms.
If a partnership holds shares or ADSs, the tax treatment of a partner will generally depend upon the status of the partner and the activities of the partnership. If you are a partner of a partnership holding shares or ADSs, you should consult your tax advisors.
ADSs
In general, for United States federal income tax purposes, if you hold ADSs you will be treated as the owner of the underlying shares that are represented by the ADSs. Deposits or withdrawals of shares, actually or constructively, by U.S. holders, for ADSs generally will not be subject to United States federal income tax.
Taxation of Dividends
Subject to the discussion of passive foreign investment companies below, the amount of dividends you receive on your shares or ADSs will generally be treated as dividend income to you if the distributions are paid out of our current or accumulated earnings and profits, as determined under United States federal income tax principles. These amounts will be includable in your gross income as ordinary income on the day you actually or constructively receive the dividends, which in the case of an ADS will be the date the depository actually or constructively receives the dividends. You will not be entitled to claim the dividends received deduction with respect to dividends you receive from us.
141
Under the current enacted legislation, dividends received before January 1, 2009 by U.S. holders that are individuals on shares of certain foreign corporations may be subject to United States federal income tax at lower rates than other types of ordinary income if certain conditions are met. You should consult your own tax advisor regarding the application of this legislation to your particular circumstances.
The amount of any dividend paid in Hong Kong dollars will equal the U.S. dollar value of the Hong Kong dollars you receive, calculated by reference to the exchange rate in effect on the date you actually or constructively receive the dividend, which in the case of ADSs will be the date actually or constructively received by the depository, regardless of whether the Hong Kong dollars are actually converted into U.S. dollars. If the Hong Kong dollars you receive as a dividend are not converted into U.S. dollars on the date you receive them, you will have a basis in the Hong Kong dollars equal to their U.S. dollar value on the date of receipt. Any gain or loss you realize if you subsequently sell or otherwise dispose of the Hong Kong dollars will be treated as ordinary gain or loss from sources within the United States for foreign tax credit limitation purposes.
To the extent that the amount of any distribution exceeds our current and accumulated earnings and profits for a taxable year, the distribution will first be treated as a tax-free return of capital, causing a reduction in your adjusted basis in the shares or ADSs. Such reduction in your basis in the shares or ADSs will increase the amount of gain, or decrease the amount of loss, which you will recognize on a subsequent disposition of the shares or ADSs. The balance in excess of your adjusted basis will be taxable to you as capital gain recognized on a sale or exchange.
Taxation of Capital Gains
Subject to the discussion of passive foreign investment companies below, for United States federal income tax purposes, you will recognize taxable gain or loss on any sale, exchange or other disposition of a share or ADS in an amount equal to the difference between the U.S. dollar value of amount realized for the share or ADSs and your basis in the share or ADSs, determined in U.S. dollars. This gain or loss will be capital gain or loss. If you have held the shares or ADSs for more than one year your gain recognized will be eligible for reduced rates of taxation. The deductibility of capital losses is subject to limitations. For foreign tax credit limitation purposes, any gain or loss you recognize will generally be treated as United States source gain or loss.
Passive Foreign Investment Company
We believe that we were not a “passive foreign investment company” (“PFIC”) for United States federal income tax purposes for 2004. In addition, based on the projected composition of our income and valuation of our assets, including goodwill, we do not expect to be a PFIC for 2005. However, since PFIC status depends upon the composition of our income and assets and the market value of our assets (including, among others, goodwill) from time to time, there can be no assurance that we will not be considered a PFIC for any taxable year. If we were treated as a PFIC for any taxable year during which you held our shares or ADSs, certain adverse consequences could apply to you.
142
Information Reporting and Backup Withholding
In general, unless you are an exempt recipient such as a corporation, information reporting requirements will apply to dividends in respect of the shares or ADSs or the proceeds received on the sale, exchange, or redemption of the shares or ADSs paid within the United States (and in certain cases, outside of the United States) to you, and backup withholding may apply to such amounts if you fail to provide an accurate taxpayer identification number, or fail to either report interest and dividends required to be shown on your federal income tax returns or to make the necessary certifications. The amount of any backup withholding from a payment to you will be allowed as a refund or a credit against your United States federal income tax liability, provided you furnish the required information to the Internal Revenue Service.
143
F. Dividends and Paying Agents
Not applicable.
G. Statement by Experts
Not applicable.
H. Documents on Display
The U.S. Securities and Exchange Commission, or the SEC, allows us to “incorporate by reference” the information we have filed with the SEC. This means that we can disclose important information to you by referring you to another document filed separately with the SEC. The information incorporated by reference in this annual report is considered to be part of this annual report. We therefore incorporate by reference in Item 19 of this annual report certain exhibits which we filed with the SEC before. You may read and copy this annual report, including the exhibit(s) incorporated by reference in this annual report, at the SEC’s Public Reference Room at 450 Fifth Street, N.W., Washington, DC 20549 and at the SEC’s regional offices in New York, New York and Chicago, Illinois. You can also request copies of this annual report, including the exhibit(s) incorporated by reference in this annual report, upon payment of a duplicating fee, by writing to the SEC’s Public Reference Room.
The SEC also maintains a website atwww.sec.gov that contains reports, proxy statements and other information regarding registrants that file electronically with the SEC. Our annual report and some of the other information submitted by us to the SEC may be accessed through this web site.
I. Subsidiary Information
Not applicable.
144
| Item 11. | Quantitative and Qualitative Disclosures about Market Risk |
Our electrical utility operations in Hong Kong are regulated under the Scheme of Control. Under the terms of the Scheme of Control, CLP Power Hong Kong’s and CAPCO’s financing costs in excess of 8% per annum, costs of fuel and commodity costs are passed on to customers through the tariff mechanism so that we are able to receive our net return. See Item 4. “Information on the Company — B. Business Overview — Electricity Business in Hong Kong — Scheme of Control”.
Due to these arrangements, we do not believe that during the term of the current Scheme of Control which expires in 2008, we would face material market risks to our rate of return from interest rate risk, foreign currency exchange risk or commodity price risk. Under the Scheme of Control, however, we have an overriding obligation to provide electricity to our service area at the lowest possible cost, and we must periodically submit financial plans to the Hong Kong Government for approval.
Foreign Currency Risk
Our primary foreign currency exposure arises from our strategic investments outside of Hong Kong, particularly those in the Asia-Pacific region outside Hong Kong and the Chinese mainland. As of December 31, 2004, approximately 27.8% of our consolidated total assets, or HK$22,468 million (US$2,891 million), are from this geographical segment. CLP Power Hong Kong also has significant foreign currency obligations related to its U.S. dollar-denominated debt, nuclear power purchase off-take commitments and fuel-related payments. Any volatility in currency exchange rate between Hong Kong dollar and other currencies may affect our financial position and results of operations.
To manage the impact of foreign exchange rate fluctuations on our operations, where appropriate and available on a cost-efficient basis, we seek to finance our overseas project investments through the use of domestic funding sources. In addition, certain projects utilize direct and indirect indexing provisions in their project agreements to match the projects’ foreign exchange costs. The objective of each project company is to be resilient to adverse movements in key currency exchange rates in order to continue to meet its debt service requirements and achieve an acceptable return.
We do not hedge foreign currency translation gains and losses that are included in the equity section of our balance sheet as a result of the conversion of project company financial statement accounts into our functional currency. Our view is predicated on the resilience of our debt/total capitalization ratios to currency movements, the availability of effective hedging instruments, the high cost associated with hedging the exposure, and our long-term view on our investments and the underlying economic prospects of our target countries.
CLP Power Hong Kong’s foreign exchange risk is mitigated through the current regulatory regime that allows for a pass-through of foreign exchange gains and losses. As a measure of additional prudence, CLP Power Hong Kong hedges a significant portion of its forward U.S. dollar obligations for up to five years provided that the hedging can be accomplished at rates below the 7.80 peg rate of Hong Kong dollar against the U.S. dollar.
145
Interest Rate Risk
Whether investing or borrowing, interest rate movements create both risks and opportunities that need to be addressed. At CLP Power Hong Kong, interest rate risks are managed within a preferred fixed/floating interest rate mix. In our overseas investments, each project company develops its own hedging program taking into consideration project debt service sensitivities to interest rate movements, lender requirements, tax and accounting implications. The purpose of each program is to produce a risk profile appropriate to the specific business, and consistent with the Group’s strategic objectives.
Off-balance Sheet Financial Instruments
We use different derivative instruments to manage our exposure to foreign currency, interest rate risks, and price risks associated with the sales and purchases of electricity in Australia, with an objective to minimize the impact of exchange rate, interest rate and electricity price fluctuations on earnings, reserves and tariff charges to customers. All transactions are made with counterparties with acceptable credit quality and a limit is assigned to each counterparty for monitoring the credit exposure.
We do not invest in risk sensitive instruments for trading purposes, except Yallourn Energy. Yallourn Energy uses electricity energy contracts, including forward electricity pricing contracts, swaps and options, principally to hedge the price risk of sales and purchases of electricity in Australia to satisfy retail sales contract obligations and has limited electricity trading activities for its wholesale market. As of December 31, 2004, the fair value of swaps and options related to Yallourn Energy’s electricity trading activities was at surplus of approximately HK$4 million (US$0.5 million).
Other than the limited electricity trading activities engaged by Yallourn Energy, all derivative instruments are employed solely for hedging purposes. As we employ these derivative instruments solely for hedging purposes, we are not exposed to market risk resulting from the derivative transactions because the change in fair value will be offset by an opposite change in the values of the underlying hedged items.
The tables below provide information about our derivative financial instruments that are sensitive to changes in interest rates or foreign currency exchange rates. For debt obligations, the tables present principal cash flows and related weighted average interest rates by expected maturity dates. For cross currency and interest rate swaps, forward foreign exchange contracts and currency options, the tables present the notional amounts and weighted average exchange rates or weighted average interest rates by contractual maturity dates.
The interest rate risk table also assumes interest rates based on the implied forward rates in the yield curve at year end. Actual future market conditions may differ materially from such assumptions.
Deposits and short-term borrowings (including overdrafts and money market loans) are not included in the following tables. Due to the short-term nature of deposits and short-term borrowings, the fair values of these instruments approximate costs.
146
INTEREST RATE RISK
| | | | | | | | | | | | | | | | | | | | | | | | |
| | | | | December 2004
| | | December 2003
| |
| | | | | Expected Maturity Dates
| | Total
| | Aggregate Fair Value(1)
| | | Total
| | Aggregate Fair Value(1)
| |
| | | | | 2005
| | 2006
| | 2007
| | 2008
| | 2009
| | Thereafter
| | | | |
| | | | | In HK$ equivalent, millions | | | | | | |
On-balance sheet financial instruments | | | | | | | | | | | | | | | | | | | | | | | | |
| | | Currency
| | | | | | | | | | | | | | | | | | | | | | |
I. Capital Markets Instruments | | | | | | | | | | | | | | | | | | | | | | | | |
| | | | | | | | | | | |
Fixed Rate Note | | USD | | – | | 2,340 | | – | | – | | – | | 2,340 | | 4,680 | | 5,060 | | | 4,680 | | 5,209 | |
Average Interest Rate % | | | | – | | 7.50 | | – | | – | | – | | 6.25 | | 6.88 | | | | | 6.88 | | | |
| | | | | | | | | | | |
Fixed Rate Note | | HKD | | – | | – | | – | | – | | – | | 2,000 | | 2,000 | | 2,143 | | | 1,000 | | 1,015 | |
Average Interest Rate % | | | | – | | – | | – | | – | | – | | 4.67 | | 4.67 | | | | | 4.73 | | | |
| | | | | | | | | | | |
II. Bank Loans | | | | | | | | | | | | | | | | | | | | | | | | |
| | | | | | | | | | | |
Fixed Rate | | USD | | 2 | | – | | – | | – | | – | | – | | 2 | | 2 | | | 4 | | 4 | |
Average Interest Rate % | | | | 5.42 | | – | | – | | – | | – | | – | | 5.42 | | | | | 5.42 | | | |
| | | | | | | | | | | |
Fixed Rate | | INR | | 32 | | 26 | | 23 | | – | | – | | – | | 81 | | 78 | | | 160 | | 152 | |
Average Interest Rate % | | | | 12.10 | | 11.93 | | 11.27 | | – | | – | | – | | 11.81 | | | | | 16.20 | | | |
| | | | | | | | | | | |
Floating Rate | | AUD | | 487 | | 2,408 | | 457 | | 484 | | 485 | | 1,723 | | 6,044 | | 6,023 | | | 9,335 | | 9,335 | |
Average Interest Rate % | | | | 6.74 | | 7.60 | | 7.84 | | 7.97 | | 8.05 | | 8.11 | | 7.76 | | | | | 7.36 | | | |
| | | | | | | | | | | |
Floating Rate | | HKD | | – | | 303 | | 2,206 | | 1,720 | | – | | – | | 4,229 | | 4,229 | | | 1,503 | | 1,503 | |
Average Interest Rate % | | | | – | | 2.02 | | 2.02 | | 3.05 | | – | | – | | 2.44 | | | | | 3.54 | | | |
| | | | | | | | | | | |
Floating Rate | | INR | | 22 | | 22 | | 11 | | 2 | | – | | – | | 57 | | 56 | | | 23 | | 23 | |
Average Interest Rate % | | | | 9.31 | | 9.31 | | 8.96 | | 7.75 | | – | | – | | 9.19 | | | | | 13.69 | | | |
| | | | | | | | | | | |
Floating Rate | | EUR | | 213 | | 214 | | 213 | | 213 | | 213 | | 193 | | 1,259 | | 1,278 | | | 1,417 | | 1,493 | |
Average Interest Rate % | | | | 3.63 | | 4.12 | | 4.50 | | 4.80 | | 5.12 | | 5.27 | | 4.56 | | | | | 5.38 | | | |
| | | | | | | | | | | |
Floating Rate | | USD | | – | | – | | – | | – | | – | | – | | – | | – | | | 8 | | 8 | |
Average Interest Rate % | | | | – | | – | | – | | – | | – | | – | | – | | | | | 4.68 | | | |
| | | |
| | | | | December 2004
| | | December 2003
| |
| | | | | Expected Maturity Dates
| | Total
| | Aggregate Fair Value(1)
| | | Total
| | Aggregate Fair Value(1)
| |
| | | | | 2005
| | 2006
| | 2007
| | 2008
| | 2009
| | Thereafter
| | | | |
| | | | | In HK$ equivalent, millions | | | | | | |
Off-balance sheet financial instruments | | | | | | | | | | | | | | | | | | | | | | | | |
| | | Currency
| | | | | | | | | | | | | | | | | | | | | | |
III. Cross Currency & Interest Rate Swaps | | | | | | | | | | | | | | | | | | | | | | | | |
| | | | | | | | | | | |
1 Fixed to Variable | | | | | | | | | | | | | | | | | | | | | | | | |
Notional pay amount | | HKD | | – | | 1,170 | | – | | – | | – | | 2,340 | | 3,510 | | 301 | | | 3,510 | | 388 | |
Notional receive amount | | USD | | – | | 1,170 | | – | | – | | – | | 2,340 | | 3,510 | | | | | 3,510 | | | |
Interest pay rate (%) | | | | – | | 1.85 | | – | | – | | – | | 4.60 | | 3.68 | | | | | 4.34 | | | |
Interest receive rate (%) | | | | – | | 7.50 | | – | | – | | – | | 6.25 | | 6.67 | | | | | 6.67 | | | |
| | | | | | | | | | | |
2 Fixed to Fixed | | | | | | | | | | | | | | | | | | | | | | | | |
Notional pay amount | | HKD | | – | | 1,170 | | – | | – | | – | | – | | 1,170 | | (46 | ) | | 1,170 | | (32 | ) |
Notional receive amount | | USD | | – | | 1,170 | | – | | – | | – | | – | | 1,170 | | | | | 1,170 | | | |
Interest pay rate (%) | | | | – | | 8.00 | | – | | – | | – | | – | | 8.00 | | | | | 8.00 | | | |
Interest receive rate (%) | | | | – | | 7.50 | | – | | – | | – | | – | | 7.50 | | | | | 7.50 | | | |
147
INTEREST RATE RISK (continued)
| | | | | | | | | | | | | | | | | | | | | | | | |
| | | | | December 2004
| | | December 2003
| |
| | | | | Expected Maturity Dates
| | Total
| | Aggregate Fair Value(1)
| | | Total
| | Aggregate Fair Value(1)
| |
| | | | | 2005
| | 2006
| | 2007
| | 2008
| | 2009
| | Thereafter
| | | | |
| | | | | In HK$ equivalent, millions | | | | | | |
| | | | | | | | | | | |
IV. Interest Rate Swaps | | | | | | | | | | | | | | | | | | | | | | | | |
| | | | | | | | | | | |
1 Variable to Fixed | | | | | | | | | | | | | | | | | | | | | | | | |
Notional amount | | HKD | | – | | 1,170 | | 1,000 | | – | | – | | – | | 2,170 | | (167 | ) | | 2,170 | | (201 | ) |
Interest pay rate (%) | | | | – | | 5.65 | | 5.32 | | – | | – | | – | | 5.50 | | | | | 5.50 | | | |
Interest receive rate (%) | | | | – | | 1.50 | | 2.13 | | – | | – | | – | | 1.79 | | | | | 2.34 | | | |
| | | | | | | | | | | |
2 Variable to Fixed | | | | | | | | | | | | | | | | | | | | | | | | |
Notional amount | | AUD | | 3,332 | | 1,393 | | 2,272 | | 3,315 | | 2,299 | | 1,514 | | 14,125 | | (191 | ) | | 13,928 | | (147 | ) |
Interest pay rate (%) | | | | 6.07 | | 6.32 | | 6.53 | | 6.83 | | 6.53 | | 6.58 | | 6.48 | | | | | 6.59 | | | |
Interest receive rate (%) | | | | 5.52 | | 6.00 | | 6.24 | | 6.37 | | 6.45 | | 6.51 | | 6.14 | | | | | 6.25 | | | |
Note:
| (1) | Fair value for off-balance sheet financial instruments represent the amounts we would receive / (pay) to close out the transactions. |
148
CURRENCY RISK
| | | | | | | | | | | | | | | | | | | | | | |
| | | | | December 2004
| | December 2003
|
| | | | | Expected Maturity Dates
| | Total
| | Aggregate Fair Value(1)
| | Total
| | Aggregate Fair Value(1)
|
| | | | | 2005
| | 2006
| | 2007
| | 2008
| | 2009
| | Thereafter
| | | | |
| | | | | In HK$ equivalent, millions | | | | |
On-balance sheet financial instruments | | | | | | | | | | | | | | | | | | | | | | |
| | | Currency
| | | | | | | | | | | | | | | | | | | | |
I. Bank Loans | | | | | | | | | | | | | | | | | | | | | | |
| | | | | | | | | | | |
Fixed Rate | | INR | | 32 | | 26 | | 23 | | – | | – | | – | | 81 | | 78 | | 160 | | 152 |
Average Interest Rate % | | | | 12.10 | | 11.93 | | 11.27 | | – | | – | | – | | 11.81 | | | | 16.20 | | |
| | | | | | | | | | | |
Fixed Rate | | USD | | 2 | | – | | – | | – | | – | | – | | 2 | | 2 | | 4 | | 4 |
Average Interest Rate % | | | | 5.42 | | – | | – | | – | | – | | – | | 5.42 | | | | 5.42 | | |
| | | | | | | | | | | |
Floating Rate | | AUD | | 487 | | 2,408 | | 457 | | 484 | | 485 | | 1,723 | | 6,044 | | 6,023 | | 9,335 | | 9,335 |
Average Interest Rate % | | | | 6.74 | | 7.60 | | 7.84 | | 7.97 | | 8.05 | | 8.11 | | 7.8 | | | | 7.36 | | |
| | | | | | | | | | | |
Floating Rate | | INR | | 22 | | 22 | | 11 | | 2 | | – | | – | | 57 | | 56 | | 23 | | 23 |
Average Interest Rate % | | | | 9.31 | | 9.31 | | 8.96 | | 7.75 | | – | | – | | 9.2 | | | | 13.69 | | |
| | | | | | | | | | | |
Floating Rate | | EUR | | 213 | | 214 | | 213 | | 213 | | 213 | | 193 | | 1,259 | | 1,278 | | 1,417 | | 1,493 |
Average Interest Rate % | | | | 3.63 | | 4.12 | | 4.5 | | 4.8 | | 5.12 | | 5.27 | | 4.6 | | | | 5.38 | | |
| | | | | | | | | | | |
Floating Rate | | USD | | – | | – | | – | | – | | – | | – | | – | | – | | 8 | | 8 |
Average Interest Rate % | | | | – | | – | | – | | – | | – | | – | | – | | | | 4.68 | | |
| | | |
| | | | | December 2004
| | December 2003
|
| | | | | Expected Maturity Dates
| | Total
| | Aggregate Fair Value(1)
| | Total
| | Aggregate Fair Value(1)
|
| | | | | 2005
| | 2006
| | 2007
| | 2008
| | 2009
| | Thereafter
| | | | |
| | | | | In HK$ equivalent, millions | | | | |
Off-balance sheet financial instruments | | | | | | | | | | | | | | | | | | | | | | |
| | | Currency
| | | | | | | | | | | | | | | | | | | | |
II. Currency Options | | | | | | | | | | | | | | | | | | | | | | |
| | | | | | | | | | | |
US Dollar (in millions) | | | | – | | – | | – | | – | | – | | – | | – | | – | | 16 | | – |
Weighted Average Contract Rate (Vs AUD) | | | | – | | – | | – | | – | | – | | – | | – | | | | 0.6943 | | |
| | | | | | | | | | | |
Japanese Yen (in millions) | | | | – | | – | | – | | – | | – | | – | | – | | – | | 13 | | – |
Weighted Average Contract Rate (Vs AUD) | | | | – | | – | | – | | – | | – | | – | | – | | | | 75.4111 | | |
Note:
| (1) | Fair value for off-balance sheet financial instruments represent the amounts we would receive / (pay) to close out the transactions. |
149
CURRENCY RISK (continued)
| | | | | | | | | | | | | | | | | | | | | | |
| | | December 2004
| | | December 2003
| |
| | | Expected Maturity Dates
| | Total
| | Aggregate Fair Value(1)
| | | Total
| | Aggregate Fair Value(1)
| |
| | | 2005
| | 2006
| | 2007
| | 2008
| | 2009
| | Thereafter
| | | | |
| | | In HK$ equivalent, millions | | | | | | |
III. Forward Foreign Exchange Contracts | | | | | | | | | | | | | | | | | | | | | | |
| | | | | | | | | | |
1For Firm Commitments | | | | | | | | | | | | | | | | | | | | | | |
Swiss Franc (in millions) | | 1 | | – | | – | | – | | – | | – | | 1 | | 0 | | | 7 | | 1 | |
Weighted Average Contract
Rate (Vs HKD) | | 6.3479 | | – | | – | | – | | – | | – | | 6.3479 | | | | | 5.6882 | | | |
| | | | | | | | | | |
British Pounds (in millions) | | 12 | | – | | – | | – | | – | | – | | 12 | | 0 | | | 10 | | 1 | |
Weighted Average Contract
Rate (Vs HKD) | | 14.6161 | | – | | – | | – | | – | | – | | 14.6161 | | | | | 13.0053 | | | |
| | | | | | | | | | |
Japanese Yen (in millions) | | 8 | | 1 | | – | | – | | – | | – | | 9 | | 1 | | | 25 | | 1 | |
Weighted Average Contract
Rate (Vs HKD) | | 0.0738 | | 0.0743 | | – | | – | | – | | – | | 0.0739 | | | | | 0.0703 | | | |
| | | | | | | | | | |
Euro (in millions) | | 127 | | 4 | | – | | – | | – | | – | | 131 | | 9 | | | 181 | | 22 | |
Weighted Average Contract
Rate (Vs HKD) | | 10.0221 | | 10.3084 | | – | | – | | – | | – | | 10.0308 | | | | | 8.6554 | | | |
| | | | | | | | | | |
2For Anticipated Transactions | | | | | | | | | | | | | | | | | | | | | | |
Australian Dollar (in millions) | | – | | – | | – | | – | | – | | – | | – | | – | | | 1,130 | | (15 | ) |
Weighted Average Contract
Rate (Vs HKD) | | – | | – | | – | | – | | – | | – | | – | | | | | 5.6747 | | | |
| | | | | | | | | | |
British Pounds (in millions) | | 5 | | – | | – | | – | | – | | – | | 5 | | 0 | | | 1 | | – | |
Weighted Average Contract
Rate (Vs HKD) | | 14.6161 | | – | | – | | – | | – | | – | | 14.6161 | | | | | 13.0053 | | | |
| | | | | | | | | | |
Japanese Yen (in millions) | | 5 | | 1 | | – | | – | | – | | – | | 6 | | 0 | | | – | | – | |
Weighted Average Contract
Rate (Vs HKD) | | 0.0738 | | 0.0743 | | – | | – | | – | | – | | 0.0739 | | | | | – | | | |
| | | | | | | | | | |
Euro (in millions) | | 45 | | 1 | | – | | – | | – | | – | | 46 | | 0 | | | 68 | | 8 | |
Weighted Average Contract
Rate (Vs HKD) | | 10.0221 | | 10.3084 | | – | | – | | – | | – | | 10.0283 | | | | | 8.6554 | | | |
| | | | | | | | | | |
US Dollars (in millions) | | 9,074 | | 8,635 | | 8,194 | | 7,791 | | 6,985 | | 168 | | 40,847 | | (1,217 | ) | | 43,290 | | (322 | ) |
Weighted Average Contract
Rate (Vs HKD) | | 7.7733 | | 7.7795 | | 7.7939 | | 7.7910 | | 7.6899 | | 7.7244 | | 7.7677 | | | | | 7.7878 | | | |
| | | | | | | | | | |
3For Net Investment in Foreign Operations | | | | | | | | | | | | | | | | | | | | | | |
Australian Dollar (in millions) | | 2,321 | | – | | – | | – | | – | | – | | 2,321 | | 23 | | | 610 | | (12 | ) |
Weighted Average Contract
Rate (Vs HKD) | | 5.9674 | | – | | – | | – | | – | | – | | 5.9674 | | | | | 5.7042 | | | |
| | | | | | | | | | |
Euro (in millions) | | 99 | | 99 | | 99 | | 99 | | 99 | | 99 | | 594 | | 20 | | | – | | – | |
Weighted Average Contract
Rate (Vs INR) | | 55.95 | | 55.95 | | 55.95 | | 55.95 | | 55.95 | | 55.95 | | 55.95 | | | | | – | | | |
| | | | | | | | | | |
US Dollars (in millions) | | 473 | | 516 | | – | | – | | – | | – | | 989 | | (28 | ) | | – | | – | |
Weighted Average Contract
Rate (Vs CNY) | | 8.0380 | | 7.8935 | | – | | – | | – | | – | | 7.9626 | | | | | – | | | |
Note:
| (1) | Fair value for off-balance sheet financial instruments represent the amounts we would receive / (pay) to close out the transactions. |
150
| Item 12. | Description of Securities Other than Equity Securities |
Not applicable.
151
PART II
| Item 13. | Defaults, Dividend Arrearages and Delinquencies |
None of these events occurred in any of fiscal years 2002, 2003 or 2004.
| Item 14. | Material Modifications to the Rights of Security Holders and Use of Proceeds |
Not Applicable.
152
| Item 15. | Controls and Procedures |
We have a policy of open communication and fair disclosure. Disclosure is a key means to enhance our corporate governance standards, in that it provides our shareholders with the information necessary for them to form their own judgment and to provide feedback to us. However, we understand that more disclosure does not necessarily result in increased transparency. The integrity of the information provided is essential for building market confidence.
We aim to present a clear and balanced assessment of our financial position and prospects. Our Directors ensure that accounts are prepared so as to give a true and fair view of our financial status. Financial results are announced as early as possible, and audited accounts are published within three months after the end of the financial year. Quarterly statements, which include turnover, interim dividends and progress in major business activities over the quarter, are issued to keep shareholders informed of our performance and operations of the Group.
An evaluation of the effectiveness of the design and operation of our disclosure controls and procedures had been carried out during the year under the supervision and with the participation of our management, including Mr. Andrew Brandler, our Group Managing Director & Chief Executive Officer, and Mr. Peter P. W. Tse, our Group Executive Director & Chief Financial Officer. Based on such evaluation, our Group Managing Director & Chief Executive Officer and Group Executive Director & Chief Financial Officer have concluded that our disclosure controls and procedures are effective, as of the end of the period covered by the annual report.
We also provide our shareholders and other stakeholders with information on our corporate governance structure, policies and systems via the Internet. See “Item 6. Directors, Senior Management and Employees — C. Board Practices — Reporting via Internet”.
In 2005, our subsidiary, CLP Power Asia Limited commenced the first phase of its accounting system conversion. The legacy accounting system will ultimately be replaced by a new Enterprise Resources Planning (ERP) system so that CLP Power Asia Limited will have the same system platform as its parent company. There have been no significant changes in our internal controls over financial reporting that occurred during the period covered by the annual report that have materially affected, or are reasonably likely to materially affect, our internal control over financial reporting.
As a foreign private issuer, we have to comply with the provisions of Section 404 of the Sarbanes-Oxley Act 2002 starting with the fiscal year ending on or after July 15, 2006. Following our practice of moving early to adopt best practices, since early 2004, we have commenced a Group-wide effort involving the thorough review of our internal control over financial reporting and assessing the risks involved, both at the entity level and also the various processes/transactions levels, and documenting the controls that we have put in place. By the end of 2004, we were already well advanced in this exercise. No material deficiencies have been identified so far.
153
| Item 16A. | Audit Committee Financial Expert |
In May 2003, our Board of Directors determined Mr. V. F. Moore to be our audit committee financial expert.
Mr. Moore was appointed as our Non-executive Director in 1997 and became our Independent Non-executive Director effective from September 27, 2002. He has also acted as the Chairman of the Audit Committee since April 1, 1998. He is a Fellow of The Institute of Chartered Accountants in England and Wales and a Fellow of The Hong Kong Institute of Certified Public Accountants. His biographical details are shown in “Item 6. Directors, Senior Management and Employees — A. Directors and Senior Management”.
We have adopted a value framework which sets out our vision, mission, strategy, values and policies. Under the guidance of this framework, we are committed to act with integrity in all our activities; we care how results are achieved, not just that they are achieved. This commitment stems from a corporate awareness that our long-term interests are best served by maintaining a strong commitment to honest and open business practices.
The value framework includes a formal Code of Conduct (the “Code”), which places all employees (including our Group Managing Director & Chief Executive Officer, Group Executive Director & Chief Financial Officer and Director of Group Financial Control) and directors under specific obligations as to the ethics and principles by which our business is conducted. We adopted our initial Code in the early 1990’s and we believe we are amongst the first companies in Hong Kong to document our commitments in such a code. We amended our Code in December 2002 to address the code of ethics requirements of the Sarbanes-Oxley Act. There have been no changes to the Code since then.
Management and staff receive periodic training on the Code and its implications from time to time. Staff at senior and middle management level is required to sign annual statements confirming compliance with the Code. During 2004, there were 11 breaches of the Code. Sanctions applied in 2004 ranged from reprimands to dismissal. None of the breaches of the Code involved senior managers or was material to the Group’s financial statements or overall operations. No waivers of any of the requirements of the Code were granted to any director or senior manager or, for that matter, any other employee. In May 2005, it was discovered that an employee of a foreign subsidiary with responsibility for financial reporting wrongly made claims for staff expenses for which he was not entitled. The employee will be asked to resign, failing which he will be terminated. There is no evidence to suggest that this employee committed any fraud related to the subsidiary’s internal control over financial reporting.
154
To establish a shared vision and a common set of values for all of our employees, we have also rolled out the value framework amongst our colleagues elsewhere in the CLP Group. Our Code has already been applied to GPEC, our consolidated subsidiary in India. A statement of principles and ethics, reflecting our Code, has been issued to all employees at Yallourn Energy, our consolidated subsidiary in Australia. In the case of joint ventures or companies in which we do not hold a controlling interest, our representatives concerned are expected to act in accordance with the Code themselves and to do everything possible to influence those with whom they are working to ensure that they also act to similar standards of integrity and ethical behavior.
The text of the Code is posted on our websitewww.clpgroup.com under the “Corporate Governance — CLP Value Framework and Policy — CLP Value Framework — Code of Conduct” section.
| Item 16C. | Principal Accountant Fees and Services |
| | | | |
| | | Total Fees
|
| | | 2004
| | 2003
|
| | | (in HK$ millions) |
| | |
Audit fees | | 9 | | 10 |
Audit-related fees | | 5 | | 3 |
Tax fees | | – | | 1 |
Other fees | | – | | – |
| | |
| |
|
| | | 14 | | 14 |
| | |
| |
|
Audit fees
Audit fees are fees billed for professional services rendered for the audit of our consolidated financial statements and the review of the interim consolidated financial statements.
Audit-related fees
Audit-related fees were billed for assurance and related services that are not reported under “Audit fees”. These services include employee benefit plan audits, annual review of offering circular under the MTN programme, merger and acquisition related services for potential projects, including accounting and tax due diligence, financial model audit and completion account audit, attest services that were not required by statute or regulation, and consultations concerning financial accounting and reporting standards. Audit-related fees in 2004 also included the pre-audit review of Sarbanes-Oxley Act Section 404 compliance of HK$3 million.
155
Tax fees
Tax fees in 2003 were related to services for tax compliance, tax advisory and filing services for expatriates or staff working outside Hong Kong and other tax advice.
Other fees
None was incurred during the year.
Policy on Audit Committee Pre-Approval of Audit and Permissible Non-Audit Services of Independent Registered Public Accounting Firm
Our Audit Committee is responsible for appointing, setting compensation, and overseeing the work of our independent registered public accounting firm. The Audit Committee has established policy and procedures for pre-approval of audit and non-audit services of our independent registered public accounting firm. The policy stipulates that the independent registered public accounting firm will not be employed for non-audit work unless it constitutes permissible non-audit work as defined in the Sarbanes-Oxley Act and has been pre-approved by the Audit Committee. On June 8, 2004, the Audit Committee approved the Supplementary Guidelines on Pre-approval of Non-audit Services. It is a refinement to the Guidelines on due diligence services and pre-approval policies and procedures. The Supplementary Guidelines clarify the responsibilities of our independent registered public accounting firm when they are engaged to carry out due diligence services and provision of accounting advice.
The Policy further stipulates that there must be clear efficiencies and value-added benefits to us from that work being undertaken by the independent registered public accounting firm, with no adverse effect on the independence of his/her audit work, or the perception of such independence. The total amount of permissible non-audit services provided by the independent registered public accounting firm each year should be budgeted at a level determined as appropriate by the Audit Committee, taking into account the business activities and the amount of audit work.
The guideline also outlines the procedures for the approval of permissible non-audit services by our independent registered public accounting firm. Such engagement can be approved on a case-by-case basis by the Audit Committee or based on pre-approval procedures endorsed by the Audit Committee as set out below.
| | (a) | At the beginning of each year, a budget for the provision of permissible non-audit services is to be submitted for consideration and approval by the Audit Committee. |
| | (b) | Before the actual engagement of the independent registered public accounting firm, the relevant business unit is to submit to the Group Executive Director & Chief Financial Officer, on a case-by-case basis and against the pre-approved budget, justification that the service meets the requirements of pre-approval policy and procedures and does not impair the independence of the independent registered public accounting firm. |
156
| | (c) | The Group Executive Director & Chief Financial Officer, if he considers the proposal is in order, may endorse the engagement where the estimated fee for that engagement is not more than HK$0.5 million. |
| | (d) | If the estimated service fee is more than HK$0.5 million, or if it exceeds the pre-approved budget level for that category of service, it will be submitted to the Audit Committee for explicit approval. |
| | (e) | A report on the actual engagement of the independent registered public accounting firm for permissible non-audit services to the Group is submitted to the Audit Committee half yearly, detailing the cost of each service and the justification thereof. |
The Audit Committee is permitted to approve fees for audit-related services, tax services and other services pursuant to ade minimus exception before the completion of the engagement. During the year, none of the fees paid were approved pursuant to thede minimus exception.
| Item 16D. | Exemptions from the Listing Standards for Audit Committees |
Not applicable.
| Item 16E. | Purchases of Equity Securities by the Issuer and Affiliated Purchasers |
Not applicable.
157
PART III
| Item 17. | Financial Statements |
Our consolidated financial statements and the report thereon by our independent registered public accounting firm listed below are attached to this annual report as follows:
| | |
| | | Page |
| |
CLP Holdings Limited | | |
| |
Report of Independent Registered Public Accounting Firm | | F – 2 |
| |
Consolidated Profit and Loss Accounts for the years ended December 31, 2002, 2003 and 2004 | | F – 3 |
| |
Consolidated Balance Sheets as of December 31, 2003 and 2004 | | F – 4 |
| |
Consolidated Statements of Changes in Equity for the years ended December 31, 2002, 2003 and 2004 | | F – 5 to F – 6 |
| |
Consolidated Cash Flow Statements for the years ended December 31, 2002, 2003 and 2004 | | F – 7 |
| |
Notes to the Consolidated Financial Statements | | F – 8 to F – 61 |
| |
Scheme of Control Statement | | F – 62 to F – 63 |
| |
Castle Peak Power Company Limited | | |
| |
Report of Independent Auditors | | F – 64 |
| |
Profit and Loss Accounts for the years ended December 31, 2002, 2003 and 2004 | | F – 65 |
| |
Balance Sheets as of December 31, 2003 and 2004 | | F – 66 |
| |
Statements of Changes in Equity for the years ended December 31, 2002, 2003 and 2004 | | F – 67 |
| |
Cash Flow Statements for the years ended December 31, 2002, 2003 and 2004 | | F – 68 |
| |
Notes to Financial Statements | | F – 69 to F – 80 |
158
| Item 18. | Financial Statements |
Not applicable.
159
| | |
| | | Exhibit Index |
Exhibit No.
| | Description
|
| 1.1 | | Memorandum and Articles of Association of our company adopted on October 8, 1997 and December 12, 1997, amended on October 8, 1999, April 25, 2002, May 5, 2003, April 22, 2004 and April 28, 2005. |
| |
| 2.1* | | Trust Deed in respect of the US$1,500,000,000 Medium Term Note Programme, established by our indirectly wholly owned subsidiary, CLP Power Hong Kong Financing Limited on April 3, 2002 and guaranteed by CLP Power Hong Kong Limited, modified by the First and Second Supplemental Trust Deeds dated April 15, 2003 and June 3, 2005, respectively. |
| |
| 4.1 | | Side letter in respect of Scheme of Control Agreement dated March 29, 2004 among CLP Power, CAPCO, ExxonMobil Energy Limited and the Hong Kong Government. |
| |
| 8.1 | | List of subsidiaries. See “Item 4. Information on the Company — C. Organization Structure”. |
| |
| 12.1 | | Certification by our Group Managing Director & Chief Executive Officer required by Rule 13a-14(a) or Rule 15d-14(a), pursuant to Section 302 of the Sarbanes-Oxley Act of 2002. |
| |
| 12.2 | | Certification by our Group Executive Director & Chief Financial Officer required by Rule 13a-14(a) or Rule 15d-14(a), pursuant to Section 302 of the Sarbanes-Oxley Act of 2002. |
| |
| 13.1 | | Certification by our Group Managing Director & Chief Executive Officer pursuant to 18 U.S.C. Section 1350 as adopted pursuant to Section 906 of the Sarbanes-Oxley Act of 2002. |
| |
| 13.2 | | Certification by our Group Executive Director & Chief Financial Officer pursuant to 18 U.S.C. Section 1350 as adopted pursuant to Section 906 of the Sarbanes-Oxley Act of 2002. |
| * | Trust Deed dated April 3, 2002 was incorporated by reference to our Annual Report on Form 20-F for the year ended December 31, 2001, dated June 25, 2002 and filed with the Securities and Exchange Commission on June 27, 2002. |
160
SIGNATURES
The registrant hereby certifies that it meets all of the requirements for filing on Form 20-F and that it has duly caused and authorized the undersigned to sign this annual report on its behalf.
| | |
| CLP HOLDINGS LIMITED |
 |
| |
| By: | | /s/ Peter P. W. Tse
|
| | | Peter P. W. Tse Group Executive Director & Chief Financial Officer |
Date: June 27, 2005
161
INDEX TO FINANCIAL STATEMENTS
| | |
| | | Page |
CLP Holdings Limited | | |
| |
Report of Independent Registered Public Accounting Firm | | F - 2 |
| |
Consolidated Profit and Loss Accounts for the years ended December 31, 2002, 2003 and 2004 | | F - 3 |
| |
Consolidated Balance Sheets as of December 31, 2003 and 2004 | | F - 4 |
| |
Consolidated Statements of Changes in Equity for the years ended December 31, 2002, 2003 and 2004 | | F – 5 to F – 6 |
| |
Consolidated Cash Flow Statements for the years ended December 31, 2002, 2003 and 2004 | | F – 7 |
| |
Notes to the Consolidated Financial Statements | | F – 8 to F – 61 |
| |
Scheme of Control Statement | | F – 62 to F – 63 |
| |
Castle Peak Power Company Limited | | |
| |
Report of Independent Auditors | | F – 64 |
| |
Profit and Loss Accounts for the years ended December 31, 2002, 2003 and 2004 | | F – 65 |
| |
Balance Sheets as of December 31, 2003 and 2004 | | F – 66 |
| |
Statements of Changes in Equity for the years ended December 31, 2002, 2003 and 2004 | | F – 67 |
| |
Cash Flow Statements for the years ended December 31, 2002, 2003 and 2004 | | F – 68 |
| |
Notes to Financial Statements | | F – 69 to F – 80 |
F-1
REPORT OF INDEPENDENT REGISTERED PUBLIC ACCOUNTING FIRM
To the Board of Directors and Shareholders of
CLP Holdings Limited
We have audited the accompanying consolidated balance sheets of CLP Holdings Limited and its subsidiaries as of December 31, 2003 and 2004, and the related consolidated profit and loss accounts, statements of changes in equity and cash flow statements for the years ended December 31, 2002, 2003 and 2004 which, as described in Note 1, have been prepared on the basis of accounting principles generally accepted in Hong Kong. These financial statements are the responsibility of the Company’s management. Our responsibility is to express an opinion on these financial statements based on our audits.
We conducted our audits in accordance with the standards of the Public Company Accounting Oversight Board (United States). Those standards require that we plan and perform the audit to obtain reasonable assurance about whether the financial statements are free of material misstatement. An audit includes examining, on a test basis, evidence supporting the amounts and disclosures in the financial statements. An audit also includes assessing the accounting principles used and significant estimates made by management, as well as evaluating the overall financial statement presentation. We believe that our audits provide a reasonable basis for our opinion.
Our audit was conducted for the purpose of forming an opinion on the basic financial statements taken as a whole. The Scheme of Control statement for the years ended December 31, 2002, 2003 and 2004 set out on page F-63, which has been prepared in accordance with the provisions of the Scheme of Control on page F-62, is presented for purposes of additional analysis and is not a required part of the basic financial statements.
In our opinion, the consolidated financial statements referred to above present fairly, in all material respects, the financial position of CLP Holdings Limited and its subsidiaries at December 31, 2003 and 2004, and the results of its operations and cash flows for the years ended December 31, 2002, 2003 and 2004 in conformity with accounting principles generally accepted in Hong Kong.
Accounting principles generally accepted in Hong Kong vary in certain significant respects from accounting principles generally accepted in the United States of America. The application of the latter would have affected the determination of consolidated financial position as expressed in Hong Kong dollars at December 31, 2003 and 2004, the determination of consolidated net income and the classification of consolidated cash flows also expressed in Hong Kong dollars for the years ended December 31, 2002, 2003 and 2004, as adjusted, to the extent summarized in Note 34 to the consolidated financial statements.
/s/ PricewaterhouseCoopers
PricewaterhouseCoopers
Certified Public Accountants
Hong Kong
June 27, 2005
F-2
CLP HOLDINGS LIMITED
CONSOLIDATED PROFIT AND LOSS ACCOUNTS
| | | | | | | | | | | | | | |
| | | | | Year ended December 31,
| |
| | | Note | | 2002
HK$M | | | 2003
HK$M | | | 2004
HK$M | | | 2004
US$M | |
| | | | | (Restated) | | | | | | | | | | |
TURNOVER | | 2 | | 26,134 | | | 28,248 | | | 30,784 | | | 3,961 | |
| | | | |
|
| |
|
| |
|
| |
|
|
Expenses | | | | | | | | | | | | | | |
Purchases of electricity | | 31(A) | | 15,586 | | | 15,873 | | | 16,055 | | | 2,066 | |
Staff expenses | | | | 945 | | | 1,157 | | | 1,284 | | | 165 | |
Fuel and other operating costs | | | | 1,331 | | | 2,249 | | | 3,026 | | | 389 | |
Depreciation | | | | 1,749 | | | 2,357 | | | 2,529 | | | 325 | |
| | | | |
|
| |
|
| |
|
| |
|
|
| | | | | 19,611 | | | 21,636 | | | 22,894 | | | 2,945 | |
| | | | |
|
| |
|
| |
|
| |
|
|
Property disposal gain | | 5 | | 313 | | | – | | | 214 | | | 27 | |
| | | | |
|
| |
|
| |
|
| |
|
|
Operating profit | | 2, 3 | | 6,836 | | | 6,612 | | | 8,104 | | | 1,043 | |
Finance costs | | 4 | | (189 | ) | | (688 | ) | | (1,046 | ) | | (134 | ) |
Finance income | | 4 | | 33 | | | 48 | | | 63 | | | 8 | |
Hok Un redevelopment profit | | 5 | | 282 | | | 291 | | | 187 | | | 24 | |
Share of profits less losses of jointly controlled entities | | 6 | | 2,992 | | | 3,399 | | | 3,181 | | | 409 | |
Share of profits less losses of associated companies | | 6 | | 86 | | | 102 | | | 236 | | | 30 | |
| | | | |
|
| |
|
| |
|
| |
|
|
Profit before taxation | | | | 10,040 | | | 9,764 | | | 10,725 | | | 1,380 | |
Taxation | | 10 | | (1,293 | ) | | (1,712 | ) | | (1,815 | ) | | (234 | ) |
| | | | |
|
| |
|
| |
|
| |
|
|
Profit after taxation | | | | 8,747 | | | 8,052 | | | 8,910 | | | 1,146 | |
Transfers under Scheme of Control (SoC) | | 11 | | (1,643 | ) | | (365 | ) | | (296 | ) | | (38 | ) |
| | | | |
|
| |
|
| |
|
| |
|
|
EARNINGS | | 12 | | | | | | | | | | | | |
| | | | | | | | | | | | | | | |
| | | | | | | | | | | | | | | |
| | | | | |
SoC earnings (Page F-63) | | | | 5,814 | | | 6,281 | | | 6,788 | | | 873 | |
Non-SoC operating earnings | | 13 | | 998 | | | 1,600 | | | 1,671 | | | 215 | |
Unallocated net finance costs | | | | (54 | ) | | (63 | ) | | (61 | ) | | (8 | ) |
Unallocated Group expenses | | | | (200 | ) | | (371 | ) | | (157 | ) | | (20 | ) |
| | | | |
|
| |
|
| |
|
| |
|
|
Total operating earnings | | | | 6,558 | | | 7,447 | | | 8,241 | | | 1,060 | |
Hok Un redevelopment profit/property disposal gain | | 5 | | 546 | | | 240 | | | 373 | | | 48 | |
| | | | | | | | | | | | | | | |
| | | | | | | | | | | | | | | |
Total earnings | | | | 7,104 | | | 7,687 | | | 8,614 | | | 1,108 | |
| | | | |
|
| |
|
| |
|
| |
|
|
DIVIDENDS | | 14 | | | | | | | | | | | | |
Interim dividends paid | | | | | | | | | | | | | | |
Ordinary | | | | 2,746 | | | 2,962 | | | 3,251 | | | 418 | |
Final dividends proposed | | | | | | | | | | | | | | |
Ordinary | | | | 1,228 | | | 1,565 | | | 1,758 | | | 226 | |
Special | | | | 554 | | | 241 | | | 361 | | | 46 | |
| | | | |
|
| |
|
| |
|
| |
|
|
| | | | | 4,528 | | | 4,768 | | | 5,370 | | | 690 | |
| | | | |
|
| |
|
| |
|
| |
|
|
| | | | | |
Earnings per share | | 15 | | HK$2.95 | | | HK$3.19 | | | HK$3.58 | | | US$0.46 | |
The accompanying notes are an integral part of the financial statements.
F-3
CLP HOLDINGS LIMITED
CONSOLIDATED BALANCE SHEETS
| | | | | | | | | | | |
| | | | | As of December 31,
| |
| | | Note | | 2003
HK$M | | | 2004
HK$M | | | 2004
US$M | |
CAPITAL EMPLOYED | | | | | | | | | | | |
Fixed assets | | 16 | | 54,157 | | | 57,748 | | | 7,430 | |
Goodwill | | 17 | | (1,017 | ) | | (1,022 | ) | | (131 | ) |
Investments in jointly controlled entities | | 19 | | 14,687 | | | 14,998 | | | 1,930 | |
Investments in associated companies | | 20 | | 1,593 | | | 1,640 | | | 211 | |
Investment securities | | | | 9 | | | 9 | | | 1 | |
Deferred tax assets | | 27 | | 952 | | | 1,043 | | | 134 | |
| | | | |
|
| |
|
| |
|
|
| | | | | 70,381 | | | 74,416 | | | 9,575 | |
| | | | |
|
| |
|
| |
|
|
Current assets | | | | | | | | | | | |
Bank balances, cash and other liquid funds | | 21 | | 787 | | | 2,520 | | | 324 | |
Other investments | | | | 10 | | | – | | | – | |
Inventories – stores and fuel | | | | 230 | | | 299 | | | 38 | |
Trade and other receivables | | 22 | | 4,424 | | | 3,564 | | | 459 | |
| | | | |
|
| |
|
| |
|
|
| | | | | 5,451 | | | 6,383 | | | 821 | |
| | | | |
|
| |
|
| |
|
|
Current liabilities | | | | | | | | | | | |
Customers’ deposits | | | | (2,878 | ) | | (3,119 | ) | | (401 | ) |
Short-term loans and current portion of long-term loans and other borrowings | | 26 | | (1,095 | ) | | (1,178 | ) | | (152 | ) |
Fuel clause account | | 23 | | (874 | ) | | (762 | ) | | (98 | ) |
Taxation payable | | | | (64 | ) | | (403 | ) | | (52 | ) |
Trade and other payables | | 24 | | (3,994 | ) | | (4,216 | ) | | (542 | ) |
| | | | |
|
| |
|
| |
|
|
| | | | | (8,905 | ) | | (9,678 | ) | | (1,245 | ) |
| | | | |
|
| |
|
| |
|
|
Net current liabilities | | | | (3,454 | ) | | (3,295 | ) | | (424 | ) |
| | | | |
|
| |
|
| |
|
|
Total assets less current liabilities | | | | 66,927 | | | 71,121 | | | 9,151 | |
| | | | |
|
| |
|
| |
|
|
REPRESENTED BY | | | | | | | | | | | |
Share capital | | 25 | | 12,041 | | | 12,041 | | | 1,549 | |
Share premium | | | | 1,164 | | | 1,164 | | | 150 | |
Reserves | | | | 25,230 | | | 28,875 | | | 3,715 | |
Proposed dividends | | | | 1,806 | | | 2,119 | | | 273 | |
| | | | |
|
| |
|
| |
|
|
Shareholders’ funds | | | | 40,241 | | | 44,199 | | | 5,687 | |
Minority interest | | | | 393 | | | – | | | – | |
Long-term loans and other borrowings | | 26 | | 17,602 | | | 17,596 | | | 2,264 | |
Deferred tax liabilities | | 27 | | 4,614 | | | 5,084 | | | 654 | |
SoC reserve accounts | | 11 | | 3,607 | | | 3,720 | | | 479 | |
Other non-current liabilities | | | | 470 | | | 522 | | | 67 | |
| | | | |
|
| |
|
| |
|
|
| | | | | 66,927 | | | 71,121 | | | 9,151 | |
| | | | |
|
| |
|
| |
|
|
The accompanying notes are an integral part of the financial statements.
F-4
CLP HOLDINGS LIMITED
CONSOLIDATED STATEMENTS OF CHANGES IN EQUITY
| | | | | | | | | | | | | | | | | |
| | | Share
Capital
HK$M | | | Share
Premium
HK$M | | | Capital
Redemption
Reserve
HK$M | | Other
Reserves
HK$M | | | Retained
Profits
HK$M | | | Total
HK$M | |
| | | | | | |
Balance as at January 1, 2002, as previously reported | | 12,107 | | | 11,281 | | | 2,416 | | (287 | ) | | 9,651 | | | 35,168 | |
Income taxes adjustments (Note 1(O)) | | – | | | – | | | – | | 1 | | | 63 | | | 64 | |
| | |
|
| |
|
| |
| |
|
| |
|
| |
|
|
Balance as at January 1, 2002, restated | | 12,107 | | | 11,281 | | | 2,416 | | (286 | ) | | 9,714 | | | 35,232 | |
Exchange differences arising on translation of: | | | | | | | | | | | | | | | | | |
jointly controlled entities | | – | | | – | | | – | | 243 | | | – | | | 243 | |
associated company | | – | | | – | | | – | | 29 | | | – | | | 29 | |
designated hedges | | – | | | – | | | – | | (49 | )(a) | | – | | | (49 | ) |
| | |
|
| |
|
| |
| |
|
| |
|
| |
|
|
Net gains not recognized in the profit and loss account | | – | | | – | | | – | | 223 | | | – | | | 223 | |
| | | | | | |
Repurchase of ordinary shares | | (66 | ) | | – | | | 66 | | – | | | (397 | ) | | (397 | ) |
Transfer of share premium to retained profits | | – | | | (10,117 | ) | | – | | – | | | 10,117 | | | – | |
Earnings for the year, restated | | – | | | – | | | – | | – | | | 7,104 | | | 7,104 | |
Dividends | | | | | | | | | | | | | | | | | |
2001 finals | | – | | | – | | | – | | – | | | (2,528 | ) | | (2,528 | ) |
2002 interims | | – | | | – | | | – | | – | | | (2,746 | ) | | (2,746 | ) |
| | |
|
| |
|
| |
| |
|
| |
|
| |
|
|
Balance as at December 31, 2002, restated | | 12,041 | | | 1,164 | | | 2,482 | | (63 | ) | | 21,264 | (b) | | 36,888 | |
| | |
|
| |
|
| |
| |
|
| |
|
| |
|
|
| | | | | | |
Company and subsidiary companies | | 12,041 | | | 1,164 | | | 2,482 | | (68 | ) | | 17,246 | | | 32,865 | |
Jointly controlled entities | | – | | | – | | | – | | 1 | | | 3,777 | | | 3,778 | |
Associated companies | | – | | | – | | | – | | 4 | | | 241 | | | 245 | |
| | |
|
| |
|
| |
| |
|
| |
|
| |
|
|
Balance as at December 31, 2002, restated | | 12,041 | | | 1,164 | | | 2,482 | | (63 | ) | | 21,264 | | | 36,888 | |
| | |
|
| |
|
| |
| |
|
| |
|
| |
|
|
| | | | | | |
Balance as at January 1, 2003, as previously reported | | 12,041 | | | 1,164 | | | 2,482 | | (76 | ) | | 21,176 | | | 36,787 | |
Income taxes adjustments (Note 1(O)) | | – | | | – | | | – | | 13 | | | 88 | | | 101 | |
| | |
|
| |
|
| |
| |
|
| |
|
| |
|
|
Balance as at January 1, 2003, restated | | 12,041 | | | 1,164 | | | 2,482 | | (63 | ) | | 21,264 | | | 36,888 | |
Exchange differences arising on translation of: | | | | | | | | | | | | | | | | | |
subsidiary companies | | – | | | – | | | – | | 1,075 | | | – | | | 1,075 | |
jointly controlled entities | | – | | | – | | | – | | (97 | ) | | – | | | (97 | ) |
associated company | | – | | | – | | | – | | 111 | | | – | | | 111 | |
designated hedges | | – | | | – | | | – | | (720 | )(a) | | – | | | (720 | ) |
| | |
|
| |
|
| |
| |
|
| |
|
| |
|
|
| | | | | | |
Net gains not recognized in the profit and loss account | | – | | | – | | | – | | 369 | | | – | | | 369 | |
Earnings for the year | | – | | | – | | | – | | – | | | 7,687 | | | 7,687 | |
Dividends | | | | | | | | | | | | | | | | | |
2002 finals | | – | | | – | | | – | | – | | | (1,782 | ) | | (1,782 | ) |
2003 interims | | – | | | – | | | – | | – | | | (2,962 | ) | | (2,962 | ) |
Share of other reserves of | | | | | | | | | | | | | | | | | |
jointly controlled entity | | – | | | – | | | – | | 40 | | | (40 | ) | | – | |
associated company | | – | | | – | | | – | | 41 | | | – | | | 41 | |
| | |
|
| |
|
| |
| |
|
| |
|
| |
|
|
Balance as at December 31, 2003 | | 12,041 | | | 1,164 | | | 2,482 | | 387 | | | 24,167 | (c) | | 40,241 | |
| | |
|
| |
|
| |
| |
|
| |
|
| |
|
|
| | | | | | |
Company and subsidiary companies | | 12,041 | | | 1,164 | | | 2,482 | | 301 | | | 20,182 | | | 36,170 | |
Jointly controlled entities | | – | | | – | | | – | | 41 | | | 3,595 | | | 3,636 | |
Associated companies | | – | | | – | | | – | | 45 | | | 390 | | | 435 | |
| | |
|
| |
|
| |
| |
|
| |
|
| |
|
|
Balance as at December 31, 2003 | | 12,041 | | | 1,164 | | | 2,482 | | 387 | | | 24,167 | | | 40,241 | |
| | |
|
| |
|
| |
| |
|
| |
|
| |
|
|
The accompanying notes are an integral part of the financial statements.
F-5
CLP HOLDINGS LIMITED
CONSOLIDATED STATEMENTS OF CHANGES IN EQUITY
| | | | | | | | | | | | | | | | | | |
| | | Share Capital
HK$M | | Share
Premium
HK$M | | Capital
Redemption
Reserve
HK$M | | Other
Reserves
HK$M | | | Retained
Profits
HK$M | | | Total HK$M | | | Total US$M | |
| | | | | | | |
Balance as at January 1, 2004 | | 12,041 | | 1,164 | | 2,482 | | 387 | | | 24,167 | | | 40,241 | | | 5,178 | |
Exchange differences arising on translation of: | | | | | | | | | | | | | | | | | | |
subsidiary companies | | – | | – | | – | | 365 | | | – | | | 365 | | | 47 | |
jointly controlled entities | | – | | – | | – | | 110 | | | – | | | 110 | | | 14 | |
associated company | | – | | – | | – | | 32 | | | – | | | 32 | | | 4 | |
designated hedges | | – | | – | | – | | (76 | )(a) | | – | | | (76 | ) | | (10 | ) |
| | |
| |
| |
| |
|
| |
|
| |
|
| |
|
|
Net gains not recognized in the profit and loss account | | – | | – | | – | | 431 | | | – | | | 431 | | | 55 | |
| | | | | | | |
Earnings for the year | | – | | – | | – | | – | | | 8,614 | | | 8,614 | | | 1,108 | |
Dividends | | | | | | | | | | | | | | | | | | |
2003 finals | | – | | – | | – | | – | | | (1,806 | ) | | (1,806 | ) | | (232 | ) |
2004 interims | | – | | – | | – | | – | | | (3,251 | ) | | (3,251 | ) | | (418 | ) |
Share of other reserves of | | | | | | | | | | | | | | | | | | |
jointly controlled entities | | – | | – | | – | | 44 | | | (42 | ) | | 2 | | | – | |
associated company | | – | | – | | – | | (32 | ) | | – | | | (32 | ) | | (4 | ) |
| | |
| |
| |
| |
|
| |
|
| |
|
| |
|
|
Balance as at December 31, 2004 | | 12,041 | | 1,164 | | 2,482 | | 830 | | | 27,682 | (d) | | 44,199 | | | 5,687 | |
| | |
| |
| |
| |
|
| |
|
| |
|
| |
|
|
| | | | | | | |
Company and subsidiary companies | | 12,041 | | 1,164 | | 2,482 | | 732 | | | 23,823 | | | 40,242 | | | 5,178 | |
Jointly controlled entities | | – | | – | | – | | 85 | | | 3,298 | | | 3,383 | | | 435 | |
Associated company | | – | | – | | – | | 13 | | | 561 | | | 574 | | | 74 | |
| | |
| |
| |
| |
|
| |
|
| |
|
| |
|
|
Balance as at December 31, 2004 | | 12,041 | | 1,164 | | 2,482 | | 830 | | | 27,682 | | | 44,199 | | | 5,687 | |
| | |
| |
| |
| |
|
| |
|
| |
|
| |
|
|
Notes:
| (a) | Including a net loss of HK$63 million (2003: HK$603 million, 2002: HK$49 million) arising from designated hedges using foreign currency borrowings and a net loss of HK$13 million (2003: HK$117 million, 2002: nil) using forward contracts. |
| (b) | The proposed final dividends as at December 31, 2002 and balance of retained profits after proposed final dividends were HK$1,782 million and HK$19,482 million respectively. |
| (c) | The proposed final dividends as at December 31, 2003 and balance of retained profits after proposed final dividends were HK$1,806 million and HK$22,361 million respectively. |
| (d) | The proposed final dividends as at December 31, 2004 and balance of retained profits after proposed final dividends were HK$2,119 million and HK$25,563 million respectively. |
The accompanying notes are an integral part of the financial statements.
F-6
CLP HOLDINGS LIMITED
CONSOLIDATED CASH FLOW STATEMENTS
| | | | | | | | | | | | | | |
| | | | | Year ended December 31,
| |
| | | Note | | 2002
HK$M | | | 2003
HK$M | | | 2004
HK$M | | | 2004
US$M | |
| | | | | |
OPERATING ACTIVITIES | | | | | | | | | | | | | | |
Net cash inflow from operations | | 28 | | 7,849 | | | 7,858 | | | 11,502 | | | 1,480 | |
Operating interest paid | | | | (164 | ) | | (579 | ) | | (807 | ) | | (104 | ) |
Interest received | | | | 15 | | | 17 | | | 62 | | | 8 | |
Profits tax paid | | | | (747 | ) | | (860 | ) | | (562 | ) | | (72 | ) |
| | | | |
|
| |
|
| |
|
| |
|
|
NET CASH INFLOW FROM OPERATING ACTIVITIES | | | | 6,953 | | | 6,436 | | | 10,195 | | | 1,312 | |
| | | | |
|
| |
|
| |
|
| |
|
|
| | | | | |
INVESTING ACTIVITIES | | | | | | | | | | | | | | |
Capital expenditure | | | | (4,734 | ) | | (5,451 | ) | | (5,292 | ) | | (681 | ) |
Capitalized interest paid | | | | (178 | ) | | (241 | ) | | (266 | ) | | (34 | ) |
Proceeds from disposal of fixed assets | | | | 85 | | | 402 | | | 251 | | | 32 | |
Proceeds from disposal of other investments | | | | – | | | 659 | | | 55 | | | 7 | |
Acquisition of remaining interest in a subsidiary | | | | – | | | – | | | (376 | ) | | (48 | ) |
Net cash outflow for acquisition of subsidiaries | | | | – | | | (354 | ) | | – | | | – | |
Net cash outflow on settlement of forward contracts for investment hedging | | | | – | | | (326 | ) | | (183 | ) | | (23 | ) |
Investments in and advances to jointly controlled entities | | | | (3,364 | ) | | (983 | ) | | (565 | ) | | (73 | ) |
Investment in an associated company | | | | (100 | ) | | – | | | – | | | – | |
Purchase of investment securities | | | | (187 | ) | | (438 | ) | | – | | | – | |
Proceeds from realization of employee retirement benefit plan assets | | | | – | | | 1,155 | | | – | | | – | |
Dividends received from investments | | | | | | | | | | | | | | |
- jointly controlled entities | | | | 2,318 | | | 2,970 | | | 2,612 | | | 336 | |
- associated company | | | | 53 | | | 50 | | | 60 | | | 8 | |
- other investments | | | | 17 | | | 34 | | | – | | | – | |
Profit received from Hok Un joint venture | | | | 1,581 | | | 612 | | | 454 | | | 58 | |
| | | | |
|
| |
|
| |
|
| |
|
|
NET CASH OUTFLOW FROM INVESTING ACTIVITIES | | | | (4,509 | ) | | (1,911 | ) | | (3,250 | ) | | (418 | ) |
| | | | |
|
| |
|
| |
|
| |
|
|
| | | | | |
NET CASH INFLOW BEFORE FINANCING ACTIVITIES | | | | 2,444 | | | 4,525 | | | 6,945 | | | 894 | |
| | | | |
|
| |
|
| |
|
| |
|
|
| | | | | |
FINANCING ACTIVITIES | | | | | | | | | | | | | | |
Proceeds from long-term borrowings | | | | 4,595 | | | 2,019 | | | 2,700 | | | 347 | |
Repayment of long-term borrowings | | | | (156 | ) | | (1,562 | ) | | (2,798 | ) | | (360 | ) |
Decrease in short-term borrowings | | | | (776 | ) | | – | | | (145 | ) | | (19 | ) |
Repurchase of ordinary shares | | | | (397 | ) | | – | | | – | | | – | |
Dividends paid | | | | (5,274 | ) | | (4,744 | ) | | (5,057 | ) | | (650 | ) |
| | | | |
|
| |
|
| |
|
| |
|
|
NET CASH OUTFLOW FROM FINANCING ACTIVITIES | | | | (2,008 | ) | | (4,287 | ) | | (5,300 | ) | | (682 | ) |
| | | | |
|
| |
|
| |
|
| |
|
|
Increase in cash and cash equivalents | | | | 436 | | | 238 | | | 1,645 | | | 212 | |
Cash and cash equivalents at beginning of year | | | | 80 | | | 516 | | | 787 | | | 101 | |
Effect of exchange rate changes | | | | – | | | 33 | | | 88 | | | 11 | |
| | | | |
|
| |
|
| |
|
| |
|
|
CASH AND CASH EQUIVALENTS AT END OF YEAR | | | | 516 | | | 787 | | | 2,520 | | | 324 | |
| | | | |
|
| |
|
| |
|
| |
|
|
| | | | | |
Analysis of balances of cash and cash equivalents | | | | | | | | | | | | | | |
Short-term investments | | | | – | | | 44 | | | 21 | | | 3 | |
Deposits with banks | | | | 471 | | | 617 | | | 2,382 | | | 306 | |
Cash at banks and on hand | | | | 45 | | | 126 | | | 117 | | | 15 | |
| | | | |
|
| |
|
| |
|
| |
|
|
| | | | | 516 | | | 787 | | | 2,520 | | | 324 | |
| | | | |
|
| |
|
| |
|
| |
|
|
The accompanying notes are an integral part of the financial statements.
F-7
CLP HOLDINGS LIMITED
NOTES TO THE CONSOLIDATED FINANCIAL STATEMENTS
| 1. | SIGNIFICANT ACCOUNTING POLICIES |
The Company, CLP Holdings Limited, and its subsidiaries are collectively referred to as the Group in the consolidated financial statements.
The accounts have been prepared in accordance with accounting principles generally accepted in Hong Kong (“Hong Kong GAAP”) and comply with accounting standards issued by the Hong Kong Institute of Certified Public Accountants (“HKICPA”). They have been prepared under the historical cost convention except that certain investments in securities are stated at fair value.
The financial operations of the Company’s major subsidiary company, CLP Power Hong Kong Limited (CLP Power Hong Kong), and its jointly controlled entity, Castle Peak Power Company Limited (CAPCO), are governed by a Scheme of Control (SoC) Agreement entered into with the Hong Kong Government. Whilst the current SoC Agreement will expire on September 30, 2008, the accounts have been prepared on the basis that there will be no change to the current regulatory framework in the foreseeable future that would have a material effect on the accounts. The main features of the SoC are summarized on page F-62.
The consolidated accounts of the Group incorporate the accounts of the Company and its subsidiary companies made up to the balance sheet date and include the Group’s interests in jointly controlled entities and associated companies on the basis set out in Notes 1(E) and 1(F) below, respectively.
The results of subsidiary companies acquired during the year are included in the consolidated profit and loss account from the effective date of acquisition.
All significant inter-company transactions and balances within the Group are eliminated on consolidation.
Minority interests represent the interests of outside shareholders in the operating results and net assets of subsidiary companies.
A subsidiary company is a company which is controlled by the Company and in which the Company has an interest, directly or indirectly, in more than 50% of the issued equity as defined in the Hong Kong Companies Ordinance. Control represents the power to govern the financial and operating policies of that company.
Investments in subsidiary companies are carried on the balance sheet of the Company at cost of equity capital together with advances from and loans to the Company, less provisions for impairment. Provision for investment in a subsidiary company is made when the recoverable amount of the subsidiary company is lower than the Company’s respective cost of investment. The results of subsidiary companies are accounted for by the Company on the basis of dividends received and receivable.
F-8
CLP HOLDINGS LIMITED
NOTES TO THE CONSOLIDATED FINANCIAL STATEMENTS
| 1. | SIGNIFICANT ACCOUNTING POLICIES(continued) |
| | E. | Jointly Controlled Entities |
A jointly controlled entity is a joint venture in which the Group and other parties undertake an economic activity which is subject to joint control and none of the participating parties has unilateral control over the economic activity.
The consolidated profit and loss account includes the Group’s share of the results of the jointly controlled entities for the year, and the consolidated balance sheet includes the Group’s share of the net assets of the jointly controlled entities and goodwill/negative goodwill (net of accumulated amortization) on acquisition.
An associated company is a company, not being a subsidiary company or jointly controlled entity, in which the Group holds equity share capital for the long term and can exercise significant influence in its management.
The consolidated profit and loss account includes the Group’s share of the results of the associated companies for the year, and the consolidated balance sheet includes the Group’s share of the net assets of the associated companies and goodwill/negative goodwill (net of accumulated amortization) on acquisition.
| | G. | Goodwill/Negative Goodwill |
Goodwill arising on consolidation represents the excess of the cost of an acquisition over the fair value of the Group’s share of the net assets of the acquired subsidiary company, jointly controlled entity or associated company at the date of acquisition, and negative goodwill represents the excess of the fair value of the Group’s share of the net assets acquired over the cost of acquisition.
Goodwill is amortized on a straight-line basis over its estimated useful life. Negative goodwill, not exceeding the fair values of the non-monetary assets acquired, is recognized in the profit and loss account over the remaining useful life of those assets.
Turnover represents sales of electricity, other electricity-related revenue, property income, and supply and maintenance service fees. Sales of electricity are based on either actual and accrued consumption derived from meter readings or the amount billed in accordance with the terms of the contractual agreements where applicable during the year. Other revenue is recognized when services are rendered or sales are completed.
| | I. | Fixed Assets and Depreciation |
Fixed assets are stated at cost less accumulated depreciation and accumulated impairment losses. Major renewals and improvements which will result in future economic benefits, in excess of the originally assessed standard of performance of the existing assets, are capitalized, while maintenance and repair costs are charged to the profit and loss account in the year in which they are incurred.
F-9
CLP HOLDINGS LIMITED
NOTES TO THE CONSOLIDATED FINANCIAL STATEMENTS
| 1. | SIGNIFICANT ACCOUNTING POLICIES(continued) |
| | I. | Fixed Assets and Depreciation (continued) |
Fixed assets employed for the electricity business in Hong Kong, also referred to as SoC fixed assets, represent a substantial portion of the assets of the Group. Depreciation of these assets is based on the rates authorized under the SoC which reflect the pattern in which the assets’ economic benefits are consumed. During the 2003 SoC interim review, the economic lives of certain fixed assets were reviewed and agreement was reached with the Hong Kong Government to depreciate land on lease terms over the unexpired terms of the leases and to extend the depreciation period of the following assets with effect from January 1, 2004:
| | | | |
| | | Original Period
| | Revised Period
|
Buildings | | 33 years | | 35 years |
Cable tunnels | | 33 years | | 100 years |
Switchgear and transformers | | 25 years | | 35 years |
Meters | | 10 years | | 15 years |
In respect of the above assets that were commissioned before January 1, 2004, their net book value as at December 31, 2003 is being written off uniformly over the remainder of their useful lives. The net decrease in depreciation charge for the year as a result of the above changes was HK$234 million. Assets commissioning after January 1, 2004 are depreciated on a straight-line basis over their revised lives.
Other SoC fixed assets are depreciated on a straight-line basis over the useful lives as set out below commencing from the date of commissioning:
| | |
Overhead lines (132 kV and above) | | 35 years |
Overhead lines (below 132 kV) and cables | | 30 years |
Generating plant | | 25 years |
System control equipment, furniture, tools, communication and office equipment | | 10 years |
Computers and office automation equipment other than those forming part of the generating plant | | 5 years |
Motor vehicles | | 5 years |
Fixed assets used for the non-SoC business, which are primarily for the electricity business located outside Hong Kong, are also depreciated on a straight-line basis. Their estimated useful lives are similar to those of the SoC fixed assets and are set out as follows:
| | |
Buildings | | 30 – 33 years |
Generating plant, switchgear and transformers | | 17 – 31 years |
Mining machines and equipment | | 10 – 30 years |
Furniture, fittings and other equipment | | 5 – 10 years |
Computers and office equipment | | 3 – 7 years |
Motor vehicles | | 3 – 8 years |
Leasehold land | | unexpired terms of the leases |
For equipment awaiting installation and plant under construction, no depreciation is provided until the construction is completed and the assets are ready for their intended use.
The gain or loss on disposal of a fixed asset is the difference between the net sales proceeds and the carrying amount of the relevant asset, and is recognized in the profit and loss account.
F-10
CLP HOLDINGS LIMITED
NOTES TO THE CONSOLIDATED FINANCIAL STATEMENTS
| 1. | SIGNIFICANT ACCOUNTING POLICIES (continued) |
The Group reviews the carrying amount of long-lived assets for impairment whenever events or changes in circumstances indicate that the carrying amount of the assets may not be recoverable. If such assets are considered to be impaired, the impairment loss to be recognized is measured by the amount by which the carrying amount of the assets exceeds the recoverable amount.
An impairment loss is reversed when there is a favourable change in the estimates used to determine the recoverable amount of an asset. A reversal of the impairment loss is limited to the asset’s carrying amount that would have been determined had no impairment loss been recognized in prior years.
Inventories comprise stores and fuel and are valued at the lower of cost and net realizable value. Cost is calculated on the weighted average basis for stores and the first-in, first-out or weighted average basis as appropriate for fuel. Net realizable value is determined on the basis of anticipated sales proceeds less estimated selling expenses.
| | L. | Cash and cash equivalents |
Cash and cash equivalents are carried at cost. For the purposes of the cash flow statement, cash and cash equivalents comprise cash at banks and on hand, demand deposits with banks and other financial institutions, short-term, highly liquid investments that are readily convertible to cash and with a maturity of three months or less from date of investment, and bank overdrafts.
Monetary assets and liabilities denominated in foreign currencies are translated into Hong Kong dollars at the rates of exchange prevailing at the balance sheet date or at the relevant forward contract rates where applicable. Exchange differences are included in the profit and loss account. Transactions during the year are converted into Hong Kong dollars at the rates of exchange ruling at the dates of transactions.
The accounts of subsidiary companies, jointly controlled entities or associated companies denominated in foreign currencies are translated into Hong Kong dollars using the year end rates of exchange for balance sheet items and the average rates of exchange for the year for the profit and loss items. Such exchange differences are dealt with as a movement in reserves.
The Group operates and/or participates in a number of defined contribution plans in Hong Kong. The assets of these schemes are held in separate trustee-administered funds. The pension plans are funded by payments from employees and by the participating companies of the Group, and provide benefits linked to contributions and investment returns on the plans.
Contributions to the defined contribution plans, including contributions to Mandatory Provident Funds, are recognized as an expense in the profit and loss account in the year to which the contributions relate, except to the extent that they are capitalized as part of the cost of qualifying assets.
| | (ii) | Incentive bonus and employee leave entitlement |
Provisions are made for the estimated liability for incentive bonus and annual leave as a result of services rendered by employees up to the balance sheet date.
F-11
CLP HOLDINGS LIMITED
NOTES TO THE CONSOLIDATED FINANCIAL STATEMENTS
| 1. | SIGNIFICANT ACCOUNTING POLICIES (continued) |
Deferred taxation is provided in full, using the liability method, on temporary differences arising between the tax bases of assets and liabilities and their carrying amounts in the accounts. Taxation rates enacted or substantively enacted by the balance sheet date are used to determine deferred taxation.
Deferred taxation is also provided on temporary differences arising on investments in subsidiary companies, jointly controlled entities and associated companies, except where the timing of the reversal of the temporary difference can be controlled and it is probable that the temporary difference will not reverse in the foreseeable future.
Deferred tax assets are recognized to the extent that it is probable that future taxable profit will be available against which the temporary differences can be utilized.
Effective January 1, 2003, the Group adopted Statement of Standard Accounting Practice (SSAP) No. 12 (Revised) “Income Taxes”, which has been applied retrospectively so that the comparative figures in 2002 have been restated to conform to the changed policy. The principal temporary differences recognized upon adoption by the Group arise from the restatement of assets to fair value on acquisition, withholding taxation on retained profits of overseas investments and tax losses carried forward.
As disclosed in the consolidated statement of changes in equity, as at January 1, 2002 and 2003, the retained profits have been increased by HK$63 million and HK$88 million respectively and the other reserves increased by HK$1 million and HK$13 million respectively. The impact of SSAP No. 12 (Revised) on the profit and loss account for the year ended December 31, 2002 has been an increase in reported net profit of HK$25 million. In addition, the 2002 earnings per share including Hok Un redevelopment profit/property disposal gain has been increased from HK$2.94 to HK$2.95 per share (an increase from HK$2.71 to HK$2.72 per share if excluding Hok Un redevelopment profit/property disposal gain).
Borrowing costs include interest and other costs incurred in connection with the borrowing of funds. Borrowing costs are charged to the profit and loss account in the year in which they are incurred, except to the extent that they are capitalized when they are directly attributable to the acquisition, construction or production of an asset which necessarily takes a substantial period of time to complete.
Related parties are individuals and companies, where the individual or company has the ability, directly or indirectly, to control the other party or exercise significant influence over the other party in making financial and operating decisions. Parties are also considered to be related if they are subject to common control or common significant influence.
Where necessary, comparative figures have been restated to conform with changes in presentation in the current financial year.
F-12
CLP HOLDINGS LIMITED
NOTES TO THE CONSOLIDATED FINANCIAL STATEMENTS
| 1. | SIGNIFICANT ACCOUNTING POLICIES (continued) |
| | S. | Recently Issued Accounting Standards |
During 2004, the HKICPA has issued a number of new and revised Hong Kong Financial Reporting Standards and Hong Kong Accounting Standards (new HKFRSs) which are effective for accounting periods beginning on or after January 1, 2005 except for HKFRS-Interpretation 4 (“HKFRS-Int 4”) which is effective for accounting periods beginning on or after January 1, 2006. The Group has not early adopted these new HKFRSs in the financial statements for the year ended December 31, 2004.
The adoption of these new HKFRS for the accounting periods beginning on or after January 1, 2005, is in general considered to have the effect of reducing the differences between Hong Kong GAAP and accounting principles generally accepted in the United States of America (“U.S. GAAP”). Below are the new HKFRSs which have substantially changed from the previous SSAP or have been newly issued, which may have more significant impact to the Group.
HKAS 17
Hong Kong Accounting Standard (“HKAS”) 17 “Leases” prescribes the appropriate accounting policies and disclosure for lessees and lessors to apply in relation to leases. The adoption of HKAS 17 will result in a change in accounting policy relating to leasehold land. Under HKAS 17, a lease of land and building should be split into a lease of land and a lease of a building in proportion to the relative fair values of the leasehold interests in the land element and the building element of the lease at the inception of the lease. When the land has an indefinite economic life, the land element is normally classified as an operating lease unless title is expected to pass to the lessee by the end of the lease term. The building element is classified as a finance or operating lease in accordance with HKAS 17. An entity that has previously applied SSAP 14 (revised 2000) “Leases” shall apply the amendments made by HKAS 17 retrospectively for all leases or, if SSAP 14 (revised 2000) was not applied retrospectively, for all leases entered into since it first applied that Standard. We are still in the process of assessing the impact of HKAS 17 on our financial position and results of operations.
HKAS 32 and HKAS 39
HKAS 32 “Financial Instruments: Disclosure and Presentation” contains requirements for the presentation of financial instruments and identifies the information that should be disclosed about them. HKAS 32 requires disclosure of information about factors that affect the amount, timing and certainty of an entity’s future cash flows relating to financial instruments and the accounting policies applied to those instruments. It also requires the disclosure of the nature and extent of an entity’s use of financial instruments, the business purposes they serve, the risks associated with them, and management’s policies for controlling those risks. HKAS 39 “Financial Instruments: Recognition and Measurement” establishes the principles for recognizing and measuring financial assets, financial liabilities and some contracts to buy or sell non-financial items and the hedging requirements for financial instruments. The Group will adopt HKAS 39 on January 1, 2005 and recognizing the fair value of derivative contracts as assets or liabilities on the balance sheet. We are still in the process of accessing the impact of HKAS 39 on our financial position and results of operations.
F-13
CLP HOLDINGS LIMITED
NOTES TO THE CONSOLIDATED FINANCIAL STATEMENTS
| 1. | SIGNIFICANT ACCOUNTING POLICIES (continued) |
| | S. | Recently Issued Accounting Standards (continued) |
HKFRS 3
HKFRS 3 “Business Combinations” specifies that all business combinations should be accounted for by applying the purchase method. Therefore, the acquirer recognizes the acquiree’s identifiable assets, liabilities and contingent liabilities at fair values at the acquisition date. HKFRS 3 prohibits the amortization of goodwill acquired in a business combination and instead requires the goodwill to be tested for impairment annually, or when there are indications of impairment. If, at the acquisition date, the acquirer’s interest in the net fair value of the acquiree’s identifiable assets, liabilities and contingent liabilities exceeds the cost of the combination, the excess referred to as negative goodwill must be recognized by the acquirer immediately in profit and loss. The adoption of HKFRS 3 will result in the Group’s cessation of goodwill amortization beginning January 1, 2005 and the derecognition of negative goodwill of HK$1,046 million (US$135 million) to retained profits on January 1, 2005.
HKFRS-Int 4
HKFRS-Int 4 “Determining whether an Arrangement contains a Lease” was issued in February 2005 to provide guidance for determining whether a transaction or a series of related transactions, that does not take the legal form of a lease but conveys a right to use an asset in return for a payment or series of payments are, or contain, leases that should be accounted for in accordance with HKAS 17. The interpretation addressed the issues of how to determine whether an arrangement is, or contains a lease as defined in HKAS 17, when the assessment or a reassessment should be made; and how the payments for the lease should be separated from payments for any other elements in the arrangement. The interpretation is effective for accounting periods beginning on or after January 1, 2006 and will be applied retrospectively. We are still in the process of assessing the impact of HKFRS-Int 4 on our financial position and results of operations.
The Group is in the process of making an assessment of the impact of these new HKFRSs and has so far concluded that the adoption of the new HKFRSs would not have a significant impact on its results of operations and financial position. The Group will be continuing with the assessment of the impact of the new HKFRSs and other significant changes may be identified as a result.
| | T. | Translation of 2004 Consolidated Financial Statements to United States Dollars (U.S. Dollars) |
The Group publishes its consolidated financial statements in Hong Kong Dollars. Solely for the convenience of the reader, the 2004 consolidated financial statements have been translated into U.S. Dollars at the specified rate below. These translations should not be construed as representations that the Hong Kong Dollar amounts actually represent such U.S. Dollar amounts or could be converted into U.S. Dollars at the rate indicated. The translation of Hong Kong Dollars into U.S. Dollars has been made at the rate of HK$7.7723 to US$1.00, which was the noon buying rate in New York City for cable transfers in Hong Kong Dollars as certified for customs purposes by the Federal Reserve Bank of New York on December 31, 2004.
F-14
CLP HOLDINGS LIMITED
NOTES TO THE CONSOLIDATED FINANCIAL STATEMENTS
| 2. | TURNOVER AND SEGMENT INFORMATION |
The Group operates, through its subsidiary companies, jointly controlled entities and associated companies, in three major geographical regions - Hong Kong, the Chinese mainland and the Asia-Pacific region. Information about the Group’s operations by geographical regions is as follows:
| | | | | | | | | | | | | | | |
| 2004 | | Hong Kong
HK$M | | | Chinese
Mainland HK$M | | | Asia-
Pacific Region HK$M | | | Unallocated
Items HK$M | | | Total
HK$M | |
| | | | | |
Turnover | | 26,966 | | | – | | | 3,814 | | | 4 | | | 30,784 | |
| �� | |
|
| |
|
| |
|
| |
|
| |
|
|
Segment results | | 7,198 | | | (181 | ) | | 1,244 | | | (157 | ) | | 8,104 | |
Hok Un redevelopment profit | | 187 | | | – | | | – | | | – | | | 187 | |
Share of profits less losses of jointly controlled entities | | 1,774 | | | 1,194 | (a) | | 213 | | | – | | | 3,181 | |
Share of profits less losses of associated companies | | (2 | ) | | – | | | 238 | | | – | | | 236 | |
| | |
|
| |
|
| |
|
| |
|
| |
|
|
Profit/(Loss) before financing and taxation | | 9,157 | | | 1,013 | | | 1,695 | | | (157 | ) | | 11,708 | |
Finance costs | | | | | | | | | | | | | | (1,046 | ) |
Finance income | | | | | | | | | | | | | | 63 | |
Taxation | | | | | | | | | | | | | | (1,815 | ) |
| | | | | | | | | | | | | | |
|
|
Profit after taxation | | | | | | | | | | | | | | 8,910 | |
Transfers under SoC | | | | | | | | | | | | | | (296 | ) |
| | | | | | | | | | | | | | |
|
|
Earnings for the year | | | | | | | | | | | | | | 8,614 | |
| | | | | | | | | | | | | | |
|
|
| | | | | |
Capital expenditure | | 5,282 | | | 7 | | | 528 | | | 6 | | | 5,823 | |
Depreciation | | 1,875 | | | 2 | | | 650 | | | 2 | | | 2,529 | |
Amortization of goodwill/negative goodwill and cost of investment | | 2 | | | 58 | | | (19 | ) | | – | | | 41 | |
Impairment charges | | 11 | | | 15 | | | – | | | – | | | 26 | |
| | | | | |
As at December 31, 2004 | | | | | | | | | | | | | | | |
Segment assets | | 44,374 | | | 215 | | | 18,324 | | | 205 | | | 63,118 | |
Investments in jointly controlled entities | | 6,894 | | | 6,643 | | | 1,461 | | | – | | | 14,998 | |
Investment in an associated company | | – | | | – | | | 1,640 | | | – | | | 1,640 | |
Tax assets | | – | | | – | | | 1,043 | | | – | | | 1,043 | |
| | |
|
| |
|
| |
|
| |
|
| |
|
|
Consolidated total assets | | 51,268 | | | 6,858 | | | 22,468 | | | 205 | | | 80,799 | |
| | |
|
| |
|
| |
|
| |
|
| |
|
|
| | | | | |
Segment liabilities | | 10,731 | | | 60 | | | 1,482 | | | 66 | | | 12,339 | |
Total borrowings | | – | | | – | | | 7,503 | | | 11,271 | | | 18,774 | |
Tax liabilities | | 5,067 | | | – | | | 420 | | | – | | | 5,487 | |
| | |
|
| |
|
| |
|
| |
|
| |
|
|
Consolidated total liabilities | | 15,798 | | | 60 | | | 9,405 | | | 11,337 | | | 36,600 | |
| | |
|
| |
|
| |
|
| |
|
| |
|
|
| | |
| Note (a): | | Out of the HK$1,194 million, HK$808 million was attributed to investments in Guangdong Nuclear Power Joint Venture Company, Limited (GNPJVC) and Hong Kong Pumped Storage Development Company, Limited (PSDC), whose generating facilities serve Hong Kong. |
F-15
CLP HOLDINGS LIMITED
NOTES TO THE CONSOLIDATED FINANCIAL STATEMENTS
| 2. | TURNOVER AND SEGMENT INFORMATION (continued) |
| | | | | | | | | | | | | | | |
| 2003 | | Hong Kong
HK$M | | | Chinese Mainland HK$M | | | Asia- Pacific Region HK$M | | | Unallocated Items HK$M | | | Total HK$M | |
| | | | | |
Turnover | | 25,935 | | | – | | | 2,310 | | | 3 | | | 28,248 | |
| | |
|
| |
|
| |
|
| |
|
| |
|
|
| | | | | |
Segment results | | 6,275 | | | (145 | ) | | 853 | | | (371 | ) | | 6,612 | |
Hok Un redevelopment profit | | 291 | | | – | | | – | | | – | | | 291 | |
Share of profits less losses of jointly controlled entities | | 1,715 | | | 1,290 | (a) | | 394 | | | – | | | 3,399 | |
Share of profits less losses of associated companies | | (66 | ) | | – | | | 168 | | | – | | | 102 | |
| | |
|
| |
|
| |
|
| |
|
| |
|
|
Profit/(Loss) before financing and taxation | | 8,215 | | | 1,145 | | | 1,415 | | | (371 | ) | | 10,404 | |
Finance costs | | | | | | | | | | | | | | (688 | ) |
Finance income | | | | | | | | | | | | | | 48 | |
Taxation | | | | | | | | | | | | | | (1,712 | ) |
| | | | | | | | | | | | | | |
|
|
Profit after taxation | | | | | | | | | | | | | | 8,052 | |
Transfers under SoC | | | | | | | | | | | | | | (365 | ) |
| | | | | | | | | | | | | | |
|
|
Earnings for the year | | | | | | | | | | | | | | 7,687 | |
| | | | | | | | | | | | | | |
|
|
| | | | | |
Capital expenditure | | 5,127 | | | 2 | | | 464 | | | 1 | | | 5,594 | |
Depreciation | | 1,978 | | | 2 | | | 375 | | | 2 | | | 2,357 | |
Amortization of goodwill/negative goodwill and cost of investment | | 16 | | | 38 | | | (15 | ) | | – | | | 39 | |
Impairment charges | | 62 | | | – | | | – | | | – | | | 62 | |
| | | | | |
As at December 31, 2003 | | | | | | | | | | | | | | | |
Segment assets | | 41,025 | | | 16 | | | 17,351 | | | 208 | | | 58,600 | |
Investments in jointly controlled entities | | 6,845 | | | 6,400 | | | 1,442 | | | – | | | 14,687 | |
Investments in associated companies | | 84 | | | – | | | 1,509 | | | – | | | 1,593 | |
Tax assets | | – | | | – | | | 952 | | | – | | | 952 | |
| | |
|
| |
|
| |
|
| |
|
| |
|
|
Consolidated total assets | | 47,954 | | | 6,416 | | | 21,254 | | | 208 | | | 75,832 | |
| | |
|
| |
|
| |
|
| |
|
| |
|
|
| | | | | |
Segment liabilities | | 10,232 | | | 78 | | | 1,441 | | | 72 | | | 11,823 | |
Total borrowings | | – | | | – | | | 8,051 | | | 10,646 | | | 18,697 | |
Tax liabilities | | 4,334 | | | – | | | 344 | | | – | | | 4,678 | |
| | |
|
| |
|
| |
|
| |
|
| |
|
|
Consolidated total liabilities | | 14,566 | | | 78 | | | 9,836 | | | 10,718 | | | 35,198 | |
| | |
|
| |
|
| |
|
| |
|
| |
|
|
| | |
| Note (a): | | Out of the HK$1,290 million, HK$899 million was attributed to investments in GNPJVC and PSDC, whose generating facilities serve Hong Kong. |
F-16
CLP HOLDINGS LIMITED
NOTES TO THE CONSOLIDATED FINANCIAL STATEMENTS
| 2. | TURNOVER AND SEGMENT INFORMATION (continued) |
| | | | | | | | | | | | | | | |
| 2002 | | Hong Kong HK$M | | | Chinese Mainland HK$M | | | Asia- Pacific Region HK$M | | | Unallocated Items HK$M | | | Total HK$M | |
| | | | | |
Turnover | | 26,096 | | | – | | | 35 | | | 3 | | | 26,134 | |
| | |
|
| |
|
| |
|
| |
|
| |
|
|
| | | | | |
Segment results | | 7,250 | | | (118 | ) | | (96 | ) | | (200 | ) | | 6,836 | |
Hok Un redevelopment profit | | 282 | | | – | | | – | | | – | | | 282 | |
Share of profits less losses of jointly controlled entities | | 1,556 | | | 1,086 | (a) | | 350 | | | – | | | 2,992 | |
Share of profits less losses of associated companies | | (7 | ) | | – | | | 93 | | | – | | | 86 | |
| | |
|
| |
|
| |
|
| |
|
| |
|
|
Profit/(Loss) before financing and taxation | | 9,081 | | | 968 | | | 347 | | | (200 | ) | | 10,196 | |
Finance costs | | | | | | | | | | | | | | (189 | ) |
Finance income | | | | | | | | | | | | | | 33 | |
Taxation | | | | | | | | | | | | | | (1,293 | ) |
| | | | | | | | | | | | | | |
|
|
Profit after taxation | | | | | | | | | | | | | | 8,747 | |
Transfers under SoC | | | | | | | | | | | | | | (1,643 | ) |
| | | | | | | | | | | | | | |
|
|
Earnings for the year | | | | | | | | | | | | | | 7,104 | |
| | | | | | | | | | | | | | |
|
|
| | | | | |
Capital expenditure | | 4,941 | | | 1 | | | 186 | | | 6 | | | 5,134 | |
Depreciation | | 1,743 | | | 2 | | | 2 | | | 2 | | | 1,749 | |
Amortization of goodwill/negative goodwill and cost of investment | | 9 | | | 49 | | | 18 | | | – | | | 76 | |
Impairment charges | | 97 | | | – | | | – | | | – | | | 97 | |
| | | | | |
As at December 31, 2002 | | | | | | | | | | | | | | | |
Segment assets | | 38,816 | | | 97 | | | 1,012 | | | 560 | | | 40,485 | |
Investments in jointly controlled entities | | 6,232 | | | 6,291 | | | 6,459 | | | – | | | 18,982 | |
Investments in associated companies | | 150 | | | – | | | 1,276 | | | – | | | 1,426 | |
| | |
|
| |
|
| |
|
| |
|
| |
|
|
Consolidated total assets | | 45,198 | | | 6,388 | | | 8,747 | | | 560 | | | 60,893 | |
| | |
|
| |
|
| |
|
| |
|
| |
|
|
| | | | | |
Segment liabilities | | 10,773 | | | 48 | | | 29 | | | 52 | | | 10,902 | |
Total borrowings | | – | | | – | | | – | | | 9,297 | | | 9,297 | |
Tax liabilities | | 3,806 | | | – | | | – | | | – | | | 3,806 | |
| | |
|
| |
|
| |
|
| |
|
| |
|
|
Consolidated total liabilities | | 14,579 | | | 48 | | | 29 | | | 9,349 | | | 24,005 | |
| | |
|
| |
|
| |
|
| |
|
| |
|
|
| | |
| Note (a): | | Out of the HK$1,086 million, HK$837 million was attributed to investments in GNPJVC and PSDC, whose generating facilities serve Hong Kong. |
F-17
CLP HOLDINGS LIMITED
NOTES TO THE CONSOLIDATED FINANCIAL STATEMENTS
| 2. | TURNOVER AND SEGMENT INFORMATION (continued) |
An analysis of the Group’s turnover, contribution to operating profit and profit before financing and taxation for the year, by principal activities, is as follows:
| | | | | | | | | |
| Turnover comprises: | | 2002 HK$M | | | 2003 HK$M | | | 2004 HK$M | |
| | | |
SoC business | | 25,844 | | | 25,739 | | | 26,773 | |
Power projects outside Hong Kong | | 35 | | | 2,310 | | | 3,814 | |
Other businesses | | 252 | | | 196 | | | 193 | |
Unallocated items | | 3 | | | 3 | | | 4 | |
| | |
|
| |
|
| |
|
|
| | | 26,134 | | | 28,248 | | | 30,784 | |
| | |
|
| |
|
| |
|
|
| | | |
| Operating Profit/(Loss) (Note (A)) comprises: | | 2002 HK$M | | | 2003 HK$M | | | 2004 HK$M | |
| | | |
SoC business | | 7,147 | | | 6,311 | | | 7,053 | |
Power projects outside Hong Kong | | (214 | ) | | 708 | | | 1,063 | |
Other businesses | | 103 | | | (36 | ) | | 145 | |
Unallocated items | | (200 | ) | | (371 | ) | | (157 | ) |
| | |
|
| |
|
| |
|
|
| | | 6,836 | | | 6,612 | | | 8,104 | |
| | |
|
| |
|
| |
|
|
| | | |
| Profit/(Loss) Before Financing and Taxation (Note (B)) comprises: | | 2002
HK$M | | | 2003
HK$M | | | 2004
HK$M | |
| | | |
SoC business | | 8,719 | | | 8,027 | | | 8,826 | |
Power projects outside Hong Kong | | 1,315 | | | 2,560 | | | 2,708 | |
Other businesses | | 362 | | | 188 | | | 331 | |
Unallocated items | | (200 | ) | | (371 | ) | | (157 | ) |
| | |
|
| |
|
| |
|
|
| | | 10,196 | | | 10,404 | | | 11,708 | |
| | |
|
| |
|
| |
|
|
| | |
| Notes: | | |
| |
| (A): | | Operating Profit/(Loss) is stated before taking into account the Group’s share of profits less losses of jointly controlled entities and associated companies. |
| |
| (B): | | Profit/(Loss) Before Financing and Taxation is stated after taking into account the Group’s share of profits less losses of jointly controlled entities and associated companies. |
F-18
CLP HOLDINGS LIMITED
NOTES TO THE CONSOLIDATED FINANCIAL STATEMENTS
| 2. | TURNOVER AND SEGMENT INFORMATION (continued) |
The following shows the carrying amount of segment assets and capital expenditure incurred by business segments:
| | | | | | | | |
| | | Total Assets | | Capital Expenditure |
| | | 2003
HK$M | | 2004
HK$M | | 2003
HK$M | | 2004 HK$M |
| | | | |
SoC business | | 40,735 | | 44,414 | | 5,125 | | 5,278 |
Power projects outside Hong Kong | | 17,367 | | 18,539 | | 466 | | 535 |
Others | | 498 | | 165 | | 3 | | 10 |
| | |
| |
| |
| |
|
| | | 58,600 | | 63,118 | | 5,594 | | 5,823 |
| | | | | | |
| |
|
Investments in jointly controlled entities | | 14,687 | | 14,998 | | | | |
Investments in associated companies | | 1,593 | | 1,640 | | | | |
Tax assets | | 952 | | 1,043 | | | | |
| | |
| |
| | | | |
Total assets | | 75,832 | | 80,799 | | | | |
| | |
| |
| | | | |
F-19
CLP HOLDINGS LIMITED
NOTES TO THE CONSOLIDATED FINANCIAL STATEMENTS
Operating profit is stated after charging/(crediting) the following:
| | | | | | | | | |
| | | 2002
HK$M |
| | 2003
HK$M |
| | 2004
HK$M |
|
| | | |
Charging | | | | | | | | | |
Staff costs (A) | | | | | | | | | |
Salaries and other costs | | 1,275 | | | 1,447 | | | 1,564 | |
Retirement benefits costs (Note 9) | | 87 | | | 129 | | | 138 | |
Auditors’ remuneration (B) | | 4 | | | 10 | | | 9 | |
Impairment loss on fixed assets | | 70 | | | 9 | | | – | |
Net loss on other investments | | – | | | 16 | | | 38 | |
Net loss on disposal of fixed assets | | 79 | | | 152 | | | 212 | |
Loss on curtailment of employee retirement benefit plan | | 83 | | | – | | | – | |
| | | |
Crediting | | | | | | | | | |
Other net exchange gains | | (6 | ) | | (15 | ) | | (48 | ) |
Net rental income from properties | | (16 | ) | | (15 | ) | | (14 | ) |
Capital gains on disposal of properties | | (321 | ) | | – | | | (214 | ) |
Gain on realization of retirement benefit plan assets | | – | | | (17 | ) | | – | |
Amortization of goodwill and negative goodwill (Note 17) | | – | | | (40 | ) | | (44 | ) |
| | (A) | Staff costs include amounts recharged to jointly controlled entities for services provided. |
| | (B) | The amount shown in 2003 includes audit fees of HK$3 million for companies re-classified as subsidiary companies in 2003. |
| 4. | FINANCE COSTS AND INCOME |
| | | | | | | | | |
| | | 2002
HK$M |
| | 2003
HK$M |
| | 2004
HK$M |
|
Finance costs: | | | | | | | | | |
Interest expenses on bank loans and overdrafts | | 127 | | | 563 | | | 713 | |
Interest expenses on other borrowings | | | | | | | | | |
wholly repayable within five years | | 166 | | | 165 | | | 166 | |
not wholly repayable within five years | | 62 | | | 107 | | | 152 | |
Interest expenses on customers’ deposits and others | | 23 | | | 31 | | | 55 | |
Finance charges | | 36 | | | 43 | | | 117 | |
Hedging costs and exchange gains/losses | | (22 | ) | | 37 | | | 104 | |
| | |
|
| |
|
| |
|
|
| | | 392 | | | 946 | | | 1,307 | |
Less: amount capitalized | | (203 | ) | | (258 | ) | | (261 | ) |
| | |
|
| |
|
| |
|
|
| | | 189 | | | 688 | | | 1,046 | |
| | |
|
| |
|
| |
|
|
| | | |
Finance income: | | | | | | | | | |
Net interest income from investment securities | | 11 | | | 18 | | | – | |
Interest income on short-term investments and bank deposits | | 5 | | | 20 | | | 62 | |
Interest income on advance to jointly controlled entities | | 17 | | | 10 | | | 1 | |
| | |
|
| |
|
| |
|
|
| | | 33 | | | 48 | | | 63 | |
| | |
|
| |
|
| |
|
|
Finance costs have been capitalized at the average interest rate of 4.06% per annum for CLP Power Hong Kong and 7.90% per annum for Yallourn Energy Pty Limited (Yallourn Energy).
F-20
CLP HOLDINGS LIMITED
NOTES TO THE CONSOLIDATED FINANCIAL STATEMENTS
| 5. | HOK UN REDEVELOPMENT PROFIT/PROPERTY DISPOSAL GAIN |
| | | | | | | | | |
| | | 2002 HK$M | | | 2003 HK$M | | | 2004 HK$M | |
| | | |
Property disposal gain (Note a) | | 313 | | | – | | | 214 | |
| | |
|
| |
|
| |
|
|
Hok Un redevelopment profit (Note b) | | | | | | | | | |
Share of profit before taxation | | 282 | | | 291 | | | 187 | |
Taxation | | (49 | ) | | (51 | ) | | (28 | ) |
| | |
|
| |
|
| |
|
|
Share of profit after taxation | | 233 | | | 240 | | | 159 | |
| | |
|
| |
|
| |
|
|
| | | 546 | | | 240 | | | 373 | |
| | |
|
| |
|
| |
|
|
Notes:
| | (a) | The Group recorded a capital gain from the disposal of a site which was formerly used as staff quarters in Ho Man Tin Hill of HK$313 million in 2002 and the sale of a former substation site in Hong Kong of HK$214 million in 2004. |
| | (b) | Represents the Group’s share of profit arising from the sale of the remaining units of Phases 4 and 5 and car parking spaces. |
| 6. | SHARE OF RESULTS OF AFFILIATED COMPANIES |
The share of profits less losses of jointly controlled entities and associated companies is determined based upon the accounts of the respective affiliated companies, after making adjustments to conform with the Group’s significant accounting policies, for the years ended December 31.
F-21
CLP HOLDINGS LIMITED
NOTES TO THE CONSOLIDATED FINANCIAL STATEMENTS
| 7. | EMOLUMENTS OF DIRECTORS |
The CLP Holdings’ Board composed of thirteen (2003 and 2002: thirteen) Non-executive Directors and four (2003: four, 2002: three) Executive Directors as at December 31, 2004.
Non-Executive Directors
Non-executive Directors of the Company are paid fees in line with market practice, based on a formal independent review undertaken no less frequently than every three years. The total amount of fees paid to Non-executive Directors of the Company are as follows:
| | | | | | |
| | | 2002 HK$M | | 2003 HK$M | | 2004 HK$M |
| | | |
Non-executive Directors | | 1.1 | | 1.0 | | 1.5 |
Independent Non-executive Directors | | 0.6 | | 0.7 | | 1.2 |
| | |
| |
| |
|
| | | 1.7 | | 1.7 | | 2.7 |
| | |
| |
| |
|
On the basis of the fees which applied prior to July 1, 2004 and the revised fees which took effect from that date, the fees paid to each of our Non-executive Directors in 2004 for their service on the CLP Holdings Board and, as applicable, on its Board Committees are as follows:
| | | | | | | | | | | | | | | | | | |
| | | 2003
| | 2004
|
| | | Total
HK$ | | Board HK$ | | Audit Committee HK$ | | Nomination Committee HK$ | | Finance & General Committee HK$ | | Regulatory Affairs Committee HK$ | | Human Resources & Remuneration Committee HK$ | | Provident & Retirement Fund Committee HK$ | | Total HK$ |
| | | | | | | |
Non-executive Directors | | | | | | | | | | | | | | |
| | | | | | | | | |
Dr. The Hon. Michael D. Kadoorie | | 225,000 | | 252,500 | | – | | 5,000 | | – | | – | | – | | – | | 257,500 |
| | | | | | | | | |
Mr. W. E. Mocatta | | 150,000 | | 185,000 | | – | | – | | 40,000 | | 10,000 | | 5,000 | | 0 | | 240,000 |
| | | | | | | | | |
Mr. J. S. Dickson Leach | | 150,000 | | 185,000 | | – | | – | | 55,000 | | 10,000 | | 7,000 | | – | | 257,000 |
| | | | | | | | | |
Mr. R. J. McAulay | | 100,000 | | 150,000 | | – | | – | | – | | – | | – | | – | | 150,000 |
| | | | | | | | | |
Mr. J. A. H. Leigh | | 100,000 | | 150,000 | | – | | – | | – | | – | | – | | – | | 150,000 |
| | | | | | | | | |
Mr. R. Bischof | | 100,000 | | 150,000 | | – | | – | | – | | – | | – | | 0 | | 150,000 |
| | | | | | | | | |
Mr. I. D. Boyce | | 100,000 | | 150,000 | | – | | – | | – | | – | | – | | – | | 150,000 |
| | | | | | | | | |
Mr. P. C. Tan | | 100,000 | | 150,000 | | – | | – | | – | | 10,000 | | 5,000 | | – | | 165,000 |
| | | | | | | |
Independent Non-executive Directors | | | | | | | | | | | | | | |
| | | | | | | | | |
The Hon. Sir S. Y. Chung | | 150,000 | | 150,000 | | 75,000 | | 5,000 | | – | | 10,000 | | 5,000 | | – | | 245,000 |
| | | | | | | | | |
Dr. William K. Fung | | 100,000 | | 150,000 | | – | | 5,000 | | – | | – | | – | | – | | 155,000 |
| | | | | | | | | |
Mr. V. F. Moore | | 150,000 | | 150,000 | | 95,000 | | – | | 40,000 | | 10,000 | | 5,000 | | – | | 300,000 |
| | | | | | | | | |
Mr. Hansen Loh | | 150,000 | | 150,000 | | 75,000 | | – | | – | | 10,000 | | – | | – | | 235,000 |
| | | | | | | | | |
Mr. P. Kan | | 150,000 | | 150,000 | | 75,000 | | – | | – | | – | | – | | – | | 225,000 |
| | |
| | | | | | | | | | | | | | | |
|
| | | 1,725,000 | | | | | | | | | | | | | | | | 2,679,500 |
| | |
| | | | | | | | | | | | | | | |
|
F-22
CLP HOLDINGS LIMITED
NOTES TO THE CONSOLIDATED FINANCIAL STATEMENTS
| 7. | EMOLUMENTS OF DIRECTORS (continued) |
The directors who received fees for their directorships in subsidiary companies and affiliated companies during the year was HK$0.3 million (2003 and 2002: HK$0.4 million). Details are as follows:
| | | | | | |
| | | 2002 HK$M | | 2003 HK$M | | 2004 HK$M |
| | | |
Mr. W. E. Mocatta | | 0.2 | | 0.2 | | 0.2 |
Mr. J. S. Dickson Leach (Note) | | 0.1 | | 0.1 | | – |
Mr. J. A. H. Leigh | | 0.1 | | 0.1 | | 0.1 |
| | |
| |
| |
|
| | | 0.4 | | 0.4 | | 0.3 |
| | |
| |
| |
|
| | |
| Note: | | Mr. J. S. Dickson Leach resigned from the Board of CLP Power Hong Kong Limited on January 2, 2004 and the amount of director’s fees for 2004 was HK$206. |
Executive Directors
Under the current remuneration package, there are three key components of Executive Directors’ remuneration:
Base compensation accounts for approximately 56% of total remuneration. It is reviewed annually taking into consideration the competitive market position, market practice and individual performance for the Executive Directors.
The levels of the performance bonus are set by the Human Resources & Remuneration Committee. No Executive Directors serve on the Committee.
Annual Incentive
The annual incentive payout depends upon the performance of the CLP Group, the functions and the individuals concerned. Key measures include achievement of financial goals and operational performance targets and demonstration of key leadership competencies, such as creating shared vision and developing talents.
Each of the Executive Directors is assigned a “target” annual incentive, which accounts for 28% of his/her total remuneration. Only individuals who attain a satisfactory performance are awarded any annual incentive. The amount of the annual incentive is capped at twice the “target” annual incentive, with the actual amount being subject to performance.
Long-term Incentive
The Executive Directors are also eligible to take part in the Long-term Incentive Plan (LTIP). The “target” long-term incentive accounts for 9% of his/her total remuneration. The LTIP is designed to align the interests of the Executive Directors with those of the Shareholders by an award that is pegged to the creation of shareholder value. A three-year financial target is set every year to drive towards higher performance and to ensure that such performance is sustained over the long term. At the end of the three-year period, an award is made which is based on performance against the financial target. The award ranges from zero to one and a half times the “target” long-term incentive. The actual payout is further adjusted to reflect the share price performance of CLP Holdings, with dividends reinvested, over the same three-year period. Subject to certain vesting conditions, the award is payable in the fourth year. The LTIP was introduced in 2001 with the first award being paid to the eligible individuals in 2004.
F-23
CLP HOLDINGS LIMITED
NOTES TO THE CONSOLIDATED FINANCIAL STATEMENTS
| 7. | EMOLUMENTS OF DIRECTORS (continued) |
The Executive Directors are eligible to join the defined contribution section of the Group’s retirement fund. The Group’s contribution to the retirement fund amounts to a maximum of 12.5% of base compensation, subject to a 5% contribution by the employee. This accounts for 7% of his/her target total remuneration.
Early retirement/termination compensation is not part of the remuneration arrangements for the Executive Directors, but may be payable, where appropriate, upon approval by the Chairman of the Human Resources & Remuneration Committee.
The Group does not have, and has never had, a share option scheme.
No Executive Director has a service contract with the Company or any of its subsidiaries with a notice period in excess of one year or with provisions for predetermined compensation on termination which exceeds one year’s salary and benefits in kind.
The remuneration paid to the Executive Directors of the Company in 2004 is as shown below:
| | | | | | | | | | |
| | | Base Compensation, Allowances & Benefits HK$M | | Performance Bonus (Note (a)) | | Provident Fund Contribution HK$M | | Total HK$M |
| | | | Annual Incentive HK$M | | Long-term Incentive HK$M | | |
2004 | | | | | | | | | | |
| | | | | |
Group Managing Director & CEO (Note (b))
(Mr. Andrew Brandler) | | 5.0 | | 4.1 | | 1.6 | | 0.6 | | 11.3 |
| | | | | |
Group Executive Director & CFO (Note (b))
(Mr. Peter P. W. Tse) | | 4.1 | | 2.8 | | 1.4 | | 0.5 | | 8.8 |
| | | | | |
Group Executive Director (Note (c))
(Dr. Y. B. Lee) | | 3.5 | | 2.2 | | 2.1 | | 0.4 | | 8.2 |
| | | | | |
Director & Company Secretary (Note (b))
(Mr. Peter W. Greenwood) | | 3.7 | | 3.2 | | 0.9 | | 0.4 | | 8.2 |
| | |
| |
| |
| |
| |
|
| | | 16.3 | | 12.3 | | 6.0 | | 1.9 | | 36.5 |
| | |
| |
| |
| |
| |
|
2003 | | | | | | | | | | |
| | | | | |
Group Managing Director & CEO | | 4.9 | | 3.3 | | – | | 0.6 | | 8.8 |
Group Executive Director & CFO | | 4.2 | | 2.8 | | – | | 0.5 | | 7.5 |
Group Executive Director (Note (d)) | | 1.4 | | 0.7 | | – | | 0.2 | | 2.3 |
Director & Company Secretary | | 3.4 | | 2.6 | | – | | 0.4 | | 6.4 |
| | |
| |
| |
| |
| |
|
| | | 13.9 | | 9.4 | | – | | 1.7 | | 25.0 |
| | |
| |
| |
| |
| |
|
2002 | | | | | | | | | | |
| | | | | |
Group Managing Director & CEO | | 4.7 | | 3.7 | | – | | 0.6 | | 9.0 |
Executive Director & CFO | | 4.3 | | 3.5 | | – | | 0.5 | | 8.3 |
Director & Company Secretary | | 3.2 | | 1.7 | | – | | 0.4 | | 5.3 |
| | |
| |
| |
| |
| |
|
| | | 12.2 | | 8.9 | | – | | 1.5 | | 22.6 |
| | |
| |
| |
| |
| |
|
F-24
CLP HOLDINGS LIMITED
NOTES TO THE CONSOLIDATED FINANCIAL STATEMENTS
| 7. | EMOLUMENTS OF DIRECTORS (continued) |
The total remuneration of Directors (Non-executive and Executive) is shown below:
| | | | | | |
| | | 2002 HK$M | | 2003 HK$M | | 2004 HK$M |
| | | |
Fees | | 2 | | 2 | | 3 |
Base compensation, allowances and benefits in kind | | 13 | | 14 | | 16 |
Performance bonus (Note (a)) | | | | | | |
- Annual incentive | | 10 | | 9 | | 12 |
- Long-term incentive | | – | | – | | 6 |
Provident fund contributions | | 2 | | 2 | | 2 |
Early retirement compensation (Note (e)) | | 10 | | – | | – |
| | |
| |
| |
|
| | | 37 | | 27 | | 39 |
| | |
| |
| |
|
Of the total remuneration paid to Directors, HK$3 million (2003: HK$2 million, 2002: HK$16 million) has been charged to the SoC operation.
Notes:
| | (a): | Performance bonus consists of annual incentive and long-term incentive. The total amount of annual incentive includes: i) the accruals that have been made in the performance bonus for the Executive Directors and members of Senior Management at the target level of performance; and ii) the actual bonus paid for the last year in excess of the previous accruals made. The long-term incentive is the incentive for 2001 (the year when such incentive scheme was first introduced), paid in 2004 when the vesting conditions had been satisfied. |
| | (b): | About 44% of the amount of 2001 long-term incentive payments results from the appreciation of CLP Holdings’ share price between 2001 and 2004, with dividends reinvested. |
| | (c): | In 2001 when the long-term incentive was granted, Dr. Y. B. Lee was not an Executive Director. He then held the office of Managing Director of CLP Power China and his long-term incentive was assessed based on the performance of the achievements of the Group’s projects in the PRC. |
| | (d): | Dr. Y.B. Lee was appointed as Executive Director from August 4, 2003; the amount of director’s remuneration only included remuneration for the period he served as director. |
| | (e): | Early retirement compensation was paid to a former Executive Director. |
F-25
CLP HOLDINGS LIMITED
NOTES TO THE CONSOLIDATED FINANCIAL STATEMENTS
| 8. | EMOLUMENTS OF HIGHEST PAID EMPLOYEES |
The six highest paid individuals in the Group during the year included four (2003: three, 2002: two) who served as Directors for the full year and none (2003 and 2002: one) who served as a Director for part of the year.
The total remuneration of the six highest paid individuals in the Group is shown below:
| | | | | | |
| | | 2002
HK$M | | 2003
HK$M | | 2004
HK$M |
| | | | | Note (b) | | Note (b) |
| | | |
Base compensation, allowances and benefits in kind | | 19 | | 23 | | 24 |
Performance bonus (Note (a)) | | | | | | |
- Annual incentive | | 14 | | 15 | | 18 |
- Long-term incentive | | – | | – | | 6 |
Provident fund contributions | | 2 | | 3 | | 3 |
Early retirement compensation | | 21 | | – | | – |
| | |
| |
| |
|
| | | 56 | | 41 | | 51 |
| | |
| |
| |
|
| | |
| Note (a): | | Performance bonus consists of annual incentive and long-term incentive. The total amount of annual incentive includes: i) the accruals that have been made in the performance bonus for the Executive Directors and members of Senior Management at the target level of performance; and ii) the actual bonus paid for the last year in excess of the previous accruals made. The long-term incentive is the incentive for 2001 (the year when such incentive scheme was first introduced), paid in 2004 when the vesting conditions had been satisfied. |
| |
| Note (b): | | The remuneration of the highest paid individuals for 2003 and 2004 included the current Managing Director of CLP Power Hong Kong Limited and CLP Power Asia Limited. Details of their remuneration are shown below: |
| | | | | | | | | | |
| | | | | Performance Bonus * | | | | |
| | | Base
Compensation,
Allowances
& Benefits | | Annual
Incentive | | Long-term
Incentive | | Provident
Fund
Contribution | | Total |
| | | HK$M | | HK$M | | HK$M | | HK$M | | HK$M |
| | | | | |
2004 | | | | | | | | | | |
| | | | | |
Managing Director,
CLP Power Hong Kong Limited#
(Mrs. Betty Yuen) | | 3.9 | | 2.8 | | – | | 0.5 | | 7.2 |
| | | | | |
Managing Director,
CLP Power Asia Limited
(Mr. Richard McIndoe) | | 3.7 | | 2.7 | | – | | 0.5 | | 6.9 |
| | |
| |
| |
| |
| |
|
| | | 7.6 | | 5.5 | | – | | 1.0 | | 14.1 |
| | |
| |
| |
| |
| |
|
| | | | | |
2003 | | | | | | | | | | |
| | | | | |
Managing Director,
CLP Power Hong Kong Limited# | | 4.0 | | 2.5 | | – | | 0.5 | | 7.0 |
Managing Director,
CLP Power Asia Limited | | 3.3 | | 1.7 | | – | | 0.4 | | 5.4 |
| | |
| |
| |
| |
| |
|
| | | 7.3 | | 4.2 | | – | | 0.9 | | 12.4 |
| | |
| |
| |
| |
| |
|
F-26
CLP HOLDINGS LIMITED
NOTES TO THE CONSOLIDATED FINANCIAL STATEMENTS
| 8. | EMOLUMENTS OF HIGHEST PAID EMPLOYEES(continued) |
| | * | Performance bonus consists of annual incentive and long-term incentive. The total amount of annual incentive includes: i) the accruals that have been made in the performance bonus for the Executive Directors and members of Senior Management at the target level of performance; and ii) the actual bonus paid for the last year in excess of the previous accruals made. The long-term incentive is the incentive for 2001 (the year when such incentive scheme was first introduced), paid in 2004 when the vesting conditions had been satisfied. |
| | | The above two individuals were not in the LTIP in 2001. |
| | # | The total remuneration has been charged to the SoC operation. |
The remuneration paid to these six individuals is within the following bands:
| | | | | | |
| | | Number of Individuals |
| | | 2002
| | 2003
| | 2004
|
| | | |
HK$ 5,000,001 - HK$ 5,500,000 | | – | | 1 | | – |
HK$ 6,000,001 - HK$ 6,500,000 | | 1 | | 2 | | – |
HK$ 6,500,001 - HK$ 7,000,000 | | – | | – | | 1 |
HK$ 7,000,001 - HK$ 7,500,000 | | – | | 2 | | 1 |
HK$ 7,500,001 - HK$ 8,000,000 | | 1 | | – | | – |
HK$ 8,000,001 - HK$ 8,500,000 | | 1 | | – | | 2 |
HK$ 8,500,001 - HK$ 9,000,000 | | – | | 1 | | 1 |
HK$ 9,000,001 - HK$10,000,000 | | 1 | | – | | – |
HK$11,000,001 - HK$11,500,000 | | – | | – | | 1 |
HK$11,500,001 - HK$12,000,000 | | 1 | | – | | – |
HK$13,000,001 - HK$13,500,000 | | 1 | | – | | – |
| | | | | | | |
F-27
CLP HOLDINGS LIMITED
NOTES TO THE CONSOLIDATED FINANCIAL STATEMENTS
Prior to 2003, the Group operated two retirement funds, one for professional and general staff and the other for industrial staff employed by Group Companies in Hong Kong. Both funds were established under trust with the assets of the funds held separately from those of the Group by an independent trustee, and were Mandatory Provident Fund (MPF) exempted schemes under the Occupational Retirement Schemes Ordinance. Commencing December 1, 2000, the Group also participated in a master trust MPF scheme in Hong Kong operated by an independent service provider.
The fund for professional and general staff consisted of three programmes: the defined benefit programme, the segregated fund programme and the defined contribution programme (introduced on December 1, 2000). The defined benefit programme provided benefits that were linked to final pay and required member contributions of 5% of base compensation. Both the defined contribution programme and the segregated fund programme provided benefits linked to contributions and investments thereon. The defined contribution programme required member contributions of at least 2.5% of base compensation, whereas members were not required to contribute under the segregated fund programme. The defined benefit programme and the segregated fund programme were closed to new employees as from December 1, 2000.
The fund for industrial staff consisted of two programmes: the defined benefit programme and the defined contribution programme (introduced on December 1, 2000). The defined benefit programme provided benefits that were linked to final pay and did not require member contributions. The defined contribution programme provided benefits linked to contributions and investments thereon. The defined contribution programme required members to contribute at least 2.5% of base compensation (waived for existing members who opted to join the defined contribution programme at inception). The defined benefit programme was closed to new employees as from December 1, 2000.
Upon the close of business on December 31, 2002, all the remaining members in the defined benefit programmes were transferred to the defined contribution programmes under respective retirement funds. At the same time, the Group obtained the relevant approvals in principle to enable the winding up of the defined benefit programmes. This represented a curtailment of the defined benefit programmes. Accordingly, all actuarial losses of HK$83 million arising during the year were recognized in the profit and loss account.
Commencing from January 1, 2003, the retirement benefit plans for staff employed by Group companies in Hong Kong are regarded as defined contribution schemes. The current scheme, named CLP Group Provident Fund Scheme (GPFS) and established on June 25, 2003, provides benefits linked to contributions and investment returns on the scheme. Contributions to defined contribution schemes, including GPFS and Mandatory Provident Funds as required under the Hong Kong Mandatory Provident Fund Schemes Ordinance, totaled HK$184 million (2003: HK$175 million, 2002: HK$2 million), of which HK$61 million (2003: HK$58 million, 2002: nil) was capitalized.
Staff employed by subsidiary companies outside Hong Kong are covered by appropriate local arrangements. Total contributions amounted to HK$15 million (2003: HK$12 million, 2002: nil). The Group’s financial obligations to these arrangements are not material.
F-28
CLP HOLDINGS LIMITED
NOTES TO THE CONSOLIDATED FINANCIAL STATEMENTS
| | | | | | | | | |
| | | 2002
HK$M | | | 2003
HK$M | | | 2004
HK$M | |
| | | |
Taxation in the consolidated profit and loss account represents: | | | | | | | | | |
| | | |
Company and subsidiary companies | | | | | | | | | |
- Hong Kong | | | | | | | | | |
current | | 769 | | | 674 | | | 869 | |
deferred | | 330 | | | 343 | | | 399 | |
- outside Hong Kong | | | | | | | | | |
current | | 8 | | | 16 | | | 29 | |
deferred | | – | | | 108 | | | (1 | ) |
| | |
|
| |
|
| |
|
|
| | | 1,107 | | | 1,141 | | | 1,296 | |
| | |
|
| |
|
| |
|
|
Jointly controlled entities | | | | | | | | | |
- Hong Kong | | | | | | | | | |
current | | 261 | | | 281 | | | 306 | |
deferred | | (203 | ) | | (37 | ) | | (41 | ) |
- outside Hong Kong | | | | | | | | | |
current | | 135 | | | 210 | | | 204 | |
deferred | | (17 | ) | | 81 | | | 2 | |
| | |
|
| |
|
| |
|
|
| | | 176 | | | 535 | | | 471 | |
| | |
|
| |
|
| |
|
|
Associated company | | | | | | | | | |
- outside Hong Kong | | | | | | | | | |
current | | 2 | | | 15 | | | 30 | |
deferred | | 8 | | | 21 | | | 18 | |
| | |
|
| |
|
| |
|
|
| | | 10 | | | 36 | | | 48 | |
| | |
|
| |
|
| |
|
|
| | | 1,293 | | | 1,712 | | | 1,815 | |
| | |
|
| |
|
| |
|
|
Hong Kong profits tax has been provided at the rate of 17.5% (2003: 17.5%, 2002: 16%) on the estimated assessable profits for the year. Taxation on profits assessable outside Hong Kong has been provided at the rates prevailing in the respective jurisdictions.
The taxation on the Group’s profit before taxation differs from the theoretical amount that would arise using the Hong Kong profits tax rate as follows:
| | | | | | | | | |
| | | 2002
HK$M | | | 2003
HK$M | | | 2004
HK$M | |
| | | |
Profit before taxation | | 10,040 | | | 9,764 | | | 10,725 | |
| | |
|
| |
|
| |
|
|
| | | |
Calculated at a taxation rate of 17.5% (2003: 17.5%, 2002: 16%) | | 1,606 | | | 1,709 | | | 1,877 | |
Effect of different taxation rates in other countries | | (114 | ) | | (161 | ) | | (151 | ) |
Income not subject to taxation | | (60 | ) | | (3 | ) | | (46 | ) |
Expenses not deductible for taxation purposes | | 17 | | | 7 | | | 23 | |
Tariff rebates deductible for taxation purposes | | (275 | ) | | (220 | ) | | (32 | ) |
Under/(Over)-provision in prior years | | 5 | | | 35 | | | (37 | ) |
Tax losses not recognized | | 120 | | | 173 | | | 112 | |
Withholding/dividend distribution tax | | (6 | ) | | 172 | | | 69 | |
| | |
|
| |
|
| |
|
|
Taxation charge | | 1,293 | | | 1,712 | | | 1,815 | |
| | |
|
| |
|
| |
|
|
F-29
CLP HOLDINGS LIMITED
NOTES TO THE CONSOLIDATED FINANCIAL STATEMENTS
| 11. | TRANSFERS UNDER SCHEME OF CONTROL |
The financial operations of CLP Power Hong Kong are governed by an SoC Agreement. In accordance with the Agreement, transfers required under the SoC are shown below:
| | | | | | | | | |
| | | 2002
HK$M | | | 2003
HK$M | | | 2004
HK$M | |
Transfers under SoC | | | | | | | | | |
To Development Fund | | (1,420 | ) | | (572 | ) | | (219 | ) |
From special provision account | | 96 | | | 494 | | | 176 | |
To rate reduction reserve | | (319 | ) | | (287 | ) | | (253 | ) |
| | |
|
| |
|
| |
|
|
| | | (1,643 | ) | | (365 | ) | | (296 | ) |
| | |
|
| |
|
| |
|
|
The Development Fund, special provision account and rate reduction reserve of CLP Power Hong Kong are collectively referred to as SoC reserve accounts in the consolidated balance sheet and the respective balances at the end of the year are: | |
| | | 2002
HK$M | | | 2003
HK$M | | | 2004
HK$M | |
SoC reserve accounts | | | | | | | | | |
Development Fund (A) | | 3,372 | | | 2,960 | | | 3,171 | |
Special provision account (B) | | 670 | | | 176 | | | – | |
Rate reduction reserve (C) | | 458 | | | 471 | | | 549 | |
| | |
|
| |
|
| |
|
|
| | | 4,500 | | | 3,607 | | | 3,720 | |
| | |
|
| |
|
| |
|
|
Movements in the SoC reserve accounts are as follows: | | | | | | | | | |
| | | 2002
HK$M | | | 2003
HK$M | | | 2004
HK$M | |
(A) Development Fund | | | | | | | | | |
As at January 1 | | 3,177 | | | 3,372 | | | 2,960 | |
Transfer from profit and loss account | | 1,420 | | | 572 | | | 219 | |
One-off rebates | | (558 | ) | | (308 | ) | | 8 | |
Business relief rebate | | (41 | ) | | (42 | ) | | (1 | ) |
Special rebate to customers | | (626 | ) | | (634 | ) | | (15 | ) |
| | |
|
| |
|
| |
|
|
As at December 31 | | 3,372 | | | 2,960 | | | 3,171 | |
| | |
|
| |
|
| |
|
|
| | | 2002
HK$M | | | 2003
HK$M | | | 2004
HK$M | |
(B) Special provision account | | | | | | | | | |
As at January 1 | | 766 | | | 670 | | | 176 | |
Transfer to profit and loss account | | (96 | ) | | (494 | ) | | (176 | ) |
| | |
|
| |
|
| |
|
|
As at December 31 | | 670 | | | 176 | | | – | |
| | |
|
| |
|
| |
|
|
F-30
CLP HOLDINGS LIMITED
NOTES TO THE CONSOLIDATED FINANCIAL STATEMENTS
| 11. | TRANSFERS UNDER SCHEME OF CONTROL (continued) |
CLP Power Hong Kong and its jointly controlled generating company, Castle Peak Power Company Limited, agreed with the Hong Kong Government in December 1999 to further defer construction of Units 7 and 8 of the Black Point Power Station. It was also agreed that a total of HK$803 million be set aside from the Development Fund to a special provision account to which the deferral premium incurred will be charged. The deferral premium is a contractual obligation that corresponds to additional costs incurred by the vendors for delayed delivery of the two generating units. Under the arrangement, there is no permitted return to be earned on the deferral premium. During the year, HK$176 million (2003: HK$494 million, 2002: HK$96 million) of deferral premium was charged to the special provision account.
| | | | | | | | | |
| | | 2002
HK$M | | | 2003
HK$M | | | 2004
HK$M | |
(C) Rate reduction reserve | | | | | | | | | |
As at January 1 | | 411 | | | 458 | | | 471 | |
Transfer from profit and loss account | | 319 | | | 287 | | | 253 | |
One-off rebates | | (101 | ) | | (101 | ) | | 2 | |
Rebate to customers (Note a) | | (171 | ) | | (173 | ) | | (177 | ) |
| | |
|
| |
|
| |
|
|
As at December 31 | | 458 | | | 471 | | | 549 | |
| | |
|
| |
|
| |
|
|
Note: (a) A rebate of HK¢0.6 per unit (2002 and 2003: HK¢0.6 per unit) was made to customers during the year.
Of the consolidated earnings of HK$8,614 million (2003: HK$7,687 million, 2002: HK$7,104 million), HK$6,350 million (2003: HK$4,727 million, 2002: HK$7,607 million) has been dealt with in the accounts of the Company.
| 13. | NON-SOC OPERATING EARNINGS |
| | | | | | | | | |
| | | 2002 HK$M | | | 2003 HK$M | | | 2004 HK$M | |
Income from power projects outside Hong Kong | | | | | | | | | |
GNPJVC | | 676 | | | 696 | | | 663 | |
PSDC | | 70 | | | 67 | | | 64 | |
Other projects in Chinese mainland | | 81 | | | 172 | | | 106 | |
Projects in Asia-Pacific region | | 348 | | | 710 | | | 824 | |
| | |
|
| |
|
| |
|
|
| | | 1,175 | | | 1,645 | | | 1,657 | |
Sales to Chinese mainland | | 64 | | | 82 | | | 90 | |
Other businesses | | (241 | ) | | (127 | ) | | (76 | ) |
| | |
|
| |
|
| |
|
|
| | | 998 | | | 1,600 | | | 1,671 | |
| | |
|
| |
|
| |
|
|
F-31
CLP HOLDINGS LIMITED
NOTES TO THE CONSOLIDATED FINANCIAL STATEMENTS
| | | | | | |
| | | 2002 HK$M | | 2003 HK$M | | 2004
HK$M |
| | | |
Interim dividends paid | | 2,746 | | 2,962 | | 3,251 |
Final dividend proposed | | 1,228 | | 1,565 | | 1,758 |
Special final dividend proposed | | 554 | | 241 | | 361 |
| | |
| |
| |
|
| | | 4,528 | | 4,768 | | 5,370 |
| | |
| |
| |
|
At the Board meeting held on February 28, 2005, the Directors recommended a final dividend of HK$0.73 per share and a special final dividend of HK$0.15 per share. The proposed dividends are not reflected as dividends payable in these accounts, but as a separate component of the shareholders’ funds for the year ended December 31, 2004.
The prescribed figure for earnings per share which includes the Hok Un redevelopment profit/property disposal gain (Note 5) is computed as follows:
| | | | | | |
| | | 2002 | | 2003 | | 2004 |
| | | |
Earnings for the year (HK$M) | | 7,104 | | 7,687 | | 8,614 |
| | |
| |
| |
|
Weighted average number of shares in issue (thousand shares) | | 2,408,783 | | 2,408,246 | | 2,408,246 |
| | |
| |
| |
|
Earnings per share (HK$) | | 2.95 | | 3.19 | | 3.58 |
| | |
| |
| |
|
To enable investors to understand better the Group’s results, an additional earnings per share figure, excluding the Hok Un redevelopment profit/property disposal gain, is provided below:
| | | | | | | | | |
| | | 2002
HK$M | | | 2003
HK$M | | | 2004
HK$M | |
| | | |
Earnings for the year | | 7,104 | | | 7,687 | | | 8,614 | |
Less: Hok Un redevelopment profit/property disposal gain | | (546 | ) | | (240 | ) | | (373 | ) |
| | |
|
| |
|
| |
|
|
Earnings excluding Hok Un redevelopment profit/property disposal gain | | 6,558 | | | 7,447 | | | 8,241 | |
| | |
|
| |
|
| |
|
|
Earnings per share excluding Hok Un redevelopment profit/property disposal gain (HK$) | | 2.72 | | | 3.09 | | | 3.42 | |
| | |
|
| |
|
| |
|
|
Fully diluted earnings per share is not included as the Company did not have any diluting equity instruments as at December 31, 2004 (2002 and 2003: nil).
F-32
CLP HOLDINGS LIMITED
NOTES TO THE CONSOLIDATED FINANCIAL STATEMENTS
| | | | | | | | | | | | |
| | | Land
HK$M | | | Buildings
HK$M | | | Plant,
Machinery
and
Equipment
HK$M | | | Total
HK$M | |
| | | | |
Cost | | | | | | | | | | | | |
As at January 1, 2003 | | 2,157 | | | 5,739 | | | 44,183 | | | 52,079 | |
Acquisition of subsidiaries | | 85 | | | 373 | | | 15,932 | | | 16,390 | |
Additions | | 101 | | | 908 | | | 4,585 | | | 5,594 | |
Transfers and disposals | | (30 | ) | | (40 | ) | | (577 | ) | | (647 | ) |
Exchange differences | | 17 | | | 37 | | | 2,736 | | | 2,790 | |
| | |
|
| |
|
| |
|
| |
|
|
As at December 31, 2003 | | 2,330 | | | 7,017 | | | 66,859 | | | 76,206 | |
| | | | |
Additions | | 61 | | | 703 | | | 5,059 | | | 5,823 | (a) |
Transfers and disposals | | – | | | (104 | ) | | (834 | ) | | (938 | ) |
Exchange differences | | 4 | | | 18 | | | 817 | | | 839 | |
| | |
|
| |
|
| |
|
| |
|
|
As at December 31, 2004 | | 2,395 | | | 7,634 | | | 71,901 | | | 81,930 | |
| | |
|
| |
|
| |
|
| |
|
|
| | | | |
Accumulated depreciation | | | | | | | | | | | | |
As at January 1, 2003 | | – | | | 1,336 | | | 14,193 | | | 15,529 | |
Acquisition of subsidiaries | | – | | | 99 | | | 3,787 | | | 3,886 | |
Depreciation charge | | – | | | 159 | | | 2,198 | | | 2,357 | |
Transfers and disposals | | – | | | (11 | ) | | (403 | ) | | (414 | ) |
Impairment charge | | – | | | – | | | 9 | | | 9 | |
Exchange differences | | – | | | 8 | | | 674 | | | 682 | |
| | |
|
| |
|
| |
|
| |
|
|
As at December 31, 2003 | | – | | | 1,591 | | | 20,458 | | | 22,049 | |
| | | | |
Depreciation charge | | 50 | | | 170 | | | 2,309 | | | 2,529 | |
Transfers and disposals | | – | | | (30 | ) | | (606 | ) | | (636 | ) |
Exchange differences | | – | | | 6 | | | 234 | | | 240 | |
| | |
|
| |
|
| |
|
| |
|
|
As at December 31, 2004 | | 50 | | | 1,737 | | | 22,395 | | | 24,182 | |
| | |
|
| |
|
| |
|
| |
|
|
Net book value | | | | | | | | | | | | |
As at December 31, 2004 | | 2,345 | | | 5,897 | | | 49,506 | | | 57,748 | (b) |
| | |
|
| |
|
| |
|
| |
|
|
As at December 31, 2003 | | 2,330 | | | 5,426 | | | 46,401 | | | 54,157 | |
| | |
|
| |
|
| |
|
| |
|
|
Notes:
| | (a) | Capital expenditure incurred in the year for the SoC business totaled HK$5,278 million (2003: HK$5,125 million). |
| | (b) | Fixed assets employed for the SoC business and non-SoC business amounted to HK$42,415 million (2003: HK$39,258 million) and HK$15,333 million (2003: HK$14,899 million) respectively. For the non-SoC business, HK$15,147 million (2003: HK$14,687 million) was attributed to Yallourn Energy and Gujarat Paguthan Energy Corporation Private Limited (GPEC). |
Included in fixed assets is equipment awaiting installation and plant under construction, the book values of which as at December 31, 2004 were HK$328 million and HK$7,121 million respectively (2003: HK$335 million and HK$7,594 million respectively) for the Group.
F-33
CLP HOLDINGS LIMITED
NOTES TO THE CONSOLIDATED FINANCIAL STATEMENTS
| 16. | FIXED ASSETS (continued) |
| | | | |
| The tenure of the land of the Group is as follows: | | 2003
HK$M | | 2004
HK$M |
| | |
Held in Hong Kong: | | | | |
On long-term leases (over 50 years) | | 155 | | 152 |
On medium-term leases (10-50 years) | | 2,071 | | 2,085 |
On short-term leases (less than 10 years) | | 2 | | 2 |
| | |
| |
|
| | | 2,228 | | 2,239 |
| | |
| |
|
Held outside Hong Kong: | | | | |
Freehold | | 101 | | 105 |
On long-term leases (over 50 years) | | 1 | | 1 |
| | |
| |
|
| | | 102 | | 106 |
| | |
| |
|
| | | 2,330 | | 2,345 |
| | |
| |
|
F-34
CLP HOLDINGS LIMITED
NOTES TO THE CONSOLIDATED FINANCIAL STATEMENTS
Goodwill and negative goodwill arising from acquisition of interests in Yallourn Energy and GPEC are as follows:
| | | | | | | | | |
| | | Goodwill
HK$M | | | Negative
Goodwill
HK$M | | | Net
Balance
HK$M | |
| | | |
Gross amount | | | | | | | | | |
As at January 1, 2003 | | – | | | – | | | – | |
Transfer from jointly controlled entities | | 220 | | | (419 | ) | | (199 | ) |
Acquisition of subsidiaries | | – | | | (457 | ) | | (457 | ) |
Fair value adjustments | | (196 | ) | | (49 | ) | | (245 | ) |
Exchange differences | | 4 | | | (184 | ) | | (180 | ) |
| | |
|
| |
|
| |
|
|
As at December 31, 2003 | | 28 | | | (1,109 | ) | | (1,081 | ) |
| | | |
Acquisition of a subsidiary | | – | | | (21 | ) | | (21 | ) |
Fair value adjustments | | – | | | 11 | | | 11 | |
Exchange differences | | 1 | | | (45 | ) | | (44 | ) |
| | |
|
| |
|
| |
|
|
As at December 31, 2004 | | 29 | | | (1,164 | ) | | (1,135 | ) |
| | |
|
| |
|
| |
|
|
| | | |
Accumulated amortization | | | | | | | | | |
As at January 1, 2003 | | – | | | – | | | – | |
Transfer from jointly controlled entities | | (11 | ) | | 23 | | | 12 | |
Amortization credit | | 8 | | | 32 | | | 40 | |
Exchange differences | | – | | | 12 | | | 12 | |
| | |
|
| |
|
| |
|
|
As at December 31, 2003 | | (3 | ) | | 67 | | | 64 | |
| | | |
Amortization (charge)/credit | | (2 | ) | | 46 | | | 44 | |
Exchange differences | | – | | | 5 | | | 5 | |
| | |
|
| |
|
| |
|
|
As at December 31, 2004 | | (5 | ) | | 118 | | | 113 | |
| | |
|
| |
|
| |
|
|
Net carrying value | | | | | | | | | |
As at December 31, 2004 | | 24 | | | (1,046 | ) | | (1,022 | ) |
| | |
|
| |
|
| |
|
|
As at December 31, 2003 | | 25 | | | (1,042 | ) | | (1,017 | ) |
| | |
|
| |
|
| |
|
|
Goodwill is amortized over the useful life of 17 years while negative goodwill is amortized over the remaining plant lives of 16 to 31 years from the respective date of acquisition. The amortization charge/credit is included within ‘fuel and other operating costs’ in the consolidated profit and loss account.
F-35
CLP HOLDINGS LIMITED
NOTES TO THE CONSOLIDATED FINANCIAL STATEMENTS
| 18. | INVESTMENTS IN SUBSIDIARY COMPANIES |
| | | | | | |
| | | 2003
HK$M | | | 2004
HK$M | |
| | |
Unlisted shares, at cost | | 23,589 | | | 23,590 | |
Provisions for impairment losses | | (100 | ) | | (100 | ) |
Advances to subsidiary companies, less provisions | | 11,356 | | | 12,087 | |
Advances from subsidiary companies | | (16 | ) | | (20 | ) |
| | |
|
| |
|
|
| | | 34,829 | | | 35,557 | |
| | |
|
| |
|
|
The advances to/from subsidiary companies are unsecured, interest free and have no fixed repayment terms except an advance from CLP Properties Group of HK$15 million (2003: HK$16 million), which is repayable on demand and bears interest of 0.75% (2003: 1.25%) per annum.
F-36
CLP HOLDINGS LIMITED
NOTES TO THE CONSOLIDATED FINANCIAL STATEMENTS
| 18. | INVESTMENTS IN SUBSIDIARY COMPANIES (continued) |
The table below lists the principal subsidiary companies of the Group:
| | | | | | | | |
| Name | | Issued Share Capital | | Percentage of Issued Capital Held in 2004 | | Place of Incorporation/
Operation | | Principal Activity |
| | | | |
CLP Power Hong Kong Limited | | 2,488,320,000 shares of HK$5 each | | 100 | | Hong Kong | | Generation and Supply of Electricity |
| | | | |
Hong Kong Nuclear Investment Company Limited | | 300,000 shares of HK$1,000 each | | 100 | | Hong Kong/ Chinese mainland | | Power Project Investment Holding |
| | | | |
CLP Engineering Limited | | 410 shares of HK$10,000 each | | 100 | | Hong Kong | | Engineering Services |
| | | | |
CLP Power Asia Limited | | 1,000 shares of US$1 each | | 100 | | British Virgin Islands/International and Chinese mainland | | Power Projects Investment Holding |
| | | | |
CLP Power China Limited | | 192,000,000 shares of US$1 each | | 100* | | British Virgin Islands/Chinese mainland | | Power Projects Investment Holding |
| | | | |
CLP Power International Limited | | 192,000 shares of US$1,000 each | | 100* | | British Virgin Islands/International | | Power Projects Investment Holding |
| | | | |
CLP Properties Limited | | 15,000,000 shares of HK$10 each | | 100 | | Hong Kong | | Property Investment Holding |
| | | | |
CLP Research Institute Limited | | 1 share of US$1 | | 100 | | British Virgin Islands/Hong Kong | | Research and Development |
| | | | |
Yallourn Energy Pty Limited (A) | | 15 shares of A$1 each | | 100* | | Australia | | Generation and Supply of Electricity |
| | | | |
Gujarat Paguthan Energy Corporation Private Limited | | 728,000,000 shares of Rs.10 each | | 100* | | India | | Generation and Supply of Electricity |
| | (A) | In March 2004, the Group completed the acquisition of the remaining 8% interest in Yallourn Energy managed by Deutsche Asset Management (Australia) Limited. Following completion, the Group owns 100% of Yallourn Energy. |
F-37
CLP HOLDINGS LIMITED
NOTES TO THE CONSOLIDATED FINANCIAL STATEMENTS
| 19. | INVESTMENTS IN JOINTLY CONTROLLED ENTITIES |
The table below lists the share of net assets of the jointly controlled entities of the Group:
| | | | |
| | | 2003
HK$M | | 2004
HK$M |
Castle Peak Power Company Limited (A) | | | | |
Share of net assets | | 215 | | 181 |
Advances | | 5,690 | | 6,037 |
Special loan | | 78 | | 78 |
| | |
| |
|
| | | 5,983 | | 6,296 |
| | |
| |
|
Guangdong Nuclear Power Joint Venture Company, Limited (B) | | | | |
Share of net assets | | 3,075 | | 3,050 |
| | |
| |
|
Ho-Ping Power Company (C) | | | | |
Share of net assets other than goodwill | | 1,054 | | 1,083 |
Unamortized goodwill on acquisition | | 240 | | 243 |
| | |
| |
|
| | | 1,294 | | 1,326 |
| | |
| |
|
CLP Guohua Power Company Limited (D) | | | | |
Share of net assets other than goodwill | | 924 | | 1,104 |
Unamortized goodwill on acquisition | | 125 | | 118 |
| | |
| |
|
| | | 1,049 | | 1,222 |
| | |
| |
|
Shandong Zhonghua Power Company, Ltd. (E) | | | | |
Share of net assets | | 1,341 | | 1,132 |
| | |
| |
|
Guizhou CLP Power Company Limited (F) | | | | |
Share of net assets | | 140 | | 466 |
| | |
| |
|
Hok Un joint venture (G) | | | | |
Share of net assets | | 560 | | 343 |
| | |
| |
|
Hong Kong Pumped Storage Development Company, Limited (H) | | | | |
Share of net assets | | 12 | | 11 |
Advances | | 306 | | 313 |
| | |
| |
|
| | | 318 | | 324 |
| | |
| |
|
Others (I) | | | | |
Share of net assets other than goodwill | | 548 | | 525 |
Unamortized goodwill on acquisition | | 77 | | 61 |
Advances | | 302 | | 253 |
| | |
| |
|
| | | 927 | | 839 |
| | |
| |
|
| | | 14,687 | | 14,998 |
| | |
| |
|
F-38
CLP HOLDINGS LIMITED
NOTES TO THE CONSOLIDATED FINANCIAL STATEMENTS
| 19. | INVESTMENTS IN JOINTLY CONTROLLED ENTITIES (continued) |
The purchased goodwill of jointly controlled entities is amortized on a straight-line basis over its estimated useful economic life. Movement of goodwill is shown as below:
| | | | | | |
| | | 2003
HK$M | | | 2004
HK$M | |
| | |
Gross amount | | 268 | | | 484 | |
Accumulated amortization | | (16 | ) | | (42 | ) |
| | |
|
| |
|
|
Balance at beginning of year | | 252 | | | 442 | |
Addition | | 42 | | | – | |
Transfer upon acquisition of subsidiary companies and disposal | | 156 | | | – | |
Amortization charge | | (20 | ) | | (20 | ) |
Impairment charge | | – | | | (15 | ) |
Exchange differences | | 12 | | | 15 | |
| | |
|
| |
|
|
Balance at end of year | | 442 | | | 422 | |
| | |
|
| |
|
|
| | |
Balance at end of year comprises: | | | | | | |
Gross amount | | 484 | | | 500 | |
Accumulated amortization | | (42 | ) | | (78 | ) |
| | |
|
| |
|
|
Balance at end of year | | 442 | | | 422 | |
| | |
|
| |
|
|
| | (A) | Castle Peak Power Company Limited (CAPCO) is 40% owned by CLP Power Hong Kong and 60% owned by ExxonMobil Energy Limited and is incorporated in Hong Kong. Its principal activity is the generation of electricity for the sole supply to CLP Power Hong Kong. While CAPCO owns the power generation assets, CLP Power Hong Kong builds and operates all CAPCO’s power stations and is the sole off-taker. |
Under the terms of the revised CAPCO Deed of Subordination, in the event of the winding up of CAPCO, CLP Power Hong Kong’s advances to it would be subordinated to certain loans of CAPCO. CLP Power Hong Kong’s advances to CAPCO may be withdrawn only to the extent that the shareholders’ funds exceed two-thirds of the aggregate principal amount outstanding of the said loans. In this context the shareholders’ funds represent the sum of the issued share capital, shareholders’ advances, special advances, deferred taxation, retained profits and any proposed dividend.
The Special Loan to CAPCO is unsecured, interest free and repayable in full on September 30, 2008.
In view of the significance of this investment, an extract of the accounts of CAPCO for the years ended December 31 is set out as follows:
| | | | | | |
| | | 2003
HK$M | | | 2004
HK$M | |
| Results for the year | | | | | | |
Turnover | | 10,523 | | | 11,025 | |
| | |
|
| |
|
|
Profit before taxation | | 4,278 | | | 4,420 | |
| | |
|
| |
|
|
Group’s share of profit before taxation | | 1,716 | | | 1,773 | |
| | |
|
| |
|
|
| | |
| Net assets as at year end | | | | | | |
Fixed assets | | 27,449 | | | 27,467 | |
Current assets | | 1,536 | | | 1,591 | |
Current liabilities | | (4,348 | ) | | (3,915 | ) |
Deferred taxation | | (2,827 | ) | | (2,847 | ) |
Long-term liabilities | | (7,011 | ) | | (6,684 | ) |
| | |
|
| |
|
|
| | | 14,799 | | | 15,612 | |
| | |
|
| |
|
|
F-39
CLP HOLDINGS LIMITED
NOTES TO THE CONSOLIDATED FINANCIAL STATEMENTS
| 19. | INVESTMENTS IN JOINTLY CONTROLLED ENTITIES (continued) |
| | (B) | Guangdong Nuclear Power Joint Venture Company, Limited (GNPJVC) is 25% owned by the Group and 75% owned by Guangdong Nuclear Investment Company, Limited and is incorporated in the Chinese mainland. This company constructed and operates the Guangdong Daya Bay Nuclear Power Station and its principal activity is the generation of electricity for supply to Hong Kong and Guangdong Province. |
In view of the significance of this investment, an extract of the management accounts of GNPJVC, after making adjustments to conform with the Group’s significant accounting policies, for the years ended December 31 is set out as follows:
| | | | | | |
| | | 2003
HK$M | | | 2004
HK$M | |
| Results for the year | | | | | | |
Turnover | | 7,348 | | | 6,700 | |
| | |
|
| |
|
|
Profit before taxation | | 3,308 | | | 2,956 | |
| | |
|
| |
|
|
Group’s share of profit before taxation | | 827 | | | 739 | |
| | |
|
| |
|
|
| | |
| Net assets as at year end | | | | | | |
Fixed assets | | 16,034 | | | 14,600 | |
Current assets | | 4,232 | | | 5,411 | |
Current liabilities | | (1,386 | ) | | (1,530 | ) |
Long-term liabilities | | (6,566 | ) | | (6,281 | ) |
| | |
|
| |
|
|
| | | 12,314 | | | 12,200 | |
| | |
|
| |
|
|
| | (C) | The Group has an interest in 40% of the issued share capital of Ho-Ping Power Company (Ho-Ping), a company which is incorporated in Taiwan. This company constructed, owns and operates a coal-fired power station and an associated 53km of 345kV transmission line at Ho-Ping in eastern Taiwan. Unit 1 and Unit 2 of the plant commenced operation in June and September 2002 respectively. All power generated is supplied to Taiwan Power Company (Taipower), the government-owned utility of Taiwan. Goodwill associated with the acquisition of Ho-Ping is amortized over a period of 25 years, which is the term of the power purchase agreement signed with Taipower. |
F-40
CLP HOLDINGS LIMITED
NOTES TO THE CONSOLIDATED FINANCIAL STATEMENTS
| 19. | INVESTMENTS IN JOINTLY CONTROLLED ENTITIES (continued) |
| | (D) | CLP Guohua Power Company Limited, the joint stock company with 51% owned by Beijing Guohua Electric Power Corporation and 49% by the Group, is incorporated in the Chinese mainland. It holds interests in three coal-fired power stations, namely Beijing Yire Power Station in Beijing, Panshan Power Station in Tianjin and Sanhe Power Station in Hebei, with a combined installed capacity of 2,100MW, of which the joint stock company owns 1,285 equity MW. Goodwill is amortized over 20 years from the date of acquisition. |
| | (E) | Shandong Zhonghua Power Company, Ltd. is 29.4% owned by the Group and is incorporated in the Chinese mainland. This company owns four power stations (namely Shiheng I, Shiheng II, Heze II and Liaocheng) totaling 3,000MW. All power generated is for supply to the Shandong power grid. |
| | (F) | Guizhou CLP Power Company Limited (Guizhou CLP Power) is 70% owned by the Group and is incorporated in the Chinese mainland. This company constructed and operates a coal-fired power station, Anshun II Power Station, in Guizhou with an installed capacity of 600MW. The plant was in trial operation in 2003, and commenced commercial operations of Unit 1 and Unit 2 in March and November 2004 respectively. All power generated is for supply to the Guizhou power grid. |
Under the joint venture agreement, none of the joint venture partners has unilateral control over the economic activity of Guizhou CLP Power; and hence, the Group’s interest is accounted for as jointly controlled entity. In view of the significant shareholding in this investment, an extract of the management accounts of Guizhou CLP Power, after making adjustments to conform with the Group’s significant accounting policies, for the years ended December 31 is set out as follows:
| | | | | | |
| | | 2003
HK$M |
| | 2004
HK$M |
|
Results for the year | | | | | | |
Turnover | | 104 | | | 604 | |
| | |
|
| |
|
|
(Loss)/Profit before taxation | | (4 | ) | | 81 | |
| | |
|
| |
|
|
Group’s share of (loss)/profit before taxation | | (3 | ) | | 57 | |
| | |
|
| |
|
|
Net assets as at year end | | | | | | |
Fixed assets | | 2,132 | | | 2,240 | |
Current assets | | 92 | | | 295 | |
Current liabilities | | (318 | ) | | (153 | ) |
Long-term liabilities | | (1,768 | ) | | (1,717 | ) |
| | |
|
| |
|
|
| | | 138 | | | 665 | |
| | |
|
| |
|
|
F-41
CLP HOLDINGS LIMITED
NOTES TO THE CONSOLIDATED FINANCIAL STATEMENTS
| 19. | INVESTMENTS IN JOINTLY CONTROLLED ENTITIES (continued) |
| | (G) | The Group entered into a joint venture agreement with a wholly-owned subsidiary company of Cheung Kong (Holdings) Limited in 1991 to develop the Hok Un site at Hung Hom (named Laguna Verde). Under the agreement, the Group has the right to share 50% of profits arising from the project, with a minimum overall profit guaranteed by the subsidiary company of Cheung Kong (Holdings) Limited which also provides all the necessary funding. |
| | | In 1999, the joint venture obtained an additional Plot Ratio from the Hong Kong Government. Under a separate agreement with the subsidiary company of Cheung Kong (Holdings) Limited, the Group shares 50% of the net proceeds of sale from this additional gross floor area and bears 50% of associated land premium, development and marketing costs. |
| | (H) | Hong Kong Pumped Storage Development Company, Limited is 49% owned by the Group and is incorporated in Hong Kong. This company has the right to use 50% of the capacity of Phase I of the Guangzhou Pumped Storage Power Station in Guangdong Province until 2034. |
| | (I) | The Group’s other investments include: |
| | - | 41.5% interest in a number of hydro power projects in Huaiji County, Guangdong Province; |
| | - | 50% interest in a joint venture undertaken with a subsidiary company of Cheung Kong (Holdings) Limited in Hong Kong to provide second mortgage financing to purchasers of Laguna Verde; |
| | - | 49% interest in CLP Guohua Shenmu, which is incorporated in the Chinese mainland and holds an interest in a coal-fired power station, Shenmu Power Station, with an installed capacity of 200MW. Goodwill is amortized over 18 years from the date of acquisition; |
| | - | 40% interest in Ho-Ping Power Services Corporation to provide operation and maintenance services to Ho-Ping; and |
| | - | 50% interest in BLCP Power Limited (BLCP), which owns and will operate a 1,434MW coal-fired power station currently under construction in Thailand. Goodwill associated with the acquisition of BLCP is to be amortized over a period of 25 years from the date of commercial operation, which is the term of the power purchase agreement signed with Electricity Generating Authority of Thailand. |
The advances to jointly controlled entities are unsecured, interest free and have no fixed repayment terms except for an advance of HK$253 million (2003: HK$302 million) to a joint venture undertaken with a subsidiary company of Cheung Kong (Holdings) Limited, of which HK$50 million (2003: HK$25 million) bears interest of 2.0% (2003: 5.0%) per annum.
F-42
CLP HOLDINGS LIMITED
| NOTES | TO THE CONSOLIDATED FINANCIAL STATEMENTS |
| 20. | INVESTMENTS IN ASSOCIATED COMPANIES |
| | | | | |
| | | 2003
HK$M |
| | 2004
HK$M |
Electricity Generating Public Company Limited (A) | | | | | |
Share of net assets other than goodwill | | 1,346 | | | 1,489 |
Unamortized goodwill on acquisition | | 163 | | | 151 |
| | |
|
| |
|
| | | 1,509 | | | 1,640 |
| | |
|
| |
|
PowerCom Network Hong Kong Limited (B) | | | | | |
Share of net losses | | (3 | ) | | – |
Unamortized goodwill on acquisition | | 87 | | | – |
| | |
|
| |
|
| | | 84 | | | – |
| | |
|
| |
|
| | | 1,593 | | | 1,640 |
| | |
|
| |
|
| | The purchased goodwill of associated companies is amortized on a straight-line basis over its estimated useful economic life of 10 to 16 years. Movement of goodwill is shown as below: |
| | | | | | |
| | | 2003
HK$M |
| | 2004
HK$M |
|
| | |
Gross amount | | 1,373 | | | 1,386 | |
Accumulated amortization | | (1,056 | ) | | (1,136 | ) |
| | |
|
| |
|
|
Balance at beginning of year | | 317 | | | 250 | |
Disposal | | – | | | (85 | ) |
Amortization charge | | (31 | ) | | (17 | ) |
Impairment charge | | (49 | ) | | – | |
Exchange differences | | 13 | | | 3 | |
| | |
|
| |
|
|
Balance at end of year | | 250 | | | 151 | |
| | |
|
| |
|
|
Balance at end of year comprises: | | | | | | |
Gross amount | | 1,386 | | | 1,255 | |
Accumulated amortization | | (1,136 | ) | | (1,104 | ) |
| | |
|
| |
|
|
Balance at end of year | | 250 | | | 151 | |
| | |
|
| |
|
|
| | (A) | Electricity Generating Public Company Limited (EGCO) is 22.4% (2003: 22.4%) owned by the Group and is incorporated and listed in Thailand. Its principal activity is the generation of electricity for supply to the Electricity Generating Authority of Thailand. The Group has nominated 4 directors to the EGCO Board out of the total of 15 Board members. The market value as at December 31, 2004 was HK$1,769 million (2003: HK$2,080 million). |
| | (B) | The Group completed the sale of its 19% equity interest in PowerCom Network Hong Kong Limited to Hutchison Global Communications Holdings Limited (HGCH, formerly known as Vanda Systems & Communications Holdings Limited) in exchange for the issue of shares in HGCH in March 2004. The Group then placed 37.7% of those shares and sold its remaining interest in HGCH in July 2004. |
F-43
CLP HOLDINGS LIMITED
NOTES TO THE CONSOLIDATED FINANCIAL STATEMENTS
| 21. | BANK BALANCES, CASH AND OTHER LIQUID FUNDS |
| | | | |
| | | 2003
HK$M | | 2004
HK$M |
| | |
Trust fund for unclaimed dividends (A) | | 21 | | 16 |
Trust accounts under TRAA (B) | | 131 | | 549 |
Short-term investments and bank deposits | | 549 | | 1,857 |
Bank balances and cash | | 86 | | 98 |
| | |
| |
|
| | | 787 | | 2,520 |
| | |
| |
|
| | (A) | As part of the restructuring arrangements in relation to the transfer of HK$10,116,789,910 from the share premium account to distributable reserves approved by the court in 2002, a trust fund was set up to cover unclaimed dividends. The Company has an obligation to pay such dividends until they can be forfeited after 6 years from the date they were declared. |
| | (B) | Pursuant to a Trust and Retention Account Agreement (TRAA) between GPEC and its lenders, GPEC is required to deposit receipts from its off-taker, Gujarat Electricity Board (GEB), into various trust accounts for fuel, operating and major maintenance expenses and debt service payments. |
| 22. | TRADE AND OTHER RECEIVABLES |
| | | | |
| | | 2003
HK$M | | 2004
HK$M |
| | |
Trade receivables (aging analysis is shown below) | | 3,201 | | 2,376 |
Deposits and prepayments | | 1,161 | | 986 |
Dividend receivable from a jointly controlled entity | | – | | 196 |
Current accounts with jointly controlled entities | | 62 | | 6 |
| | |
| |
|
| | | 4,424 | | 3,564 |
| | |
| |
|
The Group has established credit policies for customers in each of its core businesses. CLP Power Hong Kong’s credit policy in respect of receivables arising from its principal electricity business is to allow customers to settle their electricity bills within 15 to 17 days after issue. Customers’ receivable balances are generally secured by cash deposits or bank guarantees. For Yallourn Energy and GPEC, the credit term for trade receivables ranges from 30 to 60 days.
| | The aging analysis of the trade receivables, after provisions, as at December 31 is as follows: |
| | | | |
| | | 2003
HK$M | | 2004
HK$M |
| | |
Below 30 days | | 2,011 | | 2,332 |
31-60 days | | 169 | | 15 |
61-90 days | | 40 | | 7 |
Over 90 days | | 981 | | 22 |
| | |
| |
|
| | | 3,201 | | 2,376 |
| | |
| |
|
Trade and other receivables attributed to GPEC and Yallourn Energy amounted to HK$1,610 million (2003: HK$3,153 million). GPEC has obtained payment for some of its receivables from GEB through bill discounting with recourse. Details of these financing arrangements are disclosed in Note 30(A).
F-44
CLP HOLDINGS LIMITED
NOTES TO THE CONSOLIDATED FINANCIAL STATEMENTS
Costs of fuel consumed by CLP Power Hong Kong are passed on to the customers. The variations between the actual cost of fuel and the fuel cost billed are captured in the Fuel Clause Account. The balance on the account (inclusive of interest) represents amounts over-recovered and is an amount due to customers of CLP Power Hong Kong.
| 24. | TRADE AND OTHER PAYABLES |
| | | | |
| | | 2003
HK$M | | 2004
HK$M |
| | |
Trade payables (aging analysis is shown below) | | 1,719 | | 2,064 |
Other payables and accruals | | 1,152 | | 1,053 |
Current accounts with jointly controlled entities | | 1,123 | | 1,099 |
| | |
| |
|
| | | 3,994 | | 4,216 |
| | |
| |
|
The aging analysis of the trade payables as at December 31 is as follows:
| | | | |
| | | 2003
HK$M | | 2004
HK$M |
| | |
Below 30 days | | 1,671 | | 2,043 |
31-60 days | | 41 | | 2 |
61-90 days | | 7 | | 4 |
Over 90 days | | – | | 15 |
| | |
| |
|
| | | 1,719 | | 2,064 |
| | |
| |
|
| | | | | | | | |
| | | 2003 | | 2004 |
| | | Number of
Shares of
HK$5 Each | | Amount
HK$M | | Number of
Shares of
HK$5 Each | | Amount
HK$M |
| | | | |
Authorized, as at December 31 | | 3,000,000,000 | | 15,000 | | 3,000,000,000 | | 15,000 |
| | |
| |
| |
| |
|
Issued and fully-paid, as at December 31 | | 2,408,245,900 | | 12,041 | | 2,408,245,900 | | 12,041 |
| | |
| |
| |
| |
|
There was no movement in the share capital of the Company during the year (2003: nil).
F-45
CLP HOLDINGS LIMITED
NOTES TO THE CONSOLIDATED FINANCIAL STATEMENTS
| 26. | BANK LOANS AND OTHER BORROWINGS |
| | | | |
| | | 2003
HK$M | | 2004
HK$M |
Total facilities available | | | | |
Bank overdrafts | | 703 | | 713 |
Bank loans | | 21,610 | | 19,765 |
U.S. Dollar Notes due 2006 (US$300 million) | | 2,340 | | 2,340 |
Notes issued under MTN programme (Note a) | | 3,340 | | 4,340 |
| | |
| |
|
| | | 27,993 | | 27,158 |
| | |
| |
|
Notes:
| | (a) | Includes only the amount of the Notes issued up to the balance sheet date. |
| | (b) | Of the total bank loan facilities available to the Group, HK$17,489 million (2003: HK$19,326 million) are committed. |
| | | | | | |
| | | 2003
HK$M |
| | 2004
HK$M |
|
Bank loans and other borrowings | | | | | | |
Unsecured | | 11,633 | | | 12,156 | |
Secured | | 7,064 | | | 6,618 | |
| | |
|
| |
|
|
| | | 18,697 | | | 18,774 | |
Short-term loans | | (567 | ) | | (422 | ) |
Current portion of long-term loans and other borrowings | | (528 | ) | | (756 | ) |
| | |
|
| |
|
|
| | | 17,602 | | | 17,596 | |
| | |
|
| |
|
|
The analysis of the above is as follows: | | | | | | |
Bank loans | | | | | | |
Wholly repayable within five years | | 7,082 | | | 6,908 | |
Not wholly repayable within five years | | 5,935 | | | 5,186 | |
| | |
|
| |
|
|
| | | 13,017 | | | 12,094 | |
| | |
|
| |
|
|
Other borrowings | | | | | | |
Wholly repayable within five years | | 2,340 | | | 2,340 | |
Not wholly repayable within five years | | 3,340 | | | 4,340 | |
| | |
|
| |
|
|
| | | 5,680 | | | 6,680 | |
| | |
|
| |
|
|
| | | 18,697 | | | 18,774 | |
| | |
|
| |
|
|
F-46
CLP HOLDINGS LIMITED
NOTES TO THE CONSOLIDATED FINANCIAL STATEMENTS
| 26. | BANK LOANS AND OTHER BORROWINGS (continued) |
As at December 31, 2004, the Group’s bank loans and other borrowings were repayable as follows:
| | | | | | | | | | | | |
| | | Bank Loans | | Other Borrowings | | Total |
| | | 2003
HK$M | | 2004
HK$M | | 2003
HK$M | | 2004
HK$M | | 2003
HK$M | | 2004
HK$M |
| | | | | | |
within one year | | 1,095 | | 1,178 | | – | | – | | 1,095 | | 1,178 |
between one and two years | | 770 | | 2,973 | | – | | 2,340 | | 770 | | 5,313 |
between two and five years | | 8,356 | | 6,027 | | 2,340 | | – | | 10,696 | | 6,027 |
after five years | | 2,796 | | 1,916 | | 3,340 | | 4,340 | | 6,136 | | 6,256 |
| | |
| |
| |
| |
| |
| |
|
| | | 13,017 | | 12,094 | | 5,680 | | 6,680 | | 18,697 | | 18,774 |
| | |
| |
| |
| |
| |
| |
|
The total borrowings of HK$18,774 million as at December 31, 2004 (2003: HK$18,697 million) comprised the following:
| | (i) | US Dollar Notes of HK$2,340 million (2003: HK$2,340 million) with a coupon rate of 7.50% (2003: 7.50%) per annum; this liability was fully swapped into Hong Kong Dollars, at an average fixed rate of 7.07% per annum; |
| | (ii) | Under the MTN programme, |
| | (a) | US Dollar Notes of HK$2,340 million (2003: HK$2,340 million) with a coupon rate of 6.25% per annum; this liability was fully swapped into Hong Kong Dollars, with HK$1,000 million further swapped into 5-year fixed rate of 6.12% per annum and the balance kept at floating rate; |
| | (b) | Hong Kong Dollar Notes of HK$2,000 million (2003: HK$1,000 million) with coupon rates ranging from 4.28% to 5.00% per annum (2003: 4.45% to 5.00% per annum); |
| | (iii) | Australian dollar bank loans of HK$6,226 million (2003: HK$9,336 million), with interest rates at a fixed margin over Australian Bank Bill Swap Rates. HK$6,106 million (2003: HK$6,444 million) of the loans were attributed to Yallourn Energy, with about 80% swapped into fixed rate on a rolling 5-year basis and secured by a fixed and floating charge over the assets of Yallourn Energy; |
| | (iv) | Bank loans of HK$1,397 million (2003: HK$1,607 million), which are principally floating rate loans, were attributed to GPEC. Over half of this liability was in Indian Rupees after currency swaps, with the remaining amount in Euros. Part of the loans (HK$512 million) are secured by a fixed and floating charge over the assets of GPEC; and |
| | (v) | Others include floating rate loans of HK$4,469 million (2003: HK$2,070 million) and a fixed rate bank loan of HK$2 million (2003: HK$4 million). |
F-47
CLP HOLDINGS LIMITED
NOTES TO THE CONSOLIDATED FINANCIAL STATEMENTS
Deferred taxation is calculated in full on temporary differences under the liability method using the taxation rates enacted or substantively enacted by the balance sheet date in the respective jurisdictions.
The movement in the deferred tax assets and liabilities (prior to offsetting of balances within the same taxation jurisdiction) during the year is as follows:
Deferred tax assets (prior to offset)
| | | | | | | | | | | | | | | | | | | | |
| | | Tax Losses | | | Accruals and
Provisions | | Others | | Total | |
| | | 2003
HK$M | | 2004
HK$M |
| | 2003
HK$M |
| | 2004
HK$M | | 2003
HK$M | | 2004
HK$M | | 2003
HK$M |
| | 2004
HK$M |
|
| | | | | | | | |
As at January 1 | | – | | 3,840 | | | – | | | 236 | | – | | 91 | | – | | | 4,167 | |
Acquisition of subsidiaries | | 2,909 | | – | | | 170 | | | – | | 73 | | – | | 3,152 | | | – | |
Fair value adjustments | | – | | – | | | (22 | ) | | 1 | | 1 | | – | | (21 | ) | | 1 | |
Credited/(charged) to profit and
loss account | | 240 | | (130 | ) | | 53 | | | 87 | | 16 | | 18 | | 309 | | | (25 | ) |
Exchange differences | | 691 | | 141 | | | 35 | | | 14 | | 1 | | 5 | | 727 | | | 160 | |
| | |
| |
|
| |
|
| |
| |
| |
| |
|
| |
|
|
As at December 31 | | 3,840 | | 3,851 | | | 236 | | | 338 | | 91 | | 114 | | 4,167 | | | 4,303 | |
| | |
| |
|
| |
|
| |
| |
| |
| |
|
| |
|
|
Deferred tax liabilities (prior to offset)
| | | | | | | | | | | | | | | | | | | | | | | | |
| | | Accelerated Tax
Depreciation |
| | Withholding/
Dividend
Distribution Tax |
| | Others | | | Total | |
| | | 2003
HK$M |
| | 2004
HK$M |
| | 2003
HK$M |
| | 2004
HK$M |
| | 2003
HK$M |
| | 2004
HK$M |
| | 2003
HK$M |
| | 2004
HK$M |
|
| | | | | | | | |
As at January 1 | | (3,610 | ) | | (7,278 | ) | | – | | | (323 | ) | | – | | | (228 | ) | | (3,610 | ) | | (7,829 | ) |
Acquisition of subsidiaries | | (2,194 | ) | | – | | | (222 | ) | | – | | | (150 | ) | | – | | | (2,566 | ) | | – | |
Fair value adjustments | | – | | | – | | | (3 | ) | | 2 | | | – | | | – | | | (3 | ) | | 2 | |
(Charged)/credited to profit and
loss account | | (623 | ) | | (361 | ) | | (97 | ) | | (21 | ) | | (40 | ) | | 9 | | | (760 | ) | | (373 | ) |
Effect of change in tax rate | | (338 | ) | | – | | | – | | | – | | | – | | | – | | | (338 | ) | | – | |
Exchange differences | | (513 | ) | | (114 | ) | | (1 | ) | | (22 | ) | | (38 | ) | | (8 | ) | | (552 | ) | | (144 | ) |
| | |
|
| |
|
| |
|
| |
|
| |
|
| |
|
| |
|
| |
|
|
As at December 31 | | (7,278 | ) | | (7,753 | ) | | (323 | ) | | (364 | ) | | (228 | ) | | (227 | ) | | (7,829 | ) | | (8,344 | ) |
| | |
|
| |
|
| |
|
| |
|
| |
|
| |
|
| |
|
| |
|
|
Deferred tax balances predominantly comprise non-current items. Deferred tax assets and liabilities are netted off when the taxes relate to the same taxation authority and where offsetting is legally enforceable. The following amounts, determined after appropriate offsetting, are shown separately in the consolidated balance sheet:
| | | | | | |
| | | 2003
HK$M |
| | 2004
HK$M |
|
| | |
Deferred tax assets | | 952 | | | 1,043 | |
Deferred tax liabilities | | (4,614 | ) | | (5,084 | ) |
| | |
|
| |
|
|
| | | (3,662 | ) | | (4,041 | ) |
| | |
|
| |
|
|
F-48
CLP HOLDINGS LIMITED
NOTES TO THE CONSOLIDATED FINANCIAL STATEMENTS
| 28. | NOTES TO THE CONSOLIDATED CASH FLOW STATEMENT |
Reconciliation of profit before taxation to net cash inflow from operations:
| | | | | | | | | |
| | | 2002
HK$M |
| | 2003
HK$M |
| | 2004
HK$M |
|
Profit before taxation | | 10,040 | | | 9,764 | | | 10,725 | |
Adjustments for: | | | | | | | | | |
Operating interest | | 184 | | | 622 | | | 828 | |
Finance income | | (33 | ) | | (48 | ) | | (63 | ) |
Hok Un redevelopment profit | | (282 | ) | | (291 | ) | | (187 | ) |
Share of profits less losses of jointly controlled entities | | (2,992 | ) | | (3,399 | ) | | (3,181 | ) |
Share of profits less losses of associated companies | | (86 | ) | | (102 | ) | | (236 | ) |
Depreciation | | 1,749 | | | 2,357 | | | 2,529 | |
Amortization of goodwill and negative goodwill | | – | | | (40 | ) | | (44 | ) |
Impairment loss on investments in jointly controlled entities | | 38 | | | – | | | – | |
Impairment loss on fixed assets | | 59 | | | 9 | | | – | |
Net loss on disposal of fixed assets | | 79 | | | 152 | | | 212 | |
Capital gain arising from disposal of properties | | (321 | ) | | – | | | (214 | ) |
Dividend income from investments | | (34 | ) | | – | | | – | |
Net (gain)/loss on other investments | | (27 | ) | | 16 | | | 38 | |
Unrealized loss/(realized gain) on retirement benefit plan assets | | 83 | | | (17 | ) | | – | |
Hedging costs and exchange (gains)/losses | | (28 | ) | | 32 | | | 52 | |
SoC items | | | | | | | | | |
| | | | | | | | | | |
Increase in customers’ deposits | | 234 | | | 194 | | | 241 | |
Increase/(Decrease) in fuel clause account | | 258 | | | 894 | | | (152 | ) |
One-off rebates | | (439 | ) | | (1,368 | ) | | (479 | ) |
Rebate to customers under SoC | | (171 | ) | | (173 | ) | | (177 | ) |
Business relief rebate | | (41 | ) | | (42 | ) | | (1 | ) |
Special rebate | | (626 | ) | | (634 | ) | | (15 | ) |
| | |
|
| |
|
| |
|
|
| | | (785 | ) | | (1,129 | ) | | (583 | ) |
| | | | | | | | | | |
Operating profit before working capital changes | | 7,644 | | | 7,926 | | | 9,876 | |
(Increase)/Decrease in debtors and prepayments | | (150 | ) | | (158 | ) | | 1,695 | |
Increase in retirement benefit plan assets | | (27 | ) | | – | | | – | |
Increase in creditors and other liabilities | | 248 | | | 29 | | | 95 | |
Increase in dividend receivable from a jointly controlled entity | | – | | | – | | | (196 | ) |
Increase in current accounts due to jointly controlled entities | | 134 | | | 61 | | | 32 | |
| | |
|
| |
|
| |
|
|
Net cash inflow from operations | | 7,849 | | | 7,858 | | | 11,502 | |
| | |
|
| |
|
| |
|
|
F-49
CLP HOLDINGS LIMITED
NOTES TO THE CONSOLIDATED FINANCIAL STATEMENTS
| | (A) | Capital expenditure authorized but not brought into the accounts is as follows: |
| | | | |
| | | 2003
HK$M | | 2004
HK$M |
| | |
Contracted but not provided for | | 2,984 | | 2,207 |
Authorized but not contracted for | | 9,411 | | 9,670 |
| | |
| |
|
| | | 12,395 | | 11,877 |
| | |
| |
|
| | (B) | Under the Equity Contribution Agreement and its amendment agreement relating to the BLCP Power project, the Group is required to make equity contributions of US$165 million. As at December 31, 2004, the Group’s obligation as to US$17 million (approximately HK$132 million) had been fulfilled. The remainder will be contributed by 2007. |
| | (C) | In respect of the investment in Changdao wind power project, the Group is required to contribute share capital of RMB45 million. The first contribution of RMB7 million (approximately HK$6 million) was made in early February 2005, with the remainder to be contributed by the end of 2005. |
| | (D) | Pursuant to the relevant loan agreements for the refinancing of Yallourn Energy, shareholders of CLP AusPower Pty Limited (formerly known as AusPower Holdings Pty Limited), the immediate holding company of Yallourn Energy, agreed to provide the senior debt lenders with contingent equity support up to A$200 million for a five-year period from February 27, 2001. Mandatory contribution of contingent equity depends on certain minimum requirements regarding the availability of cash flows for debt service, measured every six months. As at December 31, 2004, A$80 million (approximately HK$460 million) had been contributed by the Group, with A$120 million of commitment still outstanding. |
Owing primarily to continued high capital expenditure requirements and a slightly lower than expected revenue this year, Yallourn Energy forecasts that the additional contingent equity support will need to be provided in 2005.
| 30. | CONTINGENT LIABILITIES |
| | (A) | GPEC has obtained payment for some of its receivables from GEB through bill discounting with recourse. The potential effect on the Group as at December 31, 2004 if these financing arrangements are not settled by GEB is that GPEC would be required to pay HK$653 million (2003: HK$538 million). There is no recourse to the Group beyond GPEC from these arrangements and to date there has been no incident where recourse to GPEC has been necessary. |
The Directors are of the opinion that no provision is required to be made in the financial statements in respect of this matter.
| | (B) | In June 2004, Shandong Zhonghua Power Company, Ltd. completed refinancing its loans procured in 1998 with new term loan facilities. Formal release of the undertakings given by the Company under the previous facilities was obtained from the lenders in October 2004 and there was no undertaking required from the Group under the new arrangements. |
F-50
CLP HOLDINGS LIMITED
NOTES TO THE CONSOLIDATED FINANCIAL STATEMENTS
| 31. | RELATED PARTY TRANSACTIONS |
In the normal course of business, the Group undertakes on an arm’s length basis a wide variety of transactions with related parties. The more significant of such transactions during the year ended December 31, 2004 are described below:
| | (A) | Purchases of electricity |
| | | | | | |
| | | 2002
HK$M | | 2003
HK$M | | 2004
HK$M |
| | | |
Purchases of electricity from CAPCO (I) | | 10,191 | | 10,431 | | 10,923 |
Purchases of nuclear electricity (II) | | 4,976 | | 5,134 | | 4,763 |
Pumped storage service fee (III) | | 419 | | 308 | | 369 |
| | |
| |
| |
|
| | | 15,586 | | 15,873 | | 16,055 |
| | |
| |
| |
|
| | (I) | Under the Electricity Supply Contract between CLP Power Hong Kong and CAPCO, CLP Power Hong Kong is obliged to purchase all of CAPCO’s generating capacity. The Electricity Supply Contract provides that the price paid by CLP Power Hong Kong to CAPCO is sufficient to cover all of CAPCO’s operating expenses, including fuel cost, depreciation, interest expenses and current and deferred taxes, as well as CAPCO’s share of the return permitted under the SoC. |
| | (II) | Under the offtake and resale contracts, CLP Power Hong Kong is obliged to purchase the Group’s 25% equity share of the output from Guangdong Daya Bay Nuclear Power Station (GNPS) and an additional 45% of such output from Guangdong Nuclear Investment Company, Limited. The price paid by CLP Power Hong Kong for electricity generated by GNPS throughout the terms of the power purchase agreements is determined by a formula based on GNPS’s operating costs and a calculation of profits by reference to shareholders’ funds and the capacity factor for that year. |
| | (III) | Under a capacity purchase contract, Hong Kong Pumped Storage Development Company, Limited (PSDC) has the right to use 50% of the 1,200MW capacity of Phase 1 of the Guangzhou Pumped Storage Power Station. CLP Power Hong Kong has entered into a contract with PSDC to make use of this capacity. The price paid by CLP Power Hong Kong to PSDC is sufficient to cover all of PSDC’s operating expenses and net return. PSDC’s net return is based on a percentage of its net fixed assets in a manner analogous to the SoC. |
| | (B) | In accordance with the CAPCO Operating Service Agreement between CLP Power Hong Kong and CAPCO, CLP Power Hong Kong is responsible to CAPCO for the efficient and proper construction, commissioning, operation and maintenance of the electricity generating facilities of CAPCO. In return, CAPCO reimburses CLP Power Hong Kong for all costs incurred in performance of the agreement. The charges from CLP Power Hong Kong to CAPCO during the year amounted to HK$1,071 million (2003: HK$1,025 million) and a portion of the charges which is accounted for as operating expenses by CAPCO is covered under the Electricity Supply Contract referred to in (I) above. |
F-51
CLP HOLDINGS LIMITED
NOTES TO THE CONSOLIDATED FINANCIAL STATEMENTS
| 32. | FINANCIAL ASSISTANCE TO AFFILIATED COMPANIES AND THEIR PROFORMA COMBINED BALANCE SHEET (RULE 13.22 OF THE LISTING RULES) |
As at December 31, 2004, the Group had made loan and advances totaling HK$6,681 million to certain affiliated companies. Affiliated companies include the Group’s jointly controlled entities and associated companies. This amount exceeds 8% of the total assets of the Group. In accordance with Rule 13.22 of the Listing Rules, a proforma combined balance sheet of those affiliated companies with financial assistance from the Group and the Group’s attributable interest in those affiliated companies as at December 31, 2004 are presented below:
| | | | | | |
| | | Proforma
Combined
Balance Sheet
HK$M |
| | Group’s
Attributable
Interest
HK$M |
|
| | |
Non-current assets | | 29,191 | | | 11,836 | |
Current assets | | 1,648 | | | 665 | |
Current liabilities | | (4,100 | ) | | (1,657 | ) |
Non-current liabilities | | (9,958 | ) | | (4,022 | ) |
Shareholders’ loan and advances | | (16,316 | ) | | (6,681 | ) |
| | |
|
| |
|
|
| | | 465 | | | 141 | |
| | |
|
| |
|
|
The proforma combined balance sheet of the affiliated companies is prepared by combining their balance sheets, after making adjustments to conform with the Group’s significant accounting policies and regrouping into significant balance sheet classification, as at December 31, 2004.
On May 31, 2005, we, through our wholly-owned Australia subsidiary CLP Australia Energy Holdings Pty Limited, completed the purchase of 100% of the SPI Electricity & Gas Australia Holdings Pty Limited (“SPI E&G”), Singapore Power’s wholly-owned merchant energy business in Australia. Acquisition of Singapore Power’s interest in SPI Pipelines will occur separately if pre-emption rights are not exercised by other partners in the pipeline. Consideration for the entire acquisition (including the interest in SPI Pipelines) is A$2,128 million (HK$12,981 million).
Consideration for the acquisition was financed by a combination of CLP Group’s internal resources, additional borrowings at CLP Holdings and a new corporate finance facility in the amount of A$2.45 billion (on a non-recourse basis to CLP Holdings) to finance the balance of the consideration and re-finance existing facilities of Yallourn Energy.
F-52
CLP HOLDINGS LIMITED
NOTES TO THE CONSOLIDATED FINANCIAL STATEMENTS
| 34. | SUMMARY OF DIFFERENCES BETWEEN HONG KONG AND UNITED STATES GAAP |
The Group’s financial statements are prepared in accordance with Hong Kong GAAP. The significant differences applicable to the Group are described below and the adjustments considered necessary to reconcile the consolidated profit (“net income”) or shareholders’ funds (“shareholders’ equity”) in accordance with U.S. GAAP are shown in the following tables.
Retirement Scheme
Prior to 2002, under Hong Kong GAAP, the periodic charge to the Group’s financial statements for costs arising from a defined benefit retirement scheme was represented by the Group’s contributions to the scheme in a given period, determined by the Group with reference to independent actuarial valuations. Statement of Financial Accounting Standards (“SFAS”) No. 87 “Employers’ Accounting for Pensions” in the United States requires that the net periodic pension cost related to the employer’s liability under a defined benefit retirement scheme be determined by reference to changes in the actuarial valuation of the pension obligations of the scheme, fair value of the scheme’s assets, amortization of the amount of underfunded or overfunded projected benefit obligations at the time the accounting standard is adopted and amortization of additional projected benefits arising as a result of changes to the scheme.
On January 1, 2002, the Group adopted the new SSAP No. 34 “Employee Benefits”, which became effective for financial statements with periods beginning on or after January 1, 2002. On initial adoption of the new standard, the Group carried out an actuarial valuation indicating a surplus of employee retirement benefit plan assets over liabilities (“the surplus”) of HK$1,194 million. Management of the Group are of the opinion that the surplus is not taxable. The new SSAP No. 34 is broadly consistent with SFAS No. 87. The surplus upon initial adoption of the SSAP No. 34 has been recognized as a prior year adjustment against retained profits. Under U.S. GAAP, the retirement scheme asset at January 1, 2002 differs from this surplus due to the existence of unrecognized actuarial gains and losses; under U.S. GAAP such actuarial gains and losses are recognized over the average remaining active employee service period.
On December 31, 2002, the remaining members in the Group’s defined benefit programmes were transferred to the defined contribution programmes. At the same time, the Group obtained the relevant approvals in principle to enable the winding up of its defined benefit programmes. This represented a curtailment and settlement of the defined benefit programmes. Accordingly, all previously unrecognized gains and losses have been credited to the profit and loss account in 2002 under U.S. GAAP. The amount of tax provision made in prior years against the differences in periodic pension costs was also written back.
Depreciation of Leasehold Land
Prior to January 1, 2004, the Scheme of Control Agreement provided that leasehold land should be capitalized at unamortized cost. Under U.S. GAAP, such assets have always been amortized over the term of the lease. Commencing from January 1, 2004, leasehold land was amortized over the unexpired lease terms in accordance with the revision made in the 2003 Scheme of Control interim review. Following this treatment under Hong Kong GAAP is consistent with that under U.S. GAAP. Accordingly, a receivable under the Scheme of Control Agreement has been recorded at December 31, 2004 to reflect the fact that the amount previously debited to shareholders’ equity under U.S. GAAP is considered to be recoverable.
F-53
CLP HOLDINGS LIMITED
NOTES TO THE CONSOLIDATED FINANCIAL STATEMENTS
| 34. | SUMMARY OF DIFFERENCES BETWEEN HONG KONG AND UNITED STATES GAAP (continued) |
Derivatives and Hedging Activities
The Group engages in forward foreign exchange contracts, currency swaps and options and interest rate swaps to hedge the impact of foreign currency exposures and fluctuations in interest rates. Our subsidiary, Yallourn Energy, also uses energy-related derivative instruments to hedge the price risk of sales of electricity and the price risk of purchasing energy to satisfy retail sales contract obligations. The Group does not recognize such derivatives at fair value, nor does it account for the gains or losses relating to the fair value changes in these derivatives as this is not required under Hong Kong GAAP.
For U.S. GAAP purposes, before the implementation of SFAS No. 133, “Accounting for Derivative Instruments and Hedging Activities,” as amended by SFAS Nos. 137, 138 and 149 (collectively referred to here as “SFAS No. 133”), the Group generally included gains and losses on forward foreign exchange contracts in the profit and loss account, except for gains and losses on forward foreign exchange contracts that were accounted for as hedges of firm identifiable foreign currency commitments, which were deferred and recognized in the profit and loss account upon settlement of the related foreign currency commitment.
Effective January 1, 2001, the Group adopted SFAS No. 133, which requires the Group to recognize all qualifying derivatives on the balance sheet at fair value. The Group’s transition adjustment to implement SFAS No. 133 was a net after-tax increase of HK$6 million to accumulated other comprehensive loss. This transition adjustment was recognized as of January 1, 2001, as a cumulative effect of a change in accounting principle.
Certain derivative transactions, while providing economic hedges, do not qualify for hedge accounting under SFAS No. 133. For these derivatives, changes in fair values are recognized in the profit and loss account.
Changes in the fair value of derivatives that are designated and qualify as fair value hedges are recorded in the profit and loss account to offset changes in the fair value of the hedged assets or liabilities. Changes in the fair value of derivatives that are designated and qualify as cash flow hedges are recognized in other comprehensive income (loss) until the hedged items are recognized in earnings, at which point the cumulative gain (loss) previously recorded in other comprehensive income (loss) is transferred to the profit and loss account. As of December 31, 2004, the application of SFAS No. 133 to the Group resulted in the fair value of derivative contracts amounting to a liability of HK$1,452 million (2003 and 2002: a liability of HK$121 million and an asset of HK$370 million, respectively), with offsetting amounts of HK$1,621 million (2003: HK$339 million, 2002: HK$113 million) being charged to customers in accordance with the Scheme of Control and HK$249 million (2003: HK$301 million, 2002: HK$377 million) being credited to the carrying amount of a hedged liability. The remaining amount of HK$80 million (2003: HK$83 million, 2002: HK$120 million) was principally charged to other assets and liabilities, the profit and loss account and accumulated other comprehensive loss.
The Group’s share of changes in the fair value of derivatives of the jointly controlled entities and associated companies were also recognized in accordance with the requirements of the SFAS No. 133, resulting in a decrease in the Group’s share of the net assets of its jointly controlled entities and associated companies of HK$110 million (2003: HK$147 million, 2002: HK$229 million). Of this amount, cumulative charges of HK$69 million (2002 and 2003: HK$78 million) have been reflected in the profit and loss account and HK$41 million (2003: HK$69 million, 2002: HK$151 million) has been charged to accumulated other comprehensive loss.
F-54
CLP HOLDINGS LIMITED
NOTES TO THE CONSOLIDATED FINANCIAL STATEMENTS
| 34. | SUMMARY OF DIFFERENCES BETWEEN HONG KONG AND UNITED STATES GAAP (continued) |
Taxation
Prior to 2003, CLP Power Hong Kong and its jointly controlled generating company, Castle Peak Power Company Limited (CAPCO) (collectively referred to here as “SoC companies”), were required under the Scheme of Control Agreement to make full provision for deferred taxation arising from timing differences attributable to accelerated tax depreciation allowances computed using the rate ruling when the timing differences arose, with no adjustments made subsequently if tax rates changed. In the non-SoC companies, deferred taxation was accounted for at the current taxation rate in respect of timing differences between profit as computed for taxation purposes and profit as stated in the accounts to the extent that a liability or an asset was expected to be payable or recoverable in the foreseeable future.
In 2003, we have fully adopted the Hong Kong accounting standard SSAP No. 12 (Revised) “Income Taxes” (“SSAP No. 12”), which was effective for accounting periods commencing on or after January 1, 2003. The adoption of the SSAP No. 12 (Revised) represents a change in accounting policy, which has been applied retrospectively, resulting in an increase in reported net profit of HK$25 million for the year ended December 31, 2002. The revised SSAP No. 12 is consistent with U.S. GAAP in all material respects. On adoption of the SSAP No. 12 by CLP Power Hong Kong, a retrospective adjustment was made for the over-provision of deferred taxation due to tax rates changes in periods prior to 2002 with a corresponding adjustment made to creditors as, based on legal advice, it is considered that the effect of tax rate changes on deferred taxation will be payable or recoverable under the Scheme of Control. In 2003, a total amount of HK$187 million previously credited to shareholders’ equity under U.S. GAAP, which represented the best estimate of the GAAP differences at the time the adjustment was made, was reversed in the profit and loss account.
Investments in Equity Securities
Under Hong Kong GAAP, investments in equity securities which are held for an identified long-term purpose and that purpose is documented at the time of acquisition or change of purpose are considered as “investment securities” and should be carried at cost less any provision for impairment. Those not classified as investment securities should be classified as “other investments” and should be measured at fair value with unrealized gains and losses being charged to the profit and loss account. When securities are transferred between categories, the transfer should be accounted for at fair value at the date of transfer. Any gain or loss arising is recognized immediately in the profit and loss account.
For investments in equity securities that are classified as “available for sale” under U.S. GAAP, they are required to be reported at fair value with the unrealized gains and losses to be recognized in other comprehensive income. Impairments in the value of equity securities, other than temporary impairments, are reflected in the profit and loss account. Any subsequent recovery in the fair value of previously impaired securities is recorded in other comprehensive loss until the security is sold.
Amortization of Goodwill
Under Hong Kong GAAP, goodwill is required to be amortized over its useful life and the amount of negative goodwill not exceeding the fair values of acquired identifiable non-monetary assets is recognized as income on a systematic basis over the remaining weighted average useful life of the acquired identifiable depreciable or amortizable assets. If the goodwill is being amortized over more than 20 years, such goodwill will be subject to an annual impairment review even if there is no indication that it is impaired.
Under U.S. GAAP, goodwill is no longer amortized but subject to impairment test at least annually. SFAS No. 141 “Business Combinations” requires that negative goodwill first be allocated pro rata to reduce amounts assigned to the acquired assets excluding financial assets other than equity method investments, assets to be disposed of by sale, deferred income tax assets, prepaid assets related to pension or other post retirement benefit plans and any other current assets. Any excess is to be recognized as an extraordinary gain in the period in which the business combination is initially recognized.
F-55
CLP HOLDINGS LIMITED
NOTES TO THE CONSOLIDATED FINANCIAL STATEMENTS
| 34. | SUMMARY OF DIFFERENCES BETWEEN HONG KONG AND UNITED STATES GAAP (continued) |
Variable Interest Entities
Under U.S. GAAP, Financial Accounting Standards Board Interpretation No. 46 (revised)(“FIN 46R”) requires that certain VIE’s to be consolidated by their primary beneficiary. The primary beneficiary is a party that is subject to a majority of the risk of losses from the VIE activities, or entitled to receive a majority of the VIE’s residual returns, or both. An entity is subject to FIN 46R and is considered to be a VIE if it has (1) equity that is not sufficient to permit the entity to finance its activities without additional subordinated financial support from other parties, or (2) equity investors that cannot make significant decisions about the entity’s operations, or that do not absorb the expected losses or receive the expected returns of the entity, or (3) equity investors have voting rights that are not proportional to their obligations to absorb the expected losses or to receive the expected returns of the entity, and substantially all of the entity’s activities are conducted on behalf of an investor that has disproportionately few voting rights.
A Foreign Private Issuer must apply the provisions of FIN 46R to those entities considered as “special-purpose entities” on January 1, 2004, and to other entities no later than December 31, 2004. The Group has adopted FIN 46R for the current year and carried out assessment on our interest in CAPCO and other jointly controlled entities under the provisions of FIN 46R.
The Electricity Supply Contract between CLP Power, ExxonMobil and CAPCO stipulates that if the actual profit for the SoC business, when added to the amount available for transfer from the development fund, is less than the permitted return, the share of any deficit to be borne by CAPCO is limited to 20%. The remaining 80% is to be borne by CLP Power as the other party to the SoC Agreement. The shareholders of CAPCO, in their capacities as shareholders, are therefore sheltered from the losses of the company and, as such, CAPCO does meet the definition of a VIE as any shortfall in the expected return, which is deemed to be the permitted return, would be borne by CLP Power, consequently, CLP Power is considered to be the primary beneficiary of CAPCO. The Group is therefore required to consolidate CAPCO in the U.S. GAAP accounts. This does not have any impact on net income or shareholders’ funds, as CAPCO was previously accounted for using the equity method, but does result in the requirement to disclose a summary income statement and balance sheet prepared under U.S. GAAP. Under Hong Kong GAAP, our investment in CAPCO is accounted for using the equity method. Audited Hong Kong GAAP financial statements of CAPCO can be found on page F-64 to F-80. Our relationship with CAPCO is more fully described in Note 19 and Note 31.
F-56
CLP HOLDINGS LIMITED
NOTES TO THE CONSOLIDATED FINANCIAL STATEMENTS
| 34. | SUMMARY OF DIFFERENCES BETWEEN HONG KONG AND UNITED STATES GAAP (continued) |
Variable Interest Entities (continued)
The Group has consolidated CAPCO in the U.S. GAAP consolidated financial statements at December 31, 2004 in accordance with the provisions of FIN 46R. There was no impact on net income on consolidation of CAPCO under U.S. GAAP as CAPCO had previously been accounted for under the equity method. The income statement and balance sheet of the Group under Hong Kong GAAP and those prepared under U.S. GAAP, including the consolidation of CAPCO and other U.S. GAAP adjustments shown on F-59 to F-61 in 2004, are presented below:
| | | | | | | | | |
| | | Hong Kong
GAAP
2004
HK$M |
| | U.S.
GAAP
2004
HK$M |
| | U.S.
GAAP
2004
US$M |
|
| | | |
Turnover | | 30,784 | | | 30,784 | | | 3,961 | |
Operating expenses | | (22,894 | ) | | (17,209 | ) | | (2,213 | ) |
| | |
|
| |
|
| |
|
|
| | | 7,890 | | | 13,575 | | | 1,748 | |
Property disposal gain | | 214 | | | 214 | | | 28 | |
| | |
|
| |
|
| |
|
|
Operating profit | | 8,104 | | | 13,789 | | | 1,776 | |
Net finance costs | | (983 | ) | | (1,248 | ) | | (161 | ) |
Share of results of affiliates | | 3,604 | | | 1,854 | | | 237 | |
| | |
|
| |
|
| |
|
|
Profit before taxation | | 10,725 | | | 14,395 | | | 1,852 | |
Taxation | | (1,815 | ) | | (2,315 | ) | | (298 | ) |
| | |
|
| |
|
| |
|
|
Profit after taxation | | 8,910 | | | 12,080 | | | 1,554 | |
Transfers under Scheme of Control | | (296 | ) | | (296 | ) | | (38 | ) |
| | |
|
| |
|
| |
|
|
| | | 8,614 | | | 11,784 | | | 1,516 | |
Earnings attributable to non-controlling interest | | – | | | (2,491 | ) | | (320 | ) |
| | |
|
| |
|
| |
|
|
Net earnings | | 8,614 | | | 9,293 | | | 1,196 | |
| | |
|
| |
|
| |
|
|
| | | |
| | | Hong Kong
GAAP
2004
HK$M |
| | U.S.
GAAP
2004
HK$M |
| | U.S.
GAAP
2004
US$M |
|
| | | |
Current assets | | 6,383 | | | 7,457 | | | 959 | |
Fixed assets | | 57,748 | | | 83,231 | | | 10,709 | |
Investments in affiliates | | 16,638 | | | 10,257 | | | 1,320 | |
Other assets | | 30 | | | 3,859 | | | 496 | |
| | |
|
| |
|
| |
|
|
Total assets | | 80,799 | | | 104,804 | | | 13,484 | |
| | | |
Current liabilities(1) | | 9,678 | | | 13,192 | | | 1,697 | |
Term loans (long-term portion) | | 17,596 | | | 24,529 | | | 3,156 | |
Deferred taxation | | 5,084 | | | 7,938 | | | 1,021 | |
Other long-term liabilities | | 4,242 | | | 5,777 | | | 743 | |
Non-controlling interest | | – | | | 9,316 | | | 1,199 | |
Shareholders’ funds | | 44,199 | | | 44,052 | | | 5,668 | |
| | |
|
| |
|
| |
|
|
Total liabilities and shareholders’ funds | | 80,799 | | | 104,804 | | | 13,484 | |
| | |
|
| |
|
| |
|
|
| | (1) | Current liabilities include the current portion of term loans. |
F-57
CLP HOLDINGS LIMITED
NOTES TO THE CONSOLIDATED FINANCIAL STATEMENTS
| 34. | SUMMARY OF DIFFERENCES BETWEEN HONG KONG AND UNITED STATES GAAP (continued) |
New Accounting Pronouncements
FIN 47
In March 2005, the Financial Accounting Standards Board (“FASB”) issued Interpretation No. 47 (“FIN 47”), “Accounting for Conditional Asset Retirement Obligations”, an interpretation of SFAS No. 143, “Accounting for Asset Retirement Obligations”. FIN 47 clarifies that the term conditional asset retirement obligation, as used in SFAS No. 143, refers to a legal obligation to perform an asset retirement activity in which the timing and/or method of settlement are conditional on a future event that may or may not be within the control of the entity. This interpretation requires an entity to recognize a liability for the fair value of a conditional asset retirement obligation if the fair value of the liability can be reasonably estimated. It also clarifies when an entity would have sufficient information to reasonably estimate the fair value of an asset retirement obligation. FIN 47 is effective no later than the end of fiscal years ending after December 15, 2005 and December 31, 2005 for calendar year enterprises. We believe the adoption of FIN 47 does not have any significant impact on our financial position and results of operations.
SFAS No. 123 (Revised)
In December 2004, the FASB issued SFAS No. 123 (Revised) (“SFAS No. 123 (R)”) “Share-Based Payment”, which is a revision of SFAS No. 123 “Accounting for Stock-Based Compensation” and supersedes Accounting Principles Board Opinion No. 25 “Accounting for Stock Issued to Employees”. SFAS No. 123 (R) requires all share-based payments to employees, including grants of employee stock options, to be valued at fair value on the date of grant, and to be expensed over the applicable vesting period. SFAS No. 123 (R) is effective for all stock-based awards granted, modified, repurchased or cancelled in interim or annual periods beginning after June 15, 2005. We believe the adoption of SFAS No. 123 (R) does not have any significant impact on our financial position and results of operations.
F-58
CLP HOLDINGS LIMITED
NOTES TO THE CONSOLIDATED FINANCIAL STATEMENTS
| 34. | SUMMARY OF DIFFERENCES BETWEEN HONG KONG AND UNITED STATES GAAP (continued) |
Net Income and Shareholders’ Equity
The estimated effect of the significant adjustments to the net income and shareholders’ equity in accordance with U.S. GAAP is summarized below:
Net income
| | | | | | | | | | | | |
| | | 2002
HK$M |
| | 2003
HK$M |
| | 2004
HK$M |
| | 2004
US$M |
|
| | | | |
Profit for the year in accordance with Hong Kong GAAP, as restated | | 7,104 | | | 7,687 | | | 8,614 | | | 1,108 | |
Income tax adjustments | | (25 | ) | | – | | | – | | | – | |
| | |
|
| |
|
| |
|
| |
|
|
Profit for the year as previously stated in accordance with Hong Kong GAAP* | | 7,079 | | | 7,687 | | | 8,614 | | | 1,108 | |
Adjustments required under U.S. GAAP: | | | | | | | | | | | | |
Difference in periodic pension costs and curtailment gain | | 130 | | | – | | | – | | | – | |
Gain/(Loss) on change in fair value of derivatives | | (221 | ) | | 74 | | | 54 | | | 7 | |
Tax effect of the above adjustments | | 218 | | | (17 | ) | | (30 | ) | | (3 | ) |
Depreciation of leasehold land | | (216 | ) | | (54 | ) | | 652 | | | 84 | |
Deferred tax accounting | | 32 | | | (187 | ) | | – | | | – | |
Change in fair value of equity securities | | (27 | ) | | 31 | | | (4 | ) | | (1 | ) |
Amortization of goodwill | | 28 | | | (9 | ) | | 7 | | | 1 | |
| | |
|
| |
|
| |
|
| |
|
|
Net income for the year in accordance with U.S. GAAP | | 7,023 | | | 7,525 | | | 9,293 | | | 1,196 | |
| | |
|
| |
|
| |
|
| |
|
|
| | * | as modified in 2002 to comply with the Scheme of Control Agreement |
F-59
CLP HOLDINGS LIMITED
NOTES TO THE CONSOLIDATED FINANCIAL STATEMENTS
| 34. | SUMMARY OF DIFFERENCES BETWEEN HONG KONG AND UNITED STATES GAAP (continued) |
Net Income and Shareholders’ Equity (continued)
Shareholders’ equity
| | | | | | | | | |
| | | 2003
HK$M |
| | 2004
HK$M |
| | 2004
US$M |
|
| | | |
Shareholders’ funds in accordance with Hong Kong GAAP (Note) | | 40,241 | | | 44,199 | | | 5,687 | |
Cumulative adjustments required under U.S. GAAP: | | | | | | | | | |
Loss on change in fair value of derivatives accruing to customers | | (290 | ) | | (1,372 | ) | | (177 | ) |
Loss on change in fair value of hedged liabilities accruing to customers | | (50 | ) | | (249 | ) | | (32 | ) |
Amount accrued to customers | | 340 | | | 1,621 | | | 209 | |
Loss on change in fair value of derivatives | | 126 | | | (71 | ) | | (9 | ) |
Loss on change in fair value of hedged liabilities | | (251 | ) | | – | | | – | |
Tax effect of the above adjustments | | 27 | | | (3 | ) | | – | |
Depreciation of leasehold land | | (652 | ) | | (938 | ) | | (121 | ) |
Amount accrued to customers | | – | | | 938 | | | 121 | |
Change in fair value of equity securities | | 4 | | | – | | | – | |
Amortization of goodwill | | 19 | | | 26 | | | 3 | |
Transitional adjustment to other comprehensive income/(loss) on implementation of SFAS No. 133, net of tax of nil (2002: nil) | | (2 | ) | | – | | | – | |
Net change in fair value of derivatives to other comprehensive income/(loss) | | | | | | | | | |
- company and subsidiaries, net of tax of HK$23 million (2003: HK$13 million) | | (42 | ) | | (58 | ) | | (8 | ) |
- share of jointly controlled entities, net of tax of HK$nil (2003: HK$10 million) | | (69 | ) | | (41 | ) | | (5 | ) |
Net change in fair value of equity securities to other comprehensive income/(loss), net of tax of nil | | (4 | ) | | – | | | – | |
| | |
|
| |
|
| |
|
|
Shareholders’ equity in accordance with U.S. GAAP | | 39,397 | | | 44,052 | | | 5,668 | |
| | |
|
| |
|
| |
|
|
Note: For the year ended December 31, 2004, fixed assets includes land, buildings, plant, machinery and equipment with total cost and accumulated depreciation of HK$4,966 million (2003: HK$4,716 million) and HK$1,749 million (2003: HK$1,471 million) respectively, which would be classified as assets subject to operating leases under U.S. GAAP.
F-60
CLP HOLDINGS LIMITED
NOTES TO THE CONSOLIDATED FINANCIAL STATEMENTS
| 34. | SUMMARY OF DIFFERENCES BETWEEN HONG KONG AND UNITED STATES GAAP (continued) |
Cash Flow Statement
Under Hong Kong GAAP, cash flows from dividends received can be classified in a manner which is most appropriate to the business and the Group therefore classifies dividends received as investing cash flows. Hong Kong GAAP further allows bank overdrafts to be a component of cash and cash equivalents as it forms an integral part of the Group’s cash management. Under U.S. GAAP, dividends received should be classified as operating cash flows whereas bank overdrafts as financing activities. The U.S. GAAP cash flow for 2004 included CAPCO as a consolidated VIE under FIN 46R. The U.S. GAAP cash flow for 2002 and 2003 had included CAPCO as jointly controlled entity accounted for under the equity method. The consolidated cash flow data by operating, investing and financing activities in accordance with U.S. GAAP are summarized below:
| | | | | | | | | | | | |
| | | 2002 HK$M | | | 2003
HK$M | | | 2004
HK$M | | | 2004
US$M | |
Net cash provided/(used) by: | | | | | | | | | | | | |
Operating activities | | 10,922 | | | 10,102 | | | 16,920 | | | 2,177 | |
Investing activities | | (8,478 | ) | | (5,577 | ) | | (8,110 | ) | | (1,043 | ) |
Financing activities | | (2,008 | ) | | (4,287 | ) | | (7,165 | ) | | (922 | ) |
| | |
|
| |
|
| |
|
| |
|
|
(Decrease)/increase in cash and cash equivalents | | 436 | | | 238 | | | 1,645 | | | 212 | |
Cash and cash equivalents at beginning of year | | 80 | | | 516 | | | 787 | | | 101 | |
Effect of exchange rate changes | | – | | | 33 | | | 88 | | | 11 | |
| | |
|
| |
|
| |
|
| |
|
|
Cash and cash equivalents at end of year | | 516 | | | 787 | | | 2,520 | | | 324 | |
| | |
|
| |
|
| |
|
| |
|
|
F-61
CLP HOLDINGS LIMITED
SCHEME OF CONTROL STATEMENT
CLP Power Hong Kong Limited and Castle Peak Power Company Limited
Overview
In Hong Kong, CLP Power Hong Kong Limited (CLP Power Hong Kong) operates a vertically integrated electricity generation, transmission and distribution business. The generating plants in Hong Kong are owned by Castle Peak Power Company Limited (CAPCO), which is 40% owned by CLP Power Hong Kong and 60% owned by ExxonMobil Energy Limited. CLP Power Hong Kong builds and operates CAPCO’s power stations under contract and is the sole customer for CAPCO’s electricity which CLP Power Hong Kong transmits and distributes to its customers in Kowloon and the New Territories. CLP Power Hong Kong owns the transmission and distribution network.
Since the financial year 1964, the electricity-related operations of CLP Power Hong Kong and CAPCO (the SoC Companies) have been governed by a Scheme of Control (SoC) Agreement with the Hong Kong Government. The SoC specifies the SoC Companies’ obligations to supply adequate and reliable electricity supplies to customers at the lowest reasonable cost and the mechanism for the Government to monitor their financial affairs and operating performance. In return, CLP Power Hong Kong is allowed to charge tariffs designed to recover the operating costs (including tax) and allowed net return of the SoC Companies. The current agreement, which took effect from October 1, 1993, covers the period to September 30, 2008.
Permitted and Net Return
The permitted and net return that the SoC Companies are allowed under the SoC are calculated as follows:
| • | | The annual permitted return is 13.5% of the SoC Companies’ average net fixed assets relating to the electricity business in Hong Kong; plus a further 1.5% on the average net fixed assets financed by shareholders’ investments and acquired after September 30, 1978. |
| • | | Any difference between the permitted return and the profit for SoC operations is transferred to or from a Development Fund. The Development Fund does not form part of distributable shareholders’ funds and is, in effect, a liability owing to customers carried in CLP Power Hong Kong’s books. |
| • | | Four charges are deducted from the permitted return. First, shareholders of the SoC Companies pay interest up to a maximum of 8% per annum on borrowed capital arranged for financing fixed assets. Second, shareholders of CLP Power Hong Kong pay a charge of 8% per annum on the sum of the average balances of the Development Fund and special provision account. This charge is credited to a rate reduction reserve in CLP Power Hong Kong’s books and is applied as rebates to customers. By a Supplemental Agreement which took effect from October 1, 1998, two more charges have been introduced. Third, shareholders of the SoC Companies pay an excess capacity adjustment of 13.5% on the average excess capacity expenditure less an allowed interest charge up to 8% per annum on the average excess capacity expenditure. This excess capacity adjustment will only apply to additional generating units installed after the SoC Companies’ Black Point Units 7 and 8 are commissioned. Fourth, shareholders of CLP Power Hong Kong pay interest up to 8% per annum on the increase in average balance of the customers’ deposits in excess of the balance as at September 30, 1998. |
| • | | The net return is the permitted return less the deductions. The rate of return on average net fixed assets of the SoC Companies for the year ended December 31, 2004 was 13.05% (2003: 12.87%, 2002: 12.52%). |
The net return is divided between the SoC Companies in accordance with the provisions of the agreements between the SoC Companies and ExxonMobil International Holdings Inc. These provisions state that each company will receive that proportion of the total net return represented by the net return that company would receive if it were the only company under the SoC and the net return were calculated solely on the basis of its own accounts. In year 2004, 60% (2003: 59%, 2002: 58%) of the net return was allocated to CLP Power Hong Kong and 40% (2003: 41%, 2002: 42%) to CAPCO. If the actual profit for the SoC, when added to the amount available for transfer from the Development Fund is less than the permitted return, the share of any such deficit to be borne by CAPCO is limited to 20%.
F-62
CLP HOLDINGS LIMITED
SCHEME OF CONTROL STATEMENT
The calculations shown below are in accordance with the SoC and the agreements between the SoC Companies. The calculations are extracted from the audited accounts of CLP Power Hong Kong for the year ended December 31, 2004, upon which the auditors have expressed an unqualified opinion.
| | | | | | | | | | | | |
| | | Year ended December 31,
| |
| | | 2002 HK$M | | | 2003 HK$M | | | 2004 HK$M | | | 2004 US$M | |
| | | | |
SOC REVENUE | | 25,844 | | | 25,739 | | | 26,773 | | | 3,445 | |
| | |
|
| |
|
| |
|
| |
|
|
| | | | |
EXPENSES | | | | | | | | | | | | |
Operating costs | | 2,752 | | | 2,817 | | | 3,166 | | | 407 | |
Fuel | | 3,268 | | | 2,901 | | | 3,482 | | | 448 | |
Purchases of nuclear electricity | | 4,976 | | | 5,134 | | | 4,763 | | | 613 | |
Depreciation | | 3,164 | | | 3,439 | | | 3,452 | | | 444 | |
Deferral premium | | 96 | | | 494 | | | 176 | | | 23 | |
Operating interest | | 617 | | | 459 | | | 415 | | | 54 | |
Taxation | | 1,478 | | | 1,652 | | | 1,967 | | | 253 | |
| | |
|
| |
|
| |
|
| |
|
|
| | | 16,351 | | | 16,896 | | | 17,421 | | | 2,242 | |
| | |
|
| |
|
| |
|
| |
|
|
PROFIT AFTER TAXATION | | 9,493 | | | 8,843 | | | 9,352 | | | 1,203 | |
| | | | |
Interest on increase in customers’ deposits | | 1 | | | – | | | – | | | – | |
Interest on long-term financing | | 818 | | | 679 | | | 679 | | | 87 | |
Adjustments required under the SoC
(including share of profit on sale of electricity to the Chinese mainland attributable to the SoC Companies) | | (5 | ) | | 367 | | | 35 | | | 5 | |
| | |
|
| |
|
| |
|
| |
|
|
PROFIT FOR SOC | | 10,307 | | | 9,889 | | | 10,066 | | | 1,295 | |
| | | | |
Transfer to Development Fund | | (1,420 | ) | | (572 | ) | | (219 | ) | | (28 | ) |
| | |
|
| |
|
| |
|
| |
|
|
PERMITTED RETURN | | 8,887 | | | 9,317 | | | 9,847 | | | 1,267 | |
| | |
|
| |
|
| |
|
| |
|
|
DEDUCT INTEREST | | | | | | | | | | | | |
On increase in customers’ deposits | | 1 | | | – | | | – | | | – | |
On long-term financing as above | | 818 | | | 679 | | | 679 | | | 87 | |
On Development Fund and special provision account transferred to rate reduction reserve | | 319 | | | 287 | | | 253 | | | 33 | |
| | |
|
| |
|
| |
|
| |
|
|
| | | 1,138 | | | 966 | | | 932 | | | 120 | |
| | |
|
| |
|
| |
|
| |
|
|
NET RETURN | | 7,749 | | | 8,351 | | | 8,915 | | | 1,147 | |
| | |
|
| |
|
| |
|
| |
|
|
| | | | |
Divisible as follows: | | | | | | | | | | | | |
CLP Power Hong Kong | | 4,517 | | | 4,895 | | | 5,363 | | | 690 | |
CAPCO | | 3,232 | | | 3,456 | | | 3,552 | | | 457 | |
| | |
|
| |
|
| |
|
| |
|
|
| | | 7,749 | | | 8,351 | | | 8,915 | | | 1,147 | |
| | |
|
| |
|
| |
|
| |
|
|
| | | | |
CLP POWER HONG KONG’S SHARE OF NET RETURN | | | | | | | | | | | | |
CLP Power Hong Kong | | 4,517 | | | 4,895 | | | 5,363 | | | 690 | |
Interest in CAPCO | | 1,297 | | | 1,386 | | | 1,425 | | | 183 | |
| | |
|
| |
|
| |
|
| |
|
|
| | | 5,814 | | | 6,281 | | | 6,788 | | | 873 | |
| | |
|
| |
|
| |
|
| |
|
|
F-63
REPORT OF INDEPENDENT AUDITORS
To the Board of Directors and Shareholders of
Castle Peak Power Company Limited
We have audited the accompanying balance sheets of Castle Peak Power Company Limited as of December 31, 2003 and 2004, and the related profit and loss accounts, statements of changes in equity and cash flow statements for the years ended December 31, 2002, 2003 and 2004 which, as described in Note 2, have been prepared on the basis of accounting principles generally accepted in Hong Kong. These financial statements are the responsibility of the Company’s management. Our responsibility is to express an opinion on these financial statements based on our audits.
We conducted our audits in accordance with the standards of the Public Company Accounting Oversight Board (United States). Those standards require that we plan and perform the audit to obtain reasonable assurance about whether the financial statements are free of material misstatement. An audit includes examining, on a test basis, evidence supporting the amounts and disclosures in the financial statements. An audit also includes assessing the accounting principles used and significant estimates made by management, as well as evaluating the overall financial statement presentation. We believe that our audits provide a reasonable basis for our opinion.
In our opinion, the financial statements referred to above present fairly, in all material aspects, the financial position of Castle Peak Power Company Limited at December 31, 2003 and 2004, and the results of its operations and cash flows for the years ended December 31, 2002, 2003 and 2004 in conformity with accounting principles generally accepted in Hong Kong.
/s/ PricewaterhouseCoopers
PricewaterhouseCoopers
Certified Public Accountants
Hong Kong
June 3, 2005
F-64
CASTLE PEAK POWER COMPANY LIMITED
PROFIT AND LOSS ACCOUNTS
| | | | | | | | | | |
| | | | | Year ended December 31,
|
| | | Note | | 2002 | | 2003 | | 2004 | | 2004 |
| | | | | HK$M | | HK$M | | HK$M | | US$M |
| | | | | |
TURNOVER | | 3 | | 10,262 | | 10,523 | | 11,025 | | 1,418 |
| | | | |
| |
| |
| |
|
Expenses | | | | | | | | | | |
Fuel | | | | 3,268 | | 2,899 | | 3,480 | | 448 |
Operating costs | | | | 651 | | 660 | | 763 | | 98 |
Depreciation | | | | 1,442 | | 1,468 | | 1,583 | | 204 |
Deferral Premium | | 4 | | 96 | | 494 | | 175 | | 22 |
Staff costs | | | | 329 | | 339 | | 339 | | 43 |
| | | | |
| |
| |
| |
|
| | | | | 5,786 | | 5,860 | | 6,340 | | 815 |
| | | | |
| |
| |
| |
|
Operating profit | | 5 | | 4,476 | | 4,663 | | 4,685 | | 603 |
| | | | | |
Finance costs | | 6 | | 559 | | 385 | | 265 | | 34 |
| | | | |
| |
| |
| |
|
Profit before taxation | | | | 3,917 | | 4,278 | | 4,420 | | 569 |
| | | | | |
Taxation | | 7 | | 625 | | 746 | | 783 | | 101 |
| | | | |
| |
| |
| |
|
EARNINGS FOR THE YEAR | | | | 3,292 | | 3,532 | | 3,637 | | 468 |
| | | | |
| |
| |
| |
|
DIVIDENDS | | 8 | | 3,292 | | 3,532 | | 3,637 | | 468 |
| | | | |
| |
| |
| |
|
The accompanying notes are an integral part of the financial statements.
F-65
CASTLE PEAK POWER COMPANY LIMITED
BALANCE SHEETS
| | | | | | | | | | | |
| | | | | As of December 31,
| |
| | | Note | | 2003
HK$M | | | 2004
HK$M | | | 2004
US$M | |
CAPITAL EMPLOYED | | | | | | | | | | | |
Fixed assets | | 9 | | 27,449 | | | 27,467 | | | 3,534 | |
| | | | |
|
| |
|
| |
|
|
Current assets | | | | | | | | | | | |
Fuel and stores | | | | 441 | | | 571 | | | 73 | |
Sundry debtors and prepayments | | 10 | | 119 | | | 106 | | | 14 | |
Current account with CLP Power Hong Kong Limited | | 11 | | 976 | | | 914 | | | 118 | |
| | | | |
|
| |
|
| |
|
|
| | | | | 1,536 | | | 1,591 | | | 205 | |
| | | | |
|
| |
|
| |
|
|
Current liabilities | | | | | | | | | | | |
Bank loans and other borrowings | | 12(a) | | (2,759 | ) | | (2,901 | ) | | (373 | ) |
Creditors | | | | (1,423 | ) | | (775 | ) | | (100 | ) |
Taxation payable | | | | (166 | ) | | (239 | ) | | (31 | ) |
| | | | |
|
| |
|
| |
|
|
| | | | | (4,348 | ) | | (3,915 | ) | | (504 | ) |
| | | | |
|
| |
|
| |
|
|
Net current liabilities | | | | (2,812 | ) | | (2,324 | ) | | (299 | ) |
| | | | |
|
| |
|
| |
|
|
Total assets less current liabilities | | | | 24,637 | | | 25,143 | | | 3,235 | |
| | | | |
|
| |
|
| |
|
|
REPRESENTED BY | | | | | | | | | | | |
Share capital | | 13 | | 50 | | | 50 | | | 6 | |
Retained earnings | | | | – | | | – | | | – | |
Proposed dividend | | | | 478 | | | 391 | | | 51 | |
| | | | |
|
| |
|
| |
|
|
Shareholders’ funds | | | | 528 | | | 441 | | | 57 | |
| | | | |
|
| |
|
| |
|
|
Advances from shareholders | | 14 | | 14,271 | | | 15,171 | | | 1,952 | |
Long-term loans and other borrowings | | 12(b) | | 7,011 | | | 6,684 | | | 860 | |
Deferred taxation | | 15 | | 2,827 | | | 2,847 | | | 366 | |
| | | | |
|
| |
|
| |
|
|
| | | | | 24,109 | | | 24,702 | | | 3,178 | |
| | | | |
|
| |
|
| |
|
|
| | | | | 24,637 | | | 25,143 | | | 3,235 | |
| | | | |
|
| |
|
| |
|
|
The accompanying notes are an integral part of the financial statements.
F-66
CASTLE PEAK POWER COMPANY LIMITED
STATEMENTS OF CHANGES IN EQUITY
| | | | | | | | | | | |
| | | Share
Capital | | Retained
Profit | | | Total | | | Total | |
| | | HK$M | | HK$M | | | HK$M | | | US$M | |
| | | | |
Balance at January 1, 2002 | | 50 | | 404 | | | 454 | | | | |
Earnings for the year | | – | | 3,292 | | | 3,292 | | | | |
Dividends declared for the year | | | | | | | | | | | |
2001 final | | – | | (404 | ) | | (404 | ) | | | |
2002 interims | | – | | (2,914 | ) | | (2,914 | ) | | | |
| | |
| |
|
| |
|
| | | |
Balance at December 31, 2002 | | 50 | | 378 | (1) | | 428 | | | | |
| | |
| |
|
| |
|
| | | |
Balance at January 1, 2003 | | 50 | | 378 | | | 428 | | | | |
| | | | |
Earnings for the year | | – | | 3,532 | | | 3,532 | | | | |
Dividends declared for the year | | | | | | | | | | | |
2002 final | | – | | (378 | ) | | (378 | ) | | | |
2003 interims | | – | | (3,054 | ) | | (3,054 | ) | | | |
| | |
| |
|
| |
|
| | | |
Balance at December 31, 2003 | | 50 | | 478 | (2) | | 528 | | | | |
| | |
| |
|
| |
|
| | | |
Balance at January 1, 2004 | | 50 | | 478 | | | 528 | | | 68 | |
| | | | |
Earnings for the year | | – | | 3,637 | | | 3,637 | | | 468 | |
Dividends declared for the year | | | | | | | | | | | |
2003 final | | – | | (478 | ) | | (478 | ) | | (62 | ) |
2004 interims | | – | | (3,246 | ) | | (3,246 | ) | | (417 | ) |
| | |
| |
|
| |
|
| |
|
|
Balance at December 31, 2004 | | 50 | | 391 | (3) | | 441 | | | 57 | |
| | |
| |
|
| |
|
| |
|
|
Note
| (1) | The proposed final dividend at December 31, 2002 is HK$378 million. |
| (2) | The proposed final dividend at December 31, 2003 is HK$478 million. |
| (3) | The proposed final dividend at December 31, 2004 is HK$391 million. |
The accompanying notes are an integral part of the financial statements.
F-67
CASTLE PEAK POWER COMPANY LIMITED
CASH FLOW STATEMENTS
| | | | | | | | | | | | | | |
| | | | | Year ended December 31,
| |
| | | Note | | 2002
HK$M | | | 2003
HK$M | | | 2004
HK$M | | | 2004
US$M | |
OPERATING ACTIVITIES | | | | | | | | | | | | | | |
Cash generated from operations | | 16 | | 6,025 | | | 6,077 | | | 6,193 | | | 797 | |
Interest paid | | | | (685 | ) | | (556 | ) | | (411 | ) | | (53 | ) |
Hong Kong profits tax paid | | | | (681 | ) | | (694 | ) | | (690 | ) | | (89 | ) |
| | | | |
|
| |
|
| |
|
| |
|
|
NET CASH INFLOW FROM OPERATING ACTIVITIES | | | | 4,659 | | | 4,827 | | | 5,092 | | | 655 | |
| | | | |
|
| |
|
| |
|
| |
|
|
INVESTING ACTIVITIES | | | | | | | | | | | | | | |
Capital expenditure | | | | (777 | ) | | (1,513 | ) | | (2,075 | ) | | (267 | ) |
Proceeds from disposal of fixed assets | | | | 10 | | | 27 | | | 1 | | | – | |
| | | | |
|
| |
|
| |
|
| |
|
|
NET CASH OUTFLOW FROM INVESTING ACTIVITIES | | | | (767 | ) | | (1,486 | ) | | (2,074 | ) | | (267 | ) |
| | | | |
|
| |
|
| |
|
| |
|
|
NET CASH INFLOW BEFORE FINANCING ACTIVITIES | | | | 3,892 | | | 3,341 | | | 3,018 | | | 388 | |
| | | | |
|
| |
|
| |
|
| |
|
|
FINANCING ACTIVITIES | | | | | | | | | | | | | | |
Net drawdown of shareholders’ advances | | | | 1,459 | | | 2,129 | | | 895 | | | 115 | |
Net repayment of bank loans and other borrowings | | | | (2,033 | ) | | (2,038 | ) | | (190 | ) | | (24 | ) |
Dividends paid | | | | (3,318 | ) | | (3,432 | ) | | (3,723 | ) | | (479 | ) |
| | | | |
|
| |
|
| |
|
| |
|
|
NET CASH OUTFLOW FROM FINANCING ACTIVITIES | | | | (3,892 | ) | | (3,341 | ) | | (3,018 | ) | | (388 | ) |
| | | | |
|
| |
|
| |
|
| |
|
|
Movement in cash and cash equivalents | | | | – | | | – | | | – | | | – | |
| | | | | |
Cash and cash equivalents at beginning of the year | | | | – | | | – | | | – | | | – | |
| | | | |
|
| |
|
| |
|
| |
|
|
CASH AND CASH EQUIVALENTS AT END OF YEAR | | | | – | | | – | | | – | | | – | |
| | | | |
|
| |
|
| |
|
| |
|
|
Analysis of cash and cash equivalents | | | | | | | | | | | | | | |
Bank balances | | | | – | | | – | | | – | | | – | |
| | | | |
|
| |
|
| |
|
| |
|
|
The accompanying notes are an integral part of the financial statements.
F-68
CASTLE PEAK POWER COMPANY LIMITED
NOTES TO FINANCIAL STATEMENTS
| 1. | BASIS OF PREPARATION OF ACCOUNTS |
The accounts have been prepared under the historical cost convention, in accordance with accounting principles generally accepted in Hong Kong and comply with accounting standards issued by the Hong Kong Institute of Certified Public Accountants.
The current Scheme of Control will expire in 2008. The accounts have been prepared on the basis that there will be no material changes to the current Scheme of Control in the foreseeable future.
| 2. | SIGNIFICANT ACCOUNTING POLICIES |
The financial operations of the Company (CAPCO) and CLP Power Hong Kong Limited (CLP Power), together called “the Companies”, are governed by a Scheme of Control Agreement (the Scheme) entered into with the Government of the Hong Kong Special Administrative Region (the Government of the HKSAR) and by other agreements entered into by CLP Power, CAPCO and ExxonMobil International Holdings Inc.
The main features of the Scheme of Control are as follows:-
| | (i) | The Scheme is to be applicable to the electricity-related activities of the Companies excluding those associated with export sales of electricity in accordance with the separate arrangement between the Companies and the Government of the HKSAR. |
| | (ii) | CAPCO is to construct and operate generating facilities and sell power exclusively to CLP Power. |
| | (iii) | The annual permitted return is to be the sum of: |
| | - | 13.5% of the average net fixed assets of the Companies, and |
| | - | a further 1.5% on any average net fixed assets financed by shareholders’ investments and acquired after September 30, 1978, as defined in the Scheme. |
| | (iv) | Any difference between the permitted return and the profit for Scheme of Control is to be transferred to or from a development fund. The balance of the development fund represents a liability in the accounts of CLP Power. |
F-69
CASTLE PEAK POWER COMPANY LIMITED
NOTES TO FINANCIAL STATEMENTS
| 2. | SIGNIFICANT ACCOUNTING POLICIES (continued) |
| | A. | Scheme of Control (continued) |
| | (v) | The following are to be deducted from the permitted return: |
| | - | a charge of 8% per annum on the sum of the average balances of the development fund and special provision account, such charge to be credited to a rate reduction reserve in the accounts of CLP Power to be applied as rebates to customers; |
| | - | interest payable, up to a maximum of 8% per annum, on borrowed capital for financing of fixed assets; |
| | - | an excess capacity adjustment which will only apply to additional generating unit installed after the Companies’ Black Point Units 7 and 8 are commissioned; and |
| | - | interest on the increase in deposits from CLP Power’s customers, which represents the average of opening and closing balances of customers’ deposits for any year in excess of the balance as at September 30, 1998 up to a rate of 8% per annum. |
| | (vi) | The net return, being the permitted return less the deductions, is to be divided in accordance with the provisions of the agreements between the Companies and ExxonMobil International Holdings Inc. (where the Scheme profit, when added to the amount available for transfer from the development fund, is less than the permitted return, the share of any such deficit to be borne by the Company is to be limited to 20%). |
| | (vii) | The records of the development fund, the special provision account, the rate reduction reserve and customers’ deposits are to be maintained in the accounts of CLP Power. |
| | B. | Non Scheme of Control activities |
Commencing October 1, 1991 the Company is entitled to 60% of the profit allowed to the Companies derived from the sale of electricity by CLP Power to customers located in the Chinese mainland, in accordance with the arrangement agreed between the Companies and the Government of the HKSAR.
These are valued at the lower of cost and net realizable value. The cost of fuel oil is measured on the ‘first-in, first-out’ basis. Coal and stores are measured on the weighted average basis.
Turnover mainly represents sale of electricity to CLP Power under the terms of the Scheme, together with the Company’s share of profit on the sale of electricity by CLP Power to customers located in the Chinese mainland. Turnover is recognized when it is paid or becomes payable by CLP Power to the Company in accordance with the agreements referred to in Notes 2 (A) and (B) above.
F-70
CASTLE PEAK POWER COMPANY LIMITED
NOTES TO FINANCIAL STATEMENTS
| 2. | SIGNIFICANT ACCOUNTING POLICIES (continued) |
| | E. | Fixed assets and depreciation |
Fixed assets are stated at cost less accumulated depreciation. Major renewals and improvements which will result in future economic benefits, in excess of the originally assessed standard of performance of the existing assets, are capitalized, while maintenance and repair costs are normally charged to the profit and loss account in the year in which they are incurred.
Depreciation of fixed assets is based on the rates authorized under the Scheme of Control, which reflect the pattern in which the assets’ economic benefits are consumed. During the 2003 Scheme of Control interim review, the economic lives of certain fixed assets were reviewed and agreement was reached with the Government of the HKSAR to extend the useful lives of the following fixed assets with effect from January 1, 2004:
| | | | |
| | | Original Life
| | Revised Life
|
Buildings | | 33 years | | 35 years |
Cable tunnels | | 33 years | | 100 years |
Switchgear and transformers | | 25 years | | 35 years |
Meters | | 10 years | | 15 years |
Leasehold land | | not depreciable | | unexpired terms of the leases |
| | (i) | In respect of the fixed assets commissioned before January 1, 2004, the net book value as at December 31, 2003 of each individual asset is being written off uniformly over its remaining revised useful life as set out in (iii) below. The net increase in depreciation charge as a result of such changes for the year ended December 31, 2004 was HK$24 million. |
| | (ii) | Fixed assets acquired on or after January 1, 2004 are depreciated on a straight-line basis over their useful lives as set out in (iii) below commencing from the date of commissioning. |
| | (iii) | Useful lives of fixed assets |
| | |
Leasehold land | | unexpired terms of the leases |
Buildings | | 35 years |
Switchgear and transformers | | 35 years |
Generating plant | | 25 years |
Meters | | 15 years |
System control equipment, furniture, tools, communication and office equipment | | 10 years |
Computers and office automation equipment other than those forming part of the generating plant | | 5 years |
Motor vehicles | | 5 years |
The gain or loss on disposal of a fixed asset is the difference between the net sales proceeds and the carrying amount of the relevant asset, and is recognized in the profit and loss account.
F-71
CASTLE PEAK POWER COMPANY LIMITED
NOTES TO FINANCIAL STATEMENTS
| 2. | SIGNIFICANT ACCOUNTING POLICIES(continued) |
Deferred taxation is provided in full, using the liability method, on temporary differences arising between the tax bases of assets and liabilities and their carrying amounts in the accounts. Taxation rates enacted or substantially enacted by the balance sheet date are used to determine deferred taxation.
Interest on borrowed capital arranged to finance the acquisition, construction or production of a fixed asset is:
| | (i) | incorporated in capital expenditure during the period of time that is required to complete and prepare the assets for its intended use; and |
| | (ii) | charged to operating costs when incurred after commissioning. |
Monetary assets and liabilities denominated in foreign currency are translated into Hong Kong Dollars at the rates of exchange prevailing at the balance sheet date, or at the relevant forward contract rates where applicable. Transactions during the year are converted into Hong Kong Dollars at the rates of exchange ruling at the dates of the transactions.
All unrealized exchange differences arising from long-term borrowings and shareholders’ advances are deferred in accordance with the treatment stipulated under the Scheme of Control. All other unrealized and all realized exchange differences are credited or debited to the Profit and Loss Account.
Related parties are individuals and companies, where the individual or company has the ability, directly or indirectly, to control the other party or exercise significant influence over the other party in making financial and operating decisions. Parties are also considered to be related if they are subject to common control or common significant influence.
| | J. | Translation of 2004 Financial Statements to United States Dollars (“US Dollars”) |
The financial statements are expressed in Hong Kong Dollars (“HK Dollars”). Solely for the convenience of the reader, the 2004 financial statements have been translated into US Dollars at the specified rate below. These translations should not be construed as representations that the HK Dollars amounts actually represent such US Dollars amounts or could be converted into US Dollars at the rate indicated. The translation of HK Dollars into US Dollars has been made at the rate of HK$7.7723 to US$1.00, which was the noon buying rate in New York City for cable transfers in HK Dollars as certified for customs purposes by the Federal Reserve Bank of New York on December 31, 2004.
F-72
CASTLE PEAK POWER COMPANY LIMITED
NOTES TO FINANCIAL STATEMENTS
Turnover comprises:
| | | | | | |
| | | 2002 | | 2003 | | 2004 |
| | | HK$M | | HK$M | | HK$M |
| | | |
Sale of electricity to CLP Power | | 10,191 | | 10,431 | | 10,923 |
Share of profit on the sale of electricity by CLP Power to customers in the Chinese mainland | | 71 | | 92 | | 102 |
| | |
| |
| |
|
| | | 10,262 | | 10,523 | | 11,025 |
| | |
| |
| |
|
Deferral Premium was a contractual obligation that corresponded to additional costs incurred by the vendors for deferred delivery of the two generator units (units 7 and 8) in Black Point Power Station.
| | | | | | |
| | | 2002 | | 2003 | | 2004 |
| | | HK$M | | HK$M | | HK$M |
| | | |
Operating profit is stated after charging the following: | | | | | | |
Depreciation | | | | | | |
Leasehold land | | – | | – | | 63 |
Buildings | | 261 | | 263 | | 239 |
Generation and other equipment | | 1,181 | | 1,205 | | 1,281 |
| | |
| |
| |
|
| | | 1,442 | | 1,468 | | 1,583 |
| | | |
Loss on disposal of fixed assets | | 83 | | 40 | | 81 |
Directors’ remuneration | | | | | | |
- fees | | 1 | | 1 | | 1 |
- other emoluments | | – | | – | | – |
Auditors’ remuneration | | 1 | | 1 | | 1 |
| | |
| |
| |
|
F-73
CASTLE PEAK POWER COMPANY LIMITED
NOTES TO FINANCIAL STATEMENTS
| | | | | | |
| | | 2002 | | 2003 | | 2004 |
| | | HK$M | | HK$M | | HK$M |
Interest on bank loans and overdrafts | | 502 | | 368 | | 394 |
Interest on other loans | | 142 | | 74 | | 16 |
Interest on short-term bank loans for fuel stock financing | | 5 | | 4 | | 2 |
| | |
| |
| |
|
| | | 649 | | 446 | | 412 |
| | | |
Finance charges | | 20 | | 16 | | 2 |
Exchange loss/(gain) | | 17 | | 21 | | (7) |
Less: Amount Capitalized | | (122) | | (94) | | (140) |
Fuel stock interest included in fuel expenses | | (5) | | (4) | | (2) |
| | |
| |
| |
|
| | | 559 | | 385 | | 265 |
| | |
| |
| |
|
| | | | | | |
| | | 2002 | | 2003 | | 2004 |
| | | HK$M | | HK$M | | HK$M |
Taxation in the profit and loss account represents: | | | | | | |
| | | |
Current taxation | | | | | | |
Hong Kong profits tax | | 650 | | 700 | | 763 |
| | | |
Deferred taxation (Note 15) | | | | | | |
(Write back)/Provision for the year | | (25) | | 46 | | 20 |
| | |
| |
| |
|
| | | 625 | | 746 | | 783 |
| | |
| |
| |
|
The taxation on the Company’s profit before taxation differs from the theoretical amount that would arise using the Hong Kong profits tax rate as follows:
| | | | | | |
| | | 2002 | | 2003 | | 2004 |
| | | HK$M | | HK$M | | HK$M |
| | | |
Profit before taxation | | 3,917 | | 4,278 | | 4,420 |
| | |
| |
| |
|
Calculated at a taxation rate of 17.5% (2002: 16%; 2003: 17.5%) | | 626 | | 749 | | 773 |
Expenses not deductible for taxation purposes | | (1) | | (3) | | 10 |
| | |
| |
| |
|
| | | 625 | | 746 | | 783 |
| | |
| |
| |
|
| | | | | | |
| | | 2002 | | 2003 | | 2004 |
| | | HK$M | | HK$M | | HK$M |
| | | |
Interim dividends paid | | 2,914 | | 3,054 | | 3,246 |
Proposed final dividend | | 378 | | 478 | | 391 |
| | |
| |
| |
|
| | | 3,292 | | 3,532 | | 3,637 |
| | |
| |
| |
|
F-74
CASTLE PEAK POWER COMPANY LIMITED
NOTES TO FINANCIAL STATEMENTS
| | | | | | | | | | | | | | | | | |
| | | Medium
term
leasehold
land in Hong Kong | | Buildings | | | Generation
equipment | | | Other
equipment
and
vehicles | | | Equipment
awaiting
installation | | | Total | |
| | | HK$M | | HK$M | | | HK$M | | | HK$M | | | HK$M | | | HK$M | |
| | | | | | |
Cost | | | | | | | | | | | | | | | | | |
As at January 1, 2003 | | 2,749 | | 9,468 | | | 29,571 | | | 262 | | | 1,196 | | | 43,246 | |
Additions | | – | | 121 | | | 1,937 | | | 44 | | | 46 | | | 2,148 | |
Transfers and disposals | | – | | (20 | ) | | (180 | ) | | (6 | ) | | (3 | ) | | (209 | ) |
| | |
| |
|
| |
|
| |
|
| |
|
| |
|
|
As at December 31, 2003 | | 2,749 | | 9,569 | | | 31,328 | | | 300 | | | 1,239 | | | 45,185 | |
Additions | | – | | 78 | | | 1,473 | | | 25 | | | 107 | | | 1,683 | |
Transfers and disposals | | – | | (30 | ) | | (244 | ) | | (26 | ) | | – | | | (300 | ) |
| | |
| |
|
| |
|
| |
|
| |
|
| |
|
|
As at December 31, 2004 | | 2,749 | | 9,617 | | | 32,557 | | | 299 | | | 1,346 | | | 46,568 | |
| | | | | | |
Accumulated depreciation | | | | | | | | | | | | | | | | | |
As at January 1, 2003 | | – | | 3,615 | | | 12,472 | | | 185 | | | 138 | | | 16,410 | |
Charge for the year | | – | | 264 | | | 1,115 | | | 16 | | | 73 | | | 1,468 | |
Transfers and disposals | | – | | (11 | ) | | (125 | ) | | (5 | ) | | (1 | ) | | (142 | ) |
| | |
| |
|
| |
|
| |
|
| |
|
| |
|
|
As at December 31, 2003 | | – | | 3,868 | | | 13,462 | | | 196 | | | 210 | | | 17,736 | |
| | | | | | |
Charge for the year | | 63 | | 239 | | | 1,184 | | | 19 | | | 78 | | | 1,583 | |
Transfers and disposals | | – | | (9 | ) | | (184 | ) | | (25 | ) | | – | | | (218 | ) |
| | |
| |
|
| |
|
| |
|
| |
|
| |
|
|
As at December 31, 2004 | | 63 | | 4,098 | | | 14,462 | | | 190 | | | 288 | | | 19,101 | |
| | | | | | |
Net book value | | | | | | | | | | | | | | | | | |
As at December 31, 2004 | | 2,686 | | 5,519 | | | 18,095 | | | 109 | | | 1,058 | | | 27,467 | |
| | |
| |
|
| |
|
| |
|
| |
|
| |
|
|
As at December 31, 2003 | | 2,749 | | 5,701 | | | 17,866 | | | 104 | | | 1,029 | | | 27,449 | |
| | |
| |
|
| |
|
| |
|
| |
|
| |
|
|
Included in fixed assets is plant under construction, the net book value of which at December 31, 2004 is HK$4,937 million (2003: HK$4,480 million).
F-75
CASTLE PEAK POWER COMPANY LIMITED
NOTES TO FINANCIAL STATEMENTS
| 10. | SUNDRY DEBTORS AND PREPAYMENTS |
Included in sundry debtors and prepayments was a receivable of HK$75 million (2003: HK$75 million), representing the additional amount of deferred taxation recognized due to temporary differences and tax rate changes from 16% to 17.5% in 2003.
| 11. | CURRENT ACCOUNT WITH CLP POWER HONG KONG LIMITED |
The amount due from CLP Power mainly represents sales of electricity for the month of December 2004, to be settled in the following month.
| 12. | BANK LOANS AND OTHER BORROWINGS |
| | | | | | | | | | |
| | | | | Note | | 2003 | | | 2004 | |
| | | | | | | HK$M | | | HK$M | |
| | | | |
(a) | | Amount included in current liabilities | | | | | | | | |
| | | Short-term bank loans | | 12(c) | | 1,116 | | | 1,235 | |
| | | Current portion of long-term liabilities | | | | | | | | |
| | | Bank loans | | | | 1,592 | | | 1,615 | |
| | | Other borrowings | | | | 51 | | | 51 | |
| | | | | | |
|
| |
|
|
| | | | | | | 1,643 | | | 1,666 | |
| | | | | | |
|
| |
|
|
| | | | | | | 2,759 | | | 2,901 | |
| | | | | | |
|
| |
|
|
(b) | | Amounts shown as long-term loans and other borrowings | | | | | | | | |
| | | Bank loans | | | | | | | | |
| | | Wholly repayable within 5 years | | | | 4,030 | | | 2,805 | |
| | | Not wholly repayable within 5 years | | | | 4,418 | | | 5,390 | |
| | | | | | |
|
| |
|
|
| | | | | 12(c) | | 8,448 | | | 8,195 | |
| | | | | | |
|
| |
|
|
| | | Other borrowings | | | | | | | | |
| | | Wholly repayable within 5 years | | 12(d) | | 206 | | | 155 | |
| | | | | | |
|
| |
|
|
| | | | | | | 8,654 | | | 8,350 | |
| | | Current portion of long-term liabilities | | | | (1,643 | ) | | (1,666 | ) |
| | | | | | |
|
| |
|
|
| | | | | | | 7,011 | | | 6,684 | |
| | | | | | |
|
| |
|
|
F-76
CASTLE PEAK POWER COMPANY LIMITED
NOTES TO FINANCIAL STATEMENTS
| 12. | BANK LOANS AND OTHER BORROWINGS (continued) |
| | (c) | The total bank loan balances of HK$9,430 million as at December 31, 2004 (2003: HK$9,564 million) comprised of: |
| | i) | Export Credit Agencies (ECA) loans of HK$1,099 million (2003: HK$1,312 million) relating to the purchase of fixed assets with interest rate of 7.16% per annum (2003: 7.16% per annum); |
| | ii) | fixed rate bank loans of HK$5,755 million (2003: HK$4,904 million) with interest rates after swap ranged from 4.37% to 6.13% per annum (2003: 4.37% to 6.13% per annum); and |
| | iii) | variable rate loans of HK$2,576 million (2003: HK$3,348 million). |
| | (d) | Other borrowings represent: |
| | | | |
| | | 2003
HK$M | | 2004
HK$M |
Private Placement | | | | |
On a 15-year amortizing basis | | 206 | | 155 |
| | |
| |
|
| | | | |
| | | 2003
HK$M | | 2004
HK$M |
Authorized: | | | | |
1,000,000 (2003: 1,000,000) shares of HK$100 each | | 100 | | 100 |
| | |
| |
|
Issued and fully paid: | | | | |
500,000 (2003: 500,000) shares of HK$100 each | | 50 | | 50 |
| | |
| |
|
| 14. | ADVANCES FROM SHAREHOLDERS |
| | | | |
| | | 2003
HK$M | | 2004
HK$M |
| | |
ExxonMobil Energy Limited | | 8,503 | | 9,056 |
CLP Power | | 5,768 | | 6,115 |
| | |
| |
|
| | | 14,271 | | 15,171 |
| | |
| |
|
The advances are unsecured, interest free and have no fixed terms of repayment, except for advances totaling of HK$78 million from CLP Power, which represent a special loan repayable in full on September 30, 2008.
F-77
CASTLE PEAK POWER COMPANY LIMITED
NOTES TO FINANCIAL STATEMENTS
Deferred taxation is calculated in full on temporary differences under the liability method using the taxation rate enacted at the balance sheet date of 17.5% (2003: 17.5%). The deferred taxation charge for the year was mainly attributable to accelerated taxation depreciation.
The movement on the deferred tax liabilities account is as follows:
| | | | |
| | | 2003
HK$M | | 2004
HK$M |
| | |
As at January 1 (a) | | 2,540 | | 2,827 |
Effect of change in tax rate (b) | | 241 | | – |
Charged to profit and loss account (Note 7) | | 46 | | 20 |
| | |
| |
|
As at December 31 | | 2,827 | | 2,847 |
| | |
| |
|
| | (a) | Prior to 2003, the Company recognized deferred taxation arising from timing differences attributable to accelerated depreciation at the profits tax rate in force in the year in which the differences arose. Statement of Standard Accounting Practice (“SSAP”) No.12 (Revised) “Income Taxes” requires the provision of deferred taxation on temporary differences between the tax bases of assets and liabilities and their carrying amounts in the accounts using the profits tax rate enacted, or substantively enacted, at the balance sheet date. On adoption of SSAP No.12 (Revised) in 2003, the deferred tax liabilities at January 1, 2003 was restated and resulted in a decrease of HK$166 million to account for the over-provision of deferred taxation due to the tax rates changes and temporary differences in prior periods with a corresponding adjustment made to creditors. |
| | (b) | As a result of the increase in the profits tax rate from 16% to 17.5% and change in temporary differences in 2003, additional deferred taxation of HK$241 million was recognized. The Company believes that such amount will be recoverable from the Scheme of Control. The corresponding movement of HK$241 million has resulted in a net receivable of HK$75 million being recognized (Note 10). |
F-78
CASTLE PEAK POWER COMPANY LIMITED
NOTES TO FINANCIAL STATEMENTS
| 16. | RECONCILIATION OF PROFIT BEFORE TAXATION TO CASH GENERATED FROM OPERATIONS |
| | | | | | | | | |
| | | 2002
HK$M | | | 2003
HK$M | | | 2004
HK$M | |
| | | |
Profit before taxation | | 3,917 | | | 4,278 | | | 4,420 | |
Adjustment for: | | | | | | | | | |
Finance costs | | 559 | | | 385 | | | 265 | |
| | |
|
| |
|
| |
|
|
Operating Profit | | 4,476 | | | 4,663 | | | 4,685 | |
Adjustment for: | | | | | | | | | |
Loss on disposal of fixed assets | | 83 | | | 40 | | | 81 | |
Depreciation | | 1,442 | | | 1,468 | | | 1,583 | |
Other financing costs | | (23 | ) | | (20 | ) | | 8 | |
| | |
|
| |
|
| |
|
|
Operating profit before working capital changes | | 5,978 | | | 6,151 | | | 6,357 | |
| | | |
Increase in fuel and stores | | (35 | ) | | (14 | ) | | (130 | ) |
Decrease/(Increase) in sundry debtors and prepayments | | 1 | | | (29 | ) | | 14 | |
(Increase)/Decrease in current account with CLP Power | | (23 | ) | | (134 | ) | | 61 | |
Increase/(Decrease) in creditors | | 104 | | | 103 | | | (109 | ) |
| | |
|
| |
|
| |
|
|
Cash generated from operations | | 6,025 | | | 6,077 | | | 6,193 | |
| | |
|
| |
|
| |
|
|
| 17. | INTEREST RATE SWAP CONTRACTS |
As at December 31, 2004, the Company had two interest rate swap contracts outstanding under which the Company pays fixed rate and receives floating rate interest. These contracts have a principal amount of HK$4,378 million (2003: HK$4,548 million) and their effective interest rates for interest payments due from 2005 to 2012 are 4.37% and 4.70% respectively.
| | (a) | Capital expenditure authorized by the Board and not provided in the accounts at December 31, 2004 amounted to HK$2,216 million (2003: HK$2,989 million). Of this amount, contracts had been entered into at December 31, 2004 for HK$233 million (2003: HK$900 million). No forward exchange contracts have been arranged for settlement of these contracts (2003: Nil). |
| | (b) | Natural gas for the Black Point Power Station is purchased by the Company on a take-or-pay basis pursuant to a 20-year contract which commenced in January 1996. The prices for the gas are determined by reference to a base price adjusted annually according to certain market and economic indices. |
F-79
CASTLE PEAK POWER COMPANY LIMITED
NOTES TO FINANCIAL STATEMENTS
| 19. | RELATED PARTY TRANSACTIONS |
The following is a summary of significant related party transactions between the Company and CLP Power, in addition to those disclosed in Notes 11 and 14, which were carried out in the normal course of business during the year ended December 31, 2004:
| | | | | | |
| | | 2002
HK$M | | 2003
HK$M | | 2004
HK$M |
| | | |
Sale of electricity to CLP Power (a) | | 10,191 | | 10,431 | | 10,923 |
| | | |
Costs reimbursed to CLP Power (b) | | 970 | | 1,025 | | 1,071 |
| | (a) | The Company sells electricity to CLP Power (Note 3) at cost plus profit calculated in accordance with the Scheme. CLP Power owns a 40% share in the Company. |
| | (b) | In accordance with the Operating Service Agreement between CLP Power and the Company, CLP Power is responsible to the Company for the efficient and proper construction, commissioning, operation and maintenance of the electricity generating facilities of the Company. In return, the Company reimburses CLP Power for all costs incurred in performance of the agreement. The portion of the amount recharged by CLP Power which is accounted for as operating expenses by the Company is covered under the electricity sales in (a) above. |
The principal activity of the Company is the generation and sale of electricity to CLP Power.
| 21. | ULTIMATE HOLDING COMPANY |
The Company is 60% owned by ExxonMobil Energy Limited and 40% owned by CLP Power which is responsible for the Company’s day to day operations. The ultimate holding company of ExxonMobil Energy Limited is Exxon Mobil Corporation, a company incorporated in the United States of America. The ultimate holding company of CLP Power is CLP Holdings Limited, a company incorporated in Hong Kong.
F-80