Table of Contents
FORM 6-K
SECURITIES AND EXCHANGE COMMISSION
Washington, D.C. 20549
Report of Foreign Private Issuer
Pursuant to Rule 13a-16 or 15d-16 of
the Securities Exchange Act of 1934
For the month of September 2005
CLP Holdings Limited
(Registrant’s name in English)
147 Argyle Street
Kowloon, Hong Kong
(Address of Registrant’s principal executive office)
Indicate by check mark whether the Registrant files or will file annual reports under cover Form 20-F or Form 40-F.
Form 20-F X Form 40-F
Indicate by check mark whether the Registrant by furnishing this information contained in this Form is also thereby furnishing information to the Commission pursuant to Rule 12g3-2(b) under the Securities Exchange Act of 1934.
Yes No X
If “Yes” is marked, indicate below the file number assigned to the Registrant in connection with Rule 12g3-2(b): 82-
Table of Contents
Registrant hereby incorporates by reference in the report on Form 6-K the following Exhibit:
Exhibit
The Interim Report 2005 which was despatched to shareholders on 13 September 2005.
2
Table of Contents
SIGNATURES
Pursuant to the requirements of the Securities Exchange Act of 1934, the Registrant has duly caused this report to be signed on its behalf by the undersigned, thereunto duly authorized.
| For and on behalf of | ||
CLP HOLDINGS LIMITED
| ||
By: | / s / April Chan | |
Name: | April Chan | |
Title: | Company Secretary | |
Date:17 October 2005
3
Table of Contents
HIGHLIGHTS
| • | Electricity sales in Hong Kong grew 3.1% to 13,193GWh; total sales (which include sales to the Chinese mainland) rose 10.5% to 15,338GWh. |
| • | Consolidated revenue rose 13.8% to HK$16,626 million; revenue from our electricity business in Hong Kong recorded a 8.6% growth to HK$13,638 million. |
| • | Earnings from our electricity business in Hong Kong increased by 5.2% to HK$3,510 million; earnings from other activities grew by 27.7% to HK$1,010 million. |
| • | Total earnings up 10.6% to HK$4,577 million; operating earnings (which exclude Hok Un redevelopment profit) up 9.7% to HK$4,403 million. |
| • | Second interim dividend of HK$0.48 per share. |
Table of Contents
Page 1
| 6 months ended 30 June | Increase/ (Decrease) | | |||||||
| 2005
| 2004
| %
| |||||||
| Per share | |||||||||
Earnings per share, HK$ | |||||||||
Including Hok Un redevelopment profit | 1.90 | 1.72 | 10.6 | ||||||
Excluding Hok Un redevelopment profit | 1.83 | 1.67 | 9.7 | ||||||
Dividends per share, HK$ | |||||||||
First interim | 0.48 | 0.45 | |||||||
Second interim | 0.48 | 0.45 | |||||||
Total interim dividends | 0.96 | 0.90 | 6.7 | ||||||
| For the period | |||||||||
Revenue, HK$M | |||||||||
Hong Kong (HK) electricity business | 13,638 | 12,563 | 8.6 | ||||||
Total
| 16,626
| 14,615
| 13.8
| ||||||
Earnings, HK$M | |||||||||
Electricity business in HK | 3,510 | 3,337 | 5.2 | ||||||
Other investments / activities | |||||||||
Sales to Chinese mainland from HK | 63 | 30 | |||||||
Generating facilities in Chinese mainland serving HK 1 | 431 | 380 | |||||||
Other power projects in Chinese mainland | 95 | 43 | |||||||
Energy businesses in Asia-Pacific region | 425 | 404 | |||||||
Group non-energy activities | (4 | ) | (66 | ) | |||||
| 1,010
| 791
| 27.7
| |||||||
Unallocated net finance costs | (43 | ) | (39 | ) | |||||
Unallocated Group expenses | (74 | ) | (75 | ) | |||||
Total operating earnings | 4,403 | 4,014 | 9.7 | ||||||
Hok Un redevelopment profit | 174 | 124 | |||||||
Total earnings | 4,577 | 4,138 | 10.6 | ||||||
Electricity sales (CLP Power HK), millions of kWh | |||||||||
Residential | 3,114 | 2,875 | 8.3 | ||||||
Commercial | 5,259 | 5,093 | 3.3 | ||||||
Infrastructure & Public Services | 3,529 | 3,497 | 0.9 | ||||||
Manufacturing | 1,291 | 1,333 | (3.2 | ) | |||||
Total local sales | 13,193 | 12,798 | 3.1 | ||||||
Export sales | 2,145 | 1,085 | 97.7 | ||||||
Total electricity sales | 15,338 | 13,883 | 10.5 | ||||||
Interest cover2 , times | 10 | 9 | |||||||
| As at the balance sheet date | 30 June | 31 December | Increase | ||||||
| 2005 | 2004 | % | |||||||
Total assets, HK$M | 98,738 | 80,799 | 22.2 | ||||||
Total borrowings, HK$M | 32,502 | 18,774 | 73.1 | ||||||
Shareholders’ funds, HK$M | 46,257 | 44,199 | 4.7 | ||||||
Total debt to total capital3, % | 41.3 | 29.8 | |||||||
| 1 | This represents earnings contribution from our investments in Guangdong Nuclear Power Joint Venture Company, Limited and Hong Kong Pumped Storage Development Company, Limited, whose generating facilities serve Hong Kong |
| 2 | Interest cover = Profit before taxation and interest / (interest charges + capitalised interest) |
| 3 | Total debt to total capital = debt / (shareholders’ funds + debt + minority interest) |
Table of Contents
Page 2
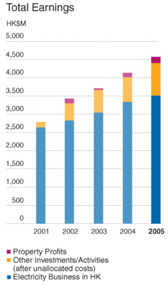
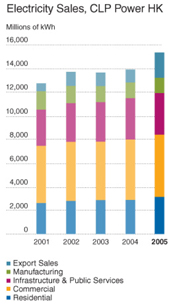
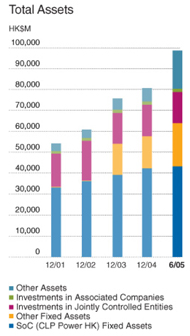
Table of Contents
Page 3
Dear Shareholders,
I am pleased to present our Interim Report for the half year ended 30 June 2005 and to record a strong performance by the CLP Group over this period.
Financial Results for the Six-month Period
Total operating earnings for the six months ended 30 June 2005 increased by 9.7% to HK$4,403 million, as compared with the corresponding period in 2004.
This growth in earnings came from across all our investments in the energy sector, whether these be our electricity business in Hong Kong or our interests in the electricity sector in the Mainland and elsewhere in the Asia-Pacific Region.
Further details of the Group’s financial performance are set out in the Management’s Discussion and Analysis which forms part of this Interim Report. In this Chairman’s Statement, I wish to focus on three aspects of our activities which have been of particular significance during the first half of 2005. These are:
| • | The Hong Kong Government’s public consultation on the development of the electricity market in Hong Kong after 2008; |
| • | The progress made by the Group in continuing to make good on its commitment to manage responsibly the environmental aspects of our activities; and |
| • | The completion of CLP’s acquisition of Singapore Power’s merchant energy business in Australia. |
Hong Kong Electricity Business
Stage I of the Hong Kong Government’s public consultation on the development of the electricity market in Hong Kong after 2008 concluded at the end of April. I wrote to shareholders in May to advise that, as promised, CLP has been an active, informed and authoritative participant in the public discussion todate. Our response to Stage I of the consultation, “A Balanced Deal - A Bright Future”, was submitted to Government on 26 April. In this, we emphasised that the keys to the excellence of Hong Kong’s electricity supply were found in a regulatory system which delivers practicality, service excellence, a fair deal for investors and clear accountability and responsibility.
In June, Government published its summary of the views received in response to Stage I of its consultation. These included 766 written submissions from many sectors of our community - ranging from businesses to individuals, from trade organisations to environmental groups, as well as 175 messages through the discussion forums on Government’s website. We welcome this wide participation in the debate on the future of our industry.
Table of Contents
Page 4
It has been noticeable that the majority of those who participated in the consultation consider reliability and the safety of electricity supply to be the most important objectives of the future regulation of Hong Kong’s electricity sectors - in line with the views which CLP itself has already expressed. We are also encouraged that most respondents consider our tariff to be reasonable and affordable.
Opinions were expressed that the post-2008 regulatory regime should provide for lowered returns for investors, and for that regime to be subject to a shortened review period. In these respects, CLP’s position is clear - returns must not be judged in isolation, nor should they be reset at unduly frequent intervals. The reliability of Hong Kong’s electricity supply has not happened by chance. It has stemmed from timely and adequate investment in Hong Kong’s electricity infrastructure. This, in turn, depends on a clear and stable regulatory system which offers reasonable returns to investors to facilitate such investment. After all, no other private industry in Hong Kong requires such continuous, large-scale and long-term investment as does the electricity sector.
We understand that Government is now taking into consideration the views collected during its Stage I consultation, so as to map out its proposals for the broad framework of development of the post-2008 electricity market, and that Stage II of the consultation will be launched later this year. CLP will continue its vigorous participation in this debate, and we will continue to report to shareholders on developments in this key issue for CLP’s future.
Environment
A number of respondents to the public consultation on Hong Kong’s electricity sector highlighted the importance of managing the environmental impact of electricity generation and of developing renewable energy sources.
I am pleased to report that CLP continues to move ahead on both these issues - in Hong Kong and elsewhere.
In Hong Kong, our proposals to retrofit flue gas desulphurisation (FGD) equipment at Castle Peak Power Station have now been approved by Government as part of the 2005-8 Financial Plan for our Hong Kong electricity business. This is a major project, and a challenging one - requiring substantial engineering works to be undertaken at the power station, whilst maintaining the availability of its essential generating capacity. Design and planning work is already underway.
The first half of 2005 also saw a significant step forward in our plans to develop the infrastructure needed to assure the availability of natural gas in Hong Kong for our electricity generation, with the start of the environmental review and approval procedures needed for site selection of the liquefied natural gas (LNG) receiving terminal which we will need in order to bring our LNG supply on stream early next decade.
As those shareholders who live in Hong Kong will know, local climatic, geographical and physical characteristics place significant constraints on the extent to which renewable energy can be developed in Hong Kong with existing technology. However, CLP remains keen to increase its participation in renewable energy projects - wherever these are economically, technically and environmentally feasible. In recent months, we have increased our investment in renewable energy projects in the Mainland, both wind and hydro. In addition, we are exploring new opportunities elsewhere, notably in Australia and India, where suitable natural resources are available. We aim to report further progress in this area by the end of 2005.
Table of Contents
Page 5
Australia
In April, a circular to shareholders advised you of the details of the proposed acquisition by CLP of Singapore Power’s merchant energy business in Australia.
This acquisition was completed, as targeted, on 31 May 2005. When coupled with CLP’s existing Yallourn Power Station, CLP is well on the way towards building a diversified and integrated energy business in Australia, focusing on electricity and gas retail, with a portfolio of physical assets in support of that retail business.
This business, which was rebranded as “TRUenergy” in June, constitutes the fifth largest energy retailer in Australia. The acquisition of the merchant energy business has also brought into the CLP Group a 1,280MW gas-fired power station at Torrens Island in South Australia - meaning that we have moved forward from reliance only on coal-fired generation at Yallourn. We believe that this diversified fuel mix promotes a better balance in our electricity generation activities in Australia, including from an environmental perspective.
Given that the acquisition of the merchant energy business was completed only at the end of May, considerable work is underway to integrate that business both with our existing investment at Yallourn and with the standards of operational excellence, financial control and corporate values of the CLP Group as a whole. I will report more fully to shareholders on the progress being made in this regard in our next Annual Report.
As in previous years, this Interim Report explains the wider environmental and social aspects of our activities, in addition to our financial and operational performance. 2005 has started well at the CLP Group - we are determined to carry this performance forward through the remainder of this year and beyond.
/ s / The Hon. Sir Michael Kadoorie
The Hon. Sir Michael Kadoorie
Hong Kong, 23 August 2005
Table of Contents
Page 6
Management’s Discussion And Analysis
This section describes CLP’s major activities in Hong Kong, the Chinese mainland and elsewhere in the Asia-Pacific region, as well as the Group’s financial results, funding and obligations during the first half of 2005.
CLP follows a clear, consistent and focused strategy to realise our vision of being a leading investor-operator in the Asia-Pacific electricity power sector. We aim continuously to enhance our core Hong Kong electricity business and to develop a portfolio of electricity businesses in the Chinese mainland and the Asia-Pacific region. An outline of our investments is set out below:
Hong Kong
| Investments | Equity Interest | Description | ||
CLP Power Hong Kong Limited (CLP Power Hong Kong) | 100% | CLP Power Hong Kong owns and operates the transmission and distribution system, covering a supply area of approximately 1,000 sq. km and which includes: • 554 km of 400kV lines; • 1,156 km of 132kV lines; • 296 km of 33kV lines; • 10,151 km of 11kV lines; • 55,631 MVA transformers; • 206 primary substations in operation; and • 12,327 secondary substations in operation.
| ||
Castle Peak Power Company Limited (CAPCO), 6,283 megawatts (MW) of installed generating capacity | 40% | CAPCO owns: Black Point Power Station (2,500MW, when completed) • Gas-fired power station (with distillate as back-up) comprising eight combined cycle turbines of 312.5MW each. • Units 1 to 6 in operation, Unit 7 commenced operation in August 2005 and Unit 8 to be commissioned in 2006.
Castle Peak Power Station (4,108MW) • Commissioned between 1982 and 1990. • One of the world’s largest coal-fired power station complexes, comprising eight units ranging from 350MW to 677MW. • Two of the 677MW units are capable of burning gas as backup fuel. All units can burn oil as a backup fuel.
Penny’s Bay Power Station (300MW) • Three diesel oil-fired units of 100MW each, commissioned in 1992.
|
| Note: | CLP Power Hong Kong operates CAPCO’s power stations and purchases its power from CAPCO and Guangdong Daya Bay Nuclear Power Station. These sources of power, together with CLP’s right to use 50% of the capacity of Phase 1 of the Guangzhou Pumped Storage Power Station, amount to a total installed capacity of 8,263MW. |
Table of Contents
Page 7
Chinese Mainland
Investments Gross/Equity MW | Equity Interest | Description | ||
Guangdong Nuclear Power Joint Venture Company, Limited (GNPJVC) 1,968/492MW | 25% | GNPJVC was established in 1985 to construct and operate Guangdong Daya Bay Nuclear Power Station (GNPS) at Daya Bay
| ||
Hong Kong Pumped Storage Development Company, Limited (PSDC) 1,200/600MW
| 49% | CLP has the right to use half of the 1,200MW pumped storage capacity of Phase I of the Guangzhou Pumped Storage Power Station until 2034. | ||
CLP Guohua Power Company Limited (CLP Guohua) 2,100/630MW
| 49% | CLP Guohua holds interests in three coal-fired power stations, namely Beijing Yire in Beijing , Panshan in Tianjin , Panshan in Tianjin , and Sanhe in Hebei , and Sanhe in Hebei , with a combined installed capacity of 2,100MW. , with a combined installed capacity of 2,100MW. | ||
CLP Guohua Shenmu Power Company Limited (Shenmu) 200/98MW
| 49% | Shenmu Power Station, in Shaanxi , has two 100MW coal-fired units. , has two 100MW coal-fired units. | ||
Guizhou CLP Power Company Limited (Guizhou CLP Power) 600/420MW
| 70% | Guizhou CLP Power owns and operates two 300MW coal-fired generating units which supply the Guizhou power grid and, indirectly, Guangdong Province power grid and, indirectly, Guangdong Province . . | ||
Shandong Zhonghua Power Company, Ltd. (SZPC) 3,000/882MW
| 29.4% | SZPC owns four coal-fired power stations, Shiheng I and II (totalling 1,200MW), Liaocheng (1,200MW) and Heze II (600MW), in Shandong Province . . | ||
Huaiji Power Project (Huaiji) 98/49MW
| 50% | Eight small hydro power stations in Huaiji County , Guangdong Province are in operation, with one under construction, amounting to a total of 98MW. , Guangdong Province are in operation, with one under construction, amounting to a total of 98MW. | ||
HNEEP-CLP Changdao Wind Power Co., Ltd. (Changdao Wind Power) 27/12MW
| 45% | Changdao Wind Power was established in 2004 to develop a 27MW wind power project on Changdao Island to supply power to Shandong Province. to supply power to Shandong Province. | ||
CLP Guangxi Fangchenggang Power Company Limited (Fangchenggang) 1,200/840MW
| 70% | Construction of a new power station with two 600MW coal-fired units at Fangchenggang , Guangxi , Guangxi is in progress and the project will be commissioned by end of 2007. is in progress and the project will be commissioned by end of 2007. |
 . GNPS is equipped with two 984MW Pressurised Water Reactors for which the majority of the equipment was imported from France and the United Kingdom. 70% of electricity generated is supplied to Hong Kong, with the remaining 30% sold to Guangdong.
Table of Contents
Page 8
Asia-Pacific Region
Investments Gross/Equity MW | Equity Interest | Description | ||
Gujarat Paguthan Energy Corporation Private Limited (GPEC), India 655MW
| 100% | GPEC owns and operates a 655MW gas-fired combined cycle power station in Gujarat, India. | ||
Ho-Ping Power Company (Ho-Ping), Taiwan 1,320/528MW
| 40% | Ho-Ping owns a 1,320MW coal-fired power station at Ho-Ping, Taiwan, which started operations in 2002. Operation is by a separate joint venture, with the same shareholdings as Ho-Ping, but with CLP management leadership. | ||
Electricity Generating Public Company Limited (EGCO), Thailand 5,575/768MW
| 22.4% | EGCO owns and operates two gas-fired combined cycle power stations in Thailand (2,056MW). It has also invested in a number of small power projects operating in Thailand and the Philippines, totalling 958MW, and in 2,561MW of projects under construction in Thailand and Laos. | ||
BLCP Power Limited (BLCP), Thailand 1,434/717MW
| 50% | BLCP is the developer of a 1,434MW coal-fired power station now under construction at Map Ta Phut, Thailand. CLP is responsible for construction management and is the major shareholder in the operating company. | ||
TRUenergy, Australia 3,726MW | 100% | TRUenergy comprises the ownership and operation of a number of electricity and gas assets in Victoria and South Australia. These include: from 1 June 2005 • 1,480MW coal-fired Yallourn Power Station and mine • 1,280MW gas-fired Torrens Island Power Station • 966MW Ecogen long-term hedge agreement • Iona Gas Storage facility • Various long-term gas supply contracts • Over 1.1 million retail electricity and gas customer accounts from 29 August 2005 • 33% interest in SEAGas
|
Table of Contents
Page 9
Operational Performance and Outlook
Electricity Business in Hong Kong
Following a strong rebound in 2004, the momentum for economic growth slowed slightly but was still sustained at a moderately high pace in the first half of 2005. Electricity sales to local customers in the first half of 2005 rose by 3.1% compared to the corresponding period last year, mainly due to increase in sales to Residential and Commercial sectors.
A steady increase in the number of residential customers and high temperatures in May helped sales to the Residential Sector. The Commercial Sector was supported by favourable business conditions and further improvement in the tourist industry. Growth in the Infrastructure & Public Services Sector was offset by the impact of energy conservation programmes within the Government. Sales to the Manufacturing Sector followed the past declining trend due to the reduction of production in Hong Kong.
A breakdown of the local sales growth by sector during the period is as follows:
| Increase/(Decrease) | Total Local Sales | |||
Residential | 8.3% | 23.6% | ||
Commercial | 3.3% | 39.9% | ||
Infrastructure & Public Services | 0.9% | 26.8% | ||
Manufacturing | (3.2%) | 9.7% | ||
Sales to the Chinese mainland recorded strong year-on-year growth of 97.7%. Demand from Shekou remained steady with a slight growth of 0.3%. With the contract with Guangdong Power Grid Corporation (GPG) renewed and continued shortage of electricity supply in Guangdong, significant growth in GPG sales was achieved.
Total unit sales, including both local sales and sales to the Chinese mainland, rose 10.5% in the first half of the year over the same period in 2004.
A new local maximum demand of 6,475MW was recorded in the evening on 18 July. This represented a growth of 2.3% over last year (6,329MW) and reduces our generation reserve margin to 27.6%.
CLP’s efforts towards improving productivity and keeping operating costs to a minimum have led to customers benefiting from an average net tariff that remains the lowest in Hong Kong. During 2004, we announced that tariffs would be frozen in 2005. There has now been no increase in tariff level since 1998.
To enhance supply quality and reliability, as well as provide for demand created by new towns and infrastructure development projects in our supply area, CLP incurred HK$1.8 billion of capital expenditure in the transmission and distribution networks during the period. Major projects included establishment of Mai Po, San Shek Wan, On Shum Street and Wan Po Road Substations. In addition, CLP also invested HK$0.7 billion in generation, customer services and other supporting facilities.
Table of Contents
Page 10
These investments will continue. In June 2005, the Executive Council approved the Financial Plan of our Hong Kong electricity business for the period from January 2005 to September 2008, submitted pursuant to the Scheme of Control Agreement. The approved Financial Plan provides for an estimated capital expenditure of HK$23.8 billion, the majority of which will be used to enhance the transmission and distribution systems.
We continue to strive to provide quality services to our customers, and to maintain a high level of satisfaction across all customer segments. Our 15 Customer Service Centres continue to be one of the popular service channels for the general public, visited by more and more customers. CLP’s commitment to quality customer service is reinforced by the Performance Pledges published annually.
Our performance in customer service is well recognised in the local industry. We won five awards at the Hong Kong Association for Customer Service Excellence Award 2004 in service counter, hotline and internal support services.
As an advocate of safe and efficient use of energy, CLP launched a series of promotional campaigns on electrical applications and appliances for business and residential customers. Electric cooking in particular has gained popularity. In a recent market survey, 58% of respondents are aware of induction cookers and 50% can easily recall the benefits.
To ensure ongoing improvements in business productivity, CLP continues to invest in information technology. Key projects include the Trouble Call and Outage Management System for supply reliability enhancement, a new field work handheld device system for improvement of customer service jobs, and a Plant Maintenance Optimisation System in order to better manage the generation assets.
CLP adopts innovative approaches with the aim of ongoing improvement in our work processes and environment. In March 2005, we won the Grand Award in the Green Innovative Practice Award for the Hong Kong Eco-Business Award 2004, based on our project on “Insulating Oil Regeneration Plant for Power Transformers” with an annual saving of HK$4 million.
Electricity Investments in the Chinese Mainland
The Guangdong Daya Bay Nuclear Power Station, in which CLP holds a 25% share, operated at a high capacity factor in the first six months. The station was awarded first places in Nuclear Safety, Industrial Safety and Radiation Protection in the 2004 Safety Challenge Competition, which included all the nuclear power stations in France and South Africa. Daya Bay also obtained its ISO 14001 re-accreditation, a recognition that Daya Bay has held since 1999.
Coal supply and tariff management for our joint ventures SZPC, CLP Guohua, Shenmu and Guizhou CLP Power continued to be a primary focus in 2005.
Despite the coal supply situation remaining tight, operation of the power stations has not been affected, except for Anshun II Power Station in Guizhou which experienced temporary restrictions in generation in February 2005 due to coal shortage.
Table of Contents
Page 11
The surge in coal prices which commenced in 2004 has not shown signs of abatement, and high coal prices are likely to prevail throughout 2005. To alleviate the financial pressure on power stations, the PRC authorities approved new tariffs which became effective in mid-2005. Most of the power stations under our joint ventures benefited from the increased tariffs. However, the increases are in general not sufficient to fully compensate for the significant rises in coal costs, resulting in various degrees of impact on profits of our joint ventures. The CLP Guohua and Shenmu power stations were least affected because of higher than projected operating hours. The impact on the Anshun II has been moderate, while that on the Shandong joint venture was substantial.
As regards new projects, satisfactory progress has been made on the 2 x 600MW greenfield project at Fangchenggang in Guangxi in which CLP has a 70% interest. Following the approval of the project by the National Development and Reform Commission and Ministry of Commerce, the joint venture was formally established in May 2005. Procurement of the major plant and auxiliary equipment was also completed. Construction has commenced and it is expected that the project will be commissioned by the end of 2007.
Electricity Investments in the Asia-Pacific Region
CLP acquired the TXU Merchant Energy Business (MEB) from Singapore Power on 31 May 2005. The acquisition was partly financed by CLP Group’s internal funds, with a new corporate finance facility used to finance the balance of the acquisition and re-finance existing facilities of Yallourn Energy Pty Limited (Yallourn Energy). An investment grade credit rating of “A-” was obtained from Standard & Poor’s.
Yallourn Energy and the MEB were combined to form TRUenergy which is the fifth largest energy retailer in Australia and sells gas and electricity to over 1.1 million customers across the eastern Australian states of Victoria, New South Wales, South Australia and Queensland. TRUenergy provides horizontal integration in generation and vertical integration into retail, and access to gas supply. Besides providing significant mitigation to electricity market risks, the integrated business with an investment grade credit rating also provides a strong platform for CLP’s future expansion in the Australian energy retail and generation sectors, including renewable energy.
Following obtaining all the necessary third party consents, CLP’s acquisition of Singapore Power’s 33% interest in SEAGas was completed on 29 August 2005.
Our wholly-owned power station GPEC, in India, continued to maintain high standards of reliability and safety. Following satisfactory implementation of the amended Power Purchase Agreement (PPA) with the Gujarat Electricity Board (GEB), there was significant improvement in overdue payments in 2004. Although some new challenges to the PPA terms in relation to matters such as incentive payments received when GPEC was available on naphtha fuel but not dispatched and calculations of interest on working capital re-emerged in early 2005, CLP has discussed these with GEB and Gujarat state authorities and is confident that these will be resolved amicably. Work on the 1,095MW expansion at the GPEC site has also been progressing, with tenders for the Engineering, Procurement and Construction contracts having been received and being evaluated. Discussions on power off-take and gas supply are also underway.
Table of Contents
Page 12
In Thailand, construction of the BLCP project has been progressing satisfactorily. The two 717MW coal-fired generating units are expected to commence commercial operation in 2006/07 as planned. Mobilisation of Operations and Maintenance (“O&M”) activities by an O&M company with CLP leadership also commenced. The current activities are focused on recruitment, installation of information technology systems, preparation of procedures and establishment of a comprehensive training program.
Details of the plans for the reform of the Thai electricity industry, privatisation of the Electricity Generating Authority of Thailand and the solicitation for new generation capacity are still being developed. In light of these developments, we continue to review our position in EGCO as well as our obligation under a Joint Development Agreement to divest half of our share in BLCP to EGCO.
In the first half of 2005, Ho-Ping Power Station in Taiwan continued to show significant improvements in operations, with high reliability recorded. However, on 18 July two of the three coal storage domes were damaged during the passage of Typhoon Haitang. The third dome had been damaged last year. Production and coal unloading were interrupted but resumed after a few days. In the meantime, claims under insurance policies and equipment warranties for the three domes are being pursued.
Favourable adjustment in the energy charge rate at Ho-Ping has also been awarded in accordance with the mechanism under the PPA with Taiwan Power Company. This mitigated to a large extent previous increases in coal and transportation costs. Ho-Ping has obtained “twA+” long-term and “twA-2” short-term corporate credit ratings, with a stable long-term outlook, from Taiwan Ratings Corporation. This would assist Ho-Ping’s potential refinancing of its existing loans by the issue of an unsecured bond to reduce interest costs and interest rate exposure.
Electricity-Related Businesses
Property Business
CLP redevelops sites in Hong Kong which are no longer required for electricity purposes.
In recent years, our major project has been the residential redevelopment of the former power station at Hok Un, Kowloon. This 50/50 joint venture project, known as Laguna Verde, led by CLP and a wholly-owned subsidiary of Cheung Kong (Holdings) Ltd., comprises 4,735 flats, 1,692 parking spaces and 270,000 sq.ft. of commercial space. Over 99% of the residential units had been sold by the end of June 2005.
Following the completion of the Hok Un redevelopment and the sale of the site at 305 Castle Peak Road, as reported in our Annual Report 2004, we do not currently consider that there are other surplus sites in Hong Kong which would be made available for redevelopment on any significant scale.
Public Lighting and Engineering Services
CLP continues to offer contracting and consultancy services in power engineering, communications, building services, road lighting, facility management and energy services for customers in Hong Kong and neighbouring areas. Our energy services include energy audit, fuel switching, power quality improvement and chiller enhancement works. We also maintain electrical systems in the Passenger Terminal Building, the sea water pumping stations, fixed ground power installation and road lighting for the Airport Authority.
Table of Contents
Page 13
Human Resources
On 30 June 2005, the Group employed 5,672 staff (2004: 4,678), of whom 3,829 (2004: 3,897) were employed in the electricity business in Hong Kong and 1,536 (2004: 479) by CLP Power Asia, TRUenergy and GPEC. Total remuneration for the six months ended 30 June 2005 was HK$1,223 million (2004: HK$1,246 million), including retirement benefit costs of HK$91 million for Hong Kong-based employees. The reason for the reduction in total remuneration is that, in the comparable period in 2004, special provision was made by the electricity business in Hong Kong to buyout certain work related allowances and bonuses in order to facilitate the transition to a new incentive based remuneration system.
During the first half of 2005, we have undertaken a number of key human resources initiatives.
Group-wide, the 2005 Management Development and Succession Planning process was initiated. In addition to ensuring that we have successors in place for identified key positions and Senior Management, this annual process is designed to identify new talent systematically.
As a continued effort to develop talent, we nominate high potential staff to attend Leadership Development Programs organised by reputable business schools. In 2005, nine staff have completed the Leadership Development Program organised with the Richard Ivey School of Business.
We have also continued with the CLP Internship Programme which encourages students to join CLP during summer or for a 12-month placement. Each student is assigned a specific project and a CLP manager as mentor. The programme has an excellent reputation with local universities. There are 49 students participating in this year’s programme.
With the growth of our business in the Asia-Pacific region, we have been encouraging more staff mobility across the region in order to leverage our core skills and experience, and also provide development opportunities to staff.
Safety
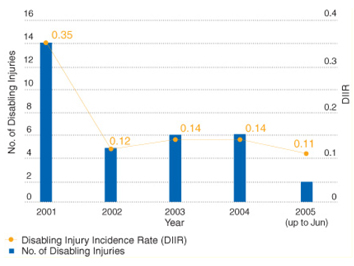
Table of Contents
Page 14
Two disabling injury incidents occurred in our Hong Kong electricity business in the first half of 2005, resulting in a disabling injury incidence rate of 0.09. On a rolling twelve months basis, the disabling injury incidence rate for the period to 30 June 2005 was 0.11, which compared favourably with that achieved for the calendar year 2004 (0.14).
During the period, significant efforts were placed on a number of safety enhancement and cultural improvement processes with the purpose of encouraging safer behaviour at work. We also continued the implementation of a Safety Incentive Scheme and a Behavior Safety Observation Scheme.
Environment
In the CLP Group’s “Manifesto on Air Quality and Climate Change” (the Manifesto) issued in December 2004, we committed to a series of initiatives in three key areas of responsible environmental management: climate change, air quality and energy conservation. We report below on our progress in each of these areas.
Climate Change
CLP undertook in the Manifesto to increase renewable energy sources to approximately 5% of the Group’s total generating capacity by 2010. In line with this commitment, CLP is investigating and investing in renewable energy projects outside of Hong Kong, focusing on wind farms and hydro schemes and with an immediate emphasis on China, Australia and India.
In June 2005, we increased our interest in the Huaiji hydro project in Guangdong, China, to 50%. A restructuring scheme is being implemented to resolve the issue of overdue electricity payment, to raise capital to complete a hydro plant being constructed and to improve the financing arrangements for the project. The scheme should put the project on a better financial standing and enable CLP to increase its ownership and exercise greater control over the project.
We have widened our partnership with a subsidiary of the China Huaneng Group on wind farm projects in China. Following our 45% investment in the 27MW wind farm at Changdao in Shandong Province, which is currently under construction, we have concluded commercial arrangements for taking a 45% interest in the 19.5MW greenfield wind project at Weihai in Shandong. Wind monitoring at various sites in Guangdong and Hainan Island is also being conducted. We are also reviewing wind farm opportunities in Australia and small hydro schemes in India.
In July 2004, CLP launched a commercial scale wind turbine pilot demonstration to investigate the economic, environmental and technical feasibility and practicality of wind energy applications in Hong Kong. This pilot study will take a commercial scale wind turbine through the full site selection and regulatory process to educate the industry and the community about wind energy applications in Hong Kong.
Through a structured site selection exercise and engagement of various stakeholders including the Government, green groups and community groups, two potential sites, namely Kau Sai Chau and Hei Ling Chau, were identified. A preferred site will be selected based on the results of the on-site wind resource measurement, engineering design and preliminary impact assessment to be conducted on both potential sites in the coming months.
Table of Contents
Page 15
The CLP-sponsored wind resource assessment for Hong Kong is nearing conclusion. This year CLP provided additional sponsorship to the same team at the Hong Kong University of Science and Technology for an assessment of the adjacent province of Guangdong.
Air Quality
We are committed to improving the environmental performance of our electricity generation activities in Hong Kong. A major environmental initiative we are planning to undertake is an Emissions Control Project at the Castle Peak B Power Station, which involves the retrofit of FGD equipment.
We have been proceeding with the necessary front-end engineering works. Technology option selection is nearing completion and we are preparing to undertake an Environmental Impact Assessment (EIA). A retrofit project such as this will involve a large amount of demolition, plant re-location, and construction works to be undertaken on an operating site. It is imperative that power generation is not disrupted throughout the project period. We are developing a project execution plan to ensure smooth and timely implementation of the project, while maintaining a reliable supply of electricity to our customers.
CLP is developing the infrastructure needed to assure the availability of LNG in Hong Kong. Preliminary site selection studies for the LNG receiving and storage terminal identified two sites which appear suitable, South Soko Island and adjacent to CAPCO’s Black Point Power Station. EIAs are underway for both sites, with anticipated completion in mid 2006.
Leading up to the EIA submission, an active public communication campaign has helped inform the public and various other stakeholders of the benefits of LNG, as well as the need for a receiving terminal and storage facility in Hong Kong. This campaign has included briefings with various stakeholders including green groups, community groups, and various government departments, advertisements, and a website. For more details, we invite you to visit our project website at www.clpgroup.com/environment/lng or phone our enquiry hotline at (852) 2678-8189.
CLP was the first company to sign the Clean Air Charter. This charter is led by the Business Coalition on the Environment, and aims to engage the business community in voluntary emissions reductions to clean up the air in Hong Kong and elsewhere in the Pearl River Delta.
Energy Conservation
In June 2005, we received our first certificate in the Hong Kong Energy Efficiency Registration Scheme for Buildings for our newly commissioned Sham Mong Road Substation. This will be adopted as the latest design standard for our future substations in Hong Kong.
CLP continued its effort in enhancing public awareness on energy savings through our school and community PowerWise outreach programmes. The PowerWise website, which passes on practical tips on wise use of energy in a fun and interactive way, has attracted about 60,000 visits from internet users.
During the first half of the year, more than 1,600 advisory services including energy audits were provided to our customers to help reduce their energy costs.
Table of Contents
Page 16
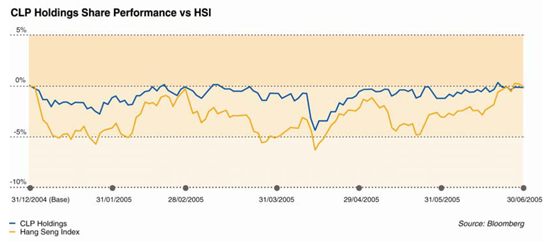
Shareholder value
During the first half of 2005, CLP’s share price was down 0.22%, whereas the Hang Seng Index (HSI) decreased by 0.20%.
The final dividends for 2004, comprising HK$0.73 per share by way of ordinary dividend and HK$0.15 per share as special dividend, were paid to Shareholders on 29 April 2005. The first interim dividend for 2005 of HK$0.48 per share was paid on 15 June 2005 and the second interim dividend of HK$0.48 per share will be paid on 15 September 2005.
Table of Contents
Page 17
The financial results for the six months ended 30 June 2005, which are unaudited but have been reviewed by the Audit Committee and our external Auditors, incorporate the following two significant changes from the corresponding period in 2004 and from the financial year ended 31 December 2004:
| 1. | The adoption of a number of new and revised Hong Kong Financial Reporting Standards (HKFRSs) and Hong Kong Accounting Standards (HKASs) issued by the Hong Kong Institute of Certified Public Accountants which become effective for accounting periods beginning on or after 1 January 2005; and |
| 2. | The consolidation of the MEB in Australia following completion of the acquisition on 31 May 2005. |
The adoption of the new accounting standards does not have material impact on earnings, but requires changes to the presentation of the profit and loss account (refer to page 27 of this Interim Report). HKAS 1 “Presentation of Financial Statements” prohibits presentation of any items of income and expense as extraordinary items and hence, the following reclassifications have been made:
| (a) | Profit from Hok Un redevelopment, previously shown as a separate line on the profit and loss account, has been grouped as part of the share of results from jointly controlled entities; |
| (b) | The transfers under the Scheme of Control (SoC) arrangement have been reclassified, namely (i) transfers from or to the Development Fund reclassified as revenue and (ii) the transfer to Rate Reduction Reserve (i.e. 8% interest on the average Development Fund balance) reclassified as finance costs. |
For the balance sheet (refer to page 28 of this Report), the major changes are:
| (a) | Leasehold land is now shown separately from fixed assets; |
| (b) | Negative goodwill of HK$1,046 million recognised to 2004 has been credited to the opening balance of retained profits; |
| (c) | Mark-to-market value of all derivative and energy trading instruments, which previously were not allowed for recognition, are now recognised; and |
| (d) | GPEC’s discounted bills with recourse, which were previously treated as contingent liabilities, have been accounted for as a collateralised borrowing starting 2005. The Group has no material contingent liabilities as at 30 June 2005. |
As the acquisition of the MEB was only completed on 31 May 2005, the one-month post-acquisition profit of HK$6 million, which was affected by seasonal factors in Australia and non-recurring expenses associated with the acquisition and re-branding exercise, did not make a significant contribution to earnings. However, the consolidation of the MEB’s net assets did have a significant impact on the consolidated balance sheet. These are described in more details under the “Group’s Financial Position” section.
Table of Contents
Page 18
Consolidated Financial Results
Revenue
During the six-month period to 30 June 2005, our revenue registered a 13.8% increase to HK$16,626 million (2004: HK$14,615 million). Our businesses in Hong Kong and Australia contributed to this growth.
Revenue from our electricity business in Hong Kong recorded a 8.6% growth to HK$13,638 million (2004: HK$12,563 million). The increase was mainly due to higher unit sales and increased fuel clause revenue. The transfer from the Development Fund, which is an adjustment under the SoC, has now been reclassified as revenue which amounted to HK$338 million (2004: HK$693 million, including HK$96 million transferred from the special provision account).
Revenue from our energy businesses outside Hong Kong amounted to HK$2,922 million (2004: HK$1,966 million), with the increase mainly resulting from the incorporation of the MEB’s revenue of HK$935 million for the one-month post-acquisition period.
Group Earnings
Total operating earnings were HK$4,403 million, which was HK$389 million higher than the corresponding period last year, representing an increase of 9.7%. Total earnings, which include Hok Un redevelopment profit, increased by 10.6% to HK$4,577 million.
Our electricity business in Hong Kong continues to provide stable earnings growth, with earnings increasing by 5.2% to HK$3,510 million. This resulted from the combined effect of ongoing investments in fixed assets to meet new customer demands and to improve quality of services.
Earnings from other energy businesses and investments rose 27.7% to HK$1,010 million, reflecting improved contributions from our overseas businesses and investments in the energy sector and reduction in losses from non-energy activities particularly after the withdrawal from telecommunication business in 2004.
Earnings from investments in GNPJVC and PSDC increased from HK$380 million to HK$431 million due to increased generation from continuous high performance of the nuclear plant. Earnings from other investments in the Chinese mainland continued to be adversely affected by high coal costs, and were lower than last year when the write-off of financing charges related to the Shandong project loans was excluded.
Our energy businesses in the Asia-Pacific region recorded an earnings growth of 5.2% to HK$425 million, with contributions mainly coming from GPEC, India. Contributions from our Australian business during the six-month period to 30 June 2005 had been affected by the one-off swap breakage cost associated with the refinancing of Yallourn Energy’s loans. With the progressive integration of Yallourn Energy and MEB, we expect to have a meaningful contribution from this segment in the second half of the year.
Table of Contents
Page 19
The contribution of each major activity to the Group earnings is analysed as follows:
| 6 months ended 30 June | ||||||||||||||
| 2005 | 2004 | Increase | ||||||||||||
| HK$M | HK$M | HK$M | HK$M | % | ||||||||||
Earnings from electricity business in Hong Kong | 3,510 | 3,337 | 5.2 | |||||||||||
Electricity sales to Chinese mainland from Hong Kong | 63 | 30 | ||||||||||||
Generating facilities in Chinese mainland serving Hong Kong (GNPJVC & PSDC) | 431 | 380 | ||||||||||||
Other power projects in Chinese mainland | 95 | 43 | ||||||||||||
Energy businesses in Asia-Pacific region | 425 | 404 | ||||||||||||
Group non-energy activities | (4 | ) | (66 | ) | ||||||||||
Earnings from other investments / activities | 1,010 | 791 | 27.7 | |||||||||||
Unallocated net finance costs | (43 | ) | (39 | ) | ||||||||||
Unallocated Group expenses | (74 | ) | (75 | ) | ||||||||||
Total operating earnings | 4,403 | 4,014 | 9.7 | |||||||||||
Hok Un redevelopment profit | 174 | 124 | ||||||||||||
Group earnings attributable to shareholders | 4,577 | 4,138 | 10.6 | |||||||||||
Weighted average number of shares in issue, million shares | 2,408.25 | 2,408.25 | ||||||||||||
Earnings per share, HK$ | ||||||||||||||
Including Hok Un redevelopment profit | 1.90 | 1.72 | 10.6 | |||||||||||
Excluding Hok Un redevelopment profit | 1.83 | 1.67 | 9.7 | |||||||||||
Earnings per share increased by 10.6% when compared to the corresponding period in 2004. Excluding the Hok Un redevelopment profit, earnings per share increased by 9.7%.
Group’s Financial Position
The Group has a strong balance sheet, with total assets as at 30 June 2005 amounting to HK$98,738 million (December 2004: HK$80,799 million). The increase of HK$17,939 million was mainly due to the consolidation of the newly acquired MEB. The acquisition gave rise to a significant increase on items such as fixed assets, derivative instruments, and trade and other receivables and reduction of deferred tax assets after offsetting by the assumed deferred tax liabilities. Goodwill and other intangible assets arising from this acquisition totalled HK$6,974 million. As the acquisition was completed only one month prior to the balance sheet date, the fair values assigned to the identifiable assets and liabilities are provisional only. Further work will be carried out in the coming months before the end of 2005 to refine the fair value allocation and therefore may result in a corresponding adjustment to goodwill.
Table of Contents
Page 20
Our total assets, which comprise primarily fixed and intangible assets as well as investments in jointly controlled entities and associated companies, analysed by principal activities, are as follows:
| 30 June 2005 | 31 December 2004 | |||||||
HK$M
| %
| HK$M
| %
| |||||
Energy businesses / investments in | ||||||||
Hong Kong | 53,057 | 53 | 50,710 | 63 | ||||
Asia-Pacific region | 38,251 | 39 | 22,468 | 28 | ||||
Chinese mainland | 6,722 | 7 | 6,858 | 8 | ||||
| 98,030 | 99 | 80,036 | 99 | |||||
Property and other businesses | 708 | 1 | 763 | 1 | ||||
| 98,738 | 100 | 80,799 | 100 | |||||
Total bank loans and other borrowings, which excluded the obligations under finance leases, increased from HK$18,774 million to HK$30,967 million. Details of the Group’s borrowings are provided in the “Financing” section.
Business Acquisitions and Developments
On 31 May 2005, we completed the acquisition of the MEB (except for the interest on SEAGas partnership) in Australia for a purchase consideration of HK$11,916 million. The acquisition was funded from internal resources as well as new financing facilities which are discussed further in the “Financing” section. With respect to the acquisition of Singapore Power’s interest in SEAGas partnership, all necessary third party consents were obtained and the acquisition was completed on 29 August 2005. The consideration for this acquisition was A$195 million, of which a deposit of A$75 million (approximately HK$448 million) was paid prior to 30 June 2005.
Pursuant to the Equity Contribution Agreement and its amendment agreement relating to the BLCP power project of Thailand, we are required to make further equity contributions of US$148 million by 2007.
For our investments in the Chinese mainland, we made capital contributions of RMB27 million (approximately HK$25 million) to a wind power project in Changdao and advances of RMB131 million (approximately HK$123 million) to a coal-fired power project in Fangchenggang during the first half of 2005. Further equity contributions of RMB18 million and RMB966 million are expected to be made by the end of this year for the Changdao project and by 2007 for the Fangchenggang project respectively. We also entered into a joint venture to develop another wind project in Weihai and are required to make an equity contribution of RMB30 million by 2006. We increased our shareholding in the hydro power stations in Huaiji, Guangdong, through an acquisition of the interest held by Sun Hung Kai China Development Fund Limited. The acquisition, at a consideration of HK$53 million, was completed on 30 June 2005.
Table of Contents
Page 21
Fixed Assets and Capital Expenditure
Fixed assets and leasehold land of the Group totalled HK$63,976 million as at 30 June 2005, comprising mainly the investments in the transmission and distribution network for our core Hong Kong electricity business of HK$43,296 million (December 2004: HK$42,415 million) and in the generating facilities of overseas subsidiaries of HK$20,502 million (December 2004: HK$15,147 million). During the six-month period, we invested HK$2,179 million (2004: HK$2,637 million), of which HK$1,911 million (2004: HK$2,313 million) was made by CLP Power Hong Kong, in various fixed assets (including payments for lease premium for land). Capital expenditure by CAPCO for the six months was HK$619 million (2004: HK$829 million).
Capital expenditure contracted, but not provided for in the accounts, as at 30 June 2005 amounted to HK$2,300 million (December 2004: HK$2,207 million). Other than HK$377 million (December 2004: HK$240 million) which was for our overseas subsidiaries, these contracted amounts are primarily for enhancing our transmission and distribution systems in Hong Kong.
Liquidity and Capital Resources
As at 30 June 2005, we had liquid funds of HK$1,932 million (December 2004: HK$2,520 million), of which 94% was denominated in foreign currency mainly held by overseas subsidiaries in India and Australia. The remainder was in Hong Kong dollars.
We strive to maintain an appropriate mix of committed and uncommitted facilities and solicit our facilities from a pool of financial institutions with strong credit standing. As at 30 June 2005, financing facilities totalling HK$40.2 billion were available to the Group, including HK$15.6 billion for overseas subsidiaries. Of the available facilities, HK$31.0 billion had been drawn down, of which HK$13.2 billion was by overseas subsidiaries. Facilities totalling HK$9.5 billion were available to CAPCO, of which HK$9.0 billion had been drawn down. The debts of overseas subsidiaries are without recourse to CLP Holdings. Of these borrowings, HK$716 million as at 30 June 2005 are secured by fixed and floating charges over the assets of GPEC.
Our total debt to total capital as at 30 June 2005 was 41.3% and interest cover for the six months ended 30 June 2005 was 10 times.
Financing
The Group engaged in new financing activities in the first half of 2005 to support the continuous expansion of electricity business in Hong Kong and acquisition of the MEB in Australia. We continue to adopt a prudent approach to all our financial arrangements, while at the same time aiming to achieve cost effective funding.
In April 2005, CLP Holdings completed a HK$6 billion self-arranged medium term loan facility with 15 international banks. CLP Holdings increased the limit of this loan arrangement to HK$6 billion from the original target of HK$4 billion upon favourable responses from the financial market, and utilised a HK$2 billion commitment amount to replace a higher-priced tranche of its existing loan facility. A portion of the financing was also used to fund part of the equity contribution related to the acquisition of the MEB. The new loan facility should provide CLP Holdings with ample liquidity to meet its investment needs over the next few years.
Table of Contents
Page 22
CLP Australia Finance Pty Ltd. (CLP Australia Finance), a wholly-owned subsidiary in Australia, completed a A$2.2 billion unsecured corporate loan facility and a A$250 million working capital facility in May 2005. The facilities were used to fund the balance of the purchase consideration payable upon the acquisition of the MEB, refinance the existing Yallourn Energy’s project finance facilities, and fund the working capital requirements for our business in Australia. The loans are non-recourse to CLP Holdings and Standard & Poor’s (S&P) has assigned its “A-” credit rating to the A$2.2 billion unsecured debt facilities with stable outlook.
In January and June 2005, CLP Power Hong Kong issued two tranches of fixed rate notes due 2015 of HK$500 million each, with coupon rates at 4.35% and 4.15% respectively, through its wholly-owned subsidiary CLP Power Hong Kong Financing Limited. These issues were made under the Medium Term Note (MTN) Programme set up by CLP Power Hong Kong Financing Limited in 2002. Under the MTN Programme, notes in an aggregate amount of up to US$1.5 billion may be issued and will be unconditionally and irrevocably guaranteed by CLP Power Hong Kong. As at 30 June 2005, nominal value of about HK$5,340 million notes have been issued under the MTN Programme.
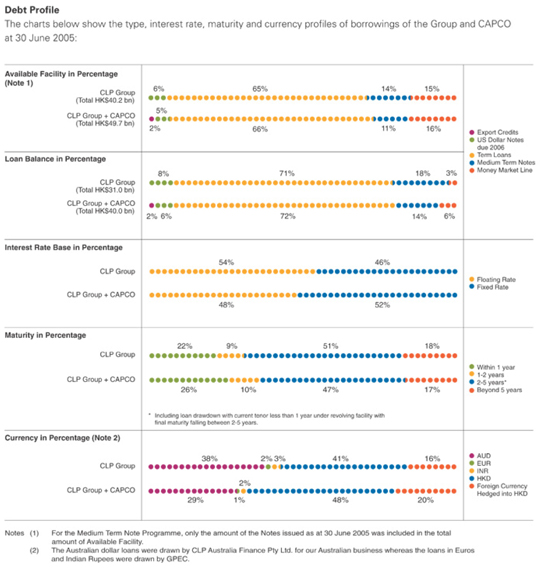
Table of Contents
Page 23
Credit Rating
In May 2005, S&P lowered the foreign currency and local currency corporate credit rating of CLP Holdings to “A” from “A+”. S&P’s downgrade of CLP Holdings’ rating reflects its view of CLP Holdings’ increasing business risk as a result of our international diversification efforts over the past few years and the increased level of debt following the acquisition of the MEB in Australia. At the same time, S&P affirmed its “A+” foreign currency and local currency credit rating on CLP Power Hong Kong. S&P noted that although the SoC was likely to be renegotiated with a potential lower rate of return, it expected that CLP Power Hong Kong’s market position and financial performance would remain strong.
In addition to CLP Holdings and CLP Power Hong Kong, S&P also assigned its “A-” long-term credit rating to two of our Australian subsidiaries, namely CLP Australia Holdings Pty Ltd. and TRUenergy Pty Ltd. in May 2005. The outlook for all ratings is stable.
Moody’s re-affirmed the foreign currency rating of CLP Holdings and CLP Power Hong Kong unchanged at “A1” in May 2005 and at the same time revised downward the local currency issuer rating of CLP Holdings and CLP Power Hong Kong to “A1” and “Aa3” from “Aa2” and “Aa1” respectively. This puts CLP Power Hong Kong on par with the HKSAR’s local currency rating of “Aa3”. The outlook for the ratings is stable. Moody’s downgrade reflected its view of the increased overall business risk profile and financial leverage of CLP Holdings after the acquisition of the Australian MEB. At the same time, Moody’s continued to recognise the key credit strengths of strong and highly predictable cash flow generated from CLP Power Hong Kong, management’s gradual approach to overseas expansion, and CLP Group’s strong access to bank and capital markets. Both Moody’s and S&P consider CLP Power Hong Kong to be an integral part of CLP Holdings with both ratings closely linked.
In July 2005, Moody’s upgraded the foreign currency bond rating of CLP Power Hong Kong to “Aa3” from “A1” based on the view that foreign currency bonds subject to international law are less likely to be subject to a debt moratorium than foreign currency obligations subject to local law and hence the differential in the ratings on foreign currency bond and foreign currency issuer ratings.
Separately, Fitch affirmed its self-initiated foreign currency and local currency ratings of CLP Holdings and CLP Power Hong Kong at “A+” with stable outlook in March 2005.
The credit ratings of major companies within the Group as at 30 June 2005 are summarised below. All ratings remain at investment grade which can facilitate and enhance our position in local and overseas business activities, including fund raising, investment and new business opportunities.
| CLP Holdings | CLP Power Hong Kong | CLP Australia Holdings | HKSAR Government 1 | |||||||||||
S&P
| Moody’s
| S&P
| Moody’s
| S&P
| S&P
| Moody’s
| ||||||||
| Long-term Rating | ||||||||||||||
Foreign Currency | A | A1 | A+ | A1 | A- | AA- | A1 | |||||||
Outlook | Stable | Stable | Stable | Stable | Stable | Stable | Stable | |||||||
Local Currency | A | A1 | A+ | Aa3 | A- | AA- | Aa3 | |||||||
Outlook | Stable | Stable | Stable | Stable | Stable | Stable | Stable | |||||||
| Short-term Rating | ||||||||||||||
Foreign Currency | A-1 | P-1 | A-1 | P-1 | — | A-1+ | P-1 | |||||||
Local Currency | A-1 | — | A-1 | — | — | A-1+ | — | |||||||
| 1 | rating updated as at 20 July 2005 |
Table of Contents
Page 24
Risk Management
The Group’s investments and operations have resulted in exposures to foreign currency risks, interest rate risks, credit risks and price risks associated with the sales and purchases of electricity in Australia. We actively manage such risks by using different derivative instruments with an objective to minimise the impact of exchange rate, interest rate and electricity price fluctuations on earnings, reserves and tariff charges to customers and monitor our risk exposures with the assistance of “Value-at-Risk” (VaR) methodology. VaR is a risk measurement that probabilistically calculates the market risk of a portfolio using historical volatility over a defined holding period. Other than certain electricity trading activities engaged by our Australian business, all derivative instruments are employed solely for hedging purposes.
Foreign Currency Risks
The Group’s foreign currency exposures primarily arise from CLP Power Hong Kong’s significant foreign currency obligations related to its U.S. dollar-denominated debt, nuclear power purchase off-take commitments, fuel and other purchase-related payments and CLP Power Asia’s investments abroad.
In order to mitigate the potential impact of foreign currency movement on electricity tariff in Hong Kong, CLP Power Hong Kong continues to hedge a significant portion of its U.S. dollar obligations, provided that the hedging can be accomplished at rates below the Government’s target peg rate of 7.80. We will review this policy periodically in light of changing market conditions to optimise benefits.
For investments overseas, we do not hedge translation exposure arising from consolidation of the Group’s net assets outside Hong Kong because the investments are long-term and effective hedging instruments are either limited or costly. The translation gains or losses do not affect the Group’s cash flow or earnings until an investment is sold. Our primary foreign exchange risk is at the individual project company level where non-functional currency exposures, if not managed properly, can lead to significant financial distress. Therefore, our primary risk mitigation is to ensure that project-level debt financings are implemented on a local currency basis to the maximum extent possible. Certain investments have incorporated direct and indirect indexation in their project agreements to reduce earnings impact from foreign exchange fluctuation.
Interest Rate Risks
The Group utilises fixed rate borrowings and interest rate swaps to mitigate the impact of interest rate volatility on current and future corporate profitability.
CLP Power Hong Kong conducts annual reviews to determine a preferred fixed/floating interest rate mix appropriate for its business profile. For the Group’s overseas investments, each project company has developed its own hedging program taking into consideration project debt service sensitivities to interest rate movements, lender requirements, tax and accounting implications.
In May 2005, Yallourn Energy closed out all its interest rate swaps upon completion of its project debt refinancing by new credit facilities at CLP Australia Finance. To mitigate its interest rate exposure arising from the new borrowings, CLP Australia Finance entered into interest rate swaps with notional amount totalled A$1.2 billion to convert part of its floating interest rate obligations into fixed rate.
Table of Contents
Page 25
Credit Risks
All finance-related hedging transactions and deposits of CLP Holdings and its principal subsidiaries are made with counter-parties with acceptable credit rating to minimise credit exposure. The Group assigns limits to its counter-parties and monitors potential exposures to each counter-party utilising the VaR methodology. All derivative transactions are entered into at the sole credit of the respective subsidiaries and affiliates and the counter-parties have no recourse to CLP Holdings for any change in the market value of derivatives.
Electricity Sales and Purchases Risks
There are risks in the Australian energy sector resulting from price volatility and the possibility of continuing low pool prices in Australia’s National Electricity Market (NEM). Our operating companies in Australia have entered into energy contracts, including forward electricity pricing contracts, swaps and options contracts to help reduce the impact on earnings of the volatility of NEM pool prices. They have engaged in energy trading activities and all trading and marketing activities are conducted within a clear and appropriate risk management framework.
The successful acquisition of the MEB in May 2005 takes the Group from ownership of a single electricity generating asset towards a broader-based vertically integrated Australian energy business with significant access to the retail gas and electricity market. The resulting combination of generation and retail should provide a natural hedge that can significantly reduce the potential impacts of volatile and cyclical wholesale pool prices.
Derivative Instruments
As at 30 June 2005, the Group had gross outstanding derivative instruments amounting to HK$71.6 billion. The fair value of these derivative instruments was at a net surplus of HK$90 million, which represents the net amount we would receive if these contracts were closed out on 30 June 2005. The significant change in fair value from net deficit of HK$1,199 million as at 31 December 2004 is primarily attributed to the strengthening of U.S. dollar in the forward currency markets in the first half of 2005.
The breakdown by type and maturity profile of the Group’s derivative instruments are shown below:
Type | ||||||||||
| Notional Amount | Fair Value Gain/(Loss) 1 | |||||||||
| 30 June 2005 | 31 December 2004 | 30 June 2005 | | 31 December 2004 | | |||||
| HK$M | HK$M | HK$M | HK$M | |||||||
CLP Group | ||||||||||
Forward Foreign Exchange Contracts | 42,593 | 44,961 | (231 | ) | (1,192 | ) | ||||
Interest Rate Swaps | 9,509 | 16,295 | (105 | ) | (358 | ) | ||||
Currency Swaps & Collars | 4,681 | 4,680 | 187 | 255 | ||||||
Energy Hedging & Trading Options | 1,131 | 48 | (2 | ) | — | |||||
Energy Hedging & Trading Swap Contracts | 13,669 | 2,330 | 241 | 96 | ||||||
| 71,583 | 68,314 | 90 | (1,199 | ) | ||||||
CAPCO | ||||||||||
Interest Rate Swaps | 4,293 | 4,378 | (85 | ) | (253 | ) | ||||
Total | 75,876 | 72,692 | 5 | (1,452 | ) | |||||
| 1 | 2004 comparative figures are not provided in the condensed consolidated interim accounts as HKAS 39 “Financial Instruments: Recognition and Measurement” prescribes the recognition of derivatives at fair value in the balance sheet to take effect prospectively from 1 January 2005. |
Table of Contents
Page 26
Maturity Profile
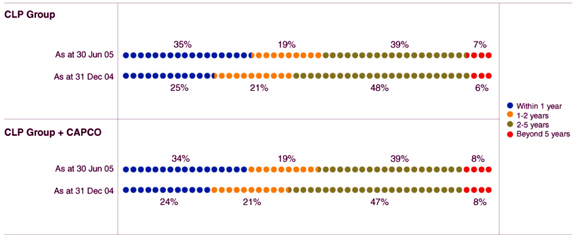
With the adoption of HKAS 39 “Financial Instruments: Recognition and Measurement” in 2005, all derivatives are required to be recognised in the balance sheet at their fair value. The fair value of derivatives as at 31 December 2004 had been recognised as assets or liabilities on 1 January 2005. Subsequent changes in fair value of the derivatives will have no impact on the Group’s cash flow until settlement as these are non-cash items.
Table of Contents
Page 27
Condensed Consolidated Profit And Loss Account
| (Unaudited) 6 months ended 30 June | | |||||||
| Note | 2005 HK$M | | 2004 HK$M | | ||||
| (Restated) | ||||||||
Revenue | 5,6 | 16,626 | 14,615 | |||||
Expenses | ||||||||
Purchases of electricity and gas | 27 | 8,613 | 7,630 | |||||
Staff expenses | 665 | 648 | ||||||
Fuel and other operating costs | 1,976 | 1,493 | ||||||
Depreciation and amortisation | 1,359 | 1,219 | ||||||
| 12,613 | 10,990 | |||||||
Operating profit | 6,7 | 4,013 | 3,625 | |||||
Finance costs | 8 | (725 | ) | (595 | ) | |||
Finance income | 8 | 63 | 23 | |||||
Share of results, net of tax | ||||||||
jointly controlled entities | 9, 16 | 1,614 | 1,541 | |||||
associated companies | 9, 17 | 79 | 116 | |||||
Profit before taxation | 5,044 | 4,710 | ||||||
Taxation | 10 | (467 | ) | (572 | ) | |||
Earnings attributable to shareholders | 11 | 4,577 | 4,138 | |||||
Dividends | 12 | |||||||
First interim paid | 1,156 | 1,084 | ||||||
Second interim proposed | 1,156 | 1,084 | ||||||
| 2,312 | 2,168 | |||||||
Earnings per share | 13 | HK$1.90 | HK$1.72 | |||||
Table of Contents
Page 28
Condensed Consolidated Balance Sheet
| (Unaudited) 30 June 2005 | | (Restated) 31 December 2004 | | |||||
| Note | HK$M | HK$M | ||||||
Non-current assets | ||||||||
Fixed assets | 14 | 61,758 | 55,508 | |||||
Leasehold land | 14 | 2,218 | 2,240 | |||||
Goodwill and other intangible assets | 15 | 6,961 | (1,022 | ) | ||||
Investments in jointly controlled entities | 16 | 14,886 | 14,998 | |||||
Investments in associated companies | 17 | 1,596 | 1,640 | |||||
Deferred tax assets | 368 | 1,043 | ||||||
Derivative instruments | 18 | 472 | — | |||||
Other non-current assets | 459 | 9 | ||||||
| 88,718 | 74,416 | |||||||
Current assets | ||||||||
Inventories – stores and fuel | 659 | 299 | ||||||
Trade and other receivables | 19 | 6,559 | 3,564 | |||||
Derivative instruments | 18 | 870 | — | |||||
Bank balances, cash and other liquid funds | 20 | 1,932 | 2,520 | |||||
| 10,020 | 6,383 | |||||||
Current liabilities | ||||||||
Customers’ deposits | (3,223 | ) | (3,119 | ) | ||||
Fuel clause account | (460 | ) | (762 | ) | ||||
Trade and other payables | 21 | (4,915 | ) | (4,216 | ) | |||
Taxation payable | (662 | ) | (403 | ) | ||||
Short-term loans and current portion of long-term borrowings | 22 | (7,023 | ) | (1,178 | ) | |||
Derivative instruments | 18 | (586 | ) | — | ||||
| (16,869 | ) | (9,678 | ) | |||||
Net current liabilities | (6,849 | ) | (3,295 | ) | ||||
Total assets less current liabilities | 81,869 | 71,121 | ||||||
Table of Contents
Page 29
Condensed Consolidated Balance Sheet (continued)
| (Unaudited) 30 June 2005 | (Restated) 31 December 2004 | |||||
| Note | HK$M | HK$M | ||||
Financed by: | ||||||
Equity | ||||||
Share capital | 23 | 12,041 | 12,041 | |||
Share premium | 1,164 | 1,164 | ||||
Reserves | ||||||
Proposed dividends | 1,156 | 2,119 | ||||
Others | 31,896 | 28,875 | ||||
Shareholders’ funds | 46,257 | 44,199 | ||||
Non-current liabilities | ||||||
Long-term borrowings | 22 | 25,479 | 17,596 | |||
Deferred tax liabilities | 5,115 | 5,084 | ||||
Derivative instruments | 18 | 666 | — | |||
Scheme of Control (SoC) reserve accounts | 24 | 3,338 | 3,720 | |||
Other non-current liabilities | 1,014 | 522 | ||||
| 35,612 | 26,922 | |||||
Equity and non-current liabilities | 81,869 | 71,121 | ||||
/s/ W. E. Mocatta | /s/ Andrew Brandler | /s/ Peter P. W. Tse | ||
W. E. Mocatta Vice Chairman | Andrew Brandler Group Managing Director & Chief Executive Officer | Peter P. W. Tse Group Executive Director & Chief Financial Officer | ||
| Hong Kong, 23 August 2005 | ||||
Table of Contents
Page 30
Condensed Consolidated Statement of Changes in Equity
(Unaudited) | Share Capital | Share Premium | Capital Redemption Reserve | Other Reserves | | Retained Profits | | Total | |||||||
| HK$M | HK$M | HK$M | HK$M | HK$M | HK$M | ||||||||||
Balance as at 1 January 2005, as previously reported | 12,041 | 1,164 | 2,482 | 830 | 27,682 | 44,199 | |||||||||
Adjustments for adoption of new HKFRSs | |||||||||||||||
Negative goodwill (HKFRS 3) (Notes 3,15) | — | — | — | — | 1,046 | 1,046 | |||||||||
Derivative instruments (HKAS 39) (Note 3) | — | — | — | (99 | ) | 83 | (16 | ) | |||||||
Balance as at 1 January 2005, as restated | 12,041 | 1,164 | 2,482 | 731 | 28,811 | 45,229 | |||||||||
Exchange differences on translation of: | |||||||||||||||
subsidiaries | — | — | — | (200 | ) | — | (200 | ) | |||||||
jointly controlled entities | — | — | — | (6 | ) | — | (6 | ) | |||||||
associated companies | — | — | — | (98 | ) | — | (98 | ) | |||||||
designated hedges | — | — | — | (6 | ) | — | (6 | ) | |||||||
Net losses not recognised in the profit and loss account | — | — | — | (310 | ) | — | (310 | ) | |||||||
Cash flow hedges, net of tax | — | — | — | 65 | — | 65 | |||||||||
Earnings for the period | — | — | — | — | 4,577 | 4,577 | |||||||||
Dividends paid | |||||||||||||||
2004 finals | — | — | — | — | (2,119 | ) | (2,119 | ) | |||||||
2005 interim | — | — | — | — | (1,156 | ) | (1,156 | ) | |||||||
Capital redemption by a subsidiary | — | — | — | 417 | (417 | ) | — | ||||||||
Share of movements in reserves of | |||||||||||||||
jointly controlled entities | — | — | — | (9 | ) | (14 | ) | (23 | ) | ||||||
associated company | — | — | — | (6 | ) | — | (6 | ) | |||||||
Balance as at 30 June 2005 | 12,041 | 1,164 | 2,482 | 888 | 29,682 | (a) | 46,257 | ||||||||
Company and subsidiaries | 12,041 | 1,164 | 2,482 | 846 | 25,821 | 42,354 | |||||||||
Jointly controlled entities | — | — | — | 35 | 3,233 | 3,268 | |||||||||
Associated companies | — | — | — | 7 | 628 | 635 | |||||||||
Balance as at 30 June 2005 | 12,041 | 1,164 | 2,482 | 888 | 29,682 | 46,257 | |||||||||
Balance as at 1 January 2004 | 12,041 | 1,164 | 2,482 | 387 | 24,167 | 40,241 | |||||||||
Exchange differences on translation of: | |||||||||||||||
subsidiaries | — | — | — | (341 | ) | — | (341 | ) | |||||||
jointly controlled entities | — | — | — | 49 | — | 49 | |||||||||
associated company | — | — | — | (49 | ) | — | (49 | ) | |||||||
designated hedges | — | — | — | 279 | — | 279 | |||||||||
Net losses not recognised in the profit and loss account | — | — | — | (62 | ) | — | (62 | ) | |||||||
Earnings for the period | — | — | — | — | 4,138 | 4,138 | |||||||||
Dividends paid | |||||||||||||||
2003 finals | — | — | — | — | (1,806 | ) | (1,806 | ) | |||||||
2004 interim | — | — | — | — | (1,084 | ) | (1,084 | ) | |||||||
| Share of movements in reserves of | |||||||||||||||
jointly controlled entities | — | — | — | 20 | (19 | ) | 1 | ||||||||
associated company | — | — | — | (25 | ) | — | (25 | ) | |||||||
Balance as at 30 June 2004 | 12,041 | 1,164 | 2,482 | 320 | 25,396 | (b) | 41,403 | ||||||||
Company and subsidiaries | 12,041 | 1,164 | 2,482 | 238 | 21,943 | 37,868 | |||||||||
Jointly controlled entities | — | — | — | 62 | 2,956 | 3,018 | |||||||||
Associated company | — | — | — | 20 | 497 | 517 | |||||||||
Balance as at 30 June 2004 | 12,041 | 1,164 | 2,482 | 320 | 25,396 | 41,403 | |||||||||
Notes:
| (a) | The proposed interim dividend as at 30 June 2005 and balance of retained profits after the proposed interim dividend were HK$1,156 million and HK$28,526 million respectively. |
| (b) | The proposed interim dividend as at 30 June 2004 and balance of retained profits after the proposed interim dividend were HK$1,084 million and HK$24,312 million respectively. |
Table of Contents
Page 31
Condensed Consolidated Cash Flow Statement
(Unaudited) 6 months ended 30 June | ||||||||||||||
| 2005 | 2004 | |||||||||||||
| Note | HK$M | HK$M | HK$M | HK$M | ||||||||||
Operating activities | ||||||||||||||
Net cash inflow from operations | 25 | 3,933 | 3,826 | |||||||||||
Operating interest paid | (408 | ) | (405 | ) | ||||||||||
Interest received | 64 | 19 | ||||||||||||
Profits tax paid | (170 | ) | (139 | ) | ||||||||||
Net cash inflow from operating activities | 3,419 | 3,301 | ||||||||||||
Investing activities | ||||||||||||||
Capital expenditure | (2,617 | ) | (2,825 | ) | ||||||||||
Capitalised interest paid | (143 | ) | (150 | ) | ||||||||||
Proceeds from disposal of fixed assets | 4 | 10 | ||||||||||||
Proceeds from disposal of other investments | — | 31 | ||||||||||||
Net cash outflow for acquisition of a subsidiary | (11,318 | ) | — | |||||||||||
Acquisition of remaining interest in a subsidiary | — | (376 | ) | |||||||||||
Net cash inflow on settlement of forward contracts for investment hedging | — | 86 | ||||||||||||
Investments in and advances to jointly controlled entities | (42 | ) | (220 | ) | ||||||||||
Dividends received from investments | ||||||||||||||
- jointly controlled entities | 1,639 | 1,855 | ||||||||||||
- associated company | 31 | 30 | ||||||||||||
Net cash outflow from investing activities | (12,446 | ) | (1,559 | ) | ||||||||||
Net cash (outflow)/inflow before financing activities | (9,027 | ) | 1,742 | |||||||||||
Financing activities | ||||||||||||||
Proceeds from long-term borrowings | 14,181 | 2,200 | ||||||||||||
Repayment of long-term borrowings | (6,103 | ) | (1,692 | ) | ||||||||||
Increase in short-term borrowings | 3,644 | 1,127 | ||||||||||||
Dividends paid | (3,275 | ) | (2,890 | ) | ||||||||||
Net cash inflow/(outflow) from financing activities | 8,447 | (1,255 | ) | |||||||||||
Net (decrease)/increase in cash and cash equivalents | (580 | ) | 487 | |||||||||||
Cash and cash equivalents at beginning of period | 2,520 | 787 | ||||||||||||
Effect of exchange rate changes | (8 | ) | (9 | ) | ||||||||||
Cash and cash equivalents at end of period | 1,932 | 1,265 | ||||||||||||
Analysis of balances of cash and cash equivalents | ||||||||||||||
Short-term investments | 69 | 46 | ||||||||||||
Deposits with banks | 1,728 | 742 | ||||||||||||
Cash at banks and on hand | 135 | 477 | ||||||||||||
| 1,932 | 1,265 | |||||||||||||
Table of Contents
Page 32
Notes to the Condensed Consolidated Interim Accounts
| 1. | General Information |
The Company, CLP Holdings Limited, and its subsidiaries are collectively referred to as the Group in the condensed consolidated interim accounts. The principal activity of the Company is investment holding whilst the principal activities of the subsidiaries are the generation and supply of electricity in Hong Kong, Australia and India, and investment holding of power projects in the Chinese mainland and other countries in the Asia-Pacific region.
The financial operations of the Company’s major subsidiary, CLP Power Hong Kong Limited (CLP Power Hong Kong), and its jointly controlled entity, Castle Peak Power Company Limited (CAPCO), are governed by a Scheme of Control (SoC) Agreement entered into with the Hong Kong Government. Our electricity business in Hong Kong is therefore also referred to as SoC business.
The condensed consolidated interim accounts have been approved for issue by the Board of Directors on 23 August 2005.
| 2. | Basis of Preparation and Accounting Policies |
The unaudited condensed consolidated interim accounts have been prepared in accordance with Hong Kong Accounting Standard (HKAS) 34 “Interim Financial Reporting” issued by the Hong Kong Institute of Certified Public Accountants.
The accounting policies used in the preparation of this condensed consolidated interim accounts are consistent with those set out in the Annual Report 2004, except that the Group has changed certain of its accounting policies following its adoption of new / revised Hong Kong Financial Reporting Standards (HKFRSs) and HKASs (collectively referred to as new HKFRSs) which are effective for accounting periods commencing on or after 1 January 2005.
Changes to the Group’s accounting policies and the effect of adopting these new policies are set out in Note 3 below.
Table of Contents
Page 33
| 3. | Changes in Accounting Policies |
In 2005, the Group adopted the new HKFRSs below, which are relevant to its operations. All changes in the accounting policies have been made in accordance with the transition provisions in the respective standards, with the 2004 comparatives amended in accordance with the relevant requirements.
| HKAS 1 | Presentation of Financial Statements | |
| HKAS 2 | Inventories | |
| HKAS 7 | Cash Flow Statements | |
| HKAS 8 | Accounting Policies, Changes in Accounting Estimates and Errors | |
| HKAS 10 | Events after the Balance Sheet Date | |
| HKAS 12 | Income Taxes | |
| HKAS 14 | Segment Reporting | |
| HKAS 16 | Property, Plant and Equipment | |
| HKAS 17 | Leases | |
| HKAS 18 | Revenue | |
| HKAS 19 | Employee Benefits | |
| HKAS 21 | The Effects of Changes in Foreign Exchange Rates | |
| HKAS 23 | Borrowing Costs | |
| HKAS 24 | Related Party Disclosures | |
| HKAS 27 | Consolidated and Separate Financial Statements | |
| HKAS 28 | Investments in Associates | |
| HKAS 31 | Investments in Joint Ventures | |
| HKAS 32 | Financial Instruments: Disclosure and Presentation | |
| HKAS 33 | Earnings Per Share | |
| HKAS 34 | Interim Financial Reporting | |
| HKAS 36 | Impairment of Assets | |
| HKAS 37 | Provisions, Contingent Liabilities and Contingent Assets | |
| HKAS 38 | Intangible Assets | |
| HKAS 39 | Financial Instruments: Recognition and Measurement | |
| HKFRS 2 | Share-based Payment | |
| HKFRS 3 | Business Combinations |
The adoption of above new HKFRSs has the following impact on the Group’s accounting policies:
| (A) | The adoption of HKASs 2, 7, 8, 10, 12, 14, 16, 18, 19, 21, 23, 24, 27, 28, 31, 33, 34, 37, 38 and HKFRS 2 do not result in substantial changes to the Group’s accounting policies. In summary: |
| - | HKASs 2, 7, 10, 12, 14, 18, 19, 21, 23, 27, 28, 34, 37, 38 and HKFRS 2 have no material effect on the Group’s policies; and |
| - | HKASs 8, 16, 24, 31 and 33 have affected certain disclosure in the accounts. |
Table of Contents
Page 34
| 3. | Changes in Accounting Policies (continued) |
| (B) | HKAS 1 “Presentation of Financial Statements” |
HKAS 1 has affected certain presentation and disclosure in the accounts. Major changes relate to the presentation of (a) share of profits from Hok Un joint venture and transfers under the SoC arrangement, which had been shown separately on the profit and loss account and (b) share of results of affiliated companies which represented the Group’s share of affiliated companies’ profits or losses before taxation.
Pursuant to the provision of HKAS 1 which prohibits presentation of any items of income and expense as extraordinary items, the Group has reclassified (a) the share of profits from Hok Un as part of the share of results from jointly controlled entities, (b) the transfers from/(to) Development Fund and special provision account as adjustments to revenue (Note 5) and (c) the transfer to Rate Reduction Reserve as part of the finance costs (Note 8). The Group’s share of results of the affiliated companies has also been presented on an after taxation basis, as prescribed under HKAS 1. These changes have no effect on earnings.
| (C) | HKAS 17 “Leases” |
The adoption of HKAS 17 has resulted in a change in the accounting policy relating to leasehold land. In prior years, the leasehold land was accounted for as fixed assets and carried at cost less accumulated depreciation. HKAS 17, however, prescribes leasehold land to be accounted for as an operating lease if title is not expected to pass to the lessee by the end of the lease term. Pursuant to the requirements, the lease premium for land is initially stated at cost and amortised over the period of the lease.
The retrospective application of HKAS 17 has resulted in a reclassification of unamortised lease premium for land from Fixed Assets to Leasehold Land, with a decrease in fixed assets and a corresponding increase in leasehold land of HK$2,218 million at 30 June 2005 (December 2004: HK$2,240 million). There was no impact on the profit and loss account.
| (D) | HKAS 32 “Financial Instruments: Disclosure and Presentation” and HKAS 39 “Financial Instruments: Recognition and Measurement” |
The adoption of HKAS 32 and HKAS 39 has resulted in a change in the accounting policy for recognition, measurement, derecognition and disclosure of financial instruments. Apart from the accounting for derivative instruments which are described below, HKAS 39 requires that where an entity sells a portfolio of receivables with recourse, that portfolio should be accounted for as a collateralised borrowing, since it does not qualify for derecognition. In the past, the Group followed the principles under the replaced accounting standard SSAP 28 “Provisions, Contingent Liabilities and Contingent Assets” and disclosed such type of transaction as contingent liabilities.
Prior to 1 January 2005, derivative instruments of the Group were not recorded on the balance sheet based on the then prevailing accounting standards. In accordance with the provisions of HKAS 39, however, a derivative or embedded derivative is initially recognised at fair value on the date a derivative contract or hybrid contract is entered into and is subsequently re-measured at its fair value. The method of recognising the resulting gain or loss depends on whether the derivative is designated as a hedging instrument, and if so, the nature of the item being hedged. The Group designates certain derivatives as either hedges of the fair value of recognised assets or liabilities (fair value hedges) or hedges of highly probable forecast transactions (cash flow hedges).
Table of Contents
Page 35
| 3. | Changes in Accounting Policies (continued) |
| (D) | HKAS 32 “Financial Instruments: Disclosure and Presentation” and HKAS 39 “Financial Instruments: Recognition and Measurement” (continued) |
Changes in fair value of derivatives that are designated and qualify as fair value hedges are recorded in the profit and loss account, together with any changes in the fair value of the hedged asset or liability that are attributable to the hedged risk. For derivatives that are designated and qualify as cash flow hedges, the effective portion of changes in fair value of derivatives is recognised in equity while the gain or loss relating to the ineffective portion is recognised immediately in the profit and loss account. Amounts accumulated in the equity are transferred to the profit and loss account or reclassified as part of the initial cost or carrying amount of an asset or liability in the period when the hedged item affects earnings or the asset or liability is recognised.
The Group has adopted HKAS 32 and HKAS 39 prospectively. For receivables sold with recourse, the change in the accounting policy has resulted in an increase in receivables and a corresponding increase in borrowings of HK$653 million on 1 January 2005 (June 2005: HK$277 million). The Group also identified derivatives embedded in contracts. Recognition of such embedded derivatives has resulted in an increase in receivables and a corresponding increase in the balance of the retained profits as at 1 January 2005 of HK$157 million (June 2005: HK$140 million).
The Group further recognised financial and energy derivatives at fair value in the balance sheet on 1 January 2005 which amounted to a net liability of HK$1,199 million. The corresponding adjustments were to (a) decrease the Group’s share of net assets of affiliated companies by HK$110 million, (b) increase the carrying amount of hedged borrowings by HK$249 million, (c) increase the deferred tax assets and liabilities by HK$29 million and HK$7 million respectively, (d) increase the other assets and liabilities by HK$1,368 million and HK$5 million respectively, and (e) decrease the reserves by HK$173 million. Adjustments to the balance sheet as at 30 June 2005 as a result of recognising these types of derivative instruments were to (a) increase in derivative instruments (net assets) by HK$90 million, (b) decrease the Group’s share of net assets of affiliated companies by HK$127 million, (c) increase the carrying amount of hedged borrowings by HK$176 million, (d) decrease the deferred tax assets and goodwill by HK$56 million and HK$130 million respectively, (e) increase the other assets by HK$269 million and (f) decrease the reserves by HK$130 million.
The Group has re-assessed the classification of the SoC reserves as a liability on the balance sheet under HKAS 32 and continues to consider that they meet the definition of a liability. Consequently, no adjustment to, or reclassification of, these balances is required as a result of the introduction of HKAS 32.
| (E) | HKFRS 3 “Business Combinations” and HKAS 36 “Impairment of Assets” |
Until 31 December 2004, goodwill was amortised on a straight-line basis over its estimated useful life and assessed for impairment whenever events or changes in circumstances indicated that its carrying amount might not be recoverable. The adoption of HKFRS 3 and HKAS 36 has resulted in a change in the accounting policy for goodwill. In accordance with the provisions of HKFRS 3, the Group ceased amortisation of goodwill from 1 January 2005 and now tests for impairment annually and when there are indications of impairment. Pursuant to its transitional provisions, the Group also (a) eliminated the accumulated amortisation of goodwill of HK$5 million as at 31 December 2004 with a corresponding decrease in the cost of goodwill and (b) derecognised the unamortised negative goodwill of HK$1,046 million, with a corresponding adjustment to the balance of retained profits on 1 January 2005. No impairment loss has been recognised during the first half of 2005.
Table of Contents
Page 36
| 4. | Acquisition of Merchant Energy Business in Australia |
On 31 May 2005, the Group completed the acquisition of the merchant energy business division (MEB) of SPI Australia Group, a wholly-owned subsidiary of Singapore Power Limited (Singapore Power). The MEB is the fifth largest energy retailer in Australia and sells gas and electricity to over 1.1 million customers across Victoria, New South Wales, South Australia and Queensland. In addition, it owns a 1,280MW gas-fired power station at Torrens Island, South Australia, an interest in a long-term hedge contract for up to 966MW, and a gas storage facility.
The acquisition involved separation of the MEB from SPI Australia Group’s other businesses in Australia. As it was completed only one month prior to the balance sheet date, the fair values assigned to the identifiable assets, liabilities and contingent liabilities, if any, are provisional. It is also considered that, given the time constraints, it is not practicable to reasonably estimate and disclose the revenue and profit or loss of this newly acquired business for the six-month period as though the acquisition took place on 1 January 2005.
Details of the net assets acquired and goodwill and other intangible assets are as follows:
| (A) | Assets and liabilities arising from the acquisition: |
| Fair Value | Carrying Amount | |||||
| HK$M | HK$M | |||||
Fixed assets (Note 14) | 5,724 | 6,192 | ||||
Derivative instruments, net | 186 | 186 | ||||
Trade receivables | 1,503 | 1,503 | ||||
Bank balances, cash and other liquid funds | 598 | 598 | ||||
Trade payables | (754 | ) | (754 | ) | ||
Total borrowings | (1,550 | ) | (1,550 | ) | ||
Other net (liabilities)/assets | (765 | ) | 2,443 | (a) | ||
Fair value of net assets acquired | 4,942 | 8,618 | ||||
| Note (a): | The carrying amount included goodwill of HK$2,636 million arising from restructuring of the MEB by SPI Australia Group prior to the acquisition by the CLP Group. |
| (B) | Goodwill and other intangible assets arising from the acquisition: |
| HK$M | |||
Purchase consideration: | |||
- cash paid | 11,876 | ||
- direct costs relating to the acquisition | 40 | ||
Total purchase consideration | 11,916 | ||
Fair value of net assets acquired (as shown above) | (4,942 | ) | |
Goodwill and other intangible assets (Note 15) | 6,974 | ||
The MEB, when combined with the Group’s existing Yallourn Energy, has created a diversified energy business across retail and generation. The above goodwill and other intangible assets are primarily attributable to the customer base of the retail business and significant synergies expected to arise after the acquisition. To the extent that the fair values of assets and liabilities acquired may be revised, there will be a corresponding impact on goodwill.
The acquired business contributed revenue of HK$935 million and earnings of HK$6 million to the Group for the period from 1 June 2005 to 30 June 2005.
Table of Contents
Page 37
| 4. | Acquisition of Merchant Energy Business in Australia (continued) |
The acquisition of the MEB also included the acquisition of Singapore Power’s 33.3% interest in SEAGas partnership, which is subject to the consents from other partners of SEAGas and is targeted for completion in the third quarter of 2005 (Note 26).
| 5. | Revenue |
An analysis of the Group’s revenue for the period is as follows:
| 6 months ended 30 June | ||||
2005 HK$M | 2004 HK$M | |||
Sales of electricity | 15,842 | 13,783 | ||
Sales of gas | 313 | — | ||
Other revenue | 133 | 139 | ||
| 16,288 | 13,922 | |||
Transfer from Development Fund (A) | 338 | 597 | ||
Transfer from special provision account | — | 96 | ||
| 16,626 | 14,615 | |||
| (A) | Pursuant to the SoC Agreement, if the gross tariff revenue in Hong Kong in any year exceeds or is less than the total of the operating costs, permitted return and taxation charges, such excess shall be added to, or such deficiency shall be deducted from, the Development Fund (Note 24). |
Table of Contents
Page 38
| 6. | Segment Information |
The Group operates, through its subsidiaries, jointly controlled entities and associated companies, in three major geographical regions - Hong Kong, the Chinese mainland and the Asia-Pacific region. Information about the Group’s operations by geographical regions is as follows:
| Hong Kong | Chinese Mainland | Asia-Pacific Region | Unallocated Items | Total | |||||||||
| HK$M | HK$M | HK$M | HK$M | HK$M | |||||||||
6 months ended 30 June 2005 | |||||||||||||
Revenue | 13,704 | — | 2,922 | — | 16,626 | ||||||||
Segment results | 3,575 | (37 | ) | 549 | (74 | ) | 4,013 | ||||||
Share of results, net of tax | |||||||||||||
jointly controlled entities | 930 | 563 | (a) | 121 | — | 1,614 | |||||||
associated companies | — | — | 79 | — | 79 | ||||||||
Profit/(Loss) before financing and taxation | 4,505 | 526 | 749 | (74 | ) | 5,706 | |||||||
Finance costs | (725 | ) | |||||||||||
Finance income | 63 | ||||||||||||
Taxation | (467 | ) | |||||||||||
Earnings for the period | 4,577 | ||||||||||||
Capital additions | 1,912 | — | 267 | — | 2,179 | ||||||||
Depreciation and amortisation | 986 | 1 | 371 | 1 | 1,359 | ||||||||
As at 30 June 2005 | |||||||||||||
Segment assets | 46,611 | 153 | 34,952 | 172 | 81,888 | ||||||||
Investments in | |||||||||||||
jointly controlled entities | 6,982 | 6,569 | 1,335 | — | 14,886 | ||||||||
associated companies | — | — | 1,596 | — | 1,596 | ||||||||
Tax assets | — | — | 368 | — | 368 | ||||||||
Consolidated total assets | 53,593 | 6,722 | 38,251 | 172 | 98,738 | ||||||||
Segment liabilities | 10,125 | 44 | 3,973 | 60 | 14,202 | ||||||||
Total borrowings | — | — | 14,757 | 17,745 | 32,502 | ||||||||
Tax liabilities | 5,479 | — | 298 | — | 5,777 | ||||||||
Consolidated total liabilities | 15,604 | 44 | 19,028 | 17,805 | 52,481 | ||||||||
| Note (a): | Out of the HK$563 million, HK$431 million was attributed to investments in Guangdong Nuclear Power Joint Venture Company, Limited (GNPJVC) and Hong Kong Pumped Storage Development Company, Limited (PSDC), whose generating facilities serve Hong Kong. |
Table of Contents
Page 39
| 6. | Segment Information (continued) |
| Hong Kong | Chinese Mainland | | Asia-Pacific Region | Unallocated Items | | Total | ||||||||
| HK$M | HK$M | HK$M | HK$M | HK$M | ||||||||||
6 months ended 30 June 2004 | ||||||||||||||
Revenue | 12,649 | — | 1,966 | — | 14,615 | |||||||||
Segment results | 3,174 | (98 | ) | 624 | (75 | ) | 3,625 | |||||||
Share of results, net of tax | ||||||||||||||
jointly controlled entities | 925 | 521 | (a) | 95 | — | 1,541 | ||||||||
associated companies | (2 | ) | — | 118 | — | 116 | ||||||||
Profit/(Loss) before financing and taxation | 4,097 | 423 | 837 | (75 | ) | 5,282 | ||||||||
Finance costs | (595 | ) | ||||||||||||
Finance income | 23 | |||||||||||||
Taxation | (572 | ) | ||||||||||||
Earnings for the period | 4,138 | |||||||||||||
Capital additions | 2,315 | 1 | 321 | — | 2,637 | |||||||||
Depreciation and amortisation | 922 | 1 | 295 | 1 | 1,219 | |||||||||
As at 31 December 2004 | ||||||||||||||
Segment assets | 44,374 | 215 | 18,324 | 205 | 63,118 | |||||||||
Investments in | ||||||||||||||
jointly controlled entities | 6,894 | 6,643 | 1,461 | — | 14,998 | |||||||||
associated company | — | — | 1,640 | — | 1,640 | |||||||||
Tax assets | — | — | 1,043 | — | 1,043 | |||||||||
Consolidated total assets | 51,268 | 6,858 | 22,468 | 205 | 80,799 | |||||||||
Segment liabilities | 10,731 | 60 | 1,482 | 66 | 12,339 | |||||||||
Total borrowings | — | — | 7,503 | 11,271 | 18,774 | |||||||||
Tax liabilities | 5,067 | — | 420 | — | 5,487 | |||||||||
Consolidated total liabilities | 15,798 | 60 | 9,405 | 11,337 | 36,600 | |||||||||
| Note (a): | Out of the HK$521 million, HK$380 million was attributed to investments in GNPJVC and PSDC, whose generating facilities serve Hong Kong. |
No business analysis is shown as substantially all the principal activities of the Group are for the generation and supply of electricity. The SoC business accounted for approximately 100% of the Group’s revenue and segment results in Hong Kong for the period ended 30 June 2005.
Table of Contents
Page 40
| 7. | Operating Profit |
Operating profit is stated after charging/(crediting) the following:
| 6 months ended 30 June | ||||||
| 2005 | 2004 | |||||
| HK$M | HK$M | |||||
Charging | ||||||
Staff costs (A) | ||||||
Salaries and other costs | 800 | 777 | ||||
Retirement benefits costs | 68 | 69 | ||||
Net loss on disposal of fixed assets | 25 | 83 | ||||
Other net exchange losses / (gains) | 24 | (10 | ) | |||
Unrealised loss on other investments | — | 33 | ||||
Crediting | ||||||
Other net fair value gains on derivative instruments | ||||||
Cash flow hedges, transfer from equity | (68 | ) | — | |||
Transactions not qualifying as hedges | (7 | ) | — | |||
Net rental income from properties | (7 | ) | (7 | ) | ||
| (A) | Staff costs include amounts recharged to jointly controlled entities for services provided. |
| 8. | Finance Costs and Income |
| 6 months ended 30 June | ||||||
| 2005 | 2004 | |||||
| HK$M | HK$M | |||||
Finance costs: | ||||||
Interest expenses on | ||||||
bank loans and overdrafts | 341 | 373 | ||||
other borrowings | ||||||
- wholly repayable within five years | 82 | 82 | ||||
- not wholly repayable within five years | 100 | 73 | ||||
Development Fund and special provision account (A) | 120 | 112 | ||||
customers’ deposits and others | 43 | 20 | ||||
Finance charges | 20 | 14 | ||||
Fair value loss on financial instruments | ||||||
Cash flow hedges, transfer from equity | 174 | — | ||||
Hedging costs and exchange gains/losses | (2 | ) | 62 | |||
| 878 | 736 | |||||
Less: amount capitalised | (153 | ) | (141 | ) | ||
| 725 | 595 | |||||
Finance income: | ||||||
Interest income on | ||||||
short-term investments and bank deposits | 62 | 23 | ||||
advance to a jointly controlled entity | 1 | — | ||||
| 63 | 23 | |||||
| (A) | In accordance with the provisions of the SoC Agreement, CLP Power Hong Kong is required to credit, to a Rate Reduction Reserve in its accounts, a charge of 8% per annum on the sum of the average balances of the Development Fund and special provision account (Note 24). |
Table of Contents
Page 41
| 9. | Share of Results of Affiliated Companies |
Affiliated companies include the Group’s jointly controlled entities and associated companies. The share of results of affiliated companies is determined based upon the management accounts of the respective affiliated companies, after making adjustments to conform with the Group’s significant accounting policies, for the period ended 30 June.
| 10. | Taxation |
Taxation in the condensed consolidated profit and loss account represents the taxation of the Company and subsidiaries and is analysed below:
| 6 months ended 30 June | |||||
| 2005 | 2004 | ||||
| HK$M | HK$M | ||||
Current income tax | |||||
Hong Kong | 418 | 333 | |||
Outside Hong Kong | 14 | 15 | |||
| 432 | 348 | ||||
Deferred income tax | |||||
Hong Kong | 126 | 165 | |||
Outside Hong Kong | (91 | ) | 59 | ||
| 35 | 224 | ||||
| 467 | 572 | ||||
Hong Kong profits tax has been provided at the rate of 17.5% (2004: 17.5%) on the estimated assessable profits for the period. Taxation on profits assessable outside Hong Kong has been provided at the rates prevailing in the respective jurisdictions.
| 11. | Earnings Attributable to Shareholders |
| 6 months ended 30 June | ||||||||||||
| 2005 | 2004 | |||||||||||
| HK$M | HK$M | HK$M | HK$M | |||||||||
Earnings from electricity business in Hong Kong (page 56) | 3,510 | 3,337 | ||||||||||
Electricity sales to Chinese mainland from Hong Kong | 63 | 30 | ||||||||||
Generating facilities in Chinese mainland serving Hong Kong (GNPJVC and PSDC) | 431 | 380 | ||||||||||
Other power projects in Chinese mainland | 95 | 43 | ||||||||||
Energy businesses in Asia-Pacific region | 425 | 404 | ||||||||||
Group non-energy activities | (4 | ) | (66 | ) | ||||||||
Earnings from other investments/activities | 1,010 | 791 | ||||||||||
Unallocated net finance costs | (43 | ) | (39 | ) | ||||||||
Unallocated Group expenses | (74 | ) | (75 | ) | ||||||||
Total operating earnings | 4,403 | 4,014 | ||||||||||
Hok Un redevelopment profit | 174 | 124 | ||||||||||
Total earnings | 4,577 | 4,138 | ||||||||||
Table of Contents
Page 42
| 12. | Dividends |
| 6 months ended 30 June | ||||||||
| 2005 | 2004 | |||||||
| HK$ per share | HK$M | HK$ per share | HK$M | |||||
First interim dividend paid | 0.48 | 1,156 | 0.45 | 1,084 | ||||
Second interim dividend proposed | 0.48 | 1,156 | 0.45 | 1,084 | ||||
| 0.96 | 2,312 | 0.90 | 2,168 | |||||
At the Board meeting held on 23 August 2005, the Directors declared the second interim dividend of HK$0.48 per share. The second interim dividend is not reflected as a dividend payable in the accounts, but as a separate component of the shareholders’ funds for the period ended 30 June 2005.
| 13. | Earnings per Share |
The prescribed earnings per share includes Hok Un redevelopment profit and is computed as follows:
| 6 months ended 30 June | ||||
| 2005 | 2004 | |||
Earnings for the period (HK$M) | 4,577 | 4,138 | ||
Weighted average number of shares in issue (thousand shares) | 2,408,246 | 2,408,246 | ||
Earnings per share (HK$) | 1.90 | 1.72 | ||
To enable investors to understand better the Group’s results, an additional earnings per share figure, excluding the Hok Un redevelopment profit, is provided below:
| 6 months ended 30 June | ||||||
| 2005 | 2004 | |||||
| HK$M | HK$M | |||||
Earnings for the period | 4,577 | 4,138 | ||||
Less: Hok Un redevelopment profit | (174 | ) | (124 | ) | ||
Earnings excluding Hok Un redevelopment profit | 4,403 | 4,014 | ||||
Earnings per share excluding Hok Un redevelopment profit (HK$) | 1.83 | 1.67 | ||||
Fully diluted earnings per share is not included as the Company did not have any diluting equity instruments as at 30 June 2005 (2004: nil).
Table of Contents
Page 43
| 14. | Fixed Assets and Leasehold Land |
Fixed assets and leasehold land totalled HK$63,976 million (December 2004: HK$57,748 million). When employed for the SoC business, they are collectively referred to as SoC fixed assets and amounted to HK$43,296 million as at 30 June 2005 (December 2004: HK$42,415 million). Fixed assets and leasehold land that were attributed to overseas subsidiaries in Australia and India totalled HK$20,502 million (December 2004: HK$15,147 million). Movements in the accounts are as follows:
| (A) | Fixed Assets: |
| Freehold Land and Buildings | | Plant, Machinery and Equipment(a) | | Total | ||||||||||||||
| 30 June 2005 | | 31 December 2004 | | 30 June 2005 | | 31 December 2004 | | 30 June 2005 | | 31 December 2004 | | |||||||
| HK$M | HK$M | HK$M | HK$M | HK$M | HK$M | |||||||||||||
Net book value, at beginning of period/year | ||||||||||||||||||
- as previously reported | 8,242 | 7,756 | 49,506 | 46,401 | 57,748 | 54,157 | ||||||||||||
- reclassification of leasehold land (Note 3) | (2,240 | ) | (2,229 | ) | — | — | (2,240 | ) | (2,229 | ) | ||||||||
- as restated | 6,002 | 5,527 | 49,506 | 46,401 | 55,508 | 51,928 | ||||||||||||
Acquisition of a subsidiary (Note 4) | 29 | — | 5,695 | — | 5,724 | — | ||||||||||||
Additions | 223 | 703 | 1,955 | 5,059 | 2,178 | 5,762 | ||||||||||||
Transfers and disposals | (1 | ) | (74 | ) | (50 | ) | (228 | ) | (51 | ) | (302 | ) | ||||||
Depreciation charge | (88 | ) | (170 | ) | (1,248 | ) | (2,309 | ) | (1,336 | ) | (2,479 | ) | ||||||
Exchange differences | (4 | ) | 16 | (261 | ) | 583 | (265 | ) | 599 | |||||||||
Net book value, at end of period/year | 6,161 | 6,002 | 55,597 | 49,506 | 61,758 | 55,508 | ||||||||||||
Cost | 7,984 | 7,739 | 80,134 | 71,901 | 88,118 | 79,640 | ||||||||||||
Accumulated depreciation | (1,823 | ) | (1,737 | ) | (24,537 | ) | (22,395 | ) | (26,360 | ) | (24,132 | ) | ||||||
Net book value, at end of period/year | 6,161 | 6,002 | 55,597 | 49,506 | 61,758 | 55,508 | ||||||||||||
| Note (a): | Plant, machinery and equipment included leased generating plants for our electricity business in Australia held under agreements which are treated as finance leases. The net book value of these leased assets as at 30 June 2005 was HK$4,681 million. |
Table of Contents
Page 44
| 14. | Fixed Assets and Leasehold Land (continued) |
| (B) | Leasehold Land: |
| 30 June 2005 | | 31 December 2004 | | |||
| HK$M | HK$M | |||||
Net book value, at beginning of period/year | ||||||
- as previously reported | — | — | ||||
- reclassification of leasehold land (Note 3) | 2,240 | 2,229 | ||||
- as restated | 2,240 | 2,229 | ||||
Additions | 1 | 61 | ||||
Amortisation charge | (23 | ) | (50 | ) | ||
Net book value, at end of period/year | 2,218 | 2,240 | ||||
Cost | 2,291 | 2,290 | ||||
Accumulated amortisation | (73 | ) | (50 | ) | ||
Net book value, at end of period/year | 2,218 | 2,240 | ||||
Leasehold land is mainly held under medium to long term leases (i.e. over 10 years) in Hong Kong. The SoC Agreement considers leasehold land as one type of fixed assets on which permitted return is earned.
Capital expenditure on fixed assets and leasehold land incurred during the period for the SoC business was HK$1,911 million (2004: HK$2,313 million).
Table of Contents
Page 45
| 15. | Goodwill and other Intangible Assets |
| Goodwill and other Intangible Assets HK$M | | Negative Goodwill HK$M | | Net Balance HK$M | | ||||
As at 30 June 2005 | |||||||||
Net carrying value, at beginning of period | |||||||||
- as previously reported | 24 | (1,046 | ) | (1,022 | ) | ||||
- derecognition of negative goodwill (Note 3) | — | 1,046 | 1,046 | ||||||
- as restated | 24 | — | 24 | ||||||
Acquisition of a subsidiary (Note 4) | 6,974 | — | 6,974 | ||||||
Exchange differences | (37 | ) | — | (37 | ) | ||||
Net carrying value | 6,961 | — | 6,961 | ||||||
Cost | 6,961 | — | 6,961 | ||||||
As at 31 December 2004 | |||||||||
Net carrying value, at beginning of year | 25 | (1,042 | ) | (1,017 | ) | ||||
Acquisition of remaining interest in a subsidiary | — | (21 | ) | (21 | ) | ||||
Fair value adjustments | — | 11 | 11 | ||||||
Amortisation (charge) / credit | (2 | ) | 46 | 44 | |||||
Exchange differences | 1 | (40 | ) | (39 | ) | ||||
Net carrying value, at end of year | 24 | (1,046 | ) | (1,022 | ) | ||||
Cost | 29 | (1,164 | ) | (1,135 | ) | ||||
Accumulated amortisation | (5 | ) | 118 | 113 | |||||
Net carrying value | 24 | (1,046 | ) | (1,022 | ) | ||||
The above goodwill and other intangible assets of HK$6,974 million arose from the acquisition of the MEB at the end of May 2005. The fair value of net assets acquired could only be determined provisionally at the balance sheet date and the Group is still in the process of identifying any intangible assets that can be recognised separately from goodwill. The allocation between goodwill and intangible assets is expected to be finalised by the end of 2005.
Table of Contents
Page 46
| 16. | Investments in Jointly Controlled Entities |
| 30 June 2005 | 31 December 2004 | |||
| HK$M | HK$M | |||
Castle Peak Power Company Limited | 6,399 | 6,296 | ||
Guangdong Nuclear Power Joint Venture Company, Limited | 2,786 | 3,050 | ||
Ho-Ping Power Company | 1,311 | 1,326 | ||
CLP Guohua Power Company Limited | 1,315 | 1,222 | ||
Shandong Zhonghua Power Company, Ltd. | 1,063 | 1,132 | ||
Guizhou CLP Power Company Limited | 423 | 466 | ||
Hok Un joint venture | 439 | 343 | ||
Hong Kong Pumped Storage Development Company, Limited | 326 | 324 | ||
Others | 824 | 839 | ||
| 14,886 | 14,998 | |||
The above amount includes the loan and advances made to the following jointly controlled entities:
| 30 June 2005 | 31 December 2004 | |||
| HK$M | HK$M | |||
Castle Peak Power Company Limited | 6,073 | 6,115 | ||
Hong Kong Pumped Storage Development Company, Limited | 308 | 313 | ||
Others | 266 | 253 | ||
| 6,647 | 6,681 | |||
The Group’s share of results of the jointly controlled entities is as follows:
| 6 months ended 30 June | ||||||
| 2005 | 2004 | |||||
| HK$M | HK$M | |||||
Revenue | 5,935 | 5,026 | ||||
Expenses | (4,062 | ) | (3,292 | ) | ||
Share of profit before taxation | 1,873 | 1,734 | ||||
Taxation | (259 | ) | (193 | ) | ||
Share of profit after taxation | 1,614 | 1,541 | ||||
Table of Contents
Page 47
| 16. | Investments in Jointly Controlled Entities (continued) |
The following amounts represent the Group’s share of net assets, capital commitment and contingent liabilities of the jointly controlled entities:
| 30 June 2005 | | 31 December 2004 | | |||
| HK$M | HK$M | |||||
Non-current assets | 28,785 | 29,190 | ||||
Current assets | 4,544 | 4,034 | ||||
Current liabilities | (4,263 | ) | (3,835 | ) | ||
Non-current liabilities | (20,827 | ) | (21,072 | ) | ||
Net assets at end of period/year | 8,239 | 8,317 | ||||
Capital commitments at end of period/year | 4,890 | 3,902 | ||||
Contingent liabilities at end of period/year | 613 | 625 | ||||
The Group’s capital commitment in relation to its interest in the jointly controlled entities is disclosed in Note 26. There are no contingent liabilities relating to the Group’s interest in these entities.
| 17. | Investments in Associated Companies |
| 30 June 2005 | 31 December 2004 | |||
| HK$M | HK$M | |||
Electricity Generating Public Company Limited | 1,591 | 1,640 | ||
Gascor Pty Ltd | 5 | — | ||
| 1,596 | 1,640 | |||
The Group, through its acquisition of the MEB in Australia, indirectly holds 1/3 interest in Gascor Pty Ltd, a company incorporated in Australia whose principal activity is to manage the gas sales agreement between Victoria’s main gas wholesaler and retailers.
The Group’s share of results of the associated companies is as follows:
| 6 months ended 30 June | ||||||
| 2005 | 2004 | |||||
| HK$M | HK$M | |||||
Share of profit before taxation | 103 | 143 | ||||
Taxation | (24 | ) | (27 | ) | ||
Share of profit after taxation | 79 | 116 | ||||
The Group did not have any loan or advances made to associated companies. In addition, there are no contingent liabilities relating to the Group’s interest in these companies.
Table of Contents
Page 48
| 18. | Derivative Instruments |
| 30 June 2005 | 31 December 2004 | |||||||||
| Assets HK$M | | Liabilities HK$M | | Assets HK$M | Liabilities HK$M | |||||
Cash flow hedges | ||||||||||
Forward foreign exchange contracts | 55 | 274 | — | — | ||||||
Interest rate swaps / cross currency & interest rate swaps | 36 | 81 | — | — | ||||||
Energy contracts | 331 | 251 | — | — | ||||||
Fair value hedge | ||||||||||
Cross currency & interest rate swap | 165 | — | — | — | ||||||
Held for trading or not qualifying as hedges | ||||||||||
Forward foreign exchange contracts | 7 | 19 | — | — | ||||||
Interest rate swaps | — | 38 | — | — | ||||||
Energy contracts | 748 | 589 | — | — | ||||||
| 1,342 | 1,252 | — | — | |||||||
Less: current portion | (870 | ) | (586 | ) | — | — | ||||
Non-current portion of derivative instruments | 472 | 666 | — | — | ||||||
Derivative instruments qualify as cash flow hedges as at 30 June 2005 have a maturity of between 1 month to 7 years from
the balance sheet date.
2004 comparative figures are not provided as HKAS 39 “Financial Instruments: Recognition and Measurement” prescribes
the recognition of derivatives at fair value in the balance sheet to take effect prospectively from 1 January 2005.
| 19. | Trade and Other Receivables |
| 30 June 2005 | 31 December 2004 | |||
| HK$M | HK$M | |||
Trade receivables (aging analysis is shown below) | 5,047 | 2,376 | ||
Deposits and prepayments | 1,330 | 986 | ||
Dividend receivable from jointly controlled entities | 170 | 196 | ||
Current accounts with jointly controlled entities | 12 | 6 | ||
| 6,559 | 3,564 | |||
Trade and other receivables attributed to overseas subsidiaries amounted to HK$3,799 million (December 2004: HK$1,610 million).
The Group has established credit policies for customers in each of its core businesses. The credit term for trade receivables ranges from 15 to 60 days.
The aging analysis of the trade receivables, after provisions, is as follows:
| 30 June 2005 | 31 December 2004 | |||
| HK$M | HK$M | |||
Below 30 days (including amount not yet due) | 4,568 | 2,332 | ||
31-60 days | 216 | 15 | ||
61-90 days | 53 | 7 | ||
Over 90 days | 210 | 22 | ||
| 5,047 | 2,376 | |||
Table of Contents
Page 49
| 20. | Bank Balances, Cash and Other Liquid Funds |
| 30 June 2005 | 31 December 2004 | |||
| HK$M | HK$M | |||
Trust fund for unclaimed dividends | 13 | 16 | ||
Trust accounts under TRAA (A) | 541 | 549 | ||
Short-term investments and bank deposits | 1,258 | 1,857 | ||
Bank balances and cash | 120 | 98 | ||
| 1,932 | 2,520 | |||
| (A) | Pursuant to a Trust and Retention Account Agreement (TRAA) between GPEC and its lenders, GPEC allocates monthly receipts from its off-taker, Gujarat Electricity Board, to various trust accounts for fuel, operating and major maintenance expenses and debt service payments. These amounts are placed by GPEC on short-term deposits or investments prior to being applied for the designated purposes. |
| 21. | Trade and Other Payables |
| 30 June 2005 | 31 December 2004 | |||
| HK$M | HK$M | |||
Trade payables (aging analysis is shown below) | 2,453 | 2,064 | ||
Other payables and accruals | 1,310 | 1,053 | ||
Current accounts with jointly controlled entities (A) | 1,152 | 1,099 | ||
| 4,915 | 4,216 | |||
| (A) | Of the amount due to the jointly controlled entities, HK$956 million (December 2004: HK$914 million) was due to CAPCO. |
The aging analysis of the trade payables is as follows:
| 30 June 2005 | 31 December 2004 | |||
| HK$M | HK$M | |||
Below 30 days (including amount not yet due) | 2,437 | 2,043 | ||
31-60 days | 1 | 2 | ||
61-90 days | 3 | 4 | ||
Over 90 days | 12 | 15 | ||
| 2,453 | 2,064 | |||
Table of Contents
Page 50
| 22. | Borrowings and Obligations under Finance Leases |
Total borrowings in the condensed consolidated balance sheet are analysed as follows:
| Current | Non-Current | Total | ||||||||||
| 30 June 2005 | 31 December 2004 | 30 June 2005 | 31 December 2004 | 30 June 2005 | 31 December 2004 | |||||||
HK$M
| HK$M
| HK$M
| HK$M
| HK$M
| HK$M
| |||||||
Short-term loans | 4,343 | 422 | — | — | 4,343 | 422 | ||||||
Long-term bank loans | 284 | 756 | 18,494 | 10,916 | 18,778 | 11,672 | ||||||
Other long-term borrowings | 2,340 | — | 5,506 | 6,680 | 7,846 | 6,680 | ||||||
Bank loans and other borrowings (A) | 6,967 | 1,178 | 24,000 | 17,596 | 30,967 | 18,774 | ||||||
Obligations under finance leases (B) | 56 | — | 1,479 | — | 1,535 | — | ||||||
| 7,023 | 1,178 | 25,479 | 17,596 | 32,502 | 18,774 | |||||||
| (A) | Bank Loans and Other Borrowings |
During the six months ended 30 June 2005, the Group arranged an AUD2,450 million and a HK$6,000 million unsecured loan facilities and used part of the facilities to fund the acquisition of the MEB and working capital requirements for our business in Australia and to refinance the existing facilities of Yallourn Energy. The Group also issued HK$1,000 million fixed rate notes under the Medium Term Note Programme to support the capital requirements of the electricity business in Hong Kong. The Group’s bank loans and other borrowings were repayable as follows:
| Bank Loans | Other Borrowings | Total | ||||||||||
| 30 June 2005 | 31 December 2004 | 30 June 2005 | 31 December 2004 | 30 June 2005 | 31 December 2004 | |||||||
HK$M
| HK$M
| HK$M
| HK$M
| HK$M
| HK$M
| |||||||
within one year | 4,627 | 1,178 | 2,340 | — | 6,967 | 1,178 | ||||||
between one and two years | 2,788 | 2,973 | — | 2,340 | 2,788 | 5,313 | ||||||
between two and five years | 15,610 | 6,027 | — | — | 15,610 | 6,027 | ||||||
after five years | 96 | 1,916 | 5,506 | 4,340 | 5,602 | 6,256 | ||||||
| 23,121 | 12,094 | 7,846 | 6,680 | 30,967 | 18,774 | |||||||
Bank loans totalling HK$13,222 million (December 2004: HK$7,503 million) were attributed to overseas subsidiaries.
Part of the loans (HK$716 million at June 2005 and HK$512 million at December 2004 for GPEC and HK$6,106 million at December 2004 for Yallourn Energy) are secured by fixed and floating charges over their respective assets.
The carrying amounts of loans and borrowings approximate their fair value. The fair value of long-term borrowings is determined using the expected future payments discounted at market interest rates prevailing at the period end.
Table of Contents
Page 51
| 22. | Borrowings and Obligations under Finance Leases (continued) |
| (A) | Bank Loans and Other Borrowings (continued) |
Loans and borrowings of the Group are predominantly in HK$ or AUD. The effective interest rates at the balance sheet date were as follows: | ||||||||
| 30 June 2005 | 31 December 2004 | |||||||
HK$
| AUD
| HK$
| AUD
| |||||
Fixed rate loans and loans swapped to fixed rates | 4.2% - 7.1% | 6.2% - 7.3% | 4.3% - 7.1% | 7.5% - 8.6% | ||||
Variable rate loans and loans swapped from fixed rates | 2.8% - 3.8% | 6.2% - 6.6% | 0.5% - 1.0% | 5.6% - 7.2% | ||||
As at 30 June 2005, the Group has undrawn bank loan and overdraft facilities of HK$9,216 million (December 2004: HK$8,384 million).
| (B) | Obligations under Finance Leases |
Following the acquisition of the MEB on 31 May 2005, the Group had obligations under finance leases repayable as follows:
| 30 June 2005 | 31 December 2004 | ||||
| HK$M | HK$M | ||||
Minimum lease payments | |||||
not later than one year | 208 | — | |||
later than one year and not later than five years | 836 | — | |||
later than five years | 1,858 | — | |||
| 2,902 | — | ||||
Future interest expenses on finance leases | (1,367 | ) | — | ||
Present value of minimum lease payments | 1,535 | — | |||
Present value of minimum lease payments | |||||
not later than one year | 56 | — | |||
later than one year and not later than five years | 284 | — | |||
later than five years | 1,195 | — | |||
| 1,535 | — | ||||
| 23. | Share Capital |
| 30 June 2005 | 31 December 2004 | |||||||
| Number of Shares of HK$5 Each | Amount HK$M | Number of Shares of HK$5 Each | Amount HK$M | |||||
Authorised | ||||||||
At end of period/year | 3,000,000,000 | 15,000 | 3,000,000,000 | 15,000 | ||||
Issued and fully-paid | ||||||||
At end of period/year | 2,408,245,900 | 12,041 | 2,408,245,900 | 12,041 | ||||
There was no movement in the share capital of the Company during the period (year 2004: nil).
Table of Contents
Page 52
| 24. | SoC Reserve Accounts |
The Development Fund, special provision account and Rate Reduction Reserve of the Group’s major subsidiary, CLP Power Hong Kong, are collectively referred to as SoC reserve accounts in the condensed consolidated balance sheet. The respective balances at the end of the period/year are:
| 30 June 2005 | 31 December 2004 | |||
HK$M
| HK$M
| |||
SoC reserve accounts | ||||
Development Fund (A) | 2,820 | 3,171 | ||
Special provision account (B) | — | — | ||
Rate Reduction Reserve (C) | 518 | 549 | ||
| 3,338 | 3,720 | |||
Movements in the SoC reserve accounts are as follows:
| 30 June 2005 | 31 December 2004 | |||||
HK$M
| HK$M
| |||||
(A) Development Fund | ||||||
At beginning of period/year | 3,171 | 2,960 | ||||
Transfer (to)/from profit and loss account (Note 5) | (338 | ) | 219 | |||
One-off rebates | (13 | ) | 8 | |||
Business relief rebate | — | (1 | ) | |||
Special rebate to customers | — | (15 | ) | |||
At end of period/year | 2,820 | 3,171 | ||||
(B) Special provision account | ||||||
At beginning of period/year | — | 176 | ||||
Transfer to profit and loss account | — | (176 | ) | |||
At end of period/year | — | — | ||||
(C) Rate Reduction Reserve | ||||||
At beginning of period/year | 549 | 471 | ||||
Interest expense charged to profit and loss account (Note 8) | 120 | 253 | ||||
One-off rebates | — | 2 | ||||
Rebate to customers(note a) | (151 | ) | (177 | ) | ||
At end of period/year | 518 | 549 | ||||
| Note (a): | A rebate of HK¢1.1 per unit (2004: HK¢0.6 per unit) was made to customers during the period. |
Table of Contents
Page 53
| 25. | Notes to the Consolidated Cash Flow Statement |
Reconciliation of profit before taxation to net cash inflow from operations:
| 6 months ended 30 June | ||||||
2005
| 2004 HK$M
| |||||
Profit before taxation | 5,044 | 4,710 | ||||
Adjustments for: | ||||||
Operating interest | 536 | 521 | ||||
Finance income | (63 | ) | (23 | ) | ||
Share of results, net of tax | ||||||
jointly controlled entities | (1,614 | ) | (1,541 | ) | ||
associated companies | (79 | ) | (116 | ) | ||
Depreciation and amortisation | 1,359 | 1,219 | ||||
Net loss on disposal of fixed assets | 25 | 83 | ||||
Net loss on other investments | — | 38 | ||||
Hedging costs and exchange gains/losses | — | 61 | ||||
Fair value (gains)/losses on derivative instruments | ||||||
Cash flow hedges, transfer from equity | 106 | — | ||||
Transactions not qualifying as hedges | (7 | ) | — | |||
SoC items | ||||||
Increase in customers’ deposits | 104 | 115 | ||||
Decrease in fuel clause account | (318 | ) | (149 | ) | ||
One-off rebates | (13 | ) | (479 | ) | ||
Rebate to customers under SoC | (151 | ) | (80 | ) | ||
Business relief rebate | — | (1 | ) | |||
Special rebate | — | (15 | ) | |||
| (378 | ) | (609 | ) | |||
Transfers from Development Fund and special provision account | (338 | ) | (693 | ) | ||
Cash flow before working capital changes | 4,591 | 3,650 | ||||
(Increase)/Decrease in debtors and prepayments | (1,020 | ) | 457 | |||
Increase/(Decrease) in creditors and other liabilities | 289 | (303 | ) | |||
Decrease in dividend receivable from jointly controlled entities | 26 | — | ||||
Increase in current accounts due to jointly controlled entities | 47 | 22 | ||||
Net cash inflow from operations | 3,933 | 3,826 | ||||
Table of Contents
Page 54
| 26. | Commitments |
| (A) | Capital expenditure on fixed assets and leasehold land authorised but not brought into the accounts is as follows: |
| 30 June 2005 | 31 December 2004 | |||
HK$M
| HK$M
| |||
Contracted but not provided for | 2,300 | 2,207 | ||
Authorised but not contracted for | 10,034 | 9,670 | ||
| 12,334 | 11,877 | |||
| (B) | The Group has entered into a number of joint venture arrangements to develop power projects in Thailand and the Chinese mainland. Equity contributions required and made by the Group under each project are summarised below: |
| Project Name | Total Equity Contributions Required | Amount Fulfilled as at 30 June 2005 | Remaining Balance to be Contributed | Expected Year for Last Contribution | ||||
BLCP power project (Thailand) | US$165 million | US$17 million (HK$132 million) | US$148 million (HK$1,150 million) | 2007 | ||||
Changdao wind power project (Chinese mainland) | RMB45 million | RMB27 million (HK$25 million) | RMB18 million (HK$17 million) | end 2005 | ||||
Weihai wind power project (Chinese mainland) | RMB30 million | nil | RMB30 million (HK$28 million) | 2006 | ||||
Fangchenggang power project (Chinese mainland) | RMB966 million | nil | RMB966 million (HK$907 million) | 2007 | ||||
| (C) | Part of the acquisition of the MEB is the acquisition of Singapore Power’s 33.3% interest in the SEAGas partnership, which owns and operates a 685 kilometre natural gas transmission pipeline between Victoria and South Australia (Note 4). The Group’s acquisition of this interest was subject to consent from the other SEAGas partners and consent from the financiers to SEAGas. All necessary consents have been obtained and completion of the acquisition is targeted for the third quarter of 2005. Consideration for the acquisition is AUD195 million, of which a deposit of AUD75 million (approximately HK$448 million) was paid prior to 30 June 2005. |
| (D) | Pursuant to the previous loan agreements of Yallourn Energy, the Group had to provide the senior lenders with contingent equity support depending on certain minimum requirements regarding the availability of cash flows for debt services. This contingent equity support is no longer required upon repayment of the debts in May 2005. |
Table of Contents
Page 55
| 27. | Related Party Transactions |
Below are the more significant transactions with related parties during the period ended 30 June:
| (A) | Purchases of electricity from jointly controlled entities |
Of the purchases of electricity and gas totalled HK$8,613 million (2004: HK$7,630 million), HK$8,278 million (2004: HK$7,630 million) was related to purchases of electricity from jointly controlled entities for the electricity business in Hong Kong. Details are shown below:
| 6 months ended 30 June | ||||
| 2005 | 2004 | |||
| HK$M | HK$M | |||
Purchases of electricity from CAPCO | 5,652 | 5,398 | ||
Purchases of nuclear electricity | 2,447 | 2,046 | ||
Pumped storage service fee | 179 | 186 | ||
| 8,278 | 7,630 | |||
Amounts due to the related parties as at 30 June 2005 are disclosed in Note 21.
| (B) | Rendering of services to jointly controlled entities |
Pursuant to the CAPCO Operating Service Agreement, the charges from CLP Power Hong Kong to CAPCO for the services rendered during the period amounted to HK$529 million (2004: HK$541 million).
Amounts due from the related parties as at 30 June 2005 are disclosed in Note 19. No provisions have been made for doubtful debts in respect of the amounts owed by the related parties.
| (C) | Loan and advances to affiliated companies are discussed under Notes 16 and 17. As at 30 June 2005, the Group did not have any guarantees given to or received from these parties. |
| (D) | Total remuneration of Non-executive Directors and Senior Management (which includes four Executive Directors of the Company and Managing Directors of the two major subsidiaries, CLP Power Hong Kong and CLP Power Asia) is as follows: |
| 6 months ended 30 June | ||||
| 2005 | 2004 | |||
| HK$M | HK$M | |||
Fees | 2 | 1 | ||
Base compensation, allowances and benefits in kind | 12 | 12 | ||
Performance bonus | ||||
Annual incentive | 15 | 12 | ||
Long-term incentive(note a) | 8 | 2 | ||
Provident fund contributions | 1 | 1 | ||
| 38 | 28 | |||
| Note (a): | The amount of long-term incentive for 2005 was paid to five individuals, while that of 2004 was paid to one individual. |
Table of Contents
Page 56
The electricity-related operations of CLP Power Hong Kong and CAPCO (the SoC Companies) have been governed by the SoC Agreement with the Hong Kong Government. A summary of which was disclosed on page 166 in the Annual Report 2004. The calculations shown below are in accordance with the SoC and the agreements between the SoC Companies. The calculations are extracted from the management accounts of CLP Power Hong Kong for the six months ended 30 June 2005.
| (Unaudited) 6 months ended 30 June | |||||
| 2005 | 2004 | ||||
| HK$M | HK$M | ||||
SoC Revenue | 13,300 | 11,870 | |||
Expenses | |||||
Operating costs | 1,454 | 1,434 | |||
Fuel | 1,977 | 1,749 | |||
Purchases of nuclear electricity | 2,447 | 2,046 | |||
Depreciation | 1,825 | 1,681 | |||
Deferral premium | — | 96 | |||
Operating interest | 220 | 195 | |||
Taxation | 920 | 800 | |||
| 8,843 | 8,001 | ||||
Profit after taxation | 4,457 | 3,869 | |||
Interest on increase in customers’ deposits | 2 | — | |||
Interest on long-term financing | 362 | 340 | |||
Adjustments required under the SoC | |||||
(including share of profit on sale of electricity to Chinese mainland attributable to the SoC Companies) | (98 | ) | 49 | ||
Profit for SoC | 4,723 | 4,258 | |||
Transfer from Development Fund | 338 | 597 | |||
Permitted return | 5,061 | 4,855 | |||
Deduct interest | |||||
On increase in customers’ deposits | 2 | — | |||
On long-term financing as above | 362 | 340 | |||
On Development Fund and special provision account transferred to Rate Reduction Reserve | 120 | 112 | |||
| 484 | 452 | ||||
Net return | 4,577 | 4,403 | |||
Divisible as follows: | |||||
CLP Power Hong Kong | 2,795 | 2,624 | |||
CAPCO | 1,782 | 1,779 | |||
| 4,577 | 4,403 | ||||
CLP Power Hong Kong’s share of net return | |||||
CLP Power Hong Kong | 2,795 | 2,624 | |||
Interest in CAPCO | 715 | 713 | |||
| 3,510 | 3,337 | ||||
Table of Contents
Page 57
To the Board of Directors of CLP Holdings Limited (the Company)
(Incorporated in Hong Kong with limited liability)
We have been instructed by the Company to review the condensed consolidated interim accounts set out on pages 27 to 55.
Respective responsibilities of Directors and Auditors
The Rules Governing the Listing of Securities on The Stock Exchange of Hong Kong Limited require the preparation of condensed consolidated interim accounts to be in compliance with HKAS No. 34 “Interim Financial Reporting” issued by the Hong Kong Institute of Certified Public Accountants. The condensed consolidated interim accounts are the responsibility of, and have been approved by, the directors.
It is our responsibility to form an independent conclusion, based on our review, on the condensed consolidated interim accounts and to report our conclusion solely to you, as a body, in accordance with our agreed terms of engagement and for no other purpose. We do not assume responsibility towards or accept liability to any other person for the contents of this report.
Review work performed
We conducted our review in accordance with SAS 700 “Engagements to review interim financial reports” issued by the Hong Kong Institute of Certified Public Accountants. A review consists principally of making enquiries of group management and applying analytical procedures to the condensed consolidated interim accounts and, based thereon, assessing whether the accounting policies and presentation have been consistently applied unless otherwise disclosed. A review excludes audit procedures such as tests of controls and verification of assets, liabilities and transactions. It is substantially less in scope than an audit and therefore provides a lower level of assurance than an audit. Accordingly we do not express an audit opinion on the condensed consolidated interim accounts.
Review conclusion
On the basis of our review, which does not constitute an audit, we are not aware of any material modifications that should be made to the condensed consolidated interim accounts for the six months ended 30 June 2005.
/s/ PricewaterhouseCoopers
|
PricewaterhouseCoopers |
Certified Public Accountants |
Hong Kong, 23 August 2005 |
Table of Contents
Page 58
Corporate Governance Practices
In the Corporate Governance Report dated 28 February 2005 which was published in our Annual Report 2004, we reported that the Company had adopted its own Code on Corporate Governance (CLP Code) which incorporated all of the Code Provisions and Recommended Best Practices in the “Code on Corporate Governance Practices and Corporate Governance Report” issued by the Hong Kong Stock Exchange (the Stock Exchange Code), save for the few exceptions specified and explained therein.
In the Corporate Governance Report we also described the structure of CLP Corporate Governance Framework and how the various key players are involved in ensuring the application of good governance practices and policies within the CLP Group.
In this Interim Report, we give a brief update on our corporate governance practices, notably the progress on bringing into compliance the two deviations from the Recommended Best Practices of the Stock Exchange Code which we reported in the Corporate Governance Report.
The first of these related to the Recommended Best Practice that Independent Non-executive Directors represent at least one-third of the Board.
At our Annual General Meeting held on 28 April 2005, we announced the appointment of Professor Judy Tsui as an Independent Non-executive Director of the Company to take effect on 10 May 2005. Professor Tsui’s appointment has brought the number of Independent Non-executive Directors of the Company to six. This represents one-third of the Board (18 Directors as at 30 June 2005), and brings CLP into compliance with this Recommended Best Practice.
CLP’s second deviation from Recommended Best Practices of the Stock Exchange Code relating to the recommendation that an issuer should announce and publish quarterly financial results remains as a deviation of the CLP Code and our actual practices from the Stock Exchange Code. CLP issues quarterly statements which include turnover, interim dividends and progress in major business activities over the quarter. However, CLP does not issue quarterly financial results. The reason is a judgment that quarterly reporting does not bring significant benefits to shareholders. The considered reasons for this deviation were stated in the Corporate Governance Report on page 95 of the Company’s Annual Report 2004.
As at 30 June 2005 the composition of the Board of CLP Holdings was as follows:
Non-executive Directors
| Independent Non-executive Directors
| Executive Directors
| ||
Dr. The Hon. Sir Michael Kadoorie | The Hon. Sir S. Y. Chung | Mr. Andrew Brandler | ||
Mr. W. E. Mocatta | Dr. William K. Fung | Mr. Peter P. W. Tse | ||
Mr. J. S. Dickson Leach | Mr. V. F. Moore | Mr. Peter W. Greenwood | ||
Mr. R. J. McAulay | Mr. Hansen C. H. Loh | (resigned on 27 August 2005) | ||
Mr. J. A. H. Leigh | Mr. Paul M. L. Kan | Dr. Y. B. Lee | ||
Mr. R. Bischof | Professor Judy Tsui | |||
Mr. I. D. Boyce | ||||
Mr. P. C. Tan |
Table of Contents
Page 59
The composition of Board Committees remains the same as set out in the Corporate Governance Report of the Annual Report 2004, save that Mr. Paul M. L. Kan resigned from, and Professor Judy Tsui joined, the Audit Committee both with effect from 1 June 2005.
Following shareholders’ approval at the Company’s Annual General Meeting held on 28 April 2005 of the resolution to fix a specific term of appointment for all Non-executive Directors, a formal letter of appointment which is modelled on the letter of appointment in the “Higgs Report” in the UK on the “Review of the Role and Effectiveness of Non-executive Directors” was issued to each of the Non-executive Directors of the Company.
During the six months ended 30 June 2005 the Company met the Code Provisions set out in the Code on Corporate Governance Practices contained in Appendix 14 of the Rules Governing the Listing of Securities on The Stock Exchange of Hong Kong Limited (Listing Rules).
The Audit Committee has reviewed the accounting principles and practices adopted by the Group and the unaudited condensed accounts for the six months ended 30 June 2005. All of the Audit Committee members are appointed from the Independent Non-executive Directors, with the Chairman and a member having appropriate professional qualifications and experience in financial matters.
Interests of Directors and Substantial Shareholders
Since 1989, the Company has adopted its own Code for Securities Transactions by Directors (CLP Securities Code), which is largely based on the Model Code set out in Appendix 10 of the Listing Rules. The CLP Securities Code also applies to Senior Management (comprising the four Executive Directors and the Managing Directors of CLP Power Hong Kong and CLP Power Asia) and other “Specified Individuals” such as senior managers in the CLP Group. The CLP Securities Code has been updated from time to time to reflect new regulatory requirements as well as CLP Holdings’ strengthened regime of disclosure of interests in its securities.
The current CLP Securities Code is on terms no less exacting than the required standard set out in the Model Code.
All Directors have confirmed, following specific enquiry by the Company, that they have complied with the required standard set out in the Model Code and CLP Securities Code throughout the period from 1 January to 30 June 2005.
Save for the shareholdings disclosed below by the four Executive Directors, Senior Management did not have any interests in CLP Holdings’ securities as at 30 June 2005.
Interests of Directors and Chief Executive Officer
The interests/short positions of each of the Directors and Chief Executive Officer in the shares, underlying shares and debentures of the Company or any of the Company’s associated corporations (within the meaning of the Securities and Futures Ordinance) as at 30 June 2005, as recorded in the register required to be kept under Section 352 of Part XV of the Securities and Futures Ordinance, are set out below:
| 1. | Aggregate long position in the shares, underlying shares and debentures of the Company and its associated corporations |
The interests of Directors and Chief Executive Officer in the shares of the Company (other than pursuant to equity derivatives such as share options, warrants to subscribe or convertible bonds) as at 30 June 2005 were as follows:
Table of Contents
Page 60
Directors | Capacity | Total Interests in Number of Ordinary Shares of the Company | % of the Issued Share Capital of the Company | |||
Dr. The Hon. Sir Michael Kadoorie | Note (a) | 475,381,026 | 19.7397 | |||
Mr. W. E. Mocatta | Founder of a discretionary trust | 250,000 | 0.0104 | |||
Mr. J. S. Dickson Leach | Beneficial owner | 3,436 | 0.0001 | |||
Mr. R. J. McAulay | Note (b) | 439,800,565 | 18.2623 | |||
The Hon. Sir S. Y. Chung | Beneficial owner | 393,789 | 0.0164 | |||
Dr. William K. Fung | Beneficial owner | 120,000 | 0.0050 | |||
Mr. J. A. H. Leigh | Beneficial owner | 22,000 | 0.0009 | |||
Mr. R. Bischof | Beneficial owner | 50,000 | 0.0021 | |||
Mr. P. C. Tan | Interests held jointly with spouse | 5,000 | 0.0002 | |||
Mr. Andrew Brandler | Note (c) | 10,600 | 0.0004 | |||
Mr. Peter P. W. Tse | Note (d) | 20,600 | 0.0009 | |||
Mr. Peter W. Greenwood | Beneficial owner | 5,600 | 0.0002 | |||
Dr. Y. B. Lee | Note (e) | 15,806 | 0.0007 | |||
Notes:
| (a) | The Hon. Sir Michael Kadoorie was deemed (by virtue of the Securities and Futures Ordinance) to be interested in 475,381,026 shares in the Company. These shares were held in the following capacity: |
| i) | 1,243 shares were an interest of his spouse. |
| ii) | 236,335,571 shares were held by discretionary trusts, of which The Hon. Sir Michael Kadoorie is one of the discretionary objects. |
| iii) | 239,044,212 shares were held by a discretionary trust, of which The Hon. Sir Michael Kadoorie is one of the discretionary objects and the founder. |
For the purpose of the Securities and Futures Ordinance, the spouse of The Hon. Sir Michael Kadoorie was taken to have a discloseable duty in Hong Kong in relation to the 239,044,212 shares referred to in (iii) above. The spouse of The Hon. Sir Michael Kadoorie was therefore deemed to be interested in 239,045,455 shares in the Company, of which 1,243 shares were held by her as beneficial owner and 239,044,212 shares were attributed to her pursuant to the Securities and Futures Ordinance for disclosure purposes. Nevertheless, she has no interest, legal or beneficial, in these 239,044,212 shares attributed to her for disclosure purposes.
Table of Contents
Page 61
| (b) | Mr. R. J. McAulay was deemed (by virtue of the Securities and Futures Ordinance) to be interested in 439,800,565 shares in the Company. These shares were held in the following capacity: |
| i) | 13,141 shares were held in a personal capacity. |
| ii) | 236,335,571 shares were held by discretionary trusts, of which Mr. R. J. McAulay is one of the discretionary objects. |
| iii) | 203,451,853 shares were held by a discretionary trust, of which Muriel, Lady Kadoorie, mother-in-law of Mr. R. J. McAulay, is the founder and a beneficiary and Mr. R. J. McAulay, his wife and members of his family are discretionary objects. |
| (c) | 600 shares were held in a personal capacity and 10,000 shares were held in a beneficial owner capacity. |
| (d) | 600 shares were held in a personal capacity and 20,000 shares were held in a beneficial owner capacity. |
| (e) | 600 shares were held in a personal capacity and 15,206 shares were held jointly with spouse. |
Messrs. I. D. Boyce, V. F. Moore, Hansen C. H. Loh and Paul M. L. Kan and Professor Judy Tsui who are Directors of the Company, and Mr. Bradley W. Corson who is an Alternate Director have each confirmed that they had no interests in the shares of the Company or any of its associated corporations as at 30 June 2005.
None of the Directors or the Chief Executive Officer had interests in debentures, under equity derivatives or in underlying shares of the Company and its associated corporations as at 30 June 2005.
| 2. | Aggregate short position in the shares, underlying shares and debentures of the Company and its associated corporations |
None of the Directors or the Chief Executive Officer had short positions in respect of shares, debentures, under equity derivatives or interests in underlying shares of the Company and its associated corporations as at 30 June 2005.
At no time during the period was the Company, its subsidiaries or its associated companies a party to any arrangement to enable the Directors and the Chief Executive Officer of the Company (including their spouse and children under 18 years of age) to acquire benefits by an acquisition of shares or underlying shares in, or debentures of, the Company or its associated corporations.
Interests of Substantial Shareholders
The interests/short positions of substantial shareholders in the shares and underlying shares of the Company as at 30 June 2005, as recorded in the register required to be kept under Section 336 of Part XV of the Securities and Futures Ordinance, are set out below:
| 1. | Aggregate long position in the shares and underlying shares of the Company |
The Company had been notified of the following substantial shareholders’ interests in the shares (other than pursuant to equity derivatives such as share options, warrants to subscribe or convertible bonds) as at 30 June 2005.
Table of Contents
Page 62
Substantial Shareholders | Capacity | Total Interests in Number of Ordinary Shares of the Company | % of the Issued Share Capital of the Company | |||
Acorn Holdings Corporation | Beneficiary | 196,468,538 Note (a) | 8.16 | |||
Bermuda Trust Company Limited | Trustee / Interests of controlled corporations | 682,978,836 Note (a) | 28.36 | |||
Bermuda Trust (Cayman) Limited | Trustee | 203,451,853 Note (b) | 8.45 | |||
Esko Limited | Interest of controlled corporation / Beneficiary of trusts | 236,335,571 Note (a) | 9.81 | |||
Hesko Limited | Interest of controlled corporation / Beneficiary of trusts | 236,335,571 Note (a) | 9.81 | |||
HWR Trustees Limited | Trustee / Interest of controlled corporation | 240,482,771 Note (a) | 9.99 | |||
Lakshmi Company Limited | Beneficiary | 196,468,538 Note (a) | 8.16 | |||
Lawrencium Corporation | Beneficiary | 196,468,538 Note (a) | 8.16 | |||
Merlin Investments Limited | Beneficiary | 196,468,538 Note (a) | 8.16 | |||
Mikado Holding Inc. | Trustee | 239,044,212 Note (a) | 9.93 | |||
Mikado Investments Limited | Interest of controlled corporation / Beneficiary of trusts | 239,044,212 Note (a) | 9.93 | |||
Muriel, Lady Kadoorie | Founder and Beneficiary | 203,451,853 Note (b) | 8.45 | |||
New Boron Holding Corporation | Trustee | 196,468,538 Note(a) | 8.16 | |||
Oak CLP Limited | Beneficiary | 203,451,853 Note (b) | 8.45 | |||
Oak (Unit Trust) Holdings Limited | Trustee | 203,451,853 Notes (a) & (b) | 8.45 | |||
Mr. R. Parsons | Trustee | 196,554,172 Note (c) | 8.16 | |||
Sir Sidney Gordon | Trustee | 205,525,453 Note (c) | 8.53 | |||
Dr. The Hon. Sir Michael Kadoorie | Note (d) | 475,381,026 Note (d) | 19.74 | |||
Mr. R. J. McAulay | Note (e) | 439,800,565 Note (e) | 18.26 | |||
Guardian Limited | Beneficiary / Interests in controlled corporation | 196,554,172 Note (c) | 8.16 | |||
Table of Contents
Page 63
Notes:
| (a) | The interests of Bermuda Trust Company Limited in the shares of the Company include the interests in the Company held by Esko Limited, Hesko Limited, Acorn Holdings Corporation, Lawrencium Corporation, Mikado Holding Inc, Mikado Investments Limited, Oak (Unit Trust) Holdings Limited and New Boron Holding Corporation. |
The interests of Bermuda Trust Company Limited in the shares of the Company also include the shares held by discretionary trusts of which The Hon. Sir Michael Kadoorie and/or Mr. R. J. McAulay are among the discretionary objects as disclosed in “Interests of Directors and Chief Executive Officer”.
Bermuda Trust Company Limited was deemed to be interested in the shares in which Esko Limited, Hesko Limited, Mikado Holding Inc, Mikado Investments Limited and Oak (Unit Trust) Holdings Limited are interested, either in the capacity as trustee or by virtue of having direct or indirect control over such companies.
HWR Trustees Limited was deemed to be interested in the shares in which New Boron Holding Corporation was interested by virtue of having direct control over New Boron Holding Corporation. HWR Trustees Limited was also deemed to be interested in 4,147,200 shares in its capacity as trustee of certain trusts.
Lakshmi Company Limited and Merlin Investments Limited were deemed to be interested in the shares in which New Boron Holding Corporation was interested.
Esko Limited and Hesko Limited together controlled Acorn Holdings Corporation and Lawrencium Corporation which together in turn controlled New Boron Holding Corporation and were therefore deemed to be interested in the shares in which such company was deemed interested.
| (b) | The interests of Bermuda Trust (Cayman) Limited in the shares of the Company include the interests in the Company in which Oak CLP Limited, Oak (Unit Trust) Holdings Limited and Muriel, Lady Kadoorie were deemed to be interested. |
The interests of Muriel, Lady Kadoorie in 203,451,853 shares of the Company include shares in which Mr. R. J. McAulay, Mr. R. Parsons and Sir Sidney Gordon were deemed to be interested.
Bermuda Trust (Cayman) Limited was interested in the 203,451,853 shares by virtue of its capacity as trustee of a trust of which Muriel, Lady Kadoorie is the founder and a beneficiary and Mr. R. J. McAulay is one of the discretionary objects. Bermuda Trust (Cayman) Limited, in its capacity as trustee of a discretionary trust, controlled Oak CLP Limited and was therefore deemed to be interested in the shares in which Oak CLP Limited was interested.
| (c) | Mr. R. Parsons and Sir Sidney Gordon, in their capacities as trustees of certain trusts, jointly controlled Guardian Limited and therefore were deemed to be interested in the shares in which Guardian Limited was deemed to be interested. Accordingly, the 196,554,172 shares in which Guardian Limited was interested is duplicated within the interests attributed to each of Sir Sidney Gordon and Mr. R. Parsons. |
Sir Sidney Gordon was also deemed to be interested in 2,073,600 shares in his capacity as trustee of certain trusts.
| (d) | The aggregate long position in the shares of the Company of The Hon. Sir Michael Kadoorie is listed below: |
Interests in the Ordinary Shares of the Company
| Number | Capacity | |
1,243 239,044,212 475,379,783 | Interest of spouse Founder of a discretionary trust Discretionary object of various discretionary trusts |
Table of Contents
Page 64
The interests of The Hon. Sir Michael Kadoorie as a founder of a discretionary trust and a discretionary object of various discretionary trusts are duplicated between each other. His interests, apart from the interest of his spouse, are also duplicated by the interests in the Company held by Bermuda Trust Company Limited and certain discretionary trusts of which Mr. R. J. McAulay is one of the discretionary objects as disclosed in Note (e) below.
For the purpose of the Securities and Futures Ordinance, the spouse of The Hon. Sir Michael Kadoorie was taken to have a discloseable duty in Hong Kong in relation to the 239,044,212 shares referred to above. The spouse of The Hon. Sir Michael Kadoorie was therefore deemed to be interested in 239,045,455 shares in the Company, of which 1,243 shares were held by her as beneficial owner and 239,044,212 shares were attributed to her pursuant to the Securities and Futures Ordinance for disclosure purposes. Nevertheless, she has no interest, legal or beneficial, in these 239,044,212 shares attributed to her for disclosure purposes.
| (e) | See Note (b) under “Interests of Directors and Chief Executive Officer”. |
| 2. | Aggregate short position in the shares and underlying shares of the Company |
As at 30 June 2005, the Company had not been notified of any short positions being held by any substantial shareholder in the shares or underlying shares of the Company.
Interests of Any Other Persons
As at 30 June 2005, the Company had not been notified of any persons other than the substantial shareholders who had interests or short positions in the shares or underlying shares of the Company, which are required to be recorded in the register required to be kept under Section 336 of Part XV of the Securities and Futures Ordinance.
Purchase, Sale or Redemption of the Company’s Listed Shares
There was no purchase, sale or redemption of the Company’s listed shares by the Company or any of its subsidiaries during the six months ended 30 June 2005.
Table of Contents
Page 65
| Financial Diary | ||||
Announcement of interim results | 23 August 2005 | |||
Interim report posted to shareholders | 13 September 2005 | |||
Last day to register for second interim dividend | 6 September 2005 | |||
Book close day | 7 September 2005 | |||
Payment of second interim dividend | 15 September 2005 | |||
Financial year end | 31 December 2005 | |||
Interim Report
Printed in English and Chinese language, available on our website at www.clpgroup.com on 6 September 2005 and posted to Shareholders on 13 September 2005.
Those Shareholders who (a) received our Interim Report 2005 electronically and would like to receive a printed copy or vice versa; or (b) received our Interim Report 2005 in either English or Chinese language version only and would like to receive a printed copy of the other language version or to receive printed copies of both language versions in future, are requested to write to the Company Secretary or the Company’s Registrars.
Shareholders may at any time change their choice of the language or means of receipt of the Company’s corporate communications free of charge by notice in writing to the Company Secretary or the Company’s Registrars.
Company’s Registrars
Computershare Hong Kong Investor Services Limited
| Address : | 46/F., Hopewell Centre, 183 Queen’s Road East, Hong Kong | |
| Telephone : | (852) 2862 8628 | |
| Facsimile : | (852) 2865 0990 | |
| E-mail : | hkinfo@computershare.com.hk |
Share Listing
CLP Holdings shares are listed on the Stock Exchange of Hong Kong and are traded over the counter in the United States in the form of American Depositary Receipts.
Our Stock Code
| The Stock Exchange of Hong Kong : | 002 | |
| Bloomberg : | 2 HK | |
| Reuters : | 0002.HK | |
| Ticker Symbol for ADR Code : | CLPHY | |
| CUSIP Reference Number : | 18946Q101 |
Our Contact Details
| Address : | 147 Argyle Street, Kowloon, Hong Kong | |
| Telephone : | (852) 2678 8228 (Shareholders’ hotline) | |
| (852) 2678 8322 (Investor Relations Manager) | ||
| Facsimile : | (852) 2678 8390 (Company Secretary) | |
| (852) 2678 8530 (Investor Relations Manager) | ||
| E-mail : | cosec@clp.com.hk (Company Secretary) | |
| IR_Dept@clp.com.hk (Investor Relations Manager) |