Table of Contents
FORM 6-K
SECURITIES AND EXCHANGE COMMISSION
Washington, D.C. 20549
Report of Foreign Private Issuer
Pursuant to Rule 13a-16 or 15d-16 of
the Securities Exchange Act of 1934
For the month of September 2006
CLP Holdings Limited
(Registrant’s name in English)
147 Argyle Street
Kowloon, Hong Kong
(Address of Registrant’s principal executive office)
Indicate by check mark whether the Registrant files or will file annual reports under cover Form 20-F or Form 40-F.
Form 20-F X Form 40-F
Indicate by check mark whether the Registrant by furnishing this information contained in this Form is also thereby furnishing information to the Commission pursuant to Rule 12g3-2(b) under the Securities Exchange Act of 1934.
Yes No X
If “Yes” is marked, indicate below the file number assigned to the Registrant in connection with Rule 12g3-2(b): 82-
Table of Contents
Registrant hereby incorporates by reference in the report on Form 6-K the following Exhibit:
Exhibit
The Interim Report 2006 which was despatched to shareholders on 1 September 2006.
2
Table of Contents
SIGNATURES
Pursuant to the requirements of the Securities Exchange Act of 1934, the Registrant has duly caused this report to be signed on its behalf by the undersigned, thereunto duly authorized.
| For and on behalf of | ||
| CLP HOLDINGS LIMITED | ||
| By: | / s / April Chan
| |
| Name: | April Chan | |
| Title: | Company Secretary | |
Date: 21 September 2006
3
Table of Contents
CLP’s vision is to be a leading investor-operator in the Asia-Pacific electric power sector.
HIGHLIGHTS
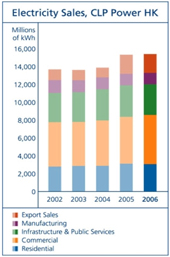
• Electricity sales in Hong Kong grew 0.8% to 13,300GWh; total sales (which include sales to the Chinese mainland) rose 0.5% to 15,414GWh.
• Consolidated revenue rose 30.9% to HK$21,412 million; revenue from our business in Hong Kong recorded a 2.6% growth to HK$14,061 million.
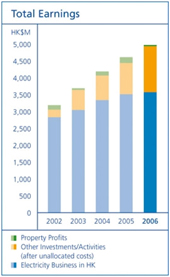
• Earnings from our electricity business in Hong Kong increased by 1.8% to HK$3,573 million; earnings from other activities (including a one-off gain of HK$291 million) grew by 50.2% to HK$1,568 million.
• Total earnings up 7.9% to HK$4,975 million; operating earnings (which exclude Hok Un redevelopment profit) up 11.2% to HK$4,936 million.
• Second interim dividend of HK$0.50 per share.
|
| 1 | ||
| 3 | ||
| 7 | ||
| 13 | ||
| 22 | ||
| 32 | ||
| 33 | ||
| 35 | ||
| 36 | ||
| 37 | ||
| 61 | ||
| 62 | ||
| 63 | ||
| 72 | ||
Table of Contents
| 6 months ended 30 June | Increase/ (Decrease) | ||||||||||||
| 2006 | 2005 (restated | )(1) | % | ||||||||||
Per share | |||||||||||||
Earnings per share, HK$ | |||||||||||||
Including Hok Un redevelopment profit | 2.07 | 1.91 | 7.9 | ||||||||||
Excluding Hok Un redevelopment profit | 2.05 | 1.84 | 11.2 | ||||||||||
Dividends per share, HK$ | |||||||||||||
First interim | 0.50 | 0.48 | |||||||||||
Second interim | 0.50 | 0.48 | |||||||||||
Total interim dividends | 1.00 | 0.96 | 4.2 | ||||||||||
For the period | |||||||||||||
Revenue, HK$M | |||||||||||||
Hong Kong (HK) business | 14,061 | 13,704 | 2.6 | ||||||||||
Businesses outside HK | 7,351 | 2,657 | 176.7 | ||||||||||
Total | 21,412 | 16,361 | 30.9 | ||||||||||
Earnings, HK$M | |||||||||||||
Electricity business in HK | 3,573 | 3,510 | 1.8 | ||||||||||
Other investments/activities | |||||||||||||
Sales to Chinese mainland from HK | 55 | 63 | |||||||||||
Generating facilities in Chinese mainland serving HK(2) | 347 | 431 | |||||||||||
Other power projects in Chinese mainland | 106 | 95 | |||||||||||
Energy business in Australia | 287 | (8 | ) | ||||||||||
Electricity business in India | 371 | 279 | |||||||||||
Power projects in Southeast Asia and Taiwan | 142 | 185 | |||||||||||
Renewable energy business | (25 | ) | 4 | ||||||||||
Other businesses | (6 | ) | (5 | ) | |||||||||
One-off gain on formation of OneEnergy | 291 | — | |||||||||||
| 1,568 | 1,044 | 50.2 | |||||||||||
Unallocated net finance costs | (122 | ) | (43 | ) | |||||||||
Unallocated Group expenses | (83 | ) | (74 | ) | |||||||||
Total operating earnings | 4,936 | 4,437 | 11.2 | ||||||||||
Hok Un redevelopment profit | 39 | 174 | |||||||||||
Total earnings | 4,975 | 4,611 | 7.9 | ||||||||||
Electricity sales (CLP Power HK), millions of kWh | |||||||||||||
Residential | 3,063 | 3,114 | (1.6 | ) | |||||||||
Commercial | 5,526 | 5,259 | 5.1 | ||||||||||
Infrastructure & Public Services | 3,434 | 3,529 | (2.7 | ) | |||||||||
Manufacturing | 1,277 | 1,291 | (1.0 | ) | |||||||||
Total local sales | 13,300 | 13,193 | 0.8 | ||||||||||
Export sales | 2,114 | 2,145 | (1.4 | ) | |||||||||
Total electricity sales | 15,414 | 15,338 | 0.5 | ||||||||||
Interest cover(3), times | 8 | 10 | |||||||||||
As at balance sheet date, HK$M | 30 June 2006 | 31 December 2005 (restated | )(1) | Increase % | | ||||||||
Total assets, including leased assets | 126,527 | 123,622 | 2.3 | ||||||||||
Total borrowings | 29,582 | 29,391 | 0.6 | ||||||||||
Obligations under finance leases | 23,482 | 21,497 | 9.2 | ||||||||||
Shareholders’ funds | 51,985 | 50,285 | 3.4 | ||||||||||
Total debt to total capital(4), % | 36.2 | 36.8 | |||||||||||
Page 1
Table of Contents
Notes:
| (1) | 2005 figures have been restated following the adoption of HKFRS–Interpretation 4 on lease accounting. |
| (2) | This represents earnings contribution from our investments in Guangdong Nuclear Power Joint Venture Company, Limited and Hong Kong Pumped Storage Development Company, Limited, whose generating facilities serve Hong Kong. |
| (3) | Interest cover = Profit before taxation and interest/(interest charges + capitalised interest). |
| (4) | Total debt to total capital = Debt/(shareholders’ funds + debt + minority interest). Total debt excludes obligations under finance leases. |
Page 2
Table of Contents
Dear Shareholders
I am pleased to present our Interim Report for the six months to 30 June 2006.
Financial Results for the Six-month Period
CLP Group’s total operating earnings for the first half of 2006 increased by 11.2% to HK$4,936 million, as compared to the corresponding period in 2005. Included in the total operating earnings is a one-off item relating to a premium gain of HK$291 million on the formation of OneEnergy.
The growth in these earnings mainly arose from our investments in the electricity sector in the Asia-Pacific region. It is encouraging to note that CLP’s policy of diversifying its business beyond our home base in Hong Kong, which we have been pursuing for several years, is now contributing to the delivery of significant and ongoing value to our shareholders.
The total earnings, which include Hok Un redevelopment profit, amounted to HK$4,975 million, representing a growth of 7.9%.
Further details of the financial and operational performance of the Group in the first six months of 2006 are set out in the Management’s Discussion and Analysis, which forms part of this Interim Report.
In this Chairman’s Statement, I wish to look forward and explain the outlook for the CLP Group, including the key tasks and issues to which the Board and Management will be giving particular attention during the second half of the year.
Hong Kong – Regulatory Regime
Shareholders will recall that the Hong Kong Government initiated a two-stage public consultation process on the future of Hong Kong’s electricity industry, as an important step in the development of the regulatory regime for the electricity sector upon the expiry of the current Scheme of Control agreement in 2008.
The Stage II Consultation ended on 31 March 2006. CLP and Government have commenced discussions on the post-2008 regulatory arrangements. CLP would like to see these discussions move forward as soon as possible. The electricity industry provides a vital service to Hong Kong. It is an industry which demands ongoing, large-scale investment and long-term planning. 2008 is fast approaching. In order to ensure the continuing security, quality and efficiency of Hong Kong’s electricity supply through to the end of this decade and beyond, it is critical that the future regulation of the power industry be clarified in a timely manner to remove unnecessary uncertainties.
Whilst I cannot predict the outcome of the discussions between CLP and Government, I can say with certainty that CLP will adopt a constructive, positive and realistic approach in these negotiations.
Page 3
Table of Contents
At its heart, our position is quite straightforward – the existing Scheme of Control has served Hong Kong extremely well. Together with strong environmental performance, it has enabled our community to enjoy a first-class and reliable electricity service at reasonable tariffs, whilst offering fair returns to the investors who have funded the necessary investments in the Special Administrative Region’s electricity infrastructure. The merits of the Scheme of Control are visible, measurable and enduring. We will work hard with Government to amend the existing arrangements, where this is necessary to reflect changes and challenges arising from the economic and social development of Hong Kong. However, it is important that the post-2008 arrangements retain the present balance between the interests of CLP’s shareholders, our customers and the community as a whole, and that these arrangements promote continued excellence in the electricity supply, on which Hong Kong’s well-being depends.
Hong Kong – Liquefied Natural Gas (LNG)
A good example of the long-term decision-making which the electricity business requires is the steps we are taking to bring LNG to Hong Kong in order to succeed the depleting gas resource in the South China Sea that is currently supplying the Black Point Power Station.
The completion of an LNG receiving terminal in Hong Kong and the availability of LNG supply by 2011 are crucial to our customers from the perspective of both environmental performance and reliability of electricity supply.
The Environmental Impact Assessment (EIA) studies for two potential sites for the LNG receiving terminal are scheduled for completion in August this year. By early 2007 we must have the site acquired and relevant government approvals in place, so that commercial contracts can be awarded to tie in with the significant amount of work required by the suppliers on upstream gas development, shipbuilding and site construction.
Our timetable for this project is challenging but achievable. It is right that a project of this size and nature should be subject to Government oversight and approval. We have kept Government informed of our plans from a very early stage, starting almost three years ago, including the importance of the arrival of LNG in Hong Kong by the end of this decade. As the EIA studies are being completed, we will be consulting the public and we will continue to work hard with various government bureaux and departments throughout the second half of this year to ensure that the LNG project stays firmly on course.
Hong Kong – Emissions Reductions
Our Hong Kong power plants recorded a substantial reduction of emissions during the first six months of the year. This is largely due to the increased use of ultra-low sulphur coal, which is by far the cleanest coal available around the world for power generation.
We are moving forward with the retrofit of additional emissions reduction facilities at Castle Peak Power Station. We have submitted the EIA report to Government and are on track with our front end work.
Our present programme envisages four major emissions reduction facilities being completed from 2009 onwards. This is a challenging programme, given the significant demolition and plant relocation work needed, and the required operation of these units to meet the summer peak demand means that much of the work must be carried out in winter.
Page 4
Table of Contents
We believe that our efforts in reducing emissions can only be effective in improving air quality as part of a wider and sustained effort by governments on both sides of the boundary and all sectors of the community to improve air quality throughout the Pearl River Delta air shed. In line with this, CLP was one of the early supporters of the Clean Air Charter established in 2005 by the business community in Hong Kong, and which now binds more than 280 leading businesses and organisations in Hong Kong in a shared commitment to develop and implement fair, practical and cost-effective environmental and emissions management policies.
Asia – OneEnergy
The success of “OneEnergy”, our recently-established 50:50 joint venture with Mitsubishi Corporation of Japan, will be measured by its ability to combine the two partners’ expertise, capital and local relationships to expand its presence in the power sector in Southeast Asia and Taiwan.
In the coming months, we aim to complete OneEnergy’s integration period, with the establishment of key policies, procedures and systems, as well as the further injection of assets currently owned by the joint venture partners. At the same time, we shall be looking to see progress in the pursuit of new development and acquisition opportunities, so that OneEnergy starts to deliver on its potential as an effective platform for enhancing our stake in its target markets and generating added value to its shareholders.
Australia – TRUenergy
The process of integrating, within TRUenergy, our existing Yallourn business with the merchant energy business acquired last year from Singapore Power has made significant progress. Over the latter half of this year we will be monitoring the success of this exercise in delivering operating cost savings and providing an organisation capable of responding effectively and rapidly to the challenges and opportunities of Australia’s power business and growing its share of that business.
Major activities will include the retention of retail market share in the core Victoria and South Australia markets. We will aim to progress expansion opportunities in New South Wales, in conjunction with our 400MW Tallawarra combined-cycle gas-fired power station which has moved into construction this year, as well as exploring the opportunity to enter the Queensland market, which the government has announced will be open to full retail contestability in mid-2007.
In addition to substantial and positive developments on each of the issues that I have highlighted in this Chairman’s Statement, the Board and I will be looking for progress on the other projects and development opportunities we have in hand, such as the construction of our 1,200MW coal-fired power station at Fangchenggang in the Chinese mainland and our renewable energy projects. And at all times, we must maintain the foundations of our business, namely continued excellence in plant and system operation, customer service, safety and environmental performance, as well as financial discipline and prudence – the core attributes on which CLP’s reputation and long-term success rests.
Page 5
Table of Contents
I am confident that CLP’s Management and staff have the skill and dedication to carry through the challenging tasks of the months ahead. I look forward to reporting to you at the end of the year on the progress that your Company has made.
/ s / The Hon. Sir Michael Kadoorie |
The Hon. Sir Michael Kadoorie |
Hong Kong, 15 August 2006 |
Page 6
Table of Contents
Management’s Discussion and Analysis
The Chairman’s Statement which introduces this Interim Report focuses on the major priorities ahead and the outlook for the CLP Group. In this Management’s Discussion and Analysis we explain the Group’s operational and financial performance over the first six months of 2006.
CLP follows a clear, consistent and focused strategy to realise our vision of being a leading investor-operator in the Asia-Pacific electricity power sector. We aim continuously to enhance our Hong Kong electricity business and to develop a portfolio of electricity businesses in Australia, the Chinese mainland and other countries in Asia. An outline of our investments is set out below:
Hong Kong
| Investments | Equity Interest | Description | ||
| CLP Power Hong Kong Limited (CLP Power Hong Kong)(1) | 100% | CLP Power Hong Kong owns and operates the transmission and distribution system, covering a supply area of approximately 1,000 sq. km and which includes:
• 554 km of 400kV lines
• 1,232 km of 132kV lines
• 185 km of 33kV lines
• 10,498 km of 11kV lines
• 55,751 MVA transformers
• 210 primary substations in operation
• 12,495 secondary substations in operation
|
Page 7
Table of Contents
| Castle Peak Power Company Limited (CAPCO)(1), 6,908 megawatts (MW) of installed generating capacity | 40% | CAPCO owns:
Black Point Power Station (2,500MW)
• Gas-fired power station (with distillate as back-up) comprising eight combined-cycle turbines of 312.5MW each
• Units 1 to 8 in operation, Unit 8 commenced operation in May 2006
Castle Peak Power Station (4,108MW)
• One of the world’s largest coal-fired power station complexes, comprising four units of 350MW each and another four units of 677MW each
• Two of the 677MW units are capable of burning gas as backup fuel. All units can burn oil as a backup fuel
Penny’s Bay Power Station (300MW)
• Three diesel oil-fired units of 100MW each
|
| Note (1): | CLP Power Hong Kong operates CAPCO’s power stations and purchases its power from CAPCO and Guangdong Daya Bay Nuclear Power Station. These sources of power, together with CLP’s right to use 50% of the capacity of Phase 1 of the Guangzhou Pumped Storage Power Station, amount to a total installed capacity of 8,888MW. |
Page 8
Table of Contents
Australia
Investments Gross/Equity MW | Equity Interest | Description | ||
| TRUenergy, Australia 4,126/4,126MW | 100% | TRUenergy is an integrated generation and retail electricity and gas business in Victoria, South Australia, New South Wales and the Australian Capital Territory, comprising:
• 1,480MW coal-firedYallourn Power Station and mine in Victoria
• 1,280MW gas-firedTorrens Island Power Station in South Australia
• Ecogen long-term hedge agreement that allows TRUenergy to purchase up to 966MW gas-fired capacity
• 400MW gas-firedTallawarra projectin New South Wales, currently under construction
• Iona Gas Storage facility in Victoria
• Various long-term gas supply contracts
• 33.33% interest in the SEAGas pipeline between Victoria and South Australia
• Over 1.1 million retail electricity and gas customer accounts, mainly in Victoria and South Australia
| ||
| Roaring 40s Renewable Energy Pty Ltd (Roaring 40s), Australia 255/99MW(2) | 50% | Roaring 40s is a 50:50 joint venture partnership with Hydro Tasmania. Roaring 40s currently owns:
• 100% of the 65MW Woolnorth Bluff Point wind farm in Tasmania
• 50% of the 66MW Cathedral Rocks wind farm in South Australia
Other renewables projects under construction include:
• 49% of the 49MW China Datang Shuangliao wind farm in Jilin Province
• 100% of the 75MW Woolnorth Studland Bay wind farm in Tasmania
|
 , China
| Note (2): | The 99 equity MW attributed to CLP, through its 50% equity interest in Roaring 40s, takes into account that Roaring 40s holds varying equity interests in the generating assets included in the 255 gross MW. |
Page 9
Table of Contents
Other Countries in Asia
Investments Gross/Equity MW | Equity Interest | Description | ||
Gujarat Paguthan Energy Corporation Private Limited (GPEC), India 655/655MW
| 100% | GPEC owns and operates a 655MW gas-fired combined-cycle power station in Gujarat, India. | ||
OneEnergy Limited (OneEnergy) 5,588/383MW(3) | 50% | A 50:50 strategic joint venture with the Mitsubishi Corporation of Japan, which currently owns a 22.4% interest inElectricity Generating Public Company Limited (EGCO) in Thailand. EGCO owns and operates:
• REGCO and KEGCO gas-fired combined-cycle power stations in Thailand (2,056MW)
• 25% interest in the 1,070MW Nam Theun 2 hydro project in Laos, under construction
• 50% interest in the 1,468MW Kaeng Khoi 2 CCGT project in Thailand, under construction
• 368MW out of a total of 994MW in a portfolio of small power projects operating and under construction in Thailand and the Philippines
| ||
Ho-Ping Power Company (HPC), Taiwan 1,320/528MW | 40% | HPC owns a 1,320MW coal-fired power station at Ho-Ping, Taiwan. Operation started in 2002 and is by a separate joint venture, with the same shareholdings as HPC, but with CLP management leadership.
| ||
BLCP Power Limited (BLCP), Thailand 1,434/717MW | 50% | BLCP is the developer of a 1,434MW coal-fired power station now under construction at Map Ta Phut, Thailand. CLP is responsible for construction management and is the major shareholder in the operating company.
|
| Note (3): | The 383 equity MW attributed to CLP, through its 50% equity interest in OneEnergy, takes into account that OneEnergy indirectly holds varying equity interests in the generating assets included in the 5,588 gross MW. |
Page 10
Table of Contents
Chinese Mainland
Investments Gross/Equity MW | Equity Interest | Description | ||
Guangdong Nuclear Power Joint Venture Company, Limited (GNPJVC) 1,968/492MW | 25% | GNPJVC was established in 1985 to construct and operate Guangdong Daya Bay Nuclear Power Station (GNPS) at Daya Bay
| ||
Hong Kong Pumped Storage Development Company, Limited (PSDC) 1,200/600MW
| 49% | PSDC has the right to use half of the 1,200MW pumped storage capacity of Phase 1 of the Guangzhou Pumped Storage Power Station until 2034. | ||
CLP Guohua Power Company Limited (CLP Guohua) 2,100/630MW(4) | 49% | CLP Guohua holds interests in three coal-fired power stations:
• Beijing Yire Power Station in Beijing
• 50% interest in 1,000MW Panshan Power Station in Tianjin
• 55% interest in 700MW Sanhe Power Station in Hebei
| ||
CLP Guohua Shenmu Power Company Limited (Shenmu) 200/98MW
| 49% | Shenmu Power Station, in Shaanxi , has two 100MW coal-fired units. , has two 100MW coal-fired units. | ||
Guizhou CLP Power Company Limited (Guizhou CLP Power) 600/420MW
| 70% | Guizhou CLP Power owns and operates two 300MW coal-fired generating units which supply the Guizhou power grid and, indirectly, Guangdong Province power grid and, indirectly, Guangdong Province . . | ||
Shandong Zhonghua Power Company, Ltd. (SZPC) 3,000/882MW
| 29.4% | SZPC owns four coal-fired power stations, Shiheng I and II (totalling 1,200MW), Liaocheng (1,200MW) and Heze II (600MW), in Shandong Province . . | ||
Huaiji Small Hydropower Stations (Huaiji) 98/74MW | 75% | Eight small hydro power stations in Huaiji County
|
 . GNPS is equipped with two 984MW Pressurised Water Reactors for which the majority of the equipment was imported from France and the United Kingdom. 70% of electricity generated is supplied to Hong Kong, with the remaining 30% sold to Guangdong.
 (400MW)

 , Guangdong Province are in operation, with one under construction, amounting to a total of 98MW. CLP’s equity interest in Huaiji was increased to 84.9% on 4 August 2006.
Page 11
Table of Contents
HNEEP-CLP Changdao Wind Power Co., Ltd. (Changdao Wind Power) 27/12MW
| 45% | Changdao wind farm, with a generating capacity of 27MW, started commercial operation in May 2006. It is connected to the Shandong provincial grid to serve Yantai City . . | ||
CLP Guangxi Fangchenggang Power Company Limited (Fangchenggang) 1,200/840MW
| 70% | Construction of a new power station with two 600MW coal-fired units at Fangchenggang , Guangxi , Guangxi is in progress. The first unit is scheduled for commissioning by third quarter of 2007. is in progress. The first unit is scheduled for commissioning by third quarter of 2007. | ||
HNNE-CLP Weihai Wind Power Company Limited (Weihai Wind Power) 20/9MW
| 45% | Weihai wind farm is located in Shandong Province and has an initial capacity of 20MW, with commissioning due in 2006/7. The power will serve local electricity needs. | ||
Huaneng Shantou Wind Power Company Limited (Nanao II Wind Power) 45/11MW
| 25% | Nanao II wind power project of 45MW is located on Nanao Island off Shantou , Guangdong Province. The power generated from this wind farm, which is targeted for commissioning in 2007, will serve the local electricity needs of Shantou City. , Guangdong Province. The power generated from this wind farm, which is targeted for commissioning in 2007, will serve the local electricity needs of Shantou City. |
| Note (4): | The 630 equity MW attributed to CLP, through its 49% equity interest in CLP Guohua, takes into account that CLP Guohua holds varying equity interests in the generating assets included in the 2,100 gross MW. |
Page 12
Table of Contents
Electricity Business in Hong Kong
The Hong Kong economy maintained robust growth in the first quarter of 2006, supported by exports and local retail sales. With services contributing a high portion of GDP, increased energy efficiency awareness of electricity consumers and milder weather conditions in the period, local sales of electricity rose only moderately by 0.8% in the first half of the year, over the same period in 2005.
An analysis of the local sales by sector during the period is as follows:
Increase/(Decrease) Over 1st Half of 2005 | Percentage of Total Local Sales | |||
Residential | (1.6)% | 23.0% | ||
Commercial | 5.1% | 41.6% | ||
Infrastructure & Public Services | (2.7)% | 25.8% | ||
Manufacturing | (1.0)% | 9.6% |
Affected by the weather conditions in the period and public awareness of energy conservation, the Residential Sector recorded a slight drop in sales. The apparent strong growth in the Commercial Sector was due to the improved economy and reclassification from the Infrastructure & Public Services (IPS) Sector of the accounts previously under the Hong Kong Housing Authority and now transferred to The Link Real Estate Investment Trust. In the IPS Sector, lower consumption was recorded for Public Services as a result of Government’s energy saving programme. For the Manufacturing Sector, the declining trend continued, but at a slower rate.
Supply to Guangdong Power Grid Corporation and Shekou remained relatively stable during the first half of 2006, compared to the same period in 2005. The combined sales to these two large mainland customers dropped slightly by 1.4%.
Total unit sales, which include both local sales and sales to the Mainland, rose by 0.5% compared to the corresponding half-year in 2005.
Towards the end of 2005, we announced that CLP’s tariffs to our Hong Kong customers would be frozen in 2006. There has been no tariff increase since 1998. Our customers continue to enjoy an average net tariff that remains the lowest in Hong Kong and amongst the lowest in metropolitan cities and open markets around the world.
In March, CLP submitted its formal response to Government’s Stage II Consultation on the future of Hong Kong’s electricity industry. In our response (which is available on our website at www.clpgroup.com) we expressed our support for Government’s policy objectives of reliable, safe, efficient and environmentally responsible energy supplies, at reasonable prices. However, we also expressed our strong and justified reservations about Government’s proposals in four major areas: environmental disincentives, unclear plans to migrate to a competitive market, inadequate incentives to encourage investment, and an unreasonably short duration of the future regulatory regime.
Page 13
Table of Contents
In May 2006, Government issued an information paper summarising the views received during the Stage II Consultation. These included over 17,000 written submissions from different sectors of the community and over 700 messages through the discussion forums on Government’s website. Many submissions were in line with our own views and there was a general consensus that reliability and safety of supply was vital and should be the key consideration in the future development of the electricity market. There were many reservations about the implications of introducing new supply sources from the Chinese mainland, as well as concerns that the proposed rate of return to the power companies, in a range of 7% to 11%, might be too low to attract continued investment and might affect supply reliability. There were also suggestions to provide incentives to encourage investment in emissions reduction facilities. The need for a stable and long term regulatory regime, in order to promote timely and adequate investment, is an important consideration which CLP has firmly and consistently emphasised in its contribution to the public debate on the future of our industry.
Investment in Hong Kong’s electricity infrastructure is necessary, substantial and continuous. For example, in the first half of 2006, in line with the Financial Plan approved by Government, CLP incurred HK$1.8 billion of capital expenditure on its transmission and distribution networks, in order to enhance supply quality and reliability, as well as providing for the demand created by residential and civil and social infrastructure development projects in our supply area.
In his Chairman’s Statement, Sir Michael Kadoorie has highlighted two major projects which CLP currently has in hand with a view to enhancing the operating and environmental performance of our generating capacity in Hong Kong – the Castle Peak ‘B’ Power Station Emissions Reduction Project and the LNG receiving terminal.
In respect of the Castle Peak ‘B’ Power Station Emissions Reduction Project, we have received and are evaluating tenders for demolition and plant re-location works and have issued the tenders for the provision of flue gas desulphurisation (FGD) equipment and Boiler Island equipment (mainly for nitrogen oxide removal).
With regard to the LNG receiving terminal, the EIA studies are scheduled for completion in August 2006. We have devoted substantial resources and efforts to engage the community regarding the importance of the timely provision of an LNG receiving terminal in meeting Hong Kong’s energy needs in an effective, reliable and clean way. Our activities have included briefings to legislators and district councillors, workshops with representatives of environmental groups, roundtable discussions with industry and academic experts, site visits by stakeholders to potential sites, and media briefings. Details of the project and our stakeholder engagement activities can be obtained through our project website at www.clpgroup.com/environment/lng or our telephone hotline at (852) 2678 8189.
Everything we do in our Hong Kong electricity business must result in the delivery of excellent service to our customers. Our commitment to quality customer service is reinforced by our performance pledges, which are published annually and cover all the key aspects of our service to customers. Our efforts in this regard are recognised by both our customers and industry peers. We were encouraged by recent awards from the Hong Kong Association for Customer Service Excellence in the category of “Contact Service Centre” and “Counter Service” as well as receipt of the Hong Kong Management Association’s Award for Excellence in Training for our call centre in the category of “Outstanding New Trainer”.
Page 14
Table of Contents
Energy Business in Australia
TRUenergy has undergone a programme of organisational realignment aiming at integrating the Yallourn and merchant energy business (MEB) in order to achieve greater operating synergies. This process has progressed well with a number of organisational changes to increase the focus of the business on maintaining retail revenues and achieving greater customer responsiveness.
During the first half of 2006, CLP reached a settlement with Singapore Power in relation to certain matters regarding the purchase of the MEB in 2005. This settlement was treated as a purchase price adjustment.
In January 2006, there was a fire in the coal conveyor at Yallourn Power Station which resulted in an outage for Units 1 and 2. The fire occurred during a time of high temperatures resulting in high electricity spot prices. Due to the efforts of Yallourn staff, the coal supply was restored within five days. At the same time, we were able to use the generation capacity available elsewhere in the TRUenergy portfolio to minimise the impact of the lost generation on our market position. This incident provided a clear illustration of the value of a portfolio of generating capacity in this market, as compared to reliance on a single asset.
The development of the 400MW combined-cycle gas-fired power station in Tallawarra in New South Wales (NSW) is proceeding well. The Tallawarra project will provide 400MW of gas-fired combined-cycle capacity to the TRUenergy portfolio. Consistent with TRUenergy’s strategy of integrating generation and retail, this project will form a basis for the expansion of the retail business in NSW. The combined-cycle plant will use natural gas at high levels of energy efficiency and has a very low level environmental impact.
The relevant approvals have been obtained and the site is being prepared for construction. Notice to proceed was issued on the main engineering, procurement and construction contract in June 2006. The plant is scheduled to start operation in late 2008, in time for the summer peak in NSW.
Overall competition in the retail energy market continues to be aggressive, particularly in the Victorian gas and electricity mass markets. Our marketing and sales initiatives have been successful in ensuring that our own customer churn (that is, the percentage of customers switching suppliers) is better than the average market rates and, we anticipate, will allow us to maintain our current market share. Competition in other regions is continuing to increase, albeit at substantially lower levels than the Victorian market. We do not expect these competitive pressures to diminish in the short term.
Electricity Investments in the Chinese Mainland
The Guangdong Daya Bay Nuclear Power Station (GNPS), in which CLP holds a 25% stake, operated at a high capacity factor during the first half of the year, except for the period during which Unit 1 was shut down for the planned 10th year refuelling outage. During the outage, comprehensive statutory inspections of safety-related equipment were made and the results were found satisfactory. GNPS has achieved a good safety record throughout the period under review. The station was awarded first places in Industrial Safety and in Radiation Protection in the 2005 Safety Challenge Competition, which included all the nuclear power stations in France, sister plants to GNPS.
Page 15
Table of Contents
Elsewhere, coal supply and tariff management continued to be the primary focus of management attention in our joint ventures: SZPC, CLP Guohua and Guizhou CLP Power. The coal supply situation has gradually improved and coal prices have started to stabilise, although they remain high. The coal supply to our joint ventures has been able to sustain generating requirements during the first six months of 2006, except for a short period early in the year when tight coal supply temporarily restricted generation at Anshun II Power Station in Guizhou.
Generating companies in the Mainland have been under financial pressure as a result of high coal prices. To alleviate this, the PRC authorities have announced the second round of coal price linked tariff adjustments in June 2006, following the first round implemented in May 2005.
Construction of the coal-fired Fangchenggang project in Guangxi is underway. The site has been formed and civil construction works are well advanced. The marine terminal for receiving coal deliveries is also under construction. Equipment for the 2 x 600MW generating units is being manufactured and components are being delivered to site. By the end of June 2006 equipment supply and construction costs representing 90% of the total projected contract values had been signed. The work remains on schedule to bring the first unit into operation by third quarter of 2007.
Electricity Investments in Other Countries in Asia
In March 2006 we announced the formation of a 50:50 strategic joint venture with Mitsubishi Corporation, called OneEnergy Limited. OneEnergy will draw on the combined expertise and capital of CLP and Mitsubishi to serve the region’s growing power needs. Mitsubishi’s local networks and relationships, as well as its experience in the independent power producer (IPP) business, are complementary to CLP’s strong skills and experience in project development, execution, construction and operation.
OneEnergy will operate in the Southeast Asia and Taiwan markets and will be the exclusive power sector investment vehicle in these markets for its two shareholders. The joint venture, which now holds the 22.4% interest in EGCO in Thailand, previously held by CLP, aims to expand elsewhere in Southeast Asia as suitable opportunities arise. CLP and Mitsubishi are also discussing the further injection into OneEnergy of their other assets in Southeast Asia and Taiwan.
Dialogue is continuing with EGCO and Electricity Generating Authority of Thailand (EGAT) regarding our position in EGCO, as well as EGCO’s role in future expansion of generation capacity in Thailand. We are also finalising discussions with EGCO on the injection of our interest in the BLCP power project into EGCO.
Construction of the coal-fired BLCP power plant, in which CLP owns a 50% share, is on schedule for commercial operation of the first unit in October 2006 and the second unit in early 2007. On completion, this project will make a substantial contribution to improving fuel diversity in the Thai electricity system. A separate joint venture, in which CLP owns 60%, is mobilised to take over operation and maintenance of the power plant upon commercial operation.
Page 16
Table of Contents
At the Ho-Ping power plant in Taiwan, in which CLP holds a 40% interest, repair work on Unit 1, which suffered a turbine blade failure in December 2005, was completed in May. The unit is operating on reduced output until late 2006, when new turbine blades will be installed to restore the full machine capacity. Rebuild of the first of the three coal storage domes destroyed during strong typhoons in 2004 and 2005 has commenced and will be completed in May 2007. Contracts for the remaining two coal domes are being finalised and construction works are scheduled for completion in late 2007 and mid 2008 respectively. Mitigation measures have been put in place and there is no significant impact on operation while the coal domes are being rebuilt.
The Taiwan government has announced a new round of solicitation for IPPs, with priority placed on coal-fired generation in northern Taiwan to be commissioned in 2011. The existing Ho-Ping power plant site within the Ho-Ping industrial zone is strategically located to serve such requirements. Work on developing the expansion plan and securing related environmental approvals is in progress.
In India, GPEC has continued to operate at high levels of reliability and availability. There have been no new disputes on billing with the off-taker and payments have been made on time and in full so far this year. Our major concern at GPEC is the availability of natural gas, since the supply from some of the existing contracts is expected to start to decline next year. GPEC can run on naphtha, as an alternative to gas, but this is much more costly. We are attempting to identify alternative sources of gas prior to the wider availability of LNG and natural gas from India’s east coast, which we expect to emerge some years in the future. In the circumstances, the development of GPEC II power station is on hold, and will be reactivated when the prospects of obtaining gas at a competitive price have become firmer.
Renewable Energy
During the opening months of 2006 CLP has continued to move forward with its renewable energy activities, in line with the commitment made in our 2004 ‘Manifesto on Air Quality and Climate Change’ that energy from renewable sources should represent 5% of our total equity generating capacity by 2010.
The 27MW wind farm in Changdao, Shandong, in which CLP has a 45% share, commenced commercial operation on 1 May 2006. Erection of wind turbine generators has started at the 20MW wind farm in Weihai, Shandong. Negotiations are also in final stage on the wind turbine supply contract for the 45MW wind farm on Nanao Island.
In August 2006, CLP has further increased its stake in the Huaiji project from 75% to 84.9%. Comprising nine small hydro-electric power stations, Huaiji has a total generating capacity of 98.4MW. These environmentally friendly small hydro power stations together represent a substantial portion of the total generating capacity of Huaiji County.
In Hong Kong, wind data collection is in progress at two potential sites for a wind pilot demonstration project. Other development work, including environmental studies, is in progress, with a view to construction and commissioning taking place in 2007.
CLP is collaborating with a UK wind farm developer, Wind Prospect, in evaluating a potential 150-180MW offshore wind farm in waters off Sai Kung in Hong Kong. The EIA commenced with the receipt of study brief from the Government in May 2006. Stakeholder engagement is in progress with various government departments, Sai Kung District Council, rural committees and environmental groups.
Page 17
Table of Contents
Our Roaring 40s joint venture with Hydro Tasmania is carrying forward the construction of a 75MW wind farm at Woolnorth Studland Bay in Tasmania. Commissioning is planned for early 2007. This facility will complement Roaring 40s’ existing portfolio of wind power assets in Australia. In April Roaring 40s signed a co-operation agreement with Guohua Energy Investment Corporation. At the end of May, this framework led to agreement on the commercial arrangements for a wind power project near Rongcheng City in Shandong Province. This wind farm, with an operating capacity of 48.75MW, is scheduled for full commissioning in mid-2007.
In light of the Australian Federal Government’s decision not to increase the Mandatory Renewable Energy Target, which is crucial for new renewable energy projects to be economically viable, Roaring 40s has decided to halt development of two wind farms in Australia. Discussions are proceeding with the Federal Government as well as State Governments about alternative means to encourage the development of renewable energy projects in Australia.
Human Resources
As at 30 June 2006, the Group employed 6,251 staff (2005: 5,672), of whom 3,862 (2005: 3,829) were employed in the electricity business in Hong Kong and 2,035 (2005: 1,536) in energy businesses outside Hong Kong in Australia, the Chinese mainland and India. The increase was mainly due to the inclusion of employees in the Huaiji Project as a result of reclassification of Huaiji from a jointly controlled entity to a subsidiary of the Group after completion of a shareholding restructuring on 3 November 2005. Total remuneration for the six months ended 30 June 2006 was HK$1,516 million (2005: HK$1,223 million), of which HK$901 million (2005: HK$866 million) was for the Scheme of Control business. Of the total remuneration, retirement benefit costs amounted to HK$123 million (2005: HK$100 million).
The Annual Group Management Development & Succession Planning (MDSP) review was held in March 2006 when the Group-wide MDSP status and key strategic MDSP issues were reviewed by the Chief Executive Officer and senior management.
To strengthen CLP’s talent acquisition strategy, scholarships were granted to outstanding electrical engineering students in universities in Hong Kong. We have also exploited synergies between the Scholarship Programme, Internship Programme and Engineering Graduate Trainee Programme to ensure that the most suitable young graduates are attracted and recruited as our Engineering Graduate Trainees. In addition to the Engineering Graduate Trainee Programme which aims at developing future engineering managers, CLP is also actively nurturing our future supply of skilled tradesmen through Apprenticeship Programmes.
During the first half of 2006 we have continued to strengthen region-wide human resources (HR) programmes as part of increasing Group synergy. For example:
| • | The Group-wide MDSP process was implemented in TRUenergy. This enabled senior management to quickly assess succession strength and identify new talent in the pipeline. |
| • | Plans for a regional development programme for Graduate Engineers were finalised, and the first two candidates from Hong Kong were selected. |
| • | The international movement of individual staff between subsidiaries has been facilitated. |
| • | Initial design work was completed on a regional HR information system that will enable us to access key HR data across the Group more easily and consistently. |
Page 18
Table of Contents
Safety
There were no reported disabling injury incidents in our Hong Kong electricity business in the first six months of 2006. The resulting disabling injury incidence rate (DIIR) of 0.00 compared favourably with the performance during 2005 (0.16). However, maintaining a good safety record demands constant vigilance and attention by all concerned. We are continuing with a series of five safety enhancement initiatives and other cultural improvement processes aimed at reinforcing our employees’ attitudes towards safety at work. These initiatives include:
| • | Safety visits by directors and senior management |
| • | Peer review by the managers of other departments |
| • | Safety coaching by fellow workers (Safety Leaders) |
| • | Predictive indicators for monitoring safety efforts against performance |
| • | Safety Incentive Scheme to encourage participation from all level of staff |
There were no reported disabling injury incidents for staff at GPEC, Ho-Ping, Torrens Island and Iona Gas Storage during the first six months. Two reportable incidents took place at Yallourn Power Station. A DIIR of 0.00 was maintained at GPEC, Ho-Ping, Torrens Island and Iona during the current year, whereas the DIIR was 2.04 for Yallourn due to two incidents. Safety enhancement initiatives were continued at all stations.
The CLP Group’s regular joint venture Safety and Health Synergy Forum continued to enhance the sharing of experience and knowledge on safety issues across the Group and with our joint venture partners.
There was a fatal accident involving an employee of a contractor working at the site of the BLCP Project in February this year. A thorough investigation has been undertaken and the necessary measures have been taken with the contractors to strengthen safety management.
Environment
CLP’s environmental performance is overseen by the Social, Environmental & Ethics (SEE) Committee of the Board of Directors, which was established in October 2005. The SEE Committee met in February 2006 to review the Social and Environmental Report (SER) 2005 prior to its publication in March. In response to stakeholder feedback, we shortened our report from 48 pages in SER 2004 to 28 pages in SER 2005. Stakeholders have responded favourably to the shorter, more focused report.
The 2005 SER focused on four major environmental issues for CLP and our stakeholders: air quality, climate change, renewable energy and energy efficiency and conservation.
Air Quality
CLP is committed to do our share to reduce emissions from Hong Kong sources. The construction of an LNG receiving terminal in Hong Kong, and a retrofit of our coal plant at Castle Peak with FGD and other controls (see pages 4, 5 and 14) are examples of the major investments that we are preparing to make in order to meet this commitment.
The use of ultra-low sulphur coal, branded as “Envirocoal”, has contributed to a significant reduction of sulphur dioxide. We continue to procure low sulphur coal for the Castle Peak Power Station and are seeking further opportunities with our committed coal suppliers to provide lower sulphur coal where possible.
Page 19
Table of Contents
Climate Change and Renewable Energy
In the 2005 SER, we published our climate strategy statement to the public for the first time. Our strategy relies on a high level of transparency in managing and reporting our greenhouse gas emissions.
In addition to publishing our greenhouse emissions in the 2005 SER, CLP submitted its response to the Carbon Disclosure Project 4 (CDP4) in June 2006. CLP is the only Hong Kong-based company that has participated in CDP since its inception. This year’s response featured our new climate strategy, an overview of the business impact of existing and possible future climate-related regulations, our communications with stakeholders about the risks and opportunities from greenhouse gas emissions and climate change, and total expenditures for fossil fuels. Our full response is available on our Group website, and will also be available through the CDP website.
CLP’s climate strategy also includes the target to increase the capacity for renewable energy in our portfolio to 5% by 2010. In 2005, we increased our share from less than 0.5% to 1.4% and, as at 30 June 2006, this represented 1.7%. The status of our renewable energy portfolio and the steps we are taking to continue to expand our activities in this area are explained on pages 17 and 18 of this Interim Report.
Energy Efficiency and Conservation
CLP has a long-standing commitment to energy efficiency and conservation.
In February, we commissioned our first green distribution substation, at the Royal Hong Kong Yacht Club in Sai Kung. This substation is equipped with a vegetable oil transformer, nitrogen gas insulated switchgear, oil-free cables and a cadmium-free battery. We will be introducing these features into other new substations when appropriate.
In June 2006, CLP launched a series of “Go Greening” initiatives, including a pledge to plant 30,000 trees over the next three years in Tai Lam Country Park in Fu Tei, Tuen Mun. In addition, trees and scrubs will be planted on the rooftop of a CLP substation facility in Lai Chi Kok to create a “Sky Woodland” both to enhance the visual amenity of the substation and help conserve energy.
In Hong Kong, through our longstanding “Powerwise” programme, together with community events, seminars and advisory support, we continue to promote energy efficiency and conservation to the public. A particularly successful initiative was our collaboration with non-governmental organisations on the safe and smart use of energy to support achieving a greener and cleaner indoor environment at homes for the elderly. In July, CLP joined the “Energy Conservation Charter 2006 – Suitable Room Temperature” organised by Hong Kong Government’s Environmental Protection Department with a pledge to save energy in the working environment and adhere to the principle of “Use if Required, Save if Possible”.
Conservation applies to water as well as energy. We have a successful track record of water conservation projects at our facilities. Our most recent water conservation project was launched by TRUenergy in April 2006. The A$300,000 upgrade to the onsite water treatment facilities at the Torrens Island Power Station in South Australia will reduce wastewater discharge by 90% after completion of the project. The upgrade will deliver significant environmental and operating improvements and will also improve the power station’s reliability in times of peak demand.
Page 20
Table of Contents
Shareholder Value
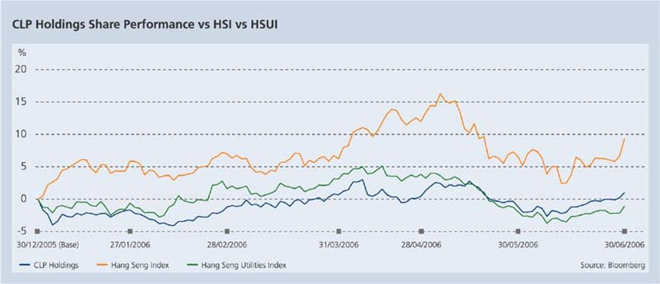
During the first half of 2006, CLP’s share price and the Hang Seng Index (HSI) rose by 1.00% and 9.35% respectively, while the Hang Seng Utilities Index (HSUI) declined by 1.10%.
The final dividends for 2005, comprising HK$0.83 per share by way of ordinary dividend and HK$0.11 per share as special dividend, were paid to shareholders on 26 April 2006. The first interim dividend for 2006 of HK$0.50 per share was paid on 15 June 2006 and the second interim dividend of HK$0.50 per share will be paid on 15 September 2006.
Page 21
Table of Contents
The condensed consolidated interim accounts for the six months ended 30 June 2006 are unaudited but have been reviewed by the Audit Committee and our external Auditors. The Accounting policies adopted in the preparation of this interim result are consistent with those set out in the 2005 Annual Report, except the Group has adopted the new Hong Kong Financial Reporting Standards (HKFRS) Interpretation 4 “Determining whether an Arrangement contains a Lease”. The adoption of this Interpretation has resulted in certain power purchase arrangements being treated as leases for accounting purposes. The financial impact of adopting this Interpretation is disclosed under Note 2 to the accounts.
Consolidated Financial Results
Revenue
During the six-month period to 30 June 2006, there was a 30.9% increase in revenue to HK$21,412 million (2005: HK$16,361 million).
Revenue from our business in Hong Kong recorded a 2.6% growth to HK$14,061 million (2005: HK$13,704 million). The increase was mainly due to higher unit sales and increased fuel clause revenue. The transfer from the Development Fund, which is an adjustment under the SoC, has now been reclassified as revenue, which amounted to HK$488 million (2005: HK$338 million).
Revenue from our energy businesses outside Hong Kong amounted to HK$7,351 million (2005: HK$2,657 million), with the increase mainly from Australia of HK$6,502 million (2005: HK$1,968 million) as a result of the incorporation of the MEB’s full six months’ revenue as compared to the one month post-acquisition period in 2005. It should be noted that about 38% of the revenues from the retail sales of electricity and gas in Australia have to be paid as network charges to third party network operators.
Group Earnings
CLP Group’s total operating earnings for the first half of 2006 were HK$4,936 million, which was HK$499 million higher than the corresponding period last year, representing an increase of 11.2%. Included in the total operating earnings is a one-off item relating to a gain of HK$291 million on the formation of OneEnergy. The total earnings, which include Hok Un redevelopment profit, increased by 7.9% to HK$4,975 million, as compared to the corresponding period in 2005.
Our electricity business in Hong Kong continues to provide mild but stable earnings growth, with earnings increasing by 1.8% to HK$3,573 million. This resulted from ongoing investments in fixed assets to meet new customer demands and to improve quality of services.
Earnings from investments in GNPJVC and PSDC decreased by HK$84 million to HK$347 million. This was due to Daya Bay Unit 1 planned outage for 10-year refuelling in the current period. Earnings from other investments in the Chinese mainland were slightly increased as a result of improved contribution from Shandong.
Our energy businesses in Australia recorded earnings of HK$287 million as compared to losses of HK$8 million in 2005, as a result of a full six months’ contribution from the MEB as compared to only one month in 2005, and the synergy gain from the progressive integration of Yallourn Energy and the MEB.
Page 22
Table of Contents
Smooth operation and improved collection of payments from the electricity off-taker increased the earnings from GPEC, India by HK$92 million to HK$371 million.
The decrease in earnings from power projects in Southeast Asia and Taiwan is due to a lower earnings contribution from Ho-Ping of Taiwan, which was substantially reduced as a result of the prolonged outage of one of the units caused by turbine blade damage that occurred in December 2005. The repaired unit resumed operation in May 2006.
In March 2006, CLP and Mitsubishi Corporation of Japan formed a strategic joint venture, called OneEnergy, to combine their respective expertise and capital to serve the power needs in Southeast Asia and Taiwan. The Group’s interest of 22.4% in EGCO Thailand has been injected into OneEnergy. One-off profits arising from the formation of OneEnergy amounted to HK$291 million.
Unallocated finance costs incurred in the current period increased by HK$79 million to HK$122 million as a result of borrowings to fund the new investments of the Group.
Following the adoption of the new HKFRS–Interpretation 4 in 2006, its impact on earnings is an increase in profit for the period of HK$19 million.
Page 23
Table of Contents
The contribution of each major activity to the Group earnings is analysed as follows:
| 6 months ended 30 June | ||||||||||||||
| 2006 | 2005 | Increase | ||||||||||||
| HK$M | HK$M | HK$M | HK$M | % | ||||||||||
Earnings from electricity business in Hong Kong | 3,573 | 3,510 | 1.8 | |||||||||||
Electricity sales to Chinese mainland from Hong Kong | 55 | 63 | ||||||||||||
Generating facilities in Chinese mainland serving Hong Kong (GNPJVC & PSDC) | 347 | 431 | ||||||||||||
Other power projects in Chinese mainland | 106 | 95 | ||||||||||||
Energy business in Australia | 287 | (8 | ) | |||||||||||
Electricity business in India | 371 | 279 | ||||||||||||
Power projects in Southeast Asia and Taiwan | 142 | 185 | ||||||||||||
Renewable energy business | (25 | ) | 4 | |||||||||||
Other businesses | (6 | ) | (5 | ) | ||||||||||
One-off gain on formation of OneEnergy | 291 | — | ||||||||||||
Earnings from other activities | 1,568 | 1,044 | 50.2 | |||||||||||
Unallocated net finance costs | (122 | ) | (43 | ) | ||||||||||
Unallocated Group expenses | (83 | ) | (74 | ) | ||||||||||
Total operating earnings | 4,936 | 4,437 | 11.2 | |||||||||||
Hok Un redevelopment profit | 39 | 174 | ||||||||||||
Group earnings attributable to shareholders | 4,975 | 4,611 | 7.9 | |||||||||||
Weighted average number of shares in issue, million shares | 2,408.25 | 2,408.25 | ||||||||||||
Earnings per share, HK$ | ||||||||||||||
Including Hok Un redevelopment profit | 2.07 | 1.91 | 7.9 | |||||||||||
Excluding Hok Un redevelopment profit | 2.05 | 1.84 | 11.2 | |||||||||||
When compared to the corresponding period in 2005, earnings per share, including Hok Un redevelopment profit, increased by 7.9% whilst earnings per share grew 11.2% after excluding Hok Un redevelopment profit.
Page 24
Table of Contents
Group’s Financial Position
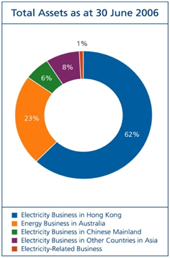
The Group has a strong balance sheet, with total assets as at 30 June 2006 amounting to HK$126,527 million (December 2005: HK$123,622 million).
Our total assets, which comprise primarily fixed and intangible assets, as well as investments in jointly controlled entities and associated companies, analysed by principal activities, are as follows:
| 30 June 2006 | 31 December 2005 | |||||||
| HK$M | % | HK$M | % | |||||
Energy businesses/investments in | ||||||||
Hong Kong | 79,277 | 62 | 75,953 | 61 | ||||
Australia | 28,836 | 23 | 30,172 | 25 | ||||
Other countries in Asia | 9,933 | 8 | 8,804 | 7 | ||||
Chinese mainland | 7,630 | 6 | 7,837 | 6 | ||||
| 125,676 | 99 | 122,766 | 99 | |||||
Property and other businesses | 851 | 1 | 856 | 1 | ||||
| 126,527 | 100 | 123,622 | 100 | |||||
Total bank loans and other borrowings, excluding the obligations under finance leases, amounted to HK$29,582 million, details of which are provided in the “Financing” section. Obligations under finance leases amounting to HK$23,482 million mainly related to the finance lease of CAPCO’s generating assets.
Business Acquisitions and Developments
Pursuant to the Equity Contribution Agreement and its amendment agreement relating to the BLCP power project of Thailand, we are required to make further equity contributions of US$148 million by 2007.
For our investments in the Chinese mainland, we made capital contributions of total RMB10 million (approximately HK$10 million) to wind power projects in Nanao and Weihai and RMB7 million (approximately HK$6 million) to a coal-fired power project in Fangchenggang during the first half of 2006. Further equity contributions of RMB31 million for the Nanao project are expected to be made by 2007 whereas RMB21 million and RMB503 million of equity contributions are expected to be made by 2008 for the Weihai projects and the Fangchenggang projects, respectively.
Page 25
Table of Contents
Fixed Assets and Capital Expenditure
Fixed assets and leasehold land of the Group totalled HK$84,700 million as at 30 June 2006, comprising mainly the investments in the transmission and distribution network and leased generating assets for our Hong Kong electricity business of HK$69,498 million (December 2005: HK$66,724 million) and in the generating facilities of subsidiaries in Australia of HK$14,413 million (December 2005: HK$14,195 million). During the six-month period, we invested HK$2,361 million, of which HK$1,934 million was made by CLP Power Hong Kong, in various fixed assets (including payments for lease premium for land). HK$2,923 million of leased assets, mainly for leased generating assets in Hong Kong, was also added to the Group.
Capital expenditure contracted but not provided for in the accounts, as at 30 June 2006, amounted to HK$2,781 million (December 2005: HK$2,689 million). Other than HK$14 million (December 2005: HK$358 million) which was for our overseas subsidiaries, these contracted amounts are primarily for enhancing our transmission and distribution systems in Hong Kong.
Liquidity and Capital Resources
As at 30 June 2006, we had liquid funds of HK$2,123 million (December 2005: HK$2,041 million), of which 96% was denominated in foreign currency mainly held by overseas subsidiaries in India and Australia. The remainder was in Hong Kong dollars.
We strive to maintain an appropriate mix of committed and uncommitted facilities and solicit our facilities from a pool of financial institutions with strong credit standing. As at 30 June 2006, financing facilities totalling HK$40.9 billion were available to the Group, including HK$15.2 billion for TRUenergy and GPEC. Of the available facilities, HK$29.6 billion had been drawn down, of which HK$10.9 billion was by TRUenergy and GPEC. Facilities totalling HK$7.8 billion were available to CAPCO, of which HK$7.1 billion had been drawn down. The debts of overseas subsidiaries are without recourse to CLP Holdings. Of these borrowings, HK$629 million as at 30 June 2006 are secured by fixed and floating charges over the assets of GPEC and HK$225 million are secured by fixed assets and land use rights in Huaiji.
Our total debt to total capital ratio as at 30 June 2006 was 36.2%. Interest cover for the six months ended 30 June 2006 was 7.9 times.
Financing
The Group engaged in new financing activities in the first half of 2006 to support the expansion of our electricity business in Hong Kong. We continue to adopt a prudent approach to all our financial arrangements, while at the same time aiming to achieve cost effective funding.
In January 2006, through its wholly-owned subsidiary CLP Power Hong Kong Financing Limited, CLP Power Hong Kong issued HK$1 billion fixed rate notes due in 2016 with coupon rate at 4.75%. This issue was made under the Medium Term Note (MTN) Programme set up by CLP Power Hong Kong Financing Limited in 2002. Under the MTN Programme, notes in an aggregate amount of up to US$1.5 billion may be issued and will be unconditionally and irrevocably guaranteed by CLP Power Hong Kong. As at 30 June 2006, notes with a nominal value of about HK$6,340 million have been issued under the MTN Programme.
Page 26
Table of Contents
Debt Profile
The charts below show the type, interest rate, maturity and currency profiles of borrowings of the Group and CAPCO at 30 June 2006:
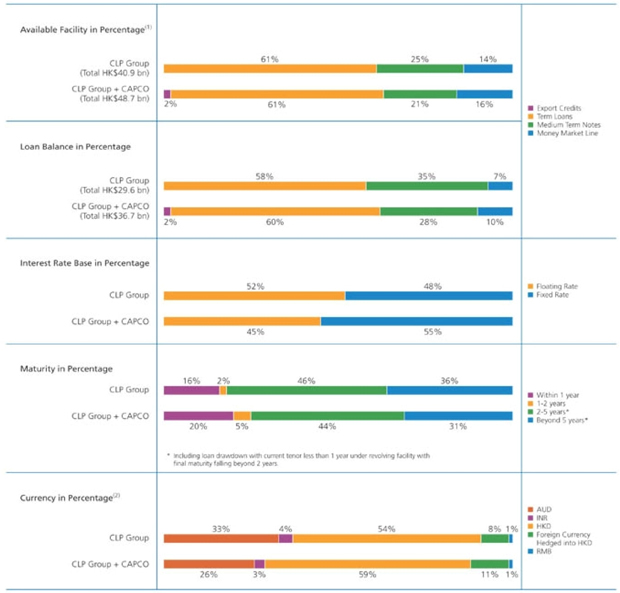
Notes:
| (1) | For the Medium Term Note Programme, only the amount of the Notes issued as at 30 June 2006 was included in the total amount of Available Facility. |
| (2) | The Australian dollar loans were drawn by CLP Australia Finance Pty Ltd for our Australian business whereas the loans in Indian Rupees were drawn by GPEC. Loan in Renminbi was drawn for a China project. |
Credit Rating
In May 2006, Moody’s upgraded CLP Power Hong Kong’s foreign currency issuer rating from A1 to Aa3, thereby matching CLP Power Hong Kong’s local currency rating and foreign currency bond rating. This followed Moody’s examination of corporate sector ratings throughout the Asia-Pacific region in light of a revision of its rating methodology for “Foreign-Currency Ceilings”.
Page 27
Table of Contents
In June 2006, S&P re-affirmed the long-term and short-term credit ratings of CLP Holdings at A/A-1 and CLP Power Hong Kong at A+/A-1 with stable outlook. This reflects CLP Holdings’ good financial profile, which is supported by good cash flows from our Hong Kong operations. S&P quoted in its credit rating reports that although negative regulatory developments for CLP’s Hong Kong operations could result in downward pressure on the rating, there is some scope for a modest reduction in the rate of return without a simultaneous reduction in credit rating, in view of CLP Power Hong Kong’s good financial profile. S&P also re-affirmed the long-term credit ratings of CLP Australia Holdings Pty Ltd at A- with stable outlook.
In July 2006, Moody’s re-affirmed the long-term and short-term credit ratings of CLP Holdings at A1/P-1 and CLP Power Hong Kong at Aa3/P-1 with stable outlook. Moody’s recognised CLP Holdings’ solid liquidity profile, supported by the Group’s strong access to domestic and international bank capital markets, as well as its well-managed debt maturity profile. At the same time, Moody’s opined that CLP Holdings’ overall risk profile is tempered by the increasing financial leverage and business risks arising from the company’s diversification initiatives and overseas expansion.
Separately, Fitch assigned its self-initiated long-term issuer default rating of A+ to CLP Holdings and CLP Power Hong Kong with stable outlook and BBB+ to CLP Australia Holdings Pty Ltd with stable outlook.
The credit ratings of major companies within the Group as at 30 June 2006 are summarised below. All ratings remain at investment grade which can facilitate and enhance our position in local and overseas business activities, including fund raising, investment and new business opportunities.
| CLP Holdings | CLP Power Hong Kong | CLP Australia S&P | HKSAR Government (1) | |||||||||||
| S&P | Moody’s | S&P | Moody’s | S&P | Moody’s | |||||||||
Long-term Rating | ||||||||||||||
Foreign Currency | A | A1 | A+ | Aa3 | A- | AA | A1 | |||||||
Outlook | Stable | Stable | Stable | Stable | Stable | Stable | Positive | |||||||
Local Currency | A | A1 | A+ | Aa3 | A- | AA | Aa3 | |||||||
Outlook | Stable | Stable | Stable | Stable | Stable | Stable | Positive | |||||||
Short-term Rating | ||||||||||||||
Foreign Currency | A-1 | P-1 | A-1 | P-1 | — | A-1+ | P-1 | |||||||
Local Currency | A-1 | — | A-1 | — | — | A-1+ | — | |||||||
Note (1): rating updated as at 27 July 2006
Risk Management
The Group’s investments and operations have resulted in exposures to foreign currency risks, interest rate risks, credit risks and price risks associated with the sales and purchases of electricity in Australia. We actively manage such risks by using different derivative instruments with an objective to minimise the impact of exchange rate, interest rate and electricity price fluctuations on earnings, reserves and tariff charges to customers and monitor our risk exposures with the assistance of “Value-at-Risk” (VaR) methodology. VaR is a risk measurement that probabilistically calculates the market risk of a portfolio using historical volatility over a defined holding period. Other than certain electricity trading activities engaged by our Australian business, all derivative instruments are employed solely for hedging purposes.
Page 28
Table of Contents
Foreign Currency Risks
The Group’s foreign currency exposures primarily arise from CLP Power Hong Kong’s significant foreign currency obligations related to its U.S. dollar-denominated debt, nuclear power purchase off-take commitments, fuel and other purchase-related payments and CLP’s investments abroad.
In order to mitigate the potential impact of foreign currency movement on electricity tariffs in Hong Kong, CLP Power Hong Kong continues to hedge a significant portion of its U.S. dollar obligations, provided that the hedging can be accomplished at rates below the Hong Kong Special Administrative Region Government’s historical target peg rate of 7.80. We will review this policy periodically in light of changing market conditions to optimise benefits.
For investments overseas, we do not hedge translation exposure arising from consolidation of the Group’s net assets outside Hong Kong because the investments are long-term and effective hedging instruments are either limited or costly. The translation gains or losses do not affect the Group’s cash flow or earnings until an investment is sold. Our primary foreign exchange risk is at the individual project company level where non-functional currency exposures, if not managed properly, can lead to significant financial distress. Therefore, our primary risk mitigation is to ensure that project-level debt financings are implemented on a local currency basis to the maximum extent possible. Certain investments have incorporated direct and indirect indexation in their project agreements to reduce earnings impact from foreign exchange fluctuation and this is taken into account in establishing the level of local currency financing.
Interest Rate Risks
The Group utilises fixed rate borrowings and interest rate swaps to mitigate the impact of interest rate volatility on current and future corporate profitability.
CLP Power Hong Kong conducts annual reviews to determine a preferred fixed/floating interest rate mix appropriate for its business profile. For the Group’s overseas investments, each project company has developed its own hedging programme taking into consideration project debt service sensitivities to interest rate movements, lender requirements, tax and accounting implications.
Credit Risks
All finance-related hedging transactions and deposits of CLP Holdings and its principal subsidiaries are made with counter-parties with acceptable credit ratings to minimise credit exposure. The Group assigns limits to its counter-parties and monitors potential exposures to each counter-party utilising the VaR methodology. All derivative transactions are entered into at the sole credit of the respective subsidiaries and affiliates and the counter-parties have no recourse to CLP Holdings for any change in the market value of derivatives.
Page 29
Table of Contents
Energy Price Risk
Our Australian business is a vertically integrated business involved in power generation, gas infrastructure and electricity and gas retail sales operating in the National Energy Market (NEM). Because of its vertically integrated business structure, a majority of TRUenergy’s cash flows are internally hedged as a result of the combination of a balance in its generation and retail portfolio along with its diversified generation mix (merit order, fuel type, multiple units). TRUenergy has also entered into energy contracts, such as swaps and option contracts, to help reduce the impact on earnings of the volatility of NEM pool prices.
In addition to its physical market position, TRUenergy participates in energy trading in the over-the-counter bilateral and exchange-traded markets. While the majority of energy trading is in support of marketing TRUenergy’s unhedged generation capacity and gas positions, this activity does create exposures which must be actively monitored and managed.
TRUenergy manages energy price risks through an established risk management framework consisting of policies to place appropriate limits on overall energy market exposures, delegations of authority on trading, pre-defined product lists, regular reporting of exposures, and segregation of duties. The corporate governance process also includes the oversight by a Risk Management Committee which acts on behalf of TRUenergy’s Board.
TRUenergy adopts VaR methodology as an indicator of the notional energy portfolio value exposure with respect to potential adverse movements in forward electricity contract prices. In addition, TRUenergy utilises a Spot Market Risk Measure as a stress test measurement of the risk of its near-term cash flows from extreme spot market price events.
Page 30
Table of Contents
Derivative Instruments
As at 30 June 2006, the Group had gross outstanding derivative instruments amounting to HK$65.5 billion. The fair value of these derivative instruments was at a net deficit of HK$142 million, which represents the net amount we would pay if these contracts were closed out on 30 June 2006. The breakdown by type and maturity profile of the Group’s derivative instruments are shown below:
| Notional Amount | Fair Value Gain/(Loss) | |||||||||
30 June 2006 | 31 December 2005 | 30 June 2006 | 31 December 2005 | |||||||
| HK$M | HK$M | HK$M | HK$M | |||||||
CLP Group | ||||||||||
Forward Foreign Exchange Contracts | 43,085 | 42,828 | (243 | ) | (311 | ) | ||||
Interest Rate Swaps | 7,998 | 9,693 | 131 | (48 | ) | |||||
Currency Swaps | 2,340 | 4,680 | (46 | ) | 125 | |||||
Renewable Energy Certificates | 39 | 100 | 16 | 13 | ||||||
Energy Hedging & Trading Options | 647 | 878 | 44 | 134 | ||||||
Energy Hedging & Trading Swap Contracts | 11,420 | 11,469 | (44 | ) | 71 | |||||
| 65,529 | 69,648 | (142 | ) | (16 | ) | |||||
CAPCO | ||||||||||
Interest Rate Swaps | 3,885 | 4,208 | 81 | 25 | ||||||
Total | 69,414 | 73,856 | (61 | ) | 9 | |||||
Maturity Profile
With the adoption of Hong Kong Accounting Standard 39 “Financial Instruments: Recognition and Measurement”, all derivatives have been recognised in the balance sheet at their fair value.
Page 31
Table of Contents
Condensed Consolidated Income Statement
(Unaudited) 6 months ended 30 June | ||||||||||
| Note | 2006 HK$M | 2005 HK$M | ||||||||
| (Restated | ) | |||||||||
Revenue | 5,6 | 21,412 | 16,361 | |||||||
Expenses | ||||||||||
Purchases of electricity, gas and distribution services | 3 | (9,583 | ) | (6,453 | ) | |||||
Staff expenses | (908 | ) | (665 | ) | ||||||
Fuel and other operating costs | (2,524 | ) | (1,989 | ) | ||||||
Depreciation and amortisation | (2,427 | ) | (2,067 | ) | ||||||
| (15,442 | ) | (11,174 | ) | |||||||
Other gain | 4 | 291 | — | |||||||
Operating profit | 6,7 | 6,261 | 5,187 | |||||||
Finance costs | 8 | (2,419 | ) | (2,072 | ) | |||||
Finance income | 8 | 242 | 251 | |||||||
Share of results, net of tax | ||||||||||
jointly controlled entities | 9, 16 | 1,362 | 1,664 | |||||||
associated companies | 9, 17 | 112 | 51 | |||||||
Profit before taxation | 5,558 | 5,081 | ||||||||
Taxation | 10 | (575 | ) | (470 | ) | |||||
Profit after taxation | 4,983 | 4,611 | ||||||||
Minority interest | (8 | ) | — | |||||||
Earnings attributable to shareholders | 11 | 4,975 | 4,611 | |||||||
Dividends | 12 | |||||||||
First interim paid | 1,204 | 1,156 | ||||||||
Second interim proposed | 1,204 | 1,156 | ||||||||
| 2,408 | 2,312 | |||||||||
Earnings per share, basic and diluted | 13 | HK$ | 2.07 | HK$ | 1.91 | |||||
Page 32
Table of Contents
Condensed Consolidated Balance Sheet
| (Unaudited | ) | (Restated | ) | |||||
30 June 2006 | 31 December 2005 | |||||||
| Note | HK$M | HK$M | ||||||
Non-current assets | ||||||||
Fixed assets | 14 | 82,492 | 79,518 | |||||
Leasehold land and land use rights | 14 | 2,208 | 2,233 | |||||
Goodwill and other intangible assets | 15 | 6,905 | 6,930 | |||||
Interests in jointly controlled entities | 16 | 18,799 | 16,661 | |||||
Interests in associated companies | 17 | 7 | 1,697 | |||||
Finance lease receivables | 18 | 2,519 | 2,652 | |||||
Deferred tax assets | 2,461 | 2,537 | ||||||
Derivative instruments | 19 | 228 | 260 | |||||
Other non-current assets | 161 | 506 | ||||||
| 115,780 | 112,994 | |||||||
Current assets | ||||||||
Inventories – stores and fuel | 570 | 596 | ||||||
Trade and other receivables | 20 | 7,005 | 6,524 | |||||
Finance lease receivables | 18 | 158 | 165 | |||||
Derivative instruments | 19 | 891 | 1,302 | |||||
Bank balances, cash and other liquid funds | 21 | 2,123 | 2,041 | |||||
| 10,747 | 10,628 | |||||||
Current liabilities | ||||||||
Customers’ deposits | (3,353 | ) | (3,308 | ) | ||||
Trade and other payables | 22 | (6,078 | ) | (6,079 | ) | |||
Taxation payable | (572 | ) | (376 | ) | ||||
Bank loans and other borrowings | 23 | (4,705 | ) | (3,508 | ) | |||
Obligations under finance leases | 24 | (1,912 | ) | (1,803 | ) | |||
Derivative instruments | 19 | (829 | ) | (1,134 | ) | |||
| (17,449 | ) | (16,208 | ) | |||||
Net current liabilities | (6,702 | ) | (5,580 | ) | ||||
Total assets less current liabilities | 109,078 | 107,414 | ||||||
Page 33
Table of Contents
Condensed Consolidated Balance Sheet (continued)
| (Unaudited | ) | (Restated | ) | |||||
30 June 2006 | 31 December 2005 | |||||||
| Note | HK$M | HK$M | ||||||
Financed by: | ||||||||
Equity | ||||||||
Share capital | 25 | 12,041 | 12,041 | |||||
Share premium | 1,164 | 1,164 | ||||||
Reserves | ||||||||
Proposed dividends | 1,204 | 2,264 | ||||||
Others | 37,576 | 34,816 | ||||||
Shareholders’ funds | 51,985 | 50,285 | ||||||
Minority interest | 120 | 111 | ||||||
| 52,105 | 50,396 | |||||||
Non-current liabilities | ||||||||
Bank loans and other borrowings | 23 | 24,877 | 25,883 | |||||
Obligations under finance leases | 24 | 21,570 | 19,694 | |||||
Deferred tax liabilities | 5,722 | 5,579 | ||||||
Derivative instruments | 19 | 432 | 444 | |||||
Fuel clause account | 91 | 323 | ||||||
Scheme of Control (SoC) reserve accounts | 26 | 3,413 | 4,174 | |||||
Other non-current liabilities | 868 | 921 | ||||||
| 56,973 | 57,018 | |||||||
Equity and non-current liabilities | 109,078 | 107,414 | ||||||
/s/ W. E. Mocatta
| /s/ Andrew Brandler | /s/ Peter P. W. Tse | ||||||
W. E. Mocatta Vice Chairman | Andrew Brandler Chief Executive Officer | Peter P. W. Tse Chief Financial Officer | ||||||
Hong Kong, 15 August 2006
Page 34
Table of Contents
Condensed Consolidated Statement of Changes in Equity
| (Unaudited) | Share Capital | Share Premium | Capital Redemption Reserve | Other Reserves | Retained Profits | Minority Interest | Total | ||||||||||||||||||||||||||
| HK$M | HK$M | HK$M | HK$M | HK$M | HK$M | HK$M | |||||||||||||||||||||||||||
Balance as at 1 January 2006, as previously reported | 12,041 | 1,164 | 2,482 | 328 | 34,144 | 111 | 50,270 | ||||||||||||||||||||||||||
Adjustments for adoption of HKFRS (Int 4) – Leases (Note 2) | — | — | — | 18 | 108 | — | 126 | ||||||||||||||||||||||||||
Balance as at 1 January 2006, as restated | 12,041 | 1,164 | 2,482 | 346 | 34,252 | 111 | 50,396 | ||||||||||||||||||||||||||
Exchange differences on translation of: | |||||||||||||||||||||||||||||||||
subsidiaries | — | — | — | 51 | — | 1 | 52 | ||||||||||||||||||||||||||
jointly controlled entities | — | — | — | 76 | — | — | 76 | ||||||||||||||||||||||||||
designated hedges | — | — | — | 3 | — | — | 3 | ||||||||||||||||||||||||||
Net gain not recognised in the income statement | — | — | — | 130 | — | 1 | 131 | ||||||||||||||||||||||||||
Cash flow hedges, net of tax | — | — | — | (167 | ) | — | — | (167 | ) | ||||||||||||||||||||||||
Revaluation of assets, net of tax | — | — | — | 33 | — | — | 33 | ||||||||||||||||||||||||||
Earnings for the period | — | — | — | — | 4,975 | 8 | 4,983 | ||||||||||||||||||||||||||
Dividends paid | |||||||||||||||||||||||||||||||||
2005 finals | — | — | — | — | (2,264 | ) | — | (2,264 | ) | ||||||||||||||||||||||||
2006 interim | — | — | — | — | (1,204 | ) | — | (1,204 | ) | ||||||||||||||||||||||||
Share of movements in reserves of | |||||||||||||||||||||||||||||||||
jointly controlled entities | — | — | — | 223 | (8 | ) | — | 215 | |||||||||||||||||||||||||
associated company | — | — | — | (18 | ) | — | — | (18 | ) | ||||||||||||||||||||||||
Balance as at 30 June 2006 | 12,041 | 1,164 | 2,482 | 547 | 35,751 | (a) | 120 | 52,105 | |||||||||||||||||||||||||
Company and subsidiaries | 12,041 | 1,164 | 2,482 | 236 | 32,556 | 120 | 48,599 | ||||||||||||||||||||||||||
Jointly controlled entities | — | — | — | 311 | 3,193 | — | 3,504 | ||||||||||||||||||||||||||
Associated company | — | — | — | — | 2 | — | 2 | ||||||||||||||||||||||||||
Balance as at 30 June 2006 | 12,041 | 1,164 | 2,482 | 547 | 35,751 | 120 | 52,105 | ||||||||||||||||||||||||||
Balance as at 1 January 2005, as per 2005 accounts | 12,041 | 1,164 | 2,482 | 731 | 28,811 | — | 45,229 | ||||||||||||||||||||||||||
Adjustments for adoption of HKFRS (Int 4) – Leases | — | — | — | (7 | ) | 56 | — | 49 | |||||||||||||||||||||||||
Balance as at 1 January 2005, as restated | 12,041 | 1,164 | 2,482 | 724 | 28,867 | — | 45,278 | ||||||||||||||||||||||||||
Exchange differences on translation of: | |||||||||||||||||||||||||||||||||
subsidiaries | — | — | — | (200 | ) | — | — | (200 | ) | ||||||||||||||||||||||||
jointly controlled entities | — | — | — | (6 | ) | — | — | (6 | ) | ||||||||||||||||||||||||
associated companies | — | — | — | (81 | ) | — | — | (81 | ) | ||||||||||||||||||||||||
designated hedges | — | — | — | (6 | ) | — | — | (6 | ) | ||||||||||||||||||||||||
Net losses not recognised in the income statement | — | — | — | (293 | ) | — | — | (293 | ) | ||||||||||||||||||||||||
Cash flow hedges, net of tax | — | — | — | 65 | — | — | 65 | ||||||||||||||||||||||||||
Earnings for the period | — | — | — | — | 4,611 | — | 4,611 | ||||||||||||||||||||||||||
Dividends paid | |||||||||||||||||||||||||||||||||
2004 finals | — | — | — | — | (2,119 | ) | — | (2,119 | ) | ||||||||||||||||||||||||
2005 interim | — | — | — | — | (1,156 | ) | — | (1,156 | ) | ||||||||||||||||||||||||
Capital redemption by a subsidiary | — | — | — | 417 | (417 | ) | — | — | |||||||||||||||||||||||||
Share of movements in reserves of | |||||||||||||||||||||||||||||||||
jointly controlled entities | — | — | — | (9 | ) | (14 | ) | — | (23 | ) | |||||||||||||||||||||||
associated company | — | — | — | (6 | ) | — | — | (6 | ) | ||||||||||||||||||||||||
Balance as at 30 June 2005 | 12,041 | 1,164 | 2,482 | 898 | 29,772 | (b) | — | 46,357 | |||||||||||||||||||||||||
Company and subsidiaries | 12,041 | 1,164 | 2,482 | 856 | 25,755 | — | 42,298 | ||||||||||||||||||||||||||
Jointly controlled entities | — | — | — | 35 | 3,321 | — | 3,356 | ||||||||||||||||||||||||||
Associated companies | — | — | — | 7 | 696 | — | 703 | ||||||||||||||||||||||||||
Balance as at 30 June 2005 | 12,041 | 1,164 | 2,482 | 898 | 29,772 | — | 46,357 | ||||||||||||||||||||||||||
| Notes: | |||||||||||||||||||||||||||||||||
(a) The proposed interim dividend as at 30 June 2006 and balance of retained profits after the proposed interim dividend were HK$1,204 million and HK$34,547 million respectively. |
| ||||||||||||||||||||||||||||||||
(b) The proposed interim dividend as at 30 June 2005 and balance of retained profits after the proposed interim dividend were HK$1,156 million and HK$28,616 million respectively. |
| ||||||||||||||||||||||||||||||||
Page 35
Table of Contents
Condensed Consolidated Cash Flow Statement
(Unaudited) 6 months ended 30 June | ||||||||||||||
| 2006 | 2005 | |||||||||||||
| Note | HK$M | HK$M | HK$M | HK$M | ||||||||||
| (Restated | ) | (Restated | ) | |||||||||||
Operating activities | ||||||||||||||
Net cash inflow from operations | 27 | 7,784 | 5,905 | |||||||||||
Operating interest paid | (2,183 | ) | (1,755 | ) | ||||||||||
Interest received | 240 | 252 | ||||||||||||
Profits tax paid | (179 | ) | (170 | ) | ||||||||||
Net cash inflow from operating activities | 5,662 | 4,232 | ||||||||||||
Investing activities | ||||||||||||||
Capital expenditure | (2,840 | ) | (2,617 | ) | ||||||||||
Capitalised interest paid | (150 | ) | (143 | ) | ||||||||||
Proceeds from disposal of fixed assets | 57 | 4 | ||||||||||||
Net cash outflow for acquisition of a subsidiary | — | (11,318 | ) | |||||||||||
Net cash inflow on settlement of derivative instruments | 78 | — | ||||||||||||
Investments in and advances from/(to) jointly controlled entities | 26 | (42 | ) | |||||||||||
Dividends received from investments | ||||||||||||||
- jointly controlled entities | 1,498 | 1,639 | ||||||||||||
- associated company | — | 31 | ||||||||||||
Net cash outflow from investing activities | (1,331 | ) | (12,446 | ) | ||||||||||
Net cash inflow/(outflow) before financing activities | 4,331 | (8,214 | ) | |||||||||||
Financing activities | ||||||||||||||
Proceeds from long-term borrowings | 2,950 | 14,181 | ||||||||||||
Repayment of long-term borrowings | (4,011 | ) | (6,103 | ) | ||||||||||
Repayment of finance lease obligations | (903 | ) | (813 | ) | ||||||||||
Increase in short-term borrowings | 1,218 | 3,644 | ||||||||||||
Dividends paid | (3,468 | ) | (3,275 | ) | ||||||||||
Net cash (outflow)/inflow from financing activities | (4,214 | ) | 7,634 | |||||||||||
Net increase/(decrease) in cash and cash equivalents | 117 | (580 | ) | |||||||||||
Cash and cash equivalents at beginning of period | 2,041 | 2,520 | ||||||||||||
Effect of exchange rate changes | (35 | ) | (8 | ) | ||||||||||
Cash and cash equivalents at end of period | 2,123 | 1,932 | ||||||||||||
Analysis of balances of cash and cash equivalents | ||||||||||||||
Short-term investments | 171 | 69 | ||||||||||||
Deposits with banks | 1,756 | 1,728 | ||||||||||||
Cash at banks and on hand | 196 | 135 | ||||||||||||
| 2,123 | 1,932 | |||||||||||||
Page 36
Table of Contents
Notes to the Condensed Consolidated Interim Accounts
| 1. | General Information |
The Company, CLP Holdings Limited, and its subsidiaries are collectively referred to as the Group in the condensed consolidated interim accounts whilst its jointly controlled entities and associated companies are collectively referred to as affiliated companies. The principal activity of the Company is investment holding whilst the principal activities of the subsidiaries are the generation and supply of electricity in Hong Kong, Australia and India, and investment holding of power projects in the Chinese mainland, Southeast Asia and Taiwan.
The financial operations of the Company’s major subsidiary, CLP Power Hong Kong Limited (CLP Power Hong Kong), and its jointly controlled entity, Castle Peak Power Company Limited (CAPCO), are governed by a Scheme of Control (SoC) Agreement entered into with the Hong Kong Government. Our electricity business in Hong Kong is therefore also referred to as the SoC business.
The current SoC Agreement will expire on 30 September 2008. The Hong Kong Government is in the process of formulating a framework for the post-2008 regulatory regime. The final post-2008 regulatory framework will be subject to negotiation and agreement between CLP Power Hong Kong and the Government. The Group considers that there will not be any impairment to the fixed and other assets recognised under the existing SoC.
The condensed consolidated interim accounts have been approved for issue by the Board of Directors on 15 August 2006.
| 2. | Basis of Preparation and Changes in Accounting Policies |
The unaudited condensed consolidated interim accounts have been prepared in accordance with Hong Kong Accounting Standard (HKAS) 34 “Interim Financial Reporting” issued by the Hong Kong Institute of Certified Public Accountants.
The accounting policies used in the preparation of this condensed consolidated interim accounts are consistent with those set out in the Annual Report 2005, except for the adoption of the new Hong Kong Financial Reporting Standards (HKFRS)-Interpretation 4 “Determining whether an Arrangement contains a Lease”, which is effective for accounting periods commencing on or after 1 January 2006.
The adoption of HKFRS-Interpretation 4 in 2006 has impacted the accounting for a number of contractual arrangements on electricity supply and power purchase that the Group’s affiliates have entered into. After assessment of these arrangements, some of them have been determined to contain terms that should be accounted for as finance leases in accordance with HKAS 17 “Leases”. One subsidiary which was previously accounted for as a purchaser of electricity has become a lessee, and another subsidiary, together with a number of joint ventures, which were previously accounted for as electricity sellers have become lessors. For finance lease accounting, a lessee has to capitalise the leased assets in its books and at the same time recognise its obligations at amounts equal to the fair value of the leased assets or, if lower, the present value of future minimum lease payments. For a lessor under a finance lease, leased assets are recognised as lease receivables at an amount equal to the net investment in the lease.
Set out below is the effect of adopting this new interpretation on the prior year’s financial results and position.
Page 37
Table of Contents
| 2. | Basis of Preparation and Changes in Accounting Policies (continued) |
The 2005 comparatives (originally shown in the Consolidated Profit and Loss Account for the six months ended 30 June 2005 published on 23 August 2005 and the Consolidated Balance Sheet as at 31 December 2005 published on 28 February 2006) have been amended as a result of:
| i) | the adoption of the new HKFRS-Interpretation 4, in accordance with the transitional provisions specified therein; and |
| ii) | the adjustment to the purchase consideration and the valuation of intangible assets relating to the acquisition of the merchant energy business division (MEB) of SPI Australia Group in 2005. |
Consolidated Profit and Loss Account (for 6 months to 30 June 2005) | As previously HK$M | Adjustments to comparatives | Restated | ||||||
| Lease accounting HK$M | |||||||||
Revenue | 16,626 | (265 | ) | 16,361 | |||||
Expenses | |||||||||
Purchase of electricity, gas and distribution services | (8,613 | ) | 2,160 | (6,453 | ) | ||||
Staff expenses | (665 | ) | — | (665 | ) | ||||
Fuel and other operating costs | (1,976 | ) | (13 | ) | (1,989 | ) | |||
Depreciation and amortisation | (1,359 | ) | (708 | ) | (2,067 | ) | |||
| (12,613 | ) | 1,439 | (11,174 | ) | |||||
Operating profit | 4,013 | 1,174 | 5,187 | ||||||
Finance costs | (725 | ) | (1,347 | ) | (2,072 | ) | |||
Finance income | 63 | 188 | 251 | ||||||
Share of results, net of tax | |||||||||
jointly controlled entities | 1,614 | 50 | 1,664 | ||||||
associated companies | 79 | (28 | ) | 51 | |||||
Profit before taxation | 5,044 | 37 | 5,081 | ||||||
Taxation | (467 | ) | (3 | ) | (470 | ) | |||
Earnings attributable to shareholders | 4,577 | 34 | 4,611 | ||||||
Page 38
Table of Contents
| 2. | Basis of Preparation and Changes in Accounting Policies (continued) |
Consolidated Balance Sheet (as at 31 December 2005) | Adjustments to comparatives | |||||||||||
| As previously stated | Lease accounting | Purchase(a) consideration | Restated | |||||||||
| HK$M | HK$M | HK$M | HK$M | |||||||||
Non-current assets | ||||||||||||
Fixed assets | 60,815 | 18,703 | — | 79,518 | ||||||||
Leasehold land and land use rights | 2,234 | (1 | ) | — | 2,233 | |||||||
Goodwill and other intangible assets (Note 15) | 7,949 | — | (1,019 | ) | 6,930 | |||||||
Interests in jointly controlled entities | 16,519 | 142 | — | 16,661 | ||||||||
Interests in associated companies | 1,641 | 56 | — | 1,697 | ||||||||
Finance lease receivables | — | 2,652 | — | 2,652 | ||||||||
Deferred tax assets | 2,537 | — | — | 2,537 | ||||||||
Derivative instruments | 260 | — | — | 260 | ||||||||
Other non-current assets | 506 | — | — | 506 | ||||||||
| 92,461 | 21,552 | (1,019 | ) | 112,994 | ||||||||
Current assets | ||||||||||||
Inventories – stores and fuel | 596 | — | — | 596 | ||||||||
Trade and other receivables | 5,505 | — | 1,019 | 6,524 | ||||||||
Finance lease receivables | — | 165 | — | 165 | ||||||||
Derivative instruments | 1,302 | — | — | 1,302 | ||||||||
Bank balances, cash and other liquid funds | 2,041 | — | — | 2,041 | ||||||||
| 9,444 | 165 | 1,019 | 10,628 | |||||||||
Current liabilities | ||||||||||||
Customers’ deposits | (3,308 | ) | — | — | (3,308 | ) | ||||||
Trade and other payables | (6,079 | ) | — | — | (6,079 | ) | ||||||
Taxation payable | (376 | ) | — | — | (376 | ) | ||||||
Bank loans and other borrowings | (3,508 | ) | — | — | (3,508 | ) | ||||||
Obligations under finance leases | — | (1,803 | ) | — | (1,803 | ) | ||||||
Derivative instruments | (1,134 | ) | — | — | (1,134 | ) | ||||||
| (14,405 | ) | (1,803 | ) | — | (16,208 | ) | ||||||
Net current (liabilities)/assets | (4,961 | ) | (1,638 | ) | 1,019 | (5,580 | ) | |||||
Total assets less current liabilities | 87,500 | 19,914 | — | 107,414 | ||||||||
Financed by: | ||||||||||||
Equity | ||||||||||||
Share capital | 12,041 | — | — | 12,041 | ||||||||
Share premium | 1,164 | — | — | 1,164 | ||||||||
Reserves | ||||||||||||
Proposed dividends | 2,264 | — | — | 2,264 | ||||||||
Others | 34,690 | 126 | — | 34,816 | ||||||||
Shareholders’ funds | 50,159 | 126 | — | 50,285 | ||||||||
Minority interest | 111 | — | — | 111 | ||||||||
| 50,270 | 126 | — | 50,396 | |||||||||
Non-current liabilities | ||||||||||||
Bank loans and other borrowings | 25,883 | — | — | 25,883 | ||||||||
Obligations under finance leases | — | 19,694 | — | 19,694 | ||||||||
Deferred tax liabilities | 5,472 | 107 | — | 5,579 | ||||||||
Derivative instruments | 444 | — | — | 444 | ||||||||
Fuel clause account | 323 | — | — | 323 | ||||||||
SoC reserve accounts | 4,174 | — | — | 4,174 | ||||||||
Other non-current liabilities | 934 | (13 | ) | — | 921 | |||||||
| 37,230 | 19,788 | — | 57,018 | |||||||||
Equity and non-current liabilities | 87,500 | 19,914 | — | 107,414 | ||||||||
| Note (a): | The acquisition of the MEB from an affiliate of Singapore Power Limited occurred in May 2005. A claim was lodged with this affiliated company prior to the end of 2005. Settlement was reached in April 2006, resulting in a reduction in the purchase consideration which has been reflected as a reduction in goodwill. |
Page 39
Table of Contents
| 3. | Purchase of Electricity, Gas and Distribution Services |
These expenses are made up of:
| 6 months ended 30 June | ||||
| 2006 HK$M | 2005 HK$M | |||
Purchase of electricity, gas and distribution services | 5,892 | 2,961 | ||
Lease and service charges | 3,691 | 3,492 | ||
| 9,583 | 6,453 | |||
Following the adoption of lease accounting by the Group, certain elements of the payments by CLP Power Hong Kong to CAPCO under the electricity supply contract have now been accounted for as lease and service payments.
| 4. | Formation of OneEnergy |
On 22 March 2006, the Group and Mitsubishi Corporation of Japan formed a jointly controlled entity called OneEnergy Limited (OneEnergy) for the purpose of acquiring interests in and developing and operating power generation businesses in Southeast Asia and Taiwan. The Group’s interest of 22.4% in Electricity Generating Public Company Limited (EGCO) of Thailand was injected into OneEnergy. The gain arising from the formation of OneEnergy amounted to HK$291 million.
| 5. | Revenue |
An analysis of the Group’s revenue for the period is as follows:
| 6 months ended 30 June | ||||
2006 HK$M | 2005 HK$M | |||
Sales of electricity | 18,590 | 14,908 | ||
Lease and service charges received | 778 | 669 | ||
Sales of gas | 1,379 | 313 | ||
Other revenue | 177 | 133 | ||
| 20,924 | 16,023 | |||
Transfer from Development Fund (A) | 488 | 338 | ||
| 21,412 | 16,361 | |||
| (A) | Pursuant to the SoC Agreement, if the gross tariff revenue in Hong Kong in any year exceeds or is less than the total of the operating costs, permitted return and taxation charges, such excess shall be added to, or such deficiency shall be deducted from, the Development Fund (Note 26). |
Page 40
Table of Contents
| 6. | Segment Information |
The Group operates, through its subsidiaries, jointly controlled entities and associated companies, in four major geographical regions - Hong Kong, Australia, the Chinese mainland and other countries in Asia. Information about the Group’s operations by geographical region is as follows:
| Hong Kong | Australia | Chinese Mainland | Other in Asia | Unallocated Items | Total | ||||||||||
| HK$M | HK$M | HK$M | HK$M | HK$M | HK$M | ||||||||||
6 months ended 30 June 2006 | |||||||||||||||
Revenue | 14,061 | 6,502 | 49 | 799 | 1 | 21,412 | |||||||||
Segment results | 5,227 | 621 | (21 | ) | 517 | (83 | ) | 6,261 | |||||||
Share of results, net of tax | |||||||||||||||
jointly controlled entities | 791 | 5 | 501 | (a) | 65 | — | 1,362 | ||||||||
associated companies | — | 2 | — | 110 | — | 112 | |||||||||
Profit/(Loss) before financing and taxation | 6,018 | 628 | 480 | 692 | (83 | ) | 7,735 | ||||||||
Finance costs | (2,419 | ) | |||||||||||||
Finance income | 242 | ||||||||||||||
Taxation | (575 | ) | |||||||||||||
Minority interest | (8 | ) | |||||||||||||
Earnings for the period | 4,975 | ||||||||||||||
Capital additions | 4,855 | 422 | 2 | 4 | 1 | 5,284 | |||||||||
Depreciation and amortisation | 1,976 | 429 | 18 | 3 | 1 | 2,427 | |||||||||
As at 30 June 2006 | |||||||||||||||
Segment assets | 5,418 | 10,878 | 307 | 6,085 | 80 | 22,768 | |||||||||
Owned and leased assets | 67,394 | 14,413 | 653 | 24 | 8 | 82,492 | |||||||||
Interests in | |||||||||||||||
jointly controlled entities | 7,228 | 1,117 | 6,630 | 3,824 | — | 18,799 | |||||||||
associated companies | — | 7 | — | — | — | 7 | |||||||||
Tax assets | — | 2,421 | 40 | — | — | 2,461 | |||||||||
Consolidated total assets | 80,040 | 28,836 | 7,630 | 9,933 | 88 | 126,527 | |||||||||
Segment liabilities | 10,432 | 4,358 | 83 | 109 | 82 | 15,064 | |||||||||
Obligation under finance leases | 23,468 | 14 | — | — | — | 23,482 | |||||||||
Bank loans and other borrowings | 12,319 | 9,678 | 225 | 1,265 | 6,095 | 29,582 | |||||||||
Tax liabilities | 5,686 | 137 | 23 | 448 | — | 6,294 | |||||||||
Consolidated total liabilities | 51,905 | 14,187 | 331 | 1,822 | 6,177 | 74,422 | |||||||||
| Note (a): | Out of the HK$501 million, HK$347 million was attributed to investments in Guangdong Nuclear Power Joint Venture Company, Limited (GNPJVC) and Hong Kong Pumped Storage Development Company, Limited (PSDC), whose generating facilities serve Hong Kong. |
Page 41
Table of Contents
| 6. | Segment Information (continued) |
| (Restated) | Hong Kong HK$M | Australia HK$M | Chinese Mainland | Other in Asia | Unallocated Items | Total HK$M | ||||||||||
6 months ended 30 June 2005 | ||||||||||||||||
Revenue | 13,704 | 1,968 | — | 689 | — | 16,361 | ||||||||||
Segment results | 4,919 | 445 | (37 | ) | (66 | ) | (74 | ) | 5,187 | |||||||
Share of results, net of tax | ||||||||||||||||
jointly controlled entities | 931 | — | 563 | (a) | 170 | — | 1,664 | |||||||||
associated companies | — | — | — | 51 | — | 51 | ||||||||||
Profit/(Loss) before financing and taxation | 5,850 | 445 | 526 | 155 | (74 | ) | 6,902 | |||||||||
Finance costs | (2,072 | ) | ||||||||||||||
Finance income | 251 | |||||||||||||||
Taxation | (470 | ) | ||||||||||||||
Earnings for the period | 4,611 | |||||||||||||||
Capital additions | 5,088 | 261 | — | 6 | — | 5,355 | ||||||||||
Depreciation and amortisation | 1,793 | 269 | 1 | 3 | 1 | 2,067 | ||||||||||
As at 31 December 2005 | ||||||||||||||||
Segment assets | 5,013 | 12,374 | 255 | 5,492 | 75 | 23,209 | ||||||||||
Owned and leased assets | 64,621 | 14,196 | 661 | 32 | 8 | 79,518 | ||||||||||
Interests in | ||||||||||||||||
jointly controlled entities | 7,092 | 1,093 | 6,888 | 1,588 | — | 16,661 | ||||||||||
associated companies | — | 5 | — | 1,692 | — | 1,697 | ||||||||||
Tax assets | — | 2,504 | 33 | — | — | 2,537 | ||||||||||
Consolidated total assets | 76,726 | 30,172 | 7,837 | 8,804 | 83 | 123,622 | ||||||||||
Segment liabilities | 11,287 | 4,271 | 150 | 598 | 77 | 16,383 | ||||||||||
Obligation under finance leases | 21,484 | 13 | — | — | — | 21,497 | ||||||||||
Bank loans and other borrowings | 11,528 | 11,108 | 228 | 1,236 | 5,291 | 29,391 | ||||||||||
Tax liabilities | 5,466 | 133 | 27 | 329 | — | 5,955 | ||||||||||
Consolidated total liabilities | 49,765 | 15,525 | 405 | 2,163 | 5,368 | 73,226 | ||||||||||
| Note (a): | Out of the HK$563 million, HK$431 million was attributed to investments in GNPJVC and PSDC, whose generating facilities serve Hong Kong. |
No business analysis is shown as substantially all the principal activities of the Group are for the generation and supply of electricity. The SoC business accounted for approximately 100% of the Group’s revenue and segment results in Hong Kong for the period ended 30 June 2006.
Page 42
Table of Contents
| 7. | Operating Profit |
Operating profit is stated after charging/(crediting) the following:
| 6 months ended 30 June | ||||||
| 2006 HK$M | 2005 HK$M | |||||
Charging | ||||||
Staff costs (A) | ||||||
Salaries and other costs | 1,039 | 800 | ||||
Retirement benefits costs | 91 | 68 | ||||
Lease and service charges from CAPCO | 3,691 | 3,492 | ||||
Lease expenditure for long-term hedge agreement with Ecogen | 105 | — | ||||
Net loss on disposal of fixed assets | 8 | 33 | ||||
Other net fair value losses/(gains) on derivative instruments | ||||||
Transactions not qualifying as hedges | 80 | (7 | ) | |||
Other net exchange losses | — | 24 | ||||
Crediting | ||||||
Other net fair value gains on derivative instruments | ||||||
Cash flow hedges, transfer from equity | (44 | ) | (68 | ) | ||
Lease and service charges received | (778 | ) | (669 | ) | ||
Net rental income from properties | (6 | ) | (7 | ) | ||
One-off gain on formation of OneEnergy | (291 | ) | — | |||
| (A) | Staff costs include amounts recharged to jointly controlled entities for services provided. |
| 8. | Finance Costs and Income |
| 6 months ended 30 June | ||||||
| 2006 HK$M | 2005 HK$M | |||||
Finance costs: | ||||||
Interest expenses on | ||||||
bank loans and overdrafts | 458 | 341 | ||||
other borrowings | ||||||
- wholly repayable within five years | 49 | 82 | ||||
- not wholly repayable within five years | 280 | 100 | ||||
Development Fund and special provision account (A) | 133 | 120 | ||||
customers’ deposits and others | 53 | 30 | ||||
Subscription interest on outstanding purchase consideration on renewable projects | 19 | — | ||||
Finance charges under finance leases | 1,533 | 1,360 | ||||
Other finance charges | 27 | 20 | ||||
Fair value losses on derivative instruments | ||||||
Cash flow hedges, transfer from equity | 1 | 174 | ||||
Transactions not qualifying as hedges | 2 | — | ||||
Hedging costs and exchange losses/(gains) | 4 | (2 | ) | |||
| 2,559 | 2,225 | |||||
Less: amount capitalised | (140 | ) | (153 | ) | ||
| 2,419 | 2,072 | |||||
Finance income: | ||||||
Interest income on | ||||||
short-term investments and bank deposits | 69 | 62 | ||||
advance to a jointly controlled entity | 1 | 1 | ||||
Finance income under finance leases | 172 | 188 | ||||
| 242 | 251 | |||||
| (A) | In accordance with the provisions of the SoC Agreement, CLP Power Hong Kong is required to credit, to a Rate Reduction Reserve in its accounts, a charge of 8% per annum on the sum of the average balances of the Development Fund and special provision account (Note 26). |
Page 43
Table of Contents
| 9. | Share of Results of Affiliated Companies |
Affiliated companies include the Group’s jointly controlled entities and associated companies. The share of results of affiliated companies is determined based upon the management accounts of the respective affiliated companies, after making adjustments to conform with the Group’s significant accounting policies, for the period ended 30 June.
| 10. | Taxation |
Taxation in the condensed consolidated income statement represents the taxation of the Company and subsidiaries and is analysed below:
| 6 months ended 30 June | |||||
| 2006 HK$M | 2005 HK$M | ||||
Current income tax | |||||
Hong Kong | 346 | 418 | |||
Outside Hong Kong | 32 | 14 | |||
| 378 | 432 | ||||
Deferred income tax | |||||
Hong Kong | 130 | 125 | |||
Outside Hong Kong | 67 | (87 | ) | ||
| 197 | 38 | ||||
| 575 | 470 | ||||
Hong Kong profits tax has been provided at the rate of 17.5% (2005: 17.5%) on the estimated assessable profits for the period. Taxation on profits assessable outside Hong Kong has been provided at the rates prevailing in the respective jurisdictions.
| 11. | Earnings Attributable to Shareholders |
The following analysis of earnings is outside the requirements of HKFRSs and is included to give further information to investors on the source of Group earnings:
| 6 months ended 30 June | ||||||||||||
| 2006 | 2005 | |||||||||||
| HK$M | HK$M | HK$M | HK$M | |||||||||
Electricity business in Hong Kong | 3,573 | 3,510 | ||||||||||
Electricity sales to Chinese mainland from Hong Kong | 55 | 63 | ||||||||||
Generating facilities in Chinese mainland serving Hong Kong (GNPJVC and PSDC) | 347 | 431 | ||||||||||
Other power projects in Chinese mainland | 106 | 95 | ||||||||||
Energy business in Australia | 287 | (8 | ) | |||||||||
Electricity business in India | 371 | 279 | ||||||||||
Power projects in Southeast Asia and Taiwan | 142 | 185 | ||||||||||
Renewable energy business | (25 | ) | 4 | |||||||||
Other businesses | (6 | ) | (5 | ) | ||||||||
One-off gain on formation of OneEnergy | 291 | — | ||||||||||
Earnings from other activities | 1,568 | 1,044 | ||||||||||
Unallocated net finance costs | (122 | ) | (43 | ) | ||||||||
Unallocated Group expenses | (83 | ) | (74 | ) | ||||||||
Total operating earnings | 4,936 | 4,437 | ||||||||||
Hok Un redevelopment profit | 39 | 174 | ||||||||||
Earnings attributable to shareholders | 4,975 | 4,611 | ||||||||||
Page 44
Table of Contents
| 12. | Dividends |
| 6 months ended 30 June | ||||||||
| 2006 | 2005 | |||||||
| HK$ per share | HK$M | HK$ per share | HK$M | |||||
First interim dividend paid | 0.50 | 1,204 | 0.48 | 1,156 | ||||
Second interim dividend proposed | 0.50 | 1,204 | 0.48 | 1,156 | ||||
| 1.00 | 2,408 | 0.96 | 2,312 | |||||
At the Board meeting held on 15 August 2006, the Directors declared the second interim dividend of HK$0.50 per share. The second interim dividend is not reflected as a dividend payable in the accounts, but as a separate component of the shareholders’ funds for the period ended 30 June 2006.
| 13. | Earnings per Share |
The prescribed earnings per share includes Hok Un redevelopment profit and is computed as follows:
| 6 months ended 30 June | ||||
| 2006 | 2005 | |||
Earnings for the period, HK$M | 4,975 | 4,611 | ||
Weighted average number of shares in issue, thousand shares | 2,408,246 | 2,408,246 | ||
Earnings per share, HK$ | 2.07 | 1.91 | ||
To enable investors to understand better the Group’s results, an additional earnings per share figure, excluding the Hok Un redevelopment profit, is provided below:
| 6 months ended 30 June | ||||||
| 2006 | 2005 | |||||
| HK$M | HK$M | |||||
Earnings for the period | 4,975 | 4,611 | ||||
Less: Hok Un redevelopment profit | (39 | ) | (174 | ) | ||
Earnings excluding Hok Un redevelopment profit | 4,936 | 4,437 | ||||
Earnings per share excluding Hok Un redevelopment profit, HK$ | 2.05 | 1.84 | ||||
Fully diluted earnings per share is not included as the Company did not have any diluting equity instruments as at 30 June 2006 (2005: nil).
Page 45
Table of Contents
| 14. | Fixed Assets, Leasehold Land and Land Use Rights |
Fixed assets, leasehold land and land use rights totalled HK$84,700 million (December 2005: HK$81,751 million). Movements in the accounts are as follows:
(A) Fixed Assets
| Freehold Land and Buildings | Plant, Machinery and Equipment | ||||||||||||||
| Owned | Leased | Owned | Leased | Total | |||||||||||
| HK$M | HK$M | HK$M | HK$M | HK$M | |||||||||||
Net book value, as at 1 January 2005 | |||||||||||||||
- as previously reported | 6,002 | — | 49,506 | — | 55,508 | ||||||||||
- adjustment on adoption of finance lease accounting | (152 | ) | 5,389 | (3,055 | ) | 14,828 | 17,010 | ||||||||
- as restated | 5,850 | 5,389 | 46,451 | 14,828 | 72,518 | ||||||||||
Acquisition of a subsidiary | 533 | — | 1,181 | 1,936 | 3,650 | ||||||||||
Additions | 572 | — | 5,176 | 3,226 | 8,974 | ||||||||||
Transfers and disposals | (75 | ) | (136 | ) | (143 | ) | 30 | (324 | ) | ||||||
Depreciation charge | (195 | ) | (248 | ) | (2,734 | ) | (1,466 | ) | (4,643 | ) | |||||
Exchange differences | (3 | ) | — | (564 | ) | (90 | ) | (657 | ) | ||||||
Net book value, as at 31 December 2005 | 6,682 | 5,005 | 49,367 | 18,464 | 79,518 | ||||||||||
Cost | 8,677 | 9,334 | 72,540 | 35,215 | 125,766 | ||||||||||
Accumulated depreciation | (1,995 | ) | (4,329 | ) | (23,173 | ) | (16,751 | ) | (46,248 | ) | |||||
Net book value, as at 31 December 2005 | 6,682 | 5,005 | 49,367 | 18,464 | 79,518 | ||||||||||
Net book value, as at 1 January 2006 | 6,682 | 5,005 | 49,367 | 18,464 | 79,518 | ||||||||||
Additions | 204 | 223 | 2,157 | 2,700 | 5,284 | ||||||||||
Transfers and disposals | 15 | — | (117 | ) | (39 | ) | (141 | ) | |||||||
Depreciation charge | (104 | ) | (127 | ) | (1,260 | ) | (820 | ) | (2,311 | ) | |||||
Exchange differences | 7 | — | 117 | 18 | 142 | ||||||||||
Net book value, as at 30 June 2006 | 6,804 | 5,101 | 50,264 | 20,323 | 82,492 | ||||||||||
Cost | 8,889 | 9,556 | 74,635 | 37,888 | 130,968 | ||||||||||
Accumulated depreciation | (2,085 | ) | (4,455 | ) | (24,371 | ) | (17,565 | ) | (48,476 | ) | |||||
Net book value, as at 30 June 2006 | 6,804 | 5,101 | 50,264 | 20,323 | 82,492 | ||||||||||
| The above leased assets include: | |||||||||||||||
(a) CAPCO’s operational generating plants and associated fixed assets for the generation of electricity supply to CLP Power Hong Kong under the Electricity Supply Contract between the two parties, following the adoption of HKFRS–Interpretation 4. The net book value of these leased assets amounted to HK$23,602 million as at 30 June 2006 (HK$21,624 million in the restated figures as at 31 December 2005); and |
| ||||||||||||||
Page 46
Table of Contents
| 14. | Fixed Assets, Leasehold Land and Land Use Rights (continued) |
| (b) | Leased generating plants for our electricity business in Australia held under agreements which are treated as finance leases. The net book value of these leased assets as at 30 June 2006 was HK$1,821 million. |
| (B) | Leasehold Land and Land Use Rights |
30 June 2006 | 31 December HK$M | |||||
| Net book value, at beginning of period/year | ||||||
- as previously restated/reported | 2,233 | 2,240 | ||||
- adjustment on adoption of finance lease accounting | — | (1 | ) | |||
- as restated | 2,233 | 2,239 | ||||
Acquisition of a subsidiary | — | 43 | ||||
Additions | 1 | 2 | ||||
Transfers and disposals | — | (2 | ) | |||
Amortisation charge | (26 | ) | (49 | ) | ||
Net book value, at end of period/year | 2,208 | 2,233 | ||||
Cost | 2,340 | 2,339 | ||||
Accumulated amortisation | (132 | ) | (106 | ) | ||
Net book value, at end of period/year | 2,208 | 2,233 | ||||
Leasehold land is mainly held under medium to long term leases (i.e. over 10 years) in Hong Kong. The SoC Agreement considers leasehold land as one type of fixed assets on which permitted return is earned.
Page 47
Table of Contents
| 15. | Goodwill and other Intangible Assets |
| Goodwill HK$M | Negative Goodwill HK$M | Net Balance | Other Intangible Assets HK$M | Total HK$M | |||||||||||
| 2006 | |||||||||||||||
Net carrying value, as at 1 January | 5,513 | — | 5,513 | 1,417 | 6,930 | ||||||||||
Amortisation charge | — | — | — | (91 | ) | (91 | ) | ||||||||
Exchange differences | 52 | — | 52 | 14 | 66 | ||||||||||
Net carrying value, as at 30 June | 5,565 | — | 5,565 | 1,340 | 6,905 | ||||||||||
Cost | 5,565 | — | 5,565 | 1,495 | 7,060 | ||||||||||
Accumulated amortisation | — | — | — | (155 | ) | (155 | ) | ||||||||
Net carrying value, as at 30 June | 5,565 | — | 5,565 | 1,340 | 6,905 | ||||||||||
2005 | |||||||||||||||
Net carrying value, as at 1 January | |||||||||||||||
- as previously reported | 24 | (1,046 | ) | (1,022 | ) | — | (1,022 | ) | |||||||
- derecognition of negative goodwill | — | 1,046 | 1,046 | — | 1,046 | ||||||||||
- as restated | 24 | — | 24 | — | 24 | ||||||||||
Acquisition of a subsidiary | 5,817 | (a) | — | 5,817 | 1,545 | (a) | 7,362 | ||||||||
Amortisation charge | — | — | — | (66 | ) | (66 | ) | ||||||||
Exchange differences | (328 | ) | — | (328 | ) | (62 | ) | (390 | ) | ||||||
Net carrying value, as at 31 December | 5,513 | — | 5,513 | 1,417 | 6,930 | ||||||||||
Cost | 5,513 | — | 5,513 | 1,481 | 6,994 | ||||||||||
Accumulated amortisation | — | — | — | (64 | ) | (64 | ) | ||||||||
Net carrying value, as at 31 December | 5,513 | — | 5,513 | 1,417 | 6,930 | ||||||||||
Other intangible assets include contracted customers and a lease arrangement under the long-term hedge agreement with Ecogen which arose from the acquisition of the MEB at the end of May 2005. The MEB is considered as a cash-generating unit of the Group during 2006.
Contracted customers and the lease premium are amortised on a straight-line basis over a period of 6 and 14 years respectively.
| Note (a): | A review of the valuation of contracted customers in Australia resulted in a reallocation of HK$185 million from goodwill to intangible assets; together with the adjustment in the purchase consideration for the MEB (refer to Note (a) on page 39), total goodwill at 31 December 2005 was decreased by HK$1,204 million. |
Page 48
Table of Contents
| 16. | Interests in Jointly Controlled Entities |
| 30 June 2006 HK$M | 31 December HK$M | |||
Castle Peak Power Company Limited | 6,853 | 6,647 | ||
Guangdong Nuclear Power Joint Venture Company, Limited | 2,704 | 3,077 | ||
OneEnergy Limited | 2,311 | — | ||
Ho-Ping Power Company | 1,458 | 1,536 | ||
CLP Guohua Power Company Limited | 1,392 | 1,293 | ||
Shandong Zhonghua Power Company, Ltd. | 1,103 | 1,091 | ||
Roaring 40s Renewable Energy Pty Ltd | 692 | 686 | ||
Guizhou CLP Power Company Limited | 445 | 466 | ||
CLP Guangxi Fangchenggang Power Company Limited | 433 | 424 | ||
South East Australia Gas Pty Ltd | 425 | 407 | ||
Hok Un joint venture | 359 | 400 | ||
Hong Kong Pumped Storage Development Company, Limited | 327 | 328 | ||
Others | 297 | 306 | ||
| 18,799 | 16,661 | |||
The above amount includes the loan and advances made to the following jointly controlled entities:
30 June 2006 | 31 December HK$M | |||
Castle Peak Power Company Limited | 6,546 | 6,505 | ||
Hong Kong Pumped Storage Development Company, Limited | 310 | 317 | ||
Others | 13 | 43 | ||
| 6,869 | 6,865 | |||
The Group’s share of results of the jointly controlled entities is as follows:
| 6 months ended 30 June | ||||||
| 2006 HK$M | | 2005 HK$M | | |||
Revenue | 4,934 | 5,272 | ||||
Expenses | (3,340 | ) | (3,342 | ) | ||
Share of profit before taxation | 1,594 | 1,930 | ||||
Taxation | (232 | ) | (266 | ) | ||
Share of profit after taxation | 1,362 | 1,664 | ||||
Page 49
Table of Contents
| 16. | Interests in Jointly Controlled Entities (continued) |
The following amounts represent the Group’s share of net assets, capital commitments and contingent liabilities of the jointly controlled entities:
30 June 2006 | 31 December HK$M | |||||
Non-current assets | 30,959 | 29,205 | ||||
Current assets | 6,755 | 5,659 | ||||
Current liabilities | (4,023 | ) | (3,766 | ) | ||
Non-current liabilities | (21,761 | ) | (21,302 | ) | ||
Net assets at end of period/year | 11,930 | 9,796 | ||||
Capital commitments at end of period/year | 9,782 | 9,406 | ||||
Contingent liabilities at end of period/year | 440 | 385 | ||||
The Group’s capital commitment in relation to its interest in the jointly controlled entities is disclosed in Note 28. There are no contingent liabilities relating to the Group’s interest in these entities.
| 17. | Interests in Associated Companies |
30 June 2006 | 31 December HK$M | |||
Electricity Generating Public Company Limited (EGCO) | — | 1,692 | ||
Gascor Pty Ltd | 7 | 5 | ||
| 7 | 1,697 | |||
The Group’s share of results of the associated companies is as follows:
| 6 months ended 30 June | ||||||
| 2006 HK$M | | 2005 HK$M | | |||
Share of profit before taxation | 152 | 64 | ||||
Taxation | (40 | ) | (13 | ) | ||
Share of profit after taxation | 112 | 51 | ||||
Upon the formation of OneEnergy, a joint venture with Mitsubishi Corporation, the Group injected its interest in EGCO into OneEnergy, effectively disposing of one-half of its interest in EGCO (Note 4).
The Group did not have any loan or advances made to associated companies. In addition, there are no contingent liabilities relating to the Group’s interest in these companies.
Page 50
Table of Contents
| 18. | Finance Lease Receivables |
Minimum lease payments | Present value of minimum lease payments | |||||||||
| 30 June 2006 HK$M | | 31 December 2005 HK$M | | 30 June 2006 HK$M | 31 December 2005 HK$M | |||||
Amounts receivable under finance leases: | ||||||||||
Within one year | 485 | 508 | 158 | 165 | ||||||
Later than one year and not later than five years | 1,809 | 2,302 | 704 | 893 | ||||||
After five years | 3,081 | 2,934 | 1,815 | 1,759 | ||||||
| 5,375 | 5,744 | 2,677 | 2,817 | |||||||
Less: unearned finance income | (2,698 | ) | (2,927 | ) | ||||||
Present value of minimum lease payments receivable | 2,677 | 2,817 | ||||||||
Analysed as: | ||||||||||
Current finance lease receivables (recoverable within 12 months) | 158 | 165 | ||||||||
Non-current finance lease receivables (recoverable after 12 months) | 2,519 | 2,652 | ||||||||
| 2,677 | 2,817 | |||||||||
The effective interest rate of the finance lease receivables was based on the interest rate implicit in the lease.
| 19. | Derivative Instruments |
| 30 June 2006 | 31 December 2005 | |||||||||||
| Assets HK$M | | Liabilities HK$M | | Assets HK$M | | Liabilities HK$M | | |||||
Cash flow hedges | ||||||||||||
Forward foreign exchange contracts | 78 | 340 | 39 | 332 | ||||||||
Interest rate swaps/cross currency & interest rate swaps | 135 | — | 9 | 48 | ||||||||
Energy contracts | 146 | 147 | 291 | 258 | ||||||||
Fair value hedge | ||||||||||||
Cross currency & interest rate swap | 7 | 53 | 129 | — | ||||||||
Held for trading or not qualifying as hedges | ||||||||||||
Forward foreign exchange contracts | 21 | 3 | 2 | 20 | ||||||||
Interest rate swaps | — | 3 | — | 13 | ||||||||
Energy contracts | 732 | 715 | 1,092 | 907 | ||||||||
| 1,119 | 1,261 | 1,562 | 1,578 | |||||||||
Less: current portion | (891 | ) | (829 | ) | (1,302 | ) | (1,134 | ) | ||||
Non-current portion of derivative instruments | 228 | 432 | 260 | 444 | ||||||||
Derivative instruments qualifying as cash flow hedges as at 30 June 2006 have a maturity of between now to approximately six years from the balance sheet date.
Page 51
Table of Contents
| 20. | Trade and Other Receivables |
30 June 2006 | 31 December HK$M | |||
Trade receivables (aging analysis is shown below) | 5,799 | 4,541 | ||
Deposits and prepayments | 881 | 872 | ||
Other receivables | — | 1,019 | ||
Dividends receivable from jointly controlled entities | 313 | 87 | ||
Current accounts with jointly controlled entities | 12 | 5 | ||
| 7,005 | 6,524 | |||
Trade and other receivables attributed to overseas subsidiaries amounted to HK$3,643 million (December 2005: HK$3,257 million).
The Group has established credit policies for customers in each of its core businesses. The credit term for trade receivables ranges from 15 to 60 days.
The aging analysis of the trade receivables, after provisions, is as follows:
30 June 2006 | 31 December HK$M | |||
Below 30 days (including amount not yet due) | 5,530 | 4,350 | ||
31-60 days | 56 | 68 | ||
61-90 days | 69 | 43 | ||
Over 90 days | 144 | 80 | ||
| 5,799 | 4,541 | |||
For the other receivables of HK$1,019 million at 31 December 2005, refer to Note (a) on page 39.
| 21. | Bank Balances, Cash and Other Liquid Funds |
30 June 2006 | 31 December HK$M | |||
Trust fund for unclaimed dividends | 10 | 12 | ||
Trust accounts under TRAA (A) | 497 | 556 | ||
Short-term investments and bank deposits | 1,433 | 1,305 | ||
Bank balances and cash | 183 | 168 | ||
| 2,123 | 2,041 | |||
| (A) | Pursuant to a Trust and Retention Account Agreement (TRAA) between GPEC and its lenders, GPEC allocates monthly receipts from its off-taker, Gujarat Urja Vikas Nigam Ltd (GUVNL, formerly known as Gujarat Electricity Board), to various trust accounts for fuel, operating and major maintenance expenses and debt service payments. These amounts are placed by GPEC on short-term deposits or investments prior to being applied for the designated purposes. |
Page 52
Table of Contents
| 22. | Trade and Other Payables |
30 June 2006 | 31 December HK$M | |||
Trade payables (aging analysis is shown below) | 2,939 | 3,116 | ||
Other payables and accruals | 1,342 | 1,395 | ||
Current accounts with jointly controlled entities (A) | 1,340 | 1,127 | ||
Amount due to a jointly controlled entity (B) | 457 | 441 | ||
| 6,078 | 6,079 | |||
| (A) | Of the amount due to the jointly controlled entities, HK$1,071 million (December 2005: HK$912 million) was due to CAPCO. |
| (B) | The amount represents the unpaid portion of the subscription price to Roaring 40s Renewable Energy Pty Ltd. Pursuant to the Subscription Agreement, the Group is obliged to pay for share capital of A$117 million by 2008 plus a pre-subscription interest fee of A$2 million. A contribution of A$40 million (approximately HK$236 million) was made in October 2005, with the outstanding amount bearing interest of 6.11% to be repayable on demand. |
The aging analysis of the trade payables is as follows:
30 June 2006 | 31 December HK$M | |||
Below 30 days (including amount not yet due) | 2,894 | 3,082 | ||
31-60 days | 7 | — | ||
61-90 days | 3 | 2 | ||
Over 90 days | 35 | 32 | ||
| 2,939 | 3,116 | |||
Page 53
Table of Contents
| 23. | Bank Loans and Other Borrowings |
Total borrowings in the condensed consolidated balance sheet are analysed as follows:
| Current | Non-Current | Total | ||||||||||
| 30 June 2006 HK$M | 31 December 2005 HK$M | 30 June 2006 HK$M | 31 December 2005 HK$M | 30 June 2006 HK$M | 31 December 2005 HK$M | |||||||
Short-term loans | 2,200 | 867 | — | — | 2,200 | 867 | ||||||
Long-term bank loans | 2,505 | 301 | 14,592 | 16,447 | 17,097 | 16,748 | ||||||
Other long-term borrowings | — | 2,340 | 10,285 | 9,436 | 10,285 | 11,776 | ||||||
Bank loans and other borrowings | 4,705 | 3,508 | 24,877 | 25,883 | 29,582 | 29,391 | ||||||
During the six months ended 30 June 2006, the Group issued HK$1 billion of fixed rate notes under the Medium Term Note Programme to support the capital requirements of the electricity business in Hong Kong. The Group’s bank loans and other borrowings were repayable as follows:
| Bank Loans | Other Borrowings | Total | ||||||||||
| 30 June 2006 HK$M | 31 December 2005 HK$M | 30 June 2006 HK$M | 31 December 2005 HK$M | 30 June 2006 HK$M | 31 December 2005 HK$M | |||||||
Within one year | 4,705 | 1,168 | — | 2,340 | 4,705 | 3,508 | ||||||
Between one and two years | 495 | 2,440 | — | — | 495 | 2,440 | ||||||
Between two and five years | 13,635 | 13,847 | — | — | 13,635 | 13,847 | ||||||
After five years | 462 | 160 | 10,285 | 9,436 | 10,747 | 9,596 | ||||||
| 19,297 | 17,615 | 10,285 | 11,776 | 29,582 | 29,391 | |||||||
Bank loans and other borrowings totalling HK$11,168 million (December 2005: HK$12,572 million) were attributed to overseas subsidiaries and are non-recourse to the Company. Of these, secured loans for GPEC and Huaiji amounted to HK$629 million (December 2005: HK$575 million) and HK$225 million (December 2005: HK$228 million) respectively. Bank loans for GPEC are secured by fixed and floating charges over its assets while for Huaiji, they are secured by fixed assets and land use rights. Collateralised borrowings for GPEC are secured by trade receivables (Note 20).
The carrying amounts of loans and borrowings approximate their fair values. The fair value of long-term borrowings is determined using the expected future payments discounted at market interest rates prevailing at the period end.
Loans and borrowings of the Group are predominantly in HK$ or AUD. The effective interest rates at the balance sheet date were as follows:
| 30 June 2006 | 31 December 2005 | |||||||
| HK$ | AUD | HK$ | AUD | |||||
Fixed rate loans and loans swapped to fixed rates | 4.2% - 6.2% | 6.3% - 6.6% | 4.2% - 7.1% | 6.3% - 6.6% | ||||
Variable rate loans and loans swapped from fixed rates | 4.1% - 5.3% | 6.4% - 6.7% | 4.3% - 5.0% | 6.1% - 6.4% | ||||
As at 30 June 2006, the Group has undrawn bank loan and overdraft facilities of HK$11,346 million (December 2005: HK$13,152 million).
Page 54
Table of Contents
| 24. | Obligations under Finance Leases |
Following the adoption of HKFRS–Interpretation 4, the Group has commitments under the finance lease arrangement with CAPCO in respect of the operational generating plants and associated fixed assets. Together with the acquisition of the MEB on 31 May 2005, the Group had obligations under finance leases repayable as follows:
30 June 2006 | 31 December HK$M | |||||
Minimum lease payments not later than one year | 4,878 | 4,601 | ||||
later than one year and not later than five years | 16,598 | 15,396 | ||||
later than five years | 29,626 | 25,614 | ||||
| 51,102 | 45,611 | |||||
Future interest expenses on finance leases | (27,620 | ) | (24,114 | ) | ||
Present value of minimum lease payments | 23,482 | 21,497 | ||||
Present value of minimum lease payments not later than one year | 1,912 | 1,803 | ||||
later than one year and not later than five years | 6,765 | 6,480 | ||||
later than five years | 14,805 | 13,214 | ||||
| 23,482 | 21,497 | |||||
The effective interest rates of the finance lease obligations were based on the interest rate implicit in the lease.
| 25. | Share Capital |
| 30 June 2006 | 31 December 2005 | |||||||
| Number of Shares of HK$5 Each | Amount HK$M | Number of Shares of HK$5 Each | Amount HK$M | |||||
| Authorised | ||||||||
At end of period/year | 3,000,000,000 | 15,000 | 3,000,000,000 | 15,000 | ||||
| Issued and fully-paid | ||||||||
At end of period/year | 2,408,245,900 | 12,041 | 2,408,245,900 | 12,041 | ||||
There was no movement in the share capital of the Company during the period (year 2005: nil).
Page 55
Table of Contents
| 26. | SoC Reserve Accounts |
The Development Fund, special provision account and Rate Reduction Reserve of the Group’s major subsidiary, CLP Power Hong Kong, are collectively referred to as SoC reserve accounts in the condensed consolidated balance sheet. The respective balances at the end of the period/year are:
30 June 2006 | 31 December HK$M | |||
SoC reserve accounts | ||||
Development Fund (A) | 2,947 | 3,685 | ||
Special provision account (B) | — | — | ||
Rate Reduction Reserve (C) | 466 | 489 | ||
| 3,413 | 4,174 | |||
Movements in the SoC reserve accounts are as follows:
30 June 2006 | 31 December HK$M | |||||||
(A) | Development Fund | |||||||
At beginning of period/year | 3,685 | 3,171 | ||||||
Transfer (to)/from the income statement (Note 5) | (488 | ) | 527 | |||||
One-off rebates | — | (13 | ) | |||||
Business relief rebate | — | — | ||||||
Special rebate to customers(a) | (250 | ) | — | |||||
At end of period/year | 2,947 | 3,685 | ||||||
(B) | Special provision account | |||||||
At beginning of period/year | — | — | ||||||
Transfer to the income statement | — | — | ||||||
At end of period/year | — | — | ||||||
(C) | Rate Reduction Reserve | |||||||
At beginning of period/year | 489 | 549 | ||||||
Interest expense charged to the income statement (Note 8) | 133 | 274 | ||||||
One-off rebates | — | — | ||||||
Rebate to customers(b) | (156 | ) | (334 | ) | ||||
At end of period/year | 466 | 489 | ||||||
Notes:
| (a) | A special rebate of HK¢1.8 per unit (2005: nil) was made to customers during the period. |
| (b) | A rebate of HK¢1.1 per unit (2005: HK¢1.1 per unit) was made to customers during the period. |
Page 56
Table of Contents
| 27. | Notes to the Consolidated Cash Flow Statement |
Reconciliation of profit before taxation to net cash inflow from operations:
| 6 months ended 30 June | ||||||||
| 2006 HK$M | 2005 HK$M | |||||||
Profit before taxation | 5,558 | 5,081 | ||||||
Adjustments for: | ||||||||
Operating interest | 2,372 | 1,883 | ||||||
Finance income | (242 | ) | (251 | ) | ||||
Share of results, net of tax jointly controlled entities | (1,362 | ) | (1,664 | ) | ||||
associated companies | (112 | ) | (51 | ) | ||||
Depreciation and amortisation | 2,427 | 2,067 | ||||||
Decrease in finance lease receivables | 81 | 77 | ||||||
Net loss on disposal of fixed assets | 8 | 33 | ||||||
One-off gain on formation of OneEnergy | (291 | ) | — | |||||
Fair value losses on tax assets | 56 | — | ||||||
Net exchange difference | 4 | — | ||||||
Fair value (gains)/losses on derivative instruments | ||||||||
Cash flow hedges, transfer from equity | (43 | ) | 106 | |||||
Transactions not qualifying as hedges | 82 | (7 | ) | |||||
SoC items | ||||||||
Increase in customers’ deposits | 45 | 104 | ||||||
Decrease in fuel clause account | (240 | ) | (318 | ) | ||||
One-off rebates | — | (13 | ) | |||||
Rebate to customers under SoC | (156 | ) | (151 | ) | ||||
Special rebate | (250 | ) | — | |||||
| (601 | ) | (378 | ) | |||||
Transfers from Development Fund and special provision account | (488 | ) | (338 | ) | ||||
Cash flow before working capital changes | 7,449 | 6,558 | ||||||
Increase in debtors and prepayments | (152 | ) | (994 | ) | ||||
Increase in creditors and other liabilities | 281 | 294 | ||||||
Increase in current accounts due to jointly controlled entities | 206 | 47 | ||||||
Net cash inflow from operations | 7,784 | 5,905 | ||||||
Page 57
Table of Contents
| 28. | Commitments |
| (A) | Capital expenditure on fixed assets, leasehold land and land use rights authorised but not brought into the accounts is as follows: |
30 June 2006 | 31 December 2005 | |||
| HK$M | HK$M | |||
Contracted but not provided for | 2,781 | 2,689 | ||
Authorised but not contracted for | 6,367 | 6,922 | ||
| 9,148 | 9,611 | |||
| (B) | The Group has entered into a number of joint venture arrangements to develop power projects in Thailand and the Chinese mainland. Equity contributions required and made by the Group under each project are summarised below: |
| Project Name | Total Equity Contributions Required | Amount Fulfilled as at 30 June 2006 | Remaining Balance to be | Expected Year for Last Contribution | ||||
BLCP power project (Thailand) | US$165 million | US$17 million (HK$132 million) | US$148 million (HK$1,149 million) | 2007 | ||||
Fangchenggang power project (Chinese mainland) | RMB966 million | RMB463 million (HK$445 million) | RMB503 million (HK$488 million) | 2008 | ||||
Weihai wind power project (Chinese mainland) | RMB30 million | RMB9 million (HK$9 million) | RMB21 million (HK$20 million) | 2008 | ||||
Nanao II wind power project (Chinese mainland) | RMB36 million | RMB5 million (HK$5 million) | RMB31 million (HK$30 million) | 2007 |
Page 58
Table of Contents
| 29. | Related Party Transactions |
Below are the more significant transactions with related parties during the period ended 30 June:
| (A) | Purchases of electricity and gas from affiliated companies |
| (i) | Details of electricity supply contracts relating to the electricity business in Hong Kong with jointly controlled entities are shown below: |
| 6 months ended 30 June | ||||
| 2006 | 2005 | |||
| HK$M | HK$M | |||
Electricity supply contract with CAPCO | 6,099 | 5,652 | ||
Purchases of nuclear electricity | 2,115 | 2,447 | ||
Pumped storage service fee | 173 | 179 | ||
| 8,387 | 8,278 | |||
Amounts due to the related parties as at 30 June 2006 are disclosed in Note 22.
The amount relating to the electricity supply contract with CAPCO refers to the payments made by CLP Power Hong Kong in discharging its payment obligations under the contract. Following the adoption of lease accounting by the Group, such payments have been accounted for as lease and service payments, finance cost and principal repayments of finance lease obligations.
| (ii) | Gascor Pty Ltd (Gascor), is a party to a gas supply contract in Victoria with Esso Australia Resources Pty Ltd (Esso) and BHP Billiton Petroleum (Bass Strait) Pty Ltd (BHP). The contract terms between Gascor and Esso/BHP are effectively replicated in the Master Agreement between TRUenergy and Gascor. TRUenergy purchases gas at the wholesale market price from Gascor, which in turn obtains the gas from Esso and BHP. The amount paid to Gascor was HK$401 million (2005: HK$91 million). |
| (B) | Rendering of services to jointly controlled entities |
Pursuant to the CAPCO Operating Service Agreement, the charges from CLP Power Hong Kong to CAPCO for the services rendered during the period amounted to HK$526 million (2005: HK$529 million).
Amounts due from the related parties as at 30 June 2006 are disclosed in Note 20. No provisions have been made for doubtful debts in respect of the amounts owed by the related parties.
| (C) | Loan and advances to affiliated companies are discussed under Notes 16 and 17. As at 30 June 2006, the Group did not have any guarantees which were of significant amount given to or received from these parties. |
| (D) | Total remuneration of Non-executive Directors and Senior Management, which includes three Executive Directors of the Company, Group Director – Managing Director Hong Kong, Group Director – Managing Director Australia, Group Director – Operations, and Group Director – Corporate Development (2005: Four Executive Directors of the Company and Managing Directors of the two major subsidiaries, CLP Power Hong Kong and CLP Power Asia), is as follows: |
| 6 months ended 30 June | ||||
| 2006 | 2005 | |||
| HK$M | HK$M | |||
Fees | 2 | 2 | ||
Base compensation, allowances and benefits in kind | 13 | 12 | ||
Performance bonus | ||||
Annual incentive | 18 | 15 | ||
Long-term incentive | 8 | 8 | ||
Provident fund contributions | 2 | 1 | ||
| 43 | 38 | |||
Page 59
Table of Contents
| 30. | Contingent Liabilities |
Under the original power purchase agreement between GPEC and its off-taker GUVNL, GUVNL was required to make a “deemed generation incentive” payment to GPEC when the plant availability was above 68.5% (70% as revised subsequently). GUVNL has been making such payments since December 1997. In September 2005, GUVNL filed a petition before the Gujarat Electricity Regulatory Commission claiming that the “deemed generation incentive” payment should not be paid for the period when the plant was using naphtha as fuel instead of gas. GUVNL’s contention is based on a 1995 Government of India notification which disallowed “deemed generation incentive” for naphtha based power plants. The total amount of the claim plus interest amounts to approximately HK$1,250 million.
On the basis of legal advice that has been sought, the Directors are of the opinion that no provision is required to be made in the accounts in respect of this matter.
Page 60
Table of Contents
The electricity-related operations of CLP Power Hong Kong and CAPCO (the SoC Companies) have been governed by the SoC Agreement with the Hong Kong Government. A summary of which was disclosed on page 190 in the Annual Report 2005. The calculations shown below are in accordance with the SoC and the agreements between the SoC Companies. The calculations are extracted from the management accounts of CLP Power Hong Kong for the six months ended 30 June 2006.
(Unaudited) 6 months ended 30 June | ||||||
| 2006 | 2005 | |||||
| HK$M | HK$M | |||||
SoC Revenue | 13,505 | 13,300 | ||||
Expenses | ||||||
Operating costs | 1,473 | 1,454 | ||||
Fuel | 2,339 | 1,977 | ||||
Purchases of nuclear electricity | 2,115 | 2,447 | ||||
Depreciation | 2,008 | 1,825 | ||||
Operating interest | 356 | 220 | ||||
Taxation | 849 | 920 | ||||
| 9,140 | 8,843 | |||||
Profit after taxation | 4,365 | 4,457 | ||||
Interest on increase in customers’ deposits | 17 | 2 | ||||
Interest on long-term financing | 406 | 362 | ||||
Adjustments required under the SoC | ||||||
(including share of profit on sale of electricity to Chinese mainland attributable to the SoC Companies) | (85 | ) | (98 | ) | ||
Profit for SoC | 4,703 | 4,723 | ||||
Transfer from Development Fund | 488 | 338 | ||||
Permitted return | 5,191 | 5,061 | ||||
Deduct interest | ||||||
On increase in customers’ deposits | 17 | 2 | ||||
On long-term financing as above | 406 | 362 | ||||
On Development Fund and special provision account transferred to Rate Reduction Reserve | 133 | 120 | ||||
| 556 | 484 | |||||
Net return | 4,635 | 4,577 | ||||
Divisible as follows: | ||||||
CLP Power Hong Kong | 2,862 | 2,795 | ||||
CAPCO | 1,773 | 1,782 | ||||
| 4,635 | 4,577 | |||||
CLP Power Hong Kong’s share of net return | ||||||
CLP Power Hong Kong | 2,862 | 2,795 | ||||
Interest in CAPCO | 711 | 715 | ||||
| 3,573 | 3,510 | |||||
Page 61
Table of Contents
To the Board of Directors of CLP Holdings Limited (the Company)
(Incorporated in Hong Kong with limited liability)
We have been instructed by the Company to review the condensed consolidated interim accounts set out on pages 32 to 60.
Respective responsibilities of Directors and Auditors
The Rules Governing the Listing of Securities on The Stock Exchange of Hong Kong Limited require the preparation of condensed consolidated interim accounts to be in compliance with Hong Kong Accounting Standard 34 “Interim financial reporting” issued by the Hong Kong Institute of Certified Public Accountants and the relevant provisions thereof. The condensed consolidated interim accounts are the responsibility of, and have been approved by, the directors.
It is our responsibility to form an independent conclusion, based on our review, on the condensed consolidated interim accounts and to report our conclusion solely to you, as a body, in accordance with our agreed terms of engagement and for no other purpose. We do not assume responsibility towards or accept liability to any other person for the contents of this report.
Review work performed
We conducted our review in accordance with SAS 700 “Engagements to review interim financial reports” issued by the Hong Kong Institute of Certified Public Accountants. A review consists principally of making enquiries of group management and applying analytical procedures to the condensed consolidated interim accounts and, based thereon, assessing whether the accounting policies and presentation have been consistently applied unless otherwise disclosed. A review excludes audit procedures such as tests of controls and verification of assets, liabilities and transactions. It is substantially less in scope than an audit and therefore provides a lower level of assurance than an audit. Accordingly we do not express an audit opinion on the condensed consolidated interim accounts.
Review conclusion
On the basis of our review, which does not constitute an audit, we are not aware of any material modifications that should be made to the condensed consolidated interim accounts for the six months ended 30 June 2006.
/s/ PricewaterhouseCoopers |
| PricewaterhouseCoopers |
| Certified Public Accountants |
| Hong Kong, 15 August 2006 |
Page 62
Table of Contents
CLP is committed to maintaining good corporate governance standards.
Corporate Governance Practices
In the Corporate Governance Report dated 28 February 2006, which was published in our 2005 Annual Report, we reported that the Company had adopted its own Code on Corporate Governance (CLP Code) on 28 February 2005 which incorporated all of the Code Provisions and Recommended Best Practices in the “Code on Corporate Governance Practices” issued by the Hong Kong Stock Exchange (the Stock Exchange Code), save for one exception.
This single deviation from the Recommended Best Practices of the Stock Exchange Code relates to the recommendation that an issuer should announce and publish quarterly financial results. CLP issues quarterly statements which include turnover, interim dividends and progress in major business activities over the quarter. However, CLP does not issue quarterly financial results because in our judgment quarterly reporting does not bring significant benefits to shareholders. The considered reasons for this deviation were stated in the Corporate Governance Report on page 99 of the Company’s 2005 Annual Report.
In the Corporate Governance Report we also described the structure of CLP’s Corporate Governance Framework and how the various key players are involved in ensuring the application of good governance practices and policies within the CLP Group. The progress made in 2005 in the evolution of CLP’s corporate governance practices was set out in the Corporate Governance Report on page 100 of the Company’s 2005 Annual Report. In 2006, we made further progress in our corporate governance practices, including the establishment of a China Committee and the implementation of a development programme for Directors.
During the first half of 2006, two additional Non-executive Directors were appointed to the Board of CLP Holdings. Sir Roderick Ian Eddington was appointed an Independent Non-executive Director effective from 1 January 2006 and Mr. Jason Holroyd Whittle, an alternate to Mr. R. J. McAulay, was appointed a Non-executive Director on 9 May 2006.
As at 30 June 2006 the composition of the Board of CLP Holdings was as follows:
| Non-executive Directors | Independent Non-executive Directors | Executive Directors | ||
| The Hon. Sir Michael Kadoorie | The Hon. Sir S. Y. Chung | Mr. Andrew Brandler | ||
| Mr. W. E. Mocatta | Dr. William K. Fung | Mr. Peter P. W. Tse | ||
| Mr. J. S. Dickson Leach | Mr. V. F. Moore | Dr. Y. B. Lee | ||
| Mr. R. J. McAulay | Mr. Hansen C. H. Loh | |||
| Mr. J. A. H. Leigh | Mr. Paul M. L. Kan | |||
| Mr. R. Bischof | Professor Judy Tsui | |||
| Mr. I. D. Boyce | Sir Rod Eddington | |||
| Mr. P. C. Tan | ||||
| Mr. Jason Whittle | ||||
Directors’ biographies are set out on CLP’s website.
Page 63
Table of Contents
The composition of Board Committees remains the same as set out in the Corporate Governance Report (pages 104-106), save that Mr. J. S. Dickson Leach resigned from the Finance and General Committee on 1 April 2006 and Mrs. Betty Yuen, Group Director - Managing Director Hong Kong, and Mr. Richard McIndoe, Group Director - Managing Director Australia, were appointed Members of the Finance and General Committee with effect from 7 June 2006.
Following shareholders’ approval at the Company’s Annual General Meeting held on 25 April 2006, remuneration is payable to the Chairmen and Members (other than Executive Directors and Management) who serve on the Company’s Social, Environmental & Ethics Committee and China Committee. Such remuneration is fixed at the levels shown below for each financial year until the Company in General Meeting otherwise determines and took effect from the date of the first meeting of the Social, Environmental & Ethics Committee and China Committee on 1 December 2005 and 10 January 2006 respectively.
| HK$ | ||
Social, Environmental & Ethics Committee | ||
Chairman | 30,000 | |
Member | 20,000 | |
China Committee | ||
Chairman | 56,000 | |
Member | 40,000 | |
In respect of the year ended 31 December 2005, the Board considered CLP’s internal control system effective and adequate. Details of the standards, processes and effectiveness of CLP’s internal control system were set out in the Corporate Governance Report on pages 108 to 110 of the Company’s 2005 Annual Report.
Through our review of CLP Group’s system of internal control, we identified in the second quarter of 2006 a number of control deficiencies principally in relation to limited segregation of duties and weak general computer controls, mainly at TRUenergy, a newly acquired subsidiary. The bulk of those deficiencies have since been rectified, and we are not aware of any situation where these have been exploited to impact our financial position or results of operations. We shall retest all related controls starting in the third quarter of 2006, and we expect the retesting to be completed by 31 December 2006.
During the six months ended 30 June 2006 the Company met the Code Provisions set out in the Stock Exchange Code contained in Appendix 14 of the Rules Governing the Listing of Securities on The Stock Exchange of Hong Kong Limited (Listing Rules).
The Audit Committee has reviewed the accounting principles and practices adopted by the Group and the unaudited condensed accounts for the six months ended 30 June 2006. All of the Audit Committee members are appointed from the Independent Non-executive Directors, with the Chairman and a member having appropriate professional qualifications and experience in financial matters.
Page 64
Table of Contents
Interests of Directors and Substantial Shareholders
Since 1989, the Company has adopted its own Code for Securities Transactions by Directors (CLP Securities Code), which is largely based on the Model Code set out in Appendix 10 of the Listing Rules. The CLP Securities Code also applies to Senior Management (comprising the three Executive Directors, Group Director - Managing Director Hong Kong, Group Director - Managing Director Australia, Group Director - Operations and Group Director - Corporate Development, whose biographies are set out on CLP’s website) and other “Specified Individuals” such as senior managers in the CLP Group. The CLP Securities Code has been updated from time to time to reflect new regulatory requirements as well as CLP Holdings’ strengthened regime of disclosure of interests in its securities.
The current CLP Securities Code is on terms no less exacting than the required standard set out in the Model Code.
All Directors and Senior Management have confirmed, following specific enquiry by the Company, that they have complied with the required standard set out in the Model Code and CLP Securities Code throughout the period from 1 January to 30 June 2006.
Save for the shareholdings disclosed below by the three Executive Directors and the 600 shares held by Group Director - Operations, the other Senior Management did not have any interests in CLP Holdings’ securities as at 30 June 2006.
Interests of Directors and Chief Executive Officer
The interests/short positions of each of the Directors and Chief Executive Officer in the shares, underlying shares and debentures of the Company or any of the Company’s associated corporations (within the meaning of the Securities and Futures Ordinance) as at 30 June 2006, as recorded in the register required to be kept under Section 352 of Part XV of the Securities and Futures Ordinance, are set out in the table and explanatory notes below:
| 1. | Aggregate long position in the shares, underlying shares and debentures of the Company and its associated corporations |
The interests of Directors and Chief Executive Officer in the shares of the Company (other than pursuant to equity derivatives such as share options, warrants to subscribe or convertible bonds) as at 30 June 2006 were as follows:
Directors | Capacity | Total Interests in Number of Ordinary Shares of the Company | % of the Issued Share Capital of the Company | |||
The Hon. Sir Michael Kadoorie | Note (a) | 475,381,026 | 19.7397 | |||
Mr. W. E. Mocatta | Founder of a discretionary trust | 250,000 | 0.0104 | |||
Page 65
Table of Contents
Directors | Capacity | Total Interests in Number of Ordinary Shares of the Company | % of the Issued Share Capital of the Company | |||
Mr. J. S. Dickson Leach | Founder of a discretionary trust Note (b) | 3,436 | 0.0001 | |||
Mr. R. J. McAulay | Note (c) | 439,800,565 | 18.2623 | |||
The Hon. Sir S. Y. Chung | Beneficial owner | 393,789 | 0.0164 | |||
Dr. William K. Fung | Beneficial owner | 120,000 | 0.0050 | |||
Mr. J. A. H. Leigh | Beneficial owner | 22,000 | 0.0009 | |||
Mr. R. Bischof | Beneficial owner | 50,000 | 0.0021 | |||
Mr. P. C. Tan | Interests held jointly with spouse | 5,000 | 0.0002 | |||
Mr. Andrew Brandler | Note (d) | 10,600 | 0.0004 | |||
Mr. Peter P. W. Tse | Note (e) | 20,600 | 0.0009 | |||
Dr. Y. B. Lee | Note (f) | 15,806 | 0.0007 | |||
Mr. Jason Whittle | Note (g) | 238,409,771 | 9.8997 | |||
Notes:
| (a) | The Hon. Sir Michael Kadoorie was deemed (by virtue of the Securities and Futures Ordinance) to be interested in 475,381,026 shares in the Company. These shares were held in the following capacity: |
| i) | 1,243 shares were an interest of his spouse, Lady Kadoorie. |
| ii) | 236,335,571 shares were held by discretionary trusts, of which The Hon. Sir Michael Kadoorie is one of the discretionary objects. |
| iii) | 239,044,212 shares were held by a discretionary trust, of which The Hon. Sir Michael Kadoorie is one of the discretionary objects and the founder. |
For the purpose of the Securities and Futures Ordinance, the spouse of The Hon. Sir Michael Kadoorie was taken to have a discloseable duty in Hong Kong in relation to the 239,044,212 shares referred to in (iii) above. The spouse of The Hon. Sir Michael Kadoorie was therefore deemed to be interested in 239,045,455 shares in the Company representing approximately 9.93% of the issued share capital of the Company, of which 1,243 shares were held by her as beneficial owner and 239,044,212 shares were attributed to her pursuant to the Securities and Futures Ordinance for disclosure purposes. Nevertheless, she has no interest, legal or beneficial, in these 239,044,212 shares attributed to her for disclosure purposes.
Page 66
Table of Contents
| (b) | According to the register of directors’ and chief executives’ interests and short position required to be kept under Section 352 of Part XV of the Securities and Futures Ordinance, Mr. J. S. Dickson Leach is the beneficial owner of 3,436 ordinary shares of the Company. The Company was notified by Mr. J. S. Dickson Leach that the capacity of his interest had been changed from Beneficial Owner to Founder of a Discretionary Trust. |
| (c) | Mr. R. J. McAulay was deemed (by virtue of the Securities and Futures Ordinance) to be interested in 439,800,565 shares in the Company. These shares were held in the following capacity: |
| i) | 13,141 shares were held in a personal capacity. |
| ii) | 236,335,571 shares were held by discretionary trusts, of which Mr. R. J. McAulay is one of the discretionary objects. |
| iii) | 203,451,853 shares were held by a discretionary trust, of which Muriel, Lady Kadoorie, mother-in-law of Mr. R. J. McAulay, is the founder and a beneficiary and Mr. R. J. McAulay, his wife and members of his family are discretionary objects. |
| (d) | 600 shares were held in a personal capacity and 10,000 shares were held in a beneficial owner capacity. |
| (e) | 600 shares were held in a personal capacity and 20,000 shares were held in a beneficial owner capacity. |
| (f) | 600 shares were held in a personal capacity and 15,206 shares were held jointly with spouse. |
| (g) | Mr. Jason Whittle was deemed (by virtue of the Securities and Futures Ordinance) to be interested in 238,409,771 shares in the Company. These shares were held in the following capacity: |
| i) | 600 shares were held in a personal capacity. |
| ii) | 236,335,571 shares were held by discretionary trusts, of which Mr. Jason Whittle is one of the discretionary objects. |
| iii) | 2,073,600 shares were indirectly held by the spouse of Mr. Jason Whittle. |
Messrs. I. D. Boyce, V. F. Moore, Hansen C. H. Loh and Paul M. L. Kan, Professor Judy Tsui and Sir Rod Eddington who are Directors of the Company, and Mr. Bradley W. Corson who is an Alternate Director have each confirmed that they had no interests in the shares of the Company or any of its associated corporations as at 30 June 2006.
None of the Directors or the Chief Executive Officer had interests in debentures, under equity derivatives or in underlying shares of the Company and its associated corporations as at 30 June 2006.
| 2. | Aggregate short position in the shares, underlying shares and debentures of the Company and its associated corporations |
None of the Directors or the Chief Executive Officer had short positions in respect of shares, debentures, under equity derivatives or interests in underlying shares of the Company and its associated corporations as at 30 June 2006.
At no time during the period was the Company, its subsidiaries or its associated companies a party to any arrangement to enable the Directors and the Chief Executive Officer of the Company (including their spouse and children under 18 years of age) to acquire benefits by an acquisition of shares or underlying shares in, or debentures of, the Company or its associated corporations.
Page 67
Table of Contents
Interests of Substantial Shareholders
The interests/short positions of substantial shareholders in the shares and underlying shares of the Company as at 30 June 2006, as recorded in the register required to be kept under Section 336 of Part XV of the Securities and Futures Ordinance, are set out in the table and explanatory notes below:
| 1. | Aggregate long position in the shares and underlying shares of the Company |
The Company had been notified of the following substantial shareholders’ interests in the shares (other than pursuant to equity derivatives such as share options, warrants to subscribe or convertible bonds) as at 30 June 2006.
Substantial Shareholders | Capacity | Total Interests in Number of Ordinary Shares of the Company | % of the Issued Share Capital of the Company | |||
Acorn Holdings Corporation | Beneficiary | 196,468,538 Note (a) | 8.16 | |||
Bermuda Trust Company Limited | Trustee / Interests of controlled corporations | 682,978,836 Note (a) | 28.36 | |||
Bermuda Trust (Cayman) Limited | Trustee | 203,451,853 Note (b) | 8.45 | |||
Esko Limited | Interests of controlled corporations | 236,335,571 Note (a) | 9.81 | |||
Hesko Limited | Interests of controlled corporations | 236,335,571 Note (a) | 9.81 | |||
HWR Trustees Limited (now known as Harneys Trustees Limited) | Interests of controlled corporations | 240,482,771 Note (a) | 9.99 | |||
Lakshmi Company Limited | Beneficiary | 196,468,538 Note (a) | 8.16 | |||
Lawrencium Corporation | Beneficiary | 196,468,538 Note (a) | 8.16 | |||
Merlin Investments Limited | Beneficiary | 196,468,538 Note (a) | 8.16 | |||
Mikado Holding Inc. | Trustee | 239,044,212 Note (a) | 9.93 | |||
Page 68
Table of Contents
Substantial Shareholders | Capacity | Total Interests in Number of Ordinary Shares of the Company | % of the Issued Share Capital of the Company | |||
Mikado Investments Limited | Interest of controlled corporation / Beneficiary of trusts | 239,044,212 Note (a) | 9.93 | |||
Muriel, Lady Kadoorie | Founder and Beneficiary | 203,451,853 Note (b) | 8.45 | |||
New Boron Holding Corporation | Trustee | 193,512,472 Note (a) | 8.04 | |||
Oak CLP Limited | Beneficiary | 196,554,172 Note (b) | 8.16 | |||
Oak (Unit Trust) Holdings Limited | Trustee | 196,554,172 Notes (a) & (b) | 8.16 | |||
Mr. R. Parsons | Trustee | 196,554,172 Note (c) | 8.16 | |||
Sir Sidney Gordon | Trustee | 205,525,453 Note (c) | 8.53 | |||
The Hon. Sir Michael Kadoorie | Note (d) | 475,381,026 Note (d) | 19.74 | |||
Mr. R. J. McAulay | Note (e) | 439,800,565 Note (e) | 18.26 | |||
Mr. Jason Whittle | Note (f) | 238,409,771 Note (f) | 9.90 | |||
Guardian Limited | Beneficiary / Interests in controlled corporations | 196,554,172 Note (c) | 8.16 | |||
Notes:
| (a) | The interests of Bermuda Trust Company Limited in the shares of the Company include the interests in the Company held by Esko Limited, Hesko Limited, Acorn Holdings Corporation, Lawrencium Corporation, Mikado Holding Inc., Mikado Investments Limited, Oak (Unit Trust) Holdings Limited, Lakshmi Company Limited and Merlin Investments Limited. |
The interests of Bermuda Trust Company Limited in the shares of the Company also include the shares held by discretionary trusts of which The Hon. Sir Michael Kadoorie and/or Mr. R. J. McAulay and/or Mr. Jason Whittle are among the discretionary objects as disclosed in “Interests of Directors and Chief Executive Officer”.
Page 69
Table of Contents
Bermuda Trust Company Limited was deemed to be interested in the shares in which Esko Limited, Hesko Limited, Acorn Holdings Corporation, Lawrencium Corporation, Mikado Holding Inc., Mikado Investments Limited, Oak (Unit Trust) Holdings Limited, Lakshmi Company Limited and Merlin Investments Limited were interested, either in the capacity as trustee or by virtue of having direct or indirect control over such companies.
Esko Limited and Hesko Limited together controlled Lakshmi Company Limited and Merlin Investments Limited and were therefore deemed to be interested in the shares in which Lakshmi Company Limited and Merlin Investments Limited were interested. The Company has been advised that Lakshmi Company Limited, Merlin Investments Limited, Acorn Holdings Corporation and Lawrencium Corporation were deemed to be interested in the same 196,468,538 shares in which New Boron Holding Corporation was deemed to be interested.
Esko Limited and Hesko Limited together controlled Acorn Holdings Corporation and Lawrencium Corporation and were therefore deemed to be interested in the shares in which such companies were deemed interested. In addition, Esko Limited and Hesko Limited were deemed interested in 39,867,033 shares through other controlled corporations controlled by them.
The Company was notified by New Boron Holding Corporation that it was interested in 193,512,472 shares as at 1 April 2003. However, HWR Trustees Limited (now known as Harneys Trustees Limited) indicated in its latest disclosure form that as at 17 January 2005, it was interested in, inter alia, 200,615,738 shares through its wholly-owned subsidiary, New Boron Holding Corporation. Therefore, New Boron Holding Corporation was interested in the same 200,615,738 shares as at 17 January 2005 but was not itself under a duty to notify the Company of the change under the Securities and Futures Ordinance.
In addition, the Company was notified by Oak (Unit Trust) Holdings Limited that it was interested in 196,554,172 shares as at 26 August 2003. However, Bermuda Trust Company Limited indicated in its latest disclosure form that as at 24 June 2005, it was interested in, inter alia, 203,451,853 shares through its wholly-owned subsidiary, Oak (Unit Trust) Holdings Limited. Therefore, Oak (Unit Trust) Holdings Limited was interested in the same 203,451,853 shares as at 24 June 2005 but was not itself under a duty to notify the Company of the change under the Securities and Futures Ordinance.
| (b) | The interests of Bermuda Trust (Cayman) Limited in the shares of the Company include the interests in the Company in which Oak CLP Limited, Oak (Unit Trust) Holdings Limited and Muriel, Lady Kadoorie were deemed to be interested. |
The interests of Muriel, Lady Kadoorie in 203,451,853 shares of the Company include shares in which Mr. R. J. McAulay, Mr. R. Parsons and Sir Sidney Gordon were deemed to be interested.
Bermuda Trust (Cayman) Limited was interested in the 203,451,853 shares by virtue of its capacity as trustee of a trust of which Muriel, Lady Kadoorie is the founder and a beneficiary and Mr. R. J. McAulay is one of the discretionary objects. Bermuda Trust (Cayman) Limited, in its capacity as trustee of a discretionary trust, controlled Oak CLP Limited and was therefore deemed to be interested in the shares in which Oak CLP Limited was interested. The Company was notified by Oak CLP Limited that it was interested in 196,554,172 shares as at 26 August 2003. However, Bermuda Trust (Cayman) Limited indicated in its latest disclosure form that as at 5 February 2004, it was interested in 203,451,853 shares through its wholly-owned subsidiary, Oak CLP Limited. Therefore, Oak CLP Limited was interested in the same 203,451,853 shares as at 5 February 2004 but was not itself under a duty to notify the Company of the change under the Securities and Futures Ordinance.
| (c) | Mr. R. Parsons and Sir Sidney Gordon, in their capacities as trustees of certain trusts, jointly controlled Guardian Limited and therefore were deemed to be interested in the shares in which Guardian Limited was deemed to be interested. Accordingly, the 196,554,172 shares in which Guardian Limited was interested is duplicated within the interests attributed to each of Sir Sidney Gordon and Mr. R. Parsons. |
Sir Sidney Gordon was also deemed to be interested in 205,525,453 shares in his capacity as trustee of certain trusts.
Page 70
Table of Contents
| (d) | The aggregate long position in the shares of the Company of The Hon. Sir Michael Kadoorie is listed below: |
Interests in the Ordinary Shares of the Company
| Number | Capacity | |||
| 1,243 239,044,212 475,379,783 | Interest of spouse Founder of a discretionary trust Discretionary object of various discretionary trusts | |||
The interests of The Hon. Sir Michael Kadoorie as a founder of a discretionary trust and a discretionary object of various discretionary trusts are duplicated between each other. His interests, apart from the interest of his spouse, are also duplicated by the interests in the Company held by Bermuda Trust Company Limited and certain discretionary trusts of which Mr. R. J. McAulay and Mr. Jason Whittle are among the discretionary objects as disclosed in Notes (e) and (f) below.
For the purpose of the Securities and Futures Ordinance, the spouse of The Hon. Sir Michael Kadoorie was taken to have a discloseable duty in Hong Kong in relation to the 239,044,212 shares referred to above. The spouse of The Hon. Sir Michael Kadoorie was therefore deemed to be interested in 239,045,455 shares in the Company representing approximately 9.93% of the issued share capital of the Company, of which 1,243 shares were held by her as beneficial owner and 239,044,212 shares were attributed to her pursuant to the Securities and Futures Ordinance for disclosure purposes. Nevertheless, she has no interest, legal or beneficial, in these 239,044,212 shares attributed to her for disclosure purposes.
| (e) | See Note (c) under “Interests of Directors and Chief Executive Officer”. |
| (f) | See Note (g) under “Interests of Directors and Chief Executive Officer”. |
| 2. | Aggregate short position in the shares and underlying shares of the Company |
As at 30 June 2006, the Company had not been notified of any short positions being held by any substantial shareholder in the shares or underlying shares of the Company.
Interests of Any Other Persons
As at 30 June 2006, the Company had not been notified of any persons other than the substantial shareholders who had interests or short positions in the shares or underlying shares of the Company, which are required to be recorded in the register required to be kept under Section 336 of Part XV of the Securities and Futures Ordinance.
Purchase, Sale or Redemption of the Company’s Listed Shares
There was no purchase, sale or redemption of the Company’s listed shares by the Company or any of its subsidiaries during the six months ended 30 June 2006.
Page 71
Table of Contents
Financial Diary
Announcement of interim results | 15 August 2006 | |
Interim report posted to Shareholders | 1 September 2006 | |
Last day to register for second interim dividend | 7 September 2006 | |
Book close day | 8 September 2006 | |
Payment of second interim dividend | 15 September 2006 | |
Financial year end | 31 December 2006 |
Interim Report
Printed in English and Chinese languages, available on our website at www.clpgroup.com on 22 August 2006 and posted to Shareholders on 1 September 2006.
Those Shareholders who (a) received our Interim Report 2006 electronically and would like to receive a printed copy or vice versa; or (b) received our Interim Report 2006 in either English or Chinese language version only and would like to receive a printed copy of the other language version or to receive printed copies of both language versions in future, are requested to write to the Company Secretary or the Company’s Registrars.
Shareholders may at any time change their choice of the language or means of receipt of the Company’s corporate communications free of charge by notice in writing to the Company Secretary or the Company’s Registrars.
Company’s Registrars
Computershare Hong Kong Investor Services Limited
| Address: | 46/F., Hopewell Centre, 183 Queen’s Road East, Hong Kong | |
| Telephone: | (852) 2862 8628 | |
| Facsimile: | (852) 2865 0990 | |
| E-mail: | hkinfo@computershare.com.hk |
Share Listing
CLP Holdings shares are listed on the Stock Exchange of Hong Kong and are traded over the counter in the United States in the form of American Depositary Receipts.
Our Stock Code
| The Stock Exchange of Hong Kong: | 002 | |
| Bloomberg: | 2 HK | |
| Reuters: | 0002.HK | |
| Ticker Symbol for ADR Code: | CLPHY | |
| CUSIP Reference Number: | 18946Q101 |
Our Contact Details
| Address: | 147 Argyle Street, Kowloon, Hong Kong | |
| Telephone: | (852) 2678 8228 (Shareholders’ hotline) (852) 2678 8322 (Investor Relations Manager) | |
| Facsimile: | (852) 2678 8390 (Company Secretary) (852) 2678 8530 (Investor Relations Manager) | |
| E-mail: | cosec@clp.com.hk (Company Secretary) IR_Dept@clp.com.hk (Investor Relations Manager) |
Page 72
Table of Contents
An Energetic Summer for our Young People …
For the third summer in succession, CLP is partnering with Junior Achievement Hong Kong to launch the Young Power Programme 2006 in Hong Kong. This will offer an opportunity to 50 secondary school students from 10 schools to go on a journey of discovery that will cover the technical, environmental and social responsibilities, as well as the business aspects, of electricity supply and customer service.
Page 73