Exhibit 99.1
Getty Realty
Investor Presentation
Safe Harbor Statement
Certain statements in this Presentation constitute “forward-looking statements” within the meaning of the federal securities laws. Forward-looking statements are statements that relate to management’s expectations or beliefs, future plans and strategies, future financial performance and similar expressions concerning matters that are not historical facts. In some cases, you can identify forward-looking statements by the use of forward-looking terminology such as “may,” “will,” “should,” “expects,” “intends,” “plans,” “anticipates,” “believes,” “estimates,” “predicts,” or “potential.” Such forward-looking statements reflect current views with respect to the matters referred to and are based on certain assumptions and involve known and unknown risks, uncertainties and other important factors, many of which are beyond the Company’s control, that could cause the actual results, performance, or achievements of the Company to differ materially from any future results, performance, or achievement implied by such forward-looking statements.
While forward-looking statements reflect the Company’s good faith beliefs, assumptions and expectations, they are not guarantees of future performance. The Company does not undertake any obligation to publicly update or revise any forward-looking statements to reflect changes in underlying assumptions or factors, new information, data or methods, future events or other changes. Examples of forward-looking statements in this Presentation include, but are not limited to, statement(s): (a) relating to the Company’s Portfolio, Long-Term Leases and Rent Escalators, Tenant Base, Market Opportunity and Redevelopment Opportunities, (b) relating to Industry Fundamentals and (c) relating to the Company’s Balance Sheet, Dividend Growth and Investment Highlights. Other unknown or unpredictable factors could also have material adverse effects on our business, financial condition, liquidity, results of operations and prospects. For a further discussion of these and other factors that could cause the Company’s future results to differ materially from any forward-looking statements, see the Company’s Annual Report on Form 10-K for the year ended December 31, 2015 and the Company’s other filings with the SEC, including, in particular, the section entitled “Risk Factors” contained therein. In light of these risks, uncertainties, assumptions and factors, there can be no assurance that the results and events contemplated by the forward-looking statements contained in this Presentation will in fact transpire. Moreover, because the Company operates in a very competitive and rapidly changing environment, new risks are likely to emerge from time to time. Given these risks and uncertainties, potential investors are cautioned not to place undue reliance on these forward-looking statements as a prediction of future results.
Unless otherwise noted in this Presentation, all reported financial data is presented as of the year ended December 31, 2015, and all portfolio data is as of December 31, 2015. Except as required under the federal securities laws and the rules and regulations of the SEC, the Company does not undertake any obligation to release publicly any revisions to the forward-looking statements to reflect events or circumstances after the date of this Presentation or to reflect the occurrence of unanticipated events.
The information contained herein has been prepared from public and non-public sources believed to be reliable. However, the Company has not independently verified certain of the information contained herein, and does not make any representation or warranty as to the accuracy or completeness of the information contained in this Presentation.
1
Investment Highlights
1 National Retail Net-Lease Portfolio Targeting Mature, High Growth Markets
Increasingly Institutional Quality Credit Tenant Base with Long Term Triple-Net
2 Leases
3 Attractive Industry Fundamentals with Stable Operator Performance
Aggregation Opportunity with Proven Ability to Successfully Pursue Growth in a
4 Consolidating Sector
5 Ongoing Process to Repurpose, Reposition, Redevelop Locations to Maximize Value
6 Strong Balance Sheet Positioned for Future Growth
2
Company Overview
Executive Management Team
Christopher J. Constant, President, Chief Executive Officer, Director
Promoted to President and Chief Executive Officer in January 2016
Joined in November 2010 as Director of Planning & Corporate Development and was later promoted to Treasurer in May 2012, Vice
President in May 2013 and Chief Financial Officer in December 2013 Previously Vice President of Morgan Joseph; Began career at ING Barings
Mark J. Olear, EVP, Chief Operating Officer
Promoted to Chief Operating Officer in May 2015
Joined in May 2014 as Executive Vice President and Chief Investment Officer
Previously held various real estate positions with TD Bank, Home Depot, Toys “R” Us and A&P
Joshua Dicker, SVP, General Counsel, Secretary
Promoted to Senior Vice President in May 2012
Joined in February 2008 as General Counsel and Secretary and was later promoted to Vice President in February 2009 Previously a Partner at Arent Fox LLP specializing in corporate and transactional matters
Danion Fielding, VP, Chief Financial Officer, Treasurer
Joined in February 2016 as Vice President, Chief Financial Officer and Treasurer
Previously held various positions with Wilbraham Capital, Inc., The Moinian Group, Nationwide Health Properties, Inc., and J.P. Morgan Securities Inc.
4
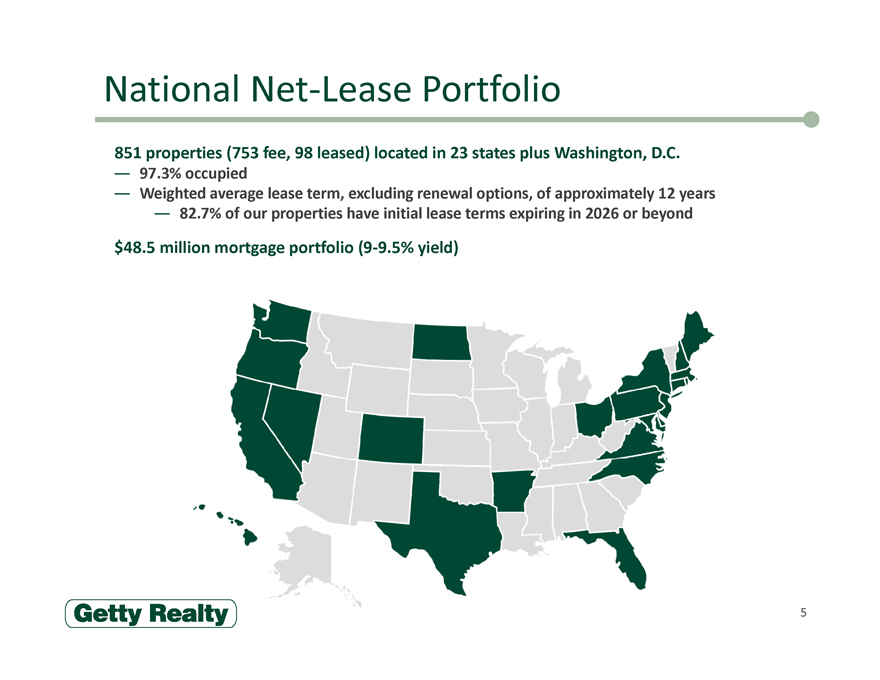
National Net-Lease Portfolio
851 properties (753 fee, 98 leased) located in 23 states plus Washington, D.C.
97.3% occupied
Weighted average lease term, excluding renewal options, of approximately 12 years
82.7% of our properties have initial lease terms expiring in 2026 or beyond
$48.5 million mortgage portfolio (9-9.5% yield)
5
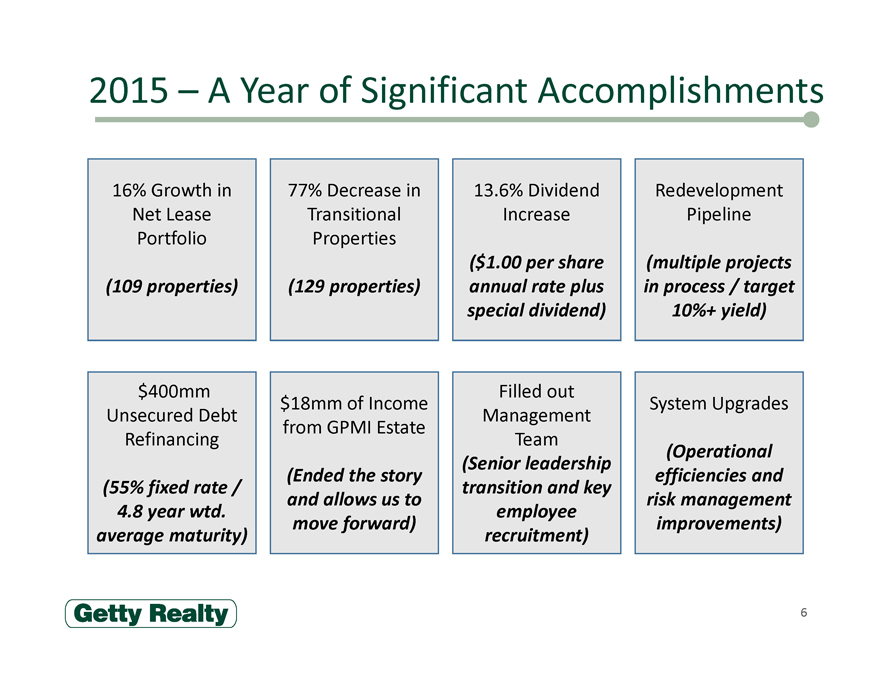
2015 – A Year of Significant Accomplishments
16% Growth in Net Lease Portfolio
(109 properties)
77% Decrease in Transitional Properties
(129 properties)
13.6% Dividend Increase
($1.00 per share annual rate plus special dividend)
Redevelopment Pipeline
(multiple projects in process / target 10%+ yield)
$400mm Unsecured Debt Refinancing
(55% fixed rate / 4.8 year wtd. average maturity)
$18mm of Income from GPMI Estate
(Ended the story and allows us to move forward)
Filled out Management Team
(Senior leadership transition and key employee recruitment)
System Upgrades
(Operational efficiencies and risk management improvements)
6
Investment Overview
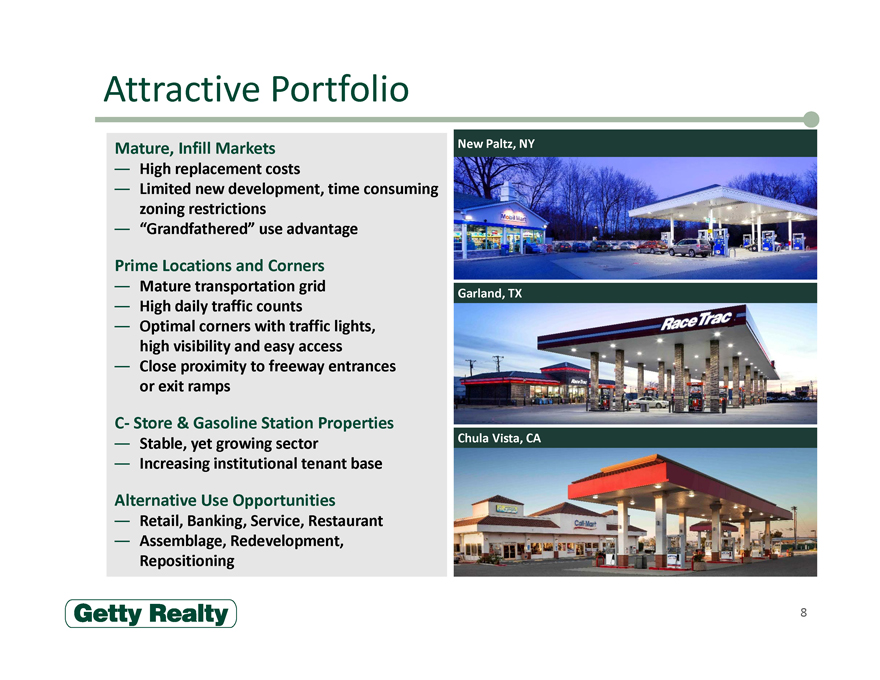
Attractive Portfolio
Mature, Infill Markets
High replacement costs
Limited new development, time consuming
zoning restrictions
“Grandfathered” use advantage
Prime Locations and Corners
Mature transportation grid
High daily traffic counts
Optimal corners with traffic lights,
high visibility and easy access
Close proximity to freeway entrances
or exit ramps
C- Store & Gasoline Station Properties
Stable, yet growing sector
Increasing institutional tenant base
Alternative Use Opportunities
Retail, Banking, Service, Restaurant
Assemblage, Redevelopment,
Repositioning
New Paltz, NY
Garland, TX
Chula Vista, CA
8
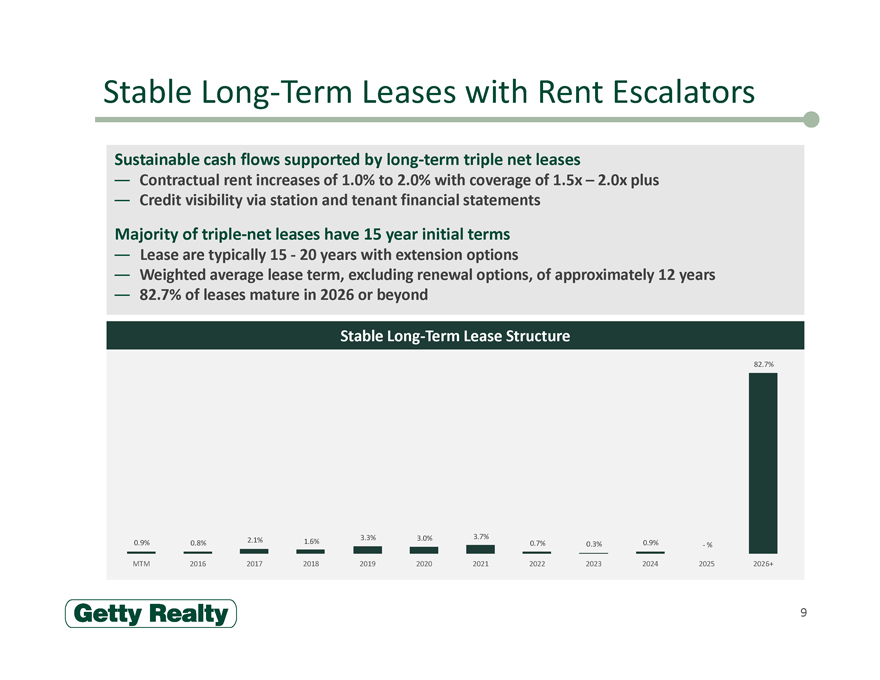
Stable Long-Term Leases with Rent Escalators
Sustainable cash flows supported by long-term triple net leases
Contractual rent increases of 1.0% to 2.0% with coverage of 1.5x – 2.0x plus
Credit visibility via station and tenant financial statements
Majority of triple-net leases have 15 year initial terms
Lease are typically 15 - 20 years with extension options
Weighted average lease term, excluding renewal options, of approximately 12 years
82.7% of leases mature in 2026 or beyond
Stable Long-Term Lease Structure
82.7%
2.1% 3.3% 3.0% 3.7%
0.9% 0.8% 1.6% 0.7% 0.3% 0.9% - %
MTM 2016 2017 2018 2019 2020 2021 2022 2023 2024 2025 2026+
9
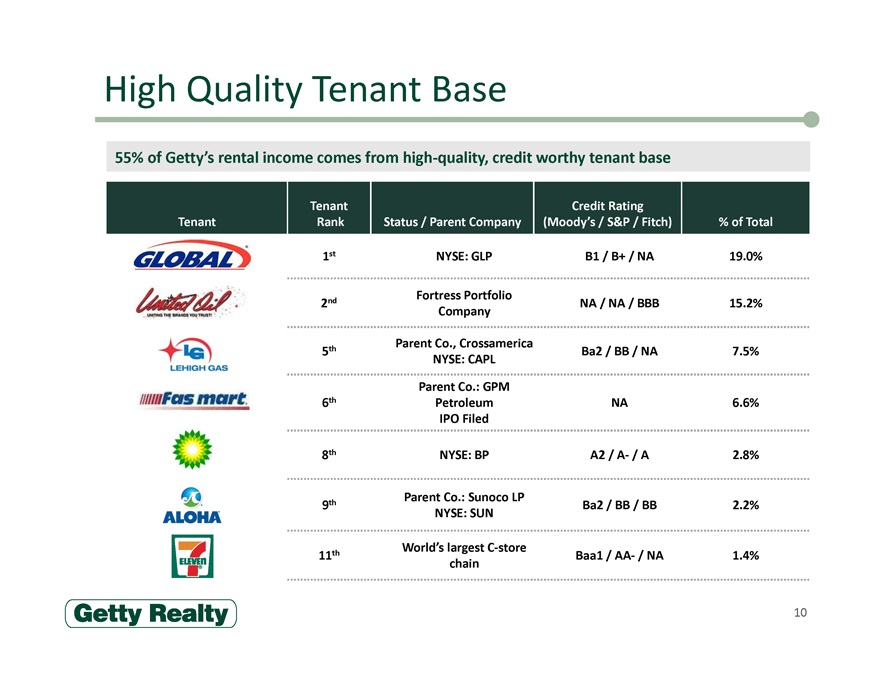
High Quality Tenant Base
55% of Getty’s rental income comes from high-quality, credit worthy tenant base
Tenant Credit Rating
Tenant Rank Status / Parent Company (Moody’s / S&P / Fitch) % of Total
1st NYSE: GLP B1 / B+ / NA 19.0%
Fortress Portfolio
2nd NA / NA / BBB 15.2%
Company
Parent Co., Crossamerica
5th Ba2 / BB / NA 7.5%
NYSE: CAPL
Parent Co.: GPM
6th Petroleum NA 6.6%
IPO Filed
8th NYSE: BP A2 / A- / A 2.8%
Parent Co.: Sunoco LP
9th Ba2 / BB / BB 2.2%
NYSE: SUN
World’s largest C-store
11th Baa1 / AA- / NA 1.4%
chain
10
Attractive Industry Fundamentals
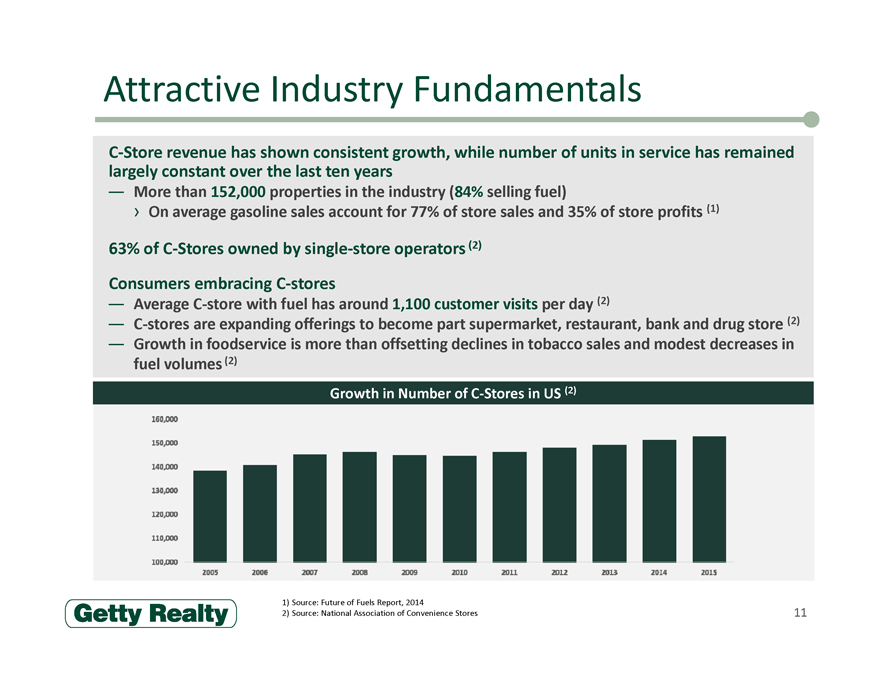
C-Store revenue has shown consistent growth, while number of units in service has remained
largely constant over the last ten years
More than 152,000 properties in the industry (84% selling fuel)
On average gasoline sales account for 77% of store sales and 35% of store profits (1)
63% of C-Stores owned by single-store operators (2)
Consumers embracing C-stores
Average C-store with fuel has around 1,100 customer visits per day (2)
C-stores are expanding offerings to become part supermarket, restaurant, bank and drug store (2)
Growth in foodservice is more than offsetting declines in tobacco sales and modest decreases in
fuel volumes (2)
Growth in Number of C-Stores in US (2)
1) Source: Future of Fuels Report, 2014
2) Source: National Association of Convenience Stores
11
Large Market Opportunity
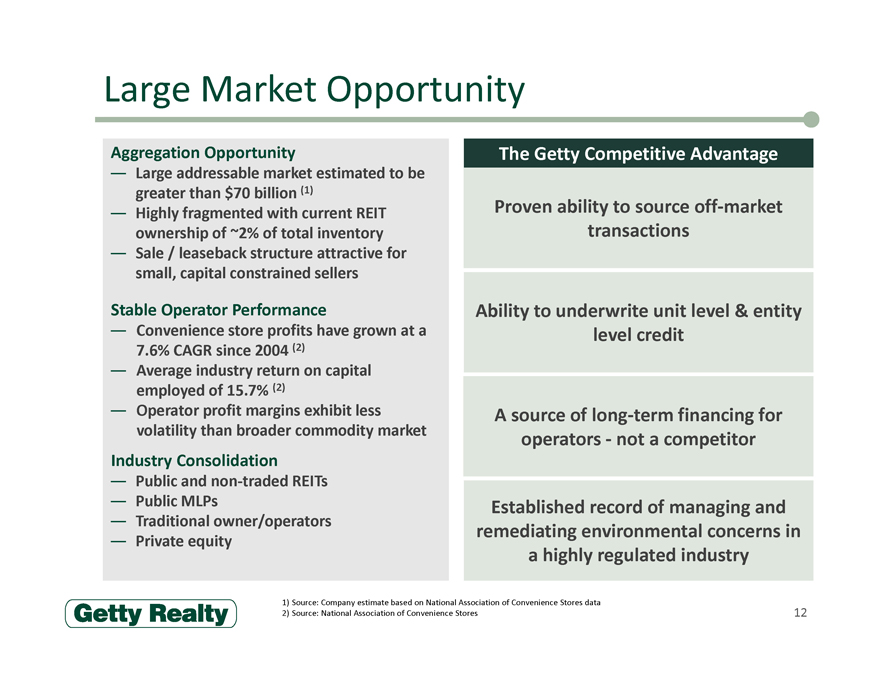
Aggregation Opportunity
Large addressable market estimated to be
greater than $70 billion (1)
Highly fragmented with current REIT
ownership of ~2% of total inventory
Sale / leaseback structure attractive for
small, capital constrained sellers
Stable Operator Performance
Convenience store profits have grown at a
7.6% CAGR since 2004 (2)
Average industry return on capital
employed of 15.7% (2)
Operator profit margins exhibit less
volatility than broader commodity market
Industry Consolidation
Public and non-traded REITs
Public MLPs
Traditional owner/operators
Private equity
The Getty Competitive Advantage
Proven ability to source off-market transactions
Ability to underwrite unit level & entity level credit
A source of long-term financing for operators -not a competitor
Established record of managing and remediating environmental concerns in a highly regulated industry
1) Source: Company estimate based on National Association of Convenience Stores data
2) Source: National Association of Convenience Stores
12
Acquisition – United Oil
$214.5 million Acquisition of 77 Properties in June 2015
Financed with a combination of long-term fixed rate
debt and credit facility borrowings
Tenant is United Oil, a leading regional convenience
store and gas station operator
› Operates ~400 locations in the Western United States
and Colorado
› Fortress Investment Group portfolio company
20 yr. triple-net lease with three 5-year renewal options
Attractive Sites in High Growth Markets
Site located across California, Colorado, Nevada, Oregon
and Washington State
Recognized brands including 7-Eleven, 76, Circle K,
Conoco and My Goods Market
Credit Enhancement
Properties supplied with fuel by Philips 66 under a long-
term supply agreement
Agreement contains credit enhancement consignment
features
13
Redevelopment – Unlocking Value in Our Assets
Getty’s unique network of assets are located on irreplaceable corners in attractive
neighborhoods which provides numerous opportunities for value enhancement
Funding of upgrades to convenience stores
NNN single tenant retail development
Multi-use urban building leases
Sources of opportunities for redevelopment include:
Transitional properties
Recapturing properties from unitary leases within Net-Lease portfolio
Supporting tenants as they convert to a full service convenience store model
Acquiring adjacent properties for development
Creating value through asset repositioning
Capital investment with attractive returns
Significant economic upside through incremental NOI
Diversifies tenant base
Improves tenant credit quality and coverage ratios
14
Case Study – MattressFIRM
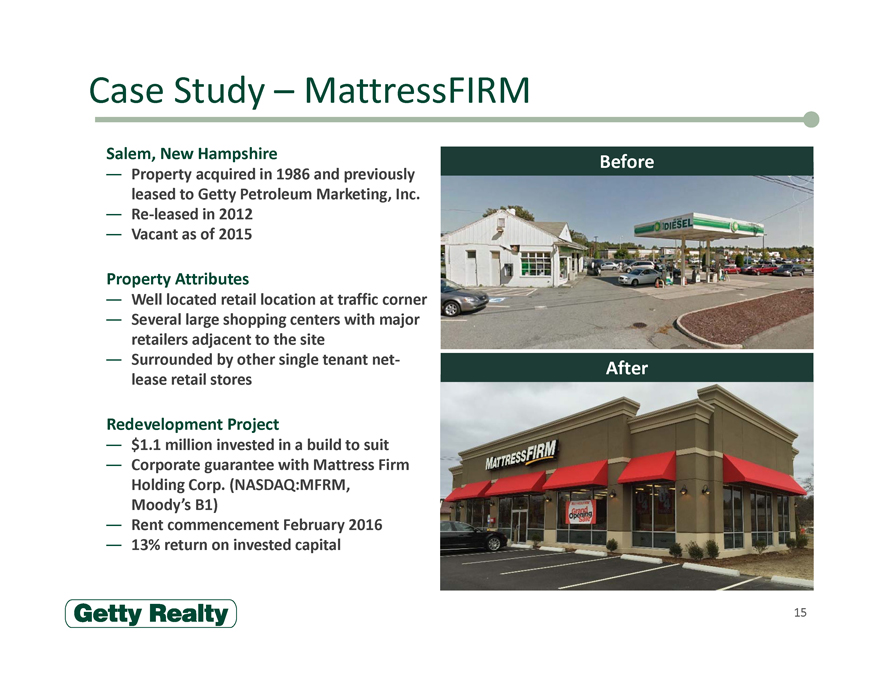
Salem, New Hampshire
Property acquired in 1986 and previously
leased to Getty Petroleum Marketing, Inc.
Re-leased in 2012
Vacant as of 2015
Property Attributes
Well located retail location at traffic corner
Several large shopping centers with major
retailers adjacent to the site
Surrounded by other single tenant net-
lease retail stores
Redevelopment Project
$1.1 million invested in a build to suit
Corporate guarantee with Mattress Firm
Holding Corp. (NASDAQ:MFRM,
Moody’s B1)
Rent commencement February 2016
13% return on invested capital
Before
After
15
Financial Overview
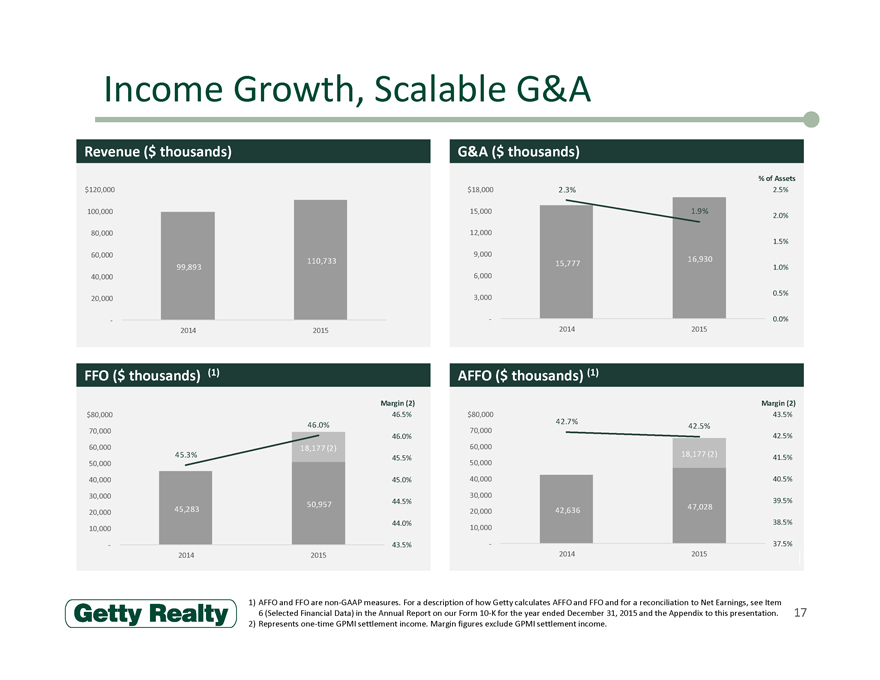
Income Growth, Scalable G&A
Revenue ($ thousands) G&A ($ thousands)
% of Assets
$120,000 $18,000 2.3% 2.5%
100,000 15,000 1.9% 2.0%
80,000 12,000
1.5%
60,000 9,000
110,733 15,777 16,930
99,893 1.0%
40,000 6,000
0.5%
20,000 3,000
- - 0.0%
2014 2015 2014 2015
FFO ($ thousands) (1) AFFO ($ thousands) (1)
Margin (2) Margin (2)
$80,000 46.5% $80,000 43.5%
42.7%
46.0% 42.5%
70,000 70,000
46.0% 42.5%
60,000 18,177 (2) 60,000
45.3% 45.5% 18,177 (2) 41.5%
50,000 50,000
40,000 45.0% 40,000 40.5%
30,000 30,000
44.5% 39.5%
50,957 47,028
20,000 45,283 20,000 42,636
44.0% 38.5%
10,000 10,000
- 43.5% - 37.5%
2014 2015 2014 2015
1) AFFO and FFO are non-GAAP measures. For a description of how Getty calculates AFFO and FFO and for a reconciliation to Net
Earnings, see Item
6 (Selected Financial Data) in the Annual Report on our Form 10-K for the year ended December 31, 2015 and the Appendix to this
presentation.
2) Represents one-time GPMI settlement income. Margin figures exclude GPMI settlement income.
17
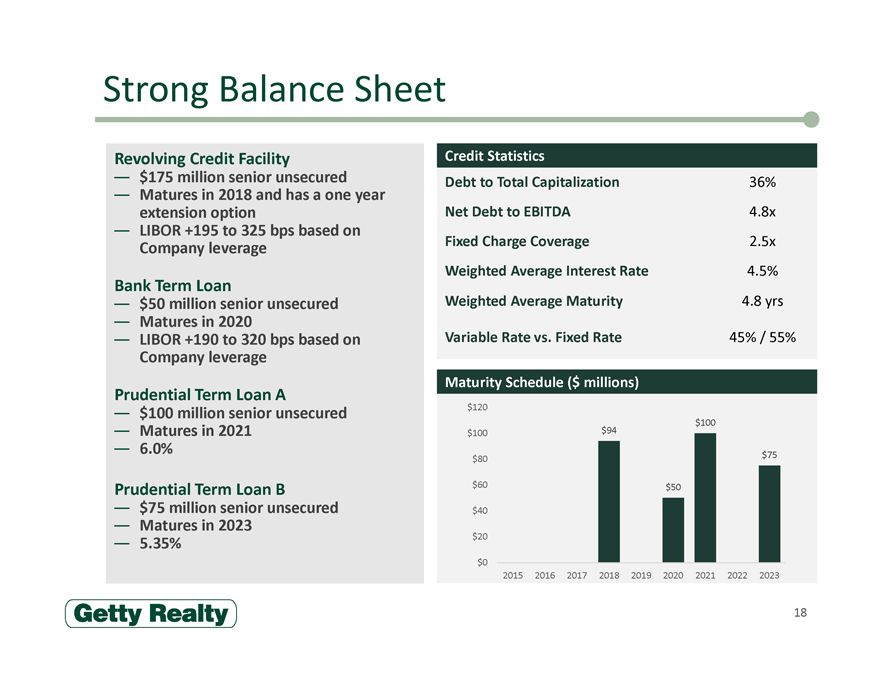
Strong Balance Sheet
Revolving Credit Facility
$175 million senior unsecured
Matures in 2018 and has a one year
extension option
LIBOR +195 to 325 bps based on
Company leverage
Bank Term Loan
$50 million senior unsecured
Matures in 2020
LIBOR +190 to 320 bps based on
Company leverage
Prudential Term Loan A
$100 million senior unsecured
Matures in 2021
6.0%
Prudential Term Loan B
$75 million senior unsecured
Matures in 2023
5.35%
Credit Statistics
Debt to Total Capitalization 36% Net Debt to EBITDA 4.8x Fixed Charge Coverage 2.5x Weighted Average Interest Rate 4.5% Weighted Average Maturity 4.8 yrs
Variable Rate vs. Fixed Rate 45% / 55%
Maturity Schedule ($ millions)
$120
$100
$100 $94
$80 $75
$60 $50
$40
$20
$0
2015 2016 2017 2018 2019 2020 2021 2022 2023
18
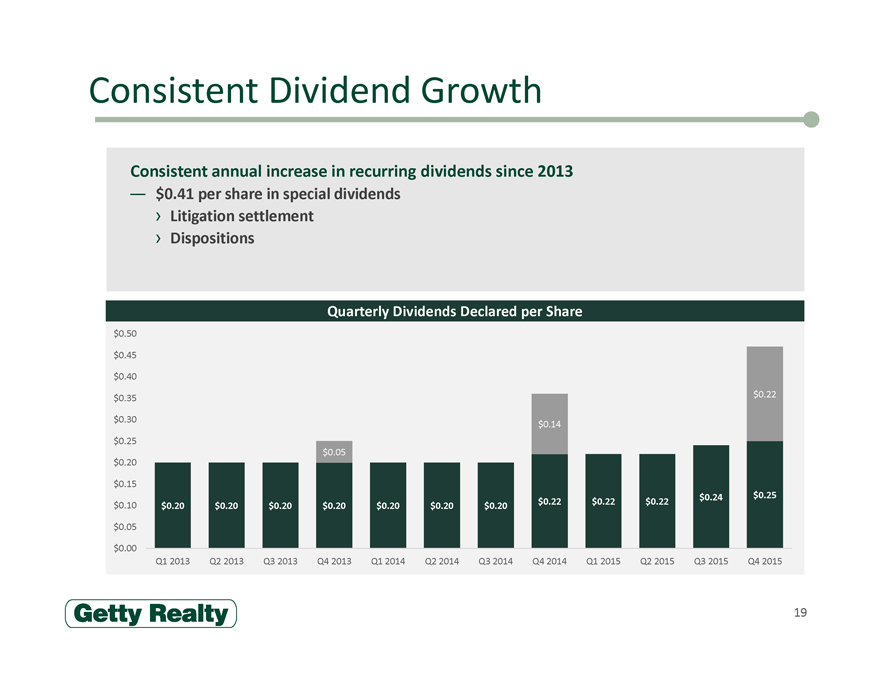
Consistent Dividend Growth
$0.41 per share in special dividends
Consistent annual increase in recurring dividends since 2013
Litigation settlement Dispositions
Quarterly Dividends Declared per Share
$0.50
$0.45
$0.40
$0.35 $ 0.22
$0.30 $ 0.14
$0.25
$ 0.05
$0.20
$0.15
$ 0.24 $ 0.25
$0.10 $ 0.20 $ 0.20 $ 0.20 $ 0.20 $ 0.20 $ 0.20 $ 0.20 $ 0.22 $ 0.22 $ 0.22
$0.05
$0.00
Q1 2013 Q2 2013 Q3 2013 Q4 2013 Q1 2014 Q2 2014 Q3 2014 Q4 2014 Q1 2015 Q2 2015 Q3 2015 Q4 2015
19
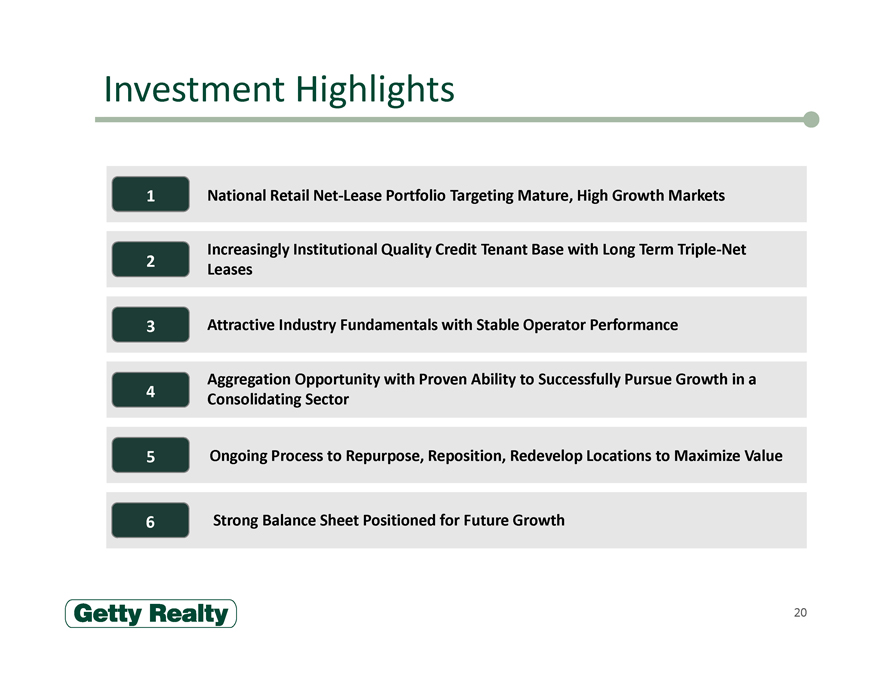
Investment Highlights
1 National Retail Net-Lease Portfolio Targeting Mature, High Growth Markets
Increasingly Institutional Quality Credit Tenant Base with Long Term Triple-Net
2 Leases
3 Attractive Industry Fundamentals with Stable Operator Performance
Aggregation Opportunity with Proven Ability to Successfully Pursue Growth in a
4 Consolidating Sector
5 Ongoing Process to Repurpose, Reposition, Redevelop Locations to Maximize Value
6 Strong Balance Sheet Positioned for Future Growth
20
Appendix
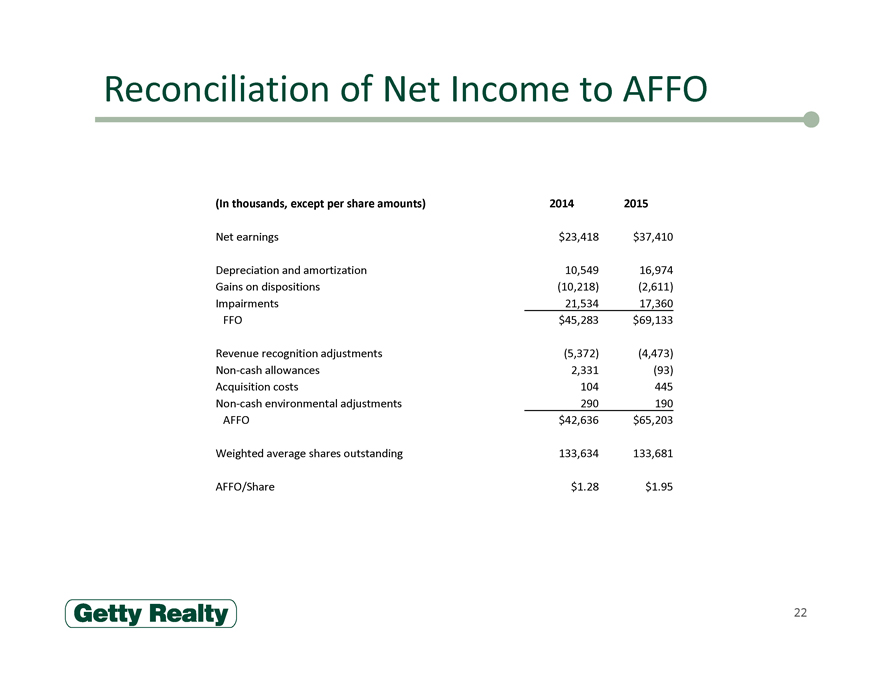
Reconciliation of Net Income to AFFO
(In thousands, except per share amounts) 2014 2015
Net earnings $23,418 $37,410
Depreciation and amortization 10,549 16,974
Gains on dispositions (10,218) (2,611)
Impairments 21,534 17,360
FFO $45,283 $69,133
Revenue recognition adjustments (5,372) (4,473)
Non-cash allowances 2,331 (93)
Acquisition costs 104 445
Non-cash environmental adjustments 290 190
AFFO $42,636 $65,203
Weighted average shares outstanding 133,634 133,681
AFFO/Share $1.28 $1.95
22