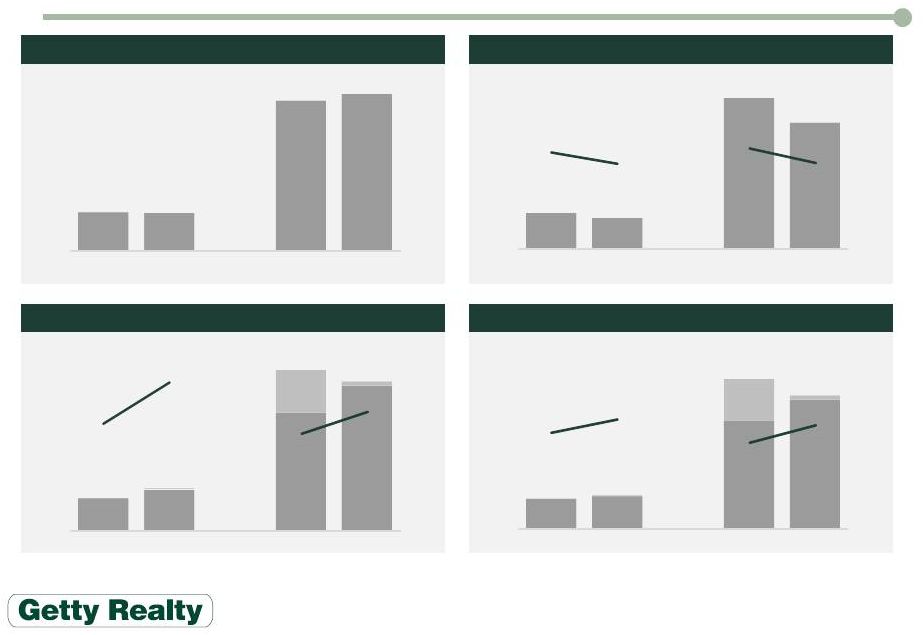
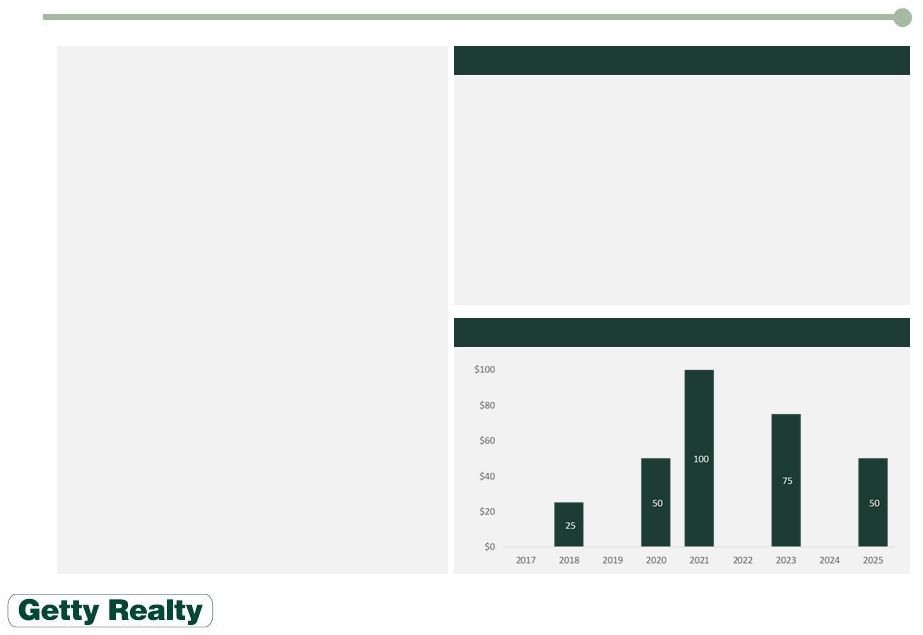
Income Growth, Scalable G&A 14 AFFO ($ thousands) (1) FFO ($ thousands) (1) 14,147 17,857 50,957 62,462 307 (3) 18,177 (2) 1,720 (3) 49.8% 64.6% 46.0% 54.2% 10.0% 20.0% 30.0% 40.0% 50.0% 60.0% 70.0% - 10,000 20,000 30,000 40,000 50,000 60,000 70,000 1Q16 1Q17 2015 2016 Margin 13,161 14,154 47,028 56,231 307 (3) 18,177 (2) 1,720 (3) 46.3% 51.2% 42.5% 48.8% 10.0% 20.0% 30.0% 40.0% 50.0% 60.0% 70.0% - 10,000 20,000 30,000 40,000 50,000 60,000 70,000 1Q16 1Q17 2015 2016 Margin 28,427 27,648 110,733 115,266 - 20,000 40,000 60,000 80,000 100,000 120,000 1Q16 1Q17 2015 2016 4,044 3,493 16,930 14,154 1.8% 1.6% 1.9% 1.6% 0.0% 0.5% 1.0% 1.5% 2.0% 2.5% 3.0% - 2,000 4,000 6,000 8,000 10,000 12,000 14,000 16,000 18,000 1Q16 1Q17 2015 2016 % of Assets G&A ($ thousands) Revenue ($ thousands) 1) AFFO and FFO are non-GAAP measures. For a description of how Getty calculates AFFO and FFO and for a reconciliation to Net Earnings, see Item 2 of our Quarterly Report on Form 10-Q for the period ended March 31, 2017. Margins exclude items detailed in footnotes 2 and 3 below 2) Includes $18.2 million of income received from the Getty Petroleum Marketing Inc. bankruptcy estate for the 12 months ended December 31, 2015 3) Includes a net $0.3 million and $1.7 million of environmental insurance reimbursements, recoveries of uncollectible accounts and other income for the three months ended March 31, 2017 and the 12 months ended December 31, 2016, respectively |