Exhibit 99.1


Essex Announces Fourth Quarter 2017 Results and 2018 Guidance
San Mateo, California—February 7, 2018—Essex Property Trust, Inc. (NYSE:ESS) announced today its fourth quarter 2017 earnings results and related business activities.
Net Income and Funds from Operations (“FFO”) per diluted share for the quarter ended December 31, 2017 are detailed below. Core FFO excludes acquisition and investment related costs and certain non-routine items.
| | | | | | | | | | | | | |
| | | Three Months Ended
December 31, | | | % | | | Year Ended
December 31, | | | % | |
| | | 2017 | | | 2016 | | | Change | | | 2017 | | | 2016 | | | Change | |
| Per Diluted Share | | | | | | | | | | | | | | | | | | |
| Net Income | | $ | 1.57 | | | $ | 2.98 | | | | -47.3 | % | | $ | 6.57 | | | $ | 6.27 | | | | 4.8 | % |
| Total FFO | | $ | 3.01 | | | $ | 2.85 | | | | 5.6 | % | | $ | 11.91 | | | $ | 11.12 | | | | 7.1 | % |
| Core FFO | | $ | 3.01 | | | $ | 2.81 | | | | 7.1 | % | | $ | 11.91 | | | $ | 11.04 | | | | 7.9 | % |
| | | | | | | | | | | | | | | | | | | | | | | | | |
Fourth Quarter and Full-Year Highlights:
| · | Reported Net Income per diluted share for the fourth quarter of 2017 of $1.57, compared to $2.98 in the fourth quarter of 2016. The decrease is primarily due to gains on sale of real estate that occurred in the fourth quarter of 2016. |
| · | Grew Core FFO per diluted share by 7.1% compared to the fourth quarter of 2016 and 7.9% for the full-year 2017. |
| · | Achieved same-property gross revenue and net operating income (“NOI”) growth of 3.0% and 3.4%, respectively, compared to the fourth quarter of 2016. For the full-year, achieved same-property gross revenue and NOI growth near the high-end of the guidance range of 3.7% and 4.2%. |
| · | Sold two communities during the fourth quarter of 2017 for a total contract price of $160.3 million. For the full-year, the Company sold four communities for a total contract price of $375.8 million. |
| · | Acquired one community during the fourth quarter of 2017 for a total contract price of $59.0 million. For the full-year, the Company acquired five communities for a total contract price of $566.8 million, near the high-end of the guidance range. |
| · | Originated $64.5 million in three preferred equity developments during the fourth quarter of 2017. For the full-year, the Company committed $167.0 million in nine preferred equity and subordinated debt investments, exceeding the original guidance range for the year. |
“Essex delivered another year of solid growth in 2017 with Core FFO growth of 7.9%, which exceeded the high-end of our initial guidance range for the year. The Essex team responded skillfully to challenging market conditions by focusing on occupancy, other income, expense management and investment transactions. Looking forward to 2018, we expect demand for housing will outpace supply in our coastal markets of California and Washington which will lead to market rent growth near long-term averages. We believe the West Coast will continue to outperform the nation in both rent growth and job growth in 2018,” commented Michael Schall, President and CEO of the Company.
1100 Park Place Suite 200 San Mateo California 94403 telephone 650 655 7800 facsimile 650 655 7810
www.essex.com
Same-Property Operations
Same-property operating results exclude any properties that are not comparable for the periods presented. The table below illustrates the percentage change in same-property gross revenues for the quarter ended December 31, 2017 compared to the quarter ended December 31, 2016, and the sequential percentage change for the quarter ended December 31, 2017 compared to the quarter ended September 30, 2017, by submarket for the Company:
| | | Q4 2017 vs. Q4 2016 | | | Q4 2017 vs. Q3 2017 | | | % of Total | |
| | | Gross Revenues | | | Gross Revenues | | | Q4 2017 Revenues | |
| Southern California | | | |
| Los Angeles County | | | 1.8 | % | | | -0.1 | % | | | 19.9 | % |
| Orange County | | | 3.8 | % | | | 0.5 | % | | | 11.6 | % |
| San Diego County | | | 3.7 | % | | | 0.3 | % | | | 9.2 | % |
| Ventura County | | | 4.4 | % | | | 0.4 | % | | | 4.5 | % |
| Other Southern California | | | 2.3 | % | | | 0.7 | % | | | 0.5 | % |
| Total Southern California | | | 2.9 | % | | | 0.2 | % | | | 45.7 | % |
| Northern California | | | |
| Santa Clara County | | | 2.0 | % | | | 0.1 | % | | | 15.7 | % |
| Alameda County | | | 4.8 | % | | | 0.1 | % | | | 7.3 | % |
| San Mateo County | | | 0.7 | % | | | -0.3 | % | | | 5.1 | % |
| Contra Costa County | | | 2.4 | % | | | 0.9 | % | | | 5.1 | % |
| San Francisco | | | 2.1 | % | | | -0.5 | % | | | 2.0 | % |
| Other Northern California | | | 6.7 | % | | | 6.6 | % | | | 0.3 | % |
| Total Northern California | | | 2.5 | % | | | 0.2 | % | | | 35.5 | % |
| Seattle Metro | | | 4.0 | % | | | 0.0 | % | | | 18.8 | % |
| Same-Property Portfolio | | | 3.0 | % | | | 0.1 | % | | | 100.0 | % |
| | | | | | | | | | | | | |
| | | Year-Over-Year Growth | | | Year-Over-Year Growth | |
| | | Q4 2017 compared to Q4 2016 | | | YTD 2017 compared to YTD 2016 | |
| | | Gross Revenues | | | Operating Expenses | | | NOI | | | Gross Revenues | | | Operating Expenses | | | NOI | |
| Southern California | | | 2.9 | % | | | 1.4 | % | | | 3.7 | % | | | 3.8 | % | | | 1.9 | % | | | 4.6 | % |
| Northern California | | | 2.5 | % | | | -0.8 | % | | | 3.8 | % | | | 2.6 | % | | | 1.5 | % | | | 3.0 | % |
| Seattle Metro | | | 4.0 | % | | | 8.7 | % | | | 1.9 | % | | | 5.8 | % | | | 6.5 | % | | | 5.5 | % |
| Same-Property Portfolio | | | 3.0 | % | | | 2.0 | % | | | 3.4 | % | | | 3.7 | % | | | 2.7 | % | | | 4.2 | % |
| | | Sequential Growth | |
| | | Q4 2017 compared to Q3 2017 | |
| | | Gross Revenues | | | Operating Expenses | | | NOI | |
| Southern California | | | 0.2 | % | | | 0.1 | % | | | 0.2 | % |
| Northern California | | | 0.2 | % | | | -2.3 | % | | | 1.1 | % |
| Seattle Metro | | | 0.0 | % | | | 0.1 | % | | | 0.0 | % |
| Same-Property Portfolio | | | 0.1 | % | | | -0.7 | % | | | 0.5 | % |
| | | Financial Occupancies | |
| | | Quarter Ended | |
| | | 12/31/2017 | | | 9/30/2017 | | | 12/31/2016 | |
| Southern California | | | 96.9 | % | | | 96.8 | % | | | 96.7 | % |
| Northern California | | | 96.9 | % | | | 96.9 | % | | | 96.5 | % |
| Seattle Metro | | | 96.4 | % | | | 96.2 | % | | | 96.7 | % |
| Same-Property Portfolio | | | 96.8 | % | | | 96.7 | % | | | 96.6 | % |
Investment Activity
In October 2017, the Wesco I, LLC (“Wesco I”) joint venture operating agreement was amended to extend the venture. As part of the amendment, the Company and joint venture partner agreed that the Company earned a promote interest of $38.0 million. The Company agreed to contribute the earned promote interest to the joint venture, resulting in an increase in the Company’s ownership interest in Wesco I to approximately 58%. The promote income has been excluded from Net Income, Total FFO and Core FFO.
During the fourth quarter of 2017, the Company formed a new joint venture entity, BEX III, LLC (“BEX III”), in which the Company has a 50% ownership interest. In November 2017, BEX III acquired The Village at Toluca Lake for a total contract price of $59.0 million. The community contains 145 apartment homes in Burbank, CA. The Village at Toluca Lake offers convenient access to employment opportunities in Burbank, Studio City, Glendale, and Hollywood.
Dispositions
In December 2017, the Company sold two communities, which were owned by BEXAEW, LLC, in which the Company has a 50% interest. The communities contained 587 apartment homes in Seattle, WA. The total contract price of the sales was $160.3 million. The Company’s share of the total gain on the sale was $34.8 million, which has been excluded from the calculation of Total FFO and Core FFO.
Other Investments
During the fourth quarter of 2017, the Company originated $64.5 million in three preferred equity investments in multifamily developments located in Los Angeles, CA, San Diego, CA, and Bellevue, WA. The total investment has an average preferred return of 11.1% and all of the investments mature in 2021.
Development Activity
During the fourth quarter of 2017, the Company began construction on a new development in Hollywood, CA. The project is estimated to have 200 apartment homes and up to 4,700 square feet of ground-floor retail space. The community is centrally located in the heart of Hollywood and less than a quarter mile from the Hollywood/Vine Metro Station, which provides convenient access to Downtown Los Angeles. The development is expected to cost approximately $105.0 million and open in the first quarter of 2020.
The following table represents the development community in lease-up and the current leasing status as of February 2, 2018.
| Project Name | Location | Total Apartment Homes | ESS Ownership | % Pre-Leased as of 2/2/18 | Status |
| Station Park Green – Phase I | San Mateo, CA | 121 | 100% | 4.2% | Pre-Leasing |
Liquidity and Balance Sheet
Common Stock
During the fourth quarter of 2017, the Company issued 33,571 shares of common stock through its equity distribution program at an average price per share of $261.19 for net proceeds of $8.7 million. For the full-year 2017, the Company issued 345,444 shares of common stock at an average price per share of $260.38 for net proceeds of $89.1 million. Subsequent to year-end through February 2, 2018, the Company did not issue any common stock through its equity distribution program.
Balance Sheet
During the fourth quarter of 2017, the Company prepaid $91.9 million of secured mortgages with an effective interest rate of 5.7%. The Company incurred approximately $1.8 million of prepayment penalties and related costs, which are excluded from the calculation of Core FFO.
In January 2018, the Company amended its unsecured line of credit facility, increasing the maximum amount available for borrowing from $1.0 billion to $1.2 billion and extending the maturity to December 2021.
As of February 2, 2018, the Company had approximately $891.0 million in undrawn capacity on its unsecured credit facilities.
2018 Full-Year Guidance and Assumptions
| Per Diluted Share | | Range |
| Net Income | | $4.42 - $4.81 |
| Total FFO | | $12.23 - $12.62 |
| Core FFO | | $12.24 - $12.64 |
| | | |
| U.S. Economic Assumptions | | |
| GDP Growth | | 2.7% |
| Job Growth | | 1.4% |
| | | |
| ESS Markets Economic Assumptions | | |
| Job Growth | | 1.6% |
| Market Rent Growth | | 3.0% |
| |
| Estimated Same-Property Portfolio Growth based on 47,242 Apartment Homes | | |
| Southern California | | 1.9% to 2.9% |
| Northern California | | 2.0% to 3.0% |
| Seattle | | 2.4% to 3.4% |
| | | |
| Gross Revenue | | 2.0% to 3.0% |
| Operating Expense | | 2.1% to 3.1% |
| Net Operating Income | | 1.6% to 3.4% |
Other Key Assumptions
| · | Acquisitions of $400-$525 million to be financed with proceeds from a combination of dispositions, joint venture capital, or common stock, depending on cost of capital. |
| · | Dispositions of $550-$750 million, subject to cost of capital. |
| · | Preferred equity investments of $100 million. |
| · | Total development spending in 2018 for existing projects under construction is expected to be $250 million at the Company’s pro rata share. The Company does not currently plan to start any new developments during 2018. |
| · | Revenue generating capital expenditures are expected to be $83 million at the Company’s pro rata share. |
For additional details regarding the 2018 assumptions, please see page S-14 of the accompanying supplemental financial information. For the first quarter of 2018, the Company has established a range of Core FFO per diluted share of $2.99 to $3.09.
Conference Call with Management
The Company will host an earnings conference call with management to discuss its quarterly results on Thursday, February 8, 2018 at 9 a.m. PT (12 p.m. ET), which will be broadcast live via the Internet at www.essex.com, and accessible via phone by dialing toll-free, (877) 407-0784, or toll/international, (201) 689-8560. No passcode is necessary.
A rebroadcast of the call will be available online for 30 days and digitally for 7 days. To access the replay online, go to www.essex.com and select the fourth quarter 2017 earnings link. To access the replay digitally, dial (844) 512-2921 using the replay pin number 13675031. If you are unable to access the information via the Company’s website, please contact the Investor Relations Department at investors@essex.com or by calling (650) 655-7800.
Corporate Profile
Essex Property Trust, Inc., an S&P 500 company, is a fully integrated real estate investment trust (REIT) that acquires, develops, redevelops, and manages multifamily residential properties in selected West Coast markets. Essex currently has ownership interests in 247 apartment communities with an additional 7 properties in various stages of active development. Additional information about Essex can be found on the Company’s website at www.essex.com.
This press release and accompanying supplemental financial information will be furnished to the Securities and Exchange Commission electronically on Form 8-K and can be accessed from the Company’s website at www.essex.com. If you are unable to obtain the information via the Web, please contact the Investor Relations Department at (650) 655-7800.
Funds from Operations (“FFO”) Reconciliation
FFO, as defined by the National Association of Real Estate Investment Trusts (“NAREIT”), is generally considered by industry analysts as an appropriate measure of performance of an equity REIT. Generally, FFO adjusts the net income of equity REITs for non-cash charges such as depreciation and amortization of rental properties, impairment charges, gains on sales of real estate and extraordinary items. Management considers FFO and FFO which excludes merger, integration and acquisition costs and items that are not routine or not related to the Company’s core business activities, which is referred to as “Core FFO”, to be useful financial performance measures of an equity REIT because, together with net income and cash flows, FFO and Core FFO provide investors with additional bases to evaluate the operating performance and ability of a REIT to incur and service debt and to fund acquisitions and other capital expenditures and the ability to pay dividends.
FFO and Core FFO do not represent net income or cash flows from operations as defined by U.S. generally accepted accounting principles (“GAAP”) and are not intended to indicate whether cash flows will be sufficient to fund cash needs. These measures should not be considered as an alternative to net income as an indicator of the REIT’s operating performance or to cash flows as a measure of liquidity. FFO and Core FFO do not measure whether cash flow is sufficient to fund all cash needs including principal amortization, capital improvements and distributions to stockholders. FFO and Core FFO also do not represent cash flows generated from operating, investing or financing activities as defined under GAAP. Management has consistently applied the NAREIT definition of FFO to all periods presented. However, there is judgment involved and other REITs’ calculation of FFO may vary from the NAREIT definition for this measure, and thus their disclosures of FFO may not be comparable to the Company’s calculation.
The following table sets forth the Company’s calculation of diluted FFO and Core FFO for the three months and year ended December 31, 2017 and 2016 (in thousands, except for share and per share amounts):
| | | Three Months Ended December 31, | | | Year Ended December 31, | |
| Funds from Operations attributable to common stockholders and unitholders | | 2017 | | | 2016 | | | 2017 | | | 2016 | |
| Net income available to common stockholders | | $ | 103,613 | | | $ | 195,569 | | | $ | 433,059 | | | $ | 411,124 | |
| Adjustments: | | | | | | | | | | | | | | | | |
| Depreciation and amortization | | | 117,988 | | | | 111,835 | | | | 468,881 | | | | 441,682 | |
| Gains not included in FFO | | | (34,779 | ) | | | (134,303 | ) | | | (159,901 | ) | | | (167,607 | ) |
| Deferred tax expense on gain on sale of real estate and land – Taxable REIT Subsidiary activity | | | - | | | | 131 | | | | - | | | | 4,410 | |
| Depreciation and amortization add back from unconsolidated co-investments | | | 15,196 | | | | 13,619 | | | | 55,531 | | | | 50,956 | |
| Noncontrolling interest related to Operating Partnership units | | | 3,536 | | | | 6,632 | | | | 14,825 | | | | 14,089 | |
| Depreciation attributable to third party ownership and other | | | (212 | ) | | | (6 | ) | | | (286 | ) | | | (9 | ) |
| Funds from Operations attributable to common stockholders and unitholders | | $ | 205,342 | | | $ | 193,477 | | | $ | 812,109 | | | $ | 754,645 | |
| FFO per share – diluted | | $ | 3.01 | | | $ | 2.85 | | | $ | 11.91 | | | $ | 11.12 | |
| Acquisition and investment related costs | | $ | 415 | | | $ | 462 | | | $ | 1,569 | | | $ | 1,841 | |
| Gain on sale of marketable securities and other investments | | | (259 | ) | | | (2,843 | ) | | | (1,909 | ) | | | (5,719 | ) |
Interest rate hedge ineffectiveness (1) | | | (59 | ) | | | (250 | ) | | | (78 | ) | | | (250 | ) |
| Loss on early retirement of debt | | | 1,796 | | | | 395 | | | | 1,796 | | | | 606 | |
| Income from early redemption of preferred equity investments | | | (100 | ) | | | - | | | | (356 | ) | | | - | |
| Excess of redemption value of preferred stock over the carrying value | | | - | | | | - | | | | - | | | | 2,541 | |
| Insurance reimbursements, legal settlements and other, net | | | (1,418 | ) | | | (429 | ) | | | (1,108 | ) | | | (4,470 | ) |
| Core Funds from Operations attributable to common stockholders and unitholders | | $ | 205,717 | | | $ | 190,812 | | | $ | 812,023 | | | $ | 749,194 | |
| Core FFO per share – diluted | | $ | 3.01 | | | $ | 2.81 | | | $ | 11.91 | | | $ | 11.04 | |
Weighted average number of shares outstanding diluted (2) | | | 68,321,214 | | | | 67,915,332 | | | | 68,194,472 | | | | 67,889,505 | |
| (1) | Interest rate swaps are generally adjusted to fair value through other comprehensive income (loss). However, because certain of our interest rate swaps do not have a 0% LIBOR floor, while related hedged debt in these cases is subject to a 0% LIBOR floor, the portion of the change in fair value of these interest rate swaps attributable to this mismatch is recorded as noncash interest rate hedge ineffectiveness through interest expense. |
| (2) | Assumes conversion of all outstanding limited partnership units in Essex Portfolio, L.P. (the “Operating Partnership”) into shares of the Company’s common stock and excludes all DownREIT limited partnership units for which the Operating Partnership has the ability and intention to redeem the units for cash and does not consider them to be common stock equivalents. |
Net Operating Income (“NOI”) and Same-Property NOI Reconciliations
Net Operating Income (“NOI”) and Same-Property NOI are considered by management to be important supplemental performance measures to earnings from operations included in the Company’s condensed consolidated statements of income. The presentation of same-property NOI assists with the presentation of the Company’s operations prior to the allocation of depreciation and any corporate-level or financing-related costs. NOI reflects the operating performance of a community and allows for an easy comparison of the operating performance of individual communities or groups of communities. In addition, because prospective buyers of real estate have different financing and overhead structures, with varying marginal impacts to overhead by acquiring real estate, NOI is considered by many in the real estate industry to be a useful measure for determining the value of a real estate asset or group of assets. The Company defines same-property NOI as same-property revenue less same-property operating expenses, including property taxes. Please see the reconciliation of earnings from operations to NOI and same-property NOI, which in the table below is the NOI for stabilized properties consolidated by the Company for the periods presented (dollars in thousands):
| | | Three Months Ended December 31, | | | Year Ended December 31, | |
| | | 2017 | | | 2016 | | | 2017 | | | 2016 | |
| Earnings from operations | | $ | 112,375 | | | $ | 105,520 | | | $ | 446,522 | | | $ | 420,800 | |
| Adjustments: | | | | | | | | | | | | | | | | |
| Depreciation and amortization | | | 117,988 | | | | 111,835 | | | | 468,881 | | | | 441,682 | |
| Management and other fees from affiliates | | | (2,647 | ) | | | (2,133 | ) | | | (9,574 | ) | | | (8,278 | ) |
| General and administrative | | | 10,659 | | | | 12,224 | | | | 41,385 | | | | 40,751 | |
| Acquisition and investment related costs | | | 415 | | | | 462 | | | | 1,569 | | | | 1,841 | |
| NOI | | | 238,790 | | | | 227,908 | | | | 948,783 | | | | 896,796 | |
| Less: Non-same property NOI | | | (22,414 | ) | | | (18,622 | ) | | | (91,096 | ) | | | (73,549 | ) |
| Same-Property NOI | | $ | 216,376 | | | $ | 209,286 | | | $ | 857,687 | | | $ | 823,247 | |
Safe Harbor Statement Under The Private Litigation Reform Act of 1995:
This press release includes “forward-looking statements” within the meaning of Section 27A of the Securities Act of 1933, as amended, and Section 21E of the Securities Exchange Act of 1934, as amended. Forward-looking statements are statements which are not historical facts, including statements regarding the Company’s expectations, estimates, assumptions, hopes, intentions, beliefs and strategies regarding the future. Words such as “expects,” “anticipates,” “intends,” “plans,” “believes,” “seeks,” “estimates,” and variations of such words and similar expressions are intended to identify such forward-looking statements. In this press release and related materials, forward-looking statements include, among other things, statements relating to the Company’s financial guidance for the first quarter and full-year 2018, including guidance relating to same-property portfolio growth, funds from operations, gross revenues, operating expenses, and net operating income; estimated costs of property development and redevelopment, the anticipated timing of completion of current development and redevelopment projects and the stabilization of such projects; financial projections and assumptions; financing and investment activities; forecasts of residential supply, jobs, and rent growth in various areas; and other information that is not historical information. The Company’s actual results may differ materially from those projected in such forward-looking statements. Factors that might cause such a difference include, but are not limited to, the failure of the Company to achieve its business objectives, changes in market demand for rental units and the impact of competition and competitive pricing, unforeseen consequences from cyber-intrusion, changes in economic conditions, unexpected delays or cost increases in the development and stabilization of development projects, unexpected difficulties in leasing of development projects, total costs of development investments exceeding the Company’s projections, and other risks detailed in the Company’s filings with the Securities and Exchange Commission (SEC). All forward-looking statements are made as of the date hereof, and the Company assumes no obligation to update or supplement this information for any reason. For more details relating to risks and uncertainties that could cause actual results to differ materially from those anticipated in our forward-looking statements, and risks relating to our business in general, please refer to our most recent Annual Report on Form 10-K, Quarterly Reports on Form 10-Q and other filings with the SEC.
Definitions and Reconciliations
Non-GAAP financial measures and certain other capitalized terms, as used in this earnings release, are defined and further explained on pages S-17.1 through S-17.4, “Reconciliations of Non-GAAP Financial Measures and Other Terms,” of the accompanying supplemental financial information. The supplemental financial information is available on the Company’s website at www.essex.com.
Contact Information
Barb Pak
Group Vice President of Finance & Investor Relations
(650) 655-7800
bpak@essex.com
Q4 2017 Supplemental
Table of Contents
| | Page(s) |
| Consolidated Operating Results | S-1 – S-2 |
| Consolidated Funds From Operations | S-3 |
| Consolidated Balance Sheets | S-4 |
| Debt Summary – December 31, 2017 | S-5 |
| Capitalization Data, Public Bond Covenants, Credit Ratings, and Selected Credit Ratios – December 31, 2017 | S-6 |
| Portfolio Summary by County – December 31, 2017 | S-7 |
| Operating Income by Quarter – December 31, 2017 | S-8 |
| Same-Property Revenue Results by County – Quarters ended December 31, 2017 and 2016, and September 30, 2017 | S-9 |
| Same-Property Revenue Results by County – Years ended December 31, 2017 and 2016 | S-9.1 |
| Same-Property Operating Expenses | S-10 |
| Development Pipeline – December 31, 2017 | S-11 |
| Redevelopment Pipeline – December 31, 2017 | S-12 |
| Capital Expenditures – December 31, 2017 | S-12.1 |
| Co-Investments – December 31, 2017 | S-13 |
| Assumptions for 2018 FFO Guidance Range | S-14 |
| Reconciliation of Projected EPS, FFO and Core FFO per diluted share | S-14.1 |
| Summary of Apartment Community Acquisitions and Dispositions Activity | S-15 |
| 2018 MSA Level Forecast: Supply, Jobs and Apartment Market Conditions | S-16 |
| Relative Job Growth Rankings – Essex West Coast Metro Performance vs. U.S. Median | S-16.1 |
| Reconciliations of Non-GAAP Financial Measures and Other Terms | S-17.1 – S-17.4 |
E S S E X P R O P E R T Y T R U S T, I N C.
Consolidated Operating Results
(Dollars in thousands, except share and per share amounts)
| | Three Months Ended | | | Twelve Months Ended | |
| | December 31, | | | December 31, | |
| | | 2017 | | | 2016 | | | 2017 | | | 2016 | |
| Revenues: | | | | | | | | | | | | |
| Rental and other property | | $ | 342,417 | | | $ | 326,905 | | | $ | 1,354,325 | | | $ | 1,285,723 | |
| Management and other fees from affiliates | | | 2,647 | | | | 2,133 | | | | 9,574 | | | | 8,278 | |
| | | | 345,064 | | | | 329,038 | | | | 1,363,899 | | | | 1,294,001 | |
| | | | | | | | | | | | | | | | | |
| Expenses: | | | | | | | | | | | | | | | | |
| Property operating | | | 103,627 | | | | 98,997 | | | | 405,542 | | | | 388,927 | |
| Depreciation and amortization | | | 117,988 | | | | 111,835 | | | | 468,881 | | | | 441,682 | |
| General and administrative | | | 10,659 | | | | 12,224 | | | | 41,385 | | | | 40,751 | |
| Acquisition and investment related costs | | | 415 | | | | 462 | | | | 1,569 | | | | 1,841 | |
| | | | 232,689 | | | | 223,518 | | | | 917,377 | | | | 873,201 | |
| Earnings from operations | | | 112,375 | | | | 105,520 | | | | 446,522 | | | | 420,800 | |
| | | | | | | | | | | | | | | | | |
Interest expense, net (1) | | | (53,116 | ) | | | (52,291 | ) | | | (212,796 | ) | | | (207,938 | ) |
| Interest and other income | | | 6,688 | | | | 7,745 | | | | 24,604 | | | | 27,305 | |
| Equity income from co-investments | | | 45,511 | | | | 9,766 | | | | 86,445 | | | | 48,698 | |
| Loss on early retirement of debt | | | (1,796 | ) | | | (395 | ) | | | (1,796 | ) | | | (606 | ) |
| Gain on sale of real estate and land | | | - | | | | 134,303 | | | | 26,423 | | | | 154,561 | |
| Deferred tax expense on gain on sale of real estate and land | | | - | | | | (131 | ) | | | - | | | | (4,410 | ) |
| Gain on remeasurement of co-investment | | | - | | | | - | | | | 88,641 | | | | - | |
| Net income | | | 109,662 | | | | 204,517 | | | | 458,043 | | | | 438,410 | |
| Net income attributable to noncontrolling interest | | | (6,049 | ) | | | (8,948 | ) | | | (24,984 | ) | | | (23,431 | ) |
| Net income attributable to controlling interest | | | 103,613 | | | | 195,569 | | | | 433,059 | | | | 414,979 | |
| Dividends to preferred stockholders | | | - | | | | - | | | | - | | | | (1,314 | ) |
| Excess of redemption value of preferred stock over the carrying value | | | - | | | | - | | | | - | | | | (2,541 | ) |
| Net income available to common stockholders | | $ | 103,613 | | | $ | 195,569 | | | $ | 433,059 | | | $ | 411,124 | |
| | | | | | | | | | | | | | | | | |
| Net income per share - basic | | $ | 1.57 | | | $ | 2.98 | | | $ | 6.58 | | | $ | 6.28 | |
| | | | | | | | | | | | | | | | | |
| Shares used in income per share - basic | | | 66,035,998 | | | | 65,520,788 | | | | 65,829,155 | | | | 65,471,540 | |
| | | | | | | | | | | | | | | | | |
| Net income per share - diluted | | $ | 1.57 | | | $ | 2.98 | | | $ | 6.57 | | | $ | 6.27 | |
| | | | | | | | | | | | | | | | | |
| Shares used in income per share - diluted | | | 66,103,882 | | | | 65,829,180 | | | | 65,898,255 | | | | 65,587,816 | |
(1) | Refer to page S-17.2, the section titled “Interest Expense, Net” for additional information. |
E S S E X P R O P E R T Y T R U S T, I N C.
Consolidated Operating Results
Selected Line Item Detail
| | Three Months Ended | | | Twelve Months Ended | |
| | December 31, | | | December 31, | |
| | 2017 | | | 2016 | | | 2017 | | | 2016 | |
| | | | | | | | | | | | | |
| Rental and other property | | | | | | | | | | | | |
| Rental | | $ | 319,500 | | | $ | 305,220 | | | $ | 1,263,476 | | | $ | 1,201,995 | |
| Other property | | | 22,917 | | | | 21,685 | | | | 90,849 | | | | 83,728 | |
| Rental and other property | | $ | 342,417 | | | $ | 326,905 | | | $ | 1,354,325 | | | $ | 1,285,723 | |
| | | | | | | | | | | | | | | | | |
| Property operating expenses | | | | | | | | | | | | | | | | |
| Real estate taxes | | $ | 38,027 | | | $ | 34,622 | | | $ | 146,310 | | | $ | 139,162 | |
| Administrative and insurance | | | 21,007 | | | | 19,954 | | | | 82,941 | | | | 78,887 | |
| Maintenance and repairs | | | 19,375 | | | | 20,385 | | | | 76,869 | | | | 76,258 | |
| Utilities | | | 17,766 | | | | 16,518 | | | | 69,266 | | | | 64,354 | |
| Property management | | | 7,452 | | | | 7,518 | | | | 30,156 | | | | 30,266 | |
| Property operating expenses | | $ | 103,627 | | | $ | 98,997 | | | $ | 405,542 | | | $ | 388,927 | |
| | | | | | | | | | | | | | | | | |
| | | | | | | | | | | | | | | | | |
| Interest and other income | | | | | | | | | | | | | | | | |
| Marketable securities and other interest income | | $ | 6,175 | | | $ | 4,353 | | | $ | 21,603 | | | $ | 16,996 | |
| Gain on sale of marketable securities and other investments | | | 259 | | | | 2,843 | | | | 1,909 | | | | 5,719 | |
| Insurance reimbursements, legal settlements, and other | | | 254 | | | | 549 | | | | 1,092 | | | | 4,590 | |
| Interest and other income | | $ | 6,688 | | | $ | 7,745 | | | $ | 24,604 | | | $ | 27,305 | |
| | | | | | | | | | | | | | | | | |
| Equity income from co-investments | | | | | | | | | | | | | | | | |
| Equity income from co-investments | | $ | 3,998 | | | $ | 4,458 | | | $ | 17,334 | | | $ | 19,269 | |
| Income from preferred equity investments | | | 6,634 | | | | 5,308 | | | | 23,918 | | | | 16,383 | |
| Gain on sale of co-investment communities | | | 34,779 | | | | - | | | | 44,837 | | | | 13,046 | |
| Income from early redemption of preferred equity investments | | | 100 | | | | - | | | | 356 | | | | - | |
| Equity income from co-investments | | $ | 45,511 | | | $ | 9,766 | | | $ | 86,445 | | | $ | 48,698 | |
| | | | | | | | | | | | | | | | | |
| Noncontrolling interest | | | | | | | | | | | | | | | | |
| Limited partners of Essex Portfolio, L.P. | | $ | 3,536 | | | $ | 6,632 | | | $ | 14,825 | | | $ | 14,089 | |
| DownREIT limited partners’ distributions | | | 1,496 | | | | 1,423 | | | | 6,433 | | | | 5,705 | |
| Third-party ownership interest | | | 1,017 | | | | 893 | | | | 3,726 | | | | 3,637 | |
| Noncontrolling interest | | $ | 6,049 | | | $ | 8,948 | | | $ | 24,984 | | | $ | 23,431 | |
E S S E X P R O P E R T Y T R U S T, I N C.
Consolidated Funds From Operations (1)
(Dollars in thousands, except share and per share amounts and in footnotes)
| | Three Months Ended | | | | | | Twelve Months Ended | | | | |
| | December 31, | | | | | | December 31, | | | | |
| | | 2017 | | | 2016 | | | % Change | | | 2017 | | | 2016 | | | % Change | |
| | | | | | | | | | | | | | | | | | | |
| Funds from operations attributable to common stockholders and unitholders (FFO) | | | | | | | | | | | | | | | | | | |
| Net income available to common stockholders | | $ | 103,613 | | | $ | 195,569 | | | | | | $ | 433,059 | | | $ | 411,124 | | | | |
| Adjustments: | | | | | | | | | | | | | | | | | | | | | | |
| Depreciation and amortization | | | 117,988 | | | | 111,835 | | | | | | | 468,881 | | | | 441,682 | | | | |
| Gains not included in FFO | | | (34,779 | ) | | | (134,303 | ) | | | | | | (159,901 | ) | | | (167,607 | ) | | | |
| Deferred tax expense on gain on sale of real estate and land - Taxable REIT Subsidiary activity | | | - | | | | 131 | | | | | | | - | | | | 4,410 | | | | |
| Depreciation and amortization add back from unconsolidated co-investments | | | 15,196 | | | | 13,619 | | | | | | | 55,531 | | | | 50,956 | | | | |
| Noncontrolling interest related to Operating Partnership units | | | 3,536 | | | | 6,632 | | | | | | | 14,825 | | | | 14,089 | | | | |
Depreciation attributable to third party ownership and other (2) | | | (212 | ) | | | (6 | ) | | | | | | (286 | ) | | | (9 | ) | | | |
| Funds from operations attributable to common stockholders and unitholders | | $ | 205,342 | | | $ | 193,477 | | | | | | $ | 812,109 | | | $ | 754,645 | | | | |
| FFO per share-diluted | | $ | 3.01 | | | $ | 2.85 | | | 5.6% | | | $ | 11.91 | | | $ | 11.12 | | | 7.1% | |
| | | | | | | | | | | | | | | | | | | | | | | | | |
| Components of the change in FFO | | | | | | | | | | | | | | | | | | | | | | | | |
| Non-core items: | | | | | | | | | | | | | | | | | | | | | | | | |
| Acquisition and investment related costs | | $ | 415 | | | $ | 462 | | | | | | | $ | 1,569 | | | $ | 1,841 | | | | | |
| Gain on sale of marketable securities and other investments | | | (259 | ) | | | (2,843 | ) | | | | | | | (1,909 | ) | | | (5,719 | ) | | | | |
Interest rate hedge ineffectiveness (3) | | | (59 | ) | | | (250 | ) | | | | | | | (78 | ) | | | (250 | ) | | | | |
| Loss on early retirement of debt | | | 1,796 | | | | 395 | | | | | | | | 1,796 | | | | 606 | | | | | |
| Income from early redemption of preferred equity investments | | | (100 | ) | | | - | | | | | | | | (356 | ) | | | - | | | | | |
| Excess of redemption value of preferred stock over the carrying value | | | - | | | | - | | | | | | | | - | | | | 2,541 | | | | | |
| Insurance reimbursements, legal settlements and other, net | | | (1,418 | ) | | | (429 | ) | | | | | | | (1,108 | ) | | | (4,470 | ) | | | | |
| Core funds from operations attributable to common stockholders and unitholders | | $ | 205,717 | | | $ | 190,812 | | | | | | | $ | 812,023 | | | $ | 749,194 | | | | | |
| Core FFO per share-diluted | | $ | 3.01 | | | $ | 2.81 | | | 7.1% | | | $ | 11.91 | | | $ | 11.04 | | | 7.9% | |
| | | | | | | | | | | | | | | | | | | | | | | | | |
| Changes in core items: | | | | | | | | | | | | | | | | | | | | | | | | |
| Same-property NOI | | $ | 7,090 | | | | | | | | | | | $ | 34,440 | | | | | | | | | |
| Non-same property NOI | | | 3,792 | | | | | | | | | | | | 17,547 | | | | | | | | | |
| Management and other fees, net | | | 514 | | | | | | | | | | | | 1,296 | | | | | | | | | |
| FFO from co-investments | | | 2,634 | | | | | | | | | | | | 10,366 | | | | | | | | | |
| Interest and other income | | | 1,956 | | | | | | | | | | | | 5,889 | | | | | | | | | |
| Interest expense | | | (1,016 | ) | | | | | | | | | | | (5,030 | ) | | | | | | | | |
| General and administrative | | | (44 | ) | | | | | | | | | | | (2,243 | ) | | | | | | | | |
| Other items, net | | | (21 | ) | | | | | | | | | | | 564 | | | | | | | | | |
| | | $ | 14,905 | | | | | | | | | | | $ | 62,829 | | | | | | | | | |
| | | | | | | | | | | | | | | | | | | | | | | | | |
Weighted average number of shares outstanding diluted (4) | | | 68,321,214 | | | | 67,915,332 | | | | | | | | 68,194,472 | | | | 67,889,505 | | | | | |
(1) | Refer to page S-17.1, the section titled “Funds from Operations (“FFO”) for additional information on the Company’s definition and use of FFO and Core FFO. |
(2) | The Company consolidates certain co-investments. The noncontrolling interest’s share of net operating income in these investments for the three and twelve months ended December 31, 2017 was $1.1 million and $4.7 million, respectively. |
(3) | Interest rate swaps are generally adjusted to fair value through other comprehensive income (loss). However, because certain of our interest rate swaps do not have a 0% LIBOR floor, while related hedged debt in these cases is subject to a 0% LIBOR floor, the portion of the change in fair value of these interest rate swaps attributable to this mismatch, if any, is recorded as noncash interest rate hedge ineffectiveness through interest expense. |
(4) | Assumes conversion of all outstanding limited partnership units in the Operating Partnership into shares of the Company’s common stock and excludes all DownREIT limited partnership units for which the Operating Partnership has the ability and intention to redeem the units for cash and does not consider them to be common stock equivalents. |
E S S E X P R O P E R T Y T R U S T, I N C.
Consolidated Balance Sheets
(Dollars in thousands)
| | | December 31, 2017 | | | December 31, 2016 | |
| | | | | | | |
| Real Estate: | | | | | | |
| Land and land improvements | | $ | 2,719,064 | | | $ | 2,559,743 | |
| Buildings and improvements | | | 10,629,767 | | | | 10,116,563 | |
| | | | 13,348,831 | | | | 12,676,306 | |
| Less: accumulated depreciation | | | (2,769,297 | ) | | | (2,311,546 | ) |
| | | | 10,579,534 | | | | 10,364,760 | |
| Real estate under development | | | 355,735 | | | | 190,505 | |
| Co-investments | | | 1,155,984 | | | | 1,161,275 | |
| Real estate held for sale, net | | | - | | | | 101,957 | |
| | | | 12,091,253 | | | | 11,818,497 | |
| Cash and cash equivalents, including restricted cash | | | 61,126 | | | | 170,302 | |
| Marketable securities | | | 190,004 | | | | 139,189 | |
| Notes and other receivables | | | 100,926 | | | | 40,970 | |
| Prepaid expenses and other assets | | | 52,397 | | | | 48,450 | |
| Total assets | | $ | 12,495,706 | | | $ | 12,217,408 | |
| | | | | | | | | |
| Unsecured debt, net | | $ | 3,501,709 | | | $ | 3,246,779 | |
| Mortgage notes payable, net | | | 2,008,417 | | | | 2,191,481 | |
| Lines of credit | | | 179,000 | | | | 125,000 | |
| Distributions in excess of investments in co-investments | | | 36,726 | | | | - | |
| Other liabilities | | | 333,823 | | | | 317,227 | |
| Total liabilities | | | 6,059,675 | | | | 5,880,487 | |
| Redeemable noncontrolling interest | | | 39,206 | | | | 44,684 | |
| Equity: | | | | | | | | |
| Common stock | | | 7 | | | | 6 | |
| Additional paid-in capital | | | 7,129,571 | | | | 7,029,679 | |
| Distributions in excess of accumulated earnings | | | (833,726 | ) | | | (805,409 | ) |
| Accumulated other comprehensive loss, net | | | (18,446 | ) | | | (32,098 | ) |
| Total stockholders’ equity | | | 6,277,406 | | | | 6,192,178 | |
| Noncontrolling interest | | | 119,419 | | | | 100,059 | |
| Total equity | | | 6,396,825 | | | | 6,292,237 | |
| Total liabilities and equity | | $ | 12,495,706 | | | $ | 12,217,408 | |
E S S E X P R O P E R T Y T R U S T, I N C.
Deby Summary - December 31, 2017
(Dollars in thousands, except in footnotes)
| | | | | | | | | | | | | | | | | | | | | | | | | | |
| | | | | | | | | | | | | Scheduled principal payments, unamortized premiums (discounts) and (debt issuance costs) are as follows - excludes lines of credit: |
| | | | | | | | | | | | | | | | | | | | | | | | | |
| | | | | | | | Weighted Average | | | | | | | | | | | | | | Weighted Average Interest Rate | | Percentage of Total Debt |
| | | | | Balance Outstanding | | Interest Rate | Maturity in Years | | | | | Unsecured | | Secured | | | Total | | |
| Unsecured Debt, net | | | | | | | | | | | | | | | | | | | | | | | |
| | Bonds private - fixed rate | | $ | 275,000 | | 4.5% | | 3.1 | | | 2018 | | $ | - | | $ | 202,131 | | $ | 202,131 | | 5.3% | | 3.7% |
| | Bonds public - fixed rate | | | 2,900,000 | | 3.7% | | 6.4 | | | 2019 | | | 75,000 | | | 560,389 | | | 635,389 | | 4.1% | | 11.5% |
| | Term loan (1) | | | 350,000 | | 2.5% | | 4.1 | | | 2020 | | | - | | | 694,921 | | | 694,921 | | 4.8% | | 12.6% |
| | Unamortized net discounts and debt issuance costs | | | (23,291) | | - | | - | | | 2021 | | | 500,000 | | | 44,846 | | | 544,846 | | 4.3% | | 9.9% |
| | | | | | 3,501,709 | | 3.6% | | 6.0 | | | 2022 | | | 650,000 | | | 42,466 | | | 692,466 | | 3.1% | | 12.6% |
| Mortgage Notes Payable, net | | | | | | | | | | 2023 | | | 600,000 | | | 2,188 | | | 602,188 | | 3.6% | | 10.9% |
| | Fixed rate - secured | | | 1,710,349 | | 4.6% | | 3.3 | | | 2024 | | | 400,000 | | | 2,317 | | | 402,317 | | 4.0% | | 7.3% |
| | Variable rate - secured (2) | | | 270,212 | | 2.0% | | 18.7 | | | 2025 | | | 500,000 | | | 16,056 | | | 516,056 | | 3.5% | | 9.4% |
| | Unamortized premiums and debt issuance costs, net | | | 27,856 | | - | | - | | | 2026 | | | 450,000 | | | 55,091 | | | 505,091 | | 3.4% | | 9.2% |
| | | Total mortgage notes payable | | | 2,008,417 | | 4.2% | | 5.4 | | | 2027 | | | 350,000 | | | 155,500 | | | 505,500 | | 3.4% | | 9.2% |
| | | | | | | | | | | | | 2028 | | | - | | | 2,934 | | | 2,934 | | 2.9% | | 0.1% |
| Unsecured Lines of Credit | | | | | | | | | | Thereafter | | | - | | | 201,722 | | | 201,722 | | 2.3% | | 3.6% |
| | Line of credit (3) | | | 179,000 | | 2.3% | | | | | Subtotal | | | 3,525,000 | | | 1,980,561 | | | 5,505,561 | | 3.8% | | 100.0% |
| | Line of credit (4) | | | - | | 2.3% | | | | | Debt Issuance Costs | | | (18,103) | | | (5,392) | | | (23,495) | | NA | | NA |
| | | Total lines of credit | | | 179,000 | | 2.3% | | | | | (Discounts)/Premiums | | | (5,188) | | | 33,248 | | | 28,060 | | NA | | NA |
| | | | | | | | | | | | | Total | | $ | 3,501,709 | | $ | 2,008,417 | | $ | 5,510,126 | | 3.8% | | 100.0% |
| | | Total debt, net | | $ | 5,689,126 | | 3.8% | | | | | | | | | | | | | | | | | | |
| | | | | | | | | | | | | | | | | | | | | | | | | | |
Capitalized interest for the three and twelve months ended December 31, 2017 was approximately $3.9 million and $13.9 million, respectively.
(1) | The unsecured term loan has a variable interest rate of LIBOR plus 0.95%. The Company has interest rate swap contracts with an aggregate notional amount of $175 million, which effectively converts the interest rate on $175 million of the term loan to a fixed rate of 2.3%. |
(2) | $270.2 million of variable rate debt is tax exempt to the note holders. $20.7 million is subject to interest rate cap protection agreements. |
(3) | As of December 31, 2017, this unsecured line of credit facility had a capacity of $1.0 billion, with a scheduled maturity date in December 2020 with one 18-month extension, exercisable at the Company’s option. The underlying interest rate on this line was based on a tiered rate structure tied to the Company’s corporate ratings and was LIBOR plus 0.90% as of December 31, 2017. In January 2018, the line of credit facility was amended such that the line’s capacity was increased to $1.2 billion and the scheduled maturity date was extended to December 2021 with one 18-month extension, exercisable at the Company’s option. The underlying interest rate on the amended line is based on a tiered rate structure tied to the Company’s corporate ratings and is currently at LIBOR plus 0.875%. |
(4) | As of December 31, 2017, this unsecured line of credit facility had a capacity of $25 million and was scheduled to mature in January 2018. The underlying interest rate on this line was based on a tiered rate structure tied to the Company’s corporate ratings and was LIBOR plus 0.90% as of December 31, 2017. In January 2018, the line of credit facility was amended such that the line’s capacity was increased to $35 million and the scheduled maturity date was extended to January 2020. The underlying interest rate on the amended line is based on a tiered rate structure tied to the Company’s corporate ratings and is currently at LIBOR plus 0.875%. |
E S S E X P R O P E R T Y T R U S T, I N C.
Capitalization Data, Public Bond Covenants, Credit Ratings and Selected Credit Ratios - December 31, 2017
(Dollars and shares in thousands, except per share amounts)
| | | | | | | | | | | | | | |
Capitalization Data | | | | | | | Public Bond Covenants (1) | | Actual | | Requirement | | |
| Total debt, net | | | | $ | 5,689,126 | | | | | | | | | | |
| | | | | | | | | | Adjusted Debt to Adjusted Total Assets: | | 37% | | < 65% | | |
| Common stock and potentially dilutive securities | | | | | | | | | | | | |
| | Common stock outstanding | | | 66,054 | | | | | | | | | | |
| | Limited partnership units (1) | | | 2,230 | | | | | | | | | | |
| | Options-treasury method | | | 54 | | | Secured Debt to Adjusted Total Assets: | | 13% | | < 40% | | |
| Total shares of common stock and potentially dilutive securities | 68,338 | | | | | | | | | | |
| | | | | | | | | | | | | | | | | |
| Common stock price per share as of December 31, 2017 | $ | 241.37 | | | | | | | | | | |
| | | | | | | | | | Interest Coverage: | | 421% | | > 150% | | |
| Total equity capitalization | | $ | 16,494,743 | | | | | | | | | | |
| | | | | | | | | | | | | | | | | |
| Total market capitalization | | $ | 22,183,869 | | | Unsecured Debt Ratio (2): | | 283% | | > 150% | | |
| | | | | | | | | | | | | | | | | |
| Ratio of debt to total market capitalization | | | 25.6% | | | | | | | | | | |
| | | | | | | | | | Selected Credit Ratios (3) | | Actual | | | | |
Credit Ratings | | | | | | | | | | | | | | | |
Rating Agency | | Rating | Outlook | | | | | Net Indebtedness Divided by Adjusted EBITDA, normalized and annualized: | | 5.6 | | | | |
| Fitch | | BBB+ | Stable | | | | | | | | | | | | |
| Moody’s | | Baa1 | Stable | | | | | Unencumbered NOI to Adjusted Total NOI: | | 71% | | | | |
| Standard & Poor’s | BBB+ | Stable | | | | | | | | | | | | |
| | | | | | | | | | (1) | Refer to page S-17.3 for additional information on the Company’s Public Bond Covenants. | | | | |
(1) | Assumes conversion of all outstanding limited partnership units in the Operating Partnership into shares of the Company’s common stock. | | (2) | Unsecured Debt Ratio is unsecured assets (excluding investments in co-investments) divided by unsecured indebtedness. |
| | | | | | | | | | (3) | Refer to pages S-17.1 to S-17.4, the section titled “Reconciliations of Non-GAAP Financial Measures and Other Terms” for additional information on the Company’s Selected Credit Ratios. |
| | | | | | | | | | | | | | | | | |
E S S E X P R O P E R T Y T R U S T, I N C.
Portfolio Summary by County as of December 31, 2017
| | | | | Apartment Homes | | Average Monthly Rental Rate (1) | | Percent of NOI (2) |
| Region - County | | Consolidated (3) | | Unconsolidated Co-investments (3) | | Apartment Homes in Development (4) | | Total | | Consolidated | | Unconsolidated Co-investments (5) | | Total (6) | | Consolidated | | Unconsolidated Co-investments (5) | | Total (6) |
| | | | | | | | | | | | | | | | | | | | | | | |
| Southern California | | | | | | | | | | | | | | | | | | | | |
| | Los Angeles County | | 9,387 | | 1,563 | | 200 | | 11,150 | | $ 2,380 | | $ 2,051 | | $ 2,354 | | 19.3% | | 12.1% | | 18.7% |
| | Orange County | | 5,553 | | 1,149 | | - | | 6,702 | | 2,125 | | 1,839 | | 2,099 | | 10.7% | | 9.0% | | 10.6% |
| | San Diego County | | 5,203 | | 616 | | - | | 5,819 | | 1,877 | | 1,723 | | 1,869 | | 8.7% | | 4.4% | | 8.3% |
| | Ventura County | | 2,577 | | 693 | | - | | 3,270 | | 1,750 | | 2,072 | | 1,791 | | 4.3% | | 6.1% | | 4.4% |
| | Other Southern CA | | 623 | | 249 | | - | | 872 | | 1,595 | | 1,589 | | 1,594 | | 0.9% | | 1.6% | | 0.9% |
| Total Southern California | | 23,343 | | 4,270 | | 200 | | 27,813 | | 2,117 | | 1,927 | | 2,101 | | 43.9% | | 33.2% | | 42.9% |
| | | | | | | | | | | | | | | | | | | | | | | |
| Northern California | | | | | | | | | | | | | | | | | | | | |
| | Santa Clara County | | 7,356 | | 2,266 | | 745 | | 10,367 | | 2,659 | | 2,797 | | 2,678 | | 18.7% | | 25.2% | | 19.3% |
| | Alameda County | | 2,954 | | 1,983 | | - | | 4,937 | | 2,488 | | 2,327 | | 2,445 | | 6.8% | | 19.7% | | 8.1% |
| | San Mateo County | | 1,830 | | 197 | | 492 | | 2,519 | | 2,828 | | 2,870 | | 2,830 | | 4.9% | | 2.4% | | 4.6% |
| | Contra Costa County | | 2,270 | | 49 | | - | | 2,319 | | 2,275 | | 4,549 | | 2,300 | | 4.8% | | 0.7% | | 4.4% |
| | San Francisco | | 1,342 | | 463 | | 545 | | 2,350 | | 3,063 | | 3,261 | | 3,095 | | 3.7% | | 6.3% | | 3.9% |
| | Other Northern CA | | 96 | | - | | - | | 96 | | 2,895 | | - | | 2,895 | | 0.3% | | - | | 0.3% |
| Total Northern California | | 15,848 | | 4,958 | | 1,782 | | 22,588 | | 2,627 | | 2,673 | | 2,634 | | 39.2% | | 54.3% | | 40.6% |
| | | | | | | | | | | | | | | | | | | | | | | |
| Seattle Metro | | 10,238 | | 1,582 | | - | | 11,820 | | 1,799 | | 1,803 | | 1,799 | | 16.9% | | 12.5% | | 16.5% |
| | | | | | | | | | | | | | | | | | | | | | | |
| Total | | | 49,429 | | 10,810 | | 1,982 | | 62,221 | | $ 2,215 | | $ 2,256 | | $ 2,219 | | 100.0% | | 100.0% | | 100.0% |
(1) | Average monthly rental rate is defined as the total potential monthly rental revenue (actual rent for occupied apartment homes plus market rent for vacant apartment homes) divided by the number of apartment homes. |
(2) | Actual NOI for the quarter ended December 31, 2017. See the section titled “Net Operating Income (“NOI”) and Same-Property NOI Reconciliations” on page S-17.3. |
(3) | Includes all apartment communities with rents. |
(4) | Includes development communities with no rental income. |
(5) | Co-investment amounts weighted for Company’s pro rata share. |
(6) | At Company’s pro rata share. |
E S S E X P R O P E R T Y T R U S T, I N C.
Operating Income by Quarter(1)
(Dollars in thousands)
| | | Apartment Homes | | | Q4 ‘17 | | | Q3 ‘17 | | | Q2 ‘17 | | | Q1 ‘17 | | | Q4 ‘16 | |
| | | | | | | | | | | | | | | | | | | |
| Rental and other property revenues: | | | | | | | | | | | | | | | | | | |
| Same-property | | | 46,128 | | | $ | 309,765 | | | $ | 309,308 | | | $ | 304,662 | | | $ | 302,125 | | | $ | 300,808 | |
Acquisitions (2) | | | 2,081 | | | | 16,145 | | | | 16,225 | | | | 15,859 | | | | 13,751 | | | | 3,018 | |
Development (3) | | | 360 | | | | 4,529 | | | | 4,530 | | | | 4,462 | | | | 4,334 | | | | 4,270 | |
| Redevelopment | | | 621 | | | | 5,005 | | | | 4,913 | | | | 4,909 | | | | 4,814 | | | | 4,757 | |
Non-residential/other, net (4) | | | 239 | | | | 6,973 | | | | 6,998 | | | | 6,874 | | | | 8,144 | | | | 14,052 | |
| Total rental and other property revenues | | | 49,429 | | | | 342,417 | | | | 341,974 | | | | 336,766 | | | | 333,168 | | | | 326,905 | |
| | | | | | | | | | | | | | | | | | | | | | | | | |
| Property operating expenses: | | | | | | | | | | | | | | | | | | | | | | | | |
| Same-property | | | | | | | 93,389 | | | | 94,021 | | | | 90,308 | | | | 90,455 | | | | 91,522 | |
Acquisitions (2) | | | | | | | 5,185 | | | | 5,288 | | | | 5,273 | | | | 4,552 | | | | 906 | |
Development (3) | | | | | | | 1,421 | | | | 1,508 | | | | 1,448 | | | | 1,576 | | | | 1,528 | |
| Redevelopment | | | | | | | 1,602 | | | | 1,604 | | | | 1,468 | | | | 1,526 | | | | 1,558 | |
Non-residential/other, net (4) (5) | | | | | | | 2,030 | | | | 1,716 | | | | (232 | ) | | | 1,404 | | | | 3,483 | |
| Total property operating expenses | | | | | | | 103,627 | | | | 104,137 | | | | 98,265 | | | | 99,513 | | | | 98,997 | |
| | | | | | | | | | | | | | | | | | | | | | | | | |
| Net operating income (NOI): | | | | | | | | | | | | | | | | | | | | | | | | |
| Same-property | | | | | | | 216,376 | | | | 215,287 | | | | 214,354 | | | | 211,670 | | | | 209,286 | |
Acquisitions (2) | | | | | | | 10,960 | | | | 10,937 | | | | 10,586 | | | | 9,199 | | | | 2,112 | |
Development (3) | | | | | | | 3,108 | | | | 3,022 | | | | 3,014 | | | | 2,758 | | | | 2,742 | |
| Redevelopment | | | | | | | 3,403 | | | | 3,309 | | | | 3,441 | | | | 3,288 | | | | 3,199 | |
Non-residential/other, net (4) | | | | | | | 4,943 | | | | 5,282 | | | | 7,106 | | | | 6,740 | | | | 10,569 | |
| Total NOI | | | | | | $ | 238,790 | | | $ | 237,837 | | | $ | 238,501 | | | $ | 233,655 | | | $ | 227,908 | |
| | | | | | | | | | | | | | | | | | | | | | | | | |
| Same-property metrics | | | | | | | | | | | | | | | | | | | | | | | | |
| Operating margin | | | | | | | 70 | % | | | 70 | % | | | 70 | % | | | 70 | % | | | 70 | % |
Annualized turnover (6) | | | | | | | 46 | % | | | 62 | % | | | 54 | % | | | 46 | % | | | 47 | % |
Financial occupancy (7) | | | | | | | 96.8 | % | | | 96.7 | % | | | 96.4 | % | | | 96.5 | % | | | 96.6 | % |
(1) | Includes consolidated communities only. |
(2) | Acquisitions include properties acquired which did not have comparable stabilized results as of January 1, 2016. |
(3) | Development includes properties developed which did not have comparable stabilized results as of January 1, 2016. |
(4) | Other real estate assets consists mainly of retail space, commercial properties, boat slips, held for sale properties, disposition properties, and student housing. |
(5) | Includes other expenses and intercompany eliminations pertaining to self-insurance. In Q2 ‘17, there were $2.0 million in reductions to operating expenses related to changes in prior period property tax estimates. |
(6) | Annualized turnover is defined as the number of apartment homes turned over during the quarter, annualized, divided by the total number of apartment homes. |
(7) | Financial occupancy is defined as the percentage resulting from dividing actual rental revenue by total potential rental revenue (actual rent for occupied apartment homes plus market rent for vacant apartment homes). |
E S S E X P R O P E R T Y T R U S T, I N C.
Same-Property Results by County - Fourth Quarter 2017 vs. Fourth Quarter 2016 and Third Quarter 2017
(Dollars in thousands, except average monthly rental rates)
| | | | | | | | | | | | | | | | | | | | | | | | | | | | | | | | | | | | | | | | |
| | | | | | | | | Average Monthly Rental Rate | | | Financial Occupancy | | | Gross Revenues | | | Sequential Gross Revenues | |
| Region - County | | Apartment Homes | | | Q4 ‘17 % of Actual NOI | | | Q4 ‘17 | | | Q4 ‘16 | | | % Change | | | Q4 ‘17 | | | Q4 ‘16 | | | % Change | | | Q4 ‘17 | | | Q4 ‘16 | | | % Change | | | Q3 ‘17 | | | % Change | |
| | | | | | | | | | | | | | | | | | | | | | | | | | | | | | | | | | | | | | | | |
| Southern California | | | | | | | | | | | | | | | | | | | | | | | | | | | | | | | | | | | | | | | |
| Los Angeles County | | | 8,523 | | | | 19.2 | % | | $ | 2,377 | | | $ | 2,332 | | | | 1.9 | % | | | 96.6 | % | | | 96.3 | % | | | 0.3 | % | | $ | 61,503 | | | $ | 60,418 | | | | 1.8 | % | | $ | 61,573 | | | | -0.1 | % |
| Orange County | | | 5,553 | | | | 11.6 | % | | | 2,125 | | | | 2,052 | | | | 3.6 | % | | | 96.9 | % | | | 96.8 | % | | | 0.1 | % | | | 35,945 | | | | 34,631 | | | | 3.8 | % | | | 35,761 | | | | 0.5 | % |
| San Diego County | | | 4,961 | | | | 9.0 | % | | | 1,866 | | | | 1,798 | | | | 3.8 | % | | | 96.9 | % | | | 96.9 | % | | | 0.0 | % | | | 28,443 | | | | 27,418 | | | | 3.7 | % | | | 28,371 | | | | 0.3 | % |
| Ventura County | | | 2,577 | | | | 4.6 | % | | | 1,750 | | | | 1,675 | | | | 4.5 | % | | | 97.5 | % | | | 97.2 | % | | | 0.3 | % | | | 14,069 | | | | 13,482 | | | | 4.4 | % | | | 14,006 | | | | 0.4 | % |
| Other Southern CA | | | 384 | | | | 0.4 | % | | | 1,265 | | | | 1,223 | | | | 3.4 | % | | | 97.4 | % | | | 97.3 | % | | | 0.1 | % | | | 1,502 | | | | 1,468 | | | | 2.3 | % | | | 1,492 | | | | 0.7 | % |
| Total Southern California | | | 21,998 | | | | 44.8 | % | | | 2,105 | | | | 2,045 | | | | 2.9 | % | | | 96.9 | % | | | 96.7 | % | | | 0.2 | % | | | 141,462 | | | | 137,417 | | | | 2.9 | % | | | 141,203 | | | | 0.2 | % |
| | | | | | | | | | | | | | | | | | | | | | | | | | | | | | | | | | | | | | | | | | | | | | | | | | | | | |
| Northern California | | | | | | | | | | | | | | | | | | | | | | | | | | | | | | | | | | | | | | | | | | | | | | | | | | | | |
| Santa Clara County | | | 5,925 | | | | 16.7 | % | | | 2,677 | | | | 2,653 | | | | 0.9 | % | | | 96.9 | % | | | 97.0 | % | | | -0.1 | % | | | 48,583 | | | | 47,614 | | | | 2.0 | % | | | 48,538 | | | | 0.1 | % |
| Alameda County | | | 2,954 | | | | 7.4 | % | | | 2,488 | | | | 2,457 | | | | 1.3 | % | | | 97.0 | % | | | 94.4 | % | | | 2.8 | % | | | 22,504 | | | | 21,464 | | | | 4.8 | % | | | 22,477 | | | | 0.1 | % |
| San Mateo County | | | 1,830 | | | | 5.3 | % | | | 2,828 | | | | 2,790 | | | | 1.4 | % | | | 96.6 | % | | | 97.4 | % | | | -0.8 | % | | | 15,931 | | | | 15,826 | | | | 0.7 | % | | | 15,986 | | | | -0.3 | % |
| Contra Costa County | | | 2,270 | | | | 5.3 | % | | | 2,275 | | | | 2,244 | | | | 1.4 | % | | | 97.4 | % | | | 97.4 | % | | | 0.0 | % | | | 15,953 | | | | 15,577 | | | | 2.4 | % | | | 15,814 | | | | 0.9 | % |
| San Francisco | | | 817 | | | | 1.9 | % | | | 2,514 | | | | 2,464 | | | | 2.0 | % | | | 95.1 | % | | | 96.2 | % | | | -1.1 | % | | | 6,165 | | | | 6,038 | | | | 2.1 | % | | | 6,198 | | | | -0.5 | % |
| Other Northern CA | | | 96 | | | | 0.3 | % | | | 2,895 | | | | 2,739 | | | | 5.7 | % | | | 99.8 | % | | | 98.5 | % | | | 1.3 | % | | | 860 | | | | 806 | | | | 6.7 | % | | | 807 | | | | 6.6 | % |
| Total Northern California | | | 13,892 | | | | 36.9 | % | | | 2,583 | | | | 2,552 | | | | 1.2 | % | | | 96.9 | % | | | 96.5 | % | | | 0.4 | % | | | 109,996 | | | | 107,325 | | | | 2.5 | % | | | 109,820 | | | | 0.2 | % |
| | | | | | | | | | | | | | | | | | | | | | | | | | | | | | | | | | | | | | | | | | | | | | | | | | | | | |
| Seattle Metro | | | 10,238 | | | | 18.3 | % | | | 1,799 | | | | 1,724 | | | | 4.4 | % | | | 96.4 | % | | | 96.7 | % | | | -0.3 | % | | | 58,307 | | | | 56,066 | | | | 4.0 | % | | | 58,285 | | | | 0.0 | % |
| | | | | | | | | | | | | | | | | | | | | | | | | | | | | | | | | | | | | | | | | | | | | | | | | | | | | |
| Total Same-Property | | | 46,128 | | | | 100.0 | % | | $ | 2,181 | | | $ | 2,126 | | | | 2.6 | % | | | 96.8 | % | | | 96.6 | % | | | 0.2 | % | | $ | 309,765 | | | $ | 300,808 | | | | 3.0 | % | | $ | 309,308 | | | | 0.1 | % |
E S S E X P R O P E R T Y T R U S T, I N C.
Same-Property Revenue Results by County - Twelve Months Ended December 31, 2017 vs. Twelve Months Ended December 31, 2016
(Dollars in thousands, except average monthly rental rates)
| | | | | | | | | | | | | | | | | | | | | | | | | | | | | | | | | | |
| | | | | | YTD | | | Average Monthly Rental Rate | | | Financial Occupancy | | | Gross Revenues | |
| Region - County | | Apartment Homes | | | 2017 % of Actual NOI | | | YTD 2017 | | | YTD 2016 | | | % Change | | | YTD 2017 | | | YTD 2016 | | | % Change | | | YTD 2017 | | | YTD 2016 | | | % Change | |
| | | | | | | | | | | | | | | | | | | | | | | | | | | | | | | | | | |
| Southern California | | | | | | | | | | | | | | | | | | | | | | | | | | | | | | | | | |
| Los Angeles County | | | 8,523 | | | | 19.4 | % | | $ | 2,366 | | | $ | 2,303 | | | | 2.7 | % | | | 96.3 | % | | | 96.2 | % | | | 0.1 | % | | $ | 243,858 | | | $ | 237,429 | | | | 2.7 | % |
| Orange County | | | 5,553 | | | | 11.5 | % | | | 2,103 | | | | 2,015 | | | | 4.4 | % | | | 96.7 | % | | | 96.4 | % | | | 0.3 | % | | | 141,887 | | | | 135,674 | | | | 4.6 | % |
| San Diego County | | | 4,961 | | | | 8.9 | % | | | 1,842 | | | | 1,767 | | | | 4.2 | % | | | 96.6 | % | | | 96.3 | % | | | 0.3 | % | | | 112,047 | | | | 107,316 | | | | 4.4 | % |
| Ventura County | | | 2,577 | | | | 4.6 | % | | | 1,723 | | | | 1,645 | | | | 4.7 | % | | | 97.3 | % | | | 96.7 | % | | | 0.6 | % | | | 55,329 | | | | 52,589 | | | | 5.2 | % |
| Other Southern CA | | | 384 | | | | 0.4 | % | | | 1,251 | | | | 1,207 | | | | 3.6 | % | | | 97.0 | % | | | 97.2 | % | | | -0.2 | % | | | 5,992 | | | | 5,730 | | | | 4.6 | % |
| Total Southern California | | | 21,998 | | | | 44.8 | % | | | 2,087 | | | | 2,013 | | | | 3.7 | % | | | 96.6 | % | | | 96.3 | % | | | 0.3 | % | | | 559,113 | | | | 538,738 | | | | 3.8 | % |
| | | | | | | | | | | | | | | | | | | | | | | | | | | | | | | | | | | | | | | | | | | | | |
| Northern California | | | | | | | | | | | | | | | | | | | | | | | | | | | | | | | | | | | | | | | | | | | | |
| Santa Clara County | | | 5,925 | | | | 16.8 | % | | | 2,672 | | | | 2,639 | | | | 1.3 | % | | | 97.0 | % | | | 96.6 | % | | | 0.4 | % | | | 193,596 | | | | 189,242 | | | | 2.3 | % |
| Alameda County | | | 2,954 | | | | 7.3 | % | | | 2,476 | | | | 2,428 | | | | 2.0 | % | | | 96.0 | % | | | 95.4 | % | | | 0.6 | % | | | 88,739 | | | | 86,463 | | | | 2.6 | % |
| San Mateo County | | | 1,830 | | | | 5.4 | % | | | 2,826 | | | | 2,761 | | | | 2.4 | % | | | 97.0 | % | | | 96.6 | % | | | 0.4 | % | | | 63,659 | | | | 62,099 | | | | 2.5 | % |
| Contra Costa County | | | 2,270 | | | | 5.3 | % | | | 2,265 | | | | 2,216 | | | | 2.2 | % | | | 97.3 | % | | | 96.9 | % | | | 0.4 | % | | | 63,153 | | | | 61,489 | | | | 2.7 | % |
| San Francisco | | | 817 | | | | 1.9 | % | | | 2,494 | | | | 2,434 | | | | 2.5 | % | | | 95.7 | % | | | 95.0 | % | | | 0.7 | % | | | 24,448 | | | | 23,545 | | | | 3.8 | % |
| Other Northern CA | | | 96 | | | | 0.3 | % | | | 2,810 | | | | 2,594 | | | | 8.3 | % | | | 97.5 | % | | | 96.9 | % | | | 0.6 | % | | | 3,281 | | | | 2,985 | | | | 9.9 | % |
| Total Northern California | | | 13,892 | | | | 37.0 | % | | | 2,575 | | | | 2,529 | | | | 1.8 | % | | | 96.8 | % | | | 96.3 | % | | | 0.5 | % | | | 436,876 | | | | 425,823 | | | | 2.6 | % |
| | | | | | | | | | | | | | | | | | | | | | | | | | | | | | | | | | | | | | | | | | | | | |
| Seattle Metro | | | 10,238 | | | | 18.2 | % | | | 1,775 | | | | 1,680 | | | | 5.7 | % | | | 96.4 | % | | | 96.1 | % | | | 0.3 | % | | | 229,871 | | | | 217,259 | | | | 5.8 | % |
| | | | | | | | | | | | | | | | | | | | | | | | | | | | | | | | | | | | | | | | | | | | | |
| Total Same-Property | | | 46,128 | | | | 100.0 | % | | $ | 2,164 | | | $ | 2,095 | | | | 3.3 | % | | | 96.6 | % | | | 96.3 | % | | | 0.3 | % | | $ | 1,225,860 | | | $ | 1,181,820 | | | | 3.7 | % |
E S S E X P R O P E R T Y T R U S T, I N C.
Same-Property Operating Expenses - Quarter and Year to Date as of December 31, 2017 and 2016
(Dollars in thousands)
| | | | | | | | | | | | | | | | | | | | | | | | | |
| | | Based on 46,128 apartment homes |
| | | | | | | | | | | | | | | | | | | | | | | | | |
| | | Q4 ‘17 | | | Q4 ‘16 | | | % Change | | | % of Op. Ex. | | | YTD 2017 | | | YTD 2016 | | | % Change | | | % of Op. Ex. | |
| | | | | | | | | | | | | | | | | | | | | | | | | |
| Same-property operating expenses: | | | | | | | | | | | | | | | | | | | | | | | | |
| Real estate taxes | | $ | 33,373 | | | $ | 31,383 | | | | 6.3 | % | | | 35.7 | % | | $ | 130,051 | | | $ | 126,025 | | | | 3.2 | % | | | 35.3 | % |
| Maintenance and repairs | | | 17,655 | | | | 18,889 | | | | -6.5 | % | | | 18.9 | % | | | 70,113 | | | | 70,076 | | | | 0.1 | % | | | 19.0 | % |
| Administrative | | | 16,479 | | | | 16,308 | | | | 1.0 | % | | | 17.6 | % | | | 65,092 | | | | 64,496 | | | | 0.9 | % | | | 17.7 | % |
| Utilities | | | 16,070 | | | | 15,118 | | | | 6.3 | % | | | 17.2 | % | | | 62,767 | | | | 58,498 | | | | 7.3 | % | | | 17.0 | % |
| Management fees | | | 6,861 | | | | 6,884 | | | | -0.3 | % | | | 7.4 | % | | | 27,737 | | | | 27,710 | | | | 0.1 | % | | | 7.6 | % |
| Insurance | | | 2,951 | | | | 2,940 | | | | 0.4 | % | | | 3.2 | % | | | 12,413 | | | | 11,768 | | | | 5.5 | % | | | 3.4 | % |
| Total same-property operating expenses | | $ | 93,389 | | | $ | 91,522 | | | | 2.0 | % | | | 100.0 | % | | $ | 368,173 | | | $ | 358,573 | | | | 2.7 | % | | | 100.0 | % |
| | | | | | | | | | | | | | | | | | | | | | | | | | | | | | | | | |
E S S E X P R O P E R T Y T R U S T, I N C.
Development Pipeline - December 31, 2017
(Dollars in millions, except per apartment home amounts in thousands and except in footnotes)
| Project Name | | Location | | Ownership % | | Estimated Apartment Homes | | Estimated Commercial sq. feet | | Incurred to Date | | Remaining Costs | | | | Essex Est. Total Cost (1) | | Cost per Apartment Home (2) | | Average % Occupied (3) | | | | Construction Start | | | | Stabilized Operations |
| | | | | | | | | | | | | | | | | | | | | | | | | | | | | |
Development Projects - Consolidated (4) | | | | | | | | | | | | | | | | | | | | | | | | | | | | |
| | Station Park Green - Phase I (5) | | San Mateo, CA | | 100% | | 121 | | 30,000 | | $ 95 | | $ 3 | | $ 98 | | $ 98 | | $ 661 | | 0.0% | | 0.0% | | Q3 2015 | | Q1 2018 | | Q2 2018 |
| | Station Park Green - Phase II (5) | | San Mateo, CA | | 100% | | 199 | | - | | 57 | | 84 | | 141 | | 141 | | 709 | | 0.0% | | 0.0% | | Q2 2017 | | Q1 2019 | | Q3 2019 |
| | Station Park Green - Phase III (5) | | San Mateo, CA | | 100% | | 172 | | - | | 43 | | 81 | | 124 | | 124 | | 721 | | 0.0% | | 0.0% | | Q3 2017 | | Q2 2019 | | Q4 2019 |
| | Gateway Village (6) | | Santa Clara, CA | | 100% | | 476 | | - | | 81 | | 145 | | 226 | | 226 | | 475 | | 0.0% | | 0.0% | | Q3 2016 | | Q1 2019 | | Q1 2020 |
| | Hollywood (7) | | Hollywood, CA | | 100% | | 200 | | 4,700 | | 27 | | 78 | | 105 | | 105 | | 500 | | 0.0% | | 0.0% | | Q4 2017 | | Q1 2020 | | Q3 2020 |
| Total Development Projects - Consolidated | | | | | | 1,168 | | 34,700 | | 303 | | 391 | | 694 | | 694 | | 574 | | | | | | | | | | |
| | | | | | | | | | | | | | | | | | | | | | | | | | | | | | |
| Land Held for Future Development - Consolidated | | | | | | | | | | | | | | | | | | | | | | | | | | |
| | Other Projects (5)(7) | | Various | | 100% | | | | | | 64 | | - | | 64 | | 64 | | | | | | | | | | | | |
| Total Development Pipeline - Consolidated | | | | | | 1,168 | | 34,700 | | 367 | | 391 | | 758 | | 758 | | | | | | | | | | | | |
| | | | | | | | | | | | | | | | | | | | | | | | | | | | | | |
Development Projects - Joint Venture (4) | | | | | | | | | | | | | | | | | | | | | | | | | | | | |
| | Ohlone | | San Jose, CA | | 50% | | 269 | | - | | 30 | | 106 | | 136 | | 68 | | 506 | | 0.0% | | 0.0% | | Q3 2017 | | Q3 2019 | | Q2 2020 |
| | 500 Folsom (8) | | San Francisco, CA | | 50% | | 545 | | 6,000 | | 160 | | 255 | | 415 | | 208 | | 751 | | 0.0% | | 0.0% | | Q4 2015 | | Q2 2019 | | Q4 2020 |
| Total Development Projects - Joint Venture | | | | | | 814 | | 6,000 | | 190 | | 361 | | 551 | | 276 | | $ 670 | | | | | | | | | | |
| | | | | | | | | | | | | | | | | | | | | | | | | | | | | | |
| Grand Total - Development Pipeline | | | | | | 1,982 | | 40,700 | | $ 557 | | $ 752 | | $ 1,309 | | 1,034 | | | | | | | | | | | | |
| Essex Cost Incurred to Date - Pro Rata | | | | | | | | | | | | | | | | (462) | | | | | | | | | | | | |
| Essex Remaining Commitment | | | | | | | | | | | | | | | | $ 572 | | | | | | | | | | | | |
(1) | The Company’s share of the estimated total costs of the project. |
(2) | Net of the estimated allocation to the retail component of the project. |
(3) | Calculations are based on multifamily operations only and are as of December 31, 2017. February 2, 2018, Station Park Green - Phase I was 4.2% pre-leased. |
(4) | For the fourth quarter of 2017, the Company’s cost includes $3.8 million of capitalized interest, $1.9 million of capitalized overhead and $0.8 million of development fees (such development fees reduced G&A expenses). |
(5) | Development of Station Park Green - Phases I, II, and III are reflected under Development Projects - Consolidated. Costs incurred for Station Park Green - Phase IV, which consists of 107 apartment homes, are included in Land Held for Future Development - Consolidated. |
(6) | Cost incurred to date does not include a deduction of $4.7 million for accumulated depreciation recorded during the period when the property was held as a retail operating asset. |
(7) | Cost incurred to date does not include a deduction of $6.3 million for accumulated depreciation recorded during the period when one property was held as a retail operating asset. |
(8) | Estimated costs incurred to date and total cost is net of a projected value for low income housing tax credit proceeds and the value of the tax exempt bond structure. |
E S S E X P R O P E R T Y T R U S T, I N C.
Redevelopment Pipeline - December 31, 2017
(Dollars in thousands)
| | | Apartment Homes | | | Total Incurred To Date | | | Estimated Remaining Cost | | | Estimated Total Cost | | | Project Start Date | | | NOI Twelve Months Ended | |
| | | | | | | | | | | | | |
| Region/Project Name | | | | | | | | | | | | 2017 | | | 2016 | |
| | | | | | | | | | | | | | | | | | | | | | |
Same-Property - Redevelopment Projects(1) | | | | | | | | | | | | | | | | | | | | | |
| Southern California | | | | | | | | | | | | | | | | | | | | | |
| Hamptons | | | 215 | | | $ | 18,500 | | | $ | 5,100 | | | $ | 23,600 | | | | Q1 2014 | | | | | | | |
| Kings Road | | | 196 | | | | 2,900 | | | | 9,300 | | | | 12,200 | | | | Q4 2016 | | | | | | | |
| The Palms at Laguna Niguel | | | 460 | | | | 3,000 | | | | 5,200 | | | | 8,200 | | | | Q4 2016 | | | | | | | |
| Northern California | | | | | | | | | | | | | | | | | | | | | | | | | | |
| Crow Canyon | | | 400 | | | | 4,100 | | | | 3,300 | | | | 7,400 | | | | Q1 2017 | | | | | | | |
| Total Same-Property - Redevelopment Projects | | | 1,271 | | | $ | 28,500 | | | $ | 22,900 | | | $ | 51,400 | | | | | | | $ | 22,760 | | | $ | 21,443 | |
| | | | | | | | | | | | | | | | | | | | | | | | | | | | | |
| Non-Same Property - Redevelopment Projects | | | | | | | | | | | | | | | | | | | | | | | | | | | | |
| Southern California | | | | | | | | | | | | | | | | | | | | | | | | | | | | |
| Bunker Hill Towers | | | 456 | | | $ | 66,700 | | | $ | 20,700 | | | $ | 87,400 | | | | Q3 2013 | | | | | | | | | |
| Total Non-Same Property - Redevelopment Projects | | | 456 | | | $ | 66,700 | | | $ | 20,700 | | | $ | 87,400 | | | | | | | $ | 7,911 | | | $ | 7,134 | |
(1) | Redevelopment activities are ongoing at these communities, but the communities have stabilized operations, therefore results are classified in same-property results. |
E S S E X P R O P E R T Y T R U S T, I N C.
Capital Expenditures - December 31, 2017
(Dollars in thousands, except in footnotes and per apartment home amounts)
Revenue Generating Capital Expenditures (1) (2) | | Q4 ‘17 | | | Q3 ‘17 | | | Q2 ‘17 | | | Q1 ‘17 | | | Trailing 4 Quarters | |
| Same-property portfolio | | $ | 14,048 | | | $ | 17,969 | | | $ | 16,519 | | | $ | 9,345 | | | $ | 57,881 | |
| Non-same property portfolio | | | 3,146 | | | | 2,006 | | | | 3,987 | | | | 2,310 | | | | 11,449 | |
| Total revenue generating capital expenditures | | $ | 17,194 | | | $ | 19,975 | | | $ | 20,506 | | | $ | 11,655 | | | $ | 69,330 | |
| | | | | | | | | | | | | | | | | | | | | |
| Number of same-property interior renovations completed | | | 426 | | | | 650 | | | | 760 | | | | 589 | | | | 2,425 | |
| Number of total consolidated interior renovations completed | | | 435 | | | | 660 | | | | 768 | | | | 594 | | | | 2,457 | |
| | | | | | | | | | | | | | | | | | | | | |
Non-Revenue Generating Capital Expenditures (3) | | Q4 ‘17 | | | Q3 ‘17 | | | Q2 ‘17 | | | Q1 ‘17 | | | Trailing 4 Quarters | |
Non-revenue generating capital expenditures (4) | | $ | 19,895 | | | $ | 20,875 | | | $ | 16,473 | | | $ | 9,381 | | | $ | 66,624 | |
| Average apartment homes in quarter | | | 49,429 | | | | 49,429 | | | | 49,429 | | | | 48,900 | | | | 49,297 | |
| Capital expenditures per apartment homes in the quarter | | $ | 402 | | | $ | 422 | | | $ | 333 | | | $ | 192 | | | $ | 1,351 | |
(1) | The Company incurred $0.1 million of capitalized interest, $2.5 million of capitalized overhead and $0.1 million of co-investment fees related to redevelopment in Q4 2017. |
(2) | Represents revenue generating or expense saving expenditures, such as full-scale redevelopments shown on page S-12, interior unit turn renovations, enhanced amenities and certain resource management initiatives. |
(3) | Represents roof replacements, paving, building and mechanical systems, exterior painting, siding, etc. |
(4) | Non-revenue generating capital expenditures does not include expenditures incurred due to changes in governmental regulations that the Company would not have incurred otherwise, and expenditures in which the Company expects to be reimbursed. |
E S S E X P R O P E R T Y T R U S T, I N C.
Co-investments - December 31, 2017
(Dollars in thousands)
| | Weighted Average Essex Ownership Percentage | | | Apartment Homes | | | Total Undepreciated Book Value | | | Debt Amount | | | Essex Book Value | | | Weighted Average Borrowing Rate | | | Remaining Term of Debt (in Years) | | | Three Months Ended December 31, 2017 | | | Twelve Months Ended December 31, 2017 | |
| | | | | | | | | | | | | | | | | | |
| | | | | | | | | | | | | | | | | | |
| | | | | | | | | | | | | | | | | | | | | | | | | | | | |
| Operating and Other Non-Consolidated Joint Ventures | | | | | | | | | | | | | | | | | | | | | | NOI | |
| | | | | | | | | | | | | | | | | | | | | | | | | | | | |
| Wesco I, III, IV, and V | | 53 | % | | | 4,578 | | | $ | 1,303,919 | | | $ | 732,646 | | | $ | 214,408 | | | | 3.7 | % | | | 5.7 | | | $ | 22,453 | | | $ | 76,710 | |
BEXAEW, BEX II, and BEX III (1) | | 50 | % | | | 2,620 | | | | 678,435 | | | | 373,142 | | | | 13,827 | | | | 3.4 | % | | | 3.6 | | | | 11,450 | | | | 44,919 | |
| CPPIB | | | 54 | % | | | 2,483 | | | | 948,392 | | | | - | | | | 500,287 | | | | - | | | | - | | | | 13,372 | | | | 49,252 | |
| Other | | | 52 | % | | | 1,129 | | | | 419,194 | | | | 314,137 | | | | 51,810 | | | | 3.2 | % | | | 6.5 | | | | 5,453 | | | | 18,229 | |
| Total Operating and Other Non-Consolidated Joint Ventures | | | | | | 10,810 | | | $ | 3,349,940 | | | $ | 1,419,925 | | | $ | 780,332 | | | | 3.5 | % | | | 5.4 | | | $ | 52,728 | | | $ | 189,110 | |
Development Non-Consolidated Joint Ventures (2) | | 50 | % | | | 814 | | | | 189,779 | | | | 60,220 | | | | 73,770 | | | | 3.4 | % | | | 29.3 | (3) | | | - | | | | - | |
| Total Non-Consolidated Joint Ventures | | | | | | 11,624 | | | $ | 3,539,719 | | | $ | 1,480,145 | | | $ | 854,102 | | | | | | | | | | | $ | 52,728 | | | $ | 189,110 | |
| | | | | | | | | | | | | | | | | | | | | | | | | | | | | | | | | | | | | |
| | | | | | | | | | | | | | | | | | | | | | | | | | | | | | | Essex Portion of NOI and Expenses | |
| NOI | | | | | | | | | | | | | | | | | | | | | | | | | | | | | | $ | 26,240 | | | $ | 97,830 | |
| Depreciation | | | | | | | | | | | | | | | | | | | | | | | | | | | | | | | (15,196 | ) | | | (55,531 | ) |
| Interest expense and other | | | | | | | | | | | | | | | | | | | | | | | | | | | | | | | (7,046 | ) | | | (24,965 | ) |
| Gain on sale of co-investments | | | | | | | | | | | | | | | | | | | | | | | | | | | | | | | 34,779 | | | | 44,837 | |
| Net income from operating and other co-investments | | | | | | | | | | | | | | | | | | | | | | | | | | | $ | 38,777 | | | $ | 62,171 | |
| | | | | | | | | | | | | | | | | | | | | | | | | | | | | | | | | | | | | |
| | | | | | | | | | | | | | | | | | | | | | | | | | | | | | | | | | | | | |
| | | | | | | | | | | | | | | | | | | | | | | | | | | | | | | | | | | |
| | | | | | | | | | | | | | | | | | | | | | | Weighted Average Preferred Return | | | Weighted Average Expected Term | | | Income from Preferred Equity Investments | |
| Income from preferred equity investments | | | | | | | | | | | | | | | | | | | | | | | | | | | $ | 6,634 | | | $ | 23,918 | |
| Income from early redemption of preferred equity investments | | | | | | | | | | | | | | | | | | | | | | | | | | | | 100 | | | | 356 | |
Preferred Equity Investments (4) | | | | | | | | | | | | | | | | | | $ | 265,156 | | | | 10.9 | % | | | 2.8 | | | $ | 6,734 | | | $ | 24,274 | |
| | | | | | | | | | | | | | | | | | | | | | | | | | | | | | | | | | | | | |
| Total Co-investments | | | | | | | | | | | | | | | | | | $ | 1,119,258 | | | | | | | | | | | $ | 45,511 | | | $ | 86,445 | |
(1) | As of December 31, 2017, the Company’s investment in BEX II was classified as a liability of $36.7 million. |
(2) | The Company has interests in two development co-investments, which are detailed on page S-11. |
(3) | $51.1 million of the debt related to 500 Folsom is financed by tax exempt bonds with a maturity date of January 2052. |
(4) | As of December 31, 2017, the Company has invested in 18 preferred equity investments. |
E S S E X P R O P E R T Y T R U S T, I N C.
Assumptions for 2018 FFO Guidance Range
Q4 2017 Earnings Results Supplement
| The guidance projections below are based on current expectations and are forward-looking. See page S-14.1 for the reconciliations of earnings per share (“EPS”) to FFO per share and Core FFO per share. The guidance on this page is given for Net Operating Income (“NOI”) and Total and Core FFO. See pages S-17.1 to S-17.4 for the definitions of non-GAAP financial measures and other terms. |
($’s in thousands, except per share data) | | 2017 | | | 2018 Full-Year Guidance Range | |
| | | Actuals (1) | | | Low End | | | High End | |
| | | | | | | | | | |
| Total NOI from Consolidated Communities | | $ | 978,939 | | | $ | 993,600 | | | $ | 1,011,400 | |
| | | | | | | | | | | | | |
| Accretion from Acquisitions Net of Dispositions | | | - | | | | 1,100 | | | | 2,100 | |
| | | | | | | | | | | | | |
| Management Fees | | | 9,574 | | | | 8,700 | | | | 9,700 | |
| | | | | | | | | | | | | |
Interest Expense | | | | | | | | | | | | |
| Interest expense, before capitalized interest | | | (226,734 | ) | | | (233,100 | ) | | | (229,700 | ) |
| Interest capitalized | | | 13,860 | | | | 17,100 | | | | 19,100 | |
| Net interest expense | | | (212,874 | ) | | | (216,000 | ) | | | (210,600 | ) |
| | | | | | | | | | | | | |
Recurring Income and Expenses | | | | | | | | | | | | |
| Interest and other income | | | 22,671 | | | | 25,200 | | | | 26,200 | |
| FFO from co-investments | | | 97,310 | | | | 113,000 | | | | 116,200 | |
| General and administrative expense | | | (42,995 | ) | | | (43,600 | ) | | | (45,600 | ) |
Corporate-level property management (2) | | | (30,156 | ) | | | (30,500 | ) | | | (31,600 | ) |
| Non-controlling interest | | | (10,446 | ) | | | (11,700 | ) | | | (10,700 | ) |
| Total recurring income and expenses | | | 36,384 | | | | 52,400 | | | | 54,500 | |
| | | | | | | | | | | | | |
Non-Core Income and Expenses | | | | | | | | | | | | |
| Gain on sale of marketable securities | | | 1,909 | | | | - | | | | - | |
| Loss on early retirement of debt | | | (1,796 | ) | | | - | | | | - | |
| Expensed acquisition and investment related costs | | | (1,569 | ) | | | (500 | ) | | | (1,200 | ) |
| Other non-core adjustments | | | 1,542 | | | | - | | | | - | |
| Total non-core income and expenses | | | 86 | | | | (500 | ) | | | (1,200 | ) |
| | | | | | | | | | | | | |
Funds from Operations (3) | | $ | 812,109 | | | $ | 839,300 | | | $ | 865,900 | |
| Funds from Operations per diluted share | | $ | 11.91 | | | $ | 12.23 | | | $ | 12.62 | |
| % Change - Funds from Operations | | | 7.1 | % | | | 2.7 | % | | | 6.0 | % |
| Core Funds from Operations (excludes non-core items) | | $ | 812,023 | | | $ | 839,800 | | | $ | 867,100 | |
| Core Funds from Operations per diluted share | | $ | 11.91 | | | $ | 12.24 | | | $ | 12.64 | |
| % Change - Core Funds from Operations | | | 7.9 | % | | | 2.8 | % | | | 6.1 | % |
| EPS - Diluted | | $ | 6.57 | | | $ | 4.42 | | | $ | 4.81 | |
| Weighted average shares outstanding - FFO calculation | | | 68,194 | | | | 68,600 | | | | 68,600 | |
(1) | All non-core items are excluded from the 2017 actuals and included in the non-core income and expense section of the FFO reconciliation. |
(2) | On page S-2, property management expenses, which are an allocation of corporate-level G&A expense pertaining to the properties, are included in property operating expenses. In 2018, in order to align with peer presentation, the company will exclude the property management expenses from property operating expenses and report it as a separate line item on the income statement. 2017 actual property management expenses on this page have been reclassified to conform with the Company’s 2018 presentation. |
(3) | 2018 Guidance excludes projected gain on sale of marketable securities, loss on early retirement of debt, political/legislative costs, and promote income until they are realized within the reporting period presented in the report. |
E S S E X P R O P E R T Y T R U S T, I N C.
Reconciliation of Projected EPS, FFO and Core FFO per diluted Share
Projected EPS, FFO and Core FFO per diluted share
With respect to the Company’s guidance regarding its projected FFO and Core FFO for the first quarter of 2018 and full-year 2018, which guidance is set forth in the earnings release for the fourth quarter of 2017 and on page S-14 of this supplement, a reconciliation of projected net income per share to projected FFO per share and projected Core FFO per share, as set forth in such guidance, is presented in the table below.
| | | | | | 2018 Guidance Range (1) | |
| | | 2017 Actuals | | | 1st Quarter 2018 | | | Full-Year 2018 | |
| | | | | Low | | | High | | | Low | | | High | |
| EPS - diluted | | $ | 6.57 | | | $ | 1.03 | | | $ | 1.13 | | | $ | 4.42 | | | $ | 4.81 | |
| Conversion from GAAP share count | | | (0.22 | ) | | | (0.04 | ) | | | (0.04 | ) | | | (0.15 | ) | | | (0.15 | ) |
| Depreciation & amortization expense | | | 7.69 | | | | 1.96 | | | | 1.96 | | | | 7.81 | | | | 7.81 | |
| Noncontrolling interests related to Operating Partnership units | | | 0.21 | | | | 0.04 | | | | 0.04 | | | | 0.15 | | | | 0.15 | |
| Gain on sale of real estate | | | (2.34 | ) | | | - | | | | - | | | | - | | | | - | |
| FFO per share - diluted | | | 11.91 | | | | 2.99 | | | | 3.09 | | | | 12.23 | | | | 12.62 | |
| Gain on sale of marketable securities | | | (0.03 | ) | | | - | | | | - | | | | - | | | | - | |
| Loss on early retirement of debt | | | 0.03 | | | | - | | | | - | | | | - | | | | - | |
| Expensed acquisition and investment related costs | | | 0.02 | | | | - | | | | - | | | | 0.01 | | | | 0.02 | |
| Other non-core adjustments | | | (0.02 | ) | | | - | | | | - | | | | - | | | | - | |
| Core FFO per share - diluted | | $ | 11.91 | | | $ | 2.99 | | | $ | 3.09 | | | $ | 12.24 | | | $ | 12.64 | |
(1) | 2018 Guidance excludes projected gain on sale of real estate and land, gain on sale of marketable securities, loss on early retirement of debt, political/legislative costs, and promote income until they are realized within the reporting period presented in the report. |
E S S E X P R O P E R T Y T R U S T, I N C.
Summary of Apartment Community Acquisitions and Dispositions Activity
Year to date as of December 31, 2017
(Dollars in thousands, except average rent amounts and in footnotes)
Acquisitions| Property Name | | Location | | | Apartment Homes | | | Essex Ownership Percentage | | Entity | Date | | Contract Price | | | Price per Apartment Home | | | Average Rent | |
| | | | | | | | | | | | |
| | | | | | | | | | | | |
| | | | | | | | | | | | | | | | | | | | | |
Palm Valley(1) | | San Jose, CA | | | | 1,098 | | | | 100 | % | EPLP | Jan-17 | | $ | 183,000 | | | $ | 333 | | | $ | 2,566 | |
Sage(2) | | San Jose, CA | | | | 230 | | | | 41 | % | EPLP | Mar-17 | | | 90,000 | | | | 391 | | | | 2,485 | |
| | | Q1 2017 | | | | 1,328 | | | | | | | | | $ | 273,000 | | | $ | 343 | | | | | |
| | | | | | | | | | | | | | | | | | | | | | | | | | | |
| 8th & Republican | | Seattle, WA | | | | 211 | | | | 50 | % | JV | Aug-17 | | $ | 101,300 | (3) | | $ | 480 | | | $ | 2,422 | |
| 360 Residences | | San Jose, CA | | | | 213 | | | | 50 | % | JV | Aug-17 | | | 133,500 | (3) | | $ | 627 | | | | 3,604 | |
| | | Q3 2017 | | | | 424 | | | | | | | | | $ | 234,800 | | | $ | 554 | | | | | |
| | | | | | | | | | | | | | | | | | | | | | | | | | | |
| Village at Toluca Lake | | Burbank, CA | | | | 145 | | | | 50 | % | JV | Nov-17 | | $ | 59,000 | (3) | | $ | 407 | | | $ | 1,940 | |
| | | Q4 2017 | | | | 145 | | | | | | | | | $ | 59,000 | | | $ | 407 | | | | | |
| | | | | | | | | | | | | | | | | | | | | | | | | | | |
| | | 2017 Total | | | | 1,897 | | | | | | | | | $ | 566,800 | | | $ | 395 | | | | | |
Dispositions
| Property Name | | Location | | | Apartment Homes | | | | | Entity | Date | | Sales Price | | | Price per Apartment Home | | | | | |
| | | | | | | | | | | | | | |
| | | | | | | | | | | | | | | | | | | | | | |
| Jefferson at Hollywood | | Hollywood, CA | | | | 270 | | | | 100 | % | EPLP | Jan-17 | | $ | 132,500 | | | $ | 491 | | | | | |
| | | | Q1 2017 | | | | 270 | | | | | | | | | $ | 132,500 | | | $ | 491 | | | | | |
| | | | | | | | | | | | | | | | | | | | | | | | | | | |
| Madrid | | Mission Viejo, CA | | | | 230 | | | | 50 | % | JV | Aug-17 | | $ | 83,000 | (4) | | $ | 361 | | | | | |
| | | | Q3 2017 | | | | 230 | | | | | | | | | $ | 83,000 | | | $ | 361 | | | | | |
| | | | | | | | | | | | | | | | | | | | | | | | | | | |
| Ballinger Commons | | Seattle, WA | | | | 485 | | | | 50 | % | JV | Dec-17 | | $ | 133,400 | (4) | | | 275 | | | | | |
| Citywalk | | Seattle, WA | | | | 102 | | | | 50 | % | JV | Dec-17 | | $ | 26,900 | (4) | | $ | 264 | | | | | |
| | | | Q4 2017 | | | | 587 | | | | | | | | | $ | 160,300 | | | $ | 273 | | | | | |
| | | | | | | | | | | | | | | | | | | | | | | | | | | |
| | | 2017 Total | | | | 1,087 | | | | | | | | | $ | 375,800 | | | $ | 346 | | | | | |
(1) | In January 2017, the Company purchased the joint venture partner’s 50.0% membership interest in the Palm Valley co-investment for a purchase price of $183.0 million. |
(2) | In March 2017, the Company converted its existing $15.3 million preferred equity investment in Sage at Cupertino into a 40.5% equity ownership interest in the property. The Company issued DownREIT limited partnership units to the seller for the remaining equity based on an estimated property valuation of $90.0 million and an encumbrance of $52.0 million of mortgage debt. Based on a VIE analysis performed by the Company, the property was consolidated. |
(3) | 8th & Republican, 360 Residences, and Village at Toluca Lake contract prices represent the total contract price at 100%. |
(4) | Madrid, Ballinger Commons, and Citywalk sales prices represent the total sales price at 100%. |
E S S E X P R O P E R T Y T R U S T, I N C.
2018 MSA Level Forecast: Supply, Jobs, and Apartment Market Conditions
| | | Residential Supply (1) | | | Job Forecast (2) | | | Market Forecast (3) | |
| Market | | New MF Supply | | | New SF Supply | | | Total Supply | | | % of MF Supply to MF Stock | | | % of Total Supply to Total Stock | | | Est. New Jobs | | | % Growth | | | Economic Rent Growth | |
| | | | | | | | | | | | | | | | | | | | | | | | | |
| Los Angeles | | | 11,050 | | | | 5,600 | | | | 16,650 | | | | 0.7 | % | | | 0.5 | % | | | 57,800 | | | | 1.3 | % | | | 2.8 | % |
| Orange | | | 4,650 | | | | 4,400 | | | | 9,050 | | | | 1.1 | % | | | 0.8 | % | | | 22,250 | | | | 1.4 | % | | | 2.7 | % |
| San Diego | | | 4,500 | | | | 3,500 | | | | 8,000 | | | | 1.0 | % | | | 0.7 | % | | | 26,000 | | | | 1.8 | % | | | 3.5 | % |
| Ventura | | | 400 | | | | 1,050 | | | | 1,450 | | | | 0.6 | % | | | 0.5 | % | | | 4,950 | | | | 1.6 | % | | | 3.2 | % |
| So. Cal. | | | 20,600 | | | | 14,550 | | | | 35,150 | | | | 0.9 | % | | | 0.6 | % | | | 111,000 | | | | 1.5 | % | | | 3.0 | % |
| | | | | | | | | | | | | | | | | | | | | | | | | | | | | | | | | |
| San Francisco | | | 3,100 | | | | 550 | | | | 3,650 | | | | 0.8 | % | | | 0.5 | % | | | 20,100 | | | | 1.8 | % | | | 2.8 | % |
| Oakland | | | 2,100 | | | | 4,000 | | | | 6,100 | | | | 0.6 | % | | | 0.6 | % | | | 18,500 | | | | 1.6 | % | | | 3.0 | % |
| San Jose | | | 2,400 | | | | 2,100 | | | | 4,500 | | | | 1.0 | % | | | 0.7 | % | | | 16,300 | | | | 1.5 | % | | | 3.0 | % |
| No. Cal. | | | 7,600 | | | | 6,650 | | | | 14,250 | | | | 0.8 | % | | | 0.6 | % | | | 54,900 | | | | 1.6 | % | | | 3.0 | % |
| | | | | | | | | | | | | | | | | | | | | | | | | | | | | | | | | |
| Seattle | | | 9,900 | | | | 7,550 | | | | 17,450 | | | | 2.1 | % | | | 1.4 | % | | | 35,450 | | | | 2.1 | % | | | 3.2 | % |
| | | | | | | | | | | | | | | | | | | | | | | | | | | | | | | | | |
Weighted Average (4) | | | 38,100 | | | | 28,750 | | | | 66,850 | | | | 1.1 | % | | | 0.8 | % | | | 201,350 | | | | 1.6 | % | | | 3.0 | % |
All data are based on Essex Property Trust, Inc. forecasts.
U.S. Economic Assumptions: 2018 G.D.P. Growth: 2.7%, 2018 Job Growth: 1.4%
(1) | New Residential Supply: total supply includes the Company’s estimate of actual multifamily deliveries including properties with 50+ units and excludes student, senior and 100% affordable housing communities. Single family estimates based on an average trailing 12 month single family permit. Previous presentations had included multifamily deliveries of 100+ units and excluded student, senior and 100% affordable housing. |
(2) | Job Forecast: refers to the difference between total non-farm industry employment (not seasonally adjusted) projected 4Q over 4Q, expressed as total new jobs and growth rates. |
(3) | Market Forecast: the estimated rent growth represents the forecasted change in effective market rents for full year 2018 vs. 2017 (excludes submarkets not targeted by Essex). |
(4) | Weighted Average: markets weighted by scheduled rent in the Company’s Portfolio. |
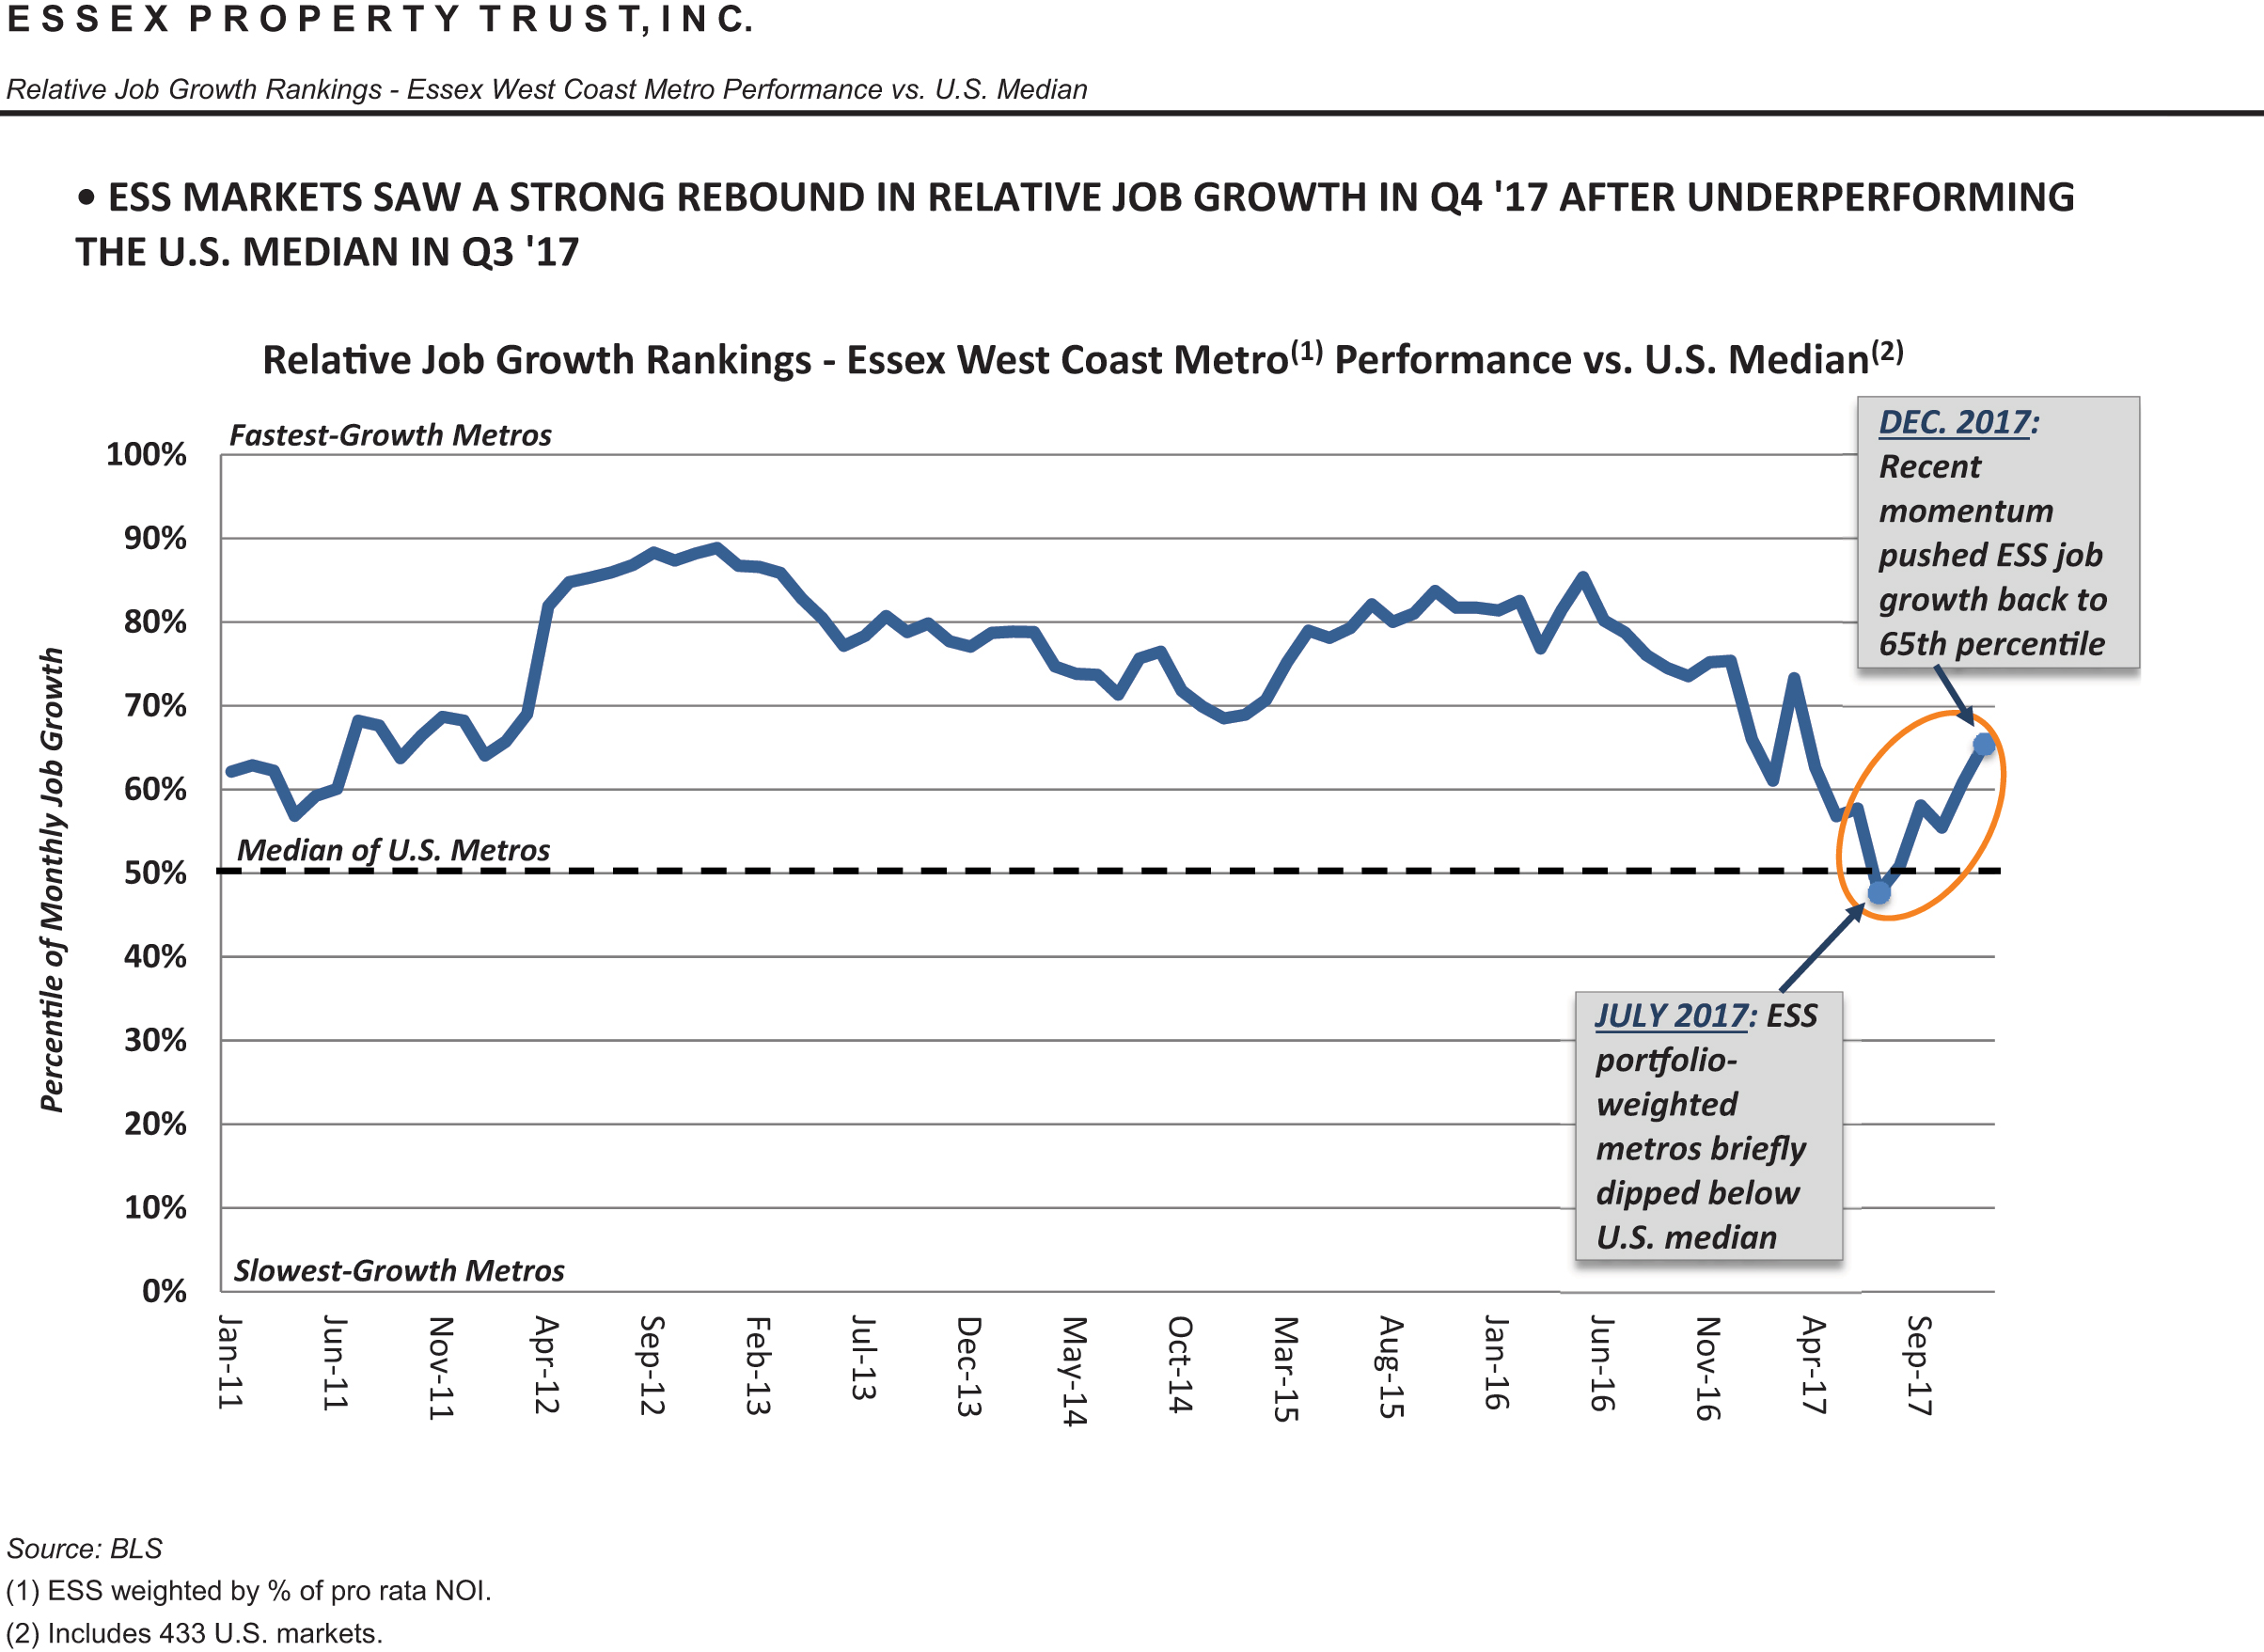
E S S E X P R O P E R T Y T R U S T, I N C.
Reconciliations of Non-GAAP Financial Measures and Other Terms
Adjusted EBITDA Reconciliation
Adjusted EBITDA (earnings before interest, taxes, depreciation, and amortization) is a component of the credit ratio, “Net Indebtedness Divided by Adjusted EBITDA”, presented on page S-6, in the section titled “Selected Credit Ratios”, and it is not intended to be a measure of free cash flow for our management’s discretionary use, as it does not consider certain cash requirements such as income tax payments, debt service requirements, capital expenditures and other fixed charges. Adjusted EBITDA is not a recognized measurement under U.S. generally accepted accounting principles (“U.S. GAAP”). Because not all companies use identical calculations, our presentation of Adjusted EBITDA may not be comparable to similarly titled measures of other companies.
The reconciliation of Adjusted EBITDA to Net Income available to common stockholders is presented in the table below (Dollars in thousands):
| | | Three Months Ended December 31, 2017 | |
| Net income available to common stockholders | | $ | 103,613 | |
| Add: Net income attributable to noncontrolling interest | | | 6,049 | |
| Net Income | | | 109,662 | |
| Adjustments: | | | | |
| Acquisition and investment related costs | | | 415 | |
| Depreciation and amortization | | | 117,988 | |
| Equity income from co-investments | | | (3,998 | ) |
| Gain on sale of marketable securities | | | (259 | ) |
| Gain on sale of co-investment communities | | | (34,779 | ) |
| Insurance reimbursements, legal settlements and other, net | | | (1,418 | ) |
| Income from early redemption of preferred equity investments | | | (100 | ) |
Interest expense, net (1) | | | 53,116 | |
| Loss on early retirement of debt | | | 1,796 | |
| Adjusted EBITDA | | $ | 242,423 | |
| | | | | |
| (1) | Internet expense, net includes items such as gains on derivatives and the amortization of deferred charges. |
Encumbered means any mortgage, deed of trust, lien, charge, pledge, security interest, security agreement or other encumbrance of any kind.
Funds From Operations (“FFO”)
FFO, as defined by the National Association of Real Estate Investment Trusts (“NAREIT”), is generally considered by industry analysts as an appropriate measure of performance of an equity REIT. Generally, FFO adjusts the net income of equity REITs for non-cash charges such as depreciation and amortization of rental properties, impairment charges, gains on sales of real estate and extraordinary items. Management considers FFO and FFO which excludes merger, integration and acquisition costs and items that are not routine or not related to the Company’s core business activities, which is referred to as “Core FFO”, to be useful financial performance measures of an equity REIT because, together with net income and cash flows, FFO and Core FFO provide investors with additional bases to evaluate the operating performance and ability of a REIT to incur and service debt and to fund acquisitions and other capital expenditures and the ability to pay dividends.
E S S E X P R O P E R T Y T R U S T, I N C.
Reconciliations of Non-GAAP Financial Measures and Other Terms
Funds From Operations (“FFO”) - continued
FFO and Core FFO do not represent net income or cash flows from operations as defined by U.S. GAAP and are not intended to indicate whether cash flows will be sufficient to fund cash needs. These measures should not be considered as an alternative to net income as an indicator of the REIT’s operating performance or to cash flows as a measure of liquidity. FFO and Core FFO do not measure whether cash flow is sufficient to fund all cash needs including principal amortization, capital improvements and distributions to shareholders. FFO and Core FFO do not represent cash flows generated from operating, investing or financing activities as defined under U.S. GAAP. Management has consistently applied the NAREIT definition of FFO to all periods presented. However, there is judgment involved and other REITs’ calculation of FFO may vary from the NAREIT definition for this measure, and thus their disclosures of FFO may not be comparable to the Company’s calculation.
The reconciliations of diluted FFO and Core FFO are detailed on page S-3 in the section titled “Consolidated Funds From Operations”.
Interest Expense, Net
Interest expense, net is presented on page S-1 in the section titled “Consolidated Operating Results”. Interest expense, net includes items such as gains on derivatives and the amortization of deferred charges and is presented in the table below (Dollars in thousands):
| | | Three Months Ended December 31, 2017 | | | Twelve Months Ended December 31, 2017 | |
| |
| |
| Interest expense | | $ | 55,561 | | | $ | 222,894 | |
| Adjustments: | | | | | | | | |
| Total return swap income | | | (2,445 | ) | | | (10,098 | ) |
| Interest expense, net | | $ | 53,116 | | | $ | 212,796 | |
Net Indebtedness Divided by Adjusted EBITDA
This credit ratio is presented on page S-6 in the section titled “Selected Credit Ratios”. This credit ratio is calculated by dividing net indebtedness by Adjusted EBITDA, as annualized based on the most recent quarter, and adjusted for estimated net operating income from properties acquired or disposed of during the quarter. This ratio is presented by the Company because it provides rating agencies and investors an additional means of comparing the Company’s ability to service debt obligations to that of other companies. Net indebtedness is total debt, net less unamortized premiums, discounts, debt issuance costs, unrestricted cash and cash equivalents, and marketable securities. The reconciliation of Adjusted EBITDA is set forth in “Adjusted EBITDA Reconciliation” on page S-17.1 The calculation of this credit ratio and a reconciliation of net indebtedness to total debt, net is presented in the table below (Dollars in thousands):
| Total debt, net | | $ | 5,689,126 | |
| Adjustments: | | | | |
| Unamortized premiums, discounts, and debt issuance costs | | | (4,565 | ) |
| Cash and cash equivalents-unrestricted | | | (44,620 | ) |
| Marketable securities | | | (190,004 | ) |
| Net Indebtedness | | $ | 5,449,937 | |
| | | | | |
Adjusted EBITDA, annualized (1) | | $ | 969,692 | |
Other EBITDA normalization adjustments, net, annualized (2) | | | 2,355 | |
| Adjusted EBITDA, normalized and annualized | | $ | 972,047 | |
| | | | | |
| Net Indebtedness Divided by Adjusted EBITDA, normalized and annualized | | | 5.6 | |
(1) | Based on the amount for the most recent quarter, multiplied by four. |
(2) | Adjustments made for properties acquired or disposed of during the most recent quarter and other partial quarter activity, multiplied by four. |
E S S E X P R O P E R T Y T R U S T, I N C.
Reconciliations of Non-GAAP Financial Measures and Other Terms
Net Operating Income (“NOI”) and Same-Property NOI Reconciliations
Net Operating Income (“NOI”) and same-property NOI are considered by management to be important supplemental performance measures to earnings from operations included in the Company’s consolidated statements of income. The presentation of same-property NOI assists with the presentation of the Company’s operations prior to the allocation of depreciation and any corporate-level or financing-related costs. NOI reflects the operating performance of a community and allows for an easy comparison of the operating performance of individual communities or groups of communities. In addition, because prospective buyers of real estate have different financing and overhead structures, with varying marginal impacts to overhead by acquiring real estate, NOI is considered by many in the real estate industry to be a useful measure for determining the value of a real estate asset or group of assets. The Company defines same-property NOI as same-property revenue less same-property operating expenses, including property taxes. Please see the reconciliation of earnings from operations to NOI and same-property NOI, which in the table below is the NOI for stabilized properties consolidated by the Company for the periods presented (Dollars in thousands):
| | | Three Months Ended December 31, 2017 | | | Three Months Ended December 31, 2016 | | | Twelve Months Ended December 31, 2017 | | | Twelve Months Ended December 31, 2016 | |
| Earnings from operations | | $ | 112,375 | | | $ | 105,520 | | | $ | 446,522 | | | $ | 420,800 | |
| Adjustments: | | | | | | | | | | | | | | | | |
| Depreciation and amortization | | | 117,988 | | | | 111,835 | | | | 468,881 | | | | 441,682 | |
| Management and other fees from affiliates | | | (2,647 | ) | | | (2,133 | ) | | | (9,574 | ) | | | (8,278 | ) |
| General and administrative | | | 10,659 | | | | 12,224 | | | | 41,385 | | | | 40,751 | |
| Acquisition and investment related costs | | | 415 | | | | 462 | | | | 1,569 | | | | 1,841 | |
| NOI | | | 238,790 | | | | 227,908 | | | | 948,783 | | | | 896,796 | |
| Less: Non-same property NOI | | | (22,414 | ) | | | (18,622 | ) | | | (91,096 | ) | | | (73,549 | ) |
| Same-Property NOI | | $ | 216,376 | | | $ | 209,286 | | | $ | 857,687 | | | $ | 823,247 | |
Public Bond Covenants
Public Bond Covenants refer to certain covenants set forth in instruments governing the Company’s unsecured indebtedness. These instruments require the Company to meet specified financial covenants, including covenants relating to net worth, fixed charge coverage, debt service coverage, the amounts of total indebtedness and secured indebtedness, leverage and certain investment limitations. These covenants may restrict the Company’s ability to expand or fully pursue its business strategies. The Company’s ability to comply with these covenants may be affected by changes in the Company’s operating and financial performance, changes in general business and economic conditions, adverse regulatory developments or other events adversely impacting it. The breach of any of these covenants could result in a default under the Company’s indebtedness, which could cause those and other obligations to become due and payable. If any of the Company’s indebtedness is accelerated, it may not be able to repay it. For risks related to failure to comply with these covenants, see “Item 1A: Risk Factors - Risks Related to Our Indebtedness and Financings” in the Company’s annual report on Form 10-K and other reports filed by the Company with the Securities and Exchange Commission (“SEC”).
The ratios set forth on page S-6 in the section titled “Public Bond Covenants” are provided only to show the Company’s compliance with certain specified covenants that are contained in indentures related to the Company’s issuance of Senior Notes, which indentures are filed by the Company with the SEC. See, for example, the Indenture dated April 10, 2017, filed by the Company as Exhibit 4.1 to the Company’s Form 8-K, filed on April 10, 2017. These ratios should not be used for any other purpose, including without limitation to evaluate the Company’s financial condition or results of operations, nor do they indicate the Company’s covenant compliance as of any other date or for any other period. The capitalized terms in the disclosure are defined in the indentures filed by the Company with the SEC and may differ materially from similar terms used by other companies that present information about their covenant compliance.
Secured Debt
Secured Debt means debt of the Company or any of its subsidiaries which is secured by an encumbrance on any property or assets of the Company or any of its subsidiaries. The Company’s total amount of Secured Debt is set forth on page S-5.
E S S E X P R O P E R T Y T R U S T, I N C.
Reconciliations of Non-GAAP Financial Measures and Other Terms
Unencumbered NOI to Adjusted Total NOI
This ratio is presented on page S-6 in the section titled “Selected Credit Ratios”. Unencumbered NOI means the sum of NOI for those real estate assets which are not subject to an encumbrance securing debt. The ratio of Unencumbered NOI to Adjusted Total NOI for the three months ended December 31, 2017, annualized, is calculated by dividing Unencumbered NOI, annualized for the three months ended December 31, 2017 and as further adjusted for pro forma NOI for properties acquired or sold during the recent quarter, by Adjusted Total NOI as annualized. The calculation and reconciliation of NOI is set forth in “Net Operating Income (“NOI”) and Same-Property NOI Reconciliation” above. This ratio is presented by the Company because it provides rating agencies and investors an additional means of comparing the Company’s ability to service debt obligations to that of other companies. The calculation of this ratio is presented in the table below (Dollars in thousands):
| | | Annualized Q4’17 (1) | |
| NOI | | $ | 955,160 | |
| Adjustments: | | | | |
Other, net (2) | | | (2,676 | ) |
| Adjusted Total NOI | | | 952,484 | |
| Less: Encumbered NOI | | | (278,819 | ) |
| Unencumbered NOI | | $ | 673,665 | |
| | | | | |
| Encumbered NOI | | $ | 278,819 | |
| Unencumbered NOI | | | 673,665 | |
| Adjusted Total NOI | | $ | 952,484 | |
| | | | | |
| Unencumbered NOI to Adjusted Total NOI | | | 71 | % |
(1) | This table is based on the amounts for the most recent quarter, multiplied by four. |
(2) | Includes intercompany eliminations pertaining to self-insurance and other expenses. |
S-17.4