Exhibit 99.1

INVESTOR PRESENTATIONMARCH 2018

ABOUT ESSEXPROVEN TRACK RECORDWEST COAST INVESTMENT STRATEGYINVESTMENT OVERVIEWFINANCIAL PERFORMANCE, 2018 GUIDANCE, & CAPITAL STRUCTUREAPPENDIX ESSEX PORTFOLIO SUSTAINABILITYDEFINITIONS & RECONCILIATIONS PAGE(S)2 – 3 4 – 7 8 – 2021 – 2526 – 3334 35 – 3839 – 4243 – 51 TABLE OF CONTENTS *
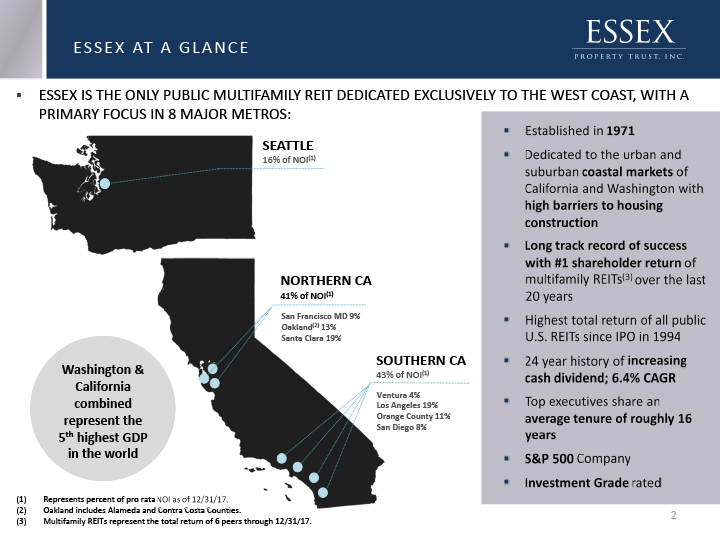
Represents percent of pro rata NOI as of 12/31/17.Oakland includes Alameda and Contra Costa Counties.Multifamily REITs represent the total return of 6 peers through 12/31/17. * San Francisco MD 9%Oakland(2) 13%Santa Clara 19% Ventura 4%Los Angeles 19%Orange County 11%San Diego 8% SOUTHERN CA43% of NOI(1) NORTHERN CA41% of NOI(1) Washington & California combined represent the 5th highest GDP in the world SEATTLE16% of NOI(1) ESSEX IS THE ONLY PUBLIC MULTIFAMILY REIT DEDICATED EXCLUSIVELY TO THE WEST COAST, WITH A PRIMARY FOCUS IN 8 MAJOR METROS: ESSEX AT A GLANCE

KEY STRATEGIC OBJECTIVES 360 ResidencesSan Jose, CA(2017 Acquisition) *

PROVEN TRACK RECORD Century TowersSan Jose, CA(2017 Development)
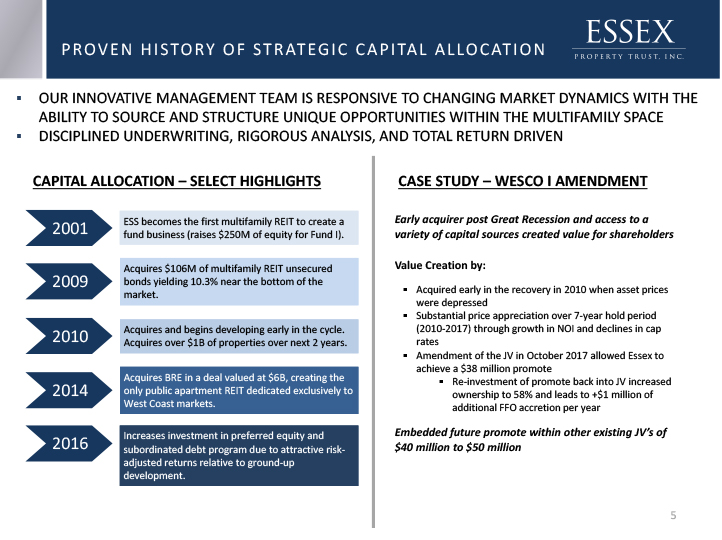
Acquires BRE in a deal valued at $6B, creating the only public apartment REIT dedicated exclusively to West Coast markets. Increases investment in preferred equity and subordinated debt program due to attractive risk-adjusted returns relative to ground-up development. Acquires and begins developing early in the cycle. Acquires over $1B of properties over next 2 years. ESS becomes the first multifamily REIT to create a fund business (raises $250M of equity for Fund I). Acquires $106M of multifamily REIT unsecured bonds yielding 10.3% near the bottom of the market. PROVEN HISTORY OF STRATEGIC CAPITAL ALLOCATION * OUR INNOVATIVE MANAGEMENT TEAM IS RESPONSIVE TO CHANGING MARKET DYNAMICS WITH THE ABILITY TO SOURCE AND STRUCTURE UNIQUE OPPORTUNITIES WITHIN THE MULTIFAMILY SPACEDISCIPLINED UNDERWRITING, RIGOROUS ANALYSIS, AND TOTAL RETURN DRIVEN 2016 2014 2010 2009 2001 CAPITAL ALLOCATION – SELECT HIGHLIGHTS CASE STUDY – WESCO I AMENDMENT Early acquirer post Great Recession and access to a variety of capital sources created value for shareholders Value Creation by:Acquired early in the recovery in 2010 when asset prices were depressed Substantial price appreciation over 7-year hold period (2010-2017) through growth in NOI and declines in cap ratesAmendment of the JV in October 2017 allowed Essex to achieve a $38 million promoteRe-investment of promote back into JV increased ownership to 58% and leads to +$1 million of additional FFO accretion per year Embedded future promote within other existing JV’s of $40 million to $50 million
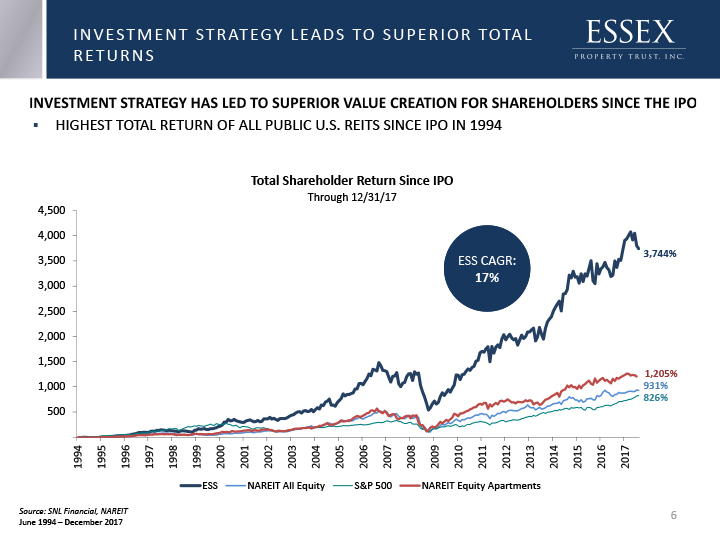
INVESTMENT STRATEGY LEADS TO SUPERIOR TOTAL RETURNS HIGHEST TOTAL RETURN OF ALL PUBLIC U.S. REITS SINCE IPO IN 1994 Source: SNL Financial, NAREITJune 1994 – December 2017 * ESS CAGR: 17% 3,744% 1,205% 931% 826%
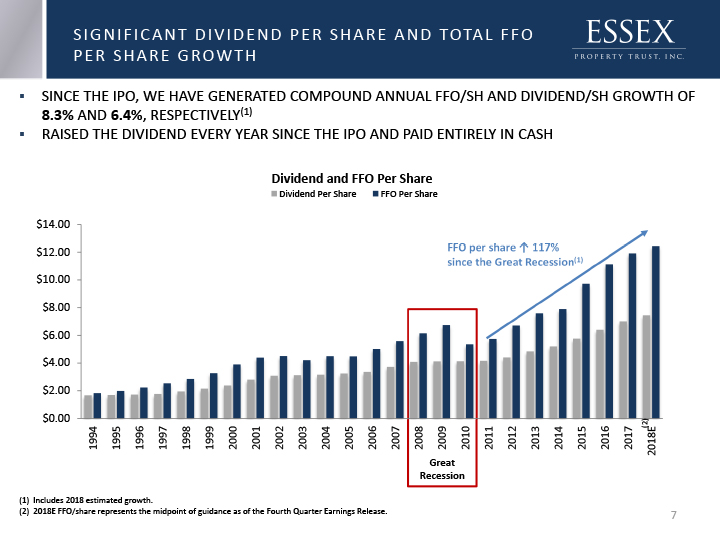
* SINCE THE IPO, WE HAVE GENERATED COMPOUND ANNUAL FFO/SH AND DIVIDEND/SH GROWTH OF 8.3% AND 6.4%, RESPECTIVELY(1)RAISED THE DIVIDEND EVERY YEAR SINCE THE IPO AND PAID ENTIRELY IN CASH SIGNIFICANT DIVIDEND PER SHARE AND TOTAL FFO PER SHARE GROWTH (1) Includes 2018 estimated growth.(2) 2018E FFO/share represents the midpoint of guidance as of the Fourth Quarter Earnings Release. Great Recession FFO per share ↑ 117% since the Great Recession(1) (2)

SOLID WEST COAST FUNDAMENTALS Gas Company LoftsLos Angeles, CA(Renovation included the addition of rooftop amenity with pool)

WHY WEST COAST MARKETS? * LONG-TERM FAVORABLE SUPPLY/DEMAND DYNAMICS
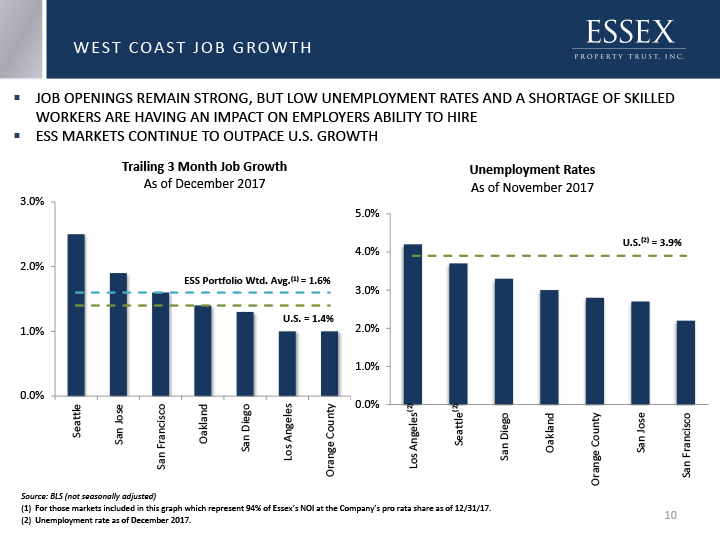
WEST COAST JOB GROWTH JOB OPENINGS REMAIN STRONG, BUT LOW UNEMPLOYMENT RATES AND A SHORTAGE OF SKILLED WORKERS ARE HAVING AN IMPACT ON EMPLOYERS ABILITY TO HIREESS MARKETS CONTINUE TO OUTPACE U.S. GROWTH Source: BLS (not seasonally adjusted)(1) For those markets included in this graph which represent 94% of Essex’s NOI at the Company’s pro rata share as of 12/31/17.(2) Unemployment rate as of December 2017. * ESS Portfolio Wtd. Avg.(1) = 1.6% U.S. = 1.4% (2) (2) U.S.(2) = 3.9%
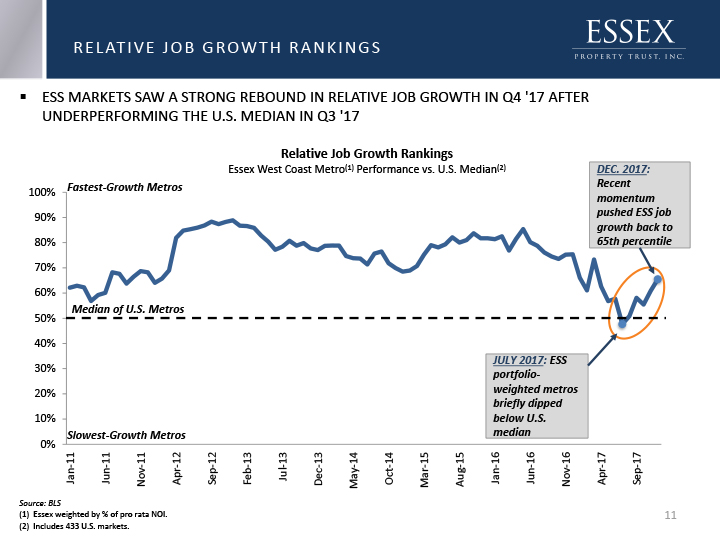
* ESS MARKETS SAW A STRONG REBOUND IN RELATIVE JOB GROWTH IN Q4 '17 AFTER UNDERPERFORMING THE U.S. MEDIAN IN Q3 '17 RELATIVE JOB GROWTH RANKINGS Source: BLS (1) Essex weighted by % of pro rata NOI.(2) Includes 433 U.S. markets.
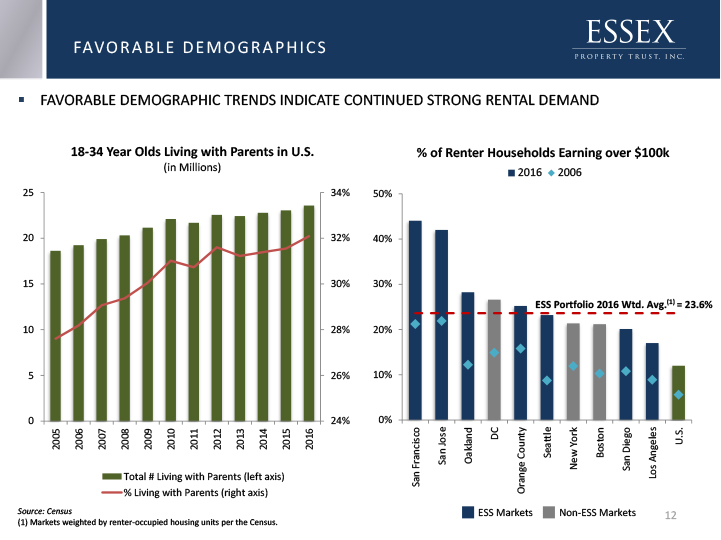
* FAVORABLE DEMOGRAPHICS FAVORABLE DEMOGRAPHIC TRENDS INDICATE CONTINUED STRONG RENTAL DEMAND Source: Census(1) Markets weighted by renter-occupied housing units per the Census. ESS Portfolio 2016 Wtd. Avg.(1) = 23.6%
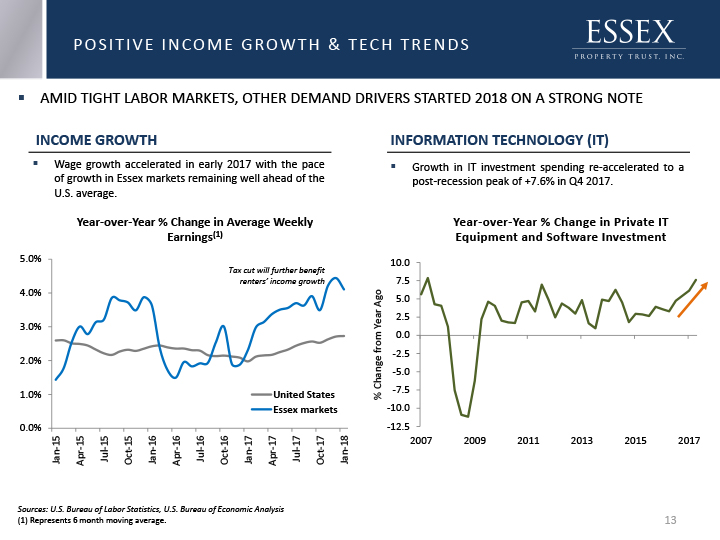
POSITIVE INCOME GROWTH & TECH TRENDS * Wage growth accelerated in early 2017 with the pace of growth in Essex markets remaining well ahead of the U.S. average. Sources: U.S. Bureau of Labor Statistics, U.S. Bureau of Economic Analysis(1) Represents 6 month moving average. Tax cut will further benefit renters’ income growth Year-over-Year % Change in Private IT Equipment and Software Investment AMID TIGHT LABOR MARKETS, OTHER DEMAND DRIVERS STARTED 2018 ON A STRONG NOTE Growth in IT investment spending re-accelerated to a post-recession peak of +7.6% in Q4 2017. INCOME GROWTH INFORMATION TECHNOLOGY (IT) Year-over-Year % Change in Average Weekly Earnings(1)
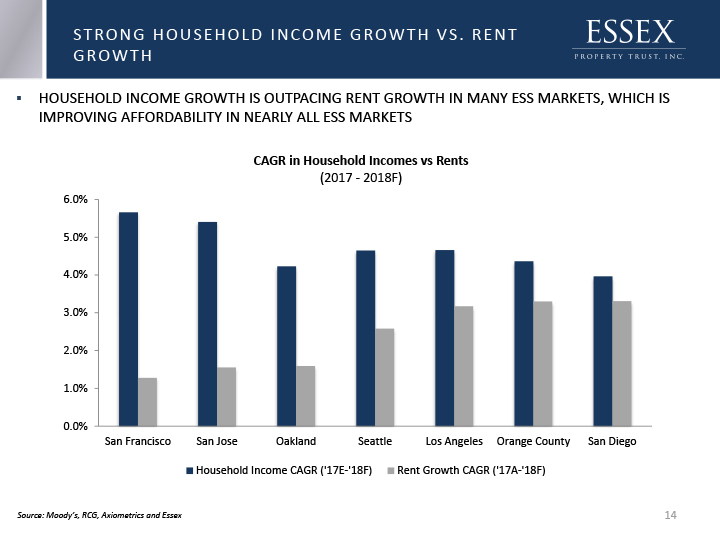
* Source: Moody’s, RCG, Axiometrics and Essex STRONG HOUSEHOLD INCOME GROWTH VS. RENT GROWTH HOUSEHOLD INCOME GROWTH IS OUTPACING RENT GROWTH IN MANY ESS MARKETS, WHICH IS IMPROVING AFFORDABILITY IN NEARLY ALL ESS MARKETS
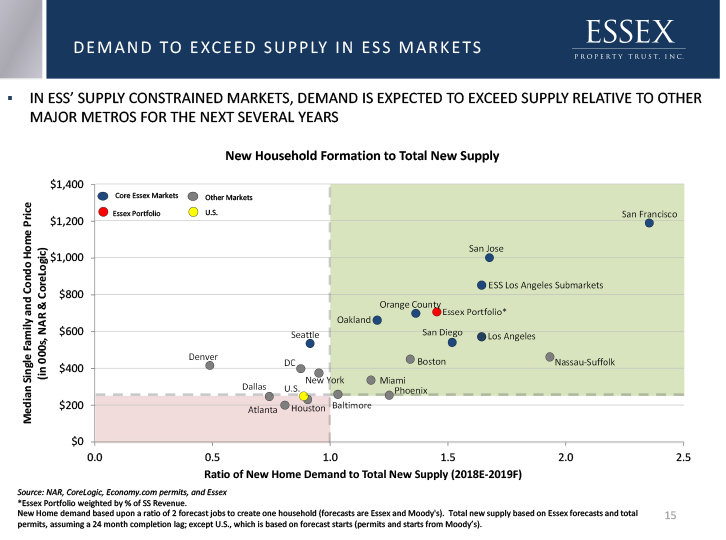
* DEMAND TO EXCEED SUPPLY IN ESS MARKETS IN ESS’ SUPPLY CONSTRAINED MARKETS, DEMAND IS EXPECTED TO EXCEED SUPPLY RELATIVE TO OTHER MAJOR METROS FOR THE NEXT SEVERAL YEARS Source: NAR, CoreLogic, Economy.com permits, and Essex*Essex Portfolio weighted by % of SS Revenue.New Home demand based upon a ratio of 2 forecast jobs to create one household (forecasts are Essex and Moody's). Total new supply based on Essex forecasts and total permits, assuming a 24 month completion lag; except U.S., which is based on forecast starts (permits and starts from Moody’s). New Household Formation to Total New Supply
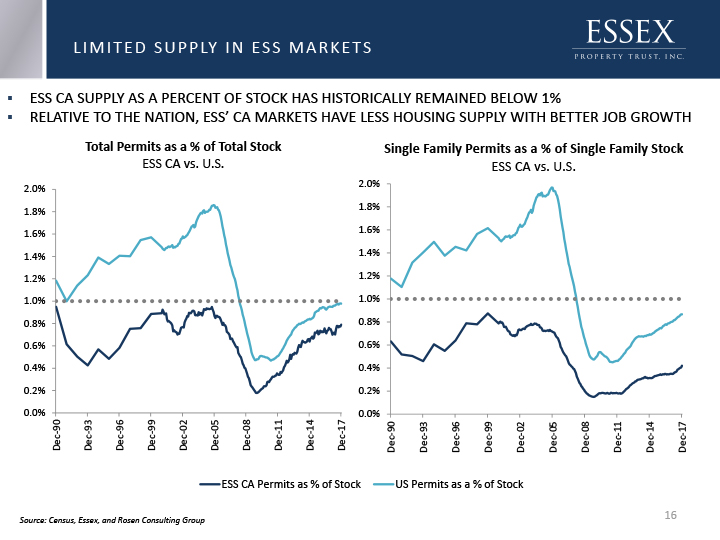
Source: Census, Essex, and Rosen Consulting Group LIMITED SUPPLY IN ESS MARKETS ESS CA SUPPLY AS A PERCENT OF STOCK HAS HISTORICALLY REMAINED BELOW 1% RELATIVE TO THE NATION, ESS’ CA MARKETS HAVE LESS HOUSING SUPPLY WITH BETTER JOB GROWTH *

MULTIFAMILY SUPPLY AS A % OF MULTIFAMILY STOCK IS EXPECTED TO DECREASE ACROSS THE ESSEX MARKETS IN 2018 AND 2019TOTAL SUPPLY AS A % OF TOTAL STOCK IS EXPECTED TO DECLINE IN 2018 AND REMAIN FLAT IN 2019 Source: Essex(1) Weighted by ESS Dec'17 YTD SS Scheduled Rent. ESSEX SUPPLY OUTLOOK *
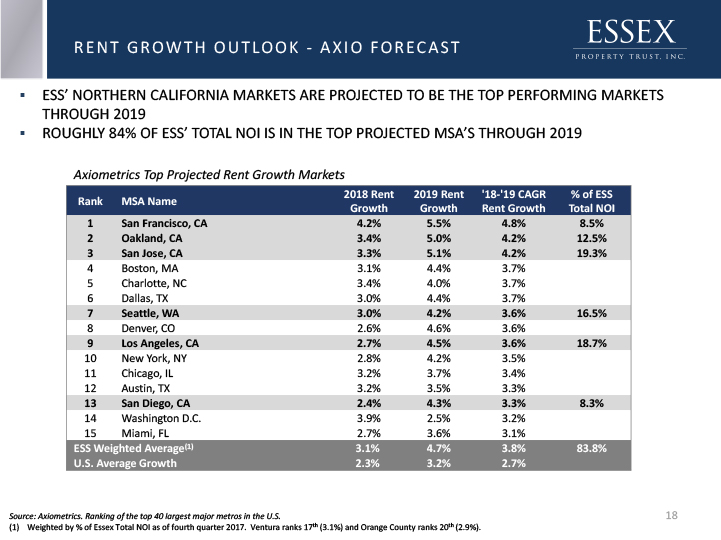
RENT GROWTH OUTLOOK - AXIO FORECAST Source: Axiometrics. Ranking of the top 40 largest major metros in the U.S.Weighted by % of Essex Total NOI as of fourth quarter 2017. Ventura ranks 17th (3.1%) and Orange County ranks 20th (2.9%). ESS’ NORTHERN CALIFORNIA MARKETS ARE PROJECTED TO BE THE TOP PERFORMING MARKETS THROUGH 2019ROUGHLY 84% OF ESS’ TOTAL NOI IS IN THE TOP PROJECTED MSA’S THROUGH 2019 Axiometrics Top Projected Rent Growth Markets *

TAX CUTS: TILTING THE RENT/BUY EQUATION * Positive for owners & renters: Lower marginal rates and higher standard deductionNegative for owners/first-time buyers: New/lower caps on property tax and mortgage interest deductions Source: Urban Institute (2018) Note: Estimated changes to breakeven rents based on constant home prices. Tax policy changes raise “breakeven rents” significantly Three scenarios for income and housing/mortgage values Net effect is tax cut at middle-incomes, but offset by prop tax & mort. interest changes at higher income/home values NEW DEDUCTION CAPS RAISE BREAKEVEN RENTS FOR FIRST-TIME HOMEBUYERS Household Income for a Family of 3 Household Income for a Family of 3 Household Income for a Family of 3 Household Income for a Family of 3 Household Income for a Family of 3 $ 75,000 $ 150,000 $ 300,000 Assumptions Home value (4x income) $ 300,000 $ 600,000 $ 1,200,000 Mortgage (20% down) $ 240,000 $ 480,000 $ 960,000 Tax Calculations Income Tax Due (2017) $ 4,792 $ 15,616 $ 46,254 Income Tax Due (2018) $ 3,739 $ 15,829 $ 47,597 Tax Difference (2018 v. 2017) $ 1,053 $ (213) $ (1,343) -- tax cut -- -- tax increase -- -- tax increase -- -- tax increase -- Breakeven Calculations Monthly Breakeven Rent (2017) $ 893 $ 1,508 $ 2,757 Monthly Breakeven Rent (2018) $ 1,017 $ 1,886 $ 3,631 Chg. to Breakeven Rent (2018 v. 2017) +$ 124 +$ 378 +$ 874 % Change to Breakeven Rent +14% +25% +32% Impact of Tax Changes on Cost of Homeownership
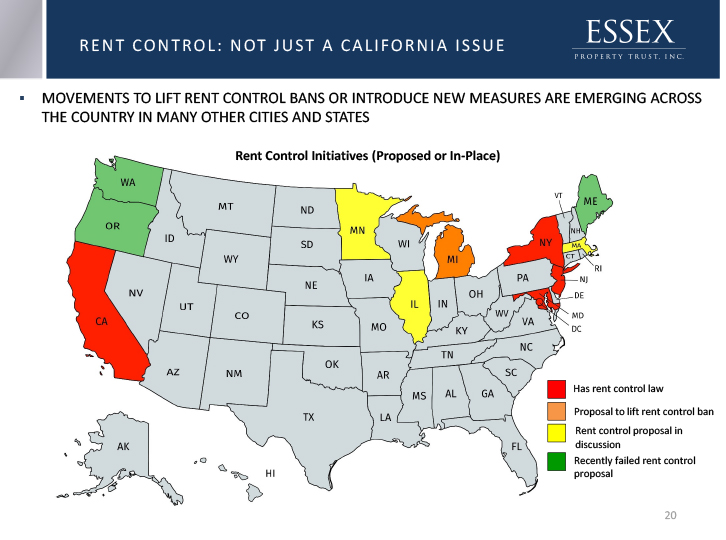
RENT CONTROL: NOT JUST A CALIFORNIA ISSUE Rent Control Initiatives (Proposed or In-Place) MOVEMENTS TO LIFT RENT CONTROL BANS OR INTRODUCE NEW MEASURES ARE EMERGING ACROSS THE COUNTRY IN MANY OTHER CITIES AND STATES Recently failed rent controlproposal *
INVESTMENT OVERVIEW Palm ValleySan Jose, CA Lawrence StationSunnyvale, CA

ACQUISITIONSImprove the NAV/sh, cash flow/sh and growth prospects of the CompanyDEVELOPMENTDevelop high-quality tenant desired apartment homes near transportation nodesREDEVELOPMENTFocused on rent justified improvements to maximize NOI and valueCO-INVESTMENT PLATFORMFacilitates growth via private capital and provides attractive risk adjusted returnsCONDO OPTIONALITYPotential value creation through 8,600 condo convertible apartment homes in the ESS Portfolio CORE COMPETENCIES TO CREATE VALUE Galloway Emerson Valley Village Redmond Hill Bunker Hill(Rendering) *
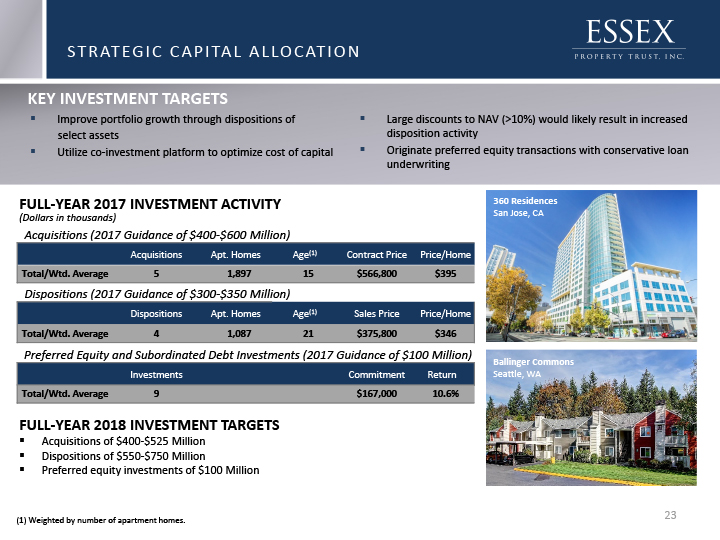
STRATEGIC CAPITAL ALLOCATION KEY INVESTMENT TARGETS MadridMission Viejo, CA * FULL-YEAR 2017 INVESTMENT ACTIVITY FULL-YEAR 2018 INVESTMENT TARGETSAcquisitions of $400-$525 MillionDispositions of $550-$750 MillionPreferred equity investments of $100 Million 360 ResidencesSan Jose, CA (1) Weighted by number of apartment homes. (Dollars in thousands) Ballinger CommonsSeattle, WA
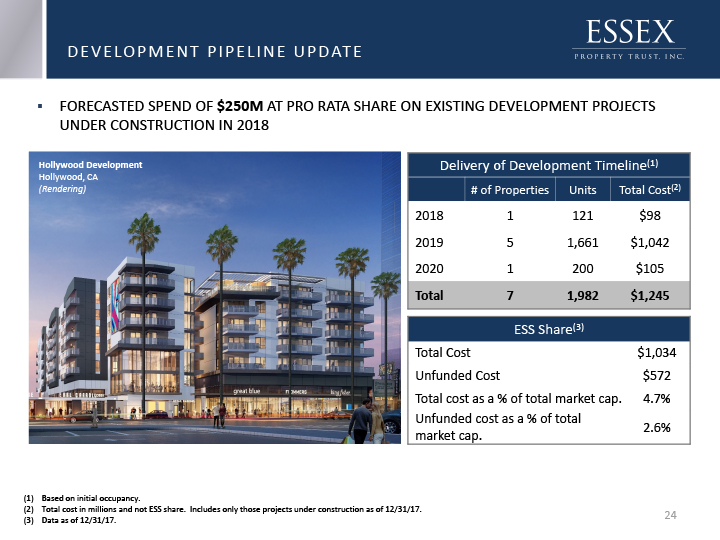
Based on initial occupancy.Total cost in millions and not ESS share. Includes only those projects under construction as of 12/31/17.Data as of 12/31/17. FORECASTED SPEND OF $250M AT PRO RATA SHARE ON EXISTING DEVELOPMENT PROJECTS UNDER CONSTRUCTION IN 2018 DEVELOPMENT PIPELINE UPDATE * GallowayPleasanton, CA(2016 Development) Hollywood DevelopmentHollywood, CA(Rendering)
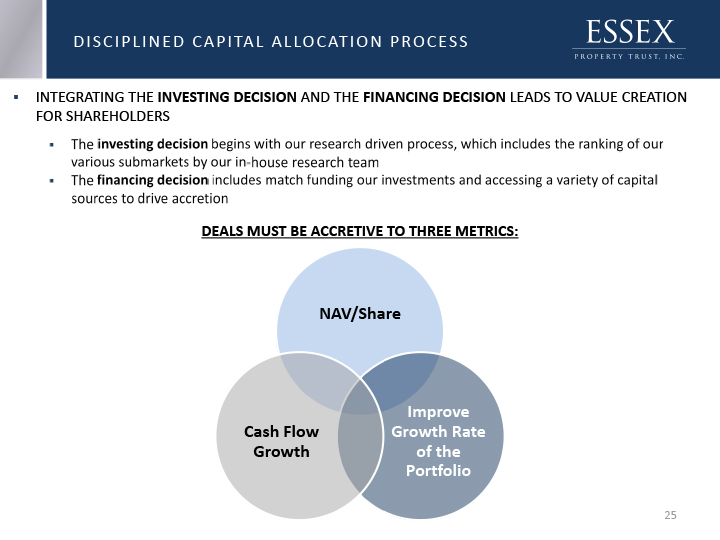
DISCIPLINED CAPITAL ALLOCATION PROCESS * DEALS MUST BE ACCRETIVE TO THREE METRICS:

FINANCIAL PERFORMANCE, 2018 GUIDANCE, & CAPITAL STRUCTURE 8th & RepublicanSeattle, WA(2017 Acquisition)
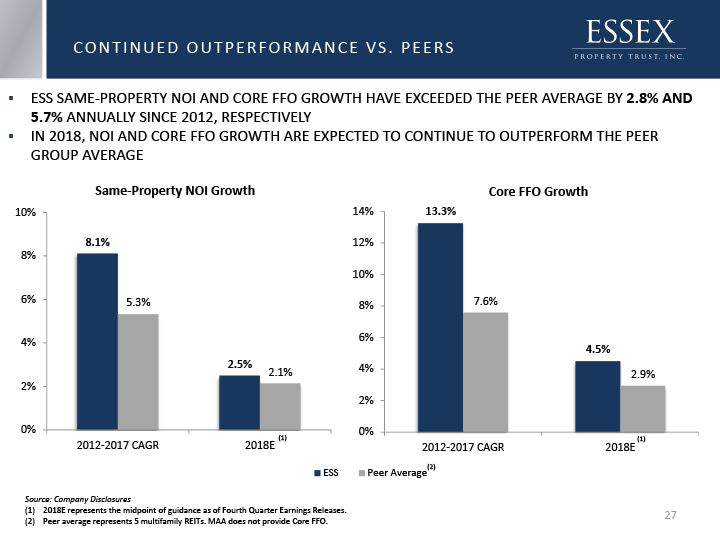
Source: Company Disclosures 2018E represents the midpoint of guidance as of Fourth Quarter Earnings Releases. Peer average represents 5 multifamily REITs. MAA does not provide Core FFO. CONTINUED OUTPERFORMANCE VS. PEERS ESS SAME-PROPERTY NOI AND CORE FFO GROWTH HAVE EXCEEDED THE PEER AVERAGE BY 2.8% AND 5.7% ANNUALLY SINCE 2012, RESPECTIVELYIN 2018, NOI AND CORE FFO GROWTH ARE EXPECTED TO CONTINUE TO OUTPERFORM THE PEER GROUP AVERAGE * (2) (1) (1)
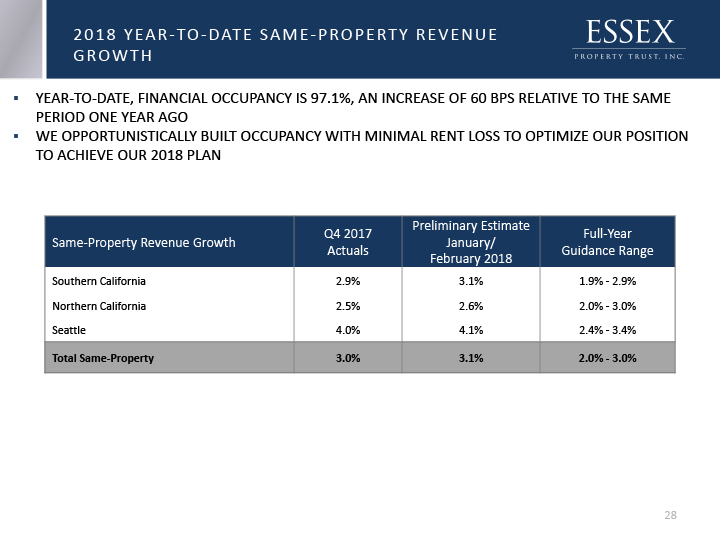
* 2018 YEAR-TO-DATE SAME-PROPERTY REVENUE GROWTH YEAR-TO-DATE, FINANCIAL OCCUPANCY IS 97.1%, AN INCREASE OF 60 BPS RELATIVE TO THE SAME PERIOD ONE YEAR AGOWE OPPORTUNISTICALLY BUILT OCCUPANCY WITH MINIMAL RENT LOSS TO OPTIMIZE OUR POSITION TO ACHIEVE OUR 2018 PLAN
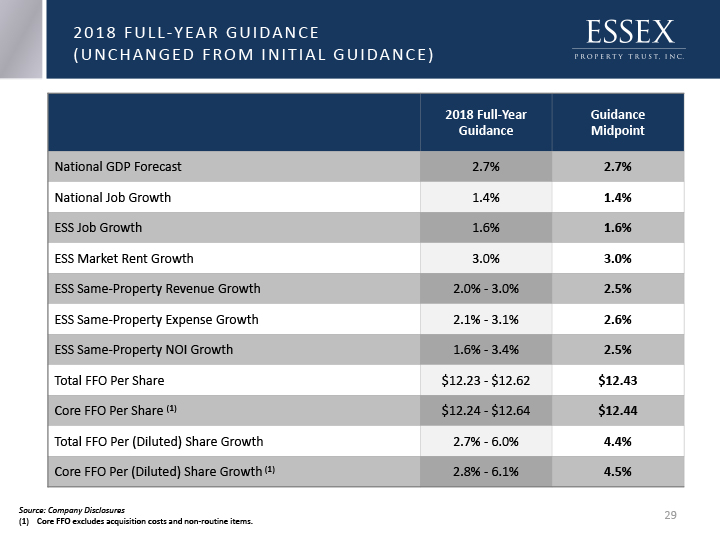
Source: Company DisclosuresCore FFO excludes acquisition costs and non-routine items. * 2018 FULL-YEAR GUIDANCE (UNCHANGED FROM INITIAL GUIDANCE)

E S S E X P R O P E R T Y T R U S T, I N C. E S S E X P R O P E R T Y T R U S T, I N C. E S S E X P R O P E R T Y T R U S T, I N C. E S S E X P R O P E R T Y T R U S T, I N C. E S S E X P R O P E R T Y T R U S T, I N C. E S S E X P R O P E R T Y T R U S T, I N C. E S S E X P R O P E R T Y T R U S T, I N C. E S S E X P R O P E R T Y T R U S T, I N C. E S S E X P R O P E R T Y T R U S T, I N C. E S S E X P R O P E R T Y T R U S T, I N C. E S S E X P R O P E R T Y T R U S T, I N C. 2018 MSA Level Forecast: Supply, Jobs, and Apartment Market Conditions 2018 MSA Level Forecast: Supply, Jobs, and Apartment Market Conditions 2018 MSA Level Forecast: Supply, Jobs, and Apartment Market Conditions 2018 MSA Level Forecast: Supply, Jobs, and Apartment Market Conditions 2018 MSA Level Forecast: Supply, Jobs, and Apartment Market Conditions 2018 MSA Level Forecast: Supply, Jobs, and Apartment Market Conditions 2018 MSA Level Forecast: Supply, Jobs, and Apartment Market Conditions 2018 MSA Level Forecast: Supply, Jobs, and Apartment Market Conditions 2018 MSA Level Forecast: Supply, Jobs, and Apartment Market Conditions 2018 MSA Level Forecast: Supply, Jobs, and Apartment Market Conditions 2018 MSA Level Forecast: Supply, Jobs, and Apartment Market Conditions Residential Supply (1) Residential Supply (1) Residential Supply (1) Residential Supply (1) Residential Supply (1) Job Forecast (2) Job Forecast (2) Market Forecast (3) Market New MF Supply New SF Supply Total Supply % of MF Supply to MF Stock % of Total Supply to Total Stock Est. New Jobs Dec-Dec % Growth Economic Rent Growth Los Angeles 11,050 5,600 16,650 0.7% 0.5% 57,800 1.3% 2.8% Orange 4,650 4,400 9,050 1.1% 0.8% 22,250 1.4% 2.7% San Diego 4,500 3,500 8,000 1.0% 0.7% 26,000 1.8% 3.5% Ventura 400 1,050 1,450 0.6% 0.5% 4,950 1.6% 3.2% So. Cal. 20,600 14,550 35,150 0.9% 0.6% 111,000 1.5% 3.0% San Francisco 3,100 550 3,650 0.8% 0.5% 20,100 1.8% 2.8% Oakland 2,100 4,000 6,100 0.6% 0.6% 18,500 1.6% 3.0% San Jose 2,400 2,100 4,500 1.0% 0.7% 16,300 1.5% 3.0% No. Cal. 7,600 6,650 14,250 0.8% 0.6% 54,900 1.6% 3.0% Seattle 9,900 7,550 17,450 2.1% 1.4% 35,450 2.1% 3.2% Weighted Average(4) 38,100 28,750 66,850 1.1% 0.8% 201,350 1.6% 3.0% All data are based on Essex Property Trust, Inc. forecasts.U.S. Economic Assumptions: 2018 G.D.P. Growth: 2.7% , 2018 Job Growth: 1.4%Residential Supply: total supply includes the Company's estimate of actual multifamily deliveries including properties with 50+ units and excludes student, senior and 100% affordable housing communities. Single family estimates based on an average trailing 12 month single family permit. Previous presentations had included multifamily deliveries of 100+ units and excluded student, senior and 100% affordable housing.Job Forecast: refers to the difference between total non-farm industry employment (not seasonally adjusted) projected 4Q over 4Q, expressed as total new jobs and growth rates.Market Forecast: the estimated rent growth represents the forecasted change in effective market rents for full year 2018 vs 2017 (excludes submarkets not targeted by Essex).Weighted Average: markets weighted by scheduled rent in the Company's Portfolio. 2018 MSA LEVEL FORECAST *
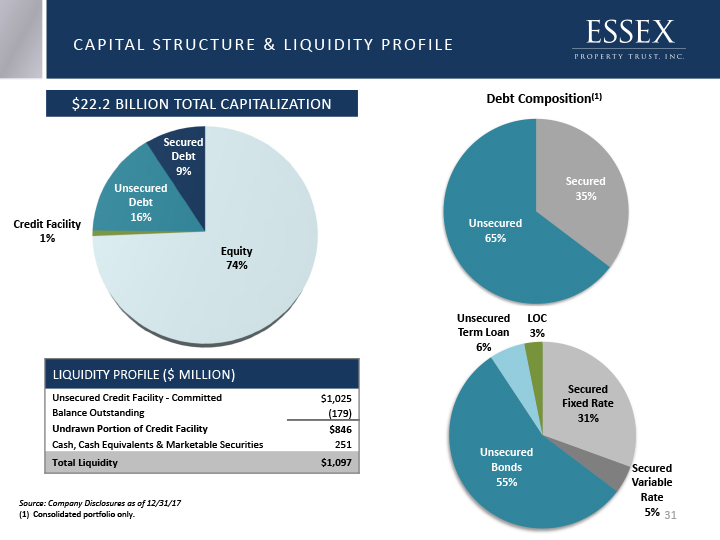
$22.2 BILLION TOTAL CAPITALIZATION Source: Company Disclosures as of 12/31/17(1) Consolidated portfolio only. * CAPITAL STRUCTURE & LIQUIDITY PROFILE (1)
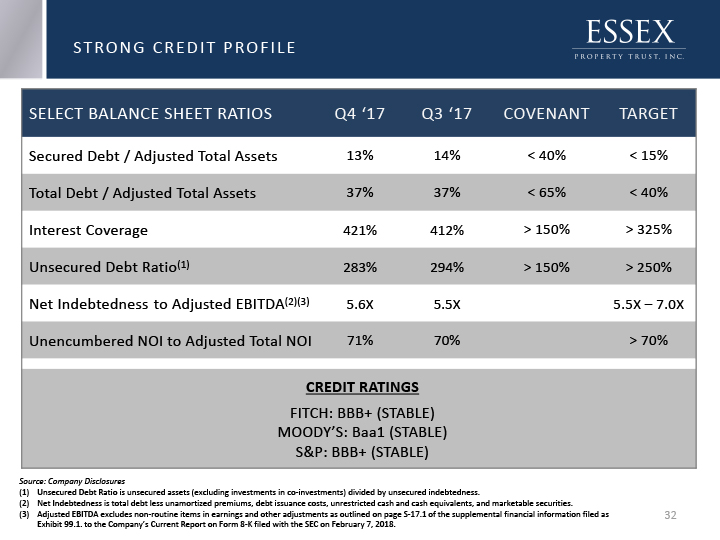
STRONG CREDIT PROFILE * Source: Company DisclosuresUnsecured Debt Ratio is unsecured assets (excluding investments in co-investments) divided by unsecured indebtedness.Net Indebtedness is total debt less unamortized premiums, debt issuance costs, unrestricted cash and cash equivalents, and marketable securities.Adjusted EBITDA excludes non-routine items in earnings and other adjustments as outlined on page S-17.1 of the supplemental financial information filed as Exhibit 99.1. to the Company’s Current Report on Form 8-K filed with the SEC on February 7, 2018.
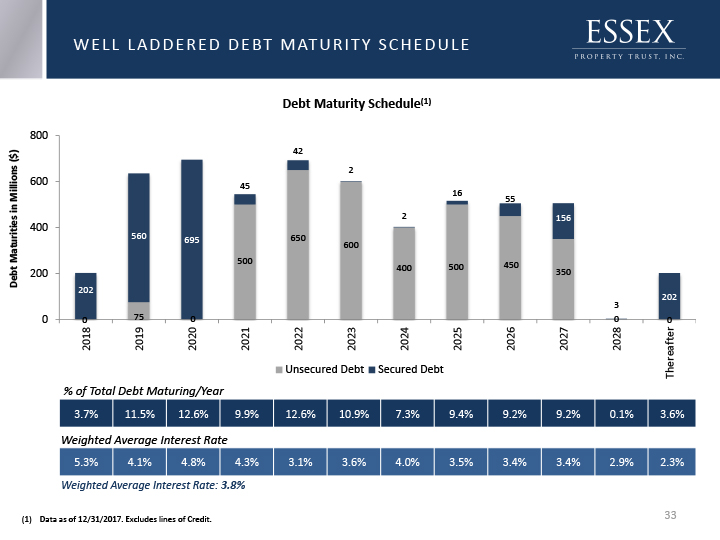
WELL LADDERED DEBT MATURITY SCHEDULE Debt Maturity Schedule(1) (1) Data as of 12/31/2017. Excludes lines of Credit. * % of Total Debt Maturing/Year 3.7% 11.5% 12.6% 9.9% 12.6% 10.9% 7.3% 9.4% 9.2% 9.2% 0.1% 3.6% Weighted Average Interest Rate 5.3% 4.1% 4.8% 4.3% 3.1% 3.6% 4.0% 3.5% 3.4% 3.4% 2.9% 2.3% Weighted Average Interest Rate: 3.8%

APPENDIX Renaissance at Uptown OrangeOrange, CA
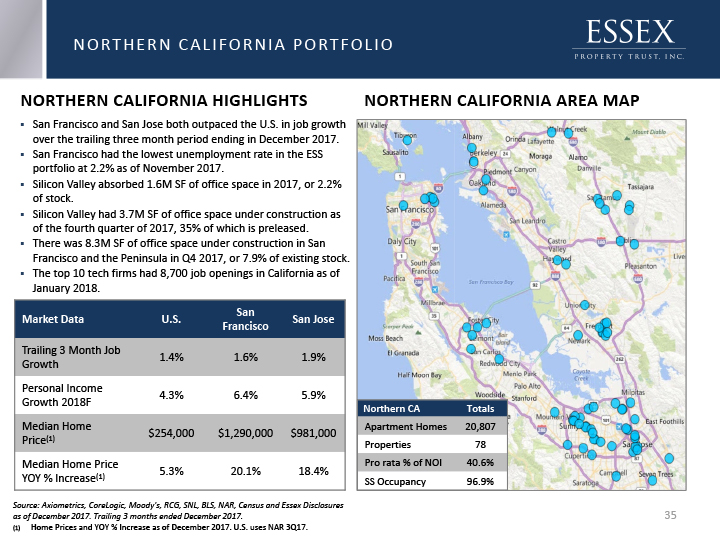
San Francisco and San Jose both outpaced the U.S. in job growth over the trailing three month period ending in December 2017.San Francisco had the lowest unemployment rate in the ESS portfolio at 2.2% as of November 2017.Silicon Valley absorbed 1.6M SF of office space in 2017, or 2.2% of stock.Silicon Valley had 3.7M SF of office space under construction as of the fourth quarter of 2017, 35% of which is preleased.There was 8.3M SF of office space under construction in San Francisco and the Peninsula in Q4 2017, or 7.9% of existing stock. The top 10 tech firms had 8,700 job openings in California as of January 2018. Source: Axiometrics, CoreLogic, Moody's, RCG, SNL, BLS, NAR, Census and Essex Disclosures as of December 2017. Trailing 3 months ended December 2017.Home Prices and YOY % Increase as of December 2017. U.S. uses NAR 3Q17. ��NORTHERN CALIFORNIA HIGHLIGHTS NORTHERN CALIFORNIA PORTFOLIO NORTHERN CALIFORNIA AREA MAP *

Source: Axiometrics, Core Logic, Moody's, RCG, SNL, BLS, NAR, Census and Essex Disclosures as of December 2017. Trailing 3 months ended December 2017.Home Prices and YOY % Increase as of December 2017. Home prices reflect only single-family and do not include condos. U.S. uses NAR 3Q17. LOS ANGELES PORTFOLIO LOS ANGELES HIGHLIGHTS Job growth in Los Angeles lagged the U.S. for the trailing three month period ending in December 2017.Tesla, Facebook and Apple recently leased a combined 426,000+ SF throughout Los Angeles county.Los Angeles had 2.1M SF of office space under construction as of the fourth quarter 2017, which is 19% preleased. LOS ANGELES AREA MAP *
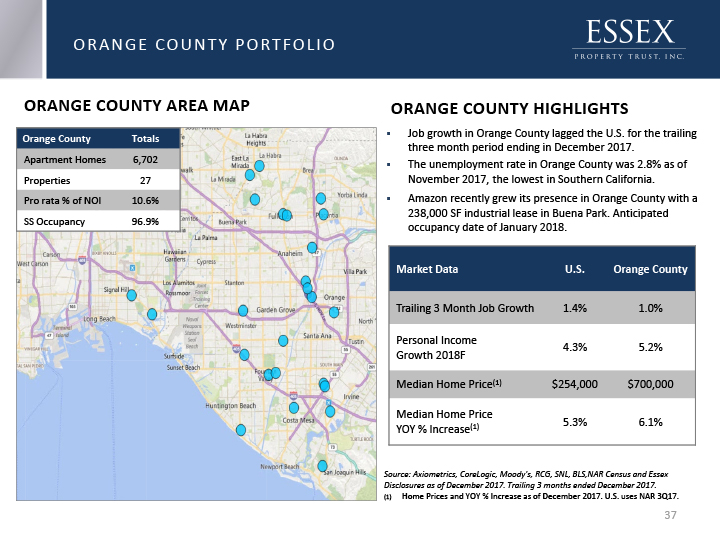
Source: Axiometrics, CoreLogic, Moody's, RCG, SNL, BLS,NAR Census and Essex Disclosures as of December 2017. Trailing 3 months ended December 2017.Home Prices and YOY % Increase as of December 2017. U.S. uses NAR 3Q17. ORANGE COUNTY PORTFOLIO ORANGE COUNTY HIGHLIGHTS Job growth in Orange County lagged the U.S. for the trailing three month period ending in December 2017.The unemployment rate in Orange County was 2.8% as of November 2017, the lowest in Southern California.Amazon recently grew its presence in Orange County with a 238,000 SF industrial lease in Buena Park. Anticipated occupancy date of January 2018. ORANGE COUNTY AREA MAP *
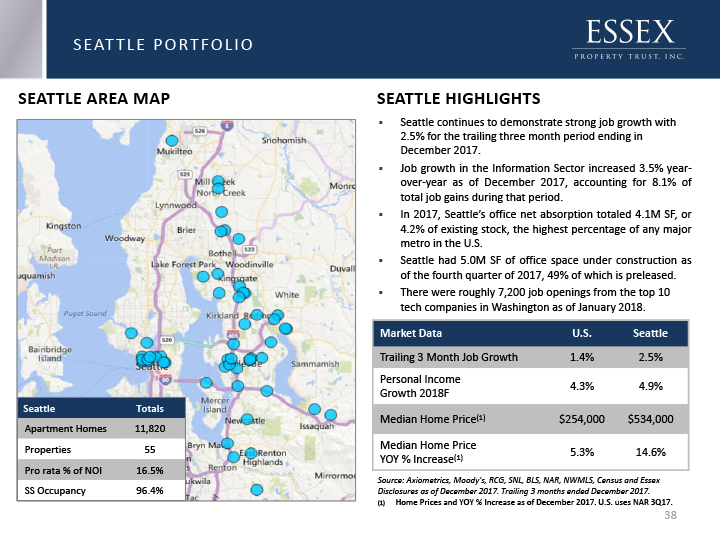
Source: Axiometrics, Moody's, RCG, SNL, BLS, NAR, NWMLS, Census and Essex Disclosures as of December 2017. Trailing 3 months ended December 2017.Home Prices and YOY % Increase as of December 2017. U.S. uses NAR 3Q17. SEATTLE HIGHLIGHTS SEATTLE PORTFOLIO Seattle continues to demonstrate strong job growth with 2.5% for the trailing three month period ending in December 2017. Job growth in the Information Sector increased 3.5% year-over-year as of December 2017, accounting for 8.1% of total job gains during that period. In 2017, Seattle’s office net absorption totaled 4.1M SF, or 4.2% of existing stock, the highest percentage of any major metro in the U.S.Seattle had 5.0M SF of office space under construction as of the fourth quarter of 2017, 49% of which is preleased.There were roughly 7,200 job openings from the top 10 tech companies in Washington as of January 2018. SEATTLE AREA MAP *

COMMITMENT TO SUSTAINABILITY Huntington BreakersHuntington Beach, CA(Recently Redeveloped)
* U.S. GREEN BUILDING COUNCIL: LEADERSHIP IN ENERGY AND ENVIRONMENTAL DESIGN (LEED)Since 2009, Essex has developed nine apartment communities that are LEED Certified, including four Gold and five Silver certifications, with one additional certification currently pending. A nationally recognized program, LEED was established by the U.S. Building Council to encourage the design of environmentally responsibly buildings. LEED is the most widely used third-party verification for green buildings worldwide. BUILD IT GREEN: GREENPOINT RATEDEssex has achieved GreenPoint Rated certifications on eight ground-up multifamily developments since 2010, with one additional certification currently pending. GreenPoint Rated is the most trusted independent green home certification program in California, providing proof that home certification program in California, providing proof that a home is healthy, comfortable, durable, and resource efficient. The program is administered by Build It Green, a nonprofit with a mission to help professionals adopt green practices and grow the market for efficient healthy homes. GLOBAL REAL ESTATE SUSTAINABILITY BENCHMARK (GRESB) Essex participated in the Global Real Estate Sustainability Benchmark for the second consecutive year in 2017, earning another “Green Star” for its sustainability performance, the highest possible designation. Essex received strong scores in several aspects including risks and opportunities, stakeholder engagement, monitoring and EMS, policy and disclosure, and performance indicators, all of which are well above the peer average. BUILT GREENEssex currently has two properties that have been certified under Built Green, an environmentally-friendly building program in Washington state. Created by the Master Builders Association of King and Snohomish Counties, the programs mission is to promote green building methods and practices, and to enhance its communities through leadership in sustainable development. AWARDS AND RECOGNITIONS

2016 2015 2014 2009 2008 2006 SUSTAINABLE COMMITMENTFor the past 10+ years, Essex has been incorporating green initiatives within its apartment communities In 2016, Essex participated in the GRESB Survey for the first time and achieved GREEN STAR Rated StatusEssex participated in GRESB for the second time in 2017, achieving a second GREEN STAR * SUSTAINABILITY INITIATIVES 2017 Published Corporate Social Responsibility strategy on Investors website
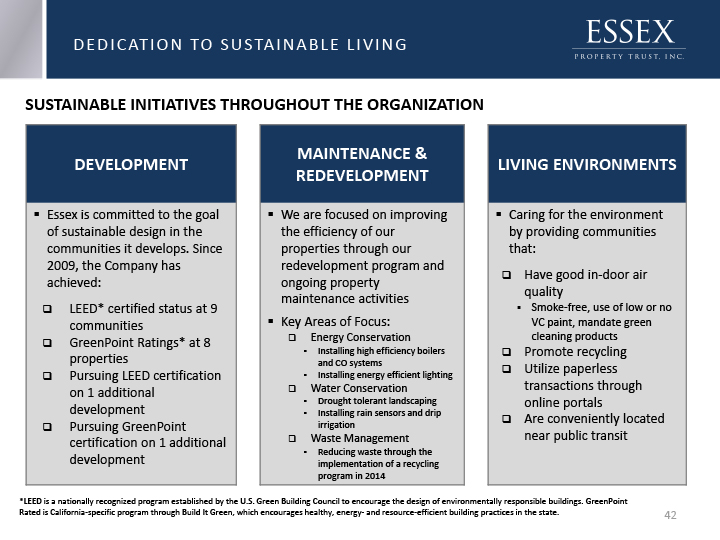
SUSTAINABLE INITIATIVES THROUGHOUT THE ORGANIZATION *LEED is a nationally recognized program established by the U.S. Green Building Council to encourage the design of environmentally responsible buildings. GreenPoint Rated is California-specific program through Build It Green, which encourages healthy, energy- and resource-efficient building practices in the state. * DEDICATION TO SUSTAINABLE LIVING

DEFINITIONS & RECONCILIATIONS

* DISCLAIMERS SAFE HARBOR STATEMENT UNDER THE PRIVATE LITIGATION REFORM ACT OF 1995This press release includes “forward-looking statements” within the meaning of Section 27A of the Securities Act of 1933, as amended, and Section 21E of the Securities Exchange Act of 1934, as amended. Forward-looking statements are statements which are not historical facts, including statements regarding the Company's expectations, estimates, assumptions, hopes, intentions, beliefs and strategies regarding the future. Words such as “expects,” “anticipates,” “intends,” “plans,” “believes,” “seeks,” “estimates,” and variations of such words and similar expressions are intended to identify such forward-looking statements. In this press release and related materials, forward-looking statements include, among other things, statements relating to the Company’s financial guidance for the first quarter and full-year 2018, including guidance relating to same-property portfolio growth, funds from operations, gross revenues, operating expenses, and net operating income; estimated costs of property development and redevelopment, the anticipated timing of completion of current development and redevelopment projects and the stabilization of such projects; financial projections and assumptions; financing and investment activities; forecasts of residential supply, jobs, and rent growth in various areas; and other information that is not historical information. The Company's actual results may differ materially from those projected in such forward looking statements. Factors that might cause such a difference include, but are not limited to, the failure of the Company to achieve its business objectives, changes in market demand for rental units and the impact of competition and competitive pricing, unforeseen consequences from cyber-intrusion, changes in economic conditions, unexpected delays or cost increases in the development and stabilization of development projects, unexpected difficulties in leasing of development projects, total costs of development investments exceeding the Company’s projections, and other risks detailed in the Company's filings with the Securities and Exchange Commission (SEC). All forward-looking statements are made as of the date hereof, and the Company assumes no obligation to update or supplement this information for any reason. For more details relating to risks and uncertainties that could cause actual results to differ materially from those anticipated in our forward-looking statements, and risks relating to our business in general, please refer to our most recent Annual Report on Form 10-K, Quarterly Reports on Form 10-Q and other filings with the SEC.REGULATION G DISCLAIMERThis presentation contains certain non-GAAP financial measures within the meaning of Regulation G of the Securities Exchange Act of 1934. The Company’s definitions and calculations of such measures may differ from those used by other companies and, therefore, may not be comparable. The definitions of these terms and, if applicable, the reasons for their use and reconciliations to the most directly comparable GAAP measures, are included in the Appendix.
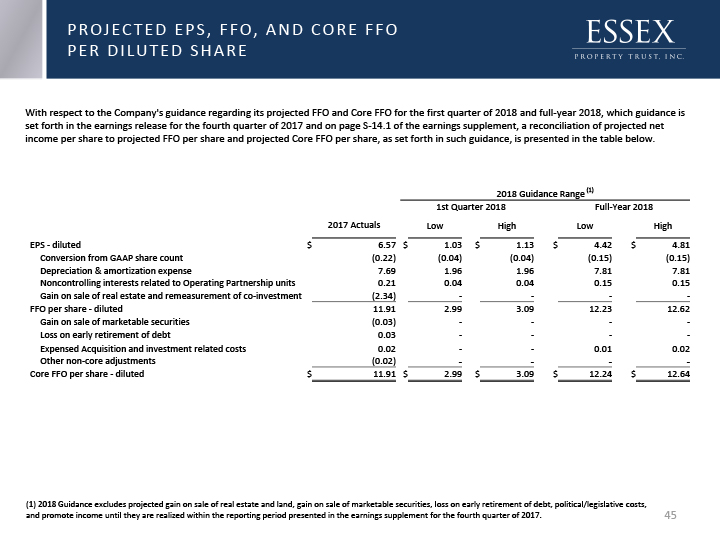
* With respect to the Company's guidance regarding its projected FFO and Core FFO for the first quarter of 2018 and full-year 2018, which guidance is set forth in the earnings release for the fourth quarter of 2017 and on page S-14.1 of the earnings supplement, a reconciliation of projected net income per share to projected FFO per share and projected Core FFO per share, as set forth in such guidance, is presented in the table below. 2018 Guidance Range (1) 2018 Guidance Range (1) 2018 Guidance Range (1) 2018 Guidance Range (1) 2018 Guidance Range (1) 2018 Guidance Range (1) 2018 Guidance Range (1) 2018 Guidance Range (1) 2018 Guidance Range (1) 2018 Guidance Range (1) 2018 Guidance Range (1) 2017 Actuals 1st Quarter 2018 1st Quarter 2018 1st Quarter 2018 1st Quarter 2018 Full-Year 2018 Full-Year 2018 Full-Year 2018 Full-Year 2018 2017 Actuals Low High Low High EPS - diluted EPS - diluted EPS - diluted $ 6.57 $ 1.03 $ 1.13 $ 4.42 $ 4.81 Conversion from GAAP share count Conversion from GAAP share count (0.22) (0.04) (0.04) (0.15) (0.15) Depreciation & amortization expense Depreciation & amortization expense 7.69 1.96 1.96 7.81 7.81 Noncontrolling interests related to Operating Partnership units Noncontrolling interests related to Operating Partnership units 0.21 0.04 0.04 0.15 0.15 Gain on sale of real estate and remeasurement of co-investment Gain on sale of real estate and remeasurement of co-investment (2.34) - - - - FFO per share - diluted FFO per share - diluted FFO per share - diluted 11.91 2.99 3.09 12.23 12.62 Gain on sale of marketable securities Gain on sale of marketable securities (0.03) - - - - Loss on early retirement of debt Loss on early retirement of debt 0.03 - - - - Expensed Acquisition and investment related costs Expensed Acquisition and investment related costs 0.02 - - 0.01 0.02 Other non-core adjustments Other non-core adjustments (0.02) - - - - Core FFO per share - diluted Core FFO per share - diluted Core FFO per share - diluted $ 11.91 $ 2.99 $ 3.09 $ 12.24 $ 12.64 (1) 2018 Guidance excludes projected gain on sale of real estate and land, gain on sale of marketable securities, loss on early retirement of debt, political/legislative costs, and promote income until they are realized within the reporting period presented in the earnings supplement for the fourth quarter of 2017. PROJECTED EPS, FFO, AND CORE FFOPER DILUTED SHARE
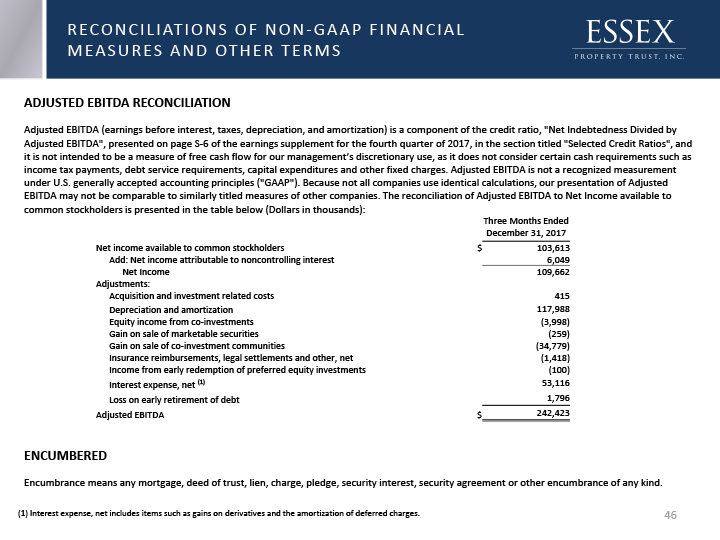
* RECONCILIATIONS OF NON-GAAP FINANCIALMEASURES AND OTHER TERMS ADJUSTED EBITDA RECONCILIATION Adjusted EBITDA (earnings before interest, taxes, depreciation, and amortization) is a component of the credit ratio, "Net Indebtedness Divided by Adjusted EBITDA", presented on page S-6 of the earnings supplement for the fourth quarter of 2017, in the section titled "Selected Credit Ratios", and it is not intended to be a measure of free cash flow for our management’s discretionary use, as it does not consider certain cash requirements such as income tax payments, debt service requirements, capital expenditures and other fixed charges. Adjusted EBITDA is not a recognized measurement under U.S. generally accepted accounting principles ("GAAP"). Because not all companies use identical calculations, our presentation of Adjusted EBITDA may not be comparable to similarly titled measures of other companies. The reconciliation of Adjusted EBITDA to Net Income available to common stockholders is presented in the table below (Dollars in thousands): Three Months Ended December 31, 2017 Net income available to common stockholders Net income available to common stockholders Net income available to common stockholders $ 103,613 Add: Net income attributable to noncontrolling interest Add: Net income attributable to noncontrolling interest 6,049 Net Income 109,662 Adjustments: Adjustments: Adjustments: Acquisition and investment related costs Acquisition and investment related costs 415 Depreciation and amortization Depreciation and amortization 117,988 Equity income from co-investments Equity income from co-investments (3,998) Gain on sale of marketable securities Gain on sale of marketable securities (259) Gain on sale of co-investment communities Gain on sale of co-investment communities (34,779) Insurance reimbursements, legal settlements and other, net Insurance reimbursements, legal settlements and other, net (1,418) Income from early redemption of preferred equity investments Income from early redemption of preferred equity investments (100) Interest expense, net (1) Interest expense, net (1) 53,116 Loss on early retirement of debt Loss on early retirement of debt 1,796 Adjusted EBITDA Adjusted EBITDA Adjusted EBITDA $ 242,423 (1) Interest expense, net includes items such as gains on derivatives and the amortization of deferred charges. ENCUMBEREDEncumbrance means any mortgage, deed of trust, lien, charge, pledge, security interest, security agreement or other encumbrance of any kind.
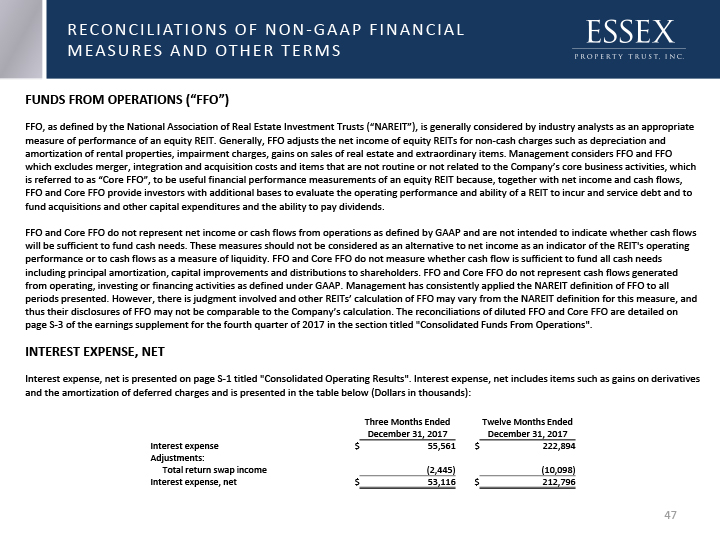
* RECONCILIATIONS OF NON-GAAP FINANCIALMEASURES AND OTHER TERMS FUNDS FROM OPERATIONS (“FFO”) FFO, as defined by the National Association of Real Estate Investment Trusts (“NAREIT”), is generally considered by industry analysts as an appropriate measure of performance of an equity REIT. Generally, FFO adjusts the net income of equity REITs for non-cash charges such as depreciation and amortization of rental properties, impairment charges, gains on sales of real estate and extraordinary items. Management considers FFO and FFO which excludes merger, integration and acquisition costs and items that are not routine or not related to the Company’s core business activities, which is referred to as “Core FFO”, to be useful financial performance measurements of an equity REIT because, together with net income and cash flows, FFO and Core FFO provide investors with additional bases to evaluate the operating performance and ability of a REIT to incur and service debt and to fund acquisitions and other capital expenditures and the ability to pay dividends.FFO and Core FFO do not represent net income or cash flows from operations as defined by GAAP and are not intended to indicate whether cash flows will be sufficient to fund cash needs. These measures should not be considered as an alternative to net income as an indicator of the REIT's operating performance or to cash flows as a measure of liquidity. FFO and Core FFO do not measure whether cash flow is sufficient to fund all cash needs including principal amortization, capital improvements and distributions to shareholders. FFO and Core FFO do not represent cash flows generated from operating, investing or financing activities as defined under GAAP. Management has consistently applied the NAREIT definition of FFO to all periods presented. However, there is judgment involved and other REITs’ calculation of FFO may vary from the NAREIT definition for this measure, and thus their disclosures of FFO may not be comparable to the Company’s calculation. The reconciliations of diluted FFO and Core FFO are detailed on page S-3 of the earnings supplement for the fourth quarter of 2017 in the section titled "Consolidated Funds From Operations".INTEREST EXPENSE, NETInterest expense, net is presented on page S-1 titled "Consolidated Operating Results". Interest expense, net includes items such as gains on derivatives and the amortization of deferred charges and is presented in the table below (Dollars in thousands): Three Months Ended Twelve Months Ended December 31, 2017 December 31, 2017 Interest expense Interest expense Interest expense $ 55,561 $ 222,894 Adjustments: Adjustments: Adjustments: Total return swap income Total return swap income (2,445) (10,098) Interest expense, net Interest expense, net Interest expense, net $ 53,116 $ 212,796
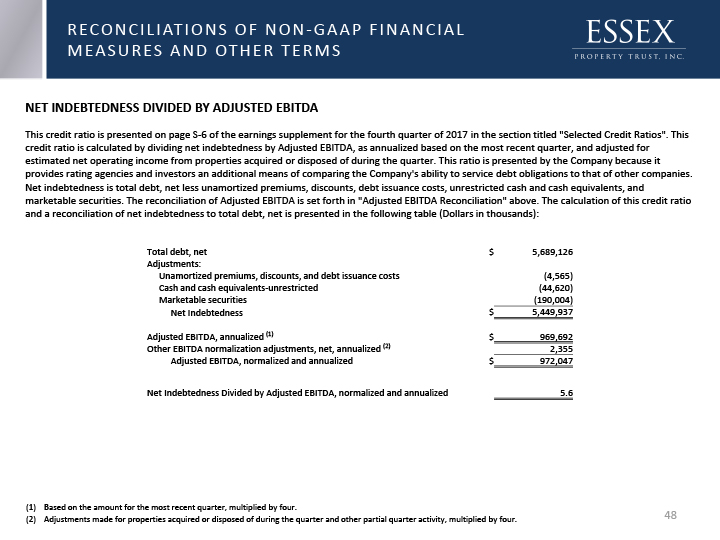
* RECONCILIATIONS OF NON-GAAP FINANCIALMEASURES AND OTHER TERMS Total debt, net Total debt, net Total debt, net $ 5,689,126 Adjustments: Adjustments: Adjustments: Unamortized premiums, discounts, and debt issuance costs Unamortized premiums, discounts, and debt issuance costs (4,565) Cash and cash equivalents-unrestricted Cash and cash equivalents-unrestricted (44,620) Marketable securities Marketable securities (190,004) Net Indebtedness $ 5,449,937 Adjusted EBITDA, annualized (1) Adjusted EBITDA, annualized (1) Adjusted EBITDA, annualized (1) $ 969,692 Other EBITDA normalization adjustments, net, annualized (2) Other EBITDA normalization adjustments, net, annualized (2) Other EBITDA normalization adjustments, net, annualized (2) 2,355 Adjusted EBITDA, normalized and annualized $ 972,047 Net Indebtedness Divided by Adjusted EBITDA, normalized and annualized Net Indebtedness Divided by Adjusted EBITDA, normalized and annualized Net Indebtedness Divided by Adjusted EBITDA, normalized and annualized 5.6 NET INDEBTEDNESS DIVIDED BY ADJUSTED EBITDAThis credit ratio is presented on page S-6 of the earnings supplement for the fourth quarter of 2017 in the section titled "Selected Credit Ratios". This credit ratio is calculated by dividing net indebtedness by Adjusted EBITDA, as annualized based on the most recent quarter, and adjusted for estimated net operating income from properties acquired or disposed of during the quarter. This ratio is presented by the Company because it provides rating agencies and investors an additional means of comparing the Company's ability to service debt obligations to that of other companies. Net indebtedness is total debt, net less unamortized premiums, discounts, debt issuance costs, unrestricted cash and cash equivalents, and marketable securities. The reconciliation of Adjusted EBITDA is set forth in "Adjusted EBITDA Reconciliation" above. The calculation of this credit ratio and a reconciliation of net indebtedness to total debt, net is presented in the following table (Dollars in thousands): Based on the amount for the most recent quarter, multiplied by four.Adjustments made for properties acquired or disposed of during the quarter and other partial quarter activity, multiplied by four.
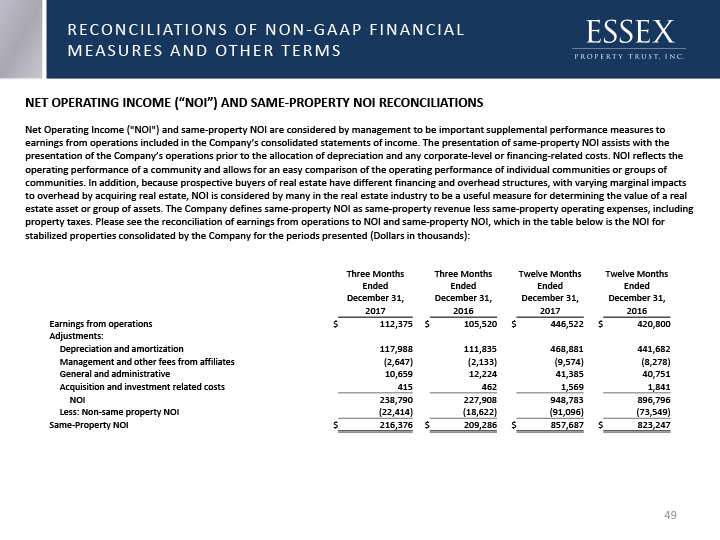
* NET OPERATING INCOME (“NOI”) AND SAME-PROPERTY NOI RECONCILIATIONSNet Operating Income ("NOI") and same-property NOI are considered by management to be important supplemental performance measures to earnings from operations included in the Company’s consolidated statements of income. The presentation of same-property NOI assists with the presentation of the Company’s operations prior to the allocation of depreciation and any corporate-level or financing-related costs. NOI reflects the operating performance of a community and allows for an easy comparison of the operating performance of individual communities or groups of communities. In addition, because prospective buyers of real estate have different financing and overhead structures, with varying marginal impacts to overhead by acquiring real estate, NOI is considered by many in the real estate industry to be a useful measure for determining the value of a real estate asset or group of assets. The Company defines same-property NOI as same-property revenue less same-property operating expenses, including property taxes. Please see the reconciliation of earnings from operations to NOI and same-property NOI, which in the table below is the NOI for stabilized properties consolidated by the Company for the periods presented (Dollars in thousands): RECONCILIATIONS OF NON-GAAP FINANCIALMEASURES AND OTHER TERMS Three Months Ended Three Months Ended Twelve Months Ended Twelve Months Ended December 31, December 31, December 31, December 31, 2017 2016 2017 2016 Earnings from operations Earnings from operations Earnings from operations $ 112,375 $ 105,520 $ 446,522 $ 420,800 Adjustments: Adjustments: Adjustments: Depreciation and amortization Depreciation and amortization 117,988 111,835 468,881 441,682 Management and other fees from affiliates Management and other fees from affiliates (2,647) (2,133) (9,574) (8,278) General and administrative General and administrative 10,659 12,224 41,385 40,751 Acquisition and investment related costs Acquisition and investment related costs 415 462 1,569 1,841 NOI 238,790 227,908 948,783 896,796 Less: Non-same property NOI Less: Non-same property NOI (22,414) (18,622) (91,096) (73,549) Same-Property NOI Same-Property NOI Same-Property NOI $ 216,376 $ 209,286 $ 857,687 $ 823,247
* PUBLIC BOND COVENANTSPublic Bond Covenants refers to certain covenants set forth in instruments governing the Company's unsecured indebtedness. These instruments require the Company to meet specified financial covenants, including covenants relating to net worth, fixed charge coverage, debt service coverage, the amounts of total indebtedness and secured indebtedness, leverage and certain investment limitations. These covenants may restrict the Company's ability to expand or fully pursue its business strategies. The Company's ability to comply with these covenants may be affected by changes in the Company's operating and financial performance, changes in general business and economic conditions, adverse regulatory developments or other events adversely impacting it. The breach of any of these covenants could result in a default under the Company's indebtedness, which could cause those and other obligations to become due and payable. If any of the Company's indebtedness is accelerated, it may not be able to repay it. For risks related to failure to comply with these covenants, see "Item 1A: Risk Factors - Risks Related to Our Indebtedness and Financing" in the Company's annual report on Form 10-K and other reports filed by the Company with the SEC.The ratios set forth on page S-6 of the earnings supplement for the fourth quarter of 2017 in the section titled "Public Bond Covenants" are provided only to show the Company's compliance with certain specified covenants that are contained in indentures related to the Company's issuance of Senior Notes, which indentures are filed by the Company with the SEC. See, for example, the Indenture dated April 10, 2017, filed by the Company as Exhibit 4.1 to the Company's Form 8-K, filed on April 10, 2017. These ratios should not be used for any other purpose, including without limitation to evaluate the Company's financial condition or results of operations, nor do they indicate the Company's covenant compliance as of any other date or for any other period. The capitalized terms in the disclosure are defined in the indentures filed by the Company with the SEC and may differ materially from similar terms used by other companies that present information about their covenant compliance.SECURED DEBTSecured Debt means Debt of the Company or any of its subsidiaries which is secured by an encumbrance on any property or assets of the Company or any of its subsidiaries. The calculation of Secured Debt is set forth on page S-5 of the earnings supplement for the fourth quarter of 2017. RECONCILIATIONS OF NON-GAAP FINANCIALMEASURES AND OTHER TERMS
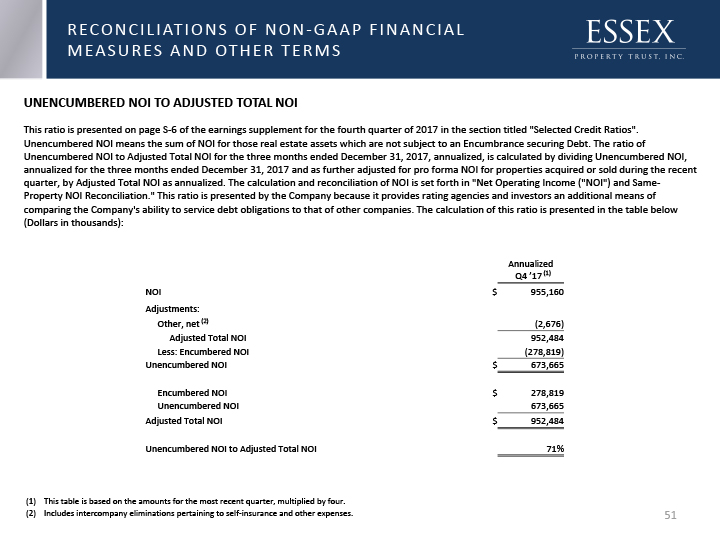
* RECONCILIATIONS OF NON-GAAP FINANCIALMEASURES AND OTHER TERMS UNENCUMBERED NOI TO ADJUSTED TOTAL NOIThis ratio is presented on page S-6 of the earnings supplement for the fourth quarter of 2017 in the section titled "Selected Credit Ratios". Unencumbered NOI means the sum of NOI for those real estate assets which are not subject to an Encumbrance securing Debt. The ratio of Unencumbered NOI to Adjusted Total NOI for the three months ended December 31, 2017, annualized, is calculated by dividing Unencumbered NOI, annualized for the three months ended December 31, 2017 and as further adjusted for pro forma NOI for properties acquired or sold during the recent quarter, by Adjusted Total NOI as annualized. The calculation and reconciliation of NOI is set forth in "Net Operating Income ("NOI") and Same-Property NOI Reconciliation." This ratio is presented by the Company because it provides rating agencies and investors an additional means of comparing the Company's ability to service debt obligations to that of other companies. The calculation of this ratio is presented in the table below (Dollars in thousands): Annualized Q4 ’17 (1) NOI NOI $ 955,160 Adjustments: Adjustments: Adjustments: Other, net (2) Other, net (2) (2,676) Adjusted Total NOI 952,484 Less: Encumbered NOI Less: Encumbered NOI (278,819) Unencumbered NOI Unencumbered NOI Unencumbered NOI $ 673,665 Encumbered NOI Encumbered NOI $ 278,819 Unencumbered NOI Unencumbered NOI 673,665 Adjusted Total NOI Adjusted Total NOI Adjusted Total NOI $ 952,484 Unencumbered NOI to Adjusted Total NOI Unencumbered NOI to Adjusted Total NOI Unencumbered NOI to Adjusted Total NOI 71% This table is based on the amounts for the most recent quarter, multiplied by four.Includes intercompany eliminations pertaining to self-insurance and other expenses.