Essex Announces Third Quarter 2018 Results
San Mateo, California—October 29, 2018—Essex Property Trust, Inc. (NYSE: ESS) (the “Company”) announced today its third quarter 2018 earnings results and related business activities.
Net Income, Funds from Operations (“FFO”) and Core FFO per diluted share for the quarter ended September 30, 2018 are detailed below.
| | | Three Months Ended September 30, | % | Nine Months Ended September 30, | % |
| | | 2018 | 2017 | Change | 2018 | 2017 | Change |
| | Per Diluted Share | | | | | | |
| | Net Income | $1.22 | $1.21 | 0.8% | $4.12 | $5.00 | -17.6% |
| | Total FFO | $3.22 | $2.97 | 8.4% | $9.74 | $8.90 | 9.4% |
| | Core FFO | $3.15 | $2.98 | 5.7% | $9.38 | $8.90 | 5.4% |
| | | | | | | | |
Third Quarter 2018 Highlights:
| · | Reported Net Income per diluted share for the third quarter of 2018 of $1.22, compared to $1.21 in the third quarter of 2017. |
| · | Grew Core FFO per diluted share by 5.7% compared to the third quarter of 2017, exceeding the midpoint of the guidance range. |
| · | Achieved same-property gross revenue and net operating income (“NOI”) growth of 2.2% and 2.4%, respectively, compared to the third quarter of 2017. |
| · | Realized a sequential quarterly increase in same-property revenue growth of 0.9%. |
| · | Revised full-year 2018 Net Income per diluted share guidance range to $5.18 to $5.28. Provided Net Income guidance range for the fourth quarter of 2018 of $1.06 to $1.16 per diluted share. |
| · | Revised full-year 2018 Total FFO per diluted share guidance range to $12.80 to $12.90, raising the midpoint by $0.05 per share. Provided Total FFO guidance range for the fourth quarter of 2018 of $3.07 to $3.17 per diluted share. |
| · | Increased full-year 2018 Core FFO per diluted share guidance by $0.03 per share at the midpoint to a range of $12.51 to $12.61. Provided Core FFO guidance range for the fourth quarter of 2018 of $3.13 to $3.23 per diluted share. |
1100 Park Place Suite 200 San Mateo California 94403 telephone 650 655 7800 facsimile 650 655 7810
www.essex.com
“We are pleased to report another quarter of healthy growth, driven by strong apartment fundamentals in the major coastal metros of California and Washington. Job growth continues to outpace national averages, contributing to ongoing shortages of rental housing and pushing personal income higher amid tight labor market conditions. We expect these conditions to continue into 2019, with market rents continuing to grow near long-term averages” commented Michael Schall, President and CEO of the company.
Same-Property Operations
Same-property operating results exclude any properties that are not comparable for the periods presented. The table below illustrates the percentage change in same-property gross revenues for the quarter ended September 30, 2018 compared to the quarter ended September 30, 2017, and the sequential percentage change for the quarter ended September 30, 2018 versus the quarter ended June 30, 2018, by submarket for the Company:
| | Q3 2018 vs. Q3 2017 | Q3 2018 vs. Q2 2018 | % of Total Revenues |
| | Gross Revenues | Gross Revenues | Q3 2018 Revenues |
| Southern California | |
| Los Angeles County | 2.2% | 1.0% | 20.4% |
| Orange County | 1.8% | 1.0% | 11.2% |
| San Diego County | 3.1% | 1.2% | 8.8% |
| Ventura County | 3.2% | 0.5% | 4.5% |
| Other Southern California | 5.2% | 2.3% | 0.5% |
| Total Southern California | 2.4% | 1.0% | 45.4% |
| Northern California | |
| Santa Clara County | 2.4% | 0.8% | 15.6% |
| Alameda County | 2.0% | 1.0% | 7.1% |
| San Mateo County | 3.4% | 1.7% | 5.1% |
| Contra Costa County | 2.0% | 0.6% | 5.0% |
| San Francisco | 0.3% | 1.1% | 3.3% |
| Other Northern California | -0.5% | -4.3% | 0.2% |
| Total Northern California | 2.2% | 0.9% | 36.3% |
| Seattle Metro | 1.6% | 0.7% | 18.3% |
| Same-Property Portfolio | 2.2% | 0.9% | 100.0% |
| | Year-Over-Year Growth | | Year-Over-Year Growth |
| | Q3 2018 compared to Q3 2017 | | YTD 2018 compared to YTD 2017 |
| | Gross Revenues | Operating Expenses | NOI | | Gross Revenues | Operating Expenses | NOI |
| Southern California | 2.4% | 2.5% | 2.4% | | 3.0% | 2.2% | 3.4% |
| Northern California | 2.2% | -1.7% | 3.6% | | 2.3% | 0.2% | 3.0% |
| Seattle Metro | 1.6% | 6.1% | -0.2% | | 3.0% | 5.5% | 2.0% |
| Same-Property Portfolio | 2.2% | 1.8% | 2.4% | | 2.8% | 2.1% | 3.0% |
| | Sequential Growth |
| | Q3 2018 compared to Q2 2018 |
| | Gross Revenues | Operating Expenses | NOI |
| Southern California | 1.0% | 6.0% | -0.9% |
| Northern California | 0.9% | 2.8% | 0.3% |
| Seattle Metro | 0.7% | -0.6% | 1.3% |
| Same-Property Portfolio | 0.9% | 3.6% | -0.1% |
| | Financial Occupancies |
| | Quarter Ended |
| | 9/30/2018 | 6/30/2018 | 9/30/2017 |
| Southern California | 96.5% | 96.8% | 96.8% |
| Northern California | 96.3% | 96.7% | 97.0% |
| Seattle Metro | 96.1% | 96.3% | 96.2% |
| Same-Property Portfolio | 96.4% | 96.7% | 96.7% |
Investment Activity
In October 2018, Wesco V, LLC (“Wesco V”), one of the Company’s joint ventures, acquired Meridian at Midtown in San Jose, CA for a total contract price of $104.0 million. As part of the transaction, Wesco V assumed a $69.9 million loan with an effective interest rate of 4.5% and a maturity date in 2026. Meridian was built in 2015 and comprises 218 apartment homes near downtown San Jose.
Other Investments
In October 2018, the Company originated an $18.6 million preferred equity investment in a multifamily development, located in Burlingame, CA. The investment has an initial preferred return of 12.0% and matures in 2024.
Liquidity and Balance Sheet
Common Stock
The Company did not issue any shares of common stock through its equity distribution program in the third quarter of 2018.
The Company did not repurchase any shares of common stock in the third quarter of 2018.
Balance Sheet
As of October 22, 2018, the Company had $1.2 billion in undrawn capacity on its unsecured credit facilities.
Guidance
For the third quarter of 2018, the Company exceeded the midpoint of the guidance range provided in its second quarter 2018 earnings release for Core FFO by $0.03 per share.
The following table provides a reconciliation of third quarter 2018 Core FFO per share to the midpoint of the guidance provided in the second quarter 2018 earnings release, which was dated August 1, 2018.
| | | Per Diluted Share | |
| Projected midpoint of Core FFO per share for Q3 2018 | | $ | 3.12 | |
| NOI from consolidated communities | | | 0.01 | |
| Interest expense and other | | | 0.02 | |
| Core FFO per share for Q3 2018 reported | | $ | 3.15 | |
The following table provides key changes to the 2018 full-year assumptions for Net Income, Total FFO, Core FFO per diluted share, and same-property growth. For additional details regarding the Company’s 2018 assumptions, please see page S-14 of the accompanying supplemental financial information. For the fourth quarter of 2018, the Company has established a range for Core FFO per diluted share of $3.13 to $3.23.
2018 Full-Year Guidance
| | | Previous Range | | | Previous Midpoint | | | Revised Range | | | Revised Midpoint | |
| Per Diluted Share | | | | | | | | | | | | |
| Net Income | | $ | 5.15 - $5.31 | | | $ | 5.23 | | | $ | 5.18 - $5.28 | | | $ | 5.23 | |
| Total FFO | | $ | 12.72 - $12.88 | | | $ | 12.80 | | | $ | 12.80 - $12.90 | | | $ | 12.85 | |
| Core FFO | | $ | 12.44 - $12.62 | | | $ | 12.53 | | | $ | 12.51 - $12.61 | | | $ | 12.56 | |
| Same-Property Growth | | | | | | | | | | | | | | | | |
| Gross Revenues | | 2.6% to 3.0% | | | | 2.8 | % | | 2.7% to 2.9% | | | | 2.8 | % |
| Operating Expenses | | 2.4% to 2.8% | | | | 2.6 | % | | 2.5% to 2.7% | | | | 2.6 | % |
| NOI | | 2.5% to 3.2% | | | | 2.9 | % | | 2.7% to 3.0% | | | | 2.9 | % |
Conference Call with Management
The Company will host an earnings conference call with management to discuss its quarterly results on Monday, October 29, 2018 at 12 p.m. PT (3 p.m. ET), which will be broadcast live via the Internet at www.essex.com, and accessible via phone by dialing toll-free, (877) 407-0784, or toll/international, (201) 689-8560. No passcode is necessary.
A rebroadcast of the live call will be available online for 30 days and digitally for seven days. To access the replay online, go to www.essex.com and select Investors and the third quarter earnings webcast. To access the replay digitally, dial (844) 512-2921 using the Replay Pin Number – 13683691. If you are unable to access the information via the Company’s website, please contact the Investor Relations Department at investors@essex.com or by calling (650) 655-7800.
Corporate Profile
Essex Property Trust, Inc., an S&P 500 company, is a fully integrated real estate investment trust (REIT) that acquires, develops, redevelops, and manages multifamily residential properties in selected West Coast markets. The Company currently has ownership interests in 248 apartment communities comprising approximately 60,000 apartment homes, excluding six properties in various stages of active development, one commercial building, preferred equity co-investments, and loan investments. Additional information about Essex can be found on the Company’s website at www.essex.com.
This press release and accompanying supplemental financial information has been furnished to the Securities and Exchange Commission (“SEC”) electronically on Form 8-K and can be accessed from the Company’s website at www.essex.com. If you are unable to obtain the information via the Internet, please contact the Investor Relations Department at (650) 655-7800.
FFO Reconciliation
FFO, as defined by the National Association of Real Estate Investment Trusts (“NAREIT”), is generally considered by industry analysts as an appropriate measure of performance of an equity REIT. Generally, FFO adjusts the net income of equity REITs for non-cash charges such as depreciation and amortization of rental properties, impairment charges, gains on sales of real estate and extraordinary items. Management considers FFO and FFO which excludes non-core items, which is referred to as “Core FFO,” to be useful supplemental operating performance measures of an equity REIT because, together with net income and cash flows, FFO and Core FFO provide investors with additional bases to evaluate the operating performance and ability of a REIT to incur and service debt and to fund acquisitions and other capital expenditures and to pay dividends. By excluding gains or losses related to sales of depreciated operating properties and excluding real estate depreciation (which can vary among owners of identical assets in similar condition based on historical cost accounting and useful life estimates), FFO can help investors compare the operating performance of a real estate company between periods or as compared to different companies. By further adjusting for items that are not considered part of the Company’s core business operations, Core FFO allows investors to compare the core operating performance of the Company to its performance in prior reporting periods and to the operating performance of other real estate companies without the effect of items that by their nature are not comparable from period to period and tend to obscure the Company’s actual operating results.
FFO and Core FFO do not represent net income or cash flows from operations as defined by U.S. generally accepted accounting principles (“GAAP”) and are not intended to indicate whether cash flows will be sufficient to fund cash needs. These measures should not be considered as alternatives to net income as an indicator of the REIT’s operating performance or to cash flows as a measure of liquidity. FFO and Core FFO do not measure whether cash flow is sufficient to fund all cash needs including principal amortization, capital improvements and distributions to stockholders. FFO and Core FFO also do not represent cash flows generated from operating, investing or financing activities as defined under GAAP. Management has consistently applied the NAREIT definition of FFO to all periods presented. However, there is judgment involved and other REITs’ calculation of FFO may vary from the NAREIT definition for this measure, and thus their disclosures of FFO may not be comparable to the Company’s calculation.
The following table sets forth the Company’s calculation of diluted FFO and Core FFO for the three and nine months ended September 30, 2018 and 2017 (in thousands, except for share and per share amounts):
| | | Three Months Ended September 30, | | | Nine Months Ended September 30, | |
| Funds from Operations attributable to common stockholders and unitholders | | 2018 | | | 2017 | | | 2018 | | | 2017 | |
| Net income available to common stockholders | | $ | 80,975 | | | $ | 79,723 | | | $ | 272,333 | | | $ | 329,446 | |
| Adjustments: | | | | | | | | | | | | | | | | |
| Depreciation and amortization | | | 120,852 | | | | 117,451 | | | | 359,287 | | | | 350,893 | |
| Gains not included in FFO | | | - | | | | (10,307 | ) | | | (22,244 | ) | | | (125,122 | ) |
| Depreciation and amortization from unconsolidated co-investments | | | 15,766 | | | | 13,854 | | | | 47,345 | | | | 40,335 | |
| Noncontrolling interest related to Operating Partnership units | | | 2,789 | | | | 2,721 | | | | 9,381 | | | | 11,289 | |
| Depreciation attributable to third party ownership and other | | | (234 | ) | | | (23 | ) | | | (699 | ) | | | (74 | ) |
| Funds from Operations attributable to common stockholders and unitholders | | $ | 220,148 | | | $ | 203,419 | | | $ | 665,403 | | | $ | 606,767 | |
| FFO per share – diluted | | $ | 3.22 | | | $ | 2.97 | | | $ | 9.74 | | | $ | 8.90 | |
| Expensed acquisition and investment related costs | | $ | 31 | | | $ | 324 | | | $ | 156 | | | $ | 1,154 | |
| Gain on sale of marketable securities | | | (120 | ) | | | (32 | ) | | | (669 | ) | | | (1,650 | ) |
| Unrealized gains on marketable securities | | | (1,180 | ) | | | - | | | | (426 | ) | | | - | |
Interest rate hedge ineffectiveness (1) | | | (35 | ) | | | 1 | | | | 61 | | | | (19 | ) |
| Gain on early retirement of debt from unconsolidated co-investment | | | (3,662 | ) | | | - | | | | (3,662 | ) | | | - | |
| Co-investment promote income | | | - | | | | - | | | | (20,541 | ) | | | - | |
| Income from early redemption of preferred equity investments | | | - | | | | (8 | ) | | | (1,602 | ) | | | (256 | ) |
| Insurance reimbursements, legal settlements, and other, net | | | 30 | | | | 335 | | | | 2,013 | | | | 310 | |
| Core Funds from Operations attributable to common stockholders and unitholders | | $ | 215,212 | | | $ | 204,039 | | | $ | 640,733 | | | $ | 606,306 | |
| Core FFO per share – diluted | | $ | 3.15 | | | $ | 2.98 | | | $ | 9.38 | | | $ | 8.90 | |
Weighted average number of shares outstanding diluted (2) | | | 68,339,057 | | | | 68,392,419 | | | | 68,328,370 | | | | 68,159,766 | |
| (1) | Interest rate swaps are generally adjusted to fair value through other comprehensive income (loss). However, because certain of our interest rate swaps do not have a 0% LIBOR floor, while related hedged debt in these cases is subject to a 0% LIBOR floor, the portion of the change in fair value of these interest rate swaps attributable to this mismatch is recorded as noncash interest rate hedge ineffectiveness through interest expense. |
| (2) | Assumes conversion of all outstanding limited partnership units in Essex Portfolio, L.P. (the “Operating Partnership”) into shares of the Company’s common stock and excludes all DownREIT limited partnership units for which the Operating Partnership has the ability and intention to redeem the units for cash and does not consider them to be common stock equivalents. |
NOI and Same-Property NOI Reconciliations
NOI and Same-Property NOI are considered by management to be important supplemental performance measures to earnings from operations included in the Company’s condensed consolidated statements of income. The presentation of same-property NOI assists with the presentation of the Company’s operations prior to the allocation of depreciation and any corporate-level or financing-related costs. NOI reflects the operating performance of a community and allows for an easy comparison of the operating performance of individual communities or groups of communities. In addition, because prospective buyers of real estate have different financing and overhead structures, with varying marginal impacts to overhead by acquiring real estate, NOI is considered by many in the real estate industry to be a useful measure for determining the value of a real estate asset or group of assets. The Company defines same-property NOI as same-property revenue less same-property operating expenses, including property taxes. Please see the reconciliation of earnings from operations to NOI and same-property NOI, which in the table below is the NOI for stabilized properties consolidated by the Company for the periods presented (dollars in thousands):
| | | Three Months Ended September 30, | | | Nine Months Ended September 30, | |
| | | 2018 | | | 2017 | | | 2018 | | | 2017 | |
| Earnings from operations | | $ | 113,897 | | | $ | 112,669 | | | $ | 340,716 | | | $ | 334,147 | |
| Adjustments: | | | | | | | | | | | | | | | | |
| Corporate-level property management expenses | | | 7,761 | | | | 7,573 | | | | 23,313 | | | | 22,604 | |
| Depreciation and amortization | | | 120,852 | | | | 117,451 | | | | 359,287 | | | | 350,893 | |
| Management and other fees from affiliates | | | (2,307 | ) | | | (2,395 | ) | | | (6,812 | ) | | | (6,927 | ) |
| General and administrative | | | 10,601 | | | | 9,788 | | | | 36,539 | | | | 30,726 | |
| Expensed acquisition and investment related costs | | | 31 | | | | 324 | | | | 156 | | | | 1,154 | |
| NOI | | | 250,835 | | | | 245,410 | | | | 753,199 | | | | 732,597 | |
| Less: Non-same property NOI | | | (18,274 | ) | | | (18,214 | ) | | | (56,611 | ) | | | (56,273 | ) |
| Same-Property NOI | | $ | 232,561 | | | $ | 227,196 | | | $ | 696,588 | | | $ | 676,324 | |
Safe Harbor Statement Under The Private Litigation Reform Act of 1995:
This press release includes “forward-looking statements” within the meaning of Section 27A of the Securities Act of 1933, as amended, and Section 21E of the Securities Exchange Act of 1934, as amended. Forward-looking statements are statements which are not historical facts, including statements regarding the Company’s expectations, estimates, assumptions, hopes, intentions, beliefs and strategies regarding the future. Words such as “expects,” “assumes,” “anticipates,” “may,” “will,” “intends,” “plans,” “believes,” “seeks,” “estimates,” and variations of such words and similar expressions are intended to identify such forward-looking statements. Such forward-looking statements include, among other things, statements regarding the Company’s intent, beliefs or expectations with respect to the timing of completion of current development and redevelopment projects and the stabilization of such projects, the timing of lease-up and occupancy of its apartment communities, the anticipated operating performance of its apartment communities, the total projected costs of development and redevelopment projects, co-investment activities, qualification as a REIT under the Internal Revenue Code, the real estate markets in the geographies in which the Company’s properties are located and in the United States in general, the adequacy of future cash flows to meet anticipated cash needs, its financing activities and the use of proceeds from such activities, the availability of debt and equity financing, general economic conditions including the potential impacts from the economic conditions, trends affecting the Company’s financial condition or results of operations, changes to U.S. tax laws and regulations in general or specifically related to REITs or real estate, changes to laws and regulations in jurisdictions in which communities the Company owns are located, and other information that is not historical information.
While the Company’s management believes the assumptions underlying its forward-looking statements are reasonable, such forward-looking statements involve known and unknown risks, uncertainties and other factors, many of which are beyond the Company’s control, which could cause the actual results, performance or achievements of the Company to be materially different from any future results, performance or achievements expressed or implied by such forward-looking statements. The Company cannot assure the future results or outcome of the matters described in these statements; rather, these statements merely reflect the Company’s current expectations of the approximate outcomes of the matters discussed. Factors that might cause the Company’s actual results, performance or achievements to differ materially from those expressed or implied by these forward-looking statements include, but are not limited to, the following: the Company may fail to achieve its business objectives; the actual completion of development and redevelopment projects may be subject to delays; the stabilization dates of such projects may be delayed; the Company may abandon or defer development projects for a number of reasons, including changes in local market conditions which make development less desirable, increases in costs of development, increases in the cost of capital or lack of capital availability, resulting in losses; the total projected costs of current development and redevelopment projects may exceed expectations; such development and redevelopment projects may not be completed; development and redevelopment projects and acquisitions may fail to meet expectations; estimates of future income from an acquired property may prove to be inaccurate; occupancy rates and rental demand may be adversely affected by competition and local economic and market conditions; there may be increased interest rates and operating costs; the Company may be unsuccessful in the management of its relationships with its co-investment partners; future cash flows may be inadequate to meet operating requirements and/or may be insufficient to provide for dividend payments in accordance with REIT requirements; there may be a downturn in general economic conditions, the real estate industry, and the markets in which the Company’s communities are located; changes in laws or regulations; the terms of any refinancing may not be as favorable as the terms of existing indebtedness; and those risks, special considerations, and other factors referred to in the Company’s quarterly reports on Form 10-Q, in the Company’s annual report on Form 10-K for the year ended December 31, 2017, and in the Company’s other filings with the SEC. All forward-looking statements are made as of the date hereof, the Company assumes no obligation to update or supplement this information for any reason, and therefore, they may not represent the Company’s estimates and assumptions after the date of this press release.
Definitions and Reconciliations
Non-GAAP financial measures and certain other capitalized terms, as used in this earnings release, are defined and further explained on pages S-17.1 through S-17.4, “Reconciliations of Non-GAAP Financial Measures and Other Terms,” of the accompanying supplemental financial information. The supplemental financial information is available on the Company’s website at www.essex.com.
Contact Information
Barb Pak
Group Vice President of Finance & Investor Relations
(650) 655-7800
bpak@essex.com
Q3 2018 Supplemental
Table of Contents
| | Page(s) |
| Consolidated Operating Results | S-1 – S-2 |
| Consolidated Funds From Operations | S-3 |
| Consolidated Balance Sheets | S-4 |
Debt Summary – September 30, 2018 | S-5 |
Capitalization Data, Public Bond Covenants, Credit Ratings, and Selected Credit Ratios – September 30, 2018 | S-6 |
Portfolio Summary by County – September 30, 2018 | S-7 |
Operating Income by Quarter – September 30, 2018 | S-8 |
Same-Property Revenue Results by County – Quarters ended September 30, 2018 and 2017, and June 30, 2018 | S-9 |
Same-Property Revenue Results by County – Nine months ended September 30, 2018 and 2017 S-9.1 | S-9.1
|
Same-Property Operating Expenses – Quarter and Year to Date as of September 30, 2018 and 2017 | S-10 |
Development Pipeline – September 30, 2018 | S-11 |
Redevelopment Pipeline – September 30, 2018 | S-12 |
Capital Expenditures – September 30, 2018 | S-12.1 |
Co-investments and Preferred Equity Investments – September 30, 2018 | S-13 |
| Assumptions for 2018 FFO Guidance Range | S-14 |
| Reconciliation of Projected EPS, FFO and Core FFO per diluted share | S-14.1 |
| Summary of Apartment Community Acquisitions and Dispositions Activity | S-15 |
| Preliminary 2019 MSA Level Forecast: Supply, Jobs and Apartment Market Conditions | S-16 |
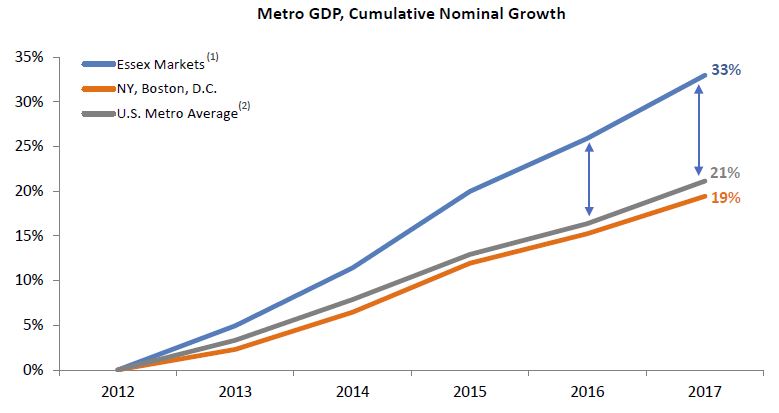
| GDP Growth in Essex Metros Consistently Exceeds U.S. and Supports Stronger Household Earnings Growth | S-16.1 |
Reconciliations of Non-GAAP Financial Measures and Other Terms
| |
E S S E X P R O P E R T Y T R U S T, I N C.
Consolidated Operating Results (Dollars in thousands, except share and per share amounts) | | Three Months Ended September 30, | | | Nine Months Ended September 30, | |
| | | 2018 | | | 2017 | | | 2018 | | | 2017 | |
| | | | | | | | | | | | | |
| Revenues: | | | | | | | | | | | | |
| Rental and other property | | $ | 348,610 | | | $ | 341,974 | | | $ | 1,040,083 | | | $ | 1,011,908 | |
| Management and other fees from affiliates | | | 2,307 | | | | 2,395 | | | | 6,812 | | | | 6,927 | |
| | | | 350,917 | | | | 344,369 | | | | 1,046,895 | | | | 1,018,835 | |
| | | | | | | | | | | | | | | | | |
| Expenses: | | | | | | | | | | | | | | | | |
| Property operating | | | 97,775 | | | | 96,564 | | | | 286,884 | | | | 279,311 | |
| Corporate-level property management expenses | | | 7,761 | | | | 7,573 | | | | 23,313 | | | | 22,604 | |
| Depreciation and amortization | | | 120,852 | | | | 117,451 | | | | 359,287 | | | | 350,893 | |
| General and administrative | | | 10,601 | | | | 9,788 | | | | 36,539 | | | | 30,726 | |
| Expensed acquisition and investment related costs | | | 31 | | | | 324 | | | | 156 | | | | 1,154 | |
| | | | 237,020 | | | | 231,700 | | | | 706,179 | | | | 684,688 | |
| Earnings from operations | | | 113,897 | | | | 112,669 | | | | 340,716 | | | | 334,147 | |
| | | | | | | | | | | | | | | | | |
Interest expense, net (1) | | | (53,012 | ) | | | (53,400 | ) | | | (159,653 | ) | | | (159,680 | ) |
| Interest and other income | | | 8,437 | | | | 5,790 | | | | 21,241 | | | | 17,916 | |
| Equity income from co-investments | | | 16,788 | | | | 19,727 | | | | 64,611 | | | | 40,934 | |
| Gain on sale of real estate and land | | | - | | | | 249 | | | | 22,244 | | | | 26,423 | |
| Gain on remeasurement of co-investment | | | - | | | | - | | | | - | | | | 88,641 | |
| Net income | | | 86,110 | | | | 85,035 | | | | 289,159 | | | | 348,381 | |
| Net income attributable to noncontrolling interest | | | (5,135 | ) | | | (5,312 | ) | | | (16,826 | ) | | | (18,935 | ) |
| Net income available to common stockholders | | $ | 80,975 | | | $ | 79,723 | | | $ | 272,333 | | | $ | 329,446 | |
| | | | | | | | | | | | | | | | | |
| Net income per share - basic | | $ | 1.23 | | | $ | 1.21 | | | $ | 4.12 | | | $ | 5.01 | |
| | | | | | | | | | | | | | | | | |
| Shares used in income per share - basic | | | 66,052,108 | | | | 65,994,896 | | | | 66,047,990 | | | | 65,759,450 | |
| | | | | | | | | | | | | | | | | |
| Net income per share - diluted | | $ | 1.22 | | | $ | 1.21 | | | $ | 4.12 | | | $ | 5.00 | |
| | | | | | | | | | | | | | | | | |
| Shares used in income per share - diluted | | | 66,103,812 | | | | 66,078,283 | | | | 66,093,004 | | | | 65,836,965 | |
| (1) | Refer to page S-17.2, the section titled “Interest Expense, Net” for additional information. |
See Company’s Form 10-K and Form 10-Qs filed with the SEC for additional information
E S S E X P R O P E R T Y T R U S T, I N C.
Consolidated Operating Results Selected Line Item Detail | | Three Months Ended September 30, | | | Nine Months Ended September 30, | |
| (Dollars in thousands) | | 2018 | | | 2017 | | | 2018 | | | 2017 | |
| | | | | | | | | | | | | |
| Rental and other property | | | | | | | | | | | | |
| Rental | | $ | 324,780 | | | $ | 319,308 | | | $ | 969,461 | | | $ | 943,976 | |
| Other property | | | 23,830 | | | | 22,666 | | | | 70,622 | | | | 67,932 | |
| Rental and other property | | $ | 348,610 | | | $ | 341,974 | | | $ | 1,040,083 | | | $ | 1,011,908 | |
| | | | | | | | | | | | | | | | | |
| Property operating expenses | | | | | | | | | | | | | | | | |
| Real estate taxes | | $ | 38,675 | | | $ | 37,531 | | | $ | 112,378 | | | $ | 108,283 | |
| Administrative | | | 19,500 | | | | 20,431 | | | | 61,211 | | | | 61,119 | |
| Maintenance and repairs | | | 20,132 | | | | 20,323 | | | | 59,742 | | | | 58,409 | |
| Utilities | | | 19,468 | | | | 18,279 | | | | 53,553 | | | | 51,500 | |
| Property operating expenses | | $ | 97,775 | | | $ | 96,564 | | | $ | 286,884 | | | $ | 279,311 | |
| | | | | | | | | | | | | | | | | |
| Interest and other income | | | | | | | | | | | | | | | | |
| Marketable securities and other interest income | | $ | 6,772 | | | $ | 5,504 | | | $ | 18,824 | | | $ | 15,428 | |
| Gain on sale of marketable securities | | | 120 | | | | 32 | | | | 669 | | | | 1,650 | |
Unrealized gains on marketable securities (1) | | | 1,180 | | | | - | | | | 426 | | | | - | |
| Insurance reimbursements, legal settlements, and other, net | | | 365 | | | | 254 | | | | 1,322 | | | | 838 | |
| Interest and other income | | $ | 8,437 | | | $ | 5,790 | | | $ | 21,241 | | | $ | 17,916 | |
| | | | | | | | | | | | | | | | | |
| Equity income from co-investments | | | | | | | | | | | | | | | | |
| Equity income from co-investments | | $ | 4,097 | | | $ | 3,688 | | | $ | 12,878 | | | $ | 13,336 | |
| Income from preferred equity investments | | | 9,029 | | | | 5,973 | | | | 25,928 | | | | 17,284 | |
| Gain on sale of co-investment communities | | | - | | | | 10,058 | | | | - | | | | 10,058 | |
| Gain on early retirement of debt from unconsolidated co-investment | | | 3,662 | | | | - | | | | 3,662 | | | | - | |
| Co-investment promote income | | | - | | | | - | | | | 20,541 | | | | - | |
| Income from early redemption of preferred equity investments | | | - | | | | 8 | | | | 1,602 | | | | 256 | |
| Equity income from co-investments | | $ | 16,788 | | | $ | 19,727 | | | $ | 64,611 | | | $ | 40,934 | |
| | | | | | | | | | | | | | | | | |
| Noncontrolling interest | | | | | | | | | | | | | | | | |
| Limited partners of Essex Portfolio, L.P. | | $ | 2,789 | | | $ | 2,721 | | | $ | 9,381 | | | $ | 11,289 | |
| DownREIT limited partners’ distributions | | | 1,590 | | | | 1,692 | | | | 4,770 | | | | 4,937 | |
| Third-party ownership interest | | | 756 | | | | 899 | | | | 2,675 | | | | 2,709 | |
| Noncontrolling interest | | $ | 5,135 | | | $ | 5,312 | | | $ | 16,826 | | | $ | 18,935 | |
| (1) | The Company adopted ASU No. 2016-01 “Recognition and Measurement of Financial Assets and Financial Liabilities”, as of January 1, 2018 using the modified-retrospective method. As a result of this adoption, the Company recognizes mark to market adjustments on equity securities through its income statement on a prospective basis. Prior period results have not been adjusted. |
See Company’s Form 10-K and Form 10-Qs filed with the SEC for additional information
E S S E X P R O P E R T Y T R U S T, I N C.
Consolidated Funds From Operations (1) (Dollars in thousands, except share and per share amounts and in footnotes) | | Three Months Ended September 30, | | | | Nine Months Ended September 30, | | |
| | | 2018 | | | 2017 | | % Change | | 2018 | | | 2017 | | % Change |
| | | | | | | | | | | | | | | |
| Funds from operations attributable to common stockholders and unitholders (FFO) | | | | | | | | | | | | |
| Net income available to common stockholders | | $ | 80,975 | | | $ | 79,723 | | | | $ | 272,333 | | | $ | 329,446 | | |
| Adjustments: | | | | | | | | | | | | | | | | | | |
| Depreciation and amortization | | | 120,852 | | | | 117,451 | | | | | 359,287 | | | | 350,893 | | |
| Gains not included in FFO | | | - | | | | (10,307 | ) | | | | (22,244 | ) | | | (125,122 | ) | |
| Depreciation and amortization from unconsolidated co-investments | | | 15,766 | | | | 13,854 | | | | | 47,345 | | | | 40,335 | | |
| Noncontrolling interest related to Operating Partnership units | | | 2,789 | | | | 2,721 | | | | | 9,381 | | | | 11,289 | | |
Depreciation attributable to third party ownership and other (2) | | | (234 | ) | | | (23 | ) | | | | (699 | ) | | | (74 | ) | |
| Funds from operations attributable to common stockholders and unitholders | | $ | 220,148 | | | $ | 203,419 | | | | $ | 665,403 | | | $ | 606,767 | | |
| FFO per share-diluted | | $ | 3.22 | | | $ | 2.97 | | 8.4% | | $ | 9.74 | | | $ | 8.90 | | 9.4% |
| | | | | | | | | | | | | | | | | | | |
| Components of the change in FFO | | | | | | | | | | | | | | | | | | |
| Non-core items: | | | | | | | | | | | | | | | | | | |
| Expensed acquisition and investment related costs | | $ | 31 | | | $ | 324 | | | | $ | 156 | | | $ | 1,154 | | |
| Gain on sale of marketable securities | | | (120 | ) | | | (32 | ) | | | | (669 | ) | | | (1,650 | ) | |
| Unrealized gains on marketable securities | | | (1,180 | ) | | | - | | | | | (426 | ) | | | - | | |
Interest rate hedge ineffectiveness (3) | | | (35 | ) | | | 1 | | | | | 61 | | | | (19 | ) | |
| Gain on early retirement of debt from unconsolidated co-investment | | | (3,662 | ) | | | - | | | | | (3,662 | ) | | | - | | |
| Co-investment promote income | | | - | | | | - | | | | | (20,541 | ) | | | - | | |
| Income from early redemption of preferred equity investments | | | - | | | | (8 | ) | | | | (1,602 | ) | | | (256 | ) | |
| Insurance reimbursements, legal settlements, and other, net | | | 30 | | | | 335 | | | | | 2,013 | | | | 310 | | |
| Core funds from operations attributable to common stockholders and unitholders | | $ | 215,212 | | | $ | 204,039 | | | | $ | 640,733 | | | $ | 606,306 | | |
| Core FFO per share-diluted | | $ | 3.15 | | | $ | 2.98 | | 5.7% | | $ | 9.38 | | | $ | 8.90 | | 5.4% |
| | | | | | | | | | | | | | | | | | | |
| Changes in core items: | | | | | | | | | | | | | | | | | | |
| Same-property NOI | | $ | 5,365 | | | | | | | | $ | 20,349 | | | | | | |
| Non-same property NOI | | | 60 | | | | | | | | | 253 | | | | | | |
| Management and other fees, net | | | (88 | ) | | | | | | | | (115 | ) | | | | | |
| FFO from co-investments | | | 5,377 | | | | | | | | | 15,196 | | | | | | |
| Interest and other income | | | 933 | | | | | | | | | 3,009 | | | | | | |
| Interest expense | | | 424 | | | | | | | | | (53 | ) | | | | | |
| General and administrative | | | (672 | ) | | | | | | | | (3,239 | ) | | | | | |
| Corporate-level property management expenses | | | (188 | ) | | | | | | | | (709 | ) | | | | | |
| Other items, net | | | (38 | ) | | | | | | | | (264 | ) | | | | | |
| | | $ | 11,173 | | | | | | | | $ | 34,427 | | | | | | |
| | | | | | | | | | | | | | | | | | | |
Weighted average number of shares outstanding diluted (4) | | | 68,339,057 | | | | 68,392,419 | | | | | 68,328,370 | | | | 68,159,766 | | |
| (1) | Refer to page S-17.2, the section titled “Funds from Operations (“FFO”) for additional information on the Company’s definition and use of FFO and Core FFO. |
| (2) | The Company consolidates certain co-investments. The noncontrolling interest’s share of net operating income in these investments for the three and nine months ended September 30, 2018 was $1.3 million and $3.8 million, respectively. |
| (3) | Interest rate swaps are generally adjusted to fair value through other comprehensive income (loss). However, because certain of our interest rate swaps do not have a 0% LIBOR floor, while related hedged debt in these cases is subject to a 0% LIBOR floor, the portion of the change in fair value of these interest rate swaps attributable to this mismatch, if any, is recorded as noncash interest rate hedge ineffectiveness through interest expense. |
| (4) | Assumes conversion of all outstanding limited partnership units in the Operating Partnership into shares of the Company’s common stock and excludes all DownREIT limited partnership units for which the Operating Partnership has the ability and intention to redeem the units for cash and does not consider them to be common stock equivalents. |
See Company’s Form 10-K and Form 10-Qs filed with the SEC for additional information
E S S E X P R O P E R T Y T R U S T, I N C.
Consolidated Balance Sheets (Dollars in thousands) | | | | | | |
| | | September 30, 2018 | | | December 31, 2017 | |
| | | | | | | |
| Real Estate: | | | | | | |
| Land and land improvements | | $ | 2,710,139 | | | $ | 2,719,064 | |
| Buildings and improvements | | | 10,744,841 | | | | 10,643,009 | |
| | | | 13,454,980 | | | | 13,362,073 | |
| Less: accumulated depreciation | | | (3,113,386 | ) | | | (2,769,297 | ) |
| | | | 10,341,594 | | | | 10,592,776 | |
| Real estate under development | | | 403,644 | | | | 355,735 | |
| Co-investments | | | 1,267,593 | | | | 1,155,984 | |
| | | | 12,012,831 | | | | 12,104,495 | |
| Cash and cash equivalents, including restricted cash | | | 174,626 | | | | 61,126 | |
| Marketable securities | | | 210,596 | | | | 190,004 | |
| Notes and other receivables | | | 69,166 | | | | 100,926 | |
| Prepaid expenses and other assets | | | 50,924 | | | | 39,155 | |
| Total assets | | $ | 12,518,143 | | | $ | 12,495,706 | |
| | | | | | | | | |
| Unsecured debt, net | | $ | 3,798,705 | | | $ | 3,501,709 | |
| Mortgage notes payable, net | | | 1,834,967 | | | | 2,008,417 | |
| Lines of credit | | | - | | | | 179,000 | |
| Distributions in excess of investments in co-investments | | | - | | | | 36,726 | |
| Other liabilities | | | 411,778 | | | | 333,823 | |
| Total liabilities | | | 6,045,450 | | | | 6,059,675 | |
| Redeemable noncontrolling interest | | | 36,665 | | | | 39,206 | |
| Equity: | | | | | | | | |
| Common stock | | | 7 | | | | 7 | |
| Additional paid-in capital | | | 7,133,587 | | | | 7,129,571 | |
| Distributions in excess of accumulated earnings | | | (808,085 | ) | | | (833,726 | ) |
| Accumulated other comprehensive loss, net | | | (8,548 | ) | | | (18,446 | ) |
| Total stockholders’ equity | | | 6,316,961 | | | | 6,277,406 | |
| Noncontrolling interest | | | 119,067 | | | | 119,419 | |
| Total equity | | | 6,436,028 | | | | 6,396,825 | |
| Total liabilities and equity | | $ | 12,518,143 | | | $ | 12,495,706 | |
See Company’s Form 10-K and Form 10-Qs filed with the SEC for additional information
E S S E X P R O P E R T Y T R U S T, I N C.
Debt Summary - September 30, 2018 (Dollars in thousands, except in footnotes) | | | | | | | | | | | | | | | | | |
| | | | | | | | | | | | | | | | | | | |
| | | | | | | | | | | | | | | | | | | |
| | | | | | | | | Scheduled principal payments, unamortized premiums (discounts) and (debt issuance costs) are as follows - excludes lines of credit: | |
| | | | | | | | | | | | | | | | | | | |
| | | |
| | | | | | | | | | | | | |
| | Balance Outstanding | |
Weighted Average | | | | Unsecured | | Secured | | Total | | Weighted Average Interest Rate | | Percentage of Total Debt | |
Interest Rate | | Maturity in Years |
| Unsecured Debt, net | | | | | | | | | | | | | | | | | | |
| Bonds private - fixed rate | $ | 275,000 | | | 4.5 | % | | 2.3 | | | 2018 | $ | - | | $ | 68,054 | | $ | 68,054 | | | 5.8 | % | | 1.2 | % |
| Bonds public - fixed rate | | 3,200,000 | | | 3.9 | % | | 7.9 | | | 2019 | | 75,000 | | | 530,688 | | | 605,688 | | | 4.4 | % | | 10.7 | % |
Term loan (1) | | 350,000 | | | 2.8 | % | | 3.4 | | | 2020 | | - | | | 693,723 | | | 693,723 | | | 5.0 | % | | 12.3 | % |
| Unamortized net discounts and debt issuance costs | | (26,295 | ) | | - | | | - | | | 2021 | | 500,000 | | | 43,604 | | | 543,604 | | | 4.5 | % | | 9.6 | % |
| | | 3,798,705 | | | 3.8 | % | | 7.1 | | | 2022 | | 650,000 | | | 41,178 | | | 691,178 | | | 3.3 | % | | 12.3 | % |
| Mortgage Notes Payable, net | | | | | | | | | | | 2023 | | 600,000 | | | 852 | | | 600,852 | | | 3.7 | % | | 10.7 | % |
| Fixed rate - secured | | 1,548,409 | | | 4.7 | % | | 2.2 | | | 2024 | | 400,000 | | | 932 | | | 400,932 | | | 4.0 | % | | 7.1 | % |
Variable rate - secured (2) | | 269,766 | | | 2.3 | % | | 17.9 | | | 2025 | | 500,000 | | | 14,619 | | | 514,619 | | | 3.6 | % | | 9.1 | % |
| Unamortized premiums and debt issuance costs, net | | 16,792 | | | - | | | - | | | 2026 | | 450,000 | | | 53,601 | | | 503,601 | | | 3.5 | % | | 8.9 | % |
| Total mortgage notes payable | | 1,834,967 | | | 4.4 | % | | 4.5 | | | 2027 | | 350,000 | | | 153,955 | | | 503,955 | | | 3.6 | % | | 8.9 | % |
| | | | | | | | | | | | 2028 | | - | | | 53,332 | | | 53,332 | | | 4.0 | % | | 1.0 | % |
| Unsecured Lines of Credit | | | | | | | | | | | Thereafter | | 300,000 | | | 163,637 | | | 463,637 | | | 3.8 | % | | 8.2 | % |
Line of credit (3) | | - | | | 3.0 | % | | | | | Subtotal | | 3,825,000 | | | 1,818,175 | | | 5,643,175 | | | 4.0 | % | | 100.0 | % |
Line of credit (4) | | - | | | 3.0 | % | | | | | Debt Issuance Costs | | (19,334 | ) | | (4,418 | ) | | (23,752 | ) | NA | | NA | |
| Total lines of credit | | - | | | 3.0 | % | | | | | (Discounts)/Premiums | | (6,961 | ) | | 21,210 | | | 14,249 | | NA | | NA | |
| | | | | | | | | | | | Total | $ | 3,798,705 | | $ | 1,834,967 | | $ | 5,633,672 | | | 4.0 | % | | 100.0 | % |
| Total debt, net | $ | 5,633,672 | | | 4.0 | % | | | | | | | | | | | | | | | | | | | | | |
| | | | | | | | | | | | | | | | | | | | | | | | | | | | |
Capitalized interest for the three and nine months ended September 30, 2018 was approximately $4.9 million and $13.3 million, respectively.
| (1) | The unsecured term loan has a variable interest rate of LIBOR plus 0.95%. The Company has interest rate swap contracts with an aggregate notional amount of $175 million, which effectively converts the interest rate on $175 million of the term loan to a fixed rate of 2.3%. |
| (2) | $269.8 million of variable rate debt is tax exempt to the note holders. $9.9 million is subject to interest rate cap protection agreements. |
| (3) | This unsecured line of credit facility has a capacity of $1.2 billion. The line matures in December 2021 with one 18-month extension, exercisable at the Company’s option. The underlying interest rate on this line is based on a tiered rate structure tied to the Company’s corporate ratings and is currently at LIBOR plus 0.875%. |
| (4) | This unsecured line of credit facility has a capacity $35.0 million and is scheduled to mature in January 2020. The underlying interest rate on this line is based on a tiered rate structure tied to the Company’s corporate ratings and is currently at LIBOR plus 0.875%. |
See Company’s Form 10-K and Form 10-Qs filed with the SEC for additional information
E S S E X P R O P E R T Y T R U S T, I N C.
Capitalization Data, Public Bond Covenants, Credit Ratings and Selected Credit Ratios - September 30, 2018
(Dollars and shares in thousands, except per share amounts)
| | | | | | | | | | | | |
Capitalization Data | | | | | | Public Bond Covenants (1) | | Actual | | Requirement | |
| Total debt, net | | $ | 5,633,672 | | | | | | | | | |
| | | | | | | | Adjusted Debt to Adjusted Total Assets: | | | 36% |
| < 65% | |
| Common stock and potentially dilutive securities | | | | | | | | | | | | | |
| Common stock outstanding | | | 66,055 | | | | | | | | | | |
Limited partnership units (1) | | | 2,235 | | | | | | | | | | |
| Options-treasury method | | | 59 | | | | Secured Debt to Adjusted Total Assets: | | | 12% |
| < 40% | |
| Total shares of common stock and potentially dilutive securities | | | 68,349 | | | | | | | | | | |
| | | | | | | | | | | | | | |
| Common stock price per share as of September 30, 2018 | | $ | 246.71 | | | | | | | | | | |
| | | | | | | | Interest Coverage: | | | 433% |
| > 150% | |
| Total equity capitalization | | $ | 16,862,382 | | | | | | | | | | |
| | | | | | | | | | | | | | |
| Total market capitalization | | $ | 22,496,054 | | | | Unsecured Debt Ratio (2): | | | 287% |
| > 150% | |
| | | | | | | | | | | | | | |
| Ratio of debt to total market capitalization | | | 25.0 | % | |
| | | | | | | |
| | | | | | | | Selected Credit Ratios (3) | | Actual | | | |
Credit Ratings | | | | | | | | | | | | | |
Rating Agency | Rating | Outlook | | | | | | | Net Indebtedness Divided by Adjusted EBITDAre, normalized and annualized: | | | 5.5 | | | |
| Fitch | BBB+ | Positive | | | | | | | | | | | | | |
| Moody’s | Baa1 | Stable | | | | | | | Unencumbered NOI to Adjusted Total NOI: | | | 73% |
| | |
| Standard & Poor’s | BBB+ | Stable | | | | | | | | | | | | | |
|
|
|
(1) Assumes conversion of all outstanding limited partnership units in the Operating Partnership into shares of the Company’s common stock. | | (1) Refer to page S-17.4 for additional information on the Company’s Public Bond Covenants. |
| | | |
| | | (2) Unsecured Debt Ratio is unsecured assets (excluding investments in co-investments) divided by unsecured indebtedness. |
| | | |
| | | (3) Refer to pages S-17.1 to S-17.4, the section titled “Reconciliations of Non-GAAP Financial Measures and Other Terms” for additional information on the Company’s Selected Credit Ratios. |
| | | |
See Company’s Form 10-K and Form 10-Qs filed with the SEC for additional information
E S S E X P R O P E R T Y T R U S T, I N C.
Portfolio Summary by County as of September 30, 2018
Region - County | | Apartment Homes | | | Average Monthly Rental Rate (1) | | | Percent of NOI (2) | |
Consolidated(3) | | | Unconsolidated Co-investments(3) | | | Apartment Homes in Development(4) | | | Total | | | Consolidated | | | Unconsolidated Co-investments(5) | | | Total(6) | | | Consolidated | | | Unconsolidated Co-investments(5) | | | Total(6) | |
| | | | | | | | | | | | | | | | | | | | | | | | | | | | | | | |
| Southern California | | | | | | | | | | | | | | | | | | | | | | | | | | | | | | |
| Los Angeles County | | | 9,387 | | | | 1,563 | | | | 200 | | | | 11,150 | | | $ | 2,436 | | | $ | 2,095 | | | $ | 2,409 | | | | 19.7 | % | | | 12.4 | % | | | 19.0 | % |
| Orange County | | | 5,553 | | | | 1,149 | | | | - | | | | 6,702 | | | | 2,170 | | | | 1,882 | | | | 2,143 | | | | 10.4 | % | | | 8.3 | % | | | 10.2 | % |
| San Diego County | | | 4,824 | | | | 616 | | | | - | | | | 5,440 | | | | 1,924 | | | | 1,789 | | | | 1,916 | | | | 8.2 | % | | | 4.2 | % | | | 7.8 | % |
| Ventura County | | | 2,577 | | | | 693 | | | | - | | | | 3,270 | | | | 1,806 | | | | 2,131 | | | | 1,847 | | | | 4.4 | % | | | 6.2 | % | | | 4.6 | % |
| Other Southern CA | | | 623 | | | | 249 | | | | - | | | | 872 | | | | 1,634 | | | | 1,619 | | | | 1,631 | | | | 0.9 | % | | | 1.5 | % | | | 0.9 | % |
| Total Southern California | | | 22,964 | | | | 4,270 | | | | 200 | | | | 27,434 | | | | 2,172 | | | | 1,975 | | | | 2,155 | | | | 43.6 | % | | | 32.6 | % | | | 42.5 | % |
| | | | | | | | | | | | | | | | | | | | | | | | | | | | | | | | | | | | | | | | | |
| Northern California | | | | | | | | | | | | | | | | | | | | | | | | | | | | | | | | | | | | | | | | |
| Santa Clara County | | | 7,356 | | | | 2,266 | | | | 745 | | | | 10,367 | | | | 2,745 | | | | 2,866 | | | | 2,762 | | | | 18.9 | % | | | 27.1 | % | | | 19.7 | % |
| Alameda County | | | 2,954 | | | | 1,983 | | | | - | | | | 4,937 | | | | 2,543 | | | | 2,350 | | | | 2,492 | | | | 6.9 | % | | | 19.4 | % | | | 8.1 | % |
| San Mateo County | | | 1,951 | | | | 197 | | | | 371 | | | | 2,519 | | | | 2,958 | | | | 2,962 | | | | 2,958 | | | | 5.2 | % | | | 2.4 | % | | | 4.9 | % |
| Contra Costa County | | | 2,270 | | | | 49 | | | | - | | | | 2,319 | | | | 2,320 | | | | 4,644 | | | | 2,345 | | | | 4.8 | % | | | 0.7 | % | | | 4.4 | % |
| San Francisco | | | 1,343 | | | | 463 | | | | 545 | | | | 2,351 | | | | 3,132 | | | | 3,262 | | | | 3,153 | | | | 3.7 | % | | | 5.6 | % | | | 3.9 | % |
| Other Northern CA | | | 96 | | | | - | | | | - | | | | 96 | | | | 2,993 | | | | - | | | | 2,993 | | | | 0.2 | % | | | - | | | | 0.2 | % |
| Total Northern California | | | 15,970 | | | | 4,958 | | | | 1,661 | | | | 22,589 | | | | 2,707 | | | | 2,717 | | | | 2,709 | | | | 39.7 | % | | | 55.2 | % | | | 41.2 | % |
| | | | | | | | | | | | | | | | | | | | | | | | | | | | | | | | | | | | | | | | | |
| Seattle Metro | | | 10,238 | | | | 1,582 | | | | - | | | | 11,820 | | | | 1,838 | | | | 1,836 | | | | 1,838 | | | | 16.7 | % | | | 12.2 | % | | | 16.3 | % |
| | | | | | | | | | | | | | | | | | | | | | | | | | | | | | | | | | | | | | | | | |
| Total | | | 49,172 | | | | 10,810 | | | | 1,861 | | | | 61,843 | | | $ | 2,276 | | | $ | 2,299 | | | $ | 2,279 | | | | 100.0 | % | | | 100.0 | % | | | 100.0 | % |
| (1) | Average monthly rental rate is defined as the total potential monthly rental revenue (actual rent for occupied apartment homes plus market rent for vacant apartment homes) divided by the number of apartment homes. |
| (2) | Actual NOI for the quarter ended September 30, 2018. See the section titled “Net Operating Income (“NOI”) and Same-Property NOI Reconciliations” on page S-17.3. |
| (3) | Includes all apartment communities with rents. |
| (4) | Includes development communities with no rental income. |
| (5) | Co-investment amounts weighted for Company’s pro rata share. |
| (6) | At Company’s pro rata share. |
See Company’s Form 10-K and Form 10-Qs filed with the SEC for additional information
E S S E X P R O P E R T Y T R U S T, I N C.
Operating Income by Quarter (1)
(Dollars in thousands, except in footnotes)
| | | Apartment Homes | | | Q3 ‘18 | | | Q2 ‘18 | | | Q1 ‘18 | | | Q4 ‘17 | | | Q3 ‘17 | |
| | | | | | | | | | | | | | | | | | | |
| Rental and other property revenues: | | | | | | | | | | | | | | | | | | |
| Same-property | | | 46,863 | | | $ | 324,271 | | | $ | 321,283 | | | $ | 320,095 | | | $ | 317,738 | | | $ | 317,302 | |
Acquisitions (2) | | | 1,328 | | | | 10,695 | | | | 10,501 | | | | 10,383 | | | | 10,435 | | | | 10,498 | |
Development (3) | | | 121 | | | | 1,091 | | | | 450 | | | | 19 | | | | - | | | | - | |
| Redevelopment | | | 621 | | | | 5,125 | | | | 5,036 | | | | 5,024 | | | | 5,005 | | | | 4,913 | |
Non-residential/other, net (4) | | | 239 | | | | 7,428 | | | | 9,256 | | | | 9,426 | | | | 9,239 | | | | 9,261 | |
| Total rental and other property revenues | | | 49,172 | | | | 348,610 | | | | 346,526 | | | | 344,947 | | | | 342,417 | | | | 341,974 | |
| | | | | | | | | | | | | | | | | | | | | | | | | |
| Property operating expenses: | | | | | | | | | | | | | | | | | | | | | | | | |
| Same-property | | | | | | | 91,710 | | | | 88,519 | | | | 88,832 | | | | 89,425 | | | | 90,106 | |
Acquisitions (2) | | | | | | | 2,842 | | | | 2,116 | | | | 3,074 | | | | 3,116 | | | | 3,220 | |
Development (3) | | | | | | | 638 | | | | 498 | | | | 64 | | | | - | | | | - | |
| Redevelopment | | | | | | | 1,647 | | | | 1,468 | | | | 1,469 | | | | 1,528 | | | | 1,529 | |
Non-residential/other, net (4) (5) | | | | | | | 938 | | | | 1,545 | | | | 1,524 | | | | 2,005 | | | | 1,709 | |
| Total property operating expenses | | | | | | | 97,775 | | | | 94,146 | | | | 94,963 | | | | 96,074 | | | | 96,564 | |
| | | | | | | | | | | | | | | | | | | | | | | | | |
| Net operating income (NOI): | | | | | | | | | | | | | | | | | | | | | | | | |
| Same-property | | | | | | | 232,561 | | | | 232,764 | | | | 231,263 | | | | 228,313 | | | | 227,196 | |
Acquisitions (2) | | | | | | | 7,853 | | | | 8,385 | | | | 7,309 | | | | 7,319 | | | | 7,278 | |
Development (3) | | | | | | | 453 | | | | (48 | ) | | | (45 | ) | | | - | | | | - | |
| Redevelopment | | | | | | | 3,478 | | | | 3,568 | | | | 3,555 | | | | 3,477 | | | | 3,384 | |
Non-residential/other, net (4) | | | | | | | 6,490 | | | | 7,711 | | | | 7,902 | | | | 7,234 | | | | 7,552 | |
| Total NOI | | | | | | $ | 250,835 | | | $ | 252,380 | | | $ | 249,984 | | | $ | 246,343 | | | $ | 245,410 | |
| | | | | | | | | | | | | | | | | | | | | | | | | |
| Same-property metrics | | | | | | | | | | | | | | | | | | | | | | | | |
| Operating margin | | | | | | | 72 | % | | | 72 | % | | | 72 | % | | | 72 | % | | | 72 | % |
Annualized turnover (6) | | | | | | | 56 | % | | | 53 | % | | | 40 | % | | | 46 | % | | | 61 | % |
Financial occupancy (7) | | | | | | | 96.4 | % | | | 96.7 | % | | | 97.1 | % | | | 96.8 | % | | | 96.7 | % |
| (1) | Includes consolidated communities only. |
| (2) | Acquisitions include properties acquired which did not have comparable stabilized results as of January 1, 2017. |
| (3) | Development includes properties developed which did not have comparable stabilized results as of January 1, 2017. |
| (4) | Other real estate assets consists mainly of retail space, commercial properties, boat slips, held for sale properties, disposition properties, and student housing. |
| (5) | Includes other expenses and intercompany eliminations pertaining to self-insurance. |
| (6) | Annualized turnover is defined as the number of apartment homes turned over during the quarter, annualized, divided by the total number of apartment homes. |
| (7) | Financial occupancy is defined as the percentage resulting from dividing actual rental revenue by total potential rental revenue (actual rent for occupied apartment homes plus market rent for vacant apartment homes). |
See Company’s Form 10-K and Form 10-Qs filed with the SEC for additional information
E S S E X P R O P E R T Y T R U S T, I N C.
Same-Property Results by County - Third Quarter 2018 vs. Third Quarter 2017 and Second Quarter 2018
(Dollars in thousands, except average monthly rental rates)
| Region - County | | Apartment Homes | | Q3 ‘18 % of Actual NOI | | Average Monthly Rental Rate | | Financial Occupancy | | Gross Revenues | | Sequential Gross Revenues | |
| Q3 ‘18 | | Q3 ‘17 | |
% Change | | Q3 ‘18 | | Q3 ‘17 | |
% Change | | Q3 ‘18 | | Q3 ‘17 | |
% Change | | Q2 ‘18 | |
% Change | |
| | | | | | | | | | | | | | | | | | | | | | | | | | | | |
| Southern California | | | | | | | | | | | | | | | | | | | | | | | | | | | |
| Los Angeles County | | | 8,931 | | | 19.8 | % | $ | 2,447 | | $ | 2,396 | | | 2.1 | % | | 96.5 | % | | 96.6 | % | | -0.1 | % | $ | 66,324 | | $ | 64,876 | | | 2.2 | % | $ | 65,670 | | | 1.0 | % |
| Orange County | | | 5,553 | | | 11.0 | % | | 2,170 | | | 2,116 | | | 2.6 | % | | 96.2 | % | | 96.8 | % | | -0.6 | % | | 36,417 | | | 35,761 | | | 1.8 | % | | 36,043 | | | 1.0 | % |
| San Diego County | | | 4,824 | | | 8.7 | % | | 1,924 | | | 1,866 | | | 3.1 | % | | 96.8 | % | | 96.7 | % | | 0.1 | % | | 28,510 | | | 27,643 | | | 3.1 | % | | 28,168 | | | 1.2 | % |
| Ventura County | | | 2,577 | | | 4.7 | % | | 1,806 | | | 1,737 | | | 4.0 | % | | 96.8 | % | | 97.4 | % | | -0.6 | % | | 14,453 | | | 14,006 | | | 3.2 | % | | 14,383 | | | 0.5 | % |
| Other Southern CA | | | 384 | | | 0.5 | % | | 1,313 | | | 1,260 | | | 4.2 | % | | 97.1 | % | | 97.0 | % | | 0.1 | % | | 1,570 | | | 1,492 | | | 5.2 | % | | 1,535 | | | 2.3 | % |
| Total Southern California | | | 22,269 | | | 44.7 | % | | 2,171 | | | 2,116 | | | 2.6 | % | | 96.5 | % | | 96.8 | % | | -0.3 | % | | 147,274 | | | 143,778 | | | 2.4 | % | | 145,799 | | | 1.0 | % |
| | | | | | | | | | | | | | | | | | | | | | | | | | | | | | | | | | | | | | | | | |
| Northern California | | | | | | | | | | | | | | | | | | | | | | | | | | | | | | | | | | | | | | | | |
| Santa Clara County | | | 6,028 | | | 16.5 | % | | 2,765 | | | 2,693 | | | 2.7 | % | | 96.5 | % | | 97.0 | % | | -0.5 | % | | 50,610 | | | 49,427 | | | 2.4 | % | | 50,223 | | | 0.8 | % |
| Alameda County | | | 2,954 | | | 7.2 | % | | 2,543 | | | 2,494 | | | 2.0 | % | | 96.2 | % | | 96.5 | % | | -0.3 | % | | 22,930 | | | 22,477 | | | 2.0 | % | | 22,694 | | | 1.0 | % |
| San Mateo County | | | 1,830 | | | 5.3 | % | | 2,924 | | | 2,844 | | | 2.8 | % | | 96.8 | % | | 96.9 | % | | -0.1 | % | | 16,534 | | | 15,986 | | | 3.4 | % | | 16,261 | | | 1.7 | % |
| Contra Costa County | | | 2,270 | | | 5.1 | % | | 2,320 | | | 2,277 | | | 1.9 | % | | 96.4 | % | | 97.4 | % | | -1.0 | % | | 16,124 | | | 15,814 | | | 2.0 | % | | 16,020 | | | 0.6 | % |
| San Francisco | | | 1,178 | | | 3.3 | % | | 3,019 | | | 2,965 | | | 1.8 | % | | 95.2 | % | | 97.1 | % | | -2.0 | % | | 10,765 | | | 10,728 | | | 0.3 | % | | 10,651 | | | 1.1 | % |
| Other Northern CA | | | 96 | | | 0.3 | % | | 2,993 | | | 2,870 | | | 4.3 | % | | 90.4 | % | | 94.1 | % | | -3.9 | % | | 803 | | | 807 | | | -0.5 | % | | 839 | | | -4.3 | % |
| Total Northern California | | | 14,356 | | | 37.7 | % | | 2,692 | | | 2,629 | | | 2.4 | % | | 96.3 | % | | 97.0 | % | | -0.7 | % | | 117,766 | | | 115,239 | | | 2.2 | % | | 116,688 | | | 0.9 | % |
| | | | | | | | | | | | | | | | | | | | | | | | | | | | | | | | | | | | | | | | | |
| Seattle Metro | | | 10,238 | | | 17.6 | % | | 1,838 | | | 1,800 | | | 2.1 | % | | 96.1 | % | | 96.2 | % | | -0.1 | % | | 59,231 | | | 58,285 | | | 1.6 | % | | 58,796 | | | 0.7 | % |
| | | | | | | | | | | | | | | | | | | | | | | | | | | | | | | | | | | | | | | | | |
| Total Same-Property | | | 46,863 | | | 100.0 | % | $ | 2,258 | | $ | 2,204 | | | 2.5 | % | | 96.4 | % | | 96.7 | % | | -0.3 | % | $ | 324,271 | | $ | 317,302 | | | 2.2 | % | $ | 321,283 | | | 0.9 | % |
| | | | | | | | | | | | | | | | | | | | | | | | | | | | | | | | | | | | | | | | | |
See Company’s Form 10-K and Form 10-Qs filed with the SEC for additional information
E S S E X P R O P E R T Y T R U S T, I N C.
Same-Property Revenue Results by County - Nine months ended September 30, 2018 vs. Nine months ended September 30, 2017
(Dollars in thousands, except average monthly rental rates)
| Region - County | | Apartment Homes | | YTD 2018 % of Actual NOI | | Average Monthly Rental Rate | | Financial Occupancy | | Gross Revenues | |
| | YTD 2018 | | YTD 2017 | | % Change | | YTD 2018 | | YTD 2017 | | % Change | | YTD 2018 | | YTD 2017 | | % Change | |
| | | | | | | | | | | | | | | | | | | | | | | | |
| Southern California | | | | | | | | | | | | | | | | | | | | | | | |
| Los Angeles County | | | 8,931 | | | 19.8 | % | $ | 2,420 | | $ | 2,377 | | | 1.8 | % | | 96.6 | % | | 96.2 | % | | 0.4 | % | $ | 197,285 | | $ | 192,065 | | | 2.7 | % |
| Orange County | | | 5,553 | | | 11.1 | % | | 2,150 | | | 2,095 | | | 2.6 | % | | 96.5 | % | | 96.6 | % | | -0.1 | % | | 108,534 | | | 105,942 | | | 2.4 | % |
| San Diego County | | | 4,824 | | | 8.7 | % | | 1,898 | | | 1,840 | | | 3.2 | % | | 97.0 | % | | 96.4 | % | | 0.6 | % | | 84,599 | | | 81,597 | | | 3.7 | % |
| Ventura County | | | 2,577 | | | 4.7 | % | | 1,781 | | | 1,714 | | | 3.9 | % | | 97.4 | % | | 97.2 | % | | 0.2 | % | | 43,129 | | | 41,260 | | | 4.5 | % |
| Other Southern CA | | | 384 | | | 0.5 | % | | 1,293 | | | 1,246 | | | 3.8 | % | | 97.2 | % | | 96.9 | % | | 0.3 | % | | 4,654 | | | 4,490 | | | 3.7 | % |
| Total Southern California | | | 22,269 | | | 44.8 | % | | 2,146 | | | 2,094 | | | 2.5 | % | | 96.7 | % | | 96.4 | % | | 0.3 | % | | 438,201 | | | 425,354 | | | 3.0 | % |
| | | | | | | | | | | | | | | | | | | | | | | | | | | | | | | | | | | |
| Northern California | | | | | | | | | | | | | | | | | | | | | | | | | | | | | | | | | | |
| Santa Clara County | | | 6,028 | | | 16.4 | % | | 2,725 | | | 2,673 | | | 1.9 | % | | 97.0 | % | | 97.1 | % | | -0.1 | % | | 150,686 | | | 147,651 | | | 2.1 | % |
| Alameda County | | | 2,954 | | | 7.2 | % | | 2,515 | | | 2,471 | | | 1.8 | % | | 96.6 | % | | 95.7 | % | | 0.9 | % | | 68,273 | | | 66,235 | | | 3.1 | % |
| San Mateo County | | | 1,830 | | | 5.3 | % | | 2,878 | | | 2,825 | | | 1.9 | % | | 97.2 | % | | 97.1 | % | | 0.1 | % | | 48,953 | | | 47,728 | | | 2.6 | % |
| Contra Costa County | | | 2,270 | | | 5.1 | % | | 2,301 | | | 2,262 | | | 1.7 | % | | 96.9 | % | | 97.3 | % | | -0.4 | % | | 48,216 | | | 47,200 | | | 2.2 | % |
| San Francisco | | | 1,178 | | | 3.2 | % | | 2,983 | | | 2,941 | | | 1.4 | % | | 95.5 | % | | 96.3 | % | | -0.8 | % | | 32,082 | | | 31,609 | | | 1.5 | % |
| Other Northern CA | | | 96 | | | 0.3 | % | | 2,928 | | | 2,782 | | | 5.2 | % | | 95.4 | % | | 96.7 | % | | -1.3 | % | | 2,498 | | | 2,421 | | | 3.2 | % |
| Total Northern California | | | 14,356 | | | 37.5 | % | | 2,657 | | | 2,609 | | | 1.8 | % | | 96.8 | % | | 96.8 | % | | 0.0 | % | | 350,708 | | | 342,844 | | | 2.3 | % |
| | | | | | | | | | | | | | | | | | | | | | | | | | | | | | | | | | | |
| Seattle Metro | | | 10,238 | | | 17.7 | % | | 1,819 | | | 1,767 | | | 2.9 | % | | 96.4 | % | | 96.3 | % | | 0.1 | % | | 176,740 | | | 171,564 | | | 3.0 | % |
| | | | | | | | | | | | | | | | | | | | | | | | | | | | | | | | | | | |
| Total Same-Property | | | 46,863 | | | 100.0 | % | $ | 2,231 | | $ | 2,180 | | | 2.3 | % | | 96.7 | % | | 96.5 | % | | 0.2 | % | $ | 965,649 | | $ | 939,762 | | | 2.8 | % |
| | | | | | | | | | | | | | | | | | | | | | | | | | | | | | | | | | | |
See Company’s Form 10-K and Form 10-Qs filed with the SEC for additional information
E S S E X P R O P E R T Y T R U S T, I N C.
Same-Property Operating Expenses - Quarter and Year to Date as of September 30, 2018 and 2017
(Dollars in thousands)
| | | Based on 46,863 apartment homes | |
| | | Q3 ‘18 | | | Q3 ‘17 | | | % Change | | | % of Op. Ex. | | | | YTD 2018 | | | YTD 2017 | | | % Change | | | % of Op. Ex. | |
| Same-property operating expenses: | | | | | | | | | | | | | | | | | | | | | | | | | |
| Real estate taxes | | $ | 35,633 | | | $ | 34,139 | | | | 4.4 | % | | | 38.9 | % | | | $ | 104,315 | | | $ | 101,229 | | | | 3.0 | % | | | 38.8 | % |
| Maintenance and repairs | | | 18,593 | | | | 18,754 | | | | -0.9 | % | | | 20.3 | % | | | | 55,124 | | | | 54,145 | | | | 1.8 | % | | | 20.5 | % |
| Administrative | | | 16,410 | | | | 17,337 | | | | -5.3 | % | | | 17.9 | % | | | | 50,845 | | | | 50,805 | | | | 0.1 | % | | | 18.9 | % |
| Utilities | | | 18,009 | | | | 16,851 | | | | 6.9 | % | | | 19.6 | % | | | | 49,584 | | | | 47,574 | | | | 4.2 | % | | | 18.4 | % |
| Insurance | | | 3,065 | | | | 3,025 | | | | 1.3 | % | | | 3.3 | % | | | | 9,193 | | | | 9,686 | | | | -5.1 | % | | | 3.4 | % |
| Total same-property operating expenses | | $ | 91,710 | | | $ | 90,106 | | | | 1.8 | % | | | 100.0 | % | | | $ | 269,061 | | | $ | 263,439 | | | | 2.1 | % | | | 100.0 | % |
| | | | | | | | | | | | | | | | | | | | | | | | | | | | | | | | | | |
See Company’s Form 10-K and Form 10-Qs filed with the SEC for additional information
E S S E X P R O P E R T Y T R U S T, I N C.
Development Pipeline - September 30, 2018
(Dollars in millions, except per apartment home amounts in thousands and except in footnotes)
| Project Name | | Location | | Ownership % | | Estimated Apartment Homes | | Estimated Commercial sq. feet | | Incurred to Date | | Remaining Costs | | Estimated Total Cost | | Essex Est. Total Cost (1) | | Cost per Apartment Home (2) | | Average % Occupied | | % Leased (3) | | Construction Start | | Initial Occupancy | | Stabilized Operations | |
| | | | | | | | | | | | | | | | | | | | | | | | | | | | | |
Development Projects - Consolidated (4) | | | | | | | | | | | | | | | | | | | | | | | | | |
Station Park Green - Phase II (5) | | San Mateo, CA | | | 100 | % | | 199 | | | - | | | 98 | | | 43 | | | 141 | | | 141 | | | 709 | | | 0 | % | | 0 | % | | Q2 2017 | | | Q2 2019 | | | Q4 2019 | |
Station Park Green - Phase III (5) | | San Mateo, CA | | | 100 | % | | 172 | | | - | | | 74 | | | 50 | | | 124 | | | 124 | | | 721 | | | 0 | % | | 0 | % | | Q3 2017 | | | Q3 2019 | | | Q1 2020 | |
Gateway Village (6) | | Santa Clara, CA | | | 100 | % | | 476 | | | - | | | 136 | | | 90 | | | 226 | | | 226 | | | 475 | | | 0 | % | | 0 | % | | Q3 2016 | | | Q1 2019 | | | Q1 2020 | |
Hollywood (7) | | Hollywood, CA | | | 100 | % | | 200 | | | 4,700 | | | 39 | | | 66 | | | 105 | | | 105 | | | 500 | | | 0 | % | | 0 | % | | Q4 2017 | | | Q1 2020 | | | Q3 2020 | |
| Total Development Projects - Consolidated | | | 1,047 | | | 4,700 | | | 347 | | | 249 | | | 596 | | | 596 | | | 564 | | | | | | | | | | | | | | | | |
| | | | | | | | | | | | | | | | | | | | | | | | | | | | | | | | | | | | | | |
| Land Held for Future Development - Consolidated | | | | | | | | | | | | | | | | | | | | | | | | | | | | | | | | | | | | | |
Other Projects (5)(7) | | Various | | | 100 | % | | | | | | | | 68 | | | - | | | 68 | | | 68 | | | | | | | | | | | | | | | | | | | |
| Total Development Pipeline - Consolidated | | | 1,047 | | | 4,700 | | | 415 | | | 249 | | | 664 | | | 664 | | | | | | | | | | | | | | | | | | | |
| | | | | | | | | | | | | | | | | | | | | | | | | | | | | | | | | | | | | | | | | | |
Development Projects - Joint Venture (4) | | | | | | | | | | | | | | | | | | | | | | | | | | | | | | | | | | | | | |
| Ohlone | | San Jose, CA | | | 50 | % | | 269 | | | - | | | 58 | | | 78 | | | 136 | | | 68 | | | 506 | | | 0 | % | | 0 | % | | Q3 2017 | | | Q3 2019 | | | Q2 2020 | |
500 Folsom (8) | | San Francisco, CA | | | 50 | % | | 545 | | | 6,000 | | | 224 | | | 191 | | | 415 | | | 208 | | | 751 | | | 0 | % | | 0 | % | | Q4 2015 | | | Q2 2019 | | | Q4 2020 | |
| Total Development Projects - Joint Venture | | | 814 | | | 6,000 | | | 282 | | �� | 269 | | | 551 | | | 276 | | $ | 670 | | | | | | | | | | | | | | | | |
| | | | | | | | | | | | | | | | | | | | | | | | | | | | | | | | | | | | | | | | | | |
| Grand Total - Development Pipeline | | | 1,861 | | | 10,700 | | $ | 697 | | $ | 518 | | $ | 1,215 | | | 940 | | | | | | | | | | | | | | | | | | | |
| Essex Cost Incurred to Date - Pro Rata | | | | | | | | | | | | | | | | | | (556 | ) | | | | | | | | | | | | | | | | | | |
| Essex Remaining Commitment | | | | | | | | | | | | | | | | | $ | 384 | | | | | | | | | | | | | | | | | | | |
| (1) | The Company’s share of the estimated total cost of the project. |
| (2) | Net of the estimated allocation to the retail component of the project. |
| (3) | Calculations are based on multifamily operations only and are as of September 30, 2018. |
| (4) | For the third quarter of 2018, the Company’s cost includes $4.6 million of capitalized interest, $1.0 million of capitalized overhead and $1.1 million of development fees (such development fees reduced G&A expenses). |
| (5) | Development of Station Park Green - Phases II and III are reflected under Development Projects - Consolidated. Costs incurred for Station Park Green - Phase IV, which consists of 107 apartment homes, are included in Land Held for Future Development - Consolidated. |
| (6) | Cost incurred to date does not include a deduction of $4.7 million for accumulated depreciation recorded during the period when the property was held as a retail operating asset. |
| (7) | Cost incurred to date does not include a deduction of $6.3 million for accumulated depreciation recorded during the period when one property was held as a retail operating asset. |
| (8) | Estimated cost incurred to date and total cost are net of a projected value for low income housing tax credit proceeds and the value of the tax exempt bond structure. |
See Company’s Form 10-K and Form 10-Qs filed with the SEC for additional information
E S S E X P R O P E R T Y T R U S T, I N C.
Redevelopment Pipeline - September 30, 2018
(Dollars in thousands)
| Region/Project Name |
| Apartment Homes |
|
| Total Incurred To Date |
|
| Estimated Remaining Cost |
|
| Estimated Total Cost |
|
| Project Start Date |
|
| NOI Nine Months Ended | |
|
| 2018 | | | 2017 | |
| | | | | | | | | | | | | | | | | | | | | | |
Same-Property - Redevelopment Projects (1) | | | | | | | | | | | | | | | | | | | | | |
| Southern California | | | | | | | | | | | | | | | | | | | | | |
| Hamptons | | | 215 | | | $ | 19,900 | | | $ | 3,700 | | | $ | 23,600 | | | | Q1 2014 | | | | | | | |
| Kings Road | | | 196 | | | | 6,400 | | | | 5,800 | | | | 12,200 | | | | Q4 2016 | | | | | | | |
| The Palms at Laguna Niguel | | | 460 | | | | 4,000 | | | | 5,500 | | | | 9,500 | | | | Q4 2016 | | | | | | | |
| Northern California | | | | | | | | | | | | | | | | | | | | | | | | | | |
| Crow Canyon | | | 400 | | | | 6,000 | | | | 1,400 | | | | 7,400 | | | | Q1 2017 | | | | | | | |
| Total Same-Property - Redevelopment Projects | | | 1,271 | | | $ | 36,300 | | | $ | 16,400 | | | $ | 52,700 | | | | | | | $ | 18,046 | | | $ | 17,501 | |
| | | | | | | | | | | | | | | | | | | | | | | | | | | | | |
| Non-Same Property - Redevelopment Projects | | | | | | | | | | | | | | | | | | | | | | | | | | | | |
| Southern California | | | | | | | | | | | | | | | | | | | | | | | | | | | | |
| Bunker Hill Towers | | | 456 | | | $ | 72,900 | | | $ | 14,500 | | | $ | 87,400 | | | | Q3 2013 | | | | | | | | | |
| Total Non-Same Property - Redevelopment Projects | | | 456 | | | $ | 72,900 | | | $ | 14,500 | | | $ | 87,400 | | | | | | | $ | 6,384 | | | $ | 6,043 | |
| (1) | Redevelopment activities are ongoing at these communities, but the communities have stabilized operations, therefore results are classified in same-property results. |
See Company’s Form 10-K and Form 10-Qs filed with the SEC for additional information
E S S E X P R O P E R T Y T R U S T, I N C.
Capital Expenditures - September 30, 2018 (1)
(Dollars in thousands, except in footnotes and per apartment home amounts)
Revenue Generating Capital Expenditures (2) | | Q3 ‘18 | | | Q2 ‘18 | | | Q1 ‘18 | | | Q4 ‘17 | | | Trailing 4 Quarters | |
| Same-property portfolio | | $ | 16,215 | | | $ | 14,029 | | | $ | 9,916 | | | $ | 14,023 | | | $ | 54,183 | |
| Non-same property portfolio | | | 3,652 | | | | 2,613 | | | | 2,863 | | | | 3,171 | | | | 12,299 | |
| Total revenue generating capital expenditures | | $ | 19,867 | | | $ | 16,642 | | | $ | 12,779 | | | $ | 17,194 | | | $ | 66,482 | |
| | | | | | | | | | | | | | | | | | | | | |
| Number of same-property interior renovations completed | | | 777 | | | | 804 | | | | 499 | | | | 426 | | | | 2,506 | |
| Number of total consolidated interior renovations completed | | | 846 | | | | 860 | | | | 522 | | | | 435 | | | | 2,663 | |
| | | | | | | | | | | | | | | | | | | | | |
Non-Revenue Generating Capital Expenditures (3) | | Q3 ‘18 | | | Q2 ‘18 | | | Q1 ‘18 | | | Q4 ‘17 | | | Trailing 4 Quarters | |
| | | | | | | | | | | | | | | | | | | | | |
Non-revenue generating capital expenditures (4) | | $ | 17,554 | | | $ | 16,178 | | | $ | 11,567 | | | $ | 19,895 | | | $ | 65,194 | |
| Average apartment homes in quarter | | | 49,172 | | | | 49,362 | | | | 49,490 | | | | 49,429 | | | | 49,363 | |
| Capital expenditures per apartment homes in the quarter | | $ | 357 | | | $ | 328 | | | $ | 234 | | | $ | 402 | | | $ | 1,321 | |
| (1) | The Company incurred $0.3 million of capitalized interest, $3.0 million of capitalized overhead and $0.2 million of co-investment fees related to redevelopment in Q3 2018. |
| (2) | Represents revenue generating or expense saving expenditures, such as full-scale redevelopments shown on page S-12, interior unit turn renovations, enhanced amenities and certain resource management initiatives. |
| (3) | Represents roof replacements, paving, building and mechanical systems, exterior painting, siding, etc. |
| (4) | Non-revenue generating capital expenditures does not include expenditures incurred due to changes in governmental regulations that the Company would not have incurred otherwise, retail, furniture and fixtures, and expenditures in which the Company expects to be reimbursed. |
See Company’s Form 10-K and Form 10-Qs filed with the SEC for additional information
E S S E X P R O P E R T Y T R U S T, I N C.
Co-investments and Preferred Equity Investments - September 30, 2018
(Dollars in thousands)
| | | Weighted Average Essex Ownership Percentage | | | Apartment Homes | | | Total Undepreciated Book Value | | | Debt Amount | | | Essex Book Value | | | Weighted Average Borrowing Rate | | | Remaining Term of Debt (in Years) | | | Three Months Ended September 30, 2018 | | | Nine Months Ended September 30, 2018 | |
| Operating and Other Non-Consolidated Joint Ventures | | | | | | | | | | | | | | | | | | | | | | | NOI | |
|
| Wesco I, III, IV, and V | | | 52 | % | | | 4,578 | | | $ | 1,313,869 | | | $ | 759,970 | | | $ | 187,905 | | | | 3.7 | % | | | 3.8 | | | $ | 20,596 | | | $ | 62,461 | |
| BEXAEW, BEX II, and BEX III | | | 50 | % | | | 2,620 | | | | 683,872 | | | | 398,529 | | | | 118,924 | | | | 3.4 | % | | | 4.1 | | | | 10,224 | | | | 30,821 | |
| CPPIB | | | 54 | % | | | 2,483 | | | | 954,877 | | | | - | | | | 487,002 | | | | - | | | | - | | | | 14,105 | | | | 42,672 | |
| Other | | | 51 | % | | | 1,129 | | | | 421,942 | | | | 313,569 | | | | 46,229 | | | | 3.7 | % | | | 5.8 | | | | 7,046 | | | | 18,555 | |
| Total Operating and Other Non-Consolidated Joint Ventures | | | | | | | 10,810 | | | $ | 3,374,560 | | | $ | 1,472,068 | | | $ | 840,060 | | | | 3.6 | % | | | 4.3 | | | $ | 51,971 | | | $ | 154,509 | |
| Development Non-Consolidated Joint Ventures (1) | | | 50 | % | | | 814 | | | | 282,113 | | | | 154,357 | | | | 77,144 | | | | 4.0 | % | | | 27.1 | (2) | | | - | | | | - | |
| Total Non-Consolidated Joint Ventures | | | | | | | 11,624 | | | $ | 3,656,673 | | | $ | 1,626,425 | | | $ | 917,204 | | | | | | | | | | | $ | 51,971 | | | $ | 154,509 | |
| | | Essex Portion of NOI and Expenses | |
| NOI | | $ | 27,752 | | | $ | 81,650 | |
| Depreciation | | | (15,766 | ) | | | (47,345 | ) |
| Interest expense and other | | | (7,889 | ) | | | (21,427 | ) |
| Gain on early retirement of debt from unconsolidated co-investment | | | 3,662 | | | | 3,662 | |
| Promote income | | | - | | | | 20,541 | |
| Net income from operating and other co-investments | | $ | 7,759 | | | $ | 37,081 | |
| | | | | | Weighted Average Preferred Return | | | Weighted Average Expected Term | | | Income from Preferred Equity Investments | |
| Income from preferred equity investments | | | | | | | | | | | $ | 9,029 | | | $ | 25,928 | |
| Income from early redemption of preferred equity investments | | | | | | | | | | | | - | | | | 1,602 | |
| Preferred Equity Investments (3) | | $ | 350,389 | | | | 10.7 | % | | | 2.9 | | | $ | 9,029 | | | $ | 27,530 | |
| | | | | | | | | | | | | | | | | | | | | |
| Total Co-investments | | $ | 1,267,593 | | | | | | | | | | | $ | 16,788 | | | $ | 64,611 | |
| (1) | The Company has ownership interests in two development co-investments, which are detailed on page S-11. |
| (2) | $123.8 million of the debt related to 500 Folsom, one of the Company’s development co-investments, is financed by tax exempt bonds with a maturity date of January 2052. |
| (3) | As of September 30, 2018, the Company has invested in 17 preferred equity investments. |
See Company’s Form 10-K and Form 10-Qs filed with the SEC for additional information
E S S E X P R O P E R T Y T R U S T, I N C.
Assumptions for 2018 FFO Guidance Range
Q3 2018 Earnings Results Supplement
The guidance projections below are based on current expectations and are forward-looking. See page S-14.1 for the reconciliations of earnings per share (“EPS”) to FFO per share and Core FFO per share. The guidance on this page is given for Net Operating Income (“NOI”) and Total and Core FFO. See pages S-17.1 to S-17.4 for the definitions of non-GAAP financial measures and other terms.
($'s in thousands, except per share data) | | Nine Months Ended September 30,
2018 (1) | | |
| | Comments About Guidance Revisions |
| 2018 Full-Year Guidance Range |
| Low End | | | High End |
| | | | | | | | | | | |
| Total NOI from Consolidated Communities | | $ | 753,199 | | | $ | 1,002,700 | | | $ | 1,007,300 | | Includes a range of same-property NOI growth of 2.7% to 3.0%, revised from the prior range of 2.5% to 3.2%. |
| | | | | | | | | | | | | | |
| Management Fees | | | 6,812 | | | | 9,100 | | | | 9,300 | | |
| | | | | | | | | | | | | | |
Interest Expense | | | | | | | | | | | | | |
| Interest expense, before capitalized interest | | | (172,904 | ) | | | (230,600 | ) | | | (230,000 | ) | |
| Interest capitalized | | | 13,312 | | | | 18,100 | | | | 18,700 | | |
| Net interest expense | | | (159,592 | ) | | | (212,500 | ) | | | (211,300 | ) | |
| | | | | | | | | | | | | | |
Recurring Income and Expenses | | | | | | | | | | | | | |
| Interest and other income | | | 19,585 | | | | 25,900 | | | | 26,500 | | |
| FFO from co-investments | | | 86,151 | | | | 115,700 | | | | 116,900 | | |
| General and administrative | | | (33,965 | ) | | | (44,100 | ) | | | (45,100 | ) | |
| Corporate-level property management expenses | | | (23,313 | ) | | | (31,000 | ) | | | (31,200 | ) | |
| Non-controlling interest | | | (8,144 | ) | | | (11,000 | ) | | | (10,800 | ) | |
| Total recurring income and expenses | | | 40,314 | | | | 55,500 | | | | 56,300 | | |
| | | | | | | | | | | | | | |
Non-Core Income and Expenses | | | | | | | | | | | | | |
| Expensed acquisition and investment related costs | | | (156 | ) | | | (200 | ) | | | (300 | ) | |
| Gain on sale of marketable securities | | | 669 | | | | 669 | | | | 669 | | |
| Unrealized gains on marketable securities | | | 426 | | | | 426 | | | | 426 | | |
| Interest rate hedge ineffectiveness | | | (61 | ) | | | (61 | ) | | | (61 | ) | |
| Gain on early retirement of debt from unconsolidated co-investment | | | 3,662 | | | | 3,662 | | | | 3,662 | | |
| Co-investment promote income | | | 20,541 | | | | 20,541 | | | | 20,541 | | |
| Income from early redemption of preferred equity investments | | | 1,602 | | | | 1,602 | | | | 1,602 | | |
| Insurance reimbursements, legal settlements, and other, net | | | (2,013 | ) | | | (6,250 | ) | | | (6,250 | ) | |
| Total non-core income and expenses | | | 24,670 | | | | 20,389 | | | | 20,289 | | |
| | | | | | | | | | | | | | |
Funds from Operations (2) | | $ | 665,403 | | | $ | 875,189 | | | $ | 881,889 | | |
| | | | | | | | | | | | | | |
| Funds from Operations per diluted share | | $ | 9.74 | | | $ | 12.80 | | | $ | 12.90 | | |
| | | | | | | | | | | | | | |
| % Change - Funds from Operations | | | 9.4 | % | | | 7.5 | % | | | 8.3 | % | |
| | | | | | | | | | | | | | |
| Core Funds from Operations (excludes non-core items) | | $ | 640,733 | | | $ | 854,800 | | | $ | 861,600 | | |
| | | | | | | | | | | | | | |
| Core Funds from Operations per diluted share | | $ | 9.38 | | | $ | 12.51 | | | $ | 12.61 | | |
| | | | | | | | | | | | | | |
| % Change - Core Funds from Operations | | | 5.4 | % | | | 5.0 | % | | | 5.8 | % | |
| | | | | | | | | | | | | | |
| EPS - Diluted | | $ | 4.12 | | | $ | 5.18 | | | $ | 5.28 | | |
| | | | | | | | | | | | | | |
| Weighted average shares outstanding - FFO calculation | | | 68,328 | | | | 68,350 | | | | 68,350 | | |
(1) All non-core items are excluded from the YTD actuals and included in the non-core income and expense section of the FFO reconciliation.
(2) 2018 guidance excludes inestimable projected gain on sale of marketable securities, loss on early retirement of debt, political/legislative costs, and promote income until they are realized within the reporting period presented in the report.
See Company's Form 10-K and Form 10-Qs filed with the SEC for additional information
E S S E X P R O P E R T Y T R U S T, I N C.
Reconciliation of Projected EPS, FFO and Core FFO per diluted share
Projected EPS, FFO and Core FFO per diluted share
With respect to the Company's guidance regarding its projected FFO and Core FFO, which guidance is set forth in the earnings release and on page S-14 of this supplement, a reconciliation of projected net income per share to projected FFO per share and projected Core FFO per share, as set forth in such guidance, is presented in the table below.
|
| Nine Months Ended September 30, 2018 | | | 2018 Guidance Range (1) | |
| | | 4th Quarter 2018
| | | Full-Year 2018
| |
| | Low | | | High | | | Low | | | High | |
| EPS - diluted | | $ | 4.12 | | | $ | 1.06 | | | $ | 1.16 | | | $ | 5.18 | | | $ | 5.28 | |
| Conversion from GAAP share count | | | (0.13 | ) | | | (0.03 | ) | | | (0.03 | ) | | | (0.16 | ) | | | (0.16 | ) |
| Depreciation and amortization | | | 5.95 | | | | 2.00 | | | | 2.00 | | | | 7.95 | | | | 7.95 | |
| Noncontrolling interest related to Operating Partnership units | | | 0.13 | | | | 0.04 | | | | 0.04 | | | | 0.16 | | | | 0.16 | |
| Gain on sale of real estate | | | (0.33 | ) | | | - | | | | - | | | | (0.33 | ) | | | (0.33 | ) |
| FFO per share - diluted | | | 9.74 | | | | 3.07 | | | | 3.17 | | | | 12.80 | | | | 12.90 | |
| Expensed acquisition and investment related costs | | | - | | | | - | | | | - | | | | - | | | | - | |
| Gain on sale of marketable securities | | | (0.01 | ) | | | - | | | | - | | | | (0.01 | ) | | | (0.01 | ) |
| Unrealized gains on marketable securities | | | (0.01 | ) | | | - | | | | - | | | | (0.01 | ) | | | (0.01 | ) |
| Interest rate hedge ineffectiveness | | | - | | | | - | | | | - | | | | - | | | | - | |
| Gain on early retirement of debt from unconsolidated co-investment | | | (0.05 | ) | | | - | | | | - | | | | (0.05 | ) | | | (0.05 | ) |
| Co-investment promote income | | | (0.30 | ) | | | - | | | | - | | | | (0.30 | ) | | | (0.30 | ) |
| Income from early redemption of preferred equity investments | | | (0.02 | ) | | | - | | | | - | | | | (0.02 | ) | | | (0.02 | ) |
| Insurance reimbursements, legal settlements, and other, net | | | 0.03 | | | | 0.06 | | | | 0.06 | | | | 0.10 | | | | 0.10 | |
| Core FFO per share - diluted | | $ | 9.38 | | | $ | 3.13 | | | $ | 3.23 | | | $ | 12.51 | | | $ | 12.61 | |
| (1) | 2018 guidance excludes inestimable projected gain on sale of real estate and land, gain on sale of marketable securities, loss on early retirement of debt, political/legislative costs, and promote income until they are realized within the reporting period presented in the report. |
See Company's Form 10-K and Form 10-Qs filed with the SEC for additional information
Summary of Apartment Community Acquisitions and Dispositions Activity
Year to date as of September 30, 2018
(Dollars in thousands)
| Acquisitions | | | Essex | | | | | |
| Property Name | Location | Apartment Homes | Entity | Date | | | |
| Neither the Company nor its unconsolidated joint ventures acquired any apartment communities during the first, second, or third quarters of 2018. |
| Dispositions | | | | | | | | Essex | | | | | | | | | |
| Property Name | | Location | | | Apartment Homes | | | | | Entity | Date | | Sales Price | | | | |
| | | | | | | | | | | | | | | | | | |
| Domain | | San Diego, CA | | | | 379 | | | | 100.0 | % | EPLP | Jun-18 | | $ | 132,000 | | | $ | 348 | |
| | | | Q2 2018 | | | | 379 | | | | | | | | | $ | 132,000 | | | $ | 348 | |
| | | | | | | | | | | | | | | | | | | | | | | |
See Company's Form 10-K and Form 10-Qs filed with the SEC for additional information
E S S E X P R O P E R T Y T R U S T, I N C.
U.S. Macro Economic Assumptions: 2019 G.D.P. Growth: 2.5%, 2019 Job Growth: 1.3%
Preliminary 2019 MSA Level Forecast: Supply, Jobs, and Apartment Market Conditions
| | | Residential Supply (1) | | | Job Forecast (2) | | | Market Forecast (3) | |
| Market | | New MF Supply | | | New SF Supply | | | Total Supply | | | % of MF Supply to MF Stock | | | % of Total Supply to Total Stock | | | Est. New Jobs | | | % Growth | | | Economic Rent Growth | |
| | | | | | | | | | | | | | | | | | | | | | | | |
|
| Los Angeles | | 11,750 | | | 6,000 | | | 17,750 | | | 0.8% |
| | 0.5% |
| | 55,700 | | | 1.2% |
| | 2.8% |
|
| Orange | | 3,500 | | | 4,500 | | | 8,000 | | | 0.9% |
| | 0.7% |
| | 20,350 | | | 1.2% |
| | 3.0% |
|
| San Diego | | 2,250 | | | 4,250 | | | 6,500 | | | 0.5% |
| | 0.5% |
| | 24,250 | | | 1.6% |
| | 3.6% |
|
| Ventura | | 500 | | | 750 | | | 1,250 | | | 0.8% |
| | 0.4% |
| | 4,450 | | | 1.4% |
| | 3.2% |
|
| So. Cal. | | 18,000 | | | 15,500 | | | 33,500 | | | 0.7% |
| | 0.6% |
| | 104,750 | | | 1.3% |
| | 3.1% |
|
| | | | | | | | | | | | | | | | | | | | | | | | | | | | | | | | |
|
| San Francisco | | 2,500 | | | 500 | | | 3,000 | | | 0.7% |
| | 0.4% |
| | 19,800 | | | 1.7% |
| | 3.2% |
|
| Oakland | | 3,500 | | | 4,000 | | | 7,500 | | | 1.0% |
| | 0.7% |
| | 18,150 | | | 1.5% |
| | 2.3% |
|
| San Jose | | 2,750 | | | 2,500 | | | 5,250 | | | 1.1% |
| | 0.8% |
| | 27,550 | | | 2.4% |
| | 3.6% |
|
| No. Cal. | | 8,750 | | | 7,000 | | | 15,750 | | | 1.0% |
| | 0.7% |
| | 65,500 | | | 2.0% |
| | 3.1% |
|
| | | | | | | | | | | | | | | | | | | | | | | | | | | | | | | | |
|
| Seattle | | 9,000 | | | 8,000 | | | 17,000 | | | 1.8% |
| | 1.3% |
| | 45,900 | | | 2.6% |
| | 2.9% |
|
| | | | | | | | | | | | | | | | | | | | | | | | | | | | | | | | |
|
Weighted Average (4) | | 35,750 | | | 30,500 | | | 66,250 | | | 1.0% |
| | 0.7% |
| | 216,150 | | | 1.8% |
| | 3.1% |
|
All data are based on Essex Property Trust, Inc. forecasts.
(1) New Residential Supply: total supply includes the Company's estimate of multifamily deliveries of properties with 50+ units and excludes student, senior and 100% affordable housing communities. Single-family estimates based on an average trailing 12-month single family permits. Multifamily estimates include a new methodological enhancement to reflect the impact of continued construction delays in Essex markets. The delay-adjusted estimates reduce scheduled 2019 units by approximately 8% to reflect the recent cadence of delays in project completions.
(2) Job Forecast: refers to the difference between total non-farm industry employment (not seasonally adjusted) projected 4Q over 4Q, expressed as total new jobs and growth rates.
(3) Market Forecast: the estimated rent growth represents the forecasted change in effective market rents for full year 2019 vs 2018 (excludes submarkets not targeted by Essex).
(4) Weighted Average: markets weighted by scheduled rent in the Company's Portfolio.
See Company's Form 10-K and Form 10-Qs filed with the SEC for additional information
E S S E X P R O P E R T Y T R U S T, I N C.
GDP Growth in Essex Metros Consistently Exceeds U.S. and Supports Stronger Household Earnings Growth
| • | From 2012-2017, GDP in Essex markets grew 33%, well above the national average, led by San Jose with 52% growth, the strongest major metro in the nation |
| • | Metro GDP is driven by employment and productivity growth, supporting strong household earnings growth and attracting new highly- skilled workers to Essex metros |
(1) | Essex Market values are weighted by % of Total NOI as of third quarter 2018. |
(2) | Includes 383 U.S. Metros. |
Source: Department of Commerce’s Bureau of Economic Analysis
See Company’s Form 10-K and Form 10-Qs filed with the SEC for additional information
E S S E X P R O P E R T Y T R U S T, I N C.
Reconciliations of Non-GAAP Financial Measures and Other Terms
Adjusted EBITDAre Reconciliation
The National Association of Real Estate Investment Trusts ("NAREIT”) defines earnings before interest, taxes, depreciation and amortization for real estate ("EBITDAre") (September 2017 White Paper) as net income (computed in accordance with U.S. generally accepted accounting principles ("U.S. GAAP")) before interest expense, income taxes, depreciation and amortization expense, and further adjusted for gains and losses from sales of depreciated operating properties, impairment write-downs of depreciated operating properties, impairment write-downs of investments in unconsolidated entities caused by a decrease in value of depreciated operating properties within the joint venture and adjustments to reflect the Company’s share of EBITDAre of investments in unconsolidated entities.
The Company believes that EBITDAre is useful to investors, creditors and rating agencies as a supplemental measure of the Company’s ability to incur and service debt because it is a recognized measure of performance by the real estate industry, and by excluding gains or losses related to sales or impairment of depreciated operating properties, EBITDAre can help compare the Company’s credit strength between periods or as compared to different companies.
Adjusted EBITDAre represents EBITDAre further adjusted for non-comparable items and is a component of the credit ratio, "Net Indebtedness Divided by Adjusted EBITDAre,normalized and annualized," presented on page S-6, in the section titled "Selected Credit Ratios," and it is not intended to be a measure of free cash flow for our management’s discretionary use, as it does not consider certain cash requirements such as income tax payments, debt service requirements, capital expenditures and other fixed charges.
Adjusted EBITDAre is an important metric in evaluating the credit strength of the Company and its ability to service its debt obligations. The Company believes that Adjusted EBITDAre is useful to investors, creditors and rating agencies because it allows investors to compare the Company’s credit strength to prior reporting periods and to other companies without the effect of items that by their nature are not comparable from period to period and tend to obscure the Company’s actual credit quality.
EBITDAre and Adjusted EBITDAre are not recognized measurements under U.S. GAAP. Because not all companies use identical calculations, our presentation of EBITDAre and Adjusted EBITDAre may not be comparable to similarly titled measures of other companies.
The reconciliations of Net Income available to common stockholders to EBITDAre and Adjusted EBITDAre are presented in the table below (Dollars in thousands):
| | Three Months Ended September 30,2018 | |
| Net income available to common stockholders | | $ | 80,975 | |
| Adjustments: | | | | |
| Net income attributable to noncontrolling interest | | | 5,135 | |
Interest expense, net (1) | | | 53,012 | |
| Depreciation and amortization | | | 120,852 | |
| Income tax provision | | | (150 | ) |
| Co-investment EBITDAre adjustments | | | 23,258 | |
| EBITDAre | | | 283,082 | |
| | | | | |
| Gain on sale of marketable securities | | | (120 | ) |
| Unrealized gains on marketable securities | | | (1,180 | ) |
| Insurance reimbursements, legal settlements, and other, net | | | 30 | |
| Expensed acquisition and investment related costs | | | 31 | |
| Gain on early retirement of debt from unconsolidated co-investment | | | (3,662 | ) |
| Adjusted EBITDAre | | $ | 278,181 | |
| (1) | Interest expense, net includes items such as gains on derivatives and the amortization of deferred charges. |
See Company's Form 10-K and Form 10-Qs filed with the SEC for additional information
E S S E X P R O P E R T Y T R U S T, I N C.
Reconciliations of Non-GAAP Financial Measures and Other Terms
Encumbered
Encumbered means any mortgage, deed of trust, lien, charge, pledge, security interest, security agreement or other encumbrance of any kind.
Funds From Operations ("FFO")
FFO, as defined by the National Association of Real Estate Investment Trusts (“NAREIT”), is generally considered by industry analysts as an appropriate measure of performance of an equity REIT. Generally, FFO adjusts the net income of equity REITs for non-cash charges such as depreciation and amortization of rental properties, impairment charges, gains on sales of real estate and extraordinary items. Management considers FFO and FFO which excludes non-core items, which is referred to as “Core FFO,” to be useful supplemental operating performance measures of an equity REIT because, together with net income and cash flows, FFO and Core FFO provide investors with additional bases to evaluate the operating performance and ability of a REIT to incur and service debt and to fund acquisitions and other capital expenditures and to pay dividends. By excluding gains or losses related to sales of depreciated operating properties and excluding real estate depreciation (which can vary among owners of identical assets in similar condition based on historical cost accounting and useful life estimates), FFO can help investors compare the operating performance of a real estate company between periods or as compared to different companies. By further adjusting for items that are not considered part of the Company’s core business operations, Core FFO allows investors to compare the core operating performance of the Company to its performance in prior reporting periods and to the operating performance of other real estate companies without the effect of items that by their nature are not comparable from period to period and tend to obscure the Company’s actual operating results.
FFO and Core FFO do not represent net income or cash flows from operations as defined by U.S. generally accepted accounting principles (“GAAP”) and are not intended to indicate whether cash flows will be sufficient to fund cash needs. These measures should not be considered as alternatives to net income as an indicator of the REIT's operating performance or to cash flows as a measure of liquidity. FFO and Core FFO do not measure whether cash flow is sufficient to fund all cash needs including principal amortization, capital improvements and distributions to stockholders. FFO and Core FFO also do not represent cash flows generated from operating, investing or financing activities as defined under GAAP. Management has consistently applied the NAREIT definition of FFO to all periods presented. However, there is judgment involved and other REITs’ calculation of FFO may vary from the NAREIT definition for this measure, and thus their disclosures of FFO may not be comparable to the Company’s calculation.
The reconciliations of diluted FFO and Core FFO are detailed on page S-3 in the section titled "Consolidated Funds From Operations".
Interest Expense, Net
Interest expense, net is presented on page S-1 in the section titled "Consolidated Operating Results". Interest expense, net includes items such as gains on derivatives and the amortization of deferred charges and is presented in the table below (Dollars in thousands):
| | | Three Months Ended September 30,2018 | | | Nine Months Ended September 30,2018 | |
| Interest expense | | $ | 55,196 | | | $ | 166,335 | |
| Adjustments: | | | | | | | | |
| Total return swap income | | | (2,184 | ) | | | (6,682 | ) |
| Interest expense, net | | $ | 53,012 | | | $ | 159,653 | |
See Company's Form 10-K and Form 10-Qs filed with the SEC for additional information
E S S E X P R O P E R T Y T R U S T, I N C.
Reconciliations of Non-GAAP Financial Measures and Other Terms
Net Indebtedness Divided by Adjusted EBITDAre
This credit ratio is presented on page S-6 in the section titled "Selected Credit Ratios." This credit ratio is calculated by dividing net indebtedness by Adjusted EBITDAre, as annualized based on the most recent quarter, and adjusted for estimated net operating income from properties acquired or disposed of during the quarter. This ratio is presented by the Company because it provides rating agencies and investors an additional means of comparing the Company's ability to service debt obligations to that of other companies. Net indebtedness is total debt, net less unamortized premiums, discounts, debt issuance costs, unrestricted cash and cash equivalents, and marketable securities. The reconciliation of Adjusted EBITDAre is set forth in "Adjusted EBITDAre Reconciliation" on page S-17.1 The calculation of this credit ratio and a reconciliation of net indebtedness to total debt at pro rata share for co-investments, net is presented in the table below (Dollars in thousands):
| Total consolidated debt, net | | $ | 5,633,672 | |
| Total debt from co-investments at pro rata share | | | 836,505 | |
| Adjustments: | | | | |
| Consolidated unamortized premiums, discounts, and debt issuance costs | | | 9,503 | |
Pro rata co-investments unamortized premiums, discounts, and debt issuance costs | | | 3,109 | |
| Consolidated cash and cash equivalents-unrestricted | | | (157,279 | ) |
| Pro rata co-investment cash and cash equivalents-unrestricted | | | (38,412 | ) |
| Marketable securities | | | (210,596 | ) |
| Net Indebtedness | | $ | 6,076,502 | |
| | | | | |
Adjusted EBITDAre, annualized (1) | | $ | 1,112,724 | |
Other EBITDAre normalization adjustments, net, annualized (2) | | | 670 | |
| Adjusted EBITDAre, normalized and annualized | | $ | 1,113,394 | |
| | | | | |
| Net Indebtedness Divided by Adjusted EBITDAre, normalized and annualized | | | 5.5 | |
(1) | Based on the amount for the most recent quarter, multiplied by four. |
(2) | Adjustments made for properties in lease-up, acquired, or disposed of during the most recent quarter and other partial quarter activity, multiplied by four. |
Net Operating Income ("NOI") and Same-Property NOI Reconciliations
Net Operating Income ("NOI") and same-property NOI are considered by management to be important supplemental performance measures to earnings from operations included in the Company’s consolidated statements of income. The presentation of same-property NOI assists with the presentation of the Company’s operations prior to the allocation of depreciation and any corporate-level or financing-related costs. NOI reflects the operating performance of a community and allows for an easy comparison of the operating performance of individual communities or groups of communities. In addition, because prospective buyers of real estate have different financing and overhead structures, with varying marginal impacts to overhead by acquiring real estate, NOI is considered by many in the real estate industry to be a useful measure for determining the value of a real estate asset or group of assets. The Company defines same-property NOI as same-property revenue less same-property operating expenses, including property taxes. Please see the reconciliation of earnings from operations to NOI and same-property NOI, which in the table below is the NOI for stabilized properties consolidated by the Company for the periods presented (Dollars in thousands):
| | | Three Months Ended September 30,2018 | | | Three Months Ended September 30,2017 | | | Nine Months Ended September 30,2018 | | | Nine Months Ended September 30,2017 | |
| Earnings from operations | | $ | 113,897 | | | $ | 112,669 | | | $ | 340,716 | | | $ | 334,147 | |
| Adjustments: | | | | | | | | | | | | | | | | |
| Corporate-level property management expenses | | | 7,761 | | | | 7,573 | | | | 23,313 | | | | 22,604 | |
| Depreciation and amortization | | | 120,852 | | | | 117,451 | | | | 359,287 | | | | 350,893 | |
| Management and other fees from affiliates | | | (2,307 | ) | | | (2,395 | ) | | | (6,812 | ) | | | (6,927 | ) |
| General and administrative | | | 10,601 | | | | 9,788 | | | | 36,539 | | | | 30,726 | |
| Expensed acquisition and investment related costs | | | 31 | | | | 324 | | | | 156 | | | | 1,154 | |
| NOI | | | 250,835 | | | | 245,410 | | | | 753,199 | | | | 732,597 | |
| Less: Non-same property NOI | | | (18,274 | ) | | | (18,214 | ) | | | (56,611 | ) | | | (56,273 | ) |
| Same-Property NOI | | $ | 232,561 | | | $ | 227,196 | | | $ | 696,588 | | | $ | 676,324 | |
See Company's Form 10-K and Form 10-Qs filed with the SEC for additional information
E S S E X P R O P E R T Y T R U S T, I N C.
Reconciliations of Non-GAAP Financial Measures and Other Terms
Public Bond Covenants
Public Bond Covenants refer to certain covenants set forth in instruments governing the Company's unsecured indebtedness. These instruments require the Company to meet specified financial covenants, including covenants relating to net worth, fixed charge coverage, debt service coverage, the amounts of total indebtedness and secured indebtedness, leverage and certain investment limitations. These covenants may restrict the Company's ability to expand or fully pursue its business strategies. The Company's ability to comply with these covenants may be affected by changes in the Company's operating and financial performance, changes in general business and economic conditions, adverse regulatory developments or other events adversely impacting it. The breach of any of these covenants could result in a default under the Company's indebtedness, which could cause those and other obligations to become due and payable. If any of the Company's indebtedness is accelerated, the Company may not be able to repay it. For risks related to failure to comply with these covenants, see "Item 1A: Risk Factors - Risks Related to Our Indebtedness and Financings" in the Company's annual report on Form 10-K and other reports filed by the Company with the Securities and Exchange Commission ("SEC").
The ratios set forth on page S-6 in the section titled "Public Bond Covenants" are provided only to show the Company's compliance with certain specified covenants that are contained in indentures related to the Company's issuance of Senior Notes, which indentures are filed by the Company with the SEC. See, for example, the Indenture dated March 8, 2018, filed by the Company as Exhibit 4.1 to the Company's Form 8-K, filed on March 8, 2018. These ratios should not be used for any other purpose, including without limitation to evaluate the Company's financial condition or results of operations, nor do they indicate the Company's covenant compliance as of any other date or for any other period. The capitalized terms in the disclosure are defined in the indentures filed by the Company with the SEC and may differ materially from similar terms used by other companies that present information about their covenant compliance.
Secured Debt
Secured Debt means debt of the Company or any of its subsidiaries which is secured by an encumbrance on any property or assets of the Company or any of its subsidiaries. The Company's total amount of Secured Debt is set forth on page S-5.
Unencumbered NOI to Adjusted Total NOI
This ratio is presented on page S-6 in the section titled "Selected Credit Ratios". Unencumbered NOI means the sum of NOI for those real estate assets which are not subject to an encumbrance securing debt. The ratio of Unencumbered NOI to Adjusted Total NOI for the three months ended September 30, 2018, annualized, is calculated by dividing Unencumbered NOI, annualized for the three months ended September 30, 2018 and as further adjusted for pro forma NOI for properties acquired or sold during the recent quarter, by Adjusted Total NOI as annualized. The calculation and reconciliation of NOI is set forth in "Net Operating Income ("NOI") and Same-Property NOI Reconciliation" above. This ratio is presented by the Company because it provides rating agencies and investors an additional means of comparing the Company's ability to service debt obligations to that of other companies. The calculation of this ratio is presented in the table below (Dollars in thousands):
| | | | |
| NOI | | $ | 1,003,340 | |
| Adjustments: | | | | |
Other, net (2) | | | (7,973 | ) |
| Adjusted Total NOI | | | 995,367 | |
| Less: Encumbered NOI | | | (272,317 | ) |
| Unencumbered NOI | | $ | 723,050 | |
| | | | | |
| Encumbered NOI | | $ | 272,317 | |
| Unencumbered NOI | | | 723,050 | |
| Adjusted Total NOI | | $ | 995,367 | |
| | | | | |
| Unencumbered NOI to Adjusted Total NOI | | | 73 | % |
(1) | This table is based on the amounts for the most recent quarter, multiplied by four. |
(2) | Includes intercompany eliminations pertaining to self-insurance and other expenses. |
See Company's Form 10-K and Form 10-Qs filed with the SEC for additional information
S-17.4