Exhibit 99.1

Essex Announces Fourth Quarter and Full-Year 2020 Results and 2021
Guidance
San Mateo, California—February 4, 2021—Essex Property Trust, Inc. (NYSE:ESS) announced today its fourth quarter and full-year 2020 earnings results and related business activities.
Net Income and Funds from Operations (“FFO”) per diluted share for the quarter ended and year ended December 31, 2020 are detailed below.
| | | | | | | | | | | | | |
| | | Three Months Ended December 31, | | | % | | | Year Ended December 31, | | | % | |
| | | 2020 | | | 2019 | | | Change | | | 2020 | | | 2019 | | | Change | |
Per Diluted Share | | | | | | | | | | | | | | | | | | |
| Net Income | | $1.47 | | | $1.95 | | | -24.6% |
| | $8.69 | | | $6.66 | | | 30.5% | |
| Total FFO | | $3.24 | | | $3.54 | | | -8.5% | | | $12.78 | | | $13.73 | | | -6.9% | |
| Core FFO | | $3.02 | | | $3.45 | | | -12.5% | | | $12.82 | | | $13.38 | | | -4.2% | |
| | | | | | | | | | | | | | | | | | | |
Fourth Quarter and Full-Year Highlights:
| • | Reported Net Income per diluted share for the fourth quarter of 2020 of $1.47, compared to $1.95 in the fourth quarter of 2019 and $1.13 in the third quarter of 2020. For the full-year, the Company reported Net Income per diluted share of $8.69. |
| • | Core FFO per diluted share declined by 12.5% compared to the fourth quarter of 2019 and 4.2% for the full-year 2020. |
| • | Core FFO per diluted share declined by $0.13 as compared to the third quarter of 2020. The impact of straight-line rent concessions accounted for $0.16 of the decline. |
| • | Same-property gross revenue and net operating income (“NOI”) declined by 8.0% and 12.7%, respectively, compared to the fourth quarter of 2019. For the full-year, same-property gross revenue and NOI declined by 3.9% and 6.8%, respectively. |
| • | On a sequential basis, same-property gross revenue and NOI improved by 0.3% and 1.0%, respectively, compared to the third quarter of 2020. |
| • | Disposed of one community during the fourth quarter for a total contract price of $60.0 million. For the full-year, the Company disposed of four apartment communities for a total contract price of $343.5 million. |
| • | Committed $206.0 million in structured finance investments in the fourth quarter of 2020. For the full-year, the Company committed $352.1 million in structured finance investments, partially financed with $175.2 million in redemptions for the year. |
| • | Repurchased 211,681 shares of common stock in the fourth quarter, totaling $46.3 million at an average price per share of $218.84 under the stock buyback program. For the full-year, the Company repurchased 1,197,190 shares of common stock totaling $269.3 million at an average price per share of $224.96. |
1100 Park Place Suite 200 San Mateo California 94403 telephone 650 655 7800 facsimile 650 655 7810
www.essex.com
“As expected, our fourth quarter and full-year results reflect the extraordinary challenges arising from the Covid-19 pandemic, including severe lockdowns which resulted in unprecedented job losses and declining effective rents for most of the year. With that backdrop, our fourth quarter results provided signs of stabilization, with a partial recovery of lost jobs and modestly improved same-property revenues on a sequential basis. Given difficult comparisons to one year ago, we expect year-over-year results to remain challenged through the second quarter of 2021, followed by a steady economic recovery and resurgence in rental demand assuming a widespread distribution of vaccines. The Company’s strong balance sheet, well-covered dividend, and technology platform position Essex to emerge from the pandemic an even stronger company,” commented Michael J. Schall, President and CEO of the Company.
Same-property operating results exclude any properties that are not comparable for the periods presented. The table below illustrates the percentage change in same-property gross revenues for the quarter ended December 31, 2020 compared to the quarter ended December 31, 2019, and the sequential percentage change for the quarter ended December 31, 2020 compared to the quarter ended September 30, 2020, by submarket for the Company:
| | | Q4 2020 vs. Q4 2019 | | | Q4 2020 vs. Q3 2020 | | | % of Total | |
| | | Gross
Revenues | | | Gross
Revenues | | | Q4 2020 Revenues | |
| Southern California | | | |
| Los Angeles County | | -13.0% | | | 2.4% |
| | 18.1% | |
| Orange County | | -3.5% | | | 1.3% |
| | 11.4% | |
| San Diego County | | -1.4% | | | 2.4% |
| | 8.9% | |
| Ventura County | | -1.3% | | | 1.2% | | | 4.3% | |
| Total Southern California | | -7.2% | | | 2.0% |
| | 42.7% | |
| Northern California | | | |
| Santa Clara County | | -10.0% | | | -1.5% | | | 18.7% | |
| Alameda County | | -11.5% | | | 0.5% |
| | 6.8% | |
| San Mateo County | | -12.0% | | | -0.2% | | | 4.9% | |
| Contra Costa County | | -4.2% | | | 1.6% |
| | 5.1% | |
| San Francisco | | -17.3% | | | -0.7% | | | 3.0% | |
| Total Northern California | | -10.4% | | | -0.5% | | | 38.5% | |
| Seattle Metro | | -4.9% | | | -1.7% | | | 18.8% | |
| Same-Property Portfolio | | -8.0% | | | 0.3% | | | 100.0% | |
The table below illustrates the components that drove the change in Same-Property Revenues on a year-over-year basis for the fourth quarter and full-year 2020.
| | | Q4 2020 vs. Q4 2019 | | | YTD 2020 vs. YTD 2019 | |
| Same-Property Revenue Components | | $ Amount (in Millions) | | | % Contribution | | | $ Amount (in Millions) | | | % Contribution | |
| Prior-Period Same-Property Revenues | | $ | 340.7 | | | | | | $ | 1,338.7 | | | | |
| Scheduled Rents | | | -6.3 | | | -1.9% | | | | 9.0 | | | 0.7% | |
| Delinquencies | | | -7.9 | | | -2.3% | | | | -23.5 | | | -1.8% | |
| Cash Concessions | | | -11.8 | | | -3.5% | | | | -31.8 | | | -2.4% |
|
| Vacancy | | | -1.6 | | | -0.5% | | | | -8.1 | | | -0.6% | |
| Other Income | | | 0.2 | | | 0.1% | | | | 2.4 | | | 0.2% | |
| 2020 Same-Property Revenues/Change | | $ | 313.3 | | | -8.0% | | | $ | 1,286.7 | | | -3.9% | |
| | | Year-Over-Year Change | | | Year-Over-Year Change | |
| | | Q4 2020 compared to Q4 2019 | | | YTD 2020 compared to YTD 2019 | |
| | | Gross Revenues | | | Operating Expenses | | | NOI | | | Gross Revenues | | | Operating Expenses | | | NOI | |
| Southern California | | -7.2% | | | 3.6% | | | -11.3% | | | -4.4% | | | 2.9% | | | -7.3% | |
| Northern California | | -10.4% | | | 4.2% | | | -15.5% | | | -4.9% | | | 3.2% | | | -7.7% | |
| Seattle Metro | | -4.9% | | | 7.8% | | | -9.9% | | | -0.6% | | | 7.8% | | | -4.0% | |
| Same-Property Portfolio | | -8.0% | | | 4.6% | | | -12.7% | | | -3.9% | | | 3.9% | | | -6.8% | |
| | | Sequential Change | |
| | | Q4 2020 compared to Q3 2020 | |
| | | Gross Revenues | | | Operating Expenses | | | NOI | |
| Southern California | | 2.0% | | | -2.3% | | | 4.0% | |
| Northern California | | -0.5% | | | 0.2% | | | -0.8% | |
| Seattle Metro | | -1.7% | | | -1.3% | | | -1.9% | |
| Same-Property Portfolio | | 0.3% | | | -1.2% | | | 1.0% | |
| | | Financial Occupancies | |
| | | Quarter Ended | |
| | | 12/31/2020 | | | 9/30/2020 | | | 12/31/2019 | |
| Southern California | | 96.8% | | | 95.9% | | | 97.0% | |
| Northern California | | 96.5% | | | 96.2% | | | 97.2% | |
| Seattle Metro | | 95.8% | | | 95.9% | | | 97.1% | |
| Same-Property Portfolio | | 96.5% | | | 96.0% | | | 97.1% | |
Investment Activity
Dispositions
In October 2020, the Company sold a community located in Glendale, CA containing 115 apartment homes, for a total contract price of $60.0 million. The Company recognized a $25.7 million gain on sale in the quarter, which has been excluded from Core FFO.
Other Investments
In the fourth quarter of 2020, the Company originated six structured finance investments totaling $206.0 million. The investments have a weighted average return of 10.1% with most of the proceeds expected to be funded by early 2021.
In the fourth quarter of 2020, the Company received cash proceeds of $84.0 million from the full redemption of two structured finance investments and the maturity of an investment in a mortgage backed security.
Development Activity
The table below represents the development communities in lease-up and the current leasing status as of February 1, 2021.
| Project Name | Location | | Total Apartment Homes | | ESS Ownership | | % Leased as of 02/01/21 | Status |
| 500 Folsom | San Francisco, CA | | 537 | | 50% | | 91.8% | In Lease-Up |
| Mylo | Santa Clara, CA | | 476 | | 100% | | 72.9% | In Lease-Up |
| Patina at Midtown | San Jose, CA | | 269 | | 50% | | 50.9% | In Lease-Up |
| Total/Average % Leased | | 1,282 | | | | 76.2% | |
Liquidity and Balance Sheet
Common Stock
In the fourth quarter of 2020, the Company repurchased 211,681 shares of its common stock totaling $46.3 million, including commissions, at an average price of $218.84 per share. For the full-year ending December 31, 2020, the Company repurchased 1,197,190 shares of its common stock totaling $269.3 million, including commissions, at an average price of $224.96 per share.
In December 2020, the Board of Directors approved the replenishment of the stock repurchase plan such that the Company had $250.0 million of purchase authority remaining under the stock repurchase plan. As of February 1, 2021, the Company had $214.4 million of purchase authority remaining under the stock repurchase plan.
The Company did not issue any shares of common stock through its equity distribution program in the fourth quarter or full-year 2020.
Balance Sheet
In the fourth quarter of 2020, the Company repaid $328.2 million of secured and unsecured debt due to mature in 2021 with a weighted average effective rate of 4.2%.
Subsequent to quarter end, the Company repaid $100.0 million of unsecured debt due to mature in 2021 at an effective rate of 4.3%.
As of February 1, 2021, the Company has approximately $1.2 billion in liquidity via undrawn capacity on its unsecured credit facilities and cash and marketable securities.
2021 Full-Year Guidance and Key Assumptions
Per Diluted Share | | Range | | Midpoint | |
| Net Income | | $3.30 - $3.90 | | $3.60 | |
| Total FFO | | $11.86 - $12.46 | | $12.16 | |
| Core FFO | | $11.86 - $12.46 | | $12.16 | |
| Estimated Same-Property Portfolio Change based on 47,090 Apartment Homes | | | |
| Gross Revenue | | -3.50% to -1.50% | | -2.5% |
|
| Operating Expense | | 2.00% to 3.00% | | 2.5% |
|
| Net Operating Income | | -6.25% to -3.00% | | -4.6% |
|
2021 Core FFO Per Diluted Share Guidance Range versus Full-Year 2020
The table below provides a summary of income statement changes between the Company’s 2020 Core FFO per diluted share and its 2021 Core FFO per diluted share guidance range.
| 2021 Core FFO Per Diluted Share Guidance versus 2020 | | Low-End | | | High-End | |
| 2020 Core FFO Per Diluted Share | | $ | 12.82 | | | $ | 12.82 | |
| NOI from Consolidated Communities, Excluding Straight-Line Concessions | | | (0.99 | ) | | | (0.44 | ) |
| Change in Straight-Line Concessions from Consolidated Communities | | | (0.41 | ) | | | (0.56 | ) |
| Net Interest Expense | | | 0.18 | | | | 0.26 | |
| Interest and Other Income | | | 0.10 | | | | 0.12 | |
| FFO from Co-Investments | | | 0.09 | | | | 0.17 | |
| G&A and Other | | | (0.01 | ) | | | 0.01 | |
| Impact from Weighted Average Shares Outstanding | | | 0.08 | | | | 0.08 | |
| 2021 Core FFO Per Diluted Share Guidance | | $ | 11.86 | | | $ | 12.46 | |
Other Key Assumptions
| • | The impact of recording lease concessions on a straight-line basis is expected to be a reduction to 2021 Core FFO by ($6.0 million) to ($16.0 million), as compared to $21.9 million recorded in 2020. As such, this non-cash item will negatively impact year-over-year Core FFO per diluted share by ($0.41) to ($0.56). |
| • | Acquisitions and dispositions of $300 - $500 million, subject to market conditions and cost of capital. |
| • | Preferred equity commitments of $100 - $150 million, to be funded by redemptions. |
| • | Total development spending in 2021 for existing projects under construction is expected to be approximately $60 million at the Company’s pro rata share. The Company does not currently plan to start any new developments during 2021. |
| • | Revenue generating capital expenditures are expected to be approximately $25 million at the Company’s pro rata share. |
For additional details regarding the Company’s 2021 FFO guidance range, please see page S-14 of the supplemental financial information. For the first quarter of 2021, the Company has established a guidance range of Core FFO per diluted share of $2.96 to $3.10.
Conference Call with Management
The Company will host an earnings conference call with management to discuss its quarterly results on Friday, February 5, 2021 at 9 a.m. PT (12 p.m. ET), which will be broadcast live via the Internet at www.essex.com, and accessible via phone by dialing toll-free, (877) 407-0784, or toll/international, (201) 689-8560. No passcode is necessary.
A rebroadcast of the call will be available online for 30 days and digitally for 7 days. To access the replay online, go to www.essex.com and select the fourth quarter 2020 earnings link. To access the replay digitally, dial (844) 512-2921 using the replay pin number 13714536. If you are unable to access the information via the Company’s website, please contact the Investor Relations Department at investors@essex.com or by calling (650) 655-7800.
Corporate Profile
Essex Property Trust, Inc., an S&P 500 company, is a fully integrated real estate investment trust (REIT) that acquires, develops, redevelops, and manages multifamily residential properties in selected West Coast markets. Essex currently has ownership interests in 246 apartment communities comprising approximately 60,000 apartment homes with an additional 6 properties in various stages of active development. Additional information about the Company can be found on the Company’s website at www.essex.com.
This press release and accompanying supplemental financial information has been furnished to the Securities and Exchange Commission electronically on Form 8-K and can be accessed from the Company’s website at www.essex.com. If you are unable to obtain the information via the Web, please contact the Investor Relations Department at investors@essex.com or by calling (650) 655-7800.
FFO RECONCILIATION
FFO, as defined by the National Association of Real Estate Investment Trusts (“NAREIT”), is generally considered by industry analysts as an appropriate measure of performance of an equity REIT. Generally, FFO adjusts the net income of equity REITs for non-cash charges such as depreciation and amortization of rental properties, impairment charges, gains on sales of real estate and extraordinary items. Management considers FFO and FFO which excludes non-core items, which is referred to as “Core FFO,” to be useful supplemental operating performance measures of an equity REIT because, together with net income and cash flows, FFO and Core FFO provide investors with additional bases to evaluate the operating performance and ability of a REIT to incur and service debt and to fund acquisitions and other capital expenditures and to pay dividends. By excluding gains or losses related to sales of depreciated operating properties and excluding real estate depreciation (which can vary among owners of identical assets in similar condition based on historical cost accounting and useful life estimates), FFO can help investors compare the operating performance of a real estate company between periods or as compared to different companies. By further adjusting for items that are not considered part of the Company’s core business operations, Core FFO allows investors to compare the core operating performance of the Company to its performance in prior reporting periods and to the operating performance of other real estate companies without the effect of items that by their nature are not comparable from period to period and tend to obscure the Company’s actual operating results. FFO and Core FFO do not represent net income or cash flows from operations as defined by U.S. generally accepted accounting principles (“GAAP”) and are not intended to indicate whether cash flows will be sufficient to fund cash needs. These measures should not be considered as alternatives to net income as an indicator of the REIT's operating performance or to cash flows as a measure of liquidity. FFO and Core FFO do not measure whether cash flow is sufficient to fund all cash needs including principal amortization, capital improvements and distributions to stockholders. FFO and Core FFO also do not represent cash flows generated from operating, investing or financing activities as defined under GAAP. Management has consistently applied the NAREIT definition of FFO to all periods presented. However, there is judgment involved and other REITs’ calculation of FFO may vary from the NAREIT definition for this measure, and thus their disclosures of FFO may not be comparable to the Company’s calculation.
The following table sets forth the Company’s calculation of diluted FFO and Core FFO for the three months and years ended December 31, 2020 and 2019 (dollars in thousands, except for share and per share amounts):
| | | Three Months Ended December 31, | | | Year Ended December 31, | |
| Funds from Operations attributable to common stockholders and unitholders | | 2020 | | | 2019 | | | 2020 | | | 2019 | |
| Net income available to common stockholders | | $ | 95,745 | | | $ | 128,818 | | �� | $ | 568,870 | | | $ | 439,286 | |
| Adjustments: | | | | | | | | | | | | | | | | |
| Depreciation and amortization | | | 130,127 | | | | 122,908 | | | | 525,497 | | | | 483,750 | |
| Gains not included in FFO | | | (25,716 | ) | | | (47,063 | ) | | | (301,886 | ) | | | (79,468 | ) |
| Impairment loss | | | 1,825 | | | | 7,105 | | | | 1,825 | | | | 7,105 | |
| Impairment loss from unconsolidated co-investments | | | - | | | | 11,484 | | | | - | | | | 11,484 | |
| Depreciation and amortization from unconsolidated co-investments | | | 13,403 | | | | 15,351 | | | | 51,594 | | | | 60,655 | |
| Noncontrolling interest related to Operating Partnership units | | | 3,369 | | | | 4,480 | | | | 19,912 | | | | 15,343 | |
| Depreciation attributable to third party ownership and other | | | (132 | ) | | | (1,097 | ) | | | (539 | ) | | | (1,805 | ) |
| | | | | | | | | | | | | | | | | |
| Funds from operations attributable to common stockholders and unitholders | | $ | 218,621 | | | $ | 241,986 | | | $ | 865,273 | | | $ | 936,350 | |
| FFO per share – diluted | | $ | 3.24 | | | $ | 3.54 | | | $ | 12.78 | | | $ | 13.73 | |
| Expensed acquisition and investment related costs | | $ | 1,487 | | | $ | 99 | | | $ | 1,591 | | | $ | 168 | |
Deferred tax (income) expense on unrealized gain on unconsolidated co-investment (1) | | | (105 | ) | | | - | | | | 1,531 | | | | 1,457 | |
| Gain on sale of marketable securities | | | (2,007 | ) | | | (534 | ) | | | (2,131 | ) | | | (1,271 | ) |
| Unrealized gains on marketable securities | | | (10,300 | ) | | | (1,430 | ) | | | (12,515 | ) | | | (5,710 | ) |
| Provision for credit losses | | | 587 | | | | - | | | | 687 | | | | - | |
Equity (income) loss from non-core co-investment (2) | | | (916 | ) | | | 418 | | | | (5,289 | ) | | | (4,143 | ) |
Interest rate hedge ineffectiveness (3) | | | - | | | | - | | | | - | | | | 181 | |
| (Gain) loss on early retirement of debt, net | | | (937 | ) | | | 3,426 | | | | 22,883 | | | | (3,717 | ) |
| Gain on early retirement of debt from unconsolidated co-investment | | | - | | | | - | | | | (38 | ) | | | - | |
| Co-investment promote income | | | - | | | | - | | | | (6,455 | ) | | | (809 | ) |
| Income from early redemption of preferred equity investments | | | - | | | | (1,031 | ) | | | (210 | ) | | | (3,562 | ) |
| Accelerated interest income from maturity of investment in mortgage backed security | | | (11,753 | ) | | | (7,032 | ) | | | (11,753 | ) | | | (7,032 | ) |
| General and administrative and other, net | | | 9,316 | | | | 1,181 | | | | 14,958 | | | | 1,181 | |
| Insurance reimbursements, legal settlements, and other, net | | | (150 | ) | | | (595 | ) | | | (81 | ) | | | (858 | ) |
| Core Funds from operations attributable to common stockholders and unitholders | | $ | 203,843 | | | $ | 236,488 | | | $ | 868,451 | | | $ | 912,235 | |
| Core FFO per share – diluted | | $ | 3.02 | | | $ | 3.45 | | | $ | 12.82 | | | $ | 13.38 | |
Weighted average number of shares outstanding diluted (4) | | | 67,398,487 | | | | 68,449,008 | | | | 67,725,692 | | | | 68,198,785 | |
| (1) | A deferred tax expense was recorded during the second quarter of 2020 related to the $4.7 million net unrealized gain on the Real Estate Technology Ventures, L.P. co-investment. |
| (2) | Represents the Company’s share of co-investment income from Real Estate Technology Ventures, L.P. |
| (3) | On January 1, 2019, the Company adopted ASU No. 2017-12 "Derivatives and Hedging - Targeted Improvements to Accounting for Hedging Activities," which resulted in a cumulative effect adjustment of approximately $181,000 from interest expense to accumulated other comprehensive income. As a result of the adoption of this standard, the Company recognizes qualifying hedge ineffectiveness through accumulated other comprehensive income as opposed to current earnings. |
| (4) | Assumes conversion of all outstanding limited partnership units in Essex Portfolio, L.P. (the “Operating Partnership”) into shares of the Company’s common stock and excludes all DownREIT limited partnership units for which the Operating Partnership has the ability and intention to redeem the units for cash and does not consider them to be common stock equivalents. |
Net Operating Income (“NOI”) and Same-Property NOI Reconciliations
NOI and Same-Property NOI are considered by management to be important supplemental performance measures to earnings from operations included in the Company’s consolidated statements of income. The presentation of same-property NOI assists with the presentation of the Company’s operations prior to the allocation of depreciation and any corporate-level or financing-related costs. NOI reflects the operating performance of a community and allows for an easy comparison of the operating performance of individual communities or groups of communities. In addition, because prospective buyers of real estate have different financing and overhead structures, with varying marginal impacts to overhead by acquiring real estate, NOI is considered by many in the real estate industry to be a useful measure for determining the value of a real estate asset or group of assets. The Company defines same-property NOI as same-property revenues less same-property operating expenses, including property taxes. Please see the reconciliation of earnings from operations to NOI and same-property NOI, which in the table below is the NOI for stabilized properties consolidated by the Company for the periods presented (dollars in thousands):
| | | Three Months Ended December 31, | | | Year Ended December 31, | |
| | | 2020 | | | 2019 | | | 2020 | | | 2019 | |
| Earnings from operations | | $ | 111,931 | | | $ | 116,818 | | | $ | 491,441 | | | $ | 481,112 | |
| Adjustments: | | | | | | | | | | | | | | | | |
| Corporate-level property management expenses | | | 8,549 | | | | 8,616 | | | | 34,573 | | | | 34,067 | |
| Depreciation and amortization | | | 130,127 | | | | 122,908 | | | | 525,497 | | | | 483,750 | |
| Management and other fees from affiliates | | | (2,286 | ) | | | (2,504 | ) | | | (9,598 | ) | | | (9,527 | ) |
| General and administrative | | | 23,144 | | | | 15,531 | | | | 65,388 | | | | 54,262 | |
| Expensed acquisition and investment related costs | | | 1,487 | | | | 99 | | | | 1,591 | | | | 168 | |
| Impairment loss | | | 1,825 | | | | 7,105 | | | | 1,825 | | | | 7,105 | |
| (Gain) Loss on sale of real estate and land | | | (25,716 | ) | | | 3,164 | | | | (64,967 | ) | | | 3,164 | |
| NOI | | | 249,061 | | | | 271,737 | | | | 1,045,750 | | | | 1,054,101 | |
| Less: Non-same property NOI | | | (31,988 | ) | | | (22,995 | ) | | | (140,782 | ) | | | (82,644 | ) |
| Same-Property NOI | | $ | 217,073 | | | $ | 248,742 | | | $ | 904,968 | | | $ | 971,457 | |
Safe Harbor Statement Under The Private Litigation Reform Act of 1995:
This press release includes “forward-looking statements” within the meaning of Section 27A of the Securities Act of 1933, as amended, and Section 21E of the Securities Exchange Act of 1934, as amended. Forward-looking statements are statements which are not historical facts, including statements regarding the Company's expectations, estimates, assumptions, hopes, intentions, beliefs and strategies regarding the future. Words such as “expects,” “assumes,” “anticipates,” “may,” “will,” “intends,” “plans,” “projects,” “believes,” “seeks,” “future,” “estimates,” and variations of such words and similar expressions are intended to identify such forward-looking statements. Such forward-looking statements include, among other things, statements regarding the Company’s expectations related to the continued impact of the COVID-19 pandemic on the Company’s business, financial condition and results of operations and the impact of any additional measures taken to mitigate the impact of the pandemic, the Company’s intent, beliefs or expectations with respect to the timing of completion of current development and redevelopment projects and the stabilization of such projects, the timing of lease-up and occupancy of its apartment communities, the anticipated operating performance of its apartment communities, the total projected costs of development and redevelopment projects, co-investment activities, qualification as a REIT under the Internal Revenue Code of 1986, as amended, the real estate markets in the geographies in which the Company’s properties are located and in the
United States in general, the adequacy of future cash flows to meet anticipated cash needs, its financing activities and the use of proceeds from such activities, the availability of debt and equity financing, general economic conditions including the potential impacts from such economic conditions, including as a result of the COVID-19 pandemic and governmental measures intended to prevent its spread, trends affecting the Company’s financial condition or results of operations, changes to U.S. tax laws and regulations in general or specifically related to REITs or real estate, changes to laws and regulations in jurisdictions in which communities the Company owns are located, and other information that is not historical information.
While the Company's management believes the assumptions underlying its forward-looking statements are reasonable, such forward-looking statements involve known and unknown risks, uncertainties and other factors, many of which are beyond the Company’s control, which could cause the actual results, performance or achievements of the Company to be materially different from any future results, performance or achievements expressed or implied by such forward-looking statements. The Company cannot assure the future results or outcome of the matters described in these statements; rather, these statements merely reflect the Company’s current expectations of the approximate outcomes of the matters discussed. Factors that might cause the Company’s actual results, performance or achievements to differ materially from those expressed or implied by these forward-looking statements include, but are not limited to, the following: the continued impact of the COVID-19 pandemic, which remains inherently uncertain as to duration and severity, and any additional governmental measures taken to limit its spread and other potential future outbreaks of infectious diseases or other health concerns, could continue to adversely affect the Company’s business and its tenants, and cause a significant downturn in general economic conditions, the real estate industry, and the markets in which the Company's communities are located; the Company may fail to achieve its business objectives; the actual completion of development and redevelopment projects may be subject to delays; the stabilization dates of such projects may be delayed; the Company may abandon or defer development or redevelopment projects for a number of reasons, including changes in local market conditions which make development less desirable, increases in costs of development, increases in the cost of capital or lack of capital availability, resulting in losses; the total projected costs of current development and redevelopment projects may exceed expectations; such development and redevelopment projects may not be completed; development and redevelopment projects and acquisitions may fail to meet expectations; estimates of future income from an acquired property may prove to be inaccurate; occupancy rates and rental demand may be adversely affected by competition and local economic and market conditions; there may be increased interest rates and operating costs; the Company may be unsuccessful in the management of its relationships with its co-investment partners; future cash flows may be inadequate to meet operating requirements and/or may be insufficient to provide for dividend payments in accordance with REIT requirements; changes in laws or regulations; the terms of any refinancing may not be as favorable as the terms of existing indebtedness; unexpected difficulties in leasing of development projects; volatility in financial and securities market; the Company’s failure to successfully operate acquired properties; unforeseen consequences from cyber-intrusion; the Company’s inability to maintain our investment grade credit rating with the rating agencies; government approvals, actions and initiatives, including the need for compliance with environmental requirements; and those further risks, special considerations, and other factors referred to in the Company’s annual report on Form 10-K, quarterly reports on Form 10-Q, and other reports that the Company files with the SEC from time to time. Additionally, the risks, uncertainties and other factors set forth above or otherwise referred to in the reports that the Company has filed with the SEC may be further amplified by the global impact of the COVID-19 pandemic. All forward-looking statements are made as of the date hereof, the Company assumes no obligation to update or supplement this information for any reason, and therefore, they may not represent the Company’s estimates and assumptions after the date of this press release.
Definitions and Reconciliations
Non-GAAP financial measures and certain other capitalized terms, as used in this earnings release, are defined and further explained on pages S-18.1 through S-18.4, "Reconciliations of Non-GAAP Financial Measures and Other Terms," of the accompanying supplemental financial information. The supplemental financial information is available on the Company's website at www.essex.com.
Contact Information
Rylan Burns
Vice President of Finance & Investor Relations
(650) 655-7800
rburns@essex.com
Q4 2020 Supplemental
Table of Contents
| | Page(s) |
Consolidated Operating Results
| S-1 – S-2 |
| | |
| Consolidated Funds From Operations | S-3 |
| | |
| Consolidated Balance Sheets | S-4 |
| | |
| Debt Summary – December 31, 2020 | S-5 |
| | |
| Capitalization Data, Public Bond Covenants, Credit Ratings, and Selected Credit Ratios – December 31, 2020 | S-6 |
| | |
| Portfolio Summary by County – December 31, 2020 | S-7 |
| | |
| Operating Income by Quarter – December 31, 2020 | S-8 |
| | |
| Same-Property Revenue Results by County – Quarters ended December 31, 2020 and 2019, and September 30, 2020 | S-9 |
| | |
| Same-Property Revenue Results by County – Years ended December 31, 2020 and 2019 | S-9.1 |
| | |
| Same-Property Operating Expenses – Quarter and Years ended as of December 31, 2020 and 2019 | S-10 |
| | |
| Development Pipeline – December 31, 2020 | S-11 |
| | |
| Redevelopment Pipeline – December 31, 2020 | S-12 |
| | |
| Capital Expenditures – December 31, 2020 | S-12.1 |
| | |
| Co-investments and Preferred Equity Investments – December 31, 2020 | S-13 |
| | |
| Assumptions for 2021 FFO Guidance Range | S-14 |
| | |
| Reconciliation of Projected EPS, FFO and Core FFO per diluted share | S-14.1 |
| | |
| Summary of Apartment Community Acquisitions and Dispositions Activity | S-15 |
| | |
| Delinquencies, Operating Statistics, and Same-Property Revenue Growth with Concessions on a GAAP basis | S-16 |
| | |
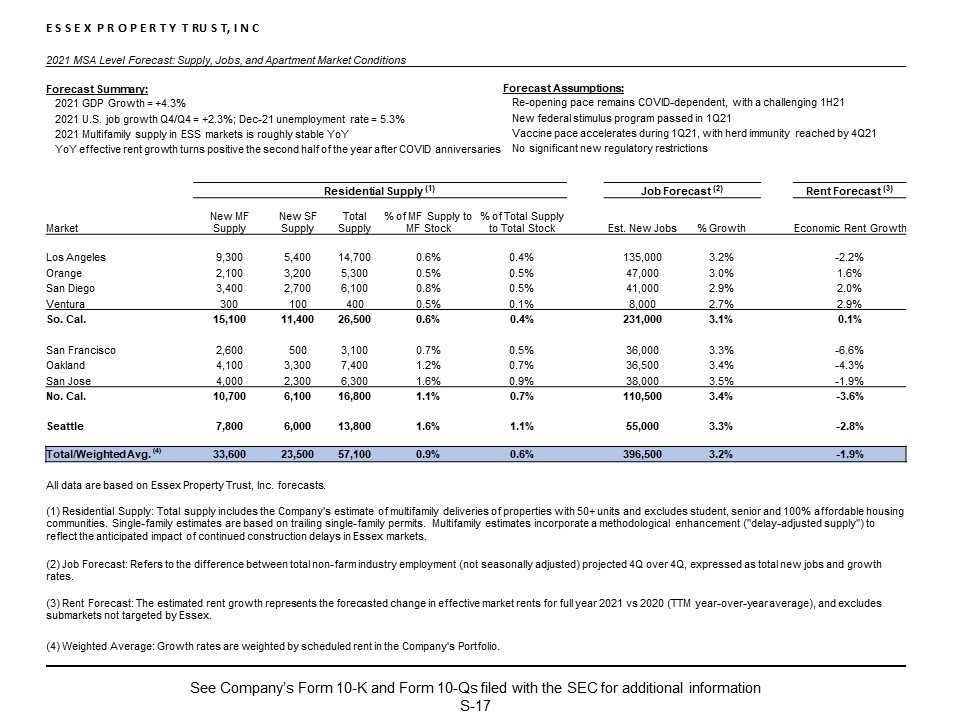
| 2021 MSA Level Forecast: Supply, Jobs, and Apartment Market Conditions | S-17 |
| | |
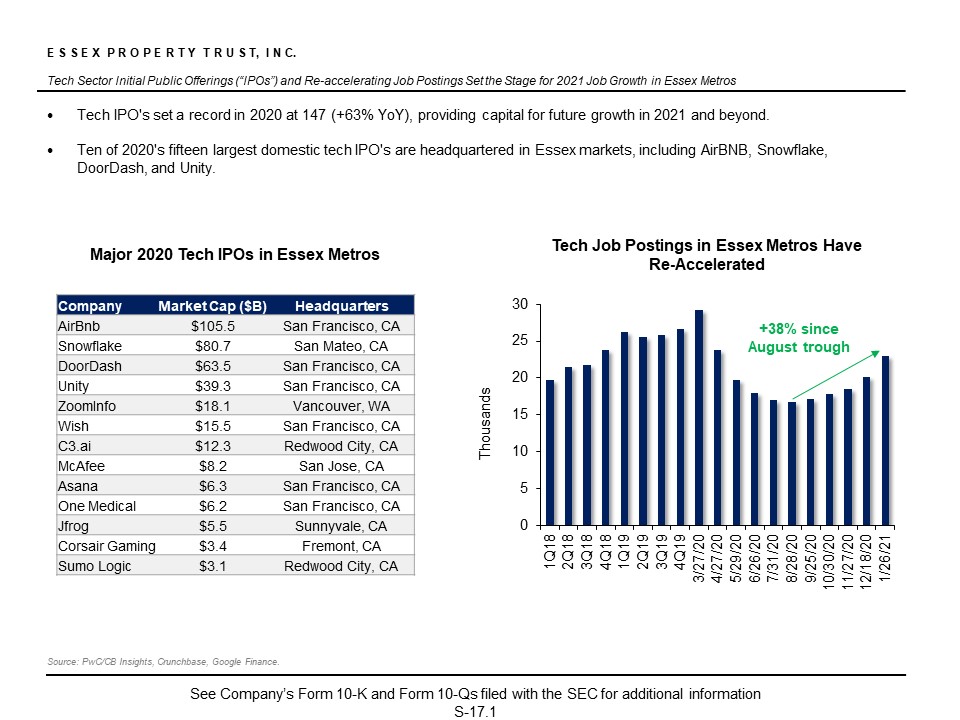
| Tech Sector Initial Public Offerings ("IPOs") and Re-accelerating Job Postings Set the Stage for 2021 Job Growth in Essex Metros | S-17.1 |
| | |
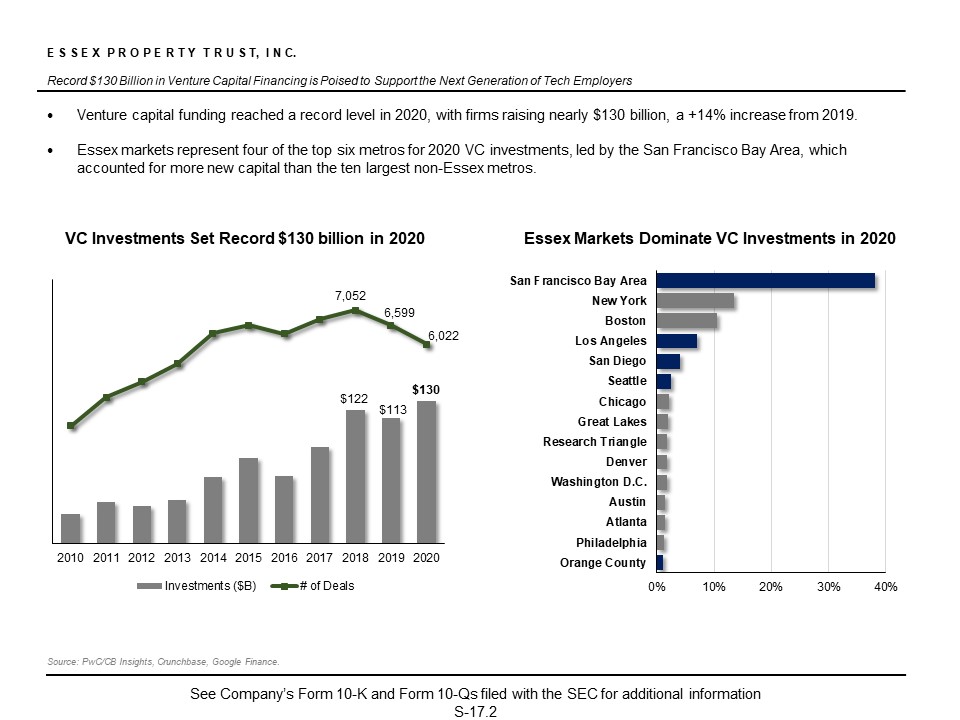
| Record $130 Billion in Venture Capital Financing is Poised to Support the Next Generation of Tech Employers | S-17.2 |
| | |
| Reconciliations of Non-GAAP Financial Measures and Other Terms | S-18.1 – S-18.4 |
E S S E X P R O P E R T Y T R U S T, I N C.
| Consolidated Operating Results | | Three Months Ended | | | Twelve Months Ended | |
| (Dollars in thousands, except share and per share amounts) | | December 31, | | | December 31, | |
| | | 2020 | | | 2019 | | | 2020 | | | 2019 | |
| | | | | | | | | | | | | |
| Revenues: | | | | | | | | | | | | |
| Rental and other property | | $ | 359,787 | | | $ | 372,861 | | | $ | 1,486,150 | | | $ | 1,450,628 | |
| Management and other fees from affiliates | | | 2,286 | | | | 2,504 | | | | 9,598 | | | | 9,527 | |
| | | | 362,073 | | | | 375,365 | | | | 1,495,748 | | | | 1,460,155 | |
| | | | | | | | | | | | | | | | | |
| Expenses: | | | | | | | | | | | | | | | | |
| Property operating | | | 110,726 | | | | 101,124 | | | | 440,400 | | | | 396,527 | |
| Corporate-level property management expenses | | | 8,549 | | | | 8,616 | | | | 34,573 | | | | 34,067 | |
| Depreciation and amortization | | | 130,127 | | | | 122,908 | | | | 525,497 | | | | 483,750 | |
| General and administrative | | | 23,144 | | | | 15,531 | | | | 65,388 | | | | 54,262 | |
| Expensed acquisition and investment related costs | | | 1,487 | | | | 99 | | | | 1,591 | | | | 168 | |
| Impairment loss | | | 1,825 | | | | 7,105 | | | | 1,825 | | | | 7,105 | |
| | | | 275,858 | | | | 255,383 | | | | 1,069,274 | | | | 975,879 | |
| Gain (loss) on sale of real estate and land | | | 25,716 | | | | (3,164 | ) | | | 64,967 | | | | (3,164 | ) |
| Earnings from operations | | | 111,931 | | | | 116,818 | | | | 491,441 | | | | 481,112 | |
Interest expense, net (1) | | | (52,625 | ) | | | (52,416 | ) | | | (209,900 | ) | | | (208,893 | ) |
| Interest and other income | | | 28,303 | | | | 17,005 | | | | 40,999 | | | | 46,298 | |
| Equity income from co-investments | | | 12,998 | | | | 57,201 | | | | 66,512 | | | | 112,136 | |
| Deferred tax income (expense) on unrealized gain on unconsolidated co-investment | | | 105 | | | | - | | | | (1,531 | ) | | | (1,457 | ) |
| Gain (loss) on early retirement of debt, net | | | 937 | | | | (3,426 | ) | | | (22,883 | ) | | | 3,717 | |
| Gain on remeasurement of co-investment | | | - | | | | - | | | | 234,694 | | | | 31,535 | |
| Net income | | | 101,649 | | | | 135,182 | | | | 599,332 | | | | 464,448 | |
| Net income attributable to noncontrolling interest | | | (5,904 | ) | | | (6,364 | ) | | | (30,462 | ) | | | (25,162 | ) |
| Net income available to common stockholders | | $ | 95,745 | | | $ | 128,818 | | | $ | 568,870 | | | $ | 439,286 | |
| | | | | | | | | | | | | | | | | |
| Net income per share - basic | | $ | 1.47 | | | $ | 1.95 | | | $ | 8.69 | | | $ | 6.67 | |
| | | | | | | | | | | | | | | | | |
| Shares used in income per share - basic | | | 65,133,112 | | | | 66,085,254 | | | | 65,454,057 | | | | 65,840,422 | |
| | | | | | | | | | | | | | | | | |
| Net income per share - diluted | | $ | 1.47 | | | $ | 1.95 | | | $ | 8.69 | | | $ | 6.66 | |
| | | | | | | | | | | | | | | | | |
| Shares used in income per share - diluted | | | 65,145,117 | | | | 66,191,395 | | | | 65,564,982 | | | | 65,939,455 | |
(1) Refer to page S-18.2, the section titled "Interest Expense, Net" for additional information.
See Company’s Form 10-K and Form 10-Qs filed with the SEC for additional information
E S S E X P R O P E R T Y T R U S T, I N C.
| Consolidated Operating Results | | Three Months Ended | | | Twelve Months Ended | |
| Selected Line Item Detail | | December 31, | | | December 31, | |
| (Dollars in thousands) | | 2020 | | | 2019 | | | 2020 | | | 2019 | |
| | | | | | | | | | | | | |
| Rental and other property | | | | | | | | | | | | |
| Rental income | | $ | 353,503 | | | $ | 366,612 | | | $ | 1,462,161 | | | $ | 1,425,585 | |
| Other property | | | 6,284 | | | | 6,249 | | | | 23,989 | | | | 25,043 | |
| Rental and other property | | $ | 359,787 | | | $ | 372,861 | | | $ | 1,486,150 | | | $ | 1,450,628 | |
| | | | | | | | | | | | | | | | | |
| Property operating expenses | | | | | | | | | | | | | | | | |
| Real estate taxes | | $ | 44,647 | | | $ | 40,177 | | | $ | 177,011 | | | $ | 155,170 | |
| Administrative | | | 21,799 | | | | 21,752 | | | | 89,290 | | | | 84,638 | |
| Maintenance and repairs | | | 22,575 | | | | 19,412 | | | | 91,566 | | | | 81,342 | |
| Utilities | | | 21,705 | | | | 19,783 | | | | 82,533 | | | | 75,377 | |
| Property operating expenses | | $ | 110,726 | | | $ | 101,124 | | | $ | 440,400 | | | $ | 396,527 | |
| | | | | | | | | | | | | | | | | |
| Interest and other income | | | | | | | | | | | | | | | | |
| Marketable securities and other income | | $ | 4,680 | | | $ | 7,957 | | | $ | 15,206 | | | $ | 31,970 | |
| Gain on sale of marketable securities | | | 2,007 | | | | 534 | | | | 2,131 | | | | 1,271 | |
| Provision for credit losses | | | (587 | ) | | | - | | | | (687 | ) | | | - | |
| Unrealized gains on marketable securities | | | 10,300 | | | | 1,430 | | | | 12,515 | | | | 5,710 | |
| Accelerated interest income from maturity of investment in mortgage backed security | | | 11,753 | | | | 7,032 | | | | 11,753 | | | | 7,032 | |
| Insurance reimbursements, legal settlements, and other, net | | | 150 | | | | 52 | | | | 81 | | | | 315 | |
| Interest and other income | | $ | 28,303 | | | $ | 17,005 | | | $ | 40,999 | | | $ | 46,298 | |
| | | | | | | | | | | | | | | | | |
| Equity income from co-investments | | | | | | | | | | | | | | | | |
| Equity (loss) income from co-investments | | $ | (362 | ) | | $ | 5,911 | | | $ | 3,938 | | | $ | 20,442 | |
| Income from preferred equity investments | | | 12,444 | | | | 11,391 | | | | 48,357 | | | | 43,024 | |
| Equity income (loss) from non-core co-investment | | | 916 | | | | (418 | ) | | | 5,289 | | | | 4,143 | |
| Impairment loss from unconsolidated co-investment | | | - | | | | (11,484 | ) | | | - | | | | (11,484 | ) |
| Legal settlement from unconsolidated co-investment | | | - | | | | 543 | | | | - | | | | 543 | |
| Gain on sale of co-investment communities | | | - | | | | 50,227 | | | | 2,225 | | | | 51,097 | |
| Gain on early retirement of debt from unconsolidated co-investment | | | - | | | | - | | | | 38 | | | | - | |
| Co-investment promote income | | | - | | | | - | | | | 6,455 | | | | 809 | |
| Income from early redemption of preferred equity investments | | | - | | | | 1,031 | | | | 210 | | | | 3,562 | |
| Equity income from co-investments | | $ | 12,998 | | | $ | 57,201 | | | $ | 66,512 | | | $ | 112,136 | |
| | | | | | | | | | | | | | | | | |
| Noncontrolling interest | | | | | | | | | | | | | | | | |
| Limited partners of Essex Portfolio, L.P. | | $ | 3,369 | | | $ | 4,480 | | | $ | 19,912 | | | $ | 15,343 | |
| DownREIT limited partners' distributions | | | 2,114 | | | | 2,016 | | | | 8,507 | | | | 7,241 | |
| Third-party ownership interest | | | 421 | | | | (132 | ) | | | 2,043 | | | | 2,578 | |
| Noncontrolling interest | | $ | 5,904 | | | $ | 6,364 | | | $ | 30,462 | | | $ | 25,162 | |
See Company’s Form 10-K and Form 10-Qs filed with the SEC for additional information
E S S E X P R O P E R T Y T R U S T, I N C.
Consolidated Funds From Operations (1) | | Three Months Ended | | | | | | Twelve Months Ended | | | | |
| (Dollars in thousands, except share and per share amounts and in footnotes) | | December 31, | | | | | | December 31, | | | | |
| | | 2020 | | | 2019 | | | % Change | | | 2020 | | | 2019 | | | % Change | |
| | | | | | | | | | | | | | | | | | | |
| Funds from operations attributable to common stockholders and unitholders (FFO) | | | | | | | | | | | | | | | | | | |
| Net income available to common stockholders | | $ | 95,745 | | | $ | 128,818 | | | | | | $ | 568,870 | | | $ | 439,286 | | | | |
| Adjustments: | | | | | | | | | | | | | | | | | | | | | | |
| Depreciation and amortization | | | 130,127 | | | | 122,908 | | | | | | | 525,497 | | | | 483,750 | | | | |
| Gains not included in FFO | | | (25,716 | ) | | | (47,063 | ) | | | | | | (301,886 | ) | | | (79,468 | ) | | | |
| Impairment loss | | | 1,825 | | | | 7,105 | | | | | | | 1,825 | | | | 7,105 | | | | |
| Impairment loss from unconsolidated co-investments | | | - | | | | 11,484 | | | | | | | - | | | | 11,484 | | | | |
| Depreciation and amortization from unconsolidated co-investments | | | 13,403 | | | | 15,351 | | | | | | | 51,594 | | | | 60,655 | | | | |
| Noncontrolling interest related to Operating Partnership units | | | 3,369 | | | | 4,480 | | | | | | | 19,912 | | | | 15,343 | | | | |
Depreciation attributable to third party ownership and other (2) | | | (132 | ) | | | (1,097 | ) | | | | | | (539 | ) | | | (1,805 | ) | | | |
| Funds from operations attributable to common stockholders and unitholders | | $ | 218,621 | | | $ | 241,986 | | | | | | $ | 865,273 | | | $ | 936,350 | | | | |
| FFO per share-diluted | | $ | 3.24 | | | $ | 3.54 | | | | -8.5 | % | | $ | 12.78 | | | $ | 13.73 | | | | -6.9 | % |
| | | | | | | | | | | | | | | | | | | | | | | | | |
| Components of the change in FFO | | | | | | | | | | | | | | | | | | | | | | | | |
| Non-core items: | | | | | | | | | | | | | | | | | | | | | | | | |
| Expensed acquisition and investment related costs | | $ | 1,487 | | | $ | 99 | | | | | | | $ | 1,591 | | | $ | 168 | | | | | |
Deferred tax (income) expense on unrealized gain on unconsolidated co-investment (3) | | | (105 | ) | | | - | | | | | | | | 1,531 | | | | 1,457 | | | | | |
| Gain on sale of marketable securities | | | (2,007 | ) | | | (534 | ) | | | | | | | (2,131 | ) | | | (1,271 | ) | | | | |
| Unrealized gains on marketable securities | | | (10,300 | ) | | | (1,430 | ) | | | | | | | (12,515 | ) | | | (5,710 | ) | | | | |
| Provision for credit losses | | | 587 | | | | - | | | | | | | | 687 | | | | - | | | | | |
Equity (income) loss from non-core co-investment (4) | | | (916 | ) | | | 418 | | | | | | | | (5,289 | ) | | | (4,143 | ) | | | | |
Interest rate hedge ineffectiveness (5) | | | - | | | | - | | | | | | | | - | | | | 181 | | | | | |
| (Gain) loss on early retirement of debt, net | | | (937 | ) | | | 3,426 | | | | | | | | 22,883 | | | | (3,717 | ) | | | | |
| Gain on early retirement of debt from unconsolidated co-investment | | | - | | | | - | | | | | | | | (38 | ) | | | - | | | | | |
| Co-investment promote income | | | - | | | | - | | | | | | | | (6,455 | ) | | | (809 | ) | | | | |
| Income from early redemption of preferred equity investments | | | - | | | | (1,031 | ) | | | | | | | (210 | ) | | | (3,562 | ) | | | | |
| Accelerated interest income from maturity of investment in mortgage backed security | | | (11,753 | ) | | | (7,032 | ) | | | | | | | (11,753 | ) | | | (7,032 | ) | | | | |
| General and administrative and other, net | | | 9,316 | | | | 1,181 | | | | | | | | 14,958 | | | | 1,181 | | | | | |
| Insurance reimbursements, legal settlements, and other, net | | | (150 | ) | | | (595 | ) | | | | | | | (81 | ) | | | (858 | ) | | | | |
| Core funds from operations attributable to common stockholders and unitholders | | $ | 203,843 | | | $ | 236,488 | | | | | | | $ | 868,451 | | | $ | 912,235 | | | | | |
| Core FFO per share-diluted | | $ | 3.02 | | | $ | 3.45 | | | | -12.5 | % | | $ | 12.82 | | | $ | 13.38 | | | | -4.2 | % |
| | | | | | | | | | | | | | | | | | | | | | | | | |
Weighted average number of shares outstanding diluted (6) | | | 67,398,487 | | | | 68,449,008 | | | | | | | | 67,725,692 | | | | 68,198,785 | | | | | |
| (1) | Refer to page S-18.2, the section titled "Funds from Operations ("FFO") and Core FFO" for additional information on the Company's definition and use of FFO and Core FFO. |
| (2) | The Company consolidates certain co-investments. The noncontrolling interest's share of net operating income in these investments for the three and twelve months ended December 31, 2020 was $0.8 million and $3.9 million, respectively. |
| (3) | Represents deferred tax (income) expense recorded during the year related to net unrealized gains on the Real Estate Technology Ventures, L.P. co-investment. |
| (4) | Represents the Company's share of co-investment income from Real Estate Technology Ventures, L.P. |
| (5) | On January 1, 2019, the Company adopted ASU No. 2017-12 "Derivatives and Hedging - Targeted Improvements to Accounting for Hedging Activities," which resulted in a cumulative effect adjustment of approximately $181,000 from interest expense to accumulated other comprehensive income. As a result of the adoption of this standard, the Company recognizes qualifying hedge ineffectiveness through accumulated other comprehensive income as opposed to current earnings. |
| (6) | Assumes conversion of all outstanding limited partnership units in the Operating Partnership into shares of the Company's common stock and excludes all DownREIT limited partnership units for which the Operating Partnership has the ability and intention to redeem the units for cash and does not consider them to be common stock equivalents. |
See Company’s Form 10-K and Form 10-Qs filed with the SEC for additional information
E S S E X P R O P E R T Y T R U S T, I N C.
| Consolidated Balance Sheets | | | | | | |
| (Dollars in thousands) | | | | | | |
| | December 31, 2020 | | | December 31, 2019 | |
| | | | | | | |
| Real Estate: | | | | | | |
| Land and land improvements | | $ | 2,929,009 | | | $ | 2,773,805 | |
| Buildings and improvements | | | 12,132,736 | | | | 11,264,337 | |
| | | | 15,061,745 | | | | 14,038,142 | |
| Less: accumulated depreciation | | | (4,133,959 | ) | | | (3,689,482 | ) |
| | | | 10,927,786 | | | | 10,348,660 | |
| Real estate under development | | | 386,047 | | | | 546,075 | |
| Co-investments | | | 1,018,010 | | | | 1,335,339 | |
| Real estate held for sale | | | 57,938 | | | | - | |
| | | | 12,389,781 | | | | 12,230,074 | |
| Cash and cash equivalents, including restricted cash | | | 84,041 | | | | 81,094 | |
| Marketable securities | | | 147,768 | | | | 144,193 | |
| Notes and other receivables | | | 195,104 | | | | 134,365 | |
| Operating lease right-of-use assets | | | 72,143 | | | | 74,744 | |
| Prepaid expenses and other assets | | | 47,340 | | | | 40,935 | |
| Total assets | | $ | 12,936,177 | | | $ | 12,705,405 | |
| | | | | | | | | |
| Unsecured debt, net | | $ | 5,607,985 | | | $ | 4,763,206 | |
| Mortgage notes payable, net | | | 643,550 | | | | 990,667 | |
| Lines of credit | | | - | | | | 55,000 | |
| Operating lease liabilities | | | 74,037 | | | | 76,740 | |
| Other liabilities | | | 395,174 | | | | 378,878 | |
| Total liabilities | | | 6,720,746 | | | | 6,264,491 | |
| Redeemable noncontrolling interest | | | 32,239 | | | | 37,410 | |
| Equity: | | | | | | | | |
| Common stock | | | 6 | | | | 7 | |
| Additional paid-in capital | | | 6,876,326 | | | | 7,121,927 | |
| Distributions in excess of accumulated earnings | | | (861,193 | ) | | | (887,619 | ) |
| Accumulated other comprehensive loss, net | | | (14,729 | ) | | | (13,888 | ) |
| Total stockholders' equity | | | 6,000,410 | | | | 6,220,427 | |
| Noncontrolling interest | | | 182,782 | | | | 183,077 | |
| Total equity | | | 6,183,192 | | | | 6,403,504 | |
| Total liabilities and equity | | $ | 12,936,177 | | | $ | 12,705,405 | |
See Company’s Form 10-K and Form 10-Qs filed with the SEC for additional information
E S S E X P R O P E R T Y T R U S T, I N C.
Debt Summary - December 31, 2020
(Dollars in thousands, except in footnotes)
| | | | | | | | | | | | | | | | | | | | | | | | | | | |
| | | | | | | | | | | | Scheduled principal payments, unamortized premiums (discounts) and (debt issuance costs) are as follows - excludes lines of credit: | |
| | | | | | | | | | | | | | | | | | | | | | | | Weighted Average Interest Rate | | | Percentage of Total Debt | |
| | | | | | Weighted Average | | | | | | | | | | | | | |
| | | Balance Outstanding | | | Interest Rate | | | Maturity in Years | | | | | | Unsecured | | | Secured | | | Total | |
| Unsecured Debt, net | | | | | | | | | | | | | | | | | | | | | | | | | | | |
| Bonds private - fixed rate | | $ | 200,000 | | | | 4.4 | % | | | 0.5 | | | | 2021 | | | $ | 200,000 | | | $ | 3,501 | | | $ | 203,501 | | | | 4.3 | % | | | 3.2 | % |
| Bonds public - fixed rate | | | 4,900,000 | | | | 3.4 | % | | | 9.4 | | | | 2022 | | | | 350,000 | | | | 43,188 | | | | 393,188 | | | | 2.0 | % | | | 6.2 | % |
Term loan (1) | | | 550,000 | | | | 1.7 | % | | | 1.5 | | | | 2023 | | | | 800,000 | | | | 2,945 | | | | 802,945 | | | | 3.1 | % | | | 12.8 | % |
| Unamortized net discounts and debt issuance costs | | | (42,015 | ) | | | - | | | | - | | | | 2024 | | | | 400,000 | | | | 3,109 | | | | 403,109 | | | | 4.0 | % | | | 6.4 | % |
| | | | 5,607,985 | | | | 3.3 | % | | | 8.3 | | | | 2025 | | | | 500,000 | | | | 133,054 | | | | 633,054 | | | | 3.5 | % | | | 10.1 | % |
| Mortgage Notes Payable, net | | | | | | | | | | | | | | | 2026 | | | | 450,000 | | | | 99,405 | | | | 549,405 | | | | 3.5 | % | | | 8.7 | % |
| Fixed rate - secured | | | 416,350 | | | | 3.5 | % | | | 5.3 | | | | 2027 | | | | 350,000 | | | | 153,955 | | | | 503,955 | | | | 3.3 | % | | | 8.0 | % |
Variable rate - secured (2) | | | 225,076 | | | | 1.2 | % | | | 17.2 | | | | 2028 | | | | - | | | | 68,332 | | | | 68,332 | | | | 4.1 | % | | | 1.1 | % |
| Unamortized premiums and debt issuance costs, net | | | 2,124 | | | | - | | | | - | | | | 2029 | | | | 500,000 | | | | 1,456 | | | | 501,456 | | | | 4.1 | % | | | 8.0 | % |
| Total mortgage notes payable | | | 643,550 | | | | 2.7 | % | | | 9.5 | | | | 2030 | | | | 550,000 | | | | 1,592 | | | | 551,592 | | | | 3.1 | % | | | 8.8 | % |
| | | | | | | | | | | | | | | | 2031 | | | | 300,000 | | | | 1,740 | | | | 301,740 | | | | 1.8 | % | | | 4.8 | % |
| Unsecured Lines of Credit | | | | | | | | | | | | | | Thereafter | | | | 1,250,000 | | | | 129,149 | | | | 1,379,149 | | | | 2.9 | % | | | 21.9 | % |
Line of credit (3) | | | - | | | | 1.0 | % | | | | | | Subtotal | | | | 5,650,000 | | | | 641,426 | | | | 6,291,426 | | | | 3.2 | % | | | 100.0 | % |
Line of credit (4) | | | - | | | | 1.0 | % | | | | | | Debt Issuance Costs | | | | (31,910 | ) | | | (1,761 | ) | | | (33,671 | ) | | NA | | | NA | |
| Total lines of credit | | | - | | | | 1.0 | % | | | | | | (Discounts)/Premiums | | | | (10,105 | ) | | | 3,885 | | | | (6,220 | ) | | NA | | | NA | |
| | | | | | | | | | | | | | | Total | | | $ | 5,607,985 | | | $ | 643,550 | | | $ | 6,251,535 | | | | 3.2 | % | | | 100.0 | % |
| Total debt, net | | $ | 6,251,535 | | | | 3.2 | % | | | 8.4 | | | | | | | | | | | | | | | | | | | | | | | | | |
| | | | | | | | | | | | | | | | | | | | | | | | | | | | | | | | | | | | | |
Capitalized interest for the three and twelve months ended December 31, 2020 was approximately $2.3 million and $14.6 million, respectively.
| (1) | $350.0 million of the unsecured term loan has a variable interest rate of LIBOR plus 0.95%. The Company has interest rate swap contracts with an aggregate notional amount of $175.0 million, which effectively converts the interest rate on $175.0 million of the term loan to a fixed rate of 2.3%. In April 2020, the Company obtained a $200.0 million unsecured term loan, that has an interest rate of LIBOR plus 1.20% with a one-year maturity and two 12-month extension options, exercisable at the Company’s option. |
| (2) | $225.1 million of variable rate debt is tax exempt to the note holders. This amount excludes $29.7 million of mortgage notes payable related to real estate held for sale that is included in other liabilities on consolidated balance sheet. |
| (3) | This unsecured line of credit facility has a capacity of $1.2 billion, with a scheduled maturity date in December 2023 with one 18-month extension, exercisable at the Company's option. The underlying interest rate on this line is based on a tiered rate structure tied to the Company's corporate ratings and is currently at LIBOR plus 0.825%. |
| (4) | This unsecured line of credit facility has a capacity $35.0 million, with a scheduled maturity date in February 2023. The underlying interest rate on this line is based on a tiered rate structure tied to the Company's corporate ratings and is currently at LIBOR plus 0.825%. |
See Company’s Form 10-K and Form 10-Qs filed with the SEC for additional information
E S S E X P R O P E R T Y T R U S T, I N C.
Capitalization Data, Public Bond Covenants, Credit Ratings and Selected Credit Ratios - December 31, 2020
(Dollars and shares in thousands, except per share amounts)
| | | | | | | | | | | | |
Capitalization Data | | | | | | | Public Bond Covenants (1) | | Actual | | Requirement |
Total debt, net (1) | | | | $ | 6,251,535 | | | | | | | |
| | | | | | | | | Debt to Total Assets: | | | 37 | % | < 65% |
| Common stock and potentially dilutive securities | | | | | | | | | | | |
| Common stock outstanding | | | | 64,999 | | | | | | | | |
Limited partnership units (2) | | | | 2,253 | | | | | | | | |
| Options-treasury method | | | | 14 | | | Secured Debt to Total Assets: | | | 4 | % | < 40% |
| Total shares of common stock and potentially dilutive securities | | | 67,266 | | | | | | | | |
| | | | | | | | | | | | | | |
| Common stock price per share as of December 31, 2020 | | $ | 237.42 | | | | | | | | |
| | | | | | | | | Interest Coverage: | | | 475 | % | > 150% |
| Total equity capitalization | | | $ | 15,970,294 | | | | | | | | |
| | | | | | | | | | | | | | |
| Total market capitalization | | | $ | 22,221,829 | | | Unsecured Debt Ratio (2): | | | 267 | % | > 150% |
| | | | | | | | | | | | | | |
| Ratio of debt to total market capitalization | | | | 28.1 | % | | | | | | | |
| | | | | | | | | Selected Credit Ratios (3) | | Actual | | |
Credit Ratings | | | | | | | | | | | | | |
Rating Agency | Rating | Outlook | | | | | | Net Indebtedness Divided by Adjusted EBITDAre, normalized and annualized: | | | 6.6 | | |
| Moody's | Baa1 | Stable | | | | | | | | | | | |
| Standard & Poor's | BBB+ | Stable | | | | | | Unencumbered NOI to Adjusted Total NOI: | | | 95 | % | |
| | | | |
(1) This amount excludes $29.4 million of mortgage notes payable, net of unamortized debt issuance costs, related to real estate held for sale that is included in other liabilities on consolidated balance sheet. (2) Assumes conversion of all outstanding limited partnership units in the Operating Partnership into shares of the Company's common stock. | | | (1) Refer to page S-18.4 for additional information on the Company's Public Bond Covenants. (2) Unsecured Debt Ratio is unsecured assets (excluding investments in co-investments) divided by unsecured indebtedness. (3) Refer to pages S-18.1 to S-18.4, the section titled "Reconciliations of Non-GAAP Financial Measures and Other Terms" for additional information on the Company's Selected Credit Ratios. |
See Company’s Form 10-K and Form 10-Qs filed with the SEC for additional information
E S S E X P R O P E R T Y T R U S T, I N C.
Portfolio Summary by County as of December 31, 2020
| | | Apartment Homes | | | Average Monthly Rental Rate (1) | | | Percent of NOI (2) | |
| Region - County | | Consolidated (3) | | | Unconsolidated
Co-investments (4) | | | Apartment Homes in Development (5) | | | Total | | | Consolidated | | | Unconsolidated Co-investments (6) | | | Total (7) | | | Consolidated | | | Unconsolidated Co-investments (6) | | | Total (7) | |
| | | | | | | | | | | | | | | | | | | | | | | | | | | | | | | |
| Southern California | | | | | | | | | | | | | | | | | | | | | | | | | | | | | | |
| Los Angeles County | | | 8,982 | | | | 1,563 | | | | 200 | | | | 10,745 | | | $ | 2,428 | | | $ | 2,157 | | | $ | 2,405 | | | | 16.1 | % | | | 15.1 | % | | | 16.0 | % |
| Orange County | | | 5,554 | | | | 1,149 | | | | - | | | | 6,703 | | | | 2,244 | | | | 1,978 | | | | 2,219 | | | | 10.7 | % | | | 11.9 | % | | | 10.8 | % |
| San Diego County | | | 4,824 | | | | 616 | | | | 264 | | | | 5,704 | | | | 2,003 | | | | 1,883 | | | | 1,996 | | | | 8.6 | % | | | 5.7 | % | | | 8.3 | % |
| Ventura County and Other | | | 3,200 | | | | 693 | | | | - | | | | 3,893 | | | | 1,852 | | | | 2,232 | | | | 1,892 | | | | 5.2 | % | | | 8.4 | % | | | 5.6 | % |
| Total Southern California | | | 22,560 | | | | 4,021 | | | | 464 | | | | 27,045 | | | | 2,210 | | | | 2,080 | | | | 2,199 | | | | 40.6 | % | | | 41.1 | % | | | 40.7 | % |
| | | | | | | | | | | | | | | | | | | | | | | | | | | | | | | | | | | | | | | | | |
| Northern California | | | | | | | | | | | | | | | | | | | | | | | | | | | | | | | | | | | | | | | | |
Santa Clara County (8) | | | 8,747 | | | | 1,506 | | | | - | | | | 10,253 | | | | 2,752 | | | | 2,758 | | | | 2,753 | | | | 20.1 | % | | | 15.9 | % | | | 19.7 | % |
| Alameda County | | | 3,959 | | | | 1,309 | | | | - | | | | 5,268 | | | | 2,485 | | | | 2,426 | | | | 2,476 | | | | 8.1 | % | | | 16.2 | % | | | 8.7 | % |
| San Mateo County | | | 2,651 | | | | 195 | | | | 107 | | | | 2,953 | | | | 2,971 | | | | 3,607 | | | | 2,994 | | | | 6.2 | % | | | 3.0 | % | | | 5.9 | % |
| Contra Costa County | | | 2,619 | | | | - | | | | - | | | | 2,619 | | | | 2,452 | | | | - | | | | 2,452 | | | | 5.6 | % | | | 0.0 | % | | | 5.2 | % |
| San Francisco | | | 1,343 | | | | 537 | | | | - | | | | 1,880 | | | | 2,875 | | | | 3,304 | | | | 2,946 | | | | 2.7 | % | | | 3.8 | % | | | 2.8 | % |
| Total Northern California | | | 19,319 | | | | 3,547 | | | | 107 | | | | 22,973 | | | | 2,695 | | | | 2,760 | | | | 2,701 | | | | 42.7 | % | | | 38.9 | % | | | 42.3 | % |
| | | | | | | | | | | | | | | | | | | | | | | | | | | | | | | | | | | | | | | | | |
| Seattle Metro | | | 10,217 | | | | 1,890 | | | | - | | | | 12,107 | | | | 1,911 | | | | 1,899 | | | | 1,910 | | | | 16.7 | % | | | 20.0 | % | | | 17.0 | % |
| | | | | | | | | | | | | | | | | | | | | | | | | | | | | | | | | | | | | | | | | |
| Total | | | 52,096 | | | | 9,458 | | | | 571 | | | | 62,125 | | | $ | 2,331 | | | $ | 2,294 | | | $ | 2,328 | | | | 100.0 | % | | | 100.0 | % | | | 100.0 | % |
| (1) | Average monthly rental rate is defined as the total scheduled monthly rental income (actual rent for occupied apartment homes plus market rent for vacant apartment homes) divided by the number of apartment homes. |
| (2) | Represents the percentage of actual NOI for the quarter ended December 31, 2020. See the section titled "Net Operating Income ("NOI") and Same-Property NOI Reconciliations" on page S-18.3. |
| (3) | Includes one community consisting of 476 apartment homes that is producing partial income due to lease-up. |
| (4) | Includes two communities consisting of 806 apartment homes that are producing partial income due to lease-up. |
| (5) | Includes development communities with no rental income. |
| (6) | Co-investment amounts weighted for Company's pro rata share. |
| (7) | At Company's pro rata share. |
| (8) | Includes all communities in Santa Clara County and one community in Santa Cruz County. |
See Company’s Form 10-K and Form 10-Qs filed with the SEC for additional information
E S S E X P R O P E R T Y T R U S T, I N C.
Operating Income by Quarter (1)
(Dollars in thousands)
| | | Apartment Homes | | | Q4 '20 | | | Q3 '20 | | | Q2 '20 | | | Q1 '20 | | | Q4 '19 | |
| Rental and other property revenues: | | | | | | | | | | | | | | | | | | |
| Same-property | | | 46,550 | | | $ | 313,254 | | | $ | 312,364 | | | $ | 320,179 | | | $ | 340,889 | | | $ | 340,663 | |
Acquisitions (2) | | | 2,557 | | | | 19,759 | | | | 20,143 | | | | 19,885 | | | | 18,879 | | | | 4,238 | |
Development (3) | | | 968 | | | | 6,094 | | | | 5,461 | | | | 4,420 | | | | 4,075 | | | | 3,417 | |
| Redevelopment | | | 621 | | | | 4,280 | | | | 4,277 | | | | 5,096 | | | | 5,401 | | | | 5,317 | |
Non-residential/other, net (4) | | | 1,400 | | | | 12,250 | | | | 11,488 | | | | 15,594 | | | | 20,506 | | | | 19,226 | |
Straight-line rent concessions (5) | | | - | | | | 4,150 | | | | 14,731 | | | | 2,975 | | | | - | | | | - | |
| Total rental and other property revenues | | | 52,096 | | | | 359,787 | | | | 368,464 | | | | 368,149 | | | | 389,750 | | | | 372,861 | |
| | | | | | | | | | | | | | | | | | | | | | | | | |
| Property operating expenses: | | | | | | | | | | | | | | | | | | | | | | | | |
| Same-property | | | | | | | 96,181 | | | | 97,358 | | | | 94,976 | | | | 93,203 | | | | 91,921 | |
Acquisitions (2) | | | | | | | 6,475 | | | | 6,506 | | | | 6,714 | | | | 5,804 | | | | 1,200 | |
Development (3) | | | | | | | 2,438 | | | | 1,977 | | | | 1,445 | | | | 1,447 | | | | 1,208 | |
| Redevelopment | | | | | | | 1,845 | | | | 2,049 | | | | 1,752 | | | | 1,663 | | | | 1,725 | |
Non-residential/other, net (4) (6) | | | | | | | 3,787 | | | | 4,505 | | | | 5,249 | | | | 5,026 | | | | 5,070 | |
| Total property operating expenses | | | | | | | 110,726 | | | | 112,395 | | | | 110,136 | | | | 107,143 | | | | 101,124 | |
| | | | | | | | | | | | | | | | | | | | | | | | | |
| Net operating income (NOI): | | | | | | | | | | | | | | | | | | | | | | | | |
| Same-property | | | | | | | 217,073 | | | | 215,006 | | | | 225,203 | | | | 247,686 | | | | 248,742 | |
Acquisitions (2) | | | | | | | 13,284 | | | | 13,637 | | | | 13,171 | | | | 13,075 | | | | 3,038 | |
Development (3) | | | | | | | 3,656 | | | | 3,484 | | | | 2,975 | | | | 2,628 | | | | 2,209 | |
| Redevelopment | | | | | | | 2,435 | | | | 2,228 | | | | 3,344 | | | | 3,738 | | | | 3,592 | |
Non-residential/other, net (4) | | | | | | | 8,463 | | | | 6,983 | | | | 10,345 | | | | 15,480 | | | | 14,156 | |
Straight-line rent concessions (5) | | | | | | | 4,150 | | | | 14,731 | | | | 2,975 | | | | - | | | | - | |
| Total NOI | | | | | | $ | 249,061 | | | $ | 256,069 | | | $ | 258,013 | | | $ | 282,607 | | | $ | 271,737 | |
| | | | | | | | | | | | | | | | | | | | | | | | | |
| Same-property metrics | | | | | | | | | | | | | | | | | | | | | | | | |
| Operating margin | | | | | | | 69 | % | | | 69 | % | | | 70 | % | | | 73 | % | | | 73 | % |
Annualized turnover (7) | | | | | | | 46 | % | | | 58 | % | | | 46 | % | | | 39 | % | | | 41 | % |
Financial occupancy (8) | | | | | | | 96.5 | % | | | 96.0 | % | | | 94.9 | % | | | 96.8 | % | | | 97.1 | % |
| (1) | Includes consolidated communities only. |
| (2) | Acquisitions include properties acquired which did not have comparable stabilized results as of January 1, 2019. |
| (3) | Development includes properties developed which did not have comparable stabilized results as of January 1, 2019. |
| (4) | Non-residential/other, net consists of revenues generated from retail space, commercial properties, held for sale properties, disposition properties, student housing, properties undergoing significant construction activities that do not meet our redevelopment criteria and three communities located in the California counties of Riverside, Santa Barbara, and Santa Cruz, which the Company does not consider its core markets. |
| (5) | Same-property revenues reflect concessions on a cash basis. Total Rental and Other Property Revenues reflect concessions on a straight-line basis in accordance with U.S. GAAP. |
| (6) | Includes other expenses and intercompany eliminations pertaining to self-insurance. |
| (7) | Annualized turnover is defined as the number of apartment homes turned over during the quarter, annualized, divided by the total number of apartment homes. |
| (8) | Financial occupancy is defined as the percentage resulting from dividing actual rental income by total scheduled rental income (actual rent for occupied apartment homes plus market rent for vacant apartment homes). |
See Company’s Form 10-K and Form 10-Qs filed with the SEC for additional information
E S S E X P R O P E R T Y T R U S T, I N C.
Same-Property Revenue Results by County - Fourth Quarter 2020 vs. Fourth Quarter 2019 and Third Quarter 2020
(Dollars in thousands, except average monthly rental rates)
| | | | | | | | | Average Monthly Rental Rate | | | Financial Occupancy | | | Gross Revenues | | | Sequential Gross Revenues | |
| Region - County | | Apartment Homes | | | Q4 '20 % of Actual NOI | | | Q4 '20 | | | Q4 '19 | | | % Change | | | Q4 '20 | | | Q4 '19 | | | % Change | | | Q4 '20 | | | Q4 '19 | | | % Change | | | Q3 '20 | | | % Change | |
| | | | | | | | | | | | | | | | | | | | | | | | | | | | | | | | | | | | | | | | |
| Southern California | | | | | | | | | | | | | | | | | | | | | | | | | | | | | | | | | | | | | | | |
| Los Angeles County | | | 8,526 | | | | 17.1 | % | | $ | 2,435 | | | $ | 2,482 | | | | -1.9 | % | | | 95.9 | % | | | 97.1 | % | | | -1.2 | % | | $ | 56,733 | | | $ | 65,185 | | | | -13.0 | % | | $ | 55,415 | | | | 2.4 | % |
| Orange County | | | 5,439 | | | | 11.6 | % | | | 2,234 | | | | 2,231 | | | | 0.1 | % | | | 97.2 | % | | | 96.6 | % | | | 0.6 | % | | | 35,809 | | | | 37,122 | | | | -3.5 | % | | | 35,359 | | | | 1.3 | % |
| San Diego County | | | 4,582 | | | | 9.2 | % | | | 1,999 | | | | 1,977 | | | | 1.1 | % | | | 97.7 | % | | | 97.3 | % | | | 0.4 | % | | | 27,804 | | | | 28,197 | | | | -1.4 | % | | | 27,149 | | | | 2.4 | % |
| Ventura County | | | 2,253 | | | | 4.5 | % | | | 1,895 | | | | 1,878 | | | | 0.9 | % | | | 98.7 | % | | | 97.0 | % | | | 1.8 | % | | | 13,064 | | | | 13,240 | | | | -1.3 | % | | | 12,905 | | | | 1.2 | % |
| Total Southern California | | | 20,800 | | | | 42.4 | % | | | 2,228 | | | | 2,240 | | | | -0.5 | % | | | 96.8 | % | | | 97.0 | % | | | -0.2 | % | | | 133,410 | | | | 143,744 | | | | -7.2 | % | | | 130,828 | | | | 2.0 | % |
| | | | | | | | | | | | | | | | | | | | | | | | | | | | | | | | | | | | | | | | | | | | | | | | | | | | | |
| Northern California | | | | | | | | | | | | | | | | | | | | | | | | | | | | | | | | | | | | | | | | | | | | | | | | | | | | |
| Santa Clara County | | | 7,406 | | | | 19.5 | % | | | 2,739 | | | | 2,849 | | | | -3.9 | % | | | 96.9 | % | | | 97.2 | % | | | -0.3 | % | | | 58,506 | | | | 65,016 | | | | -10.0 | % | | | 59,421 | | | | -1.5 | % |
| Alameda County | | | 2,954 | | | | 6.8 | % | | | 2,515 | | | | 2,603 | | | | -3.4 | % | | | 96.3 | % | | | 97.3 | % | | | -1.0 | % | | | 21,282 | | | | 24,044 | | | | -11.5 | % | | | 21,178 | | | | 0.5 | % |
| San Mateo County | | | 1,830 | | | | 4.9 | % | | | 2,906 | | | | 3,072 | | | | -5.4 | % | | | 96.0 | % | | | 97.1 | % | | | -1.1 | % | | | 15,413 | | | | 17,511 | | | | -12.0 | % | | | 15,440 | | | | -0.2 | % |
| Contra Costa County | | | 2,270 | | | | 5.3 | % | | | 2,369 | | | | 2,384 | | | | -0.6 | % | | | 97.6 | % | | | 97.3 | % | | | 0.3 | % | | | 16,112 | | | | 16,811 | | | | -4.2 | % | | | 15,864 | | | | 1.6 | % |
| San Francisco | | | 1,178 | | | | 2.6 | % | | | 2,794 | | | | 3,154 | | | | -11.4 | % | | | 93.3 | % | | | 96.5 | % | | | -3.3 | % | | | 9,502 | | | | 11,496 | | | | -17.3 | % | | | 9,571 | | | | -0.7 | % |
| Total Northern California | | | 15,638 | | | | 39.1 | % | | | 2,667 | | | | 2,784 | | | | -4.2 | % | | | 96.5 | % | | | 97.2 | % | | | -0.7 | % | | | 120,815 | | | | 134,878 | | | | -10.4 | % | | | 121,474 | | | | -0.5 | % |
| | | | | | | | | | | | | | | | | | | | | | | | | | | | | | | | | | | | | | | | | | | | | | | | | | | | | |
| Seattle Metro | | | 10,112 | | | | 18.5 | % | | | 1,912 | | | | 1,914 | | | | -0.1 | % | | | 95.8 | % | | | 97.1 | % | | | -1.3 | % | | | 59,029 | | | | 62,041 | | | | -4.9 | % | | | 60,062 | | | | -1.7 | % |
| | | | | | | | | | | | | | | | | | | | | | | | | | | | | | | | | | | | | | | | | | | | | | | | | | | | | |
| Total Same-Property | | | 46,550 | | | | 100.0 | % | | $ | 2,307 | | | $ | 2,352 | | | | -1.9 | % | | | 96.5 | % | | | 97.1 | % | | | -0.6 | % | �� | $ | 313,254 | | | $ | 340,663 | | | | -8.0 | % | | $ | 312,364 | | | | 0.3 | % |
See Company’s Form 10-K and Form 10-Qs filed with the SEC for additional information
E S S E X P R O P E R T Y T R U S T, I N C.
Same-Property Revenue Results by County - Twelve months ended December 31, 2020 vs. Twelve months ended December 31, 2019
(Dollars in thousands, except average monthly rental rates)
| | | | | | YTD | | | Average Monthly Rental Rate | | | Financial Occupancy | | | Gross Revenues | |
| Region - County | | Apartment Homes | | | 2020 % of Actual NOI | | | YTD 2020 | | | YTD 2019 | | | % Change | | | YTD 2020 | | | YTD 2019 | | | % Change | | | YTD 2020 | | | YTD 2019 | | | % Change | |
| | | | | | | | | | | | | | | | | | | | | | | | | | | | | | | | | | |
| Southern California | | | | | | | | | | | | | | | | | | | | | | | | | | | | | | | | | |
| Los Angeles County | | | 8,526 | | | | 17.5 | % | | $ | 2,467 | | | $ | 2,460 | | | | 0.3 | % | | | 95.1 | % | | | 96.6 | % | | | -1.6 | % | | | 235,531 | | | | 256,720 | | | | -8.3 | % |
| Orange County | | | 5,439 | | | | 11.1 | % | | | 2,236 | | | | 2,207 | | | | 1.3 | % | | | 96.3 | % | | | 96.2 | % | | | 0.1 | % | | | 142,897 | | | | 145,534 | | | | -1.8 | % |
| San Diego County | | | 4,582 | | | | 8.7 | % | | | 1,995 | | | | 1,958 | | | | 1.9 | % | | | 97.0 | % | | | 96.9 | % | | | 0.1 | % | | | 110,444 | | | | 110,945 | | | | -0.5 | % |
| Ventura County | | | 2,253 | | | | 4.2 | % | | | 1,890 | | | | 1,862 | | | | 1.5 | % | | | 97.3 | % | | | 97.0 | % | | | 0.3 | % | | | 51,899 | | | | 52,395 | | | | -0.9 | % |
| Total Southern California | | | 20,800 | | | | 41.5 | % | | | 2,240 | | | | 2,219 | | | | 0.9 | % | | | 96.0 | % | | | 96.6 | % | | | -0.6 | % | | | 540,771 | | | | 565,594 | | | | -4.4 | % |
| | | | | | | | | | | | | | | | | | | | | | | | | | | | | | | | | | | | | | | | | | | | | |
| Northern California | | | | | | | | | | | | | | | | | | | | | | | | | | | | | | | | | | | | | | | | | | | | |
| Santa Clara County | | | 7,406 | | | | 20.1 | % | | | 2,818 | | | | 2,819 | | | | 0.0 | % | | | 96.4 | % | | | 96.8 | % | | | -0.4 | % | | | 245,690 | | | | 255,628 | | | | -3.9 | % |
| Alameda County | | | 2,954 | | | | 6.9 | % | | | 2,577 | | | | 2,590 | | | | -0.5 | % | | | 95.7 | % | | | 96.7 | % | | | -1.0 | % | | | 88,556 | | | | 94,531 | | | | -6.3 | % |
| San Mateo County | | | 1,830 | | | | 5.2 | % | | | 3,027 | | | | 3,035 | | | | -0.3 | % | | | 96.0 | % | | | 96.4 | % | | | -0.4 | % | | | 64,631 | | | | 68,506 | | | | -5.7 | % |
| Contra Costa County | | | 2,270 | | | | 5.1 | % | | | 2,377 | | | | 2,366 | | | | 0.5 | % | | | 97.2 | % | | | 96.8 | % | | | 0.4 | % | | | 64,315 | | | | 66,303 | | | | -3.0 | % |
| San Francisco | | | 1,178 | | | | 3.0 | % | | | 3,007 | | | | 3,114 | | | | -3.4 | % | | | 94.1 | % | | | 96.2 | % | | | -2.2 | % | | | 41,108 | | | | 45,146 | | | | -8.9 | % |
| Total Northern California | | | 15,638 | | | | 40.3 | % | | | 2,747 | | | | 2,757 | | | | -0.4 | % | | | 96.1 | % | | | 96.7 | % | | | -0.6 | % | | | 504,300 | | | | 530,114 | | | | -4.9 | % |
| | | | | | | | | | | | | | | | | | | | | | | | | | | | | | | | | | | | | | | | | | | | | |
| Seattle Metro | | | 10,112 | | | | 18.2 | % | | | 1,932 | | | | 1,886 | | | | 2.4 | % | | | 96.0 | % | | | 96.6 | % | | | -0.6 | % | | | 241,615 | | | | 242,982 | | | | -0.6 | % |
| | | | | | | | | | | | | | | | | | | | | | | | | | | | | | | | | | | | | | | | | | | | | |
| Total Same-Property | | | 46,550 | | | | 100.0 | % | | $ | 2,343 | | | $ | 2,327 | | | | 0.7 | % | | | 96.0 | % | | | 96.6 | % | | | -0.6 | % | | $ | 1,286,686 | | | $ | 1,338,690 | | | | -3.9 | % |
See Company’s Form 10-K and Form 10-Qs filed with the SEC for additional information
E S S E X P R O P E R T Y T R U S T, I N C.
Same-Property Operating Expenses - Quarter and Year to Date as of December 31, 2020 and 2019
(Dollars in thousands)
| | | Based on 46,550 apartment homes | |
| | | Q4 '20 | | | Q4 '19 | | | % Change | | | % of Op. Ex. | | | | YTD 2020 | | | YTD 2019 | | | % Change | | | % of Op. Ex. | |
| | | | | | | | | | | | | | | | | | | | | | | | | | |
| Same-property operating expenses: | | | | | | | | | | | | | | | | | | | | | | | | | |
| Real estate taxes | | $ | 37,579 | | | $ | 36,090 | | | | 4.1 | % | | | 39.1 | % | | | $ | 148,575 | | | $ | 141,895 | | | | 4.7 | % | | | 38.9 | % |
Maintenance and repairs (1) | | | 19,790 | | | | 17,645 | | | | 12.2 | % | | | 20.6 | % | | | | 80,259 | | | | 74,754 | | | | 7.4 | % | | | 21.0 | % |
| Administrative | | | 15,529 | | | | 16,502 | | | | -5.9 | % | | | 16.1 | % | | | | 63,991 | | | | 65,396 | | | | -2.1 | % | | | 16.8 | % |
| Utilities | | | 18,822 | | | | 17,454 | | | | 7.8 | % | | | 19.6 | % | | | | 71,675 | | | | 68,434 | | | | 4.7 | % | | | 18.8 | % |
| Insurance and other | | | 4,461 | | | | 4,230 | | | | 5.5 | % | | | 4.6 | % | | | | 17,218 | | | | 16,754 | | | | 2.8 | % | | | 4.5 | % |
| Total same-property operating expenses | | $ | 96,181 | | | $ | 91,921 | | | | 4.6 | % | | | 100.0 | % | | | $ | 381,718 | | | $ | 367,233 | | | | 3.9 | % | | | 100.0 | % |
(1) Maintenance and repairs includes expenses related to COVID-19 of $0.4 million and $3.6 million for the three and twelve months ended December 31, 2020, respectively. | | | | | | | | | | | | | | | | | | |
See Company’s Form 10-K and Form 10-Qs filed with the SEC for additional information
E S S E X P R O P E R T Y T R U S T, I N C.
Development Pipeline - December 31, 2020
(Dollars in millions, except per apartment home amounts in thousands and except in footnotes)
| Project Name | | Location | | Ownership % | | | Estimated Apartment Homes | | | Estimated Commercial sq. feet | | | Incurred to Date | | | Remaining Costs | | | Estimated Total Cost | | | Essex Est. Total Cost (1) | | | Cost per Apartment Home (2) | | | Average %
Occupied | | | % Leased as of 12/31/20 (3) | | | % Leased as of 2/1/21 (3) | | | Construction Start | | | Initial Occupancy | | | Stabilized Operations | |
| | | | | | | | | | | | | | | | | | | | | | | | | | | | | | | | | | | | | | | | | | | | |
Development Projects - Consolidated (4) | | | | | | | | | | | | | | | | | | | | | | | | | | | | | | | | | | | | | | | | | | | | |
| Station Park Green - Phase IV | | San Mateo, CA | | | 100 | % | | | 107 | | | | - | | | | 66 | | | | 28 | | | | 94 | | | | 94 | | | | 879 | | | | 0 | % | | | 0 | % | | | 0 | % | | | Q3 2019 | | | | Q4 2021 | | | | Q2 2022 | |
Mylo (5) | | Santa Clara, CA | | | 100 | % | | | 476 | | | | - | | | | 213 | | | | 13 | | | | 226 | | | | 226 | | | | 475 | | | | 63 | % | | | 67 | % | | | 73 | % | | | Q3 2016 | | | | Q3 2019 | | | | Q2 2021 | |
Wallace on Sunset (6) | | Hollywood, CA | | | 100 | % | | | 200 | | | | 4,700 | | | | 97 | | | | 19 | | | | 116 | | | | 116 | | | | 550 | | | | 0 | % | | | 0 | % | | | 0 | % | | | Q4 2017 | | | | Q2 2021 | | | | Q4 2021 | |
| Total Development Projects - Consolidated | | | | | | | | | 783 | | | | 4,700 | | | | 376 | | | | 60 | | | | 436 | | | | 436 | | | | 549 | | | | | | | | | | | | | | | | | | | | | | | | | |
| | | | | | | | | | | | | | | | | | | | | | | | | | | | | | | | | | | | | | | | | | | | | | | | | | | | | | | | | | | |
| Land Held for Future Development - Consolidated | | | | | | | | | | | | | | | | | | | | | | | | | | | | | | | | | | | | | | | | | | | | | | | | | | | | | | | | | | |
| Other Projects | | Various | | | 100 | % | | | | | | | | | | | 21 | | | | - | | | | 21 | | | | 21 | | | | | | | | | | | | | | | | | | | | | | | | | | | | | |
| Total Development Pipeline - Consolidated | | | | | | | | | 783 | | | | 4,700 | | | | 397 | | | | 60 | | | | 457 | | | | 457 | | | | | | | | | | | | | | | | | | | | | | | | | | | | | |
| | | | | | | | | | | | | | | | | | | | | | | | | | | | | | | | | | | | | | | | | | | | | | | | | | | | | | | | | | | |
Development Projects - Joint Venture (4) | | | | | | | | | | | | | | | | | | | | | | | | | | | | | | | | | | | | | | | | | | | | | | | | | | | | | | | | | | |
| Patina at Midtown | | San Jose, CA | | | 50 | % | | | 269 | | | | - | | | | 135 | | | | 13 | | | | 148 | | | | 74 | | | | 550 | | | | 43 | % | | | 46 | % | | | 51 | % | | | Q3 2017 | | | | Q3 2020 | | | | Q2 2021 | |
500 Folsom (7) | | San Francisco, CA | | | 50 | % | | | 537 | | | | 6,000 | | | | 400 | | | | 15
| | | | 415 | | | | 208 | | | | 763 | | | | 86 | % | | | 89 | % | | | 92 | % | | | Q4 2015 | | | | Q3 2019 | | | | Q1 2021 | |
Scripps Mesa Apartments (7) | | San Diego, CA | | | 51 | % | | | 264 | | | | 2,000 | | | | 16 | | | | 86 | | | | 102 | | | | 52 | | | | 383 | | | | 0 | % | | | 0 | % | | | 0 | % | | | Q3 2020 | | | | Q4 2022 | | | | Q3 2023 | |
| Total Development Projects - Joint Venture | | | | | | | | | 1,070 | | | | 8,000 | | | | 551 | | | | 114 | | | | 665 | | | | 334 | | | $ | 615 | | | | | | | | | | | | | |
| | | | | | | | | | | | | | | | | | | | | | | | | | | | | | | | | | | | | | | | | | | | | | | | | | | | | | | | | | | |
| Grand Total - Development Pipeline | | | | | | | | | 1,853 | | | | 12,700 | | | $ | 948 | | | $ | 174 | | | $ | 1,122 | | | | 791 | | | | | | | | | | | | | | | | | | | | | | | | | | | | | |
| Essex Cost Incurred to Date - Pro Rata | | | | | | | | | | | | | | | | | | | | | | | | | | | | | (673 | ) | | | | | | | | | | | | | | | | | | | | | | | | | | | | |
| Essex Remaining Commitment | | | | | | | | | | | | | | | | | | | | | | | | | | | | $ | 118 | | | | | | | | | | | | | | | | | | | | | | | | | | | | | |
| | (1) | The Company's share of the estimated total cost of the project. |
| | (2) | Net of the estimated allocation to the retail component of the project. |
| | (3) | Calculations are based on multifamily operations only. |
| | (4) | For the fourth quarter of 2020, the Company's cost includes $2.3 million of capitalized interest, $1.1 million of capitalized overhead and $0.2 million of development fees (such development fees reduced G&A expenses). |
| | (5) | Cost incurred to date does not include a deduction of $4.7 million for accumulated depreciation recorded during the period when the property was held as a retail operating asset. |
| | (6) | Cost incurred to date does not include a deduction of $6.3 million for accumulated depreciation recorded during the period when the property was held as a retail operating asset and is net of cost incurred on the adjacent theatre at the property. |
| | (7) | Cost incurred to date and estimated total cost are net of a projected value for low income housing tax credit proceeds and the value of the tax exempt bond structure. |
See Company’s Form 10-K and Form 10-Qs filed with the SEC for additional information
E S S E X P R O P E R T Y T R U S T, I N C.
Redevelopment Pipeline - December 31, 2020
(Dollars in thousands)
| Region/Project Name | | Location | | | | | Incurred To Date | | | Remaining Cost | | | Total Cost | | | | | | NOI Twelve Months Ended | |
| 2020 | | | 2019 |
| | | | | | | | | | | | | | | | | | | | | | | | |
| Consolidated - Redevelopment Projects | | | | | | | | | | | | | | | | | | | | | | | |
Same-Property (1) | | | | | | | | | | | | | | | | | | | | | | | |
| Southern California | | | | | | | | | | | | | | | | | | | | | | | |
| The Blake LA | | Los Angeles, CA | | | 196 | | | $ | 11,500 | | | $ | 700 | | | $ | 12,200 | | | | Q4 2016 | | | | | | | |
| The Palms at Laguna Niguel | | Laguna Niguel, CA | | | 460 | | | | 7,600 | | | | 1,900 | | | | 9,500 | | | | Q4 2016 | | | | | | | |
| Total Same-Property - Redevelopment Projects | | | | | 656 | | | $ | 19,100 | | | $ | 2,600 | | | $ | 21,700 | | | | | | | $ | 11,594 | | | $ | 12,260 | |
| | | | | | | | | | | | | | | | | | | | | | | | | | | | | | | |
| Non-Same Property | | | | | | | | | | | | | | | | | | | | | | | | | | | | | | |
| Southern California | | | | | | | | | | | | | | | | | | | | | | | | | | | | | | |
| Bunker Hill Towers | | Los Angeles, CA | | | 456 | | | $ | 85,500 | | | $ | 1,900 | | | $ | 87,400 | | | | Q3 2013 | | | | | | | | | |
| Total Non-Same Property - Redevelopment Projects | | | | | 456 | | | $ | 85,500 | | | $ | 1,900 | | | $ | 87,400 | | | | | | | $ | 7,253 | | | $ | 8,482 | |
| | (1) | Redevelopment activities are ongoing at these communities, but the communities have stabilized operations, therefore results are classified in same-property results. |
See Company’s Form 10-K and Form 10-Qs filed with the SEC for additional information
E S S E X P R O P E R T Y T R U S T, I N C.
Capital Expenditures - December 31, 2020 (1)
(Dollars in thousands, except in footnotes and per apartment home amounts)
Revenue Generating Capital Expenditures (2) | | Q4 '20 | | | Q3 '20 | | | Q2 '20 | | | Q1 '20 | | | | Trailing 4 Quarters | |
| Same-property portfolio | | $ | 6,762 | | | $ | 5,676 | | | $ | 7,659 | | | $ | 18,065 | | | | $ | 38,162 | |
| Non-same property portfolio | | | 124 | | | | 3,116 | | | | 1,423 | | | | 3,580 | | | | | 8,243 | |
| Total revenue generating capital expenditures | | $ | 6,886 | | | $ | 8,792 | | | $ | 9,082 | | | $ | 21,645 | | | | $ | 46,405 | |
| | | | | | | | | | | | | | | | | | | | | | |
| Number of same-property interior renovations | | | 246 | | | | 414 | | | | 491 | | | | 771 | | | | | 1,922 | |
| Number of total consolidated interior renovations | | | 394 | | | | 485 | | | | 574 | | | | 917 | | | | | 2,370 | |
| | | | | | | | | | | | | | | | | | | | | | |
Non-Revenue Generating Capital Expenditures (3) | | Q4 '20 | | | Q3 '20 | | | Q2 '20 | | | Q1 '20 | | | | Trailing 4 Quarters | |
| | | | | | | | | | | | | | | | | | | | | | |
Non-revenue generating capital expenditures (4) | | $ | 18,614 | | | $ | 21,009 | | | $ | 16,559 | | | $ | 15,315 | | | | $ | 71,497 | |
| Average apartment homes in quarter | | | 52,154 | | | | 52,274 | | | | 52,552 | | | | 51,670 | | | | | 52,163 | |
| Capital expenditures per apartment homes in the quarter | | $ | 357 | | | $ | 402 | | | $ | 315 | | | $ | 296 | | | | $ | 1,371 | |
| | (1) | The Company incurred $30 thousand of capitalized interest, $2.9 million of capitalized overhead and $0.1 million of co-investment fees related to redevelopment in Q4 2020. |
| | (2) | Represents revenue generating or expense saving expenditures, such as full-scale redevelopments shown on page S-12, interior unit turn renovations, enhanced amenities and certain resource management initiatives. |
| | (3) | Represents roof replacements, paving, building and mechanical systems, exterior painting, siding, etc. |
| | (4) | Non-revenue generating capital expenditures does not include expenditures incurred due to changes in governmental regulations that the Company would not have incurred otherwise, costs related to the COVID-19 pandemic, retail, furniture and fixtures, and expenditures in which the Company expects to be reimbursed. |
See Company’s Form 10-K and Form 10-Qs filed with the SEC for additional information
E S S E X P R O P E R T Y T R U S T, I N C.
Co-investments and Preferred Equity Investments - December 31, 2020
| | | Weighted Average Essex Ownership Percentage | | | Apartment Homes | | | Total Undepreciated Book Value | | | Debt Amount | | | Essex Book Value | | | Weighted Average Borrowing Rate | | | Remaining Term of Debt (in Years) | | | | | Three Months Ended
December 31, 2020 | | | Twelve Months Ended
December 31, 2020 | |
| | | | | | | | | | | | | | | | | | | | | | | | | | | | | | |
| Operating and Other Non-Consolidated Joint Ventures | | | | | | | | | | | | | | | | | | | | | | | | | NOI | |
| Wesco I, III, IV, and V | | | 51 | % | | | 5,310 | | | $ | 1,731,131 | | | $ | 1,058,322 | | | $ | 178,322 | | | | 3.4 | % | | | 3.4 | | | | | $ | 23,174 | | | $ | 96,258 | |
| BEXAEW, BEX II, BEX III, and BEX IV | | | 50 | % | | | 2,691 | | | | 829,222 | | | | 420,723 | | | | 152,309 | | | | 3.3 | % | | | 3.0 | | | | | | 10,996 | | | | 45,481 | |
CPPIB (1) | | | - | | | | - | | | | - | | | | - | | | | - | | | | - | | | | - | | | | | | - | | | | 2,524 | |
| Other | | | 47 | % | | | 651 | | | | 214,566 | | | | 166,433 | | | | 27,635 | | | | 3.0 | % | | | 2.9 | | | | | | 3,143 | | | | 12,945 | |
| Total Operating and Other Non-Consolidated Joint Ventures | | | | | | | 8,652 | | | $ | 2,774,919 | | | $ | 1,645,478 | | | $ | 358,266 | | | | 3.3 | % | | | 3.3 | | | | | $ | 37,313 | | | $ | 157,208 | |
Pre-Development and Development Non-Consolidated Joint Ventures (2) | | | 50 | % | | | 1,070 | | | | 550,863 | | | | 278,607 | | | | 157,433 | | | | 1.8 | % | | | 27.5 | (3) | (4)
| | | | 1,890 | | | | 7,761 | |
| Total Non-Consolidated Joint Ventures | | | | | | | 9,722 | | | $ | 3,325,782 | | | $ | 1,924,085 | | | $ | 515,699 | | | | 3.1 | % | | | 6.8 | | | | | $ | 39,203 | | | $ | 164,969 | |
| | | | | | | | | | | | | | | | | | | | | | | | | | | | | | | | | | | | | | | |
| | | | | | | | | | | | | | | | | | | | | | | | | | | | | | | | | Essex Portion of NOI and Expenses | |
| NOI | | | | | | | | | | | | | | | | | | | | | | | | | | | | | | | | $ | 20,373 | | | $ | 85,758 | |
| Depreciation | | | | | | | | | | | | | | | | | | | | | | | | | | | | | | | | | (13,403 | ) | | | (51,594 | ) |
| Interest expense and other | | | | | | | | | | | | | | | | | | | | | | | | | | | | | | | | | (7,332 | ) | | | (30,226 | ) |
| Equity (loss) income from non-core co-investment | | | | | | | | | | | | | | | | | | | | | | | | | | | | | | | | | 916 | | | | 5,289 | |
| Gain on sale of co-investment communities | | | | | | | | | | | | | | | | | | | | | | | | | | | | | | | | | - | | | | 2,225 | |
| Gain on early retirement of debt from unconsolidated co-investment | | | | | | | | | | | | | | | | | | | | | | | | | | | | | | | | | - | | | | 38 | |
| Co-investment promote income | | | | | | | | | | | | | | | | | | | | | | | | | | | | | | | | | - | | | | 6,455 | |
| Net income from operating and other co-investments | | | | | | | | | | | | | | | | | | | | | | | | | | | | | | | | $ | 554 | | | $ | 17,945 | |
| | | | | | | | | | | | | | | | | | | | | | | | | | | | | | | | | | | | | | | |
| | | | | | | | | | | | | | | | | | | | | | | Weighted Average Preferred Return | �� | | Weighted Average Expected Term | | | | | Income from Preferred Equity Investments | |
| Income from preferred equity investments | | | | | | | | | | | | | | | | | | | | | | | | | | | | | | | | $ | 12,444 | | | $ | 48,357 | |
| Income from early redemption of preferred equity investments | | | | | | | | | | | | | | | | | | | | | | | | | | | | | | | | | - | | | | 210 | |
Preferred Equity Investments (5) | | | | | | | | | | | | | | | | | | $ | 502,311 | | | | 10.2 | % | | | 2.0 | | | | | $ | 12,444 | | | $ | 48,567 | |
| | | | | | | | | | | | | | | | | | | | | | | | | | | | | | | | | | | | | | | |
| Total Co-investments | | | | | | | | | | | | | | | | | | $ | 1,018,010 | | | | | | | | | | | | | $ | 12,998 | | | $ | 66,512 | |
| | (1) | In January 2020, the Company purchased CPPIB's 45% interest in each of a land parcel and six communities totaling 2,020 apartment homes. The NOI for the twelve months ended December 31, 2020 includes NOI prior to the acquisition. |
| | (2) | The Company has ownership interests in development co-investments, which are detailed on page S-11. |
| | (3) | $132.0 million of the debt related to 500 Folsom, one of the Company's development co-investments, is financed by tax exempt bonds with a maturity date of January 2052. |
| | (4) | Scripps Mesa Apartments has $89.3 million of long-term tax-exempt bond debt that is subject to a total return swap that matures in 2025. |
| | (5) | As of December 31, 2020, the Company has invested in 18 preferred equity investments. |
See Company’s Form 10-K and Form 10-Qs filed with the SEC for additional information
E S S E X P R O P E R T Y T R U S T, I N C.
Assumptions for 2021 FFO Guidance Range
The guidance projections below are based on current expectations and are forward-looking. The guidance on this page is given for Net Operating Income ("NOI") and Total and Core FFO. See pages S-18.1 to S-18.4 for the definitions of non-GAAP financial measures and other terms.
Significant uncertainties remain surrounding the recovery from COVID, including vaccine distribution and eviction moratoriums, that are outside the Company's control but could swing the full-year guidance in a variety of ways.
| | | 2020 | | | 2021 Full-Year Guidance Range | | |
(Dollars in thousands, except per share data) | | Actuals (1) | | | Low End | | | High End | | Comments About 2021 Full-Year Guidance |
| | | | | | | | | | | |
| Total NOI from Consolidated Communities - Excluding Straight-Line Rent Concessions | | $ | 1,023,894 | | | $ | 957,500 | | | $ | 994,500 | | Reflects a range of same-property NOI growth of -6.25% to -3.00%. Includes the sale of three properties totaling $275 million under contract to close in Q1 '21 |
| | | | | | | | | | | | | | |
| Straight-Line Rent Concessions from Consolidated Communities | | | 21,856 | | | | (6,000 | ) | | | (16,000 | ) | Reflects the non-cash impact of recording lease concessions on a straight-line basis |
| | | | | | | | | | | | | | |
| Accretion from Acquisitions/Dispositions/Preferred Equity | | | - | | | | 800 | | | | 2,800 | | |
| | | | | | | | | | | | | | |
| Management Fees | | | 9,598 | | | | 8,500 | | | | 9,500 | | |
| | | | | | | | | | | | | | |
Interest Expense | | | | | | | | | | | | | |
| Interest expense, before capitalized interest | | | (224,516 | ) | | | (202,200 | ) | | | (198,300 | ) | |
| Interest capitalized | | | 14,616 | | | | 4,000 | | | | 6,000 | | |
| Net interest expense | | | (209,900 | ) | | | (198,200 | ) | | | (192,300 | ) | |
| | | | | | | | | | | | | | |
Recurring Income and Expenses | | | | | | | | | | | | | |
| Interest and other income | | | 15,206 | | | | 22,000 | | | | 23,000 | | |
| FFO from co-investments | | | 103,889 | | | | 109,800 | | | | 115,400 | | |
| General and administrative | | | (50,430 | ) | | | (49,500 | ) | | | (51,500 | ) | |
| Corporate-level property management expenses | | | (34,573 | ) | | | (35,100 | ) | | | (36,100 | ) | |
| Non-controlling interest | | | (11,089 | ) | | | (11,800 | ) | | | (10,800 | ) | |
| Total recurring income and expenses | | | 23,003 | | | | 35,400 | | | | 40,000 | | |
| | | | | | | | | | | | | | |
Non-Core Income and Expenses | | | | | | | | | | | | | |
| Expensed acquisition and investment related costs | | | (1,591 | ) | | | | | | | | | |
| Deferred tax expense on unrealized gain on unconsolidated co-investments | | | (1,531 | ) | | | | | | | | | |
| Gain on sale of marketable securities | | | 2,131 | | | | | | | | | | |
| Unrealized gains on marketable securities | | | 12,515 | | | | | | | | | | |
| Equity income from non-core co-investments | | | 5,289 | | | | | | | | | | |
| Gain on early retirement of debt, net | | | (22,883 | ) | | | | | | | | | |
| Gain on early retirement of debt from unconsolidated co-investment | | | 38 | | | | | | | | | | |
| Co-investment promote income | | | 6,455 | | | | | | | | | | |
| Income from early redemption of preferred equity investments | | | 210 | | | | | | | | | | |
| Accelerated interest income from maturity of investment in mortgage backed security | | | 11,753 | | | | | | | | | | |
| General and administrative and other, net | | | (14,958 | ) | | | | | | | | | |
| Insurance reimbursements and legal settlements, net | | | 81 | | | | | | | | | | |
| Provision for Credit Losses | | | (687 | ) | | | | | | | | | |
| Total non-core income and expenses | | | (3,178 | ) | | | - | | | | - | | |
| | | | | | | | | | | | | | |
Funds from Operations (2) | | $ | 865,273 | | | $ | 798,000 | | | $ | 838,500 | | |
| | | | | | | | | | | | | | |
| Funds from Operations per diluted Share | | $ | 12.78 | | | $ | 11.86 | | | $ | 12.46 | | |
| | | | | | | | | | | | | | |
| % Change - Funds from Operations | | | -6.9 | % | | | -7.2 | % | | | -2.5 | % | |
| | | | | | | | | | | | | | |
| Core Funds from Operations (excludes non-core items) | | $ | 868,451 | | | $ | 798,000 | | | $ | 838,500 | | |
| | | | | | | | | | | | | | |
| Core Funds from Operations per diluted Share | | $ | 12.82 | | | $ | 11.86 | | | $ | 12.46 | | |
| | | | | | | | | | | | | | |
| % Change - Core Funds from Operations | | | -4.2 | % | | | -7.5 | % | | | -2.8 | % | |
| | | | | | | | | | | | | | |
| EPS - Diluted | | $ | 8.69 | | | $ | 3.30 | | | $ | 3.90 | | |
| | | | | | | | | | | | | | |
| Weighted average shares outstanding - FFO calculation | | | 67,726 | | | | 67,300 | | | | 67,300 | | |
| | (1) | All non-core items are excluded from the 2020 actuals and included in the non-core income and expense section of the FFO reconciliation. |
| | (2) | 2021 guidance excludes inestimable projected gain on sale of marketable securities, loss on early retirement of debt, political/legislative costs, and promote income until they are realized within the reporting period presented in the report. |
See Company’s Form 10-K and Form 10-Qs filed with the SEC for additional information
E S S E X P R O P E R T Y T R U S T, I N C.
Reconciliation of Projected EPS, FFO and Core FFO per diluted share
With respect to the Company's guidance regarding its projected FFO and Core FFO, which guidance is set forth in the earnings release and on page S-14 of this supplement, a reconciliation of projected net income per share to projected FFO per share and projected Core FFO per share, as set forth in such guidance, is presented in the table below.
| | | | | | 2021 Guidance Range (1) | |
| | | | | | 1st Quarter 2021 | | | Full-Year 2021 | |
| | | 2020 | | | | | | | | | | | | | |
| | | Actuals | | | Low | | | High | | | Low | | | High | |
| EPS - diluted | | $ | 8.69 | | | $ | 0.82 | | | $ | 0.96 | | | $ | 3.30 | | | $ | 3.90 | |
| Conversion from GAAP share count | | | (0.28 | ) | | | (0.03 | ) | | | (0.03 | ) | | | (0.12 | ) | | | (0.12 | ) |
| Impairment Loss | | | 0.03 | | | | - | | | | - | | | | - | | | | - | |
| Depreciation and amortization | | | 8.52 | | | | 2.14 | | | | 2.14 | | | | 8.56 | | | | 8.56 | |
| Noncontrolling interest related to Operating Partnership units | | | 0.28 | | | | 0.03 | | | | 0.03 | | | | 0.12 | | | | 0.12 | |
| Gain on sale of real estate | | | (0.99 | ) | | | - | | | | - | | | | - | | | | - | |
| Gain on remeasurement of co-investment | | | (3.47 | ) | | | - | | | | - | | | | - | | | | - | |
| FFO per share - diluted | | $ | 12.78 | | | $ | 2.96 | | | $ | 3.10 | | | $ | 11.86 | | | $ | 12.46 | |
| Expensed acquisition and investment related costs | | | 0.02 | | | | - | | | | - | | | | - | | | | - | |
| Deferred tax expense on unrealized gain on unconsolidated co-investments | | | 0.02 | | | | - | | | | - | | | | - | | | | - | |
| Gain on sale of marketable securities | | | (0.03 | ) | | | - | | | | - | | | | - | | | | - | |
| Unrealized gains on marketable securities | | | (0.18 | ) | | | - | | | | - | | | | - | | | | - | |
| Equity income from non-core co-investments | | | (0.08 | ) | | | - | | | | - | | | | - | | | | - | |
| Gain on early retirement of debt, net | | | 0.34 | | | | - | | | | - | | | | - | | | | - | |
| Gain on early retirement of debt from unconsolidated co-investment | | | - | | | | - | | | | - | | | | - | | | | - | |
| Co-investment promote income | | | (0.11 | ) | | | - | | | | - | | | | - | | | | - | |
| Income from early redemption of preferred equity investments | | | - | | | | - | | | | - | | | | - | | | | - | |
| Accelerated interest income from maturity of investment in mortgage backed security | | | (0.17 | ) | | | - | | | | - | | | | - | | | | - | |
| General and administrative and other, net | | | 0.22 | | | | - | | | | - | | | | - | | | | - | |
| Insurance reimbursements and legal settlements, net | | | - | | | | - | | | | - | | | | - | | | | - | |
| Provision for Credit Losses | | | 0.01 | | | | - | | | | - | | | | - | | | | - | |
| Core FFO per share - diluted | | $ | 12.82 | | | $ | 2.96 | | | $ | 3.10 | | | $ | 11.86 | | | $ | 12.46 | |
| | (1) | 2021 guidance excludes inestimable projected gain on sale of real estate and land, gain on sale of marketable securities, loss on early retirement of debt, political/legislative costs, and promote income until they are realized within the reporting period presented in the report. |
See Company’s Form 10-K and Form 10-Qs filed with the SEC for additional information
E S S E X P R O P E R T Y T R U S T, I N C.
Summary of Apartment Community Acquisitions and Dispositions Activity
Year to date as of December 31, 2020
(Dollars in thousands)
| Acquisitions | | | | | |
| | | | | |
| | | | | |
| Property Name | | Location | | | | Ownership Percentage | | Entity | | Date | | Contract Price | | Price per Apartment Home (2) | | | |
| | | | | | | | | | | | | | | | | | |
CPPIB Portfolio (1) | | Various | | | 2,020 | | 100% |
| EPLP | | Jan-20 | | $ | 463,400 | | $ | 497 | | $ | 2,732 | |
| | | Q1 2020 | | | 2,020 | | | | | | | | $ | 463,400 | | $ | 497 | | | | |
| Dispositions | | | | | |
| | | | | |
| | | | | | |
| Property Name | | Location | | | | Ownership Percentage | | Entity | | Date | | Sales Price | | Price per Apartment Home (2) | | | | |
| | | | | | | | | | | | | | | | | | | |
| One South Market and Museum Park | | San Jose, CA | | | 429 | | 100% | | EPLP | | Jun-20 | | $ | 232,000 | | $ | 534 | | | | |
| | | Q2 2020 | | | 429 | | | | | | | | $ | 232,000 | | $ | 534 | | | | |
| | | | | | | | | | | | | | | | | | | | | | |
| Delano | | Redmond, WA | | | 126 | | 100% | | EPLP | | Jul-20 | | $ | 51,500 | | $ | 409 | | | | |
| | | Q3 2020 | | | 126 | | | | | | | | $ | 51,500 | | $ | 409 | | | | |
| | | | | | | | | | | | | | | | | | | | | | |
| 416 on Broadway | | Glendale, CA | | | 115 | | 100% | | EPLP | | Oct-20 | | $ | 60,000 | | $ | 500 | | | | |
| | | Q4 2020 | | | 115 | | | | | | | | $ | 60,000 | | $ | 500 | | | | |
| | | | | | | | | | | | | | | | | | | | | | |
| | 2020 Total | | | 670 | | | | | | | | $ | 343,500 | | $ | 504 | | | | |
| | (1) | In January 2020, the Company purchased the joint venture partner's 45% membership interest in each of a land parcel and six communities totaling 2,020 apartments homes based on a total valuation of approximately $1.0 billion. |
| | (2) | Price per apartment home excludes value allocated to retail space. |
See Company’s Form 10-K and Form 10-Qs filed with the SEC for additional information
E S S E X P R O P E R T Y T R U S T, I N C.
Delinquencies, Operating Statistics, and Same-Property Revenue Growth with Concessions on a GAAP basis
(Dollars in millions, except in footnotes and per share amounts)
Delinquencies for Fourth Quarter 2020 | | Same-Property | | | Non-Same
Property and
Co-investments | | | Total Operating Communities | | | Commercial | | Total | |
| Operating apartment community units | | | 46,550 | | | | 12,791 | | | | 59,341 | | | | N/A | | | N/A | |
| | | | | | | | | | | | | | | | | | | | |
| Cash delinquencies as % of scheduled rent | | | 2.7 | % | | | 2.9 | % | | | 2.7 | % | | | N/A | | | N/A | |
Reported delinquencies as % of scheduled rent (1) | | | 2.7 | % | | | 2.9 | % | | | 2.7 | % | | | N/A | | | N/A | |
Reported delinquencies in 4Q 2020 (2) | | $ | (8.7 | ) | | $ | (1.8 | ) | | $ | (10.5 | ) | | $ | (1.2) | (3) | $ | (11.7 | ) |
Reported delinquencies in 4Q 2019 (2) | | $ | (0.8 | ) | | $ | - | | | $ | (0.8 | ) | | $ | - | | $ | (0.8 | ) |
| | | | | | | | | | | | | | | | | | | | |
| Impact to 4Q 2020 Core FFO per share | | $ | (0.12 | ) | | $ | (0.03 | ) | | $ | (0.14 | ) | | $ | (0.02 | | $ | (0.16 | ) |
| Impact to Core FFO per share growth | | | -3.4 | % | | | -0.8 | % | | | -4.2 | % | | | -0.5 | %
| | -4.7 | % |
| | (1)
| Represents total residential portfolio delinquencies as a percentage of scheduled rent reflected in the financial statements for the three months ended December 31, 2020. |
| | | Co-investment delinquencies reported at the Company's pro rata share. |
| | (3) | Commercial delinquencies in 4Q 2020 includes a straight-line rent reserve of $1.0 million and includes co-investment amounts at the Company's pro rata share. |
Operating Statistics | | | | | | | | Same-Property Revenue Growth with Concessions on a GAAP basis | | | | | | | |
| | | | | | | | | | | | | | | | | | | | | |
| Same-Property Portfolio (46,550 units) | | January 2021 (1) | | | 4Q 2020 | | | | | 4Q 2020 | | | 4Q 2019 | | | YTD 2020 | | | YTD 2019 | |
| Cash delinquencies as % of scheduled rent | | | 2.8 | % | | | 2.7 | % | | Reported rental revenue (cash basis) | | $ | 313.3 | | | $ | 340.7 | | | $ | 1,286.7 | | | $ | 1,338.7 | |
| | | | | | | | | | | Straight-line rent impact to rental revenue | | | 3.2 | | | | - | | | | 19.0 | | | | - | |
New lease rates (2) | | | -8.8 | % | | | -8.9 | % | | GAAP rental revenue | | $ | 316.5 | | | $ | 340.7 | | | $ | 1,305.7 | | | $ | 1,338.7 | |
Renewal rates (3) | | | -1.4 | % | | | -2.5 | % | | | | | | | | | | | | | | | | | | |
| Blended rates | | | -5.5 | % | | | -6.0 | % | | % change - cash rental revenue | | | -8.0 | % | | | | | | | -3.9 | % | | | | |
| | | | | | | | | | | % change - GAAP rental revenue | | | -7.1 | % | | | | | | | -2.5 | % | | | | |
| Financial occupancy | | | 96.7 | % | | | 96.5 | % | | | | | | | | | | | | | | | | | | |
| | (1) | Preliminary January 2021 estimate. |
| | (2) | Represents % change on a net-effective basis, including the impact of leasing incentives. |
| | (3) | Represents % change in similar term lease tradeouts, including the impact of leasing incentives. |
See Company’s Form 10-K and Form 10-Qs filed with the SEC for additional information
See Company’s Form 10-K and Form 10-Qs filed with the SEC for additional informationS-17 E S S E X P R O P E R T Y T RU S T, I N C 2021 MSA Level Forecast: Supply, Jobs, and Apartment Market Conditions Forecast Summary: Forecast Assumptions: Forecast Assumptions: 2021 GDP Growth = +4.3% Re-opening pace remains COVID-dependent, with a challenging 1H21 Re-opening pace remains COVID-dependent, with a challenging 1H21 2021 U.S. job growth Q4/Q4 = +2.3%; Dec-21 unemployment rate = 5.3% New federal stimulus program passed in 1Q21 New federal stimulus program passed in 1Q21 2021 Multifamily supply in ESS markets is roughly stable YoY Vaccine pace accelerates during 1Q21, with herd immunity reached by 4Q21 Vaccine pace accelerates during 1Q21, with herd immunity reached by 4Q21 YoY effective rent growth turns positive the second half of the year after COVID anniversaries No significant new regulatory restrictions No significant new regulatory restrictions Residential Supply (1) Job Forecast (2) Rent Forecast (3) Market New MF Supply New SF Supply Total Supply Total Supply % of MF Supply to MF Stock % of MF Supply to MF Stock % of Total Supply to Total Stock % of Total Supply to Total Stock Est. New Jobs % Growth Economic Rent Growth Los Angeles 9,300 5,400 14,700 14,700 0.6% 0.6% 0.4% 0.4% 135,000 3.2% -2.2% Orange 2,100 3,200 5,300 5,300 0.5% 0.5% 0.5% 0.5% 47,000 3.0% 1.6% San Diego 3,400 2,700 6,100 6,100 0.8% 0.8% 0.5% 0.5% 41,000 2.9% 2.0% Ventura 300 100 400 400 0.5% 0.5% 0.1% 0.1% 8,000 2.7% 2.9% So. Cal. 15,100 11,400 26,500 26,500 0.6% 0.6% 0.4% 0.4% 231,000 3.1% 0.1% San Francisco 2,600 500 3,100 3,100 0.7% 0.7% 0.5% 0.5% 36,000 3.3% -6.6% Oakland 4,100 3,300 7,400 7,400 1.2% 1.2% 0.7% 0.7% 36,500 3.4% -4.3% San Jose 4,000 2,300 6,300 6,300 1.6% 1.6% 0.9% 0.9% 38,000 3.5% -1.9% No. Cal. 10,700 6,100 16,800 16,800 1.1% 1.1% 0.7% 0.7% 110,500 3.4% -3.6% Seattle 7,800 6,000 13,800 13,800 1.6% 1.6% 1.1% 1.1% 55,000 3.3% -2.8% Total/Weighted Avg. (4) 33,600 23,500 57,100 57,100 0.9% 0.9% 0.6% 0.6% 396,500 3.2% -1.9% All data are based on Essex Property Trust, Inc. forecasts. �� (1) Residential Supply: Total supply includes the Company's estimate of multifamily deliveries of properties with 50+ units and excludes student, senior and 100% affordable housing communities. Single-family estimates are based on trailing single-family permits. Multifamily estimates incorporate a methodological enhancement ("delay-adjusted supply") to reflect the anticipated impact of continued construction delays in Essex markets. (2) Job Forecast: Refers to the difference between total non-farm industry employment (not seasonally adjusted) projected 4Q over 4Q, expressed as total new jobs and growth rates. (3) Rent Forecast: The estimated rent growth represents the forecasted change in effective market rents for full year 2021 vs 2020 (TTM year-over-year average), and excludes submarkets not targeted by Essex. (4) Weighted Average: Growth rates are weighted by scheduled rent in the Company's Portfolio.
E S S E X P R O P E R T Y T R U S T, I N C. Tech Sector Initial Public Offerings (“IPOs”) and Re-accelerating Job Postings Set the Stage for 2021 Job Growth in Essex MetrosTech IPO's set a record in 2020 at 147 (+63% YoY), providing capital for future growth in 2021 and beyond.Ten of 2020's fifteen largest domestic tech IPO's are headquartered in Essex markets, including AirBNB, Snowflake, DoorDash, and Unity. Source: PwC/CB Insights, Crunchbase, Google Finance. See Company’s Form 10-K and Form 10-Qs filed with the SEC for additional informationS-17.1 Major 2020 Tech IPOs in Essex Metros Tech Job Postings in Essex Metros Have Re-Accelerated Company Market Cap ($B) Headquarters AirBnb $105.5 San Francisco, CA Snowflake $80.7 San Mateo, CA DoorDash $63.5 San Francisco, CA Unity $39.3 San Francisco, CA ZoomInfo $18.1 Vancouver, WA Wish $15.5 San Francisco, CA C3.ai $12.3 Redwood City, CA McAfee $8.2 San Jose, CA Asana $6.3 San Francisco, CA One Medical $6.2 San Francisco, CA Jfrog $5.5 Sunnyvale, CA Corsair Gaming $3.4 Fremont, CA Sumo Logic $3.1 Redwood City, CA +38% since August trough
E S S E X P R O P E R T Y T R U S T, I N C. Record $130 Billion in Venture Capital Financing is Poised to Support the Next Generation of Tech EmployersVenture capital funding reached a record level in 2020, with firms raising nearly $130 billion, a +14% increase from 2019.Essex markets represent four of the top six metros for 2020 VC investments, led by the San Francisco Bay Area, which accounted for more new capital than the ten largest non-Essex metros. Source: PwC/CB Insights, Crunchbase, Google Finance. See Company’s Form 10-K and Form 10-Qs filed with the SEC for additional informationS-17.2 VC Investments Set Record $130 billion in 2020 Essex Markets Dominate VC Investments in 2020
E S S E X P R O P E R T Y T R U S T, I N C.
Reconciliations of Non-GAAP Financial Measures and Other Terms
Adjusted EBITDAre Reconciliation
The National Association of Real Estate Investment Trusts ("NAREIT”) defines earnings before interest, taxes, depreciation and amortization for real estate ("EBITDAre") (September 2017 White Paper) as net income (computed in accordance with U.S. generally accepted accounting principles ("U.S. GAAP")) before interest expense, income taxes, depreciation and amortization expense, and further adjusted for gains and losses from sales of depreciated operating properties, impairment write-downs of depreciated operating properties, impairment write-downs of investments in unconsolidated entities caused by a decrease in value of depreciated operating properties within the joint venture and adjustments to reflect the Company’s share of EBITDAre of investments in unconsolidated entities.
The Company believes that EBITDAre is useful to investors, creditors and rating agencies as a supplemental measure of the Company’s ability to incur and service debt because it is a recognized measure of performance by the real estate industry, and by excluding gains or losses related to sales or impairment of depreciated operating properties, EBITDAre can help compare the Company’s credit strength between periods or as compared to different companies.
Adjusted EBITDAre represents EBITDAre further adjusted for non-comparable items and is a component of the credit ratio, "Net Indebtedness Divided by Adjusted EBITDAre, normalized and annualized," presented on page S-6, in the section titled "Selected Credit Ratios," and it is not intended to be a measure of free cash flow for management’s discretionary use, as it does not consider certain cash requirements such as income tax payments, debt service requirements, capital expenditures and other fixed charges.
Adjusted EBITDAre is an important metric in evaluating the credit strength of the Company and its ability to service its debt obligations. The Company believes that Adjusted EBITDAre is useful to investors, creditors and rating agencies because it allows investors to compare the Company’s credit strength to prior reporting periods and to other companies without the effect of items that by their nature are not comparable from period to period and tend to obscure the Company’s actual credit quality.
EBITDAre and Adjusted EBITDAre are not recognized measurements under U.S. GAAP. Because not all companies use identical calculations, the Company's presentation of EBITDAre and Adjusted EBITDAre may not be comparable to similarly titled measures of other companies.
The reconciliations of Net Income available to common stockholders to EBITDAre and Adjusted EBITDAre are presented in the table below (Dollars in thousands):
| | | December 31, 2020 | |
| Net income available to common stockholders | | $ | 95,745 | |
| Adjustments: | | | | |
| Net income attributable to noncontrolling interest | | | 5,904 | |
Interest expense, net (1) | | | 52,625 | |
| Depreciation and amortization | | | 130,127 | |
| Income tax provision | | | 592 | |
| Gain on sale of real estate and land | | | (25,716 | ) |
| Impairment loss | | | 1,825 | |
| Co-investment EBITDAre adjustments | | | 20,643 | |
| EBITDAre | | | 281,745 | |
| | | | | |
| Gain on sale of marketable securities | | | (2,007 | ) |
| Unrealized gains on marketable securities | | | (10,300 | ) |
| Provision for credit losses | | | 587 | |
| Equity income from non-core co-investment | | | (916 | ) |
| Deferred tax expense on unrealized gain on unconsolidated co-investment | | | (105 | ) |
| General and administrative and other, net | | | 9,316 | |
| Insurance reimbursements and legal settlements, net | | | (150 | ) |
| Accelerated interest income from maturity of investment in mortgage backed security | | | (11,753 | ) |
| Expensed acquisition and investment related costs | | | 1,487 | |
| Gain on early retirement of debt, net | | | (937 | ) |
| Adjusted EBITDAre | | $ | 266,967 | |
| | (1) | Interest expense, net includes items such as gains on derivatives and the amortization of deferred charges. |
See Company’s Form 10-K and Form 10-Qs filed with the SEC for additional information
E S S E X P R O P E R T Y T R U S T, I N C.
Reconciliations of Non-GAAP Financial Measures and Other Terms
Encumbered
Encumbered means any mortgage, deed of trust, lien, charge, pledge, security interest, security agreement or other encumbrance of any kind.
Funds From Operations ("FFO") and Core FFO
FFO, as defined by NAREIT, is generally considered by industry analysts as an appropriate measure of performance of an equity REIT. Generally, FFO adjusts the net income of equity REITs for non-cash charges such as depreciation and amortization of rental properties, impairment charges, gains on sales of real estate and extraordinary items. Management considers FFO and FFO which excludes non-core items, which is referred to as “Core FFO,” to be useful supplemental operating performance measures of an equity REIT because, together with net income and cash flows, FFO and Core FFO provide investors with additional bases to evaluate the operating performance and ability of a REIT to incur and service debt and to fund acquisitions and other capital expenditures and to pay dividends. By excluding gains or losses related to sales of depreciated operating properties and excluding real estate depreciation (which can vary among owners of identical assets in similar condition based on historical cost accounting and useful life estimates), FFO can help investors compare the operating performance of a real estate company between periods or as compared to different companies. By further adjusting for items that are not considered part of the Company’s core business operations, Core FFO allows investors to compare the core operating performance of the Company to its performance in prior reporting periods and to the operating performance of other real estate companies without the effect of items that by their nature are not comparable from period to period and tend to obscure the Company’s actual operating results.
FFO and Core FFO do not represent net income or cash flows from operations as defined by U.S. GAAP and are not intended to indicate whether cash flows will be sufficient to fund cash needs. These measures should not be considered as alternatives to net income as an indicator of the REIT's operating performance or to cash flows as a measure of liquidity. FFO and Core FFO do not measure whether cash flow is sufficient to fund all cash needs including principal amortization, capital improvements and distributions to stockholders. FFO and Core FFO also do not represent cash flows generated from operating, investing or financing activities as defined under GAAP. Management has consistently applied the NAREIT definition of FFO to all periods presented. However, there is judgment involved and other REITs’ calculation of FFO may vary from the NAREIT definition for this measure, and thus their disclosures of FFO may not be comparable to the Company’s calculation.
The reconciliations of diluted FFO and Core FFO are detailed on page S-3 in the section titled "Consolidated Funds From Operations".
Interest Expense, Net
Interest expense, net is presented on page S-1 in the section titled "Consolidated Operating Results". Interest expense, net includes items such as gains on derivatives and the amortization of deferred charges and is presented in the table below (Dollars in thousands):
| | | Three Months Ended December 31, | | | Twelve Months Ended December 31, | |
| | | 2020 | | | 2020 | |
| Interest expense | | $ | 55,608 | | | $ | 220,633 | |
| Adjustments: | | | | | | | | |
| Total return swap income | | | (2,983 | ) | | | (10,733 | ) |
| Interest expense, net | | $ | 52,625 | | | $ | 209,900 | |
Immediately Available Liquidity
The Company's immediately available liquidity as of February 1, 2021, consisted of the following (Dollars in millions):
| | | February 1, 2021 | |
| Unsecured credit facility - committed | | $ | 1,235 | |
| Balance outstanding | | | 200 | |
| Undrawn portion of line of credit | | $ | 1,035 | |
| Cash, cash equivalents & marketable securities | | | 168 | |
| Total liquidity | | $ | 1,203 | |
See Company’s Form 10-K and Form 10-Qs filed with the SEC for additional information
E S S E X P R O P E R T Y T R U S T, I N C.
Reconciliations of Non-GAAP Financial Measures and Other Terms
Net Indebtedness Divided by Adjusted EBITDAre
This credit ratio is presented on page S-6 in the section titled "Selected Credit Ratios." This credit ratio is calculated by dividing net indebtedness by Adjusted EBITDAre, as annualized based on the most recent quarter, and adjusted for estimated net operating income from properties acquired or disposed of during the quarter. This ratio is presented by the Company because it provides rating agencies and investors an additional means of comparing the Company's ability to service debt obligations to that of other companies. Net indebtedness is total debt, net less unamortized premiums, discounts, debt issuance costs, unrestricted cash and cash equivalents, and marketable securities. The reconciliation of Adjusted EBITDAre is set forth in "Adjusted EBITDAre Reconciliation" on page S-18.1 The calculation of this credit ratio and a reconciliation of net indebtedness to total debt at pro rata share for co-investments, net is presented in the table below (Dollars in thousands):
| Total consolidated debt, net | | $ | 6,251,535 | |
Mortgage debt associated with real estate held for sale, net (1) | | | 29,422 | |
| Total debt from co-investments at pro rata share | | | 983,198 | |
| Adjustments: | | | | |
| Consolidated unamortized premiums, discounts, and debt issuance costs | | | 39,891 | |
Pro rata co-investments unamortized premiums, discounts, and debt issuance costs | | | 4,642 | |
| Consolidated cash and cash equivalents-unrestricted | | | (73,629 | ) |
| Pro rata co-investment cash and cash equivalents-unrestricted | | | (20,342 | ) |
| Marketable securities | | | (195,868 | ) |
| Net Indebtedness | | $ | 7,018,849 | |
| | | | | |
Adjusted EBITDAre, annualized (2) | | $ | 1,067,868 | |
Other EBITDAre normalization adjustments, net, annualized (3) | | | (528 | ) |
| Adjusted EBITDAre, normalized and annualized | | $ | 1,067,340 | |
| | | | | |
| Net Indebtedness Divided by Adjusted EBITDAre, normalized and annualized | | | 6.6 | |
| | (1) | Amount is net of unamortized debt issuance costs and is included in other liabilities on the consolidated balance sheet. |
| | (2) | Based on the amount for the most recent quarter, multiplied by four. |
| | (3) | Adjustments made for properties in lease-up, acquired, or disposed during the most recent quarter and other partial quarter activity, multiplied by four. |
Net Operating Income ("NOI") and Same-Property NOI Reconciliations
NOI and same-property NOI are considered by management to be important supplemental performance measures to earnings from operations included in the Company’s consolidated statements of income. The presentation of same-property NOI assists with the presentation of the Company’s operations prior to the allocation of depreciation and any corporate-level or financing-related costs. NOI reflects the operating performance of a community and allows for an easy comparison of the operating performance of individual communities or groups of communities.
In addition, because prospective buyers of real estate have different financing and overhead structures, with varying marginal impacts to overhead by acquiring real estate, NOI is considered by many in the real estate industry to be a useful measure for determining the value of a real estate asset or group of assets. The Company defines same-property NOI as same-property revenues less same-property operating expenses, including property taxes. Please see the reconciliation of earnings from operations to NOI and same-property NOI, which in the table below is the NOI for stabilized properties consolidated by the Company for the periods presented (Dollars in thousands):
| | | Three Months Ended December 31, | | | Three Months Ended December 31, | | | Twelve Months Ended December 31, | | | Twelve Months Ended December 31, | |
| | | 2020 | | | 2019 | | | 2020 | | | 2019 | |
| Earnings from operations | | $ | 111,931 | | | $ | 116,818 | | | $ | 491,441 | | | $ | 481,112 | |
| Adjustments: | | | | | | | | | | | | | | | | |
| Corporate-level property management expenses | | | 8,549 | | | | 8,616 | | | | 34,573 | | | | 34,067 | |
| Depreciation and amortization | | | 130,127 | | | | 122,908 | | | | 525,497 | | | | 483,750 | |
| Management and other fees from affiliates | | | (2,286 | ) | | | (2,504 | ) | | | (9,598 | ) | | | (9,527 | ) |
| General and administrative | | | 23,144 | | | | 15,531 | | | | 65,388 | | | | 54,262 | |
| Expensed acquisition and investment related costs | | | 1,487 | | | | 99 | | | | 1,591 | | | | 168 | |
| Impairment loss | | | 1,825 | | | | 7,105 | | | | 1,825 | | | | 7,105 | |
| (Gain) loss on sale of real estate and land | | | (25,716 | ) | | | 3,164 | | | | (64,967 | ) | | | 3,164 | |
| NOI | | | 249,061 | | | | 271,737 | | | | 1,045,750 | | | | 1,054,101 | |
| Less: Non-same property NOI | | | (31,988 | ) | | | (22,995 | ) | | | (140,782 | ) | | | (82,644 | ) |
| Same-Property NOI | | $ | 217,073 | | | $ | 248,742 | | | $ | 904,968 | | | $ | 971,457 | |
See Company’s Form 10-K and Form 10-Qs filed with the SEC for additional information
E S S E X P R O P E R T Y T R U S T, I N C.
Reconciliations of Non-GAAP Financial Measures and Other Terms
Public Bond Covenants
Public Bond Covenants refer to certain covenants set forth in instruments governing the Company's unsecured indebtedness. These instruments require the Company to meet specified financial covenants, including covenants relating to net worth, fixed charge coverage, debt service coverage, the amounts of total indebtedness and secured indebtedness, leverage and certain investment limitations. These covenants may restrict the Company's ability to expand or fully pursue its business strategies. The Company's ability to comply with these covenants may be affected by changes in the Company's operating and financial performance, changes in general business and economic conditions, adverse regulatory developments or other events adversely impacting it. The breach of any of these covenants could result in a default under the Company's indebtedness, which could cause those and other obligations to become due and payable. If any of the Company's indebtedness is accelerated, the Company may not be able to repay it. For risks related to failure to comply with these covenants, see "Item 1A: Risk Factors - Risks Related to Our Indebtedness and Financings" in the Company's annual report on Form 10-K and other reports filed by the Company with the Securities and Exchange Commission ("SEC").
The ratios set forth on page S-6 in the section titled "Public Bond Covenants" are provided only to show the Company's compliance with certain specified covenants that are contained in indentures related to the Company's issuance of Senior Notes, which indentures are filed by the Company with the SEC. See, for example, the Indenture dated August 24, 2020, filed by the Company as Exhibit 4.1 to the Company's Form 8-K, filed on August 24, 2020. These ratios should not be used for any other purpose, including without limitation to evaluate the Company's financial condition or results of operations, nor do they indicate the Company's covenant compliance as of any other date or for any other period. The capitalized terms in the disclosure are defined in the indentures filed by the Company with the SEC and may differ materially from similar terms used by other companies that present information about their covenant compliance.
Secured Debt
Secured Debt means debt of the Company or any of its subsidiaries which is secured by an encumbrance on any property or assets of the Company or any of its subsidiaries. The Company's total amount of Secured Debt is set forth on page S-5.
Unencumbered NOI to Adjusted Total NOI
This ratio is presented on page S-6 in the section titled "Selected Credit Ratios". Unencumbered NOI means the sum of NOI for those real estate assets which are not subject to an encumbrance securing debt. The ratio of Unencumbered NOI to Adjusted Total NOI for the three months ended December 31, 2020, annualized, is calculated by dividing Unencumbered NOI, annualized for the three months ended December 31, 2020 and as further adjusted for pro forma NOI for properties acquired or sold during the recent quarter, by Adjusted Total NOI as annualized. The calculation and reconciliation of NOI is set forth in "Net Operating Income ("NOI") and Same-Property NOI Reconciliations" above. This ratio is presented by the Company because it provides rating agencies and investors an additional means of comparing the Company's ability to service debt obligations to that of other companies. The calculation of this ratio is presented in the table below (Dollars in thousands):
| | | | |
| NOI | | $ | 996,244 | |
| Adjustments: | | | | |
| NOI from real estate assets sold or held for sale | | | (5,897 | ) |
Other, net (2) | | | (19,257 | ) |
| Adjusted Total NOI | | | 971,090 | |
| Less: Encumbered NOI | | | (52,735 | ) |
| Unencumbered NOI | | $ | 918,355 | |
| | | | | |
| Encumbered NOI | | $ | 52,735 | |
| Unencumbered NOI | | | 918,355 | |
| Adjusted Total NOI | | $ | 971,090 | |
| | | | | |
| Unencumbered NOI to Adjusted Total NOI | | | 95 | % |
| | (1) | This table is based on the amounts for the most recent quarter, multiplied by four. |
| | (2) | Includes intercompany eliminations pertaining to self-insurance and other expenses. |
See Company’s Form 10-K and Form 10-Qs filed with the SEC for additional information
S-18.4