 |
| Financial highlights | |||||||||||||||||
| in / end of | % change | in / end of | % change | ||||||||||||||
| 2Q08 | 1Q08 | 2Q07 | QoQ | YoY | 6M08 | 6M07 | YoY | ||||||||||
| Net income (CHF million) | |||||||||||||||||
| Net income/(loss) | 1,215 | (2,148) | 3,189 | – | (62) | (933) | 5,918 | – | |||||||||
| Earnings per share (CHF) | |||||||||||||||||
| Basic earnings per share | 1.18 | (2.10) | 3.00 | – | (61) | (0.91) | 5.56 | – | |||||||||
| Diluted earnings per share | 1.12 | (2.10) | 2.82 | – | (60) | (0.91) | 5.24 | – | |||||||||
| Return on equity (%) | |||||||||||||||||
| Return on equity | 13.2 | (20.8) | 29.7 | – | – | (4.8) | 27.4 | – | |||||||||
| Core Results (CHF million) | |||||||||||||||||
| Net revenues | 7,830 | 3,019 | 11,703 | 159 | (33) | 10,849 | 22,372 | (52) | |||||||||
| Provision for credit losses | 45 | 151 | (20) | (70) | – | 196 | 33 | 494 | |||||||||
| Total operating expenses | 6,214 | 5,440 | 7,637 | 14 | (19) | 11,654 | 14,677 | (21) | |||||||||
| Income/(loss) before taxes | 1,571 | (2,572) | 4,086 | – | (62) | (1,001) | 7,662 | – | |||||||||
| Core Results statement of income metrics (%) | |||||||||||||||||
| Cost/income ratio | 79.4 | 180.2 | 65.3 | – | – | 107.4 | 65.6 | – | |||||||||
| Pre-tax income margin | 20.1 | (85.2) | 34.9 | – | – | (9.2) | 34.2 | – | |||||||||
| Effective tax rate | 18.9 | 17.7 | 21.1 | – | – | 15.8 | 22.0 | – | |||||||||
| Net income margin | 15.5 | (71.1) | 27.2 | – | – | (8.6) | 26.5 | – | |||||||||
| Assets under management and net new assets (CHF billion) | |||||||||||||||||
| Assets under management | 1,411.9 | 1,380.5 | 1,629.0 | 2.3 | (13.3) | 1,411.9 | 1,629.0 | (13.3) | |||||||||
| Net new assets | 14.0 | (4.2) | 27.6 | – | – | 9.8 | 70.6 | – | |||||||||
| Balance sheet statistics (CHF million) | |||||||||||||||||
| Total assets | 1,229,825 | 1,207,994 | 1,415,174 | 2 | (13) | 1,229,825 | 1,415,174 | (13) | |||||||||
| Net loans | 234,731 | 229,168 | 224,222 | 2 | 5 | 234,731 | 224,222 | 5 | |||||||||
| Total shareholders' equity | 36,848 | 37,639 | 43,849 | (2) | (16) | 36,848 | 43,849 | (16) | |||||||||
| Book value per share outstanding (CHF) | |||||||||||||||||
| Total book value per share | 35.99 | 37.14 | 41.90 | (3) | (14) | 35.99 | 41.90 | (14) | |||||||||
| Tangible book value per share 1 | 25.84 | 27.15 | 30.82 | (5) | (16) | 25.84 | 30.82 | (16) | |||||||||
| Shares outstanding (million) | |||||||||||||||||
| Common shares issued | 1,174.2 | 1,162.5 | 1,215.9 | 1 | (3) | 1,174.2 | 1,215.9 | (3) | |||||||||
| Treasury shares | (150.5) | (149.0) | (169.4) | 1 | (11) | (150.5) | (169.4) | (11) | |||||||||
| Shares outstanding | 1,023.7 | 1,013.5 | 1,046.5 | 1 | (2) | 1,023.7 | 1,046.5 | (2) | |||||||||
| Market capitalization | |||||||||||||||||
| Market capitalization (CHF million) | 52,740 | 56,251 | 100,221 | (6) | (47) | 52,740 | 100,221 | (47) | |||||||||
| Market capitalization (USD million) | 50,952 | 56,618 | 81,416 | (10) | (37) | 50,952 | 81,416 | (37) | |||||||||
| BIS statistics | |||||||||||||||||
| Risk-weighted assets (CHF million) 2 | 301,817 | 301,009 | 296,416 | 0 | 2 | 301,817 | 296,416 | 2 | |||||||||
| Tier 1 ratio (%) 2 | 10.2 | 9.8 | 13.0 | – | – | 10.2 | 13.0 | – | |||||||||
| Total capital ratio (%) 2 | 14.3 | 13.6 | 16.3 | – | – | 14.3 | 16.3 | – | |||||||||
| Number of employees (full-time equivalents) | |||||||||||||||||
| Number of employees | 49,000 | 48,700 | 45,600 | 1 | 7 | 49,000 | 45,600 | 7 | |||||||||
| 1 Based on tangible shareholders' equity, which is calculated by deducting goodwill and other intangible assets from total shareholders' equity. Management believes that the return on tangible shareholders' equity is meaningful as it allows consistent measurement of the performance of businesses without regard to whether the businesses were acquired. 2 Under Basel II from January 1, 2008. Prior periods are reported under Basel I and are therefore not comparable. For further information, refer to IV – Treasury and Risk management – Treasury management. | |||||||||||||||||
Dear shareholders |
 |
| Brady W. Dougan, Chief Executive Officer (left), Walter B. Kielholz, Chairman of the Board of Directors. |
| The operating environment remained difficult in the second quarter of 2008 as the credit crisis continued to have far-reaching effects on global capital markets and the financial industry. Against this backdrop, we are pleased to report net income of CHF 1,215 million. Core net revenues were CHF 7,830 million. Given market conditions, these are solid results that demonstrate the resilience and earnings power of our business model and our success in reducing our risk exposures. |
| Private Banking recorded net new assets of CHF 17.4 billion, including strong net new assets of CHF 15.4 billion from Wealth Management. Corporate & Retail Banking in Switzerland also continued to perform well. Investment Banking delivered a solid operating performance, with pre-tax income of CHF 281 million. Asset Management returned to profitability. |
| During the second quarter, we continued to benefit from our conservative funding structure and our position as one of the world’s best capitalized banks. At the end of the second quarter, our tier 1 capital ratio under Basel II stood at 10.2%. We achieved this without having to raise dilutive equity capital and while accruing a significant dividend. |
| Net writedowns in Investment Banking were immaterial at CHF 22 million. As we have done since the beginning of the credit crisis, we continued to make progress in reducing our risk exposures, which are now approaching more normal levels. Our total exposure in Investment Banking declined by 31% in leveraged finance and by 22% in commercial mortgages during the second quarter. |
| We generated CHF 1.3 billion in revenues from cross-divisional activities in the second quarter, as client demand for comprehensive financial solutions continued to increase. These revenues include the results of initiatives to develop new products and distribute them through our own channels and to tap important market opportunities. We also saw increased non-transaction-related referrals of clients from Investment Banking to Private Banking, which we expect to continue. |
| As part of our focus on efficiency, over the past few years we have reduced the level of non-compensation costs in Investment Banking and have established our network of global operating hubs – Centers of Excellence – in low-cost locations. As a result, we were a more efficient and flexible organization well before market conditions deteriorated. Enhancing operating efficiency and active cost management remain strategic priorities for Credit Suisse. |
| We have adapted swiftly to the changing environment and have continued to invest in growth while managing our cost base. In Private Banking we continue to invest in our Wealth Management business globally. In the second quarter we hired 120 relationship managers, including several leading teams. In Investment Banking, we are rebalancing our businesses by shifting our resources to take advantage of areas with robust growth opportunities, such as prime services and derivatives. |
| We believe that the consistency and clarity of our strategic direction is an advantage at a time when many competitors are questioning their business models. The fundamental changes underway within the financial industry provide us with unprecedented opportunities. However, our focus remains on organic growth and we will manage our resources and our balance sheet prudently, even as we accelerate the execution of our strategy. We will continue to invest in the growth of Private Banking; further diversify the business mix and revenue streams and improve capital efficiency in Investment Banking; and enhance the financial performance of Asset Management and align it more closely with our other two divisions. |
| Market developments over the past year have inevitably led to a reassessment of regulation for our industry. Although Credit Suisse has operated successfully within the current regulatory framework, we understand the need to explore further measures to safeguard the stability of the financial system. We are actively participating in these discussions and want to contribute to a set of revised rules that will support this stability while ensuring our competitiveness. |
| We expect challenging market conditions to persist in the near to medium term. Accordingly, we will continue to manage our business conservatively. Credit Suisse is in a strong position, financially and competitively. When opportunities emerge, our disciplined approach will enable us to seize and realize them. |
| Credit Suisse’s resilience in difficult markets and our integrated model and clear strategy are distinct advantages that we intend to build on. We are encouraged by the strong results in Private Banking and the sound performance of Investment Banking. Our strong capital position and conservative funding structure continue to differentiate Credit Suisse and provide us with a solid foundation for growth. But our most important advantage remains our people and their commitment to creating value through collaboration. We want to thank them for their exceptional efforts on behalf of our clients and our shareholders. |
| Yours sincerely |
| Walter B. Kielholz Brady W. Dougan |
| July 2008 |
 |
Dear shareholders
Credit Suisse at a glance
I – Credit Suisse results
Operating environment
Credit Suisse
Core Results
Key performance indicators
II – Results by division
Private Banking
Wealth Management
Corporate & Retail Banking
Investment Banking
Asset Management
III – Overview of Results and Assets under Management
Results
Assets under Management
IV – Treasury and Risk management
Treasury management
Risk management
V – Condensed consolidated financial statements – unaudited
Report of Independent Registered Public Accounting Firm
Condensed consolidated financial statements – unaudited
Notes to the condensed consolidated financial statements – unaudited
Note 1 Summary of significant accounting policies
Note 2 Business developments
Note 3 Segment reporting
Note 4 Net interest income
Note 5 Commissions and fees
Note 6 Other revenues
Note 7 Provision for credit losses
Note 8 Compensation and benefits
Note 9 General and administrative expenses
Note 10 Earnings per share
Note 11 Trading assets and liabilities
Note 12 Loans
Note 13 Other assets and liabilities
Note 14 Long-term debt
Note 15 Accumulated other comprehensive income
Note 16 Tax
Note 17 Employee share-based compensation and other benefits
Note 18 Pension
Note 19 Guarantees and commitments
Note 20 Variable interest entities
Note 21 Fair value of financial instruments
Note 22 Subsidiary guarantee information
Note 23 Litigation
VI – Investor information
Investor information
| For purposes of this report, unless the context otherwise requires, the terms “Credit Suisse,” “the Group,” “we,” “us” and “our” mean Credit Suisse Group AG and its consolidated subsidiaries. The business of Credit Suisse, the Swiss bank subsidiary of the Group, is substantially similar to the Group, and we use these terms to refer to both when the subject is the same or substantially similar. We use the term “the Bank” when we are only referring to Credit Suisse, the Swiss bank subsidiary of the Group, and its consolidated subsidiaries. |
| In various tables, use of “–” indicates not meaningful or not applicable. |
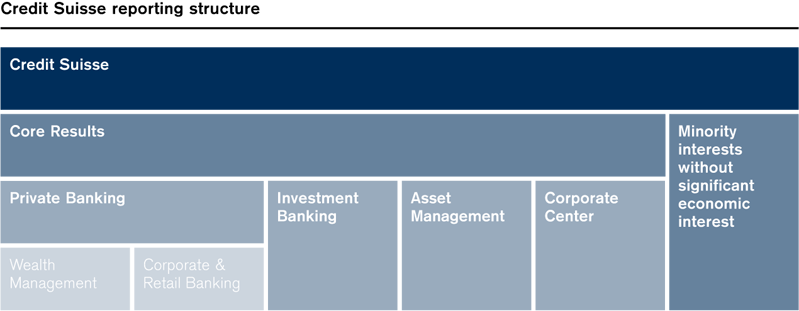
Credit Suisse at a glance |
Credit Suisse |
| As one of the world’s leading financial services providers, we are committed to delivering our combined financial experience and expertise to corporate, institutional and government clients and high-net-worth individuals worldwide, as well as to retail clients in Switzerland. We serve our diverse clients through our three divisions, which cooperate closely to provide holistic financial solutions based on innovative products and specially tailored advice. Founded in 1856, we have a truly global reach today, with operations in over 50 countries and a team of around 49,000 employees from approximately 100 different nations. |
Private Banking |
| In Private Banking, we offer comprehensive advice and a broad range of wealth management solutions, including pension planning, life insurance products, tax planning and wealth and inheritance advice, which are tailored to the needs of high-net-worth individuals worldwide. In Switzerland, we supply banking products and services to high-net-worth, corporate and retail clients. |
Investment Banking |
| In Investment Banking, we offer investment banking and securities products and services to corporate, institutional and government clients around the world. Our products and services include debt and equity underwriting, sales and trading, mergers and acquisitions advice, divestitures, corporate sales, restructuring and investment research. |
Asset Management |
| In Asset Management, we offer integrated investment solutions and services to institutions, governments and private clients globally. We provide access to the full range of investment classes, ranging from equity and fixed income products and multi-asset class solutions to alternative investments such as private equity, real estate and hedge funds. |
I – Credit Suisse results |
Operating environment |
Credit Suisse |
Core Results |
Key performance indicators |
Operating environment |
| The operating environment in 2Q08 remained challenging given the ongoing deterioration in the mortgage and credit markets and its continued contagion to other sectors and asset classes. June in particular was characterized by a spike in the price of oil, stronger-than-expected gross domestic product (GDP) growth data in certain markets and indications of rising inflation. Comments from the United States Federal Reserve (Fed) and the European Central Bank (ECB) regarding interest rates resulted in volatile markets, especially bond and currency markets. |
Economic environment |
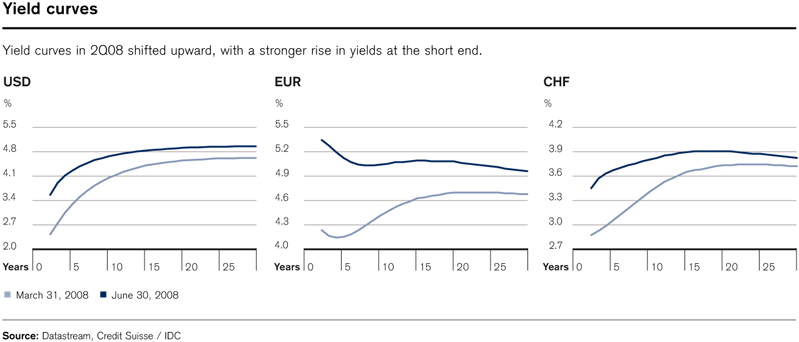
| In 2Q08, we observed a substantial shift in the market assessment of both growth and inflation risks. With stronger than expected growth both in the US and Europe, investors moved from recession fears and focused on inflation, driven by concern over the increasing price of energy and agricultural products. Central banks globally shifted their risk assessment. While the Fed cut rates in April, its June assessment of monetary policy stressed the risks of inflation. The market re-priced US rate expectations, and this contributed to an upward shift in the yield curve with a stronger rise in yields at the short end, resulting in a flattening yield curve. The change in tone was even more pronounced in European countries. The ECB in particular emphasized its mandate to review inflationary trends and its willingness to slow growth to ensure that inflation remains in a moderate range. Over 2Q08, this brought strong upward pressure on yields in European countries (refer to the chart “Yield curves”). |
| The euro stayed within a narrow trading range against the US dollar. The Swiss franc was also relatively stable against the US dollar, while depreciating slightly against the euro. |
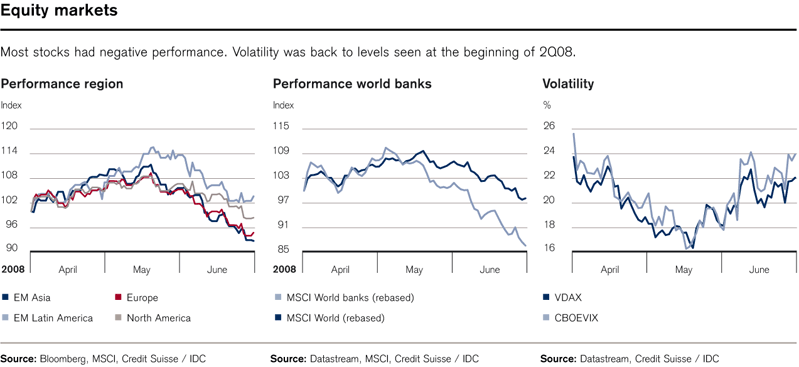
| Most equity markets continued their downward trend from 1Q08. Performance was mixed during 2Q08, with European and Asian stocks generally performing worse than markets in North America and Latin America (refer to the chart "Equity markets"). Equity volatility decreased from the very high March levels, but increased again in June due to inflation concerns. |
| In emerging markets, the demand for commodities remained strong given the continued solid growth in these markets. However, increasing inflation posed the risk of a slowdown in growth, which was addressed by increased interest rates (e.g. Brazil, Indonesia, Russia) and a reduction in fuel subsidies or increased regulated prices (e.g. China, India, Malaysia, Indonesia). |
 |
 |
 |
Sector environment |
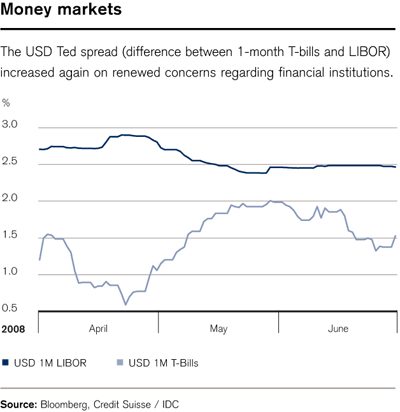
| In 2Q08, investor focus moved from short-term systemic credit risk to concern about the longer-term effects of the credit turmoil and the commodities price shock. Inflation concerns, in particular at the end of the quarter, increased volatility in the bond and equity markets. Credit spreads narrowed in 2Q08 until the end of May but began widening again significantly in June. |
| Falling housing prices and rising non-performing loans since 2Q07 contributed to an economic slowdown in the US. In Switzerland, the environment for financial institutions remained favorable, with a continued solid economy, good consumer confidence and low default rates. |
| After significant writedowns and increased credit provisions, capital increases in the banking sector continued at high levels, and this put additional pressure on the sector’s share valuations. Regulators continued to discuss potential regulatory changes for the banking sector, focusing on capital, balance sheet leverage ratios and increased transparency of risk positions and off-balance sheet exposures. |
| Market activity was mixed, with global and European equity trading volume down year-on-year as well as quarter-on-quarter. Global and European fixed income trading volume was higher year-on-year and almost unchanged in Europe in comparison to 1Q08. Globally, quarter-on-quarter fixed income trading volume was down. Announced mergers and acquisitions volumes showed an increase of 21% compared to 1Q08. However, with a slowdown in Western European markets, European volumes declined in the quarter. Completed mergers and acquisitions showed lower volumes in both global and European markets quarter-on-quarter as well as year-on-year. Equity and debt underwriting globally and in Europe were down year-on-year and up quarter-on-quarter. The global fee pool increased in 2Q08 compared to 1Q08, but reflected a slowdown from the prior-year period. |
| The wealth management sector continued its growth, but at a slower pace given lower transaction volumes and a reduction in assets under management, primarily reflecting adverse market and foreign exchange-related movements. Investor sentiment remained defensive due to the ongoing uncertain economic and financial market outlook. |
| Market volumes (growth in %) | |||||||||
| Global | Europe | ||||||||
| QoQ | YoY | QoQ | YoY | ||||||
| Equity trading volume 1 | (15.8) | (4.0) | (17.2) | (10.2) | |||||
| Fixed income trading volume 2 | (7.6) | 8.1 | 1.7 | 16.6 | |||||
| Announced mergers and acquisitions 3 | 21.0 | (24.6) | (8.8) | (37.9) | |||||
| Completed mergers and acquisitions 3 | (29.4) | (28.5) | (12.2) | (20.9) | |||||
| Equity underwriting 3 | 77.5 | (20.2) | 255.1 | (23.1) | |||||
| Debt underwriting 3 | 45.2 | (17.5) | 63.9 | (15.5) | |||||
| Syndicated lending - investment grade 3 | (27.8) | (32.3) | – | – | |||||
| 1 LSE, Borsa Italiana, Deutsche Börse, BME, SWX Europe, NYSE Euronext, NASDAQ 2 Deutsche Börse, Federal Reserve Bank of New York 3 Dealogic | |||||||||
Credit Suisse |
| We recorded net income of CHF 1,215 million in 2Q08, with strong performance and net new assets in Private Banking, solid operating results in Investment Banking and a return to profitability in Asset Management. We further reduced our risk exposures and maintained a strong capital base. |
| Results | |||||||||||||||||
| in / end of | % change | in / end of | % change | ||||||||||||||
| 2Q08 | 1Q08 | 2Q07 | QoQ | YoY | 6M08 | 6M07 | YoY | ||||||||||
| Statements of income (CHF million) | |||||||||||||||||
| Net interest income | 1,860 | 2,106 | 2,249 | (12) | (17) | 3,966 | 4,338 | (9) | |||||||||
| Commissions and fees | 4,197 | 3,933 | 5,242 | 7 | (20) | 8,130 | 10,219 | (20) | |||||||||
| Trading revenues | 900 | (1,777) | 3,810 | – | (76) | (877) | 7,026 | – | |||||||||
| Other revenues | 1,180 | (1,167) | 1,736 | – | (32) | 13 | 3,074 | (100) | |||||||||
| Net revenues | 8,137 | 3,095 | 13,037 | 163 | (38) | 11,232 | 24,657 | (54) | |||||||||
| Provision for credit losses | 45 | 151 | (20) | (70) | – | 196 | 33 | 494 | |||||||||
| Compensation and benefits | 4,076 | 3,264 | 5,409 | 25 | (25) | 7,340 | 10,359 | (29) | |||||||||
| General and administrative expenses | 1,565 | 1,585 | 1,619 | (1) | (3) | 3,150 | 3,151 | 0 | |||||||||
| Commission expenses | 610 | 624 | 642 | (2) | (5) | 1,234 | 1,251 | (1) | |||||||||
| Total other operating expenses | 2,175 | 2,209 | 2,261 | (2) | (4) | 4,384 | 4,402 | 0 | |||||||||
| Total operating expenses | 6,251 | 5,473 | 7,670 | 14 | (19) | 11,724 | 14,761 | (21) | |||||||||
| Income/(loss) before taxes | 1,841 | (2,529) | 5,387 | &ndas h; | (66) | (688) | 9,863 | – | |||||||||
| Income tax expense/(benefit) | 297 | (455) | 863 | – | (66) | (158) | 1,685 | – | |||||||||
| Minority interests | 329 | 74 | 1,335 | 345 | (75) | 403 | 2,260 | (82) | |||||||||
| Net income/(loss) | 1,215 | (2,148) | 3,189 | – | (62) | (933) | 5,918 | – | |||||||||
| Earnings per share (CHF) | |||||||||||||||||
| Basic earnings per share | 1.18 | (2.10) | 3.00 | – | (61) | (0.91) | 5.56 | – | |||||||||
| Diluted earnings per share | 1.12 | (2.10) | 2.82 | – | (60) | (0.91) | 5.24 | – | |||||||||
| Return on equity (%) | |||||||||||||||||
| Return on equity | 13.2 | (20.8) | 29.7 | – | – | (4.8) | 27.4 | – | |||||||||
| Return on tangible equity 1 | 18.5 | (28.1) | 40.6 | – | – | (6.6) | 37.4 | – | |||||||||
| BIS statistics | |||||||||||||||||
| Risk-weighted assets (CHF million) 2 | 301,817 | 301,009 | 296,416 | 0 | 2 | 301,817 | 296,416 | 2 | |||||||||
| Tier 1 capital (CHF million) 2 | 30,795 | 29,361 | 38,617 | 5 | (20) | 30,795 | 38,617 | (20) | |||||||||
| Total capital (CHF million) 2 | 43,145 | 41,077 | 48,362 | 5 | (11) | 43,145 | 48,362 | (11) | |||||||||
| Tier 1 ratio (%) 2 | 10.2 | 9.8 | 13.0 | – | – | 10.2 | 13.0 | – | |||||||||
| Total capital ratio (%) 2 | 14.3 | 13.6 | 16.3 | – | – | 14.3 | 16.3 | – | |||||||||
| Number of employees (full-time equivalents) | |||||||||||||||||
| Number of employees | 49,000 | 48,700 | 45,600 | 1 | 7 | 49,000 | 45,600 | 7 | |||||||||
| 1 Based on tangible shareholders' equity, which is calculated by deducting goodwill and other intangible assets from total shareholders' equity. Management believes that the return on tangible shareholders' equity is meaningful as it allows consistent measurement of the performance of businesses without regard to whether the businesses were acquired. 2 Under Basel II from January 1, 2008. Prior periods are reported under Basel I and are therefore not comparable. For further information, refer to IV – Treasury and Risk management – Treasury management. | |||||||||||||||||
Results summary |
| In 2Q08, net income was CHF 1,215 million, down significantly compared to net income of CHF 3,189 million in the strong 2Q07, but substantially improved compared to the net loss of CHF 2,148 million in 1Q08. Private Banking continued to deliver good results in both Wealth Management and Corporate & Retail Banking, and had strong asset gathering. Investment Banking improved substantially from 1Q08, with solid results in most businesses while reflecting a small combined net valuation reduction in the structured products and leveraged finance businesses and fair value losses on Credit Suisse debt. We continued to manage down our exposures to assets most significantly impacted by the dislocation in the mortgage and credit markets. Asset Management returned to profitability during the quarter. The decrease in the income tax expense was primarily due to the lower results compared to 2Q07. The 2Q08 income tax expense reflecte d the negative impact of the geographical mix of results and the negative effect of increased valuation allowances on the recognition of deferred tax assets in certain jurisdictions. These two effects were partly offset by the net release of CHF 146 million of tax contingency accruals following the favorable resolution of certain tax matters. |
| Diluted earnings per share in 2Q08 were CHF 1.12 compared to CHF 2.82 in 2Q07 and a loss of CHF 2.10 in 1Q08. Return on equity was 13.2%, compared to 29.7% in 2Q07 and (20.8)% in 1Q08. |
Capital trends |
| Our capital position remained strong. Our consolidated BIS tier 1 ratio under Basel II was 10.2% as of the end of 2Q08, compared to 9.8% as of the end of 1Q08, reflecting increased tier 1 capital. |
| At the Annual General Meeting (AGM) on May 4, 2007, the shareholders approved a share buyback program of up to CHF 8 billion, which runs through 2010. During 2Q08, no common shares were repurchased. As of July 23, 2008, we had repurchased shares for CHF 4.1 billion, or 52%, of the approved CHF 8 billion. |
| For further information, refer to IV – Treasury and Risk management – Treasury management. |
Core Results |
| Core Results include the results of our three segments and the Corporate Center. Credit Suisse’s results also include revenues and expenses from the consolidation of certain private equity funds and other entities in which we do not have a significant economic interest (SEI) in such revenues and expenses. The consolidation of these entities does not affect net income as the amounts recorded in net revenues and total operating expenses are offset by corresponding amounts reported as minority interests. In addition, our income tax expense is not affected by these revenues and expenses. These minority interest-related revenues and expenses are reported as “Minority interests without SEI” in the “Credit Suisse and Core Results” table. |
| Corporate Center includes parent company operations such as Group financing, expenses for projects sponsored by the Group and certain expenses that have not been allocated to the segments. In addition, Corporate Center includes consolidation and elimination adjustments required to eliminate intercompany revenues and expenses. |
| Certain reclassifications have been made to prior periods to conform to the current presentation. |
 |
| Credit Suisse and Core Results | |||||||||||||||||||
| Core Results | Minority interests without SEI | Credit Suisse | |||||||||||||||||
| in the period | 2Q08 | 1Q08 | 2Q07 | 2Q08 | 1Q08 | 2Q07 | 2Q08 | 1Q08 | 2Q07 | ||||||||||
| Statements of income (CHF million) | |||||||||||||||||||
| Net revenues | 7,830 | 3,019 | 11,703 | 307 | 76 | 1,334 | 8,137 | 3,095 | 13,037 | ||||||||||
| Provision for credit losses | 45 | 151 | (20) | 0 | 0 | 0 | 45 | 151 | (20) | ||||||||||
| Compensation and benefits | 4,061 | 3,245 | 5,386 | 15 | 19 | 23 | 4,076 | 3,264 | 5,409 | ||||||||||
| General and administrative expenses | 1,543 | 1,571 | 1,609 | 22 | 14 | 10 | 1,565 | 1,585 | 1,619 | ||||||||||
| Commission expenses | 610 | 624 | 642 | 0 | 0 | 0 | 610 | 624 | 642 | ||||||||||
| Total other operating expenses | 2,153 | 2,195 | 2,251 | 22 | 14 | 10 | 2,175 | 2,209 | 2,261 | ||||||||||
| Total operating expenses | 6,214 | 5,440 | 7,637 | 37 | 33 | 33 | 6,251 | 5,473 | 7,670 | ||||||||||
| Income/(loss) before taxes | 1,571 | (2,572) | 4,086 | 270 | 43 | 1,301 | 1,841 | (2,529) | 5,387 | ||||||||||
| Income tax expense/(benefit) | 297 | (455) | 863 | 0 | 0 | 0 | 297 | (455) | 863 | ||||||||||
| Minority interests | 59 | 31 | 34 | 270 | 43 | 1,301 | 329 | 74 | 1,335 | ||||||||||
| Net income/(loss) | 1,215 | (2,148) | 3,189 | 0 | 0 | 0 | 1,215 | (2,148) | 3,189 | ||||||||||
| Statement of income metrics (%) | |||||||||||||||||||
| Compensation/revenue ratio | 51.9 | 107.5 | 46.0 | – | – | – | 50.1 | 105.5 | 41.5 | ||||||||||
| Non-compensation/revenue ratio | 27.5 | 72.7 | 19.2 | – | – | – | 26.7 | 71.4 | 17.3 | ||||||||||
| Cost/income ratio | 79.4 | 180.2 | 65.3 | – | – | – | 76.8 | 176.8 | 58.8 | ||||||||||
| Pre-tax income margin | 20.1 | (85.2) | 34.9 | – | – | – | 22.6 | (81.7) | 41.3 | ||||||||||
| Effective tax rate | 18.9 | 17.7 | 21.1 | – | – | – | 16.1 | 18.0 | 16.0 | ||||||||||
| Net income margin | 15.5 | (71.1) | 27.2 | – | – | – | 14.9 | (69.4) | 24.5 | ||||||||||
Remediation developments on certain internal control matters |
| We continue to implement our remediation plan with respect to internal controls over the valuation of certain asset-backed securities (ABS) positions in the collateralized debt obligations (CDO) trading business within Investment Banking. We have performed alternative procedures regarding the valuations of these positions in our CDO trading business and are confident that, as a result of the alternative procedures performed, our financial statements in this report are fairly presented, in all material respects, in accordance with accounting principles generally accepted in the US. |
Core Results |
| In 2Q08, we achieved net income of CHF 1,215 million, reflecting profitability in all three of our divisions. This result demonstrates the resilience and earnings power of our business model in an operating environment that remained difficult. |
| Results | |||||||||||||||||
| in | % change | in / end of | % change | ||||||||||||||
| 2Q08 | 1Q08 | 2Q07 | QoQ | YoY | 6M08 | 6M07 | YoY | ||||||||||
| Statements of income (CHF million) | |||||||||||||||||
| Net interest income | 1,834 | 2,076 | 2,224 | (12) | (18) | 3,910 | 4,283 | (9) | |||||||||
| Commissions and fees | 4,174 | 3,918 | 5,268 | 7 | (21) | 8,092 | 10,263 | (21) | |||||||||
| Trading revenues | 891 | (1,777) | 3,811 | – | (77) | (886) | 7,026 | – | |||||||||
| Other revenues | 931 | (1,198) | 400 | – | 133 | (267) | 800 | – | |||||||||
| Net revenues 1, 2 | 7,830 | 3,019 | 11,703 | 159 | (33) | 10,849 | 22,372 | (52) | |||||||||
| Provision for credit losses | 45 | 151 | (20) | (70) | – | 196 | 33 | 494 | |||||||||
| Compensation and benefits | 4,061 | 3,245 | 5,386 | 25 | (25) | 7,306 | 10,292 | (29) | |||||||||
| General and administrative expenses | 1,543 | 3 | 1,571 | 1,609 | (2) | (4) | 3,114 | 3 | 3,134 | (1) | |||||||
| Commission expenses | 610 | 624 | 642 | (2) | (5) | 1,234 | 1,251 | (1) | |||||||||
| Total other operating expenses | 2,153 | 2,195 | 2,251 | (2) | (4) | 4,348 | 4,385 | (1) | |||||||||
| Total operating expenses | 6,214 | 5,440 | 7,637 | 14 | (19) | 11,654 | 14,677 | (21) | |||||||||
| Income/(loss) before taxes | 1,571 | (2,572) | 4,086 | &ndas h; | (62) | (1,001) | 7,662 | – | |||||||||
| Income tax expense/(benefit) | 297 | (455) | 863 | – | (66) | (158) | 1,685 | – | |||||||||
| Minority interests | 59 | 31 | 34 | 90 | 74 | 90 | 59 | 53 | |||||||||
| Net income/(loss) | 1,215 | (2,148) | 3,189 | – | (62) | (933) | 5,918 | – | |||||||||
| Statement of income metrics (%) | |||||||||||||||||
| Compensation/revenue ratio | 51.9 | 107.5 | 46.0 | – | – | 67.3 | 46.0 | – | |||||||||
| Non-compensation/revenue ratio | 27.5 | 72.7 | 19.2 | – | – | 40.1 | 19.6 | – | |||||||||
| Cost/income ratio | 79.4 | 180.2 | 65.3 | – | – | 107.4 | 65.6 | – | |||||||||
| Pre-tax income margin | 20.1 | (85.2) | 34.9 | – | – | (9.2) | 34.2 | – | |||||||||
| Effective tax rate | 18.9 | 17.7 | 21.1 | – | – | 15.8 | 22.0 | – | |||||||||
| Net income margin | 15.5 | (71.1) | 27.2 | – | – | (8.6) | 26.5 | – | |||||||||
| Risk metrics (CHF million) | |||||||||||||||||
| Position risk | 10,989 | 11,108 | 11,497 | (1) | (4) | 10,989 | 11,497 | (4) | |||||||||
| VaR (average) | 193 | 194 | 110 | (1) | 75 | – | – | – | |||||||||
| Number of employees (full-time equivalents) | |||||||||||||||||
| Number of employees | 49,000 | 48,700 | 45,600 | 1 | 7 | 49,000 | 45,600 | 7 | |||||||||
| 1 Includes valuation gains/(reductions) in Asset Management of CHF 79 million, CHF (566) million and CHF (487) million in 2Q08, 1Q08 and 6M08, respectively, from securities purchased from our money market funds. 2 Includes combined net valuation reductions in Investment Banking of CHF 22 million, CHF 5,281 million and CHF 5,303 million in 2Q08, 1Q08 and 6M08, respectively, relating to leveraged finance and structured products. 3 Includes a net credit pertaining to litigation in Investment Banking of CHF 134 million. | |||||||||||||||||
| Core Results include the results of our integrated banking organization and exclude revenues and expenses in respect of minority interests in which we do not have significant economic interest. |
Results summary |
| In 2Q08, net income was CHF 1,215 million, compared to net income of CHF 3,189 million in a strong 2Q07. Net revenues were CHF 7,830 million, down CHF 3,873 million, or 33%, compared to 2Q07, while total operating expenses were CHF 6,214 million, down CHF 1,423 million, or 19%. |
| Our Core Results for 2Q08 reflected the benefits of our business model. In Private Banking, we achieved continued strong profitability and strong asset gathering, demonstrating the resilience of this business in the challenging operating environment. In Investment Banking, we achieved solid results in most businesses outside of the structured products and leveraged finance businesses, which included a small combined net valuation reduction. We continued to manage down our exposures to assets most significantly impacted by the dislocation in the mortgage and credit markets. Asset Management returned to profitability during the quarter and we continued to reduce exposures from securities purchased from our money market funds. Our results also included fair value losses on Credit Suisse debt, substantially all of which were recorded in Investment Banking. |
| Total operating expenses decreased compared to 2Q07, mainly due to significantly lower performance-related compensation, reflecting the lower results. The decrease in the income tax expense was primarily due to the lower results compared to 2Q07. The 2Q08 income tax expense reflected the negative impact of the geographical mix of results and the negative effect of increased valuation allowances on the recognition of deferred tax assets in certain jurisdictions. These two effects were partly offset by the net release of CHF 146 million of tax contingency accruals following the favorable resolution of certain tax matters. |
| Assets under management were CHF 1,411.9 billion as of the end of 2Q08, an increase of CHF 31.4 billion, or 2.3%, compared to the end of 1Q08, reflecting favorable foreign exchange-related movements and strong net new assets inflows, partially offset by adverse market movements. We had net new asset inflows of CHF 14.0 billion, primarily reflecting inflows of CHF 17.4 billion in Private Banking, including CHF 15.4 billion in Wealth Management and CHF 2.0 billion in Corporate & Retail Banking, and outflows of CHF 3.8 billion in Asset Management. |
Risk trends |
| In 2Q08, our overall position risk, measured on the basis of our economic risk capital model, decreased 1% compared to 1Q08, mainly due to reductions in fixed income trading and international lending and counterparty exposures position risks, mostly offset by an increase in equity trading and investments position risk. Average Value-at-Risk (VaR) for the Group’s trading books was stable at CHF 193 million compared to CHF 194 million in 1Q08. |
| For further information on risk trends, refer to IV – Treasury and Risk management – Risk management. |
Fair valuations |
| Fair value is considered the most relevant measurement for financial instruments as it provides more transparency than a historical cost-based model valuation and aligns the accounting for these financial instruments with how we manage our business. For further information, refer to Note 1 – Summary of significant accounting policies and Note 21 – Fair value of financial instruments in V – Condensed consolidated financial statements – unaudited. |
| As of the end of 2Q08, 60% and 42% of our total assets and total liabilities, respectively, were measured at fair value. As of the end of both 2Q08 and 1Q08, 7% and 3% of total assets and total liabilities were recorded as level 3, respectively. As of the end of 2Q08, 13% and 6% of those assets and liabilities measured at fair value were recorded as level 3, respectively, compared to 12% and 7%, respectively, as of the end of 1Q08. |
| While the majority of our level 3 assets are recorded in Investment Banking, some are recorded in Asset Management, specifically certain private equity investments. The increase in total assets recorded as level 3 was largely driven by increased derivatives in the energy business, new lending in emerging markets and increased equity derivatives, partly offset by decreased commercial mortgage-backed securities (CMBS), CDO assets and residential mortgage-backed securities (RMBS). The percentage increase was also impacted by the increase in total assets. Models were used to value these products. Models are developed internally and are reviewed by functions independent of the front office to ensure they are appropriate for current market conditions. The models require subjective assessment and varying degrees of judgment depending on liquidity, concentration, pricing assumptions and risks affecting the specific instrument. The models consider observable and unobservable parameters in calculating the value of these products, including certain indices relating to these products, which were extremely volatile during 2Q08, particularly in June. Consideration of these indices has become more significant in our valuation techniques as the market for these products has become less active. |
| For a description of our valuation techniques, refer to Note 33 – Financial instruments in V – Consolidated financial statements – Credit Suisse Group in the Credit Suisse Annual Report 2007. There were no changes to our valuation techniques from those described in our annual report. |
| For all transfers to level 3, we determine and disclose as level 3 events any gains or losses as measured from the first day of the reporting period, even if the transfer occurred subsequent to the first day of the reporting period. For all transfers out of level 3, we determine and disclose as level 3 events any gains or losses through the last day of the reporting period, even if the transfer occurred prior to the last day of the reporting period. We believe this provides greater transparency over the financial impact of our level 3 assets and liabilities. We believe that the range of any valuation uncertainty, in the aggregate, would not be material to our financial condition. |
| For further information, refer to II – Results by division – Investment Banking. |
| Core Results reporting by division | |||||||||||||||||
| in / end of | % change | in / end of | % change | ||||||||||||||
| 2Q08 | 1Q08 | 2Q07 | QoQ | YoY | 6M08 | 6M07 | YoY | ||||||||||
| Net revenues (CHF million) | |||||||||||||||||
| Wealth Management | 2,278 | 2,313 | 2,384 | (2) | (4) | 4,591 | 4,763 | (4) | |||||||||
| Corporate & Retail Banking | 987 | 1,042 | 969 | (5) | 2 | 2,029 | 1,956 | 4 | |||||||||
| Private Banking | 3,265 | 3,355 | 3,353 | (3) | (3) | 6,620 | 6,719 | (1) | |||||||||
| Investment Banking | 3,740 | (489) | 7,538 | – | (50) | 3,251 | 14,120 | (77) | |||||||||
| Asset Management | 739 | 63 | 853 | – | (13) | 802 | 1,629 | (51) | |||||||||
| Corporate Center | 86 | 90 | (41) | (4) | – | 176 | (96) | – | |||||||||
| Net revenues | 7,830 | 3,019 | 11,703 | 159 | (33) | 10,849 | 22,372 | (52) | |||||||||
| Provision for credit losses (CHF million) | |||||||||||||||||
| Wealth Management | 0 | 4 | (1) | (100) | 100 | 4 | 2 | 100 | |||||||||
| Corporate & Retail Banking | (5) | (9) | (28) | (44) | (82) | (14) | (38) | (63) | |||||||||
| Private Banking | (5) | (5) | (29) | 0 | (83) | (10) | (36) | (72) | |||||||||
| Investment Banking | 50 | 156 | 9 | (68) | 456 | 206 | 70 | 194 | |||||||||
| Asset Management | 0 | 0 | 0 | – | – | 0 | 0 | – | |||||||||
| Corporate Center | 0 | 0 | 0 | – | – | 0 | (1) | 100 | |||||||||
| Provision for credit losses | 45 | 151 | (20) | (70) | – | 196 | 33 | 494 | |||||||||
| Total operating expenses (CHF million) | |||||||||||||||||
| Wealth Management | 1,448 | 1,449 | 1,384 | 0 | 5 | 2,897 | 2,772 | 5 | |||||||||
| Corporate & Retail Banking | 602 | 587 | 617 | 3 | (2) | 1,189 | 1,163 | 2 | |||||||||
| Private Banking | 2,050 | 2,036 | 2,001 | 1 | 2 | 4,086 | 3,935 | 4 | |||||||||
| Investment Banking | 3,409 | 2,815 | 5,027 | 21 | (32) | 6,224 | 9,558 | (35) | |||||||||
| Asset Management | 572 | 531 | 554 | 8 | 3 | 1,103 | 1,073 | 3 | |||||||||
| Corporate Center | 183 | 58 | 55 | 216 | 233 | 241 | 111 | 117 | |||||||||
| Total operating expenses | 6,214 | 5,440 | 7,637 | 14 | (19) | 11,654 | 14,677 | (21) | |||||||||
| Income before taxes (CHF million) | |||||||||||||||||
| Wealth Management | 830 | 860 | 1,001 | (3) | (17) | 1,690 | 1,989 | (15) | |||||||||
| Corporate & Retail Banking | 390 | 464 | 380 | (16) | 3 | 854 | 831 | 3 | |||||||||
| Private Banking | 1,220 | 1,324 | 1,381 | (8) | (12) | 2,544 | 2,820 | (10) | |||||||||
| Investment Banking | 281 | (3,460) | 2,502 | – | (89) | (3,179) | 4,492 | – | |||||||||
| Asset Management | 167 | (468) | 299 | – | (44) | (301) | 556 | – | |||||||||
| Corporate Center | (97) | 32 | (96) | – | 1 | (65) | (206) | (68) | |||||||||
| Income/(loss) before taxes | 1,571 | (2,572) | 4,086 | &ndas h; | (62) | (1,001) | 7,662 | – | |||||||||
| Core Results reporting by region | |||||||||||||||||
| in | % change | in | % change | ||||||||||||||
| 2Q08 | 1Q08 | 2Q07 | QoQ | YoY | 6M08 | 6M07 | YoY | ||||||||||
| Net revenues (CHF million) | |||||||||||||||||
| Switzerland | 2,479 | 2,563 | 2,598 | (3) | (5) | 5,042 | 5,214 | (3) | |||||||||
| EMEA | 1,092 | 1,106 | 3,446 | (1) | (68) | 2,198 | 6,752 | (67) | |||||||||
| Americas | 3,648 | (1,322) | 4,339 | – | (16) | 2,326 | 8,273 | (72) | |||||||||
| Asia Pacific | 525 | 582 | 1,361 | (10) | (61) | 1,107 | 2,229 | (50) | |||||||||
| Corporate Center | 86 | 90 | (41) | (4) | – | 176 | (96) | – | |||||||||
| Net revenues | 7,830 | 3,019 | 11,703 | 159 | (33) | 10,849 | 22,372 | (52) | |||||||||
| Income before taxes (CHF million) | |||||||||||||||||
| Switzerland | 1,049 | 1,218 | 1,207 | (14) | (13) | 2,267 | 2,450 | (7) | |||||||||
| EMEA | (1,097) | (496) | 1,036 | 121 | – | (1,593) | 2,117 | – | |||||||||
| Americas | 1,905 | (3,369) | 1,377 | – | 38 | (1,464) | 2,545 | – | |||||||||
| Asia Pacific | (189) | 43 | 562 | – | – | (146) | 756 | – | |||||||||
| Corporate Center | (97) | 32 | (96) | – | 1 | (65) | (206) | (68) | |||||||||
| Income/(loss) before taxes | 1,571 | (2,572) | 4,086 | &ndas h; | (62) | (1,001) | 7,662 | – | |||||||||
| A significant portion of our business requires inter-regional coordination in order to facilitate the needs of our clients. The methodology for allocating our results by region is dependent on management judgment. For Wealth Management, results are allocated based on the management reporting structure of our relationship managers and the region where the transaction is recorded. For Investment Banking, trading results are allocated based on where the risk is primarily managed and fee-based results are allocated where the client is domiciled. For Asset Management, results are allocated based on the location of the investment advisors and sales teams. | |||||||||||||||||
Results detail |
| The following provides a comparison of our 2Q08 results versus 2Q07 (YoY) and versus 1Q08 (QoQ). |
Net revenues |
| In managing the business, revenues are evaluated in the aggregate, including an assessment of trading gains and losses and the related interest income and expense from financing and hedging positions. For this reason, individual revenue categories may not be indicative of performance. |
| YoY: Down 33% from CHF 11,703 million to CHF 7,830 million |
| Net revenues declined in all three divisions compared to the strong 2Q07. |
| In Private Banking, net revenues were down 3%. Net interest income increased 10%, mainly due to lower funding costs. Total non-interest income decreased 9%, mainly due to lower transaction-based revenues. |
| In Investment Banking, net revenues were down 50% due in large part to a decline in industry-wide origination activity, particularly in the structured products and leveraged finance businesses, compared to the exceptionally high levels in 2Q07. The 2Q08 results also reflected a combined net valuation reduction of CHF 22 million in our structured products and leveraged finance businesses and fair value losses of CHF 503 million on Credit Suisse debt. Despite the challenging market conditions, many businesses reported solid results, including near-record performance in prime services and strong revenues in the equity derivatives, cash equities and high grade businesses. |
| In Asset Management, net revenues were down 13%. Net revenues included valuation gains of CHF 79 million on securities purchased from our money market funds. Asset management and administrative fees for both global investors and multi-asset class solutions were lower compared to 2Q07, reflecting the significant decline in average assets under management. Asset management and administrative fees were higher for alternative investments, primarily due to performance fees from Hedging-Griffo, which we acquired in 4Q07, offset in part by higher funding costs. Private equity and other investment-related gains were CHF 50 million, compared to CHF 189 million in 2Q07. |
| QoQ: Up 159% from CHF 3,019 million to CHF 7,830 million |
| In Private Banking, net revenues were down 3%. Net interest income increased 3%, mainly due to higher revenues from deposits and lending and lower funding costs. Total non-interest income decreased 6%, mainly due to fair value losses on a synthetic collateralized loan portfolio, named Clock Finance No.1, compared to fair value gains in 1Q08, and lower brokerage and product issuing fees, reflecting low client activity. |
| In Investment Banking, fixed income trading revenues increased, primarily driven by significantly lower valuation reductions in our structured products and leveraged finance businesses, partially offset by weaker results in our global rates and foreign exchange businesses. Equity trading had strong results across most businesses. Net revenues also reflected fair value losses on Credit Suisse debt of CHF 503 million compared to fair value gains of CHF 1,362 million in 1Q08. |
| In Asset Management, net revenues reflected the valuation gains of CHF 79 million on securities purchased from our money market funds in 2Q08 compared to valuation reductions of CHF 566 million in 1Q08, semi-annual performance-based fees and higher private equity and other investment-related gains. |
Provision for credit losses |
| YoY: Up from CHF (20) million to CHF 45 million |
| The increase was due primarily to higher provisions relating to a guarantee provided in a prior year to a third-party bank by Investment Banking. |
| QoQ: Down 70% from CHF 151 million to CHF 45 million |
| The decrease was due primarily to lower provisions in 2Q08 relating to the third-party bank guarantee. |
Operating expenses |
| Compensation and benefits |
| Compensation and benefits for a given year reflect the strength and breadth of the business results and staffing levels and include fixed components, such as salaries, benefits and share-based compensation expense from prior-year awards, and a variable component. The variable component reflects the performance-based compensation for the current year to be paid in cash. The portion of the performance-based compensation for the current year deferred through share-based awards is expensed in future periods. For further information, refer to Note 17 – Employee share-based compensation and other benefits in V – Condensed consolidated financial statements – unaudited. |
| YoY: Down 25% from CHF 5,386 million to CHF 4,061 million |
| The decrease was due primarily to significantly lower performance-related compensation, mainly reflecting the lower revenues in Investment Banking, partly offset by expenses relating to increased headcount and deferred compensation. |
| QoQ: Up 25% from CHF 3,245 million to CHF 4,061 million |
| The increase was due primarily to higher performance-related compensation, mainly reflecting the improved results. |
| General and administrative expenses |
| YoY: Down 4% from CHF 1,609 million to CHF 1,543 million |
| The decrease primarily reflected a net credit of CHF 134 million, which included a release from our reserve for certain private litigation matters (refer to Note 23 – Litigation in V – Condensed consolidated financial statements – unaudited), partially offset by a charge related to an agreement with the Parmalat Group to settle all claims between the parties in Italy. The decrease was partially offset by higher depreciation and amortization expenses. Most other expense categories were stable. |
| QoQ: Down 2% from CHF 1,571 million to CHF 1,543 million |
| The decrease was primarily due to the net credit of CHF 134 million, offset in part by higher professional fees and information technology and occupancy expenses. |
Income tax expense/(benefit) |
| YoY: From CHF 863 million to CHF 297 million |
| The decrease in the income tax expense was primarily due to the lower results compared to 2Q07. The 2Q08 income tax expense reflected the negative impact of the geographical mix of results and the negative effect of increased valuation allowances on the recognition of deferred tax assets in certain jurisdictions. These two effects were partly offset by the net release of CHF 146 million of tax contingency accruals following the favorable resolution of certain tax matters. The effective tax rate was 18.9% compared to 21.1% in 2Q07. |
| QoQ: From CHF (455) million to CHF 297 million |
| The increase in income tax expense reflected the substantially improved results in 2Q08. The 2Q08 income tax expense reflected the negative impact of the geographical mix of results and the negative effects of increased valuation allowances against deferred tax assets. These two effects were partly offset by benefits related to the net release of CHF 146 million of tax contingency accruals. |
Personnel |
| The number of employees increased by 300 full-time equivalents compared to the end of 1Q08. The increase included additional relationship managers and support functions in targeted markets of Wealth Management. In Investment Banking, we are rebalancing our businesses by shifting our resources to take advantage of areas with robust growth opportunities, such as prime services and derivatives. In Asset Management, in line with our strategy, we announced reductions in headcount, which we expect to be reflected in our headcount numbers in the future. |
| Number of employees by division | |||||||||||
| end of | % change | ||||||||||
| 2Q08 | 1Q08 | 2Q07 | QoQ | YoY | |||||||
| Number of employees by division (full-time equivalents) | |||||||||||
| Wealth Management | 15,100 | 14,800 | 13,600 | 2 | 11 | ||||||
| Corporate & Retail Banking | 9,000 | 9,000 | 8,800 | 0 | 2 | ||||||
| Private Banking | 24,100 | 23,800 | 22,400 | 1 | 8 | ||||||
| Investment Banking | 20,500 | 20,600 | 19,300 | 0 | 6 | ||||||
| Asset Management | 3,700 | 3,600 | 3,300 | 3 | 12 | ||||||
| Corporate Center | 700 | 700 | 600 | 0 | 17 | ||||||
| Number of employees | 49,000 | 48,700 | 45,600 | 1 | 7 | ||||||
Key performance indicators |
| To benchmark our achievements, we have defined a set of key performance indicators (KPI) for which we have targets to be achieved over a three to five year period across market cycles. Although market conditions have been extremely challenging, we continue to be confident about our ability to achieve these targets over the longer term. |
Performance |
| For return on equity, we target an annual rate of return of above 20%. In 2Q08, return on equity was 13.2%. |
| For total shareholder return, we target superior share price appreciation plus dividends compared to our peer group. For 2Q08, total shareholder return was (10.3)%. |
Growth |
| For earnings per share, we target a double-digit annual percentage growth. Diluted earnings per share growth from continuing operations was (60.3)% in 2Q08. |
| For net new assets, we target a growth rate above 6%. In 2Q08, we recorded an annualized net new asset growth rate of 4.1% and a rolling four-quarter average growth rate of (0.6)%. |
| In 2008, we announced a target for integrated bank collaboration revenues in excess of CHF 10 billion annually by 2010. For 2Q08, integrated bank collaboration revenues were CHF 1.3 billion, bringing the 2008 year-to-date total to CHF 2.5 billion. |
Efficiency |
| In 2008, we announced a target for our Core Results cost/income ratio of 65% by 2010. Our Core Results cost/income ratio was 79.4% for 2Q08. |
Capital strength |
| For the BIS tier 1 ratio under Basel II, we target a ratio of 10%. The BIS tier 1 ratio under Basel II was 10.2% as of the end of 2Q08. |
| in / end of | 2Q08 | 6M08 | 2007 | 2006 | 2005 | ||||||
| Performance (%) | |||||||||||
| Return on equity (annualized) | 13.2 | (4.8) | 18.0 | 27.5 | 15.4 | ||||||
| Total shareholder return 1 | (10.3) | (28.2) | (17.8) | 30.5 | 44.2 | ||||||
| Growth | |||||||||||
| YoY diluted earnings per share growth from continuing operations | (60.3) | (117.4) | (3.2) | 84.4 | (7.8) | ||||||
| Net new asset growth (annualized) | 4.1 | 1.3 | 3.4 | 7.2 | 5.4 | ||||||
| Net new asset growth (rolling four-quarter average) | (0.6) | – | 3.4 | 7.2 | 5.4 | ||||||
| Collaboration revenues (CHF billion) | 1.3 | 2.5 | 5.9 | 4.9 | – | ||||||
| Efficiency (%) | |||||||||||
| Core Results cost/income ratio | 79.4 | 107.4 | 73.1 | 69.6 | 81.6 | ||||||
| Capital strength (%) | |||||||||||
| BIS tier 1 ratio 2 | 10.2 | 10.2 | 11.1 | 13.9 | 11.3 | ||||||
| 1 The total return of an investor is measured by the annualized capital gain/(loss) plus dividends received. 2 Under Basel II from January 1, 2008. Prior periods are reported under Basel I and are therefore not comparable. For further information, refer to IV – Treasury and Risk management – Treasury management. | |||||||||||
II – Results by division |
Private Banking |
Wealth Management |
Corporate & Retail Banking |
Investment Banking |
Asset Management |
Private Banking |
| Our results in 2Q08 further evidenced the strength of our business in a challenging operating environment, with income before taxes of CHF 1,220 million and strong asset gathering, with net new assets of CHF 17.4 billion. |
| Results | |||||||||||||||||
| in / end of | % change | in / end of | % change | ||||||||||||||
| 2Q08 | 1Q08 | 2Q07 | QoQ | YoY | 6M08 | 6M07 | YoY | ||||||||||
| Statements of income (CHF million) | |||||||||||||||||
| Net revenues | 3,265 | 3,355 | 3,353 | (3) | (3) | 6,620 | 6,719 | (1) | |||||||||
| Provision for credit losses | (5) | (5) | (29) | 0 | (83) | (10) | (36) | (72) | |||||||||
| Compensation and benefits | 1,160 | 1,161 | 1,127 | 0 | 3 | 2,321 | 2,279 | 2 | |||||||||
| General and administrative expenses | 698 | 666 | 660 | 5 | 6 | 1,364 | 1,229 | 11 | |||||||||
| Commission expenses | 192 | 209 | 214 | (8) | (10) | 401 | 427 | (6) | |||||||||
| Total other operating expenses | 890 | 875 | 874 | 2 | 2 | 1,765 | 1,656 | 7 | |||||||||
| Total operating expenses | 2,050 | 2,036 | 2,001 | 1 | 2 | 4,086 | 3,935 | 4 | |||||||||
| Income before taxes | 1,220 | 1,324 | 1,381 | (8) | (12) | 2,544 | 2,820 | (10) | |||||||||
| Statement of income metrics (%) | |||||||||||||||||
| Compensation/revenue ratio | 35.5 | 34.6 | 33.6 | – | – | 35.1 | 33.9 | – | |||||||||
| Non-compensation/revenue ratio | 27.3 | 26.1 | 26.1 | – | – | 26.7 | 24.6 | – | |||||||||
| Cost/income ratio | 62.8 | 60.7 | 59.7 | – | – | 61.7 | 58.6 | – | |||||||||
| Pre-tax income margin | 37.4 | 39.5 | 41.2 | – | – | 38.4 | 42.0 | – | |||||||||
| Utilized economic capital and return | |||||||||||||||||
| Average utilized economic capital (CHF million) | 5,490 | 5,370 | 5,117 | 2 | 7 | 5,457 | 5,162 | 6 | |||||||||
| Pre-tax return on average utilized economic capital (%) 1 | 89.5 | 99.3 | 108.8 | – | – | 93.9 | 110.1 | – | |||||||||
| Balance sheet statistics (CHF million) | |||||||||||||||||
| Total assets | 375,064 | 365,249 | 359,903 | 3 | 4 | 375,064 | 359,903 | 4 | |||||||||
| Net loans | 180,597 | 175,413 | 173,614 | 3 | 4 | 180,597 | 173,614 | 4 | |||||||||
| Goodwill | 826 | 819 | 797 | 1 | 4 | 826 | 797 | 4 | |||||||||
| Number of employees (full-time equivalents) | |||||||||||||||||
| Number of employees | 24,100 | 23,800 | 22,400 | 1 | 8 | 24,100 | 22,400 | 8 | |||||||||
| 1 Calculated using a return excluding interest costs for allocated goodwill. | |||||||||||||||||
| Results (continued) | |||||||||||||||||
| in / end of | % change | in / end of | % change | ||||||||||||||
| 2Q08 | 1Q08 | 2Q07 | QoQ | YoY | 6M08 | 6M07 | YoY | ||||||||||
| Net revenue detail (CHF million) | |||||||||||||||||
| Net interest income | 1,277 | 1,241 | 1,160 | 3 | 10 | 2,518 | 2,334 | 8 | |||||||||
| Total non-interest income | 1,988 | 2,114 | 2,193 | (6) | (9) | 4,102 | 4,385 | (6) | |||||||||
| Net revenues | 3,265 | 3,355 | 3,353 | (3) | (3) | 6,620 | 6,719 | (1) | |||||||||
Results summary |
| In 2Q08, the challenging operating environment continued and was characterized by ongoing high market volatility, weak equity markets and cautious investor behavior. We delivered good profitability, with income before taxes of CHF 1,220 million, down CHF 161 million, or 12%, compared to 2Q07. Net revenues were CHF 3,265 million, down CHF 88 million, or 3%, compared to 2Q07. Net interest income increased 10%, mainly due to lower funding costs. Total non-interest income decreased 9%, mainly due to lower transaction-based revenues from low client activity. Provision for credit losses resulted in net releases of CHF 5 million, compared to CHF 29 million in 2Q07. Total operating expenses were CHF 2,050 million, up CHF 49 million, or 2%, compared to 2Q07, mainly driven by higher expenses related to the international expansion of Wealth Management, as we maintained our growth strategy by adding relationship managers and support s taff and expanding our international platform. |
| Assets under management of CHF 926.8 billion were up CHF 27.2 billion, or 3.0%, compared to 1Q08, reflecting favorable foreign exchange-related movements and strong net new assets, partially offset by adverse market movements. Assets under management were down CHF 89.4 billion, or 8.8%, compared to 2Q07, reflecting adverse foreign exchange-related and market movements, partially offset by strong net new assets. Net new assets were CHF 17.4 billion in 2Q08, compared to CHF 17.1 million in 1Q08, and nearly double the levels achieved in 2Q07. Wealth Management contributed CHF 15.4 billion and Corporate & Retail Banking contributed CHF 2.0 billion of net new assets in 2Q08. |
| Compared to 1Q08, income before taxes was down CHF 104 million, or 8%. Net revenues decreased CHF 90 million, or 3%. Net interest income increased 3%, mainly due to higher revenues from deposits and lending and lower funding costs. Total non-interest income decreased 6%, mainly due to fair value losses of CHF 18 million on a synthetic collateralized loan portfolio, named Clock Finance No.1, compared to fair value gains in 1Q08 of CHF 64 million, and lower brokerage and product issuing fees, reflecting the low client activity. Total operating expenses were stable, with compensation and benefits in line with 1Q08 and higher general and administrative expenses, offset by lower commission expenses. |
Wealth Management |
| With good profitability, strong net new asset inflows and continued success in hiring new relationship managers, the results in 2Q08 further evidenced the resilience of our wealth management business in a challenging operating environment. Income before taxes was CHF 830 million, and net new assets amounted to CHF 15.4 billion. We maintained our growth strategy by expanding our workforce and international platform. |
| Results | |||||||||||||||||
| in / end of | % change | in / end of | % change | ||||||||||||||
| 2Q08 | 1Q08 | 2Q07 | QoQ | YoY | 6M08 | 6M07 | YoY | ||||||||||
| Statements of income (CHF million) | |||||||||||||||||
| Net revenues | 2,278 | 2,313 | 2,384 | (2) | (4) | 4,591 | 4,763 | (4) | |||||||||
| Provision for credit losses | 0 | 4 | (1) | (100) | 100 | 4 | 2 | 100 | |||||||||
| Compensation and benefits | 814 | 806 | 788 | 1 | 3 | 1,620 | 1,587 | 2 | |||||||||
| General and administrative expenses | 473 | 462 | 415 | 2 | 14 | 935 | 820 | 14 | |||||||||
| Commission expenses | 161 | 181 | 181 | (11) | (11) | 342 | 365 | (6) | |||||||||
| Total other operating expenses | 634 | 643 | 596 | (1) | 6 | 1,277 | 1,185 | 8 | |||||||||
| Total operating expenses | 1,448 | 1,449 | 1,384 | 0 | 5 | 2,897 | 2,772 | 5 | |||||||||
| Income before taxes | 830 | 860 | 1,001 | (3) | (17) | 1,690 | 1,989 | (15) | |||||||||
| Statement of income metrics (%) | |||||||||||||||||
| Compensation/revenue ratio | 35.7 | 34.8 | 33.1 | – | – | 35.3 | 33.3 | – | |||||||||
| Non-compensation/revenue ratio | 27.8 | 27.8 | 25.0 | – | – | 27.8 | 24.9 | – | |||||||||
| Cost/income ratio | 63.6 | 62.6 | 58.1 | – | – | 63.1 | 58.2 | – | |||||||||
| Pre-tax income margin | 36.4 | 37.2 | 42.0 | – | – | 36.8 | 41.8 | – | |||||||||
| Utilized economic capital and return | |||||||||||||||||
| Average utilized economic capital (CHF million) | 2,070 | 1,987 | 1,701 | 4 | 22 | 2,027 | 1,660 | 22 | |||||||||
| Pre-tax return on average utilized economic capital (%) 1 | 162.0 | 174.9 | 237.7 | – | – | 168.4 | 242.0 | – | |||||||||
| Balance sheet statistics (CHF million) | |||||||||||||||||
| Total assets | 262,709 | 256,063 | 251,666 | 3 | 4 | 262,709 | 251,666 | 4 | |||||||||
| Net loans | 79,048 | 75,482 | 76,844 | 5 | 3 | 79,048 | 76,844 | 3 | |||||||||
| Goodwill | 645 | 638 | 616 | 1 | 5 | 645 | 616 | 5 | |||||||||
| Number of employees (full-time equivalents) | |||||||||||||||||
| Number of employees | 15,100 | 14,800 | 13,600 | 2 | 11 | 15,100 | 13,600 | 11 | |||||||||
| Number of relationship managers | |||||||||||||||||
| Switzerland | 1,120 | 1,110 | 1,070 | 1 | 5 | 1,120 | 1,070 | 5 | |||||||||
| EMEA | 1,300 | 1,270 | 1,130 | 2 | 15 | 1,300 | 1,130 | 15 | |||||||||
| Americas | 510 | 480 | 430 | 6 | 19 | 510 | 430 | 19 | |||||||||
| Asia Pacific | 440 | 390 | 290 | 13 | 52 | 440 | 290 | 52 | |||||||||
| Number of relationship managers | 3,370 | 3,250 | 2,920 | 4 | 15 | 3,370 | 2,920 | 15 | |||||||||
| 1 Calculated using a return excluding interest costs for allocated goodwill. | |||||||||||||||||
| Results (continued) | |||||||||||||||||
| in / end of | % change | in / end of | % change | ||||||||||||||
| 2Q08 | 1Q08 | 2Q07 | QoQ | YoY | 6M08 | 6M07 | YoY | ||||||||||
| Net revenue detail (CHF million) | |||||||||||||||||
| Net interest income | 657 | 641 | 582 | 2 | 13 | 1,298 | 1,166 | 11 | |||||||||
| Total non-interest income | 1,621 | 1,672 | 1,802 | (3) | (10) | 3,293 | 3,597 | (8) | |||||||||
| Net revenues | 2,278 | 2,313 | 2,384 | (2) | (4) | 4,591 | 4,763 | (4) | |||||||||
| Net revenue detail (CHF million) | |||||||||||||||||
| Recurring | 1,690 | 1,684 | 1,582 | 0 | 7 | 3,374 | 3,164 | 7 | |||||||||
| Transaction-based | 588 | 629 | 802 | (7) | (27) | 1,217 | 1,599 | (24) | |||||||||
| Net revenues | 2,278 | 2,313 | 2,384 | (2) | (4) | 4,591 | 4,763 | (4) | |||||||||
| Gross and net margin on assets under management (bp) | |||||||||||||||||
| Recurring | 86 | 85 | 75 | – | – | 86 | 77 | – | |||||||||
| Transaction-based | 30 | 32 | 38 | – | – | 31 | 39 | – | |||||||||
| Gross margin | 116 | 117 | 113 | – | – | 117 | 116 | – | |||||||||
| Net margin (pre-tax) | 42 | 44 | 48 | – | – | 43 | 48 | – | |||||||||
Operating environment |
| Volatile markets persisted during 2Q08 due to ongoing uncertainties surrounding the credit markets and the health of the global economy. However, volatility was below the extraordinary levels in 1Q08. Equity markets were slightly up in April and May, but the quarter closed below 1Q08 levels due to concerns about the economic outlook and inflation. Growth in major emerging markets continued. Concerns about global inflation increased and were the main reason for several central banks to hold interest rates steady despite the ongoing credit crisis. With rising commodity prices, particularly in energy and agricultural products, and weaker global economic data, consumer spending in certain markets started to slow. The US dollar remained weak against the Swiss franc in early 2Q08, but ended slightly higher than the 1Q08 level. The euro finished the quarter slightly stronger against the Swiss franc, but was relatively volatile du ring the quarter, reflecting concern that the ECB would likely increase key interest rates in the near term. |
| Investor sentiment was mixed, with investors fearing the impact from higher inflation on growth prospects. Client activity reflected lower volumes and a reduction in average transaction values compared to 1Q08. In general, investors remained risk averse and maintained defensive positions in money market instruments and other short-term investment strategies, particularly money market funds, products with capital protection and index-based products. |
| In the current market environment, we benefited from our integrated bank model and strong capital base to advise high-net-worth individuals seeking the service of experienced wealth managers with holistic solutions. |
Results summary |
| Income before taxes was CHF 830 million, down CHF 171 million, or 17%, compared to 2Q07. Net revenues were CHF 2,278 million, down CHF 106 million, or 4%, compared to 2Q07. Recurring revenues, which represented 74% of net revenues, increased CHF 108 million, or 7%, primarily reflecting higher net interest income, mainly from lower funding costs, partially offset by lower revenues from lending, and slightly higher commissions and fees. The increase in recurring commissions and fees reflected semi-annual performance-based fees, partially offset by lower fees from managed investment products. Transaction-based revenues decreased CHF 214 million, or 27%, mainly due to lower brokerage and product issuing fees, reflecting low client activity. Total operating expenses were CHF 1,448 million, up CHF 64 million, or 5%. Compensation and benefits increased 3%, primarily due to increased personnel expenses related to the ongoing strat egic investment in expanding the global franchise, including 450 additional relationship managers, offset in part by lower performance-related compensation, reflecting lower results. The 14% increase in general and administrative expenses was mainly due to an increase in front- and back-office infrastructure costs relating to our continued international expansion. We maintained our growth strategy by adding relationship managers and related support staff and expanding our international platform. |
| Assets under management as of the end of 2Q08 were CHF 773.5 billion, up CHF 24.1 billion, or 3.2%, from the end of 1Q08, reflecting favorable foreign exchange-related movements and strong net new asset inflows, partially offset by adverse market movements. Despite the continued deleveraging by investors in certain markets, net new assets were CHF 15.4 billion in 2Q08, with good contributions from all regions, especially Europe, Middle East and Africa (EMEA) and Asia Pacific. Compared to 2Q07, assets under management were down CHF 87.0 billion, or 10.1%, primarily impacted by adverse foreign exchange-related and market movements, partially offset by strong net new assets. |
| Compared to 1Q08, income before taxes was down CHF 30 million, or 3%. Net revenues were down 2%, reflecting lower transaction-based revenues, which suffered from low client activity, and stable recurring revenues. Total operating expenses were stable, with compensation and benefits in line with 1Q08, and higher general and administrative expenses offset by lower commission expenses. |
Performance indicators |
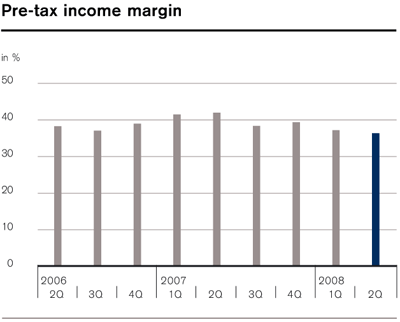
Pre-tax income margin (KPI) |
| Our target over market cycles is a pre-tax income margin above 40%. In 2Q08, the pre-tax income margin was 36.4%, down 5.6 percentage points from 2Q07 and down 0.8 percentage points from 1Q08. |
 |
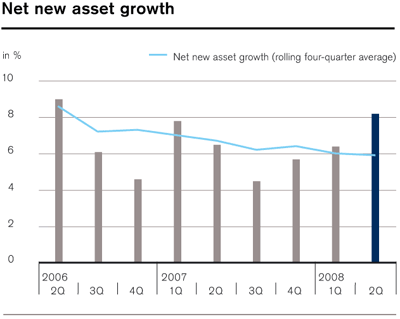
Net new asset growth rate (KPI) |
| Our target over market cycles is a growth rate over 6%. We achieved an annualized quarterly growth rate of 8.2%. The rolling four-quarter average growth rate was 5.9%. |
 |
Gross margin |
| Our gross margin was 116 basis points, compared to 113 basis points in 2Q07, as net revenues decreased at a lower rate than average assets under management. Compared to 2Q07, the recurring margin increased 11 basis points to a very strong 86 basis points, benefiting from lower funding costs and slightly higher commissions and fees, while the transaction-based margin decreased eight basis points, driven mainly by a decline in brokerage and product issuing fees, reflecting low client activity. Compared to 1Q08, the gross margin decreased slightly, as net revenues decreased 2%, while the average assets under management were stable. |
Initiatives and achievements |
| In 2Q08, we implemented several strategic growth initiatives to strengthen our franchise and broaden our geographic scope: |
| – We continued to strengthen our onshore business in mature markets and opened a branch in Parma, Italy as well as offices in Manchester and Birmingham, England. |
| – We continued to invest in emerging markets and opened our new wealth management business in Mumbai, India, marking an important milestone in the implementation of our international growth strategy. |
| – We continued to pursue our middle-market strategy by extending our geographic scope, reaching an agreement to acquire Hindal, a privately owned corporate advisory firm with teams in Sydney and Melbourne, Australia. The acquisition will further strengthen our wealth management capabilities for entrepreneurs by providing corporate advisory services to small-to-mid cap businesses. |
| – Wealth Management and Corporate & Retail Banking successfully launched OpportunityNet, a global intranet platform for relationship managers, offering new business options to ultra-high-net-worth clients who are increasingly looking for opportunities to make direct investments in companies. OpportunityNet is an innovative tool to match supply and demand for direct equity and real estate investments. |
| – We continued the global roll out of our Client Centricity initiative and introduced the client centric advisory process in the US, utilizing advanced technology to support relationship managers in advising clients. |
| Assets under management - Wealth Management | |||||||||||||||||
| in / end of | % change | in / end of | % change | ||||||||||||||
| 2Q08 | 1Q08 | 2Q07 | QoQ | YoY | 6M08 | 6M07 | YoY | ||||||||||
| Assets under management (CHF billion) | |||||||||||||||||
| Assets under management | 773.5 | 749.4 | 860.5 | 3.2 | (10.1) | 773.5 | 860.5 | (10.1) | |||||||||
| of which discretionary assets | 164.1 | 161.5 | 193.9 | 1.6 | (15.4) | 164.1 | 193.9 | (15.4) | |||||||||
| of which advisory assets | 609.4 | 587.9 | 666.6 | 3.7 | (8.6) | 609.4 | 666.6 | (8.6) | |||||||||
| Assets under management by currency (CHF billion) | |||||||||||||||||
| USD | 301.3 | 290.5 | 367.4 | 3.7 | (18.0) | 301.3 | 367.4 | (18.0) | |||||||||
| EUR | 232.1 | 224.8 | 237.6 | 3.2 | (2.3) | 232.1 | 237.6 | (2.3) | |||||||||
| CHF | 145.8 | 145.4 | 161.4 | 0.3 | (9.7) | 145.8 | 161.4 | (9.7) | |||||||||
| Other | 94.3 | 88.7 | 94.1 | 6.3 | 0.2 | 94.3 | 94.1 | 0.2 | |||||||||
| Assets under management | 773.5 | 749.4 | 860.5 | 3.2 | (10.1) | 773.5 | 860.5 | (10.1) | |||||||||
| Assets under management by region (CHF billion) | |||||||||||||||||
| Switzerland | 312.8 | 307.6 | 345.1 | 1.7 | (9.4) | 312.8 | 345.1 | (9.4) | |||||||||
| EMEA | 284.9 | 274.7 | 311.1 | 3.7 | (8.4) | 284.9 | 311.1 | (8.4) | |||||||||
| Americas | 111.7 | 108.8 | 140.4 | 2.7 | (20.4) | 111.7 | 140.4 | (20.4) | |||||||||
| Asia Pacific | 64.1 | 58.3 | 63.9 | 9.9 | 0.3 | 64.1 | 63.9 | 0.3 | |||||||||
| Assets under management | 773.5 | 749.4 | 860.5 | 3.2 | (10.1) | 773.5 | 860.5 | (10.1) | |||||||||
| Net new assets by region (CHF billion) | |||||||||||||||||
| Switzerland | 3.5 | 5.3 | 3.2 | (34.0) | 9.4 | 8.8 | 7.0 | 25.7 | |||||||||
| EMEA | 5.7 | 2.1 | 7.1 | 171.4 | (19.7) | 7.8 | 13.1 | (40.5) | |||||||||
| Americas | 2.1 | 3.6 | 3.0 | (41.7) | (30.0) | 5.7 | 6.3 | (9.5) | |||||||||
| Asia Pacific | 4.1 | 2.5 | 0.0 | 64.0 | – | 6.6 | 2.1 | 214.3 | |||||||||
| Net new assets | 15.4 | 13.5 | 13.3 | 14.1 | 15.8 | 28.9 | 28.5 | 1.4 | |||||||||
| Growth in assets under management (CHF billion) | |||||||||||||||||
| Net new assets | 15.4 | 13.5 | 13.3 | – | – | 28.9 | 28.5 | – | |||||||||
| Acquisitions and divestitures | 0.0 | 0.0 | 0.0 | – | – | 0.0 | 0.0 | – | |||||||||
| Market movements | (5.5) | (43.2) | 27.1 | – | – | (48.7) | 40.4 | – | |||||||||
| Currency | 16.0 | (59.5) | 6.3 | – | – | (43.5) | 8.5 | – | |||||||||
| Other | (1.8) | 0.0 | (1.0) | – | – | (1.8) | (1.1) | – | |||||||||
| Total other effects | 8.7 | (102.7) | 32.4 | – | – | (94.0) | 47.8 | – | |||||||||
| Growth in assets under management | 24.1 | (89.2) | 45.7 | & ndash; | – | (65.1) | 76.3 | – | |||||||||
| Growth in assets under management (annualized) (%) | |||||||||||||||||
| Net new assets | 8.2 | 6.4 | 6.5 | – | – | 6.9 | 7.3 | – | |||||||||
| Total other effects | 4.6 | (49.0) | 15.9 | – | – | (22.4) | 12.2 | – | |||||||||
| Growth in assets under management | 12.8 | (42.6) | 22.4 | & ndash; | – | (15.5) | 19.5 | – | |||||||||
| Growth in assets under management (rolling four-quarter average) (%) | |||||||||||||||||
| Net new assets | 5.9 | 6.0 | 6.7 | – | – | – | – | – | |||||||||
| Total other effects | (16.0) | (14.0) | 13.8 | – | – | – | – | – | |||||||||
| Growth in assets under management (rolling four-quarter average) | (10.1) | (8.0) | 20.5 | – | – | – | – | – | |||||||||
Results detail |
| The following provides a comparison of our 2Q08 results versus 2Q07 (YoY) and versus 1Q08 (QoQ). |
Net revenues |
| Recurring |
| Recurring revenues arise from recurring net interest income, commissions and fees, including performance-based fees, related to assets under management and custody assets, as well as fees for general banking products and services. |
| YoY: Up 7% from CHF 1,582 million to CHF 1,690 million |
| The increase was largely attributable to higher net interest income, mainly from lower funding costs, partially offset by lower revenues from lending and deposits. Commissions and fees increased slightly, mainly from semi-annual performance-based fees from Hedging-Griffo, mostly offset by lower fees from managed investment products. The decline in fees from managed investment products was mainly due to lower assets under management, reflecting the adverse market conditions. |
| QoQ: From CHF 1,684 million to CHF 1,690 million |
| Stable recurring revenues reflected the semi-annual performance-based fees from Hedging-Griffo, offset by lower fees from managed investment products. |
| Transaction-based |
| Transaction-based revenues arise primarily from brokerage and product issuing fees, client foreign exchange income and other transaction-based income. |
| YoY: Down 27% from CHF 802 million to CHF 588 million |
| The decrease was mainly driven by a decline in brokerage and product issuing fees and lower client foreign exchange income, due to low client activity. |
| QoQ: Down 7% from CHF 629 million to CHF 588 million |
| The decrease was mainly driven by lower brokerage and product issuing fees and client foreign exchange income, due to low client activity. |
Provision for credit losses |
| YoY: From CHF (1) million to nil |
| Provision for credit losses was stable. |
| QoQ: From CHF 4 million to nil |
| Provision for credit losses was stable. |
Operating expenses |
| Compensation and benefits |
| YoY: Up 3% from CHF 788 million to CHF 814 million |
| The increase mainly reflected personnel expenses arising from increased headcount in strategic growth markets, partially offset by lower performance-related compensation, reflecting lower results. |
| QoQ: Stable at CHF 814 million |
| Compensation and benefits reflected stable personnel expenses and performance-related compensation. |
| General and administrative expenses |
| YoY: Up 14% from CHF 415 million to CHF 473 million |
| The increase reflected the international expansion of the franchise, driven mainly by higher front- and back-office infrastructure costs, including premises and equipment and information technology expenses, and non-credit-related provisions. |
| QoQ: Up 2% from CHF 462 million to CHF 473 million |
| The increase reflected the infrastructure costs, offset in part by lower non-credit-related provisions. |
Personnel |
| Since 2Q07, we increased headcount by 1,500 and strengthened our front-office teams, mainly in Asia Pacific, EMEA and the Americas. As of the end of 2Q08, we had 3,370 relationship managers, an increase of 450 from the end of 2Q07, mainly in EMEA, Asia Pacific and the Americas. From the end of 1Q08, the number of relationship managers increased by 120, mainly in Asia Pacific, the Americas and EMEA. We continue to have a strong hiring pipeline for experienced relationship managers. |
Corporate & Retail Banking |
| Our strong results in 2Q08 reflected our continued focus on profitable growth in a favorable operating environment in Switzerland. We achieved good net revenues of CHF 987 million and income before taxes of CHF 390 million. |
| Results | |||||||||||||||||
| in / end of | % change | in / end of | % change | ||||||||||||||
| 2Q08 | 1Q08 | 2Q07 | QoQ | YoY | 6M08 | 6M07 | YoY | ||||||||||
| Statements of income (CHF million) | |||||||||||||||||
| Net revenues | 987 | 1 | 1,042 | 1 | 969 | (5) | 2 | 2,029 | 1 | 1,956 | 4 | ||||||
| Provision for credit losses | (5) | (9) | (28) | (44) | (82) | (14) | (38) | (63) | |||||||||
| Compensation and benefits | 346 | 355 | 339 | (3) | 2 | 701 | 692 | 1 | |||||||||
| General and administrative expenses | 225 | 204 | 245 | 10 | (8) | 429 | 409 | 2 | 5 | ||||||||
| Commission expenses | 31 | 28 | 33 | 11 | (6) | 59 | 62 | (5) | |||||||||
| Total other operating expenses | 256 | 232 | 278 | 10 | (8) | 488 | 471 | 4 | |||||||||
| Total operating expenses | 602 | 587 | 617 | 3 | (2) | 1,189 | 1,163 | 2 | |||||||||
| Income before taxes | 390 | 464 | 380 | (16) | 3 | 854 | 831 | 3 | |||||||||
| Statement of income metrics (%) | |||||||||||||||||
| Compensation/revenue ratio | 35.1 | 34.1 | 35.0 | – | – | 34.5 | 35.4 | – | |||||||||
| Non-compensation/revenue ratio | 25.9 | 22.3 | 28.7 | – | – | 24.1 | 24.1 | – | |||||||||
| Cost/income ratio | 61.0 | 56.3 | 63.7 | – | – | 58.6 | 59.5 | – | |||||||||
| Pre-tax income margin | 39.5 | 44.5 | 39.2 | – | – | 42.1 | 42.5 | – | |||||||||
| Utilized economic capital and return | |||||||||||||||||
| Average utilized economic capital (CHF million) | 3,420 | 3,383 | 3,416 | 1 | 0 | 3,430 | 3,502 | (2) | |||||||||
| Pre-tax return on average utilized economic capital (%) 3 | 45.7 | 54.9 | 44.6 | – | – | 49.8 | 47.5 | – | |||||||||
| Balance sheet statistics (CHF million) | |||||||||||||||||
| Total assets | 112,355 | 109,186 | 108,237 | 3 | 4 | 112,355 | 108,237 | 4 | |||||||||
| Net loans | 101,549 | 99,931 | 96,770 | 2 | 5 | 101,549 | 96,770 | 5 | |||||||||
| Goodwill | 181 | 181 | 181 | 0 | 0 | 181 | 181 | 0 | |||||||||
| Number of employees (full-time equivalents) | |||||||||||||||||
| Number of employees | 9,000 | 9,000 | 8,800 | 0 | 2 | 9,000 | 8,800 | 2 | |||||||||
| 1 Includes fair value gains/(losses) on a synthetic collateralized loan portfolio of CHF (18) million, CHF 64 million and CHF 46 million in 2Q08, 1Q08 and 6M08, respectively. 2 Includes releases of non-credit-related provisions of CHF 37 million. 3 Calculated using a return excluding interest costs for allocated goodwill. | |||||||||||||||||
| Results (continued) | |||||||||||||||||
| in / end of | % change | in / end of | % change | ||||||||||||||
| 2Q08 | 1Q08 | 2Q07 | QoQ | YoY | 6M08 | 6M07 | YoY | ||||||||||
| Net revenue detail (CHF million) | |||||||||||||||||
| Net interest income | 620 | 600 | 578 | 3 | 7 | 1,220 | 1,168 | 4 | |||||||||
| Total non-interest income | 367 | 1 | 442 | 1 | 391 | (17) | (6) | 809 | 1 | 788 | 3 | ||||||
| Net revenues | 987 | 1,042 | 969 | (5) | 2 | 2,029 | 1,956 | 4 | |||||||||
| Number of branches | |||||||||||||||||
| Number of branches | 217 | 217 | 216 | 0 | 0 | 217 | 216 | 0 | |||||||||
| 1 Includes fair value gains/(losses) on a synthetic collateralized loan portfolio of CHF (18) million, CHF 64 million and CHF 46 million in 2Q08, 1Q08 and 6M08, respectively. | |||||||||||||||||
Operating environment |
| The economic environment continued to be favorable in Switzerland in 2Q08. Economic growth was relatively robust, fueled by consumer spending and exports to emerging markets, but eased from the end of 2007. Unemployment remained low during the quarter and real wages continued to increase, supporting consumer spending. Consumer sentiment remained positive, although consumers began to assess the economic outlook in Switzerland and its potential impact on their personal financial situation. The Swiss franc weakened slightly against the US dollar and euro during 2Q08 after strengthening against both currencies in 1Q08. Short-term interest rates in 2Q08 were stable as the Swiss National Bank decided to leave its monetary policy unchanged. Loan volumes in Switzerland maintained an upward trend, as Swiss banks did not significantly tighten lending conditions and households and companies remained on a sound financial foundation. |
Results summary |
| In 2Q08, income before taxes was CHF 390 million, up CHF 10 million, or 3%, compared to 2Q07. Net revenues were CHF 987 million, up CHF 18 million, or 2%. Net interest income increased CHF 42 million, or 7%, mainly due to lower funding costs, partly offset by lower revenues from lending, reflecting lower asset margins. Net interest income from deposits was stable, reflecting volume growth offset by lower margins. Total non-interest income was down 6%, mainly due to fair value losses of CHF 18 million on a synthetic collateralized loan portfolio, named Clock Finance No. 1, and lower commissions and fees, particularly from brokerage and product issuing fees. Net releases of provision for credit losses were CHF 5 million, versus CHF 28 million in 2Q07, which benefited from the resolution of a single exposure. Total operating expenses were CHF 602 million, down CHF 15 million, or 2%. Compensation and benefits were up 2%, but t he increase was more than offset by lower general and administrative expenses and commission expenses. |
| Net new assets were CHF 2.0 billion, mainly from the institutional pension fund business. |
| Compared to 1Q08, income before taxes decreased CHF 74 million, or 16%. Net revenues were down CHF 55 million, or 5%, mainly driven by the fair value losses of CHF 18 million on the synthetic collateralized loan portfolio, compared to the fair value gains of CHF 64 million on this portfolio in 1Q08, offset in part by higher net interest income. Net interest income benefited from lower funding costs and higher revenues from lending, reflecting volume growth, partially offset by slightly lower margins, while revenues from deposits were stable. Total operating expenses increased CHF 15 million, or 3%, driven by higher general and administrative expenses across most categories, partly offset by slightly lower compensation and benefits. |
Performance indicators |
Pre-tax income margin (KPI) |
| Our target over market cycles is a pre-tax income margin above 40%. In 2Q08, our pre-tax income margin was 39.5%, compared to 39.2% in 2Q07 and 44.5% in 1Q08. |
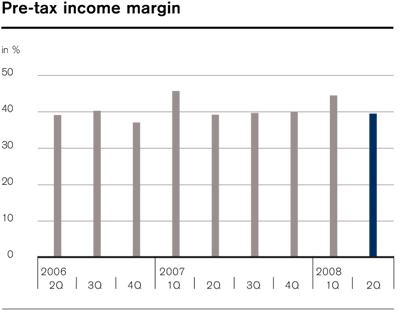 |
Cost/income ratio |
| In 2Q08, the cost/income ratio was 61.0%, compared to 63.7% in 2Q07 and 56.3% in 1Q08. |
Pre-tax return on average utilized economic capital |
| In 2Q08, the pre-tax return on average utilized economic capital was 45.7%, compared to 44.6% in 2Q07 and 54.9% in 1Q08. |
Initiatives and achievements |
| – Credit Suisse was named “Best Bank” in Switzerland inEuromoney’s annual Awards of Excellence feature for the second consecutive year. In addition, Credit Suisse was awarded “Best Sub-Custodian in Switzerland” byGlobal Finance magazine for the fifth consecutive year. |
| – During 2Q08, Credit Suisse continued to improve client experience and accessibility for special-needs clients through the renovation of four additional branches under the Bank’s “Branch Excellence” initiative. Throughout Switzerland, renovations have been completed on 42 branches. |
| – We continued to foster our integrated bank collaboration through the launch of OpportunityNet, which is an innovative tool to match supply and demand for direct equity and real estate investments. |
Results detail |
| The following provides a comparison of our 2Q08 results versus 2Q07 (YoY) and versus 1Q08 (QoQ). |
Net revenues |
| Net interest income |
| YoY: Up 7% from CHF 578 million to CHF 620 million |
| The increase primarily reflected lower funding costs, partly offset by lower revenues from lending due to margin pressure, despite higher volumes. |
| QoQ: Up 3% from CHF 600 million to CHF 620 million |
| The increase was mainly due to lower funding costs and higher revenues from lending, while revenues from deposits were stable. |
| Total non-interest income |
| YoY: Down 6% from CHF 391 million to CHF 367 million |
| The decrease was mainly due to lower commissions and fees, particularly brokerage and product issuing fees, and fair value losses of CHF 18 million in 2Q08 on the synthetic collateralized loan portfolio, named Clock Finance No. 1, due to narrowing credit spreads. |
| QoQ: Down 17% from CHF 442 million to CHF 367 million |
| The decrease was mainly due to the fair value losses on the synthetic collateralized loan portfolio compared to gains of CHF 64 million in 1Q08, and lower brokerage and product issuing fees. |
Provision for credit losses |
| YoY: From CHF (28) million to CHF (5) million |
| We reported net releases of CHF 5 million, which included provisions of CHF 36 million and releases of CHF 41 million. Provision for credit losses in 2Q07 benefited from the resolution of a single exposure. The current level of provisions was supported by the continued favorable credit environment. |
| QoQ: From CHF (9) million to CHF (5) million |
| Provision for credit losses was stable. |
Operating expenses |
| Compensation and benefits |
| YoY: Up 2% from CHF 339 million to CHF 346 million |
| The increase was mainly due to higher performance-related compensation, while salaries and related benefits were stable. |
| QoQ: Down 3% from CHF 355 million to CHF 346 million |
| The decrease was mainly due to lower performance-related compensation, reflecting the lower results, partially offset by increased employee benefits. |
| General and administrative expenses |
| YoY: Down 8% from CHF 245 million to CHF 225 million |
| The decrease was primarily due to lower non-credit-related provisions and a decline in most general and administrative expenses. |
| QoQ: Up 10% from CHF 204 million to CHF 225 million |
| The increase was due to higher premises and equipment expenses, including branch renovations, and increased sales and marketing activities. |
Investment Banking |
| Our 2Q08 performance improved substantially from 1Q08 despite the continued challenging market conditions, with solid results in most businesses. Our results reflected a small combined net valuation reduction in our structured products and leveraged finance businesses, and fair value losses on Credit Suisse debt due to narrower credit spreads compared to the prior quarter. In 2Q08, we reported net revenues of CHF 3,740 million and income before taxes of CHF 281 million. |
| Results | |||||||||||||||||
| in / end of | % change | in / end of | % change | ||||||||||||||
| 2Q08 | 1Q08 | 2Q07 | QoQ | YoY | 6M08 | 6M07 | YoY | ||||||||||
| Statements of income (CHF million) | |||||||||||||||||
| Net revenues | 3,740 | (489) | 7,538 | – | (50) | 3,251 | 14,120 | (77) | |||||||||
| Provision for credit losses | 50 | 156 | 9 | (68) | 456 | 206 | 70 | 194 | |||||||||
| Compensation and benefits | 2,462 | 1,718 | 3,882 | 43 | (37) | 4,180 | 7,272 | (43) | |||||||||
| General and administrative expenses | 652 | 1 | 748 | 803 | (13) | (19) | 1,400 | 1 | 1,630 | (14) | |||||||
| Commission expenses | 295 | 349 | 342 | (15) | (14) | 644 | 656 | (2) | |||||||||
| Total other operating expenses | 947 | 1,097 | 1,145 | (14) | (17) | 2,044 | 2,286 | (11) | |||||||||
| Total operating expenses | 3,409 | 2,815 | 5,027 | 21 | (32) | 6,224 | 9,558 | (35) | |||||||||
| Income/(loss) before taxes | 281 | (3,460) | 2,502 | – | (89) | (3,179) | 4,492 | – | |||||||||
| Statement of income metrics (%) | |||||||||||||||||
| Compensation/revenue ratio | 65.8 | – | 51.5 | – | – | 128.6 | 51.5 | – | |||||||||
| Non-compensation/revenue ratio | 25.3 | – | 15.2 | – | – | 62.9 | 16.2 | – | |||||||||
| Cost/income ratio | 91.1 | – | 66.7 | – | – | 191.4 | 67.7 | – | |||||||||
| Pre-tax income margin | 7.5 | – | 33.2 | – | – | (97.8) | 31.8 | – | |||||||||
| Utilized economic capital and return | |||||||||||||||||
| Average utilized economic capital (CHF million) | 16,559 | 18,031 | 18,782 | (8) | (12) | 17,441 | 19,071 | (9) | |||||||||
| Pre-tax return on average utilized economic capital (%) 2 | 7.5 | (76.0) | 54.5 | – | – | (35.7) | 48.3 | – | |||||||||
| Balance sheet statistics (CHF million) | |||||||||||||||||
| Total assets | 1,021,587 | 997,660 | 1,204,397 | 2 | (15) | 1,021,587 | 1,204,397 | (15) | |||||||||
| Net loans | 54,011 | 53,516 | 50,104 | 1 | 8 | 54,011 | 50,104 | 8 | |||||||||
| Goodwill | 6,864 | 6,708 | 7,858 | 2 | (13) | 6,864 | 7,858 | (13) | |||||||||
| Number of employees (full-time equivalents) | |||||||||||||||||
| Number of employees | 20,500 | 20,600 | 19,300 | 0 | 6 | 20,500 | 19,300 | 6 | |||||||||
| 1 Includes a net credit pertaining to litigation of CHF 134 million. 2 Calculated using a return excluding interest costs for allocated goodwill. | |||||||||||||||||
| Results (continued) | |||||||||||||||||
| in | % change | in | % change | ||||||||||||||
| 2Q08 | 1Q08 | 2Q07 | QoQ | YoY | 6M08 | 6M07 | YoY | ||||||||||
| Net revenue detail (CHF million) | |||||||||||||||||
| Debt underwriting | 216 | 1 | 136 | 1 | 713 | 59 | (70) | 352 | 1 | 1,438 | (76) | ||||||
| Equity underwriting | 245 | 172 | 413 | 42 | (41) | 417 | 724 | (42) | |||||||||
| Total underwriting | 461 | 308 | 1,126 | 50 | (59) | 769 | 2,162 | (64) | |||||||||
| Advisory and other fees | 364 | 396 | 632 | (8) | (42) | 760 | 1,143 | (34) | |||||||||
| Total underwriting and advisory | 825 | 704 | 1,758 | 17 | (53) | 1,529 | 3,305 | (54) | |||||||||
| Fixed income trading | 320 | 2 | (1,576) | 2 | 3,282 | – | (90) | (1,256) | 2 | 6,054 | – | ||||||
| Equity trading | 2,255 | 1,379 | 2,475 | 64 | (9) | 3,634 | 4,646 | (22) | |||||||||
| Total trading | 2,575 | (197) | 5,757 | – | (55) | 2,378 | 10,700 | (78) | |||||||||
| Other | 340 | 3 | (996) | 3 | 23 | – | – | (656) | 3 | 115 | – | ||||||
| Net revenues | 3,740 | (489) | 7,538 | – | (50) | 3,251 | 14,120 | (77) | |||||||||
| Average one-day, 99% Value-at-Risk (CHF million) | |||||||||||||||||
| Interest rate and credit spread | 185 | 145 | 58 | 28 | 219 | 166 | 56 | 196 | |||||||||
| Foreign exchange | 21 | 37 | 24 | (43) | (13) | 29 | 21 | 38 | |||||||||
| Commodity | 40 | 42 | 18 | (5) | 122 | 41 | 15 | 173 | |||||||||
| Equity | 56 | 78 | 93 | (28) | (40) | 67 | 79 | (15) | |||||||||
| Diversification benefit | (109) | (115) | (83) | (5) | 31 | (113) | (77) | 47 | |||||||||
| Average one-day, 99% Value-at-Risk | 193 | 187 | 110 | 3 | 75 | 190 | 94 | 102 | |||||||||
| 1 Includes CHF 21 million, CHF 18 million and CHF 39 million of net valuation gains (including hedges) on CDO origination assets and CHF 40 million of fee revenues and CHF 67 million and CHF 27 million of fee losses from the leveraged finance business in 2Q08, 1Q08 and 6M08, respectively. 2 Includes CHF 477 million, CHF 848 million and CHF 1,325 million of net valuation reductions (including fees, hedges, interest on funded positions and executed transactions) on CMBS, CHF 33 million of net valuation gains (including fees, hedges and interest on funded positions) and CHF 96 million and CHF 63 million of net valuation reductions (including fees, hedges and interest on funded positions) on RMBS, CHF 434 million, CHF 905 million and CHF 1,339 million of net valuation reductions (including fees, hedges, interest on funded positions, recoveries and e xecuted transactions) on leveraged finance loan commitments and CHF 487 million of net valuation gains (including hedges) and CHF 2,674 million and CHF 2,187 million of net valuation reductions (including hedges) on CDO warehouse and synthetic CDO assets in 2Q08, 1Q08 and 6M08, respectively. 3 Includes CHF 308 million of net valuation gains (including fees, hedges, interest on funded positions, recoveries and executed transactions) and CHF 709 million and CHF 401 million of net valuation reductions (including fees, hedges, interest on funded positions, recoveries and executed transactions) on leveraged finance bridge loan commitments in 2Q08, 1Q08 and 6M08, respectively. | |||||||||||||||||
Operating environment |
| The operating environment remained challenging in 2Q08. The environment recovered somewhat from 1Q08, with improved liquidity but renewed uncertainty around the direction of the US and European economies. By the end of the quarter, recession fears had been replaced by inflation indications driven by a surge in energy and agricultural products prices and stronger than expected GDP growth, leading to increased volatility in the currency, interest rate and credit markets. The Fed, after lowering interest rates 25 basis points in April, indicated it would cease cutting rates to curtail inflation and strengthen the US dollar. The possibility of a rate hike caused the yield curve to flatten, both in the US and Europe. The US dollar remained weak throughout most of the quarter, but rebounded slightly after the announcement by the Fed. There was continued growth momentum in the major emerging markets, although inflationary concern s prompted central bank intervention in many of these markets as well. |
| The CDX and ABX indices, including high yield and investment grade, narrowed throughout most of the quarter but widened slightly in June. In addition, credit spreads, which had narrowed through the end of May, began to widen through the end of the quarter. Asset prices stabilized during the quarter with little incremental price deterioration. However, the financial services sector continued to be burdened by announced valuation reductions, capital raising activities and widespread discussions on increased regulation. |
| Equity markets began to recover in April and during most of May, driven by expectations of improvement in the economy. However, towards the end of the quarter major equity indices reversed those gains, driven by renewed fears of incremental credit losses, the instability of financial services companies, rising food prices, soaring energy costs and higher unemployment. Equity trading volumes declined, driven by lower volatility levels. Market volatility decreased in April and May, but increased dramatically in June. Fixed income trading volumes also declined in the quarter. |
| Debt and equity underwriting volumes were up from 1Q08 levels due to increased demand for fixed income products, particularly high grade, and higher equity valuations. Despite a decline in financial sponsor activity, an increase in strategic activity by corporate buyers led to an overall increase in announced mergers and acquisitions from 1Q08. |
| League table positions | |||||||||
| in / end of | |||||||||
| 2Q08 | 6M08 | 2007 | 2006 | ||||||
| League table rank / market share (% – rounded) 1 | |||||||||
| Global fee pool 2 | 7 / 5% | 7 / 5% | 7 / 5% | 4 / 6% | |||||
| High yield 3 | 3 / 13% | 3 / 12% | 2 / 11% | 3 / 12% | |||||
| Investment grade 3 | 13 / 3% | 13 / 4% | 13 / 3% | 13 / 3% | |||||
| Asset-backed 3 | 12 / 3% | 9 / 3% | 10 / 5% | 8 / 5% | |||||
| Mortgage-backed 3 | 2 / 12% | 3 / 11% | 4 / 7% | 5 / 7% | |||||
| Total debt underwriting 3 | 8 / 5% | 8 / 5% | 11 / 4% | 8 / 5% | |||||
| IPO 2 | 6 / 6% | 11 / 4% | 3 / 8% | 4 / 7% | |||||
| Follow-on 2 | 9 / 4% | 9 / 4% | 7 / 6% | 7 / 6% | |||||
| Convertible 2 | 11 / 3% | 10 / 3% | 9 / 5% | 11 / 4% | |||||
| Total equity underwriting 2 | 9 / 3% | 11 / 3% | 7 / 6% | 7 / 6% | |||||
| Announced mergers and acquisitions 3 | 9 / 14% | 5 / 19% | 6 / 20% | 6 / 19% | |||||
| Completed mergers and acquisitions 3 | 7 / 18% | 4 / 26% | 8 / 18% | 8 / 15% | |||||
| 1 Volume-based, except global fee pool 2 Dealogic 3 Thomson Financial | |||||||||
Results summary |
| In 2Q08, income before taxes was CHF 281 million, compared to record income before taxes of CHF 2,502 million in 2Q07. Net revenues were CHF 3,740 million, down 50%, compared to CHF 7,538 million in 2Q07. The decline in revenues was due in large part to a decline in industry-wide origination activity, particularly in the structured products and leveraged finance businesses, compared to the exceptionally high levels in 2Q07. The 2Q08 revenues reflected a combined net valuation reduction of CHF 22 million in our leveraged finance and structured products businesses and fair value losses of CHF 503 million on Credit Suisse debt. We continued to manage down our exposure to assets most significantly impacted by the dislocation in the mortgage and credit markets. Total operating expenses were CHF 3,409 million, down CHF 1,618 million, or 32%, due primarily to a decrease in compensation and benefits, reflecting lower performance-r elated compensation on lower revenues. General and administrative expenses decreased 19%, primarily reflecting a net credit of CHF 134 million, which included a release from our reserve for certain private litigation matters (refer to Note 23 – Litigation in V – Condensed consolidated financial statements – unaudited), partially offset by a charge related to an agreement with the Parmalat Group to settle all claims between the parties in Italy. |
| Despite the challenging market conditions, many businesses reported solid results, including a near-record performance in prime services, and strong results in the equity derivatives, cash equities and high grade businesses. |
| Results in 2Q08 were negatively impacted by significantly lower fixed income trading revenues compared to 2Q07. These results reflected valuation reductions in our CMBS and leveraged finance businesses as well as lower levels of origination activity across the structured products businesses and lower secondary trading activity in leveraged finance. Revenues from the global rates business also declined significantly compared to 2Q07, primarily due to losses incurred as a result of a sharp shift in the euro yield curve in June. The decline in revenues was partially offset by an increase in our RMBS business and Europe high grade results. |
| Equity trading decreased from 2Q07, primarily due to lower revenues in our equity proprietary trading and convertibles businesses compared to a strong 2Q07. The decline was partially offset by a near-record performance in prime services and a strong performance in cash equities. Equity derivatives also posted solid results. Fixed income and equity trading were impacted by fair value losses of CHF 503 million due to narrower credit spreads in 2Q08 on Credit Suisse debt. Our underwriting and advisory businesses had lower revenues compared to 2Q07, in line with a decline in industry-wide market activity. |
| Compared to 1Q08, income before taxes increased CHF 3,741 million and net revenues increased CHF 4,229 million. Fixed income trading revenues increased, primarily driven by significantly lower valuation reductions in our structured products and leveraged finance businesses, partially offset by weaker results in our global rates and foreign exchange businesses. Equity trading had strong results across most businesses. Net revenues also reflected fair value losses on Credit Suisse debt compared to fair value gains of CHF 1,362 million in 1Q08. Total operating expenses were up CHF 594 million, or 21%, due primarily to higher compensation and benefits, reflecting higher performance-based compensation on the improved revenues. |
| The weakening of the average rate of the US dollar against the Swiss franc from 2Q07 adversely affected revenues and favorably impacted expenses and losses. For information on foreign currency translation rates, refer to VI – Investor information. |
Impact on results of the events in the mortgage and credit markets |
| In 2Q08, despite continued dislocation in the mortgage and credit markets, revenues in our leveraged finance and structured products businesses improved compared to 1Q08, due to significantly lower valuation reductions. Our leveraged finance and structured products (CMBS, RMBS and CDO) businesses had a net valuation reduction of CHF 22 million in 2Q08. The exposures for the leveraged finance and structured products businesses detailed below reflect a risk management rather than a financial reporting perspective. |
| Risk exposures | |||||||||||
| end of | % change | ||||||||||
2Q08 | 1Q08 | 4Q07 | 2Q08 vs. 1Q08 | 2Q08 vs. 4Q07 | |||||||
| Origination-related positions (CHF billion) 1 | |||||||||||
| Unfunded commitments | 11.0 | 13.0 | 24.8 | (15) | (56) | ||||||
| Funded positions | 3.0 | 7.5 | 10.0 | (60) | (70) | ||||||
| Equity bridges | 0.3 | 0.3 | 0.3 | 0 | 0 | ||||||
| Leveraged finance 2 | 14.3 | 20.8 | 35.1 | (31) | (59) | ||||||
| Commercial mortgages | 15.0 | 3 | 19.3 | 25.9 | (22) | (42) | |||||
| Trading-related book positions (CHF billion) 4 | |||||||||||
| US subprime | 0.8 | 1.1 | 1.6 | (27) | (50) | ||||||
| US Alt-A | 1.1 | 1.1 | 2.8 | 0 | (61) | ||||||
| US prime | 0.7 | 0.8 | 1.4 | (13) | (50) | ||||||
| European/Asian | 2.8 | 2.5 | 2.9 | 12 | (3) | ||||||
| Residential mortgages | 5.4 | 5.5 | 8.7 | (2) | (38) | ||||||
| CDO US subprime 5 | 1.1 | 1.9 | 4.6 | (42) | (76) | ||||||
| 1 Exposures shown gross. 2 Excluding term financing of CHF 2.8 billion (USD 2.7 billion) and CHF 2.2 billion (USD 2.2 billion) for executed transactions in 2Q08 and 1Q08, respectively. 3 Reflects the sale of CHF 1.7 billion of loans on a trade-date basis. 4 Exposures shown net. 5 Beginning in 2Q08, we refined our methodology for deriving CDO risk exposures by assuming all underlying assets move to zero value. Our prior methodology used spread sensitivity and duration information. Under our prior methodology, our CDO exposure would have been CHF 0.5 billion, CHF 0.7 billion and CHF 1.6 billion as of the end of 2Q08, 1Q08 and 4Q07, respectively. | |||||||||||
| Net valuation adjustments | |||||||
| in | 2Q08 | 1Q08 | 4Q07 | ||||
| Net valuation adjustments (CHF million) | |||||||
| Leveraged finance 1 | (86) | (1,681) | (231) | ||||
| CMBS 2 | (477) | (848) | (384) | ||||
| RMBS 3 | 33 | (96) | (480) | ||||
| CDO 4 | 508 | (2,656) | (1,341) | ||||
| Total | (22) | (5,281) | (2,436) | ||||
| 1 Including fees, hedges, interest on funded positions, recoveries and executed transactions. 2 Including fees, hedges, interest on funded positions and executed transactions. 3 Including fees, hedges and interest on funded positions. 4 Including hedges. | |||||||
Leveraged Finance |
| Our leveraged finance business had net valuation reductions (including fees, hedges, interest on funded positions, recoveries and executed transactions) of CHF 86 million in 2Q08. Our unfunded non-investment grade loan commitments (both leveraged loan and bridge) were CHF 11.0 billion (USD 10.8 billion) as of the end of 2Q08 versus CHF 13.0 billion (USD 13.1 billion) as of the end of 1Q08. Our funded non-investment grade loans (both leveraged loan and bridge) were CHF 3.0 billion (USD 3.0 bi llion) as of the end of 2Q08 versus CHF 7.5 billion (USD 7.6 billion) as of the end of 1Q08. We have actively pursued reductions in our total exposure through sales and syndications, resulting in significantly lower leveraged finance exposures in 2Q08, with unfunded commitments reduced 15% from the end of 1Q08. Total exposure has been reduced 31% from the end of 1Q08 and 76% from the end of 3Q07. Our funded and unfunded loan commitments exposure to any one borrower has become more concentrated as a result of the significant reduction in our portfolio. Our loan commitments exposure is mainly to US large-cap companies with substantial enterprise values. The leveraged finance business, including origination and trading activities and net valuation adjustments, had losses of CHF 111 million in 2Q08 compared to revenues of CHF 1,202 million in 2Q07 and losses of CHF 1,646 million in 1Q08. |
Structured Products |
| Our CMBS business had net valuation reductions (including fees, hedges, interest on funded positions and executed transactions) of CHF 477 million in 2Q08. Our gross valuation reduction (net of fees) was CHF 530 million. Our commercial mortgages gross exposure was CHF 15.0 billion (USD 14.7 billion) as of the end of 2Q08 versus CHF 19.3 billion (USD 19.5 billion) as of the end of 1Q08. Total exposure has been reduced 22% from the end of 1Q08 and 58% from the end of 3Q07. We have been actively selling both loans and securities in all regions of the world. The majority of our loans are secured by historically stable, high-quality, income-producing real estate to a diverse range of borrowers in Europe, the US and Asia. |
| Our RMBS business had a net valuation gain (including fees, hedges and interest on funded positions) of CHF 33 million in 2Q08. Within our RMBS business, we had net US subprime exposure of CHF 0.8 billion (USD 0.8 billion) as of the end of 2Q08 versus CHF 1.1 billion (USD 1.1 billion) as of the end of 1Q08. Our other RMBS non-agency exposure was CHF 4.6 billion (USD 4.5 billion) as o f the end of 2Q08 versus CHF 4.4 billion (USD 4.5 billion) as of the end of 1Q08. Of this amount, our US Alt-A exposure was CHF 1.1 billion (USD 1.1 billion) as of the end of 2Q08 and 1Q08. |
| Our CDO origination, warehousing and synthetic businesses had a net valuation gain (including hedges) of CHF 508 million in 2Q08. Our CDO business had net subprime exposure of CHF 1.1 billion (USD 1.1 billion) as of the end of 2Q08 versus CHF 1.9 billion (USD 1.9 billion) as of the end of 1Q08. |
| The RMBS and CDO businesses are managed as a trading book on a net basis, and the related gross long and short positions are monitored as part of our risk management activities and price testing procedures. |
| Our structured products businesses, including net valuation adjustments, had revenues of CHF 343 million in 2Q08, compared to revenues of CHF 1,081 million in 2Q07 and losses of CHF 3,388 million in 1Q08. |
Performance indicators |
Pre-tax income margin (KPI) |
| Our target over market cycles is a pre-tax income margin of 30% or greater. In 2Q08, the pre-tax income margin was 7.5% compared to 33.2% in 2Q07, reflecting the difficult operating environment. In 1Q08, the pre-tax income margin was not meaningful given our negative revenues. |
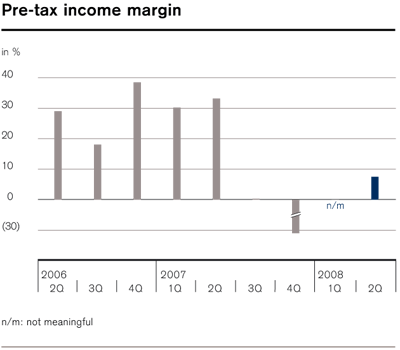 |
Compensation/revenue ratio |
| The 2Q08 compensation/revenue ratio was 65.8% compared to 51.5% in 2Q07, primarily reflecting lower revenues. In 1Q08, the compensation/revenue ratio was not meaningful given our negative revenues. |
Value-at-Risk |
| The 2Q08 average one-day, 99% VaR was CHF 193 million compared to CHF 110 million in 2Q07 and CHF 187 million in 1Q08, primarily reflecting the increase in market volatility. For further information on VaR, refer to IV – Treasury and Risk management – Risk management. |
Pre-tax return on average utilized economic capital |
| The 2Q08 pre-tax return on average utilized economic capital was 7.5% compared to 54.5% in 2Q07 and (76.0)% in 1Q08. |
Significant transactions and achievements |
| We executed a number of significant transactions, reflecting the breadth and diversity of our investment banking franchise: |
| – Debt capital markets: We arranged key financings for a diverse set of clients, including Philip Morris International, Inc. (US tobacco company), Oracle Corp. (US software company), the Republic of the Philippines and Chesapeake Energy Corp. (US natural gas production company). |
| – Equity capital markets: We executed initial public offerings (IPO) for OGX Petroleo Gas Participacoes SA (Brazilian oil and gas production company) and Western Gas Partners, LP (US natural gas company) and an equity offering for Barclays PLC (UK bank). |
| – Mergers and acquisitions: We advised on a number of key transactions that were announced in 2Q08, including the sale of a minority stake in Alcon, Inc. (Swiss specialty medical company) by Nestlé SA (Swiss diversified food company) to Novartis AG (Swiss healthcare solutions provider), the sale of a minority interest in The Carphone Warehouse Group PLC (UK-based mobile phone retailer) to Best Buy Co., Inc. (US electronics retailer), the sale of Wing Lung Bank (Chinese commercial bank) by Wu Jieh Yee Co., Wu Yee Sun Co. and Yee Hong Co. (Chinese holding companies) to China Merchants Bank (Chinese commercial bank) and the sale of an equity interest in Standard Pacific Corp. (US homebuilder) to MatlinPatterson Global Advisors LLC (US private equity firm). |
| We received several industry awards and expanded our ability to serve certain geographic and product markets: |
| – Credit Suisse commenced investment banking operations in China through a newly formed joint venture with Founder Securities. This is an important milestone in the implementation of Credit Suisse’s Asia Pacific growth strategy to establish a global platform for providing financial services and products. |
| – Credit Suisse launched operations in Pakistan, offering equity research and research sales to institutional clients. This is evidence of Credit Suisse’s strong commitment to maintaining a leadership position in global emerging markets. |
| – “Deal of the Year” byThe Banker, including the merger of Capitalia SpA into UniCredito Italiano SpA, the merger of OMX AB into Nasdaq Stock Market, Inc., the acquisition by Enel SpA and Acciona SA of Endesa SA, the sale of Corus Group plc to Tata Steel, Ltd and the IPO of Eurasian Natural Resources Corporation PLC. |
| – “Best Investment Bank of the last twenty years” byLatinFinance. In addition, the Bovespa Holdings SA IPO was voted “Best Equity Deal” and the Companhia Vale do Rio Doce SA acquisition of Inco Ltd was voted “Best M&A Deal.” |
| – Ranked first in Latin America Equity Research byInstitutional Investor.This recognition, combined with the awards byLatinFinance, demonstrate our commitment to the region. |
| – In theFinancial Times World’s Top Analysts awards, Credit Suisse Equity Research ranked first in non-Japan Asia, third in the US and sixth in Europe. |
| – “Best Overall Loan Trading Group” inCredit Investment News’ 11th annual buyside survey. Credit Suisse also took home several team awards, including “Best Sales Force”, “Best Distressed Desk” and “Market Maker Award.” |
| – “Best Sell Side Alternative Execution Service of the Year” in the Trade Tech Awards sponsored byWorld Business Research. |
Results detail |
| The following provides a comparison of our 2Q08 results versus 2Q07 (YoY) and versus 1Q08 (QoQ). |
Net revenues |
| Debt underwriting |
| YoY: Down 70% from CHF 713 million to CHF 216 million |
| The decrease was primarily due to substantially weaker performance in our leveraged finance business, reflecting significantly lower levels of high yield and leveraged lending issuance activity compared to the record levels in 2Q07. The weakness in our leveraged finance business was partially offset by an increase in our high grade business. |
| QoQ: Up 59% from CHF 136 million to CHF 216 million |
| The increase was due to higher industry-wide high grade debt issuance. |
| Equity underwriting |
| YoY: Down 41% from CHF 413 million to CHF 245 million |
| The decrease was primarily due to significantly lower levels of industry-wide equity issuance, resulting from lower equity market valuations in 2Q08 compared with the favorable equity markets in 2Q07, and a decline in market share. The number of IPOs declined significantly during the quarter as many transactions were pulled from the market. |
| QoQ: Up 42% from CHF 172 million to CHF 245 million |
| The increase was primarily due to higher industry-wide equity issuance. |
| Advisory and other fees |
| YoY: Down 42% from CHF 632 million to CHF 364 million |
| The decrease was in line with lower levels of global mergers and acquisitions activity. The decrease was also driven by a decline in revenues from the private fund group, which raises capital for hedge funds, private equity and real estate funds. |
| QoQ: Down 8% from CHF 396 million to CHF 364 million |
| The decrease was primarily due to lower announced and completed mergers and acquisitions activity over the past several quarters as well as a decline in market share, offset in part by higher revenues from the private fund group, which had seasonally lower revenues in 1Q08. |
| Fixed income trading |
| YoY: Down 90% from CHF 3,282 million to CHF 320 million |
| The decrease was primarily due to valuation reductions in our leveraged finance and CMBS businesses as well as lower levels of origination activity across the structured products businesses, lower secondary trading activity in leveraged finance, a decline in revenues from the global rates business and fair value losses of CHF 453 million on Credit Suisse debt. Revenues from the global rates business declined significantly compared to 2Q07, primarily due to losses incurred as a result of the sharp shift in the euro yield curve in June. The fixed income proprietary trading business also had weaker revenues. Despite the challenging market conditions, certain businesses, including RMBS, Europe high grade and life finance, performed well during the quarter, and we recorded valuation gains in our RMBS and CDO businesses. |
| QoQ: From CHF (1,576) million to CHF 320 million |
| The increase was driven by the improved performance of our structured products and leveraged finance businesses, mainly from lower valuation reductions. The result also reflected fair value losses of CHF 453 million on Credit Suisse debt compared to fair value gains of CHF 1,226 million in 1Q08, and weaker results in our global rates and foreign exchange businesses. |
| Equity trading |
| YoY: Down 9% from CHF 2,475 million to CHF 2,255 million |
| The decrease was primarily due to lower revenues in equity proprietary trading compared to the strong results in 2Q07, lower revenues in convertibles reflecting a decline in industry issuance and fair value losses of CHF 50 million on Credit Suisse debt. The decrease was partially offset by near-record revenues in prime services, which continued to show strong growth in client balances and new client mandates. We also recorded strong revenues in equity derivatives across all regions and products, although the level was down from a record 2Q07. Our global cash business revenues were strong, increasing slightly and reflecting continued high trading volumes and client flows as well as the continued strong performance of our Advanced Execution Services business. |
| QoQ: Up 64% from CHF 1,379 million to CHF 2,255 million |
| The increase was driven by strong results in equity proprietary trading compared to the loss in 1Q08, solid results in equity derivatives and stronger results in our global cash and convertibles businesses, offset in part by fair value losses of CHF 50 million on Credit Suisse debt compared to fair value gains of CHF 136 million in 1Q08. |
| Other |
| YoY: From CHF 23 million to CHF 340 million |
| The increase was primarily due to valuation gains of CHF 308 million on our leveraged finance bridge commitments, partially offset by lower gains from private equity-related investments not managed as part of Asset Management. |
| QoQ: From CHF (996) million to CHF 340 million |
| The increase was primarily due to the valuation gains on our leveraged finance bridge commitments compared to valuation reductions of CHF 709 million in 1Q08. |
Provision for credit losses |
| YoY: Up 456% from CHF 9 million to CHF 50 million |
| The increase was primarily due to additional provisions relating to a guarantee provided in a prior year to a third-party bank. |
| QoQ: Down 68% from CHF 156 million to CHF 50 million |
| The decrease was primarily due to lower provisions in 2Q08 relating to the third-party bank guarantee. |
Operating expenses |
| Compensation and benefits |
| YoY: Down 37% from CHF 3,882 million to CHF 2,462 million |
| The decrease was primarily due to significantly lower performance-related compensation reflecting lower revenues, partially offset by an increase in deferred compensation expense. |
| QoQ: Up 43% from CHF 1,718 million to CHF 2,462 million |
| The increase was primarily due to significantly higher performance-related compensation, reflecting higher revenues, and increased deferred compensation expense. |
| General and administrative expenses |
| YoY: Down 19% from CHF 803 million to CHF 652 million |
| General and administrative expenses decreased 19%, primarily reflecting a net credit of CHF 134 million, which included the release from our reserve for certain private litigation matters, partially offset by the charge related to the Parmalat settlement. In US dollar terms, most other general and administrative expenses increased, reflecting the growth in employment levels and higher non-recoverable legal fees and travel and entertainment expenses resulting from delayed or cancelled transactions. |
| QoQ: Down 13% from CHF 748 million to CHF 652 million |
| The decrease was due to the litigation matters. Excluding the litigation matters, general and administrative expenses increased, primarily due to a seasonal rise in firm-wide recruitment costs and the reversal of a value-added tax provision in 1Q08. |
Personnel |
| Headcount was slightly down from the end of 1Q08. We are rebalancing our businesses by shifting resources to take advantage of areas with robust growth opportunities, such as prime services and derivatives. |
Asset Management |
| In 2Q08, we recorded income before taxes of CHF 167 million, including valuation gains of CHF 79 million from securities purchased from our money market funds. The gross margin before these gains and private equity and other investment-related gains was stable as revenues declined in line with assets under management. Net new assets in alternative investments were strong. |
| Results | |||||||||||||||||
| in / end of | % change | in / end of | % change | ||||||||||||||
| 2Q08 | 1Q08 | 2Q07 | QoQ | YoY | 6M08 | 6M07 | YoY | ||||||||||
| Statements of income (CHF million) | |||||||||||||||||
| Net revenues | 739 | 1 | 63 | 1 | 853 | – | (13) | 802 | 1 | 1,629 | (51) | ||||||
| Provision for credit losses | 0 | 0 | 0 | – | – | 0 | 0 | – | |||||||||
| Compensation and benefits | 336 | 2 | 304 | 314 | 11 | 7 | 640 | 2 | 610 | 5 | |||||||
| General and administrative expenses | 160 | 151 | 135 | 6 | 19 | 311 | 257 | 21 | |||||||||
| Commission expenses | 76 | 76 | 105 | 0 | (28) | 152 | 206 | (26) | |||||||||
| Total other operating expenses | 236 | 227 | 240 | 4 | (2) | 463 | 463 | 0 | |||||||||
| Total operating expenses | 572 | 531 | 554 | 8 | 3 | 1,103 | 1,073 | 3 | |||||||||
| Income/(loss) before taxes | 167 | (468) | 299 | – | (44) | (301) | 556 | – | |||||||||
| Statement of income metrics (%) | |||||||||||||||||
| Compensation/revenue ratio | 45.5 | – | 36.8 | – | – | 79.8 | 37.4 | – | |||||||||
| Non-compensation/revenue ratio | 31.9 | – | 28.1 | – | – | 57.7 | 28.4 | – | |||||||||
| Cost/income ratio | 77.4 | – | 64.9 | – | – | 137.5 | 65.9 | – | |||||||||
| Pre-tax income margin | 22.6 | – | 35.1 | – | – | (37.5) | 34.1 | – | |||||||||
| Utilized economic capital and return | |||||||||||||||||
| Average utilized economic capital (CHF million) | 2,155 | 2,102 | 1,586 | 3 | 36 | 2,145 | 1,575 | 36 | |||||||||
| Pre-tax return on average utilized economic capital (%) 3 | 32.9 | (86.9) | 78.9 | – | – | (26.1) | 74.1 | – | |||||||||
| Balance sheet statistics (CHF million) | |||||||||||||||||
| Total assets | 24,834 | 26,673 | 23,929 | (7) | 4 | 24,834 | 23,929 | 4 | |||||||||
| Goodwill | 2,116 | 2,063 | 2,439 | 3 | (13) | 2,116 | 2,439 | (13) | |||||||||
| Number of employees (full-time equivalents) | |||||||||||||||||
| Number of employees | 3,700 | 3,600 | 3,300 | 3 | 12 | 3,700 | 3,300 | 12 | |||||||||
| 1 Includes valuation gains/(reductions) of CHF 79 million, CHF (566) million and CHF (487) million in 2Q08, 1Q08 and 6M08, respectively, from securities purchased from our money market funds. 2 Includes severance costs of CHF 23 million. 3 Calculated using a return excluding interest costs for allocated goodwill. | |||||||||||||||||
| Results (continued) | |||||||||||||||||
| in / end of | % change | in / end of | % change | ||||||||||||||
| 2Q08 | 1Q08 | 2Q07 | QoQ | YoY | 6M08 | 6M07 | YoY | ||||||||||
| Net revenue detail (CHF million) | |||||||||||||||||
| Equities | 82 | 82 | 108 | 0 | (24) | 164 | 217 | (24) | |||||||||
| Fixed income | 70 | 79 | 97 | (11) | (28) | 149 | 190 | (22) | |||||||||
| Securities purchased from our money market funds | 79 | (566) | – | – | – | (487) | – | – | |||||||||
| Other 1 | 31 | 36 | 46 | (14) | (33) | 67 | 120 | (44) | |||||||||
| Global investors | 262 | (369) | 251 | – | 4 | (107) | 527 | – | |||||||||
| Multi-asset class solutions | 151 | 155 | 166 | (3) | (9) | 306 | 326 | (6) | |||||||||
| Private equity | 36 | 101 | 67 | (64) | (46) | 137 | 111 | 23 | |||||||||
| Real estate | 54 | 64 | 59 | (16) | (8) | 118 | 110 | 7 | |||||||||
| Credit strategies | 24 | 32 | 37 | (25) | (35) | 56 | 65 | (14) | |||||||||
| Hedge fund strategies | 68 | 64 | 82 | 6 | (17) | 132 | 167 | (21) | |||||||||
| Other 2 | 94 | 35 | 2 | 169 | – | 129 | 6 | – | |||||||||
| Alternative investment strategies | 276 | 296 | 247 | (7) | 12 | 572 | 459 | 25 | |||||||||
| Net revenues before private equity and other investment-related gains | 689 | 82 | 664 | – | 4 | 771 | 1,312 | (41) | |||||||||
| Private equity and other investment-related gains/(losses) | 50 | (19) | 189 | – | (74) | 31 | 317 | (90) | |||||||||
| Net revenues | 739 | 63 | 853 | – | (13) | 802 | 1,629 | (51) | |||||||||
| Gross and net margin on assets under management (bp) | |||||||||||||||||
| Gross margin before private equity and other investment-related gains | 45 | 5 | 36 | – | – | 24 | 37 | – | |||||||||
| Gross margin on private equity and other investment- related gains/(losses) | 3 | (1) | 11 | – | – | 1 | 9 | – | |||||||||
| Gross margin | 48 | 4 | 47 | – | – | 25 | 46 | – | |||||||||
| Net margin (pre-tax) | 11 | (29) | 16 | – | – | (9) | 16 | – | |||||||||
| 1 Includes institutional pension advisory business and Credit Suisse (Brasil). 2 Includes Hedging-Griffo. | |||||||||||||||||
Operating environment |
| While showing a modest improvement, the operating environment remained challenging in 2Q08. Economic data continued to indicate a deceleration of the US economy, with slowing growth, a softening labor market, weakening consumer spending and the ongoing correction in the housing market. Increasing energy and agricultural product prices resulted in growing concern over rising inflation. Conditions in emerging markets were more favorable as these economies continued their growth, albeit at a slower rate. |
| In the fixed income markets, new issuance volumes in both unsecured and structured products strengthened in 2Q08. Credit conditions improved in April and May but deteriorated again at the end of June with a general widening of credit spreads and poor liquidity. Global equity markets deteriorated, with most equity markets showing year-to-date losses as of the end of 2Q08. |
| Investor focus was on low risk strategies. Client flows were mainly in absolute return funds, longer duration government bonds and those sectors and companies less vulnerable to a global slow down, with strong cash flows and minimal leverage. Other investment opportunities increased, including distressed assets and commodities in alternative investments and emerging markets. |
Results summary |
| In 2Q08, income before taxes was CHF 167 million, compared to CHF 299 million in 2Q07. Valuation gains of CHF 79 million on securities purchased from our money market funds and semi-annual performance-based fees were more than offset by lower private equity and other investment-related gains, lower asset management and administrative revenues, reflecting the decline in average assets under management, and higher funding costs. We continued to manage down our exposure to securities purchased from our money market funds. |
| Net revenues were CHF 739 million, down CHF 114 million, or 13%, compared to 2Q07. Net revenues of CHF 610 million before securities purchased from our money market funds and private equity and other investment-related gains were down CHF 54 million, or 8%, from 2Q07 (refer to the table “Results before securities purchased from our money market funds”). Asset management and administrative fees for both global investors and multi-asset class solutions were lower compared to 2Q07, reflecting the significant decline in average assets under management. Asset management and administrative fees were higher for alternative investments, primarily due to performance fees from Hedging-Griffo, offset in part by higher funding costs. Private equity and other investment-related gains were CHF 50 million, compared to CHF 189 million in 2Q07. |
| Total operating expenses were CHF 572 million, up CHF 18 million, or 3%, compared to 2Q07. Compensation and benefits were up 7%, reflecting severance costs of CHF 23 million and increased salaries and benefits due to higher headcount, offset in part by lower performance-related compensation. General and administrative expenses increased 19%, reflecting higher occupancy costs, costs from Hedging-Griffo and professional fees, while commission expenses decreased 28%. |
| Assets under management of CHF 605.0 billion as of the end of 2Q08 were stable from the end of 1Q08, primarily reflecting favorable foreign exchange-related movements, and down CHF 144.6 billion, or 19.3%, from the end of 2Q07, primarily reflecting net new asset outflows and adverse foreign exchange-related and market movements. Net new asset outflows in 2Q08 of CHF 3.8 billion included outflows of CHF 10.0 billion of institutional pension advisory assets, CHF 4.9 billion in fixed income assets, CHF 2.0 billion in multi-asset class solutions and CHF 0.2 billion of equity assets, partly offset by inflows of CHF 7.5 billion in alternative investments and CHF 6.8 billion in money market assets. The inflows in alternative investments demonstrated our strength in this strategy, and the inflows in money markets reflected the stabilization of our money market funds. |
| Compared to 1Q08, income before taxes increased, reflecting valuation gains of CHF 79 million on securities purchased from our money market funds compared to valuation reductions of CHF 566 million in 1Q08, semi-annual performance-based fees and higher private equity and other investment-related gains. Total operating expenses were up CHF 41 million, or 8%, primarily due to higher compensation and benefits. |
Securities purchased from our money market funds |
| In the second half of 2007, we repositioned our money market funds by purchasing securities from these funds with the intent to eliminate structured investment vehicle (SIV), ABS CDO and US subprime exposure. The securities transactions were executed in order to address liquidity concerns caused by the US market’s challenging conditions. We had no legal obligation to purchase these securities. Valuations gains on these securities were CHF 79 million in 2Q08, including gains on hedges. As of the end of 2Q08, the fair value of our balance sheet exposure from these purchased securities was CHF 1.5 billion, down CHF 724 million, or 32%, from 1Q08. The majority of this exposure is mortgage-backed and CHF 165 million is US subprime, compared to CHF 217 million as of the end of 1Q08. |
| Of the CHF 1.5 billion balance sheet exposure, CHF 1.1 billion were securities issued by SIVs, of which the two largest positions totaled CHF 919 million. ABS exposures were CHF 264 million, with the two largest positions totaling CHF 207 million. Corporate securities, most of which are floating rate notes, totaled CHF 185 million. |
| Results before securities purchased from our money market funds | |||||||||||||||||
| in / end of | % change | in / end of | % change | ||||||||||||||
| 2Q08 | 1Q08 | 2Q07 | QoQ | YoY | 6M08 | 6M07 | YoY | ||||||||||
| Statements of income (CHF million) | |||||||||||||||||
| Net revenues before private equity and other investment-related gains | 610 | 648 | 664 | (6) | (8) | 1,258 | 1,312 | (4) | |||||||||
| Private equity and other investment- related gains/(losses) | 50 | (19) | 189 | – | (74) | 31 | 317 | (90) | |||||||||
| Net revenues | 660 | 629 | 853 | 5 | (23) | 1,289 | 1,629 | (21) | |||||||||
| Provision for credit losses | 0 | 0 | 0 | – | – | 0 | 0 | – | |||||||||
| Compensation and benefits | 336 | 304 | 314 | 11 | 7 | 640 | 610 | 5 | |||||||||
| Total other operating expenses | 236 | 227 | 240 | 4 | (2) | 463 | 463 | 0 | |||||||||
| Total operating expenses | 572 | 531 | 554 | 8 | 3 | 1,103 | 1,073 | 3 | |||||||||
| Income/(loss) before taxes | 88 | 98 | 299 | (10) | (71) | 186 | 556 | (67) | |||||||||
| Statement of income metrics (%) | |||||||||||||||||
| Compensation/revenue ratio | 50.9 | 48.3 | 36.8 | – | – | 49.7 | 37.4 | – | |||||||||
| Non-compensation/revenue ratio | 35.8 | 36.1 | 28.1 | – | – | 35.9 | 28.4 | – | |||||||||
| Cost/income ratio | 86.7 | 84.4 | 64.9 | – | – | 85.6 | 65.9 | – | |||||||||
| Pre-tax income margin | 13.3 | 15.6 | 35.1 | – | – | 14.4 | 34.1 | – | |||||||||
| Gross and net margin on assets under management (bp) | |||||||||||||||||
| Gross margin before private equity and other investment-related gains | 40 | 40 | 36 | – | – | 40 | 37 | – | |||||||||
| Gross margin on private equity and other investment- related gains/(losses) | 3 | (1) | 11 | – | – | 1 | 9 | – | |||||||||
| Gross margin | 43 | 39 | 47 | – | – | 41 | 46 | – | |||||||||
| Net margin (pre-tax) | 6 | 6 | 16 | – | – | 6 | 16 | – | |||||||||
| Management believes that results before securities purchased from our money market funds is meaningful as it more appropriately reflects the performance of the ongoing business. | |||||||||||||||||
| Securities purchased from our money market funds | |||||||||||||||
| Fair value end of 1Q08 | Purchased | Net gains/ (losses) | Sold | Matured/ restruc- tured | Foreign exchange | Fair value end of 2Q08 | |||||||||
| CP, bonds and other securities issued by (CHF million) | |||||||||||||||
| Structured investment vehicles | 1,535 | 0 | (77) | (25) | (421) | 61 | 1,073 | ||||||||
| Asset-backed securities vehicles | 528 | 0 | 68 | (308) | (45) | 21 | 264 | ||||||||
| Corporates | 183 | 0 | (3) | 0 | 1 | 4 | 185 | ||||||||
| Total | 2,246 | 0 | (12) | 1 | (333) | (465) | 86 | 1,522 | |||||||
| 1 Excluding CHF 91 million relating to hedging gains. | |||||||||||||||
| Revenue details on securities purchased from our money market funds | |||||||||||||||||
| in / end of | % change | in / end of | % change | ||||||||||||||
| 2Q08 | 1Q08 | 2Q07 | QoQ | YoY | 6M08 | 6M07 | YoY | ||||||||||
| Revenue details (CHF million) | |||||||||||||||||
| Realized gains/(losses) | (57) | (40) | – | 43 | – | (97) | – | – | |||||||||
| Unrealized gains/(losses) | 136 | (526) | – | – | – | (390) | – | – | |||||||||
| Securities purchased from our money market funds | 79 | (566) | – | – | – | (487) | – | – | |||||||||
Performance indicators |
Pre-tax income margin (KPI) |
| Our target over market cycles is a pre-tax income margin above 35%. The pre-tax margin was 22.6% in 2Q08, 35.1% in 2Q07 and not meaningful in 1Q08 given our negative results. The pre-tax margin before securities purchased from our money market funds was 13.3%, compared to 35.1% in 2Q07 and 15.6% in 1Q08. |
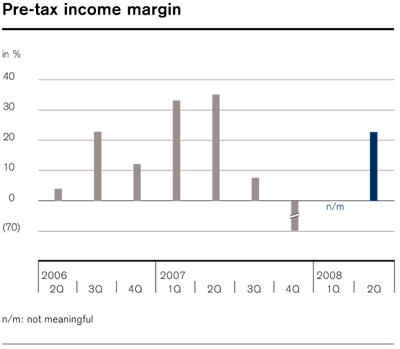 |
Net new asset growth rate |
| In 2Q08, the annualized growth rate was (2.5)%, compared to 11.5% in 2Q07 and (11.7)% in 1Q08, and the rolling four-quarter average growth rate was (9.3)%, compared to 11.0% in 2Q07 and (6.4)% in 1Q08. |
Gross margin |
| The gross margin on assets under management was 48 basis points in 2Q08, compared to 47 basis points in 2Q07 and four basis points in 1Q08. The gross margin on assets under management before securities purchased from our money market funds and private equity and other investment-related gains was 40 basis points in 2Q08 and 1Q08, compared to 36 basis points in 2Q07. |
Initiatives and achievements |
| In 2Q08, we were awarded diverse mandates and realized the following opportunities for growth and diversification: |
| – Global Infrastructure Partners (GIP) completed fundraising of USD 5.6 billion in its first fund. GIP has made investments in London City Airport, Great Yarmouth Port, East India Petroleum Limited, International Trade Logistics and Biffa PLC. |
| – Credit Suisse launched the Long/Short Equity Replication Index, the first planned suite of alternative index replication products designed to track the performance of major hedge fund strategies. This index aims to capture the risk/return characteristics of the Credit Suisse/Tremont Long/Short Equity Hedge Fund Index. |
| – We launched a number of funds in 2Q08, including a multi-manager multi-asset growth fund, a fund in the UK focusing on equity investment themes, such as releveraging and climate change, and a global income fund. |
Results detail |
| The following provides a comparison of our 2Q08 results versus 2Q07 (YoY) and versus 1Q08 (QoQ). |
Net revenues |
| Net revenues before private equity and other investment-related gains include asset management fees, performance-based fees, fees from fund administration services provided to clients and securities purchased from our money market funds. Private equity and other investment-related gains include realized and unrealized gains and losses on investments and performance-related carried interest. |
| Global investors |
| YoY: Up 4% from CHF 251 million to CHF 262 million |
| The increase was mainly due to valuation gains of CHF 79 million on securities purchased from our money market funds, mostly offset by lower revenues in equities, fixed income and the institutional pension advisory business, reflecting lower average assets under management. |
| QoQ: From CHF (369) million to CHF 262 million |
| The increase was mainly due to valuation gains on securities purchased from our money market funds in 2Q08 versus valuation reductions of CHF 566 million in 1Q08. Revenues from equities were stable. The decline in fixed income revenues primarily reflected a decline in assets under management in European mandates. |
| Assets under management - Asset Management | |||||||||||||||||
| in / end of | % change | in / end of | % change | ||||||||||||||
| 2Q08 | 1Q08 | 2Q07 | QoQ | YoY | 6M08 | 6M07 | YoY | ||||||||||
| Assets under management (CHF billion) | |||||||||||||||||
| Equities | 33.7 | 31.1 | 46.5 | 8.4 | (27.5) | 33.7 | 46.5 | (27.5) | |||||||||
| Fixed income | 155.7 | 150.7 | 241.5 | 3.3 | (35.5) | 155.7 | 241.5 | (35.5) | |||||||||
| Other 1 | 84.1 | 92.8 | 111.3 | (9.4) | (24.4) | 84.1 | 111.3 | (24.4) | |||||||||
| Global investors | 273.5 | 274.6 | 399.3 | (0.4) | (31.5) | 273.5 | 399.3 | (31.5) | |||||||||
| Multi-asset class solutions | 163.9 | 165.4 | 186.1 | (0.9) | (11.9) | 163.9 | 186.1 | (11.9) | |||||||||
| Private equity | 32.5 | 28.9 | 30.4 | 12.5 | 6.9 | 32.5 | 30.4 | 6.9 | |||||||||
| Real estate | 37.4 | 35.6 | 34.0 | 5.1 | 10.0 | 37.4 | 34.0 | 10.0 | |||||||||
| Credit strategies | 19.9 | 17.7 | 27.5 | 12.4 | (27.6) | 19.9 | 27.5 | (27.6) | |||||||||
| Hedge fund strategies | 63.9 | 60.8 | 66.2 | 5.1 | (3.5) | 63.9 | 66.2 | (3.5) | |||||||||
| Other 2 | 13.9 | 17.4 | 6.1 | (20.1) | 127.9 | 13.9 | 6.1 | 127.9 | |||||||||
| Alternative investment strategies | 167.6 | 160.4 | 164.2 | 4.5 | 2.1 | 167.6 | 164.2 | 2.1 | |||||||||
| Assets under Management | 605.0 | 600.4 | 749.6 | 0.8 | (19.3) | 605.0 | 749.6 | (19.3) | |||||||||
| of which discretionary assets | 534.6 | 520.8 | 646.2 | 2.6 | (17.3) | 534.6 | 646.2 | (17.3) | |||||||||
| of which advisory assets | 70.4 | 79.6 | 103.4 | (11.6) | (31.9) | 70.4 | 103.4 | (31.9) | |||||||||
| Assets under management by currency (CHF billion) | |||||||||||||||||
| USD | 167.0 | 150.0 | 240.7 | 11.3 | (30.6) | 167.0 | 240.7 | (30.6) | |||||||||
| EUR | 101.6 | 98.8 | 110.0 | 2.8 | (7.6) | 101.6 | 110.0 | (7.6) | |||||||||
| CHF | 260.0 | 268.4 | 312.7 | (3.1) | (16.9) | 260.0 | 312.7 | (16.9) | |||||||||
| Other | 76.4 | 83.2 | 86.2 | (8.2) | (11.4) | 76.4 | 86.2 | (11.4) | |||||||||
| Assets under management | 605.0 | 600.4 | 749.6 | 0.8 | (19.3) | 605.0 | 749.6 | (19.3) | |||||||||
| Growth in assets under management (CHF billion) | |||||||||||||||||
| Net new assets | (3.8) | (20.2) | 20.4 | – | – | (24.0) | 49.4 | – | |||||||||
| Acquisitions and divestitures | 0.0 | 0.0 | 0.0 | – | – | 0.0 | 0.0 | – | |||||||||
| Market movements | 3.8 | (34.0) | 15.4 | – | – | (30.2) | 24.2 | – | |||||||||
| Currency | 11.2 | (37.0) | 5.2 | – | – | (25.8) | 7.0 | – | |||||||||
| Other | (6.6) | 0.3 | 0.0 | – | – | (6.3) | (0.9) | – | |||||||||
| Total other effects | 8.4 | (70.7) | 20.6 | – | – | (62.3) | 30.3 | – | |||||||||
| Growth in assets under management | 4.6 | (90.9) | 41.0 | &n dash; | – | (86.3) | 79.7 | – | |||||||||
| Growth in assets under management (annualized) (%) | |||||||||||||||||
| Net new assets | (2.5) | (11.7) | 11.5 | – | – | (6.9) | 14.8 | – | |||||||||
| Total other effects | 5.6 | (40.9) | 11.6 | – | – | (18.0) | 9.0 | – | |||||||||
| Growth in assets under management | 3.1 | (52.6) | 23.1 | &n dash; | – | (24.9) | 23.8 | – | |||||||||
| Growth in assets under management (rolling four-quarter average) (%) | |||||||||||||||||
| Net new assets | (9.3) | (6.4) | 11.0 | – | – | – | – | – | |||||||||
| Total other effects | (10.0) | (8.8) | 10.8 | – | – | – | – | – | |||||||||
| Growth in assets under management (rolling four-quarter average) | (19.3) | (15.2) | 21.8 | – | – | – | – | – | |||||||||
| Private equity investments (CHF billion) | |||||||||||||||||
| Private equity investments | 4.1 | 3.8 | 3.0 | 7.9 | 36.7 | 4.1 | 3.0 | 36.7 | |||||||||
| The classification of assets is based upon the classification of the fund manager. | |||||||||||||||||
| 1 Includes institutional pension advisory business and Credit Suisse (Brasil). 2 Includes Hedging-Griffo. | |||||||||||||||||
| Multi-asset class solutions |
| YoY: Down 9% from CHF 166 million to CHF 151 million |
| The decrease was mainly due to lower average assets under management and lower performance-based fees, partly from our alternative and derivative funds. |
| QoQ: Down 3% from CHF 155 million to CHF 151 million |
| The decrease reflected lower asset management and administrative fees, primarily performance-based fees from our alternative and derivative funds. |
| Alternative investment strategies |
| YoY: Up 12% from CHF 247 million to CHF 276 million |
| The increase reflected lower asset management and administrative fees across investment strategies, primarily due to semi-annual performance-based fees, primarily from Hedging-Griffo, partly offset by higher funding costs. |
| QoQ: Down 7% from CHF 296 million to CHF 276 million |
| This decrease was mainly due to the higher funding costs, offset in part by the performance-based fees. |
| Private equity and other investment-related gains |
| YoY: Down 74% from CHF 189 million to CHF 50 million |
| The decrease was primarily due to the adverse effects of the credit crisis on valuations and exit strategies. 2Q08 revenues included unrealized gains from investments in energy-related companies. |
| QoQ: From CHF (19) million to CHF 50 million |
| The increase was primarily due to unrealized losses in 1Q08, which reflected significant valuation declines in China-related public company investments. |
Operating expenses |
| Compensation and benefits |
| YoY: Up 7% from CHF 314 million to CHF 336 million |
| The increase mainly reflectedincreased salaries and benefits, due to severance costs of CHF 23 million and increased headcount, offset in part by lower performance-related compensation. |
| QoQ: Up 11% from CHF 304 million to CHF 336 million |
| The increase was mainly due to increased salaries and benefits, including severance costs, and higher performance-related compensation, reflecting improved revenues. |
| General and administrative expenses |
| YoY: Up 19% from CHF 135 million to CHF 160 million |
| The increase mainly reflected higher occupancy costs, costs from Hedging-Griffo and increased professional fees. |
| QoQ: Up 6% from CHF 151 million to CHF 160 million |
| The increase was primarily due to higher professional fees, offset in part by a release of provisions for litigation. Other general and administrative expenses were stable. |
Personnel |
| In 2Q08, headcount was up 400 from 2Q07, which did not include Hedging-Griffo. Since 2Q07, we have continued to hire investment talent and build product development and distribution capabilities, particularly in alternative investment strategies. During 2Q08, we have announced reductions in headcount in line with our strategy, which we expect to be reflected in our headcount numbers in the future. |
III – Overview of Results and Assets under Management |
Results |
Assets under Management |
Results |
| Private Banking | Investment Banking | Asset Management | Corporate Center | Core Results | 1 | Credit Suisse | |||||||||||||||||||||||||||||||||||||||||||
| Wealth Management | Corporate & Retail Banking | ||||||||||||||||||||||||||||||||||||||||||||||||
| in / end of period | 2Q08 | 1Q08 | 2Q07 | 2Q08 | 1Q08 | 2Q07 | 2Q08 | 1Q08 | 2Q07 | 2Q08 | 1Q08 | 2Q07 | 2Q08 | 1Q08 | 2Q07 | 2Q08 | 1Q08 | 2Q07 | 2Q08 | 1Q08 | 2Q07 | 2Q08 | 1Q08 | 2Q07 | |||||||||||||||||||||||||
| Statements of income (CHF million) | |||||||||||||||||||||||||||||||||||||||||||||||||
| Net revenues | 2,278 | 2,313 | 2,384 | 9 87 | 2 | 1,042 | 2 | 969 | 3,265 | 3,355 | 3,353 | 3,740 | 3 | (489) | 3 | 7,538 | 739 | 4 | 63 | 4 | 853 | 86 | 90 | (41) | 7,830 | 3,019 | 11,703 | 8,137 | 3,095 | 13,037 | |||||||||||||||||||
| Provision for credit losses | 0 | 4 | (1) | (5) | (9) | (28) | (5) | (5) | (29) | 50 | 156 | 9 | 0 | 0 | 0 | 0 | 0 | 0 | 45 | 151 | (20) | 45 | 151 | (20) | |||||||||||||||||||||||||
| Compensation and benefits | 814 | 806 | 788 | 346 | 355 | 339 | 1,160 | 1,161 | 1,127 | 2,462 | 1,718 | 3,882 | 336 | 5 | 304 | 314 | 103 | 62 | 63 | 4,061 | 3,245 | 5,386 | 4,076 | 3,264 | 5,409 | ||||||||||||||||||||||||
| General and administrative expenses | 473 | 462 | 415 | 225 | 204 | 245 | 698 | 666 | 660 | 652 | 6 | 748 | 803 | 160 | 151 | 135 | 33 | 6 | 11 | 1,543 | 1,571 | 1,609 | 1,565 | 1,585 | 1,619 | ||||||||||||||||||||||||
| Commission expenses | 161 | 181 | 181 | 31 | 28 | 33 | 192 | 209 | 214 | 295 | 349 | 342 | 76 | 76 | 105 | 47 | (10) | (19) | 610 | 624 | 642 | 610 | 624 | 642 | |||||||||||||||||||||||||
| Total other operating expenses | 634 | 643 | 596 | 256 | 232 | 278 | 890 | 875 | 874 | 947 | 1,097 | 1,145 | 236 | 227 | 240 | 80 | (4) | (8) | 2,153 | 2,195 | 2,251 | 2,175 | 2,209 | 2,261 | |||||||||||||||||||||||||
| Total operating expenses | 1,448 | 1,449 | 1,384 | 602 | 587 | 617 | 2,050 | 2,036 | 2,001 | 3,409 | 2,815 | 5,027 | 572 | 531 | 554 | 183 | 58 | 55 | 6,214 | 5,440 | 7,637 | 6,251 | 5,473 | 7,670 | |||||||||||||||||||||||||
| Income/(loss) before taxes | 830 | 860 | 1,001 | 390 | 464 | 380 | 1,220 | 1,324 | 1,381 | 281 | (3,460) | 2,502 | 167 | (468) | 299 | (97) | 32 | (96) | 1,571 | (2,572) | 4,086 | 1,841 | (2,529) | 5,387 | |||||||||||||||||||||||||
| Income tax expense/(benefit) | – | – | – | – | – | – | – | – | – | – | – | – | – | – | – | – | – | – | 297 | (455) | 863 | 297 | (455) | 863 | |||||||||||||||||||||||||
| Minority interests | – | – | – | – | – | – | – | – | – | – | – | – | – | – | – | – | – | – | 59 | 31 | 34 | 329 | 74 | 1,335 | |||||||||||||||||||||||||
| Net income/(loss) | – | – | – | – | – | – | – | – | – | – | – | – | – | – | – | – | – | – | 1,215 | (2,148) | 3,189 | 1,215 | (2,148) | 3,189 | |||||||||||||||||||||||||
| Statement of income metrics (%) | |||||||||||||||||||||||||||||||||||||||||||||||||
| Compensation/revenue ratio | 35.7 | 34.8 | 33.1 | 35.1 | 34.1 | 35.0 | 35.5 | 34.6 | 33.6 | 65.8 | – | 51.5 | 45.5 | – | 36.8 | – | – | – | 51.9 | 107.5 | 46.0 | 50.1 | 105.5 | 41.5 | |||||||||||||||||||||||||
| Non-compensation/revenue ratio | 27.8 | 27.8 | 25.0 | 25.9 | 22.3 | 28.7 | 27.3 | 26.1 | 26.1 | 25.3 | – | 15.2 | 31.9 | – | 28.1 | – | – | – | 27.5 | 72.7 | 19.2 | 26.7 | 71.4 | 17.3 | |||||||||||||||||||||||||
| Cost/income ratio | 63.6 | 62.6 | 58.1 | 61.0 | 56.3 | 63.7 | 62.8 | 60.7 | 59.7 | 91.1 | – | 66.7 | 77.4 | – | 64.9 | – | – | – | 79.4 | 180.2 | 65.3 | 76.8 | 176.8 | 58.8 | |||||||||||||||||||||||||
| Pre-tax income margin | 36.4 | 37.2 | 42.0 | 39.5 | 44.5 | 39.2 | 37.4 | 39.5 | 41.2 | 7.5 | – | 33.2 | 22.6 | – | 35.1 | – | – | – | 20.1 | (85.2) | 34.9 | 22.6 | (81.7) | 41.3 | |||||||||||||||||||||||||
| Effective tax rate | – | – | – | – | – | – | – | – | – | – | – | – | – | – | – | – | – | – | 18.9 | 17.7 | 21.1 | 16.1 | 18.0 | 16.0 | |||||||||||||||||||||||||
| Net income margin | – | – | – | – | – | – | – | – | – | – | – | – | – | – | – | – | – | – | 15.5 | (71.1) | 27.2 | 14.9 | (69.4) | 24.5 | |||||||||||||||||||||||||
| Utilized economic capital and return | |||||||||||||||||||||||||||||||||||||||||||||||||
| Average utilized economic capital (CHF million) | 2,070 | 1,987 | 1,701 | 3,420 | 3,383 | 3,416 | 5,490 | 5,370 | 5,117 | 16,559 | 18,031 | 18,782 | 2,155 | 2,102 | 1,586 | 767 | 7 | 581 | 7 | 1,229 | 7 | 24,930 | 26,063 | 26,684 | 24,930 | 26,063 | 26,684 | ||||||||||||||||||||||
| Pre-tax return on average utilized economic capital (%) 8 | 162.0 | 174.9 | 237.7 | 45.7 | 54.9 | 44.6 | 89.5 | 99.3 | 108.8 | 7.5 | (76.0) | 54.5 | 32.9 | (86.9) | 78.9 | – | – | – | 26.0 | (38.6) | 62.5 | 30.3 | (37.9) | 82.0 | |||||||||||||||||||||||||
| Post-tax return on average utilized economic capital (%) 8 | – | – | – | – | – | – | – | – | – | – | – | – | – | – | – | – | – | – | 20.1 | (32.3) | 48.7 | 20.1 | (32.3) | 48.7 | |||||||||||||||||||||||||
| Balance sheet statistics (CHF million) | |||||||||||||||||||||||||||||||||||||||||||||||||
| Total assets | 262,709 | 256,063 | 251,666 | 112,355 | 109,186 | 108,237 | 375,064 | 365,249 | 359,903 | 1,021,587 | 997,660 | 1,204,397 | 24,834 | 26,673 | 23,929 | (207,276) | (196,388) | (190,124) | 1,214,209 | 1,193,194 | 1,398,105 | 1,229,825 | 1,207,99 4 | 1,415,174 | |||||||||||||||||||||||||
| Net loans | 79,048 | 75,482 | 76,844 | 101,549 | 99,931 | 96,770 | 180,597 | 175,413 | 173,614 | 54,011 | 53,516 | 50,104 | – | – | – | 123 | 239 | 504 | 234,731 | 229,168 | 224,222 | 234,731 | 229,168 | 224,222 | |||||||||||||||||||||||||
| Goodwill | 645 | 638 | 616 | 181 | 181 | 181 | 826 | 819 | 797 | 6,864 | 6,708 | 7,858 | 2,116 | 2,063 | 2,439 | – | – | – | 9,806 | 9,590 | 11,094 | 9,806 | 9,590 | 11,094 | |||||||||||||||||||||||||
| Number of employees (full-time equivalents) | |||||||||||||||||||||||||||||||||||||||||||||||||
| Number of employees | 15,100 | 14,800 | 13,600 | 9,000 | 9,000 | 8,800 | 24,100 | 23,800 | 22,400 | 20,500 | 20,600 | 19,300 | 3,700 | 3,600 | 3,300 | 700 | 700 | 600 | 49,000 | 48,700 | 45,600 | 49,000 | 48,700 | 45,600 | |||||||||||||||||||||||||
| 1 Core Results include the results of our integrated banking business, excluding revenues and expenses in respect of minority interests without significant economic interest. 2 Includes fair value gains/(losses) on a synthetic collateralized loan portfolio of CHF (18) million and CHF 64 million in 2Q08 and 1Q08, respectively. 3 Includes combined net valuation reductions of CHF 22 million and CHF 5,281 million in 2Q08 and 1Q08, respectively, relating to leveraged finance and structured products. 4 Includes valuation gains/(reductions) of CHF 79 million and CHF (566) million in 2Q08 and 1Q08, respectively, from securities purchased from our money market funds. 5 Includes sever ance costs of CHF 23 million. 6 Includes a net credit pertaining to litigation of CHF 134 million. 7 Includes diversification benefit. 8 Calculated using a return excluding interest costs for allocated goodwill. | |||||||||||||||||||||||||||||||||||||||||||||||||
Assets under Management |
Assets under management |
| Assets under management comprise assets which are placed with us for investment purposes and include discretionary and advisory counterparty assets. |
| Discretionary assets are assets for which the customer fully transfers the discretionary power to a Credit Suisse entity with a management mandate. Discretionary assets are reported in the segment in which the investment advice is provided, as well as in the segment in which distribution takes place. Any duplication of assets managed on behalf of other segments is eliminated at the Group level. |
| Advisory assets include assets placed with us where the client is provided access to investment advice but retains discretion over investment decisions. |
| As of the end of 2Q08, assets under management amounted to CHF 1,411.9 billion, up CHF 31.4 billion, or 2.3%, compared to the end of 1Q08, reflecting favorable foreign exchange-related movements and strong net new asset inflows, partially offset by adverse market movements. Compared to the end of 2Q07, assets under management were down CHF 217.1 billion, or 13.3%, primarily reflecting adverse foreign exchange-related and market movements. |
| In Private Banking, assets under management were up CHF 27.2 billion, or 3.0%, compared to the end of 1Q08, and down CHF 89.4 billion, or 8.8%, compared to the end of 2Q07. In Asset Management, assets under management were stable, compared to the end of 1Q08, and decreased CHF 144.6 billion, or 19.3%, compared to the end of 2Q07. For further information, refer to II – Results by division – Private Banking and – Asset Management. |
| Assets under management and client assets | |||||||||||||||
| end of | % change | ||||||||||||||
| 2Q08 | 1Q08 | 4Q07 | 2Q07 | QoQ | Ytd | YoY | |||||||||
| Assets under management (CHF billion) | |||||||||||||||
| Wealth Management | 773.5 | 749.4 | 838.6 | 860.5 | 3.2 | (7.8) | (10.1) | ||||||||
| Corporate & Retail Banking | 153.3 | 150.2 | 156.8 | 155.7 | 2.1 | (2.2) | (1.5) | ||||||||
| Private Banking | 926.8 | 899.6 | 995.4 | 1,016.2 | 3.0 | (6.9) | (8.8) | ||||||||
| Asset Management | 605.0 | 600.4 | 691.3 | 749.6 | 0.8 | (12.5) | (19.3) | ||||||||
| Assets managed on behalf of other segments | (119.9) | (119.5) | (132.0) | (136.8) | 0.3 | (9.2) | (12.4) | ||||||||
| Assets under management | 1,411.9 | 1,380.5 | 1,554.7 | 1,629.0 | 2.3 | (9.2) | (13.3) | ||||||||
| of which discretionary assets | 613.7 | 595.9 | 678.8 | 737.2 | 3.0 | (9.6) | (16.8) | ||||||||
| of which advisory assets | 798.2 | 784.6 | 875.9 | 891.8 | 1.7 | (8.9) | (10.5) | ||||||||
| Client assets (CHF billion) | |||||||||||||||
| Wealth Management | 849.4 | 821.9 | 928.8 | 932.4 | 3.3 | (8.5) | (8.9) | ||||||||
| Corporate & Retail Banking | 219.5 | 222.7 | 230.6 | 229.6 | (1.4) | (4.8) | (4.4) | ||||||||
| Private Banking | 1,068.9 | 1,044.6 | 1,159.4 | 1,162.0 | 2.3 | (7.8) | (8.0) | ||||||||
| Asset Management | 633.8 | 631.1 | 721.7 | 783.4 | 0.4 | (12.2) | (19.1) | ||||||||
| Assets managed on behalf of other segments | (119.9) | (119.5) | (132.0) | (136.8) | 0.3 | (9.2) | (12.4) | ||||||||
| Client assets | 1,582.8 | 1,556.2 | 1,749.1 | 1,808.6 | 1.7 | (9.5) | (12.5) | ||||||||
| Growth in assets under management | |||||||||||
| in | |||||||||||
| 2Q08 | 1Q08 | 2Q07 | 6M08 | 6M07 | |||||||
| Growth in assets under management (CHF billion) | |||||||||||
| Wealth Management | 15.4 | 13.5 | 13.3 | 28.9 | 28.5 | ||||||
| Corporate & Retail Banking | 2.0 | 3.6 | (4.4) | 5.6 | (1.2) | ||||||
| Private Banking | 17.4 | 17.1 | 8.9 | 34.5 | 27.3 | ||||||
| Asset Management | (3.8) | (20.2) | 20.4 | (24.0) | 49.4 | ||||||
| Assets managed on behalf of other segments | 0.4 | (1.1) | (1.7) | (0.7) | (6.1) | ||||||
| Net new assets | 14.0 | (4.2) | 27.6 | 9 .8 | 70.6 | ||||||
| Wealth Management | 8.7 | (102.7) | 32.4 | (94.0) | 47.8 | ||||||
| Corporate & Retail Banking | 1.1 | (10.2) | 1.2 | (9.1) | 0.8 | ||||||
| Private Banking | 9.8 | (112.9) | 33.6 | (103.1) | 48.6 | ||||||
| Asset Management | 8.4 | (70.7) | 20.6 | (62.3) | 30.3 | ||||||
| Assets managed on behalf of other segments | (0.8) | 13.6 | (4.3) | 12.8 | (5.6) | ||||||
| Other effects | 17.4 | (170.0) | 49.9 | (152.6) | 73.3 | ||||||
| Wealth Management | 24.1 | (89.2) | 45.7 | (65.1) | 76.3 | ||||||
| Corporate & Retail Banking | 3.1 | (6.6) | (3.2) | (3.5) | (0.4) | ||||||
| Private Banking | 27.2 | (95.8) | 42.5 | (68.6) | 75.9 | ||||||
| Asset Management | 4.6 | (90.9) | 41.0 | (86.3) | 79.7 | ||||||
| Assets managed on behalf of other segments | (0.4) | 12.5 | (6.0) | 12.1 | (11.7) | ||||||
| Growth in assets under management | 31.4 | (174.2) | 77.5 | (142.8) | 143.9 | ||||||
| Growth in assets under management (annualized) (%) | |||||||||||
| Wealth Management | 8.2 | 6.4 | 6.5 | 6.9 | 7.3 | ||||||
| Corporate & Retail Banking | 5.3 | 9.2 | (11.1) | 7.1 | (1.5) | ||||||
| Private Banking | 7.7 | 6.9 | 3.7 | 6.9 | 5.8 | ||||||
| Asset Management | (2.5) | (11.7) | 11.5 | (6.9) | 14.8 | ||||||
| Assets managed on behalf of other segments | (1.3) | 3.3 | 5.2 | 1.1 | 9.8 | ||||||
| Net new assets | 4.1 | (1.1) | 7.1 | 1.3 | 9.5 | ||||||
| Wealth Management | 4.6 | (49.0) | 15.9 | (22.4) | 12.2 | ||||||
| Corporate & Retail Banking | 2.9 | (26.0) | 3.0 | (11.6) | 1.0 | ||||||
| Private Banking | 4.4 | (45.4) | 13.8 | (20.7) | 10.3 | ||||||
| Asset Management | 5.6 | (40.9) | 11.6 | (18.0) | 9.0 | ||||||
| Assets managed on behalf of other segments | 2.7 | (41.2) | 13.1 | (19.4) | 9.0 | ||||||
| Other effects | 5.0 | (43.7) | 12.9 | (1 9.6) | 9.9 | ||||||
| Wealth Management | 12.8 | (42.6) | 22.4 | (15.5) | 19.5 | ||||||
| Corporate & Retail Banking | 8.2 | (16.8) | (8.1) | (4.5) | (0.5) | ||||||
| Private Banking | 12.1 | (38.5) | 17.5 | (13.8) | 16.1 | ||||||
| Asset Management | 3.1 | (52.6) | 23.1 | (24.9) | 23.8 | ||||||
| Assets managed on behalf of other segments | 1.4 | (37.9) | 18.3 | (18.3) | 18.8 | ||||||
| Growth in assets under management | 9.1 | (44.8) | 20.0 | (18.3) | 19.4 | ||||||
| Growth in assets under management (continued) | |||||||
| in | 2Q08 | 1Q08 | 2Q07 | ||||
| Growth in assets under management (rolling four-quarter average) (%) | |||||||
| Wealth Management | 5.9 | 6.0 | 6.7 | ||||
| Corporate & Retail Banking | 6.5 | 2.3 | 0.1 | ||||
| Private Banking | 6.0 | 5.4 | 5.6 | ||||
| Asset Management | (9.3) | (6.4) | 11.0 | ||||
| Assets managed on behalf of other segments | 1.0 | 2.6 | 6.2 | ||||
| Net new assets | (0.6) | 0.2 | 8.0 | ||||
Net new assets |
| Net new assets include individual cash payments, security deliveries and cash flows resulting from loan increases or repayments. Interest and dividend income credited to clients, commissions, interest and fees charged for banking services are not included as they do not reflect success in acquiring assets under management. Furthermore, changes due to currency and market movements as well as asset inflows and outflows due to the acquisition or divestiture of businesses are not part of net new assets. |
| Compared to 1Q08, we had strong net new asset inflows in Private Banking, partially offset by net new asset outflows in Asset Management. We recorded net new asset inflows of CHF 14.0 billion in 2Q08, primarily due to net inflows of CHF 15.4 billion in Wealth Management, mainly from EMEA and Asia Pacific, partially offset by net outflows in Asset Management of CHF 3.8 billion, primarily institutional pension advisory assets in global investors. |
Client assets |
| Client assets is a broader measure than assets under management as it includes transactional and custody accounts (assets held solely for transaction-related or safekeeping/custody purposes) and assets of corporate clients and public institutions used primarily for cash management or transaction-related purposes. |
IV – Treasury and Risk management |
Treasury management |
Risk management |
Treasury management |
| We continued to conservatively manage our liquidity and funding position and our capital remained strong with a BIS tier 1 ratio under Basel II of 10.2% as of the end of 2Q08. |
Liquidity and funding management |
| Securities for funding and capital purposes are issued primarily by the Bank, our principal operating subsidiary and a US registrant. The Bank lends funds to its operating subsidiaries and affiliates on both a senior and subordinated basis, as needed, the latter typically to meet capital requirements, or as desired by management to support business initiatives. For further information, refer to Treasury management in III – Balance sheet, Off-balance sheet, Treasury and Risk in the Credit Suisse Annual Report 2007. |
Funding sources and uses |
| The challenging operating environment continued throughout 2Q08. In response, the Bank maintained its conservative liquidity and funding management strategy and strong capital base. The distribution of our unsecured funding remained consistent with the distribution as of the end of 1Q08, with the majority still from client deposits and long-term debt (refer to the chart “Unsecured funding distribution”). As of the end of 2Q08, our liquid assets included CHF 82 billion of securities and similar assets accepted under existing central bank facilities. Client deposits, a particularly stable source of funds, covered 121% of total loans outstanding as of the end of 2Q08 (refer to the chart “Funding by asset category”). |
| The balance sheet as of the end of 2Q08 compared to 4Q07 and 2Q07 was impacted by the depreciation of the US dollar against the Swiss franc. |
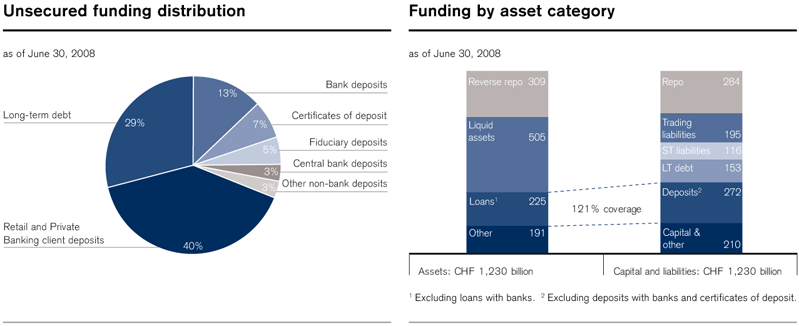 |
Liquidity and funding policy |
| Our liquidity and funding policy is designed to ensure that funding is available to meet all obligations in times of stress, whether caused by market events or issues specific to Credit Suisse. Our liquidity risk parameters reflect various liquidity stress assumptions, which we believe are conservative and which are described in the Credit Suisse Annual Report 2007. We manage our liquidity profile at a sufficient level such that, in the event that we are unable to access unsecured funding, we will have sufficient liquidity to sustain operations for an extended period of time. |
Debt issuances and redemptions |
| Our primary sources of liquidity are through consolidated entities, and funding through non-consolidated special purpose entities and asset securitization activity is immaterial. Our capital markets debt issuance includes issues of senior and subordinated debt in US registered offerings and medium-term note programs, euro market medium-term note programs and a samurai shelf registration statement in Japan. Substantially all of our unsecured senior debt is issued without financial covenants that could trigger an increase of our cost of financing or accelerate the maturity of the debt, including adverse changes in our credit ratings, cash flows, results of operations or financial ratios. |
| In 2Q08, the Bank issued CHF 12.4 billion of senior debt, CHF 150 million of subordinated debt and CHF 1.2 billion of core tier 1 capital securities. Senior debt of CHF 3.7 billion and subordinated debt of CHF 204 million matured and we redeemed CHF 391 million of subordinated debt. |
Capital management |
| Our capital position remained strong. Our consolidated BIS tier 1 ratio under Basel II was 10.2% as of the end of 2Q08, compared to 9.8% as of the end of 1Q08. Our economic capital coverage ratio was down two percentage points from 144% to 142%, reflecting reduced economic capital resources due to the 2007 cash dividend payment. |
Shareholders’ equity |
| Our shareholders’ equity decreased from CHF 37.6 billion as of the end of 1Q08 to CHF 36.8 billion as of the end of 2Q08, primarily due to the cash dividend payment and the effect of share-based compensation, partly offset by the net income in 2Q08 and the positive foreign exchange-related movements reflected in other comprehensive income. |
| At the AGM on May 4, 2007, the shareholders approved a share buyback program of up to CHF 8 billion, which runs through 2010. During 2Q08, no common shares were repurchased. As of July 23, 2008, we had repurchased shares for CHF 4.1 billion, or 52%, of the approved CHF 8 billion. |
Regulatory capital |
| The Basel Committee on Banking Supervision introduced significant changes to the international capital adequacy standards known as Basel II. These changes affect both risk-weighted assets and eligible capital, and the new standard is effective for us from January 1, 2008. |
| Credit Suisse has received approval from the Swiss Federal Banking Commission (SFBC) to use the advanced internal ratings-based approach (A-IRB) for measuring credit risk and the advanced measurement approach (AMA) for measuring operational risk. Under the A-IRB for measuring credit risk, risk weights are determined by using internal risk parameters for probability of default, loss given default and transactional maturity. The exposure at default is either derived from balance sheet values or by using models. |
| Under Basel II, operational risk is included in risk-weighted assets. Under the AMA for measuring operational risk, we have identified key scenarios that describe major operational risks relevant for us using an event model. |
| Eligible capital (tier 1 and tier 2 capital) under Basel II is more affected by changes in deductions to shareholders’ equity than under Basel I. Under Basel II, intangible assets (except software) are deducted and a broader scope of securitization risk exposures and expected losses in excess of eligible provisions are deducted (50% from tier 1 capital and 50% from tier 2 capital). |
| For further information, refer to Treasury management in III – Balance sheet, Off-balance sheet, Treasury and Risk in the Credit Suisse Annual Report 2007. |
| Comparison of Basel I to Basel II as of 4Q07 |
| The tier 1 ratio declined from 11.1% under Basel I to 10.0% under Basel II as of the end of 4Q07, primarily related to decreased tier 1 capital and increased risk-weighted assets. The total capital ratio decreased from 14.5% under Basel I to 12.9% under Basel II, in line with the impact on tier 1 capital, primarily from increased capital deductions. |
| Tier 1 and total capital declined CHF 2.5 billion, or 7%, and CHF 3.5 billion, or 8%, respectively, due to the deductions relating to intangible assets, increased securitization exposures and expected losses in excess of eligible provisions. |
| Total risk-weighted assets increased CHF 11.6 billion, or 4%, due to the inclusion of operational risk, offset in part by a decrease in credit risk. Risk-weighted assets derived from market risk and non-counterparty-related risk, primarily fixed assets, were mostly unchanged. |
| Regulatory capital in 2Q08 |
| Our consolidated BIS tier 1 ratio under Basel II was 10.2% as of the end of 2Q08, compared to 9.8% as of the end of 1Q08. The increase was driven by an increase in tier 1 capital from CHF 29.4 billion as of the end of 1Q08 to CHF 30.8 billion as of the end of 2Q08, as the decrease in shareholders’ equity was more than offset by the issuance of CHF 1.2 billion of core tier 1 capital securities recorded in qualifying minority interests and lower other adjustments and capital deductions. The other adjustments were lower, reflecting the cash dividend payment and the reduction of the cumulative fair value gains on Credit Suisse debt, net of tax, partly offset by a significant dividend accrual and other regulatory adjustments. Lower capital deductions reflected decreased securitization exposures and an increase in the eligible provision in excess of expected losses. Risk-weighted assets were stable, with a decrease in cred it risk due to reduced exposures, offset by an increase in market risk due to market volatility in the data used to calculate VaR and a methodology change for certain CDO position risk (refer to – Risk management – Market risk). |
| Our total capital under Basel II increased from CHF 41.1 billion as of the end of 1Q08 to CHF 43.1 billion as of the end of 2Q08, and the total capital ratio was 14.3% as of the end of 2Q08, an increase from 13.6% as of the end of 1Q08, favorably impacted by the increase in tier 1 capital. Tier 2 capital increased, primarily due to the increase in the eligible provision in excess of expected losses in upper tier 2 and the issuance of tier 2 capital, offset in part by redemptions and reductions on lower tier 2 capital, reflecting amortization of subordinated debt for regulatory purposes. |
| The business of the Bank is substantially the same as the business of the Group. The trends for the Bank under Basel II are generally consistent with those for the Group. |
| Capital | |||||||||||||||
| end of | % change | ||||||||||||||
| 2Q08 | 1Q08 | 4Q07 | 2Q07 | QoQ | Ytd | YoY | |||||||||
| Shares outstanding (million) | |||||||||||||||
| Common shares issued | 1,174.2 | 1,162.5 | 1,162.4 | 1,215.9 | 1 | 1 | (3) | ||||||||
| Second trading line treasury shares 1 | (49.7) | 2 | (49.7) | (46.1) | (68.5) | 0 | 8 | (27) | |||||||
| Other treasury shares | (100.8) | (99.3) | (95.7) | (100.9) | 2 | 5 | 0 | ||||||||
| Treasury shares | (150.5) | (149.0) | (141.8) | (169.4) | 1 | 6 | (11) | ||||||||
| Shares outstanding | 1,023.7 | 1,013.5 | 1,020.6 | 1,046.5 | 1 | 0 | (2) | ||||||||
| Par value (CHF) | |||||||||||||||
| Par value 3 | 0.04 | 0.04 | 0.04 | 0.50 | 0 | 0 | (92) | ||||||||
| Shareholders' equity (CHF million) | |||||||||||||||
| Common shares | 46 | 46 | 46 | 608 | 0 | 0 | (92) | ||||||||
| Additional paid-in capital | 25,235 | 25,228 | 24,553 | 24,259 | 0 | 3 | 4 | ||||||||
| Retained earnings | 29,957 | 31,522 | 33,670 | 34,912 | (5) | (11) | (14) | ||||||||
| Second trading line treasury shares, at cost | (4,123) | (4,123) | (3,918) | (5,384) | 0 | 5 | (23) | ||||||||
| Other treasury shares, at cost | (5,677) | (5,612) | (5,460) | (5,805) | 1 | 4 | (2) | ||||||||
| Treasury shares, at cost | (9,800) | (9,735) | (9,378) | (11,189) | 1 | 4 | (12) | ||||||||
| Accumulated other comprehensive income | (8,590) | (9,422) | (5,692) | (4,741) | (9) | 51 | 81 | ||||||||
| Total shareholders' equity | 36,848 | 37,639 | 43,199 | 43,849 | (2) | (15) | (16) | ||||||||
| Goodwill | (9,806) | (9,590) | (10,882) | (11,094) | 2 | (10) | (12) | ||||||||
| Other intangible assets | (585) | (532) | (444) | (506) | 10 | 32 | 16 | ||||||||
| Tangible shareholders' equity 4 | 26,457 | 27,517 | 31,873 | 32,249 | (4) | (17) | (18) | ||||||||
| Book value per share outstanding (CHF) | |||||||||||||||
| Total book value per share | 35.99 | 37.14 | 42.33 | 41.90 | (3) | (15) | (14) | ||||||||
| Goodwill per share | (9.58) | (9.46) | (10.66) | (10.60) | 1 | (10) | (10) | ||||||||
| Other intangible assets per share | (0.57) | (0.53) | (0.44) | (0.48) | 8 | 31 | 18 | ||||||||
| Tangible book value per share | 25.84 | 27.15 | 31.23 | 30.82 | (5) | (17) | (16) | ||||||||
| 1 These shares were repurchased in connection with our share buyback program for subsequent cancellation upon shareholder approval. 2 On April 25, 2008, the shareholders of Credit Suisse Group approved the cancellation of these shares, which is scheduled for 3Q08. 3 On May 4, 2007, the shareholders of Credit Suisse Group approved a par value reduction of CHF 0.46 per share which was paid out on July 18, 2007. 4 Tangible shareholders' equity is calculated by deducting goodwill and other intangible assets from total shareholders' equity. Management believes that the return on tangible shareholders' equity is meaningful as it allows for the consistent measurement of the performance of businesses without regard to whether the businesse s were acquired. | |||||||||||||||
| BIS statistics - Group | ||||||||||||||
Basel II | Basel I | Basel II % change | ||||||||||||
| end of | 2Q08 | 1Q08 | 4Q07 | 4Q07 | QoQ | Ytd | ||||||||
| Risk-weighted assets (CHF million) | ||||||||||||||
| Credit risk | 228,056 | 234,408 | 252,400 | 270,266 | (3) | (10) | ||||||||
| Non-counterparty-related risk | 6,989 | 6,916 | 7,304 | 7,262 | 1 | (4) | ||||||||
| Market risk | 40,390 | 33,957 | 34,739 | 34,540 | 19 | 16 | ||||||||
| Operational risk | 26,382 | 25,728 | 29,197 | – | 3 | (10) | ||||||||
| Risk-weighted assets | 301,817 | 301,009 | 323,640 | 312,068 | 0 | (7) | ||||||||
| Eligible capital (CHF million) | ||||||||||||||
| Total shareholders' equity | 36,848 | 37,639 | 43,199 | 43,199 | (2) | (15) | ||||||||
| Goodwill and intangible assets | (10,428) | (10,160) | (11,370) | (10,882) | 3 | (8) | ||||||||
| Non-cumulative perpetual preferred securities and capital notes 1 | 5,194 | 2 | 5,407 | 2 | 4,136 | 4,136 | (4) | 26 | ||||||
| Qualifying minority interests | 1,348 | 119 | 63 | 79 | – | – | ||||||||
| Capital deductions 50% from tier 1 | (817) | (986) | (2,014) | (71) | (17) | (59) | ||||||||
| Other adjustments | (1,350) | (2,658) | (1,774) | (1,724) | (49) | (24) | ||||||||
| Tier 1 capital | 30,795 | 29,361 | 32,240 | 34,737 | 5 | (4) | ||||||||
| Upper tier 2 | 3,252 | 2,462 | 2,860 | 2,860 | 32 | 14 | ||||||||
| Lower tier 2 | 9,915 | 10,240 | 8,515 | 8,565 | (3) | 16 | ||||||||
| Capital deductions 50% from tier 2 | (817) | (986) | (2,014) | – | (17) | (59) | ||||||||
| Tier 2 capital | 12,350 | 11,716 | 9,361 | 11,425 | 5 | 32 | ||||||||
| Investments in non-consolidated banking and finance participations and credit enhancements | – | – | – | (989) | – | – | ||||||||
| Investments in insurance entities (50%) | – | – | – | (71) | – | – | ||||||||
| Total capital | 43,145 | 41,077 | 41,601 | 45,102 | 5 | 4 | ||||||||
| Capital ratios (%) | ||||||||||||||
| Tier 1 ratio | 10.2 | 9.8 | 10.0 | 11.1 | – | – | ||||||||
| Total capital ratio | 14.3 | 13.6 | 12.9 | 14.5 | – | – | ||||||||
| 1 The SFBC has advised that Credit Suisse Group may continue to include as tier 1 capital CHF 1.7 billion, CHF 1.8 billion and CHF 1.8 billion in 2Q08, 1Q08 and 4Q07, respectively, of equity from special purpose entities which are deconsolidated under FIN 46(R). 2 Hybrid tier 1 capital represented 16.4 % and 17.8% of adjusted tier 1 capital as of the end of 2Q08 and 1Q08, respectively. | ||||||||||||||
| BIS statistics - Bank | |||||||||
| Basel II | Basel I | ||||||||
| end of | 2Q08 | 1Q08 | 4Q07 | 4Q07 | |||||
| Capital ratios (%) | |||||||||
| Tier 1 ratio | 9.5 | 9.2 | 9.6 | 11.0 | |||||
| Total capital ratio | 14.4 | 13.9 | 13.2 | 15.1 | |||||
| The SFBC has advised that the Bank may continue to include as tier 1 capital CHF 4.4 billion, CHF 4.4 billion and CHF 4.8 billion in 2Q08, 1Q08 and 4Q07, respectively, of equity from special purpose entities which are deconsolidated under FIN 46(R). | |||||||||
Economic capital |
Overview |
| Economic capital is used as a consistent and comprehensive tool for risk management, capital management and performance measurement. It is called economic capital because it measures risks in terms of economic realities rather than regulatory or accounting rules. Economic capital is the estimated capital needed to remain solvent and in business, even under extreme market, business and operational conditions, given the institution’s target financial strength (i.e., long-term credit rating). |
| Under Pillar II of the Basel II framework (also referred to as the Supervisory Review Process), banks are required to implement a robust and comprehensive framework for assessing capital adequacy, defining internal capital targets and ensuring that these capital targets are consistent with their overall risk profile and the current operating environment. Our economic capital framework has an important role under Pillar II, as it represents our internal view of the amount of capital required to support our business activities. |
| Economic capital is calculated separately for position risk, operational risk and other risks. These three risks are used to determine our utilized economic capital and are defined as follows: |
| – Position risk: the level of unexpected loss in economic value on our portfolio of positions over a one-year horizon which is exceeded with a given, small probability (1% for risk management purposes; 0.03% for capital management purposes); |
| – Operational risk: the level of loss resulting from inadequate or failed internal processes, people and systems or from external events over a one-year horizon which is exceeded with a given, small probability (0.03%). Estimating this type of economic capital is inherently more subjective, and reflects both quantitative tools as well as senior management judgment; and |
| – Other risks: the risks not captured by the above, for example, expense risk, pension risk and owned real estate risk. Expense risk is defined as the difference between expenses and revenues in a severe market event, exclusive of the elements captured by position risk and operational risk. Pension risk is defined as the potential under-funding of our obligations in an extreme event. Owned real estate risk is defined as the risk associated with the buildings we own. |
| We regularly review the economic capital methodology in order to ensure that the model remains relevant as markets and business strategies evolve. In 2Q08, various changes were made to the 99% position risk (risk management) and 99.97% position risk and other risks (capital management) metrics. The key change to economic capital reflected a methodology enhancement to measure economic capital for pension plans, which is included within other risks (capital management). Prior period balances have been restated for methodology changes in order to show meaningful trends. The total impact of methodology changes on 1Q08 economic capital was an increase of approximately CHF 1.2 billion, or 5%. |
| For details on the 99% position risk enhancements, refer to “Risk management.” |
Utilized economic capital trends |
| Over the course of 2Q08, our utilized economic capital decreased 1%, primarily due to reduced Investment Banking position risk. |
| The utilized economic capital for Wealth Management increased 4%, primarily due to increased private banking corporate and retail lending. Corporate & Retail Banking increased 6%, primarily due to increased emerging markets trade finance exposures and increased private banking corporate and retail lending. |
| For Investment Banking, utilized economic capital decreased 4%. International lending and counterparty exposures decreased due to reduced loan exposures in leveraged finance. Fixed income trading decreased due to reduced interest rate and credit spread exposures, partially offset by increased commodity exposures. Real estate and structured assets decreased due to sales of commercial real estate exposures. |
| For Asset Management, utilized economic capital increased 8% over the period, mainly due to increased equity trading and investments exposures. Corporate Center utilized economic capital decreased 9% due to lower foreign exchange risk between available and utilized economic capital. |
| For further information on our position risk, refer to – Risk management – Key position risk trends. |
Capital adequacy trends |
| The economic capital coverage ratio decreased two percentage points from 144% to 142% over 2Q08, primarily due to reduced economic capital resources due to the cash dividend payment. This was partially offset by reduced utilized economic capital due to the decrease in Investment Banking position risk. Our coverage ratio remained above our target band of 100% to 140%. |
| Economic capital | |||||||||||||||
| in / end of | % change | ||||||||||||||
| 2Q08 | 1Q08 | 4Q07 | 2Q07 | QoQ | Ytd | YoY | |||||||||
| Economic capital resources (CHF million) | |||||||||||||||
| Tier 1 capital 1 | 30,795 | 29,361 | 34,737 | 38,617 | 5 | (11) | (20) | ||||||||
| Economic adjustments | 4,334 | 6,638 | 4,768 | 3,164 | (35) | (9) | 37 | ||||||||
| Economic capital resources | 35,129 | 35,999 | 39,505 | 41,781 | (2) | (11) | (16) | ||||||||
| Utilized economic capital (CHF million) | |||||||||||||||
| Position risk (99.97% confidence level) | 19,970 | 20,107 | 22,468 | 20,785 | (1) | (11) | (4) | ||||||||
| Operational risk | 2,241 | 2,169 | 2,469 | 2,615 | 3 | (9) | (14) | ||||||||
| Other risks 2 | 2,602 | 2,771 | 2,142 | 2,735 | (6) | 21 | (5) | ||||||||
| Utilized economic capital | 24,813 | 25,047 | 27,079 | 3 | 26,135 | (1) | (8) | (5) | |||||||
| Economic capital coverage ratio (%) | |||||||||||||||
| Economic capital coverage ratio | 141.6 | 143.7 | 145.9 | 3 | 159.9 | – | – | – | |||||||
| Utilized economic capital by segment (CHF million) | |||||||||||||||
| Wealth Management | 2,107 | 2,034 | 1,940 | 1,790 | 4 | 9 | 18 | ||||||||
| Corporate & Retail Banking | 3,525 | 3,314 | 3,453 | 3,439 | 6 | 2 | 3 | ||||||||
| Private Banking | 5,632 | 5,348 | 5,393 | 5,229 | 5 | 4 | 8 | ||||||||
| Investment Banking | 16,260 | 16,858 | 19,205 | 3 | 18,103 | (4) | (15) | (10) | |||||||
| Asset Management | 2,233 | 2,077 | 2,127 | 1,607 | 8 | 5 | 39 | ||||||||
| Corporate Center | 729 | 805 | 358 | 1,225 | (9) | 104 | (40) | ||||||||
| Utilized economic capital - Credit Suisse 4 | 24,813 | 25,047 | 27,079 | 3 | 26,135 | (1) | (8) | (5) | |||||||
| Average utilized economic capital by segment (CHF million) | |||||||||||||||
| Wealth Management | 2,070 | 1,987 | 1,906 | 1,701 | 4 | 9 | 22 | ||||||||
| Corporate & Retail Banking | 3,420 | 3,383 | 3,441 | 3,416 | 1 | (1) | 0 | ||||||||
| Private Banking | 5,490 | 5,370 | 5,347 | 5,117 | 2 | 3 | 7 | ||||||||
| Investment Banking | 16,559 | 18,031 | 20,345 | 3 | 18,782 | (8) | (19) | (12) | |||||||
| Asset Management | 2,155 | 2,102 | 2,015 | 1,586 | 3 | 7 | 36 | ||||||||
| Corporate Center | 767 | 581 | 369 | 1,229 | 32 | 108 | (38) | ||||||||
| Average utilized economic capital - Credit Suisse 5 | 24,930 | 26,063 | 28,070 | 3 | 26,684 | (4) | (11) | (7) | |||||||
| Prior economic capital balances have been restated for methodology changes in order to show meaningful trends. | |||||||||||||||
| 1 Under Basel II from January 1, 2008. Prior period ratios are reported under Basel I and are therefore not comparable. 2 Includes owned real estate, expense risk, pension risk and diversification benefit. 3 Does not reflect the valuation reductions from revaluing certain ABS positions in our CDO trading business (refer to II – Operating and financial review – Credit Suisse – Revaluing of certain asset-backed securities positions in the Credit Suisse Annual Report 2007), as we do not consider the impact of these valuation reductions to be material to our economic capital, position risk, VaR or related trends. 4 Includes a diversification benefit of CHF 41 million as of the end of 2Q08. ; 5 Includes a diversification benefit of CHF 41 million in 2Q08. | |||||||||||||||
Risk management |
| In 2Q08, our overall 99% position risk, measured on the basis of the economic capital model, decreased 1% compared to 1Q08. Average one-day, 99% VaR for our trading books was stable at CHF 193 million. We reported a net new provision for credit losses of CHF 45 million in 2Q08. |
Economic capital |
| Economic capital represents our core Group-wide risk management tool. It represents good current market practice for measuring and reporting all quantifiable risks; it measures risk in terms of economic realities rather than regulatory or accounting rules. The development and usage of economic capital methodologies and models have increased across the industry over recent years. In the absence of a standardized industry-wide approach, comparisons across firms may not be meaningful. |
| Position risk, which is a component of the economic capital framework, represents the level of unexpected loss in economic value on our portfolio of positions over a one-year horizon which is exceeded with a given small probability (1% for risk management purposes; 0.03% for capital management purposes). For further details of the economic capital framework, refer to III – Balance sheet, Off-balance sheet, Treasury and Risk – Treasury management in the Credit Suisse Annual Report 2007. |
| We regularly review the economic capital methodology in order to ensure that the model remains relevant as markets and business strategies evolve. In 2Q08, various changes were made to both the 99% position risk (risk management) and 99.97% position risk and other risks (capital management) metrics. The key change to 99% position risk was in the international lending and counterparty exposures calculation where the treatment of leveraged finance commitments has been refined. Other smaller changes impacted the fixed income trading, real estate and structured assets and equity trading and investments position risk categories. Prior period balances have been restated for methodology changes in order to show meaningful trends. The total impact of methodology changes on 1Q08 99% position risk was an increase of approximately CHF 74 million, or 1%. |
| Position risk | |||||||||||||||
| end of | % change | ||||||||||||||
| 2Q08 | 1Q08 | 4Q07 | 1 | 2Q07 | QoQ | Ytd | YoY | ||||||||
| Position risk (CHF million) | |||||||||||||||
| Fixed income trading 2 | 2,017 | 2,229 | 2,163 | 2,393 | (10) | (7) | (16) | ||||||||
| Equity trading and investments | 3,053 | 2,615 | 2,911 | 2,554 | 17 | 5 | 20 | ||||||||
| Private banking corporate and retail lending | 2,351 | 2,298 | 2,286 | 2,197 | 2 | 3 | 7 | ||||||||
| International lending and counterparty exposures | 3,760 | 3,928 | 4,307 | 2,859 | (4) | (13) | 32 | ||||||||
| Emerging markets | 1,920 | 1,750 | 2,040 | 1,782 | 10 | (6) | 8 | ||||||||
| Real estate and structured assets 3 | 2,231 | 2,354 | 3,418 | 4,112 | (5) | (35) | (46) | ||||||||
| Simple sum across risk categories | 15,332 | 15,174 | 17,125 | 15,897 | 1 | (10) | (4) | ||||||||
| Diversification benefit | (4,343) | (4,066) | (4,703) | (4,400) | 7 | (8) | (1) | ||||||||
| Position risk (99% confidence level for risk management purposes) | 10,989 | 11,108 | 12,422 | 11,497 | (1) | (12) | (4) | ||||||||
| Position risk (99.97% confidence level for capital management purposes) | 19,970 | 20,107 | 22,468 | 20,785 | (1) | (11) | (4) | ||||||||
| Prior balances have been restated for methodology changes in order to show meaningful trends. | |||||||||||||||
| 1 Does not reflect the valuation reductions from revaluing certain ABS positions in our CDO trading business (refer to II – Operating and financial review – Credit Suisse – Revaluing of certain asset-backed securities positions in the Credit Suisse Annual Report 2007), as we do not consider the impact of these valuation reductions to be material to our economic capital, position risk, VaR or related trends. 2 This category comprises fixed income trading, foreign exchange and commodity exposures. 3 This category comprises the real estate investments of the Group, commercial and residential real estate, ABS exposure and real estate acquired at auction. | |||||||||||||||
Key position risk trends |
| During 2Q08, position risk decreased 1% compared to the end of 1Q08. This was mainly due to the reductions in fixed income trading and international lending and counterparty exposures. Fixed income trading decreased due to reduced interest rate and credit spread exposures, partially offset by increased commodity exposures. International lending and counterparty exposures decreased due to reduced loan exposures in leveraged finance. Real estate and structured assets decreased due to sales of commercial real estate exposures. This was partially offset by higher equity trading and investments exposures, primarily reflecting increased equity derivatives risk, and emerging markets exposures in Latin America. |
| Compared to the end of 2Q07, position risk decreased 4%, primarily due to the depreciation of the US dollar against the Swiss franc. Excluding the impact of the depreciation of the US dollar against the Swiss franc, position risk increased 12%, driven by increased international lending and counterparty exposures and equity trading and investments exposures. The increase in international lending and counterparty exposures was primarily due to higher derivatives exposures. The increase was partially offset by a decrease in real estate and structured assets due to significantly reduced commercial real estate, residential real estate and asset-backed exposures. |
| As part of our overall risk management, we hold a portfolio of hedges. Hedges are impacted by market movements similar to other trading securities, and may result in gains or losses which offset losses or gains on the portfolio they were designed to hedge. Due to the varying nature and structure of hedges, these gains or losses may not perfectly offset the losses or gains on the portfolio. |
Market risk |
| We primarily assume trading risks through the trading activities in Investment Banking. The other divisions also engage in trading activities, but to a much lesser extent. Trading risks are measured using VaR along with a number of other risk measurement tools. VaR is the potential loss in fair value of trading positions due to adverse market movements over a defined time horizon and for a specified confidence level. VaR relies on historical data and is considered a useful tool for estimating potential loss in normal markets in which there are no abrupt changes in market conditions. Other tools are more appropriate for modeling the impact from severe market conditions. |
| In order to show the aggregate market risk in our trading books, the table entitled “Daily VaR” shows the trading-related market risk on a consolidated basis. It shows ten-day VaR scaled to a one-day holding period and is based on a 99% confidence level. This means that there is a 1-in-100 chance of incurring a daily mark-to-market trading loss that is at least as large as the reported VaR. |
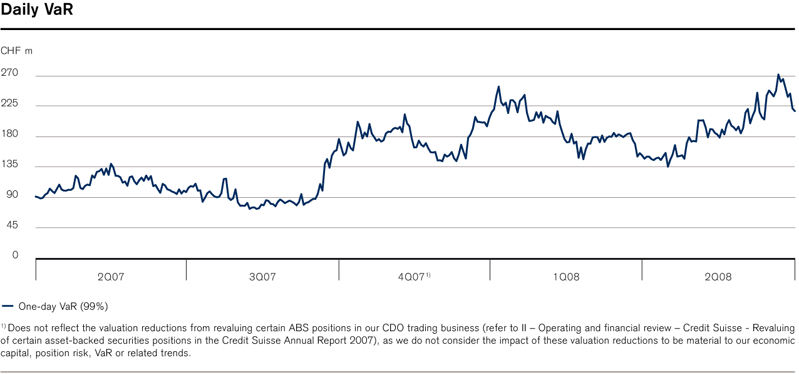 |
| Our average one-day, 99% VaR during 2Q08 was CHF 193 million compared to CHF 194 million during 1Q08 and CHF 110 million during 2Q07. Average VaR was stable, as lower exposures during 2Q08 were offset by the market volatility and methodology changes that increased the reported VaR. Period-end VaR increased significantly during 2Q08 to CHF 218 million compared to CHF 153 million as of the end of 1Q08 and CHF 100 million as of the end of 2Q07. This was due to market volatility in the data used to calculate VaR and a methodology change for certain CDO positions to better capture the liquidity basis risk between the related derivative and cash positions. If this new methodology had been in place as of the end of 1Q08, the 1Q08 end-of-period one-day, 99% VaR would have been CHF 180 million. |
| One-day, 99% VaR | |||||||||||||
in / end of period | Interest rate and credit spread | Foreign exchange | Commodity | Equity | Diversi- fication benefit | Total | |||||||
| 2Q08 (CHF million) | |||||||||||||
| Average | 184 | 21 | 40 | 56 | (108) | 193 | |||||||
| Minimum | 113 | 11 | 25 | 38 | – | 1 | 136 | ||||||
| Maximum | 232 | 29 | 50 | 90 | – | 1 | 272 | ||||||
| End of period | 186 | 17 | 36 | 78 | (99) | 218 | |||||||
| 1Q08 (CHF million) | |||||||||||||
| Average | 152 | 37 | 42 | 78 | (115) | 194 | |||||||
| Minimum | 129 | 23 | 30 | 52 | – | 1 | 147 | ||||||
| Maximum | 185 | 57 | 60 | 104 | – | 1 | 254 | ||||||
| End of period | 146 | 23 | 39 | 54 | (109) | 153 | |||||||
| 2Q07 (CHF million) | |||||||||||||
| Average | 60 | 24 | 18 | 92 | (84) | 110 | |||||||
| Minimum | 48 | 16 | 10 | 69 | – | 1 | 89 | ||||||
| Maximum | 70 | 38 | 26 | 126 | – | 1 | 140 | ||||||
| End of period | 48 | 30 | 14 | 99 | (91) | 100 | |||||||
| 1 As the maximum and minimum occur on different days for different risk types, it is not meaningful to calculate a portfolio diversification benefit. | |||||||||||||
| Various techniques are used to assess the accuracy of the VaR model, including backtesting. In line with industry practice, we present backtesting using actual daily trading revenues. Actual daily trading revenues are compared with VaR calculated using a one-day holding period. A backtesting exception occurs when the trading revenues loss exceeds the daily VaR estimate. We had one backtesting exception during 2Q08, due to the volatile market conditions. The histogram entitled “Actual daily trading revenues” reflects the distribution of actual daily trading revenues during 2Q08, 1Q08 and 2Q07. The width of this distribution provides another indication of the day-to-day risk in our trading activities. |
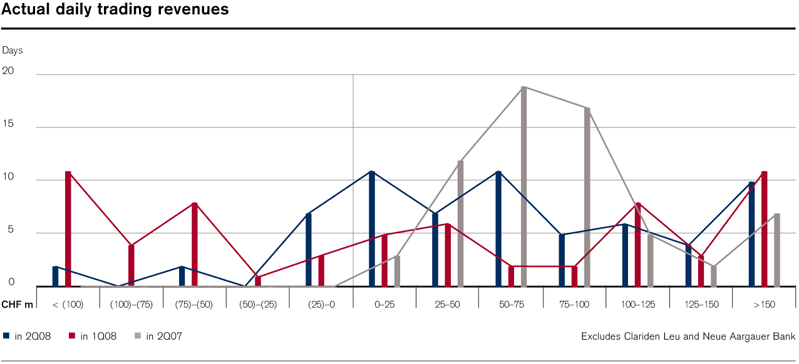 |
| We assume non-trading interest rate risks through interest rate-sensitive positions originated by Private Banking and risk-transferred to Global Treasury, money market and funding activities by Global Treasury and the deployment of our consolidated equity as well as other activities, including market-making and trading activities involving banking book positions at the divisions. Savings accounts and many other retail banking products have no contractual maturity date or direct market-linked interest rate and are risk-transferred from Private Banking to Global Treasury on a pooled basis using replicating portfolios (approximating the re-pricing behavior of the underlying product). Global Treasury, as well as other desks running interest rate risk positions, actively manage their position within approved limits. |
| The impact of a one basis point parallel increase of the yield curves on the fair value of interest rate-sensitive non-trading book positions would have amounted to a valuation decrease of CHF 3.3 million as of the end of 2Q08, compared to CHF 4.1 million as of the end of 1Q08, mainly due to a reduction in the long bond interest rate exposures in the banking books at Global Treasury. |
Credit risk |
| We encounter credit risk in our lending-related businesses, in counterparty trading and through issuer risk in trading assets. The majority of our credit risk is concentrated in Investment Banking and Private Banking. |
Loan exposure |
| Compared to the end of 1Q08, gross loans increased 2% to CHF 236 billion as of the end of 2Q08. In Private Banking, gross loans increased 3% to CHF 181.4 billion, primarily due to growth in loans collateralized by securities in Wealth Management. Gross loans in Investment Banking increased 1% to CHF 54.4 billion. |
| As of the end of 2Q08, gross impaired loans were CHF 1.8 billion, an 8% reduction from the end of 1Q08, with reductions in both Private Banking and Investment Banking. Total coverage of gross impaired loans by valuation allowances as of the end of 2Q08 increased during the quarter to 68% from 62% as of the end of 1Q08. In Private Banking, coverage of gross impaired loans by valuation allowances increased to 63% from 60% and in Investment Banking coverage increased to 84% from 67%. We recorded a net new provision for credit losses of CHF 45 million in 2Q08 compared to CHF 151 million in 1Q08. The provisions in 2Q08 and 1Q08 were primarily due to provisions in Investment Banking relating to a guarantee provided in a prior year to a third-party bank. |
| Compared to 2Q07, gross loans increased CHF 10.4 billion, or 5%, reflecting growth in both Investment Banking and Private Banking. Gross loans in Private Banking increased from CHF 174.6 billion to CHF 181.4 billion across most businesses. In Investment Banking, gross loans increased from CHF 50.4 billion to CHF 54.4 billion, due to increases in commercial and industrial loans and real estate. |
| Compared to 2Q07, gross impaired loans increased 1%, driven by an increase in non-performing loans and other impaired loans in Investment Banking, partially offset by reductions in non-performing loans in Private Banking. |
| Loans | |||||||||||||||||||||||||||||||||||||
| Private Banking | Investment Banking | Other | 1 | Credit Suisse | |||||||||||||||||||||||||||||||||
| Wealth Management | Corporate & Retail Banking | ||||||||||||||||||||||||||||||||||||
| end of | 2Q08 | 1Q08 | 2Q07 | 2Q08 | 1Q08 | 2Q07 | 2Q08 | 1Q08 | 2Q07 | 2Q08 | 1Q08 | 2Q07 | 2Q08 | 1Q08 | 2Q07 | 2Q08 | 1Q08 | 2Q07 | |||||||||||||||||||
| Loans (CHF million) | |||||||||||||||||||||||||||||||||||||
| Mortgages | 32,272 | 31,926 | 31,038 | 48,611 | 48,316 | 48,569 | 80,883 | 80,242 | 79,607 | 0 | 0 | 0 | 0 | 0 | 0 | 80,883 | 80,242 | 79,607 | |||||||||||||||||||
| Loans collateralized by securities | 25,783 | 23,013 | 25,484 | 197 | 185 | 244 | 25,980 | 23,198 | 25,728 | 0 | 0 | 0 | 0 | 0 | 0 | 25,980 | 23,198 | 25,728 | |||||||||||||||||||
| Consumer finance | 942 | 993 | 260 | 3,801 | 3,748 | 3,032 | 4,743 | 4,741 | 3,292 | 1,288 | 1,030 | 1,067 | 0 | 0 | 0 | 6,031 | 5,771 | 4,359 | |||||||||||||||||||
| Consumer loans | 58,997 | 55,932 | 56,782 | 52,609 | 52,249 | 51,845 | 111,606 | 108,181 | 108,627 | 1,288 | 1,030 | 1,067 | 0 | 0 | 0 | 112,894 | 109,211 | 109,694 | |||||||||||||||||||
| Real estate | 5,382 | 4,926 | 4,396 | 15,563 | 15,419 | 15,159 | 20,945 | 20,345 | 19,555 | 2,627 | 2,196 | 1,211 | 0 | 0 | 10 | 23,572 | 22,541 | 20,776 | |||||||||||||||||||
| Commercial and industrial loans | 8,970 | 9,406 | 9,086 | 28,169 | 28,534 | 27,033 | 37,139 | 37,940 | 36,119 | 29,329 | 28,220 | 27,140 | 0 | 0 | 1 | 66,468 | 66,160 | 63,260 | |||||||||||||||||||
| Loans to financial institutions | 5,743 | 5,263 | 6,628 | 4,670 | 3,165 | 2,259 | 10,413 | 8,428 | 8,887 | 19,058 | 20,240 | 20,106 | 122 | 234 | 494 | 29,593 | 28,902 | 29,487 | |||||||||||||||||||
| Governments and public institutions | 17 | 17 | 17 | 1,271 | 1,335 | 1,432 | 1,288 | 1,352 | 1,449 | 2,142 | 2,200 | 913 | 0 | 5 | 0 | 3,430 | 3,557 | 2,362 | |||||||||||||||||||
| Corporate and institutional loans | 20,112 | 2 | 19,612 | 2 | 20,127 | 2 | 49,673 | 48,453 | 45,883 | 69,785 | 68,065 | 66,010 | 53,156 | 52,856 | 49,370 | 122 | 239 | 505 | 123,063 | 121,160 | 115,885 | ||||||||||||||||
| Gross loans | 79,109 | 75,544 | 76,909 | 102,282 | 100,702 | 97,728 | 181,391 | 176,246 | 174,637 | 54,444 | 53,886 | 50,437 | 122 | 239 | 505 | 235,957 | 230,371 | 225,579 | |||||||||||||||||||
| of which reported at fair value | – | – | – | – | – | – | – | – | – | 28,478 | 28,682 | 21,154 | – | – | – | 28,478 | 28,682 | 21,154 | |||||||||||||||||||
| Net (unearned income) / deferred expenses | 15 | 14 | 13 | 29 | 31 | 47 | 44 | 45 | 60 | (68) | (62) | (46) | 1 | 0 | 1 | (23) | (17) | 15 | |||||||||||||||||||
| Allowance for loan losses 3 | (76) | (76) | (78) | (762) | (802) | (1,005) | (838) | (878) | (1,083) | (365) | (308) | (287) | 0 | 0 | (2) | (1,203) | (1,186) | (1,372) | |||||||||||||||||||
| Net loans | 79,048 | 75,482 | 76,844 | 1 01,549 | 99,931 | 96,770 | 180,597 | 175,413 | 173,614 | 54,011 | 53,516 | 50,104 | 123 | 239 | 504 | 234,731 | 229,168 | 224,222 | |||||||||||||||||||
| Impaired loans (CHF million) | |||||||||||||||||||||||||||||||||||||
| Non-performing loans | 125 | 171 | 131 | 547 | 601 | 698 | 672 | 772 | 829 | 392 | 390 | 55 | 0 | 0 | 1 | 1,064 | 1,162 | 885 | |||||||||||||||||||
| Non-interest-earning loans | 39 | 33 | 31 | 253 | 283 | 443 | 292 | 316 | 474 | 0 | 0 | 0 | 0 | 0 | 0 | 292 | 316 | 474 | |||||||||||||||||||
| Total non-performing loans | 164 | 204 | 162 | 800 | 884 | 1,141 | 964 | 1,088 | 1,303 | 392 | 390 | 55 | 0 | 0 | 1 | 1,356 | 1,478 | 1,359 | |||||||||||||||||||
| Restructured loans | 0 | 0 | 0 | 0 | 3 | 3 | 0 | 3 | 3 | 38 | 38 | 0 | 0 | 0 | 0 | 38 | 41 | 3 | |||||||||||||||||||
| Potential problem loans | 10 | 12 | 11 | 362 | 365 | 371 | 372 | 377 | 382 | 3 | 30 | 0 | 0 | 0 | 1 | 375 | 407 | 383 | |||||||||||||||||||
| Total other impaired loans | 10 | 12 | 11 | 362 | 368 | 374 | 372 | 380 | 385 | 41 | 68 | 0 | 0 | 0 | 1 | 413 | 448 | 386 | |||||||||||||||||||
| Gross impaired loans 3 | 174 | 216 | 173 | 1,162 | 1,252 | 1,515 | 1,336 | 1,468 | 1,688 | 433 | 458 | 55 | 0 | 0 | 2 | 1,769 | 1,926 | 1,745 | |||||||||||||||||||
| of which with a specific allowance | 171 | 215 | 170 | 998 | 1,089 | 1,298 | 1,169 | 1,304 | 1,468 | 430 | 454 | 55 | 0 | 0 | 2 | 1,599 | 1,758 | 1,525 | |||||||||||||||||||
| of which without a specific allowance | 3 | 1 | 3 | 164 | 163 | 217 | 167 | 164 | 220 | 3 | 4 | 0 | 0 | 0 | 0 | 170 | 168 | 220 | |||||||||||||||||||
| Allowance for loan losses (CHF million) | |||||||||||||||||||||||||||||||||||||
| Balance at beginning of period 3 | 76 | 74 | 81 | 802 | 865 | 1,101 | 878 | 939 | 1,182 | 308 | 295 | 266 | 0 | 0 | 1 | 1,186 | 1,234 | 1,449 | |||||||||||||||||||
| Change in accounting | 0 | 0 | 0 | 0 | 0 | 0 | 0 | 0 | 0 | 0 | 0 | 0 | 0 | 0 | 0 | 0 | 0 | 0 | |||||||||||||||||||
| Net additions charged to statements of income | 2 | 2 | 0 | 2 | (7) | (30) | 4 | (5) | (30) | 38 | 33 | 16 | 0 | 0 | 1 | 42 | 28 | (13) | |||||||||||||||||||
| Gross write-offs | (1) | (1) | (3) | (62) | (55) | (84) | (63) | (56) | (87) | 2 | (14) | (5) | 0 | 0 | 1 | (61) | (70) | (91) | |||||||||||||||||||
| Recoveries | 0 | 0 | 0 | 16 | 10 | 22 | 16 | 10 | 22 | 6 | 26 | 2 | 0 | 0 | 0 | 22 | 36 | 24 | |||||||||||||||||||
| Net write-offs | (1) | (1) | (3) | (46) | (45) | (62) | (47) | (46) | (65) | 8 | 12 | (3) | 0 | 0 | 1 | (39) | (34) | (67) | |||||||||||||||||||
| Provisions for interest | (1) | 2 | 0 | 1 | (2) | (5) | 0 | 0 | (5) | (1) | 5 | 6 | 0 | 0 | 0 | (1) | 5 | 1 | |||||||||||||||||||
| Foreign currency translation impact and other adjustments, net | 0 | (1) | 0 | 3 | (9) | 1 | 3 | (10) | 1 | 12 | (37) | 2 | 0 | 0 | (1) | 15 | (47) | 2 | |||||||||||||||||||
| Balance at end of period 3 | 76 | 76 | 78 | 762 | 802 | 1,005 | 838 | 878 | 1,083 | 365 | 308 | 287 | 0 | 0 | 2 | 1,203 | 1,186 | 1,372 | |||||||||||||||||||
| of which a specific allowance | 51 | 52 | 55 | 625 | 670 | 865 | 676 | 722 | 920 | 139 | 108 | 33 | 0 | 0 | 1 | 815 | 830 | 954 | |||||||||||||||||||
| of which an inherent credit loss allowance | 25 | 24 | 23 | 137 | 132 | 140 | 162 | 156 | 163 | 226 | 200 | 254 | 0 | 0 | 1 | 388 | 356 | 418 | |||||||||||||||||||
| Loan metrics (%) | |||||||||||||||||||||||||||||||||||||
| Total non-performing loans / Gross loans 4 | 0.2 | 0.3 | 0.2 | 0.8 | 0.9 | 1.2 | 0.5 | 0.6 | 0.7 | 1.5 | 1.5 | 0.2 | – | – | – | 0.7 | 0.7 | 0.7 | |||||||||||||||||||
| Gross impaired loans / Gross loans 4 | 0.2 | 0.3 | 0.2 | 1.1 | 1.2 | 1.6 | 0.7 | 0.8 | 1.0 | 1.7 | 1.8 | 0.2 | – | – | – | 0.9 | 1.0 | 0.9 | |||||||||||||||||||
| Allowance for loan losses / Total non-performing loans 3 | 46.3 | 37.3 | 48.1 | 95.3 | 90.7 | 88.1 | 86.9 | 80.7 | 83.1 | 93.1 | 79.0 | – | – | – | – | 88.7 | 80.2 | 101.0 | |||||||||||||||||||
| Allowance for loan losses / Gross impaired loans 3 | 43.7 | 35.2 | 45.1 | 65.6 | 64.1 | 66.3 | 62.7 | 59.8 | 64.2 | 84.3 | 67.2 | – | – | – | – | 68.0 | 61.6 | 78.6 | |||||||||||||||||||
| The disclosure presents our lending exposure from a risk management perspective and, as such, differs from the loans presentation in Note 12 - Loans in V - Condensed consolidated financial statements - unaudited. | |||||||||||||||||||||||||||||||||||||
| 1 Includes Asset Management and Corporate Center. 2 Of which CHF 18,822 million, CHF 18,437 million and CHF 17,405 million were secured by financial collateral and mortgages in 2Q08, 1Q08 and 2Q07, respectively. 3 Impaired loans and allowance for loan losses are only based on loans which are not carried at fair value. 4 Excludes loans carried at fair value. | |||||||||||||||||||||||||||||||||||||
V – Condensed consolidated financial statements – unaudited |
Report of Independent Registered Public Accounting Firm |
Condensed consolidated financial statements – unaudited |
Notes to the condensed consolidated financial statements – unaudited |
Report of Independent Registered Public Accounting Firm |
| Report of Independent Registered Public Accounting Firm to the Board of Directors of |
| Credit Suisse Group AG, Zurich |
| We have reviewed the accompanying condensed consolidated balance sheets of Credit Suisse Group AG and subsidiaries (the “Group”) as of June 30, 2008 and 2007, the related condensed consolidated statements of income and comprehensive income for the three and six-month periods ended June 30, 2008 and 2007 and the related condensed consolidated statements of changes in shareholders' equity and cash flows for the six-month periods ended June 30, 2008 and 2007. These condensed consolidated financial statements are the responsibility of the Group's management. |
| We conducted our reviews in accordance with the standards of the Public Company Accounting Oversight Board (United States). A review of interim financial information consists principally of applying analytical procedures and making inquiries of persons responsible for financial and accounting matters. It is substantially less in scope than an audit conducted in accordance with the standards of the Public Company Accounting Oversight Board (United States), the objective of which is the expression of an opinion regarding the financial statements taken as a whole. Accordingly, we do not express such an opinion. |
| Based on our reviews, we are not aware of any material modifications that should be made to the condensed consolidated financial statements referred to above for them to be in conformity with U.S. generally accepted accounting principles. |
| We have previously audited, in accordance with standards of the Public Company Accounting Oversight Board (United States), the consolidated balance sheet of the Group as of December 31, 2007, and the related consolidated statements of income, changes in shareholders’ equity, comprehensive income and cash flows for the year then ended (not presented herein); and in our report dated March 18, 2008, we expressed an unqualified opinion on those consolidated financial statements. In our opinion, the information set forth in the accompanying condensed consolidated balance sheet as of December 31, 2007, is fairly stated, in all material respects, in relation to the consolidated balance sheet from which it has been derived. |
| KPMG Klynveld Peat Marwick Goerdeler SA |
| David L. Jahnke Robert S. Overstreet |
| Auditor in charge |
| Zurich, Switzerland |
| July 23, 2008 |
| The accompanying notes to the condensed consolidated financial statements – unaudited are an integral part of these statements. |
Condensed consolidated financial statements – unaudited |
| Consolidated statements of income (unaudited) | |||||||||||||||||
| in | % change | in | % change | ||||||||||||||
| 2Q08 | 1Q08 | 2Q07 | QoQ | YoY | 6M08 | 6M07 | YoY | ||||||||||
| Consolidated statements of income (CHF million) | |||||||||||||||||
| Interest and dividend income | 13,062 | 12,759 | 16,619 | 2 | (21) | 25,821 | 31,311 | (18) | |||||||||
| Interest expense | (11,202) | (10,653) | (14,370) | 5 | (22) | (21,855) | (26,973) | (19) | |||||||||
| Net interest income | 1,860 | 2,106 | 2,249 | (12) | (17) | 3,966 | 4,338 | (9) | |||||||||
| Commissions and fees | 4,197 | 3,933 | 5,242 | 7 | (20) | 8,130 | 10,219 | (20) | |||||||||
| Trading revenues | 900 | (1,777) | 3,810 | – | (76) | (877) | 7,026 | – | |||||||||
| Other revenues | 1,180 | (1,167) | 1,736 | – | (32) | 13 | 3,074 | (100) | |||||||||
| Net revenues | 8,137 | 3,095 | 13,037 | 163 | (38) | 11,232 | 24,657 | (54) | |||||||||
| Provision for credit losses | 45 | 151 | (20) | (70) | – | 196 | 33 | 494 | |||||||||
| Compensation and benefits | 4,076 | 3,264 | 5,409 | 25 | (25) | 7,340 | 10,359 | (29) | |||||||||
| General and administrative expenses | 1,565 | 1,585 | 1,619 | (1) | (3) | 3,150 | 3,151 | 0 | |||||||||
| Commission expenses | 610 | 624 | 642 | (2) | (5) | 1,234 | 1,251 | (1) | |||||||||
| Total other operating expenses | 2,175 | 2,209 | 2,261 | (2) | (4) | 4,384 | 4,402 | 0 | |||||||||
| Total operating expenses | 6,251 | 5,473 | 7,670 | 14 | (19) | 11,724 | 14,761 | (21) | |||||||||
| Income/(loss) before taxes and minority interests | 1,841 | (2,529) | 5,387 | – | (66) | (688) | 9,863 | – | |||||||||
| Income tax expense/(benefit) | 297 | (455) | 863 | – | (66) | (158) | 1,685 | – | |||||||||
| Minority interests | 329 | 74 | 1,335 | 345 | (75) | 403 | 2,260 | (82) | |||||||||
| Net income/(loss) | 1,215 | (2,148) | 3,189 | – | (62) | (933) | 5,918 | – | |||||||||
| Basic earnings per share (CHF) | |||||||||||||||||
| Net income/(loss) | 1.18 | (2.10) | 3.00 | – | (61) | (0.91) | 5.56 | – | |||||||||
| Diluted earnings per share (CHF) | |||||||||||||||||
| Net income/(loss) | 1.12 | (2.10) | 2.82 | – | (60) | (0.91) | 5.24 | – | |||||||||
| Consolidated balance sheets (unaudited) | |||||||||||||||
| end of | % change | ||||||||||||||
| 2Q08 | 1Q08 | 4Q07 | 2Q07 | QoQ | Ytd | YoY | |||||||||
| Assets (CHF million) | |||||||||||||||
| Cash and due from banks | 30,949 | 27,773 | 38,459 | 36,569 | 11 | (20) | (15) | ||||||||
| Interest-bearing deposits with banks | 5,419 | 3,412 | 3,759 | 2,838 | 59 | 44 | 91 | ||||||||
| Central bank funds sold, securities purchased under resale agreements and securities borrowing transactions | 281,549 | 276,507 | 296,709 | 33 9,361 | 2 | (5) | (17) | ||||||||
| of which reported at fair value | 148,087 | 158,948 | 183,719 | 160,658 | (7) | (19) | (8) | ||||||||
| Securities received as collateral, at fair value | 27,072 | 20,679 | 28,314 | 23,912 | 31 | (4) | 13 | ||||||||
| Trading assets, at fair value | 444,775 | 446,683 | 532,083 | 552,321 | 0 | (16) | (19) | ||||||||
| of which encumbered | 108,793 | 122,470 | 141,764 | 161,149 | (11) | (23) | (32) | ||||||||
| Investment securities | 14,246 | 15,129 | 15,731 | 18,544 | (6) | (9) | (23) | ||||||||
| of which reported at fair value | 13,977 | 14,865 | 15,453 | 18,268 | (6) | (10) | (23) | ||||||||
| of which encumbered | 44 | 4,320 | 1,908 | 7,390 | (99) | (98) | (99) | ||||||||
| Other investments | 27,687 | 25,228 | 28,120 | 21,783 | 10 | (2) | 27 | ||||||||
| of which reported at fair value | 25,006 | 22,933 | 25,195 | 19,931 | 9 | (1) | 25 | ||||||||
| Net loans | 234,731 | 229,168 | 240,534 | 224,222 | 2 | (2) | 5 | ||||||||
| of which reported at fair value | 28,478 | 28,682 | 31,047 | 21,154 | (1) | (8) | 35 | ||||||||
| allowance for loan losses | 1,203 | 1,186 | 1,234 | 1,372 | 1 | (3) | (12) | ||||||||
| Premises and equipment | 6,082 | 5,912 | 6,149 | 6,133 | 3 | (1) | (1) | ||||||||
| Goodwill | 9,806 | 9,590 | 10,882 | 11,094 | 2 | (10) | (12) | ||||||||
| Other intangible assets | 585 | 532 | 444 | 506 | 10 | 32 | 16 | ||||||||
| of which reported at fair value | 123 | 129 | 179 | 217 | (5) | (31) | (43) | ||||||||
| Other assets | 146,924 | 147,381 | 159,496 | 177,891 | 0 | (8) | (17) | ||||||||
| of which reported at fair value | 47,199 | 48,573 | 49,326 | 48,104 | (3) | (4) | (2) | ||||||||
| of which encumbered | 5,599 | 8,634 | 12,084 | 23,487 | (35) | (54) | (76) | ||||||||
| Total assets | 1,229,825 | 1,207,994 | 1,360,680 | 1,415,174 | 2 | (10) | (13) | ||||||||
| Consolidated balance sheets (unaudited) | |||||||||||||||
| end of | % change | ||||||||||||||
| 2Q08 | 1Q08 | 4Q07 | 2Q07 | QoQ | Ytd | YoY | |||||||||
| Liabilities and shareholders' equity (CHF million) | |||||||||||||||
| Due to banks | 71,780 | 75,339 | 90,864 | 117,020 | (5) | (21) | (39) | ||||||||
| of which reported at fair value | 6,205 | 6,040 | 6,047 | 5,138 | 3 | 3 | 21 | ||||||||
| Customer deposits | 304,158 | 315,564 | 335,505 | 342,318 | (4) | (9) | (11) | ||||||||
| of which reported at fair value | 4,357 | 5,288 | 6,134 | 6,532 | (18) | (29) | (33) | ||||||||
| Central bank funds purchased, securities sold under repurchase agreements and securities lending transactions | 256,820 | 255,893 | 300,381 | 291,930 | 0 | (15) | (12) | ||||||||
| of which reported at fair value | 137,526 | 112,867 | 140,424 | 137,878 | 22 | (2) | 0 | ||||||||
| Obligation to return securities received as collateral, at fair value | 27,072 | 20,679 | 28,314 | 23,912 | 31 | (4) | 13 | ||||||||
| Trading liabilities, at fair value | 195,213 | 186,868 | 201,809 | 243,351 | 4 | (3) | (20) | ||||||||
| Short-term borrowings | 12,081 | 12,709 | 19,390 | 27,471 | (5) | (38) | (56) | ||||||||
| of which reported at fair value | 6,222 | 4,692 | 8,120 | 11,143 | 33 | (23) | (44) | ||||||||
| Long-term debt | 152,755 | 142,839 | 160,157 | 160,876 | 7 | (5) | (5) | ||||||||
| of which reported at fair value | 98,228 | 96,008 | 111,293 | 106,222 | 2 | (12) | (8) | ||||||||
| Other liabilities | 157,109 | 146,305 | 164,421 | 147,955 | 7 | (4) | 6 | ||||||||
| of which reported at fair value | 25,644 | 24,431 | 24,233 | 24,359 | 5 | 6 | 5 | ||||||||
| Minority interests | 15,989 | 14,159 | 16,640 | 16,492 | 13 | (4) | (3) | ||||||||
| Total liabilities | 1,192,977 | 1,170,355 | 1,317,481 | 1,371,325 | 2 | (9) | (13) | ||||||||
| Common shares | 46 | 46 | 46 | 608 | 0 | 0 | (92) | ||||||||
| Additional paid-in capital | 25,235 | 25,228 | 24,553 | 24,259 | 0 | 3 | 4 | ||||||||
| Retained earnings | 29,957 | 31,522 | 33,670 | 34,912 | (5) | (11) | (14) | ||||||||
| Treasury shares, at cost | (9,800) | (9,735) | (9,378) | (11,189) | 1 | 4 | (12) | ||||||||
| Accumulated other comprehensive income/(loss) | (8,590) | (9,422) | (5,692) | (4,741) | (9) | 51 | 81 | ||||||||
| Total shareholders' equity | 36,848 | 37,639 | 43,199 | 43,849 | (2) | (15) | (16) | ||||||||
| Total liabilities and shareholders' equity | 1,229,825 | 1,207,994 | 1,360,680 | 1,415,174 | 2 | (10) | (13) | ||||||||
| end of | % change | ||||||||||||||
| 2Q08 | 1Q08 | 4Q07 | 2Q07 | QoQ | Ytd | YoY | |||||||||
| Additional share information | |||||||||||||||
| Par value (CHF) | 0.04 | 0.04 | 0.04 | 0.50 | 0 | 0 | (92) | ||||||||
| Authorized shares (million) | 1,359.2 | 1,359.3 | 1,359.3 | 1,413.3 | 0 | 0 | (4) | ||||||||
| Issued shares (million) | 1,174.2 | 1,162.5 | 1,162.4 | 1,215.9 | 1 | 1 | (3) | ||||||||
| Repurchased shares (million) | (150.5) | (149.0) | (141.8) | (169.4) | 1 | 6 | (11) | ||||||||
| Shares outstanding (million) | 1,023.7 | 1,013.5 | 1,020.6 | 1,046.5 | 1 | 0 | (2) | ||||||||
| Consolidated statements of changes in shareholders' equity (unaudited) | |||||||||||||||
Common shares | Additional paid-in capital | Retained earnings | Treasury shares, at cost | Accumu- lated other compre- hensive income/ (loss) | Total share- holders' equity | Number of common shares outstanding | |||||||||
| 6M08 (CHF million) | |||||||||||||||
| Balance at beginning of period | 46 | 24,553 | 33,670 | (9,378) | (5,692) | 43,199 | 1,020,627,855 | 1 | |||||||
| Net income/(loss) | – | – | (933) | – | – | (933) | – | ||||||||
| Other comprehensive income/(loss), net of tax | – | – | – | – | (2,898) | (2,898) | – | ||||||||
| Issuance of common shares | – | 633 | – | – | – | 633 | 11,753,222 | ||||||||
| Issuance of treasury shares | – | (39) | – | 12,940 | – | 12,901 | 238,091,502 | ||||||||
| Repurchase of treasury shares | – | – | (13,558) | – | (13,558) | (249,978,737) | 2 | ||||||||
| Share-based compensation, net of tax | – | 196 | – | 196 | – | 392 | 3,248,041 | ||||||||
| Derivatives indexed to own shares 3 | – | (108) | – | – | – | (108) | – | ||||||||
| Cash dividends paid | – | – | (2,780) | – | – | (2,780) | – | ||||||||
| Balance at end of period | 46 | 25,235 | 29,957 | (9,800) | (8,590) | 36,848 | 1,023,741,883 | 4 | |||||||
| 6M07 (CHF million) | |||||||||||||||
| Balance at beginning of period | 607 | 24,817 | 32,306 | (9,111) | (5,033) | 43,586 | 1,062,467,061 | ||||||||
| Net income | – | – | 5,918 | – | – | 5,918 | – | ||||||||
| Cumulative effect of accounting changes, net of tax | – | – | (829) | – | 10 | (819) | – | ||||||||
| Other comprehensive income/(loss), net of tax | – | – | – | – | 282 | 282 | – | ||||||||
| Issuance of common shares | 1 | 43 | – | – | – | 44 | 995,655 | ||||||||
| Issuance of treasury shares | – | (25) | – | 17,128 | – | 17,103 | 195,928,526 | ||||||||
| Repurchase of treasury shares | – | – | – | (20,369) | – | (20,369) | (233,132,103) | ||||||||
| Share-based compensation, net of tax | – | (313) | – | 1,163 | – | 850 | 20,173,268 | ||||||||
| Derivatives indexed to own shares | – | (263) | – | – | – | (263) | – | ||||||||
| Cash dividends paid | – | – | (2,483) | – | – | (2,483) | – | ||||||||
| Balance at end of period | 608 | 24,259 | 34,912 | (11,189) | (4,741) | 43,849 | 1,046,432,407 | ||||||||
| 1 At par value CHF 0.04 each, fully paid, net of 141,834,285 treasury shares. In addition to the treasury shares, a maximum of 196,835,440 unissued shares (conditional and authorized capital) were available for issuance without further approval of the shareholders. 2 Includes 3,595,000 shares repurchased in connection with Credit Suisse Group's share buyback programs. 3 The Group has purchased certain call options on its own shares to economically hedge all or a portion of the leverage element of the Incentive Share Units granted to the employees during 6M08. In accordance with EITF 00-19, these call options are designated as equity instruments and, as such, are initially recognized in shareholders' equity at their fair values and not subsequently remeasured. 4 At par value CHF 0.04 each, fully paid, net of 150,473,479 treasury shares, of which 49,700,000 shares have been approved at the Annual General Meeting on April 25, 2008, for cancellation in 3Q08. In addition to the treasury shares, a maximum of 185,015,438 unissued shares (conditional and authorized capital) were available for issuance without further approval of the shareholders. | |||||||||||||||
| Comprehensive income (unaudited) | |||||||||||||||||
| in | % change | in | % change | ||||||||||||||
| 2Q08 | 1Q08 | 2Q07 | QoQ | YoY | 6M08 | 6M07 | YoY | ||||||||||
| Comprehensive income (CHF million) | |||||||||||||||||
| Net income/(loss) | 1,215 | (2,148) | 3,189 | – | (62) | (933) | 5,918 | – | |||||||||
| Gains/(losses) on cash flow hedges | (24) | 11 | (2) | – | – | (13) | (9) | 44 | |||||||||
| Cumulative translation adjustments | 914 | (3,765) | 343 | – | 166 | (2,851) | 277 | – | |||||||||
| Unrealized gains/(losses) on securities | (72) | 21 | (17) | – | 324 | (51) | (6) | – | |||||||||
| Actuarial gains/losses | 7 | 4 | 48 | 75 | (85) | 11 | 46 | (76) | |||||||||
| Net prior service cost | 7 | (1) | (26) | – | – | 6 | (26) | – | |||||||||
| Other comprehensive income/(loss), net of tax | 832 | (3,730) | 346 | – | 140 | (2,898) | 282 | – | |||||||||
| Comprehensive income/(loss) | 2,047 | (5,878) | 3,535 | &nda sh; | (42) | (3,831) | 6,200 | – | |||||||||
| Consolidated statements of cash flows (unaudited) | |||||||
| in | % change | ||||||
| 6M08 | 6M07 | YoY | |||||
| Operating activities (CHF million) | |||||||
| Net income/(loss) | (933) | 5,918 | – | ||||
| Adjustments to reconcile net income/(loss) to net cash provided by/(used in) operating activities (CHF million) | |||||||
| Impairment, depreciation and amortization | 475 | 432 | 10 | ||||
| Provision for credit losses | 196 | 33 | 494 | ||||
| Deferred tax provision | (282) | (32) | – | ||||
| Share of net income from equity method investments | (32) | (25) | 28 | ||||
| Trading assets and liabilities | 44,095 | (39,622) | – | ||||
| (Increase)/decrease in accrued interest, fees receivable and other assets | (4,464) | (47,415) | (91) | ||||
| Increase/(decrease) in accrued expenses and other liabilities | 9,161 | 34,201 | (73) | ||||
| Other, net | (7,902) | 2,513 | – | ||||
| Total adjustments | 41,247 | (49,915) | – | ||||
| Net cash provided by/(used in) operating activities | 40,314 | (43,997) | – | ||||
| Investing activities (CHF million) | |||||||
| (Increase)/decrease in interest-bearing deposits with banks | (1,891) | 5,511 | – | ||||
| (Increase)/decrease in central bank funds sold, securities purchased under resale agreements and securities borrowing transactions | (10,887) | (19,581) | (44) | ||||
| Purchase of investment securities | (512) | (281) | 82 | ||||
| Proceeds from sale of investment securities | 8 | 531 | (98) | ||||
| Maturities of investment securities | 1,221 | 2,647 | (54) | ||||
| Investments in subsidiaries and other investments | (2,574) | (1,726) | 49 | ||||
| Proceeds from sale of other investments | 1,393 | 895 | 56 | ||||
| (Increase)/decrease in loans | (1,287) | (15,755) | (92) | ||||
| Proceeds from sales of loans | 472 | 285 | 66 | ||||
| Capital expenditures for premises and equipment and other intangible assets | (601) | (612) | (2) | ||||
| Proceeds from sale of premises and equipment and other intangible assets | 2 | 11 | (82) | ||||
| Other, net | (15) | (23) | (35) | ||||
| Net cash provided by/(used in) investing activities | (14,671) | (28,098) | (48) | ||||
| Consolidated statements of cash flows (unaudited) (continued) | |||||||
| in | % change | ||||||
| 6M08 | 6M07 | YoY | |||||
| Financing activities (CHF million) | |||||||
| Increase/(decrease) in due to banks and customer deposits | (28,210) | 69,839 | – | ||||
| Increase/(decrease) in short-term borrowings | (6,252) | 6,087 | – | ||||
| Increase/(decrease) in central bank funds purchased, securities sold under repurchase agreements and securities lending transactions | (17,662) | 2,633 | – | ||||
| Issuances of long-term debt | 61,476 | 39,264 | 57 | ||||
| Repayments of long-term debt | (40,801) | (34,780) | 17 | ||||
| Issuances of common shares | 633 | 44 | – | ||||
| Issuances of treasury shares | 12,901 | 17,103 | (25) | ||||
| Repurchase of treasury shares | (13,558) | (20,369) | (33) | ||||
| Dividends paid/capital repayments | (2,812) | (2,490) | 13 | ||||
| Other, net | 3,685 | 2,520 | 46 | ||||
| Net cash provided by/(used in) financing activities | (30,600) | 79,851 | – | ||||
| Effect of exchange rate changes on cash and due from banks (CHF million) | |||||||
| Effect of exchange rate changes on cash and due from banks | (2,553) | (227) | – | ||||
| Net increase/(decrease) in cash and due from banks (CHF million) | |||||||
| Net increase/(decrease) in cash and due from banks | (7,510) | 7,529 | – | ||||
| Cash and due from banks at beginning of period | 38,459 | 29,040 | 32 | ||||
| Cash and due from banks at end of period | 30,949 | 36,569 | (15) | ||||
| Supplemental cash flow information (unaudited) | |||||||
| in | % change | ||||||
| 6M08 | 6M07 | YoY | |||||
| Cash paid for income taxes and interest (CHF million) | |||||||
| Cash paid for income taxes | 1,320 | 1,027 | 29 | ||||
| Cash paid for interest | 22,995 | 26,525 | (13) | ||||
Notes to the condensed consolidated financial statements – unaudited |
| Note 1 Summary of significant accounting policies |
Basis of presentation |
| The accompanying unaudited condensed consolidated financial statements of Credit Suisse Group AG (the Group) are prepared in accordance with accounting principles generally accepted in the United States of America (US GAAP) and are stated in Swiss francs (CHF). These condensed consolidated financial statements should be read in conjunction with the US GAAP consolidated financial statements and notes thereto for the year ended December 31, 2007, included in the Credit Suisse Annual Report 2007. For a description of the Group’s significant accounting policies, refer to Note 1 – Summary of significant accounting policies in V – Consolidated financial statements – Credit Suisse Group in the Credit Suisse Annual Report 2007. |
| Certain financial information, which is normally included in annual consolidated financial statements prepared in accordance with US GAAP but not required for interim reporting purposes, has been condensed or omitted. Certain reclassifications have been made to the prior period’s consolidated financial statements to conform to the current period’s presentation. These condensed consolidated financial statements reflect, in the opinion of management, all adjustments that are necessary for a fair presentation of the condensed consolidated financial statements for the periods presented. The presentation of period over period change, the 1Q08 consolidated statements of income and consolidated balance sheet and the 2Q07 consolidated balance sheet have been added for convenience of the reader and are not a required presentation under US GAAP. The results of operations for interim periods are not indicative of results for the entire year. |
| In preparing these condensed consolidated financial statements, management is required to make estimates and assumptions, which affect the reported amounts of assets and liabilities and disclosure of contingent assets and liabilities as of the date of the condensed consolidated balance sheets and the reported amounts of revenues and expenses during the reporting period. Actual results could differ from those estimates. |
Recently adopted accounting standards |
| The following provides the most relevant recently adopted accounting standards. For a complete description of recently adopted accounting standards, refer to Note 2 – Recently issued accounting standards in V – Consolidated financial statements – Credit Suisse Group in the Credit Suisse Annual Report 2007. |
| SAB 110 |
| In December 2007, the United States (US) Securities and Exchange Commission (SEC) issued Staff Accounting Bulletin (SAB) No. 110, “Share-Based Payment” (SAB 110). SAB 110 expresses the view of the staff regarding the use of a simplified method, as discussed in SAB No. 107, “Share-Based Payment” (SAB 107), in developing an estimate of the expected term of ‘plain vanilla’ share options in accordance with Statement of Financial Accounting Standards (SFAS) No. 123 (revised 2004), “Share Based Payment.” When SAB 107 was issued, the staff indicated that it would not expect a company to use the simplified method for share option grants after December 31, 2007. As the staff now understands that detailed information about employee exercise behavior may not be widely available by December 31, 2007, the staff will continue to accept, under certain circumstances, the use of the simplifie d method beyond December 31, 2007. |
| The Group adopted SAB 110 on January 1, 2008. The adoption of SAB 110 did not have a material impact on the Group’s financial condition, results of operations or cash flows. |
| SAB 109 |
| In November 2007, the SEC issued SAB No. 109, “Written Loan Commitments Recorded at Fair Value Through Earnings” (SAB 109). SAB 109 provides guidance that the expected net future cash flows related to the associated servicing of the loan should be included in the measurement of all written loan commitments that are accounted at fair value through earnings. |
| SAB 109 retains the view that internally-developed intangible assets should not be recorded as part of the fair value of a derivative loan commitment and broadens this view to all written loan commitments that are accounted for at fair value through earnings. |
| The Group adopted SAB 109 on January 1, 2008. The adoption of SAB 109 did not have a material impact on the Group’s financial condition, results of operations or cash flows. |
| EITF 06-11 |
| In June 2007, the Financial Accounting Standards Board (FASB) ratified Emerging Issues Task Force (EITF) Issue No. 06-11, “Accounting for Income Tax Benefits of Dividends on Share-Based Payment Awards” (EITF 06-11). EITF 06-11 addresses share-based payment arrangements where employees receive dividends on awards during the vesting period. EITF 06-11 confirmed that a realized income tax benefit from dividends or dividend equivalents that are charged to retained earnings and are paid to employees for equity classified non-vested equity shares, non-vested equity share units and outstanding equity share options should be recognized as an increase to additional paid-in capital. The amount recognized in additional paid-in capital for the realized income tax benefit from dividends in those awards should be included in the pool of excess tax benefits available to absorb tax deficiencies on share-based payment awards. |
| EITF 06-11 is effective prospectively to income tax benefits that result from dividends on equity classified employee share-based payment awards that are declared in fiscal years beginning after December 15, 2007. Early application was permitted for the income tax benefits of dividends on equity-classified share-based payment awards that are declared in periods for which financial statements have not yet been issued. The Group early adopted EITF 06-11 for the accounting period ended December 31, 2007 and recognized CHF 13 million of tax benefits in respect of tax on dividend equivalent payments. |
| FSP FIN 39-1 |
| In April 2007, the FASB issued FASB Staff Position (FSP) No. FIN 39-1, “Amendment of FASB Interpretation No. 39” (FSP FIN 39-1). FSP FIN 39-1 permits a reporting entity that is a party to a master netting agreement to offset fair value amounts recognized for the right to reclaim cash collateral or the obligation to return cash collateral against fair value amounts recognized for derivative instruments that have been offset under the same master netting agreement. FSP FIN 39-1 is required to be applied retrospectively for all financial statements presented unless it is impracticable to do so. As part of the Group’s implementation procedures for adopting FSP FIN 39-1, it was determined that adopting FSP FIN 39-1 retrospectively is impracticable as it would require undue time and effort. Based on this, the Group adopted the provisions of FSP FIN 39-1 on a prospective basis. For further information on the imp act of offsetting cash collateral against derivative instruments, refer to Note 11 – Trading assets and liabilities. |
| SFAS 159 |
| In February 2007, the FASB issued SFAS No. 159, “The Fair Value Option for Financial Assets and Financial Liabilities – Including an amendment of FASB Statement No. 115” (SFAS 159). SFAS 159 creates an alternative measurement treatment for certain financial assets and financial liabilities that permits fair value to be used for initial and subsequent measurement with changes in fair value recognized in earnings. The availability of this alternative measurement treatment is referred to as the fair value option. The statement also provides for additional financial statement presentation and disclosures relating to the alternative measurement treatment. The Group adopted the provisions of SFAS 159 on January 1, 2007. As a result of adoption and election of certain existing instruments under the fair value option, the Group reported a decrease in opening retained earnings of CHF 1,003 million, net of tax. For further information on fair values, refer to Note 21 – Fair value of financial instruments. |
| SFAS 157 |
| In September 2006, the FASB issued SFAS No. 157, “Fair Value Measurements” (SFAS 157). SFAS 157 establishes a single authoritative definition of fair value, sets out a framework for measuring fair value, and requires additional disclosures for instruments carried at fair value. The statement applies only to fair value measurements which are already required or permitted by other accounting standards. It eliminates the EITF Issue No. 02-3 “Issues Involved in Accounting for Derivative Contracts Held for Trading Purposes and Contracts Involved in Energy Trading and Risk Management Activities” (EITF 02-3) guidance which prohibits the recognition of gains or losses at the inception of derivative transactions whose fair value is estimated based upon unobservable market data. SFAS 157 also eliminates the use of blockage factors on instruments that are quoted in active markets by brokers, dealers and invest ment companies that have been applying the applicable American Institute of Certified Public Accountants (AICPA) Audit and Accounting Guides. SFAS 157 also requires the Group to consider its own credit spreads when measuring the fair value of liabilities. The Group adopted the provisions of SFAS 157 on January 1, 2007. As a result of this adoption, the Group reported an increase in opening retained earnings of CHF 187 million, net of tax. For further information on fair values, refer to Note 21 – Fair value of financial instruments. |
| SFAS 158 |
| In September 2006, the FASB issued SFAS No. 158, “Employers’ Accounting for Defined Benefit Pension and Other Postretirement Plans – an amendment of FASB Statements No. 87, 88, 106 and 132(R)” (SFAS 158). SFAS 158 requires an employer to: |
| (i) recognize in the statement of financial condition the funded status of a defined benefit plan on a prospective basis; |
| (ii) recognize as a component of other comprehensive income, net of tax, the actuarial gains or losses and prior service costs or credits that arise during the period but are not recognized as components of net periodic benefit cost pursuant to SFAS No. 87, “Employers’ Accounting for Pensions” (SFAS 87) or No. 106, “Employers’ Accounting for Postretirement Benefits Other than Pensions” (SFAS 106). Amounts recognized in accumulated other comprehensive income (AOCI), including gains or losses, prior service costs or credits and transition assets or obligations remaining from the initial application of SFAS 87 and SFAS 106, are to be adjusted as they are subsequently recognized as a component of net periodic benefit cost; |
| (iii) measure the defined benefit plan assets and obligations as of the date of the employer’s fiscal year-end statement of financial condition; and |
| (iv) disclose in the notes to the financial statements additional information about certain effects on net periodic benefit cost for the next fiscal year that arise from delayed recognition of the gains or losses, prior service costs or credits and transition asset or obligation. |
| SFAS 158 recognition provisions associated with the funded status of a defined benefit plan was effective as of the end of the fiscal year ending after December 15, 2006. The provision to measure plan assets and benefit obligations as of the date of the employer’s fiscal year-end statement of financial condition is effective for fiscal years ending after December 15, 2008, with early adoption permitted. |
| The cumulative effect of the Group adopting the recognition provisions of SFAS 158 as of December 31, 2006, was an after-tax decrease in AOCI and consolidated net assets of CHF 1.8 billion. The Group did not early adopt the measurement date provisions and is evaluating the impact of those provisions for adoption in 2008. |
| FIN 48 |
| In July 2006, the FASB issued FASB Interpretation (FIN) No. 48, “Accounting for Uncertainty in Income Taxes – an interpretation of FASB Statement No. 109” (FIN 48). FIN 48 addresses the accounting for uncertainty in income tax positions by prescribing a consistent recognition threshold and measurement attribute for income tax positions taken or expected to be taken in an income tax return. FIN 48 also provides guidance on derecognition, classification, interest and penalties, accounting in interim periods, disclosure and transition. |
| FIN 48 requires a two-step process in evaluating income tax positions. In the first step, an enterprise determines whether it is more likely than not that an income tax position will be sustained upon examination, including resolution of any related appeals or litigation processes, based on the technical merits of the position. Income tax positions meeting the more-likely-than-not recognition threshold are then measured to determine the amount of benefit eligible for recognition in the financial statements. Each income tax position is measured at the largest amount of benefit that is more likely than not to be realized upon ultimate settlement. |
| The provisions of FIN 48 are effective for fiscal years beginning after December 15, 2006. The adoption of FIN 48 as of January 1, 2007, resulted in a decrease in beginning retained earnings of CHF 13 million. For further information on uncertainty in income tax positions, refer to Note 16 – Tax. |
Standards to be adopted in future periods |
| SFAS 141(R) |
| In December 2007, the FASB issued SFAS No. 141 (Revised 2007), “Business Combinations” (SFAS 141(R)). SFAS 141(R) requires an acquiring entity to recognize all assets acquired, liabilities assumed and any noncontrolling interest in the acquiree at the acquisition date, at their fair values as of that date. |
| SFAS 141(R) also requires substantial new disclosures and will change the accounting treatment for the recognition of acquisition costs, restructuring costs and in-process research and development as well as the recognition and subsequent measurement of acquired contingent liabilities. |
| The guidance in SFAS 141(R) is effective on a prospective basis for business combinations in which the acquisition date is on or after the first annual reporting period beginning on or after December 15, 2008. The Group is currently evaluating the impact of adopting SFAS 141(R). |
| SFAS 160 |
| In December 2007, the FASB issued SFAS No. 160, “Noncontrolling Interests in Consolidated Financial Statements – an amendment of ARB No. 51” (SFAS 160). SFAS 160 amends Accounting Research Bulletin (ARB) No. 51 to establish accounting and reporting standards for a noncontrolling interest in a subsidiary and for deconsolidation of a subsidiary. |
| SFAS 160 requires the recognition of a noncontrolling interest as equity in the consolidated financial statements and separate from the parent’s equity. In addition, net income attributable to the noncontrolling interest must be included in consolidated net income on the face of the income statement. SFAS 160 clarifies that changes in a parent’s ownership interest in a subsidiary that do not result in deconsolidation are equity transactions if the parent retains its controlling financial interest. SFAS 160 has additional disclosure requirements that clearly identify and distinguish between the interests of the parent and the interests of the noncontrolling owners. |
| SFAS 160 is effective for fiscal years, and interim periods within those fiscal years, beginning on or after December 15, 2008. The Group is currently evaluating the impact of adopting SFAS 160. |
| FSP FAS 140-3 |
| In February 2008, the FASB issued FSP No. FAS 140-3, “Accounting for Transfers of Financial Assets and Repurchase Financing Transactions” (FSP FAS 140-3). FSP FAS 140-3 applies to a repurchasing financing, which is a repurchase agreement that relates to a previously transferred financial asset between the same counterparties that is entered into contemporaneously with, or in contemplation of, the initial transfer. FSP FAS 140-3 states that a transferor and transferee shall not separately account for a transfer of a financial asset and a related repurchase financing unless the two transactions have a valid and distinct business or economic purpose for being entered into separately and the repurchase financing does not result in the initial transferor regaining control over the financial asset. FSP FAS 140-3 establishes a presumption that an initial transfer and a repurchase financing are linked unless certain cr iteria are met. If the criteria are not met, the initial transfer is not accounted for as a sale by the transferor and the repurchase financing is accounted for as a forward contract. |
| FSP FAS 140-3 is effective for prospective transactions entered into in fiscal years and interim periods within those fiscal years, beginning after November 15, 2008. Earlier application is not permitted. The Group is currently evaluating the impact of adopting FSP FAS 140-3. |
| SFAS 161 |
| In March 2008, the FASB issued SFAS No. 161, “Disclosures about Derivative Instruments and Hedging Activities – an amendment of FASB Statement No. 133” (SFAS 161). SFAS 161 amends and expands the disclosure requirements of SFAS No. 133, “Accounting for Derivative Instruments and Hedging Activities” (SFAS 133), with the intent to provide users of financial statements with an enhanced understanding of: i) how and why an entity uses derivative instruments; ii) how derivative instruments and related hedge items are accounted for under SFAS 133 and its related interpretations; and iii) how derivative instruments and related hedged items affect an entity’s financial position, financial performance and cash flows. |
| SFAS 161 requires qualitative disclosures about objectives and strategies for using derivatives, quantitative disclosures about fair value amounts of gains and losses on derivative instruments and credit-risk-related contingent features in derivative agreements. |
| SFAS 161 is effective for financial statements issued for fiscal years, and interim periods within those fiscal years, beginning after November 15, 2008. The statement encourages but does not require disclosures for earlier periods presented for comparative purposes at initial adoption. In years after initial adoption, SFAS 161 requires comparative disclosures only for periods subsequent to initial adoption. SFAS 161 is a disclosure standard and as such will not impact the Group’s financial position, results of operations or cash flows. |
| FSP EITF 03-6-1 |
| In June 2008, the FASB issued FSP No. EITF 03-6-1, “Determining Whether Instruments Granted in Share-Based Payment Transactions Are Participating Securities” (FSP EITF 03-6-1). This FSP provides guidance that certain instruments granted in share-based payment transactions are participating securities prior to vesting and, therefore, need to be included in computing earnings per share under the two class method described in FASB Statement No. 128, “Earnings Per Share.” |
| FSP EITF 03-6-1 is effective for financial statements issued in the fiscal years beginning after December 15, 2008, and interim periods within those years. All prior-period earnings per share data presented shall be adjusted retrospectively to conform with the provisions of FSP EITF 03-6-1. Early application is not permitted. The Group is currently evaluating the impact of adopting the provisions of FSP EITF 03-6-1. |
| EITF 07-5 |
| In June 2008, the FASB ratified EITF Issue No. 07-5, “Determining Whether an Instrument (or Embedded Feature) Is Indexed to an Entity’s Own Stock” (EITF 07-5). EITF 07-5 requires an entity to evaluate whether an equity-linked financial instrument is indexed to its own stock using a two step approach. The first step requires entities to evaluate the instrument’s contingent exercise provisions, if any. The second step requires entities to evaluate the instrument’s settlement provisions. |
| EITF 07-5 is effective for financial statements issued for fiscal years beginning after December 15, 2008, and interim periods within those fiscal years. Earlier application is permitted by entities that have previously adopted an alternative accounting policy. The Group is currently evaluating the impact of adopting EITF 07-5. |
| Note 2 Business developments |
Acquisitions and divestitures |
| There were no significant acquisitions or divestitures in 2Q08. |
| Note 3 Segment reporting |
Overview |
| The Group is a global financial services company domiciled in Switzerland. The Group’s business consists of three segments: Private Banking, Investment Banking and Asset Management. The three segments are complemented by Shared Services, which provides support in the areas of finance, operations, including human resources, legal and compliance, risk management and information technology. |
| The segment information reflects the Group’s reportable segments as follows: |
| – Private Banking offers comprehensive advice and a broad range of wealth management solutions, including pension planning, life insurance products, tax planning and wealth and inheritance advice, which are tailored to the needs of high-net-worth individuals worldwide. In Switzerland, it supplies banking products and services to high-net-worth, corporate and retail clients. |
| – Investment Banking offers investment banking and securities products and services to corporate, institutional and government clients around the world. Its products and services include debt and equity underwriting, sales and trading, mergers and acquisitions advice, divestitures, corporate sales, restructuring and investment research. |
| – Asset Management offers integrated investment solutions and services to institutions, governments and private clients globally. It provides access to the full range of investment classes, ranging from equity and fixed income products and multi-asset class solutions to alternative investments such as private equity, real estate and hedge funds. |
| Corporate Center includes parent company operations such as Group financing, expenses for projects sponsored by the Group and certain expenses that have not been allocated to the segments. In addition, Corporate Center includes consolidation and elimination adjustments required to eliminate intercompany revenues and expenses. |
| Minority interest-related revenues and expenses resulting from the consolidation of certain private equity funds and other entities in which the Group does not have a significant economic interest in such revenues and expenses are reported as minorities without significant economic interest. The consolidation of these entities does not affect net income as the amounts recorded in net revenues and total operating expenses are offset by corresponding amounts reported as minority interests. In addition, our tax expense is not affected by these revenues and expenses. |
Revenue sharing and cost allocation |
| Responsibility for each product is allocated to a segment, which records all related revenues and expenses. Revenue-sharing and service level agreements govern the compensation received by one segment for generating revenue or providing services on behalf of another. These agreements are negotiated periodically by the relevant segments on a product-by-product basis. |
| The aim of revenue-sharing and cost allocation agreements is to reflect the pricing structure of unrelated third-party transactions. |
| Corporate services and business support in finance, operations, including human resources, legal and compliance, risk management and information technology are provided by the Shared Services area. Shared Services costs are allocated to the segments and Corporate Center based on their requirements and other relevant measures. |
Funding |
| Credit Suisse centrally manages its funding activities. New securities for funding and capital purposes are issued primarily by the Bank. The Bank lends funds to its operating subsidiaries and affiliates on both a senior and subordinated basis, as needed, the latter typically to meet capital requirements, or as desired by management to capitalize on opportunities. Capital is distributed to the segments considering factors such as regulatory capital requirements, utilized economic capital and the historic and future potential return on capital. Transfer pricing, using market rates, is used to record interest income and expense in each of the segments for this capital and funding. Included in this allocation are gains and losses recorded on the fair value of Credit Suisse own debt. |
Taxes |
| The Group’s segments are managed and reported on a pre-tax basis. |
| Net revenues and income before taxes | |||||||||||||||||
| in | % change | in | % change | ||||||||||||||
| 2Q08 | 1Q08 | 2Q07 | QoQ | YoY | 6M08 | 6M07 | YoY | ||||||||||
| Net revenues (CHF million) | |||||||||||||||||
| Private Banking | 3,265 | 3,355 | 3,353 | (3) | (3) | 6,620 | 6,719 | (1) | |||||||||
| Investment Banking | 3,740 | (489) | 7,538 | – | (50) | 3,251 | 14,120 | (77) | |||||||||
| Asset Management | 739 | 63 | 853 | – | (13) | 802 | 1,629 | (51) | |||||||||
| Corporate Center | 86 | 90 | (41) | (4) | – | 176 | (96) | – | |||||||||
| Minority interests without significant economic interest | 307 | 76 | 1,334 | 304 | (77) | 383 | 2,285 | (83) | |||||||||
| Net revenues | 8,137 | 3,095 | 13,037 | 163 | (38) | 11,232 | 24,657 | (54) | |||||||||
| Income before taxes and minority interests (CHF million) | |||||||||||||||||
| Private Banking | 1,220 | 1,324 | 1,381 | (8) | (12) | 2,544 | 2,820 | (10) | |||||||||
| Investment Banking | 281 | (3,460) | 2,502 | – | (89) | (3,179) | 4,492 | – | |||||||||
| Asset Management | 167 | (468) | 299 | – | (44) | (301) | 556 | – | |||||||||
| Corporate Center | (97) | 32 | (96) | – | 1 | (65) | (206) | (68) | |||||||||
| Minority interests without significant economic interest | 270 | 43 | 1,301 | – | (79) | 313 | 2,201 | (86) | |||||||||
| Income/(loss) before taxes and minority interests | 1,841 | (2,529) | 5,387 | – | (66) | (688) | 9,863 | – | |||||||||
| Total assets | |||||||||||||||
| end of | % change | ||||||||||||||
| 2Q08 | 1Q08 | 4Q07 | 2Q07 | QoQ | Ytd | YoY | |||||||||
| Total assets (CHF million) | |||||||||||||||
| Private Banking | 375,064 | 365,249 | 376,800 | 359,903 | 3 | 0 | 4 | ||||||||
| Investment Banking | 1,021,587 | 997,660 | 1,140,740 | 1,204,397 | 2 | (10) | (15) | ||||||||
| Asset Management | 24,834 | 26,673 | 27,784 | 23,929 | (7) | (11) | 4 | ||||||||
| Corporate Center | (207,276) | (196,388) | (201,947) | (190,124) | 6 | 3 | 9 | ||||||||
| Minority interests without significant economic interest | 15,616 | 14,800 | 17,303 | 17,069 | 6 | (10) | (9) | ||||||||
| Total assets | 1,229,825 | 1,207,994 | 1,360,680 | 1,415,174 | 2 | (10) | (13) | ||||||||
| Note 4 Net interest income |
| in | % change | in | % change | ||||||||||||||
| 2Q08 | 1Q08 | 2Q07 | QoQ | YoY | 6M08 | 6M07 | YoY | ||||||||||
| Net interest income (CHF million) | |||||||||||||||||
| Loans | 2,165 | 2,363 | 2,131 | (8) | 2 | 4,528 | 4,178 | 8 | |||||||||
| Investment securities | 163 | 166 | 187 | (2) | (13) | 329 | 376 | (13) | |||||||||
| Trading assets | 5,560 | 4,601 | 6,458 | 21 | (14) | 10,161 | 11,940 | (15) | |||||||||
| Central bank funds sold, securities purchased under resale agreements and securities borrowing transactions | 3,371 | 3,923 | 5,929 | (14) | (43) | 7,294 | 11,245 | (35) | |||||||||
| Other | 1,803 | 1,706 | 1,914 | 6 | (6) | 3,509 | 3,572 | (2) | |||||||||
| Interest and dividend income | 13,062 | 12,759 | 16,619 | 2 | (21) | 25,821 | 31,311 | (18) | |||||||||
| Deposits | (2,477) | (3,253) | (4,168) | (24) | (41) | (5,730) | (7,872) | (27) | |||||||||
| Short-term borrowings | (128) | (170) | (286) | (25) | (55) | (298) | (504) | (41) | |||||||||
| Trading liabilities | (3,579) | (1,578) | (2,689) | 127 | 33 | (5,157) | (4,787) | 8 | |||||||||
| Central bank funds purchased, securities sold under repurchase agreements and securities lending transactions | (3,249) | (3,912) | (5,436) | (17) | (40) | (7,161) | (10,267) | (30) | |||||||||
| Long-term debt | (1,180) | (1,003) | (1,204) | 18 | (2) | (2,183) | (2,447) | (11) | |||||||||
| Other | (589) | (737) | (587) | (20) | 0 | (1,326) | (1,096) | 21 | |||||||||
| Interest expense | (11,202) | (10,653) | (14,370) | 5 | (22) | (21,855) | (26,973) | (19) | |||||||||
| Net interest income | 1,860 | 2,106 | 2,249 | (12) | (17) | 3,966 | 4,338 | (9) | |||||||||
| Note 5 Commissions and fees |
| in | % change | in | % change | ||||||||||||||
| 2Q08 | 1Q08 | 2Q07 | QoQ | YoY | 6M08 | 6M07 | YoY | ||||||||||
| Commissions and fees (CHF million) | |||||||||||||||||
| Lending business | 255 | 226 | 661 | 13 | (61) | 481 | 1,308 | (63) | |||||||||
| Investment and portfolio management | 1,543 | 1,460 | 1,510 | 6 | 2 | 3,003 | 2,955 | 2 | |||||||||
| Other securities business | 55 | 55 | 61 | 0 | (10) | 110 | 117 | (6) | |||||||||
| Fiduciary | 1,598 | 1,515 | 1,571 | 5 | 2 | 3,113 | 3,072 | 1 | |||||||||
| Underwriting | 471 | 191 | 717 | 147 | (34) | 662 | 1,332 | (50) | |||||||||
| Brokerage | 1,222 | 1,358 | 1,429 | (10) | (14) | 2,580 | 2,916 | (12) | |||||||||
| Underwriting and brokerage | 1,693 | 1,549 | 2,146 | 9 | (21) | 3,242 | 4,248 | (24) | |||||||||
| Other customer services | 651 | 643 | 864 | 1 | (25) | 1,294 | 1,591 | (19) | |||||||||
| Commissions and fees | 4,197 | 3,933 | 5,242 | 7 | (20) | 8,130 | 10,219 | (20) | |||||||||
| Note 6 Other revenues |
| in | % change | in | % change | ||||||||||||||
| 2Q08 | 1Q08 | 2Q07 | QoQ | YoY | 6M08 | 6M07 | YoY | ||||||||||
| Other revenues (CHF million) | |||||||||||||||||
| Minority interests without significant economic interest | 249 | 31 | 1,336 | – | (81) | 280 | 2,274 | (88) | |||||||||
| Loans held-for-sale | 321 | (790) | (15) | – | – | (469) | (13) | – | |||||||||
| Long-lived assets held-for-sale | 3 | 4 | 9 | (25) | (67) | 7 | 15 | (53) | |||||||||
| Equity method investments | 12 | 20 | 23 | (40) | (48) | 32 | 52 | (38) | |||||||||
| Other investments | 436 | (496) | 259 | – | 68 | (60) | 522 | – | |||||||||
| Other | 159 | 64 | 124 | 148 | 28 | 223 | 224 | 0 | |||||||||
| Other revenues | 1,180 | (1,167) | 1,736 | – | (32) | 13 | 3,074 | (100) | |||||||||
| Note 7 Provision for credit losses |
| in | % change | in | % change | ||||||||||||||
| 2Q08 | 1Q08 | 2Q07 | QoQ | YoY | 6M08 | 6M07 | YoY | ||||||||||
| Provision for credit losses (CHF million) | |||||||||||||||||
| Allowance for loan losses | 42 | 28 | (13) | 50 | – | 70 | 44 | 59 | |||||||||
| Provisions for lending-related and other exposures | 3 | 123 | (7) | (98) | – | 126 | (11) | – | |||||||||
| Provision for credit losses | 45 | 151 | (20) | (70) | – | 196 | 33 | 494 | |||||||||
| Note 8 Compensation and benefits |
| in | % change | in | % change | ||||||||||||||
| 2Q08 | 1Q08 | 2Q07 | QoQ | YoY | 6M08 | 6M07 | YoY | ||||||||||
| Compensation and benefits (CHF million) | |||||||||||||||||
| Salaries and bonuses | 3,654 | 2,875 | 4,877 | 27 | (25) | 6,529 | 9,350 | (30) | |||||||||
| Social security | 238 | 197 | 325 | 21 | (27) | 435 | 572 | (24) | |||||||||
| Other | 184 | 192 | 207 | (4) | (11) | 376 | 437 | (14) | |||||||||
| Compensation and benefits | 4,076 | 3,264 | 5,409 | 25 | (25) | 7,340 | 10,359 | (29) | |||||||||
| Note 9 General and administrative expenses |
| in | % change | in | % change | ||||||||||||||
| 2Q08 | 1Q08 | 2Q07 | QoQ | YoY | 6M08 | 6M07 | YoY | ||||||||||
| General and administrative expenses (CHF million) | |||||||||||||||||
| Occupancy expenses | 214 | 206 | 223 | 4 | (4) | 420 | 442 | (5) | |||||||||
| IT, machinery, etc. | 124 | 115 | 119 | 8 | 4 | 239 | 244 | (2) | |||||||||
| Provisions and losses | (98) | 60 | 39 | – | – | (38) | 22 | – | |||||||||
| Travel and entertainment | 153 | 148 | 146 | 3 | 5 | 301 | 292 | 3 | |||||||||
| Professional services | 527 | 467 | 537 | 13 | (2) | 994 | 1,032 | (4) | |||||||||
| Depreciation of property and equipment | 226 | 215 | 199 | 5 | 14 | 441 | 416 | 6 | |||||||||
| Amortization and impairment of other intangible assets | 16 | 18 | 8 | (11) | 100 | 34 | 16 | 113 | |||||||||
| Other | 403 | 356 | 348 | 13 | 16 | 759 | 687 | 10 | |||||||||
| General and administrative expenses | 1,565 | 1,585 | 1,619 | (1) | (3) | 3,150 | 3,151 | 0 | |||||||||
| Note 10 Earnings per share |
| in | % change | in | % change | ||||||||||||||
| 2Q08 | 1Q08 | 2Q07 | QoQ | YoY | 6M08 | 6M07 | YoY | ||||||||||
| Net income (CHF million) | |||||||||||||||||
| Net income/(loss) | 1,215 | (2,148) | 3,189 | – | (62) | (933) | 5,918 | – | |||||||||
| Net income/(loss) available for common shares for basic earnings per share | 1,215 | (2,148) | 3,189 | – | (62) | (933) | 5,918 | – | |||||||||
| Net income/(loss) available for common shares for diluted earnings per share | 1,215 | (2,148) | 3,189 | – | (62) | (933) | 5,918 | – | |||||||||
| Weighted-average shares outstanding (million) | |||||||||||||||||
| Weighted-average shares outstanding for basic earnings per share | 1,029.0 | 1,023.8 | 1,063.6 | 1 | (3) | 1,026.5 | 1,064.9 | (4) | |||||||||
| Dilutive share options and warrants | 6.8 | 0.0 | 12.6 | – | (46) | 0.0 | 13.1 | – | |||||||||
| Dilutive share awards | 49.3 | 0.0 | 54.5 | – | (10) | 0.0 | 52.3 | – | |||||||||
| Weighted-average shares outstanding for diluted earnings per share 1, 2 | 1,085.1 | 1,023.8 | 1,130.7 | 6 | (4) | 1,026.5 | 1,130.3 | (9) | |||||||||
| Basic earnings per share (CHF) | |||||||||||||||||
| Net income/(loss) | 1.18 | (2.10) | 3.00 | – | (61) | (0.91) | 5.56 | – | |||||||||
| Diluted earnings per share (CHF) | |||||||||||||||||
| Net income/(loss) | 1.12 | (2.10) | 2.82 | – | (60) | (0.91) | 5.24 | – | |||||||||
| 1 Weighted-average potential common shares relating to instruments that were not dilutive for the respective periods (and therefore not included in the diluted earnings per share calculation above) but could potentially dilute earnings per share in the future were 63.3 million, 62.1 million, 21.8 million, 62.7 million and 19.9 million for 2Q08, 1Q08, 2Q07, 6M08 and 6M07, respectively. 2 Due to the net loss in 1Q08 and 6M08, 9.1 million and 8.0 million, respectively, weighted-average share options and warrants outstanding and 51.1 million and 50.2 million, respectively, weighted-average share awards outstanding, were excluded from the diluted earnings per share calculation, as the effect would be antidilutive. | |||||||||||||||||
| Note 11 Trading assets and liabilities |
| end of | % change | ||||||||||||||
| 2Q08 | 1Q08 | 4Q07 | 2Q07 | QoQ | Ytd | YoY | |||||||||
| Trading assets (CHF million) | |||||||||||||||
| Debt securities | 176,406 | 190,004 | 208,913 | 237,939 | (7) | (16) | (26) | ||||||||
| Equity securities 1 | 146,806 | 137,688 | 195,243 | 202,582 | 7 | (25) | (28) | ||||||||
| Derivative instruments 2, 3 | 100,639 | 96,321 | 98,485 | 79,921 | 4 | 2 | 26 | ||||||||
| Other | 20,924 | 22,670 | 29,442 | 31,879 | (8) | (29) | (34) | ||||||||
| Trading assets | 444,775 | 446,683 | 532,083 | 552,321 | 0 | (16) | (19) | ||||||||
| Trading liabilities (CHF million) | |||||||||||||||
| Short positions | 120,279 | 109,737 | 122,720 | 170,181 | 10 | (2) | (29) | ||||||||
| Derivative instruments 2, 4 | 74,934 | 77,131 | 79,089 | 73,170 | (3) | (5) | 2 | ||||||||
| Trading liabilities | 195,213 | 186,868 | 201,809 | 243,351 | 4 | (3) | (20) | ||||||||
| 1 Including convertible bonds. 2 In accordance with the provisions of FSP FIN 39-1, the Group offset cash collateral receivables and payables of CHF 19.3 billion and CHF 16.9 billion, respectively, as of the end of 2Q08 and CHF 20.9 billion and CHF 17.2 billion, respectively, as of the end of 1Q08 against the derivative positions. Cash colleratal receivables and payables of CHF 13.1 billion and CHF 36.7 billion, respectively, as of the end of 2Q08 and CHF 8.2 billion and CHF 32.5 billion, respectively, as of the end of 1Q08 were not netted, primarily due to the fact that no valid Master Netting Agreement exist. The Group adopted the provisions of FSP FIN 39-1 on a prospective basis as of January 1, 2008. 3 The positive replacement values of trading derivatives before netting as of the end of 2Q08, 1Q08, 4Q07 and 2Q07 was CHF 581.3 billion, CHF 612.3 billion, CHF 444.7 billion and CHF 356.3 billion, respectively. 4 The negative replacement values of trading derivatives before netting as of the end of 2Q08, 1Q08, 4Q07 and 2Q07 was CHF 553.2 billion, CHF 589.5 billion, CHF 425.3 billion and CHF 349.6 billion, respectively. | |||||||||||||||
| Note 12 Loans |
| end of | % change | ||||||||||||||
| 2Q08 | 1Q08 | 4Q07 | 2Q07 | QoQ | Ytd | YoY | |||||||||
| Loans (CHF million) | |||||||||||||||
| Banks | 1 | 1 | 1 | 26 | 0 | 0 | (96) | ||||||||
| Commercial | 44,449 | 45,971 | 45,351 | 44,305 | (3) | (2) | 0 | ||||||||
| Consumer | 87,862 | 87,158 | 86,220 | 85,753 | 1 | 2 | 2 | ||||||||
| Public authorities | 1,171 | 1,237 | 1,283 | 1,299 | (5) | (9) | (10) | ||||||||
| Lease financings | 3,442 | 3,211 | 3,263 | 3,202 | 7 | 5 | 7 | ||||||||
| Switzerland | 136,925 | 137,578 | 136,118 | 134,585 | 0 | 1 | 2 | ||||||||
| Banks | 9,650 | 9,207 | 9,638 | 10,652 | 5 | 0 | (9) | ||||||||
| Commercial | 62,837 | 60,184 | 71,846 | 56,326 | 4 | (13) | 12 | ||||||||
| Consumer | 24,182 | 20,980 | 21,508 | 22,830 | 15 | 12 | 6 | ||||||||
| Public authorities | 2,259 | 2,320 | 2,563 | 1,063 | (3) | (12) | 113 | ||||||||
| Lease financings | 104 | 102 | 115 | 123 | 2 | (10) | (15) | ||||||||
| Foreign | 99,032 | 92,793 | 105,670 | 90,994 | 7 | (6) | 9 | ||||||||
| Gross loans | 235,957 | 230,371 | 241,788 | 225,579 | 2 | (2) | 5 | ||||||||
| Net (unearned income)/deferred expenses | (23) | (17) | (20) | 15 | 35 | 15 | – | ||||||||
| Allowance for loan losses | (1,203) | (1,186) | (1,234) | (1,372) | 1 | (3) | (12) | ||||||||
| Net loans | 234,731 | 229,168 | 240,534 | 224,222 | 2 | (2) | 5 | ||||||||
| Impaired loan portfolio (CHF million) | |||||||||||||||
| Gross impaired loans | 1,769 | 1,926 | 1,946 | 1,745 | (8) | (9) | 1 | ||||||||
| of which with a specific allowance | 1,599 | 1,758 | 1,563 | 1,525 | (9) | 2 | 5 | ||||||||
| of which without a specific allowance | 170 | 168 | 383 | 220 | 1 | (56) | (23) | ||||||||
| in | % change | in | % change | ||||||||||||||
| 2Q08 | 1Q08 | 2Q07 | QoQ | YoY | 6M08 | 6M07 | YoY | ||||||||||
| Allowance for loan losses (CHF million) | |||||||||||||||||
| Balance at beginning of period | 1,186 | 1,234 | 1,449 | (4) | (18) | 1,234 | 1,484 | (17) | |||||||||
| Change in accounting 1 | 0 | 0 | 0 | – | – | 0 | (61) | 100 | |||||||||
| Net additions charged to statements of income | 42 | 28 | (13) | 50 | – | 70 | 44 | 59 | |||||||||
| Gross write-offs | (61) | (70) | (91) | (13) | (33) | (131) | (141) | (7) | |||||||||
| Recoveries | 22 | 36 | 24 | (39) | (8) | 58 | 44 | 32 | |||||||||
| Net write-offs | (39) | (34) | (67) | 15 | (42) | (73) | (97) | (25) | |||||||||
| Provisions for interest | (1) | 5 | 1 | – | – | 4 | (1) | – | |||||||||
| Foreign currency translation impact and other adjustments, net | 15 | (47) | 2 | – | – | (32) | 3 | – | |||||||||
| Balance at end of period | 1,203 | 1,186 | 1,372 | 1 | (12) | 1,203 | 1,372 | (12) | |||||||||
| of which a specific allowance | 815 | 830 | 954 | (2) | (15) | 815 | 954 | (15) | |||||||||
| of which an inherent credit loss allowance | 388 | 356 | 418 | 9 | (7) | 388 | 418 | (7) | |||||||||
| 1 Related to the adoption of SFAS 159. | |||||||||||||||||
| Note 13 Other assets and liabilities |
| end of | % change | ||||||||||||||
| 2Q08 | 1Q08 | 4Q07 | 2Q07 | QoQ | Ytd | YoY | |||||||||
| Other assets (CHF million) | |||||||||||||||
| Cash collateral on derivative instruments | 13,092 | 8,181 | 18,766 | 19,349 | 60 | (30) | (32) | ||||||||
| Derivative instruments used for hedging | 1,283 | 1,016 | 1,065 | 1,232 | 26 | 20 | 4 | ||||||||
| Brokerage receivables | 54,754 | 61,792 | 54,883 | 67,782 | (11) | 0 | (19) | ||||||||
| Assets held-for-sale | 38,974 | 44,675 | 48,206 | 55,811 | (13) | (19) | (30) | ||||||||
| of which loans | 38,700 | 44,394 | 47,975 | 55,560 | (13) | (19) | (30) | ||||||||
| of which real estate | 247 | 254 | 231 | 251 | (3) | 7 | (2) | ||||||||
| Interest and fees receivable | 8,127 | 8,224 | 10,808 | 10,506 | (1) | (25) | (23) | ||||||||
| Deferred tax assets | 5,824 | 5,833 | 5,804 | 5,329 | 0 | 0 | 9 | ||||||||
| Prepaid expenses | 554 | 728 | 565 | 668 | (24) | (2) | (17) | ||||||||
| Other | 24,316 | 16,932 | 19,399 | 17,214 | 44 | 25 | 41 | ||||||||
| Other assets | 146,924 | 147,381 | 159,496 | 177,891 | 0 | (8) | (17) | ||||||||
| Other liabilities (CHF million) | |||||||||||||||
| Cash collateral on derivative instruments | 36,664 | 32,452 | 49,307 | 35,192 | 13 | (26) | 4 | ||||||||
| Derivative instruments used for hedging | 301 | 109 | 84 | 244 | 176 | 258 | 23 | ||||||||
| Brokerage payables | 64,409 | 65,132 | 55,808 | 50,841 | (1) | 15 | 27 | ||||||||
| Provisions 1 | 1,847 | 2,302 | 2,279 | 1,864 | (20) | (19) | (1) | ||||||||
| of which off-balance sheet risk | 375 | 359 | 268 | 58 | 4 | 40 | – | ||||||||
| Interest and fees payable | 10,703 | 9,678 | 11,829 | 16,011 | 11 | (10) | (33) | ||||||||
| Current tax liabilities | 2,557 | 2,435 | 3,341 | 3,813 | 5 | (23) | (33) | ||||||||
| Deferred tax liabilities | 981 | 947 | 787 | 509 | 4 | 25 | 93 | ||||||||
| Failed sales | 11,669 | 9,445 | 10,627 | 11,257 | 24 | 10 | 4 | ||||||||
| Other | 27,978 | 23,805 | 30,359 | 28,224 | 18 | (8) | (1) | ||||||||
| Other liabilities | 157,109 | 146,305 | 164,421 | 147,955 | 7 | (4) | 6 | ||||||||
| 1 Includes provisions for bridge commitments. | |||||||||||||||
| Note 14 Long-term debt |
| end of | % change | ||||||||||||||
| 2Q08 | 1Q08 | 4Q07 | 2Q07 | QoQ | Ytd | YoY | |||||||||
| Long-term debt (CHF million) | |||||||||||||||
| Senior | 132,978 | 122,602 | 141,675 | 141,640 | 8 | (6) | (6) | ||||||||
| Subordinated | 19,777 | 20,237 | 18,482 | 19,236 | (2) | 7 | 3 | ||||||||
| Long-term debt | 152,755 | 142,839 | 160,157 | 160,876 | 7 | (5) | (5) | ||||||||
| of which reported at fair value | 98,228 | 96,008 | 111,293 | 106,222 | 2 | (12) | (8) | ||||||||
| Note 15 Accumulated other comprehensive income |
Gains/ (losses) on cash flow hedges | Cumulative translation adjustments | Unrealized gains/ (losses) on securities | Actuarial gains/ (losses) | Net prior service cost | Accumu- lated other compre- hensive income/ (loss) | ||||||||
| 6M08 (CHF million) | |||||||||||||
| Balance at beginning of period | (74) | (4,661) | 116 | (942) | (131) | (5,692) | |||||||
| Increase/(decrease) | 1 | (2,851) | (59) | (3) | (8) | (2,920) | |||||||
| Decrease due to equity method investments | (14) | 0 | 0 | 0 | 0 | (14) | |||||||
| Reclassification adjustments, included in net income | 0 | 0 | 8 | 14 | 14 | 36 | |||||||
| Balance at end of period | (87) | (7,512) | 65 | (931) | (125) | (8,590) | |||||||
| 6M07 (CHF million) | |||||||||||||
| Balance at beginning of period | (42) | (2,878) | 114 | (2,110) | (117) | (5,033) | |||||||
| Increase/(decrease) | 10 | 277 | (2) | 0 | (39) | 246 | |||||||
| Decrease due to equity method investments | (18) | 0 | 0 | 0 | 0 | (18) | |||||||
| Reclassification adjustments, included in net income | (1) | 0 | (4) | 46 | 13 | 54 | |||||||
| Adoption of SFAS 159, net of tax | 6 | 0 | 4 | 0 | 0 | 10 | |||||||
| Balance at end of period | (45) | (2,601) | 112 | (2,064) | (143) | (4,741) | |||||||
| Note 16 Tax |
| The Group is currently subject to ongoing tax audits and inquiries with the tax authorities in a number of jurisdictions, including the US, the UK and Switzerland. Although the timing of the completion of these audits is uncertain, it is reasonably possible that some of these audits and inquiries will be resolved within 12 months of the reporting date. It is reasonably possible that there will be a decrease between zero and CHF 56 million in unrecognized tax benefits within 12 months of the reporting date. During 2Q08, the Group’s unrecognized tax benefit decreased, primarily relating to the recognition of benefits from the release of CHF 146 million of tax contingency accruals. |
| The Group remains open to examination from federal, state, provincial or similar local jurisdictions from the following years onward in these major countries: Japan – 2005; Switzerland – 2004; the UK – 1997; and the US – 1993. |
| Note 17 Employee share-based compensation and other benefits |
Share-based compensation |
| The Group’s share-based compensation is an important part of the overall compensation package for select employees and senior executives. Share-based compensation is designed to promote employee retention and align the interests of employees and shareholders. The majority of share-based compensation is granted as part of the annual incentive performance bonus subsequent to the fiscal year to which the incentive performance bonus relates. Share-based compensation is generally subject to restrictive features such as vesting, forfeiture and blocking rules. For further information on share-based compensation plans and the related fair value assumptions, refer to Note 27 – Employee share-based compensation and other benefits in V – Consolidated financial statements – Credit Suisse Group in the Credit Suisse Annual Report 2007. |
Compensation expense |
| Compensation expense in any year includes a variable compensation expense for that year’s discretionary cash performance bonus and fixed expenses for share-based awards granted in prior years. Recognition in the consolidated statements of income of expense relating to awards granted in prior years is dependent primarily upon the vesting period, which is determined by the plan, retirement eligibility of employees, moratorium periods and certain other terms. |
| Total compensation expense for share-based compensation recognized in the consolidated statements of income in compensation and benefits was CHF 1,772 million and CHF 1,247 million in 6M08 and 6M07, respectively. As of June 30, 2008, the total estimated unrecognized compensation expense related to non-vested share-based compensation of CHF 3,772 million will be recognized over the remaining weighted-average requisite service period of 1.3 years. |
| The Group generally repurchases its own shares in the open market to satisfy these obligations but can also issue new shares out of available conditional capital. In the first six months of 2008, the Group delivered approximately 14.9 million shares to employees. |
Incentive Share Unit |
| In January 2007, as part of the 2006 remuneration process, the Group aligned its share-based compensation plans and introduced Incentive Share Units (ISU). Previously granted awards will continue to settle under their original terms and are not affected by the ISU. An ISU is a unit that is similar to shares, but offers additional upside depending on the development of the Credit Suisse Group share price. For each ISU granted, the employee will receive at least one Credit Suisse Group share. In addition, the leverage component can deliver additional upside, which will be determined by the monthly average Credit Suisse Group share price over the three-year period following the grant. Each ISU will vest at a rate of one-third of a share per year over three years, with the potential additional shares vesting on the third anniversary of the grant date, depending on the development of the leverage component. |
| The compensation expense recognized in 6M08 related to ISUs was CHF 1,225 million. The estimated unrecognized compensation expense related to ISUs as of June 30, 2008 was CHF 3,163 million and will be recognized over the term of the award, subject to early retirement rules. |
| Incentive Share Unit activities | |||
| in 6M08 | ISU | ||
| Number of awards (million) | |||
| Balance at beginning of period | 25.4 | ||
| Granted | 47.0 | ||
| Settled | (8.8) | ||
| Forfeited | (0.5) | ||
| Balance at end of period | 63.1 | ||
| of which vested | 0.3 | ||
| of which unvested | 62.8 | ||
Performance Incentive Plan |
| As part of its annual incentive performance bonus process for 2004 and 2005, the Group granted Performance Incentive Plan (PIP) units during 2005 (PIP I) and 2006 (PIP II), respectively. PIP units are long-term retention incentive awards requiring continued employment with the Group, subject to restrictive covenants and cancellation provisions, and vest evenly over a five-year period. Each PIP unit will settle for a specified number of Credit Suisse Group registered shares subsequent to the fifth anniversary of the grant date based on the achievement of: i) earnings performance as compared to predefined targets; and ii) share price performance compared to predefined targets and share price performance relative to peers. |
| The compensation expense recognized in 6M08 related to PIP I and PIP II was CHF 169 million. The estimated unrecognized compensation expense related to PIP I and PIP II as of June 30, 2008 was CHF 172 million. None of the PIP units were deliverable as of June 30, 2008. |
| Performance Incentive Plan activities | |||||
| in 6M08 | PIP II | PIP I | |||
| Number of awards (million) | |||||
| Balance at beginning of period | 6.5 | 12.3 | |||
| Granted | 0.1 | 0.0 | |||
| Settled | 0.0 | 0.0 | |||
| Forfeited | (0.1) | 0.0 | |||
| Balance at end of period | 6.5 | 12.3 | |||
| of which vested | 3.1 | 8.0 | |||
| of which unvested | 3.4 | 4.3 | |||
Shares |
| The Group’s share-based compensation in prior years has included three different types of share awards: phantom shares; Longevity Premium Awards (LPA); and special awards. These share awards entitle the holder to receive one Credit Suisse Group registered share subject to continued employment with the Group, restrictive covenants and cancellation provisions and generally vest between zero and three years. |
| Special awards, which continue to be utilized on a case by case basis, are generally shares granted to new employees and are in addition to the annual bonus grants. During the first half of 2008, 2.5 million new special awards were granted, 13.3 million share awards were settled and 0.5 million share awards were forfeited. The compensation expense recognized in 6M08 related to shares awarded under phantom share, LPA and special awards was CHF 378 million. The estimated unrecognized compensation expense related to these awards as of June 30, 2008 was CHF 437 million. |
Share options |
| Options were a substantial component of the Group’s share-based program prior to 2004. The Group has discontinued the practice of issuing options and the majority of the original grants have since vested. Share options were granted with an exercise price equal to the market price of Credit Suisse Group’s shares on the date of grant and expire after ten years. |
| Note 18 Pension |
| Credit Suisse Group previously disclosed in the Credit Suisse Annual Report 2007, that it expected to contribute CHF 574 million to the defined benefit pension plans and to other post-retirement defined benefit plans in 2008. As of June 30, 2008, CHF 399 million of contributions have been made, including approximately CHF 140 million as a special contribution to the UK plan. |
| in | % change | in | % change | ||||||||||||||
| 2Q08 | 1Q08 | 2Q07 | QoQ | YoY | 6M08 | 6M07 | YoY | ||||||||||
| Total pension costs (CHF million) | |||||||||||||||||
| Service costs on benefit obligation | 66 | 67 | 80 | (1) | (18) | 133 | 160 | (17) | |||||||||
| Interest costs on benefit obligation | 152 | 153 | 139 | (1) | 9 | 305 | 278 | 10 | |||||||||
| Expected return on plan assets | (195) | (196) | (184) | (1) | 6 | (391) | (368) | 6 | |||||||||
| Amortization of recognized prior service cost | 8 | 9 | 10 | (11) | (20) | 17 | 17 | 0 | |||||||||
| Amortization of recognized actuarial (gains)/losses | 12 | 11 | 32 | 9 | (63) | 23 | 64 | (64) | |||||||||
| Net periodic pension costs | 43 | 44 | 77 | (2) | (44) | 87 | 151 | (42) | |||||||||
| Note 19 Guarantees and commitments |
| Guarantees | |||||||||||||
end of | Maturity less than 1 year | Maturity greater than 1 year | Total gross amount | Total net amount | 1 | Carrying value | Collateral received | ||||||
| 2Q08 (CHF million) | |||||||||||||
| Credit guarantees and similar instruments | 4,091 | 4,588 | 8,679 | 7,373 | 345 | 5,423 | |||||||
| Performance guarantees and similar instruments | 7,659 | 3,894 | 11,553 | 9,849 | 84 | 2,982 | |||||||
| Securities lending indemnifications | 35,703 | 0 | 35,703 | 35,703 | 0 | 35,703 | |||||||
| Derivatives | 252,585 | 901,022 | 1,153,607 | 1,153,607 | 47,556 | – | 2 | ||||||
| Other guarantees | 3,577 | 1,134 | 4,711 | 4,633 | 3 | 2,110 | |||||||
| Total guarantees | 303,615 | 910,638 | 1,214,253 | 1,211,165 | 47,988 | 46,218 | |||||||
| 4Q07 (CHF million) | |||||||||||||
| Credit guarantees and similar instruments | 3,428 | 6,041 | 9,469 | 8,083 | 223 | 5,396 | |||||||
| Performance guarantees and similar instruments | 4,422 | 8,130 | 12,552 | 10,802 | 141 | 3,588 | |||||||
| Securities lending indemnifications | 40,006 | 0 | 40,006 | 40,006 | 0 | 40,006 | |||||||
| Derivatives | 139,154 | 991,570 | 1,130,724 | 1,130,724 | 38,866 | – | 2 | ||||||
| Other guarantees | 3,225 | 1,008 | 4,233 | 4,198 | 3 | 1,862 | |||||||
| Total guarantees | 190,235 | 1,006,749 | 1,196,984 | 1,193,813 | 39,233 | 50,852 | |||||||
| 1 Total net amount is computed as the gross amount less any participations. 2 Collateral for derivatives accounted for as guarantees is not considered significant. | |||||||||||||
| Guarantees provided by the Group are broadly classified as follows: credit guarantees and similar instruments, performance guarantees and similar instruments, securities lending indemnifications, derivatives and other guarantees. For a detailed description of guarantees, refer to Note 31 – Guarantees and commitments in V – Consolidated financial statements – Credit Suisse Group in the Credit Suisse Annual Report 2007. |
| Deposit-taking banks in Switzerland and certain other European countries are required to ensure the payout of privileged deposits in case of specified restrictions or compulsory liquidation of a deposit-taking bank. Upon occurrence of a payout event, the Group’s contribution will be calculated based on its share of privileged deposits in proportion to total privileged deposits. These deposit insurance guarantees are reflected in other guarantees. The Group believes that the likelihood of having to pay under these agreements is remote. |
Disposal-related contingencies and other indemnifications |
| The Group has certain guarantees for which its maximum contingent liability cannot be quantified. These guarantees are not reflected in the table above and are discussed below. |
| Disposal-related contingencies |
| In connection with the sale of assets or businesses, the Group sometimes provides the acquirer with certain indemnification provisions. These indemnification provisions vary by counterparty in scope and duration and depend upon the type of assets or businesses sold. These indemnification provisions generally shift the potential risk of certain unquantifiable and unknowable loss contingencies (e.g., relating to litigation, tax and intellectual property matters) from the acquirer to the seller. The Group closely monitors all such contractual agreements in order to ensure that indemnification provisions are adequately provided for in the Group’s consolidated financial statements. |
| Other indemnifications |
| The Group provides indemnifications to certain counterparties in connection with its normal operating activities, for which it is not possible to estimate the maximum amount that it could be obligated to pay. As a normal part of issuing its own securities, the Group typically agrees to reimburse holders for additional tax-withholding charges or assessments resulting from changes in applicable tax laws or the interpretation of those laws. Securities that include these agreements to pay additional amounts generally also include a related redemption or call provision if the obligation to pay the additional amounts results from a change in law or its interpretation and the obligation cannot be avoided by the issuer taking reasonable steps to avoid the payment of additional amounts. Since such potential obligations are dependent on future changes in tax laws, the related liabilities the Group may incur as a result of such chang es cannot be reasonably estimated. In light of the related call provisions typically included, the Group does not expect any potential liabilities in respect of tax gross-ups to be material. |
| The Group is a member of numerous securities exchanges and clearing houses and may, as a result of its membership arrangements, be required to perform if another member defaults. The Group has determined that it is not possible to estimate the maximum amount of these obligations and believes that any potential requirement to make payments under these arrangements is remote. |
| Other commitments | |||||||||||
end of | Maturity less than 1 year | Maturity greater than 1 year | Total gross amount | Total net amount | 1 | Collateral received | |||||
| 2Q08 (CHF million) | |||||||||||
| Irrevocable commitments under documentary credits | 5,791 | 78 | 5,869 | 5,172 | 2,421 | ||||||
| Loan commitments | 175,013 | 53,536 | 228,549 | 228,375 | 156,844 | ||||||
| Forward reverse repurchase agreements | 58,903 | 0 | 58,903 | 58,903 | 58,903 | ||||||
| Other commitments | 6,376 | 1,708 | 8,084 | 8,084 | 831 | ||||||
| Total other commitments | 246,083 | 55,322 | 301,405 | 300,534 | 218,999 | ||||||
| 4Q07 (CHF million) | |||||||||||
| Irrevocable commitments under documentary credits | 5,874 | 96 | 5,970 | 5,240 | 2,448 | ||||||
| Loan commitments | 190,826 | 58,199 | 249,025 | 248,773 | 171,735 | ||||||
| Forward reverse repurchase agreements | 40,403 | 0 | 40,403 | 40,403 | 40,403 | ||||||
| Other commitments | 2,621 | 2,264 | 4,885 | 4,885 | 347 | ||||||
| Total other commitments | 239,724 | 60,559 | 300,283 | 299,301 | 214,933 | ||||||
| 1 Total net amount is computed as the gross amount less any participations. | |||||||||||
| Other commitments of the Group are broadly classified as follows: irrevocable commitments under documentary credits, loan commitments, forward reverse repurchase agreements and other commitments. For a detailed description of these commitments, refer to Note 31 – Guarantees and commitments in V – Consolidated financial statements – Credit Suisse Group in the Credit Suisse Annual Report 2007. |
| Note 20 Variable interest entities |
| In the normal course of business, the Group enters into transactions with, and makes use of, special purpose entities (SPE). SPEs typically qualify either as qualified special purpose entities (QSPE) according to SFAS No. 140, “Accounting for Transfers and Servicing of Financial Assets and Extinguishments of Liabilities” (SFAS 140) or variable interest entities (VIEs) according to FIN 46(R), “Consolidation of Variable Interest Entities – an interpretation of ARB No. 51” (FIN 46(R)). At each balance sheet date, QSPEs and VIEs are reviewed for events that may trigger reassessment of the entities’ classification. For a detailed description of QSPEs and VIEs, refer to Note 32 – Transfers and servicing of financial assets in V – Consolidated financial statements – Credit Suisse Group in the Credit Suisse Annual Report 2007. |
| As a normal part of its business, the Group engages in various transactions that include entities which are considered VIEs and are broadly grouped into three primary categories: CDOs, commercial paper (CP) conduits and financial intermediation. The Group consolidates all VIEs for which it is the primary beneficiary. VIEs may be sponsored by the Group, unrelated third parties or clients. |
| Application of the accounting requirements for consolidation of VIEs may require the exercise of significant management judgment. In the event consolidation of a VIE is required, the exposure to the Group is limited to that portion of the VIE’s assets attributable to any beneficial interest held by the Group prior to any risk management activities to hedge the Group’s net exposure. Any interests held in the VIE by third parties, even though consolidated by the Group, will not typically impact our results of operations. |
| The amounts shown as total assets of consolidated and non-consolidated VIEs for which the Group has involvement represent the total assets of the VIEs even though the Group’s involvement may be significantly less due to interests held by third-party investors. The Group’s maximum exposure to loss is different from the carrying value of the VIEs assets. This maximum loss exposure consists of the carrying value of the Group’s interests held as trading assets, derivatives or loans and the notional amount of guarantees to VIEs, rather than the amount of total assets of the VIEs. The maximum exposure to loss does not reflect our risk management activities, including effects from financial instruments that the Group may utilize to hedge the risks inherent in these VIEs. The economic risks associated with VIE exposures held by the Group, together with all relevant risk mitigation initiatives, are included in the Group’s risk management framework. |
| Consolidated and non-consolidated VIEs | |||||||
| end of | % change | ||||||
| 2Q08 | 4Q07 | QoQ | |||||
| Consolidated VIEs (CHF million) | |||||||
| CDO | 5,034 | 6,672 | (25) | ||||
| CP conduit | 0 | 1 | (100) | ||||
| Financial intermediation | 15,765 | 17,404 | (9) | ||||
| Total assets of consolidated VIEs | 20,799 | 24,077 | (14) | ||||
| Non-consolidated VIEs (CHF million) | |||||||
| CDO | 8,713 | 16,360 | (47) | ||||
| CP conduit | 9,948 | 12,642 | (21) | ||||
| Financial intermediation | 92,694 | 99,244 | (7) | ||||
| Total assets of non-consolidated VIEs | 111,355 | 128,246 | (13) | ||||
| Total maximum exposure to loss of non-consolidated VIEs (CHF million) | |||||||
| CDO | 2,568 | 2,453 | 5 | ||||
| CP conduit | 14,852 | 17,347 | (14) | ||||
| Financial intermediation | 23,225 | 20,512 | 13 | ||||
Collateralized debt obligations |
| As part of its structured finance business, the Group purchases loans and other debt obligations from and on behalf of clients for the purpose of securitization. The loans and other debt obligations are sold to VIEs that issue CDOs. |
| In connection with its CDO activities, the Group may act as underwriter, placement agent or asset manager and may warehouse assets prior to the closing of a transaction. |
| The Group has consolidated all CDO VIEs for which it is the primary beneficiary, resulting in the inclusion by the Group of approximately CHF 5.0 billion and CHF 6.7 billion of assets and liabilities of these VIEs in the consolidated balance sheets as of June 30, 2008 and December 31, 2007, respectively. The beneficial interests issued by these VIEs are payable solely from the cash flows of the related collateral and third-party creditors of these VIEs do not have recourse to the Group in the event of default. |
| The Group also retains certain debt and equity interests in open CDO VIEs that are not consolidated because the Group is not the primary beneficiary. The Group’s exposure in these CDO transactions typically consists of the interests retained in connection with its underwriting or market-making activities. We believe the Group’s maximum loss exposure is generally equal to the carrying value of these retained interests, which are reported as trading assets and carried at fair value and totaled CHF 2.6 billion and CHF 2.5 billion as of June 30, 2008 and December 31, 2007. |
| The Group’s maximum exposure to loss does not include any effects from financial instruments used to hedge the risks of the VIEs. The economic risks associated with CDO VIE exposures held by the Group, together with all relevant risk mitigation initiatives, are included in the Group’s risk management framework. |
Commercial paper conduits |
| The Group continues to act as the administrator and provider of liquidity and credit enhancement facilities for one CP conduit, Alpine Securitization Corp., a client-focused multi-seller conduit vehicle (Alpine). The Group does not have any ownership interest in Alpine. |
| The overall average maturity of the conduit’s outstanding CP was approximately 20 days as of June 30, 2008. Alpine’s commercial paper has the highest short-term ratings from the major independent external rating agencies. The majority of Alpine’s assets are highly rated loans or receivables in the consumer sector and money markets, including auto loans or leases, credit card receivables and student loans. Those assets had a weighted average rating of AA-, based on the lowest of each asset’s external or internal rating, and an average maturity of 3.1 years as of June 30, 2008. The Group’s commitment to this CP conduit consists of obligations under liquidity agreements and a program-wide credit enhancement agreement. |
| As of June 30, 2008, the Group’s maximum loss exposure to this non-consolidated CP conduit was CHF 14.9 billion, which consisted of CHF 9.9 billion of funded assets and the CP conduit’s commitments to purchase CHF 5.0 billion of additional assets. As of December 31, 2007, the Group’s maximum loss exposure was CHF 17.4 billion. |
| The Group believes that the likelihood of incurring a loss equal to this maximum exposure is remote because the assets held by the CP conduit, after giving effect to related asset-specific credit enhancement primarily provided by the clients, are classified as investment grade. If Alpine’s assets were consolidated as of June 30, 2008, we estimate that the valuation reductions of these assets would not have been material to our results of operations. The Group’s economic risks associated with the CP conduit are included in the Group’s risk management framework including counterparty, economic capital and scenario analysis. |
Financial intermediation |
| The Group has significant involvement with VIEs in its role as a financial intermediary on behalf of clients. The Group has consolidated all VIEs related to financial intermediation for which it is the primary beneficiary, resulting in the inclusion by the Group of approximately CHF 15.8 billion and CHF 17.4 billion of assets and liabilities of these VIEs in the consolidated balance sheets as of June 30, 2008 and December 31, 2007, respectively. Approximately 60% of the total assets relate to investment structures which the Group sponsors, manages and distributes. |
| The Group’s maximum loss exposure to non-consolidated VIEs related to financial intermediation activities was CHF 23.2 billion and CHF 20.5 billion as of June 30, 2008 and December 31, 2007, respectively. This exposure consists of the carrying value of the Group’s interests held as trading assets, derivatives or loans and the notional amount of guarantees to VIEs, not the total assets of the VIEs. The Group considers the likelihood of incurring a loss equal to the maximum exposure to be remote because of the Group’s risk mitigation efforts, including hedging strategies, collateral arrangements and the risk of loss that is retained by investors. The Group’s economic risks associated with consolidated and non-consolidated VIE exposures arising from financial intermediation, together with all relevant risk mitigation initiatives, are included in the Group’s risk management framework. |
| Financial intermediation is broadly grouped into the following categories: lending arrangements, certain securitizations and investment structures. |
| The Group’s lending arrangements are not consolidated by the Group as the clients are the sponsors of the VIEs and are deemed the primary beneficiaries. These structures are established to purchase, lease or otherwise finance and manage clients’ assets. The maximum exposure to loss is equivalent to the carrying value of the Group’s loan exposure, which is subject to the same credit risk management procedures as loans issued directly to clients. The Group considers the likelihood of incurring a loss equal to the maximum exposure to be remote because of the Group’s risk mitigation efforts which includes over-collateralization and effective monitoring to ensure that a sufficient loan-to-value ratio is maintained. |
| The Group acts as underwriter and market maker, liquidity provider, derivative counterparty or provider of credit enhancements to VIEs related to certain securitization transactions. In addition, the Group has exposure to third-party securitization VIEs as a result of the securities purchased from our money market funds in the second half of 2007 and the first quarter of 2008. The Group’s maximum loss exposure is generally equal to the carrying value of the retained interests and derivative positions, if any, plus the exposure arising from any credit enhancements provided by us. The Group’s maximum exposure to loss does not include any effects from financial instruments used to hedge the risks of the VIEs. |
| The Group may have various relationships with investment structures which the Group sponsors, manages and distributes, including in the form of structurer, investment advisor, investment manager, administrator, custodian, underwriter, placement agent, market maker or as prime broker. The maximum exposure to loss consists of the fair value of instruments issued by such structures, which are held by the Group as a result of underwriting or market-making activities, the fair value of any derivative exposure resulting from prime brokerage activities and our exposure resulting from principal protection and redemptions features. The investors typically retain the risk of loss on such transactions but the Group may provide principal protection on the securities to limit the investors’ exposure to downside risk. In addition, certain structures are designed to include redemption mechanisms which allow investors to redeem thei r participating interests in the respective VIEs within the agreed redemption periods. The Group’s maximum exposure to loss does not include any effects from financial instruments used to hedge the risk of the VIEs. |
| Note 21 Fair value of financial instruments |
| For further information on the fair value of financial instruments, refer to Note 33 – Financial instruments in V – Consolidated financial statements – Credit Suisse Group in the Credit Suisse Annual Report 2007. |
| The fair value of the majority of the Group’s financial instruments is based on quoted prices in active markets or observable inputs. These instruments include government and agency securities, commercial paper, most investment-grade corporate debt, most high-yield debt securities, exchange-traded and certain over-the-counter (OTC) derivative instruments and certain listed equity securities. |
| In addition, the Group holds financial instruments for which no prices are available and which have little or no observable inputs. For these instruments, the determination of fair value requires subjective assessment and varying degrees of judgment depending on liquidity, concentration, pricing assumptions and the risks affecting the specific instrument. In such circumstances, valuation is determined based on management’s own assumptions about the assumptions that market participants would use in pricing the asset or liability (including assumptions about risk). These instruments include certain high-yield debt securities, distressed debt securities, certain OTC derivatives, certain CDOs, certain asset-backed and mortgage-backed securities, non-traded equity securities, private equity and other long-term investments. |
| The Group has availed itself of the simplification in accounting offered under the fair value option, primarily in the Investment Banking and Asset Management segments. This has been accomplished generally by electing the fair value option, both at initial adoption and for subsequent transactions, on items impacted by the hedge accounting requirements of SFAS 133. That is, for instruments for which there was an inability to achieve hedge accounting and for which we are economically hedged, we have elected the fair value option. Likewise, where we manage an activity on a fair value basis but previously have been unable to achieve fair value accounting, we have utilized the fair value option to align our risk management reporting to our financial accounting. |
Fair value hierarchy |
| The levels of the fair value hierarchy are defined as follows in SFAS 157: |
| – Level 1: Quoted prices (unadjusted) in active markets for identical assets or liabilities that the Group has the ability to access. This level of the fair value hierarchy provides the most reliable evidence of fair value and is used to measure fair value whenever available. |
| – Level 2: Inputs other than quoted prices included within level 1 that are observable for the asset or liability, either directly or indirectly. These inputs include: (i) quoted prices for similar assets or liabilities in active markets; (ii) quoted prices for identical or similar assets or liabilities in markets that are not active, that is, markets in which there are few transactions for the asset or liability, the prices are not current or price quotations vary substantially either over time or among market makers, or in which little information is publicly available; (iii) inputs other than quoted prices that are observable for the asset or liability; or (iv) inputs that are derived principally from or corroborated by observable market data by correlation or other means. |
| – Level 3: Inputs that are unobservable for the asset or liability. These inputs reflect the Group’s own assumptions about the assumptions that market participants would use in pricing the asset or liability (including assumptions about risk). These inputs are developed based on the best information available in the circumstances, which include the Group’s own data. The Group’s own data used to develop unobservable inputs is adjusted if information indicates that market participants would use different assumptions. |
| An overview of the Group’s valuation techniques applied to financial instruments is described in Note 33 – Financial instruments in V – Consolidated financial statements – Credit Suisse Group in the Credit Suisse Annual Report 2007. |
| Assets and liabilities measured at fair value on a recurring basis | |||||||||||
end of 6M08 | Quoted prices in active markets for identical assets or liabilities (level1) | Significant other observable inputs (level 2) | Significant unobserv- able inputs (level 3) | Impact of netting | 1 | Total at fair value | |||||
| Assets (CHF million) | |||||||||||
| Central bank funds sold, securities purchased under resale agreements and securities borrowing transactions | 0 | 148,087 | 0 | 0 | 148,087 | ||||||
| Securities received as collateral | 24,906 | 2,166 | 0 | 0 | 27,072 | ||||||
| Trading assets | 199,372 | 661,160 | 64,917 | (480,674) | 444,775 | ||||||
| Investment securities | 13,264 | 703 | 10 | 0 | 13,977 | ||||||
| Other investments | 497 | 6,621 | 17,888 | 0 | 25,006 | ||||||
| Loans | 0 | 16,294 | 12,184 | 0 | 28,478 | ||||||
| Other intangible assets | 0 | 0 | 123 | 0 | 123 | ||||||
| Other assets | 4,539 | 23,593 | 19,183 | (116) | 47,199 | ||||||
| Total assets at fair value | 242,578 | 858,624 | 114,305 | (480,790) | 734,717 | ||||||
| Liabilities (CHF million) | |||||||||||
| Due to banks | 0 | 6,201 | 4 | 0 | 6,205 | ||||||
| Customer deposits | 0 | 4,331 | 26 | 0 | 4,357 | ||||||
| Central bank funds purchased, securities sold under repurchase agreements and securities lending transactions | 0 | 137,526 | 0 | 0 | 137,526 | ||||||
| Obligations to return securities received as collateral | 24,906 | 2,166 | 0 | 0 | 27,072 | ||||||
| Trading liabilities | 105,700 | 545,019 | 22,856 | (478,362) | 195,213 | ||||||
| Short-term borrowings | 0 | 5,573 | 649 | 0 | 6,222 | ||||||
| Long-term debt | 0 | 69,504 | 28,724 | 0 | 98,228 | ||||||
| Other liabilities | 0 | 24,116 | 1,561 | (33) | 25,644 | ||||||
| Total liabilities at fair value | 130,606 | 794,436 | 53,820 | (478,395) | 500,467 | ||||||
| Net assets/liabilities at fair value | 111,972 | 64,188 | 60,485 | (2,395) | 2 | 234,250 | |||||
| 1 Derivative contracts are reported on a gross basis by level. The impact of netting represents an adjustment related to counterparty netting. 2 In accordance with the provisions of FSP FIN 39-1, the Group offset cash collateral receivables and payables of CHF 19.3 billion and CHF 16.9 billion, respectively, as of the end of 6M08 against the derivative positions. The Group adopted the provisions of FSP FIN 39-1 on a prospective basis as of January 1, 2008. | |||||||||||
| Assets and liabilities measured at fair value on a recurring basis | |||||||||||
end of 4Q07 | Quoted prices in active markets for identical assets or liabilities (level1) | Significant other observable inputs (level 2) | Significant unobserv- able inputs (level 3) | Impact of netting | 1 | Total at fair value | |||||
| Assets (CHF million) | |||||||||||
| Central bank funds sold, securities purchased under resale agreements and securities borrowing transactions | 0 | 183,719 | 0 | 0 | 183,719 | ||||||
| Securities received as collateral | 25,488 | 2,826 | 0 | 0 | 28,314 | ||||||
| Trading assets | 252,055 | 565,607 | 60,621 | (346,200) | 532,083 | ||||||
| Investment securities | 14,451 | 992 | 10 | 0 | 15,453 | ||||||
| Other investments | 565 | 6,893 | 17,737 | 0 | 25,195 | ||||||
| Loans | 0 | 25,409 | 5,638 | 0 | 31,047 | ||||||
| Other intangible assets | 0 | 0 | 179 | 0 | 179 | ||||||
| Other assets | 4,092 | 37,248 | 8,080 | (94) | 49,326 | ||||||
| Total assets at fair value | 296,651 | 822,694 | 92,265 | (346,294) | 865,316 | ||||||
| Liabilities (CHF million) | |||||||||||
| Due to banks | 0 | 6,041 | 6 | 0 | 6,047 | ||||||
| Customer deposits | 0 | 6,134 | 0 | 0 | 6,134 | ||||||
| Central bank funds purchased, securities sold under repurchase agreements and securities lending transactions | 0 | 140,424 | 0 | 0 | 140,424 | ||||||
| Obligations to return securities received as collateral | 25,488 | 2,826 | 0 | 0 | 28,314 | ||||||
| Trading liabilities | 111,776 | 416,688 | 19,597 | (346,252) | 201,809 | ||||||
| Short-term borrowings | 0 | 7,426 | 694 | 0 | 8,120 | ||||||
| Long-term debt | 0 | 80,061 | 31,232 | 0 | 111,293 | ||||||
| Other liabilities | 0 | 24,102 | 173 | (42) | 24,233 | ||||||
| Total liabilities at fair value | 137,264 | 683,702 | 51,702 | (346,294) | 526,374 | ||||||
| Net assets/liabilities at fair value | 159,387 | 138,992 | 40,563 | 0 | 338,942 | ||||||
| 1 Derivative contracts are reported on a gross basis by level. The impact of netting represents an adjustment related to counterparty netting. | |||||||||||
| Assets and liabilities measured at fair value on a recurring basis for level 3 | |||||||||
6M08 | Derivatives, net | Private equity investments | Other | Total | |||||
| Assets (CHF million) | |||||||||
| Balance at beginning of period | 5,631 | 17,737 | 49,569 | 1 | 72,937 | ||||
| Net realized/unrealized gains/(losses) included in net revenues | 4,702 | (1,780) | (11,425) | (8,503) | |||||
| Purchases, sales, issuances and settlements | (208) | 1,945 | 718 | 2,455 | |||||
| Transfers in and/or out of level 3 | (1,481) | (14) | 26,372 | 24,877 | |||||
| Balance at end of period | 8,644 | 17,888 | 65,234 | 2 | 91,766 | ||||
| Liabilities (CHF million) | |||||||||
| Balance at beginning of period | – | – | 32,374 | 3 | 32,374 | ||||
| Net realized/unrealized (gains)/losses included in net revenues | – | – | (4,475) | (4,475) | |||||
| Purchases, sales, issuances and settlements | – | – | (1,228) | (1,228) | |||||
| Transfers in and/or out of level 3 | – | – | 4,610 | 4,610 | |||||
| Balance at end of period | – | – | 31,281 | 3 | 31,281 | ||||
| Net | 8,644 | 17,888 | 33,953 | 60,485 | |||||
| Total realized/unrealized gains/(losses) included in net revenues | 4,702 | (1,780) | (6,950) | (4,028) | |||||
| 1 Includes primarily CMBS, RMBS, CDO, corporate loans and internally managed private equity funds. 2 Includes primarily equity derivatives, internally managed private equity funds, RMBS, CMBS and CDO. 3 Includes primarily structured notes. | |||||||||
| Assets and liabilities measured at fair value on a recurring basis for level 3 | |||||||||
6M07 | Derivatives, net | Private equity investments | Other | Total | |||||
| Assets (CHF million) | |||||||||
| Balance at beginning of period | 189 | 14,953 | 10,712 | 1 | 25,854 | ||||
| Net realized/unrealized gains/(losses) included in net revenues | 1,008 | 2,521 | 1,441 | 4,970 | |||||
| Purchases, sales, issuances and settlements | 1,916 | (1,207) | 11,058 | 11,767 | |||||
| Transfers in and/or out of level 3 | 1,967 | (68) | 5,708 | 7,607 | |||||
| Balance at end of period | 5,080 | 16,199 | 28,919 | 1 | 50,198 | ||||
| Liabilities (CHF million) | |||||||||
| Balance at beginning of period | – | – | 27,939 | 2 | 27,939 | ||||
| Net realized/unrealized (gains)/losses included in net revenues | – | – | 265 | 265 | |||||
| Purchases, sales, issuances and settlements | – | – | 8,938 | 8,938 | |||||
| Transfers in and/or out of level 3 | – | – | (4,226) | (4,226) | |||||
| Balance at end of period | – | – | 32,916 | 2 | 32,916 | ||||
| Net | 5,080 | 16,199 | (3,997) | 17,282 | |||||
| Total realized/unrealized gains/(losses) included in net revenues | 1,008 | 2,521 | 1,176 | 4,705 | |||||
| 1 Includes primarily CMBS, RMBS, CDO and internally managed private equity funds. 2 Includes primarily structured notes. | |||||||||
| Gains and losses on assets and liabilities measured at fair value on a recurring basis using significant unobservable inputs (level 3) | |||||||||||||
| 6M08 | 6M07 | ||||||||||||
in | Trading revenues | Other revenues | Total revenues | Trading revenues | Other revenues | Total revenues | |||||||
| Gains and losses on assets and liabilities (CHF million) | |||||||||||||
| Net realized/unrealized gains/(losses) included in net revenues | (4,278) | 250 | (4,028) | 2,379 | 2,326 | 4,705 | |||||||
| Whereof: | |||||||||||||
| Unrealized gains/(losses) relating to assets and liabilities still held as of the reporting date | 2,560 | 281 | 2,841 | 1,038 | 781 | 1,819 | |||||||
| Both observable and unobservable inputs may be used to determine the fair value of positions that have been classified within level 3. As a result, the unrealized gains and losses for assets and liabilities within level 3 presented in the table above may include changes in fair value that were attributable to both observable and unobservable inputs. |
| The Group employs various economic hedging techniques in order to manage risks, including risks in level 3 positions. Such techniques may include the purchase or sale of financial instruments that are classified in levels 1 and/or 2. The realized and unrealized gains and losses for assets and liabilities in level 3 presented in the table above do not reflect the related realized or unrealized gains and losses arising on economic hedging instruments classified in levels 1 and/or 2. |
Nonrecurring fair value changes |
| Certain assets and liabilities are measured at fair value on a nonrecurring basis; that is, they are not measured at fair value on an ongoing basis but are subject to fair value adjustments in certain circumstances (for example, when there is evidence of impairment). As of June 30, 2008 and December 31, 2007, CHF 4.8 billion and CHF 6.3 billion, respectively, of loans have been recorded at fair value, of which CHF 1.8 billion and CHF 5.7 billion, respectively, were classified as level 2 and CHF 3.0 billion and CHF 0.6 billion, respectively, were classified as level 3. |
Fair value option |
| Upon adoption of SFAS 159, the Group elected fair value for certain of its financial statement captions. The following represents a change to the Group’s fair value elections beginning in 1Q08. |
| Long-term debt |
| The Group’s long-term debt includes debt issuances managed by its Global Treasury department that do not contain derivative features (vanilla debt). The Group actively manages the interest rate risk on these instruments with derivatives; in particular, fixed-rate debt is hedged with receive-fixed, pay-floating interest rate swaps. Upon adoption of SFAS 159, the Group availed itself of the simplification objective of the fair value option and elected fair value for this fixed-rate debt in order to achieve a similar financial reporting outcome as that achieved under hedge accounting per the guidance of SFAS 133. Given the significant volatility due to changes in the Group’s credit spreads, the Group did not elect to apply the fair value option to fixed-rate debt issued by the Group in 1Q08 or subsequent and instead will apply hedge accounting. |
| Difference between the aggregate fair value and the aggregate unpaid principal balances of loans and financial instruments | |||||||||||||
| 2Q08 | 4Q07 | ||||||||||||
end of | Aggregate fair value | Aggregate unpaid principal | Difference | Aggregate fair value | Aggregate unpaid principal | Difference | |||||||
| Loans (CHF million) | |||||||||||||
| Non-performing loans (90 days or more past due) | 187 | 229 | (42) | 0 | 0 | 0 | |||||||
| Non-accrual loans | 423 | 854 | (431) | 232 | 459 | (227) | |||||||
| Financial instruments (CHF million) | |||||||||||||
| Central bank funds sold, securities purchased under resale agreements and securities borrowing transactions | 148,087 | 147,763 | 324 | 183,71 9 | 183,303 | 416 | |||||||
| Loans | 28,478 | 28,872 | (394) | 31,047 | 31,517 | (470) | |||||||
| Other assets | 31,835 | 35,975 | (4,140) | 33,936 | 35,420 | (1,484) | |||||||
| Due to banks and customer deposits | (2,904) | (2,929) | 25 | (5,902) | (5,895) | (7) | |||||||
| Central bank funds purchased, securities sold under repurchase agreements and securities lending transactions | (137,526) | (137,685) | 159 | (140,424) | (140,436) | 12 | |||||||
| Short-term borrowings | (6,222) | (6,609) | 387 | (8,120) | (8,409) | 289 | |||||||
| Long-term debt | (98,228) | (106,019) | 7,791 | (111,293) | (111,595) | 302 | |||||||
| Other liabilities | (4,620) | (4,671) | 51 | (3,648) | (3,646) | (2) | |||||||
| Gains and losses on financial instruments | |||||
| 6M08 | 6M07 | ||||
in | Net gains/ (losses) | Net gains/ (losses) | |||
| Financial instruments (CHF million) | |||||
| Central bank funds sold, securities purchased under resale agreements and securities borrowing transactions | 4,896 | 1 | 7,112 | 1 | |
| Trading loans | 87 | 2 | 106 | 1 | |
| of which related to credit risk | 0 | 21 | |||
| Other investments | (219) | 2 | 33 | 2 | |
| Loans | 622 | 1 | 593 | 1 | |
| of which related to credit risk | (170) | (26) | |||
| Other assets | (2,342) | 2 | 825 | 1 | |
| of which related to credit risk | (3,566) | 123 | |||
| Due to banks and customer deposits | (48) | 1 | (79) | 1 | |
| of which related to credit risk | 9 | 0 | |||
| Central bank funds purchased, securities sold under repurchase agreements and securities lending transactions | (3,745) | 1 | (6,018) | 1 | |
| Short-term borrowings | (202) | 2 | (232) | 1 | |
| Long-term debt | 2,628 | 2 | (2,817) | 2 | |
| of which related to credit risk | 933 | (93) | |||
| Other liabilities | (421) | 2 | (5) | 2 | |
| of which related to credit risk | (498) | (5) | |||
| 1 Primarily recognized in net interest income. 2 Primarily recognized in trading revenues. | |||||
| Note 22 Subsidiary guarantee information |
| On March 26, 2007, the Group and the Bank issued full, unconditional and several guarantees of Credit Suisse (USA), Inc.’s outstanding US SEC-registered debt securities. In accordance with the guarantees, if Credit Suisse (USA), Inc. fails to make any timely payment under the agreements governing such debt securities, the holders of the debt securities may demand payment from either the Group or the Bank, without first proceeding against Credit Suisse (USA), Inc. The guarantee from the Group is subordinated to senior liabilities. Credit Suisse (USA), Inc. is an indirect, wholly owned subsidiary of the Group. |
| Condensed consolidating statements of income | |||||||||||||
in 2Q08 | Credit Suisse (USA), Inc. | Other Credit Suisse subsidiaries | 1 | Credit Suisse (the Bank) | Credit Suisse Group parent company | Other Credit Suisse Group subsidiaries | 1 | Credit Suisse Group | |||||
| Condensed consolidating statements of income (CHF million) | |||||||||||||
| Interest and dividend income | 4,526 | 8,292 | 12,818 | 105 | 139 | 13,062 | |||||||
| Interest expense | (3,683) | (7,452) | (11,135) | (101) | 34 | (11,202) | |||||||
| Net interest income | 843 | 840 | 1,683 | 4 | 173 | 1,860 | |||||||
| Commissions and fees | 1,057 | 2,829 | 3,886 | 5 | 306 | 4,197 | |||||||
| Trading revenues | 113 | 856 | 969 | 0 | (69) | 900 | |||||||
| Other revenues | 508 | 737 | 1,245 | 1,264 | (1,329) | 1,180 | |||||||
| Net revenues | 2,521 | 5,262 | 7,783 | 1 ,273 | (919) | 8,137 | |||||||
| Provision for credit losses | 0 | 35 | 35 | 0 | 10 | 45 | |||||||
| Compensation and benefits | 1,190 | 2,763 | 3,953 | 25 | 98 | 4,076 | |||||||
| General and administrative expenses | (110) | 1,622 | 1,512 | 31 | 22 | 1,565 | |||||||
| Commission expenses | 73 | 487 | 560 | 1 | 49 | 610 | |||||||
| Total other operating expenses | (37) | 2,109 | 2,072 | 32 | 71 | 2,175 | |||||||
| Total operating expenses | 1,153 | 4,872 | 6,025 | 57 | 169 | 6,251 | |||||||
| Income before taxes and minority interests | 1,368 | 355 | 1,723 | 1,216 | (1,098) | 1,841 | |||||||
| Income tax expense/(benefit) | 285 | (2) | 283 | 1 | 13 | 297 | |||||||
| Minority interests | 311 | (100) | 211 | 0 | 118 | 329 | |||||||
| Net income | 772 | 457 | 1,229 | 1,215 | (1,229) | 1,215 | |||||||
| in 2Q07 | |||||||||||||
| Condensed consolidating statements of income (CHF million) | |||||||||||||
| Interest and dividend income | 7,271 | 9,111 | 16,382 | 98 | 139 | 16,619 | |||||||
| Interest expense | (7,052) | (7,304) | (14,356) | (127) | 113 | (14,370) | |||||||
| Net interest income | 219 | 1,807 | 2,026 | (29) | 252 | 2,249 | |||||||
| Commissions and fees | 1,506 | 3,378 | 4,884 | 5 | 353 | 5,242 | |||||||
| Trading revenues | 1,227 | 2,585 | 3,812 | 1 | (3) | 3,810 | |||||||
| Other revenues | 1,454 | 320 | 1,774 | 3,205 | (3,243) | 1,736 | |||||||
| Net revenues | 4,406 | 8,090 | 12,496 | 3,182 | (2,641) | 13,037 | |||||||
| Provision for credit losses | 0 | (23) | (23) | 0 | 3 | (20) | |||||||
| Compensation and benefits | 1,848 | 3,388 | 5,236 | 53 | 120 | 5,409 | |||||||
| General and administrative expenses | 327 | 1,314 | 1,641 | (68) | 46 | 1,619 | |||||||
| Commission expenses | 112 | 479 | 591 | 5 | 46 | 642 | |||||||
| Total other operating expenses | 439 | 1,793 | 2,232 | (63) | 92 | 2,261 | |||||||
| Total operating expenses | 2,287 | 5,181 | 7,468 | (10) | 212 | 7,670 | |||||||
| Income before taxes and minority interests | 2,119 | 2,932 | 5,051 | 3,192 | (2,856) | 5,387 | |||||||
| Income tax expense/(benefit) | 241 | 601 | 842 | 3 | 18 | 863 | |||||||
| Minority interests | 1,201 | 235 | 1,436 | 0 | (101) | 1,335 | |||||||
| Net income | 677 | 2,096 | 2,773 | 3,189 | (2,773) | 3,189 | |||||||
| 1 Includes eliminations and consolidation adjustments. | |||||||||||||
| Condensed consolidating statements of income | |||||||||||||
in 6M08 | Credit Suisse (USA), Inc. | Other Credit Suisse subsidiaries | 1 | Credit Suisse (the Bank) | Credit Suisse Group parent company | Other Credit Suisse Group subsidiaries | 1 | Credit Suisse Group | |||||
| Condensed consolidating statements of income (CHF million) | |||||||||||||
| Interest and dividend income | 9,678 | 15,673 | 25,351 | 208 | 262 | 25,821 | |||||||
| Interest expense | (8,193) | (13,549) | (21,742) | (213) | 100 | (21,855) | |||||||
| Net interest income | 1,485 | 2,124 | 3,609 | (5) | 362 | 3,966 | |||||||
| Commissions and fees | 1,872 | 5,635 | 7,507 | 10 | 613 | 8,130 | |||||||
| Trading revenues | 88 | (1,214) | (1,126) | (1) | 250 | (877) | |||||||
| Other revenues | 681 | (592) | 89 | (860) | 784 | 13 | |||||||
| Net revenues | 4,126 | 5,953 | 10,079 | (856) | 2,009 | 11,232 | |||||||
| Provision for credit losses | 0 | 186 | 186 | 0 | 10 | 196 | |||||||
| Compensation and benefits | 2,240 | 4,842 | 7,082 | 54 | 204 | 7,340 | |||||||
| General and administrative expenses | 215 | 2,880 | 3,095 | 12 | 43 | 3,150 | |||||||
| Commission expenses | 156 | 974 | 1,130 | 1 | 103 | 1,234 | |||||||
| Total other operating expenses | 371 | 3,854 | 4,225 | 13 | 146 | 4,384 | |||||||
| Total operating expenses | 2,611 | 8,696 | 11,307 | 67 | 350 | 11,724 | |||||||
| Income/(loss) before taxes and minority interests | 1,515 | (2,929) | (1,414) | (923) | 1,649 | (688) | |||||||
| Income tax expense | 284 | (587) | (303) | 10 | 135 | (158) | |||||||
| Minority interests | 431 | (390) | 41 | 0 | 362 | 403 | |||||||
| Net income/(loss) | 800 | (1,952) | (1,152) | (933) | 1,152 | (933) | |||||||
| in 6M07 | |||||||||||||
| Condensed consolidating statements of income (CHF million) | |||||||||||||
| Interest and dividend income | 13,793 | 17,018 | 30,811 | 203 | 297 | 31,311 | |||||||
| Interest expense | (13,389) | (13,528) | (26,917) | (253) | 197 | (26,973) | |||||||
| Net interest income | 404 | 3,490 | 3,894 | (50) | 494 | 4,338 | |||||||
| Commissions and fees | 3,061 | 6,447 | 9,508 | 11 | 700 | 10,219 | |||||||
| Trading revenues | 2,329 | 4,674 | 7,003 | 2 | 21 | 7,026 | |||||||
| Other revenues | 2,533 | 652 | 3,185 | 5,938 | (6,049) | 3,074 | |||||||
| Net revenues | 8,327 | 15,263 | 23,590 | 5,901 | (4,834) | 24,657 | |||||||
| Provision for credit losses | 0 | 28 | 28 | 0 | 5 | 33 | |||||||
| Compensation and benefits | 3,662 | 6,364 | 10,026 | 104 | 229 | 10,359 | |||||||
| General and administrative expenses | 660 | 2,538 | 3,198 | (128) | 81 | 3,151 | |||||||
| Commission expenses | 220 | 921 | 1,141 | 6 | 104 | 1,251 | |||||||
| Total other operating expenses | 880 | 3,459 | 4,339 | (122) | 185 | 4,402 | |||||||
| Total operating expenses | 4,542 | 9,823 | 14,365 | (18) | 414 | 14,761 | |||||||
| Income before taxes and minority interests | 3,785 | 5,412 | 9,197 | 5,919 | (5,253) | 9,863 | |||||||
| Income tax expense | 507 | 1,124 | 1,631 | 1 | 53 | 1,685 | |||||||
| Minority interests | 2,082 | 309 | 2,391 | 0 | (131) | 2,260 | |||||||
| Net income | 1,196 | 3,979 | 5,175 | 5,918 | (5,175) | 5,918 | |||||||
| 1 Includes eliminations and consolidation adjustments. | |||||||||||||
| Condensed consolidating balance sheets | |||||||||||||
end of 2Q08 | Credit Suisse (USA), Inc. | Other Credit Suisse subsidiaries | 1 | Credit Suisse (the Bank) | Credit Suisse Group parent company | Other Credit Suisse Group subsidiaries | 1 | Credit Suisse Group | |||||
| Assets (CHF million) | |||||||||||||
| Cash and due from banks | 4,186 | 26,822 | 31,008 | 15 | (74) | 30,949 | |||||||
| Interest-bearing deposits with banks | 39,460 | (32,872) | 6,588 | 0 | (1,169) | 5,419 | |||||||
| Central bank funds sold, securities purchased under resale agreements and securities borrowing transactions | 175,667 | 104,966 | 280,633 | 0 | 916 | 281,549 | |||||||
| Securities received as collateral | 25,339 | 2,052 | 27,391 | 0 | (319) | 27,072 | |||||||
| Trading assets | 140,724 | 303,348 | 444,072 | 0 | 703 | 444,775 | |||||||
| Investment securities | 0 | 12,870 | 12,870 | 29 | 1,347 | 14,246 | |||||||
| Other investments | 18,025 | 9,509 | 27,534 | 37,713 | (37,560) | 27,687 | |||||||
| Net loans | 853 | 214,296 | 215,149 | 9,536 | 10,046 | 234,731 | |||||||
| Premises and equipment | 805 | 4,701 | 5,506 | 0 | 576 | 6,082 | |||||||
| Goodwill | 742 | 7,928 | 8,670 | 0 | 1,136 | 9,806 | |||||||
| Other intangible assets | 164 | 401 | 565 | 0 | 20 | 585 | |||||||
| Other assets | 30,165 | 115,723 | 145,888 | 196 | 840 | 146,924 | |||||||
| Total assets | 436,130 | 769,744 | 1,205,874 | 47,489 | (23,538) | 1,229,825 | |||||||
| Liabilities and shareholders' equity (CHF million) | |||||||||||||
| Due to banks | 93 | 88,320 | 88,413 | 5,148 | (21,781) | 71,780 | |||||||
| Customer deposits | 2 | 275,099 | 275,101 | 0 | 29,057 | 304,158 | |||||||
| Central bank funds purchased, securities sold under repurchase agreements and securities lending transactions | 180,575 | 76,236 | 256,811 | 0 | 9 | 256,820 | |||||||
| Obligation to return securities received as collateral | 25,339 | 2,052 | 27,391 | 0 | (319) | 27,072 | |||||||
| Trading liabilities | 62,768 | 131,711 | 194,479 | 0 | 734 | 195,213 | |||||||
| Short-term borrowings | 40,828 | (31,347) | 9,481 | 0 | 2,600 | 12,081 | |||||||
| Long-term debt | 36,020 | 114,020 | 150,040 | 5,258 | (2,543) | 152,755 | |||||||
| Other liabilities | 57,487 | 98,621 | 156,108 | 235 | 766 | 157,109 | |||||||
| Minority interests | 14,356 | 6,828 | 21,184 | 0 | (5,195) | 15,989 | |||||||
| Total liabilities | 417,468 | 761,540 | 1,179,008 | 10,641 | 3,328 | 1,192,977 | |||||||
| Total shareholders' equity | 18,662 | 8,204 | 26,866 | 36,848 | (26,866) | 36,848 | |||||||
| Total liabilities and shareholders' equity | 436,130 | 769,744 | 1,205,874 | 47,489 | (23,538) | 1,229,825 | |||||||
| 1 Includes eliminations and consolidation adjustments. | |||||||||||||
| Condensed consolidating balance sheets | |||||||||||||
end of 4Q07 | Credit Suisse (USA), Inc. | Other Credit Suisse subsidiaries | 1 | Credit Suisse (the Bank) | Credit Suisse Group parent company | Other Credit Suisse Group subsidiaries | 1 | Credit Suisse Group | |||||
| Assets (CHF million) | |||||||||||||
| Cash and due from banks | 3,118 | 33,186 | 36,304 | 7 | 2,148 | 38,459 | |||||||
| Interest-bearing deposits with banks | 49,060 | (44,534) | 4,526 | 0 | (767) | 3,759 | |||||||
| Central bank funds sold, securities purchased under resale agreements and securities borrowing transactions | 182,625 | 113,716 | 296,341 | 0 | 368 | 296,709 | |||||||
| Securities received as collateral | 29,194 | (466) | 28,728 | 0 | (414) | 28,314 | |||||||
| Trading assets | 161,718 | 368,407 | 530,125 | 0 | 1,958 | 532,083 | |||||||
| Investment securities | 0 | 14,515 | 14,515 | 29 | 1,187 | 15,731 | |||||||
| Other investments | 18,312 | 9,595 | 27,907 | 45,188 | (44,975) | 28,120 | |||||||
| Net loans | 909 | 220,661 | 221,570 | 9,440 | 9,524 | 240,534 | |||||||
| Premises and equipment | 839 | 4,751 | 5,590 | 0 | 559 | 6,149 | |||||||
| Goodwill | 806 | 8,940 | 9,746 | 0 | 1,136 | 10,882 | |||||||
| Other intangible assets | 224 | 197 | 421 | 0 | 23 | 444 | |||||||
| Other assets | 33,459 | 124,510 | 157,969 | 203 | 1,324 | 159,496 | |||||||
| Total assets | 480,264 | 853,478 | 1,333,742 | 54,867 | (27,929) | 1,360,680 | |||||||
| Liabilities and shareholders' equity (CHF million) | |||||||||||||
| Due to banks | 62 | 106,917 | 106,979 | 5,978 | (22,093) | 90,864 | |||||||
| Customer deposits | 2 | 307,596 | 307,598 | 0 | 27,907 | 335,505 | |||||||
| Central bank funds purchased, securities sold under repurchase agreements and securities lending transactions | 214,479 | 85,997 | 300,476 | 0 | (95) | 300,381 | |||||||
| Obligation to return securities received as collateral | 29,194 | (466) | 28,728 | 0 | (414) | 28,314 | |||||||
| Trading liabilities | 59,204 | 141,371 | 200,575 | 0 | 1,234 | 201,809 | |||||||
| Short-term borrowings | 49,915 | (35,517) | 14,398 | 0 | 4,992 | 19,390 | |||||||
| Long-term debt | 47,353 | 109,929 | 157,282 | 5,421 | (2,546) | 160,157 | |||||||
| Other liabilities | 46,316 | 116,037 | 162,353 | 269 | 1,799 | 164,421 | |||||||
| Minority interests | 15,267 | 8,752 | 24,019 | 0 | (7,379) | 16,640 | |||||||
| Total liabilities | 461,792 | 840,616 | 1,302,408 | 11,668 | 3,405 | 1,317,481 | |||||||
| Total shareholders' equity | 18,472 | 12,862 | 31,334 | 43,199 | (31,334) | 43,199 | |||||||
| Total liabilities and shareholders' equity | 480,264 | 853,478 | 1,333,742 | 54,867 | (27,929) | 1,360,680 | |||||||
| 1 Includes eliminations and consolidation adjustments. | |||||||||||||
| Condensed consolidating statements of cash flows | |||||||||||||
in 6M08 | Credit Suisse (USA), Inc. | Other Credit Suisse subsidiaries | 1 | Credit Suisse (the Bank) | Credit Suisse Group parent company | Other Credit Suisse Group subsidiaries | 1 | Credit Suisse Group | |||||
| Operating activities of continuing operations (CHF million) | |||||||||||||
| Net cash provided by/(used in) operating activities of continuing operations | 32,143 | 6,338 | 38,481 | (1,243) | 3,076 | 40,314 | |||||||
| Investing activities of continuing operations (CHF million) | |||||||||||||
| (Increase)/decrease in interest-bearing deposits with banks | 5,066 | (7,212) | (2,146) | 0 | 255 | (1,891) | |||||||
| (Increase)/decrease in central bank funds sold, securities purchased under resale agreements and securities borrowing transactions | (10,822) | 484 | (10,338) | 0 | (549) | (10,887) | |||||||
| Purchase of investment securities | 0 | (138) | (138) | 0 | (374) | (512) | |||||||
| Proceeds from sale of investment securities | 0 | 8 | 8 | 0 | 0 | 8 | |||||||
| Maturities of investment securities | 0 | 1,034 | 1,034 | 0 | 187 | 1,221 | |||||||
| Investments in subsidiaries and other investments | (1,122) | (1,278) | (2,400) | 3,082 | (3,256) | (2,574) | |||||||
| Proceeds from sale of other investments | 912 | 328 | 1,240 | 1,276 | (1,123) | 1,393 | |||||||
| (Increase)/decrease in loans | (183) | (472) | (655) | (298) | (334) | (1,287) | |||||||
| Proceeds from sales of loans | 0 | 472 | 472 | 0 | 0 | 472 | |||||||
| Capital expenditures for premises and equipment and other intangible assets | (101) | (438) | (539) | 0 | (62) | (601) | |||||||
| Proceeds from sale of premises and equipment and other intangible assets | 0 | 2 | 2 | 0 | 0 | 2 | |||||||
| Other, net | (55) | 41 | (14) | (4) | 3 | (15) | |||||||
| Net cash provided by/(used in) investing activities of continuing operations | (6,305) | (7,169) | (13,474) | 4,056 | (5,253) | (14,671) | |||||||
| Financing activities of continuing operations (CHF million) | |||||||||||||
| Increase/(decrease) in due to banks and customer deposits | 38 | (28,879) | (28,841) | (786) | 1,417 | (28,210) | |||||||
| Increase/(decrease) in short-term borrowings | (4,652) | 480 | (4,172) | 0 | (2,080) | (6,252) | |||||||
| Increase/(decrease) in central bank funds purchased, securities sold under repurchase agreements and securities lending transactions | (13,835) | (3,931) | (17,766) | 0 | 104 | (17,662) | |||||||
| Issuances of long-term debt | 946 | 59,927 | 60,873 | 0 | 603 | 61,476 | |||||||
| Repayments of long-term debt | (7,099) | (33,233) | (40,332) | 355 | (824) | (40,801) | |||||||
| Issuances of common shares | 0 | 1,208 | 1,208 | 655 | (1,230) | 633 | |||||||
| Issuances of treasury shares | 0 | 155 | 155 | 10 | 12,736 | 12,901 | |||||||
| Repurchase of treasury shares | 0 | (222) | (222) | (216) | (13,120) | (13,558) | |||||||
| Dividends paid/capital repayments | (112) | (2,534) | (2,646) | (2,769) | 2,603 | (2,812) | |||||||
| Other, net | 371 | 3,190 | 3,561 | (46) | 170 | 3,685 | |||||||
| Net cash provided by/(used in) financing activities of continuing operations | (24,343) | (3,839) | (28,182) | (2,797) | 379 | (30,600) | |||||||
| Effect of exchange rate changes on cash and due from banks (CHF million) | |||||||||||||
| Effect of exchange rate changes on cash and due from banks | (427) | (1,694) | (2,121) | (8) | (424) | (2,553) | |||||||
| Net increase/(decrease) in cash and due from banks (CHF million) | |||||||||||||
| Net increase/(decrease) in cash and due from banks | 1,068 | (6,364) | (5,296) | 8 | (2,222) | (7,510) | |||||||
| Cash and due from banks at beginning of period | 3,118 | 33,186 | 36,304 | 7 | 2,148 | 38,459 | |||||||
| Cash and due from banks at end of period | 4,186 | 26,822 | 31,008 | 15 | (74) | 30,949 | |||||||
| 1 Includes eliminations and consolidation adjustments. | |||||||||||||
| Condensed consolidating statements of cash flows | |||||||||||||
in 6M07 | Credit Suisse (USA), Inc. | Other Credit Suisse subsidiaries | 1 | Credit Suisse (the Bank) | Credit Suisse Group parent company | Other Credit Suisse Group subsidiaries | 1 | Credit Suisse Group | |||||
| Operating activities of continuing operations (CHF million) | |||||||||||||
| Net cash provided by/(used in) operating activities of continuing operations | 12,209 | (51,573) | (39,364) | 6,154 | (10,787) | (43,997) | |||||||
| Investing activities of continuing operations (CHF million) | |||||||||||||
| (Increase)/decrease in interest-bearing deposits with banks | (16,880) | 17,950 | 1,070 | 1,047 | 3,394 | 5,511 | |||||||
| (Increase)/decrease in central bank funds sold, securities purchased under resale agreements and securities borrowing transactions | (32,145) | 12,407 | (19,738) | 0 | 157 | (19,581) | |||||||
| Purchase of investment securities | 0 | (28) | (28) | 0 | (253) | (281) | |||||||
| Proceeds from sale of investment securities | 0 | 511 | 511 | 0 | 20 | 531 | |||||||
| Maturities of investment securities | 0 | 2,473 | 2,473 | 0 | 174 | 2,647 | |||||||
| Investments in subsidiaries and other investments | (99) | (1,505) | (1,604) | (10,310) | 10,188 | (1,726) | |||||||
| Proceeds from sale of other investments | 537 | 347 | 884 | 0 | 11 | 895 | |||||||
| (Increase)/decrease in loans | (175) | (15,608) | (15,783) | 1,093 | (1,065) | (15,755) | |||||||
| Proceeds from sales of loans | 0 | 285 | 285 | 0 | 0 | 285 | |||||||
| Capital expenditures for premises and equipment and other intangible assets | (189) | (391) | (580) | 0 | (32) | (612) | |||||||
| Proceeds from sale of premises and equipment and other intangible assets | 0 | 11 | 11 | 0 | 0 | 11 | |||||||
| Other, net | (72) | 32 | (40) | 5 | 12 | (23) | |||||||
| Net cash provided by/(used in) investing activities of continuing operations | (49,023) | 16,484 | (32,539) | (8,165) | 12,606 | (28,098) | |||||||
| Financing activities of continuing operations (CHF million) | |||||||||||||
| Increase/(decrease) in due to banks and customer deposits | 856 | 66,217 | 67,073 | (539) | 3,305 | 69,839 | |||||||
| Increase/(decrease) in short-term borrowings | 25,352 | (20,216) | 5,136 | 0 | 951 | 6,087 | |||||||
| Increase/(decrease) in central bank funds purchased, securities sold under repurchase agreements and securities lending transactions | 18,251 | (15,519) | 2,732 | 0 | (99) | 2,633 | |||||||
| Issuances of long-term debt | 625 | 37,592 | 38,217 | 92 | 955 | 39,264 | |||||||
| Repayments of long-term debt | (4,502) | (28,993) | (33,495) | (1,000) | (285) | (34,780) | |||||||
| Issuance of trust preferred securities | 0 | 22 | 22 | 0 | (22) | 0 | |||||||
| Issuances of common shares | 0 | 0 | 0 | 43 | 1 | 44 | |||||||
| Issuances of treasury shares | 0 | 0 | 0 | 0 | 17,103 | 17,103 | |||||||
| Repurchase of treasury shares | 0 | (287) | (287) | (2,710) | (17,372) | (20,369) | |||||||
| Dividends paid/capital repayments | (132) | 204 | 72 | (2,586) | 24 | (2,490) | |||||||
| Other, net | (968) | 3,631 | 2,663 | (101) | (42) | 2,520 | |||||||
| Net cash provided by/(used in) financing activities of continuing operations | 39,482 | 42,651 | 82,133 | (6,801) | 4,519 | 79,851 | |||||||
| Effect of exchange rate changes on cash and due from banks (CHF million) | |||||||||||||
| Effect of exchange rate changes on cash and due from banks | 114 | (113) | 1 | (284) | 56 | (227) | |||||||
| Net increase/(decrease) in cash and due from banks (CHF million) | |||||||||||||
| Net increase/(decrease) in cash and due from banks | 2,782 | 7,449 | 10,231 | (9,096) | 6,394 | 7,529 | |||||||
| Cash and due from banks at beginning of period | 2,323 | 25,542 | 27,865 | 9,150 | (7,975) | 29,040 | |||||||
| Cash and due from banks at end of period | 5,105 | 32,991 | 38,096 | 54 | (1,581) | 36,569 | |||||||
| 1 Includes eliminations and consolidation adjustments. | |||||||||||||
| Note 23 Litigation |
| In accordance with SFAS No. 5, “Accounting for Contingencies”, the Group has litigation reserves for private litigation involving Enron, certain IPO allocation practices, research analyst independence and other related litigation of CHF 0.5 billion (USD 0.5 billion) as of June 30, 2008, after deductions for settlements. In the second quarter of 2008, the Group released CHF 0.4 billion of the reserve for these private litigation matters due to recent developments. |
| The Group is involved in a number of other judicial, regulatory and arbitration proceedings concerning matters arising in connection with the conduct of its businesses. Some of these actions have been brought on behalf of various classes of claimants and seek damages of material and/or indeterminate amounts. The Group believes, based on currently available information and advice of counsel, that the results of such proceedings, in the aggregate, will not have a material adverse effect on its financial condition but might be material to operating results for any particular period, depending, in part, upon the operating results for such period. In respect of each of the matters described above, each of which consists of a number of claims, it is the Group’s belief that the reasonably possible losses relating to such claims in excess of its provisions are either not material or not estimable. |
| It is inherently difficult to predict the outcome of many of these matters. In presenting the condensed consolidated financial statements, management makes estimates regarding the outcome of these matters, records a reserve and takes a charge to income when losses with respect to such matters are probable and can be reasonably estimated. Estimates, by their nature, are based on judgment and currently available information and involve a variety of factors, including, but not limited to, the type and nature of the litigation, claim or proceeding, the progress of the matter, the advice of legal counsel, the Group’s defenses and its experience in similar cases or proceedings, as well as its assessment of matters, including settlements, involving other defendants in similar or related cases or proceedings. |
| Further charges or releases of litigation reserves may be necessary in the future as developments in such litigation, claims or proceedings warrant. |
VI – Investor information |
Investor information |
Investor information |
| Share data | |||||||||
| in / end of | |||||||||
| 6M08 | 2007 | 2006 | 2005 | ||||||
| Share price (common shares, CHF) | |||||||||
| Average | 54.47 | 83.02 | 73.13 | 54.19 | |||||
| Minimum | 45.16 | 61.90 | 62.70 | 46.85 | |||||
| Maximum | 66.95 | 95.45 | 85.35 | 68.50 | |||||
| End of period | 46.90 | 68.10 | 85.25 | 67.00 | |||||
| Share price (American Depository Shares, USD) | |||||||||
| Average | 51.98 | 68.97 | 58.46 | 43.40 | |||||
| Minimum | 44.82 | 55.93 | 50.07 | 38.75 | |||||
| Maximum | 59.76 | 79.03 | 70.00 | 52.91 | |||||
| End of period | 45.31 | 60.10 | 69.85 | 50.95 | |||||
| Market capitalization | |||||||||
| Market capitalization (CHF million) | 52,740 | 56,251 | 86,576 | 81,847 | |||||
| Market capitalization (USD million) | 50,952 | 56,618 | 74,290 | 62,241 | |||||
| Dividend per share (CHF) | |||||||||
| Dividend per share paid | – | 2.50 | 2.24 | 2.00 | |||||
| Par value reduction | – | – | 0.46 | – | |||||
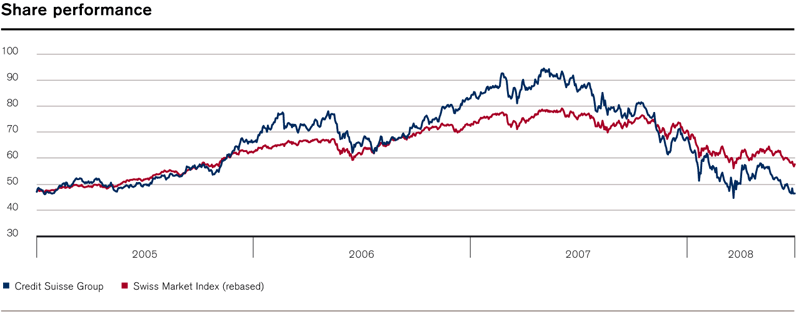 |
| Ticker symbols / stock exchange listings | |||||
| Common shares | ADS | 1 | |||
| Ticker symbols | |||||
| Bloomberg | CSGN VX | CS US | |||
| Reuters | CSGN.VX | CS.N | |||
| Telekurs | CSGN,380 | CS,065 | |||
| Stock exchange listings | |||||
| Swiss security number | 1213853 | 570660 | |||
| ISIN number | CH0012138530 | US2254011081 | |||
| CUSIP number | – | 225 401 108 | |||
| 1 One American Depositary Share (ADS) represents one common share. | |||||
| Bond ratings | |||||||
Moody's | Standard & Poor's | Fitch Ratings | |||||
| Credit Suisse Group ratings | |||||||
| Short-term | – | A-1 | F1+ | ||||
| Long-term | Aa2 | A+ | AA- | ||||
| Outlook | Stable | Negative | Stable | ||||
| Credit Suisse (the Bank) ratings | |||||||
| Short-term | P-1 | A-1+ | F1+ | ||||
| Long-term | Aa1 | AA- | AA- | ||||
| Outlook | Stable | Negative | Stable | ||||
| Financial calendar and information sources | |||
| Financial calendar | |||
| Third quarter 2008 results | Thursday, October 23, 2008 | ||
| Fourth quarter / full year 2008 results | Wednesday, February 11, 2009 | ||
| Investor relations | |||
| Phone | +41 44 333 71 49 | ||
| investor.relations@credit-suisse.com | |||
| Internet | www.credit-suisse.com/investors | ||
| Media relations | |||
| Phone | +41 844 33 88 44 | ||
| media.relations@credit-suisse.com | |||
| Internet | www.credit-suisse.com/news | ||
| Additional information | |||
| Results and financial information | www.credit-suisse.com/results | ||
| Printed copies | Credit Suisse | ||
| Procurement Non-IT Switzerland | |||
| RSCP 1 Publikationenversand | |||
| CH-8070 Zurich | |||
| Switzerland | |||
| US share register and transfer agent | |||
| ADS depositary institution | Deutsche Bank Trust Company Americas | ||
| Broker Service Desk | |||
| Address | Credit Suisse | ||
| c/o Mellon Investor Services | |||
| P.O. Box 3316 | |||
| So. Hackensack, NJ 07606 | |||
| United States | |||
| US and Canada phone (toll free) | +1 800 301 35 17 | ||
| Phone from outside US and Canada | +1 201 680 66 26 | ||
| shrrelations@mellon.com | |||
| Swiss share register and transfer agent | |||
| Address | Credit Suisse Group AG | ||
| Dept. GHBS | |||
| CH-8070 Zurich | |||
| Switzerland | |||
| Phone | +41 44 332 26 60 | ||
| Fax | +41 44 332 98 96 | ||
| Foreign currency translation rates | |||||||||||||||
| in / end of | % change | ||||||||||||||
| 2Q08 | 1Q08 | 4Q07 | 2Q07 | QoQ | Ytd | YoY | |||||||||
| Average rate | |||||||||||||||
| 1 USD / 1 CHF | 1.02 | 1.06 | 1.15 | 1.22 | (4) | (11) | (16) | ||||||||
| 1 EUR / 1 CHF | 1.60 | 1.60 | 1.66 | 1.64 | 0 | (4) | (2) | ||||||||
| 1 GBP / 1 CHF | 2.03 | 2.11 | 2.34 | 2.42 | (4) | (13) | (16) | ||||||||
| 100 JPY / 1 CHF | 0.99 | 1.01 | 1.01 | 1.01 | (2) | (2) | (2) | ||||||||
| Closing rate | |||||||||||||||
| 1 USD / 1 CHF | 1.02 | 0.99 | 1.13 | 1.23 | 3 | (10) | (17) | ||||||||
| 1 EUR / 1 CHF | 1.60 | 1.57 | 1.66 | 1.66 | 2 | (4) | (4) | ||||||||
| 1 GBP / 1 CHF | 2.03 | 1.97 | 2.25 | 2.46 | 3 | (10) | (17) | ||||||||
| 100 JPY / 1 CHF | 0.96 | 0.99 | 1.00 | 0.99 | (3) | (4) | (3) | ||||||||
| Cautionary statement regarding forward-looking information |
| This report contains statements that constitute forward-looking statements within the meaning of the Private Securities Litigation Reform Act. In addition, in the future we, and others on our behalf, may make statements that constitute forward-looking statements. Such forward-looking statements may include, without limitation, statements relating to the following: |
| – our plans, objectives or goals; |
| – our future economic performance or prospects; |
| – the potential effect on our future performance of certain contingencies; and |
| – assumptions underlying any such statements. |
| Words such as “believes,” “anticipates,” “expects,” “intends” and “plans” and similar expressions are intended to identify forward-looking statements but are not the exclusive means of identifying such statements. We do not intend to update these forward-looking statements except as may be required by applicable securities laws. |
| By their very nature, forward-looking statements involve inherent risks and uncertainties, both general and specific, and risks exist that predictions, forecasts, projections and other outcomes described or implied in forward-looking statements will not be achieved. We caution you that a number of important factors could cause results to differ materially from the plans, objectives, expectations, estimates and intentions expressed in such forward-looking statements. These factors include: |
| – the ability to maintain sufficient liquidity and access capital markets; |
| – market and interest rate fluctuations; |
| – the strength of the global economy in general and the strength of the economies of the countries in which we conduct our operations, in particular the risk of a continued US or global economic downturn in 2008 and beyond; |
| – the direct and indirect impacts of continuing deterioration of subprime and other real estate markets; |
| – further adverse rating actions by credit rating agencies in respect of structured credit products or other credit-related exposures or of monoline insurers; |
| – the ability of counterparties to meet their obligations to us; |
| – the effects of, and changes in, fiscal, monetary, trade and tax policies, and currency fluctuations; |
| – political and social developments, including war, civil unrest or terrorist activity; |
| – the possibility of foreign exchange controls, expropriation, nationalization or confiscation of assets in countries in which we conduct our operations; |
| – operational factors such as systems failure, human error, or the failure to implement procedures properly; |
| – actions taken by regulators with respect to our business and practices in one or more of the countries in which we conduct our operations; |
| – the effects of changes in laws, regulations or accounting policies or practices; |
| – competition in geographic and business areas in which we conduct our operations; |
| – the ability to retain and recruit qualified personnel; |
| – the ability to maintain our reputation and promote our brand; |
| – the ability to increase market share and control expenses; |
| – technological changes; |
| – the timely development and acceptance of our new products and services and the perceived overall value of these products and services by users; |
| – acquisitions, including the ability to integrate acquired businesses successfully, and divestitures, including the ability to sell non-core assets; |
| – the adverse resolution of litigation and other contingencies; and |
| – our success at managing the risks involved in the foregoing. |
| |
| We caution you that the foregoing list of important factors is not exclusive. When evaluating forward-looking statements, you should carefully consider the foregoing factors and other uncertainties and events, as well as the information set forth in our Form 20-F Item 3 – Key Information – Risk Factors. |
 |
| Design: www.arnold.inhaltundform.com |
| Production: Management Digital Data AG, Zurich |
| Printer: NZZ Fretz AG, Zurich |
 |
| For a detailed presentation of Credit Suisse Group’s financial statements 2007, its company structure, risk management, corporate governance and an in-depth review of its operating and financial results, please refer to theAnnual Report 2007. For a summary of our performance during the business year and a close look at innovation through examples from various areas of the bank, refer to ourBusiness Review 2007. For information on how the Bank assumes its responsibilities when conducting its business activities, including its commitments toward the environment and various stakeholders within society, refer to theCorporate Citizenship Report 2007. |
 |