UNITED STATES
SECURITIES AND EXCHANGE COMMISSION
SECURITIES AND EXCHANGE COMMISSION
Washington, D.C. 20549
Form 6-K
REPORT OF FOREIGN PRIVATE ISSUER PURSUANT TO RULE 13a-16 OR 15d-16
UNDER THE SECURITIES EXCHANGE ACT OF 1934
UNDER THE SECURITIES EXCHANGE ACT OF 1934
October 30, 2019
Commission File Number 001-15244
CREDIT SUISSE GROUP AG
(Translation of registrant’s name into English)
Paradeplatz 8, CH 8001 Zurich, Switzerland
(Address of principal executive office)
(Address of principal executive office)
Commission File Number 001-33434
CREDIT SUISSE AG
(Translation of registrant’s name into English)
Paradeplatz 8, CH 8001 Zurich, Switzerland
(Address of principal executive office)
(Address of principal executive office)
Indicate by check mark whether the registrant files or will file annual reports under cover of Form 20-F or
Form 40-F.
Form 40-F.
Form 20-F  Form 40-F
Form 40-F Indicate by check mark if the registrant is submitting the Form 6-K in paper as permitted by Regulation S-T Rule 101(b)(1):
Note: Regulation S-T Rule 101(b)(1) only permits the submission in paper of a Form 6-K if submitted solely to provide an attached annual report to security holders.
Indicate by check mark if the registrant is submitting the Form 6-K in paper as permitted by Regulation S-T Rule 101(b)(7):
Note: Regulation S-T Rule 101(b)(7) only permits the submission in paper of a Form 6-K if submitted to furnish a report or other document that the registrant foreign private issuer must furnish and make public under the laws of the jurisdiction in which the registrant is incorporated, domiciled or legally organized (the registrant’s “home country”), or under the rules of the home country exchange on which the registrant’s securities are traded, as long as the report or other document is not a press release, is not required to be and has not been distributed to the registrant’s security holders, and, if discussing a material event, has already been the subject of a Form 6-K submission or other Commission filing on EDGAR.
This report includes the media release and the slides for the presentation to investors in connection with the 3Q19 results.
Media Release Zurich, October 30, 2019 |  |
3Q19 financial results
Continued year on year improvement in returns:
Pre-tax income of CHF 1.1 billion, up 70%, and net income1 of CHF 881 million, up 108% year on year; Record Net New Assets of CHF 72 billion year to date; Group Return on Tangible Equity of 9%; Global Markets revenues up 34% year on year
Highlights
| § | Group pre-tax income of CHF 1.1 billion in 3Q19, up 70% year on year; Group net income1 of CHF 881 million, up 108% year on year |
| § | Group Return on Tangible Equity (RoTE) of 9% in 3Q19, up from 4.5% in 3Q18; includes gain on InvestLab transfer partially offset by accounting volatility from structured notes |
| § | Tangible book value per share of CHF 16.24; tangible book value increased by CHF 1.2 billion in 9M19 |
| § | Record CHF 72 billion of Net New Assets (NNA) across the Group for 9M19, including CHF 12.8 billion of NNA in 3Q19 |
| § | Delivering growth in a challenging market environment; Wealth Management businesses2 generated 12% increase in transaction and performance-based revenues in 3Q19, stable net interest income and recurring commissions & fees compared to 3Q18 |
| § | Asset Management revenues up 12% in 3Q19 with 11th consecutive quarter of year on year management fee growth |
| § | Global Investment Banking franchise3 revenues up 8% on a US dollar basis compared to 3Q18 |
| § | Global Markets revenues up 34% year on year at USD 1.43 billion, with pre-tax income of USD 272 million; Fixed Income sales and trading up 72% and Equity sales and trading up 11% year on year on a US dollar basis |
| § | Global Advisory and Underwriting revenues4 down 18% year on year on a US dollar basis |
| § | Continued strong capital position |
| § | Tier 1 leverage ratio of 5.5% compared to 5.1% in 3Q18 |
| § | CET1 capital of CHF 37.4 billion, up by CHF 1.8 billion or 5% from 3Q18 |
| § | CET1 ratio of 12.6%5 (12.4% post recalibration) |
| § | CHF 1.4 billion of total capital returned to shareholders year to date6 through the share buyback programme (CHF 695 million) and dividends (CHF 695 million) |
Tidjane Thiam, Chief Executive Officer of Credit Suisse, commented:
“During the third quarter of 2019, we continued to implement our strategy of being a leading wealth manager with strong investment banking capabilities. We have continued, in a challenging environment, to grow our wealth management franchises, increasing our revenues and gathering record net new assets of CHF 72 billion across the Group year to date. Our Global Investment Banking3 revenues, across markets and advisory, underwriting and financing activities, have also grown strongly, up 8% year
Page 1
Media Release Zurich, October 30, 2019 | |
on year. Overall, we are reporting our 12th consecutive quarter of year on year positive operating leverage and profit growth.
We have continued to invest in our Impact Advisory and Finance activities, as we believe this is an area with large, positive effects globally and in which our clients are increasingly interested. We intend for this to become a growing part of our activities.
We believe that we are well positioned to achieve further profitable growth, with clients benefitting from our integrated approach as we work with them to provide solutions addressing both their asset and their liability requirements. Helping our clients achieve their objectives ultimately ensures that we create value for our shareholders.”
Outlook
As we head into the final quarter of 2019, we expect to see the usual seasonal slowdown as a result of the holiday season in many parts of the world. We also expect headwinds from the ongoing challenging geopolitical environment, most notably the US-China trade dispute and Brexit, to persist. This is likely to lead to more cautious capital expenditure and investment decisions, specifically looking forward to 2020 and 2021.
That said, we believe that the long-term outlook remains attractive in wealth management, as indicated by the findings of our latest Global Wealth Report7, and through our integrated approach, we expect to capitalise on these trends. Since 2016, we have significantly de-risked the bank and lowered the cost base, and we believe we are well positioned to outperform on a relative basis.
Key metrics
| In CHF millions | 3Q19 | 2Q19 | 3Q18 | Δ 2Q19 | Δ 3Q18 | |
| Net revenues | 5,326 | 5,581 | 4,888 | -5% | 9% | |
| Pre-tax income | 1,142 | 1,302 | 671 | -12% | 70% | |
| Net income attributable to shareholders | 881 | 937 | 424 | -6% | 108% | |
| Return on Tangible Equity | 9.0% | 9.7% | 4.5% | -0.7pp | 4.5pp |
Key metrics excluding revenue gain of CHF 327 million on transfer of Credit Suisse InvestLab:
| In CHF millions | 3Q19 | 2Q19 | 3Q18 | Δ 2Q19 | Δ 3Q18 | |
| Net revenues | 4,999 | 5,581 | 4,888 | -10% | 2% | |
| Pre-tax income | 815 | 1,302 | 671 | -37% | 21% |
Page 2
Media Release Zurich, October 30, 2019 | |
Detailed divisional summaries
Swiss Universal Bank (SUB) reported a solid third quarter in 2019 with pre-tax income of CHF 607 million, an increase of 19% year on year. Net revenues rose 6%, reflecting the transfer of the InvestLab fund platform to Allfunds Group8, which generated CHF 98 million in gains for Corporate & Institutional Clients (C&IC). Excluding the gain from the InvestLab transfer, net revenues would have been CHF 1.3 billion, down 2% year on year, while pre-tax income would have been CHF 509 million, stable year on year. While the negative interest rate environment remains challenging, increased client activity and solid revenue generation from our collaboration with Global Markets and International Wealth Management –International Trading Solutions (ITS) – provided further support to our revenue performance. Total operating expenses were down 2% year on year; continued efficiency gains helped fund growth investments in technology and selected hires. The cost/income ratio at the end of the third quarter was 55%.
As announced in August, in response to the changing market environment, we are launching the next phase in the execution of our strategy for SUB and shifting from asset-based client segmentation to a needs-based coverage operating model. The new business area, Direct Banking9, will optimally combine digital solutions with personal advice and serve retail, as well as small commercial clients, who primarily use core banking products. With this high-tech client segment, we aim to continuously improve our digital adoption rate through enhanced product offerings and digital interaction with clients.
Private Clients reported pre-tax income of CHF 251 million in the third quarter of 2019, up 1% year on year. Operating expenses were down 4%, reflecting continued discipline on costs, with further investments in digital solutions. Net revenues were slightly lower, down 2% year on year, despite increased client activity in the third quarter of 2019, mainly reflecting a one-time gain from a real estate sale in 3Q18. Quarterly NNA were negative CHF 0.6 billion, with a disciplined approach to protect profitability in a sustained negative interest rate environment. In September, we informed our Private Banking clients that we intend to start charging negative interest rates on cash holdings in excess of CHF 2 million due to the continued negative interest rate environment. NNA remained positive for the first nine months of the year at CHF 3.9 billion, an annualised growth rate of 3%, in line with our mid-term ambition to grow at above market levels.
C&IC generated pre-tax income of CHF 356 million, up 36% year on year, driven by the transfer of the InvestLab fund platform to Allfunds Group. Excluding the gain, pre-tax income would have been CHF 258 million, down 2% year on year. Net revenues for C&IC, including the gain made from the InvestLab transfer, were CHF 702 million, up 15% year on year; excluding the gain, net revenues would have been down 1% at CHF 604 million. Our transaction-based revenues increased slightly year on year, with higher revenues from ITS, and net interest income and recurring commissions and fees were down, 2% and 4%, respectively. We gathered NNA of CHF 6.3 billion in the quarter, confirming the continued momentum in our pension funds business.
International Wealth Management (IWM) delivered continued strong growth momentum in the third quarter of 2019. Pre-tax income increased 43% year on year to CHF 539 million, reflecting a 15% increase in net revenues and a 4% increase in operating expenses. These results include a gain of CHF 131 million on the transfer of the InvestLab fund platform to Allfunds Group, which was recorded in Private Banking. Excluding this gain, pre-tax income would have been CHF 408 million, up 8% year on year, and net revenues would have been up 5% year on year. Asset gathering remained solid with NNA
Page 3
Media Release Zurich, October 30, 2019 | |
of CHF 9.5 billion for the third quarter. Additionally, IWM’s return on regulatory capital was 34% for the third quarter of 2019.
Private Banking’s pre-tax income for the third quarter increased 49% year on year to CHF 428 million. Net revenues rose 17% to CHF 1.07 billion, including the gain on the InvestLab transfer. Excluding this gain, pre-tax income would have been CHF 297 million, an increase of 3% on 2% growth in net revenues. Net revenue growth, excluding the gain, was driven by a particularly strong increase in transaction and performance-based revenues. Recurring revenues remained stable year on year and net interest income proved resilient, with loan growth offsetting pressure from the negative interest rate environment. Operating expenses in the quarter increased 2% year on year. They decreased by 1% for the first nine months of the year, during which we made targeted investments in client coverage, hiring a number of high-quality relationship managers. NNA stood at CHF 3.6 billion for the quarter, and at CHF 10.4 billion for the first nine months of 2019, an annualised growth rate of 4%.
Asset Management’s pre-tax income in the third quarter increased 22% year on year to CHF 111 million. Net revenues rose 12% on significantly higher performance and placement revenues and higher management fees, partly offset by a decline in investment and partnership income. Higher performance fees were supported by a gain on the sale of a private equity investment of a fund, and related compensation expenses were a driver of higher operating expenses year on year. NNA for the third quarter totalled CHF 5.9 billion, and CHF 14.0 billion in the first nine months of the year, driven by inflows in Fixed Income, Index Solutions, Credit and Real Estate products.
Asia Pacific (APAC) pre-tax income rose 40% year on year in the third quarter of 2019, to CHF 247 million, driven by higher revenues of CHF 886 million, up 9% year on year. These results were supported by stronger performance in our Private Banking business within Wealth Management & Connected (WM&C) and were largely driven by a gain of CHF 98 million from the InvestLab transfer. Excluding that gain, pre-tax income would have been down 15% year on year at CHF 149 million and net revenues would have been down 3% at CHF 788 million. Strong Private Banking revenues were partially offset by lower revenues in our Markets and advisory, financing and underwriting businesses, as economic uncertainty and geopolitical risks continued to weigh on market sentiment. APAC delivered a return on regulatory capital of 17% for the third quarter.
Excluding the InvestLab gain, WM&C’s net revenues would have been CHF 575 million, up 3% year on year, and pre-tax income would have been CHF 183 million, up 2%. Private Banking revenues, excluding the gain on the InvestLab transfer, were up 13% year on year. We achieved record AuM of CHF 222 billion and generated NNA of CHF 2.6 billion in the quarter. Advisory, underwriting, and financing revenues for the quarter were down 18% year on year, performing better than the Street10 which was down 24%, reflecting significantly lower M&A and equity underwriting activities across the industry. In the first nine months of the year, APAC advisory, underwriting and financing ranked number 210 in terms of share of wallet.
Markets reported a pre-tax loss of USD 34 million in the third quarter of 2019, compared to a pre-tax loss of USD 4 million in the same quarter of last year. Net revenues were down 17% year on year, impacted by challenging conditions and continued weakness in emerging markets. Operating expenses were down 2% year on year for the quarter. We continue to drive further strategic alignment in our Asia Trading Solutions business, with synergies in structured product capabilities and distribution, increased focus on UHNW clients, and platform initiatives.
Page 4
Media Release Zurich, October 30, 2019 | |
Investment Banking & Capital Markets (IBCM) reported a pre-tax loss of USD 16 million for the third quarter of 2019, compared to pre-tax income of USD 72 million in the third quarter of 2018. Net revenues, of USD 428 million, were down 21% year on year, reflecting fewer M&A completions as well as reduced levels of IPOs and leveraged finance client activity. Performance was impacted by continued challenging market conditions characterised by volatility and macroeconomic uncertainty. Net revenues were down 6% compared to the second quarter of 2019, in line with the Street11. Operating expenses of USD 432 million were down 8% year on year, driven by lower variable compensation and the completion of our restructuring programme.
Advisory revenues for the third quarter were down 28% year on year at USD 175 million, reflecting lower revenues from completed M&A transactions. However, revenues were up 10% compared to the second quarter, in line with the Street11.
Equity underwriting revenues were down 20% year on year at USD 74 million for the quarter, reflecting lower IPO issuance and follow-on client activity. Revenues decreased 33% compared to the second quarter, which had more IPO issuance activity, and were down more than the Street11.
Debt underwriting revenues were down 11% year on year at USD 204 million, primarily due to lower leveraged finance revenues, partially offset by higher investment grade issuance activity. Revenues were down 3% compared to the second quarter, in line with the Street11.
Our total global advisory and underwriting revenues12 for the third quarter of 2019 were USD 841 million, down 18% year on year due to lower client activity. Revenues were down 9% compared to the second quarter, down slightly more than the Street, which saw revenues decline by 6%13.
Global Markets (GM) delivered pre-tax income of USD 272 million in the third quarter, up substantially compared to the third quarter of 2018. Our diversified client franchise delivered higher revenues year on year and a second consecutive quarter of positive operating leverage, including a return on regulatory capital of 8% for the quarter.
Net revenues of USD 1.43 billion for the quarter increased by 34% compared to the third quarter of 2018, due to a marked increase in trading results, which more than offset reduced debt and equity underwriting.
Fixed income sales and trading revenues of USD 903 million increased 72% year on year, reflecting robust revenue growth across most businesses and sustained leading market shares.14
Equities sales and trading revenues of USD 424 million increased 11% year on year, with higher trading activity in prime services and equity derivatives as a result of increased market volatility.
Underwriting revenues of USD 211 million decreased 23% year on year, reflecting lower industry-wide issuance activity across equity and debt, including lower industry-wide leveraged finance issuance activity.
We continue to see strong momentum in our ITS business, which benefitted from collaboration with IWM and SUB to serve our wealth management and institutional clients.
Total operating expenses and capital usage were stable year on year, with leverage exposure of USD 261 billion and risk-weighted assets of USD 61 billion.
Page 5
Media Release Zurich, October 30, 2019 | |
Impact Advisory and Finance
In September, Credit Suisse Asset Management announced its intention to integrate Environmental, Social and Governance (ESG) factors into its investment process; initially with 30 actively managed investment funds representing CHF 20 billion of assets. That sum is expected to grow to more than CHF 100 billion of assets under management by 202015. This repositioning will fulfil ESG criteria as defined by the Credit Suisse Sustainable Investing Framework, constructed with guidance from the Impact Advisory and Finance Department.
The same month also saw the launch of a partnership with the Climate Bonds Initiative for leveraging the global capital markets to accelerate the corporate sustainable transition to a low-carbon economy. The objective is to promote a ‘sustainable transition bond’ market, which ultimately could experience the level of growth the green bond market has seen in recent years as both investors and issuers look to contribute to the fight against climate change.
Sustainability and Corporate Citizenship
In the third quarter, Credit Suisse became a founding signatory to the Principles for Responsible Banking of the UN Environment Programme Finance Initiative, which specify the role and the responsibilities of the banking sector in the development of a sustainable future.
At the same time, Credit Suisse continued to expand its own role in supporting the transition to a low-carbon and climate-resilient economy. We introduced a Group-wide Climate Risk Strategy with a three-pronged approach. Firstly, we aim to work with our clients to support their transition to low-carbon and climate-resilient business models, and further integrate climate change into our risk management models. Secondly, we endeavour to focus on delivering sustainable finance solutions that help our clients achieve their goals and make a contribution to the realisation of the UN Sustainable Development Goals; and thirdly, we aim to reduce the carbon footprint of our own operations.
Reflecting our commitment to operating responsibly, Credit Suisse was selected as an index component of the Dow Jones Sustainability Index in September for the 20th consecutive year.
Page 6
Media Release Zurich, October 30, 2019 | |
Contact details
Adam Gishen, Investor Relations, Credit Suisse Tel: +41 44 333 71 49 Email: investor.relations@credit-suisse.com |
James Quinn, Corporate Communications, Credit Suisse Tel: +41 844 33 88 44 E-mail: media.relations@credit-suisse.com |
The Financial Report and Presentation Slides for the third quarter 2019 are available to download from 7:00 CET today at: https://www.credit-suisse.com/results |
Presentation of 3Q19 results – Wednesday, October 30, 2019
| Event | Analyst Call | Media Call |
| Time | 08:15 Zurich 07:15 London 03:15 New York | 10:15 Zurich 09:15 London 05:15 New York |
| Language | English | English |
| Access | Switzerland: +41 44 580 48 67 Europe: +44 203 057 6528 US: +1 866 276 89 33 Reference: Credit Suisse analyst call Conference ID: 5857677 Please dial in 10 minutes before the start of the call | Switzerland: +41 44 580 48 67 Europe: +44 203 057 6528 US: +1 866 276 89 33 Reference: Credit Suisse media call Conference ID: 3588684 Please dial in 10 minutes before the start of the call |
| Q&A Session | Following the presentation, you will have the opportunity to ask the speakers questions | Following the presentation, you will have the opportunity to ask the speakers questions |
| Playback | Replay available approximately one hour after the event Switzerland: +41 44 580 40 26 Europe: +44 333 300 9785 US: +1 917 677 7532 Conference ID: 5857677 | Replay available approximately one hour after the event Switzerland: +41 44 580 40 26 Europe: +44 333 300 9785 US: +1 917 677 7532 Conference ID: 3588684 |
Page 7
Media Release Zurich, October 30, 2019 | |
Footnotes
1 Net income attributable to shareholders
2 Relating to the combined revenue results of SUB, IWM and APAC PB within WM&C
3 Includes Global Markets, Investment Banking and Capital Markets as well as APAC Markets and APAC Advisory, Underwriting and Financing within Wealth Management & Connected; APAC Advisory, Underwriting and Financing revenues converted to USD at quarter-end average rates
4 Gross global revenues from advisory, debt and equity underwriting generated across all divisions
5 Excludes impact of CHF 6 billion RWA uplift due to a change in the time period applied in the capital calculations resulting from the redemption of certain legacy SRU eurozone exposures
6 As of October 29, 2019
7 As announced: Media Release, Global Wealth Report 2019, October 21, 2019
8 As announced: Media Release, Credit Suisse announces the closing of the transfer of its third party investment fund platform Credit Suisse InvestLab to Allfunds, September 6, 2019
9 As announced: Media Release, Credit Suisse in Switzerland launches next phase in execution of strategy: Focusing of business areas and investments in growth, August 26, 2019
10 Source: Dealogic (APAC excluding Japan and excluding onshore China) for the period ending September 30, 2019
11 Source: Dealogic for the period ending September 30, 2019 (Americas and EMEA only)
12 Gross global revenues from advisory, debt and equity underwriting generated across all divisions
13 Source: Dealogic for the period ending September 30, 2019 (Global)
14 Ranked #1 for Asset Finance for 9M19; source: Thomson Reuters, ranked #3 for Leveraged Finance Capital Markets for 9M19, source: Dealogic
15 As announced: Media Release, Credit Suisse Asset Management migrates ESG across its product range, targeting CHF 100 billion of ESG assets under management by the end of 2020, September 27, 2019
Abbreviations
APAC – Asia Pacific; AuM – assets under management; CHF – Swiss francs; CET1 – common equity tier 1; C&IC – Corporate & Institutional Clients; EMEA – Europe, Middle East and Africa; ESG – Environmental, Social and Governance; FINMA – Swiss Financial Market Supervisory Authority; GAAP – Generally accepted accounting principles; GM – Global Markets; IBCM – Investment Banking & Capital Markets; IPO – initial public offering; ITS – International Trading Solutions; IWM – International Wealth Management; M&A – mergers and acquisitions; NNA – net new assets; PB – Private Banking; PC – Private Clients; RoTE – Return on Tangible Equity; RWA – risk weighted assets; SUB – Swiss Universal Bank; UHNW – ultra-high-net-worth; UN – United Nations; USD – US dollar; WM&C – Wealth Management & Connected
Important information
This document contains select information from the full 3Q19 Financial Report and 3Q19 Results Presentation slides that Credit Suisse believes is of particular interest to media professionals. The complete 3Q19 Financial Report and 3Q19 Results Presentation slides, which have been distributed simultaneously, contain more comprehensive information about our results and operations for the reporting quarter, as well as important information about our reporting methodology and some of the terms used in these documents. The complete 3Q19 Financial Report and 3Q19 Results Presentation slides are not incorporated by reference into this document.
We may not achieve all of the expected benefits of our strategic initiatives. Factors beyond our control, including but not limited to the market and economic conditions, changes in laws, rules or regulations and other challenges discussed in our public filings, could limit our ability to achieve some or all of the expected benefits of these initiatives.
In particular, the terms “Estimate”, “Illustrative”, “Ambition”, “Objective”, “Outlook” and “Goal” are not intended to be viewed as targets or projections, nor are they considered to be Key Performance Indicators. All such estimates, illustrations, ambitions, objectives, outlooks and goals are subject to a large number of inherent risks, assumptions and uncertainties, many of which are completely outside of our control. These risks, assumptions and uncertainties include, but are not limited to, general market conditions, market volatility, interest rate volatility and levels, global and regional economic conditions, political uncertainty, changes in tax policies, regulatory changes, changes in levels of client activity as a result of any of the foregoing and other factors. Accordingly, this information should not be relied on for any purpose. We do not intend to update these estimates, illustrations, ambitions, objectives, outlooks or goals.
In preparing this document, management has made estimates and assumptions that affect the numbers presented. Actual results may differ. Annualised numbers do not take into account variations in operating results, seasonality and other factors and may not be indicative of actual, full-year results. Figures throughout this document may also be subject to rounding adjustments. All opinions and views constitute judgments as of the date of writing without regard to the date on which the reader may receive or access the information. This information is subject to change at any time without notice and we do not intend to update this information.
Page 8
Media Release Zurich, October 30, 2019 | |
Return on tangible equity is based on tangible shareholders’ equity, a non-GAAP financial measure, which is calculated by deducting goodwill and other intangible assets from total shareholders’ equity as presented in our balance sheet. Tangible book value, a non-GAAP financial measure, is equal to tangible shareholders' equity. Tangible book value per share is a non-GAAP financial measure, which is calculated by dividing tangible shareholders' equity by total number of shares outstanding. Management believes that tangible shareholders' equity/tangible book value, return on tangible equity and tangible book value per share are meaningful as they are measures used and relied upon by industry analysts and investors to assess valuations and capital adequacy. For end-3Q19, tangible shareholders’ equity excluded goodwill of CHF 4,760 million and other intangible assets of CHF 219 million from total shareholders’ equity of CHF 45,150 million as presented in our balance sheet. For end-2Q19, tangible shareholders’ equity excluded goodwill of CHF 4,731 million and other intangible assets of CHF 216 million from total shareholders’ equity of CHF 43,673 million as presented in our balance sheet. For end-4Q18, tangible equity excluded goodwill of CHF 4,766 million and other intangible assets of CHF 219 million from total shareholders’ equity of CHF 43,922 million as presented in our balance sheet. For end-3Q18, tangible shareholders’ equity excluded goodwill of CHF 4,736 million and other intangible assets of CHF 214 million from total shareholders’ equity of CHF 42,734 million as presented in our balance sheet. Shares outstanding were 2,473.8 million at end-3Q19.
Regulatory capital is calculated as the worst of 10% of RWA and 3.5% of leverage exposure. Return on regulatory capital (a non-GAAP financial measure) is calculated using income / (loss) after tax and assumes a tax rate of 30% and capital allocated based on the worst of 10% of average RWA and 3.5% of average leverage exposure. For the Markets business within the APAC division and for the Global Markets and Investment Banking & Capital Markets divisions, return on regulatory capital is based on US dollar denominated numbers. Adjusted return on regulatory capital is calculated using adjusted results, applying the same methodology to calculate return on regulatory capital.
Credit Suisse is subject to the Basel III framework, as implemented in Switzerland, as well as Swiss legislation and regulations for systemically important banks (Swiss Requirements), which include capital, liquidity, leverage and large exposure requirements and rules for emergency plans designed to maintain systemically relevant functions in the event of threatened insolvency. Credit Suisse has adopted the Bank for International Settlements (BIS) leverage ratio framework, as issued by the Basel Committee on Banking Supervision (BCBS) and implemented in Switzerland by the Swiss Financial Market Supervisory Authority FINMA (FINMA).
References to phase-in and look-through included herein refer to Basel III capital requirements and Swiss Requirements. Phase-in reflects that, for the years 2014-2018, there was a five-year (20% per annum) phase-in of goodwill, other intangible assets and other capital deductions (e.g., certain deferred tax assets) and a phase-out of an adjustment for the accounting treatment of pension plans. For the years 2013-2022, there is a phase-out of certain capital instruments. Look-through assumes the full phase-in of goodwill and other intangible assets and other regulatory adjustments and the phase-out of certain capital instruments.
Unless otherwise noted, all CET1 ratio, Tier-1 leverage ratio, risk-weighted assets and leverage exposure figures in this document are as of the end of the respective period and on a “look-through” basis.
Unless otherwise noted, leverage exposure is based on the BIS leverage ratio framework and consists of period-end balance sheet assets and prescribed regulatory adjustments. The look-through tier 1 leverage ratio and CET1 leverage ratio are calculated as look-through BIS tier 1 capital and CET1 capital, respectively, divided by period end leverage exposure. Swiss leverage ratios are measured on the same period-end basis as the leverage exposure for the BIS leverage ratio.
Generic references to profit and costs in this document refer to pre-tax income and operating expenses, respectively. References to global advisory and underwriting include global revenues from advisory, debt and equity underwriting generated across all divisions.
Investors and others should note that we announce material information (including quarterly earnings releases and financial reports) to the investing public using press releases, SEC and Swiss ad hoc filings, our website and public conference calls and webcasts. We intend to also use our Twitter account @creditsuisse (https://twitter.com/creditsuisse) to excerpt key messages from our public disclosures, including earnings releases. We may retweet such messages through certain of our regional Twitter accounts, including @csschweiz (https://twitter.com/csschweiz) and @csapac (https://twitter.com/csapac). Investors and others should take care to consider such abbreviated messages in the context of the disclosures from which they are excerpted. The information we post on these Twitter accounts is not a part of this document.
Information referenced in this document, whether via website links or otherwise, is not incorporated into this document.
Certain material in this document has been prepared by Credit Suisse on the basis of publicly available information, internally developed data and other third-party sources believed to be reliable. Credit Suisse has not sought to independently verify information obtained from public and third-party sources and makes no representations or warranties as to accuracy, completeness or reliability of such information.
In various tables, use of “–” indicates not meaningful or not applicable.
Page 9
| Key metrics | |||||||||||||||||
| in / end of | % change | in / end of | % change | ||||||||||||||
| 3Q19 | 2Q19 | 3Q18 | QoQ | YoY | 9M19 | 9M18 | YoY | ||||||||||
| Credit Suisse Group results (CHF million) | |||||||||||||||||
| Net revenues | 5,326 | 5,581 | 4,888 | (5) | 9 | 16,294 | 16,119 | 1 | |||||||||
| Provision for credit losses | 72 | 25 | 65 | 188 | 11 | 178 | 186 | (4) | |||||||||
| Compensation and benefits | 2,383 | 2,545 | 2,394 | (6) | 0 | 7,446 | 7,479 | 0 | |||||||||
| General and administrative expenses | 1,404 | 1,395 | 1,301 | 1 | 8 | 4,212 | 4,229 | 0 | |||||||||
| Commission expenses | 325 | 314 | 286 | 4 | 14 | 952 | 958 | (1) | |||||||||
| Restructuring expenses | – | – | 171 | – | – | – | 490 | – | |||||||||
| Total other operating expenses | 1,729 | 1,709 | 1,758 | 1 | (2) | 5,164 | 5,677 | (9) | |||||||||
| Total operating expenses | 4,112 | 4,254 | 4,152 | (3) | (1) | 12,610 | 13,156 | (4) | |||||||||
| Income before taxes | 1,142 | 1,302 | 671 | (12) | 70 | 3,506 | 2,777 | 26 | |||||||||
| Net income attributable to shareholders | 881 | 937 | 424 | (6) | 108 | 2,567 | 1,765 | 45 | |||||||||
| Statement of operations metrics (%) | |||||||||||||||||
| Return on regulatory capital | 10.0 | 11.6 | 6.0 | – | – | 10.4 | 8.1 | – | |||||||||
| Balance sheet statistics (CHF million) | |||||||||||||||||
| Total assets | 795,920 | 784,216 | 768,544 | 1 | 4 | 795,920 | 768,544 | 4 | |||||||||
| Risk-weighted assets | 302,121 | 290,798 | 276,607 | 4 | 9 | 302,121 | 276,607 | 9 | |||||||||
| Leverage exposure | 921,411 | 897,916 | 884,952 | 3 | 4 | 921,411 | 884,952 | 4 | |||||||||
| Assets under management and net new assets (CHF billion) | |||||||||||||||||
| Assets under management | 1,482.2 | 1,459.9 | 1,404.7 | 1.5 | 5.5 | 1,482.2 | 1,404.7 | 5.5 | |||||||||
| Net new assets | 12.8 | 23.2 | 15.7 | (44.8) | (18.5) | 71.8 | 56.0 | 28.2 | |||||||||
| Basel III regulatory capital and leverage statistics (%) | |||||||||||||||||
| CET1 ratio | 12.4 | 12.5 | 12.9 | – | – | 12.4 | 12.9 | – | |||||||||
| CET1 leverage ratio | 4.1 | 4.1 | 4.0 | – | – | 4.1 | 4.0 | – | |||||||||
| Look-through tier 1 leverage ratio | 5.5 | 5.3 | 5.1 | – | – | 5.5 | 5.1 | – | |||||||||
A-1
| Swiss Universal Bank | |||||||||||||||||
| in / end of | % change | in / end of | % change | ||||||||||||||
| 3Q19 | 2Q19 | 3Q18 | QoQ | YoY | 9M19 | 9M18 | YoY | ||||||||||
| Results (CHF million) | |||||||||||||||||
| Net revenues | 1,417 | 1,476 | 1,341 | (4) | 6 | 4,272 | 4,191 | 2 | |||||||||
| of which Private Clients | 715 | 828 | 730 | (14) | (2) | 2,285 | 2,249 | 2 | |||||||||
| of which Corporate & Institutional Clients | 702 | 648 | 611 | 8 | 15 | 1,987 | 1,942 | 2 | |||||||||
| Provision for credit losses | 28 | 10 | 31 | 180 | (10) | 67 | 100 | (33) | |||||||||
| Total operating expenses | 782 | 812 | 799 | (4) | (2) | 2,394 | 2,464 | (3) | |||||||||
| Income before taxes | 607 | 654 | 511 | (7) | 19 | 1,811 | 1,627 | 11 | |||||||||
| of which Private Clients | 251 | 356 | 249 | (29) | 1 | 880 | 782 | 13 | |||||||||
| of which Corporate & Institutional Clients | 356 | 298 | 262 | 19 | 36 | 931 | 845 | 10 | |||||||||
| Metrics (%) | |||||||||||||||||
| Return on regulatory capital | 18.5 | 20.1 | 16.2 | – | – | 18.6 | 17.2 | – | |||||||||
| Cost/income ratio | 55.2 | 55.0 | 59.6 | – | – | 56.0 | 58.8 | – | |||||||||
| Private Clients | |||||||||||||||||
| Assets under management (CHF billion) | 214.2 | 214.7 | 209.3 | (0.2) | 2.3 | 214.2 | 209.3 | 2.3 | |||||||||
| Net new assets (CHF billion) | (0.6) | 1.2 | 0.9 | – | – | 3.9 | 4.1 | – | |||||||||
| Gross margin (annualized) (bp) | 133 | 156 | 139 | – | – | 144 | 144 | – | |||||||||
| Net margin (annualized) (bp) | 47 | 67 | 48 | – | – | 55 | 50 | – | |||||||||
| Corporate & Institutional Clients | |||||||||||||||||
| Assets under management (CHF billion) | 424.6 | 410.7 | 360.2 | 3.4 | 17.9 | 424.6 | 360.2 | 17.9 | |||||||||
| Net new assets (CHF billion) | 6.3 | 8.9 | 1.8 | – | – | 42.8 | 6.5 | – | |||||||||
| International Wealth Management | |||||||||||||||||
| in / end of | % change | in / end of | % change | ||||||||||||||
| 3Q19 | 2Q19 | 3Q18 | QoQ | YoY | 9M19 | 9M18 | YoY | ||||||||||
| Results (CHF million) | |||||||||||||||||
| Net revenues | 1,461 | 1,369 | 1,265 | 7 | 15 | 4,247 | 4,012 | 6 | |||||||||
| of which Private Banking | 1,066 | 989 | 913 | 8 | 17 | 3,074 | 2,948 | 4 | |||||||||
| of which Asset Management | 395 | 380 | 352 | 4 | 12 | 1,173 | 1,064 | 10 | |||||||||
| Provision for credit losses | 14 | 9 | 15 | 56 | (7) | 33 | 19 | 74 | |||||||||
| Total operating expenses | 908 | 916 | 872 | (1) | 4 | 2,708 | 2,698 | 0 | |||||||||
| Income before taxes | 539 | 444 | 378 | 21 | 43 | 1,506 | 1,295 | 16 | |||||||||
| of which Private Banking | 428 | 340 | 287 | 26 | 49 | 1,170 | 1,035 | 13 | |||||||||
| of which Asset Management | 111 | 104 | 91 | 7 | 22 | 336 | 260 | 29 | |||||||||
| Metrics (%) | |||||||||||||||||
| Return on regulatory capital | 34.3 | 28.9 | 27.1 | – | – | 32.9 | 31.4 | – | |||||||||
| Cost/income ratio | 62.1 | 66.9 | 68.9 | – | – | 63.8 | 67.2 | – | |||||||||
| Private Banking | |||||||||||||||||
| Assets under management (CHF billion) | 365.2 | 363.1 | 368.4 | 0.6 | (0.9) | 365.2 | 368.4 | (0.9) | |||||||||
| Net new assets (CHF billion) | 3.6 | 5.5 | 3.0 | – | – | 10.4 | 13.7 | – | |||||||||
| Gross margin (annualized) (bp) | 117 | 109 | 99 | – | – | 113 | 107 | – | |||||||||
| Net margin (annualized) (bp) | 47 | 37 | 31 | – | – | 43 | 37 | – | |||||||||
| Asset Management | |||||||||||||||||
| Assets under management (CHF billion) | 426.0 | 414.0 | 403.7 | 2.9 | 5.5 | 426.0 | 403.7 | 5.5 | |||||||||
| Net new assets (CHF billion) | 5.9 | 8.6 | 4.5 | – | – | 14.0 | 21.5 | – | |||||||||
A-2
| Asia Pacific | |||||||||||||||||
| in / end of | % change | in / end of | % change | ||||||||||||||
| 3Q19 | 2Q19 | 3Q18 | QoQ | YoY | 9M19 | 9M18 | YoY | ||||||||||
| Results (CHF million) | |||||||||||||||||
| Net revenues | 886 | 913 | 811 | (3) | 9 | 2,653 | 2,716 | (2) | |||||||||
| of which Wealth Management & Connected | 673 | 614 | 557 | 10 | 21 | 1,852 | 1,784 | 4 | |||||||||
| of which Markets | 213 | 299 | 254 | (29) | (16) | 801 | 932 | (14) | |||||||||
| Provision for credit losses | 19 | (1) | 10 | – | 90 | 35 | 27 | 30 | |||||||||
| Total operating expenses | 620 | 677 | 625 | (8) | (1) | 1,951 | 2,062 | (5) | |||||||||
| Income before taxes | 247 | 237 | 176 | 4 | 40 | 667 | 627 | 6 | |||||||||
| of which Wealth Management & Connected | 281 | 216 | 180 | 30 | 56 | 667 | 553 | 21 | |||||||||
| of which Markets | (34) | 21 | (4) | – | – | 0 | 74 | (100) | |||||||||
| Metrics (%) | |||||||||||||||||
| Return on regulatory capital | 17.2 | 17.0 | 12.5 | – | – | 15.9 | 15.0 | – | |||||||||
| Cost/income ratio | 70.0 | 74.2 | 77.1 | – | – | 73.5 | 75.9 | – | |||||||||
| Wealth Management & Connected – Private Banking | |||||||||||||||||
| Assets under management (CHF billion) | 222.4 | 218.7 | 207.5 | 1.7 | 7.2 | 222.4 | 207.5 | 7.2 | |||||||||
| Net new assets (CHF billion) | 2.6 | 2.8 | 6.4 | – | – | 10.4 | 16.0 | – | |||||||||
| Gross margin (annualized) (bp) | 97 | 79 | 76 | – | – | 84 | 83 | – | |||||||||
| Net margin (annualized) (bp) | 50 | 30 | 26 | – | – | 35 | 30 | – | |||||||||
A-3
| Global Markets | |||||||||||||||||
| in / end of | % change | in / end of | % change | ||||||||||||||
| 3Q19 | 2Q19 | 3Q18 | QoQ | YoY | 9M19 | 9M18 | YoY | ||||||||||
| Results (CHF million) | |||||||||||||||||
| Net revenues | 1,415 | 1,553 | 1,043 | (9) | 36 | 4,440 | 4,015 | 11 | |||||||||
| Provision for credit losses | 8 | 2 | 3 | 300 | 167 | 21 | 19 | 11 | |||||||||
| Total operating expenses | 1,138 | 1,194 | 1,136 | (5) | 0 | 3,511 | 3,649 | (4) | |||||||||
| Income/(loss) before taxes | 269 | 357 | (96) | (25) | – | 908 | 347 | 162 | |||||||||
| Metrics (%) | |||||||||||||||||
| Return on regulatory capital | 8.3 | 11.0 | (3.0) | – | – | 9.5 | 3.5 | – | |||||||||
| Cost/income ratio | 80.4 | 76.9 | 108.9 | – | – | 79.1 | 90.9 | – | |||||||||
| Investment Banking & Capital Markets | |||||||||||||||||
| in / end of | % change | in / end of | % change | ||||||||||||||
| 3Q19 | 2Q19 | 3Q18 | QoQ | YoY | 9M19 | 9M18 | YoY | ||||||||||
| Results (CHF million) | |||||||||||||||||
| Net revenues | 425 | 454 | 530 | (6) | (20) | 1,235 | 1,702 | (27) | |||||||||
| Provision for credit losses | 11 | 1 | 3 | – | 267 | 20 | 19 | 5 | |||||||||
| Total operating expenses | 429 | 447 | 457 | (4) | (6) | 1,317 | 1,444 | (9) | |||||||||
| Income/(loss) before taxes | (15) | 6 | 70 | – | – | (102) | 239 | – | |||||||||
| Metrics (%) | |||||||||||||||||
| Return on regulatory capital | (1.7) | 0.8 | 8.9 | – | – | (3.7) | 10.4 | – | |||||||||
| Cost/income ratio | 100.9 | 98.5 | 86.2 | – | – | 106.6 | 84.8 | – | |||||||||
| Global advisory and underwriting revenues | |||||||||||||||||
| in | % change | in | % change | ||||||||||||||
| 3Q19 | 2Q19 | 3Q18 | QoQ | YoY | 9M19 | 9M18 | YoY | ||||||||||
| Global advisory and underwriting revenues (USD million) | |||||||||||||||||
| Global advisory and underwriting revenues | 841 | 924 | 1,020 | (9) | (18) | 2,534 | 3,282 | (23) | |||||||||
| of which advisory and other fees | 203 | 208 | 291 | (2) | (30) | 582 | 855 | (32) | |||||||||
| of which debt underwriting | 463 | 463 | 498 | 0 | (7) | 1,386 | 1,682 | (18) | |||||||||
| of which equity underwriting | 175 | 253 | 231 | (31) | (24) | 566 | 745 | (24) | |||||||||
A-4
Cautionary statement regarding forward-looking information
This document contains statements that constitute forward-looking statements. In addition, in the future we, and others on our behalf, may make statements that constitute forward-looking statements. Such forward-looking statements may include, without limitation, statements relating to the following:
■ our plans, targets or goals;
■ our future economic performance or prospects;
■ the potential effect on our future performance of certain contingencies; and
■ assumptions underlying any such statements.
Words such as “believes,” “anticipates,” “expects,” “intends” and “plans” and similar expressions are intended to identify forward-looking statements but are not the exclusive means of identifying such statements. We do not intend to update these forward-looking statements.
By their very nature, forward-looking statements involve inherent risks and uncertainties, both general and specific, and risks exist that predictions, forecasts, projections and other outcomes described or implied in forward-looking statements will not be achieved. We caution you that a number of important factors could cause results to differ materially from the plans, targets, goals, expectations, estimates and intentions expressed in such forward-looking statements. These factors include:
■ the ability to maintain sufficient liquidity and access capital markets;
■ market volatility and interest rate fluctuations and developments affecting interest rate levels;
■ the strength of the global economy in general and the strength of the economies of the countries in which we conduct our operations, in particular the risk of continued slow economic recovery or downturn in the EU, the US or other developed countries or in emerging markets in 2019 and beyond;
■ the direct and indirect impacts of deterioration or slow recovery in residential and commercial real estate markets;
■ adverse rating actions by credit rating agencies in respect of us, sovereign issuers, structured credit products or other credit-related exposures;
■ the ability to achieve our strategic goals, including those related to our targets and financial goals;
■ the ability of counterparties to meet their obligations to us;
■ the effects of, and changes in, fiscal, monetary, exchange rate, trade and tax policies, as well as currency fluctuations;
■ political and social developments, including war, civil unrest or terrorist activity;
■ the possibility of foreign exchange controls, expropriation, nationalization or confiscation of assets in countries in which we conduct our operations;
■ operational factors such as systems failure, human error, or the failure to implement procedures properly;
■ the risk of cyber attacks, information or security breaches or technology failures on our business or operations;
■ the adverse resolution of litigation, regulatory proceedings and other contingencies;
■ actions taken by regulators with respect to our business and practices and possible resulting changes to our business organization, practices and policies in countries in which we conduct our operations;
■ the effects of changes in laws, regulations or accounting or tax standards, policies or practices in countries in which we conduct our operations;
■ the potential effects of changes in our legal entity structure;
■ competition or changes in our competitive position in geographic and business areas in which we conduct our operations;
■ the ability to retain and recruit qualified personnel;
■ the ability to maintain our reputation and promote our brand;
■ the ability to increase market share and control expenses;
■ technological changes;
■ the timely development and acceptance of our new products and services and the perceived overall value of these products and services by users;
■ acquisitions, including the ability to integrate acquired businesses successfully, and divestitures, including the ability to sell non-core assets; and
■ other unforeseen or unexpected events and our success at managing these and the risks involved in the foregoing.
We caution you that the foregoing list of important factors is not exclusive. When evaluating forward-looking statements, you should carefully consider the foregoing factors and other uncertainties and events, including the information set forth in “Risk factors” in I – Information on the company in our Annual Report 2018.
A-5

Tidjane Thiam, Chief Executive OfficerDavid Mathers, Chief Financial OfficerOctober 30, 2019 Credit SuisseThird Quarter 2019 Results
Disclaimer 2 October 30, 2019 This material does not purport to contain all of the information that you may wish to consider. This material is not to be relied upon as such or used in substitution for the exercise of independent judgment.Cautionary statement regarding forward-looking statements This presentation contains forward-looking statements that involve inherent risks and uncertainties, and we might not be able to achieve the predictions, forecasts, projections and other outcomes we describe or imply in forward-looking statements. A number of important factors could cause results to differ materially from the plans, objectives, expectations, estimates and intentions we express in these forward-looking statements, including those we identify in "Risk factors” in our Annual Report on Form 20-F for the fiscal year ended December 31, 2018 and in the “Cautionary statement regarding forward-looking information" in our 3Q19 Financial Report published on October 30, 2019 and filed with the US Securities and Exchange Commission, and in other public filings and press releases. We do not intend to update these forward-looking statements. In particular, the terms “Estimate”, “Illustrative”, “Ambition”, “Objective”, “Outlook” and “Goal” are not intended to be viewed as targets or projections, nor are they considered to be Key Performance Indicators. All such estimates, illustrations, ambitions, objectives, outlooks and goals are subject to a large number of inherent risks, assumptions and uncertainties, many of which are completely outside of our control. These risks, assumptions and uncertainties include, but are not limited to, general market conditions, market volatility, interest rate volatility and levels, global and regional economic conditions, political uncertainty, changes in tax policies, regulatory changes, changes in levels of client activity as a result of any of the foregoing and other factors. Accordingly, this information should not be relied on for any purpose. We do not intend to update these estimates, illustrations, ambitions, objectives, outlooks or goals. We may not achieve the benefits of our strategic initiativesWe may not achieve all of the expected benefits of our strategic initiatives. Factors beyond our control, including but not limited to the market and economic conditions, changes in laws, rules or regulations and other challenges discussed in our public filings, could limit our ability to achieve some or all of the expected benefits of these initiatives. Estimates and assumptionsIn preparing this presentation, management has made estimates and assumptions that affect the numbers presented. Actual results may differ. Annualized numbers do not take account of variations in operating results, seasonality and other factors and may not be indicative of actual, full-year results. Figures throughout this presentation may also be subject to rounding adjustments. All opinions and views constitute judgments as of the date of writing without regard to the date on which the reader may receive or access the information. This information is subject to change at any time without notice and we do not intend to update this information.Statement regarding non-GAAP financial measuresThis presentation also contains non-GAAP financial measures, including adjusted results as well as return on regulatory capital, return on tangible equity and tangible book value per share (which are based on tangible shareholders’ equity). Information needed to reconcile such non-GAAP financial measures to the most directly comparable measures under US GAAP can be found in this presentation in the Appendix as well as in the 3Q19 Financial Report, which are both available on our website at www.credit-suisse.com.Statement regarding capital, liquidity and leverageCredit Suisse is subject to the Basel III framework, as implemented in Switzerland, as well as Swiss legislation and regulations for systemically important banks (Swiss Requirements), which include capital, liquidity, leverage and large exposure requirements and rules for emergency plans designed to maintain systemically relevant functions in the event of threatened insolvency. Credit Suisse has adopted the Bank for International Settlements (BIS) leverage ratio framework, as issued by the Basel Committee on Banking Supervision (BCBS) and implemented in Switzerland by the Swiss Financial Market Supervisory Authority FINMA.References to phase-in and look-through included herein refer to Basel III capital requirements and Swiss Requirements. Phase-in reflects that, for the years 2014-2018, there was a five-year (20% per annum) phase-in of goodwill, other intangible assets and other capital deductions (e.g., certain deferred tax assets) and a phase-out of an adjustment for the accounting treatment of pension plans. For the years 2013-2022, there is a phase-out of certain capital instruments. Look-through assumes the full phase-in of goodwill and other intangible assets and other regulatory adjustments and the phase-out of certain capital instruments.Unless otherwise noted, leverage exposure is based on the BIS leverage ratio framework and consists of period-end balance sheet assets and prescribed regulatory adjustments. The tier 1 leverage ratio and CET1 leverage ratio are calculated as BIS tier 1 capital and CET1 capital, respectively, divided by period-end leverage exposure. Swiss leverage ratios are measured on the same period-end basis as the leverage exposure for the BIS leverage ratio.SourcesCertain material in this presentation has been prepared by Credit Suisse on the basis of publicly available information, internally developed data and other third-party sources believed to be reliable. Credit Suisse has not sought to independently verify information obtained from public and third-party sources and makes no representations or warranties as to accuracy, completeness or reliability of such information.

Earnings Review 3 October 30, 2019
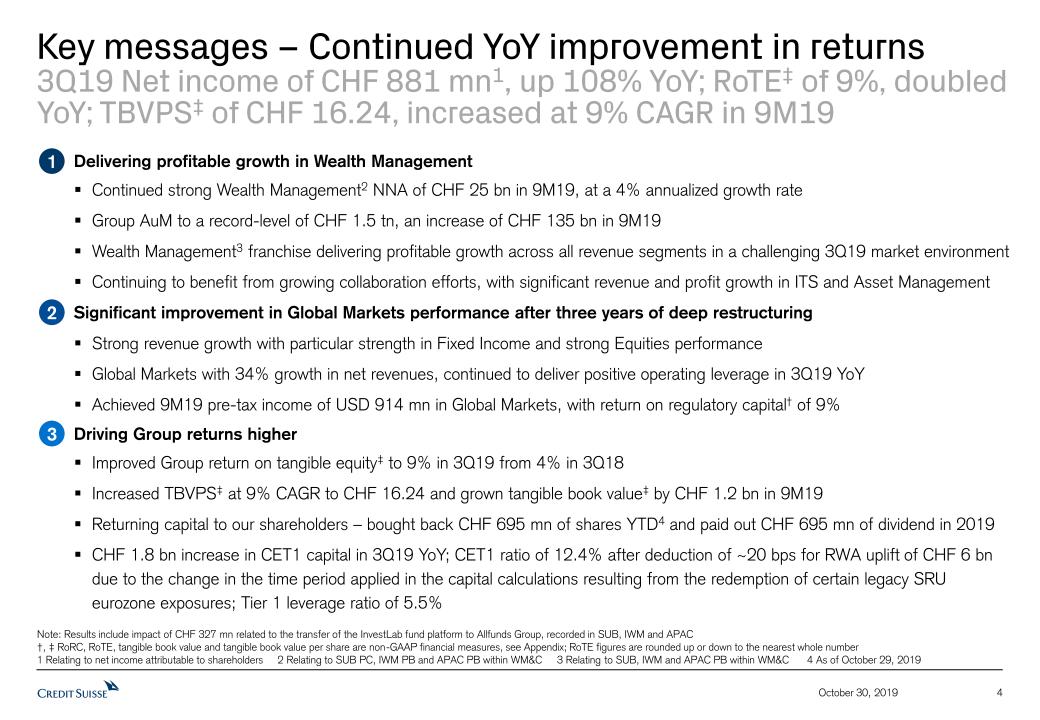
Key messages – Continued YoY improvement in returns3Q19 Net income of CHF 881 mn1, up 108% YoY; RoTE‡ of 9%, doubled YoY; TBVPS‡ of CHF 16.24, increased at 9% CAGR in 9M19 4 October 30, 2019 Delivering profitable growth in Wealth ManagementContinued strong Wealth Management2 NNA of CHF 25 bn in 9M19, at a 4% annualized growth rateGroup AuM to a record-level of CHF 1.5 tn, an increase of CHF 135 bn in 9M19Wealth Management3 franchise delivering profitable growth across all revenue segments in a challenging 3Q19 market environmentContinuing to benefit from growing collaboration efforts, with significant revenue and profit growth in ITS and Asset ManagementSignificant improvement in Global Markets performance after three years of deep restructuring Strong revenue growth with particular strength in Fixed Income and strong Equities performanceGlobal Markets with 34% growth in net revenues, continued to deliver positive operating leverage in 3Q19 YoYAchieved 9M19 pre-tax income of USD 914 mn in Global Markets, with return on regulatory capital† of 9%Driving Group returns higherImproved Group return on tangible equity‡ to 9% in 3Q19 from 4% in 3Q18Increased TBVPS‡ at 9% CAGR to CHF 16.24 and grown tangible book value‡ by CHF 1.2 bn in 9M19Returning capital to our shareholders – bought back CHF 695 mn of shares YTD4 and paid out CHF 695 mn of dividend in 2019CHF 1.8 bn increase in CET1 capital in 3Q19 YoY; CET1 ratio of 12.4% after deduction of ~20 bps for RWA uplift of CHF 6 bn due to the change in the time period applied in the capital calculations resulting from the redemption of certain legacy SRU eurozone exposures; Tier 1 leverage ratio of 5.5% 1 2 3 Note: Results include impact of CHF 327 mn related to the transfer of the InvestLab fund platform to Allfunds Group, recorded in SUB, IWM and APAC†, ‡ RoRC, RoTE, tangible book value and tangible book value per share are non-GAAP financial measures, see Appendix; RoTE figures are rounded up or down to the nearest whole number1 Relating to net income attributable to shareholders 2 Relating to SUB PC, IWM PB and APAC PB within WM&C 3 Relating to SUB, IWM and APAC PB within WM&C 4 As of October 29, 2019
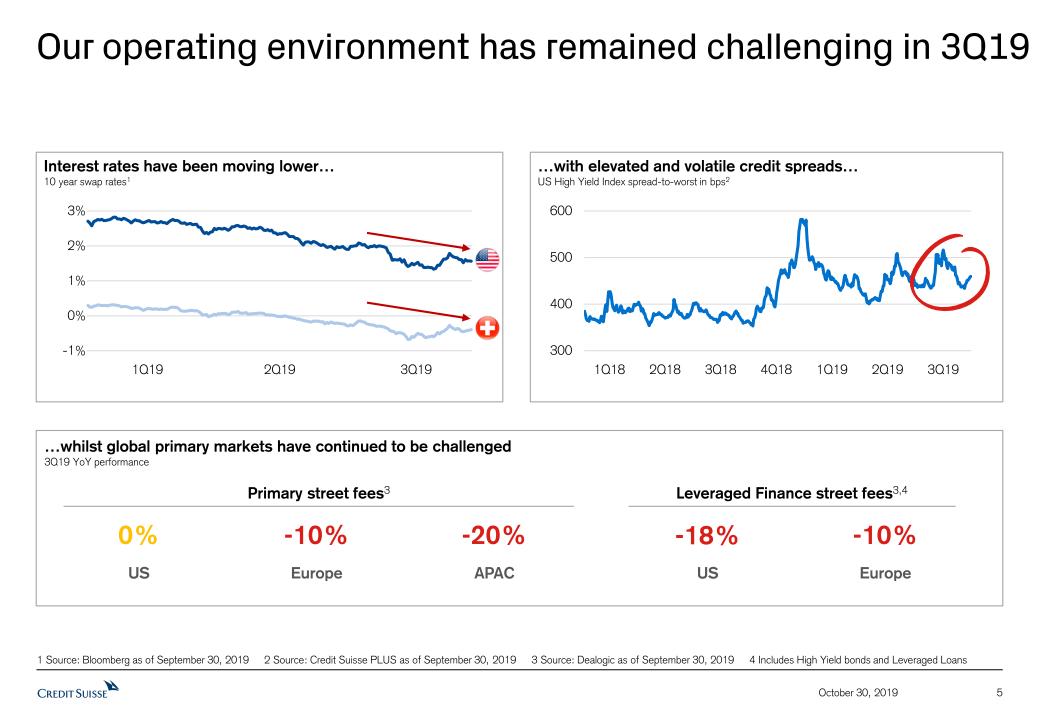
-10% 5 October 30, 2019 Our operating environment has remained challenging in 3Q19 …whilst global primary markets have continued to be challenged3Q19 YoY performance 1 Source: Bloomberg as of September 30, 2019 2 Source: Credit Suisse PLUS as of September 30, 2019 3 Source: Dealogic as of September 30, 2019 4 Includes High Yield bonds and Leveraged Loans Primary street fees3 0% -20% APAC Europe US -10% Leveraged Finance street fees3,4 -18% Europe US Interest rates have been moving lower…10 year swap rates1 …with elevated and volatile credit spreads…US High Yield Index spread-to-worst in bps2 1Q19 2Q19 3Q19 1Q18 2Q18 3Q18 1Q19 4Q18 2Q19 3Q19 % % % % %
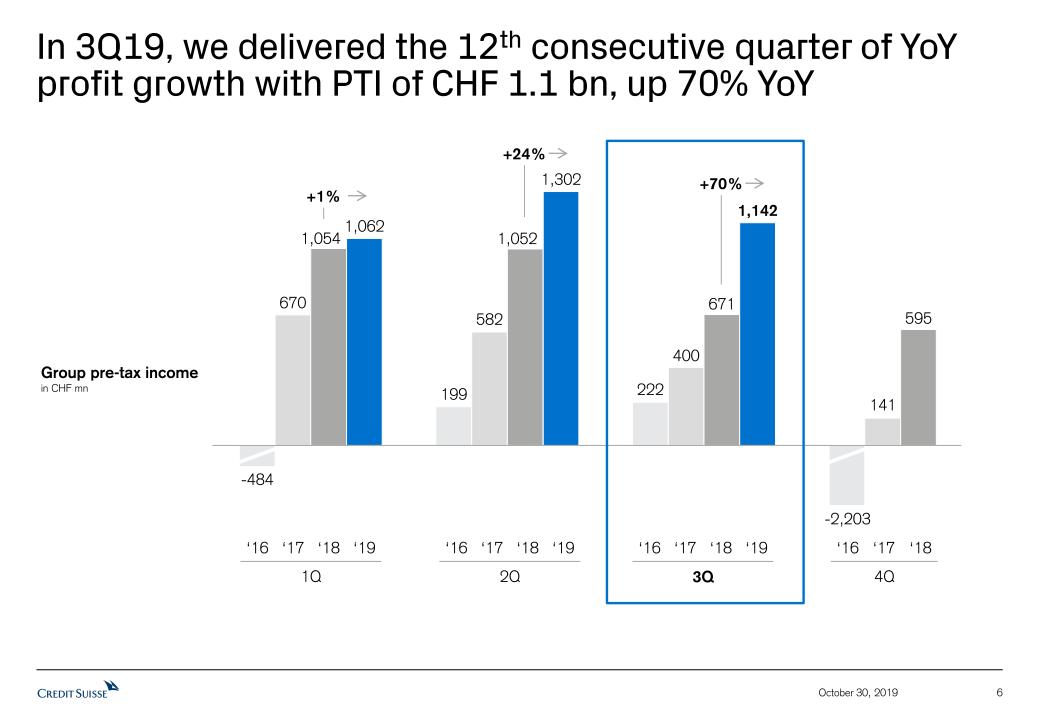
In 3Q19, we delivered the 12th consecutive quarter of YoY profit growth with PTI of CHF 1.1 bn, up 70% YoY 6 October 30, 2019 Group pre-tax incomein CHF mn 1Q ‘16 ‘17 ‘18 ‘19 -484 4Q ‘16 ‘17 ‘18 -2,203 2Q ‘16 ‘17 ‘18 ‘19 +24% +1% 3Q ‘16 ‘17 ‘18 ‘19 +70%
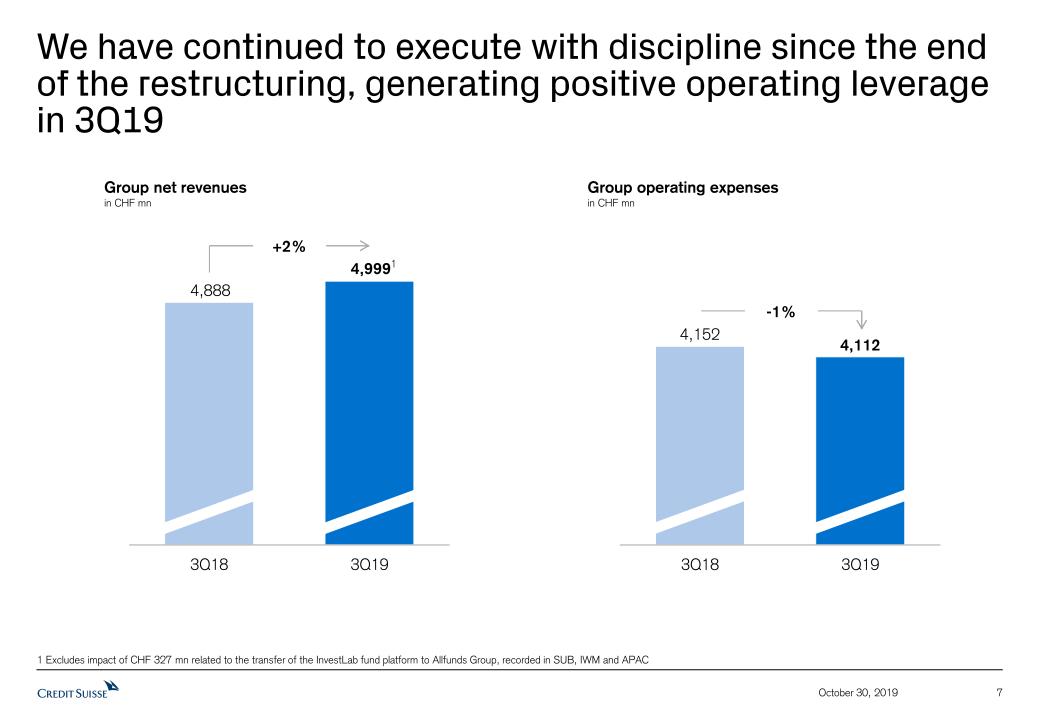
We have continued to execute with discipline since the end of the restructuring, generating positive operating leverage in 3Q19 7 October 30, 2019 1 Excludes impact of CHF 327 mn related to the transfer of the InvestLab fund platform to Allfunds Group, recorded in SUB, IWM and APAC Group net revenuesin CHF mn Group operating expensesin CHF mn -1% +2% 1
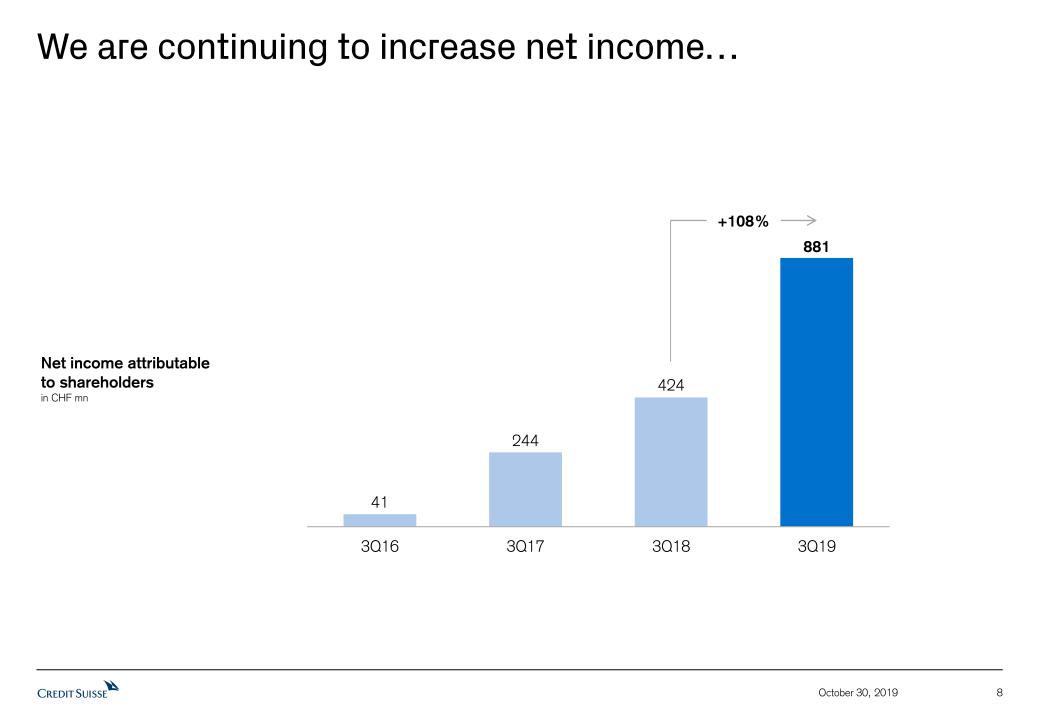
We are continuing to increase net income… 8 October 30, 2019 +108% Net income attributableto shareholdersin CHF mn
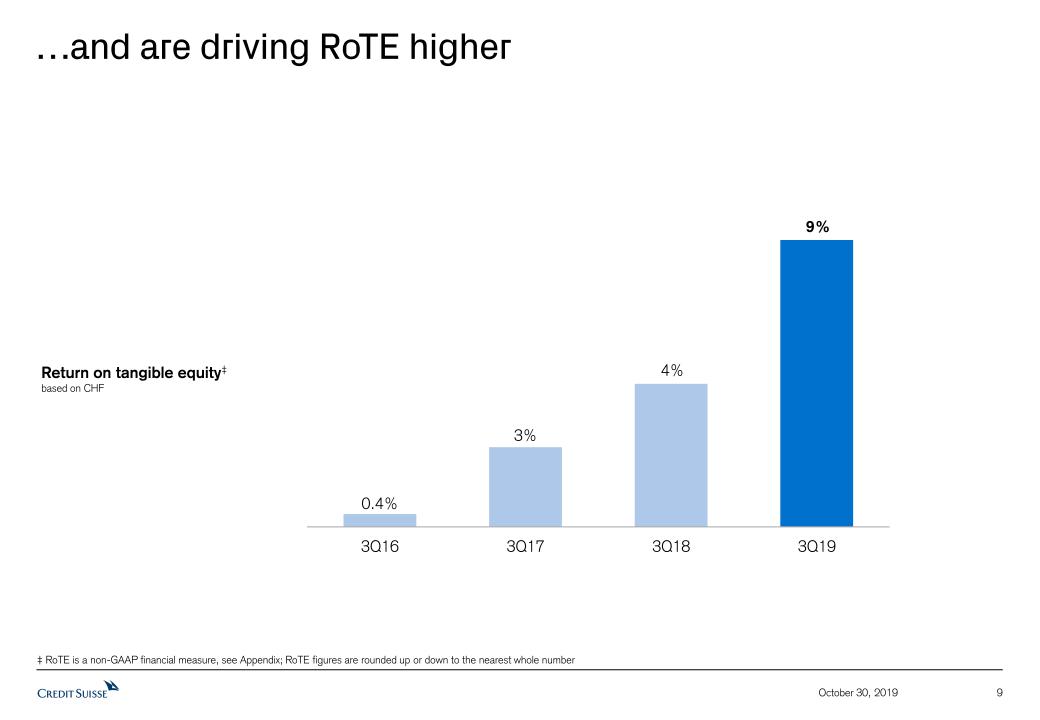
…and are driving RoTE higher 9 October 30, 2019 Return on tangible equity‡based on CHF ‡ RoTE is a non-GAAP financial measure, see Appendix; RoTE figures are rounded up or down to the nearest whole number
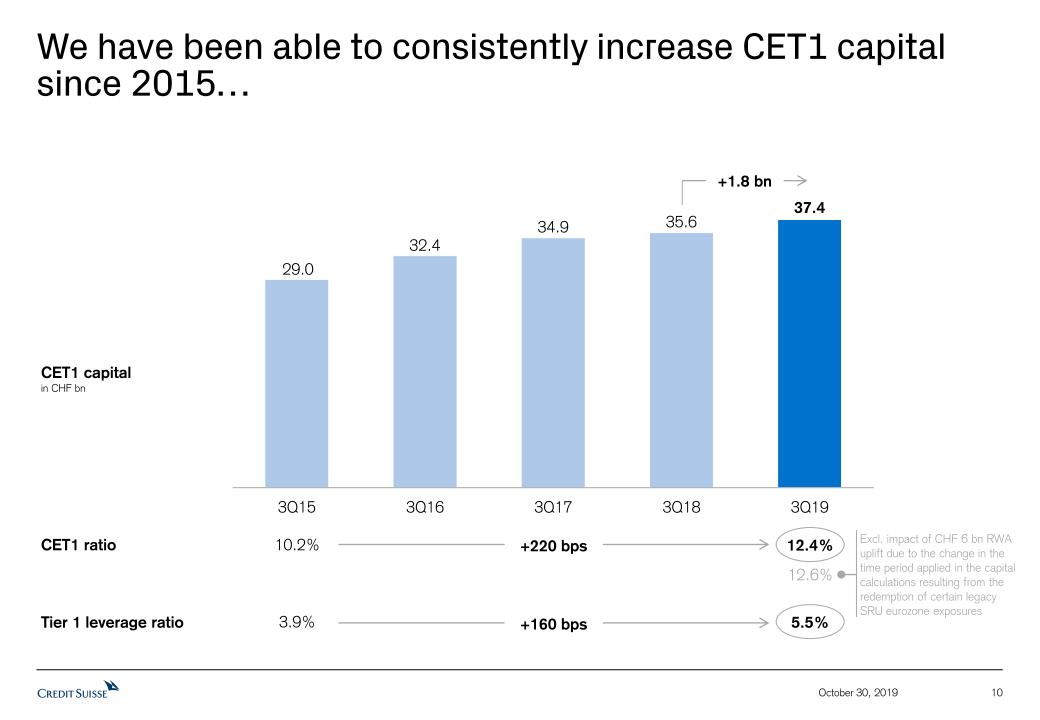
We have been able to consistently increase CET1 capital since 2015… 10 October 30, 2019 CET1 capitalin CHF bn Tier 1 leverage ratio 5.5% CET1 ratio 12.4% 10.2% 3.9% +1.8 bn 12.6% +220 bps +160 bps Excl. impact of CHF 6 bn RWA uplift due to the change in the time period applied in the capital calculations resulting from the redemption of certain legacy SRU eurozone exposures
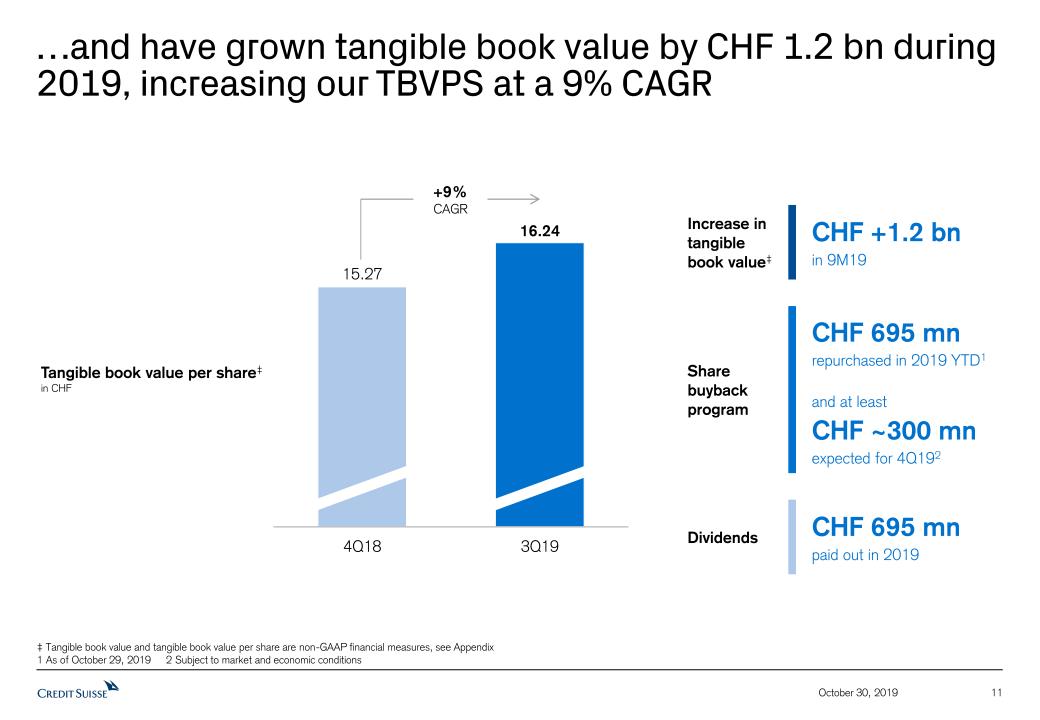
11 October 30, 2019 …and have grown tangible book value by CHF 1.2 bn during 2019, increasing our TBVPS at a 9% CAGR Tangible book value per share‡in CHF +9%CAGR ‡ Tangible book value and tangible book value per share are non-GAAP financial measures, see Appendix1 As of October 29, 2019 2 Subject to market and economic conditions Increase in tangible book value‡ CHF +1.2 bnin 9M19 Dividends CHF 695 mnpaid out in 2019 Share buyback program CHF 695 mnrepurchased in 2019 YTD1 and at leastCHF ~300 mnexpected for 4Q192
Divisional highlights 12 October 30, 2019
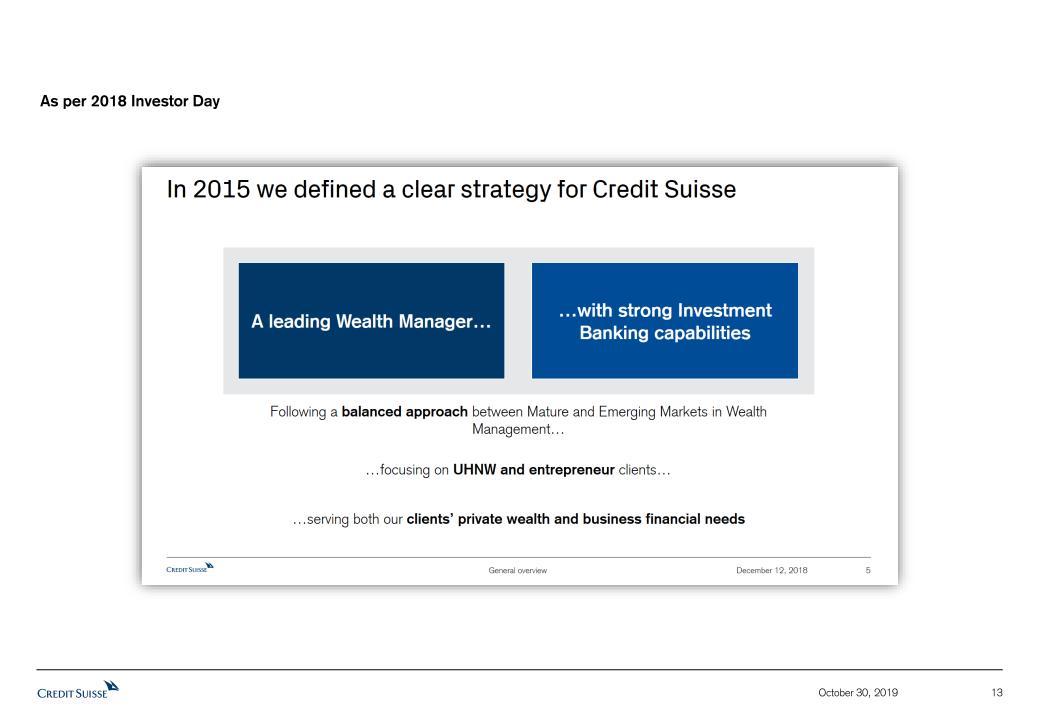
13 October 30, 2019 As per 2018 Investor Day
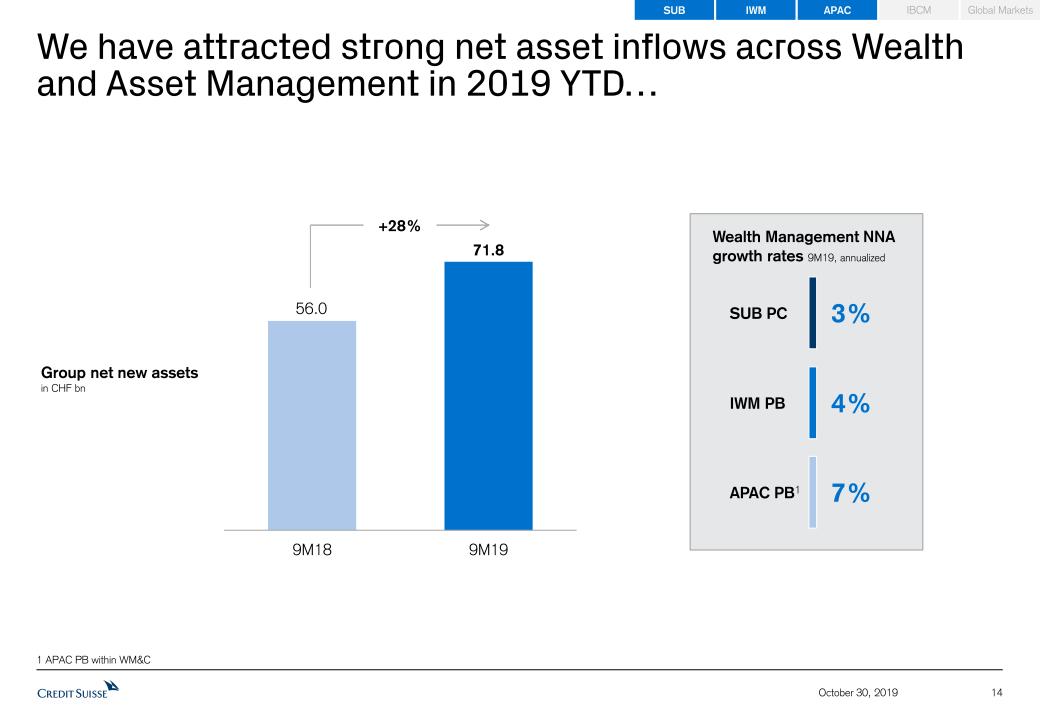
We have attracted strong net asset inflows across Wealth and Asset Management in 2019 YTD… 14 October 30, 2019 Group net new assetsin CHF bn SUB PC 4% 7% Wealth Management NNAgrowth rates 9M19, annualized IWM PB APAC PB1 1 APAC PB within WM&C 3% +28% IBCM APAC Global Markets IWM SUB
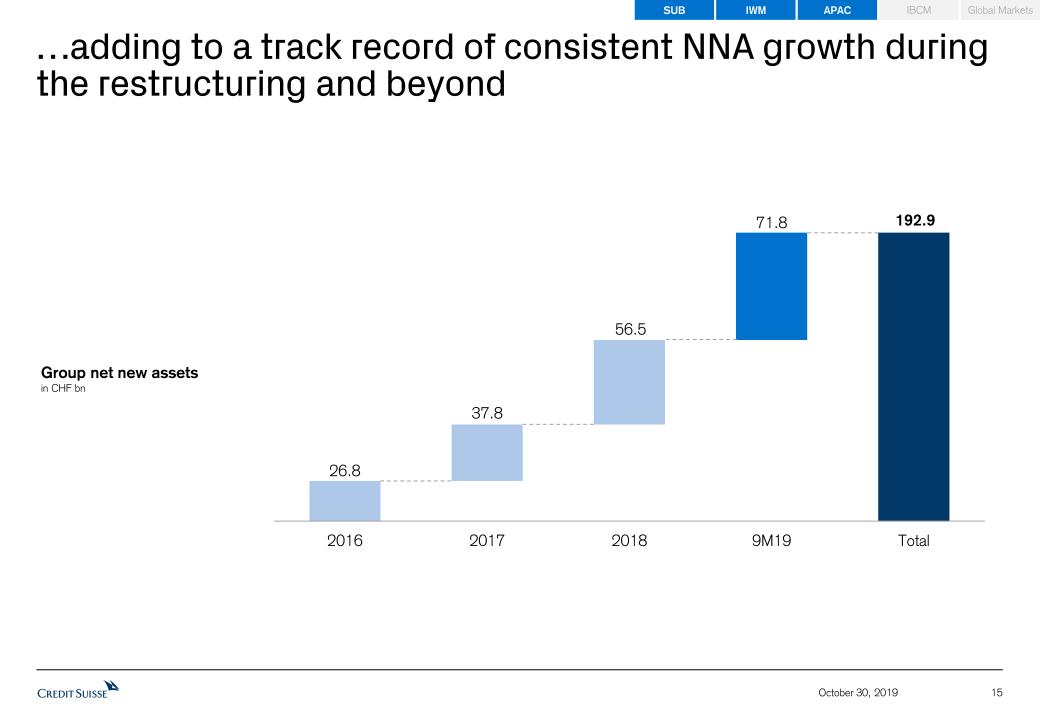
15 October 30, 2019 …adding to a track record of consistent NNA growth during the restructuring and beyond Group net new assetsin CHF bn IBCM APAC Global Markets IWM SUB
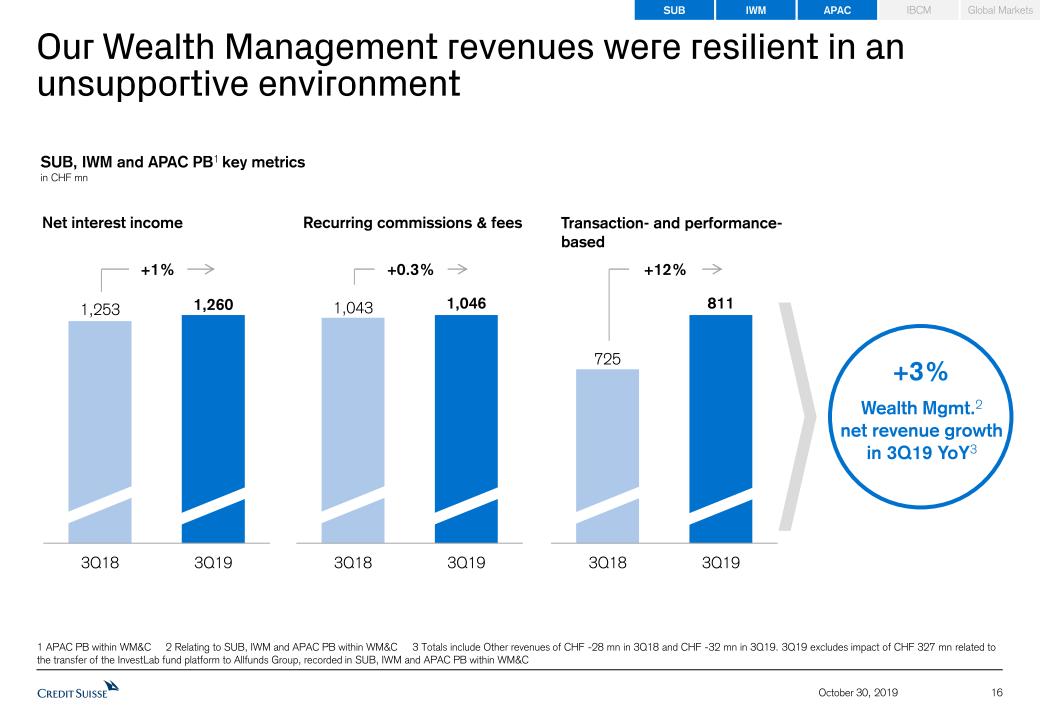
Our Wealth Management revenues were resilient in an unsupportive environment 16 October 30, 2019 1 APAC PB within WM&C 2 Relating to SUB, IWM and APAC PB within WM&C 3 Totals include Other revenues of CHF -28 mn in 3Q18 and CHF -32 mn in 3Q19. 3Q19 excludes impact of CHF 327 mn related to the transfer of the InvestLab fund platform to Allfunds Group, recorded in SUB, IWM and APAC PB within WM&C SUB, IWM and APAC PB1 key metricsin CHF mn Net interest income Recurring commissions & fees Transaction- and performance-based +1% +0.3% +12% IBCM APAC Global Markets IWM SUB +3%Wealth Mgmt.2net revenue growth in 3Q19 YoY3
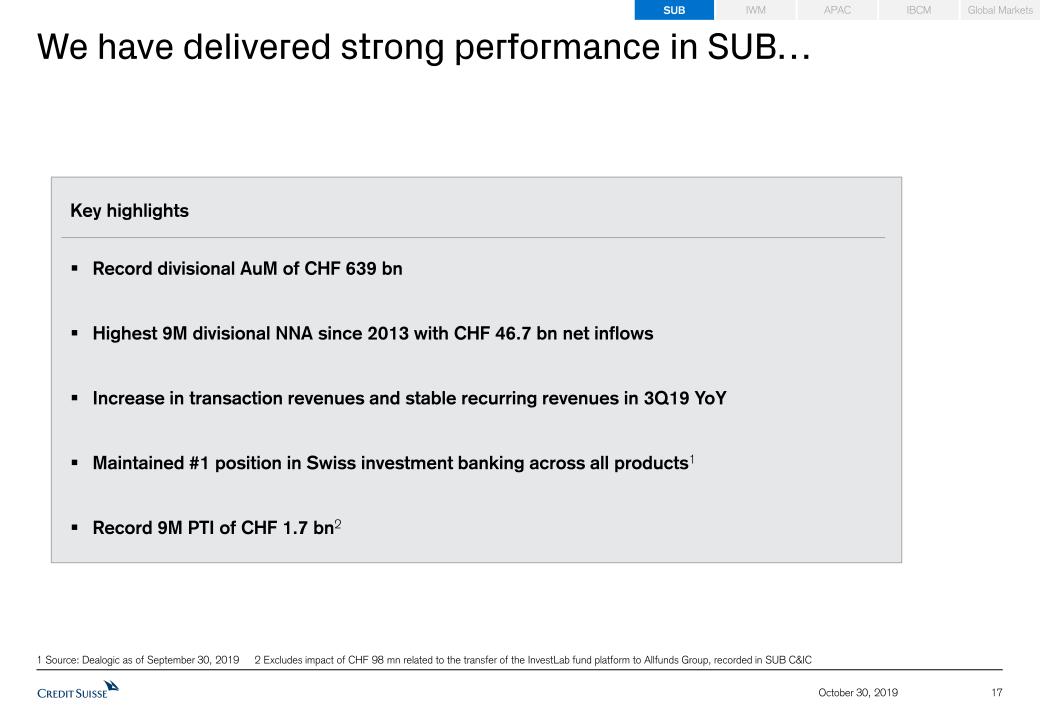
We have delivered strong performance in SUB… 17 October 30, 2019 IBCM APAC Global Markets 1 Source: Dealogic as of September 30, 2019 2 Excludes impact of CHF 98 mn related to the transfer of the InvestLab fund platform to Allfunds Group, recorded in SUB C&IC IWM SUB Key highlightsRecord divisional AuM of CHF 639 bnHighest 9M divisional NNA since 2013 with CHF 46.7 bn net inflowsIncrease in transaction revenues and stable recurring revenues in 3Q19 YoY Maintained #1 position in Swiss investment banking across all products1Record 9M PTI of CHF 1.7 bn2
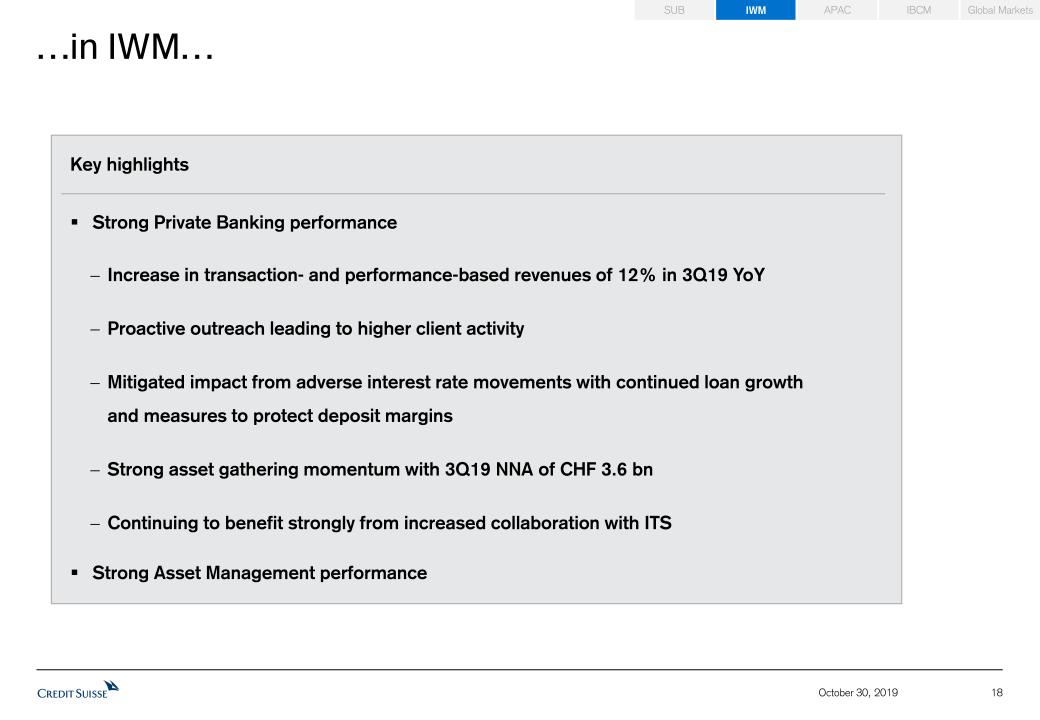
…in IWM… 18 October 30, 2019 IBCM APAC Global Markets IWM SUB Key highlightsStrong Private Banking performanceIncrease in transaction- and performance-based revenues of 12% in 3Q19 YoYProactive outreach leading to higher client activityMitigated impact from adverse interest rate movements with continued loan growth and measures to protect deposit marginsStrong asset gathering momentum with 3Q19 NNA of CHF 3.6 bnContinuing to benefit strongly from increased collaboration with ITSStrong Asset Management performance
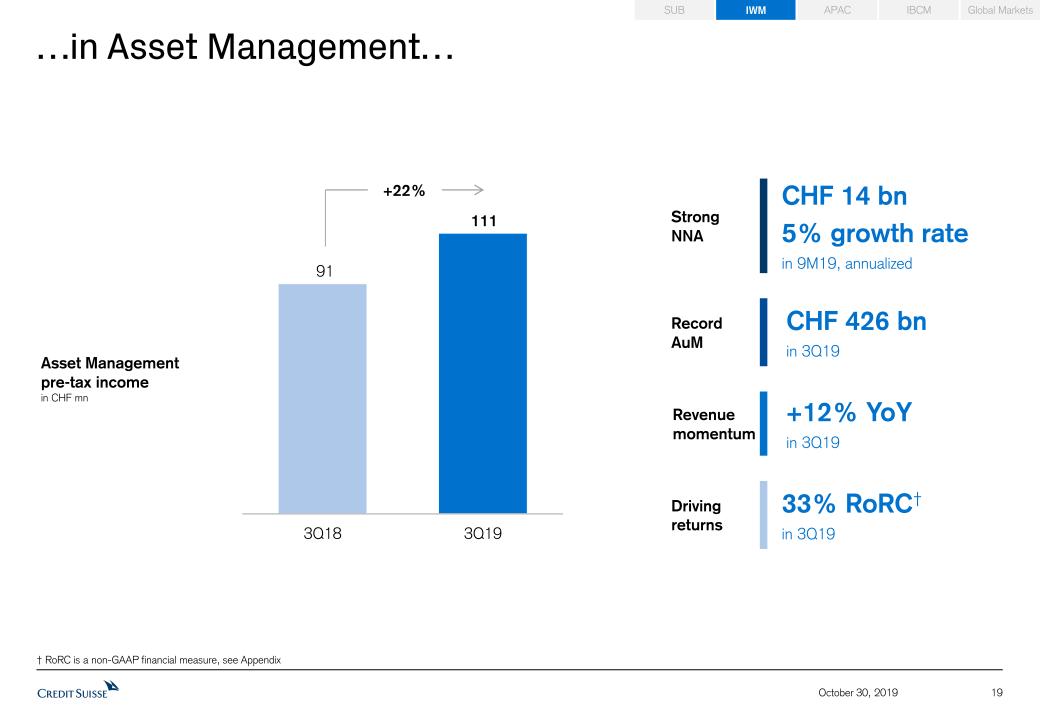
19 October 30, 2019 …in Asset Management… Asset Managementpre-tax incomein CHF mn +22% † RoRC is a non-GAAP financial measure, see Appendix Record AuM Strong NNA CHF 14 bn5% growth ratein 9M19, annualized CHF 426 bnin 3Q19 Driving returns 33% RoRC†in 3Q19 Revenue momentum +12% YoYin 3Q19 IBCM APAC Global Markets IWM SUB
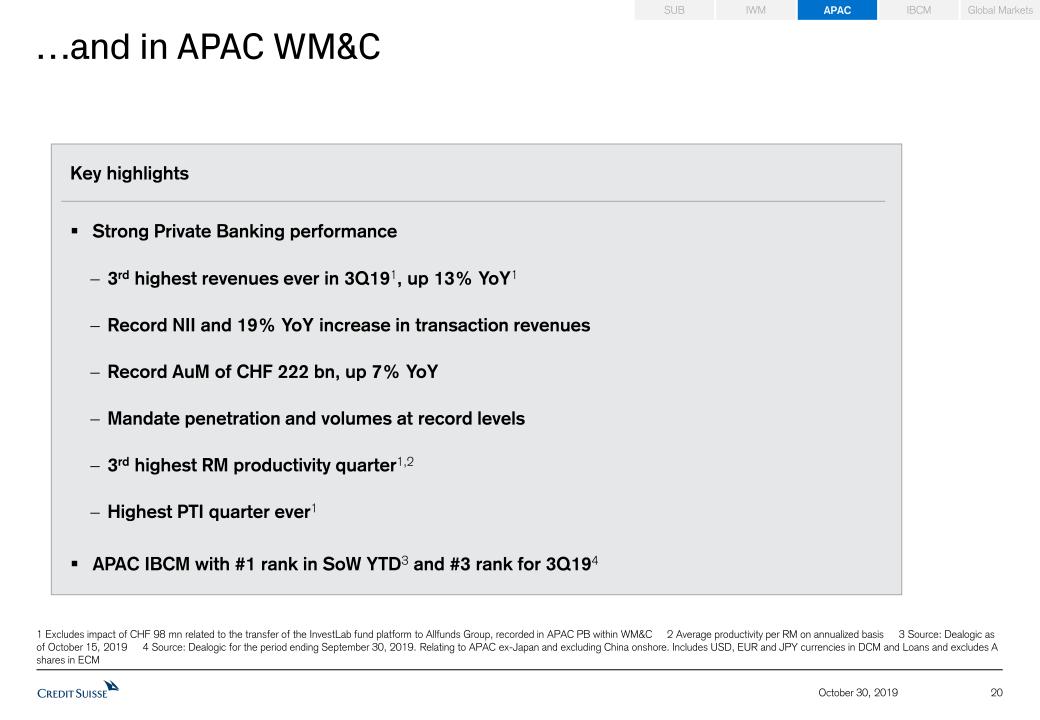
…and in APAC WM&C 20 October 30, 2019 IBCM APAC Global Markets 1 Excludes impact of CHF 98 mn related to the transfer of the InvestLab fund platform to Allfunds Group, recorded in APAC PB within WM&C 2 Average productivity per RM on annualized basis 3 Source: Dealogic as of October 15, 2019 4 Source: Dealogic for the period ending September 30, 2019. Relating to APAC ex-Japan and excluding China onshore. Includes USD, EUR and JPY currencies in DCM and Loans and excludes A shares in ECM IWM SUB Key highlightsStrong Private Banking performance3rd highest revenues ever in 3Q191, up 13% YoY1Record NII and 19% YoY increase in transaction revenuesRecord AuM of CHF 222 bn, up 7% YoYMandate penetration and volumes at record levels3rd highest RM productivity quarter1,2Highest PTI quarter ever1APAC IBCM with #1 rank in SoW YTD3 and #3 rank for 3Q194
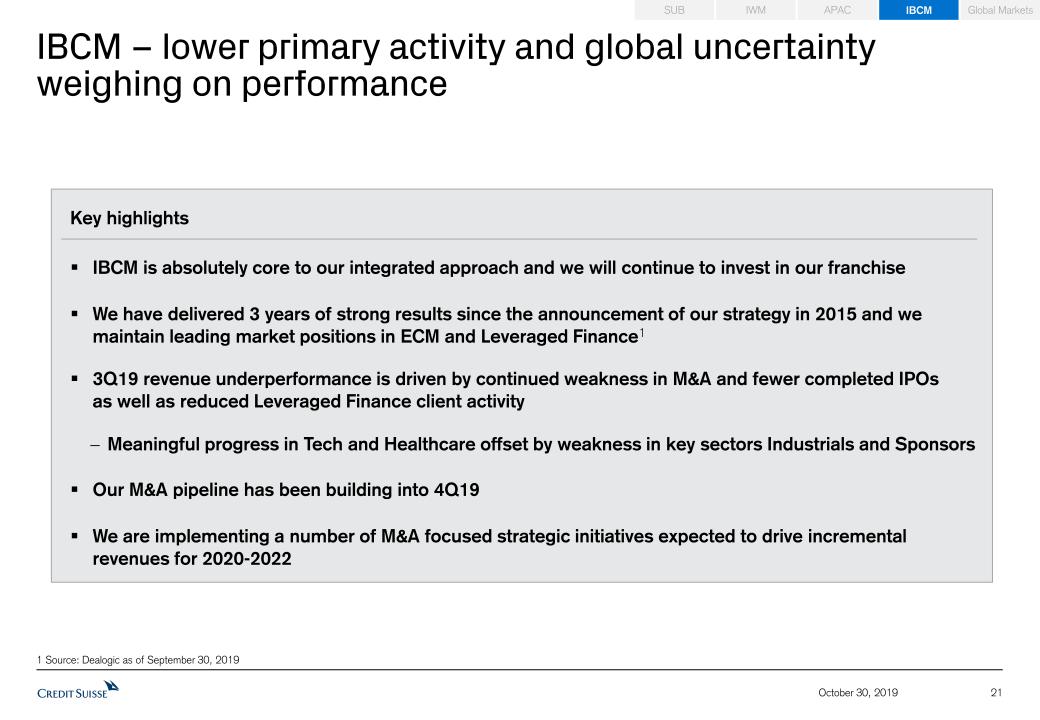
21 October 30, 2019 IBCM – lower primary activity and global uncertainty weighing on performance IBCM APAC Global Markets IWM SUB Key highlightsIBCM is absolutely core to our integrated approach and we will continue to invest in our franchiseWe have delivered 3 years of strong results since the announcement of our strategy in 2015 and wemaintain leading market positions in ECM and Leveraged Finance13Q19 revenue underperformance is driven by continued weakness in M&A and fewer completed IPOsas well as reduced Leveraged Finance client activityMeaningful progress in Tech and Healthcare offset by weakness in key sectors Industrials and SponsorsOur M&A pipeline has been building into 4Q19We are implementing a number of M&A focused strategic initiatives expected to drive incrementalrevenues for 2020-2022 1 Source: Dealogic as of September 30, 2019
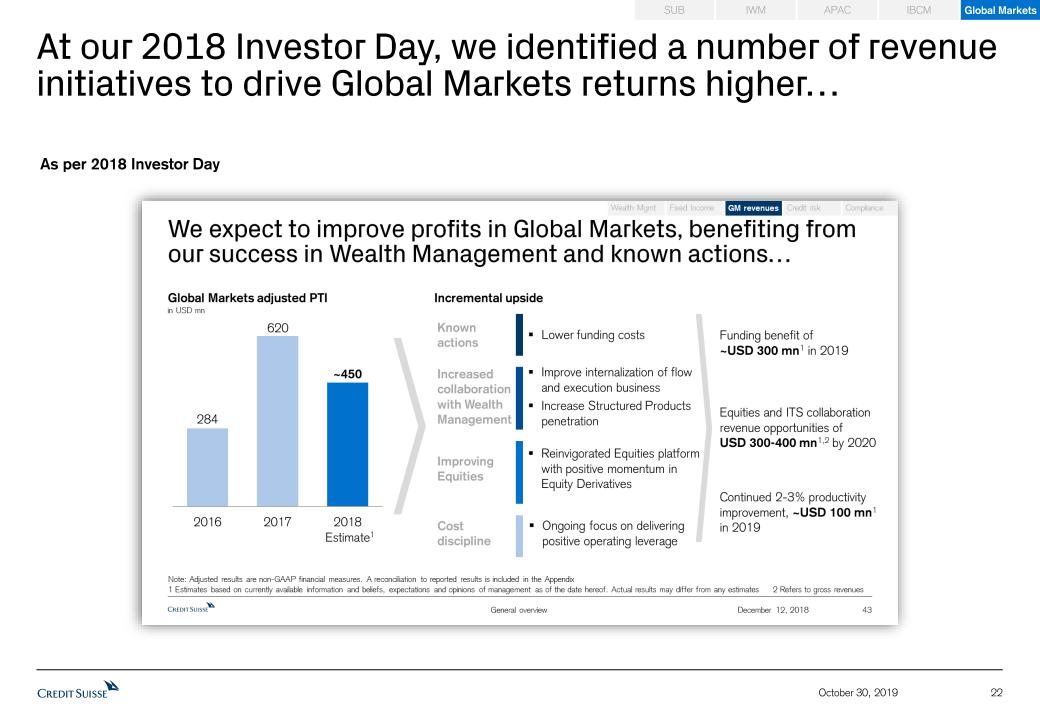
22 October 30, 2019 At our 2018 Investor Day, we identified a number of revenue initiatives to drive Global Markets returns higher… Global Markets IBCM APAC IWM SUB As per 2018 Investor Day
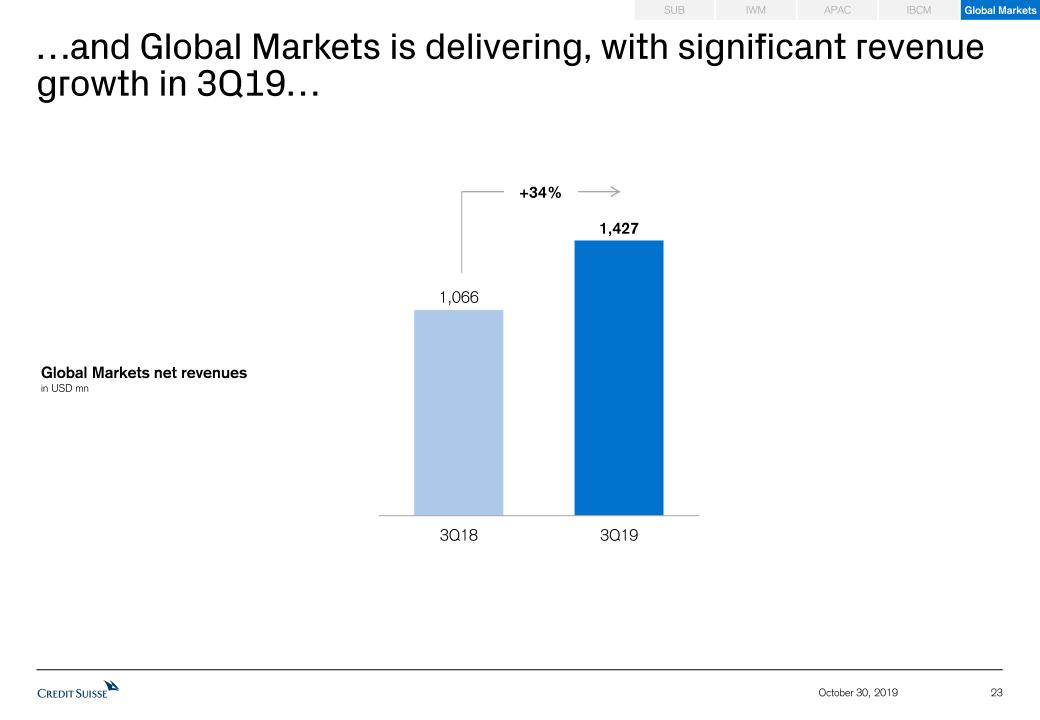
23 October 30, 2019 …and Global Markets is delivering, with significant revenue growth in 3Q19… Global Markets IBCM APAC IWM SUB +34% Global Markets net revenuesin USD mn
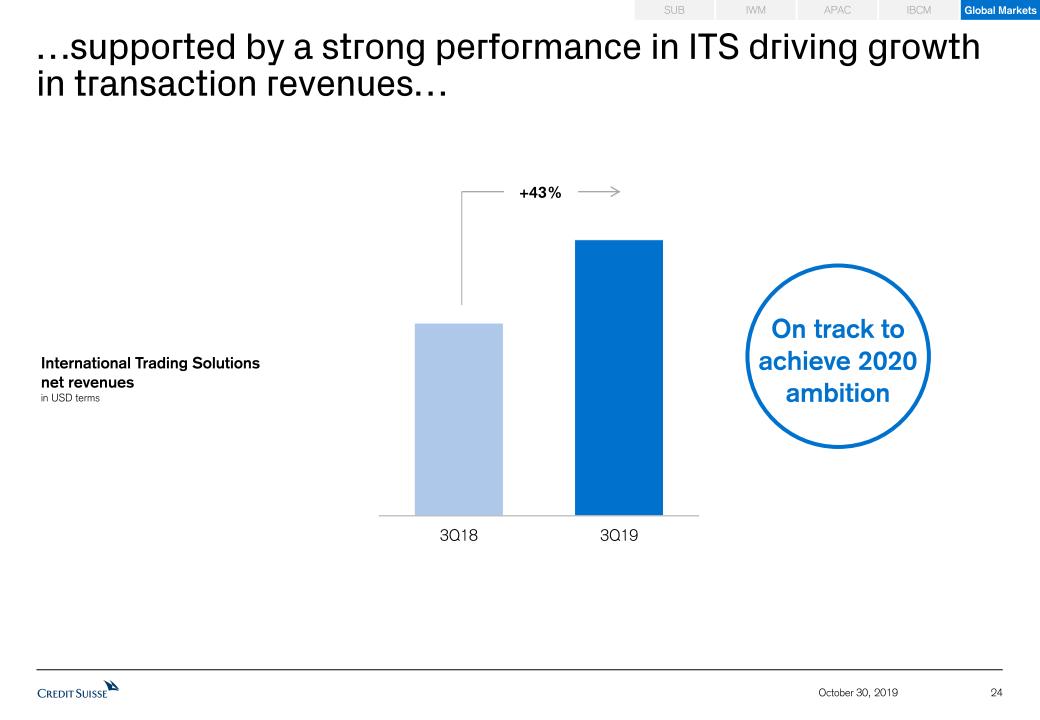
24 October 30, 2019 …supported by a strong performance in ITS driving growth in transaction revenues… On track to achieve 2020 ambition +43% International Trading Solutionsnet revenuesin USD terms Global Markets IBCM APAC IWM SUB
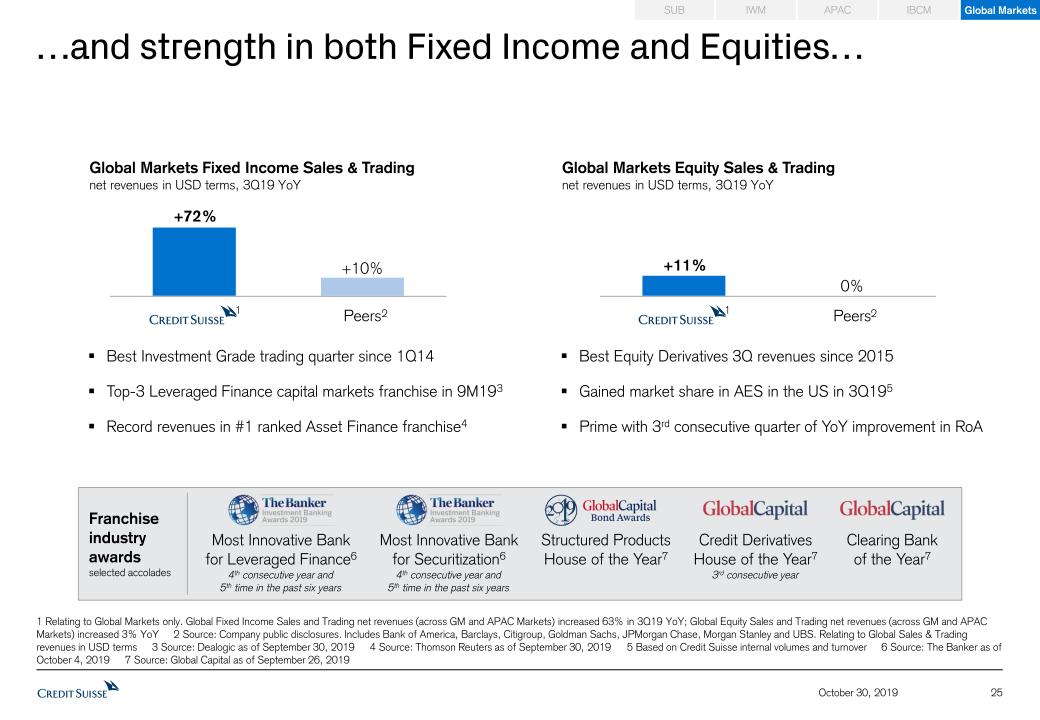
Best Investment Grade trading quarter since 1Q14Top-3 Leveraged Finance capital markets franchise in 9M193Record revenues in #1 ranked Asset Finance franchise4 Best Equity Derivatives 3Q revenues since 2015Gained market share in AES in the US in 3Q195Prime with 3rd consecutive quarter of YoY improvement in RoA 25 October 30, 2019 …and strength in both Fixed Income and Equities… 1 Relating to Global Markets only. Global Fixed Income Sales and Trading net revenues (across GM and APAC Markets) increased 63% in 3Q19 YoY; Global Equity Sales and Trading net revenues (across GM and APAC Markets) increased 3% YoY 2 Source: Company public disclosures. Includes Bank of America, Barclays, Citigroup, Goldman Sachs, JPMorgan Chase, Morgan Stanley and UBS. Relating to Global Sales & Trading revenues in USD terms 3 Source: Dealogic as of September 30, 2019 4 Source: Thomson Reuters as of September 30, 2019 5 Based on Credit Suisse internal volumes and turnover 6 Source: The Banker as of October 4, 2019 7 Source: Global Capital as of September 26, 2019 Global Markets Equity Sales & Tradingnet revenues in USD terms, 3Q19 YoY 2 Global Markets Fixed Income Sales & Tradingnet revenues in USD terms, 3Q19 YoY 2 Franchise industry awardsselected accolades Clearing Bankof the Year7 Structured ProductsHouse of the Year7 Global Markets IBCM APAC IWM SUB Most Innovative Bankfor Leveraged Finance6 4th consecutive year and5th time in the past six years Most Innovative Bankfor Securitization6 4th consecutive year and5th time in the past six years Credit DerivativesHouse of the Year7 3rd consecutive year 1 1
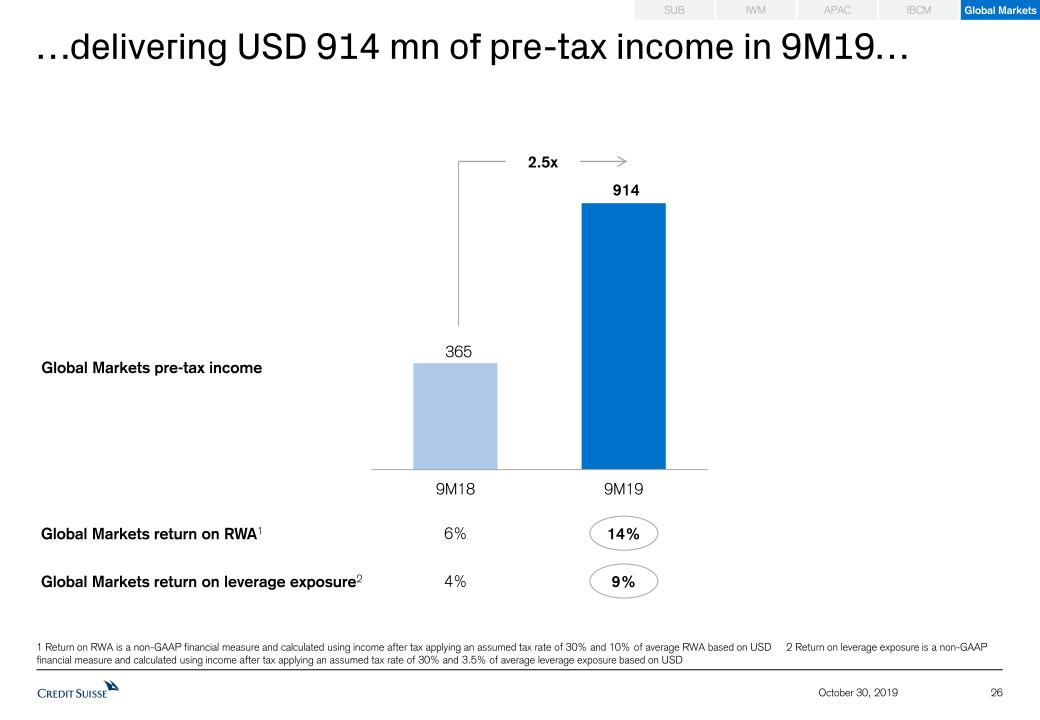
26 October 30, 2019 …delivering USD 914 mn of pre-tax income in 9M19… 1 Return on RWA is a non-GAAP financial measure and calculated using income after tax applying an assumed tax rate of 30% and 10% of average RWA based on USD 2 Return on leverage exposure is a non-GAAP financial measure and calculated using income after tax applying an assumed tax rate of 30% and 3.5% of average leverage exposure based on USD Global Markets return on RWA1 14% 6% 2.5x Global Markets pre-tax income Global Markets return on leverage exposure2 9% 4% Global Markets IBCM APAC IWM SUB
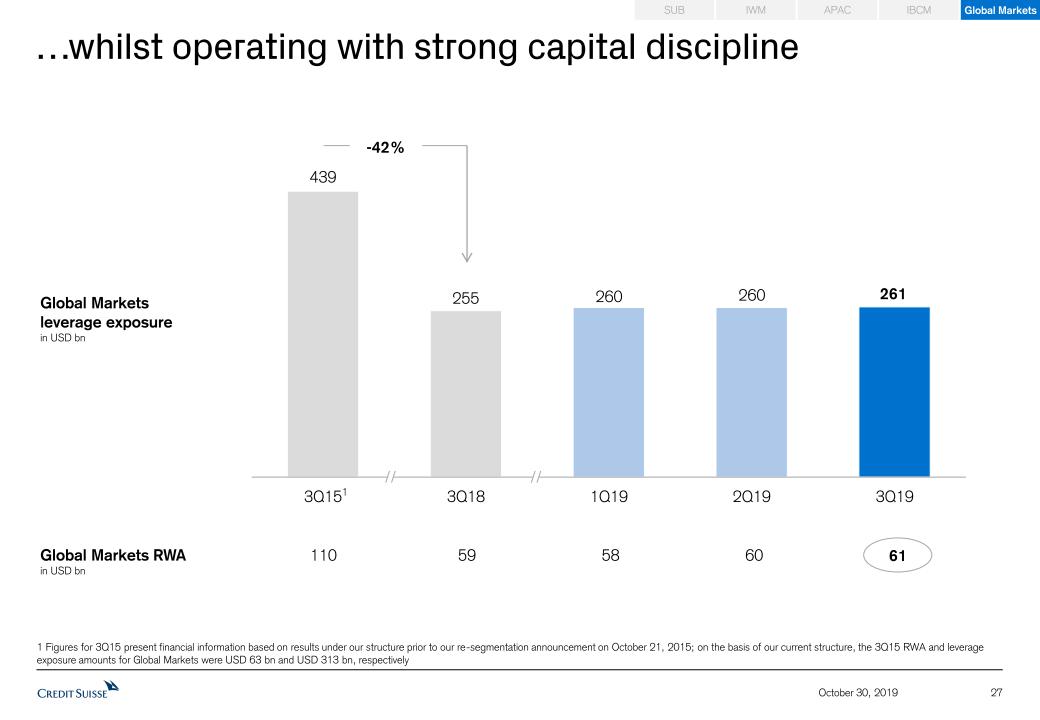
27 October 30, 2019 …whilst operating with strong capital discipline Global Markets IBCM APAC IWM SUB Global Markets RWAin USD bn Global Markets leverage exposurein USD bn 1 Figures for 3Q15 present financial information based on results under our structure prior to our re-segmentation announcement on October 21, 2015; on the basis of our current structure, the 3Q15 RWA and leverage exposure amounts for Global Markets were USD 63 bn and USD 313 bn, respectively -42% 61 110 59 58 60 1
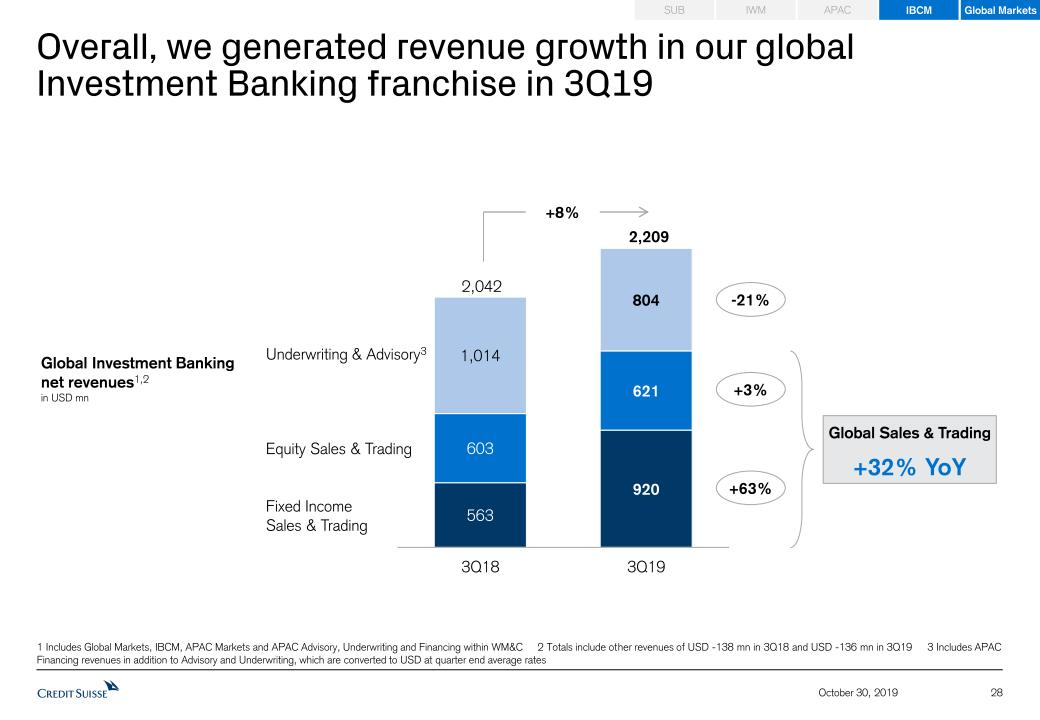
Overall, we generated revenue growth in our global Investment Banking franchise in 3Q19 28 October 30, 2019 Global Investment Bankingnet revenues1,2in USD mn Fixed IncomeSales & Trading Equity Sales & Trading 2,042 -21% +63% 2,209 +8% 1 Includes Global Markets, IBCM, APAC Markets and APAC Advisory, Underwriting and Financing within WM&C 2 Totals include other revenues of USD -138 mn in 3Q18 and USD -136 mn in 3Q19 3 Includes APAC Financing revenues in addition to Advisory and Underwriting, which are converted to USD at quarter end average rates Underwriting & Advisory3 +3% +32% YoY Global Sales & Trading IBCM APAC Global Markets IWM SUB

Summary 29 October 30, 2019 Continued year-on-year improvement in returnsDelivering profitable growth in Wealth ManagementSignificant improvement in Global Markets performance after three years of deep restructuring Growing TBVPS‡ – increased at 9% CAGR in 9M19Returned CHF 1.4 bn of capital to our shareholders in 9M19 ‡ Tangible book value per share is a non-GAAP financial measures, see Appendix

Detailed Financials 30 October 30, 2019
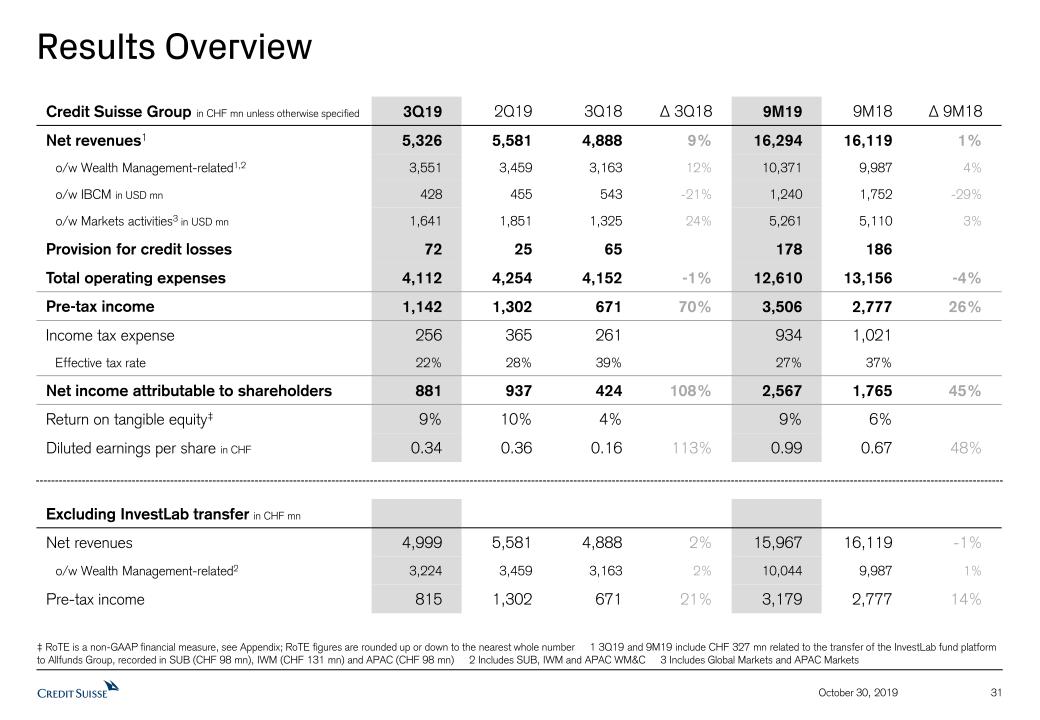
Results Overview ‡ RoTE is a non-GAAP financial measure, see Appendix; RoTE figures are rounded up or down to the nearest whole number 1 3Q19 and 9M19 include CHF 327 mn related to the transfer of the InvestLab fund platform to Allfunds Group, recorded in SUB (CHF 98 mn), IWM (CHF 131 mn) and APAC (CHF 98 mn) 2 Includes SUB, IWM and APAC WM&C 3 Includes Global Markets and APAC Markets 31 October 30, 2019 Credit Suisse Group in CHF mn unless otherwise specified 3Q19 2Q19 3Q18 Δ 3Q18 9M19 9M18 Δ 9M18 Net revenues1 5,326 5,581 4,888 9% 16,294 16,119 1% o/w Wealth Management-related1,2 3,551 3,459 3,163 12% 10,371 9,987 4% o/w IBCM in USD mn 428 455 543 -21% 1,240 1,752 -29% o/w Markets activities3 in USD mn 1,641 1,851 1,325 24% 5,261 5,110 3% Provision for credit losses 72 25 65 178 186 Total operating expenses 4,112 4,254 4,152 -1% 12,610 13,156 -4% Pre-tax income 1,142 1,302 671 70% 3,506 2,777 26% Income tax expense 256 365 261 934 1,021 Effective tax rate 22% 28% 39% 27% 37% Net income attributable to shareholders 881 937 424 108% 2,567 1,765 45% Return on tangible equity‡ 9% 10% 4% 9% 6% Diluted earnings per share in CHF 0.34 0.36 0.16 113% 0.99 0.67 48% Excluding InvestLab transfer in CHF mn Net revenues 4,999 5,581 4,888 2% 15,967 16,119 -1% o/w Wealth Management-related2 3,224 3,459 3,163 2% 10,044 9,987 1% Pre-tax income 815 1,302 671 21% 3,179 2,777 14%
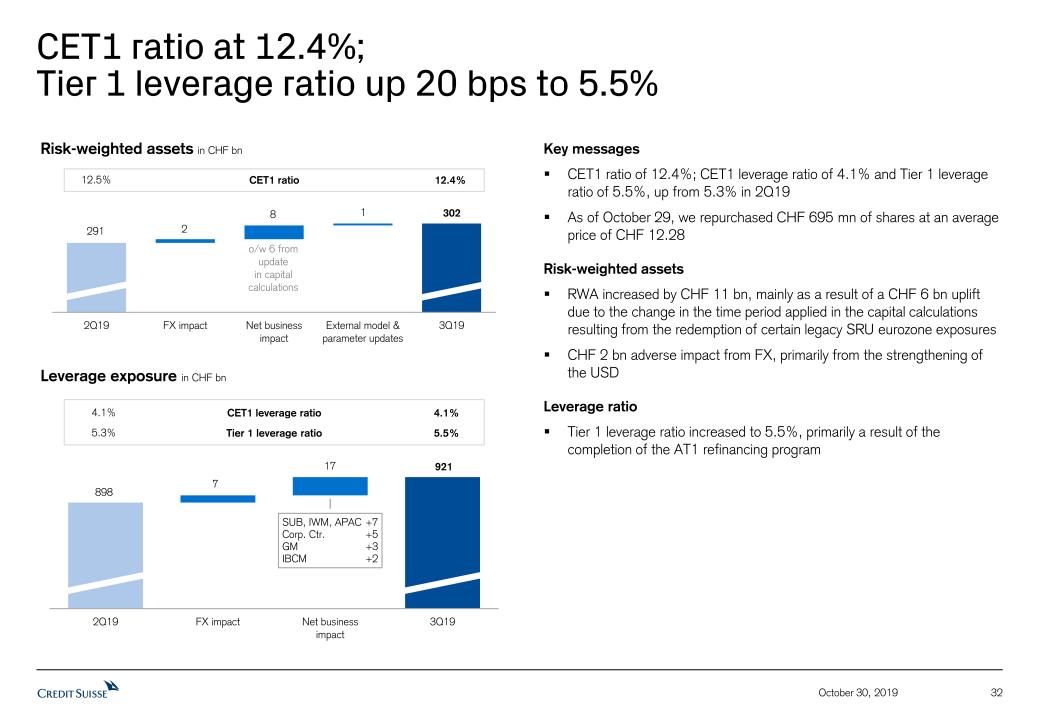
CET1 ratio at 12.4%;Tier 1 leverage ratio up 20 bps to 5.5% 32 October 30, 2019 Risk-weighted assets in CHF bn 291 2 8 1 302 Leverage exposure in CHF bn 898 7 921 12.5% 12.4% CET1 ratio 4.1% 4.1% CET1 leverage ratio 5.3% 5.5% Tier 1 leverage ratio Key messagesCET1 ratio of 12.4%; CET1 leverage ratio of 4.1% and Tier 1 leverage ratio of 5.5%, up from 5.3% in 2Q19As of October 29, we repurchased CHF 695 mn of shares at an average price of CHF 12.28Risk-weighted assetsRWA increased by CHF 11 bn, mainly as a result of a CHF 6 bn uplift due to the change in the time period applied in the capital calculations resulting from the redemption of certain legacy SRU eurozone exposuresCHF 2 bn adverse impact from FX, primarily from the strengthening of the USDLeverage ratioTier 1 leverage ratio increased to 5.5%, primarily a result of the completion of the AT1 refinancing program 17 SUB, IWM, APAC +7Corp. Ctr. +5GM +3IBCM +2 o/w 6 from updatein capital calculations
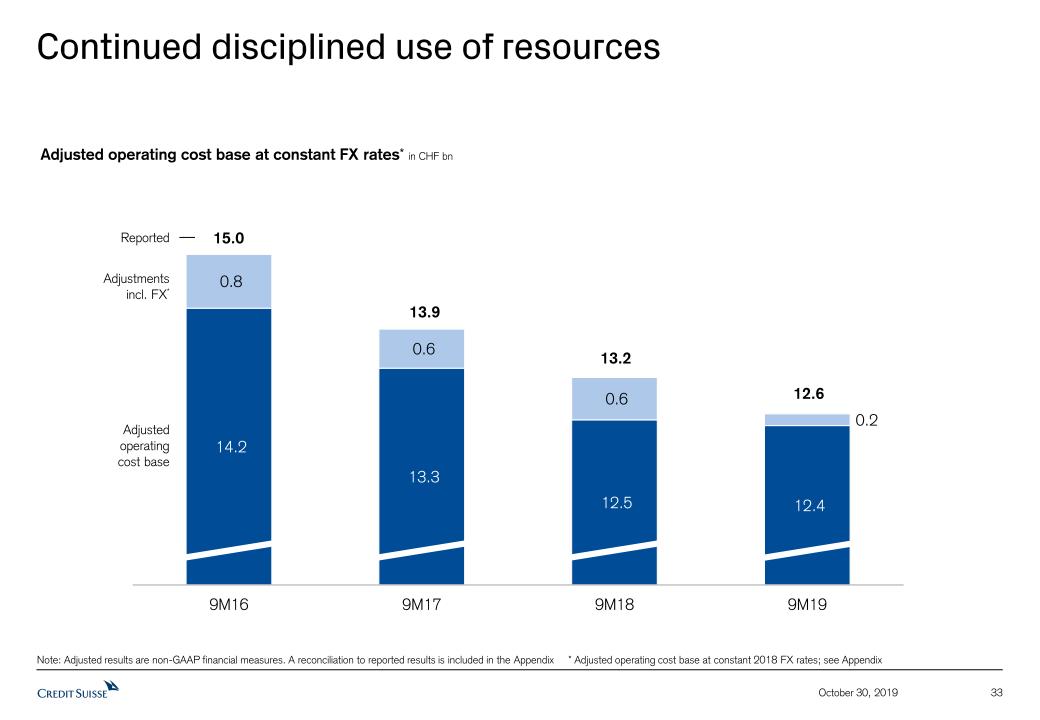
33 October 30, 2019 Continued disciplined use of resources Note: Adjusted results are non-GAAP financial measures. A reconciliation to reported results is included in the Appendix * Adjusted operating cost base at constant 2018 FX rates; see Appendix Adjusted operating cost base at constant FX rates* in CHF bn 15.0 13.9 13.2 12.6 Adjusted operatingcost base Adjustmentsincl. FX* Reported
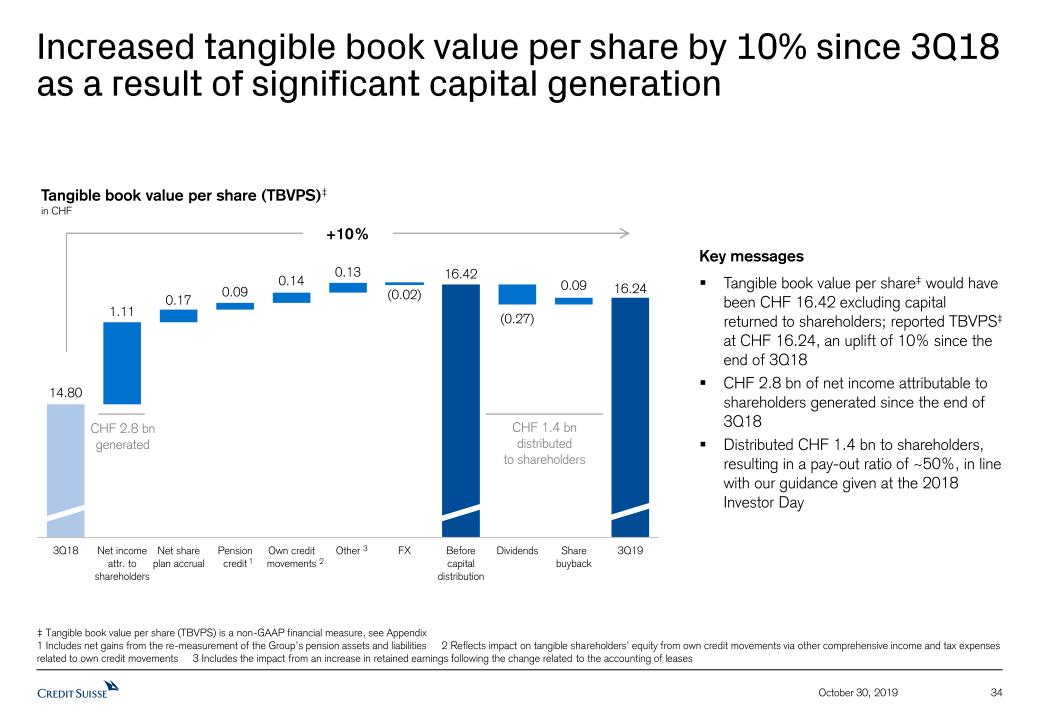
34 Increased tangible book value per share by 10% since 3Q18 as a result of significant capital generation October 30, 2019 Tangible book value per share (TBVPS)‡in CHF Key messagesTangible book value per share‡ would have been CHF 16.42 excluding capital returned to shareholders; reported TBVPS‡ at CHF 16.24, an uplift of 10% since the end of 3Q18CHF 2.8 bn of net income attributable to shareholders generated since the end of 3Q18Distributed CHF 1.4 bn to shareholders, resulting in a pay-out ratio of ~50%, in line with our guidance given at the 2018 Investor Day ‡ Tangible book value per share (TBVPS) is a non-GAAP financial measure, see Appendix1 Includes net gains from the re-measurement of the Group’s pension assets and liabilities 2 Reflects impact on tangible shareholders’ equity from own credit movements via other comprehensive income and tax expenses related to own credit movements 3 Includes the impact from an increase in retained earnings following the change related to the accounting of leases 2 1 CHF 1.4 bn distributed to shareholders CHF 2.8 bngenerated +10% 3
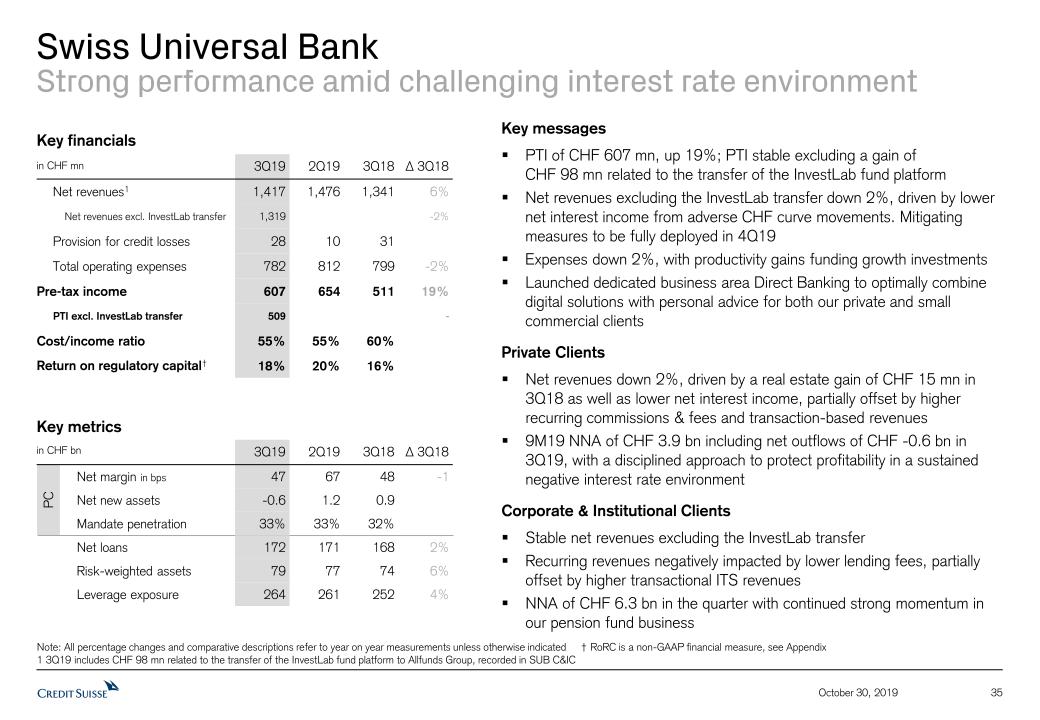
Swiss Universal Bank Strong performance amid challenging interest rate environment Note: All percentage changes and comparative descriptions refer to year on year measurements unless otherwise indicated † RoRC is a non-GAAP financial measure, see Appendix1 3Q19 includes CHF 98 mn related to the transfer of the InvestLab fund platform to Allfunds Group, recorded in SUB C&IC PC Key financials in CHF mn 3Q19 2Q19 3Q18 Δ 3Q18 Net revenues1 1,417 1,476 1,341 6% Net revenues excl. InvestLab transfer 1,319 -2% Provision for credit losses 28 10 31 Total operating expenses 782 812 799 -2% Pre-tax income 607 654 511 19% PTI excl. InvestLab transfer 509 - Cost/income ratio 55% 55% 60% Return on regulatory capital† 18% 20% 16% 35 October 30, 2019 Key metrics in CHF bn 3Q19 2Q19 3Q18 Δ 3Q18 Net margin in bps 47 67 48 -1 Net new assets -0.6 1.2 0.9 Mandate penetration 33% 33% 32% Net loans 172 171 168 2% Risk-weighted assets 79 77 74 6% Leverage exposure 264 261 252 4% Key messagesPTI of CHF 607 mn, up 19%; PTI stable excluding a gain of CHF 98 mn related to the transfer of the InvestLab fund platformNet revenues excluding the InvestLab transfer down 2%, driven by lower net interest income from adverse CHF curve movements. Mitigating measures to be fully deployed in 4Q19Expenses down 2%, with productivity gains funding growth investmentsLaunched dedicated business area Direct Banking to optimally combine digital solutions with personal advice for both our private and small commercial clients Private ClientsNet revenues down 2%, driven by a real estate gain of CHF 15 mn in 3Q18 as well as lower net interest income, partially offset by higher recurring commissions & fees and transaction-based revenues9M19 NNA of CHF 3.9 bn including net outflows of CHF -0.6 bn in 3Q19, with a disciplined approach to protect profitability in a sustained negative interest rate environmentCorporate & Institutional ClientsStable net revenues excluding the InvestLab transferRecurring revenues negatively impacted by lower lending fees, partially offset by higher transactional ITS revenuesNNA of CHF 6.3 bn in the quarter with continued strong momentum in our pension fund business
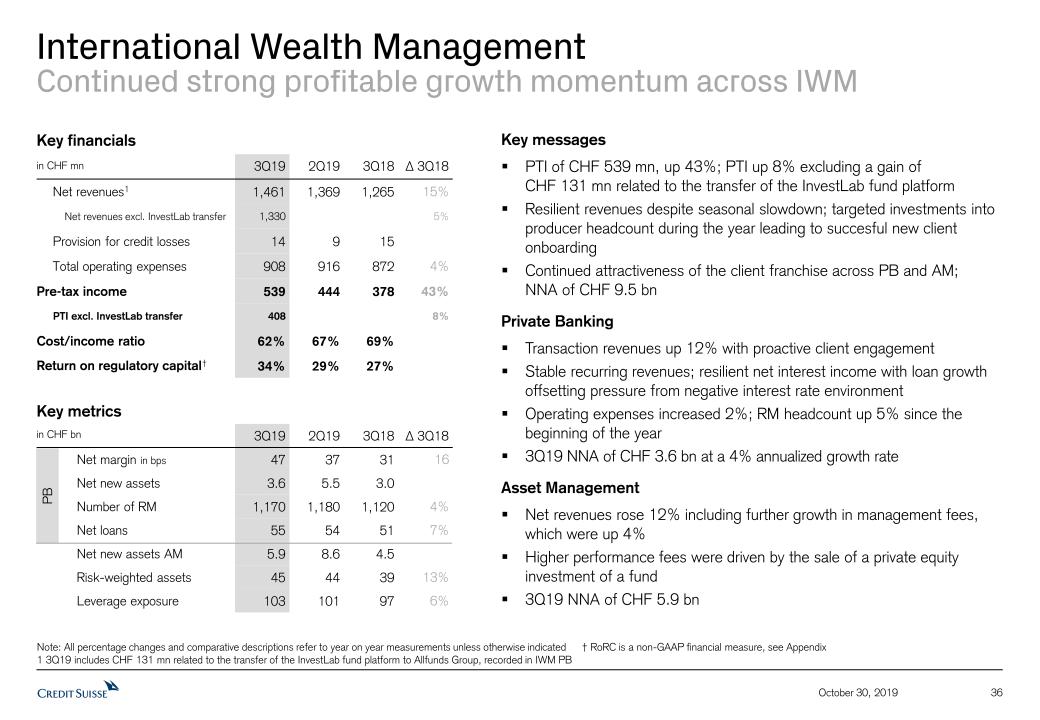
Key metrics in CHF bn 3Q19 2Q19 3Q18 Δ 3Q18 Net margin in bps 47 37 31 16 Net new assets 3.6 5.5 3.0 Number of RM 1,170 1,180 1,120 4% Net loans 55 54 51 7% Net new assets AM 5.9 8.6 4.5 Risk-weighted assets 45 44 39 13% Leverage exposure 103 101 97 6% International Wealth ManagementContinued strong profitable growth momentum across IWM PB Key financials in CHF mn 3Q19 2Q19 3Q18 Δ 3Q18 Net revenues1 1,461 1,369 1,265 15% Net revenues excl. InvestLab transfer 1,330 5% Provision for credit losses 14 9 15 Total operating expenses 908 916 872 4% Pre-tax income 539 444 378 43% PTI excl. InvestLab transfer 408 8% Cost/income ratio 62% 67% 69% Return on regulatory capital† 34% 29% 27% 36 October 30, 2019 Note: All percentage changes and comparative descriptions refer to year on year measurements unless otherwise indicated † RoRC is a non-GAAP financial measure, see Appendix1 3Q19 includes CHF 131 mn related to the transfer of the InvestLab fund platform to Allfunds Group, recorded in IWM PB Key messagesPTI of CHF 539 mn, up 43%; PTI up 8% excluding a gain of CHF 131 mn related to the transfer of the InvestLab fund platformResilient revenues despite seasonal slowdown; targeted investments into producer headcount during the year leading to succesful new client onboardingContinued attractiveness of the client franchise across PB and AM;NNA of CHF 9.5 bnPrivate BankingTransaction revenues up 12% with proactive client engagementStable recurring revenues; resilient net interest income with loan growth offsetting pressure from negative interest rate environmentOperating expenses increased 2%; RM headcount up 5% since the beginning of the year3Q19 NNA of CHF 3.6 bn at a 4% annualized growth rateAsset ManagementNet revenues rose 12% including further growth in management fees, which were up 4%Higher performance fees were driven by the sale of a private equity investment of a fund3Q19 NNA of CHF 5.9 bn
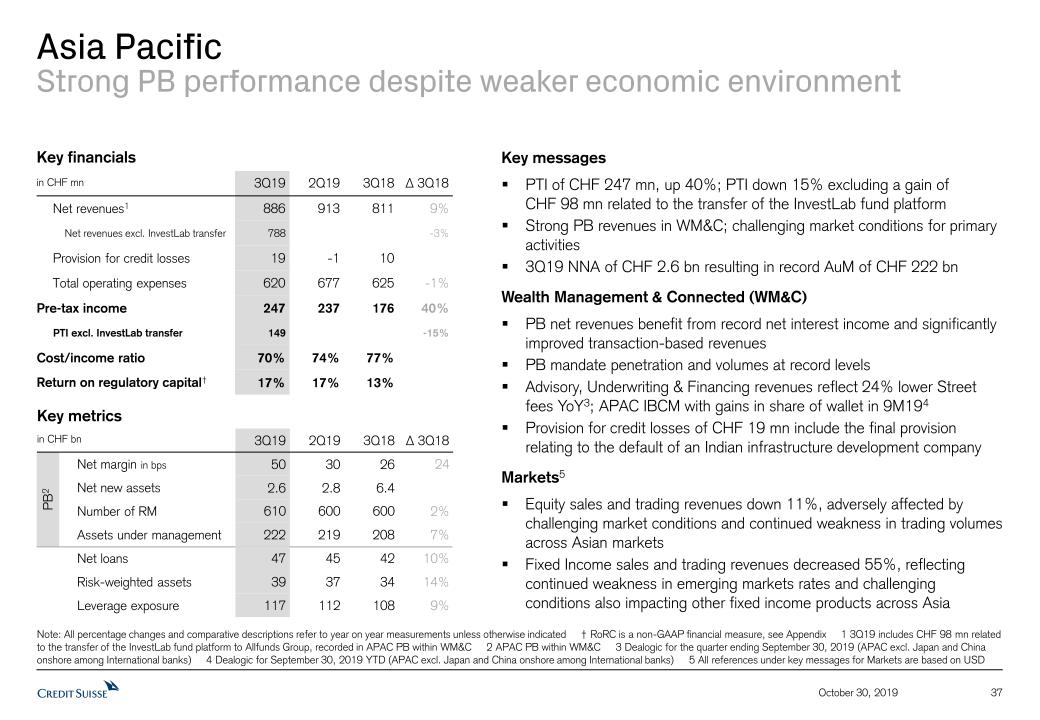
Asia PacificStrong PB performance despite weaker economic environment PB2 Key financials in CHF mn 3Q19 2Q19 3Q18 Δ 3Q18 Net revenues1 886 913 811 9% Net revenues excl. InvestLab transfer 788 -3% Provision for credit losses 19 -1 10 Total operating expenses 620 677 625 -1% Pre-tax income 247 237 176 40% PTI excl. InvestLab transfer 149 -15% Cost/income ratio 70% 74% 77% Return on regulatory capital† 17% 17% 13% 37 October 30, 2019 Key messagesPTI of CHF 247 mn, up 40%; PTI down 15% excluding a gain of CHF 98 mn related to the transfer of the InvestLab fund platformStrong PB revenues in WM&C; challenging market conditions for primary activities3Q19 NNA of CHF 2.6 bn resulting in record AuM of CHF 222 bnWealth Management & Connected (WM&C)PB net revenues benefit from record net interest income and significantly improved transaction-based revenuesPB mandate penetration and volumes at record levels Advisory, Underwriting & Financing revenues reflect 24% lower Street fees YoY3; APAC IBCM with gains in share of wallet in 9M194Provision for credit losses of CHF 19 mn include the final provision relating to the default of an Indian infrastructure development company Markets5Equity sales and trading revenues down 11%, adversely affected by challenging market conditions and continued weakness in trading volumes across Asian marketsFixed Income sales and trading revenues decreased 55%, reflecting continued weakness in emerging markets rates and challenging conditions also impacting other fixed income products across Asia Key metrics in CHF bn 3Q19 2Q19 3Q18 Δ 3Q18 Net margin in bps 50 30 26 24 Net new assets 2.6 2.8 6.4 Number of RM 610 600 600 2% Assets under management 222 219 208 7% Net loans 47 45 42 10% Risk-weighted assets 39 37 34 14% Leverage exposure 117 112 108 9% Note: All percentage changes and comparative descriptions refer to year on year measurements unless otherwise indicated † RoRC is a non-GAAP financial measure, see Appendix 1 3Q19 includes CHF 98 mn related to the transfer of the InvestLab fund platform to Allfunds Group, recorded in APAC PB within WM&C 2 APAC PB within WM&C 3 Dealogic for the quarter ending September 30, 2019 (APAC excl. Japan and China onshore among International banks) 4 Dealogic for September 30, 2019 YTD (APAC excl. Japan and China onshore among International banks) 5 All references under key messages for Markets are based on USD
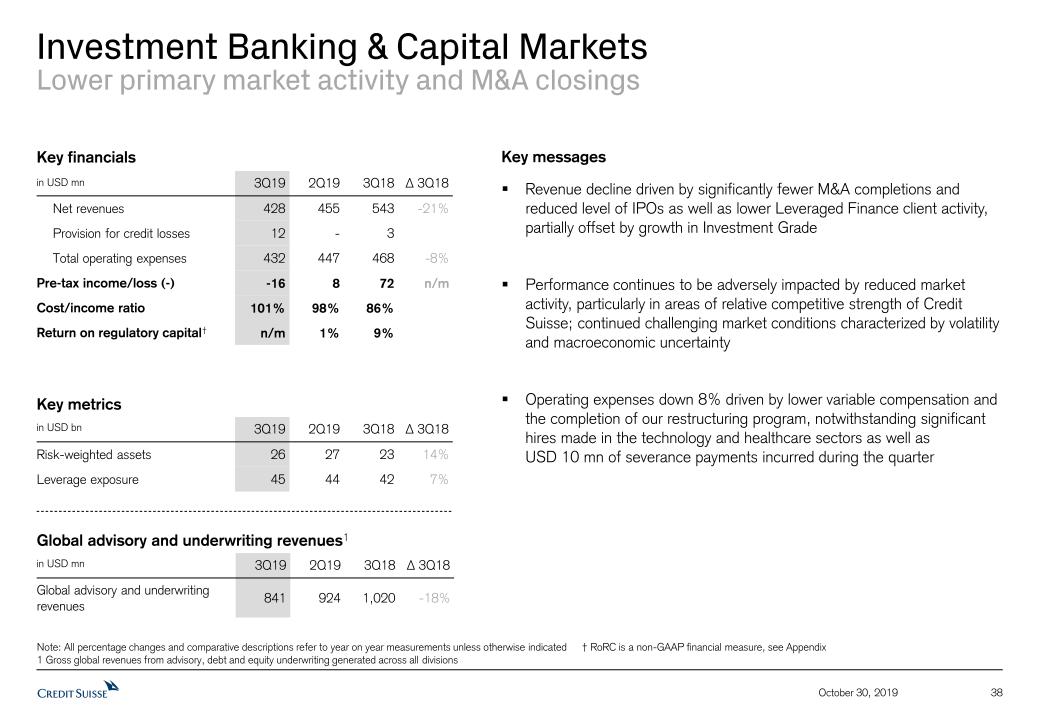
Investment Banking & Capital Markets Lower primary market activity and M&A closings Key metrics in USD bn 3Q19 2Q19 3Q18 Δ 3Q18 Risk-weighted assets 26 27 23 14% Leverage exposure 45 44 42 7% Key financials in USD mn 3Q19 2Q19 3Q18 Δ 3Q18 Net revenues 428 455 543 -21% Provision for credit losses 12 - 3 Total operating expenses 432 447 468 -8% Pre-tax income/loss (-) -16 8 72 n/m Cost/income ratio 101% 98% 86% Return on regulatory capital† n/m 1% 9% Global advisory and underwriting revenues1 in USD mn 3Q19 2Q19 3Q18 Δ 3Q18 Global advisory and underwriting revenues 841 924 1,020 -18% 38 October 30, 2019 Note: All percentage changes and comparative descriptions refer to year on year measurements unless otherwise indicated † RoRC is a non-GAAP financial measure, see Appendix 1 Gross global revenues from advisory, debt and equity underwriting generated across all divisions Key messagesRevenue decline driven by significantly fewer M&A completions and reduced level of IPOs as well as lower Leveraged Finance client activity, partially offset by growth in Investment GradePerformance continues to be adversely impacted by reduced market activity, particularly in areas of relative competitive strength of Credit Suisse; continued challenging market conditions characterized by volatility and macroeconomic uncertaintyOperating expenses down 8% driven by lower variable compensation and the completion of our restructuring program, notwithstanding significant hires made in the technology and healthcare sectors as well as USD 10 mn of severance payments incurred during the quarter
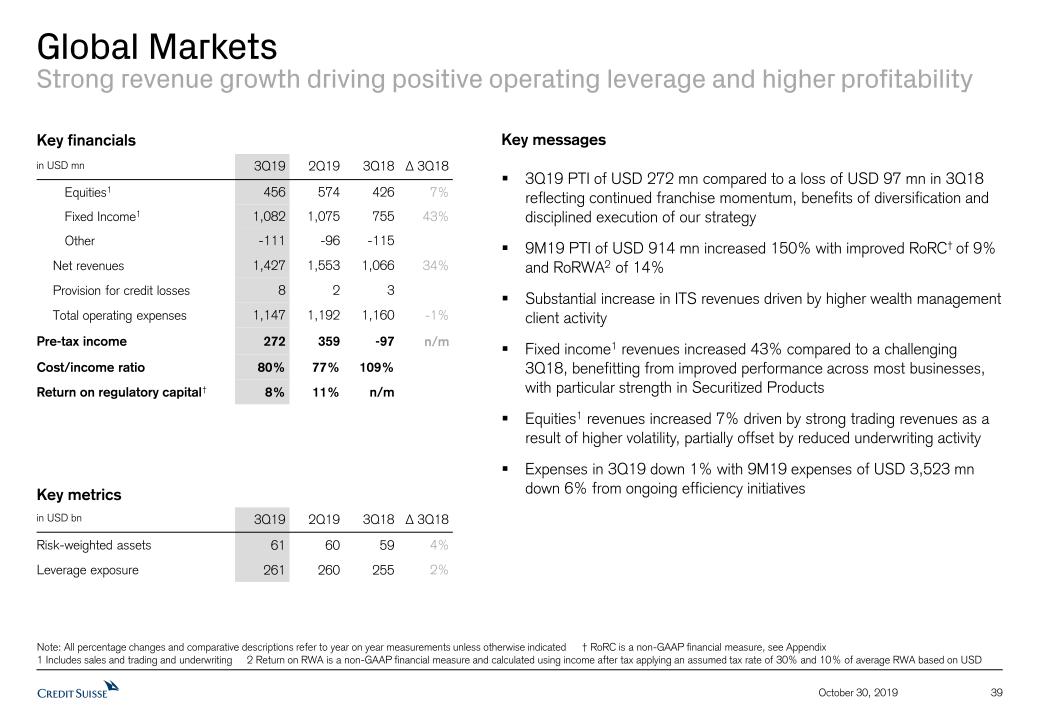
Global MarketsStrong revenue growth driving positive operating leverage and higher profitability Note: All percentage changes and comparative descriptions refer to year on year measurements unless otherwise indicated † RoRC is a non-GAAP financial measure, see Appendix 1 Includes sales and trading and underwriting 2 Return on RWA is a non-GAAP financial measure and calculated using income after tax applying an assumed tax rate of 30% and 10% of average RWA based on USD Key metrics in USD bn 3Q19 2Q19 3Q18 Δ 3Q18 Risk-weighted assets 61 60 59 4% Leverage exposure 261 260 255 2% Key financials in USD mn 3Q19 2Q19 3Q18 Δ 3Q18 Equities1 456 574 426 7% Fixed Income1 1,082 1,075 755 43% Other -111 -96 -115 Net revenues 1,427 1,553 1,066 34% Provision for credit losses 8 2 3 Total operating expenses 1,147 1,192 1,160 -1% Pre-tax income 272 359 -97 n/m Cost/income ratio 80% 77% 109% Return on regulatory capital† 8% 11% n/m 39 October 30, 2019 Key messages3Q19 PTI of USD 272 mn compared to a loss of USD 97 mn in 3Q18 reflecting continued franchise momentum, benefits of diversification and disciplined execution of our strategy9M19 PTI of USD 914 mn increased 150% with improved RoRC† of 9% and RoRWA2 of 14%Substantial increase in ITS revenues driven by higher wealth management client activity Fixed income1 revenues increased 43% compared to a challenging 3Q18, benefitting from improved performance across most businesses, with particular strength in Securitized ProductsEquities1 revenues increased 7% driven by strong trading revenues as a result of higher volatility, partially offset by reduced underwriting activityExpenses in 3Q19 down 1% with 9M19 expenses of USD 3,523 mn down 6% from ongoing efficiency initiatives

Summary 40 October 30, 2019
Summary 41 October 30, 2019 Continued year-on-year improvement in returnsDelivering profitable growth in Wealth ManagementSignificant improvement in Global Markets performance after three years of deep restructuring Growing TBVPS‡ – increased at 9% CAGR in 9M19Returned CHF 1.4 bn of capital to our shareholders in 9M19 ‡ Tangible book value per share is a non-GAAP financial measures, see Appendix
Appendix 42 October 30, 2019
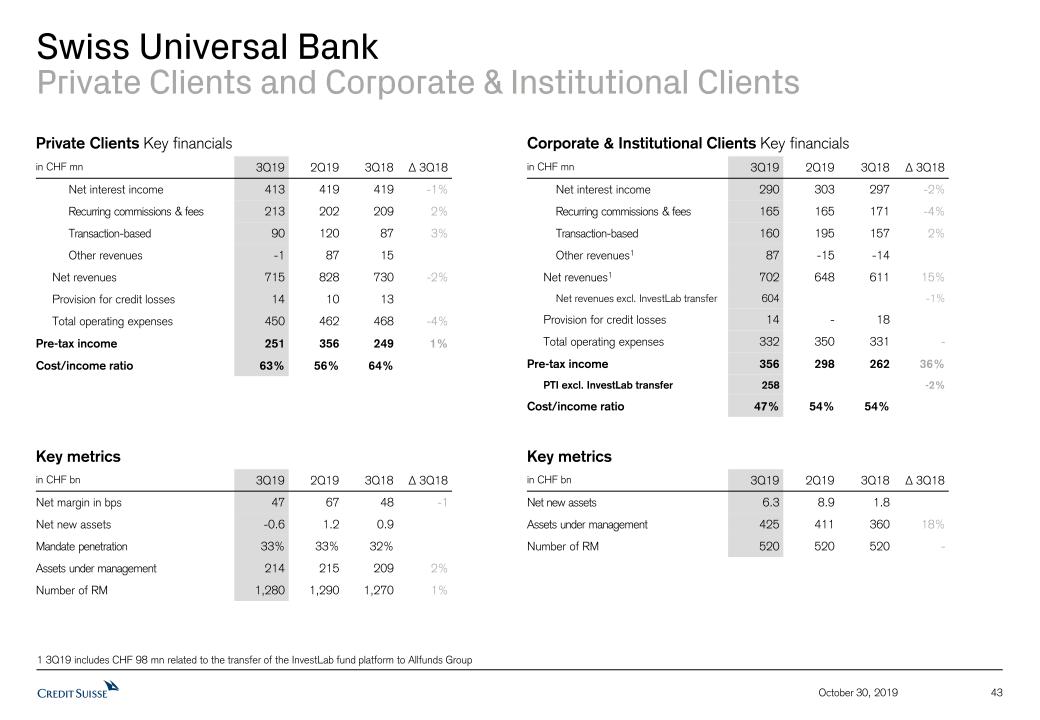
Swiss Universal BankPrivate Clients and Corporate & Institutional Clients Corporate & Institutional Clients Key financials in CHF mn 3Q19 2Q19 3Q18 Δ 3Q18 Net interest income 290 303 297 -2% Recurring commissions & fees 165 165 171 -4% Transaction-based 160 195 157 2% Other revenues1 87 -15 -14 Net revenues1 702 648 611 15% Net revenues excl. InvestLab transfer 604 -1% Provision for credit losses 14 - 18 Total operating expenses 332 350 331 - Pre-tax income 356 298 262 36% PTI excl. InvestLab transfer 258 -2% Cost/income ratio 47% 54% 54% Key metrics in CHF bn 3Q19 2Q19 3Q18 Δ 3Q18 Net margin in bps 47 67 48 -1 Net new assets -0.6 1.2 0.9 Mandate penetration 33% 33% 32% Assets under management 214 215 209 2% Number of RM 1,280 1,290 1,270 1% Key metrics in CHF bn 3Q19 2Q19 3Q18 Δ 3Q18 Net new assets 6.3 8.9 1.8 Assets under management 425 411 360 18% Number of RM 520 520 520 - Private Clients Key financials in CHF mn 3Q19 2Q19 3Q18 Δ 3Q18 Net interest income 413 419 419 -1% Recurring commissions & fees 213 202 209 2% Transaction-based 90 120 87 3% Other revenues -1 87 15 Net revenues 715 828 730 -2% Provision for credit losses 14 10 13 Total operating expenses 450 462 468 -4% Pre-tax income 251 356 249 1% Cost/income ratio 63% 56% 64% 43 October 30, 2019 1 3Q19 includes CHF 98 mn related to the transfer of the InvestLab fund platform to Allfunds Group
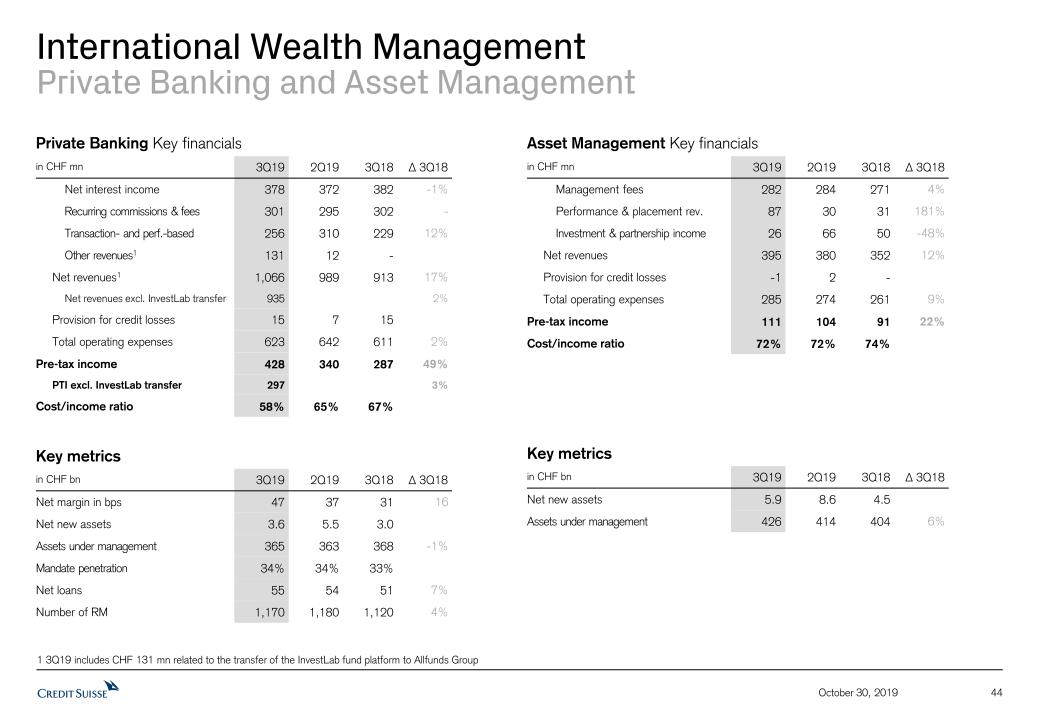
International Wealth ManagementPrivate Banking and Asset Management Private Banking Key financials in CHF mn 3Q19 2Q19 3Q18 Δ 3Q18 Net interest income 378 372 382 -1% Recurring commissions & fees 301 295 302 - Transaction- and perf.-based 256 310 229 12% Other revenues1 131 12 - Net revenues1 1,066 989 913 17% Net revenues excl. InvestLab transfer 935 2% Provision for credit losses 15 7 15 Total operating expenses 623 642 611 2% Pre-tax income 428 340 287 49% PTI excl. InvestLab transfer 297 3% Cost/income ratio 58% 65% 67% Key metrics in CHF bn 3Q19 2Q19 3Q18 Δ 3Q18 Net margin in bps 47 37 31 16 Net new assets 3.6 5.5 3.0 Assets under management 365 363 368 -1% Mandate penetration 34% 34% 33% Net loans 55 54 51 7% Number of RM 1,170 1,180 1,120 4% Asset Management Key financials in CHF mn 3Q19 2Q19 3Q18 Δ 3Q18 Management fees 282 284 271 4% Performance & placement rev. 87 30 31 181% Investment & partnership income 26 66 50 -48% Net revenues 395 380 352 12% Provision for credit losses -1 2 - Total operating expenses 285 274 261 9% Pre-tax income 111 104 91 22% Cost/income ratio 72% 72% 74% Key metrics in CHF bn 3Q19 2Q19 3Q18 Δ 3Q18 Net new assets 5.9 8.6 4.5 Assets under management 426 414 404 6% 44 October 30, 2019 1 3Q19 includes CHF 131 mn related to the transfer of the InvestLab fund platform to Allfunds Group
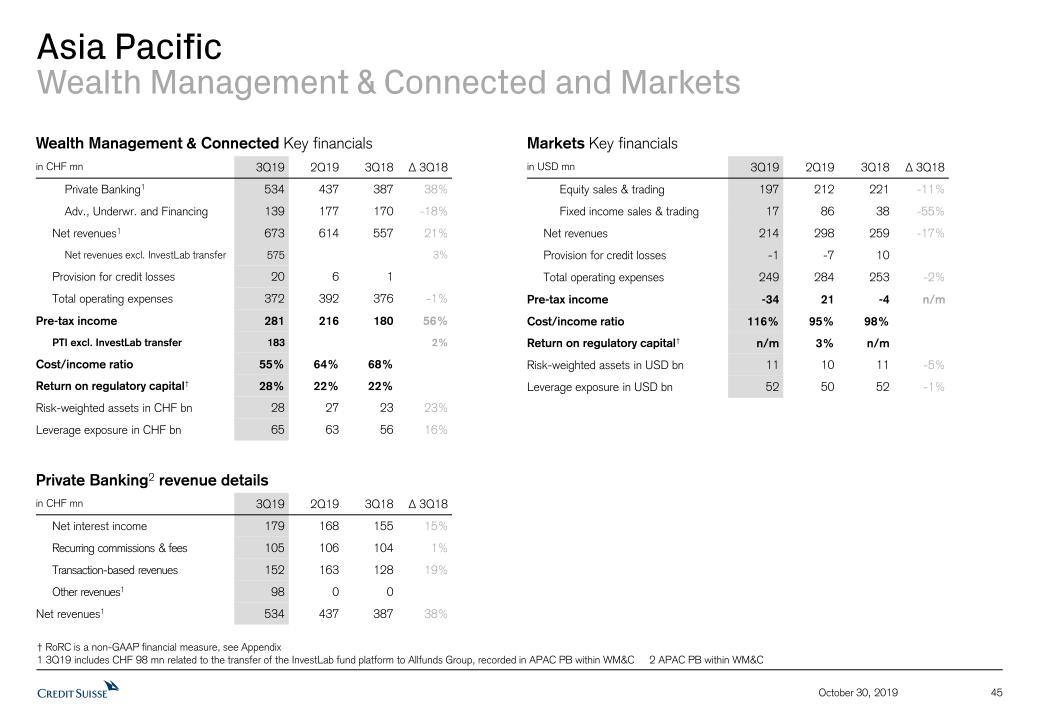
Asia PacificWealth Management & Connected and Markets † RoRC is a non-GAAP financial measure, see Appendix 1 3Q19 includes CHF 98 mn related to the transfer of the InvestLab fund platform to Allfunds Group, recorded in APAC PB within WM&C 2 APAC PB within WM&C Wealth Management & Connected Key financials in CHF mn 3Q19 2Q19 3Q18 Δ 3Q18 Private Banking1 534 437 387 38% Adv., Underwr. and Financing 139 177 170 -18% Net revenues1 673 614 557 21% Net revenues excl. InvestLab transfer 575 3% Provision for credit losses 20 6 1 Total operating expenses 372 392 376 -1% Pre-tax income 281 216 180 56% PTI excl. InvestLab transfer 183 2% Cost/income ratio 55% 64% 68% Return on regulatory capital† 28% 22% 22% Risk-weighted assets in CHF bn 28 27 23 23% Leverage exposure in CHF bn 65 63 56 16% Markets Key financials in USD mn 3Q19 2Q19 3Q18 Δ 3Q18 Equity sales & trading 197 212 221 -11% Fixed income sales & trading 17 86 38 -55% Net revenues 214 298 259 -17% Provision for credit losses -1 -7 10 Total operating expenses 249 284 253 -2% Pre-tax income -34 21 -4 n/m Cost/income ratio 116% 95% 98% Return on regulatory capital† n/m 3% n/m Risk-weighted assets in USD bn 11 10 11 -5% Leverage exposure in USD bn 52 50 52 -1% Private Banking2 revenue details in CHF mn 3Q19 2Q19 3Q18 Δ 3Q18 Net interest income 179 168 155 15% Recurring commissions & fees 105 106 104 1% Transaction-based revenues 152 163 128 19% Other revenues1 98 0 0 Net revenues1 534 437 387 38% 45 October 30, 2019
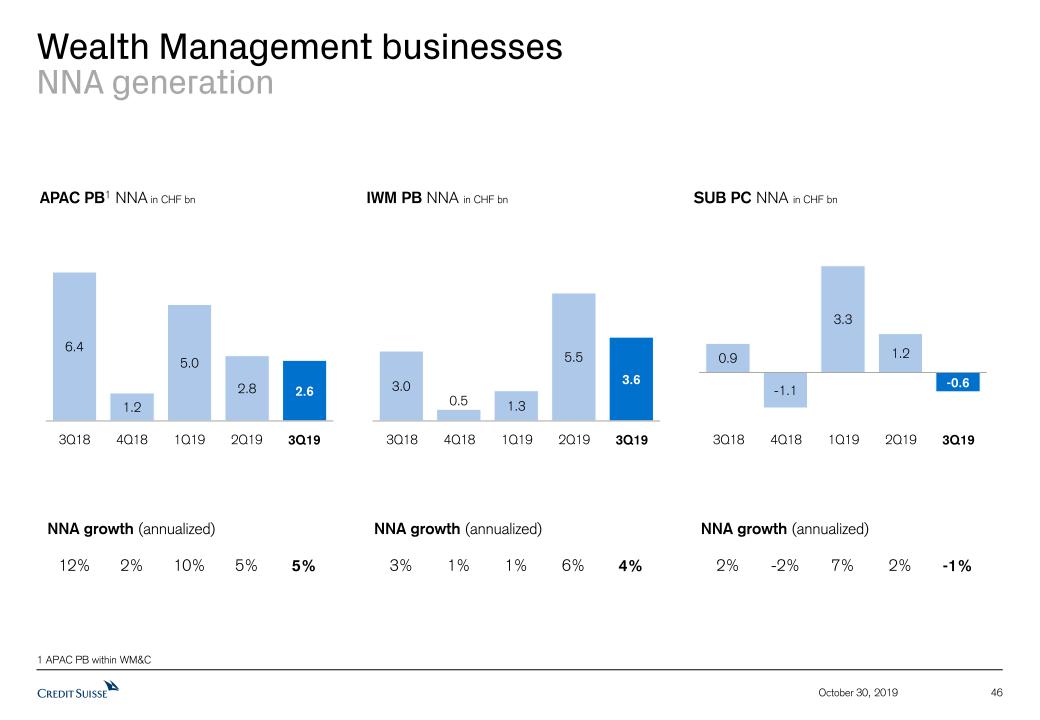
Wealth Management businessesNNA generation IWM PB NNA in CHF bn NNA growth (annualized) 4% SUB PC NNA in CHF bn NNA growth (annualized) -1% 1 APAC PB within WM&C 3Q19 3Q19 NNA growth (annualized) 5% APAC PB1 NNA in CHF bn 3Q19 46 October 30, 2019 5% 12% 10% 2% 6% 3% 1% 1% 2% 2% 7% -2% 2Q19 3Q18 4Q18 1Q19 2Q19 3Q18 4Q18 1Q19 2Q19 3Q18 4Q18 1Q19
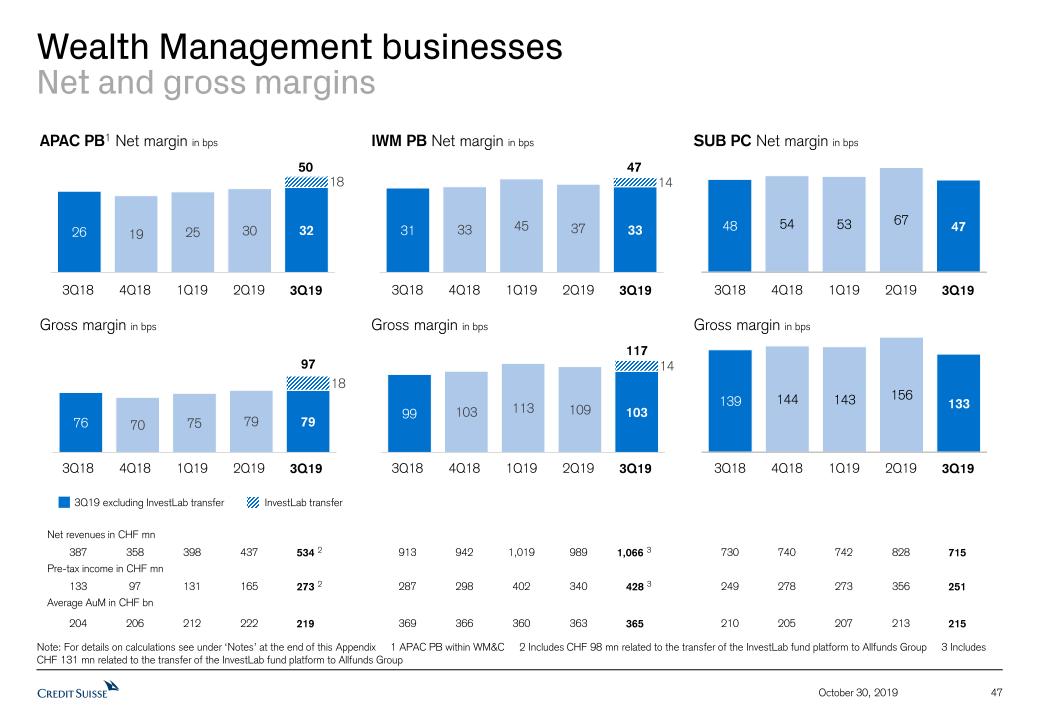
Wealth Management businessesNet and gross margins Note: For details on calculations see under ‘Notes’ at the end of this Appendix 1 APAC PB within WM&C 2 Includes CHF 98 mn related to the transfer of the InvestLab fund platform to Allfunds Group 3 Includes CHF 131 mn related to the transfer of the InvestLab fund platform to Allfunds Group IWM PB Net margin in bps Gross margin in bps SUB PC Net margin in bps Gross margin in bps 365 215 428 3 251 1,066 3 715 APAC PB1 Net margin in bps Gross margin in bps 219 Average AuM in CHF bn 273 2 Pre-tax income in CHF mn 534 2 Net revenues in CHF mn 3Q19 47 October 30, 2019 2Q19 4Q18 3Q18 1Q19 3Q19 2Q19 4Q18 3Q18 1Q19 3Q19 2Q19 4Q18 3Q18 1Q19 3Q19 2Q19 4Q18 3Q18 1Q19 3Q19 2Q19 4Q18 3Q18 1Q19 3Q19 2Q19 4Q18 3Q18 1Q19 437 398 387 358 165 131 133 97 222 212 204 206 989 1,019 913 942 340 402 287 298 363 360 369 366 828 742 730 740 356 273 249 278 213 207 210 205 117 3Q19 excluding InvestLab transfer InvestLab transfer 47 97 50
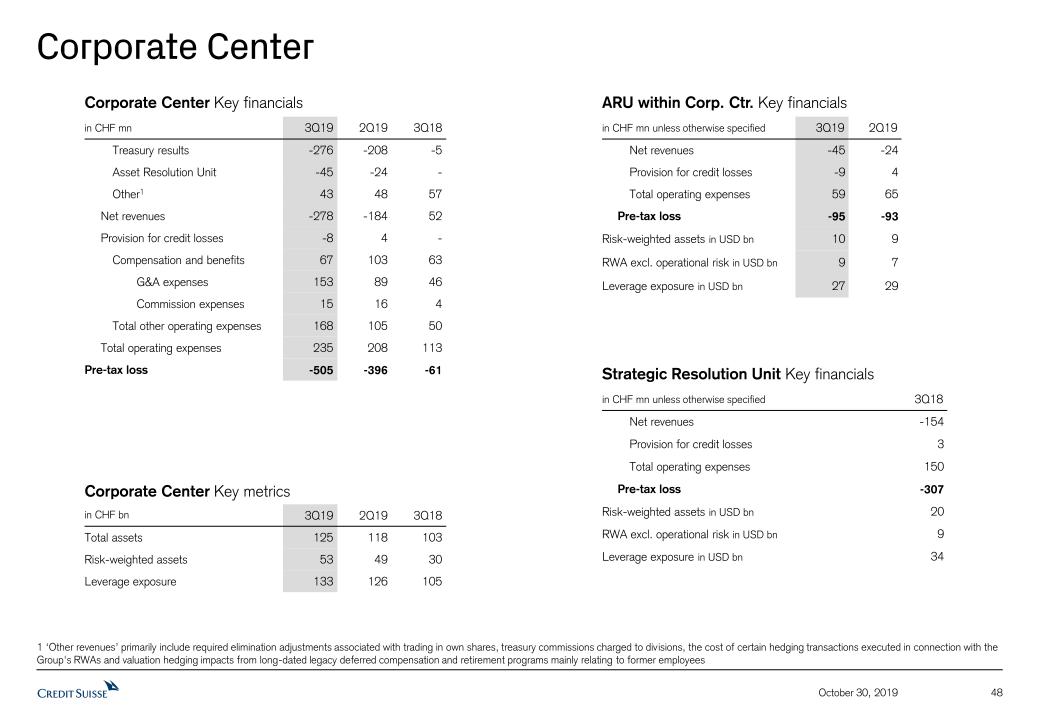
Corporate Center 48 October 30, 2019 1 ‘Other revenues’ primarily include required elimination adjustments associated with trading in own shares, treasury commissions charged to divisions, the cost of certain hedging transactions executed in connection with the Group's RWAs and valuation hedging impacts from long-dated legacy deferred compensation and retirement programs mainly relating to former employees ARU within Corp. Ctr. Key financials in CHF mn unless otherwise specified 3Q19 2Q19 Net revenues -45 -24 Provision for credit losses -9 4 Total operating expenses 59 65 Pre-tax loss -95 -93 Risk-weighted assets in USD bn 10 9 RWA excl. operational risk in USD bn 9 7 Leverage exposure in USD bn 27 29 Corporate Center Key metrics in CHF bn 3Q19 2Q19 3Q18 Total assets 125 118 103 Risk-weighted assets 53 49 30 Leverage exposure 133 126 105 Corporate Center Key financials in CHF mn 3Q19 2Q19 3Q18 Treasury results -276 -208 -5 Asset Resolution Unit -45 -24 - Other1 43 48 57 Net revenues -278 -184 52 Provision for credit losses -8 4 - Compensation and benefits 67 103 63 G&A expenses 153 89 46 Commission expenses 15 16 4 Total other operating expenses 168 105 50 Total operating expenses 235 208 113 Pre-tax loss -505 -396 -61 Strategic Resolution Unit Key financials in CHF mn unless otherwise specified 3Q18 Net revenues -154 Provision for credit losses 3 Total operating expenses 150 Pre-tax loss -307 Risk-weighted assets in USD bn 20 RWA excl. operational risk in USD bn 9 Leverage exposure in USD bn 34
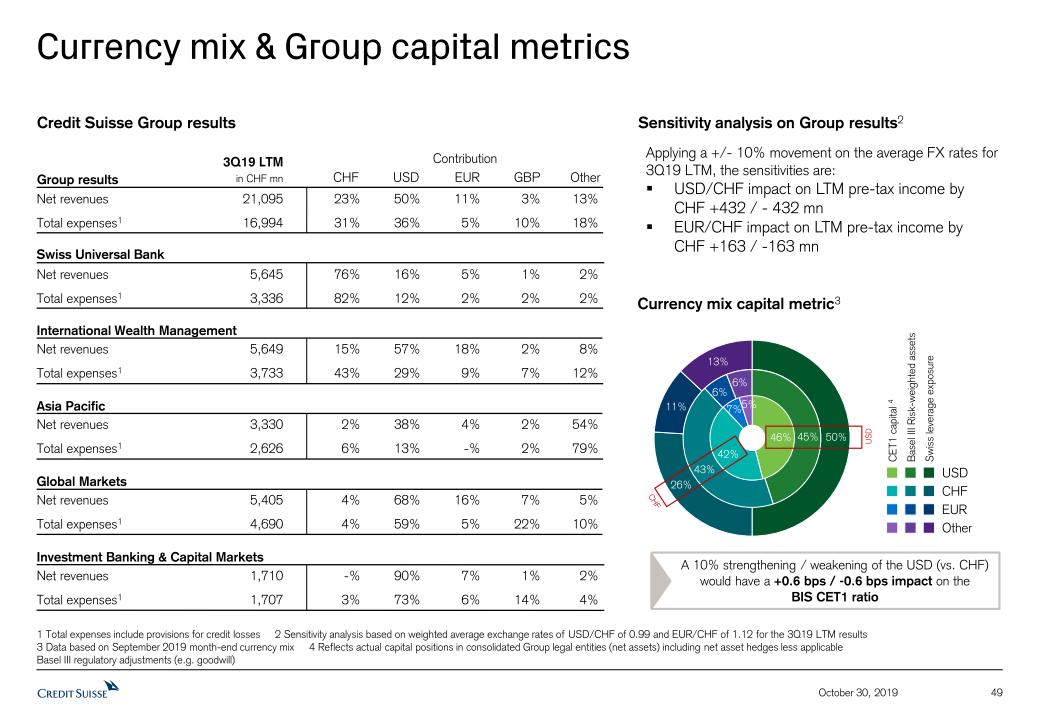
Currency mix & Group capital metrics 49 October 30, 2019 1 Total expenses include provisions for credit losses 2 Sensitivity analysis based on weighted average exchange rates of USD/CHF of 0.99 and EUR/CHF of 1.12 for the 3Q19 LTM results 3 Data based on September 2019 month-end currency mix 4 Reflects actual capital positions in consolidated Group legal entities (net assets) including net asset hedges less applicable Basel III regulatory adjustments (e.g. goodwill) Credit Suisse Group results 3Q19 LTMin CHF mn Applying a +/- 10% movement on the average FX rates for 3Q19 LTM, the sensitivities are:USD/CHF impact on LTM pre-tax income by CHF +432 / - 432 mnEUR/CHF impact on LTM pre-tax income by CHF +163 / -163 mn Sensitivity analysis on Group results2 Contribution Swiss Universal Bank International Wealth Management Asia Pacific Global Markets Investment Banking & Capital Markets Group results CHF USD EUR GBP Other Net revenues 21,095 23% 50% 11% 3% 13%Total expenses1 16,994 31% 36% 5% 10% 18% Net revenues 5,645 76% 16% 5% 1% 2%Total expenses1 3,336 82% 12% 2% 2% 2% Net revenues 5,649 15% 57% 18% 2% 8%Total expenses1 3,733 43% 29% 9% 7% 12% Net revenues 3,330 2% 38% 4% 2% 54%Total expenses1 2,626 6% 13% -% 2% 79% Net revenues 5,405 4% 68% 16% 7% 5%Total expenses1 4,690 4% 59% 5% 22% 10% Net revenues 1,710 -% 90% 7% 1% 2%Total expenses1 1,707 3% 73% 6% 14% 4% Currency mix capital metric3 A 10% strengthening / weakening of the USD (vs. CHF) would have a +0.6 bps / -0.6 bps impact on theBIS CET1 ratio Basel III Risk-weighted assets Swiss leverage exposure CHF EUR Other USD USD CET1 capital 4 CHF
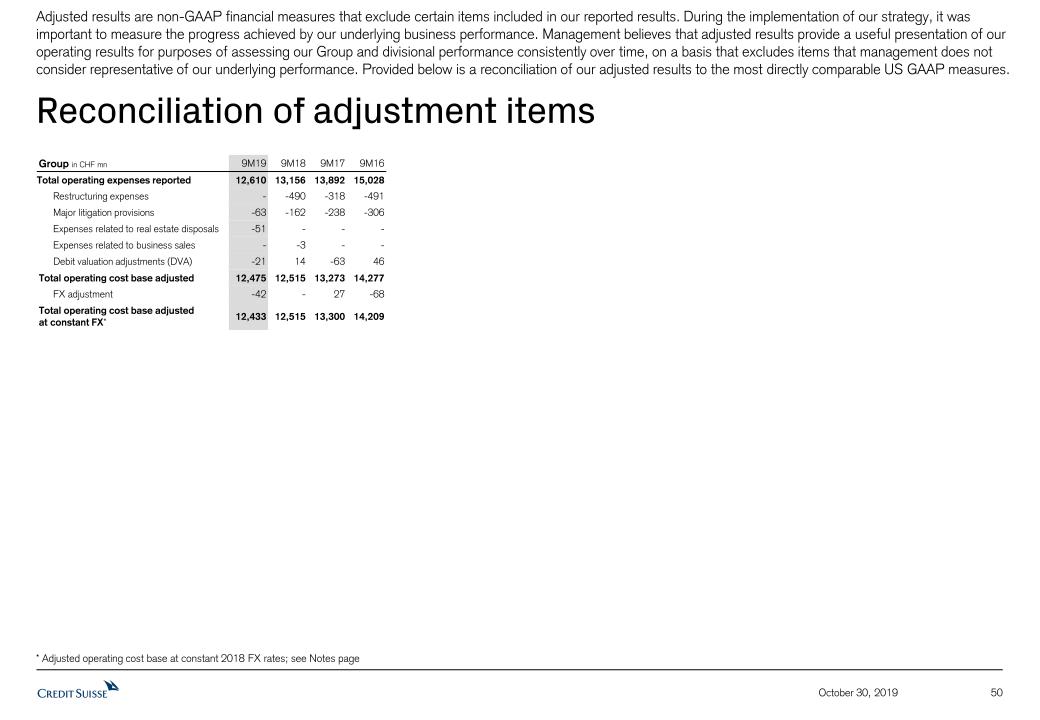
50 October 30, 2019 Reconciliation of adjustment items Adjusted results are non-GAAP financial measures that exclude certain items included in our reported results. During the implementation of our strategy, it was important to measure the progress achieved by our underlying business performance. Management believes that adjusted results provide a useful presentation of our operating results for purposes of assessing our Group and divisional performance consistently over time, on a basis that excludes items that management does not consider representative of our underlying performance. Provided below is a reconciliation of our adjusted results to the most directly comparable US GAAP measures. * Adjusted operating cost base at constant 2018 FX rates; see Notes page Group in CHF mn 9M19 9M18 9M17 9M16 Total operating expenses reported 12,610 13,156 13,892 15,028 Restructuring expenses - -490 -318 -491 Major litigation provisions -63 -162 -238 -306 Expenses related to real estate disposals -51 - - - Expenses related to business sales - -3 - - Debit valuation adjustments (DVA) -21 14 -63 46 Total operating cost base adjusted 12,475 12,515 13,273 14,277 FX adjustment -42 - 27 -68 Total operating cost base adjusted at constant FX* 12,433 12,515 13,300 14,209
Notes 51 October 30, 2019 General notesThroughout the presentation rounding differences may occurUnless otherwise noted, all CET1 ratio, Tier 1 leverage ratio, risk-weighted assets and leverage exposure figures shown in this presentation are as of the end of the respective period and on a “look-through” basisGross and net margins are shown in basis pointsGross margin = net revenues annualized / average AuM; net margin = pre-tax income annualized / average AuMMandate penetration reflects advisory and discretionary mandate volumes as a percentage of AuM, excluding those from the external asset manager businessSpecific notes* Following the successful completion of our restructuring program in 2018, we updated our calculation approach for adjusted operating cost base at constant FX rates. Beginning in 1Q19, adjusted operating cost base at constant FX rates includes adjustments for major litigation provisions, expenses related to real estate disposals and business sales as well as for debit valuation adjustments (DVA) related volatility and FX, but not for restructuring expenses and certain accounting changes. Adjustments for FX apply unweighted 2018 currency exchange rates, i.e., a straight line average of monthly rates, consistently for the periods under review. Under the current presentation, adjusted operating cost base at constant FX rates for periods prior to 1Q19 still include adjustments for restructuring expenses and a goodwill impairment taken in 4Q15, but no longer include an adjustment for certain accounting changes.† Regulatory capital is calculated as the worst of 10% of RWA and 3.5% of leverage exposure. Return on regulatory capital (a non-GAAP financial measure) is calculated using income / (loss) after tax and assumes a tax rate of 30% and capital allocated based on the worst of 10% of average RWA and 3.5% of average leverage exposure. For the Markets business within the APAC division and for the Global Markets and Investment Banking & Capital Markets divisions, return on regulatory capital is based on US dollar denominated numbers. ‡ Return on tangible equity is based on tangible shareholders’ equity, a non-GAAP financial measure, which is calculated by deducting goodwill and other intangible assets from total shareholders’ equity as presented in our balance sheet. Tangible book value, a non-GAAP financial measure, is equal to tangible shareholders’ equity. Tangible book value per share is a non-GAAP financial measure, which is calculated by dividing tangible shareholders' equity by total number of shares outstanding. Management believes that tangible shareholders’ equity/tangible book value, return on tangible equity and tangible book value per share are meaningful as they are measures used and relied upon by industry analysts and investors to assess valuations and capital adequacy. For end-3Q16, tangible equity excluded goodwill of CHF 4,725 mn and other intangible assets of CHF 192 mn from total shareholders’ equity of CHF 44,276 mn as presented in our balance sheet. For end-3Q17, tangible equity excluded goodwill of CHF 4,715 mn and other intangible assets of CHF 219 mn from total shareholders’ equity of CHF 43,858 mn as presented in our balance sheet. For end-3Q18, tangible equity excluded goodwill of CHF 4,736 mn and other intangible assets of CHF 214 mn from total shareholders’ equity of CHF 42,734 mn as presented in our balance sheet. For end-4Q18, tangible equity excluded goodwill of CHF 4,766 mn and other intangible assets of CHF 219 mn from total shareholders’ equity of CHF 43,922 mn as presented in our balance sheet. For end-2Q19, tangible equity excluded goodwill of CHF 4,731 mn and other intangible assets of CHF 216 mn from total shareholders’ equity of CHF 43,673 mn as presented in our balance sheet. For end-3Q19, tangible equity excluded goodwill of CHF 4,760 mn and other intangible assets of CHF 219 mn from total shareholders’ equity of CHF 45,150 mn as presented in our balance sheet. Shares outstanding were 2,552.4 mn at end-3Q18, 2,550.6 at end-4Q18 and 2,473.8 mn at end-3Q19.AbbreviationsAdv. = Advisory; AES = Advanced Execution Services; AM = Asset Management; APAC = Asia Pacific; ARU = Asset Resolution Unit; AT1 = Additional Tier 1; attr. = attributable; AuM = Assets under Management; BCBS = Basel Committee on Banking Supervision; BIS = Bank for International Settlements; bps = basis points; CAGR = Compound Annual Growth Rate; CET1 = Common Equity Tier 1; C&IC = Corporate & Institutional Clients; Corp. = Corporate(s); Corp. Ctr. = Corporate Center; DVA = Debit Valuation Adjustments; ECM = Equity Capital Markets; excl. = excluding; FINMA = Swiss Financial Market Supervisory Authority; FX = Foreign Exchange; GAAP = Generally Accepted Accounting Principles; GM = Global Markets; IBCM = Investment Banking & Capital Markets; incl. = including; IPO = Initial Public Offering; ITS = International Trading Solutions; IWM = International Wealth Management; LTM = Last Twelve Months; M&A = Mergers & Acquisitions; NII = Net interest income; n/m = not meaningful; NNA = Net New Assets; PB = Private Banking; PC = Private Clients; perf. = performance; PTI = Pre-tax income; rev. = revenues; RM = Relationship Manager; RoA = Return on Assets; RoRC = Return on Regulatory Capital; RoRWA = Return on Risk-weighted assets; RoTE = Return on Tangible Equity; RWA = Risk-weighted assets; SoW = Share of Wallet; SRU = Strategic Resolution Unit; SUB = Swiss Universal Bank; TBVPS = Tangible Book Value Per Share; (U)HNW = (Ultra) High Net Worth; Underwr. = Underwriting; WM&C = Wealth Management & Connected; YoY = Year on year; YTD = Year to Date

Pursuant to the requirements of the Securities Exchange Act of 1934, the registrants have duly caused this report to be signed on their behalf by the undersigned, thereunto duly authorized.
CREDIT SUISSE GROUP AG and CREDIT SUISSE AG
(Registrants)
Date: October 30, 2019
By:
/s/ Tidjane Thiam
Tidjane Thiam
Chief Executive Officer
By:
/s/ David R. Mathers
David R. Mathers
Chief Financial Officer