UNITED STATES
SECURITIES AND EXCHANGE COMMISSION
REPORT OF FOREIGN PRIVATE ISSUER PURSUANT TO RULE 13a-16 OR 15d-16
UNDER THE SECURITIES EXCHANGE ACT OF 1934
Commission File Number 001-15244
(Translation of registrant’s name into English)
Paradeplatz 8, 8001 Zurich, Switzerland
(Address of principal executive office)
Commission File Number 001-33434
(Translation of registrant’s name into English)
Paradeplatz 8, 8001 Zurich, Switzerland
(Address of principal executive office)
Indicate by check mark whether the registrant files or will file annual reports under cover of Form 20-F or Form 40-F.
Form 20-F  Form 40-F
Indicate by check mark if the registrant is submitting the Form 6-K in paper as permitted by Regulation S-T Rule 101(b)(1):
Note: Regulation S-T Rule 101(b)(1) only permits the submission in paper of a Form 6-K if submitted solely to provide an attached annual report to security holders.
Indicate by check mark if the registrant is submitting the Form 6-K in paper as permitted by Regulation S-T Rule 101(b)(7):
Note: Regulation S-T Rule 101(b)(7) only permits the submission in paper of a Form 6-K if submitted to furnish a report or other document that the registrant foreign private issuer must furnish and make public under the laws of the jurisdiction in which the registrant is incorporated, domiciled or legally organized (the registrant’s “home country”), or under the rules of the home country exchange on which the registrant’s securities are traded, as long as the report or other document is not a press release, is not required to be and has not been distributed to the registrant’s security holders, and, if discussing a material event, has already been the subject of a Form 6-K submission or other Commission filing on EDGAR.
This report includes the media release and the slides for the presentation to investors in connection with the 1Q20 results.
Media release Zurich, April 23, 2020 | |
| | |
| First quarter 2020 financial results |
Resilient performance amid market dislocation
Highlights:
| - | Pre-tax income of CHF 1.2 billion, up 13% year on year |
| - | Net income of CHF 1.3 billion, up 75% year on year |
| - | Net revenues of CHF 5.8 billion, up 7% year on year |
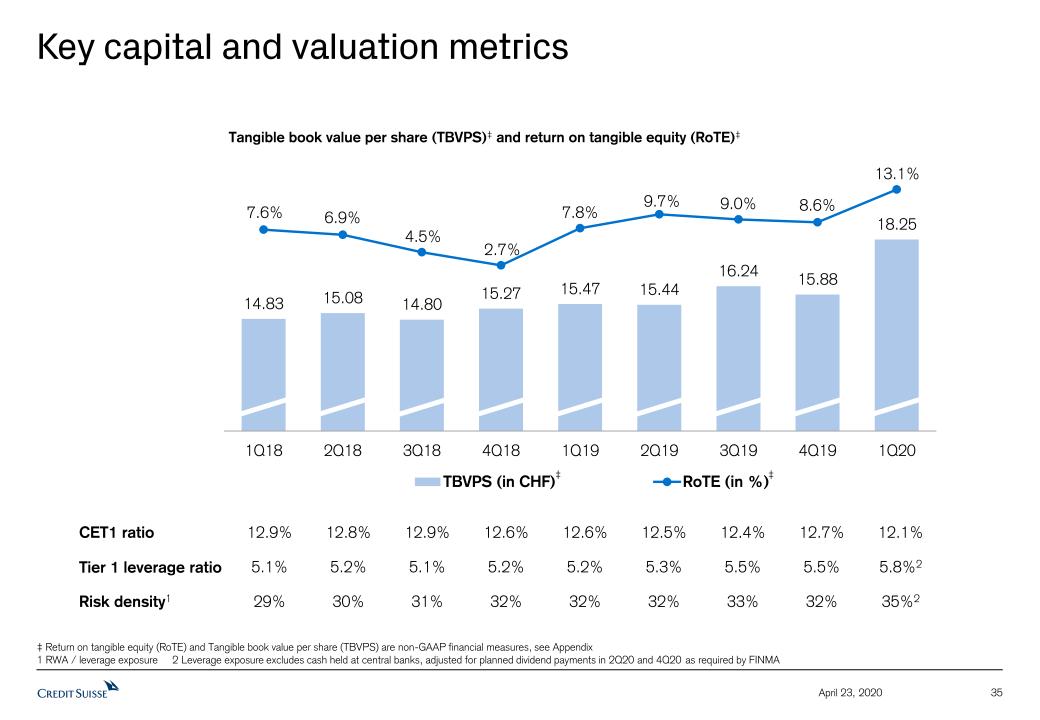
| - | Return on Tangible Equity (RoTE) of 13.1%, up from 8.6% in the previous quarter |
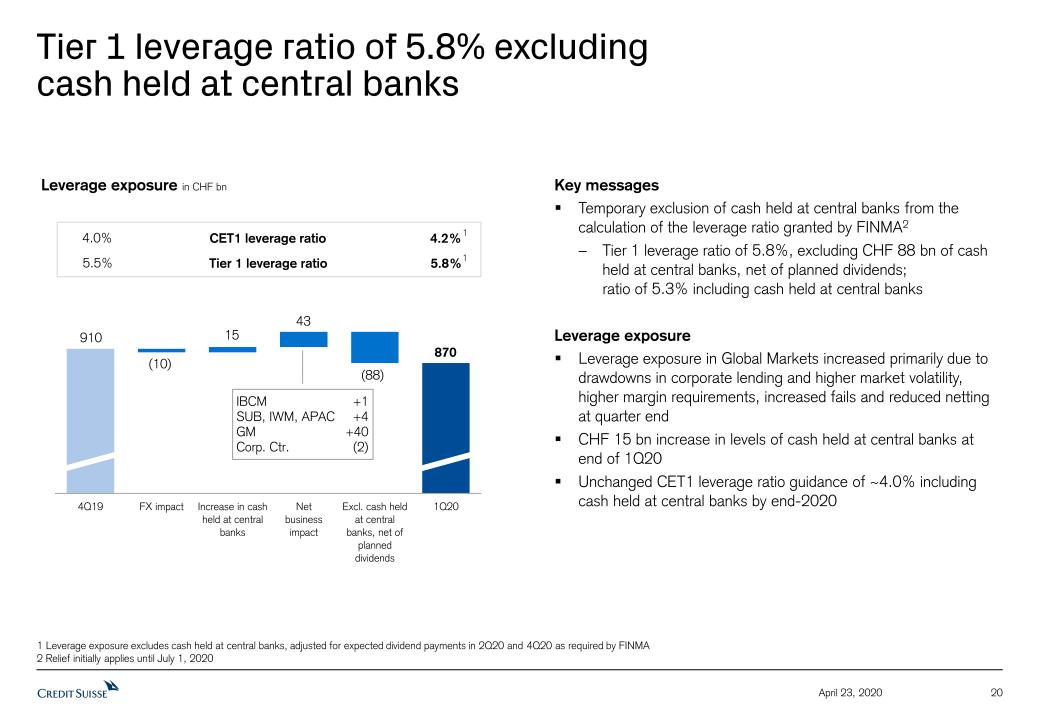
| - | CET1 ratio of 12.1%, down from 12.7% at the end of the previous quarter, and Tier 1 leverage ratio of 5.8%1, up from 5.5% at the end of the previous quarter |
| - | Average Liquidity Coverage Ratio (LCR) of 182% as of the end of the quarter |
Thomas Gottstein, Chief Executive Officer of Credit Suisse Group AG, commented: “In my first quarter as CEO of the Group, we all witnessed a highly challenging environment with a severe impact from the COVID-19 pandemic. We delivered a resilient performance, driven by our SUB, IWM, APAC and GM divisions, while absorbing a significant reserve build of over CHF 1 billion. Our wealth management-focused business model proved to be resilient once more, while allowing us to leverage our investment banking capabilities for our clients in a period of high volatility. In line with our global positioning as the ‘Bank for Entrepreneurs’, and emphasizing the importance of our home market, we played an active role in the development of the bridging loan solution for Swiss small and medium-sized enterprises (SMEs), sponsored by the Swiss government. Also, we remained supportive of our global workforce by enabling over 90% of our employees to work from home as well as granting paid family leave as long as schools remain closed, and stayed connected to our societies worldwide. Thanks to our strong capital and liquidity base, we are well positioned to support our clients, employees and societies in the coming quarters, during which we expect the COVID-19-related uncertainty to persist.” |
Credit Suisse Group (in CHF million) | 1Q20 | 4Q19 | 1Q19 | ∆1Q19 |
| Net revenues | 5,776 | 6,190 | 5,387 | 7% |
| Provision for credit losses | 568 | 146 | 81 | - |
| Total operating expenses | 4,007 | 4,830 | 4,244 | (6)% |
| Pre-tax income | 1,201 | 1,214 | 1,062 | 13% |
| Net income attributable to shareholders | 1,314 | 852 | 749 | 75% |
| Return on tangible equity | 13.1% | 8.6% | 7.8% | 6.3p.p. |
SUMMARY
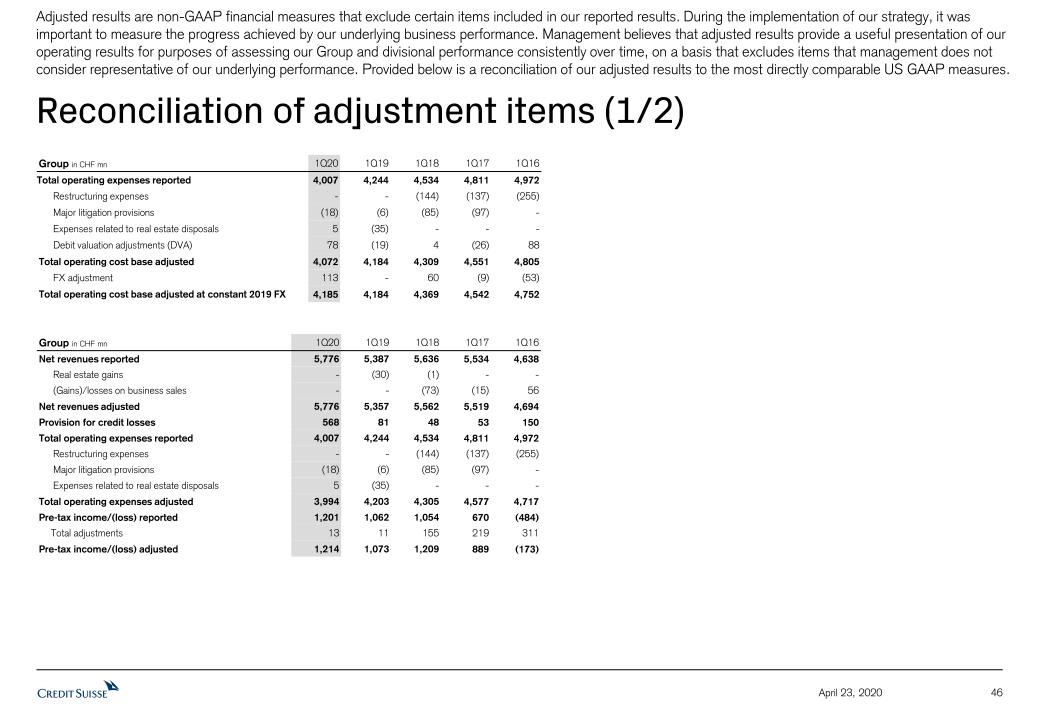
Notwithstanding the COVID-19 pandemic and the resultant volatile market environment, profitability in a very challenging 1Q20 increased compared to 1Q19, with pre-tax income up 13% year on year at CHF 1.2 billion, including the gain from the second and final closing of the InvestLab funds platform transfer to Allfunds Group. Excluding the gain from the InvestLab transfer and major litigation provisions*, pre-tax income would have been CHF 951 million, down 11% year on year. Net income was up 75% year on year at CHF 1.3 billion, the highest quarterly result in the last five years, benefitting from a negative tax rate2. Our net revenues of CHF 5.8 billion increased by 7% year on year; excluding the gain from the
Page 1
Media release Zurich, April 23, 2020 | |
| | |
InvestLab transfer*, net revenues would have been up 2%. As a result of our continued focus on cost discipline across compensation and non-compensation expenses, total operating expenses for 1Q20 were CHF 4.0 billion, down 6% year on year, resulting in positive operating leverage for the 14th consecutive quarter. Our RoTE was 13.1% for the quarter, benefitting from the gain from the InvestLab transfer and a negative tax rate. Based on our revised tax guidance of 20% to 25% for the full year 2020, RoTE would have been around 9% to 9.5%.
1Q20 results were supported by a strong contribution from our Private Banking franchises, with net revenues excluding the gain from the InvestLab transfer* up 9% year on year. Amid a market sell-off, our Private Banking franchises reported increased transaction-based revenues, up 31% year on year, as well as stable recurring commissions and fees, while net interest income increased 6%. Total Investment Banking3 net revenues in 1Q20 were up 23% year on year, on a US dollar basis, benefitting from a diversified portfolio, with Fixed Income sales and trading4 net revenues up 26% and Equity sales and trading4 net revenues up 24%. To reflect the challenging economic environment and continued pressure on oil prices, we absorbed over CHF 1 billion of reserve build in 1Q20.
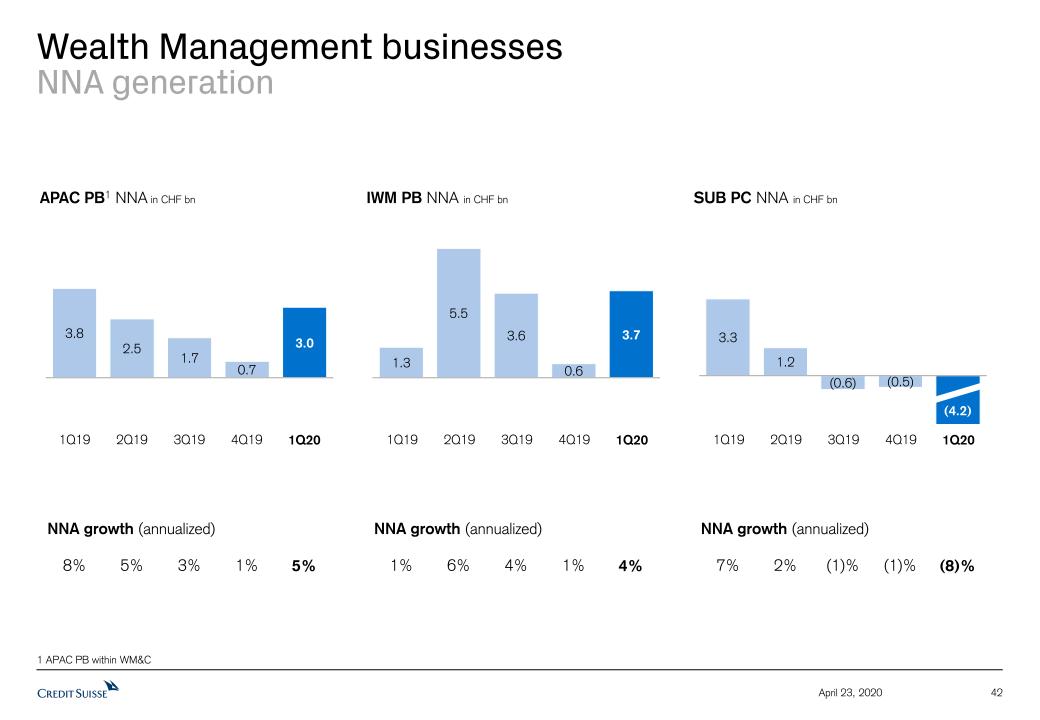
While we recorded Net New Assets (NNA) of CHF 5.8 billion across our businesses in 1Q20, with CHF 0.6 billion in SUB, CHF 3.8 billion in IWM, and CHF 3.0 billion in APAC, our Assets under Management (AuM) decreased by CHF 0.1 trillion to CHF 1.4 trillion at the end of the quarter compared to the previous quarter, driven by unfavorable market and foreign exchange-related movements.
Our capital position at the end of 1Q20 remained strong, with a CET1 ratio of 12.1% compared to 12.7% at the end of the previous quarter, reflecting an increase of risk-weighted assets, mainly from corporate lending drawdowns and increased market volatility in the second half of the quarter. Our Tier 1 leverage ratio was 5.8% at the end of the quarter, up from 5.5% at the end of the previous quarter, benefitting from the decision by the Swiss Financial Market Supervisory Authority FINMA (FINMA) to temporarily allow Swiss banks to calculate the leverage ratio without central bank reserves5. We had one of the highest LCRs among international peers, with an average LCR of 182% as of the end of the quarter.
As part of our strategy to be a leading global wealth manager with strong investment banking capabilities, on April 17, 2020, we announced that we received approval from the China Securities Regulatory Commission to become a majority shareholder in our securities joint venture, Credit Suisse Founder Securities Limited, marking a significant milestone in the bank’s China strategy.
Notwithstanding our financial strength, the Board of Directors decided, in light of the COVID-19 pandemic and in response to a request by FINMA, to revise its dividend proposal for the Annual General Meeting (AGM) on April 30, 2020. Under the revised approach, the Board of Directors proposes the distribution of half of the originally proposed dividend at the AGM, and intends to propose to an Extraordinary General Meeting (EGM) in the autumn of 2020 the distribution of the second half of the 2019 dividend, subject to market and economic conditions. Having completed the initial share repurchases under our 2020 share buyback program, under which we had bought back shares of CHF 325 million6, further repurchases are on hold until at least 3Q20 to allow us time to reassess the impact of the persisting pandemic. We believe this revised approach is a prudent and responsible step to preserving capital in the face of the challenges posed by the COVID-19 pandemic.
Page 2
Media release Zurich, April 23, 2020 | |
| | |
COVID-19
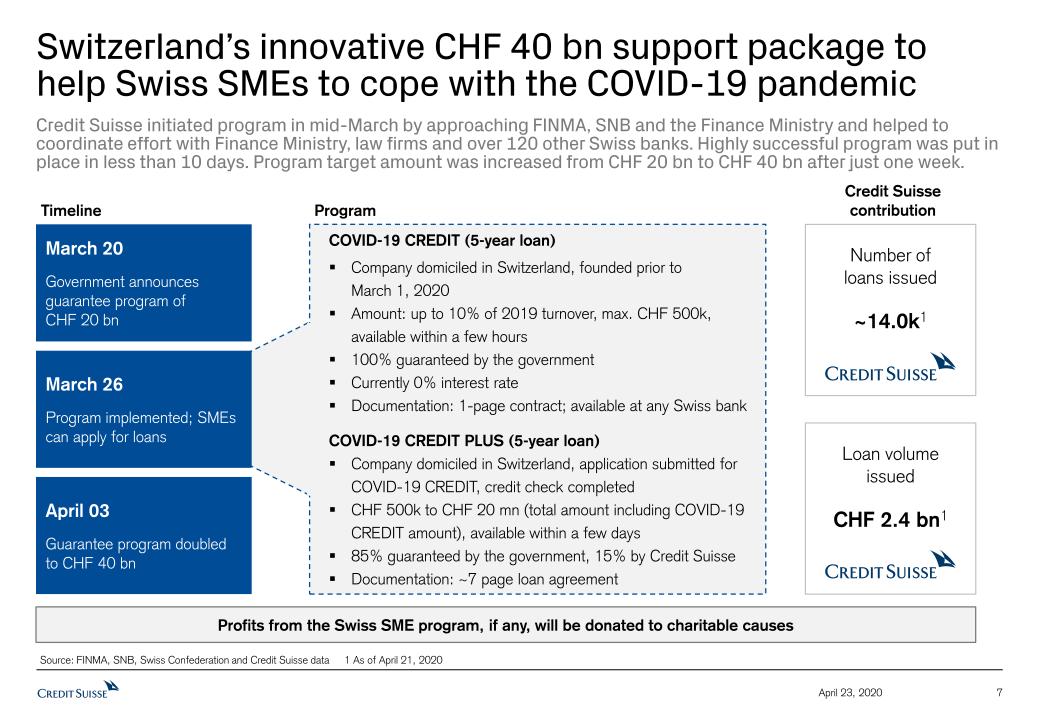
In this troubled environment, we continued to stay close to our clients, supporting them through unprecedented challenges. We were able to play an active role, from the outset, in the development of the CHF 20 billion bridging loan solution for Swiss companies in conjunction with the Swiss Federal Department of Finance, the Swiss National Bank, FINMA and the Swiss Bankers Association that was announced on March 25, 2020, and subsequently increased to CHF 40 billion. So far7, Credit Suisse has granted about 14,000 loans with a total volume of CHF 2.4 billion under this program. Our significant involvement, since the inception of the program, is a testament to our commitment to our home market and to our position as the ‘Bank for Entrepreneurs’.
Furthermore, from an early stage, we implemented responsive contingency measures for our own operations globally to help protect against the spread of COVID-19, while providing continuity of service. We deployed our robust business continuity management capabilities and took what we believe are the necessary actions to safeguard our operations while ensuring the safety of our teams. In addition, we established numerous support measures for our employees to overcome the challenges of the pandemic, including working from home measures or split working arrangements as well as paid family leave in all markets in which schools are closed for our colleagues who are unable to work from home while also looking after their children or other family members.
To contribute to the communities in which we operate, we set up a bank-wide donor-advised matching program, launched to encourage employee donations to charities. Additionally, members of the Executive Board committed to donating at least 20% of their six months’ base salary as part of this matching program. The Chairman of the Board of Directors will also donate to a similar extent.
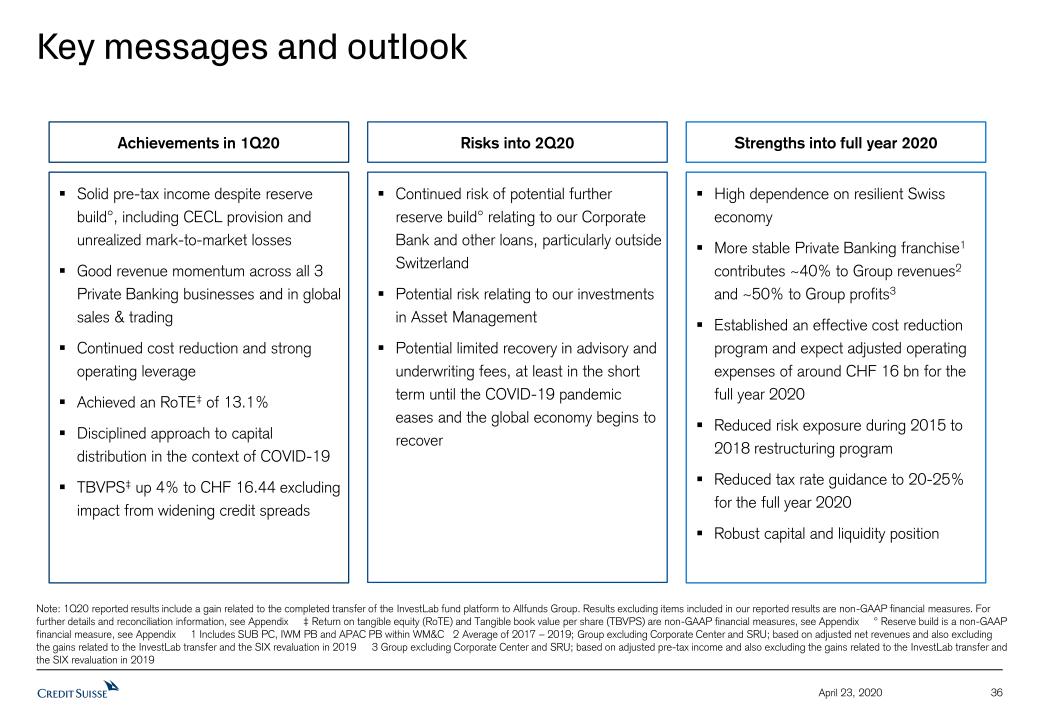
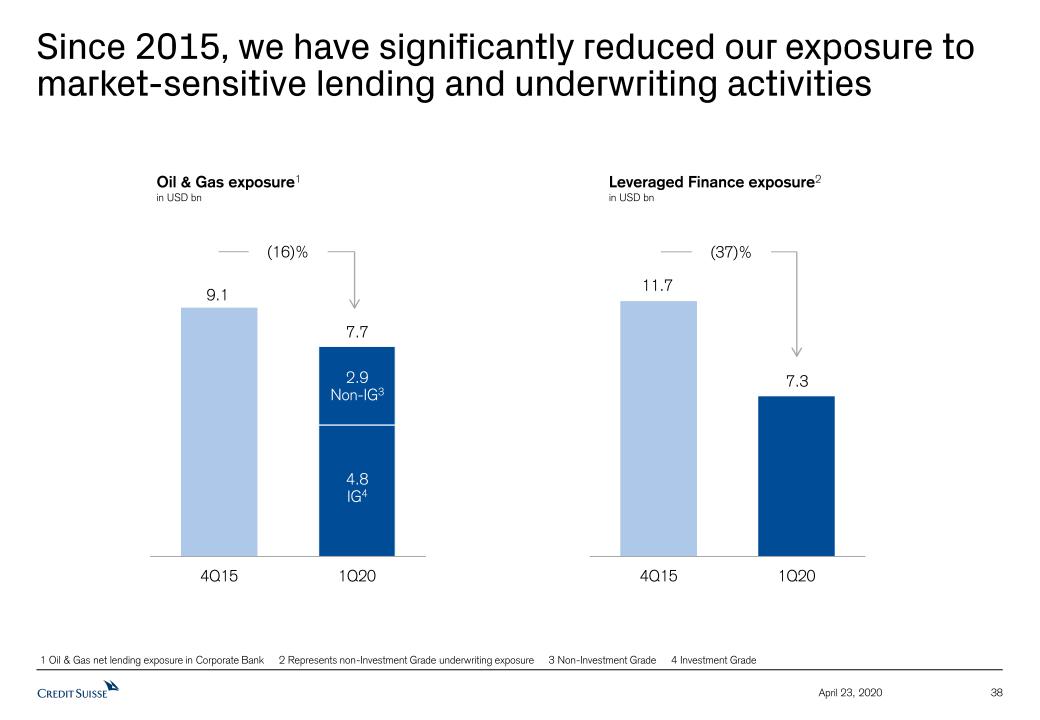
OUTLOOK Our 1Q20 results reflect the strength of our businesses, delivering a solid performance while absorbing over CHF 1 billion of reserve build. However, the scale of the adverse economic impact of the COVID-19 crisis is still difficult to assess and we would caution that we may also see further reserve build and impairments in the coming quarters, particularly in our Corporate Bank and other loans, outside Switzerland, as well as from our investments in Asset Management. Additionally, we would caution that the recovery in advisory and underwriting fees might be limited, at least in the short term until the COVID-19 pandemic eases and the global economy begins to recover. Credit Suisse, however, has entered this crisis with a number of key advantages. First, we have profitable and resilient operations in our Swiss home market that has historically had a low credit loss experience. Second, we have a stable Private Banking franchise, contributing significantly to our revenues and pre-tax income for the Group. Third, we have significantly reduced our cost base and decreased our risk exposure following our 2015 to 2018 restructuring program, including our oil & gas and leveraged finance exposure. Fourth, we have one of the highest LCRs among international peers and a strong capital position. We are well prepared to continue to serve our clients and we believe we can maintain a resilient financial performance through this crisis. |
Page 3
Media release Zurich, April 23, 2020 | |
| | |
DETAILED DIVISIONAL SUMMARIES
Swiss Universal Bank (SUB)
SUB (in CHF million) | 1Q20 | 4Q19 | 1Q19 | ∆1Q19 |
| Net revenues | 1,509 | 1,748 | 1,379 | 9% |
| Provision for credit losses | 124 | 43 | 29 | - |
| Total operating expenses | 796 | 819 | 800 | (1%) |
| Pre-tax income | 589 | 886 | 550 | 7% |
| Cost/income ratio | 53% | 47% | 58% | - |
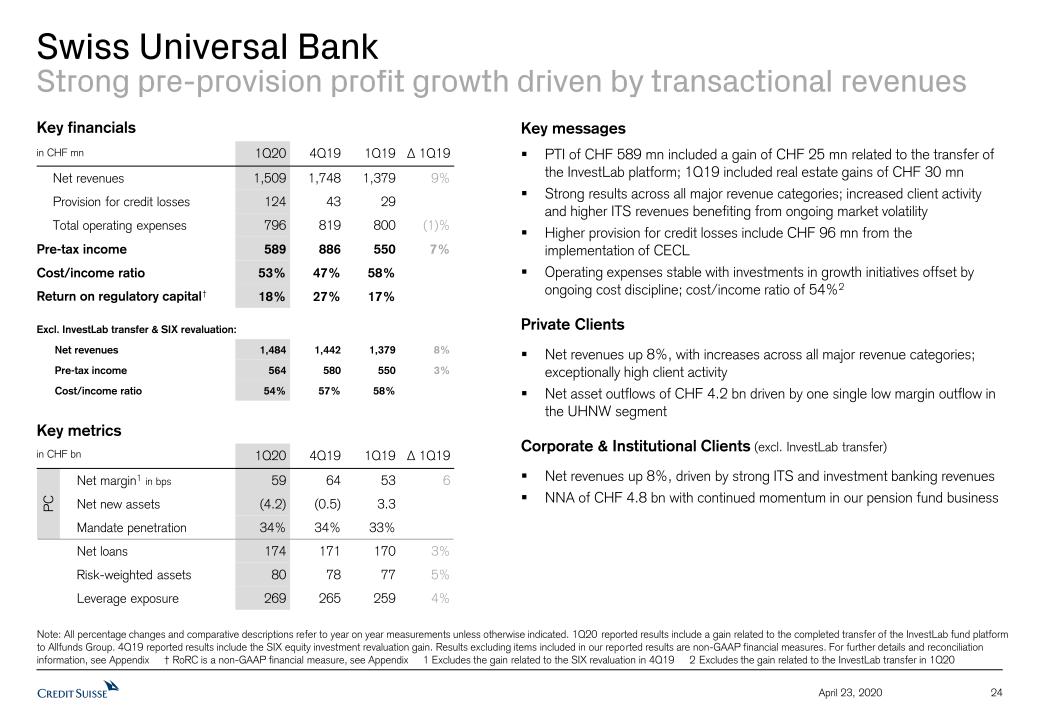
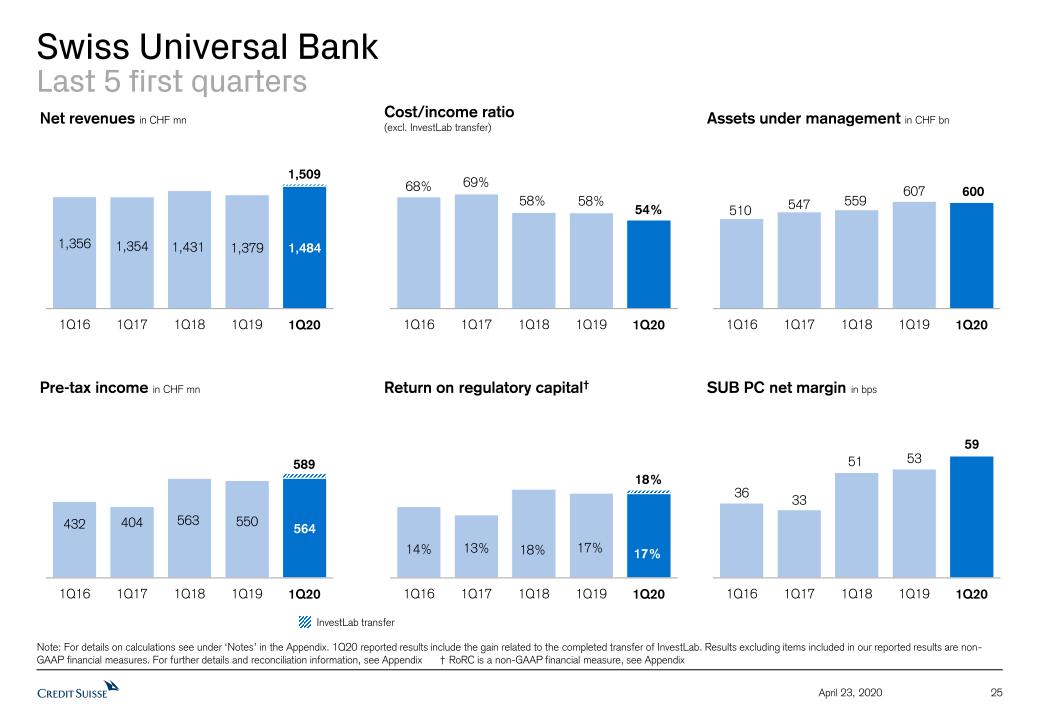
SUB had a strong 1Q20 with pre-tax income of CHF 589 million, up 7% year on year. Net revenues rose 9% year on year, with increases across all major revenue categories. We saw a strong performance in transaction-based revenues, which increased significantly with the ongoing market volatility, driving the level of client activity higher as well as revenues from our collaboration with Global Markets and International Wealth Management – International Trading Solutions (ITS). Revenues for the division were also driven by the gain from the InvestLab transfer in 1Q20, while during the same period in 2019, revenues reflected gains from real estate sales. Excluding the gain from the InvestLab transfer*, SUB pre-tax income would have been CHF 564 million, up 3% year on year. Operating expenses were stable compared to last year, with investments in our growth initiatives funded by continued cost discipline. The cost/income ratio in 1Q20 was 53%. In SUB, we recorded higher provision for credit losses of CHF 124 million, including CHF 96 million from the expected deterioration of macro-economic factors across multiple industries under the new CECL methodology.
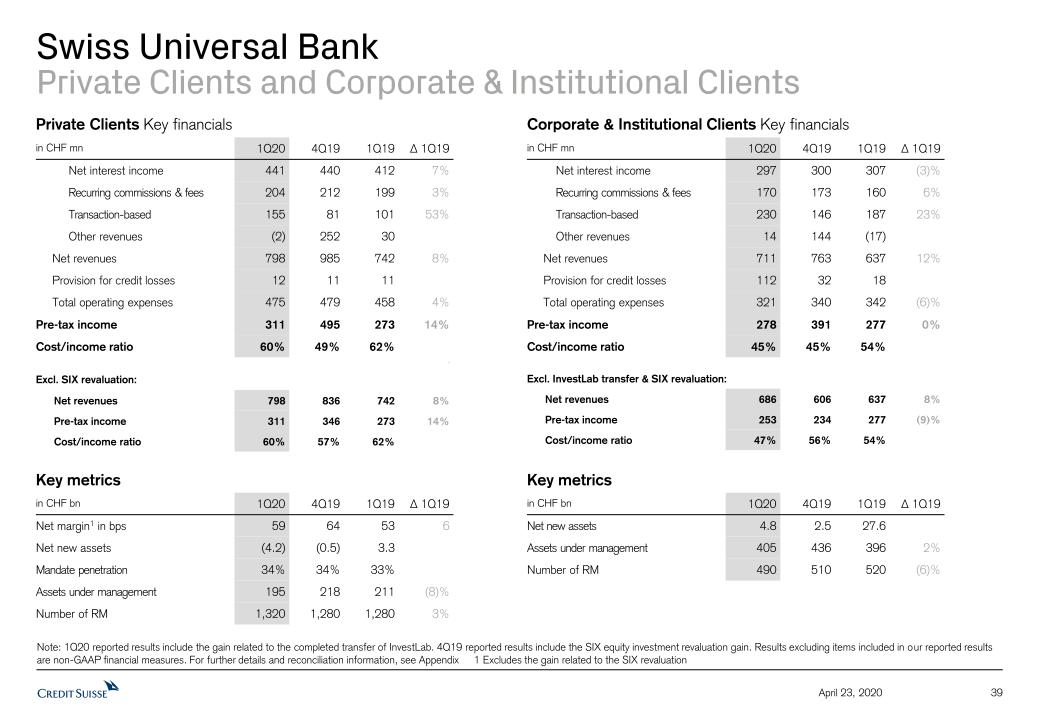
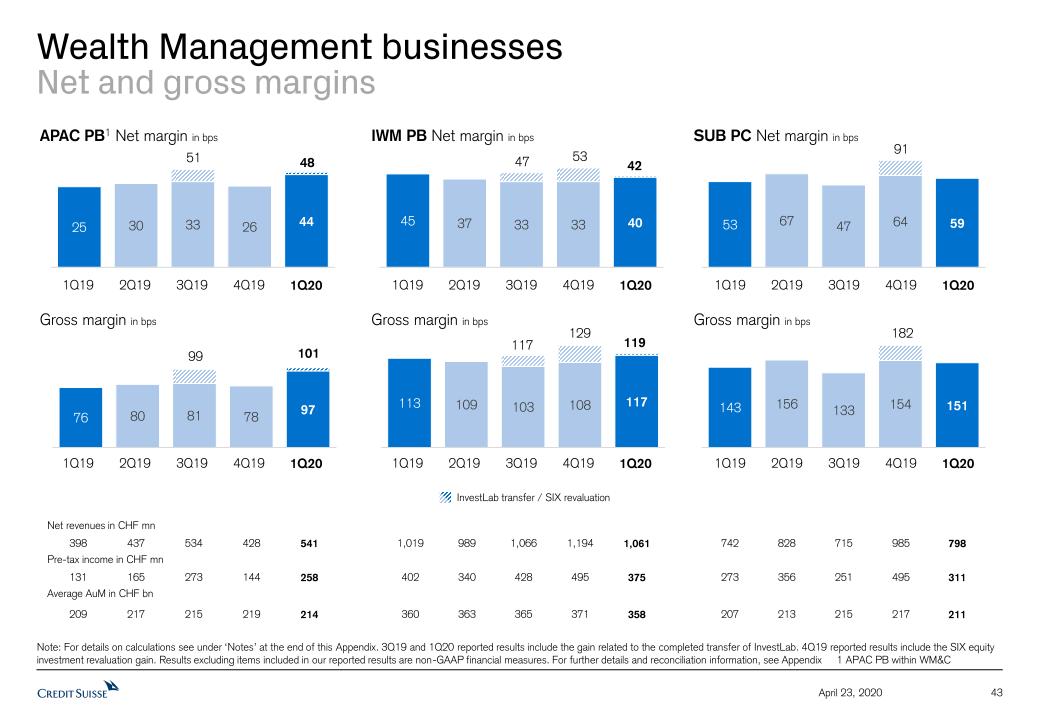
Private Clients reported pre-tax income of CHF 311 million in 1Q20, an increase of 14% year on year. Net revenues of CHF 798 million, up 8% year on year, were driven by exceptionally high levels of client activity due to volatility and the market environment. AuM of CHF 195 billion decreased by 10% from CHF 218 billion at the end of 2019, mainly driven by unfavorable market movements. Private Clients saw net asset outflows of CHF 4.2 billion in 1Q20, primarily due to an individual, low margin case in the ultra-high-net-worth client segment.
Corporate & Institutional Clients generated pre-tax income of CHF 278 million, stable year on year. Excluding the gain from the InvestLab transfer*, pre-tax income would have been CHF 253 million, down 9% year on year. This quarter’s revenue growth, up 8% excluding the gain from the InvestLab transfer*, was also driven by an increase in transaction-based revenues, mainly driven by higher revenues from ITS and from our Swiss investment banking business, which offset a slight decline in net interest income. NNA of CHF 4.8 billion reflected continued momentum in our pension funds business. Furthermore, we supported SMEs and the Swiss economy by processing CHF 2.4 billion7 of COVID-19 bridging loans.
International Wealth Management (IWM)
IWM (in CHF million) | 1Q20 | 4Q19 | 1Q19 | ∆1Q19 |
| Net revenues | 1,502 | 1,640 | 1,417 | 6% |
| Provision of credit losses | 39 | 16 | 10 | - |
| Total operating expenses | 926 | 992 | 884 | 5% |
| Pre-tax income | 537 | 632 | 523 | 3% |
| Cost/income ratio | 62% | 60% | 62% | - |
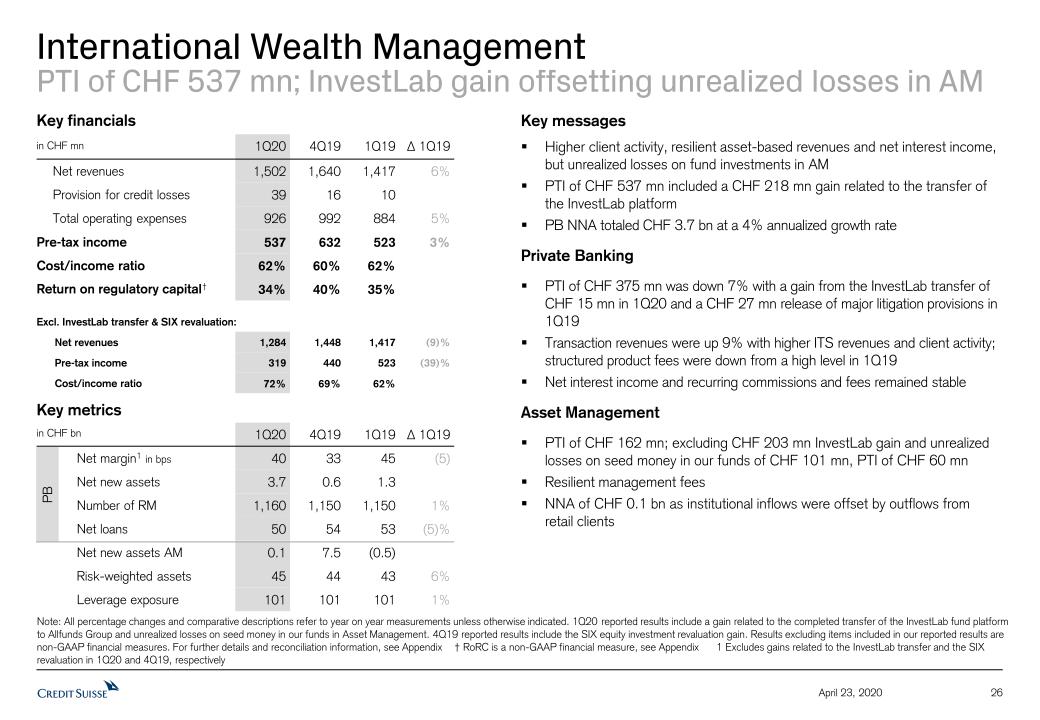
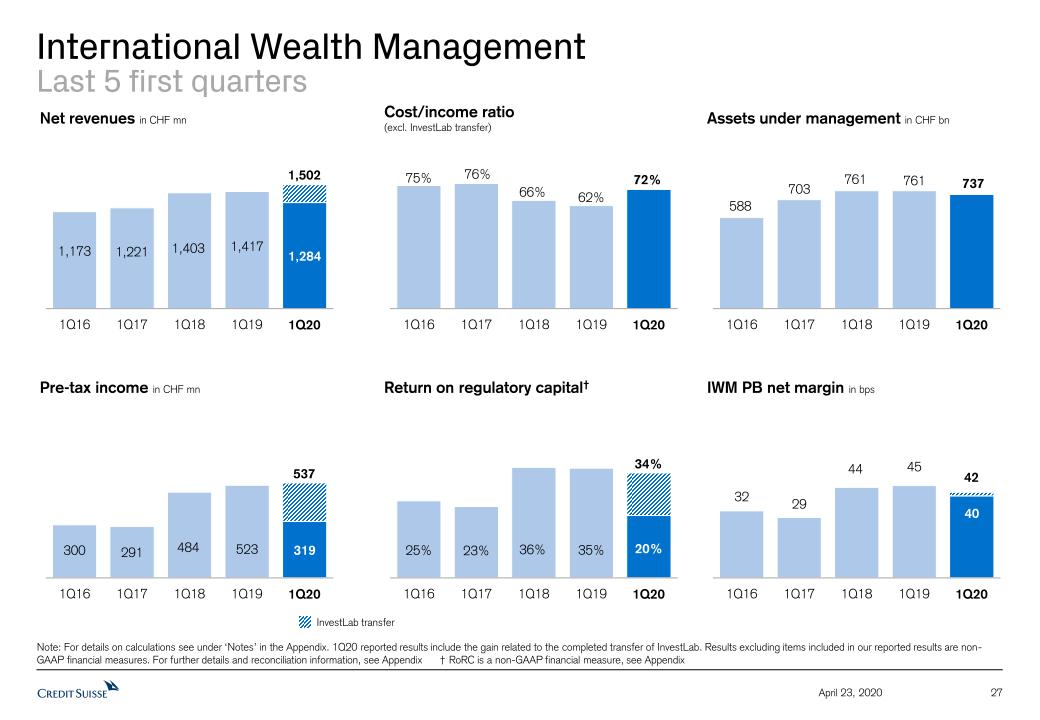
IWM’s results in 1Q20 were supported by higher levels of client activity as well as asset-based revenues and net interest income, offset by unrealized losses on fund investments in Asset Management. Pre-tax income in 1Q20 grew 3% year on year, to CHF 537 million, reflecting a 6%
Page 4
Media release Zurich, April 23, 2020 | |
| | |
increase in net revenues and a 5% increase in operating expenses. IWM’s return on regulatory capital stood at 34%. These results include a gain related to the InvestLab transfer; excluding this gain*, pre-tax income would have been CHF 319 million, down 39%, impacted by unrealized losses on seed money in our funds in Asset Management. In IWM, we recorded higher provision for credit losses of CHF 39 million. NNA in IWM stood at CHF 3.8 billion in 1Q20.
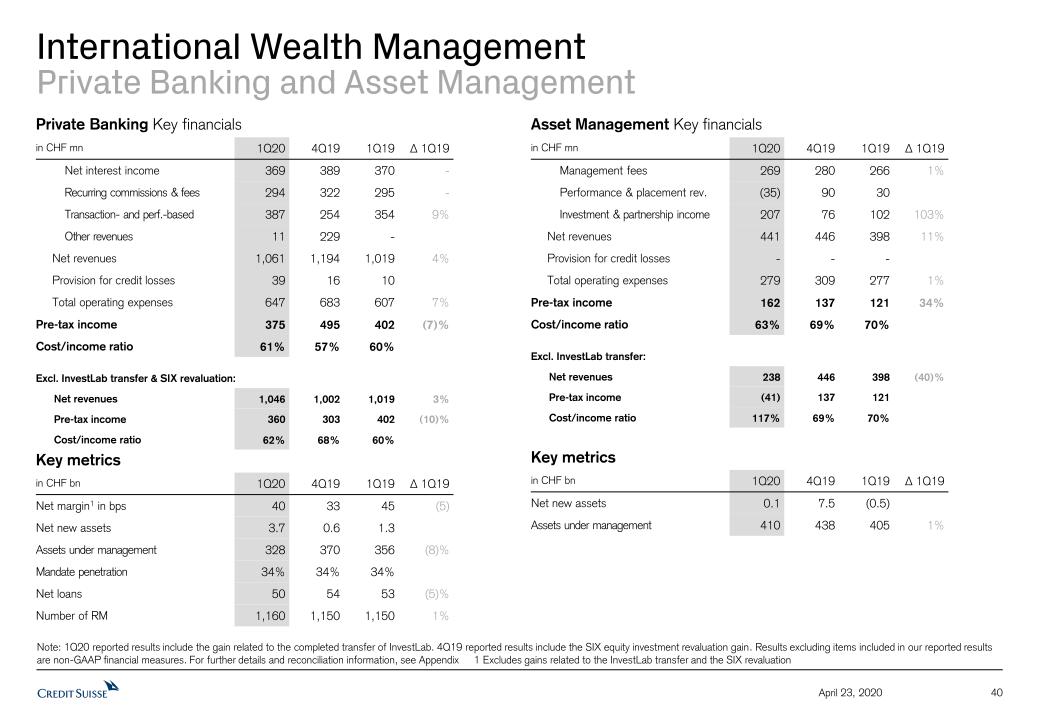
Private Banking’s pre-tax income was down 7% year on year at CHF 375 million, reflecting the release of a major litigation provision of CHF 27 million that we recorded in 1Q19. Excluding the gain from the InvestLab transfer*, pre-tax income would have been CHF 360 million, down 10% year on year. Net revenues of CHF 1.1 billion increased 4% year on year, driven by higher transaction- and performance-based revenues, as we helped our clients navigate in turbulent markets. Within transaction- and performance-based revenues, revenues from ITS and client activity were up, reflecting higher industry-wide trading volumes and volatility, while our structured product issuance fees were lower compared to a very high level in 1Q19. Net interest income and recurring commissions and fees were stable. Total operating expenses of CHF 647 million increased 7%, primarily due to a provision release included in 1Q19. NNA were strong at CHF 3.7 billion for the quarter, an annualized growth rate of 4%, reflecting inflows from Europe and emerging markets.
Asset Management’s pre-tax income in 1Q20 increased 34% year on year to CHF 162 million, with an 11% increase in net revenues and stable operating expenses. Management fees were resilient. With the sharp reduction in financial markets across asset classes, we recorded CHF 101 million unrealized losses on seed money in our funds during the quarter. Excluding the gain from the InvestLab transfer* and the unrealized losses on seed money in our funds, the business would have recorded a pre-tax profit of CHF 60 million in 1Q20. NNA stood at CHF 0.1 billion, as inflows from traditional investments offset some outflows from retail clients.
Asia Pacific (APAC)
APAC (in CHF million) | 1Q20 | 4Q19 | 1Q19 | ∆1Q19 |
| Net revenues | 1,025 | 937 | 854 | 20% |
| Provision for credit losses | 97 | 11 | 17 | - |
| Total operating expenses | 676 | 691 | 654 | 3% |
| Pre-tax income | 252 | 235 | 183 | 38% |
| Cost/income ratio | 66% | 74% | 77% | – |
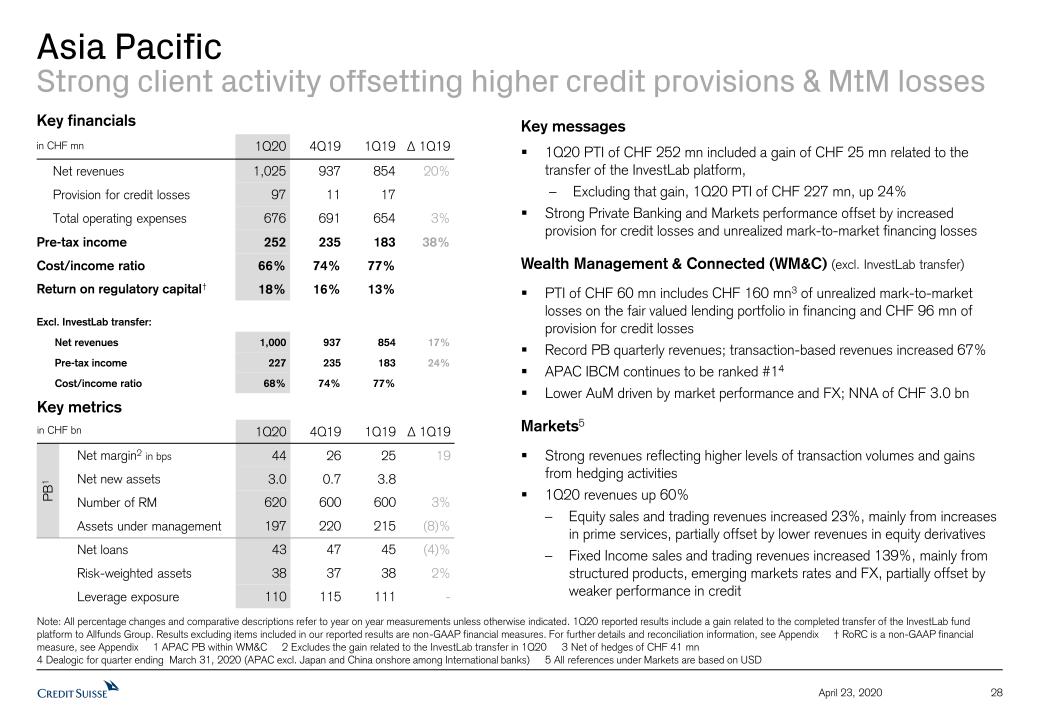
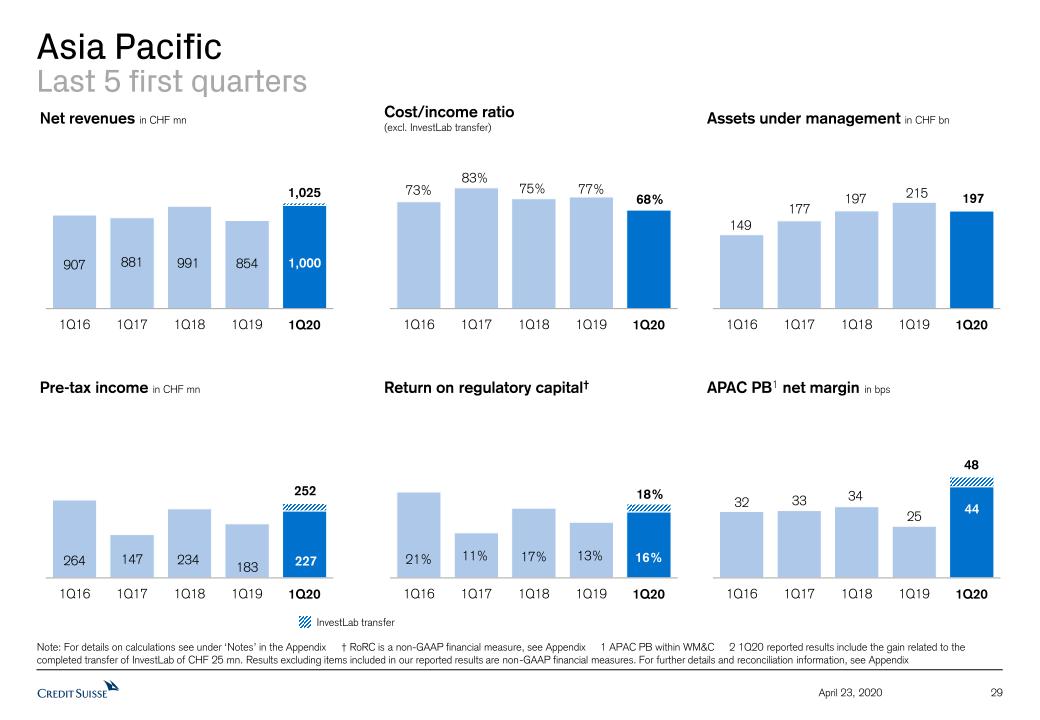
APAC reported a pre-tax income of CHF 252 million, up 38% year on year, for 1Q20. Excluding the gain from the InvestLab transfer*, pre-tax income would have been CHF 227 million, up 24% year on year, driven by higher revenues, up 17% year on year. These results were supported by a significantly stronger performance in both our Markets business and Private Banking within Wealth Management & Connected (WM&C). APAC delivered a return on regulatory capital of 18% in 1Q20 and a cost/income ratio of 66%. In APAC, we recorded higher provision for credit losses of CHF 97 million.
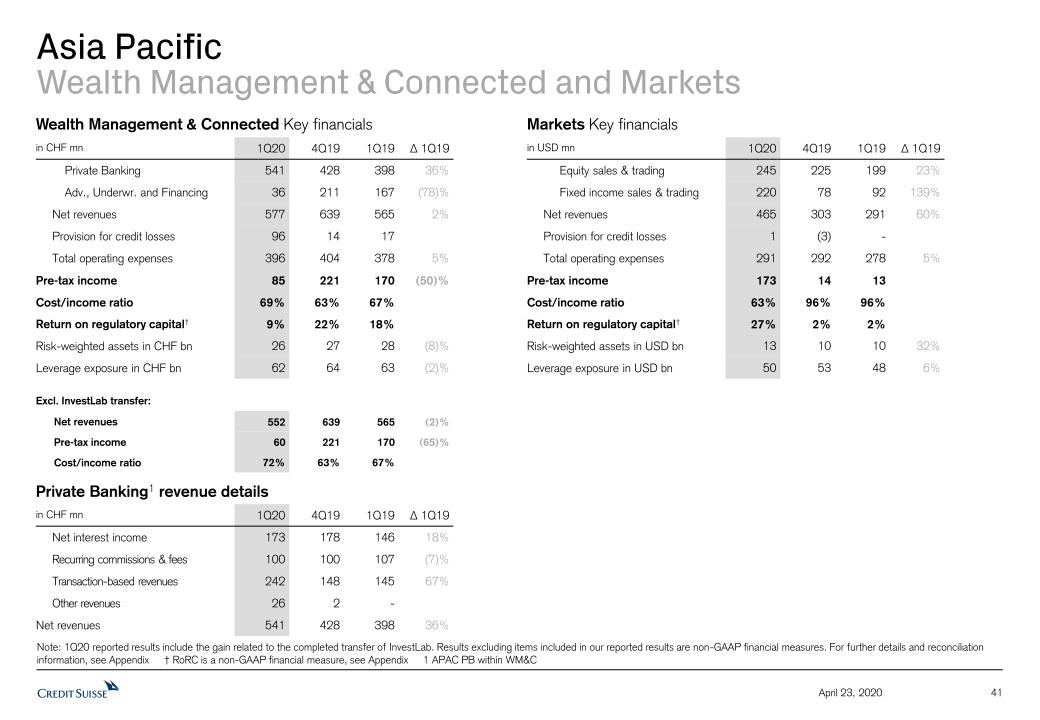
WM&C reported pre-tax income of CHF 85 million in 1Q20, down 50% year on year, due principally to unrealized mark-to-market losses of CHF 160 million8 on the fair valued lending portfolio in our advisory, underwriting and financing business and higher provision for credit losses of CHF 96 million. Excluding the gain from the InvestLab transfer*, WM&C pre-tax income would have been CHF 60 million, down 65% year on year, with net revenues down 2%. Our Private Banking business, excluding the gain from the InvestLab transfer*, reported record revenues, mainly driven by higher transaction-based revenues and net interest income. In 1Q20, we generated NNA of CHF 3 billion and had AuM of CHF 197 billion. Our AuM, compared to the previous quarter, were impacted by unfavorable market and foreign
Page 5
Media release Zurich, April 23, 2020 | |
| | |
exchange-related movements. Over the period, APAC advisory, underwriting and financing continued to be ranked number 1 in terms of share of wallet9.
Markets delivered strong pre-tax income of USD 173 million in 1Q20 compared to pre-tax income of USD 13 million in 1Q19. Net revenues were up 60% year on year, reflecting higher levels of client activity. Equity sales and trading revenues were up 23% year on year, mainly reflecting a strong performance in prime services but partially offset by lower revenues in equity derivatives. Fixed income sales and trading revenues rose 139% year on year, driven mainly by higher revenues from structured, emerging market rates and FX products and gains from hedging activities, partially offset by lower revenues from credit products.
Investment Banking & Capital Markets (IBCM)
IBCM (in USD million) | 1Q20 | 4Q19 | 1Q19 | ∆1Q19 |
| Net revenues | 189 | 437 | 357 | (47%) |
| Provision for credit losses | 161 | 40 | 8 | - |
| Total operating expenses | 420 | 456 | 443 | (5%) |
| Pre-tax income | (392) | (59) | (94) | - |
| Cost/income ratio | 222% | 104% | 124% | - |
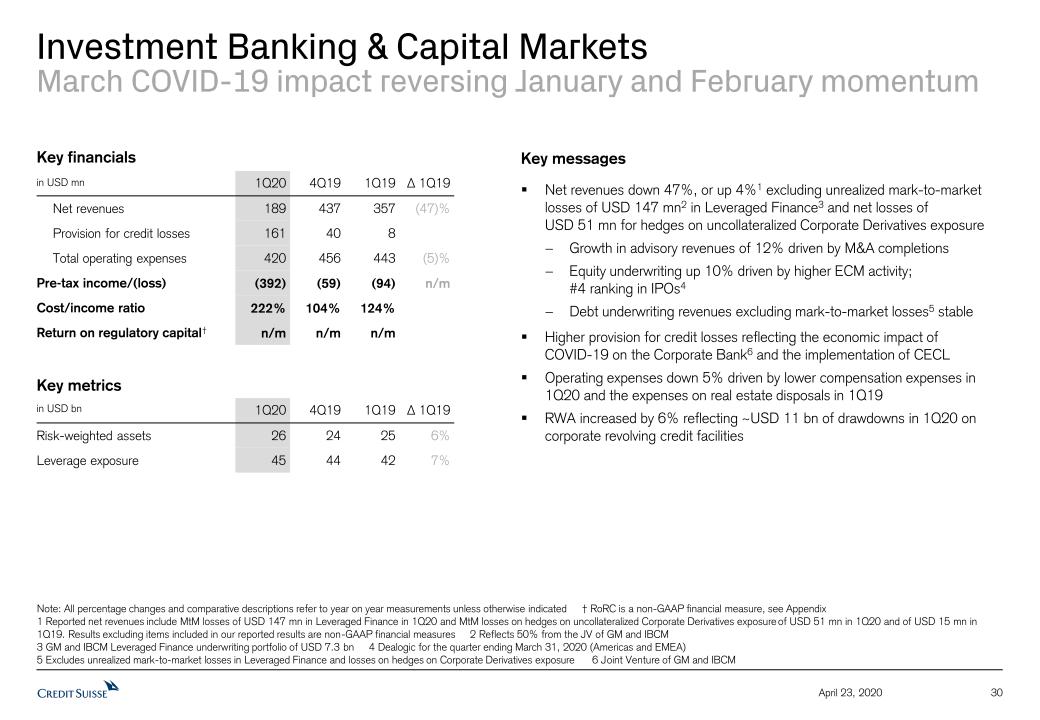
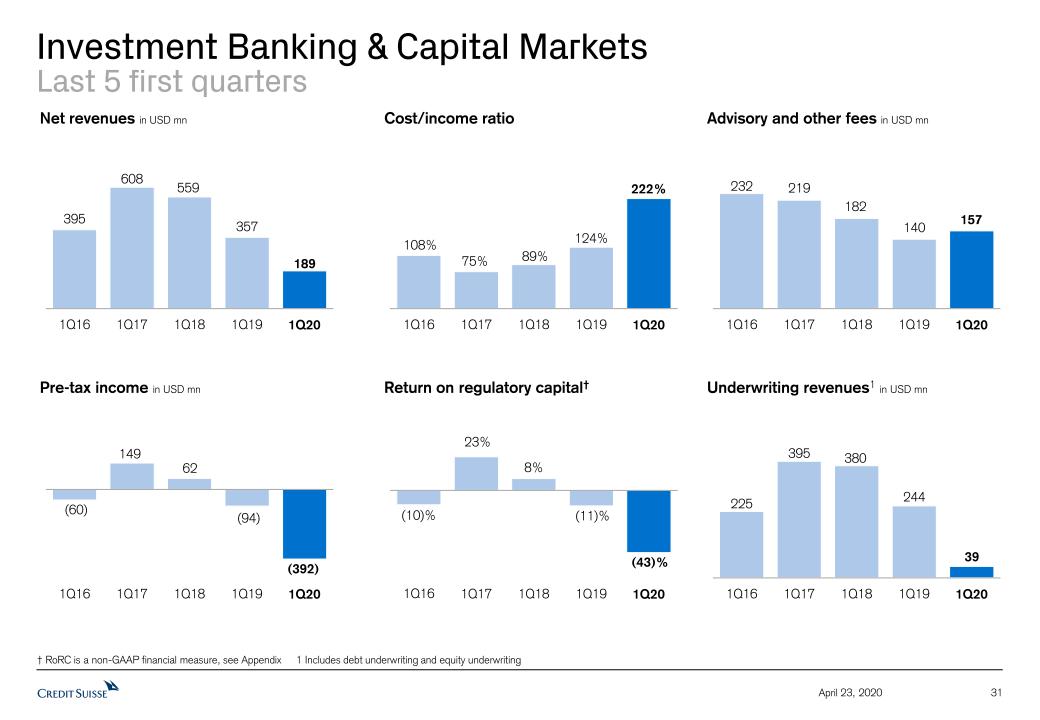
IBCM reported net revenues of USD 189 million, down 47% year on year; 1Q20 results included significant mark-to-market losses of USD 147 million in our leveraged finance underwriting portfolio and net losses of USD 51 million on hedges on IBCM’s uncollateralized corporate derivatives exposure. Excluding these losses, IBCM’s revenues would have been up 4%10 year on year, as a strong performance in January and February was offset by the global market disruption that resulted in the closure of primary markets in March. We reported pre-tax loss of USD 392 million in 1Q20, in a challenging operating environment, compared to pre-tax loss of USD 94 million for 1Q19. Our continued focus on cost discipline led to lower operating expenses, down 5% year on year, driven by lower compensation costs in 1Q20 and by the expenses related to real estate disposals incurred in 1Q19. We recorded provision for credit losses of USD 161 million in 1Q20 primarily driven by negative developments in our corporate lending portfolio, including increased drawdowns on loan commitments and the impact from the expected deterioration of macro-economic factors across multiple industries under the new CECL methodology.
Advisory revenues were up 12% year on year at USD 157 million, driven by an increase in completed M&A transactions. Advisory revenues were up compared to the Street, which was down 15% year on year 11.
Equity underwriting revenues were up 10% year on year at USD 64 million, but down compared to the Street11, which was up 15%. We maintained our number 4 ranking in IPOs for the quarter11.
Debt underwriting reported negative revenues of USD 25 million for the quarter as they included mark-to-market losses of USD 147 million in our leveraged finance underwriting portfolio, driven by the closure of the primary markets in March, and USD 73 million of mark-to-market losses on hedges on IBCM’s corporate derivatives exposure, partially offset by higher investment grade capital markets revenues. This compares to revenues of USD 186 million in 1Q19, which saw USD 9 million of mark-to-market losses on hedges on IBCM’s corporate derivatives exposure. Excluding mark-to-market losses, debt underwriting revenues were stable. Despite the challenging environment, we maintained our number 2 ranking in leveraged finance for the quarter11.
Page 6
Media release Zurich, April 23, 2020 | |
| | |
Global Markets (GM)
GM (in USD million) | 1Q20 | 4Q19 | 1Q19 | ∆1Q19 |
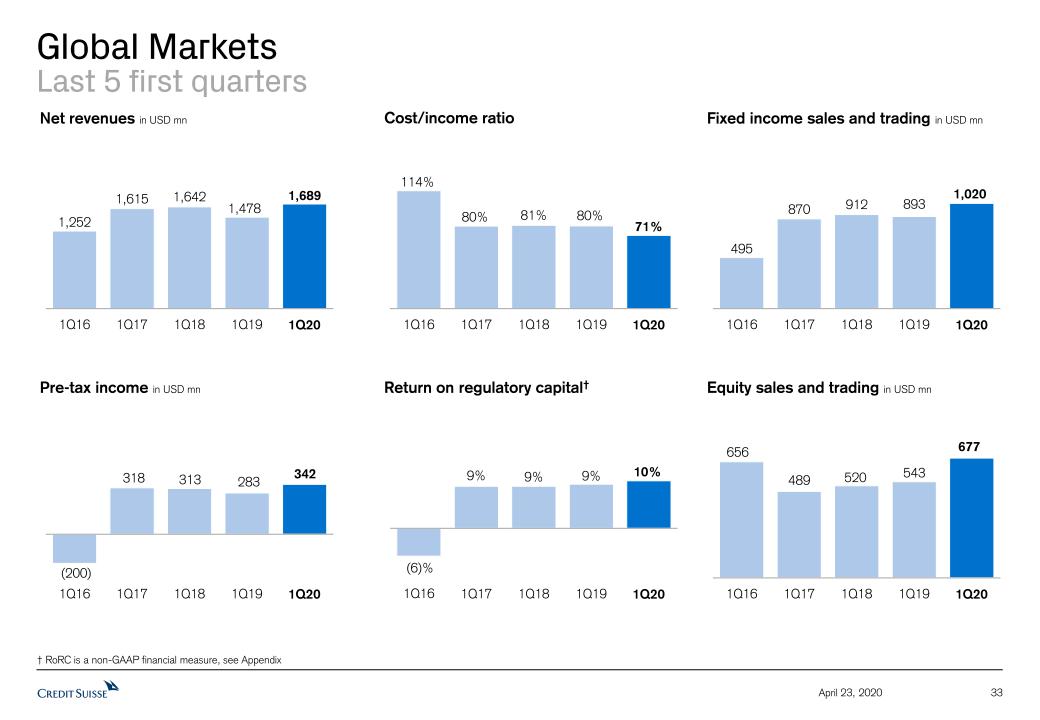
| Net revenues | 1,689 | 1,331 | 1,478 | 14% |
| Provision for credit losses | 156 | 32 | 11 | - |
| Total operating expenses | 1,191 | 1,253 | 1,184 | 1% |
| Pre-tax income | 342 | 46 | 283 | 21% |
| Cost/income ratio | 71% | 94% | 80% | - |
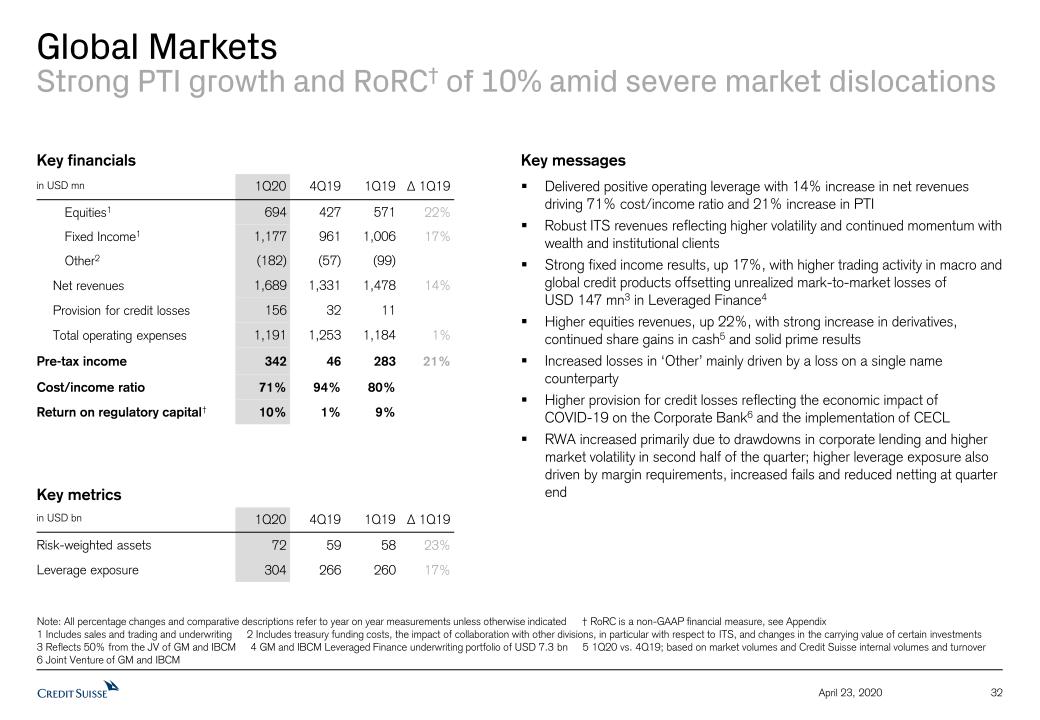
GM achieved pre-tax income of USD 342 million and a return on regulatory capital of 10% in 1Q20. Our diversified franchise delivered positive operating leverage and strong pre-tax income growth despite significantly challenging market conditions, particularly in March. Net revenues of USD 1.7 billion increased 14% year on year, reflecting robust trading activity driven by high levels of volatility and trading volumes. This was partially offset by increased losses in other revenues, mainly driven by a loss from a single name counterparty. Total operating expenses were stable year on year with an improved cost/income ratio of 71%. Additionally, we recorded provision for credit losses of USD 156 million, primarily driven by negative developments in our corporate lending portfolio, including increased drawdowns on loan commitments and the impact from the expected deterioration of macro-economic factors across multiple industries under the new CECL methodology.
Fixed income12 revenues of USD 1.2 billion increased 17% year on year, driven by higher trading activity in macro and global credit products, partially offset by certain unrealized mark-to-market losses in leveraged finance.
Equities13 revenues of USD 694 million increased 22% year on year, with marked increases in derivatives, which benefited from higher levels of volatility, as well as increases in cash and solid prime results.
We continue to see strong momentum in our ITS business driven by higher trading revenues and increased collaboration with IWM and SUB to serve our wealth management, institutional and corporate clients.
Page 7
Media release Zurich, April 23, 2020 | |
| | |
Impact Advisory and Finance (IAF)
Impact Advisory and Finance continued its work to further the use of both private and public capital markets solutions in addressing the social and environmental needs identified by the United Nations Sustainable Development Goals (UN SDGs) in 1Q20.
In January, Credit Suisse hosted its seventh annual Conservation Finance Investor Conference. The conference brought together some of the biggest influencers, conservation experts and financiers to discuss the topics that will define the next decade and the unique opportunities there are for investors in the field of conservation.
Also in January, Credit Suisse announced the inaugural issuance of a green Asset-Backed Commercial Paper (ABCP) note, raising USD 200 million. The note was issued by Alpine Securitization, a special purpose vehicle sponsored by Credit Suisse to issue ABCP notes.
Over the course of 1Q20, IAF continued to publish pertinent thought leadership reports on topics such as institutional investor awareness of the Blue Economy and ocean-related investments and investment in alternative proteins as a path to conservation, to name a few.
Sustainability and Corporate Citizenship
Credit Suisse continues, as an organization, to be committed to sustainable initiatives across our divisions and geographies. In January, Credit Suisse signed the Poseidon Principles, a global framework that promotes the integration of climate considerations into lending decisions in ship finance.
In February, Credit Suisse established the Global Markets Environmental Social and Governance (ESG) Steering Committee to provide a GM-wide solution to set the overall strategic direction and ensure consistency in ESG product and solution development.
In March, Credit Suisse joined RE100, with a public commitment to source 100% renewable electricity across its entire global operations by 2025. At the end of 2019, 90% of the bank’s global electricity consumption was from renewable sources. Also in March, Credit Suisse published its 2019 Corporate Responsibility Report, alongside its Annual Report, which describes how the bank assumes its various responsibilities in banking, in the economy and society, as an employer and for the environment.
In Switzerland, Credit Suisse co-founded the ‘Wirtschaftswochen’, with long-term partner Ernst Schmidheiny Stiftung, an initiative to further expand entrepreneurship, business and economic education of young people. This is part of Credit Suisse’s new Corporate Citizenship focus on the topic of Future Skills and will leverage the bank’s monetary, expertise and volunteering-support. Finally, Credit Suisse’s new corporate foundation, the Credit Suisse APAC Foundation, was formally launched. The Foundation will provide philanthropic support to organizations across the Asia Pacific region in the bank’s main Corporate Citizenship topics: Financial Inclusion, Financial Education and Future Skills.
Page 8
Media release Zurich, April 23, 2020 | |
| | |
Contact details
Investor Relations, Credit Suisse Tel: +41 44 333 71 49 Email: investor.relations@credit-suisse.com |
Corporate Communications, Credit Suisse Tel: +41 844 33 88 44 E-mail: media.relations@credit-suisse.com |
The Earnings Release and Presentation Slides for 1Q20 are available to download from 7:00 CEST today at: https://www.credit-suisse.com/results |
Presentation of 1Q20 results – Thursday, April 23, 2020
| Event | Analyst Call | Media Call |
| Time | 08:15 Zurich 07:15 London 02:15 New York | 10:30 Zurich 09:30 London 04:30 New York |
| Language | English | English |
| Access | Switzerland: +41 44 580 48 67 Europe: +44 203 057 6528 US: +1 866 276 8933 Reference: Credit Suisse Analysts and Investors Call Conference ID: 1764198 Please dial in 10 minutes before the start of the call | Switzerland: +41 44 580 48 67 Europe: +44 203 057 6528 US: +1 866 276 8933 Reference: Credit Suisse Media Call Conference ID: 5266287 Please dial in 10 minutes before the start of the call |
| Q&A Session | Following the presentation, you will have the opportunity to ask the speakers questions | Following the presentation, you will have the opportunity to ask the speakers questions |
| Playback | Replay available approximately one hour after the event Switzerland: +41 44 580 40 26 Europe: +44 333 300 9785 US: +1 917 677 7532 Conference ID: 1764198 | Replay available approximately one hour after the event Switzerland: +41 44 580 40 26 Europe: +44 333 300 9785 US: +1 917 677 7532 Conference ID: 5266287 |
Page 9
Media release Zurich, April 23, 2020 | |
| | |
Footnotes
1 Leverage exposure excludes CHF 88 billion of cash held at central banks, after adjusting for planned dividend payments in 2Q20 and 4Q20, as permitted by FINMA
2 Negative tax rate includes improved interest deductibility for tax purposes and revision of the prior US BEAT estimate
3 Includes net revenues from GM, IBCM, APAC Markets and APAC advisory, underwriting and financing as well as M&A, DCM and ECM revenues in SUB C&IC
4 Includes Global Markets and APAC Markets
5 Including cash held at central banks, our Tier 1 leverage ratio would have been 5.3% for 1Q20
6 Up to March 13, 2020
7 As of April 21, 2020
8 Net of hedges of CHF 41 million
9 Source: Dealogic for the period ending March 31, 2020 (APAC excluding Japan and China onshore among International banks)
10 Excludes mark-to-market losses in our leveraged finance underwriting portfolio of USD 147 million and net mark-to-market losses on hedges on IBCM’s uncollateralized corporate derivatives exposure of USD 51 million in 1Q20 and of USD 15 million in 1Q19. Results excluding items included in our reported results are non-GAAP financial measures
11 Source: Dealogic for the period ending March 31, 2020 (Americas and EMEA only)
12 Includes Fixed Income Sales and Trading and Underwriting revenues
13 Includes Equity Sales and Trading and Underwriting revenues
* 1Q20 includes CHF 268 million related to the transfer of the InvestLab fund platform to Allfunds Group, recorded in SUB C&IC (CHF 25 million), IWM PB (CHF 15 million), IWM AM (CHF 203 million) and APAC PB within WM&C (CHF 25 million). Major litigation provisions for 1Q20 were CHF 18 million and 1Q19 were CHF 6 million. Results excluding items that are included in our reported results are non-GAAP financial measures.
Abbreviations
ABCP – Asset-Backed Commercial Paper; AGM – Annual General Meeting; APAC – Asia Pacific; AuM – assets under management; BIS – Bank for International Settlements; CECL – US GAAP accounting standard for current expected credit losses; CEO – Chief Executive Officer; CET1 – common equity tier 1; CHF – Swiss francs; C&IC – Corporate & Institutional Clients; ESG – Environmental, Social and Governance; FINMA – Swiss Financial Market Supervisory Authority FINMA; FX – Foreign Exchange; GAAP – Generally accepted accounting principles; GM – Global Markets; IAF – Impact Advisory and Finance; IBCM – Investment Banking & Capital Markets; ITS – International Trading Solutions; IWM – International Wealth Management; LCR – Liquidity Coverage Ratio; M&A – mergers and acquisitions; NNA – net new assets; PB – Private Banking; PC – Private Clients; PTI – pre-tax income; RoTE – Return on Tangible Equity; RWA – risk weighted assets; SDG – Sustainable Development Goals; SEC – U.S. Securities and Exchange Commission; SME – Small and Medium Enterprises; SUB – Swiss Universal Bank; UN – United Nations; USD – US dollar; WM&C – Wealth Management & Connected.
Important information
This document contains select information from the full 1Q20 Earnings Release and 1Q20 Results Presentation slides that Credit Suisse believes is of particular interest to media professionals. The complete 1Q20 Earnings Release and 1Q20 Results Presentation slides, which have been distributed simultaneously, contain more comprehensive information about our results and operations for the reporting quarter, as well as important information about our reporting methodology and some of the terms used in these documents. The complete 1Q20 Earnings Release and 1Q20 Results Presentation slides are not incorporated by reference into this document.
Credit Suisse has not finalized its 1Q20 Financial Report and Credit Suisse’s independent registered public accounting firm has not completed its review of the condensed consolidated financial statements (unaudited) for the period. Accordingly, the financial information contained in this document is subject to completion of quarter-end procedures, which may result in changes to that information.
We may not achieve all of the expected benefits of our strategic initiatives. Factors beyond our control, including but not limited to the market and economic conditions (including macroeconomic and other challenges and uncertainties, for example, resulting from the COVID-19 pandemic), changes in laws, rules or regulations and other challenges discussed in our public filings, could limit our ability to achieve some or all of the expected benefits of these initiatives.
In particular, the terms “Estimate”, “Illustrative”, “Ambition”, “Objective”, “Outlook” and “Goal” are not intended to be viewed as targets or projections, nor are they considered to be Key Performance Indicators. All such estimates, illustrations, ambitions, objectives, outlooks and goals are subject to a large number of inherent risks, assumptions and uncertainties, many of which are completely outside of our control. These risks, assumptions and uncertainties include, but are not limited to, general market conditions, market volatility, interest rate volatility and levels, global and regional economic conditions, challenges and uncertainties resulting from the COVID-19 pandemic, political uncertainty, changes in tax policies, regulatory changes, changes in levels of client activity as a result of any of the foregoing and other factors. Accordingly, this information should not be relied on for any purpose. We do not intend to update these estimates, illustrations, ambitions, objectives, outlooks or goals.
Page 10
Media release Zurich, April 23, 2020 | |
| | |
In preparing this document, management has made estimates and assumptions that affect the numbers presented. Actual results may differ. Annualized numbers do not take into account variations in operating results, seasonality and other factors and may not be indicative of actual, full-year results. Figures throughout this document may also be subject to rounding adjustments. All opinions and views constitute judgments as of the date of writing without regard to the date on which the reader may receive or access the information. This information is subject to change at any time without notice and we do not intend to update this information.
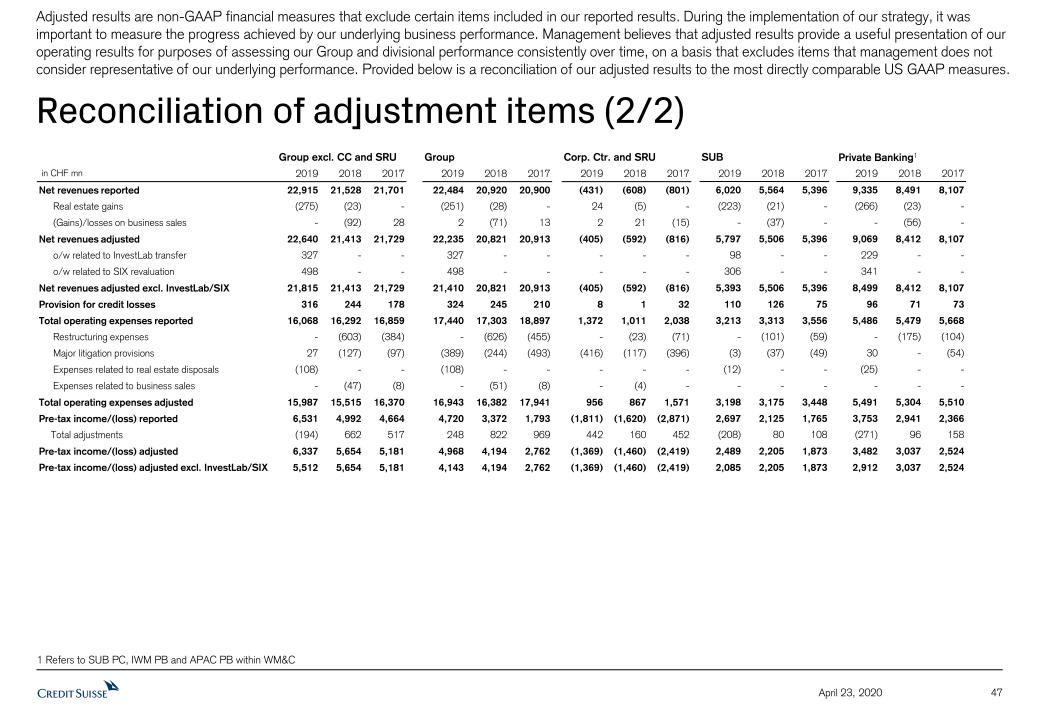
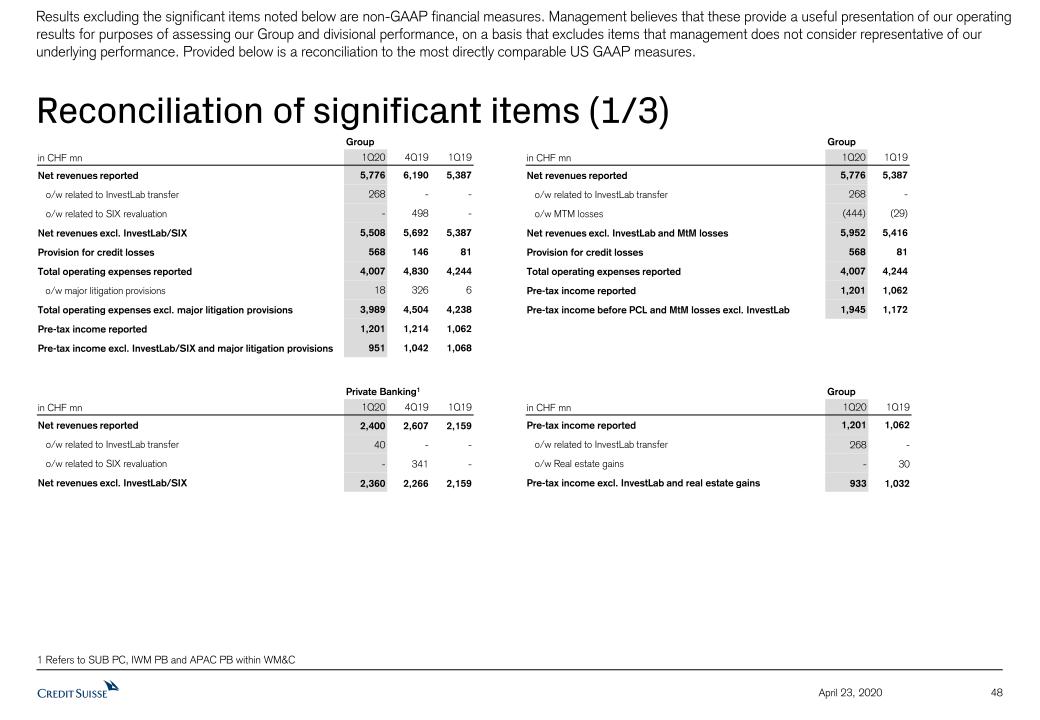
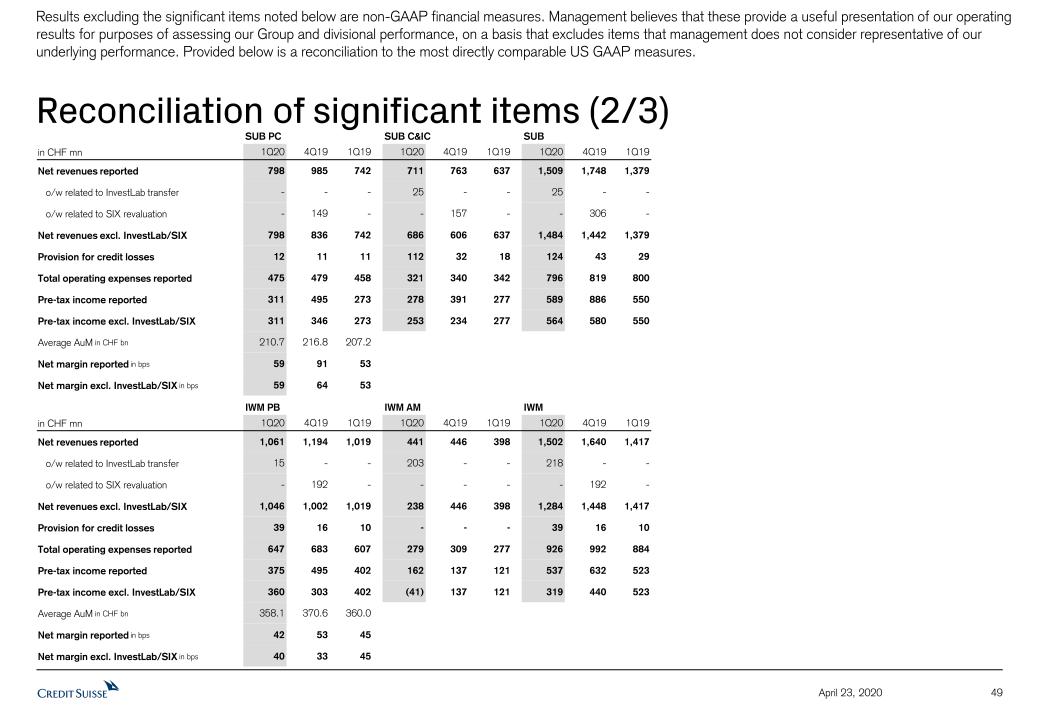
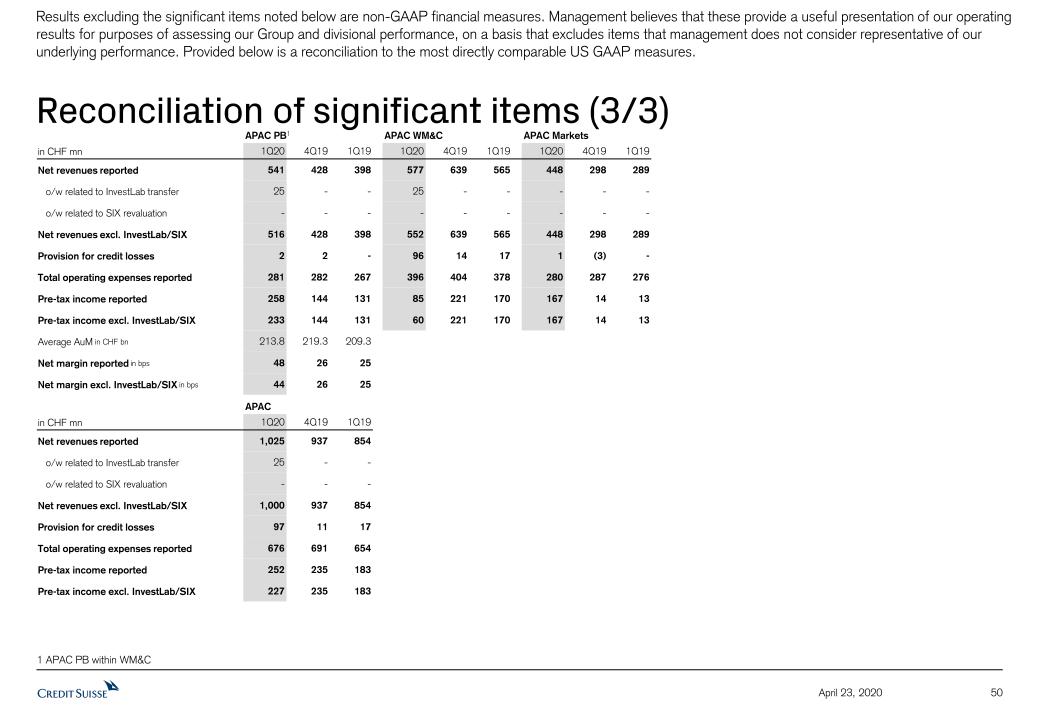
Results excluding items that are included in our reported results are non-GAAP financial measures. Our estimates, ambitions, objectives and targets often include metrics that are non-GAAP financial measures and are unaudited. A reconciliation of the estimates, ambitions, objectives and targets to the nearest GAAP measures is unavailable without unreasonable efforts. Return on tangible equity is based on tangible shareholders' equity (also known as tangible book value), a non-GAAP financial measure, which is calculated by deducting goodwill and other intangible assets from total shareholders' equity as presented in our balance sheet, both of which are unavailable on a prospective basis. Such estimates, ambitions, objectives and targets are calculated in a manner that is consistent with the accounting policies applied by us in preparing our financial statements.
Return on tangible equity is based on tangible shareholders’ equity, a non-GAAP financial measure, which is calculated by deducting goodwill and other intangible assets from total shareholders’ equity as presented in our balance sheet. Management believes that tangible shareholders' equity and return on tangible equity are meaningful as they are measures used and relied upon by industry analysts and investors to assess valuations and capital adequacy. For end-1Q20, tangible shareholders’ equity excluded goodwill of CHF 4,604 million and other intangible assets of CHF 279 million from total shareholders’ equity of CHF 48,777 million as presented in our balance sheet. For end-4Q19, tangible shareholders’ equity excluded goodwill of CHF 4,663 million and other intangible assets of CHF 291 million from total shareholders’ equity of CHF 43,644 million as presented in our balance sheet.
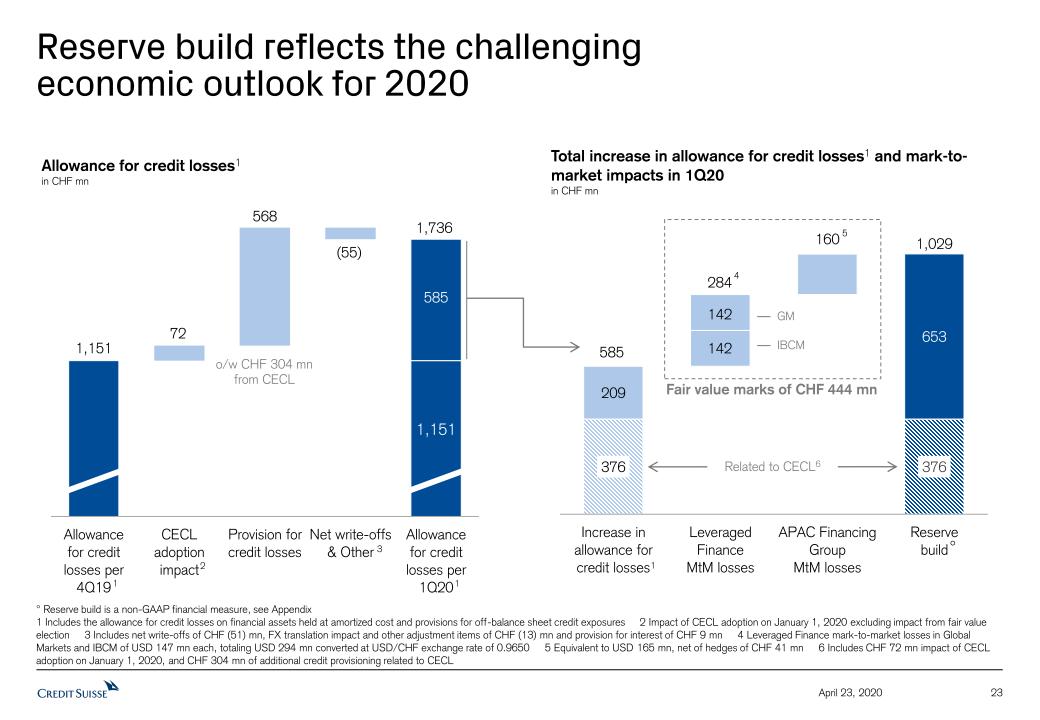
Reserve build is a non-GAAP financial measure, calculated by adding certain fair value mark-to-market losses (or gains) for the period to the increase in allowance for credit losses on financial assets held at amortized cost and provisions for off-balance sheet credit exposures recognized in that period. Management believes that reserve build is a useful measure that enables investors and others to assess the increase or decrease in reserves in the period across our accrual loan book, as well as our fair value loan book and underwriting book in potentially less liquid asset classes. In 1Q20, reserve build of CHF 1,029 million included CHF 585 million of increase in allowance for credit losses and provisions for off-balance sheet credit exposures and a combined total of CHF 444 million of fair value mark-to-market losses, comprising CHF 284 million of leveraged finance mark-to-market losses in Global Markets and IBCM and CHF 160 million of APAC Financing Group mark-to-market losses.
Regulatory capital is calculated as the worst of 10% of RWA and 3.5% of leverage exposure. Return on regulatory capital (a non-GAAP financial measure) is calculated using income / (loss) after tax and assumes a tax rate of 30% and capital allocated based on the worst of 10% of average RWA and 3.5% of average leverage exposure. These percentages are used in the calculation in order to reflect the Swiss regulatory minimum requirements for Basel III CET1 capital and leverage ratios. For the Markets business within the APAC division and for the Global Markets and Investment Banking & Capital Markets divisions, return on regulatory capital is based on US dollar denominated numbers.
Credit Suisse is subject to the Basel III framework, as implemented in Switzerland, as well as Swiss legislation and regulations for systemically important banks, which include capital, liquidity, leverage and large exposure requirements and rules for emergency plans designed to maintain systemically relevant functions in the event of threatened insolvency. Credit Suisse has adopted the Bank for International Settlements (BIS) leverage ratio framework, as issued by the Basel Committee on Banking Supervision (BCBS) and implemented in Switzerland by the Swiss Financial Market Supervisory Authority FINMA (FINMA).
Unless otherwise noted, all CET1 ratio, Tier-1 leverage ratio, risk-weighted assets and leverage exposure figures in this document are as of the end of the respective period.
Unless otherwise noted, leverage exposure is based on the BIS leverage ratio framework and consists of period-end balance sheet assets and prescribed regulatory adjustments. The tier 1 leverage ratio and CET1 leverage ratio are calculated as BIS tier 1 capital and CET1 capital, respectively, divided by period end leverage exposure. Swiss leverage ratios are measured on the same period-end basis as the leverage exposure for the BIS leverage ratio.
Assets under management and net new assets for APAC relate to the Private Banking business within the Wealth Management & Connected business.
References to Private Banking mean SUB PC, IWM PB and APAC PB within WM&C or their combined results. References to Total Investment Banking mean Global Markets, IBCM, APAC Markets and APAC advisory, underwriting and financing as well as M&A, DCM and ECM revenues within SUB C&IC. References to Markets mean Global Markets and APAC Markets or their combined results. References to Fixed Income Sales and Trading includes Global Markets and APAC Markets. References to Equity Sales and Trading includes Global Markets and APAC Markets.
Page 11
Media release Zurich, April 23, 2020 | |
| | |
Investors and others should note that we announce material information (including quarterly earnings releases and financial reports) to the investing public using press releases, SEC and Swiss ad hoc filings, our website and public conference calls and webcasts. We intend to also use our Twitter account @creditsuisse (https://twitter.com/creditsuisse) to excerpt key messages from our public disclosures, including earnings releases. We may retweet such messages through certain of our regional Twitter accounts, including @csschweiz (https://twitter.com/csschweiz) and @csapac (https://twitter.com/csapac). Investors and others should take care to consider such abbreviated messages in the context of the disclosures from which they are excerpted. The information we post on these Twitter accounts is not a part of this document.
Information referenced in this document, whether via website links or otherwise, is not incorporated into this document.
Certain material in this document has been prepared by Credit Suisse on the basis of publicly available information, internally developed data and other third-party sources believed to be reliable. Credit Suisse has not sought to independently verify information obtained from public and third-party sources and makes no representations or warranties as to accuracy, completeness or reliability of such information.
In various tables, use of “–” indicates not meaningful or not applicable.
Page 12
| Key metrics |
| | in / end of | | % change | |
| | 1Q20 | | 4Q19 | | 1Q19 | | QoQ | | YoY | |
| Credit Suisse Group results (CHF million) |
| Net revenues | | 5,776 | | 6,190 | | 5,387 | | (7) | | 7 | |
| Provision for credit losses | | 568 | | 146 | | 81 | | 289 | | – | |
| Compensation and benefits | | 2,316 | | 2,590 | | 2,518 | | (11) | | (8) | |
| General and administrative expenses | | 1,346 | | 1,916 | | 1,413 | | (30) | | (5) | |
| Commission expenses | | 345 | | 324 | | 313 | | 6 | | 10 | |
| Total other operating expenses | | 1,691 | | 2,240 | | 1,726 | | (25) | | (2) | |
| Total operating expenses | | 4,007 | | 4,830 | | 4,244 | | (17) | | (6) | |
| Income before taxes | | 1,201 | | 1,214 | | 1,062 | | (1) | | 13 | |
| Net income attributable to shareholders | | 1,314 | | 852 | | 749 | | 54 | | 75 | |
| Statement of operations metrics (%) |
| Return on regulatory capital | | 10.8 | | 10.6 | | 9.5 | | – | | – | |
| Balance sheet statistics (CHF million) |
| Total assets | | 832,166 | | 787,295 | | 793,636 | | 6 | | 5 | |
| Risk-weighted assets | | 300,580 | | 290,463 | | 290,098 | | 3 | | 4 | |
| Leverage exposure | | 869,706 | | 909,994 | | 901,814 | | (4) | | (4) | |
| Assets under management and net new assets (CHF billion) |
| Assets under management | | 1,370.5 | | 1,507.2 | | 1,427.0 | | (9.1) | | (4.0) | |
| Net new assets | | 5.8 | | 9.9 | | 34.6 | | (41.4) | | (83.2) | |
| Basel III regulatory capital and leverage statistics (%) |
| CET1 ratio | | 12.1 | | 12.7 | | 12.6 | | – | | – | |
| CET1 leverage ratio | | 4.2 | | 4.0 | | 4.1 | | – | | – | |
| Tier 1 leverage ratio | | 5.8 | | 5.5 | | 5.2 | | – | | – | |
| Swiss Universal Bank |
| | in / end of | | % change | |
| | 1Q20 | | 4Q19 | | 1Q19 | | QoQ | | YoY | |
| Results (CHF million) |
| Net revenues | | 1,509 | | 1,748 | | 1,379 | | (14) | | 9 | |
| of which Private Clients | | 798 | | 985 | | 742 | | (19) | | 8 | |
| of which Corporate & Institutional Clients | | 711 | | 763 | | 637 | | (7) | | 12 | |
| Provision for credit losses | | 124 | | 43 | | 29 | | 188 | | 328 | |
| Total operating expenses | | 796 | | 819 | | 800 | | (3) | | (1) | |
| Income before taxes | | 589 | | 886 | | 550 | | (34) | | 7 | |
| of which Private Clients | | 311 | | 495 | | 273 | | (37) | | 14 | |
| of which Corporate & Institutional Clients | | 278 | | 391 | | 277 | | (29) | | 0 | |
| Metrics (%) |
| Return on regulatory capital | | 17.7 | | 26.8 | | 17.1 | | – | | – | |
| Cost/income ratio | | 52.8 | | 46.9 | | 58.0 | | – | | – | |
| Private Clients |
| Assets under management (CHF billion) | | 194.8 | | 217.6 | | 210.7 | | (10.5) | | (7.5) | |
| Net new assets (CHF billion) | | (4.2) | | (0.5) | | 3.3 | | – | | – | |
| Gross margin (annualized) (bp) | | 151 | | 182 | | 143 | | – | | – | |
| Net margin (annualized) (bp) | | 59 | | 91 | | 53 | | – | | – | |
| Corporate & Institutional Clients |
| Assets under management (CHF billion) | | 405.3 | | 436.4 | | 395.9 | | (7.1) | | 2.4 | |
| Net new assets (CHF billion) | | 4.8 | | 2.5 | | 27.6 | | – | | – | |
| International Wealth Management |
| | in / end of | | % change | |
| | 1Q20 | | 4Q19 | | 1Q19 | | QoQ | | YoY | |
| Results (CHF million) |
| Net revenues | | 1,502 | | 1,640 | | 1,417 | | (8) | | 6 | |
| of which Private Banking | | 1,061 | | 1,194 | | 1,019 | | (11) | | 4 | |
| of which Asset Management | | 441 | | 446 | | 398 | | (1) | | 11 | |
| Provision for credit losses | | 39 | | 16 | | 10 | | 144 | | 290 | |
| Total operating expenses | | 926 | | 992 | | 884 | | (7) | | 5 | |
| Income before taxes | | 537 | | 632 | | 523 | | (15) | | 3 | |
| of which Private Banking | | 375 | | 495 | | 402 | | (24) | | (7) | |
| of which Asset Management | | 162 | | 137 | | 121 | | 18 | | 34 | |
| Metrics (%) |
| Return on regulatory capital | | 33.9 | | 40.1 | | 35.4 | | – | | – | |
| Cost/income ratio | | 61.7 | | 60.5 | | 62.4 | | – | | – | |
| Private Banking |
| Assets under management (CHF billion) | | 327.7 | | 370.0 | | 356.4 | | (11.4) | | (8.1) | |
| Net new assets (CHF billion) | | 3.7 | | 0.6 | | 1.3 | | – | | – | |
| Gross margin (annualized) (bp) | | 119 | | 129 | | 113 | | – | | – | |
| Net margin (annualized) (bp) | | 42 | | 53 | | 45 | | – | | – | |
| Asset Management |
| Assets under management (CHF billion) | | 409.6 | | 437.9 | | 404.5 | | (6.5) | | 1.3 | |
| Net new assets (CHF billion) | | 0.1 | | 7.5 | | (0.5) | | – | | – | |
| Asia Pacific |
| | in / end of | | % change | |
| | 1Q20 | | 4Q19 | | 1Q19 | | QoQ | | YoY | |
| Results (CHF million) |
| Net revenues | | 1,025 | | 937 | | 854 | | 9 | | 20 | |
| of which Wealth Management & Connected | | 577 | | 639 | | 565 | | (10) | | 2 | |
| of which Markets | | 448 | | 298 | | 289 | | 50 | | 55 | |
| Provision for credit losses | | 97 | | 11 | | 17 | | – | | 471 | |
| Total operating expenses | | 676 | | 691 | | 654 | | (2) | | 3 | |
| Income before taxes | | 252 | | 235 | | 183 | | 7 | | 38 | |
| of which Wealth Management & Connected | | 85 | | 221 | | 170 | | (62) | | (50) | |
| of which Markets | | 167 | | 14 | | 13 | | – | | – | |
| Metrics (%) |
| Return on regulatory capital | | 17.9 | | 16.2 | | 13.5 | | – | | – | |
| Cost/income ratio | | 66.0 | | 73.7 | | 76.6 | | – | | – | |
| Wealth Management & Connected – Private Banking |
| Assets under management (CHF billion) | | 197.0 | | 220.0 | | 214.7 | | (10.5) | | (8.2) | |
| Net new assets (CHF billion) | | 3.0 | | 0.7 | | 3.8 | | – | | – | |
| Gross margin (annualized) (bp) | | 101 | | 78 | | 76 | | – | | – | |
| Net margin (annualized) (bp) | | 48 | | 26 | | 25 | | – | | – | |
| Global Markets |
| | in / end of | | % change | |
| | 1Q20 | | 4Q19 | | 1Q19 | | QoQ | | YoY | |
| Results (CHF million) |
| Net revenues | | 1,630 | | 1,312 | | 1,472 | | 24 | | 11 | |
| Provision for credit losses | | 150 | | 31 | | 11 | | 384 | | – | |
| Total operating expenses | | 1,150 | | 1,233 | | 1,179 | | (7) | | (2) | |
| Income before taxes | | 330 | | 48 | | 282 | | – | | 17 | |
| Metrics (%) |
| Return on regulatory capital | | 9.6 | | 1.4 | | 8.9 | | – | | – | |
| Cost/income ratio | | 70.6 | | 94.0 | | 80.1 | | – | | – | |
| Investment Banking & Capital Markets |
| | in / end of | | % change | |
| | 1Q20 | | 4Q19 | | 1Q19 | | QoQ | | YoY | |
| Results (CHF million) |
| Net revenues | | 183 | | 431 | | 356 | | (58) | | (49) | |
| Provision for credit losses | | 155 | | 39 | | 8 | | 297 | | – | |
| Total operating expenses | | 406 | | 452 | | 441 | | (10) | | (8) | |
| Loss before taxes | | (378) | | (60) | | (93) | | – | | 306 | |
| Metrics (%) |
| Return on regulatory capital | | (43.4) | | (6.6) | | (10.6) | | – | | – | |
| Cost/income ratio | | 221.9 | | 104.9 | | 123.9 | | – | | – | |
| Global advisory and underwriting revenues |
| | in | | % change | |
| | 1Q20 | | 4Q19 | | 1Q19 | | QoQ | | YoY | |
| Global advisory and underwriting revenues (USD million) |
| Advisory and other fees | | 189 | | 234 | | 171 | | (19) | | 11 | |
| Debt underwriting | | 65 | | 456 | | 460 | | (86) | | (86) | |
| Equity underwriting | | 164 | | 205 | | 138 | | (20) | | 19 | |
| Global advisory and underwriting revenues | | 418 | | 895 | | 769 | | (53) | | (46) | |
Cautionary statement regarding forward-looking information
This document contains statements that constitute forward-looking statements. In addition, in the future we, and others on our behalf, may make statements that constitute forward-looking statements. Such forward-looking statements may include, without limitation, statements relating to the following:
■ our plans, targets or goals;
■ our future economic performance or prospects;
■ the potential effect on our future performance of certain contingencies; and
■ assumptions underlying any such statements.
Words such as “believes,” “anticipates,” “expects,” “intends” and “plans” and similar expressions are intended to identify forward-looking statements but are not the exclusive means of identifying such statements. We do not intend to update these forward-looking statements.
By their very nature, forward-looking statements involve inherent risks and uncertainties, both general and specific, and risks exist that predictions, forecasts, projections and other outcomes described or implied in forward-looking statements will not be achieved. We caution you that a number of important factors could cause results to differ materially from the plans, targets, goals, expectations, estimates and intentions expressed in such forward-looking statements. These factors include:
■ the ability to maintain sufficient liquidity and access capital markets;
■ market volatility and interest rate fluctuations and developments affecting interest rate levels , including the persistence of a low or negative interest rate environment;
■ the strength of the global economy in general and the strength of the economies of the countries in which we conduct our operations, in particular the risk of negative impacts of COVID-19 on the global economy and financial markets and the risk of continued slow economic recovery or downturn in the EU, the US or other developed countries or in emerging markets in 2020 and beyond;
■ the emergence of widespread health emergencies, infectious diseases or pandemics, such as COVID-19, and the actions that may be taken by governmental authorities to contain the outbreak or to counter its impact on our business;
■ potential risks and uncertainties relating to the ultimate geographic spread of COVID-19, the severity of the disease and the duration of the COVID-19 outbreak, including potential material adverse effects on our business, financial condition and results of operations;
■ the direct and indirect impacts of deterioration or slow recovery in residential and commercial real estate markets;
■ adverse rating actions by credit rating agencies in respect of us, sovereign issuers, structured credit products or other credit-related exposures;
■ the ability to achieve our strategic goals, including those related to our targets and financial goals;
■ the ability of counterparties to meet their obligations to us and the adequacy of our allowance for credit losses;
■ the effects of, and changes in, fiscal, monetary, exchange rate, trade and tax policies, as well as currency fluctuations;
■ political and social developments, including war, civil unrest or terrorist activity and climate change;
■ the ability to appropriately address social, environmental and sustainability concerns that may arise from our business activities;
■ the effects of, and uncertainty arising from, the UK’s withdrawal from the EU;
■ the possibility of foreign exchange controls, expropriation, nationalization or confiscation of assets in countries in which we conduct our operations;
■ operational factors such as systems failure, human error, or the failure to implement procedures properly;
■ the risk of cyber attacks, information or security breaches or technology failures on our business or operations;
■ the adverse resolution of litigation, regulatory proceedings and other contingencies;
■ actions taken by regulators with respect to our business and practices and possible resulting changes to our business organization, practices and policies in countries in which we conduct our operations;
■ the effects of changes in laws, regulations or accounting or tax standards, policies or practices in countries in which we conduct our operations;
■ the expected discontinuation of LIBOR and other interbank offered rates and the transition to alternative reference rates;
■ the potential effects of changes in our legal entity structure;
■ competition or changes in our competitive position in geographic and business areas in which we conduct our operations;
■ the ability to retain and recruit qualified personnel;
■ the ability to maintain our reputation and promote our brand;
■ the ability to increase market share and control expenses;
■ technological changes instituted by us, our counterparties or competitors;
■ the timely development and acceptance of our new products and services and the perceived overall value of these products and services by users;
■ acquisitions, including the ability to integrate acquired businesses successfully, and divestitures, including the ability to sell non-core assets; and
■ other unforeseen or unexpected events and our success at managing these and the risks involved in the foregoing.
We caution you that the foregoing list of important factors is not exclusive. When evaluating forward-looking statements, you should carefully consider the foregoing factors and other uncertainties and events, including the information set forth in “Risk factors” in I – Information on the company in our Annual Report 2019.
Thomas Gottstein, Chief Executive OfficerDavid Mathers, Chief Financial OfficerApril 23, 2020 Credit SuisseFirst Quarter 2020 Results
Disclaimer (1/2) 2 April 23, 2020 Credit Suisse has not finalized its 1Q20 Financial Report and Credit Suisse’s independent registered public accounting firm has not completed its review of the condensed consolidated financial statements (unaudited) for the period. Accordingly, the financial information contained in this presentation is subject to completion of quarter-end procedures, which may result in changes to that information.This material does not purport to contain all of the information that you may wish to consider. This material is not to be relied upon as such or used in substitution for the exercise of independent judgment. Cautionary statement regarding forward-looking statements This presentation contains forward-looking statements that involve inherent risks and uncertainties, and we might not be able to achieve the predictions, forecasts, projections and other outcomes we describe or imply in forward-looking statements. A number of important factors could cause results to differ materially from the plans, targets, goals, expectations, estimates and intentions we express in these forward-looking statements, including those we identify in "Risk factors” in our Annual Report on Form 20-F for the fiscal year ended December 31, 2019 and in the “Cautionary statement regarding forward-looking information" in our 1Q20 Earnings Release published on April 23, 2020 and filed with the US Securities and Exchange Commission, and in other public filings and press releases. We do not intend to update these forward-looking statements. In particular, the terms “Estimate”, “Illustrative”, “Ambition”, “Objective”, “Outlook” and “Goal” are not intended to be viewed as targets or projections, nor are they considered to be Key Performance Indicators. All such estimates, illustrations, ambitions, objectives, outlooks and goals are subject to a large number of inherent risks, assumptions and uncertainties, many of which are completely outside of our control. These risks, assumptions and uncertainties include, but are not limited to, general market conditions, market volatility, interest rate volatility and levels, global and regional economic conditions, challenges and uncertainties resulting from the COVID-19 pandemic, political uncertainty, changes in tax policies, regulatory changes, changes in levels of client activity as a result of any of the foregoing and other factors. Accordingly, this information should not be relied on for any purpose. We do not intend to update these estimates, illustrations, ambitions, objectives, outlooks or goals. We may not achieve the benefits of our strategic initiativesWe may not achieve all of the expected benefits of our strategic initiatives. Factors beyond our control, including but not limited to the market and economic conditions (including macroeconomic and other challenges and uncertainties, for example, resulting from the COVID-19 pandemic), changes in laws, rules or regulations and other challenges discussed in our public filings, could limit our ability to achieve some or all of the expected benefits of these initiatives. Estimates and assumptionsIn preparing this presentation, management has made estimates and assumptions that affect the numbers presented. Actual results may differ. Annualized numbers do not take into account variations in operating results, seasonality and other factors and may not be indicative of actual, full-year results. Figures throughout this presentation may also be subject to rounding adjustments. All opinions and views constitute judgments as of the date of writing without regard to the date on which the reader may receive or access the information. This information is subject to change at any time without notice and we do not intend to update this information.Statement regarding non-GAAP financial measuresThis presentation also contains non-GAAP financial measures, including adjusted results and results excluding certain significant items as well as return on regulatory capital, return on tangible equity and tangible book value per share (which are based on tangible shareholders’ equity). Information needed to reconcile such non-GAAP financial measures to the most directly comparable measures under US GAAP can be found in this presentation, which is available on our website at www.credit-suisse.com.Our estimates, ambitions, objectives and targets often include metrics that are non-GAAP financial measures and are unaudited. A reconciliation of the estimates, ambitions, objectives and targets to the nearest GAAP measures is unavailable without unreasonable efforts. Adjusted results exclude goodwill impairment, major litigation provisions, real estate gains and other revenue and expense items included in our reported results, all of which are unavailable on a prospective basis. Such estimates, ambitions, objectives and targets are calculated in a manner that is consistent with the accounting policies applied by us in preparing our financial statements.
Disclaimer (2/2) 3 April 23, 2020 Statement regarding capital, liquidity and leverageCredit Suisse is subject to the Basel III framework, as implemented in Switzerland, as well as Swiss legislation and regulations for systemically important banks (Swiss Requirements), which include capital, liquidity, leverage and large exposure requirements and rules for emergency plans designed to maintain systemically relevant functions in the event of threatened insolvency. Credit Suisse has adopted the Bank for International Settlements (BIS) leverage ratio framework, as issued by the Basel Committee on Banking Supervision (BCBS) and implemented in Switzerland by the Swiss Financial Market Supervisory Authority FINMA.References to phase-in and look-through included herein refer to Basel III capital requirements and Swiss Requirements. Phase-in reflects that, for the years 2014-2018, there was a five-year (20% per annum) phase-in of goodwill, other intangible assets and other capital deductions (e.g., certain deferred tax assets) and a phase-out of an adjustment for the accounting treatment of pension plans. For the years 2013-2022, there is a phase-out of certain capital instruments. Look-through assumes the full phase-in of goodwill and other intangible assets and other regulatory adjustments and the phase-out of certain capital instruments.Unless otherwise noted, leverage exposure is based on the BIS leverage ratio framework and consists of period-end balance sheet assets and prescribed regulatory adjustments. The tier 1 leverage ratio and CET1 leverage ratio are calculated as BIS tier 1 capital and CET1 capital, respectively, divided by period-end leverage exposure. Swiss leverage ratios are measured on the same period-end basis as the leverage exposure for the BIS leverage ratio.SourcesCertain material in this presentation has been prepared by Credit Suisse on the basis of publicly available information, internally developed data and other third-party sources believed to be reliable. Credit Suisse has not sought to independently verify information obtained from public and third-party sources and makes no representations or warranties as to accuracy, completeness or reliability of such information.
Earnings Review 4 April 23, 2020
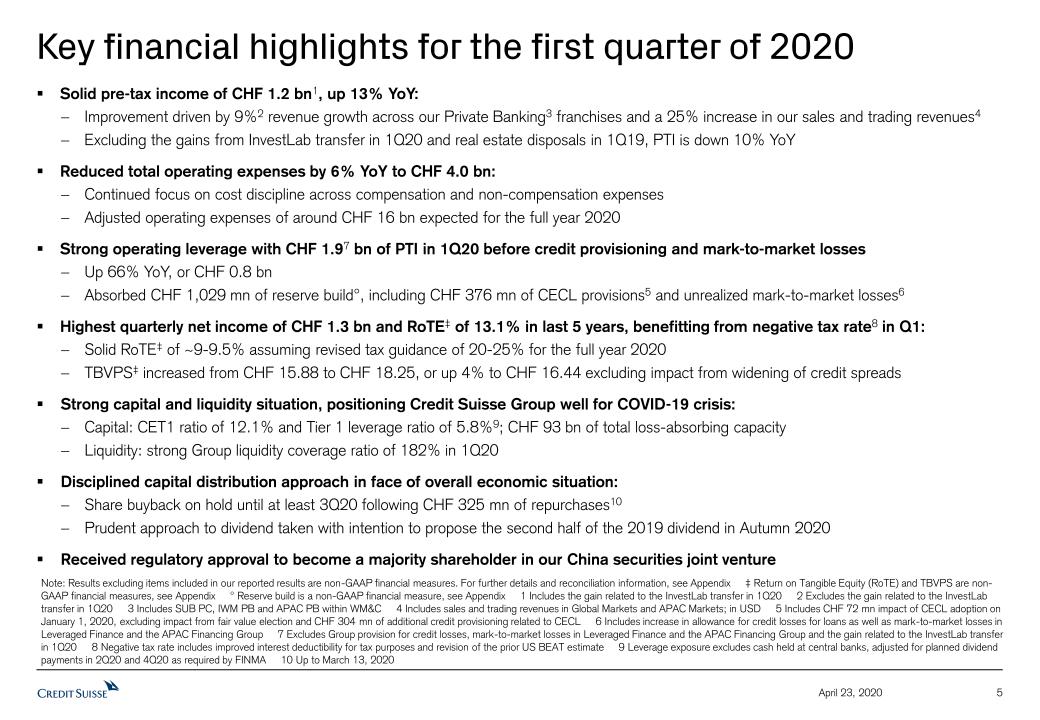
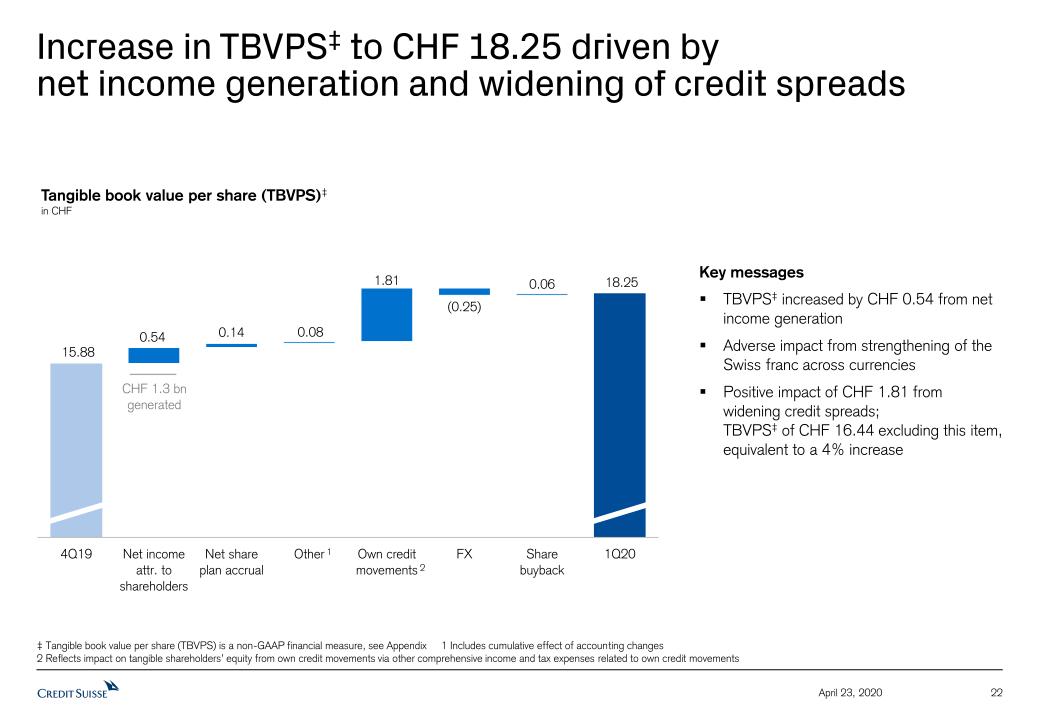
Key financial highlights for the first quarter of 2020 5 April 23, 2020 Solid pre-tax income of CHF 1.2 bn1, up 13% YoY:Improvement driven by 9%2 revenue growth across our Private Banking3 franchises and a 25% increase in our sales and trading revenues4Excluding the gains from InvestLab transfer in 1Q20 and real estate disposals in 1Q19, PTI is down 10% YoYReduced total operating expenses by 6% YoY to CHF 4.0 bn:Continued focus on cost discipline across compensation and non-compensation expensesAdjusted operating expenses of around CHF 16 bn expected for the full year 2020Strong operating leverage with CHF 1.97 bn of PTI in 1Q20 before credit provisioning and mark-to-market lossesUp 66% YoY, or CHF 0.8 bnAbsorbed CHF 1,029 mn of reserve build°, including CHF 376 mn of CECL provisions5 and unrealized mark-to-market losses6Highest quarterly net income of CHF 1.3 bn and RoTE‡ of 13.1% in last 5 years, benefitting from negative tax rate8 in Q1:Solid RoTE‡ of ~9-9.5% assuming revised tax guidance of 20-25% for the full year 2020TBVPS‡ increased from CHF 15.88 to CHF 18.25, or up 4% to CHF 16.44 excluding impact from widening of credit spreads Strong capital and liquidity situation, positioning Credit Suisse Group well for COVID-19 crisis:Capital: CET1 ratio of 12.1% and Tier 1 leverage ratio of 5.8%9; CHF 93 bn of total loss-absorbing capacityLiquidity: strong Group liquidity coverage ratio of 182% in 1Q20Disciplined capital distribution approach in face of overall economic situation:Share buyback on hold until at least 3Q20 following CHF 325 mn of repurchases10Prudent approach to dividend taken with intention to propose the second half of the 2019 dividend in Autumn 2020Received regulatory approval to become a majority shareholder in our China securities joint venture Note: Results excluding items included in our reported results are non-GAAP financial measures. For further details and reconciliation information, see Appendix ‡ Return on Tangible Equity (RoTE) and TBVPS are non-GAAP financial measures, see Appendix ° Reserve build is a non-GAAP financial measure, see Appendix 1 Includes the gain related to the InvestLab transfer in 1Q20 2 Excludes the gain related to the InvestLab transfer in 1Q20 3 Includes SUB PC, IWM PB and APAC PB within WM&C 4 Includes sales and trading revenues in Global Markets and APAC Markets; in USD 5 Includes CHF 72 mn impact of CECL adoption on January 1, 2020, excluding impact from fair value election and CHF 304 mn of additional credit provisioning related to CECL 6 Includes increase in allowance for credit losses for loans as well as mark-to-market losses in Leveraged Finance and the APAC Financing Group 7 Excludes Group provision for credit losses, mark-to-market losses in Leveraged Finance and the APAC Financing Group and the gain related to the InvestLab transfer in 1Q20 8 Negative tax rate includes improved interest deductibility for tax purposes and revision of the prior US BEAT estimate 9 Leverage exposure excludes cash held at central banks, adjusted for planned dividend payments in 2Q20 and 4Q20 as required by FINMA 10 Up to March 13, 2020
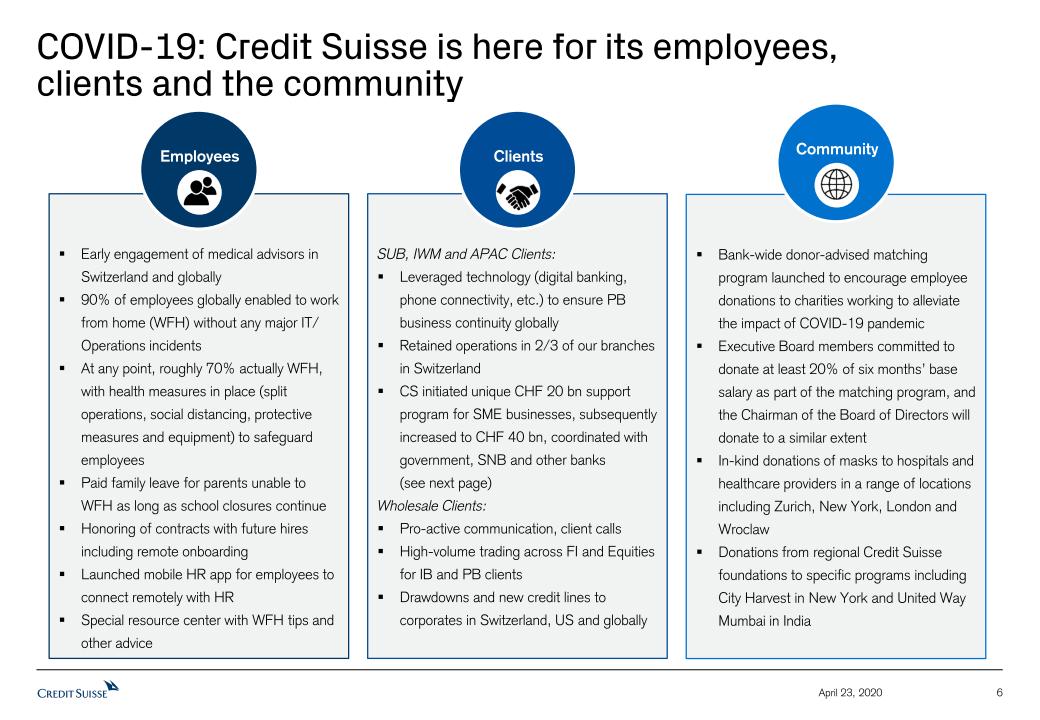
COVID-19: Credit Suisse is here for its employees,clients and the community 6 April 23, 2020 Early engagement of medical advisors in Switzerland and globally90% of employees globally enabled to work from home (WFH) without any major IT/ Operations incidentsAt any point, roughly 70% actually WFH, with health measures in place (split operations, social distancing, protective measures and equipment) to safeguard employeesPaid family leave for parents unable to WFH as long as school closures continueHonoring of contracts with future hires including remote onboardingLaunched mobile HR app for employees to connect remotely with HRSpecial resource center with WFH tips and other advice Employees SUB, IWM and APAC Clients:Leveraged technology (digital banking, phone connectivity, etc.) to ensure PB business continuity globallyRetained operations in 2/3 of our branches in SwitzerlandCS initiated unique CHF 20 bn support program for SME businesses, subsequently increased to CHF 40 bn, coordinated with government, SNB and other banks(see next page)Wholesale Clients:Pro-active communication, client callsHigh-volume trading across FI and Equities for IB and PB clientsDrawdowns and new credit lines to corporates in Switzerland, US and globally Clients Bank-wide donor-advised matching program launched to encourage employee donations to charities working to alleviate the impact of COVID-19 pandemicExecutive Board members committed to donate at least 20% of six months’ base salary as part of the matching program, and the Chairman of the Board of Directors will donate to a similar extentIn-kind donations of masks to hospitals and healthcare providers in a range of locations including Zurich, New York, London and WroclawDonations from regional Credit Suisse foundations to specific programs including City Harvest in New York and United Way Mumbai in India Community
COVID-19 CREDIT (5-year loan)Company domiciled in Switzerland, founded prior to March 1, 2020Amount: up to 10% of 2019 turnover, max. CHF 500k, available within a few hours100% guaranteed by the government Currently 0% interest rateDocumentation: 1-page contract; available at any Swiss bankCOVID-19 CREDIT PLUS (5-year loan)Company domiciled in Switzerland, application submitted for COVID-19 CREDIT, credit check completedCHF 500k to CHF 20 mn (total amount including COVID-19 CREDIT amount), available within a few days 85% guaranteed by the government, 15% by Credit SuisseDocumentation: ~7 page loan agreement Switzerland’s innovative CHF 40 bn support package to help Swiss SMEs to cope with the COVID-19 pandemic Number ofloans issued~14.0k1 Loan volume issuedCHF 2.4 bn1 7 April 23, 2020 Source: FINMA, SNB, Swiss Confederation and Credit Suisse data 1 As of April 21, 2020 March 20Government announces guarantee program of CHF 20 bn March 26Program implemented; SMEs can apply for loans April 03Guarantee program doubled to CHF 40 bn Timeline Program Credit Suisse contribution Credit Suisse initiated program in mid-March by approaching FINMA, SNB and the Finance Ministry and helped to coordinate effort with Finance Ministry, law firms and over 120 other Swiss banks. Highly successful program was put in place in less than 10 days. Program target amount was increased from CHF 20 bn to CHF 40 bn after just one week. Profits from the Swiss SME program, if any, will be donated to charitable causes
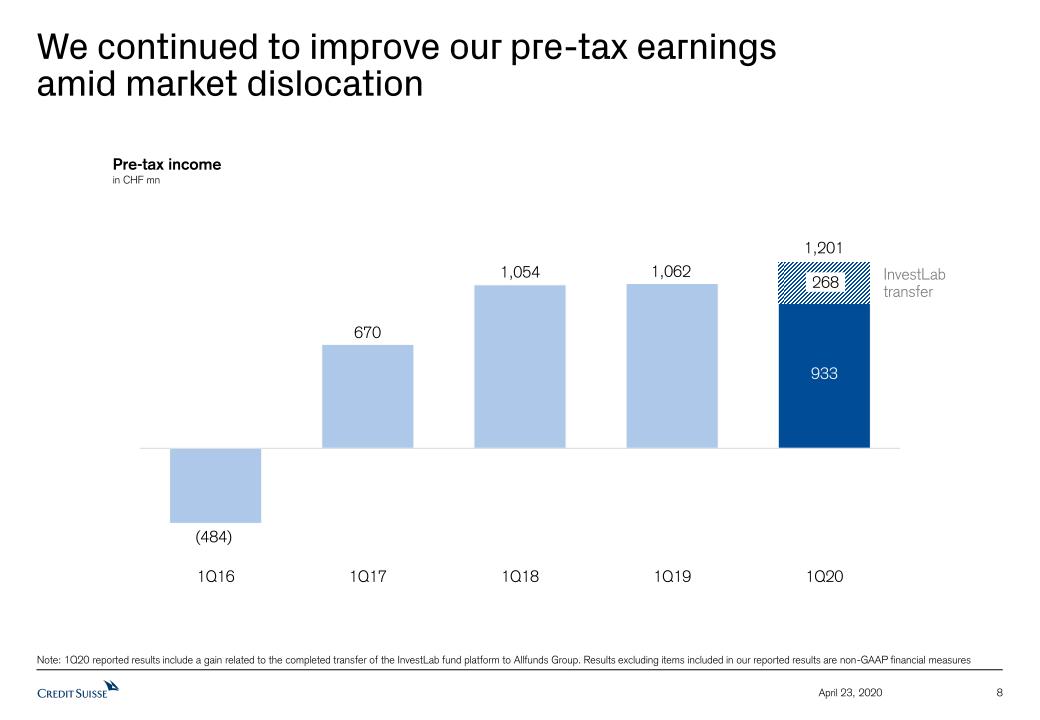
8 April 23, 2020 We continued to improve our pre-tax earningsamid market dislocation Pre-tax incomein CHF mn InvestLabtransfer 1,201 268 Note: 1Q20 reported results include a gain related to the completed transfer of the InvestLab fund platform to Allfunds Group. Results excluding items included in our reported results are non-GAAP financial measures
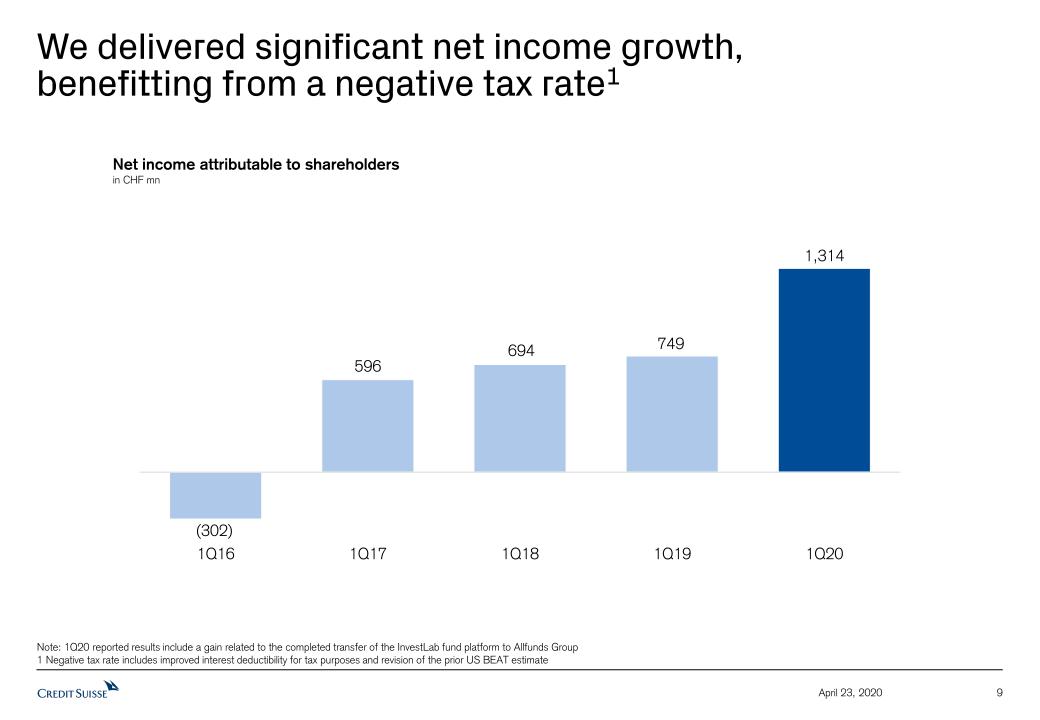
9 April 23, 2020 We delivered significant net income growth,benefitting from a negative tax rate1 Net income attributable to shareholdersin CHF mn Note: 1Q20 reported results include a gain related to the completed transfer of the InvestLab fund platform to Allfunds Group1 Negative tax rate includes improved interest deductibility for tax purposes and revision of the prior US BEAT estimate
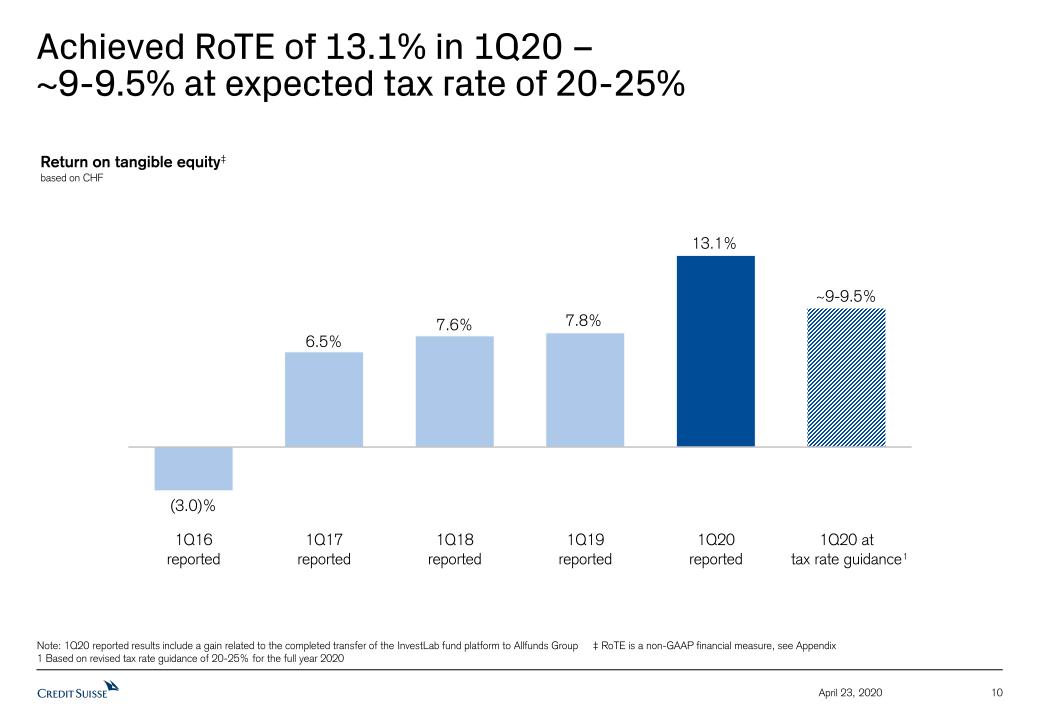
10 April 23, 2020 Achieved RoTE of 13.1% in 1Q20 – ~9-9.5% at expected tax rate of 20-25% Return on tangible equity‡based on CHF 1 Note: 1Q20 reported results include a gain related to the completed transfer of the InvestLab fund platform to Allfunds Group ‡ RoTE is a non-GAAP financial measure, see Appendix1 Based on revised tax rate guidance of 20-25% for the full year 2020 ~9-9.5%
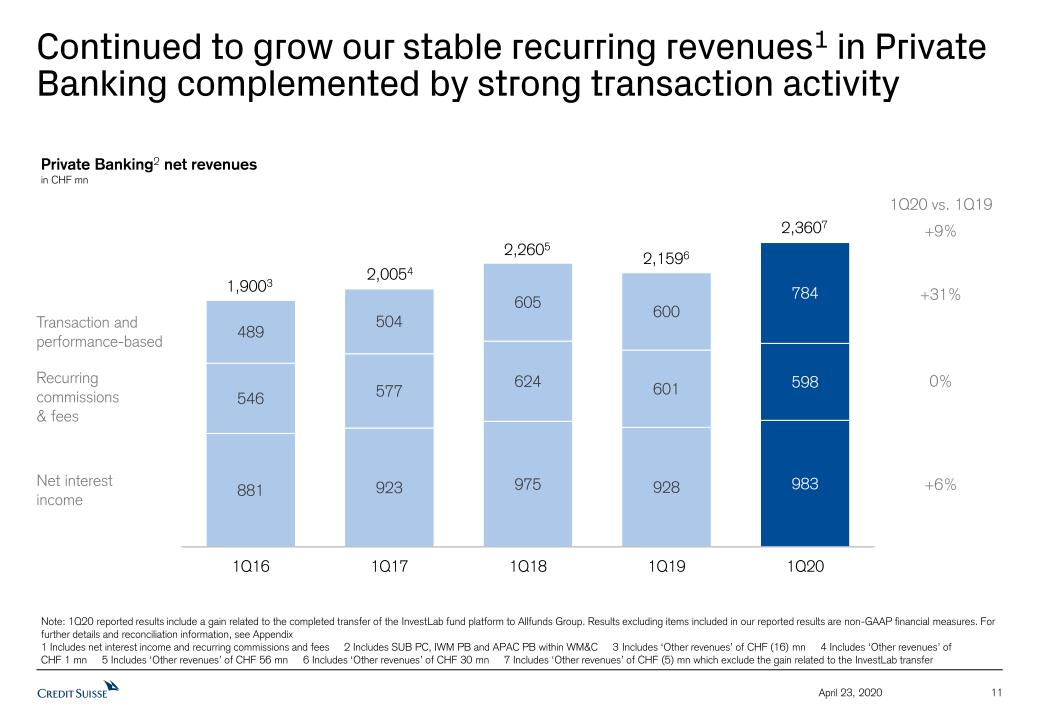
11 April 23, 2020 Continued to grow our stable recurring revenues1 in Private Banking complemented by strong transaction activity Private Banking2 net revenuesin CHF mn 2,1596 Net interest income Recurring commissions & fees Transaction and performance-based 2,3607 2,2605 2,0054 1,9003 +6% 0% +31% +9% 1Q20 vs. 1Q19 Note: 1Q20 reported results include a gain related to the completed transfer of the InvestLab fund platform to Allfunds Group. Results excluding items included in our reported results are non-GAAP financial measures. For further details and reconciliation information, see Appendix1 Includes net interest income and recurring commissions and fees 2 Includes SUB PC, IWM PB and APAC PB within WM&C 3 Includes ‘Other revenues’ of CHF (16) mn 4 Includes ‘Other revenues’ ofCHF 1 mn 5 Includes ‘Other revenues’ of CHF 56 mn 6 Includes ‘Other revenues’ of CHF 30 mn 7 Includes ‘Other revenues’ of CHF (5) mn which exclude the gain related to the InvestLab transfer
12 April 23, 2020 ITS continues to provide innovative, cross-asset solutions to our clients ITS net revenues in USD Selected key differentiators +64% Provided hedging solutions to a number of our clients amid market dislocation Executed bespoke Fixed Income solutions in credit, rates and FX products Structured Products / OTC derivatives Repositioned client portfolios during the COVID-19 pandemic, resulting in higher transaction volumes across asset classes Brokerage / Execution Continued to provide tailored solutions to our clients in a challenging environmentProactive approach to client loan restructuring to mitigate the impact of the COVID-19 crisis on their portfolios Lending
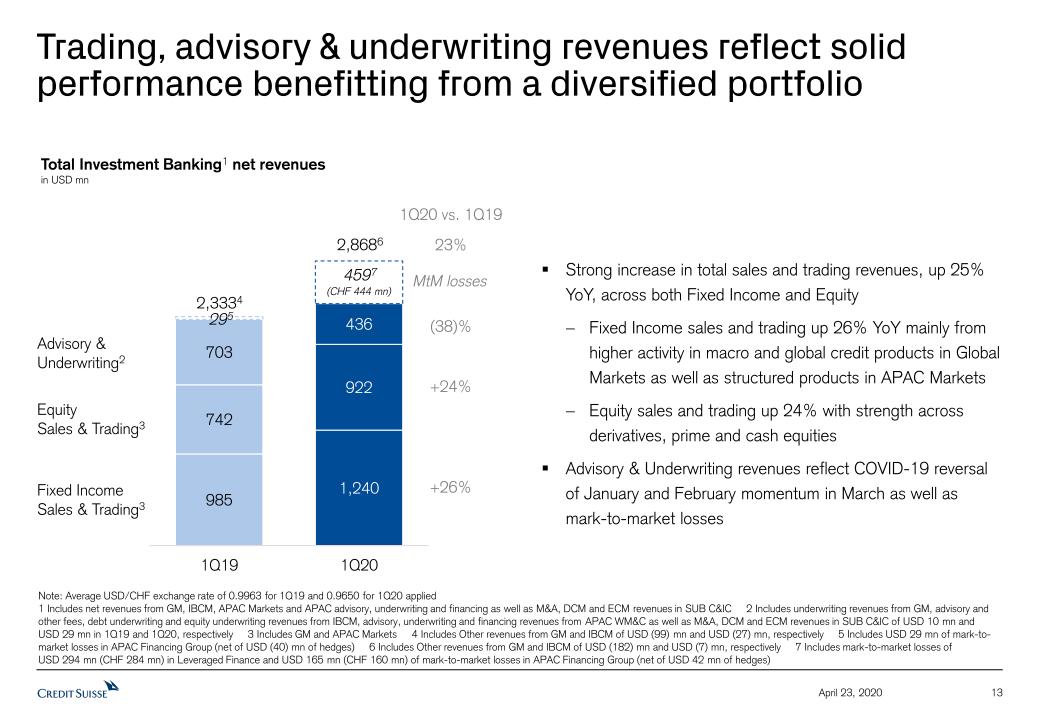
13 April 23, 2020 Trading, advisory & underwriting revenues reflect solid performance benefitting from a diversified portfolio Total Investment Banking1 net revenuesin USD mn Fixed IncomeSales & Trading3 EquitySales & Trading3 Advisory & Underwriting2 Note: Average USD/CHF exchange rate of 0.9963 for 1Q19 and 0.9650 for 1Q20 applied1 Includes net revenues from GM, IBCM, APAC Markets and APAC advisory, underwriting and financing as well as M&A, DCM and ECM revenues in SUB C&IC 2 Includes underwriting revenues from GM, advisory and other fees, debt underwriting and equity underwriting revenues from IBCM, advisory, underwriting and financing revenues from APAC WM&C as well as M&A, DCM and ECM revenues in SUB C&IC of USD 10 mn andUSD 29 mn in 1Q19 and 1Q20, respectively 3 Includes GM and APAC Markets 4 Includes Other revenues from GM and IBCM of USD (99) mn and USD (27) mn, respectively 5 Includes USD 29 mn of mark-to-market losses in APAC Financing Group (net of USD (40) mn of hedges) 6 Includes Other revenues from GM and IBCM of USD (182) mn and USD (7) mn, respectively 7 Includes mark-to-market losses ofUSD 294 mn (CHF 284 mn) in Leveraged Finance and USD 165 mn (CHF 160 mn) of mark-to-market losses in APAC Financing Group (net of USD 42 mn of hedges) 2,3334 2,8686 +26% (38)% 1Q20 vs. 1Q19 +24% Strong increase in total sales and trading revenues, up 25% YoY, across both Fixed Income and EquityFixed Income sales and trading up 26% YoY mainly from higher activity in macro and global credit products in Global Markets as well as structured products in APAC MarketsEquity sales and trading up 24% with strength across derivatives, prime and cash equitiesAdvisory & Underwriting revenues reflect COVID-19 reversal of January and February momentum in March as well as mark-to-market losses 23% MtM losses 295 4597 (CHF 444 mn)
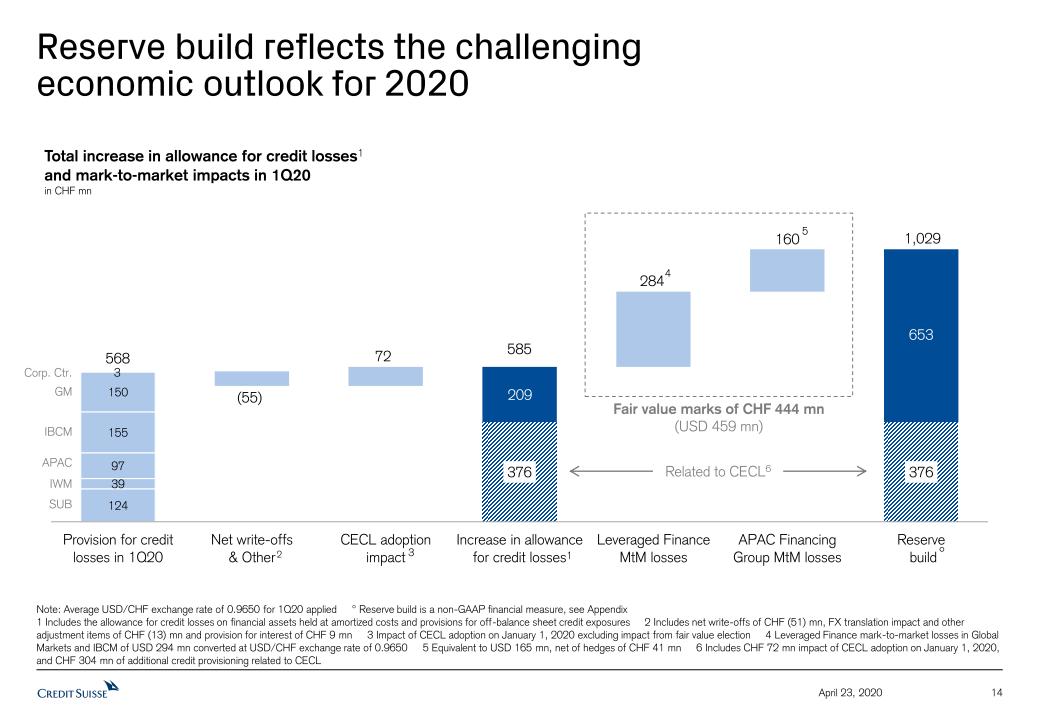
14 April 23, 2020 Reserve build reflects the challenging economic outlook for 2020 4 Fair value marks of CHF 444 mn(USD 459 mn) 5 Note: Average USD/CHF exchange rate of 0.9650 for 1Q20 applied ° Reserve build is a non-GAAP financial measure, see Appendix1 Includes the allowance for credit losses on financial assets held at amortized costs and provisions for off-balance sheet credit exposures 2 Includes net write-offs of CHF (51) mn, FX translation impact and other adjustment items of CHF (13) mn and provision for interest of CHF 9 mn 3 Impact of CECL adoption on January 1, 2020 excluding impact from fair value election 4 Leveraged Finance mark-to-market losses in Global Markets and IBCM of USD 294 mn converted at USD/CHF exchange rate of 0.9650 5 Equivalent to USD 165 mn, net of hedges of CHF 41 mn 6 Includes CHF 72 mn impact of CECL adoption on January 1, 2020, and CHF 304 mn of additional credit provisioning related to CECL Total increase in allowance for credit losses1 and mark-to-market impacts in 1Q20in CHF mn Related to CECL6 1,029 (55) 3 2 568 SUB IWM IBCM APAC GM Corp. Ctr. 3 1 °
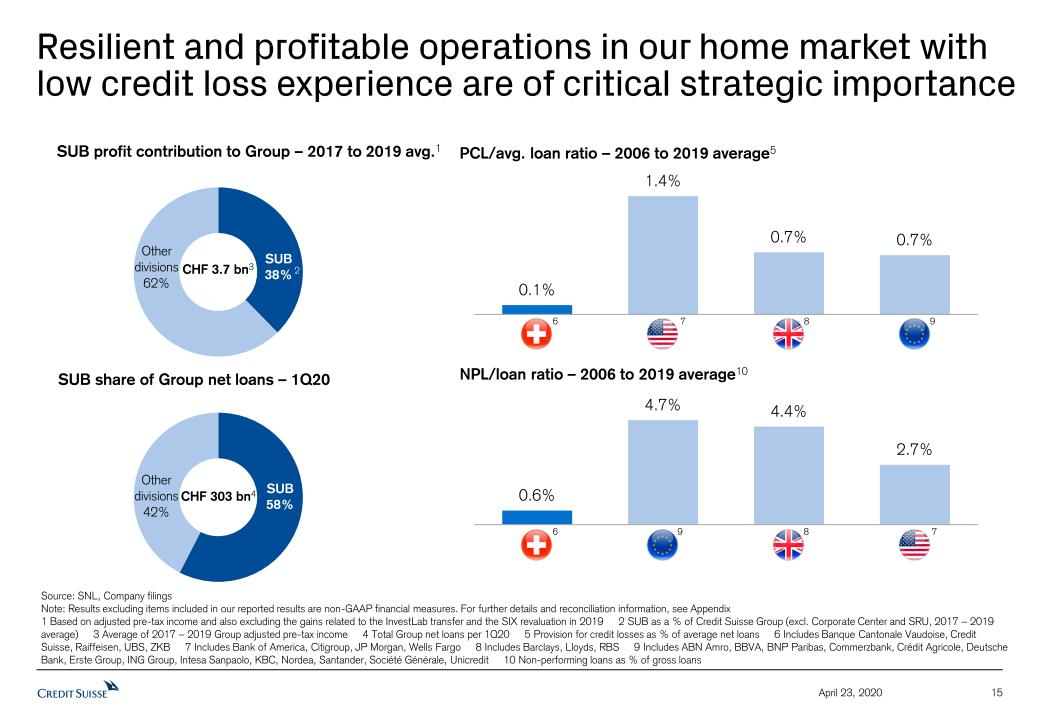
15 April 23, 2020 Resilient and profitable operations in our home market with low credit loss experience are of critical strategic importance CHF 3.7 bn3 Source: SNL, Company filingsNote: Results excluding items included in our reported results are non-GAAP financial measures. For further details and reconciliation information, see Appendix1 Based on adjusted pre-tax income and also excluding the gains related to the InvestLab transfer and the SIX revaluation in 2019 2 SUB as a % of Credit Suisse Group (excl. Corporate Center and SRU, 2017 – 2019 average) 3 Average of 2017 – 2019 Group adjusted pre-tax income 4 Total Group net loans per 1Q20 5 Provision for credit losses as % of average net loans 6 Includes Banque Cantonale Vaudoise, Credit Suisse, Raiffeisen, UBS, ZKB 7 Includes Bank of America, Citigroup, JP Morgan, Wells Fargo 8 Includes Barclays, Lloyds, RBS 9 Includes ABN Amro, BBVA, BNP Paribas, Commerzbank, Crédit Agricole, Deutsche Bank, Erste Group, ING Group, Intesa Sanpaolo, KBC, Nordea, Santander, Société Générale, Unicredit 10 Non-performing loans as % of gross loans SUB profit contribution to Group – 2017 to 2019 avg.1 PCL/avg. loan ratio – 2006 to 2019 average5 NPL/loan ratio – 2006 to 2019 average10 6 9 8 7 6 9 8 7 SUB share of Group net loans – 1Q20 CHF 303 bn4 2
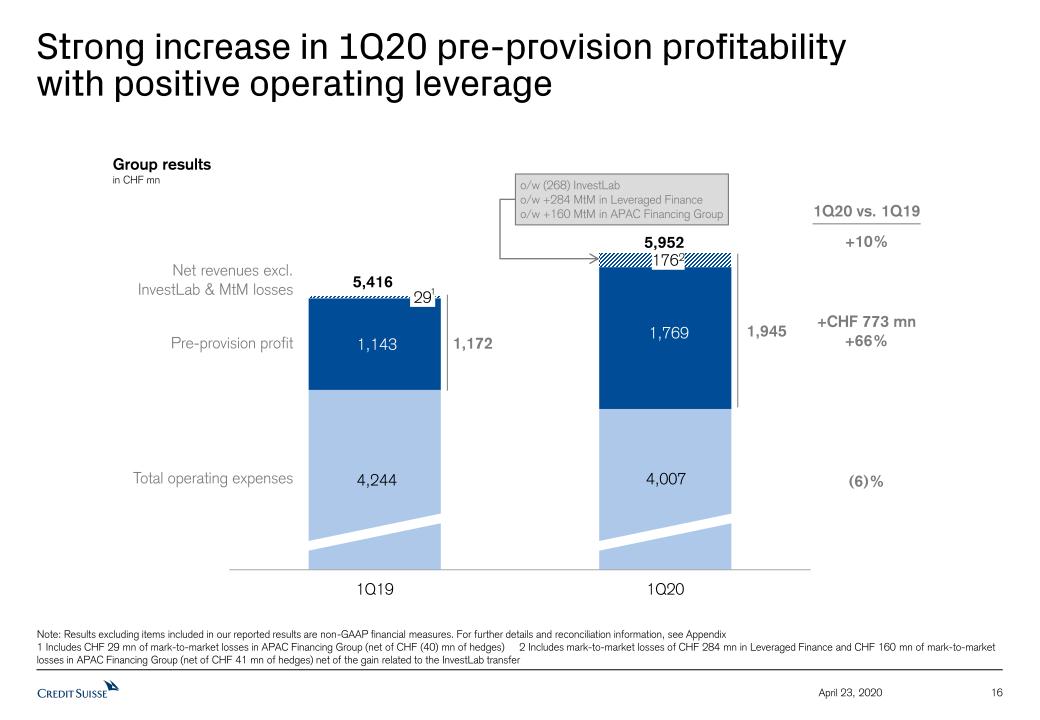
16 April 23, 2020 Strong increase in 1Q20 pre-provision profitability with positive operating leverage 1762 5,416 5,952 Total operating expenses Net revenues excl.InvestLab & MtM losses (6)% +CHF 773 mn+66% 1Q20 vs. 1Q19 Pre-provision profit Group resultsin CHF mn 1,172 1,945 Note: Results excluding items included in our reported results are non-GAAP financial measures. For further details and reconciliation information, see Appendix1 Includes CHF 29 mn of mark-to-market losses in APAC Financing Group (net of CHF (40) mn of hedges) 2 Includes mark-to-market losses of CHF 284 mn in Leveraged Finance and CHF 160 mn of mark-to-market losses in APAC Financing Group (net of CHF 41 mn of hedges) net of the gain related to the InvestLab transfer +10% o/w (268) InvestLabo/w +284 MtM in Leveraged Financeo/w +160 MtM in APAC Financing Group 29 1
Detailed Financials 17 April 23, 2020
Results Overview 18 April 23, 2020 Credit Suisse Group in CHF mn unless otherwise specified 1Q20 4Q19 1Q19 Δ 4Q19 Δ 1Q19 Net revenues 5,776 6,190 5,387 (7)% 7% o/w Wealth Management-related1 3,588 4,027 3,361 (11)% 7% o/w IBCM in USD mn 189 437 357 (57)% (47)% o/w Markets activities2 in USD mn 2,154 1,634 1,769 32% 22% Provision for credit losses 568 146 81 Total operating expenses 4,007 4,830 4,244 (17)% (6)% Pre-tax income 1,201 1,214 1,062 (1)% 13% Income tax expense (110) 361 313 Effective tax rate (9)% 30% 29% Net income attributable to shareholders 1,314 852 749 54% 75% Return on tangible equity‡ 13% 9% 8% Diluted earnings per share in CHF 0.52 0.33 0.29 58% 79% Excluding InvestLab transfer, SIX revaluation and major litigation provisions in CHF mn Net revenues 5,508 5,692 5,387 (3)% 2% o/w Private Banking3 2,360 2,266 2,159 4% 9% Pre-tax income 951 1,042 1,068 (9) (11)% Note: 1Q20 reported results include a gain related to the completed transfer of the InvestLab fund platform to Allfunds Group. 4Q19 reported results include a gain related to the revaluation of our equity investment in the SIX Group AG. Results excluding items included in our reported results are non-GAAP financial measures. For further details and reconciliation information, see Appendix ‡ RoTE is a non-GAAP financial measure, see Appendix; RoTE figures are rounded up or down to the nearest whole number 1 Includes SUB, IWM and APAC WM&C 2 Includes Global Markets and APAC Markets 3 Includes SUB PC, IWM PB and APAC PB within WM&C
19 April 23, 2020 CET1 ratio of 12.1% Risk-weighted assets in CHF bn Key messagesCET1 ratio of 12.1%, which already included as of 4Q19 a capital deduction for the two components of the planned 2019 dividend to be paid in 2Q20 and to be proposed in Autumn 2020Mitigating actions taken by FINMA due to COVID-19 pandemic:CHF 12 bn of RWA inflation from Basel III reforms (primarily SA-CCR) to be phased-in equally throughout the year, of which CHF 3 bn is phased in in the first quarterIntroduction of temporary exemption from backtesting results in the model approach to market risk3Risk weighted assetsNet business RWA increase driven by corporate lending drawdowns and increased market volatility in the second half of the quarter, with risk of rating migration Strengthening of Swiss franc across currencies led to a CHF 3 bn reduction in RWA with a negligible impact on CET1 ratioCapital distributionShare buyback on hold until at least 3Q20 to allow time to reassess market, financial and economic conditions around COVID-19Expect CET1 ratio of ~11.5% for the balance of 2020 due to the phase-in of Basel III reforms and market volatility driven RWA increases partially offset by management action 290 301 12.1% CET1 ratio SUB, IWM, APAC +4IBCM +2GM +13Corp. Ctr. (9) 12.7% 1 1 Includes internal model & parameter updates 2 Includes methodology & policy changes and external model & parameter updates 3 Exemption initially applies until July 1, 2020 10 3 2
20 April 23, 2020 Tier 1 leverage ratio of 5.8% excludingcash held at central banks Leverage exposure in CHF bn Key messagesTemporary exclusion of cash held at central banks from the calculation of the leverage ratio granted by FINMA2Tier 1 leverage ratio of 5.8%, excluding CHF 88 bn of cash held at central banks, net of planned dividends; ratio of 5.3% including cash held at central banksLeverage exposureLeverage exposure in Global Markets increased primarily due to drawdowns in corporate lending and higher market volatility, higher margin requirements, increased fails and reduced netting at quarter endCHF 15 bn increase in levels of cash held at central banks at end of 1Q20Unchanged CET1 leverage ratio guidance of ~4.0% including cash held at central banks by end-2020 910 870 5.8% Tier 1 leverage ratio 5.5% 1 1 Leverage exposure excludes cash held at central banks, adjusted for expected dividend payments in 2Q20 and 4Q20 as required by FINMA 2 Relief initially applies until July 1, 2020 15 (88) 4.2% CET1 leverage ratio 4.0% 43 1 IBCM +1SUB, IWM, APAC +4GM +40Corp. Ctr. (2)
21 April 23, 2020 Maintained focus on cost discipline Note: Adjusted results are non-GAAP financial measures. A reconciliation to reported results is included in the Appendix1 Adjustments include major litigation provisions, restructuring expenses and expenses related to real estate disposals Total operating expenses in CHF bn 4.8 4.5 4.2 4.0 Adjusted operatingexpenses Adjustments1 5.0
22 April 23, 2020 Increase in TBVPS‡ to CHF 18.25 driven bynet income generation and widening of credit spreads Tangible book value per share (TBVPS)‡in CHF Key messagesTBVPS‡ increased by CHF 0.54 from net income generationAdverse impact from strengthening of the Swiss franc across currenciesPositive impact of CHF 1.81 from widening credit spreads; TBVPS‡ of CHF 16.44 excluding this item, equivalent to a 4% increase ‡ Tangible book value per share (TBVPS) is a non-GAAP financial measure, see Appendix 1 Includes cumulative effect of accounting changes2 Reflects impact on tangible shareholders’ equity from own credit movements via other comprehensive income and tax expenses related to own credit movements 2 1 CHF 1.3 bngenerated -0.35
23 April 23, 2020 Allowance for credit losses1in CHF mn ° Reserve build is a non-GAAP financial measure, see Appendix1 Includes the allowance for credit losses on financial assets held at amortized cost and provisions for off-balance sheet credit exposures 2 Impact of CECL adoption on January 1, 2020 excluding impact from fair value election 3 Includes net write-offs of CHF (51) mn, FX translation impact and other adjustment items of CHF (13) mn and provision for interest of CHF 9 mn 4 Leveraged Finance mark-to-market losses in Global Markets and IBCM of USD 147 mn each, totaling USD 294 mn converted at USD/CHF exchange rate of 0.9650 5 Equivalent to USD 165 mn, net of hedges of CHF 41 mn 6 Includes CHF 72 mn impact of CECL adoption on January 1, 2020, and CHF 304 mn of additional credit provisioning related to CECL 4 Fair value marks of CHF 444 mn Reserve build reflects the challenging economic outlook for 2020 Total increase in allowance for credit losses1 and mark-to-market impacts in 1Q20in CHF mn 3 1,736 2 585 1,029 284 142 142 GM IBCM 5 o/w CHF 304 mn from CECL Related to CECL6 1 1 1 °
Swiss Universal BankStrong pre-provision profit growth driven by transactional revenues 24 April 23, 2020 Key financials in CHF mn 1Q20 4Q19 1Q19 Δ 1Q19 Net revenues 1,509 1,748 1,379 9% Provision for credit losses 124 43 29 Total operating expenses 796 819 800 (1)% Pre-tax income 589 886 550 7% Cost/income ratio 53% 47% 58% Return on regulatory capital† 18% 27% 17% Excl. InvestLab transfer & SIX revaluation: Net revenues 1,484 1,442 1,379 8% Pre-tax income 564 580 550 3% Cost/income ratio 54% 57% 58% PC Key metrics in CHF bn 1Q20 4Q19 1Q19 Δ 1Q19 Net margin1 in bps 59 64 53 6 Net new assets (4.2) (0.5) 3.3 Mandate penetration 34% 34% 33% Net loans 174 171 170 3% Risk-weighted assets 80 78 77 5% Leverage exposure 269 265 259 4% Note: All percentage changes and comparative descriptions refer to year on year measurements unless otherwise indicated. 1Q20 reported results include a gain related to the completed transfer of the InvestLab fund platform to Allfunds Group. 4Q19 reported results include the SIX equity investment revaluation gain. Results excluding items included in our reported results are non-GAAP financial measures. For further details and reconciliation information, see Appendix † RoRC is a non-GAAP financial measure, see Appendix 1 Excludes the gain related to the SIX revaluation in 4Q19 2 Excludes the gain related to the InvestLab transfer in 1Q20 Key messagesPTI of CHF 589 mn included a gain of CHF 25 mn related to the transfer of the InvestLab platform; 1Q19 included real estate gains of CHF 30 mnStrong results across all major revenue categories; increased client activity and higher ITS revenues benefiting from ongoing market volatilityHigher provision for credit losses include CHF 96 mn from the implementation of CECLOperating expenses stable with investments in growth initiatives offset by ongoing cost discipline; cost/income ratio of 54%2Private ClientsNet revenues up 8%, with increases across all major revenue categories; exceptionally high client activityNet asset outflows of CHF 4.2 bn driven by one single low margin outflow in the UHNW segmentCorporate & Institutional Clients (excl. InvestLab transfer)Net revenues up 8%, driven by strong ITS and investment banking revenues NNA of CHF 4.8 bn with continued momentum in our pension fund business
Swiss Universal BankLast 5 first quarters 25 April 23, 2020 Net revenues in CHF mn 1Q20 1Q19 1Q16 1Q17 1Q18 1,509 Pre-tax income in CHF mn 1Q20 1Q19 1Q16 1Q17 1Q18 589 InvestLab transfer Cost/income ratio(excl. InvestLab transfer) 1Q20 1Q19 1Q16 1Q17 1Q18 Return on regulatory capital† Assets under management in CHF bn 1Q20 1Q19 1Q16 1Q17 1Q18 SUB PC net margin in bps 1Q20 1Q19 1Q16 1Q17 1Q18 Note: For details on calculations see under ‘Notes’ in the Appendix. 1Q20 reported results include the gain related to the completed transfer of InvestLab. Results excluding items included in our reported results are non-GAAP financial measures. For further details and reconciliation information, see Appendix † RoRC is a non-GAAP financial measure, see Appendix 1Q20 1Q19 1Q16 1Q17 1Q18 18%
International Wealth ManagementPTI of CHF 537 mn; InvestLab gain offsetting unrealized losses in AM 26 April 23, 2020 Note: All percentage changes and comparative descriptions refer to year on year measurements unless otherwise indicated. 1Q20 reported results include a gain related to the completed transfer of the InvestLab fund platform to Allfunds Group and unrealized losses on seed money in our funds in Asset Management. 4Q19 reported results include the SIX equity investment revaluation gain. Results excluding items included in our reported results are non-GAAP financial measures. For further details and reconciliation information, see Appendix † RoRC is a non-GAAP financial measure, see Appendix 1 Excludes gains related to the InvestLab transfer and the SIX revaluation in 1Q20 and 4Q19, respectively Key metrics in CHF bn 1Q20 4Q19 1Q19 Δ 1Q19 Net margin1 in bps 40 33 45 (5) Net new assets 3.7 0.6 1.3 Number of RM 1,160 1,150 1,150 1% Net loans 50 54 53 (5)% Net new assets AM 0.1 7.5 (0.5) Risk-weighted assets 45 44 43 6% Leverage exposure 101 101 101 1% PB Key financials in CHF mn 1Q20 4Q19 1Q19 Δ 1Q19 Net revenues 1,502 1,640 1,417 6% Provision for credit losses 39 16 10 Total operating expenses 926 992 884 5% Pre-tax income 537 632 523 3% Cost/income ratio 62% 60% 62% Return on regulatory capital† 34% 40% 35% Excl. InvestLab transfer & SIX revaluation: Net revenues 1,284 1,448 1,417 (9)% Pre-tax income 319 440 523 (39)% Cost/income ratio 72% 69% 62% Key messagesHigher client activity, resilient asset-based revenues and net interest income, but unrealized losses on fund investments in AMPTI of CHF 537 mn included a CHF 218 mn gain related to the transfer of the InvestLab platformPB NNA totaled CHF 3.7 bn at a 4% annualized growth ratePrivate BankingPTI of CHF 375 mn was down 7% with a gain from the InvestLab transfer of CHF 15 mn in 1Q20 and a CHF 27 mn release of major litigation provisions in 1Q19Transaction revenues were up 9% with higher ITS revenues and client activity; structured product fees were down from a high level in 1Q19Net interest income and recurring commissions and fees remained stableAsset ManagementPTI of CHF 162 mn; excluding CHF 203 mn InvestLab gain and unrealized losses on seed money in our funds of CHF 101 mn, PTI of CHF 60 mnResilient management feesNNA of CHF 0.1 bn as institutional inflows were offset by outflows from retail clients
International Wealth ManagementLast 5 first quarters 27 April 23, 2020 Net revenues in CHF mn 1Q20 1Q19 1Q16 1Q17 1Q18 1,502 Pre-tax income in CHF mn 1Q20 1Q19 1Q16 1Q17 1Q18 537 InvestLab transfer 1Q20 1Q19 1Q16 1Q17 1Q18 Return on regulatory capital† 1Q20 1Q19 1Q16 1Q17 1Q18 Assets under management in CHF bn 1Q20 1Q19 1Q16 1Q17 1Q18 IWM PB net margin in bps 1Q20 1Q19 1Q16 1Q17 1Q18 42 34% Cost/income ratio(excl. InvestLab transfer) Note: For details on calculations see under ‘Notes’ in the Appendix. 1Q20 reported results include the gain related to the completed transfer of InvestLab. Results excluding items included in our reported results are non-GAAP financial measures. For further details and reconciliation information, see Appendix † RoRC is a non-GAAP financial measure, see Appendix
Asia PacificStrong client activity offsetting higher credit provisions & MtM losses 28 April 23, 2020 Note: All percentage changes and comparative descriptions refer to year on year measurements unless otherwise indicated. 1Q20 reported results include a gain related to the completed transfer of the InvestLab fund platform to Allfunds Group. Results excluding items included in our reported results are non-GAAP financial measures. For further details and reconciliation information, see Appendix † RoRC is a non-GAAP financial measure, see Appendix 1 APAC PB within WM&C 2 Excludes the gain related to the InvestLab transfer in 1Q20 3 Net of hedges of CHF 41 mn4 Dealogic for quarter ending March 31, 2020 (APAC excl. Japan and China onshore among International banks) 5 All references under Markets are based on USD PB1 Key metrics in CHF bn 1Q20 4Q19 1Q19 Δ 1Q19 Net margin2 in bps 44 26 25 19 Net new assets 3.0 0.7 3.8 Number of RM 620 600 600 3% Assets under management 197 220 215 (8)% Net loans 43 47 45 (4)% Risk-weighted assets 38 37 38 2% Leverage exposure 110 115 111 - Key financials in CHF mn 1Q20 4Q19 1Q19 Δ 1Q19 Net revenues 1,025 937 854 20% Provision for credit losses 97 11 17 Total operating expenses 676 691 654 3% Pre-tax income 252 235 183 38% Cost/income ratio 66% 74% 77% Return on regulatory capital† 18% 16% 13% Excl. InvestLab transfer: Net revenues 1,000 937 854 17% Pre-tax income 227 235 183 24% Cost/income ratio 68% 74% 77% Key messages1Q20 PTI of CHF 252 mn included a gain of CHF 25 mn related to the transfer of the InvestLab platform, Excluding that gain, 1Q20 PTI of CHF 227 mn, up 24%Strong Private Banking and Markets performance offset by increased provision for credit losses and unrealized mark-to-market financing lossesWealth Management & Connected (WM&C) (excl. InvestLab transfer)PTI of CHF 60 mn includes CHF 160 mn3 of unrealized mark-to-market losses on the fair valued lending portfolio in financing and CHF 96 mn of provision for credit lossesRecord PB quarterly revenues; transaction-based revenues increased 67%APAC IBCM continues to be ranked #14 Lower AuM driven by market performance and FX; NNA of CHF 3.0 bnMarkets5Strong revenues reflecting higher levels of transaction volumes and gains from hedging activities1Q20 revenues up 60%Equity sales and trading revenues increased 23%, mainly from increases in prime services, partially offset by lower revenues in equity derivativesFixed Income sales and trading revenues increased 139%, mainly from structured products, emerging markets rates and FX, partially offset by weaker performance in credit
Asia PacificLast 5 first quarters 29 April 23, 2020 Net revenues in CHF mn 1Q20 1Q19 1Q16 1Q17 1Q18 Pre-tax income in CHF mn 1Q20 1Q19 1Q16 1Q17 1Q18 252 Cost/income ratio(excl. InvestLab transfer) 1Q20 1Q19 1Q16 1Q17 1Q18 Return on regulatory capital† 1Q20 1Q19 1Q16 1Q18 Assets under management in CHF bn 1Q20 1Q19 1Q16 1Q17 1Q18 APAC PB1 net margin in bps 1Q20 1Q19 1Q16 1Q17 1Q18 Note: For details on calculations see under ‘Notes’ in the Appendix † RoRC is a non-GAAP financial measure, see Appendix 1 APAC PB within WM&C 2 1Q20 reported results include the gain related to the completed transfer of InvestLab of CHF 25 mn. Results excluding items included in our reported results are non-GAAP financial measures. For further details and reconciliation information, see Appendix 48 18% 1Q17 1,025 InvestLab transfer
Investment Banking & Capital Markets March COVID-19 impact reversing January and February momentum 30 April 23, 2020 Note: All percentage changes and comparative descriptions refer to year on year measurements unless otherwise indicated † RoRC is a non-GAAP financial measure, see Appendix 1 Reported net revenues include MtM losses of USD 147 mn in Leveraged Finance in 1Q20 and MtM losses on hedges on uncollateralized Corporate Derivatives exposure of USD 51 mn in 1Q20 and of USD 15 mn in 1Q19. Results excluding items included in our reported results are non-GAAP financial measures 2 Reflects 50% from the JV of GM and IBCM 3 GM and IBCM Leveraged Finance underwriting portfolio of USD 7.3 bn 4 Dealogic for the quarter ending March 31, 2020 (Americas and EMEA) 5 Excludes unrealized mark-to-market losses in Leveraged Finance and losses on hedges on Corporate Derivatives exposure 6 Joint Venture of GM and IBCM Key metrics in USD bn 1Q20 4Q19 1Q19 Δ 1Q19 Risk-weighted assets 26 24 25 6% Leverage exposure 45 44 42 7% Key financials in USD mn 1Q20 4Q19 1Q19 Δ 1Q19 Net revenues 189 437 357 (47)% Provision for credit losses 161 40 8 Total operating expenses 420 456 443 (5)% Pre-tax income/(loss) (392) (59) (94) n/m Cost/income ratio 222% 104% 124% Return on regulatory capital† n/m n/m n/m Key messagesNet revenues down 47%, or up 4%1 excluding unrealized mark-to-market losses of USD 147 mn2 in Leveraged Finance3 and net losses of USD 51 mn for hedges on uncollateralized Corporate Derivatives exposureGrowth in advisory revenues of 12% driven by M&A completionsEquity underwriting up 10% driven by higher ECM activity;#4 ranking in IPOs4Debt underwriting revenues excluding mark-to-market losses5 stableHigher provision for credit losses reflecting the economic impact of COVID-19 on the Corporate Bank6 and the implementation of CECLOperating expenses down 5% driven by lower compensation expenses in 1Q20 and the expenses on real estate disposals in 1Q19 RWA increased by 6% reflecting ~USD 11 bn of drawdowns in 1Q20 on corporate revolving credit facilities
Investment Banking & Capital Markets Last 5 first quarters 31 April 23, 2020 Net revenues in USD mn 1Q20 1Q19 1Q16 1Q17 1Q18 Pre-tax income in USD mn 1Q20 1Q19 1Q16 1Q17 1Q18 Cost/income ratio 1Q20 1Q19 1Q16 1Q17 1Q18 Return on regulatory capital† 1Q20 1Q19 1Q17 1Q18 Advisory and other fees in USD mn 1Q20 1Q19 1Q16 1Q17 1Q18 Underwriting revenues1 in USD mn 1Q20 1Q19 1Q16 1Q17 1Q18 † RoRC is a non-GAAP financial measure, see Appendix 1 Includes debt underwriting and equity underwriting 1Q16
Global MarketsStrong PTI growth and RoRC† of 10% amid severe market dislocations Note: All percentage changes and comparative descriptions refer to year on year measurements unless otherwise indicated † RoRC is a non-GAAP financial measure, see Appendix 1 Includes sales and trading and underwriting 2 Includes treasury funding costs, the impact of collaboration with other divisions, in particular with respect to ITS, and changes in the carrying value of certain investments 3 Reflects 50% from the JV of GM and IBCM 4 GM and IBCM Leveraged Finance underwriting portfolio of USD 7.3 bn 5 1Q20 vs. 4Q19; based on market volumes and Credit Suisse internal volumes and turnover 6 Joint Venture of GM and IBCM 32 April 23, 2020 Key messagesDelivered positive operating leverage with 14% increase in net revenues driving 71% cost/income ratio and 21% increase in PTI Robust ITS revenues reflecting higher volatility and continued momentum with wealth and institutional clientsStrong fixed income results, up 17%, with higher trading activity in macro and global credit products offsetting unrealized mark-to-market losses of USD 147 mn3 in Leveraged Finance4Higher equities revenues, up 22%, with strong increase in derivatives, continued share gains in cash5 and solid prime results Increased losses in ‘Other’ mainly driven by a loss on a single name counterparty Higher provision for credit losses reflecting the economic impact of COVID-19 on the Corporate Bank6 and the implementation of CECLRWA increased primarily due to drawdowns in corporate lending and higher market volatility in second half of the quarter; higher leverage exposure also driven by margin requirements, increased fails and reduced netting at quarter end Key metrics in USD bn 1Q20 4Q19 1Q19 Δ 1Q19 Risk-weighted assets 72 59 58 23% Leverage exposure 304 266 260 17% Key financials in USD mn 1Q20 4Q19 1Q19 Δ 1Q19 Equities1 694 427 571 22% Fixed Income1 1,177 961 1,006 17% Other2 (182) (57) (99) Net revenues 1,689 1,331 1,478 14% Provision for credit losses 156 32 11 Total operating expenses 1,191 1,253 1,184 1% Pre-tax income 342 46 283 21% Cost/income ratio 71% 94% 80% Return on regulatory capital† 10% 1% 9%
Global MarketsLast 5 first quarters 33 April 23, 2020 Net revenues in USD mn 1Q20 1Q19 1Q16 1Q17 1Q18 Pre-tax income in USD mn 1Q20 1Q19 1Q16 1Q17 1Q18 1Q20 1Q19 1Q16 1Q17 1Q18 Return on regulatory capital† 1Q20 1Q19 1Q17 1Q18 Fixed income sales and trading in USD mn 1Q20 1Q19 1Q16 1Q17 1Q18 Equity sales and trading in USD mn 1Q20 1Q19 1Q16 1Q17 1Q18 1Q16 † RoRC is a non-GAAP financial measure, see Appendix Cost/income ratio
Summary 34 April 23, 2020
35 April 23, 2020 Key capital and valuation metrics ‡ Return on tangible equity (RoTE) and Tangible book value per share (TBVPS) are non-GAAP financial measures, see Appendix1 RWA / leverage exposure 2 Leverage exposure excludes cash held at central banks, adjusted for planned dividend payments in 2Q20 and 4Q20 as required by FINMA Tangible book value per share (TBVPS)‡ and return on tangible equity (RoTE)‡ CET1 ratio 12.9% 12.8% 12.9% 12.6% 12.6% 12.5% 12.4% 12.7% 12.1% Tier 1 leverage ratio 5.1% 5.2% 5.1% 5.2% 5.2% 5.3% 5.5% 5.5% 5.8%2 Risk density1 29% 30% 31% 32% 32% 32% 33% 32% 35%2 ‡ ‡
36 April 23, 2020 Key messages and outlook Note: 1Q20 reported results include a gain related to the completed transfer of the InvestLab fund platform to Allfunds Group. Results excluding items included in our reported results are non-GAAP financial measures. For further details and reconciliation information, see Appendix ‡ Return on tangible equity (RoTE) and Tangible book value per share (TBVPS) are non-GAAP financial measures, see Appendix ° Reserve build is a non-GAAP financial measure, see Appendix 1 Includes SUB PC, IWM PB and APAC PB within WM&C 2 Average of 2017 – 2019; Group excluding Corporate Center and SRU; based on adjusted net revenues and also excluding the gains related to the InvestLab transfer and the SIX revaluation in 2019 3 Group excluding Corporate Center and SRU; based on adjusted pre-tax income and also excluding the gains related to the InvestLab transfer and the SIX revaluation in 2019 Solid pre-tax income despite reserve build°, including CECL provision and unrealized mark-to-market lossesGood revenue momentum across all 3 Private Banking businesses and in global sales & tradingContinued cost reduction and strong operating leverageAchieved an RoTE‡ of 13.1%Disciplined approach to capital distribution in the context of COVID-19TBVPS‡ up 4% to CHF 16.44 excluding impact from widening credit spreads Continued risk of potential further reserve build° relating to our Corporate Bank and other loans, particularly outside SwitzerlandPotential risk relating to our investments in Asset ManagementPotential limited recovery in advisory and underwriting fees, at least in the short term until the COVID-19 pandemic eases and the global economy begins to recover Achievements in 1Q20 Risks into 2Q20 High dependence on resilient Swiss economyMore stable Private Banking franchise1 contributes ~40% to Group revenues2 and ~50% to Group profits3Established an effective cost reduction program and expect adjusted operating expenses of around CHF 16 bn for the full year 2020Reduced risk exposure during 2015 to 2018 restructuring programReduced tax rate guidance to 20-25% for the full year 2020Robust capital and liquidity position Strengths into full year 2020
Appendix 37 April 23, 2020
38 April 23, 2020 Since 2015, we have significantly reduced our exposure to market-sensitive lending and underwriting activities Oil & Gas exposure1in USD bn Leveraged Finance exposure2in USD bn (16)% (37)% 1 Oil & Gas net lending exposure in Corporate Bank 2 Represents non-Investment Grade underwriting exposure 3 Non-Investment Grade 4 Investment Grade 11.7 7.3 7.7 2.9Non-IG3 4.8IG4
Swiss Universal BankPrivate Clients and Corporate & Institutional Clients 39 April 23, 2020 Corporate & Institutional Clients Key financials in CHF mn 1Q20 4Q19 1Q19 Δ 1Q19 Net interest income 297 300 307 (3)% Recurring commissions & fees 170 173 160 6% Transaction-based 230 146 187 23% Other revenues 14 144 (17) Net revenues 711 763 637 12% Provision for credit losses 112 32 18 Total operating expenses 321 340 342 (6)% Pre-tax income 278 391 277 0% Cost/income ratio 45% 45% 54% Excl. InvestLab transfer & SIX revaluation: Net revenues 686 606 637 8% Pre-tax income 253 234 277 (9)% Cost/income ratio 47% 56% 54% Key metrics in CHF bn 1Q20 4Q19 1Q19 Δ 1Q19 Net margin1 in bps 59 64 53 6 Net new assets (4.2) (0.5) 3.3 Mandate penetration 34% 34% 33% Assets under management 195 218 211 (8)% Number of RM 1,320 1,280 1,280 3% Key metrics in CHF bn 1Q20 4Q19 1Q19 Δ 1Q19 Net new assets 4.8 2.5 27.6 Assets under management 405 436 396 2% Number of RM 490 510 520 (6)% Private Clients Key financials in CHF mn 1Q20 4Q19 1Q19 Δ 1Q19 Net interest income 441 440 412 7% Recurring commissions & fees 204 212 199 3% Transaction-based 155 81 101 53% Other revenues (2) 252 30 Net revenues 798 985 742 8% Provision for credit losses 12 11 11 Total operating expenses 475 479 458 4% Pre-tax income 311 495 273 14% Cost/income ratio 60% 49% 62% • Excl. SIX revaluation: Net revenues 798 836 742 8% Pre-tax income 311 346 273 14% Cost/income ratio 60% 57% 62% Note: 1Q20 reported results include the gain related to the completed transfer of InvestLab. 4Q19 reported results include the SIX equity investment revaluation gain. Results excluding items included in our reported results are non-GAAP financial measures. For further details and reconciliation information, see Appendix 1 Excludes the gain related to the SIX revaluation
International Wealth ManagementPrivate Banking and Asset Management 40 April 23, 2020 Private Banking Key financials in CHF mn 1Q20 4Q19 1Q19 Δ 1Q19 Net interest income 369 389 370 - Recurring commissions & fees 294 322 295 - Transaction- and perf.-based 387 254 354 9% Other revenues 11 229 - Net revenues 1,061 1,194 1,019 4% Provision for credit losses 39 16 10 Total operating expenses 647 683 607 7% Pre-tax income 375 495 402 (7)% Cost/income ratio 61% 57% 60% Excl. InvestLab transfer & SIX revaluation: Net revenues 1,046 1,002 1,019 3% Pre-tax income 360 303 402 (10)% Cost/income ratio 62% 68% 60% Key metrics in CHF bn 1Q20 4Q19 1Q19 Δ 1Q19 Net margin1 in bps 40 33 45 (5) Net new assets 3.7 0.6 1.3 Assets under management 328 370 356 (8)% Mandate penetration 34% 34% 34% Net loans 50 54 53 (5)% Number of RM 1,160 1,150 1,150 1% Asset Management Key financials in CHF mn 1Q20 4Q19 1Q19 Δ 1Q19 Management fees 269 280 266 1% Performance & placement rev. (35) 90 30 Investment & partnership income 207 76 102 103% Net revenues 441 446 398 11% Provision for credit losses - - - Total operating expenses 279 309 277 1% Pre-tax income 162 137 121 34% Cost/income ratio 63% 69% 70% Excl. InvestLab transfer: Net revenues 238 446 398 (40)% Pre-tax income (41) 137 121 Cost/income ratio 117% 69% 70% Key metrics in CHF bn 1Q20 4Q19 1Q19 Δ 1Q19 Net new assets 0.1 7.5 (0.5) Assets under management 410 438 405 1% Note: 1Q20 reported results include the gain related to the completed transfer of InvestLab. 4Q19 reported results include the SIX equity investment revaluation gain. Results excluding items included in our reported results are non-GAAP financial measures. For further details and reconciliation information, see Appendix 1 Excludes gains related to the InvestLab transfer and the SIX revaluation
Asia PacificWealth Management & Connected and Markets 41 April 23, 2020 Note: 1Q20 reported results include the gain related to the completed transfer of InvestLab. Results excluding items included in our reported results are non-GAAP financial measures. For further details and reconciliation information, see Appendix † RoRC is a non-GAAP financial measure, see Appendix 1 APAC PB within WM&C Wealth Management & Connected Key financials in CHF mn 1Q20 4Q19 1Q19 Δ 1Q19 Private Banking 541 428 398 36% Adv., Underwr. and Financing 36 211 167 (78)% Net revenues 577 639 565 2% Provision for credit losses 96 14 17 Total operating expenses 396 404 378 5% Pre-tax income 85 221 170 (50)% Cost/income ratio 69% 63% 67% Return on regulatory capital† 9% 22% 18% Risk-weighted assets in CHF bn 26 27 28 (8)% Leverage exposure in CHF bn 62 64 63 (2)% Excl. InvestLab transfer: Net revenues 552 639 565 (2)% Pre-tax income 60 221 170 (65)% Cost/income ratio 72% 63% 67% Markets Key financials in USD mn 1Q20 4Q19 1Q19 Δ 1Q19 Equity sales & trading 245 225 199 23% Fixed income sales & trading 220 78 92 139% Net revenues 465 303 291 60% Provision for credit losses 1 (3) - Total operating expenses 291 292 278 5% Pre-tax income 173 14 13 Cost/income ratio 63% 96% 96% Return on regulatory capital† 27% 2% 2% Risk-weighted assets in USD bn 13 10 10 32% Leverage exposure in USD bn 50 53 48 6% Private Banking1 revenue details in CHF mn 1Q20 4Q19 1Q19 Δ 1Q19 Net interest income 173 178 146 18% Recurring commissions & fees 100 100 107 (7)% Transaction-based revenues 242 148 145 67% Other revenues 26 2 - Net revenues 541 428 398 36%
Wealth Management businessesNNA generation 1 APAC PB within WM&C 42 April 23, 2020 IWM PB NNA in CHF bn NNA growth (annualized) 4% SUB PC NNA in CHF bn NNA growth (annualized) (8)% 1Q20 1Q20 NNA growth (annualized) 5% APAC PB1 NNA in CHF bn 1Q20 1% 8% 3% 5% 1% 1% 4% 6% (1)% 7% (1)% 2% 4Q19 1Q19 2Q19 3Q19 4Q19 1Q19 2Q19 3Q19 4Q19 1Q19 2Q19 3Q19 (4.2)
Wealth Management businessesNet and gross margins 43 April 23, 2020 Note: For details on calculations see under ‘Notes’ at the end of this Appendix. 3Q19 and 1Q20 reported results include the gain related to the completed transfer of InvestLab. 4Q19 reported results include the SIX equity investment revaluation gain. Results excluding items included in our reported results are non-GAAP financial measures. For further details and reconciliation information, see Appendix 1 APAC PB within WM&C IWM PB Net margin in bps Gross margin in bps SUB PC Net margin in bps Gross margin in bps 358 211 375 311 1,061 798 APAC PB1 Net margin in bps Gross margin in bps Average AuM in CHF bn 258 Pre-tax income in CHF mn 541 Net revenues in CHF mn 1Q20 4Q19 2Q19 1Q19 3Q19 1Q20 4Q19 2Q19 1Q19 3Q19 1Q20 4Q19 2Q19 1Q19 3Q19 428 534 398 437 144 273 131 165 1,194 1,066 1,019 989 495 428 402 340 371 365 360 363 985 715 742 828 495 251 273 356 217 215 207 213 117 47 99 1Q20 4Q19 2Q19 1Q19 3Q19 1Q20 4Q19 2Q19 1Q19 3Q19 1Q20 4Q19 2Q19 1Q19 3Q19 53 129 91 182 InvestLab transfer / SIX revaluation 214 219 215 209 217 51 42 119 48 101
44 April 23, 2020 Corporate Center 1 ‘Other revenues’ primarily include required elimination adjustments associated with trading in own shares, treasury commissions charged to divisions, the cost of certain hedging transactions executed in connection with the Group's RWAs and valuation hedging impacts from long-dated legacy deferred compensation and retirement programs mainly relating to former employees 2 Excludes CHF 88 bn of central bank reserves, after adjusting for planned dividend payments in 2Q20 and 4Q20 ARU within Corp. Ctr. Key financials in CHF mn unless otherwise specified 1Q20 4Q19 1Q19 Net revenues (57) (43) (35) Provision for credit losses - 4 6 Total operating expenses 37 47 62 Pre-tax income / (loss) (94) (94) (103) Risk-weighted assets in USD bn 9 10 12 RWA excl. operational risk in USD bn 7 9 7 Leverage exposure in USD bn 27 26 29 Corporate Center Key metrics in CHF bn 1Q20 4Q19 1Q19 Total assets 133 122 120 Risk-weighted assets 42 51 50 Leverage exposure 522 129 130 Corporate Center Key financials in CHF mn 1Q20 4Q19 1Q19 Treasury results (49) 91 (118) Asset Resolution Unit (57) (43) (35) Other1 33 74 62 Net revenues (73) 122 (91) Provision for credit losses 3 6 6 Compensation and benefits (59) 167 130 G&A expenses 88 457 140 Commission expenses 24 19 16 Total other operating expenses 112 476 156 Total operating expenses 53 643 286 Pre-tax income / (loss) (129) (527) (383)
Currency mix & Group capital metrics 45 Credit Suisse Group results Applying a +/- 10% movement on the average FX rates for 1Q20 LTM, the sensitivities are:USD/CHF impact on FY 2019 pre-tax income by CHF +422 / (422) mnEUR/CHF impact on FY 2019 pre-tax income by CHF +186 / (186) mn Sensitivity analysis on Group results2 Currency mix capital metric3 A 10% strengthening / weakening of the USD (vs. CHF) would have a +2.5 bps / (2.8) bps impact on theBIS CET1 ratio Basel III Risk-weighted assets Swiss leverage exposure CHF EUR Other USD USD CET1 capital 4 CHF 1 Total expenses include provisions for credit losses 2 Sensitivity analysis based on weighted average exchange rates of USD/CHF of 0.99 and EUR/CHF of 1.09 for the 1Q20 LTM results 3 Data based on March 2020 month-end currency mix 4 Reflects actual capital positions in consolidated Group legal entities (net assets) including net asset hedges less applicable Basel III regulatory adjustments (e.g., goodwill) April 23, 2020 1Q20 LTMin CHF mn Contribution Swiss Universal Bank International Wealth Management Asia Pacific Global Markets Investment Banking & Capital Markets Group results CHF USD EUR GBP Other Net revenues 22,873 25% 48% 12% 3% 12%Total expenses1 18,014 30% 38% 4% 10% 18% Net revenues 6,150 78% 15% 4% 1% 2%Total expenses1 3,414 83% 11% 2% 2% 2% Net revenues 5,972 18% 55% 17% 2% 8%Total expenses1 3,820 45% 26% 9% 7% 13% Net revenues 3,761 -% 41% 5% 2% 52%Total expenses1 2,790 5% 17% -% 2% 76% Net revenues 5,910 5% 66% 19% 6% 4%Total expenses1 4,906 6% 59% 5% 21% 9% Net revenues 1,493 -% 91% 4% 2% 3%Total expenses1 1,940 1% 76% 5% 13% 5%
46 Reconciliation of adjustment items (1/2) Adjusted results are non-GAAP financial measures that exclude certain items included in our reported results. During the implementation of our strategy, it was important to measure the progress achieved by our underlying business performance. Management believes that adjusted results provide a useful presentation of our operating results for purposes of assessing our Group and divisional performance consistently over time, on a basis that excludes items that management does not consider representative of our underlying performance. Provided below is a reconciliation of our adjusted results to the most directly comparable US GAAP measures. April 23, 2020 Group in CHF mn 1Q20 1Q19 1Q18 1Q17 1Q16 Total operating expenses reported 4,007 4,244 4,534 4,811 4,972 Restructuring expenses - - (144) (137) (255) Major litigation provisions (18) (6) (85) (97) - Expenses related to real estate disposals 5 (35) - - - Debit valuation adjustments (DVA) 78 (19) 4 (26) 88 Total operating cost base adjusted 4,072 4,184 4,309 4,551 4,805 FX adjustment 113 - 60 (9) (53) Total operating cost base adjusted at constant 2019 FX 4,185 4,184 4,369 4,542 4,752 Group in CHF mn 1Q20 1Q19 1Q18 1Q17 1Q16 Net revenues reported 5,776 5,387 5,636 5,534 4,638 Real estate gains - (30) (1) - - (Gains)/losses on business sales - - (73) (15) 56 Net revenues adjusted 5,776 5,357 5,562 5,519 4,694 Provision for credit losses 568 81 48 53 150 Total operating expenses reported 4,007 4,244 4,534 4,811 4,972 Restructuring expenses - - (144) (137) (255) Major litigation provisions (18) (6) (85) (97) - Expenses related to real estate disposals 5 (35) - - - Total operating expenses adjusted 3,994 4,203 4,305 4,577 4,717 Pre-tax income/(loss) reported 1,201 1,062 1,054 670 (484) Total adjustments 13 11 155 219 311 Pre-tax income/(loss) adjusted 1,214 1,073 1,209 889 (173)
47 Reconciliation of adjustment items (2/2) Adjusted results are non-GAAP financial measures that exclude certain items included in our reported results. During the implementation of our strategy, it was important to measure the progress achieved by our underlying business performance. Management believes that adjusted results provide a useful presentation of our operating results for purposes of assessing our Group and divisional performance consistently over time, on a basis that excludes items that management does not consider representative of our underlying performance. Provided below is a reconciliation of our adjusted results to the most directly comparable US GAAP measures. April 23, 2020 Group excl. CC and SRU Group Corp. Ctr. and SRU in CHF mn 2019 2018 2017 2019 2018 2017 2019 2018 2017 Net revenues reported 22,915 21,528 21,701 22,484 20,920 20,900 (431) (608) (801) Real estate gains (275) (23) - (251) (28) - 24 (5) - (Gains)/losses on business sales - (92) 28 2 (71) 13 2 21 (15) Net revenues adjusted 22,640 21,413 21,729 22,235 20,821 20,913 (405) (592) (816) o/w related to InvestLab transfer 327 - - 327 - - - - - o/w related to SIX revaluation 498 - - 498 - - - - - Net revenues adjusted excl. InvestLab/SIX 21,815 21,413 21,729 21,410 20,821 20,913 (405) (592) (816) Provision for credit losses 316 244 178 324 245 210 8 1 32 Total operating expenses reported 16,068 16,292 16,859 17,440 17,303 18,897 1,372 1,011 2,038 Restructuring expenses - (603) (384) - (626) (455) - (23) (71) Major litigation provisions 27 (127) (97) (389) (244) (493) (416) (117) (396) Expenses related to real estate disposals (108) - - (108) - - - - - Expenses related to business sales - (47) (8) - (51) (8) - (4) - Total operating expenses adjusted 15,987 15,515 16,370 16,943 16,382 17,941 956 867 1,571 Pre-tax income/(loss) reported 6,531 4,992 4,664 4,720 3,372 1,793 (1,811) (1,620) (2,871) Total adjustments (194) 662 517 248 822 969 442 160 452 Pre-tax income/(loss) adjusted 6,337 5,654 5,181 4,968 4,194 2,762 (1,369) (1,460) (2,419) Pre-tax income/(loss) adjusted excl. InvestLab/SIX 5,512 5,654 5,181 4,143 4,194 2,762 (1,369) (1,460) (2,419) SUB 2019 2018 2017 6,020 5,564 5,396 (223) (21) - - (37) - 5,797 5,506 5,396 98 - - 306 - - 5,393 5,506 5,396 110 126 75 3,213 3,313 3,556 - (101) (59) (3) (37) (49) (12) - - - - - 3,198 3,175 3,448 2,697 2,125 1,765 (208) 80 108 2,489 2,205 1,873 2,085 2,205 1,873 Private Banking1 2019 2018 2017 9,335 8,491 8,107 (266) (23) - - (56) - 9,069 8,412 8,107 229 - - 341 - - 8,499 8,412 8,107 96 71 73 5,486 5,479 5,668 - (175) (104) 30 - (54) (25) - - - - - 5,491 5,304 5,510 3,753 2,941 2,366 (271) 96 158 3,482 3,037 2,524 2,912 3,037 2,524 1 Refers to SUB PC, IWM PB and APAC PB within WM&C
48 Reconciliation of significant items (1/3) Results excluding the significant items noted below are non-GAAP financial measures. Management believes that these provide a useful presentation of our operating results for purposes of assessing our Group and divisional performance, on a basis that excludes items that management does not consider representative of our underlying performance. Provided below is a reconciliation to the most directly comparable US GAAP measures. April 23, 2020 Group in CHF mn 1Q20 4Q19 1Q19 Net revenues reported 5,776 6,190 5,387 o/w related to InvestLab transfer 268 - - o/w related to SIX revaluation - 498 - Net revenues excl. InvestLab/SIX 5,508 5,692 5,387 Provision for credit losses 568 146 81 Total operating expenses reported 4,007 4,830 4,244 o/w major litigation provisions 18 326 6 Total operating expenses excl. major litigation provisions 3,989 4,504 4,238 Pre-tax income reported 1,201 1,214 1,062 Pre-tax income excl. InvestLab/SIX and major litigation provisions 951 1,042 1,068 Private Banking1 in CHF mn 1Q20 4Q19 1Q19 Net revenues reported 2,400 2,607 2,159 o/w related to InvestLab transfer 40 - - o/w related to SIX revaluation - 341 - Net revenues excl. InvestLab/SIX 2,360 2,266 2,159 1 Refers to SUB PC, IWM PB and APAC PB within WM&C Group in CHF mn 1Q20 1Q19 Net revenues reported 5,776 5,387 o/w related to InvestLab transfer 268 - o/w MTM losses (444) (29) Net revenues excl. InvestLab and MtM losses 5,952 5,416 Provision for credit losses 568 81 Total operating expenses reported 4,007 4,244 Pre-tax income reported 1,201 1,062 Pre-tax income before PCL and MtM losses excl. InvestLab 1,945 1,172 Group in CHF mn 1Q20 1Q19 Pre-tax income reported 1,201 1,062 o/w related to InvestLab transfer 268 - o/w Real estate gains - 30 Pre-tax income excl. InvestLab and real estate gains 933 1,032
49 Reconciliation of significant items (2/3) Results excluding the significant items noted below are non-GAAP financial measures. Management believes that these provide a useful presentation of our operating results for purposes of assessing our Group and divisional performance, on a basis that excludes items that management does not consider representative of our underlying performance. Provided below is a reconciliation to the most directly comparable US GAAP measures. April 23, 2020 SUB PC SUB C&IC SUB in CHF mn 1Q20 4Q19 1Q19 1Q20 4Q19 1Q19 1Q20 4Q19 1Q19 Net revenues reported 798 985 742 711 763 637 1,509 1,748 1,379 o/w related to InvestLab transfer - - - 25 - - 25 - - o/w related to SIX revaluation - 149 - - 157 - - 306 - Net revenues excl. InvestLab/SIX 798 836 742 686 606 637 1,484 1,442 1,379 Provision for credit losses 12 11 11 112 32 18 124 43 29 Total operating expenses reported 475 479 458 321 340 342 796 819 800 Pre-tax income reported 311 495 273 278 391 277 589 886 550 Pre-tax income excl. InvestLab/SIX 311 346 273 253 234 277 564 580 550 Average AuM in CHF bn 210.7 216.8 207.2 Net margin reported in bps 59 91 53 Net margin excl. InvestLab/SIX in bps 59 64 53 IWM PB IWM AM IWM in CHF mn 1Q20 4Q19 1Q19 1Q20 4Q19 1Q19 1Q20 4Q19 1Q19 Net revenues reported 1,061 1,194 1,019 441 446 398 1,502 1,640 1,417 o/w related to InvestLab transfer 15 - - 203 - - 218 - - o/w related to SIX revaluation - 192 - - - - - 192 - Net revenues excl. InvestLab/SIX 1,046 1,002 1,019 238 446 398 1,284 1,448 1,417 Provision for credit losses 39 16 10 - - - 39 16 10 Total operating expenses reported 647 683 607 279 309 277 926 992 884 Pre-tax income reported 375 495 402 162 137 121 537 632 523 Pre-tax income excl. InvestLab/SIX 360 303 402 (41) 137 121 319 440 523 Average AuM in CHF bn 358.1 370.6 360.0 Net margin reported in bps 42 53 45 Net margin excl. InvestLab/SIX in bps 40 33 45
50 1 APAC PB within WM&C Reconciliation of significant items (3/3) Results excluding the significant items noted below are non-GAAP financial measures. Management believes that these provide a useful presentation of our operating results for purposes of assessing our Group and divisional performance, on a basis that excludes items that management does not consider representative of our underlying performance. Provided below is a reconciliation to the most directly comparable US GAAP measures. April 23, 2020 APAC PB1 APAC WM&C APAC Markets in CHF mn 1Q20 4Q19 1Q19 1Q20 4Q19 1Q19 1Q20 4Q19 1Q19 Net revenues reported 541 428 398 577 639 565 448 298 289 o/w related to InvestLab transfer 25 - - 25 - - - - - o/w related to SIX revaluation - - - - - - - - - Net revenues excl. InvestLab/SIX 516 428 398 552 639 565 448 298 289 Provision for credit losses 2 2 - 96 14 17 1 (3) - Total operating expenses reported 281 282 267 396 404 378 280 287 276 Pre-tax income reported 258 144 131 85 221 170 167 14 13 Pre-tax income excl. InvestLab/SIX 233 144 131 60 221 170 167 14 13 Average AuM in CHF bn 213.8 219.3 209.3 Net margin reported in bps 48 26 25 Net margin excl. InvestLab/SIX in bps 44 26 25 APAC in CHF mn 1Q20 4Q19 1Q19 Net revenues reported 1,025 937 854 o/w related to InvestLab transfer 25 - - o/w related to SIX revaluation - - - Net revenues excl. InvestLab/SIX 1,000 937 854 Provision for credit losses 97 11 17 Total operating expenses reported 676 691 654 Pre-tax income reported 252 235 183 Pre-tax income excl. InvestLab/SIX 227 235 183
Notes (1/2) 51 General notesThroughout the presentation rounding differences may occurUnless otherwise noted, all CET1 capital, CET1 ratio, Tier 1 leverage ratio, risk-weighted assets and leverage exposure figures shown in this presentation are as of the end of the respective period and, for periods prior to 2019, on a “look-through” basisGross and net margins are shown in basis pointsGross margin = net revenues annualized / average AuM; net margin = pre-tax income annualized / average AuM. Net margin excluding certain significant items, as disclosed herein, is calculated excluding those items applying the same methodologyMandate penetration reflects advisory and discretionary mandate volumes as a percentage of AuM, excluding those from the external asset manager businessSpecific notes† Regulatory capital is calculated as the worst of 10% of RWA and 3.5% of leverage exposure. Return on regulatory capital (a non-GAAP financial measure) is calculated using income / (loss) after tax and assumes a tax rate of 30% and capital allocated based on the worst of 10% of average RWA and 3.5% of average leverage exposure. For the Markets business within the APAC division and for the Global Markets and Investment Banking & Capital Markets divisions, return on regulatory capital is based on US dollar denominated numbers. Return on regulatory capital excluding certain significant items, as disclosed herein, is calculated excluding those items applying the same methodology.‡ Return on tangible equity is based on tangible shareholders’ equity, a non-GAAP financial measure, which is calculated by deducting goodwill and other intangible assets from total shareholders’ equity as presented in our balance sheet. Tangible book value, a non-GAAP financial measure, is equal to tangible shareholders’ equity. Tangible book value per share is a non-GAAP financial measure, which is calculated by dividing tangible shareholders' equity by total number of shares outstanding. Management believes that tangible shareholders’ equity/tangible book value, return on tangible equity and tangible book value per share are meaningful as they are measures used and relied upon by industry analysts and investors to assess valuations and capital adequacy. For end-1Q18, tangible shareholders’ equity excluded goodwill of CHF 4,667 mn and other intangible assets of CHF 212 mn from total shareholders’ equity of CHF 42,540 mn as presented in our balance sheet. For end-2Q18, tangible shareholders’ equity excluded goodwill of CHF 4,797 mn and other intangible assets of CHF 212 mn from total shareholders’ equity of CHF 43,470 mn as presented in our balance sheet. For end-3Q18, tangible shareholders’ equity excluded goodwill of CHF 4,736 mn and other intangible assets of CHF 214 mn from total shareholders’ equity ofCHF 42,734 mn as presented in our balance sheet. For end-4Q18, tangible shareholders’ equity excluded goodwill of CHF 4,766 mn and other intangible assets of CHF 219 mn from total shareholders’ equity of CHF 43,922 mn as presented in our balance sheet. For end-1Q19, tangible shareholders’ equity excluded goodwill of CHF 4,807 mn and other intangible assets of CHF 224 mn from total shareholders’ equity of CHF 43,825 mn as presented in our balance sheet. For end-2Q19, tangible shareholders’ equity excluded goodwill of CHF 4,731 mn and other intangible assets of CHF 216 mn from total shareholders’ equity of CHF 43,673 mn as presented in our balance sheet. For end-3Q19, tangible shareholders’ equity excluded goodwill of CHF 4,760 mn and other intangible assets of CHF 219 mn from total shareholders’ equity of CHF 45,150 mn as presented in our balance sheet. For end-4Q19, tangible shareholders’ equity excluded goodwill ofCHF 4,663 mn and other intangible assets of CHF 291 mn from total shareholders’ equity of CHF 43,644 mn as presented in our balance sheet. For end-1Q20, tangible shareholders’ equity excluded goodwill of CHF 4,604 mn and other intangible assets of CHF 279 mn from total shareholders’ equity of CHF 48,675 mn as presented in our balance sheet. Shares outstanding were 2,539.6 mn at end-1Q18, 2,550.0 mn at end-2Q18, 2,552.4 mn at end-3Q18, 2,550.6 mn at end-4Q18, 2,507.8 mn at end-1Q19, 2,507.8 mn at end-2Q19,2,473.8 mn at end-3Q19, 2,436.2 mn at end-4Q19 and 2,399.0 mn at end-1Q20.° Reserve build is a non-GAAP financial measure, calculated by adding certain fair value mark-to-market losses (or gains) for the period to the increase in allowance for credit losses on financial assets held at amortized cost and provisions for off-balance sheet credit exposures recognized in that period. Management believes that reserve build is a useful measure that enables investors and others to assess the increase or decrease in reserves in the period across our accrual loan book, as well as our fair value loan book and underwriting book in potentially less liquid asset classes. In 1Q20, reserve build of CHF 1,029 mn included CHF 585 mn of increase in allowance for credit losses and provisions for off-balance sheet credit exposures and a combined total of CHF 444 mn of fair value mark-to-market losses, comprising CHF 284 mn of leveraged finance mark-to-market losses in Global Markets and IBCM and CHF 160 mn of APAC Financing Group mark-to-market losses. April 23, 2020
Notes (2/2) 52 AbbreviationsAdv. = Advisory; AM = Asset Management; APAC = Asia Pacific; ARU = Asset Resolution Unit; attr. = attributable; AuM = Assets under Management; Avg. = Average; BCBS = Basel Committee on Banking Supervision; BEAT = Base Erosion and Anti-avoidance Tax; BIS = Bank for International Settlements; bps = basis points; CECL = Current Expected Credit Losses; CET1 = Common Equity Tier 1; C&IC = Corporate & Institutional Clients; Corp. Ctr. = Corporate Center; COVID-19 = Coronavirus disease 2019; DCM = Debt Capital Markets; DVA = Debit Valuation Adjustments; ECM = Equity Capital Markets; EGM = Extraordinary General Meeting; EMEA = Europe, Middle East and Africa; excl. = excluding; FINMA = Swiss Financial Market Supervisory Authority; FI = Fixed Income; FX = Foreign Exchange; G&A = General and Administrative; GAAP = Generally Accepted Accounting Principles; GM = Global Markets; HR = Human Resources; IB = Investment Banking; IBCM = Investment Banking & Capital Markets; IG = Investment Grade; incl. = including; IPO = Initial Public Offering; ITS = International Trading Solutions; IWM = International Wealth Management; LTM = Last Twelve Months; M&A = Mergers & Acquisitions; MtM = Mark to Market; n/m = not meaningful; NNA = Net New Assets; NPL = Non Performing Loan; OTC = Over The Counter; PB = Private Banking; PC = Private Clients; PCL = Provision for Credit Losses; perf. = performance; PTI = Pre-tax income; rev. = revenues; RM = Relationship Manager; RoRC = Return on Regulatory Capital; RoTE = Return on Tangible Equity;RWA = Risk-weighted assets; SA-CCR = Standardized Approach for measuring Counterparty Credit Risk; SIX = Swiss Infrastructure and Exchange; SME = Small and Medium Enterprise; SNB = Swiss National Bank; SRU = Strategic Resolution Unit; SUB = Swiss Universal Bank; TBVPS = Tangible Book Value Per Share; U/HNW = (Ultra) High Net Worth;Underwr. = Underwriting; US = United States; vs. = versus; WFH = Work From Home; WM&C = Wealth Management & Connected; YoY = Year on year April 23, 2020
Signatures
Pursuant to the requirements of the Securities Exchange Act of 1934, the registrants have duly caused this report to be signed on their behalf by the undersigned, thereunto duly authorized.
CREDIT SUISSE GROUP AG and CREDIT SUISSE AG
(Registrants)
Date: April 23, 2020
By:
/s/ Thomas Gottstein
Thomas Gottstein
Chief Executive Officer
By:
/s/ David R. Mathers
David R. Mathers
Chief Financial Officer