UNITED STATES SECURITIES AND EXCHANGE COMMISSION
REPORT OF FOREIGN PRIVATE ISSUER PURSUANT TO RULE 13a-16 OR 15d-16 UNDER THE SECURITIES EXCHANGE ACT OF 1934
Commission File Number 001-15244
(Translation of registrant’s name into English)
Paradeplatz 8, 8001 Zurich, Switzerland (Address of principal executive office)
Commission File Number 001-33434
(Translation of registrant’s name into English)
Paradeplatz 8, 8001 Zurich, Switzerland (Address of principal executive office)
Indicate by check mark whether the registrant files or will file annual reports under cover of Form 20-F or Form 40-F.
Form 20-F  Form 40-F
Indicate by check mark if the registrant is submitting the Form 6-K in paper as permitted by Regulation S-T Rule 101(b)(1):
Note: Regulation S-T Rule 101(b)(1) only permits the submission in paper of a Form 6-K if submitted solely to provide an attached annual report to security holders.
Indicate by check mark if the registrant is submitting the Form 6-K in paper as permitted by Regulation S-T Rule 101(b)(7):
Note: Regulation S-T Rule 101(b)(7) only permits the submission in paper of a Form 6-K if submitted to furnish a report or other document that the registrant foreign private issuer must furnish and make public under the laws of the jurisdiction in which the registrant is incorporated, domiciled or legally organized (the registrant’s “home country”), or under the rules of the home country exchange on which the registrant’s securities are traded, as long as the report or other document is not a press release, is not required to be and has not been distributed to the registrant’s security holders, and, if discussing a material event, has already been the subject of a Form 6-K submission or other Commission filing on EDGAR.
This report includes the media release and the slides for the presentation to investors in connection with the 2Q20 results and strategic update.
Media Release Zurich, July 30, 2020 | |
Second quarter 2020 financial results
Highest first-half net income of CHF 2.5 billion in a decade1
| - | 2Q20 pre-tax income of CHF 1.6 billion, up 19% year on year; net income attributable to shareholders of CHF 1.2 billion, up 24% year on year; net revenues of CHF 6.2 billion, up 11% year on year |
| - | 2Q20 Return on Tangible Equity (RoTE) of 11.0% |
| - | 1H20 pre-tax income of CHF 2.8 billion, up 16% year on year; net income attributable to shareholders of CHF 2.5 billion, up 47% year on year; net revenues of CHF 12 billion, up 9% year on year |
| - | CET1 ratio of 12.5% in 2Q20, up from 12.1% at the end of 1Q20, and Tier 1 leverage ratio of 6.2%2 in 2Q20, up from 5.8% at the end of 1Q20 |
| - | Total Assets under Management (AuM) were CHF 1.4 trillion at the end of 2Q20 |
| - | Net New Assets (NNA) were CHF 9.8 billion for 2Q20, up compared to CHF 5.8 billion in 1Q20; NNA were CHF 15.6 billion for 1H20 |
Urs Rohner, Chairman of the Board of Directors of Credit Suisse Group AG, said: “Thanks to our proven strategy, solid capital position and an agile and well-executed crisis response, Credit Suisse has been able to effectively address the challenges of the COVID-19 pandemic from a position of strength and deliver a very good 1H20 result. In light of the strong 1H20 performance, the Board of Directors expects to distribute the second half of the full dividend amount of CHF 0.2776 gross per share as originally proposed to shareholders for the financial year 2019, subject to approval by shareholders at an Extraordinary General Meeting (EGM) to be held on November 27, 2020, and subject to market and economic conditions.” Thomas Gottstein, Chief Executive Officer of Credit Suisse Group AG, commented: “In a continued volatile market environment, we delivered a strong performance. Despite persistent challenges caused by COVID-19, our employees again showed outstanding commitment and dedication. With an RoTE of 11.0% for the second quarter and 12.0% for the first six months 2020, we delivered on our pre-COVID-19 ambition to achieve an RoTE of approximately 10% for 2020, confirming the resilience of our integrated business model as a leading wealth manager with strong global investment banking capabilities. Amid the turbulent market environment, we were also able to improve our CET1 ratio in the second quarter to 12.5%. Having achieved strong results in the first half of the year, we would like to take this opportunity to reaffirm our strategy and to announce several structural changes, which we will implement going forward. The changes should allow us to extract significant potential to improve effectiveness and efficiency, navigate the current environment with the necessary far-sightedness, and to unlock additional growth potential in the future to the benefit of our clients.” |
Media Release Zurich, July 30, 2020 | |
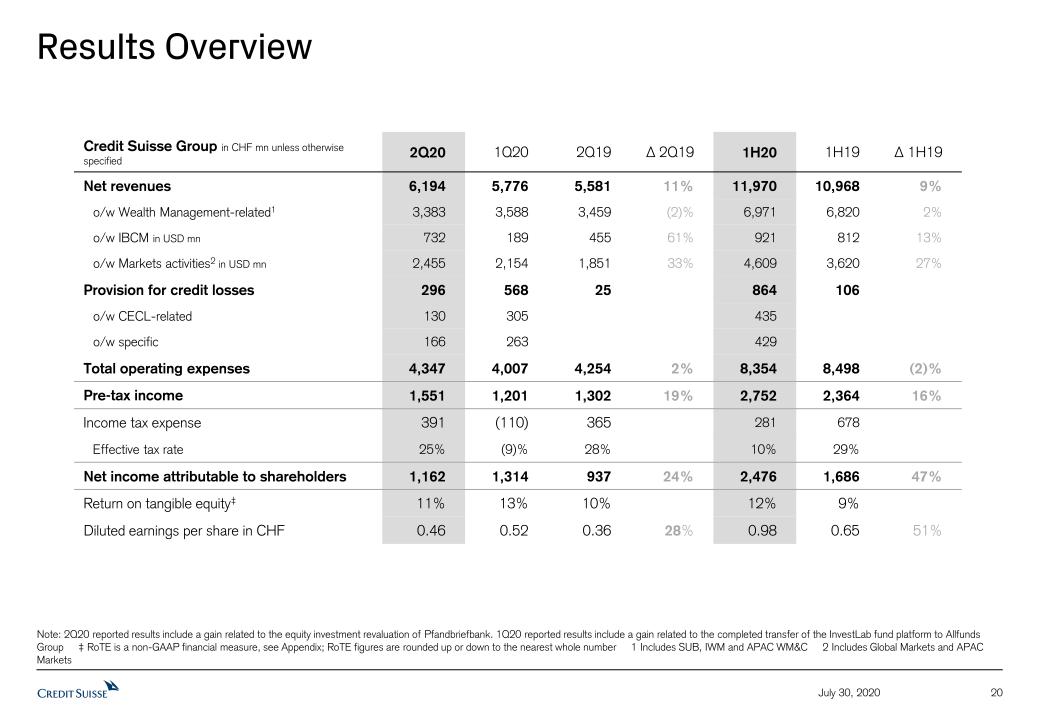
Credit Suisse Group (in CHF million) | 2Q20 | 1Q20 | 2Q19 | ∆2Q19 | | 1H20 | 1H19 | ∆1H19 |
| Net revenues | 6,194 | 5,776 | 5,581 | 11% | 11,970 | 10,968 | 9% |
| Provision for credit losses | 296 | 568 | 25 | - | 864 | 106 | - |
| Total operating expenses | 4,347 | 4,007 | 4,254 | 2% | 8,354 | 8,498 | (2)% |
| Pre-tax income | 1,551 | 1,201 | 1,302 | 19% | 2,752 | 2,364 | 16% |
| Net income attributable to shareholders | 1,162 | 1,314 | 937 | 24% | 2,476 | 1,686 | 47% |
| Return on tangible equity (%) | 11.0 | 13.1 | 9.7 | - | 12.0 | 8.7 | - |
| |
| CET1 capital | 37,346 | 36,332 | 36,394 | 3% | | 37,346 | 36,394 | 3% |
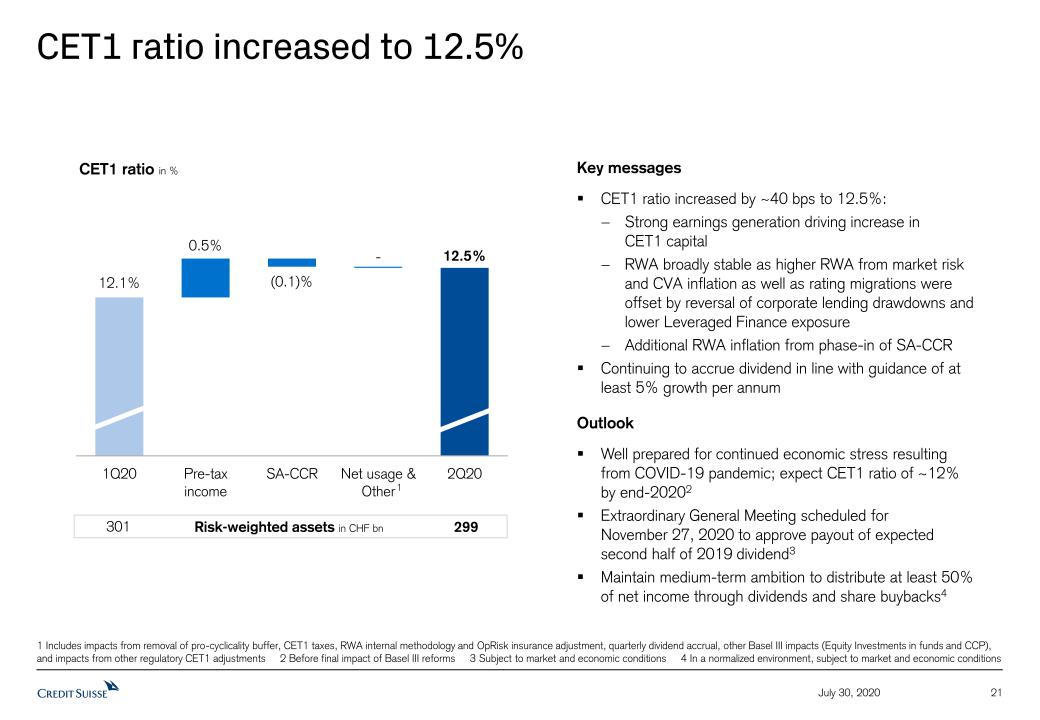
| CET1 ratio (%) | 12.5 | 12.1 | 12.5 | - | 12.5 | 12.5 | - |
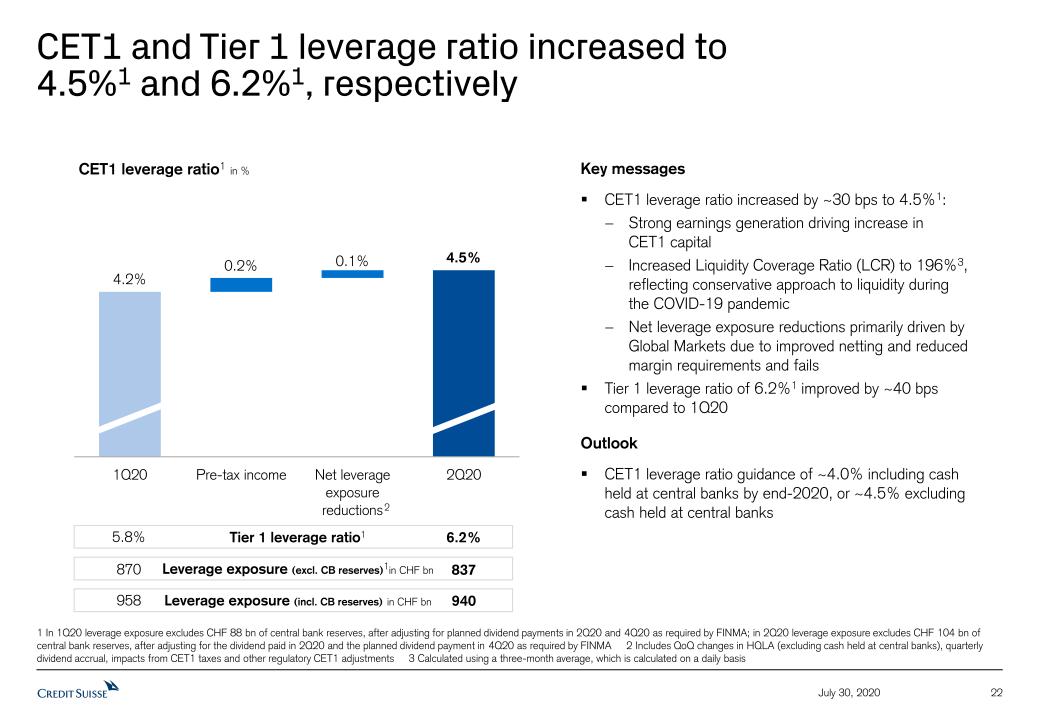
CET1 leverage ratio (%)3 | 4.5 | 4.2 | 4.1 | - | 4.5 | 4.1 | - |
Tier 1 leverage ratio (%)2 | 6.2 | 5.8 | 5.3 | - | 6.2 | 5.3 | - |
SUMMARY
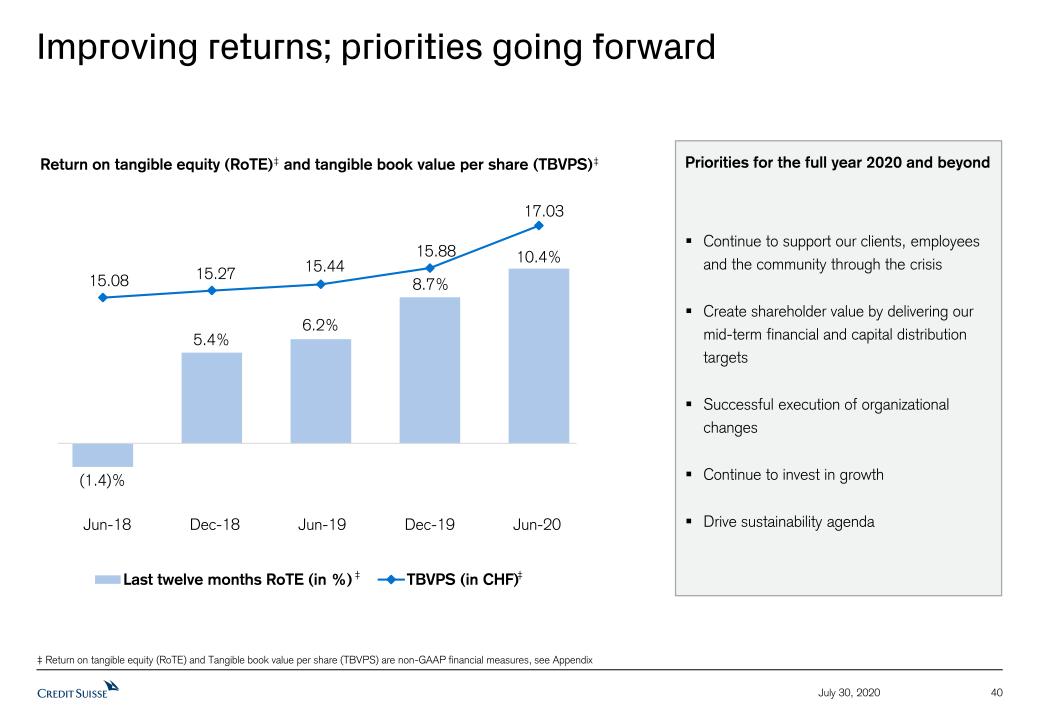
As in the previous quarter, 2Q20 results were heavily influenced by the COVID-19 pandemic. Despite the resulting challenges and continued geopolitical difficulties, profitability significantly increased compared to 2Q19. Pre-tax income of CHF 1.6 billion was up 19% year on year, while net income attributable to shareholders increased by 24% year on year to CHF 1.2 billion, the highest second quarter in a decade. In 1H20, pre-tax income was CHF 2.8 billion, up 16% year on year, and net income attributable to shareholders was CHF 2.5 billion, up 47%, again the highest first six months result in a decade. We delivered positive operating leverage for the 15th consecutive quarter, with higher net revenues of CHF 6.2 billion, up 11% year on year, more than offsetting slightly higher total operating expenses of CHF 4.3 billion, up 2% year on year. 1H20 net revenues were CHF 12.0 billion, up 9% year on year, and total operating expenses were CHF 8.4 billion, down 2%. Our RoTE for 2Q20 was 11.0%, for 1H20 it was 12.0% and over the last twelve months it was 10.4%, all in excess of our pre-COVID-19 ambition of approximately 10% for 2020.
Our Private Banking businesses4 delivered a solid performance in 2Q20, with slightly lower net revenues, down 3% year on year, mainly reflecting stable transaction-based revenues, as well as lower recurring revenues, down 11%, and slightly lower net interest income, down 3%. For 1H20, net revenues were up 4% year on year. On an FX-adjusted basis, net revenues would have been stable in 2Q205 and up 8% in 1H206, year on year.
Total Investment Banking7 net revenues in 2Q20 were up 38% year on year, on a US dollar basis, benefitting from a diversified portfolio, with IBCM net revenues up 61% and Markets activities8 net revenues up 33% year on year. For 1H20, total Investment Banking7 net revenues were up 25% year on year, on a US dollar basis.
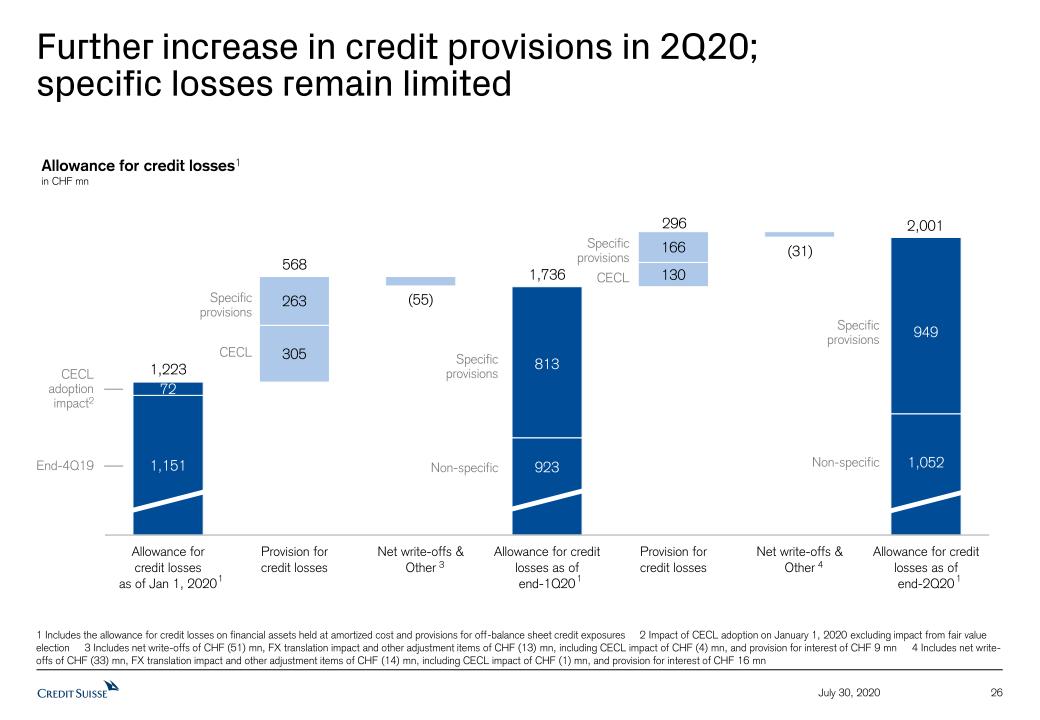
To reflect the challenging economic environment, we recorded CHF 296 million additional provision for credit losses in 2Q20, of which CHF 130 million were related to the recently implemented CECL methodology under US GAAP. In 1H20, we absorbed provision for credit losses of CHF 864 million, of which CHF 435 million were CECL-related. Our 1H20 provision for credit losses was 12 times higher than the average of the last ten years of first six months credit provisions, demonstrating both the degree
Media Release Zurich, July 30, 2020 | |
of challenges in the current environment but also the resilience of our integrated business model given the strong profitability.
We recorded NNA of CHF 9.8 billion across our businesses in 2Q20, with CHF 5.9 billion in IWM, CHF 4.5 billion in APAC and flat NNA in SUB. Our AuM were stable in 2Q20, compared to 1Q20, at CHF 1.4 trillion, with favorable market movements significantly offsetting negative foreign exchange-related effects. Total NNA for 1H20 were CHF 15.6 billion, with CHF 0.6 billion in SUB, CHF 9.7 billion in IWM and CHF 7.5 billion in APAC. Pure Private Banking4 NNA were CHF 4.7 billion in 2Q20 and CHF 7.2 billion for the first half 2020.
Our capital position at the end of 2Q20 remained strong, with a CET1 ratio of 12.5% compared to 12.1% at the end of 1Q20, as a result of our resilient and diversified business model as well as organic capital generation. Our Tier 1 leverage ratio was 6.2% at the end of 2Q20, up from 5.8% at the end of 1Q20, driven by higher Tier 1 capital and lower leverage exposure2.
Following our successful restructuring and repositioning years and the strong 2Q20 results, Credit Suisse reaffirms its strategy as a leading wealth manager with strong global investment banking capabilities. We intend to launch a series of structural improvements and investment initiatives, delivering additional financial benefits for our shareholders for the coming years. The strategic update was announced separately this morning.
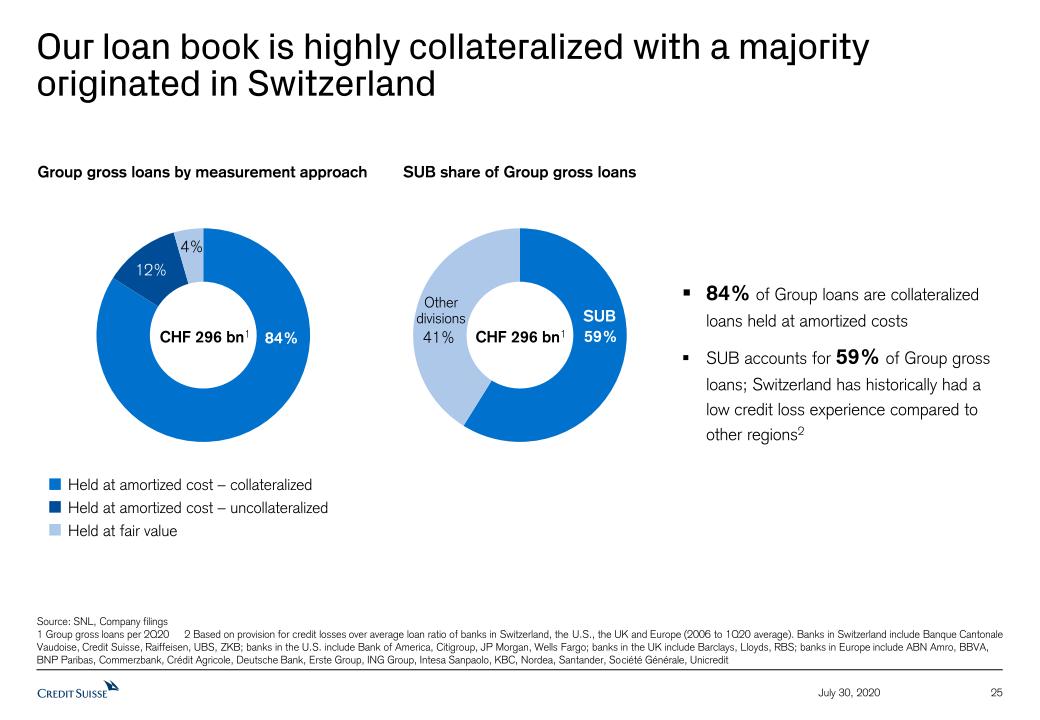
OUTLOOK Our strong 2Q20 and first half results have confirmed the strength and resilience of our integrated business model, delivering double-digit return on tangible equity. While the scale of the adverse economic impact of the COVID--19 crisis and path to recovery is still difficult to assess, the US GAAP CECL approach to provisioning should generally lead to earlier recognition of potential credit losses. Moreover, a substantial proportion of our overall loan book is collateralized and our profitable and resilient operations in our Swiss home market have historically experienced low credit losses. While US dollar interest rate headwinds are likely to persist, we expect a more stable net interest income performance from our Swiss Franc-denominated business. In recent months, capital markets have worked effectively to allow for refinancing of corporates around the world and we expect this trend to continue. Although elevated activity levels have subsided in our trading and transaction-based businesses, we expect volatility to persist and present opportunities to support our clients. We are accelerating the pace of change to make our organization even more effective in how we serve our clients and generate efficiencies for further growth investments and for our continued digitalization efforts across all of our divisions. We believe we are well prepared for further potential risks from COVID-19 as well as increased geopolitical uncertainties and can maintain a resilient financial performance and robust capital position through this challenging period. |
Media Release Zurich, July 30, 2020 | |
CAPITAL DISTRIBUTION
In light of the strong 1H20 performance, we expect to distribute the full dividend amount of CHF 0.2776 gross per share as originally proposed to shareholders for the financial year 2019. To this end, the Board of Directors intends to propose a second dividend distribution equal to the first distribution of CHF 0.1388 gross per share for approval by shareholders at an EGM to be held on November 27, 2020, subject to market and economic conditions and according to the Ordinance of the Swiss Federal Council regarding measures on combatting the coronavirus.
The Board of Directors intends to review our 2020 share buyback program subsequent to the EGM, subject to market and economic conditions. In 1Q20, prior to the suspension of the program, we bought back 28.5 million shares for a total of CHF 325 million under the current program.
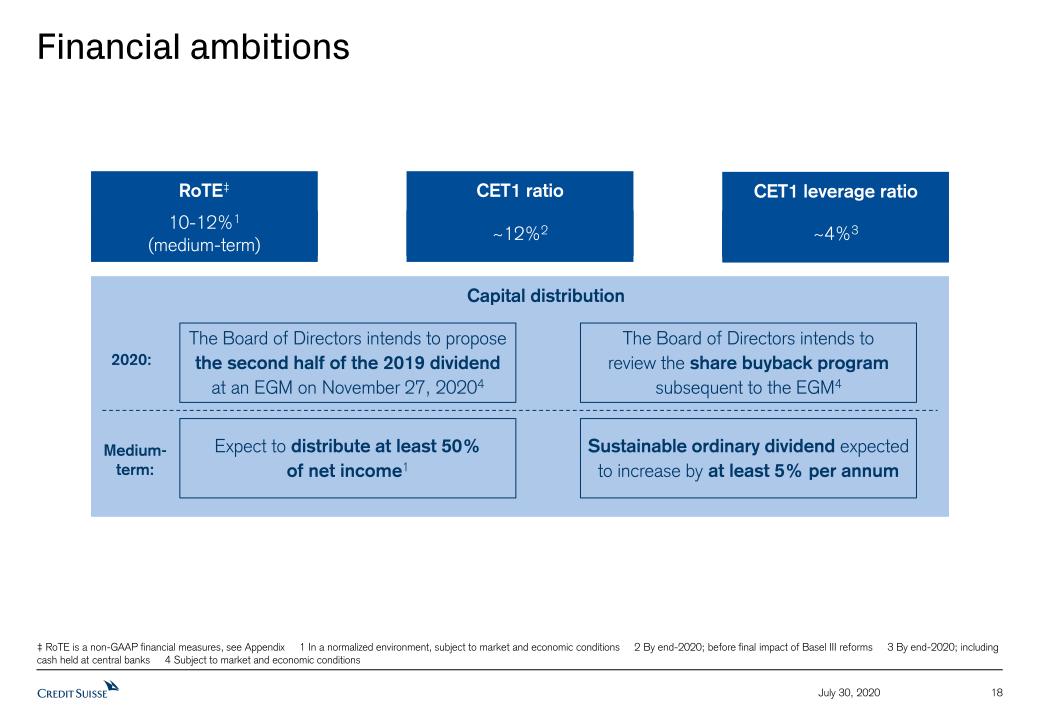
In the medium term, in a normalized environment, we expect to distribute at least 50% of our net income to our shareholders, subject to market and economic conditions. We continue to intend to sustainably increase our ordinary dividend by at least 5% per annum. To that end, we have been accruing for the 2020 dividend accordingly.
Media Release Zurich, July 30, 2020 | |
DETAILED DIVISIONAL SUMMARIES
Swiss Universal Bank (SUB)
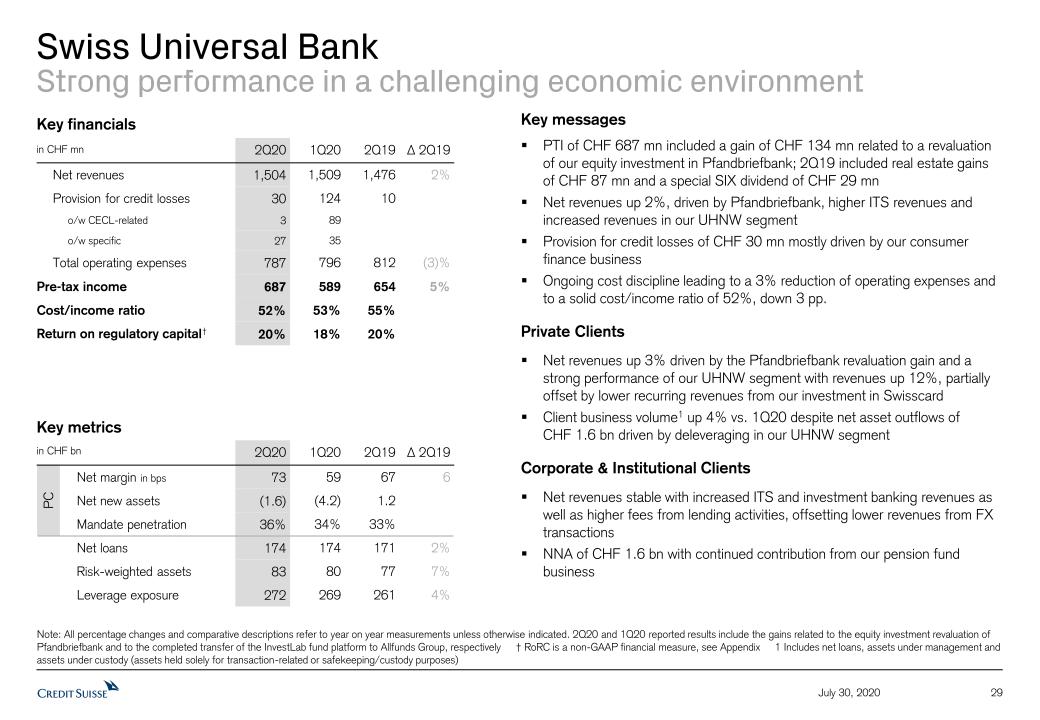
SUB (in CHF million) | 2Q20 | 1Q20 | 2Q19 | ∆2Q19 | | 1H20 | 1H19 | ∆1H19 |
| Net revenues | 1,504 | 1,509 | 1,476 | 2% | 3,013 | 2,855 | 6% |
| Provision for credit losses | 30 | 124 | 10 | - | 154 | 39 | - |
| Total operating expenses | 787 | 796 | 812 | (3)% | 1,583 | 1,612 | (2)% |
| Pre-tax income | 687 | 589 | 654 | 5% | 1,276 | 1,204 | 6% |
| Cost/income ratio (%) | 52 | 53 | 55 | - | 53 | 56 | - |
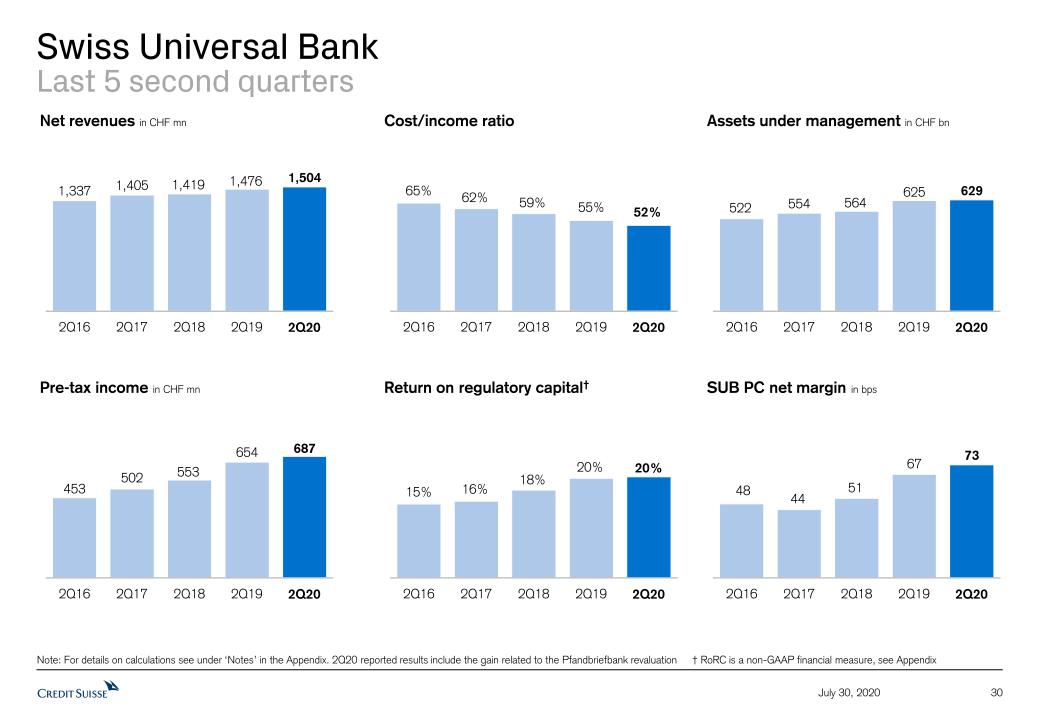
In a challenging economic environment, SUB recorded a strong pre-tax income of CHF 687 million in 2Q20, up 5% year on year. Net revenues increased by 2% year on year to CHF 1.5 billion, including a gain from the revaluation of our equity investment in Pfandbriefbank9; during 2Q19, revenues reflected real estate gains and a special SIX dividend10. Higher revenues from our collaboration with Global Markets (GM) and International Wealth Management (IWM) – International Trading Solutions (ITS), as well as increased revenues in our ultra-high-net-worth client segment further contributed to our revenues. Total operating expenses were down 3% year on year in 2Q20; our ongoing cost discipline helped fund continued investments in digitalization and selected hires. As a result, the cost/income ratio in 2Q20 was 52%. Provision for credit losses of CHF 30 million was mostly driven by Private Clients, primarily related to our consumer finance business.
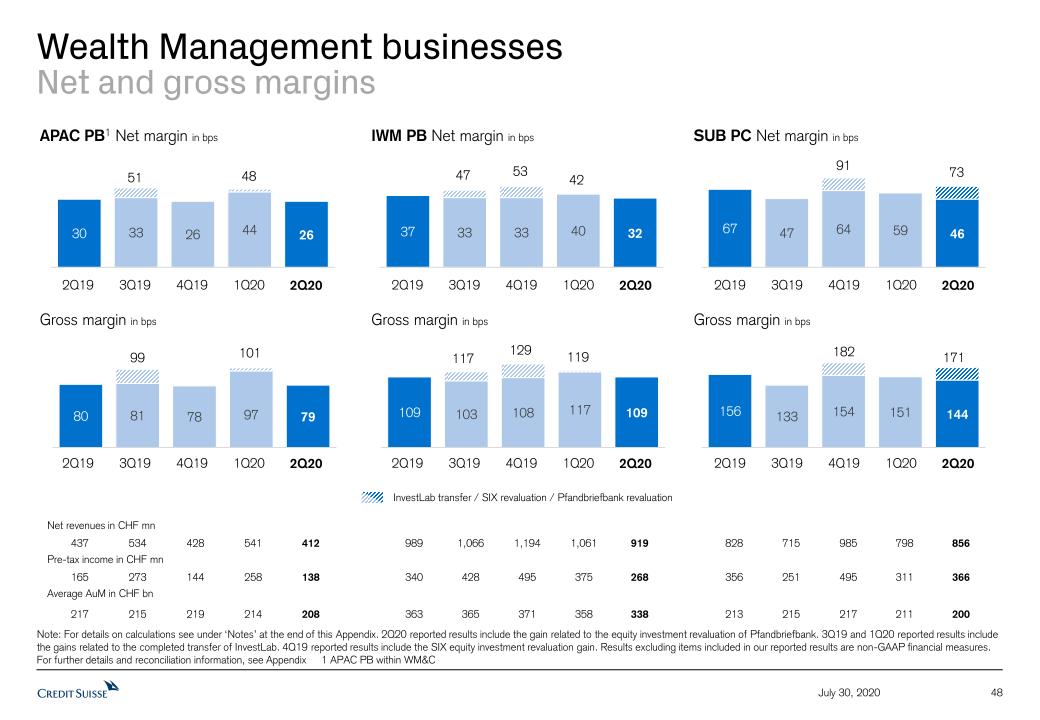
Private Clients generated pre-tax income of CHF 366 million in 2Q20, up 3% year on year. Net revenues of CHF 856 million increased by 3% year on year, driven by the Pfandbriefbank revaluation gain9 and increased revenues in our ultra-high-net-worth client segment. This was partially offset by lower recurring revenues, primarily relating to our investment in Swisscard; additionally, 2Q19 net revenues included real estate gains11. AuM increased by 4% to CHF 202 billion compared to 1Q20, mainly due to favorable market developments. Net asset outflows of CHF 1.6 billion were partially driven by deleveraging in our ultra-high-net-worth client segment.
Corporate & Institutional Clients reported pre-tax income of CHF 321 million, up 8% year on year. Net revenues were stable year on year, with higher revenues from ITS and our Swiss investment banking business as well as higher fees from lending activities, which helped to offset decreased revenues from our foreign exchange business. AuM of CHF 427 billion increased by 5% compared to 1Q20. NNA in 2Q20 were CHF 1.6 billion, reflecting positive momentum in our pension fund business.
Media Release Zurich, July 30, 2020 | |
International Wealth Management (IWM)
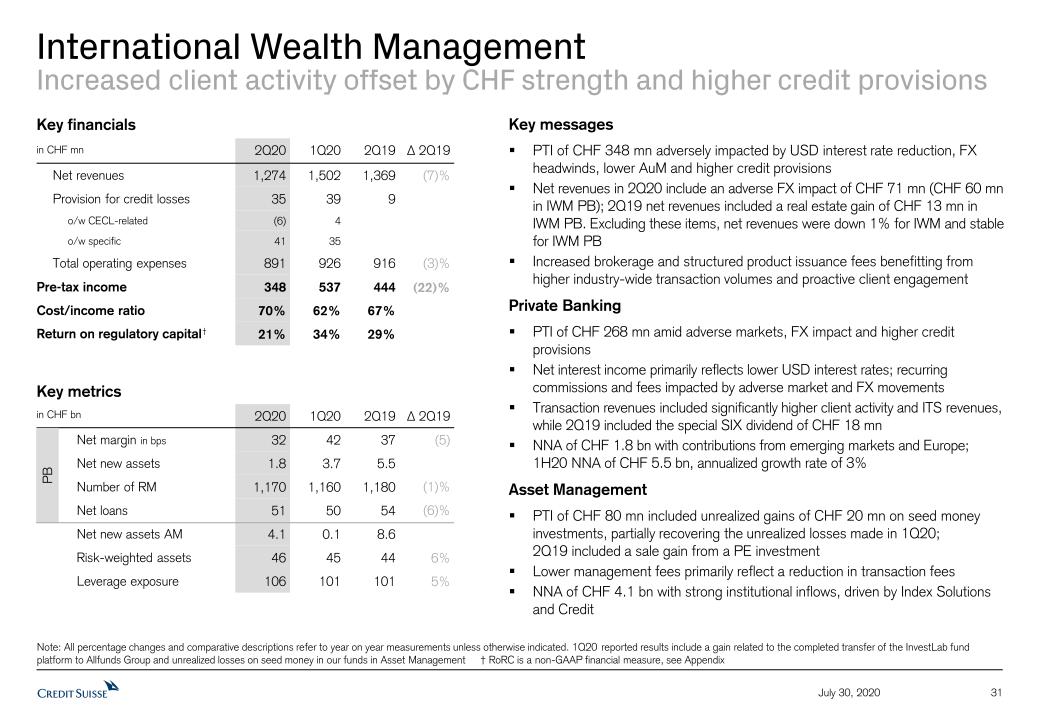
IWM (in CHF million) | 2Q20 | 1Q20 | 2Q19 | ∆2Q19 | | 1H20 | 1H19 | ∆1H19 |
| Net revenues | 1,274 | 1,502 | 1,369 | (7)% | 2,776 | 2,786 | - |
| Provision for credit losses | 35 | 39 | 9 | - | 74 | 19 | - |
| Total operating expenses | 891 | 926 | 916 | (3)% | 1,817 | 1,800 | 1% |
| Pre-tax income | 348 | 537 | 444 | (22)% | 885 | 967 | (8)% |
| Cost/income ratio (%) | 70 | 62 | 67 | - | 66 | 65 | - |
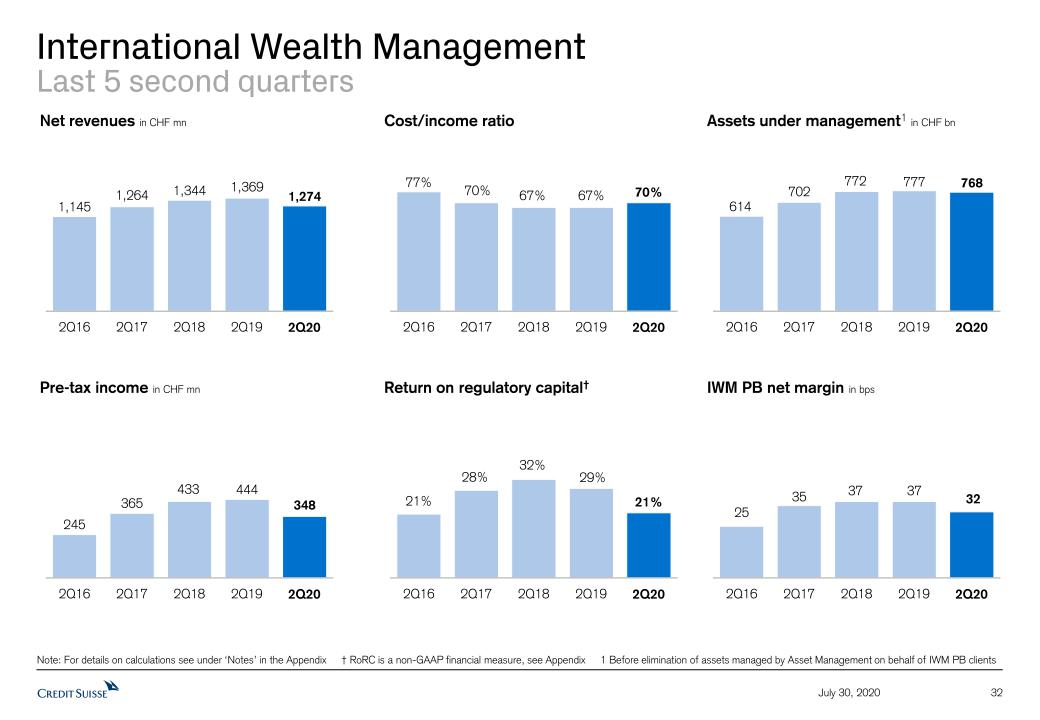
IWM’s results in 2Q20 continued to be supported by higher levels of client activity, which was offset by certain adverse market impacts and higher credit provisions. Pre-tax income in 2Q20 decreased 22% year on year to CHF 348 million, with net revenues down 7% and higher credit provisions, partially offset by lower operating expenses, down 3% year on year. IWM recorded a return on regulatory capital of 21% and solid NNA of CHF 5.9 billion for 2Q20.
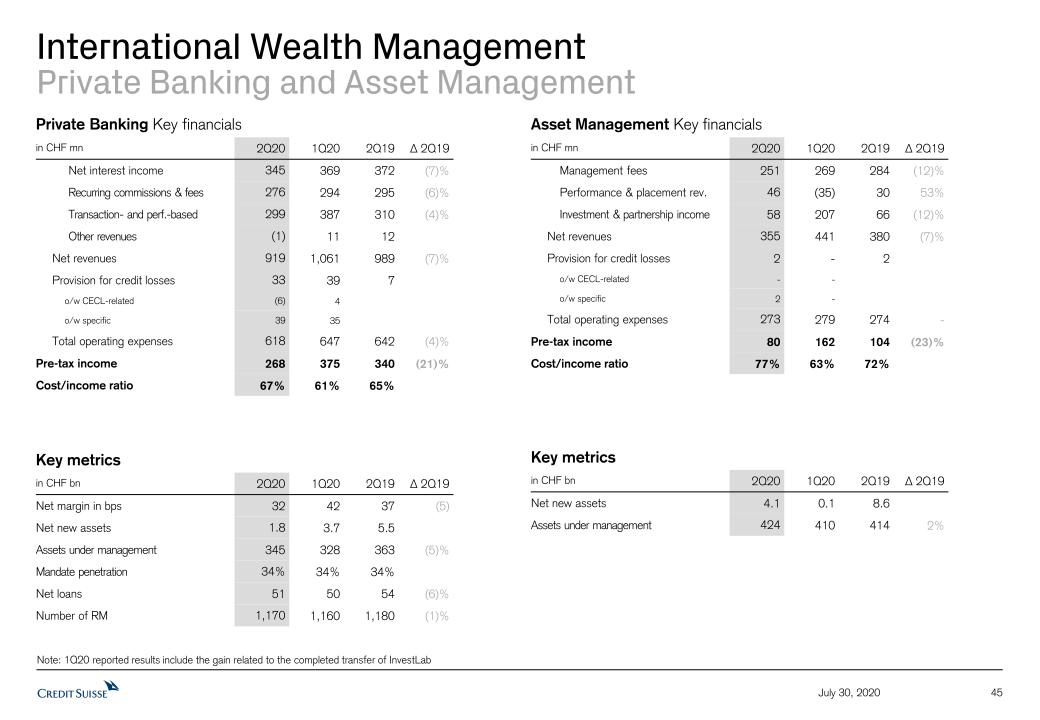
Private Banking recorded pre-tax income of CHF 268 million in 2Q20, down 21% year on year, affected by higher credit provisions and lower net revenues of CHF 919 million in 2Q20, down 7% year on year. Net revenues benefitted from higher client activity, which was more than offset by lower net interest income and recurring commissions and fees. Within transaction- and performance-based revenues, significantly higher brokerage and structured product issuance fees benefited from higher industry-wide transaction volumes and proactive client engagement. Net interest income in part reflected the impact of further reductions in US dollar interest rates. Recurring commissions and fees declined in line with AuM, which were negatively impacted by FX movements. NNA stood at CHF 1.8 billion with solid contributions from emerging markets and Europe, bringing the half year 2020 total to CHF 5.5 billion at an annualized growth rate of 3%.
Asset Management’s pre-tax income in 2Q20 decreased 23% year on year to CHF 80 million, with a 7% decline in net revenues and stable operating expenses. Lower revenues mainly reflect decreased management fees, primarily due to a reduction in real estate-related transaction fees. Performance and placement revenues and investment and partnership income in 2Q20 included unrealized gains of CHF 20 million on seed money investments, partially recovering unrealized losses in 1Q20. NNA of CHF 4.1 billion in 2Q20, reflecting strong institutional inflows, driven by Index Solutions and Credit.
Media Release Zurich, July 30, 2020 | |
Asia Pacific (APAC)
APAC (in CHF million) | 2Q20 | 1Q20 | 2Q19 | ∆2Q19 | | 1H20 | 1H19 | ∆1H19 |
| Net revenues | 1,064 | 1,025 | 913 | 17% | 2,089 | 1,767 | 18% |
| Provision for credit losses | 81 | 97 | (1) | - | 178 | 16 | - |
| Total operating expenses | 685 | 676 | 677 | 1% | 1,361 | 1,331 | 2% |
| Pre-tax income | 298 | 252 | 237 | 26% | 550 | 420 | 31% |
| Cost/income ratio (%) | 64 | 66 | 74 | – | 65 | 75 | - |
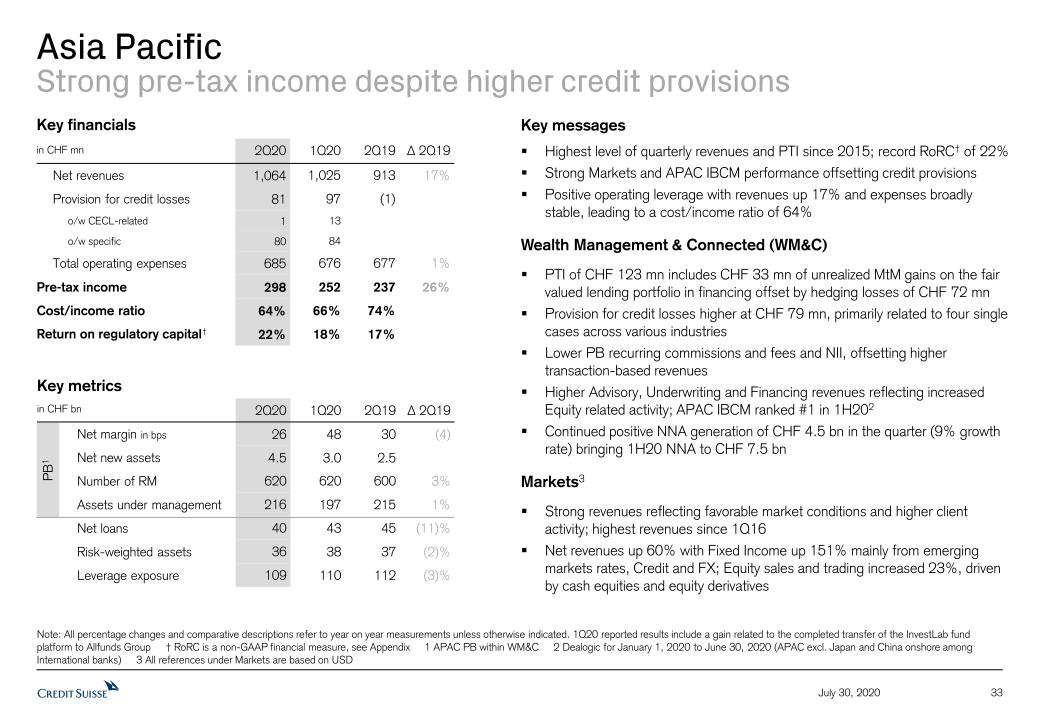
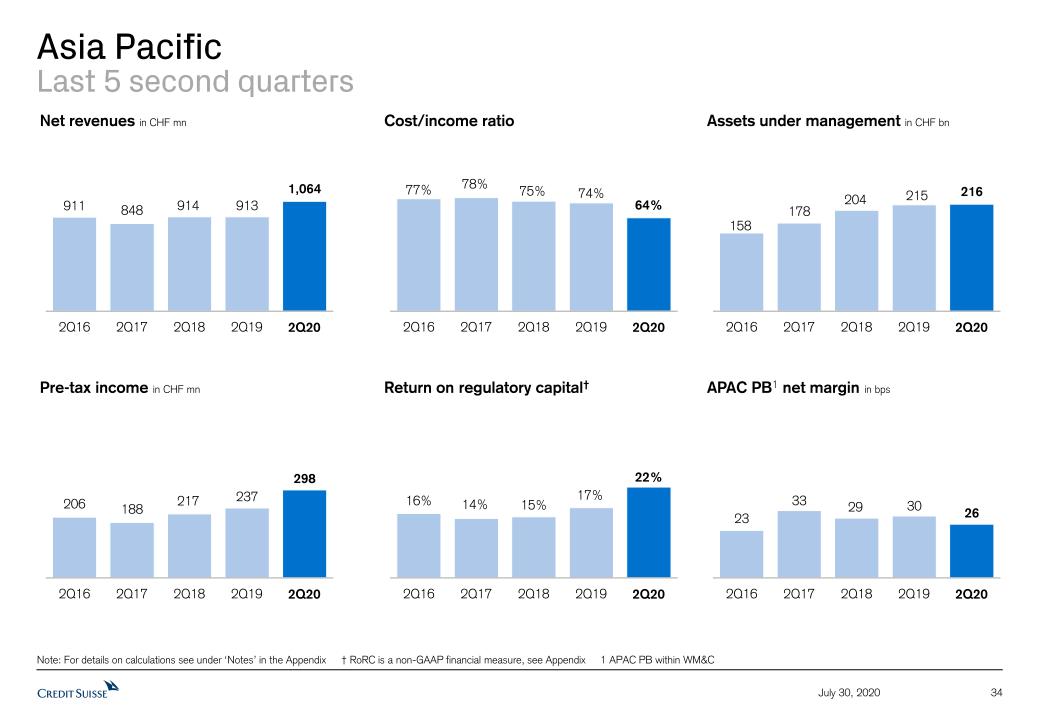
APAC delivered pre-tax income of CHF 298 million in 2Q20, a record since the formation of the division and up 26% year on year, with strong revenues of CHF 1.1 billion, up 17% year on year. These results were supported by higher performance in both our Markets business and our advisory, underwriting and financing business within Wealth Management & Connected (WM&C). Operating expenses for APAC in 2Q20 were stable year on year. APAC delivered a return on regulatory capital of 22% in 2Q20 and a cost/income ratio of 64%. In APAC, we recorded provision for credit losses of CHF 81 million.
WM&C reported pre-tax income of CHF 123 million in 2Q20, down 43% year on year and impacted by a provision for credit losses of CHF 79 million. Our Private Banking revenues were down 6% year on year, driven by lower recurring commissions and fees and lower net interest income. In 2Q20, we recorded AuM of CHF 216 billion and generated strong NNA of CHF 4.5 billion, supported by deposit inflows from Japan, Southeast Asia and Greater China. Advisory, underwriting and financing revenues for the quarter were up 9% year on year, reflecting higher equity-related activities. Unrealized mark-to-market gains on the fair valued lending portfolio in financing were offset by hedge losses. APAC advisory, underwriting and financing ranked as number 1 in terms of share of wallet in the first half of 202012, continuing our market leadership from 2019.
Markets delivered strong pre-tax income of USD 182 million in 2Q20, compared to pre-tax income of USD 21 million in 2Q19. Net revenues were up 60% year on year, supported by higher client activity across both equity and fixed income sales and trading. Equity sales and trading revenues were up 23% year on year, with a strong performance in equity derivatives and cash equities. Fixed income sales and trading revenues were up by 151% year on year, driven by emerging markets rates, credit and FX products.
Media Release Zurich, July 30, 2020 | |
Investment Banking & Capital Markets (IBCM)
IBCM (in USD million) | 2Q20 | 1Q20 | 2Q19 | ∆2Q19 | | 1H20 | 1H19 | ∆1H19 |
| Net revenues | 732 | 189 | 455 | 61% | 921 | 812 | 13% |
| Provision for credit losses | 69 | 161 | 0 | - | 230 | 8 | - |
| Total operating expenses | 451 | 420 | 447 | 1% | 871 | 890 | (2)% |
| Pre-tax income/loss | 212 | (392) | 8 | - | (180) | (86) | - |
| Cost/income ratio (%) | 62 | 222 | 98 | - | 95 | 110 | - |
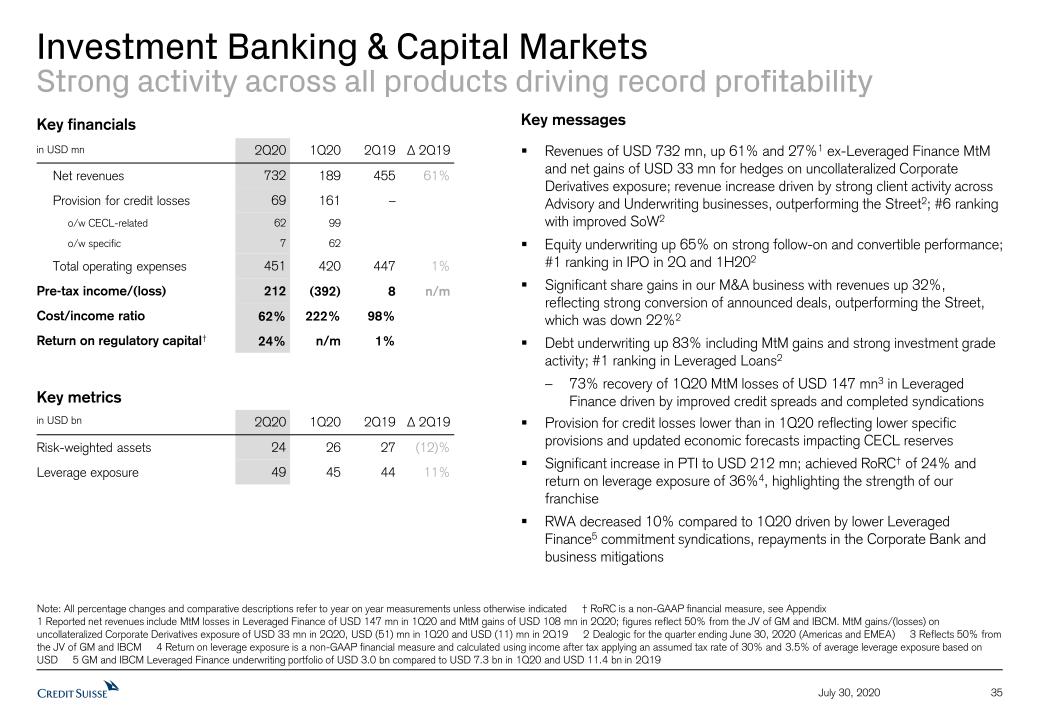
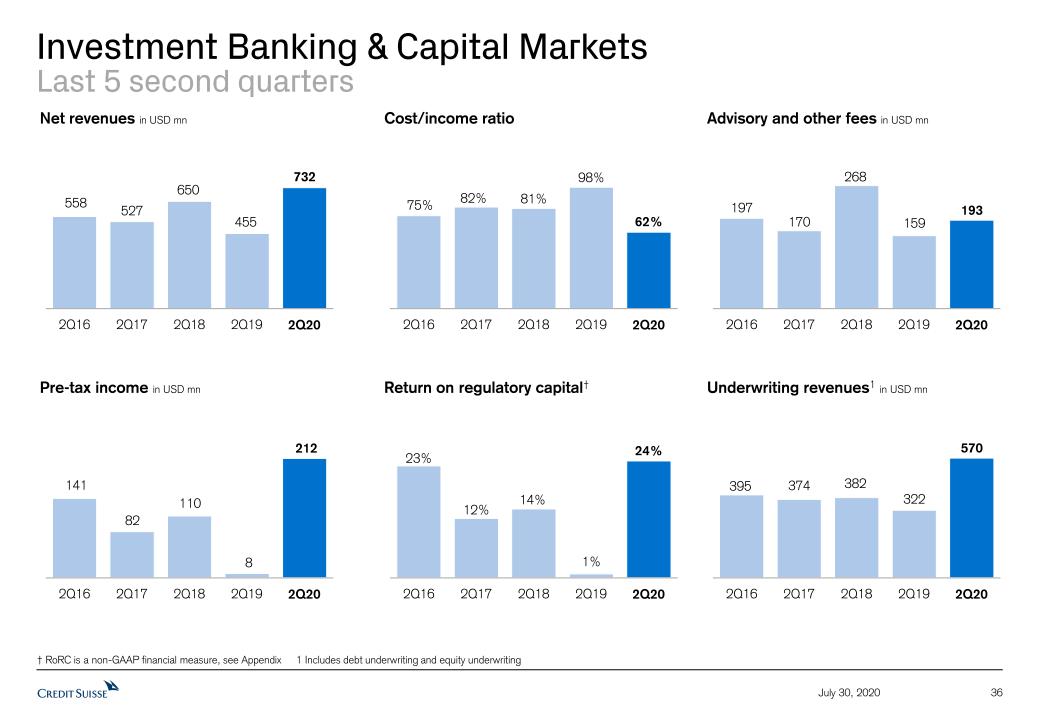
IBCM reported net revenues of USD 732 million for 2Q20, up 61% year on year, driven by strong client activity across debt and equity underwriting and advisory, despite the global market disruption that continued throughout the quarter. We reported pre-tax income of USD 212 million, compared to pre-tax income of USD 8 million in 2Q19. Total operating expenses were slightly up year on year at USD 451 million. We recorded provision for credit losses of USD 69 million in 2Q20, reflecting the impact of macroeconomic factors under the recently implemented CECL methodology.
Advisory revenues were up 21% year on year at USD 193 million, reflecting strong conversions of announced deals, including the closings of several large deals during the quarter. Advisory revenues were up significantly compared to the Street13, which was down 22% year on year.
Equity underwriting revenues were up 65% year on year at USD 183 million, driven by strong follow-on and convertible performance. Equity underwriting revenues were in line with the Street’s performance, which was up 63% year on year13. Credit Suisse ranked number 1 in global IPOs for both the second quarter and the first half of 2020, a position which we last held in 200114.
Debt underwriting revenues were up 83% year on year at USD 387 million, primarily driven by mark-to-market gains on leveraged finance underwriting commitments, strong revenues from investment grade debt issuance and net gains on hedges for our corporate derivatives portfolio. We reported a 73% recovery of our first quarter’s mark-to-market losses of USD 147 million in our leveraged finance underwriting portfolio, led by improved credit and large successful syndications.
In terms of strategic initiatives, IBCM recently formed an Environmental, Social and Governance (ESG) Advisory Group tasked with capturing future investment banking opportunities through the identification of new high-growth clients that are addressing global ESG challenges as well as advising existing clients on sustainable growth and finance opportunities.
Media Release Zurich, July 30, 2020 | |
Global Markets (GM)
GM (in USD million) | 2Q20 | 1Q20 | 2Q19 | ∆2Q19 | | 1H20 | 1H19 | ∆1H19 |
| Net revenues | 1,979 | 1,689 | 1,553 | 27% | 3,668 | 3,031 | 21% |
| Provision for credit losses | 80 | 156 | 2 | - | 236 | 13 | - |
| Total operating expenses | 1,284 | 1,191 | 1,192 | 8% | 2,475 | 2,376 | 4% |
| Pre-tax income/loss | 615 | 342 | 359 | 71% | 957 | 642 | 49% |
| Cost/income ratio (%) | 65 | 71 | 77 | - | 68 | 78 | - |
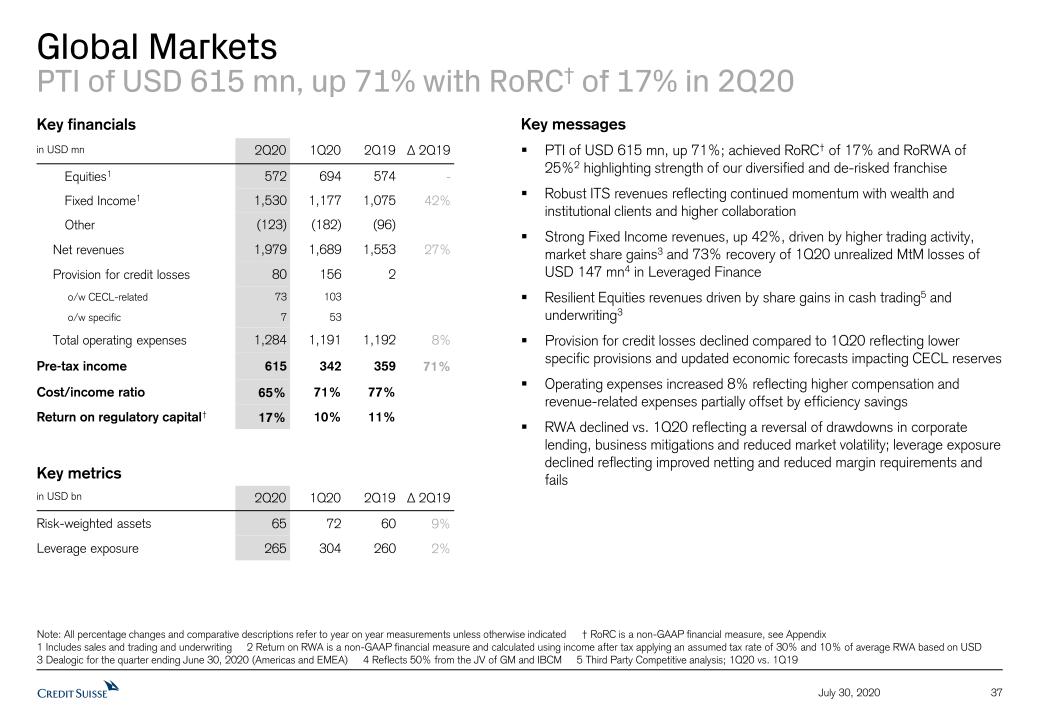
GM achieved pre-tax income of USD 615 million, up 71% year on year, with a return on regulatory capital of 17%, in 2Q20. Our diversified client franchise delivered the best second quarter revenue performance since 2015, highlighting the strength of our de-risked business model. Net revenues of USD 2 billion in 2Q20 increased 27% year on year, driven by strong fixed income sales and trading results and increased underwriting activity as well as constructive market conditions. Total operating expenses in 2Q20 increased 8% year on year reflecting increased compensation and benefits and higher revenue related expenses, partially offset by continued efficiency savings. Additionally, we recorded provision for credit losses of USD 80 million, primarily reflecting the impact of macroeconomic factors under the recently implemented CECL methodology.
Fixed income15 revenues of USD 1.5 billion in 2Q20 increased 42% year on year, driven by higher trading and financing activity and market share gains16 across credit, macro and emerging markets products. In addition, results benefitted from a 73% recovery of unrealized mark-to-market losses of USD 147 million in leveraged finance incurred in 1Q20.
Equities17 revenues of USD 572 million in 2Q20 were stable year on year, with increasing market share in cash equities trading18 and underwriting 19.
We continue to see strong momentum in our ITS business driven by increased collaboration with IWM and SUB to serve our wealth management, institutional and corporate clients.
Media Release Zurich, July 30, 2020 | |
ONGOING COMMITMENT TO SOCIETY AND SUSTAINABILITY
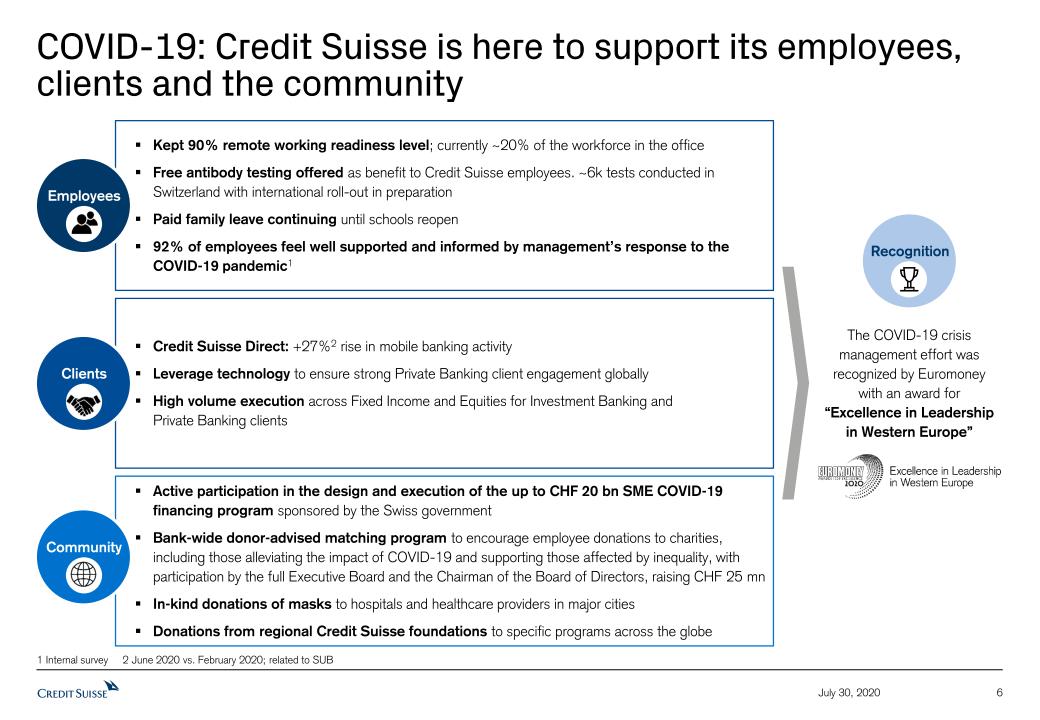
The safety of our employees, clients and communities remained the highest priority in 2Q20. During the pandemic, we have enabled 90% of our staff globally to work from home and we have offered free antibody testing to our employees. So far, more than 6,000 tests have been conducted in Switzerland, with a global roll-out now under preparation. We continued to offer paid family leave until schools reopened, and launched an initiative in July to explore new ways of working, with Switzerland being the first trial market of a broader study.
Credit Suisse continued to play a critical role in the bridging loan solution for Swiss companies that was introduced on March 25, 2020. Since the start of the Swiss SME support program and shortly before its official expiration, we granted around 16,500 COVID-19 bridging loans with a total volume of approximately CHF 3.2 billion as of today.
Credit Suisse’s global donation matching campaign, encouraging employee donations to charities, including those working to alleviate the impact of the COVID-19 pandemic and to support those affected by inequality, raised CHF 25 million, benefiting 1,400 charitable organizations. Also, in response to the challenges brought about by the COVID-19 pandemic, Credit Suisse offers ongoing support to its non-profit partner organizations by providing flexibility in how grants are spent, including providing some emergency funding to partners in the US and India. Additionally, where possible, employee volunteering assignments have been and are being shifted to virtual settings.
Our Impact Advisory and Finance (IAF) Department continued to drive key initiatives to further the bank’s sustainable and impact investing agenda in 2Q20. Over the quarter, Credit Suisse was involved in the issuance of over USD 5.5 billion of green bonds20. Furthermore, in May, Credit Suisse announced the successful pricing of its inaugural green bond, which raised EUR 500 million in proceeds to be allocated to eligible green projects or assets as defined by our Green Finance Framework.
In June, Credit Suisse Asset Management and IAF launched the Credit Suisse (Lux) Environmental Impact Equity Fund, which will invest in publicly traded, mostly small and mid-cap companies that provide products, services and technologies aimed at solving the most pressing environmental challenges such as climate change, pollution and natural resource depletion. Also in June, Credit Suisse became a member of the International Corporate Governance Network, an investor-led organization that promotes best standards of corporate governance and investor stewardship, globally. Additionally, Credit Suisse published its annual International Finance Corporation Operating Principles for Impact Management disclosure statement.
Finally, the bank sponsored the Asian Venture Philanthropy Network (virtual) conference in APAC, showcasing Credit Suisse’s contributions to collective impact, shared learning and capacity building in the region.
Media Release Zurich, July 30, 2020 | |
CONTACT DETAILS
Kinner Lakhani, Investor Relations, Credit Suisse Tel: +41 44 333 71 49 Email: investor.relations@credit-suisse.com |
James Quinn, Corporate Communications, Credit Suisse Tel: +41 844 33 88 44 E-mail: media.relations@credit-suisse.com |
The Financial Report and Presentation Slides for 2Q20 are available to download from 7:00 CEST today at: https://www.credit-suisse.com/results |
PRESENTATION OF 2Q20 RESULTS – THURSDAY, JULY 30, 2020
| Event | Analyst Call | Media Call |
| Time | 08:00 Zurich 07:00 London 02:00 New York | 10:30 Zurich 09:30 London 04:30 New York |
| Language | English | English |
| Access | Switzerland: +41 44 580 48 67 Europe: +44 203 057 6528 US: +1 866 276 8933 Reference: Credit Suisse Analysts and Investors Call Conference ID: 1847265 Please dial in 10 minutes before the start of the call Webcast link here. | Switzerland: +41 44 580 48 67 Europe: +44 203 057 6528 US: +1 866 276 8933 Reference: Credit Suisse Media Call Conference ID: 8985759 Please dial in 10 minutes before the start of the call Webcast link here. |
| Q&A Session | Following the presentation, you will have the opportunity to ask the speakers questions | Following the presentation, you will have the opportunity to ask the speakers questions |
| Playback | Replay available approximately one hour after the event Switzerland: +41 44 580 40 26 Europe: +44 333 300 9785 US: +1 917 677 7532 Conference ID: 1847265 | Replay available approximately one hour after the event Switzerland: +41 44 580 40 26 Europe: +44 333 300 9785 US: +1 917 677 7532 Conference ID: 8985759 |
Media Release Zurich, July 30, 2020 | |
Note: Our 2Q20 results include a gain of CHF 134 million related to the revaluation of our equity investment in Pfandbriefbank. Our 1Q20 and 3Q19 results include gains of CHF 268 million and CHF 327 million, respectively, related to the transfer of the InvestLab fund platform to Allfunds Group. Our 4Q19 results include a gain of CHF 498 million related to the revaluation of our equity investment in SIX Group AG.
Footnotes
1 Refers to net income attributable to shareholders
2 Including cash held at central banks, our Tier 1 leverage ratio would have been 5.5% for 2Q20 and 5.3% for 1Q20
3 Including cash held at central banks, our CET1 leverage ratio would have been 4.0% for 2Q20 and 3.8% for 1Q20
4 Includes Private Clients in SUB, Private Banking in IWM and APAC Private Banking within Wealth Management & Connected
5 Excludes CHF (85) million of negative FX impact in 2Q20; underlying revenue base at constant 1H19 average FX rates, applying a straight line average of monthly rates
6 Excludes CHF (165) million of negative FX impact in 1H20; underlying revenue base at constant 1H19 average FX rates, applying a straight line average of monthly rates
7 Includes Global Markets, APAC Markets and Investment Banking & Capital Markets
8 Includes Global Markets and APAC Markets
9 Gains from a Pfandbriefbank revaluation of CHF 134 million in Private Clients other revenues in 2Q20
10 Real estate gains of CHF 87 million in Private Clients other revenues and a special SIX dividend of CHF 29 million in transaction-based revenues in 2Q19
11 Real estate gains of CHF 87 million in other revenues in 2Q19
12 Source: Dealogic for the period ending June 30, 2020 (APAC excluding Japan and China onshore among International banks)
13 Source: Dealogic for the period ending June 30, 2020 (Americas and EMEA only)
14 Source: Dealogic for the period ending June 30, 2020 (Global)
15 Includes Fixed Income Sales and Trading and Underwriting revenues
16 Source: Dealogic as of June 30, 2020 (Americas and EMEA only) and Bloomberg as of June 30, 2020
17 Includes Equity Sales and Trading and Underwriting revenues
18 Source: Third Party competitive analysis 1Q20 vs. 1Q19
19 Source: Dealogic as June 30, 2020 (Americas and EMEA only)
20 Source: Bloomberg, April 1, 2020 – June 30, 2020, Americas and EMEA
Abbreviations
APAC – Asia Pacific; AuM – assets under management; BIS – Bank for International Settlements; CECL – US GAAP accounting standard for current expected credit losses; CET1 – common equity tier 1; CHF – Swiss francs; C&IC – Corporate & Institutional Clients; EGM – Extraordinary General Meeting; ESG – Environmental, Social and Governance; FINMA – Swiss Financial Market Supervisory Authority FINMA; FX – Foreign Exchange; GAAP – Generally accepted accounting principles; GM – Global Markets; IAF – Impact Advisory and Finance; IBCM – Investment Banking & Capital Markets; IPO – Initial Public Offering; ITS – International Trading Solutions; IWM – International Wealth Management; NNA – net new assets; PB – Private Banking; PC – Private Clients; RoTE – Return on Tangible Equity; RWA – risk weighted assets; SEC – U.S. Securities and Exchange Commission; SIX – Swiss Stock Exchange; SME – Small and Medium Enterprises; SUB – Swiss Universal Bank; USD – US dollar; WM&C – Wealth Management & Connected.
Important information
This document contains select information from the full 2Q20 Financial Report and 2Q20 Results Presentation slides that Credit Suisse believes is of particular interest to media professionals. The complete 2Q20 Financial Report and 2Q20 Results Presentation slides, which have been distributed simultaneously, contain more comprehensive information about our results and operations for the reporting quarter, as well as important information about our reporting methodology and some of the terms used in these documents. The complete 2Q20 Financial Report and 2Q20 Results Presentation slides are not incorporated by reference into this document.
We may not achieve all of the expected benefits of our strategic initiatives. Factors beyond our control, including but not limited to the market and economic conditions (including macroeconomic and other challenges and uncertainties, for example, resulting from the COVID-19 pandemic), changes in laws, rules or regulations and other challenges discussed in our public filings, could limit our ability to achieve some or all of the expected benefits of these initiatives.
In particular, the terms “Estimate”, “Illustrative”, “Ambition”, “Objective”, “Outlook” and “Goal” are not intended to be viewed as targets or projections, nor are they considered to be Key Performance Indicators. All such estimates, illustrations, ambitions, objectives, outlooks and goals are subject to a large number of inherent risks, assumptions and uncertainties, many of which are completely outside of our control. These risks, assumptions and uncertainties include, but are not limited to, general market conditions, market volatility, interest rate volatility and levels, global and regional economic conditions, challenges and uncertainties resulting from the COVID-19 pandemic, political uncertainty, changes in tax policies, regulatory changes, changes
Media Release Zurich, July 30, 2020 | |
in levels of client activity as a result of any of the foregoing and other factors. Accordingly, this information should not be relied on for any purpose. We do not intend to update these estimates, illustrations, ambitions, objectives, outlooks or goals.
In preparing this document, management has made estimates and assumptions that affect the numbers presented. Actual results may differ. Annualized numbers do not take into account variations in operating results, seasonality and other factors and may not be indicative of actual, full-year results. Figures throughout this document may also be subject to rounding adjustments. All opinions and views constitute judgments as of the date of writing without regard to the date on which the reader may receive or access the information. This information is subject to change at any time without notice and we do not intend to update this information.
Our estimates, ambitions, objectives and targets often include metrics that are non-GAAP financial measures and are unaudited. A reconciliation of the estimates, ambitions, objectives and targets to the nearest GAAP measures is unavailable without unreasonable efforts. Return on tangible equity is based on tangible shareholders' equity (also known as tangible book value), a non-GAAP financial measure, which is calculated by deducting goodwill and other intangible assets from total shareholders' equity as presented in our balance sheet, both of which are unavailable on a prospective basis. Such estimates, ambitions, objectives and targets are calculated in a manner that is consistent with the accounting policies applied by us in preparing our financial statements.
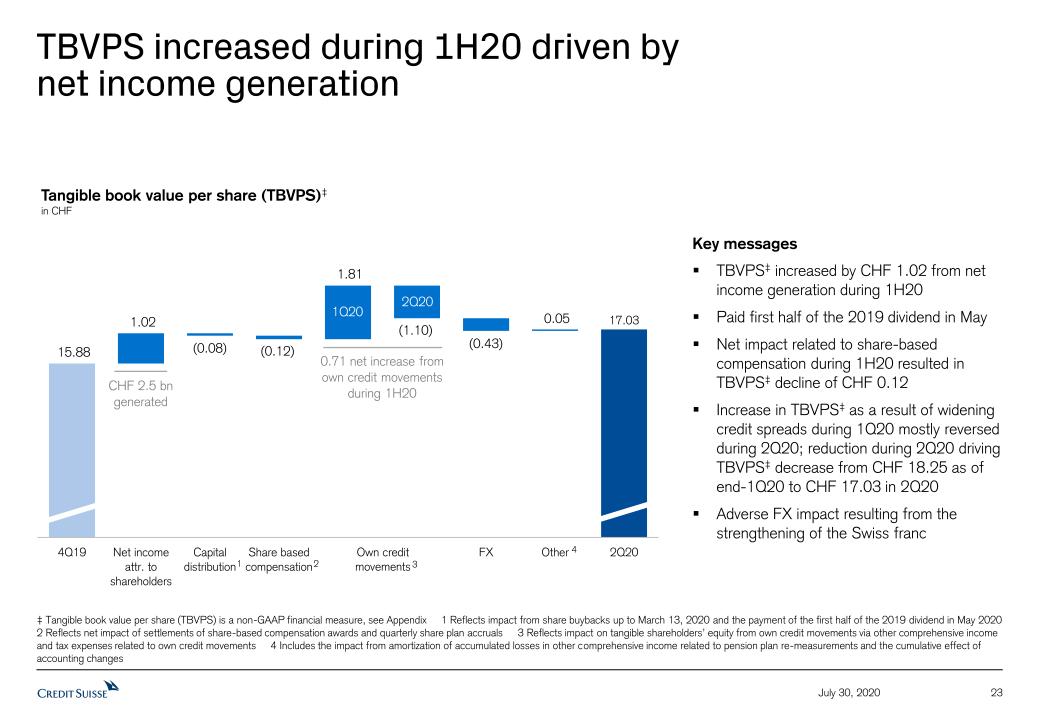
Return on tangible equity is based on tangible shareholders’ equity, a non-GAAP financial measure, which is calculated by deducting goodwill and other intangible assets from total shareholders’ equity as presented in our balance sheet. Management believes that return on tangible equity is meaningful as it is a measure used and relied upon by industry analysts and investors to assess valuations and capital adequacy. For end-2Q20, tangible shareholders’ equity excluded goodwill of CHF 4,676 million and other intangible assets of CHF 273 million from total shareholders’ equity of CHF 46,535 million as presented in our balance sheet. For end-1Q20, tangible shareholders’ equity excluded goodwill of CHF 4,604 million and other intangible assets of CHF 279 million from total shareholders’ equity of CHF 48,675 million as presented in our balance sheet. For end-4Q19, tangible shareholders’ equity excluded goodwill of CHF 4,663 million and other intangible assets of CHF 291 million from total shareholders’ equity of CHF 43,644 million as presented in our balance sheet. For end-3Q19, tangible shareholders’ equity excluded goodwill of CHF 4,760 million and other intangible assets of CHF 219 million from total shareholders’ equity of CHF 45,150 million as presented in our balance sheet.
Regulatory capital is calculated as the worst of 10% of RWA and 3.5% of leverage exposure. Return on regulatory capital (a non-GAAP financial measure) is calculated using income / (loss) after tax and assumes a tax rate of 30% and capital allocated based on the worst of 10% of average RWA and 3.5% of average leverage exposure. For the Markets business within the APAC division and for the Global Markets and Investment Banking & Capital Markets divisions, return on regulatory capital is based on US dollar denominated numbers.
Credit Suisse is subject to the Basel III framework, as implemented in Switzerland, as well as Swiss legislation and regulations for systemically important banks, which include capital, liquidity, leverage and large exposure requirements and rules for emergency plans designed to maintain systemically relevant functions in the event of threatened insolvency. Credit Suisse has adopted the Bank for International Settlements (BIS) leverage ratio framework, as issued by the Basel Committee on Banking Supervision (BCBS) and implemented in Switzerland by the Swiss Financial Market Supervisory Authority FINMA (FINMA).
Unless otherwise noted, all CET1 ratio, Tier-1 leverage ratio, risk-weighted assets and leverage exposure figures in this document are as of the end of the respective period and on a “look-through” basis.
Unless otherwise noted, leverage exposure is based on the BIS leverage ratio framework and consists of period-end balance sheet assets and prescribed regulatory adjustments. The tier 1 leverage ratio and CET1 leverage ratio are calculated as BIS tier 1 capital and CET1 capital, respectively, divided by period end leverage exposure. Swiss leverage ratios are measured on the same period-end basis as the leverage exposure for the BIS leverage ratio.
Generic references to profit and costs in this document refer to pre-tax income and operating expenses, respectively. When we refer to operating divisions throughout this document, we mean SUB, IWM, APAC, IBCM and GM. References to Private Banking mean SUB PC, IWM PB and APAC PB within WM&C or their combined results. References to Investment Banking mean GM, IBCM, APAC Markets or their combined results.
Investors and others should note that we announce material information (including quarterly earnings releases and financial reports) to the investing public using press releases, SEC and Swiss ad hoc filings, our website and public conference calls and webcasts. We intend to also use our Twitter account @creditsuisse (https://twitter.com/creditsuisse) to excerpt key messages from our public disclosures, including earnings releases. We may retweet such messages through certain of our regional Twitter accounts, including @csschweiz (https://twitter.com/csschweiz) and @csapac (https://twitter.com/csapac). Investors and others should take care to consider such abbreviated messages in the context of the disclosures from which they are excerpted. The information we post on these Twitter accounts is not a part of this document.
Information referenced in this document, whether via website links or otherwise, is not incorporated into this document.
Media Release Zurich, July 30, 2020 | |
Certain material in this document has been prepared by Credit Suisse on the basis of publicly available information, internally developed data and other third-party sources believed to be reliable. Credit Suisse has not sought to independently verify information obtained from public and third-party sources and makes no representations or warranties as to accuracy, completeness or reliability of such information.
In various tables, use of “–” indicates not meaningful or not applicable.
Page 14
| Key metrics |
| | in / end of | | % change | | in / end of | | % change | |
| | 2Q20 | | 1Q20 | | 2Q19 | | QoQ | | YoY | | 6M20 | | 6M19 | | YoY | |
| Credit Suisse Group results (CHF million) |
| Net revenues | | 6,194 | | 5,776 | | 5,581 | | 7 | | 11 | | 11,970 | | 10,968 | | 9 | |
| Provision for credit losses | | 296 | | 568 | | 25 | | (48) | | – | | 864 | | 106 | | – | |
| Compensation and benefits | | 2,594 | | 2,316 | | 2,545 | | 12 | | 2 | | 4,910 | | 5,063 | | (3) | |
| General and administrative expenses | | 1,440 | | 1,346 | | 1,395 | | 7 | | 3 | | 2,786 | | 2,808 | | (1) | |
| Commission expenses | | 313 | | 345 | | 314 | | (9) | | – | | 658 | | 627 | | 5 | |
| Total other operating expenses | | 1,753 | | 1,691 | | 1,709 | | 4 | | 3 | | 3,444 | | 3,435 | | 0 | |
| Total operating expenses | | 4,347 | | 4,007 | | 4,254 | | 8 | | 2 | | 8,354 | | 8,498 | | (2) | |
| Income before taxes | | 1,551 | | 1,201 | | 1,302 | | 29 | | 19 | | 2,752 | | 2,364 | | 16 | |
| Net income attributable to shareholders | | 1,162 | | 1,314 | | 937 | | (12) | | 24 | | 2,476 | | 1,686 | | 47 | |
| Statement of operations metrics (%) |
| Return on regulatory capital | | 14.5 | | 10.8 | | 11.6 | | – | | – | | 12.6 | | 10.6 | | – | |
| Balance sheet statistics (CHF million) |
| Total assets | | 828,480 | | 832,166 | | 784,216 | | 0 | | 6 | | 828,480 | | 784,216 | | 6 | |
| Risk-weighted assets | | 299,293 | | 300,580 | | 290,798 | | 0 | | 3 | | 299,293 | | 290,798 | | 3 | |
| Leverage exposure | | 836,755 | | 869,706 | | 897,916 | | (4) | | (7) | | 836,755 | | 897,916 | | (7) | |
| Assets under management and net new assets (CHF billion) |
| Assets under management | | 1,443.4 | | 1,370.5 | | 1,455.7 | | 5.3 | | (0.8) | | 1,443.4 | | 1,455.7 | | (0.8) | |
| Net new assets | | 9.8 | | 5.8 | | 22.9 | | 69.0 | | (57.2) | | 15.6 | | 57.5 | | (72.9) | |
| Basel III regulatory capital and leverage statistics (%) |
| CET1 ratio | | 12.5 | | 12.1 | | 12.5 | | – | | – | | 12.5 | | 12.5 | | – | |
| CET1 leverage ratio | | 4.5 | | 4.2 | | 4.1 | | – | | – | | 4.5 | | 4.1 | | – | |
| Tier 1 leverage ratio | | 6.2 | | 5.8 | | 5.3 | | – | | – | | 6.2 | | 5.3 | | – | |
| Swiss Universal Bank |
| | in / end of | | % change | | in / end of | | % change | |
| | 2Q20 | | 1Q20 | | 2Q19 | | QoQ | | YoY | | 6M20 | | 6M19 | | YoY | |
| Results (CHF million) |
| Net revenues | | 1,504 | | 1,509 | | 1,476 | | 0 | | 2 | | 3,013 | | 2,855 | | 6 | |
| of which Private Clients | | 856 | | 798 | | 828 | | 7 | | 3 | | 1,654 | | 1,570 | | 5 | |
| of which Corporate & Institutional Clients | | 648 | | 711 | | 648 | | (9) | | 0 | | 1,359 | | 1,285 | | 6 | |
| Provision for credit losses | | 30 | | 124 | | 10 | | (76) | | 200 | | 154 | | 39 | | 295 | |
| Total operating expenses | | 787 | | 796 | | 812 | | (1) | | (3) | | 1,583 | | 1,612 | | (2) | |
| Income before taxes | | 687 | | 589 | | 654 | | 17 | | 5 | | 1,276 | | 1,204 | | 6 | |
| of which Private Clients | | 366 | | 311 | | 356 | | 18 | | 3 | | 677 | | 629 | | 8 | |
| of which Corporate & Institutional Clients | | 321 | | 278 | | 298 | | 15 | | 8 | | 599 | | 575 | | 4 | |
| Metrics (%) |
| Return on regulatory capital | | 20.3 | | 17.7 | | 20.1 | | – | | – | | 19.0 | | 18.6 | | – | |
| Cost/income ratio | | 52.3 | | 52.8 | | 55.0 | | – | | – | | 52.5 | | 56.5 | | – | |
| Private Clients |
| Assets under management (CHF billion) | | 201.8 | | 194.8 | | 214.7 | | 3.6 | | (6.0) | | 201.8 | | 214.7 | | (6.0) | |
| Net new assets (CHF billion) | | (1.6) | | (4.2) | | 1.2 | | – | | – | | (5.8) | | 4.5 | | – | |
| Gross margin (annualized) (bp) | | 171 | | 151 | | 156 | | – | | – | | 161 | | 150 | | – | |
| Net margin (annualized) (bp) | | 73 | | 59 | | 67 | | – | | – | | 66 | | 60 | | – | |
| Corporate & Institutional Clients |
| Assets under management (CHF billion) | | 427.4 | | 405.3 | | 410.7 | | 5.5 | | 4.1 | | 427.4 | | 410.7 | | 4.1 | |
| Net new assets (CHF billion) | | 1.6 | | 4.8 | | 8.9 | | – | | – | | 6.4 | | 36.5 | | – | |
| International Wealth Management |
| | in / end of | | % change | | in / end of | | % change | |
| | 2Q20 | | 1Q20 | | 2Q19 | | QoQ | | YoY | | 6M20 | | 6M19 | | YoY | |
| Results (CHF million) |
| Net revenues | | 1,274 | | 1,502 | | 1,369 | | (15) | | (7) | | 2,776 | | 2,786 | | 0 | |
| of which Private Banking | | 919 | | 1,061 | | 989 | | (13) | | (7) | | 1,980 | | 2,008 | | (1) | |
| of which Asset Management | | 355 | | 441 | | 380 | | (20) | | (7) | | 796 | | 778 | | 2 | |
| Provision for credit losses | | 35 | | 39 | | 9 | | (10) | | 289 | | 74 | | 19 | | 289 | |
| Total operating expenses | | 891 | | 926 | | 916 | | (4) | | (3) | | 1,817 | | 1,800 | | 1 | |
| Income before taxes | | 348 | | 537 | | 444 | | (35) | | (22) | | 885 | | 967 | | (8) | |
| of which Private Banking | | 268 | | 375 | | 340 | | (29) | | (21) | | 643 | | 742 | | (13) | |
| of which Asset Management | | 80 | | 162 | | 104 | | (51) | | (23) | | 242 | | 225 | | 8 | |
| Metrics (%) |
| Return on regulatory capital | | 21.4 | | 33.9 | | 28.9 | | – | | – | | 27.6 | | 32.2 | | – | |
| Cost/income ratio | | 69.9 | | 61.7 | | 66.9 | | – | | – | | 65.5 | | 64.6 | | – | |
| Private Banking |
| Assets under management (CHF billion) | | 344.5 | | 327.7 | | 363.1 | | 5.1 | | (5.1) | | 344.5 | | 363.1 | | (5.1) | |
| Net new assets (CHF billion) | | 1.8 | | 3.7 | | 5.5 | | – | | – | | 5.5 | | 6.8 | | – | |
| Gross margin (annualized) (bp) | | 109 | | 119 | | 109 | | – | | – | | 114 | | 111 | | – | |
| Net margin (annualized) (bp) | | 32 | | 42 | | 37 | | – | | – | | 37 | | 41 | | – | |
| Asset Management |
| Assets under management (CHF billion) | | 423.8 | | 409.6 | | 414.0 | | 3.5 | | 2.4 | | 423.8 | | 414.0 | | 2.4 | |
| Net new assets (CHF billion) | | 4.1 | | 0.1 | | 8.6 | | – | | – | | 4.2 | | 8.1 | | – | |
| Asia Pacific |
| | in / end of | | % change | | in / end of | | % change | |
| | 2Q20 | | 1Q20 | | 2Q19 | | QoQ | | YoY | | 6M20 | | 6M19 | | YoY | |
| Results (CHF million) |
| Net revenues | | 1,064 | | 1,025 | | 913 | | 4 | | 17 | | 2,089 | | 1,767 | | 18 | |
| of which Wealth Management & Connected | | 605 | | 577 | | 614 | | 5 | | (1) | | 1,182 | | 1,179 | | 0 | |
| of which Markets | | 459 | | 448 | | 299 | | 2 | | 54 | | 907 | | 588 | | 54 | |
| Provision for credit losses | | 81 | | 97 | | (1) | | (16) | | – | | 178 | | 16 | | – | |
| Total operating expenses | | 685 | | 676 | | 677 | | 1 | | 1 | | 1,361 | | 1,331 | | 2 | |
| Income before taxes | | 298 | | 252 | | 237 | | 18 | | 26 | | 550 | | 420 | | 31 | |
| of which Wealth Management & Connected | | 123 | | 85 | | 216 | | 45 | | (43) | | 208 | | 386 | | (46) | |
| of which Markets | | 175 | | 167 | | 21 | | 5 | | – | | 342 | | 34 | | – | |
| Metrics (%) |
| Return on regulatory capital | | 21.8 | | 17.9 | | 17.0 | | – | | – | | 19.7 | | 15.3 | | – | |
| Cost/income ratio | | 64.4 | | 66.0 | | 74.2 | | – | | – | | 65.2 | | 75.3 | | – | |
| Wealth Management & Connected – Private Banking |
| Assets under management (CHF billion) | | 215.8 | | 197.0 | | 214.5 | | 9.5 | | 0.6 | | 215.8 | | 214.5 | | 0.6 | |
| Net new assets (CHF billion) | | 4.5 | | 3.0 | | 2.5 | | – | | – | | 7.5 | | 6.3 | | – | |
| Gross margin (annualized) (bp) | | 79 | | 101 | | 80 | | – | | – | | 90 | | 78 | | – | |
| Net margin (annualized) (bp) | | 26 | | 48 | | 30 | | – | | – | | 38 | | 28 | | – | |
| Global Markets |
| | in / end of | | % change | | in / end of | | % change | |
| | 2Q20 | | 1Q20 | | 2Q19 | | QoQ | | YoY | | 6M20 | | 6M19 | | YoY | |
| Results (CHF million) |
| Net revenues | | 1,901 | | 1,630 | | 1,553 | | 17 | | 22 | | 3,531 | | 3,025 | | 17 | |
| Provision for credit losses | | 77 | | 150 | | 2 | | (49) | | – | | 227 | | 13 | | – | |
| Total operating expenses | | 1,233 | | 1,150 | | 1,194 | | 7 | | 3 | | 2,383 | | 2,373 | | 0 | |
| Income before taxes | | 591 | | 330 | | 357 | | 79 | | 66 | | 921 | | 639 | | 44 | |
| Metrics (%) |
| Return on regulatory capital | | 17.3 | | 9.6 | | 11.0 | | – | | – | | 13.8 | | 10.0 | | – | |
| Cost/income ratio | | 64.9 | | 70.6 | | 76.9 | | – | | – | | 67.5 | | 78.4 | | – | |
| Investment Banking & Capital Markets |
| | in / end of | | % change | | in / end of | | % change | |
| | 2Q20 | | 1Q20 | | 2Q19 | | QoQ | | YoY | | 6M20 | | 6M19 | | YoY | |
| Results (CHF million) |
| Net revenues | | 702 | | 183 | | 454 | | 284 | | 55 | | 885 | | 810 | | 9 | |
| Provision for credit losses | | 67 | | 155 | | 1 | | (57) | | – | | 222 | | 9 | | – | |
| Total operating expenses | | 433 | | 406 | | 447 | | 7 | | (3) | | 839 | | 888 | | (6) | |
| Income/(loss) before taxes | | 202 | | (378) | | 6 | | – | | – | | (176) | | (87) | | 102 | |
| Metrics (%) |
| Return on regulatory capital | | 23.8 | | (43.4) | | 0.8 | | – | | – | | (10.3) | | (4.7) | | – | |
| Cost/income ratio | | 61.7 | | 221.9 | | 98.5 | | – | | – | | 94.8 | | 109.6 | | – | |
| Global advisory and underwriting revenues |
| | in | | % change | | in | | % change | |
| | 2Q20 | | 1Q20 | | 2Q19 | | QoQ | | YoY | | 6M20 | | 6M19 | | YoY | |
| Global advisory and underwriting revenues (USD million) |
| Advisory and other fees | | 245 | | 189 | | 208 | | 30 | | 18 | | 434 | | 379 | | 15 | |
| Debt underwriting | | 737 | | 65 | | 463 | | – | | 59 | | 802 | | 923 | | (13) | |
| Equity underwriting | | 438 | | 164 | | 253 | | 167 | | 73 | | 602 | | 391 | | 54 | |
| Global advisory and underwriting revenues | | 1,420 | | 418 | | 924 | | 240 | | 54 | | 1,838 | | 1,693 | | 9 | |
Cautionary statement regarding forward-looking information
This document contains statements that constitute forward-looking statements. In addition, in the future we, and others on our behalf, may make statements that constitute forward-looking statements. Such forward-looking statements may include, without limitation, statements relating to the following:
■ our plans, targets or goals;
■ our future economic performance or prospects;
■ the potential effect on our future performance of certain contingencies; and
■ assumptions underlying any such statements.
Words such as “believes,” “anticipates,” “expects,” “intends” and “plans” and similar expressions are intended to identify forward-looking statements but are not the exclusive means of identifying such statements. We do not intend to update these forward-looking statements.
By their very nature, forward-looking statements involve inherent risks and uncertainties, both general and specific, and risks exist that predictions, forecasts, projections and other outcomes described or implied in forward-looking statements will not be achieved. We caution you that a number of important factors could cause results to differ materially from the plans, targets, goals, expectations, estimates and intentions expressed in such forward-looking statements. These factors include:
■ the ability to maintain sufficient liquidity and access capital markets;
■ market volatility and interest rate fluctuations and developments affecting interest rate levels, including the persistence of a low or negative interest rate environment;
■ the strength of the global economy in general and the strength of the economies of the countries in which we conduct our operations, in particular the risk of negative impacts of COVID-19 on the global economy and financial markets and the risk of continued slow economic recovery or downturn in the EU, the US or other developed countries or in emerging markets in 2020 and beyond;
■ the emergence of widespread health emergencies, infectious diseases or pandemics, such as COVID-19, and the actions that may be taken by governmental authorities to contain the outbreak or to counter its impact on our business;
■ potential risks and uncertainties relating to the severity of impacts from COVID-19 and the duration of the pandemic, including potential material adverse effects on our business, financial condition and results of operations;
■ the direct and indirect impacts of deterioration or slow recovery in residential and commercial real estate markets;
■ adverse rating actions by credit rating agencies in respect of us, sovereign issuers, structured credit products or other credit-related exposures;
■ the ability to achieve our strategic goals, including those related to our targets, ambitions and financial goals;
■ the ability of counterparties to meet their obligations to us and the adequacy of our allowance for credit losses;
■ the effects of, and changes in, fiscal, monetary, exchange rate, trade and tax policies, as well as currency fluctuations;
■ political, social and environmental developments, including war, civil unrest or terrorist activity and climate change;
■ the ability to appropriately address social, environmental and sustainability concerns that may arise from our business activities;
■ the effects of, and the uncertainty arising from, the UK’s withdrawal from the EU;
■ the possibility of foreign exchange controls, expropriation, nationalization or confiscation of assets in countries in which we conduct our operations;
■ operational factors such as systems failure, human error, or the failure to implement procedures properly;
■ the risk of cyber attacks, information or security breaches or technology failures on our business or operations;
■ the adverse resolution of litigation, regulatory proceedings and other contingencies;
■ actions taken by regulators with respect to our business and practices and possible resulting changes to our business organization, practices and policies in countries in which we conduct our operations;
■ the effects of changes in laws, regulations or accounting or tax standards, policies or practices in countries in which we conduct our operations;
■ the expected discontinuation of LIBOR and other interbank offered rates and the transition to alternative reference rates;
■ the potential effects of changes in our legal entity structure;
■ competition or changes in our competitive position in geographic and business areas in which we conduct our operations;
■ the ability to retain and recruit qualified personnel;
■ the ability to maintain our reputation and promote our brand;
■ the ability to increase market share and control expenses;
■ technological changes instituted by us, our counterparties or competitors;
■ the timely development and acceptance of our new products and services and the perceived overall value of these products and services by users;
■ acquisitions, including the ability to integrate acquired businesses successfully, and divestitures, including the ability to sell non-core assets; and
■ other unforeseen or unexpected events and our success at managing these and the risks involved in the foregoing.
We caution you that the foregoing list of important factors is not exclusive. When evaluating forward-looking statements, you should carefully consider the foregoing factors and other uncertainties and events, including the information set forth in “Risk factors” in I – Information on the company in our Annual Report 2019 and in “Risk factor” in I – Credit Suisse in our 1Q20 Financial Report.
Thomas Gottstein, Chief Executive OfficerDavid Mathers, Chief Financial OfficerJuly 30, 2020 Credit SuisseSecond Quarter 2020 ResultsAnalyst and Investor Call
Disclaimer (1/2) 2 July 30, 2020 This material does not purport to contain all of the information that you may wish to consider. This material is not to be relied upon as such or used in substitution for the exercise of independent judgment. Cautionary statement regarding forward-looking statements This presentation contains forward-looking statements that involve inherent risks and uncertainties, and we might not be able to achieve the predictions, forecasts, projections and other outcomes we describe or imply in forward-looking statements. A number of important factors could cause results to differ materially from the plans, targets, goals, expectations, estimates and intentions we express in these forward-looking statements, including those we identify in "Risk factors” in our Annual Report on Form 20-F for the fiscal year ended December 31, 2019, in “Credit Suisse – Risk Factor” in our 1Q20 Financial Report published on May 7, 2020 and in the “Cautionary statement regarding forward-looking information" in our 2Q20 Financial Report published on July 30, 2020 and filed with the US Securities and Exchange Commission, and in other public filings and press releases. We do not intend to update these forward-looking statements. In particular, the terms “Estimate”, “Illustrative”, “Ambition”, “Objective”, “Outlook” and “Goal” are not intended to be viewed as targets or projections, nor are they considered to be Key Performance Indicators. All such estimates, illustrations, ambitions, objectives, outlooks and goals are subject to a large number of inherent risks, assumptions and uncertainties, many of which are completely outside of our control. These risks, assumptions and uncertainties include, but are not limited to, general market conditions, market volatility, interest rate volatility and levels, global and regional economic conditions, challenges and uncertainties resulting from the COVID-19 pandemic, political uncertainty, changes in tax policies, regulatory changes, changes in levels of client activity as a result of any of the foregoing and other factors. Accordingly, this information should not be relied on for any purpose. We do not intend to update these estimates, illustrations, ambitions, objectives, outlooks or goals. We may not achieve the benefits of our strategic initiativesWe may not achieve all of the expected benefits of our strategic initiatives. Factors beyond our control, including but not limited to the market and economic conditions (including macroeconomic and other challenges and uncertainties, for example, resulting from the COVID-19 pandemic), changes in laws, rules or regulations and other challenges discussed in our public filings, could limit our ability to achieve some or all of the expected benefits of these initiatives. Estimates and assumptionsIn preparing this presentation, management has made estimates and assumptions that affect the numbers presented. Actual results may differ. Annualized numbers do not take into account variations in operating results, seasonality and other factors and may not be indicative of actual, full-year results. Figures throughout this presentation may also be subject to rounding adjustments. All opinions and views constitute judgments as of the date of writing without regard to the date on which the reader may receive or access the information. This information is subject to change at any time without notice and we do not intend to update this information.Statement regarding non-GAAP financial measuresThis presentation also contains non-GAAP financial measures, including adjusted results as well as return on regulatory capital, return on tangible equity and tangible book value per share (which are based on tangible shareholders’ equity). Information needed to reconcile such non-GAAP financial measures to the most directly comparable measures under US GAAP can be found in this presentation, which is available on our website at www.credit-suisse.com.Our estimates, ambitions, objectives and targets often include metrics that are non-GAAP financial measures and are unaudited. A reconciliation of the estimates, ambitions, objectives and targets to the nearest GAAP measures is unavailable without unreasonable efforts. Return on tangible equity is based on tangible shareholders’ equity, a non-GAAP financial measure also known as tangible book value, which is calculated by deducting goodwill and other intangible assets from total shareholders’ equity as presented in our balance sheet, both of which are unavailable on a prospective basis. Return on regulatory capital (a non-GAAP financial measure) is calculated using income / (loss) after tax and assumes a tax rate of 30% and capital allocated based on the worst of 10% of average RWA and 3.5% of average leverage exposure; the essential components of this calculation are unavailable on a prospective basis. Adjusted results exclude goodwill impairment, major litigation provisions, real estate gains and other revenue and expense items included in our reported results, all of which are unavailable on a prospective basis. Such estimates, ambitions, objectives and targets are calculated in a manner that is consistent with the accounting policies applied by us in preparing our financial statements.
Disclaimer (2/2) 3 July 30, 2020 Statement regarding capital, liquidity and leverageCredit Suisse is subject to the Basel III framework, as implemented in Switzerland, as well as Swiss legislation and regulations for systemically important banks (Swiss Requirements), which include capital, liquidity, leverage and large exposure requirements and rules for emergency plans designed to maintain systemically relevant functions in the event of threatened insolvency. Credit Suisse has adopted the Bank for International Settlements (BIS) leverage ratio framework, as issued by the Basel Committee on Banking Supervision (BCBS) and implemented in Switzerland by the Swiss Financial Market Supervisory Authority FINMA.References to phase-in and look-through included herein refer to Basel III capital requirements and Swiss Requirements. Phase-in reflects that, for the years 2014-2018, there was a five-year (20% per annum) phase-in of goodwill, other intangible assets and other capital deductions (e.g., certain deferred tax assets) and a phase-out of an adjustment for the accounting treatment of pension plans. For the years 2013-2022, there is a phase-out of certain capital instruments. Look-through assumes the full phase-in of goodwill and other intangible assets and other regulatory adjustments and the phase-out of certain capital instruments.Unless otherwise noted, leverage exposure is based on the BIS leverage ratio framework and consists of period-end balance sheet assets and prescribed regulatory adjustments. The tier 1 leverage ratio and CET1 leverage ratio are calculated as BIS tier 1 capital and CET1 capital, respectively, divided by period-end leverage exposure. Swiss leverage ratios are measured on the same period-end basis as the leverage exposure for the BIS leverage ratio.SourcesCertain material in this presentation has been prepared by Credit Suisse on the basis of publicly available information, internally developed data and other third-party sources believed to be reliable. Credit Suisse has not sought to independently verify information obtained from public and third-party sources and makes no representations or warranties as to accuracy, completeness or reliability of such information.
Executive Summary 4 July 30, 2020
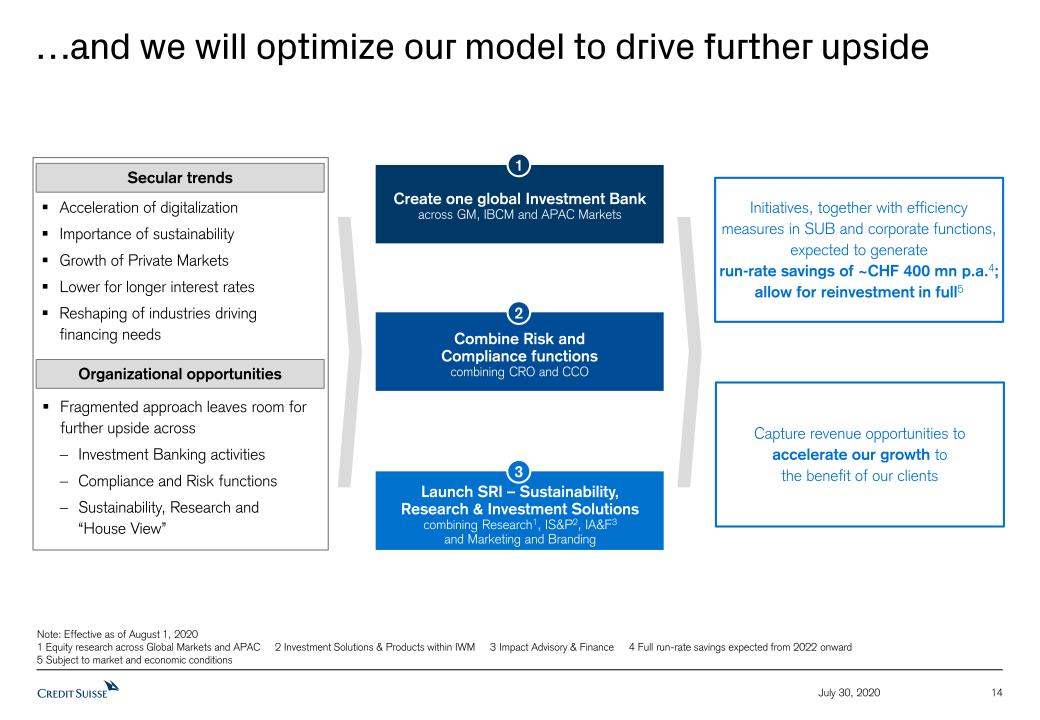
Executive Summary 5 July 30, 2020 Key financial highlights for 2Q20Net income in 2Q20 increased 24% YoY to CHF 1.2 bn1, the highest second quarter in a decade;RoTE‡ of 11.0% in 2Q20, 12.0% in 1H20 and 10.4% in last twelve months Net revenues in 2Q20 increased by 11% YoY, supported by the strong momentum across GM, IBCM and APAC Markets and solid performances in our Private Banking businessesTotal operating expenses in 2Q20 increased 2% YoY, with 15th consecutive quarter of positive operating leverageAdditional provision for credit losses of CHF 296 mn in 2Q20, totaling CHF 864 mn for 1H20PTI of CHF 1.6 bn in 2Q20, up 19% YoY Over the last few years, Credit Suisse has successfully de-risked and has a strong balance sheetCET1 ratio of 12.5% and CET1 leverage ratio of 4.5%2 or 4.0% including cash held at central banks Group LCR of 196%3, among the strongest in the industry84% of Group loans are collateralized4; SUB accounts for 59% of Group gross loansStrategic initiatives and structural refinements to accelerate growth and drive efficiencyStrategy of being a leading Wealth Manager with strong global Investment Banking capabilities has delivered success. We intend to continue to allocate the majority of our capital deployed to Wealth Management to accelerate growthWe will optimize our model to drive further upside in the context of secular trends, which have been accentuated by COVID-19 Create one global Investment BankCombine and integrate Risk and Compliance functionsLaunch SRI capability (Sustainability, Research & Investment Solutions), led at Executive Board levelThis should make our organization even more effective and generate efficiencies for further investments and digitalization in our 4 divisionsDisciplined capital distributionOur Board of Directors intends to propose to the shareholders the second half of the 2019 dividend at an EGM on November 27, 20205Subsequent to the EGM and subject to market and economic conditions, the Board intends to review the share buyback program 1 2 3 ‡ Return on Tangible Equity (RoTE) is a non-GAAP financial measures, see AppendixNote: 2Q20 results include a gain related to the equity investment revaluation of Pfandbriefbank, 1Q20 and 3Q19 results include gains related to the transfer of the InvestLab fund platform to Allfunds Group and 4Q19 results include a gain related to the revaluation of our equity investment in SIX Group1 Relating to net income attributable to shareholders 2 Leverage exposure excludes cash held at central banks, adjusted for the dividend paid in 2Q20 and the planned dividend payment in 4Q20 as required by FINMA 3 Calculated using a three-month average, which is calculated on a daily basis 4 Percentage of collateralized loans held at amortized cost in relation to Group gross loans 5 Subject to market and economic conditions
Kept 90% remote working readiness level; currently ~20% of the workforce in the officeFree antibody testing offered as benefit to Credit Suisse employees. ~6k tests conducted in Switzerland with international roll-out in preparationPaid family leave continuing until schools reopen92% of employees feel well supported and informed by management’s response to the COVID-19 pandemic1 6 July 30, 2020 COVID-19: Credit Suisse is here to support its employees, clients and the community 1 Internal survey 2 June 2020 vs. February 2020; related to SUB Credit Suisse Direct: +27%2 rise in mobile banking activityLeverage technology to ensure strong Private Banking client engagement globallyHigh volume execution across Fixed Income and Equities for Investment Banking andPrivate Banking clients Active participation in the design and execution of the up to CHF 20 bn SME COVID-19 financing program sponsored by the Swiss governmentBank-wide donor-advised matching program to encourage employee donations to charities, including those alleviating the impact of COVID-19 and supporting those affected by inequality, with participation by the full Executive Board and the Chairman of the Board of Directors, raising CHF 25 mnIn-kind donations of masks to hospitals and healthcare providers in major citiesDonations from regional Credit Suisse foundations to specific programs across the globe Employees Clients Community The COVID-19 crisis management effort was recognized by Euromoneywith an award for“Excellence in Leadershipin Western Europe” Recognition
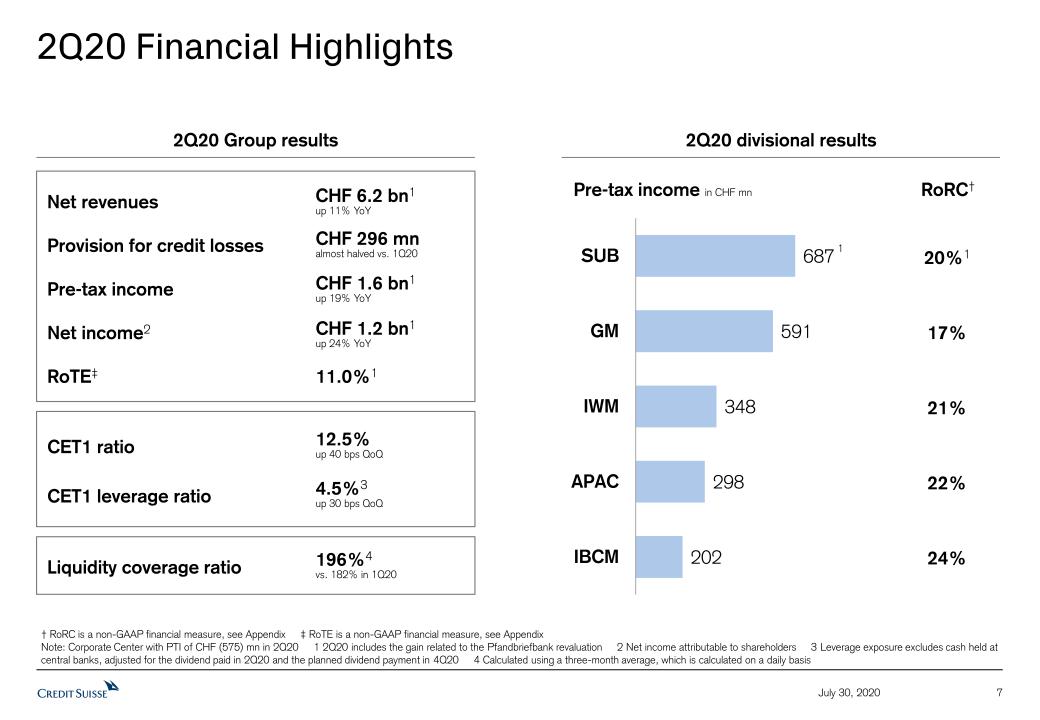
2Q20 Financial Highlights 7 July 30, 2020 † RoRC is a non-GAAP financial measure, see Appendix ‡ RoTE is a non-GAAP financial measure, see AppendixNote: Corporate Center with PTI of CHF (575) mn in 2Q20 1 2Q20 includes the gain related to the Pfandbriefbank revaluation 2 Net income attributable to shareholders 3 Leverage exposure excludes cash held at central banks, adjusted for the dividend paid in 2Q20 and the planned dividend payment in 4Q20 4 Calculated using a three-month average, which is calculated on a daily basis 2Q20 Group results 2Q20 divisional results Pre-tax income in CHF mn RoRC† 20%1 17% 21% 22% 24% 1 RoTE‡ 11.0%1 Pre-tax income CHF 1.6 bn1up 19% YoY Net income2 CHF 1.2 bn1up 24% YoY CET1 ratio 12.5%up 40 bps QoQ 4.5%3up 30 bps QoQ Liquidity coverage ratio 196%4vs. 182% in 1Q20 Provision for credit losses CHF 296 mnalmost halved vs. 1Q20 CET1 leverage ratio Net revenues CHF 6.2 bn1up 11% YoY
8 July 30, 2020 In 1H20 we achieved an RoTE of 12.0% and deliveredthe highest net income in a decade Note: 1H20 reported results include the gains related to the Pfandbriefbank revaluation and to the second tranche of the InvestLab transfer ‡ RoTE is a non-GAAP financial measure, see Appendix1 Net income attributable to shareholders Return on tangible equity‡based on CHF Net income1in CHF mn (132) 899 1,341 1,686 2,476
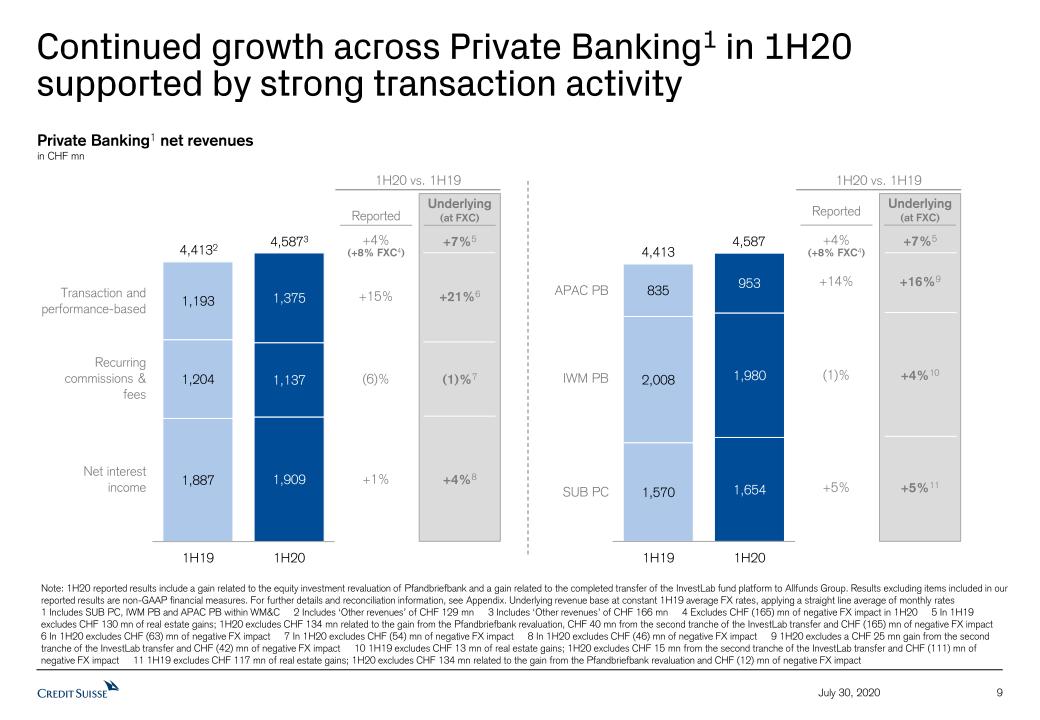
Continued growth across Private Banking1 in 1H20 supported by strong transaction activity July 30, 2020 9 Note: 1H20 reported results include a gain related to the equity investment revaluation of Pfandbriefbank and a gain related to the completed transfer of the InvestLab fund platform to Allfunds Group. Results excluding items included in our reported results are non-GAAP financial measures. For further details and reconciliation information, see Appendix. Underlying revenue base at constant 1H19 average FX rates, applying a straight line average of monthly rates1 Includes SUB PC, IWM PB and APAC PB within WM&C 2 Includes ‘Other revenues’ of CHF 129 mn 3 Includes ‘Other revenues’ of CHF 166 mn 4 Excludes CHF (165) mn of negative FX impact in 1H20 5 In 1H19 excludes CHF 130 mn of real estate gains; 1H20 excludes CHF 134 mn related to the gain from the Pfandbriefbank revaluation, CHF 40 mn from the second tranche of the InvestLab transfer and CHF (165) mn of negative FX impact6 In 1H20 excludes CHF (63) mn of negative FX impact 7 In 1H20 excludes CHF (54) mn of negative FX impact 8 In 1H20 excludes CHF (46) mn of negative FX impact 9 1H20 excludes a CHF 25 mn gain from the second tranche of the InvestLab transfer and CHF (42) mn of negative FX impact 10 1H19 excludes CHF 13 mn of real estate gains; 1H20 excludes CHF 15 mn from the second tranche of the InvestLab transfer and CHF (111) mn of negative FX impact 11 1H19 excludes CHF 117 mn of real estate gains; 1H20 excludes CHF 134 mn related to the gain from the Pfandbriefbank revaluation and CHF (12) mn of negative FX impact 4,413 SUB PC IWM PB APAC PB 4,587 1H20 vs. 1H19 +5% (1)% +14% +4% +5%11 +4%10 +16%9 +7%5 Underlying(at FXC) Reported (+8% FXC4) 4,4132 Net interestincome Recurring commissions & fees Transaction and performance-based 4,5873 1H20 vs. 1H19 +1% (6)% +15% +4% +4%8 (1)%7 +21%6 Underlying(at FXC) Reported Private Banking1 net revenuesin CHF mn +7%5 (+8% FXC4)
Total Investment Banking1 revenues increasedacross products July 30, 2020 10 4,8084 Fixed IncomeSales & Trading3 EquitySales & Trading3 Advisory &Underwriting2 5,8255 Note: Average USD/CHF exchange rate of 0.9982 for 1H19 and 0.9628 for 1H20 applied1 Includes net revenues from GM, IBCM, APAC Markets and APAC advisory, underwriting and financing as well as M&A, DCM and ECM revenues in SUB C&IC 2 Includes underwriting revenues from GM, advisory andother fees, debt underwriting and equity underwriting revenues from IBCM, advisory, underwriting and financing revenues from APAC WM&C as well as M&A, DCM and ECM revenues in SUB C&IC of USD 31 mn andUSD 57 mn in 1H19 and 1H20, respectively 3 Includes GM and APAC Markets 4 Includes Other revenues from GM and IBCM of USD (195) mn and USD (53) mn, respectively and MtM losses of USD (42) mn in APAC Financing Group (net of USD (61) mn of hedges) 5 Includes Other revenues from GM and IBCM of USD (305) mn and USD (38) mn, respectively and MtM losses of USD (206) mn in APAC Financing Group (net of USD (31) mn of hedges) and USD (78) mn in Leveraged Finance 6 1H20 excludes MtM losses of USD (78) mn in Leveraged Finance and USD (206) mn in APAC Financing Group (net of USD (31) mn of hedges); 1H19 excludes MtM losses of USD (42) mn in APAC Financing Group (net of USD (61) mn of hedges) 7 1H20 excludes MtM losses of USD (39) mn in Leveraged Finance and USD (206) mn in APAC Financing Group (net of USD (31) mn of hedges); 1H19 excludes MtM losses of USD (42) mn in APAC Financing Group (net of USD (61) mn of hedges) 8 1H20 excludes MtM losses of USD (39) mn in Leveraged Finance Total Investment Banking1 net revenuesin USD mn 1H20 vs. 1H19 +43% +13% +5% +21% +45%8 +13% +17%7 +26%6 Excl. MtM Reported
Update on Strategic Initiatives and Structural Refinements 11 July 30, 2020
July 30, 2020 We reaffirm our strategy… 12 A leading Wealth Manager with strong global Investment Banking capabilities Balanced approach between Mature and Emerging MarketsBank for Entrepreneurs focused on UHNWI as core strengthRegional Wealth Management model with proximity to clients
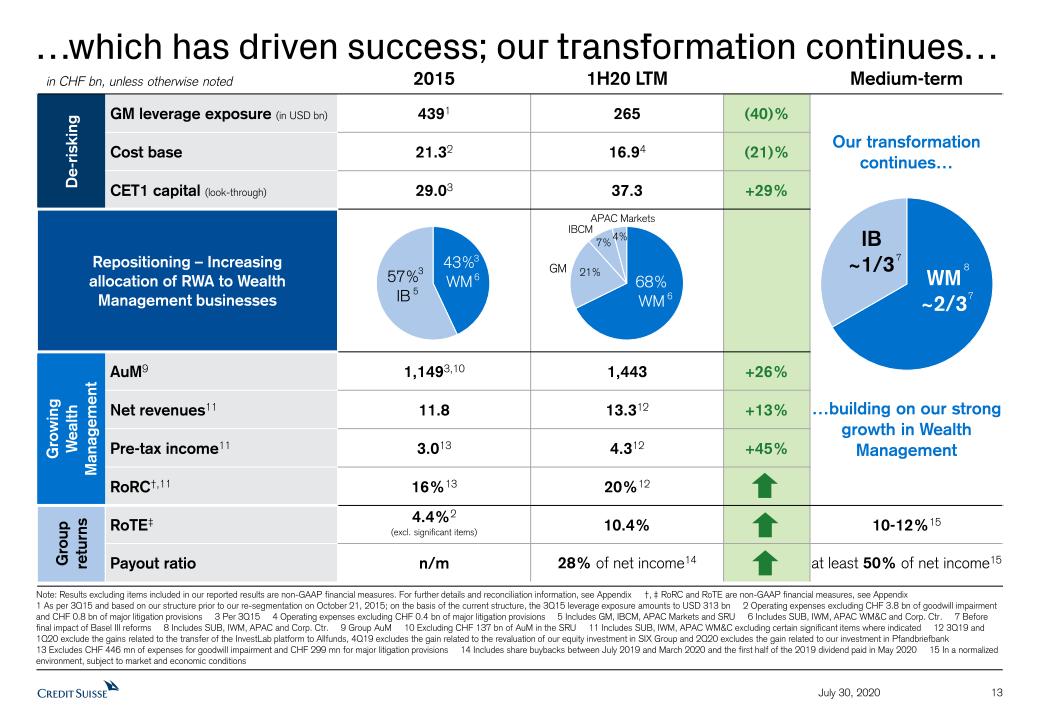
July 30, 2020 13 …which has driven success; our transformation continues… Note: Results excluding items included in our reported results are non-GAAP financial measures. For further details and reconciliation information, see Appendix †, ‡ RoRC and RoTE are non-GAAP financial measures, see Appendix1 As per 3Q15 and based on our structure prior to our re-segmentation on October 21, 2015; on the basis of the current structure, the 3Q15 leverage exposure amounts to USD 313 bn 2 Operating expenses excluding CHF 3.8 bn of goodwill impairment and CHF 0.8 bn of major litigation provisions 3 Per 3Q15 4 Operating expenses excluding CHF 0.4 bn of major litigation provisions 5 Includes GM, IBCM, APAC Markets and SRU 6 Includes SUB, IWM, APAC WM&C and Corp. Ctr. 7 Before final impact of Basel III reforms 8 Includes SUB, IWM, APAC and Corp. Ctr. 9 Group AuM 10 Excluding CHF 137 bn of AuM in the SRU 11 Includes SUB, IWM, APAC WM&C excluding certain significant items where indicated 12 3Q19 and 1Q20 exclude the gains related to the transfer of the InvestLab platform to Allfunds, 4Q19 excludes the gain related to the revaluation of our equity investment in SIX Group and 2Q20 excludes the gain related to our investment in Pfandbriefbank13 Excludes CHF 446 mn of expenses for goodwill impairment and CHF 299 mn for major litigation provisions 14 Includes share buybacks between July 2019 and March 2020 and the first half of the 2019 dividend paid in May 2020 15 In a normalized environment, subject to market and economic conditions in CHF bn, unless otherwise noted 2015 1H20 LTM Medium-term De-risking GM leverage exposure (in USD bn) 4391 265 (40)% Our transformation continues… Cost base 21.32 16.94 (21)% CET1 capital (look-through) 29.03 37.3 +29% Repositioning – Increasing allocation of RWA to Wealth Management businesses GrowingWealthManagement AuM9 1,1493,10 1,443 +26% …building on our strong growth in Wealth Management Net revenues11 11.8 13.312 +13% Pre-tax income11 3.013 4.312 +45% RoRC†,11 16%13 20%12 Groupreturns RoTE‡ 4.4%2(excl. significant items) 10.4% 10-12%15 Payout ratio n/m 28% of net income14 at least 50% of net income15 6 5 6 GM IBCM APAC Markets 8 7 7 3 3
14 July 30, 2020 …and we will optimize our model to drive further upside Fragmented approach leaves room for further upside acrossInvestment Banking activitiesCompliance and Risk functionsSustainability, Research and“House View” Acceleration of digitalizationImportance of sustainabilityGrowth of Private MarketsLower for longer interest ratesReshaping of industries drivingfinancing needs Note: Effective as of August 1, 20201 Equity research across Global Markets and APAC 2 Investment Solutions & Products within IWM 3 Impact Advisory & Finance 4 Full run-rate savings expected from 2022 onward5 Subject to market and economic conditions Secular trends Organizational opportunities Create one global Investment Bankacross GM, IBCM and APAC Markets 1 Combine Risk andCompliance functionscombining CRO and CCO 2 Launch SRI – Sustainability,Research & Investment Solutionscombining Research1, IS&P2, IA&F3and Marketing and Branding 3 Initiatives, together with efficiency measures in SUB and corporate functions, expected to generaterun-rate savings of ~CHF 400 mn p.a.4;allow for reinvestment in full5 Capture revenue opportunities toaccelerate our growth tothe benefit of our clients
July 30, 2020 Three structural refinements driving effectiveness and efficiency 15 Integrate global IB capabilities across GM, IBCM and APAC Markets to achieve critical scaleLeverage globally integrated Equities platform; create Global Trading Solutions (GTS) combining the success of ITS and APAC Solutions; combine Capital Markets origination & execution; integrate IBCM EMEA mid-market capabilities into IWMDrive more dynamic capital allocation, optimize RWA/leverage exposure and generate efficiencyCapture growth opportunities and RoRC† ambition of at least 10% in the medium-term Create one global investment banking division: “Investment Bank” (IB) Combine Risk and Compliance functions under one leadership:“Group Chief Risk and Compliance Officer” (CRCO) Launch new ExB function: “Sustainability, Research & Investment Solutions” (SRI) Build on our progress in the second line of defense organizations and enhance collaboration across Risk and ComplianceLeverage scalability in common technology and data platformsReduce fragmentation and complexity, eliminate duplicationsEnhance effectiveness of control environment across continuum of financial and non-financial risk Integrate and centralize Equity Research (GM/APAC), Investment Solutions & Products (IWM),Impact Advisory & Finance/Sustainability and Marketing/Branding efforts under one roofProvide one single “House View” with Supertrends and sustainability at its coreIncrease connectivity of Research with CIO and sustainability agenda; deliver market-leading thematic insights and content across public and private markets, leveraging dataDrive globally consistent sustainability strategy † RoRC is a non-GAAP financial measure, see Appendix
July 30, 2020 Capture revenue opportunities to accelerate our growth 16 APAC Broaden and deepen our successful coverage of UHNW and entrepreneur clientsGrow wealth-linked strategic solutions, including enhanced financing capabilities and distributionDeepen onshore franchises to tap into faster growing markets and accelerate our China build-out with the aim to take full ownership of our securities JV, Credit Suisse Founder Securities Limited IWM SUB Investment Bank RoRC†ambitionmedium-term Capital allocationmedium-term >20% ~2/31,2 >10% ~1/31 Aim to double revenue growth contribution from UHNW strategic clients over the next3 years3 and strengthen client coverage through integration of IBCM EMEA mid-market capabilitiesMore integrated solution delivery through creation of the International Financing Group Optimize regional PB coverage to create a more effective operating model Build on our leading ‘high-touch’ market positions with HNW / UHNW, institutional and large corporate clientsLeverage our Direct Banking business to transform and grow our ‘high-tech’ business with retail and smaller corporate clients and optimize collaboration with subsidiariesGoal to reduce cost/income-ratio from high-50s to mid-50s in the medium-term Leverage globally integrated platform across Equities, Capital Markets, Advisory,Credit and Global Trading Solutions (GTS)Target growth opportunities across Advisory / M&A, ESG and Private MarketsOptimize resource allocation and generate savings Accelerate our growth † RoRC is a non-GAAP financial measure, see Appendix 1 Before final impact of Basel III reforms 2 Includes SUB, IWM, APAC and Corporate Center 3 Refers to estimated net revenue increase from strategic clients between 2020 to 2022 compared to 2016 to 2018
July 30, 2020 Credit Suisse’s ambition to be a leader in Sustainability 17 1 Between December 31, 2018 and December 31, 2019 2 As of July 24, 2020 3 Between 2010 and end-2019 4 Direct lending 5 Unless such transaction is to help the company specifically transition and the use of proceeds are tied to such transition strategies aligned with the Paris Agreement; for greater certainty, these exclusions do not apply to metallurgical coal 6 Unless company can demonstrate decreasing share of coal in generation portfolio consistent with our Energy Transition Framework or such transaction is to help the company specifically transition and the use of proceeds are tied to such transition strategies (and will continue our policy of not financing the development of new coal-fired power plants) Building on our progress in the lastfew years… …to become a leader in Sustainability across our Wealth Management and Investment Bank client franchises Grow & Enhance:Goal to provide at least CHF 300 bn of sustainable financing (renewables, Green/ Blue/Transition bonds, low-carbon energy solutions and UN SDG-aligned financings) over the next 10 yearsEnhanced consideration of biodiversity in lending and capital market transactions with development of new commitments to be integratedTransition:Reposition corporate oil & gas business by reducing exposure to traditional business in order to align resources to support clients in their ongoing energy transition, including transition bonds, and utilizing our broader Energy Transition Frameworks to guide engagement with high carbon-emitting industriesRestrict:No lending or capital markets underwriting to any company deriving more than 25% of their revenues from thermal coal extraction4,5No lending or capital markets underwriting to any company deriving more than 25% of their revenues from coal power4,6No financing related to offshore and onshore oil & gas projects in the Arctic region Developing leading sustainability client offering Elevating and strengthening governance Making new commitmentsto propel our progress Wealth Management clients (e.g., sustainable mandates and bespoke products)Institutional clients (e.g., world-class Asset Management & capital markets products)Corporate clients (e.g., financing new technologies) Established Executive Board-level function - SRINamed Board of Directors Sustainability LeaderDesignated Sustainability leaders in each division 76% growth1 in sustainable AuM totaling CHF 44 bnBespoke sustainable product launches(e.g., Blue Economy Note, Responsible Consumer Fund, Edutainment Fund & Environmental Impact Fund)15 Green Bond transactions executedin 2020 YTD2 totaling USD 8 bnOver 130 transactions in clean and renewable energy businesses with a value of more than USD 100 bn3~1.5 million people benefited from our investment activities related to financial inclusion in 2019Exclusions including new greenfield thermal coal mines, mountain-top mining and new coal-fired power plantsSignatory to key Principles (e.g., one of the first Equator Principles signatories in 2003, UN Principles of Responsible Banking, Poseidon Principles and IIF Debt Transparency Principles)
July 30, 2020 Financial ambitions 18 RoTE‡ 10-12%1(medium-term) CET1 ratio ~12%2 Capital distribution CET1 leverage ratio The Board of Directors intends to proposethe second half of the 2019 dividendat an EGM on November 27, 20204 The Board of Directors intends toreview the share buyback program subsequent to the EGM4 Expect to distribute at least 50%of net income1 Sustainable ordinary dividend expectedto increase by at least 5% per annum ~4%3 2020: Medium-term: ‡ RoTE is a non-GAAP financial measures, see Appendix 1 In a normalized environment, subject to market and economic conditions 2 By end-2020; before final impact of Basel III reforms 3 By end-2020; including cash held at central banks 4 Subject to market and economic conditions
Detailed Financials 19 July 30, 2020
Results Overview 20 Credit Suisse Group in CHF mn unless otherwise specified 2Q20 1Q20 2Q19 Δ 2Q19 1H20 1H19 Δ 1H19 Net revenues 6,194 5,776 5,581 11% 11,970 10,968 9% o/w Wealth Management-related1 3,383 3,588 3,459 (2)% 6,971 6,820 2% o/w IBCM in USD mn 732 189 455 61% 921 812 13% o/w Markets activities2 in USD mn 2,455 2,154 1,851 33% 4,609 3,620 27% Provision for credit losses 296 568 25 864 106 o/w CECL-related 130 305 435 o/w specific 166 263 429 Total operating expenses 4,347 4,007 4,254 2% 8,354 8,498 (2)% Pre-tax income 1,551 1,201 1,302 19% 2,752 2,364 16% Income tax expense 391 (110) 365 281 678 Effective tax rate 25% (9)% 28% 10% 29% Net income attributable to shareholders 1,162 1,314 937 24% 2,476 1,686 47% Return on tangible equity‡ 11% 13% 10% 12% 9% Diluted earnings per share in CHF 0.46 0.52 0.36 28% 0.98 0.65 51% Note: 2Q20 reported results include a gain related to the equity investment revaluation of Pfandbriefbank. 1Q20 reported results include a gain related to the completed transfer of the InvestLab fund platform to Allfunds Group ‡ RoTE is a non-GAAP financial measure, see Appendix; RoTE figures are rounded up or down to the nearest whole number 1 Includes SUB, IWM and APAC WM&C 2 Includes Global Markets and APAC Markets July 30, 2020
21 July 30, 2020 CET1 ratio increased to 12.5% Key messagesCET1 ratio increased by ~40 bps to 12.5%:Strong earnings generation driving increase in CET1 capitalRWA broadly stable as higher RWA from market risk and CVA inflation as well as rating migrations were offset by reversal of corporate lending drawdowns and lower Leveraged Finance exposureAdditional RWA inflation from phase-in of SA-CCRContinuing to accrue dividend in line with guidance of at least 5% growth per annumOutlookWell prepared for continued economic stress resulting from COVID-19 pandemic; expect CET1 ratio of ~12%by end-20202Extraordinary General Meeting scheduled for November 27, 2020 to approve payout of expected second half of 2019 dividend3Maintain medium-term ambition to distribute at least 50% of net income through dividends and share buybacks4 299 Risk-weighted assets in CHF bn 301 CET1 ratio in % 1 1 Includes impacts from removal of pro-cyclicality buffer, CET1 taxes, RWA internal methodology and OpRisk insurance adjustment, quarterly dividend accrual, other Basel III impacts (Equity Investments in funds and CCP), and impacts from other regulatory CET1 adjustments 2 Before final impact of Basel III reforms 3 Subject to market and economic conditions 4 In a normalized environment, subject to market and economic conditions
22 July 30, 2020 CET1 and Tier 1 leverage ratio increased to 4.5%1 and 6.2%1, respectively Key messagesCET1 leverage ratio increased by ~30 bps to 4.5%1:Strong earnings generation driving increase in CET1 capitalIncreased Liquidity Coverage Ratio (LCR) to 196%3, reflecting conservative approach to liquidity during the COVID-19 pandemicNet leverage exposure reductions primarily driven by Global Markets due to improved netting and reduced margin requirements and failsTier 1 leverage ratio of 6.2%1 improved by ~40 bps compared to 1Q20Outlook CET1 leverage ratio guidance of ~4.0% including cash held at central banks by end-2020, or ~4.5% excluding cash held at central banks 1 In 1Q20 leverage exposure excludes CHF 88 bn of central bank reserves, after adjusting for planned dividend payments in 2Q20 and 4Q20 as required by FINMA; in 2Q20 leverage exposure excludes CHF 104 bn of central bank reserves, after adjusting for the dividend paid in 2Q20 and the planned dividend payment in 4Q20 as required by FINMA 2 Includes QoQ changes in HQLA (excluding cash held at central banks), quarterly dividend accrual, impacts from CET1 taxes and other regulatory CET1 adjustments 3 Calculated using a three-month average, which is calculated on a daily basis CET1 leverage ratio1 in % 6.2% Tier 1 leverage ratio1 5.8% 837 Leverage exposure (excl. CB reserves)1in CHF bn 870 2 940 Leverage exposure (incl. CB reserves) in CHF bn 958
23 July 30, 2020 TBVPS increased during 1H20 driven bynet income generation Tangible book value per share (TBVPS)‡in CHF Key messagesTBVPS‡ increased by CHF 1.02 from net income generation during 1H20Paid first half of the 2019 dividend in MayNet impact related to share-based compensation during 1H20 resulted in TBVPS‡ decline of CHF 0.12Increase in TBVPS‡ as a result of widening credit spreads during 1Q20 mostly reversed during 2Q20; reduction during 2Q20 driving TBVPS‡ decrease from CHF 18.25 as of end-1Q20 to CHF 17.03 in 2Q20Adverse FX impact resulting from the strengthening of the Swiss franc ‡ Tangible book value per share (TBVPS) is a non-GAAP financial measure, see Appendix 1 Reflects impact from share buybacks up to March 13, 2020 and the payment of the first half of the 2019 dividend in May 2020 2 Reflects net impact of settlements of share-based compensation awards and quarterly share plan accruals 3 Reflects impact on tangible shareholders’ equity from own credit movements via other comprehensive income and tax expenses related to own credit movements 4 Includes the impact from amortization of accumulated losses in other comprehensive income related to pension plan re-measurements and the cumulative effect of accounting changes 3 2 CHF 2.5 bngenerated 1 4 17.03 0.71 net increase from own credit movements during 1H20 Own creditmovements 1Q20 2Q20
24 July 30, 2020 Continued cost discipline Note: Adjusted results are non-GAAP financial measures. A reconciliation to reported results is included in the Appendix1 Adjustments include major litigation provisions, restructuring expenses, expenses related to real estate disposals and expenses related to business sales Total operating expenses in CHF bn 9.4 9.0 8.5 8.4 Adjusted operatingexpenses Adjustments1 9.9 Cost developmentIncreased compensation expenses 2Q20 vs. 1Q20 include reversal of own credit volatility and higher variable compensation accrualLower costs in 1H20 include savings on travel & entertainment and professional services feesOutlookExpect adjusted operating expenses of CHF 16.0-16.5 bn for the full year 2020, depending on market and economic conditions
25 July 30, 2020 Our loan book is highly collateralized with a majorityoriginated in Switzerland CHF 296 bn1 Group gross loans by measurement approach 84% of Group loans are collateralized loans held at amortized costsSUB accounts for 59% of Group gross loans; Switzerland has historically had a low credit loss experience compared to other regions2 Source: SNL, Company filings1 Group gross loans per 2Q20 2 Based on provision for credit losses over average loan ratio of banks in Switzerland, the U.S., the UK and Europe (2006 to 1Q20 average). Banks in Switzerland include Banque Cantonale Vaudoise, Credit Suisse, Raiffeisen, UBS, ZKB; banks in the U.S. include Bank of America, Citigroup, JP Morgan, Wells Fargo; banks in the UK include Barclays, Lloyds, RBS; banks in Europe include ABN Amro, BBVA, BNP Paribas, Commerzbank, Crédit Agricole, Deutsche Bank, Erste Group, ING Group, Intesa Sanpaolo, KBC, Nordea, Santander, Société Générale, Unicredit SUB share of Group gross loans CHF 296 bn1 SUB Otherdivisions Held at amortized cost – collateralizedHeld at amortized cost – uncollateralizedHeld at fair value
26 July 30, 2020 Further increase in credit provisions in 2Q20;specific losses remain limited Allowance for credit losses1in CHF mn 1 Includes the allowance for credit losses on financial assets held at amortized cost and provisions for off-balance sheet credit exposures 2 Impact of CECL adoption on January 1, 2020 excluding impact from fair value election 3 Includes net write-offs of CHF (51) mn, FX translation impact and other adjustment items of CHF (13) mn, including CECL impact of CHF (4) mn, and provision for interest of CHF 9 mn 4 Includes net write-offs of CHF (33) mn, FX translation impact and other adjustment items of CHF (14) mn, including CECL impact of CHF (1) mn, and provision for interest of CHF 16 mn 3 1 1 2,001 1 296 CECL Specificprovisions CECL Specificprovisions 4 (55) 1,736 1,223 (31) 813 923 Non-specific Specificprovisions Non-specific Specificprovisions 1,052 949 568 CECL adoption impact2 End-4Q19
27 July 30, 2020 Credit Suisse’s comparative reserves against wholesale exposures of international peers Wholesale - Allowance for loan losses as % of loans1 (excluding fair value and held-for-sale loans) Source: Company filingsNote: Ratios based on local currency 1 Includes specific and portfolio based allowances for credit losses as % of gross loans for wholesale businesses. CS includes Global Markets and IBCM. Peers include Barclays, Bank of America, Citigroup and JP Morgan. Bank of America includes Commercial, Barclays include Wholesale International, Citigroup includes Corporate, JP Morgan includes Wholesale
28 July 30, 2020 Details on restructuring program Restructuring program includes measures taken in relation to:Creation of one global Investment Bank (incl. Global Trading Solutions (GTS) by combining ITS and APAC Solutions)Combination and integration of Risk and Compliance functionsLaunch of SRI capability (Sustainability, Research & Investment Solutions), led at Executive Board levelDigitalization and efficiency initiatives in SUB Scope Duration Restructuring program is expected to be completed within a year Savings & restructuring expenses Expect to generate ~CHF 400 mn of run-rate savings per annumFull run-rate savings expected from 2022 onwardAllow for reinvestment in full, subject to market and economic conditionsExpect to incur total restructuring expenses of ~CHF 300-400 mn over the duration of the program Financial disclosure Restated financials reflecting the new reporting structure expected to be provided at the beginning of October 2020Restructuring expenses related to the program will be disclosed as a separate expense item
Swiss Universal BankStrong performance in a challenging economic environment 29 Key financials in CHF mn 2Q20 1Q20 2Q19 Δ 2Q19 Net revenues 1,504 1,509 1,476 2% Provision for credit losses 30 124 10 o/w CECL-related 3 89 o/w specific 27 35 Total operating expenses 787 796 812 (3)% Pre-tax income 687 589 654 5% Cost/income ratio 52% 53% 55% Return on regulatory capital† 20% 18% 20% PC Key metrics in CHF bn 2Q20 1Q20 2Q19 Δ 2Q19 Net margin in bps 73 59 67 6 Net new assets (1.6) (4.2) 1.2 Mandate penetration 36% 34% 33% Net loans 174 174 171 2% Risk-weighted assets 83 80 77 7% Leverage exposure 272 269 261 4% Note: All percentage changes and comparative descriptions refer to year on year measurements unless otherwise indicated. 2Q20 and 1Q20 reported results include the gains related to the equity investment revaluation of Pfandbriefbank and to the completed transfer of the InvestLab fund platform to Allfunds Group, respectively † RoRC is a non-GAAP financial measure, see Appendix 1 Includes net loans, assets under management and assets under custody (assets held solely for transaction-related or safekeeping/custody purposes) Key messagesPTI of CHF 687 mn included a gain of CHF 134 mn related to a revaluation of our equity investment in Pfandbriefbank; 2Q19 included real estate gains of CHF 87 mn and a special SIX dividend of CHF 29 mnNet revenues up 2%, driven by Pfandbriefbank, higher ITS revenues and increased revenues in our UHNW segmentProvision for credit losses of CHF 30 mn mostly driven by our consumer finance businessOngoing cost discipline leading to a 3% reduction of operating expenses and to a solid cost/income ratio of 52%, down 3 pp.Private Clients Net revenues up 3% driven by the Pfandbriefbank revaluation gain and a strong performance of our UHNW segment with revenues up 12%, partially offset by lower recurring revenues from our investment in Swisscard Client business volume1 up 4% vs. 1Q20 despite net asset outflows of CHF 1.6 bn driven by deleveraging in our UHNW segmentCorporate & Institutional Clients Net revenues stable with increased ITS and investment banking revenues as well as higher fees from lending activities, offsetting lower revenues from FX transactionsNNA of CHF 1.6 bn with continued contribution from our pension fund business July 30, 2020
Swiss Universal BankLast 5 second quarters 30 Net revenues in CHF mn 2Q20 2Q19 2Q16 2Q17 2Q18 Pre-tax income in CHF mn 2Q20 2Q19 2Q16 2Q17 2Q18 Cost/income ratio 2Q20 2Q19 2Q16 2Q17 2Q18 Return on regulatory capital† Assets under management in CHF bn 2Q20 2Q19 2Q16 2Q17 2Q18 SUB PC net margin in bps 2Q20 2Q19 2Q16 2Q17 2Q18 Note: For details on calculations see under ‘Notes’ in the Appendix. 2Q20 reported results include the gain related to the Pfandbriefbank revaluation † RoRC is a non-GAAP financial measure, see Appendix 2Q20 2Q19 2Q16 2Q17 2Q18 July 30, 2020
International Wealth ManagementIncreased client activity offset by CHF strength and higher credit provisions 31 July 30, 2020 Note: All percentage changes and comparative descriptions refer to year on year measurements unless otherwise indicated. 1Q20 reported results include a gain related to the completed transfer of the InvestLab fund platform to Allfunds Group and unrealized losses on seed money in our funds in Asset Management † RoRC is a non-GAAP financial measure, see Appendix Key metrics in CHF bn 2Q20 1Q20 2Q19 Δ 2Q19 Net margin in bps 32 42 37 (5) Net new assets 1.8 3.7 5.5 Number of RM 1,170 1,160 1,180 (1)% Net loans 51 50 54 (6)% Net new assets AM 4.1 0.1 8.6 Risk-weighted assets 46 45 44 6% Leverage exposure 106 101 101 5% PB Key financials in CHF mn 2Q20 1Q20 2Q19 Δ 2Q19 Net revenues 1,274 1,502 1,369 (7)% Provision for credit losses 35 39 9 o/w CECL-related (6) 4 o/w specific 41 35 Total operating expenses 891 926 916 (3)% Pre-tax income 348 537 444 (22)% Cost/income ratio 70% 62% 67% Return on regulatory capital† 21% 34% 29% Key messagesPTI of CHF 348 mn adversely impacted by USD interest rate reduction, FX headwinds, lower AuM and higher credit provisionsNet revenues in 2Q20 include an adverse FX impact of CHF 71 mn (CHF 60 mn in IWM PB); 2Q19 net revenues included a real estate gain of CHF 13 mn in IWM PB. Excluding these items, net revenues were down 1% for IWM and stable for IWM PBIncreased brokerage and structured product issuance fees benefitting from higher industry-wide transaction volumes and proactive client engagementPrivate BankingPTI of CHF 268 mn amid adverse markets, FX impact and higher credit provisionsNet interest income primarily reflects lower USD interest rates; recurring commissions and fees impacted by adverse market and FX movementsTransaction revenues included significantly higher client activity and ITS revenues, while 2Q19 included the special SIX dividend of CHF 18 mnNNA of CHF 1.8 bn with contributions from emerging markets and Europe; 1H20 NNA of CHF 5.5 bn, annualized growth rate of 3%Asset ManagementPTI of CHF 80 mn included unrealized gains of CHF 20 mn on seed money investments, partially recovering the unrealized losses made in 1Q20; 2Q19 included a sale gain from a PE investmentLower management fees primarily reflect a reduction in transaction feesNNA of CHF 4.1 bn with strong institutional inflows, driven by Index Solutions and Credit
International Wealth ManagementLast 5 second quarters 32 Net revenues in CHF mn 2Q20 2Q19 2Q16 2Q17 2Q18 Pre-tax income in CHF mn 2Q20 2Q19 2Q16 2Q17 2Q18 2Q20 2Q19 2Q16 2Q17 2Q18 Return on regulatory capital† 2Q20 2Q19 2Q16 2Q17 2Q18 Assets under management1 in CHF bn 2Q20 2Q19 2Q16 2Q17 2Q18 IWM PB net margin in bps 2Q20 2Q19 2Q16 2Q17 2Q18 Cost/income ratio Note: For details on calculations see under ‘Notes’ in the Appendix † RoRC is a non-GAAP financial measure, see Appendix 1 Before elimination of assets managed by Asset Management on behalf of IWM PB clients July 30, 2020
Asia PacificStrong pre-tax income despite higher credit provisions 33 July 30, 2020 Note: All percentage changes and comparative descriptions refer to year on year measurements unless otherwise indicated. 1Q20 reported results include a gain related to the completed transfer of the InvestLab fund platform to Allfunds Group † RoRC is a non-GAAP financial measure, see Appendix 1 APAC PB within WM&C 2 Dealogic for January 1, 2020 to June 30, 2020 (APAC excl. Japan and China onshore among International banks) 3 All references under Markets are based on USD PB1 Key metrics in CHF bn 2Q20 1Q20 2Q19 Δ 2Q19 Net margin in bps 26 48 30 (4) Net new assets 4.5 3.0 2.5 Number of RM 620 620 600 3% Assets under management 216 197 215 1% Net loans 40 43 45 (11)% Risk-weighted assets 36 38 37 (2)% Leverage exposure 109 110 112 (3)% Key financials in CHF mn 2Q20 1Q20 2Q19 Δ 2Q19 Net revenues 1,064 1,025 913 17% Provision for credit losses 81 97 (1) o/w CECL-related 1 13 o/w specific 80 84 Total operating expenses 685 676 677 1% Pre-tax income 298 252 237 26% Cost/income ratio 64% 66% 74% Return on regulatory capital† 22% 18% 17% Key messagesHighest level of quarterly revenues and PTI since 2015; record RoRC† of 22%Strong Markets and APAC IBCM performance offsetting credit provisionsPositive operating leverage with revenues up 17% and expenses broadly stable, leading to a cost/income ratio of 64%Wealth Management & Connected (WM&C)PTI of CHF 123 mn includes CHF 33 mn of unrealized MtM gains on the fair valued lending portfolio in financing offset by hedging losses of CHF 72 mnProvision for credit losses higher at CHF 79 mn, primarily related to four single cases across various industriesLower PB recurring commissions and fees and NII, offsetting higher transaction-based revenues Higher Advisory, Underwriting and Financing revenues reflecting increased Equity related activity; APAC IBCM ranked #1 in 1H202Continued positive NNA generation of CHF 4.5 bn in the quarter (9% growth rate) bringing 1H20 NNA to CHF 7.5 bnMarkets3Strong revenues reflecting favorable market conditions and higher client activity; highest revenues since 1Q16Net revenues up 60% with Fixed Income up 151% mainly from emerging markets rates, Credit and FX; Equity sales and trading increased 23%, driven by cash equities and equity derivatives
Asia PacificLast 5 second quarters 34 Net revenues in CHF mn 2Q20 2Q19 2Q16 2Q17 2Q18 Pre-tax income in CHF mn 2Q20 2Q19 2Q16 2Q17 2Q18 Cost/income ratio 2Q20 2Q19 2Q16 2Q17 2Q18 Return on regulatory capital† 2Q20 2Q19 2Q16 2Q18 Assets under management in CHF bn 2Q20 2Q19 2Q16 2Q17 2Q18 APAC PB1 net margin in bps 2Q20 2Q19 2Q16 2Q17 2Q18 Note: For details on calculations see under ‘Notes’ in the Appendix † RoRC is a non-GAAP financial measure, see Appendix 1 APAC PB within WM&C 2Q17 July 30, 2020
Investment Banking & Capital Markets Strong activity across all products driving record profitability 35 Note: All percentage changes and comparative descriptions refer to year on year measurements unless otherwise indicated † RoRC is a non-GAAP financial measure, see Appendix 1 Reported net revenues include MtM losses in Leveraged Finance of USD 147 mn in 1Q20 and MtM gains of USD 108 mn in 2Q20; figures reflect 50% from the JV of GM and IBCM. MtM gains/(losses) on uncollateralized Corporate Derivatives exposure of USD 33 mn in 2Q20, USD (51) mn in 1Q20 and USD (11) mn in 2Q19 2 Dealogic for the quarter ending June 30, 2020 (Americas and EMEA) 3 Reflects 50% from the JV of GM and IBCM 4 Return on leverage exposure is a non-GAAP financial measure and calculated using income after tax applying an assumed tax rate of 30% and 3.5% of average leverage exposure based on USD 5 GM and IBCM Leveraged Finance underwriting portfolio of USD 3.0 bn compared to USD 7.3 bn in 1Q20 and USD 11.4 bn in 2Q19 Key metrics in USD bn 2Q20 1Q20 2Q19 Δ 2Q19 Risk-weighted assets 24 26 27 (12)% Leverage exposure 49 45 44 11% Key financials in USD mn 2Q20 1Q20 2Q19 Δ 2Q19 Net revenues 732 189 455 61% Provision for credit losses 69 161 – o/w CECL-related 62 99 o/w specific 7 62 Total operating expenses 451 420 447 1% Pre-tax income/(loss) 212 (392) 8 n/m Cost/income ratio 62% 222% 98% Return on regulatory capital† 24% n/m 1% Key messagesRevenues of USD 732 mn, up 61% and 27%1 ex-Leveraged Finance MtM and net gains of USD 33 mn for hedges on uncollateralized Corporate Derivatives exposure; revenue increase driven by strong client activity across Advisory and Underwriting businesses, outperforming the Street2; #6 ranking with improved SoW2 Equity underwriting up 65% on strong follow-on and convertible performance; #1 ranking in IPO in 2Q and 1H202Significant share gains in our M&A business with revenues up 32%, reflecting strong conversion of announced deals, outperforming the Street, which was down 22%2Debt underwriting up 83% including MtM gains and strong investment grade activity; #1 ranking in Leveraged Loans273% recovery of 1Q20 MtM losses of USD 147 mn3 in Leveraged Finance driven by improved credit spreads and completed syndicationsProvision for credit losses lower than in 1Q20 reflecting lower specific provisions and updated economic forecasts impacting CECL reservesSignificant increase in PTI to USD 212 mn; achieved RoRC† of 24% and return on leverage exposure of 36%4, highlighting the strength of our franchise RWA decreased 10% compared to 1Q20 driven by lower Leveraged Finance5 commitment syndications, repayments in the Corporate Bank and business mitigations July 30, 2020
Investment Banking & Capital Markets Last 5 second quarters 36 Net revenues in USD mn 2Q20 2Q19 2Q16 2Q17 2Q18 Pre-tax income in USD mn 2Q20 2Q19 2Q16 2Q17 2Q18 Cost/income ratio 2Q20 2Q19 2Q16 2Q17 2Q18 Return on regulatory capital† 2Q20 2Q19 2Q17 2Q18 Advisory and other fees in USD mn 2Q20 2Q19 2Q16 2Q17 2Q18 Underwriting revenues1 in USD mn 2Q20 2Q19 2Q16 2Q17 2Q18 † RoRC is a non-GAAP financial measure, see Appendix 1 Includes debt underwriting and equity underwriting 2Q16 July 30, 2020
Global MarketsPTI of USD 615 mn, up 71% with RoRC† of 17% in 2Q20 Note: All percentage changes and comparative descriptions refer to year on year measurements unless otherwise indicated † RoRC is a non-GAAP financial measure, see Appendix 1 Includes sales and trading and underwriting 2 Return on RWA is a non-GAAP financial measure and calculated using income after tax applying an assumed tax rate of 30% and 10% of average RWA based on USD 3 Dealogic for the quarter ending June 30, 2020 (Americas and EMEA) 4 Reflects 50% from the JV of GM and IBCM 5 Third Party Competitive analysis; 1Q20 vs. 1Q19 37 Key messagesPTI of USD 615 mn, up 71%; achieved RoRC† of 17% and RoRWA of 25%2 highlighting strength of our diversified and de-risked franchise Robust ITS revenues reflecting continued momentum with wealth and institutional clients and higher collaborationStrong Fixed Income revenues, up 42%, driven by higher trading activity, market share gains3 and 73% recovery of 1Q20 unrealized MtM losses of USD 147 mn4 in Leveraged FinanceResilient Equities revenues driven by share gains in cash trading5 and underwriting3Provision for credit losses declined compared to 1Q20 reflecting lower specific provisions and updated economic forecasts impacting CECL reservesOperating expenses increased 8% reflecting higher compensation and revenue-related expenses partially offset by efficiency savingsRWA declined vs. 1Q20 reflecting a reversal of drawdowns in corporate lending, business mitigations and reduced market volatility; leverage exposure declined reflecting improved netting and reduced margin requirements and fails Key metrics in USD bn 2Q20 1Q20 2Q19 Δ 2Q19 Risk-weighted assets 65 72 60 9% Leverage exposure 265 304 260 2% Key financials in USD mn 2Q20 1Q20 2Q19 Δ 2Q19 Equities1 572 694 574 - Fixed Income1 1,530 1,177 1,075 42% Other (123) (182) (96) Net revenues 1,979 1,689 1,553 27% Provision for credit losses 80 156 2 o/w CECL-related 73 103 o/w specific 7 53 Total operating expenses 1,284 1,191 1,192 8% Pre-tax income 615 342 359 71% Cost/income ratio 65% 71% 77% Return on regulatory capital† 17% 10% 11% July 30, 2020
Global MarketsLast 5 second quarters 38 Net revenues in USD mn 2Q20 2Q19 2Q16 2Q17 2Q18 Pre-tax income in USD mn 2Q20 2Q19 2Q16 2Q17 2Q18 2Q20 2Q19 2Q16 2Q17 2Q18 Return on regulatory capital† 2Q20 2Q19 2Q17 2Q18 Fixed income sales and trading in USD mn 2Q20 2Q19 2Q16 2Q17 2Q18 Equity sales and trading in USD mn 2Q20 2Q19 2Q16 2Q17 2Q18 2Q16 † RoRC is a non-GAAP financial measure, see Appendix Cost/income ratio July 30, 2020
CEO Summary 39 July 30, 2020
40 July 30, 2020 Improving returns; priorities going forward Return on tangible equity (RoTE)‡ and tangible book value per share (TBVPS)‡ ‡ ‡ Jun-18 Dec-18 Jun-19 Dec-19 Jun-20 Priorities for the full year 2020 and beyondContinue to support our clients, employees and the community through the crisisCreate shareholder value by delivering our mid-term financial and capital distribution targetsSuccessful execution of organizational changesContinue to invest in growthDrive sustainability agenda ‡ Return on tangible equity (RoTE) and Tangible book value per share (TBVPS) are non-GAAP financial measures, see Appendix
Appendix 41 July 30, 2020
Executive Board structure July 30, 2020 Group CEOT. Gottstein Swiss Universal BankA. Helfenstein International Wealth ManagementP. Wehle Asia PacificH. Sitohang Investment BankB. Chin Business Divisions Corporate Functions Chief Operating OfficerJ. Walker Human ResourcesA. Poschung General CounselR. Cerutti Chief Financial OfficerD. Mathers Group Chief Risk and Compliance OfficerL. Warner Sustainability, Research & Investment SolutionsL. Hudson 42 Note: Effective as of August 1, 2020
High-level overview of changes to reporting units 43 July 30, 2020 Credit Suisse Swiss Universal Bank Private Clients Corporate & Institutional Clients InternationalWealthManagement Private Banking Asset Management AsiaPacific(APAC) Wealth Management & Connected Markets Global Markets(GM) InvestmentBanking &Capital Markets(IBCM) CorporateCenter Credit Suisse Swiss Universal Bank Private Clients Corporate & Institutional Clients InternationalWealthManagement Private Banking Asset Management AsiaPacific(APAC) InvestmentBank CorporateCenter From: To: Separate reporting unit Restated financials reflecting the new reporting structure expected to be provided at the beginning of October 2020
Swiss Universal BankPrivate Clients and Corporate & Institutional Clients 44 Corporate & Institutional Clients Key financials in CHF mn 2Q20 1Q20 2Q19 Δ 2Q19 Net interest income 304 297 303 - Recurring commissions & fees 168 170 165 2% Transaction-based 193 230 195 (1)% Other revenues (17) 14 (15) Net revenues 648 711 648 - Provision for credit losses 2 112 – o/w CECL-related (9) 86 o/w specific 11 26 Total operating expenses 325 321 350 (7)% Pre-tax income 321 278 298 8% Cost/income ratio 50% 45% 54% Key metrics in CHF bn 2Q20 1Q20 2Q19 Δ 2Q19 Net margin in bps 73 59 67 6 Net new assets (1.6) (4.2) 1.2 Mandate penetration 36% 34% 33% Assets under management 202 195 215 (6)% Number of RM 1,330 1,320 1,290 3% Key metrics in CHF bn 2Q20 1Q20 2Q19 Δ 2Q19 Net new assets 1.6 4.8 8.9 Assets under management 427 405 411 4% Number of RM 480 490 520 (8)% Private Clients Key financials in CHF mn 2Q20 1Q20 2Q19 Δ 2Q19 Net interest income 428 441 419 2% Recurring commissions & fees 179 204 202 (11)% Transaction-based 118 155 120 (2)% Other revenues 131 (2) 87 Net revenues 856 798 828 3% Provision for credit losses 28 12 10 o/w CECL-related 12 3 o/w specific 16 9 Total operating expenses 462 475 462 - Pre-tax income 366 311 356 3% Cost/income ratio 54% 60% 56% Note: 2Q20 and 1Q20 reported results include the gains related to the Pfandbriefbank revaluation and the completed transfer of InvestLab, respectively July 30, 2020
International Wealth ManagementPrivate Banking and Asset Management 45 Private Banking Key financials in CHF mn 2Q20 1Q20 2Q19 Δ 2Q19 Net interest income 345 369 372 (7)% Recurring commissions & fees 276 294 295 (6)% Transaction- and perf.-based 299 387 310 (4)% Other revenues (1) 11 12 Net revenues 919 1,061 989 (7)% Provision for credit losses 33 39 7 o/w CECL-related (6) 4 o/w specific 39 35 Total operating expenses 618 647 642 (4)% Pre-tax income 268 375 340 (21)% Cost/income ratio 67% 61% 65% Key metrics in CHF bn 2Q20 1Q20 2Q19 Δ 2Q19 Net margin in bps 32 42 37 (5) Net new assets 1.8 3.7 5.5 Assets under management 345 328 363 (5)% Mandate penetration 34% 34% 34% Net loans 51 50 54 (6)% Number of RM 1,170 1,160 1,180 (1)% Asset Management Key financials in CHF mn 2Q20 1Q20 2Q19 Δ 2Q19 Management fees 251 269 284 (12)% Performance & placement rev. 46 (35) 30 53% Investment & partnership income 58 207 66 (12)% Net revenues 355 441 380 (7)% Provision for credit losses 2 - 2 o/w CECL-related - - o/w specific 2 - Total operating expenses 273 279 274 - Pre-tax income 80 162 104 (23)% Cost/income ratio 77% 63% 72% Key metrics in CHF bn 2Q20 1Q20 2Q19 Δ 2Q19 Net new assets 4.1 0.1 8.6 Assets under management 424 410 414 2% Note: 1Q20 reported results include the gain related to the completed transfer of InvestLab July 30, 2020
Asia PacificWealth Management & Connected and Markets 46 Note: 1Q20 reported results include the gain related to the completed transfer of InvestLab † RoRC is a non-GAAP financial measure, see Appendix 1 APAC PB within WM&C Wealth Management & Connected Key financials in CHF mn 2Q20 1Q20 2Q19 Δ 2Q19 Private Banking 412 541 437 (6)% Adv., Underwr. and Financing 193 36 177 9% Net revenues 605 577 614 (1)% Provision for credit losses 79 96 6 o/w CECL-related - 13 o/w specific 79 83 Total operating expenses 403 396 392 3% Pre-tax income 123 85 216 (43)% Cost/income ratio 67% 69% 64% Return on regulatory capital† 14% 9% 22% Risk-weighted assets in CHF bn 24 26 27 (13)% Leverage exposure in CHF bn 57 62 63 (9)% Markets Key financials in USD mn 2Q20 1Q20 2Q19 Δ 2Q19 Equity sales & trading 260 245 212 23% Fixed income sales & trading 216 220 86 151% Net revenues 476 465 298 60% Provision for credit losses 2 1 (7) o/w CECL-related 1 - o/w specific 1 1 Total operating expenses 292 291 284 3% Pre-tax income 182 173 21 767% Cost/income ratio 61% 63% 95% Return on regulatory capital† 28% 27% 3% Risk-weighted assets in USD bn 13 13 10 33% Leverage exposure in USD bn 54 50 50 8% Private Banking1 revenue details in CHF mn 2Q20 1Q20 2Q19 Δ 2Q19 Net interest income 153 173 168 (9)% Recurring commissions & fees 84 100 106 (21)% Transaction-based revenues 174 242 163 7% Other revenues 1 26 - Net revenues 412 541 437 (6)% July 30, 2020
Wealth Management businessesNNA generation 1 APAC PB within WM&C 47 IWM PB NNA in CHF bn NNA growth (annualized) 2% SUB PC NNA in CHF bn NNA growth (annualized) (3)% 2Q20 2Q20 NNA growth (annualized) 9% APAC PB1 NNA in CHF bn 2Q20 5% 5% 1% 3% 4% 6% 1% 4% (8)% 2% (1)% (1)% 1Q20 2Q19 3Q19 4Q19 1Q20 2Q19 3Q19 4Q19 1Q20 2Q19 3Q19 4Q19 (4.2) July 30, 2020
Wealth Management businessesNet and gross margins 48 July 30, 2020 Note: For details on calculations see under ‘Notes’ at the end of this Appendix. 2Q20 reported results include the gain related to the equity investment revaluation of Pfandbriefbank. 3Q19 and 1Q20 reported results include the gains related to the completed transfer of InvestLab. 4Q19 reported results include the SIX equity investment revaluation gain. Results excluding items included in our reported results are non-GAAP financial measures. For further details and reconciliation information, see Appendix 1 APAC PB within WM&C 358 211 375 311 1,061 798 Average AuM in CHF bn 258 Pre-tax income in CHF mn 541 Net revenues in CHF mn 428 534 412 437 144 273 138 165 1,194 1,066 919 989 495 428 268 340 371 365 338 363 985 715 856 828 495 251 366 356 217 215 200 213 214 219 215 208 217 IWM PB Net margin in bps Gross margin in bps APAC PB1 Net margin in bps Gross margin in bps 2Q20 1Q20 3Q19 2Q19 4Q19 2Q20 1Q20 3Q19 2Q19 4Q19 117 47 99 2Q20 1Q20 3Q19 2Q19 4Q19 2Q20 1Q20 3Q19 2Q19 4Q19 53 129 InvestLab transfer / SIX revaluation / Pfandbriefbank revaluation 51 42 119 101 48 SUB PC Net margin in bps Gross margin in bps 2Q20 1Q20 3Q19 2Q19 4Q19 2Q20 1Q20 3Q19 2Q19 4Q19 91 182 73 171
49 Corporate Center 1 ‘Other revenues’ primarily include required elimination adjustments associated with trading in own shares, treasury commissions charged to divisions, the cost of certain hedging transactions executed in connection with the Group's RWAs and valuation hedging impacts from long-dated legacy deferred compensation and retirement programs mainly relating to former employees 2 Excludes CHF 104 bn of central bank reserves, after adjusting for the dividend paid in 2Q20 and the planned dividend payment in 4Q20 as required by FINMA 3 Excludes CHF 88 bn of central bank reserves, after adjusting for planned dividend payments in 2Q20 and 4Q20 as required by FINMA ARU within Corp. Ctr. Key financials in CHF mn unless otherwise specified 2Q20 1Q20 2Q19 Net revenues (39) (57) (24) Provision for credit losses (2) - 4 Total operating expenses 39 37 65 Pre-tax income / (loss) (76) (94) (93) Risk-weighted assets in USD bn 11 9 9 RWA excl. operational risk in USD bn 10 7 7 Leverage exposure in USD bn 25 27 29 Corporate Center Key metrics in CHF bn 2Q20 1Q20 2Q19 Total assets 150 133 118 Risk-weighted assets 50 42 49 Leverage exposure 522 523 126 Corporate Center Key financials in CHF mn 2Q20 1Q20 2Q19 Treasury results (264) (49) (208) Asset Resolution Unit (39) (57) (24) Other1 52 33 48 Net revenues (251) (73) (184) Provision for credit losses 6 3 4 o/w CECL-related 1 3 o/w specific 5 - Compensation and benefits 123 (59) 103 G&A expenses 176 88 89 Commission expenses 19 24 16 Total other operating expenses 195 112 105 Total operating expenses 318 53 208 Pre-tax income / (loss) (575) (129) (396) July 30, 2020
50 July 30, 2020 Further reduction of Oil & Gas andLeveraged Finance exposures Oil & Gas exposure1in USD bn Leveraged Finance exposure2in USD bn (18)% (74)% 1 Oil & Gas net lending exposure in Corporate Bank 2 Represents non-Investment Grade underwriting exposure 11.7 7.3 7.7 2.9Non-IG 4.8IG 3.0 7.5 3.4Non-IG
51 Reconciliation of significant items (1/4) Results excluding the significant items noted below are non-GAAP financial measures. Management believes that these provide a useful presentation of our operating results for purposes of assessing our Group and divisional performance, on a basis that excludes items that management does not consider representative of our underlying performance. Provided below is a reconciliation to the most directly comparable US GAAP measures. July 30, 2020 1 SUB, IWM and APAC WM&C Group in CHF mn 1H20 LTM 2015 Total operating expenses reported 17,296 25,895 Goodwill impairment - (3,797) Major litigation provisions (433) (820) Cost base 16,863 21,278 Wealth Management1 SUB IWM APAC WM&C in CHF mn 1H20 LTM 2015 1H20 LTM 2015 1H20 LTM 2015 1H20 LTM 2015 Net revenues reported 14,549 11,779 6,178 5,721 5,877 4,552 2,494 1,506 o/w related to InvestLab transfer 595 - 123 - 349 - 123 - o/w related to SIX revaluation 498 - 306 - 192 - - - o/w Pfandbriefbank gain 134 - 134 - - - - - Net revenues excl. one-offs 13,322 11,779 5,615 5,721 5,336 4,552 2,371 1,506 Provision for credit losses 538 174 225 138 104 5 209 31 Total operating expenses reported 8,476 9,375 3,184 3,908 3,717 3,824 1,575 1,643 Pre-tax income reported 5,535 2,230 2,769 1,675 2,056 723 710 (168) o/w Goodwill impairment (2015) - (446) - - - - - (446) o/w Major litigation (2015) - (299) - (25) - (268) - (6) Pre-tax income excl. one-offs, goodwill impairment and major litigation 4,308 2,975 2,206 1,700 1,515 991 587 284
52 July 30, 2020 Reconciliation of significant items (2/4) Results excluding the significant items noted below are non-GAAP financial measures. Management believes that these provide a useful presentation of our operating results for purposes of assessing our Group and divisional performance, on a basis that excludes items that management does not consider representative of our underlying performance. Provided below is a reconciliation to the most directly comparable US GAAP measures. in CHF mn unless otherwise specified 2015 Income/(loss) from continuing operations before taxes (2,422) Impact from Goodwill impairment 3,797 Impact from major litigation provisions 820 Income/(loss) from continuing operations before taxes before Goodwill impairment and major litigation provisions 2,195 Income tax expense 523 Impact from Goodwill impairment - Impact from major litigation provisions 134 Income tax expense excl. Goodwill impairment and major litigation provisions 657 Net income attributable to shareholders (2,944) Impact from Goodwill impairment 3,797 Impact from major litigation provisions 686 Net income attributable to shareholders excl. Goodwill impairment and major litigation provisions 1,539 Reported return on tangible equity (8.4)% Return on tangible equity excl. Goodwill impairment and major litigation provisions 4.4%
53 Reconciliation of significant items (3/4) Results excluding the significant items noted below are non-GAAP financial measures. Management believes that these provide a useful presentation of our operating results for purposes of assessing our Group and divisional performance, on a basis that excludes items that management does not consider representative of our underlying performance. Provided below is a reconciliation to the most directly comparable US GAAP measures. July 30, 2020 Private Banking1 SUB PC IWM PB APAC PB in CHF mn 2Q20 2Q19 1H20 1H19 2Q20 2Q19 1H20 1H19 2Q20 2Q19 1H20 1H19 2Q20 2Q19 1H20 1H19 Net revenues reported 2,187 2,254 4,587 4,413 856 828 1,654 1,570 919 989 1,980 2,008 412 437 953 835 o/w FX impact (85) - (165) - (6) - (12) - (60) - (111) - (19) - (42) - Net revenues reported excl. FX 2,272 2,254 4,752 4,413 862 828 1,666 1,570 979 989 2,091 2,008 431 437 995 835 IWM IWM PB in CHF mn 2Q20 2Q19 2Q20 2Q19 Net revenues reported 1,274 1,369 919 989 o/w Real estate gains - 13 - 13 Net revenues excl. one-offs 1,274 1,356 919 976 o/w FX impact (71) - (60) - Net revenues excl. one-offs & FX 1,345 1,356 979 976 WM-related2 in CHF mn 2Q20 2Q19 Net revenues reported 3,383 3,459 o/w FX impact (116) - Net revenues reported excl. FX 3,499 3,459 1 SUB PC, IWM PB and APAC PB within WM&C 2 SUB, IWM and APAC WM&C
54 Reconciliation of significant items (4/4) Results excluding the significant items noted below are non-GAAP financial measures. Management believes that these provide a useful presentation of our operating results for purposes of assessing our Group and divisional performance, on a basis that excludes items that management does not consider representative of our underlying performance. Provided below is a reconciliation to the most directly comparable US GAAP measures. July 30, 2020 SUB PC in CHF mn 2Q20 4Q19 Net revenues reported 856 985 o/w related to InvestLab transfer - - o/w related to SIX revaluation - 149 o/w Pfandbriefbank gain 134 - Net revenues excl. one-offs 722 836 Provision for credit losses 28 11 Total operating expenses reported 462 479 Pre-tax income reported 366 495 Pre-tax income excl. one-offs 232 346 Average AuM in CHF bn 200.2 216.8 Gross margin reported in bps 171 182 Gross margin excl. one-offs in bps 144 154 Net margin reported in bps 73 91 Net margin excl. one-offs in bps 46 64 IWM PB 1Q20 4Q19 3Q19 1,061 1,194 1,066 15 - 131 - 192 - - - - 1,046 1,002 935 39 16 15 647 683 623 375 495 428 360 303 297 358.1 370.6 364.5 119 129 117 117 108 103 42 53 47 40 33 33 APAC PB 1Q20 3Q19 541 534 25 98 - - - - 516 436 2 - 281 261 258 273 233 175 213.8 214.9 101 99 97 81 48 51 44 33
55 Reconciliation of adjustment items Adjusted results are non-GAAP financial measures that exclude certain items included in our reported results. During the implementation of our strategy, it was important to measure the progress achieved by our underlying business performance. Management believes that adjusted results provide a useful presentation of our operating results for purposes of assessing our Group and divisional performance consistently over time, on a basis that excludes items that management does not consider representative of our underlying performance. Provided below is a reconciliation of our adjusted results to the most directly comparable US GAAP measures. July 30, 2020 Group in CHF mn 1H20 1H19 1H18 1H17 1H16 Total operating expenses reported 8,354 8,498 9,004 9,352 9,909 Restructuring expenses - - (319) (206) (346) Major litigation provisions (79) (35) (140) (130) - Expenses related to real estate disposals 2 (51) - - - Expenses related to business sales - - (1) - - Total operating expenses adjusted 8,277 8,412 8,544 9,016 9,563
56 July 30, 2020 Currency mix & Group capital metrics Credit Suisse Group results Applying a +/- 10% movement on the average FX rates for 2Q20 LTM, the sensitivities are:USD/CHF impact on LTM pre-tax income by CHF +402 / (402) mnEUR/CHF impact on LTM pre-tax income by CHF +204 / (204) mn Sensitivity analysis on Group results2 1 Total expenses include provisions for credit losses 2 Sensitivity analysis based on weighted average exchange rates of USD/CHF of 0.98 and EUR/CHF of 1.08 for the 2Q20 LTM results 3 Data based on June 2020 month-end currency mix 4 Reflects actual capital positions in consolidated Group legal entities (net assets) including net asset hedges less applicable Basel III regulatory adjustments (e.g. goodwill) 2Q20 LTMin CHF mn Contribution Swiss Universal Bank International Wealth Management Asia Pacific Global Markets Investment Banking & Capital Markets Group results CHF USD EUR GBP Other Net revenues 23,486 25% 47% 12% 3% 13%Total expenses1 18,378 31% 38% 4% 9% 18% Net revenues 6,178 78% 15% 4% 1% 2%Total expenses1 3,409 82% 11% 2% 2% 3% Net revenues 5,877 18% 54% 17% 2% 9%Total expenses1 3,821 44% 27% 9% 7% 13% Net revenues 3,912 1% 37% 5% 2% 55%Total expenses1 2,880 7% 20% -% 1% 72% Net revenues 6,258 5% 64% 20% 7% 4%Total expenses1 5,020 7% 58% 5% 20% 10% Net revenues 1,741 - 91% 6% 2% 1%Total expenses1 1,992 1% 77% 5% 12% 5% Currency mix capital metric3 A 10% strengthening / weakening of the USD (vs. CHF) would have a +0.1 bps / (0.1) bps impact on theBIS CET1 ratio Basel III Risk-weighted assets Swiss leverage exposure CHF EUR Other USD USD CET1 capital 4 CHF
Notes 57 July 30, 2020 General notesThroughout the presentation rounding differences may occurUnless otherwise noted, all CET1 capital, CET1 ratio, Tier 1 leverage ratio, risk-weighted assets and leverage exposure figures shown in this presentation are as of the end of the respective period and, for periods prior to 2019, on a “look-through” basisGross and net margins are shown in basis pointsGross margin = net revenues annualized / average AuM; net margin = pre-tax income annualized / average AuM. Net margin excluding certain significant items, as disclosed herein, is calculated excluding those items applying the same methodologyMandate penetration reflects advisory and discretionary mandate volumes as a percentage of AuM, excluding those from the external asset manager businessSpecific notes† Regulatory capital is calculated as the worst of 10% of RWA and 3.5% of leverage exposure. Return on regulatory capital (a non-GAAP financial measure) is calculated using income / (loss) after tax and assumes a tax rate of 30% and capital allocated based on the worst of 10% of average RWA and 3.5% of average leverage exposure. For the Markets business within the APAC division and for the Global Markets and Investment Banking & Capital Markets divisions, return on regulatory capital is based on US dollar denominated numbers. Return on regulatory capital excluding certain significant items, as disclosed herein, is calculated excluding those items applying the same methodology.‡ Return on tangible equity is based on tangible shareholders’ equity, a non-GAAP financial measure, which is calculated by deducting goodwill and other intangible assets from total shareholders’ equity as presented in our balance sheet. Tangible book value, a non-GAAP financial measure, is equal to tangible shareholders’ equity. Tangible book value per share is a non-GAAP financial measure, which is calculated by dividing tangible shareholders' equity by total number of shares outstanding. Management believes that tangible shareholders’ equity/tangible book value, return on tangible equity and tangible book value per share are meaningful as they are measures used and relied upon by industry analysts and investors to assess valuations and capital adequacy. For end-4Q15, tangible shareholders’ equity excluded goodwill of CHF 4,808 mn and other intangible assets of CHF 196 mn from total shareholders’ equity of CHF 44,382 mn as presented in our balance sheet.For end-2Q16, tangible shareholders’ equity excluded goodwill of CHF 4,745 mn and other intangible assets of CHF 191 mn from total shareholders’ equity of CHF 44,962 mn as presented in our balance sheet. For end-2Q17, tangible shareholders’ equity excluded goodwill of CHF 4,673 mn and other intangible assets of CHF 195 mn from total shareholders’ equity of CHF 43,493 mn as presented in our balance sheet. For end-2Q18, tangible shareholders’ equity excluded goodwill of CHF 4,797 mn and other intangible assets of CHF 212 mn from total shareholders’ equity of CHF 43,470 mn as presented in our balance sheet. For end-4Q18, tangible shareholders’ equity excluded goodwill of CHF 4,766 mn and other intangible assets of CHF 219 mn from total shareholders’ equity of CHF 43,922 mn as presented in our balance sheet. For end-2Q19, tangible shareholders’ equity excluded goodwill of CHF 4,731 mn and other intangible assets of CHF 216 mn from total shareholders’ equity of CHF 43,673 mn as presented in our balance sheet. For end-3Q19, tangible shareholders’ equity excluded goodwill of CHF 4,760 mn and other intangible assets of CHF 219 mn from total shareholders’ equity of CHF 45,150 mn as presented in our balance sheet.For end-4Q19, tangible shareholders’ equity excluded goodwill of CHF 4,663 mn and other intangible assets of CHF 291 mn from total shareholders’ equity of CHF 43,644 mn as presented in our balance sheet. For end-1Q20, tangible shareholders’ equity excluded goodwill of CHF 4,604 mn and other intangible assets of CHF 279 mn from total shareholders’ equity of CHF 48,675 mn as presented in our balance sheet. For end-2Q20, tangible shareholders’ equity excluded goodwill of CHF 4,676 mn and other intangible assets of CHF 273 mn from total shareholders’ equity of CHF 46,535 mn as presented in our balance sheet. Shares outstanding were 2,550.0 mn at end-2Q18, 2,550.6 mn at end-4Q18, 2,507.8 mn at end-2Q19, 2,436.2 mn at end-4Q19, 2,441.6 mn at end-2Q20.AbbreviationsAdv. = Advisory; AM = Asset Management; APAC = Asia Pacific; ARU = Asset Resolution Unit; attr. = attributable; AuM = Assets under Management; BCBS = Basel Committee on Banking Supervision; BIS = Bank for International Settlements; bps = basis points; CB = Central Bank; CCO = Chief Compliance Officer; CCP = Central Counterparties; CECL = Current Expected Credit Losses;CET1 = Common Equity Tier 1; C&IC = Corporate & Institutional Clients; Corp. Ctr. = Corporate Center; COVID-19 = Coronavirus disease 2019; CRO = Chief Risk Officer; CVA = Credit Valuation Adjustments; DCM = Debt Capital Markets; ECM = Equity Capital Markets; EGM = Extraordinary General Meeting; EMEA = Europe, Middle East and Africa; ESG = Environmental, Social and Governance; excl. = excluding; FINMA = Swiss Financial Market Supervisory Authority; FX = Foreign Exchange; FXC = FX Constant; G&A = General and Administrative; GAAP = Generally Accepted Accounting Principles; GM = Global Markets; GTS = Global Trading Solutions; HQLA = High Quality Liquid Assets; IA&F = Impact Advisory & Finance; IB = Investment Bank; IBCM = Investment Banking & Capital Markets;IG = Investment Grade; IIF = International Institute of Finance; incl. = including; IPO = Initial Public Offering; IS&P = Investment Solutions & Products; ITS = International Trading Solutions;IWM = International Wealth Management; JV = Joint Venture; LCR = Liquidity Coverage Ratio; LE = Leverage Exposure; LTM = Last Twelve Months; M&A = Mergers & Acquisitions; MtM = Mark to Market; n/m = not meaningful; NNA = Net New Assets; p.a. = per annum; PB = Private Banking; PC = Private Clients; PE = Private Equity; perf. = performance; pp. = percentage points;PTI = Pre-tax income; QoQ = Quarter on Quarter; rev. = revenues; RM = Relationship Manager; RoRC = Return on Regulatory Capital; RoTE = Return on Tangible Equity; RWA = Risk-weighted assets; SA-CCR = Standardized Approach for measuring Counterparty Credit Risk; SDG = Sustainable Development Goals; SIX = Swiss Infrastructure and Exchange; SME = Small and Medium Enterprise; SoW = Share of Wallet; SRI = Sustainability, Research & Investment Solutions; SRU = Strategic Resolution Unit; SUB = Swiss Universal Bank; TBVPS = Tangible Book Value Per Share; TLAC = Total loss-absorbing capacity; U/HNW = (Ultra) High Net Worth; UN = United Nations; Underwr. = Underwriting; vs. = versus; WFH = Work From Home; WM = Wealth Management; WM&C = Wealth Management & Connected; YoY = Year on year; YTD = Year-to-date
Signatures
Pursuant to the requirements of the Securities Exchange Act of 1934, the registrants have duly caused this report to be signed on their behalf by the undersigned, thereunto duly authorized.
CREDIT SUISSE GROUP AG and CREDIT SUISSE AG
(Registrants)
Date: July 30, 2020
By:
/s/ Thomas Gottstein
Thomas Gottstein
Chief Executive Officer
By:
/s/ David R. Mathers
David R. Mathers
Chief Financial Officer
 Form 40-F


