UNITED STATES SECURITIES AND EXCHANGE COMMISSION
Washington, D.C. 20549
Form 6-K
REPORT OF FOREIGN PRIVATE ISSUER PURSUANT TO RULE 13a-16 OR 15d-16 UNDER THE SECURITIES EXCHANGE ACT OF 1934
February 10, 2022
Commission File Number 001-15244
Credit Suisse Group AG
(Translation of registrant’s name into English)
Paradeplatz 8, 8001 Zurich, Switzerland
(Address of principal executive office)
Commission File Number 001-33434
Credit Suisse AG
(Translation of registrant’s name into English)
Paradeplatz 8, 8001 Zurich, Switzerland
(Address of principal executive office)
Indicate by check mark whether the registrant files or will file annual reports under cover of Form 20-F or Form 40-F.
Form 20-F  Form 40-F
Form 40-F Indicate by check mark if the registrant is submitting the Form 6-K in paper as permitted by Regulation S-T Rule 101(b)(1):
Note: Regulation S-T Rule 101(b)(1) only permits the submission in paper of a Form 6-K if submitted solely to provide an attached annual report to security holders.
Indicate by check mark if the registrant is submitting the Form 6-K in paper as permitted by Regulation S-T Rule 101(b)(7):
Note: Regulation S-T Rule 101(b)(7) only permits the submission in paper of a Form 6-K if submitted to furnish a report or other document that the registrant foreign private issuer must furnish and make public under the laws of the jurisdiction in which the registrant is incorporated, domiciled or legally organized (the registrant’s “home country”), or under the rules of the home country exchange on which the registrant’s securities are traded, as long as the report or other document is not a press release, is not required to be and has not been distributed to the registrant’s security holders, and, if discussing a material event, has already been the subject of a Form 6-K submission or other Commission filing on EDGAR.
This report includes the media release and the slides for the presentation to investors in connection with the 4Q21 and full year 2021 results.
Media Release Zurich, February 10, 2022 |
Ad hoc announcement pursuant to article 53 LR
Credit Suisse reports pre-tax loss of CHF 522 mn in FY21, impacted by the Archegos matter, goodwill impairment and litigation provisions. On an underlying basis*, the bank posts pre-tax income of CHF 6.6 bn
"2021 was a very challenging year for Credit Suisse. Our reported financial results were negatively impacted by the Archegos matter, the impairment of goodwill relating to the Donaldson, Lufkin & Jenrette (DLJ) acquisition in 2000 and litigation provisions, as we look to proactively resolve legacy issues. For the full year, we delivered a resilient underlying* performance, with stable net revenues despite a significant reduction of risk weighted assets and leverage exposure – especially in our IB division – since the end of 1Q21. During the last three quarters of the year, we ran the bank with a constrained risk appetite across all divisions as we took decisive actions to strengthen our overall risk and controls foundation and continued our remediation efforts, including on the Supply Chain Finance Funds matter, where our priority is to return cash to investors. Our clear focus remains on the disciplined execution of our new Group strategy as announced in November 2021: strengthening our core and simplifying our organization as we look to invest for growth in key strategic business areas. We intend to continue to operate Credit Suisse Group with a stronger capital base and a CET1 ratio of at least 14%. Over the coming quarters, we expect to implement our strategy progressively. We have set clear financial goals for all our divisions and are now focused on delivering on our strategic objectives. I am confident that we are well-positioned to build a stronger and customer-centric bank that puts risk management at the very core of its DNA in order to deliver sustainable growth and value for investors, clients and colleagues." Thomas Gottstein, Chief Executive Officer of Credit Suisse Group AG |
Credit Suisse Group Reported Results (CHF mn, unless otherwise specified) | 4Q21 | 3Q21 | 4Q20 | ∆4Q20 | FY21 | FY20 | ∆FY20 | |
| Net revenues | 4,582 | 5,437 | 5,221 | (12)% | 22,696 | 22,389 | 1% | |
| o/w Wealth Management-related | 3,200 | 3,270 | 3,129 | 2% | 13,961 | 13,607 | 3% | |
| o/w Investment Bank in USD mn | 1,605 | 2,465 | 2,337 | (31)% | 9,719 | 9,718 | - | |
| Provision for credit losses | (20) | (144) | 138 | - | 4,205 | 1,096 | - | |
| Total operating expenses | 6,188 | 4,573 | 5,171 | 20% | 19,013 | 17,826 | 7% | |
| o/w Goodwill impairment | 1,623 | - | - | - | 1,623 | - | - | |
| Pre-tax income / (loss) | (1,586) | 1,008 | (88) | - | (522) | 3,467 | - | |
| Net income / (loss) attributable to shareholders | (2,007) | 434 | (353) | - | (1,572) | 2,669 | - | |
| Return on tangible equity | (20.1)% | 4.5% | (3.5)% | - | (4.0)% | 6.6% | - | |
| CET1 ratio | 14.4% | 14.4% | 12.9% | - | 14.4% | 12.9% | - | |
CET1 leverage ratio1 | 4.4% | 4.3% | 4.4% | - | 4.4% | 4.4% | - | |
Tier 1 leverage ratio2 | 6.2% | 6.1% | 6.4% | - | 6.2% | 6.4% | - | |
| Adjusted excluding significant items and Archegos* (CHF mn) | 4Q21 | 3Q21 | 4Q20 | ∆4Q20 | FY21 | FY20 | ∆FY20 | |
| Net revenues | 4,384 | 5,504 | 5,335 | (18)% | 22,544 | 22,101 | 2% | |
| Pre-tax income | 328 | 1,362 | 861 | (62)% | 6,599 | 4,375 | 51% |
Highlights for the fourth quarter of 2021
Net revenues were down 12% year on year, impacted by a reduced risk appetite across the Group in 2021, a negative impact on our franchise momentum and a return to a more normal trading environment after the exceptional conditions that prevailed for most of 2020 and 2021. This was most evident in the Investment Bank, largely due to our exit3 of Prime Services and the strong comparable performance in 4Q20, but our Wealth Management-related businesses also saw a reduction in transaction-based revenues. The pre-tax loss of CHF 1.6 bn compared to pre-tax loss of CHF 88 mn in 4Q20, included a goodwill impairment of CHF 1.6 bn relating to DLJ and major litigation provisions of CHF 436 mn, partly offset by real estate gains of CHF 224 mn.
– Reported pre-tax loss of CHF 1.6 bn for 4Q21, compared to a reported pre-tax loss of CHF 88 mn in 4Q20, predominantly driven by the previously announced goodwill impairment of CHF 1.6 bn taken in the quarter mainly relating to the acquisition of DLJ that was completed in 2000. We took major litigation provisions of CHF 436 mn in 4Q21, part of our progress towards addressing legacy issues
– On an adjusted basis, excluding significant items and Archegos*, 4Q21 pre-tax income of CHF 328 mn, down 62% year on year
Media Release Zurich, February 10, 2022 |
– On an adjusted basis, excluding significant items and Archegos*, net revenues were down 18% year on year, impacted by the cumulative effect of our reduced risk appetite during the year, more normal trading conditions and client deleveraging
– NNA of CHF 1.6 bn compared to CHF 8.4 bn in 4Q20 across the Group, driven by NNA in AM of CHF 4.7 bn and in IWM of CHF 2.7 bn partly offset by net asset outflows in APAC of USD 3.2 bn (CHF 2.9 bn), which includes client deleveraging and de-risking measures we have taken, and in SUB of CHF 1.7 bn
– Strong capital base, with CET1 ratio at 14.4% as of the end of 4Q21, stable compared to the end of 3Q21 and improved Tier 1 leverage ratio at 6.2% as well as CET1 leverage ratio at 4.4%; capital and leverage ratios benefitting from reductions of RWA and leverage exposure
– Continued progress on remediation work on the Supply Chain Finance Funds (SCFF) matter. Returning cash to investors remains a priority; total cash paid out and current cash and cash equivalents of approximately USD 7.2 bn as of December 31, 2021
Highlights for the full year 2021
Stable net revenues with increased net revenues in the Wealth Management-related businesses, partially offset by a net revenue decrease in the Investment Bank, due to the loss related to Archegos and the cumulative impact of our reduced risk appetite in 2021 as well as our exit4 of Prime Services. We had a pre-tax loss of CHF 522 mn compared to pre-tax income of CHF 3.5 bn in FY20 due to the impact of the Archegos matter, the cumulative impact of our more conservative risk approach in 2021 and a goodwill impairment of CHF 1.6 bn, taken in 4Q21; additionally, the bank took major litigation provisions of CHF 1.1 bn in FY21.
– Net loss attributable to shareholders of CHF 1.6 bn, compared to net income attributable to shareholders of CHF 2.7 bn in FY20
– Reported pre-tax loss of CHF 522 mn, down significantly year on year, compared to pre-tax income of CHF 3.5 bn in FY20; FY21 included gains made on our equity investment in Allfunds Group of CHF 602 mn as well as gains on real estate sales of CHF 232 mn. Results in FY21 were affected by the impact of CHF 4.8 bn relating to Archegos, CHF 1.6 bn in the form of a goodwill impairment, CHF 1.1 bn relating to major litigation provisions, a CHF 113 mn impairment related to the valuation of our non-controlling interest in York Capital Management and CHF 103 mn of restructuring costs
– On an adjusted basis, excluding significant items and Archegos*, FY21 pre-tax income of CHF 6.6 bn, up 51% year on year
– On an adjusted basis, excluding significant items and Archegos*, net revenues of CHF 22.5 bn, up 2% year on year, driven by higher net revenues across AM, IB and SUB, partly offset by lower net revenues in IWM
– Adjusted operating expenses, excluding significant items and Archegos*, of CHF 16.1 bn, down 4%, reflecting underlying cost discipline and resulting from lower variable compensation costs, partially offset by increased professional services fees and investments in strategic initiatives, including hiring of relationship managers in APAC and hiring in risk and controls. Reported operating expenses of CHF 19.0 bn, up 7% year on year, mainly driven by the goodwill impairment taken in 4Q21 in IB and APAC, partially offset by decreased compensation and benefits
– Group AuM of over CHF 1.6 trn as of December 31, 2021, up approximately 7% year on year; NNA of CHF 30.9 bn with NNA in AM, IWM and SUB offsetting net asset outflows in APAC
– Wealth Management AuM of CHF 827 bn, up from CHF 795.3 bn as of December 31, 2020, with NNA of CHF 11.3 bn, supporting recurring commissions and fees’ growth of 9% year on year
Outlook
Compared to the exceptional levels of 1Q21, we have seen a reversion to lower, pre-pandemic levels of business activity, particularly given the monetary tightening that central banks have initiated. We also expect our Equities revenues to be impacted by the exit from Prime Services. However, after a weak start to the year, we are seeing encouraging signs of improving franchise momentum, including positive net new asset inflows year-to-date in our Wealth Management business.
As previously highlighted at our Investor Day on November 4, 2021, the year 2022 will be a transition year for Credit Suisse as the benefits of our strategic capital reallocation towards core businesses and generating structural costs savings to invest for growth should largely materialize from 2023 onwards. In this context, the results for 2022 are expected to be adv2022 ersely affected by restructuring costs and higher compensation costs compared to last year. Our reported results are expected to also reflect volatility in the share price of our 8.6% holding in Allfunds Group (the value of which has declined by CHF 204 mn so far in 5). During 2022, we intend to meet our goal of releasing a cumulative USD 3 bn of allocated capital from our Investment Bank for reinvestment into Wealth Management and other core businesses.
Media Release Zurich, February 10, 2022 |
Capital returns to shareholders
The Board of Directors (Board) will propose to the shareholders at the Annual General Meeting on April 29, 2022 a cash distribution of CHF 0.10 per share for the financial year 2021. This is consistent with the reduced dividend paid with respect to the financial year 2020 and reflects a prudent capital distribution approach for a challenging year. 50% of the distribution will be paid out of capital contribution reserves, free of Swiss withholding tax and will not be subject to income tax for Swiss resident individuals holding shares as a private investment, and 50% will be paid out of retained earnings, net of 35% Swiss withholding tax.
Supply Chain Finance Funds Matter Update
Last year, the Board commissioned Walder Wyss to execute an independent external investigation into the Supply Chain Finance Funds (SCFF). Walder Wyss appointed Deloitte Touche Tohmatsu Limited (Deloitte AG) to assist them in their work. The related report has been completed, the findings have been made available to the Board and the report was shared with FINMA. Given the reputational impact of the SCFF matter on Credit Suisse, actions have been taken against a number of individuals where the Board deemed it was appropriate. In light of the ongoing recovery process and the legal complexities of the matter, there is no intention by the Board to publish the report.
With regard to the funds themselves, we continue to pursue all available avenues for recovery on behalf of our investors. As of December 31, 2021, the focus areas account for approximately USD 2.2 bn of the NAV as of February 25, 2021. Regarding GFG Australia, after the initial payment we received in October 2021, we continued to receive monthly payments in 2021 in line with what GFG Australia agreed for the repayment of the then remaining principal of approximately USD 178 mn, including interest, by mid-20236. Regarding Katerra, we filed two applications for document discovery in the United States for use in planned litigation in the United Kingdom against various entities affiliated with Softbank Group Corp. Finally, with regard to Bluestone Resources and the remainder of GFG, we continue to pursue all available recovery avenues.
Furthermore, we have filed five insurance claims, as of December 31, 2021, through the filing process with Greensill Bank. These five claims have corresponding Credit Suisse Asset Management exposure of approximately USD 1.2 bn.
Following the sixth cash payment made in mid-December 2021, total cash paid out and current cash and cash equivalents, as of December 31, 2021, were at approximately 72% of the funds’ net asset value (NAV) as of February 25, 2021. In terms of cash payments, investors have received approximately USD 6.7 bn as of December 31, 2021. We continue to make good progress on our non-focus areas and have reduced the outstanding exposure of notes by approximately 90% of the February 25, 2021 exposure level. As of December 31, 2021, non-focus areas account for USD 0.4 bn of the NAV as of February 25, 2021.
4Q21 Results – Review of Performance
We posted a pre-tax loss of CHF 1.6 bn in 4Q21 mainly due to the impact of the goodwill impairment taken in the Investment Bank and APAC, as well as major litigation provisions of CHF 436 mn and the impact of reduced net revenues, due in part to reduced risk appetite across divisions in 2021 and lower client activity. This led to a net loss attributable to shareholders of CHF 2.0 bn. We recorded a release of provision for credit losses of CHF 20 mn, which included a release pertaining to an assessment of the future recoverability of receivables related to Archegos of CHF 5 mn as well as a release of CHF 28 mn relating to non-specific provisions for expected credit losses. Our adjusted net revenues, excluding significant items and Archegos*, of CHF 4.4 bn, were down 18% year on year, and our adjusted pre-tax income, excluding significant items and Archegos*, of CHF 328 mn, was down 62%; this was in part due to our recalibrated risk appetite across divisions in 2021 as well as lower client activity.
The lower risk appetite in 2021 led to reductions in our Investment Bank’s Risk Weighted Assets (RWA) and Leverage Exposure of CHF 1 bn7 and CHF 18 bn8, respectively, quarter on quarter. Additionally, we achieved a capital9 reduction in the Investment Bank of USD 2.0 bn in 2021, representing significant progress towards our ambition to release > USD 3 bn of capital by the end of 2022. In terms of our Wealth Management-related businesses, RWA and Leverage exposure decreased by CHF 5 bn10 and CHF 7 bn11, respectively, quarter on quarter; this was mainly as a result of client deleveraging reflecting adverse market conditions, particularly in Asia.
Our capital ratios remain strong with a CET1 ratio of 14.4% at the end of 4Q21, stable compared to the end of 3Q21, and a CET1 leverage ratio of 4.4%, compared to 4.3% at the end of 3Q21. Our CET1 and leverage ratios benefitted from our lower RWA and leverage exposure.
Our Wealth Management-related businesses reported net revenues of CHF 3.2 bn, up 2% year on year; on an adjusted basis, excluding significant items*, net revenues were down 8% due to lower transaction- and performance-based revenues, down 25% year on year, impacted by lower revenues from Global Trading Solutions (GTS) and lower client activity, as well as lower net interest
Media Release Zurich, February 10, 2022 |
income, down 5%. However we saw strong momentum in recurring commissions and fees, up 6%, in line with the growth in our asset base.
Our Investment Bank’s reported net revenues of USD 1.6 bn were down 31% year on year, reflecting our strategy to reduce capital and risk across our businesses and more normalized trading conditions, particularly in Fixed Income. IB reported results included a charge of USD 1.7 bn relating to a goodwill impairment. Fixed Income Sales & Trading revenues were down 38% year on year, mainly reflecting weaker trading conditions in Credit. Equity Sales & Trading revenues were down 26% due to continued de-risking in and the exit12 of Prime Services. Capital Markets revenues were down 48%, reflecting a slowdown in SPAC activity, compared to a strong 4Q20, and lower risk appetite in our Leveraged Finance business. Advisory revenues were up significantly, by 51%, year on year, driven by higher revenues from completed M&A transactions. Revenues in GTS, our collaboration between the IB and our wealth management businesses, declined in part due to our reduced capital usage and more conservative risk appetite in 2021 coupled with lower volumes and volatility compared to an exceptional 4Q20.
Operating expenses for the Group of CHF 6.2 bn increased by 20% year on year, mainly driven by the goodwill impairment taken in the quarter of CHF 1.6 bn relating to DLJ. We also had litigation provisions of CHF 436 mn in the quarter. Our adjusted operating expenses, excluding significant items and Archegos*, decreased by 6%, illustrating continued cost discipline and driven by lower compensation expenses more than offsetting continued strategic investments across our businesses, including our investments in IT infrastructure, relationship manager hiring in APAC, as well as investments in risk and controls.
The Group reported AuM totaling CHF 1.6 trn at the end of 4Q21, up approximately 7% year on year. We saw NNA of CHF 1.6 bn in 4Q21, compared to NNA of CHF 8.4 bn in 4Q20 and NNA of CHF 5.6 bn in 3Q21.
FY21 Results – Review of Performance
2021 has been a year of challenges for Credit Suisse. It was paramount that we reviewed, reflected and comprehended the impact that both the Archegos and SCFF matters had on our bank, our culture, our strategy and the way we work. It is also imperative that we take action and remain focused on offering our clients continued excellent services and innovative solutions. We set a new path for our bank in our new Group strategy and simplified structure, which was effective as of January 1, 2022. What is clear from our FY21 results, is that despite the challenges, our franchise remains resilient.
On an adjusted basis, excluding significant items and Archegos*, our net revenues were up 2% year on year, at CHF 22.5 bn, driven by revenue growth in AM, IB and SUB partially offset by lower revenues in IWM.
Our adjusted pre-tax income, excluding significant items and Archegos*, increased 51% year on year, to CHF 6.6 bn, driven by growth across most divisions, except for IWM where there was a 23% decrease year on year. Provision for credit losses for FY21 were CHF 4.2 bn, of which CHF 4.3 bn was related to Archegos, also included a net release of CHF 235 mn relating to non-specific provisions for expected credit losses.
Our Wealth Management-related businesses reported net revenues of CHF 14.0 bn, up 3% year on year. On an adjusted basis, excluding significant items*, net revenues were flat, driven by higher recurring commissions and fees, up 9% year on year, in line with growth in our asset base, partly offset by lower net interest income, down 6% year on year, as well as lower transaction- and performance-based revenues, down 4%.
Our Investment Bank reported net revenues of USD 9.7 bn, stable year on year. Our adjusted net revenues, excluding Archegos*, were up 5%. This was despite our disciplined approach to risk during the year and a strong FY20; revenues were driven by record13 performances across Capital Markets, M&A, Equity Derivatives and Securitized Products. Fixed Income Sales & Trading revenues were down 12% year on year, compared to a strong prior year, which benefited from more favorable market conditions across macro, global credit products and emerging markets, partially offset by significantly higher securitized products revenues. Equity Sales & Trading revenues were down 25% year on year, mainly reflecting the loss related to Archegos in Prime Services as well as the exit of Prime Services14, however, excluding Archegos*, they were down 5%15, in light of our strategy to resize the Prime Services franchise, partially offset by significantly higher equity derivatives revenues. Capital Markets revenues were up 30%, driven by robust markets, and Advisory revenues were up 50% due to a significant increase in M&A activity.
Operating expenses for the Group of CHF 19.0 bn increased by 7% year on year, mainly driven by the goodwill impairment taken in 4Q21 and higher litigation provisions, partially offset by decreased compensation and benefits. This masked our underlying cost discipline, as adjusted operating expenses, excluding significant items and Archegos*, decreased by 4% in part due to lower variable compensation costs, partially offset by increased professional services fees and investments in strategic initiatives, including hiring of relationship managers in APAC, investments in IT infrastructure and in risk and controls.
Media Release Zurich, February 10, 2022 |
In setting compensation awards recently communicated to employees, the Executive Board and Board have sought to balance three competing priorities. First, to recognize the impact of significant matters in 2021 on our financial performance, most notably the Archegos matter, but also the reputational damage from the SCFF matter, as well as the goodwill impairment relating to the DLJ acquisition and the high level of legal provisions against a number of significant litigation issues. Second, to reflect the strength of the underlying* performance during 2021 of many of our businesses, notwithstanding our significant reduction in risk appetite during the year. Third, to ensure, going forward, that we are able to align the incentives for our employees to the delivery on the strategic plan that we announced on November 4, 2021, and that we remain competitive.
Our variable compensation awards are aligned to these goals. With regard to awards that relate to our 2021 performance, the Group variable compensation pool is 32% lower than in 2020 to reflect the aforementioned issues. The overall structure of these variable compensation awards is consistent with prior years for the majority of employees. However, most employees at a more senior level (Managing Directors and Directors), who have taken a higher proportionate share of the reduction in the variable compensation pool, have received a cash award with a pro-rata repayment (clawback) provision16 that applies in the event that they voluntarily leave the firm during the three-year period ending in February 2025, together with a regular deferred share-based award that generally vests linearly over the next three years.
To increase the alignment of executive compensation with shareholder interests, and recognizing the role of senior management in the implementation of our strategic plan, most Managing Directors and Directors have received a separate one-time share-based award (Strategic Delivery Plan or SDP), which will vest in its entirety in three years’ time if certain financial metrics are achieved over the course of 2022-2024. We will provide further details on these compensation awards in our Annual Report which will be published on March 10, 2022.
Our goal is to remain a competitive employer in what is a highly competitive compensation environment. We believe that with the above compensation outcome, Credit Suisse has found the right balance for all stakeholders in what was a very challenging year for the firm.
NNA for FY21 were CHF 30.9 bn compared to CHF 42.0 bn in FY20, with contributions from AM of CHF 14.6 bn, IWM of CHF 11.0 bn, SUB of CHF 6.5 bn, partly offset by net asset outflows in APAC of CHF 1.1 bn (USD 1.3 bn).
Media Release Zurich, February 10, 2022 |
Detailed Divisional Summaries
| Swiss Universal Bank (SUB) | ||||||||
| Reported results (in CHF mn) | 4Q21 | 3Q21 | 4Q20 | ∆4Q20 | FY21 | FY20 | ∆FY20 | |
| Net revenues | 1,484 | 1,391 | 1,393 | 7% | 5,801 | 5,615 | 3% | |
| Provision for credit losses | (3) | 4 | 66 | - | 6 | 270 | (98)% | |
| Operating expenses | 771 | 764 | 840 | (8)% | 3,066 | 3,241 | (5)% | |
| Pre-tax income | 716 | 623 | 487 | 47% | 2,729 | 2,104 | 30% | |
| Cost/income ratio (%) | 52% | 55% | 60% | - | 53% | 58% | - | |
| Net New Assets (bn) | (1.7) | 1.5 | 1.7 | - | 6.5 | 7.8 | - | |
| o/w Private Clients (bn) | (1.8) | 1.9 | (2.1) | - | 1.4 | (5.9) | - | |
Adjusted results, excluding significant items* (in CHF mn) | 4Q21 | 3Q21 | 4Q20 | ∆4Q20 | FY21 | FY20 | ∆FY20 | |
| Net revenues | 1,313 | 1,354 | 1,243 | 6% | 5,402 | 5,306 | 2% | |
| Operating expenses | 770 | 764 | 790 | (3)% | 3,041 | 3,149 | (3)% | |
| Pre-tax income | 546 | 586 | 387 | 41% | 2,355 | 1,887 | 25% | |
| Cost/income ratio (%) | 59% | 56% | 64% | - | 56% | 59% | - | |
4Q21
– On an adjusted basis, excluding significant items*, SUB had a record17 fourth quarter pre-tax income of CHF 546 mn, up 41% year on year, due to higher net revenues up 6%, lower operating expenses, and a release of provision for credit losses. Our adjusted operating expenses, excluding significant items*, were down 3% year on year with lower discretionary compensation expenses; this in turn supported our adjusted cost/income ratio, excluding significant items*, of 59% down compared to 4Q20
– Reported net revenues of CHF 1.5 bn were up 7% year on year, which included real estate gains of CHF 205 mn, a gain of CHF 9 mn on our equity investment in Allfunds Group and a revaluation loss of CHF 43 mn on our equity investment in SIX Group. Adjusted net revenues, excluding significant items*, were up 6% driven by increases across all major revenue categories with recurring commissions and fees up 13% supported by record18 AuM levels and higher revenues from improved performance in our investment in Swisscard. Transaction-based revenues were up 8% and net interest income was stable
– Net asset outflows of CHF 1.7 bn reflecting net outflows from Private Clients of CHF 1.8 bn, primarily due to individual cases in the ultra-high-net-worth (UHNW) and high-net-worth (HNW) client segments and the usual seasonal slowdown for the quarter, partially offset by net inflows of CHF 0.1 bn in Corporate & Institutional Clients
– Client business volume of CHF 1.1 trn, up 9% year on year
FY21
– On an adjusted basis, excluding significant items*, record19 full-year pre-tax income of CHF 2.4 bn, up 25% year on year, driven by significantly lower provision for credit losses, and higher net revenues, up 2%, with operating expenses down 3%
– Reported net revenues were up 3% compared to FY20; adjusted net revenues, excluding significant items*, of CHF 5.4 bn, up 2%, mainly driven by higher recurring commissions and fees, up 10%, with stable net interest income, partly offset by lower transaction-based revenues, down 2%
– NNA of CHF 6.5 bn at an annualized growth rate of 1%, with contributions from both Private Clients and Corporate & Institutional Clients businesses
Media Release Zurich, February 10, 2022 |
| International Wealth Management (IWM) | ||||||||
| Reported results (in CHF mn) | 4Q21 | 3Q21 | 4Q20 | ∆4Q20 | FY21 | FY20 | ∆FY20 | |
| Net revenues | 716 | 829 | 974 | (26)% | 3,462 | 3,747 | (8)% | |
| Provision for credit losses | (1) | 12 | 31 | - | (14) | 110 | - | |
| Operating expenses | 682 | 624 | 650 | 5% | 2,500 | 2,546 | (2)% | |
| Pre-tax income | 35 | 193 | 293 | (88)% | 976 | 1,091 | (11)% | |
| Cost/income ratio (%) | 95% | 75% | 67% | - | 72% | 68% | - | |
| Net New Assets (bn) | 2.7 | 1.4 | 4.3 | - | 11.0 | 16.7 | - | |
Adjusted results, excluding significant items* (in CHF mn) | 4Q21 | 3Q21 | 4Q20 | ∆4Q20 | FY21 | FY20 | ∆FY20 | |
| Net revenues | 695 | 812 | 862 | (19)% | 3,239 | 3,620 | (11)% | |
| Operating expenses | 671 | 624 | 625 | 7% | 2,483 | 2,515 | (1)% | |
| Pre-tax income | 25 | 176 | 206 | (88)% | 770 | 995 | (23)% | |
| Cost/income ratio (%) | 97% | 77% | 73% | - | 77% | 69% | - | |
4Q21
– On an adjusted basis, excluding significant items*, IWM pre-tax income fell to CHF 25 mn, down 88% year on year, driven by lower net revenues, down 19%, as well as higher operating expenses, up 7%, reflecting higher investments and year-end compensation accruals
– Reported net revenues of CHF 716 mn were down 26% year on year and included gains on real estate and business sales of CHF 36 mn and a negative net impact of CHF 15 mn from the equity investment gain in Allfunds Group and an equity investment revaluation loss in SIX Group. Adjusted net revenues, excluding significant items*, of CHF 695 mn, were down 19% driven by lower transaction- and performance-based revenues, down 40%, due to more normalized client activity, lower GTS revenues in less volatile markets and a mark-to-market loss on an investment of CHF 19 mn in 4Q21 compared to a gain of CHF 31 mn in 4Q20. We also saw lower net interest income, down 13%, due in part to cumulative interest rate moves. Finally, recurring commissions and fees were down 7%, with lower fees from lending activities, partially offset by higher mandate revenues at a stable margin
– NNA of CHF 2.7 bn with inflows in emerging markets and Western Europe
– Client business volume of CHF 555 bn, up 7% year on year, reflecting higher AuM of CHF 391 bn
FY21
– On an adjusted basis, excluding significant items*, pre-tax income was down 23% year on year at CHF 770 mn, mainly reflecting lower net revenues, down 11%, which were only partly offset by slightly lower operating expenses, down 1%, and a net release of provision for credit losses of CHF 14 mn
– Reported net revenues were down 8% year on year; adjusted net revenues, excluding significant items*, of CHF 3.3 bn, were down 11% year on year, driven by lower transaction- and performance-based revenues, down 21%, mainly due to lower GTS and structured products revenues and lower FX commissions in less volatile markets. We also had lower net interest income, down 14%, with lower deposit and treasury income, partly offset by higher loan income. Recurring commissions and fees were up 5%, with higher mandate and investment product revenues at a stable margin
– NNA of CHF 11.0 bn, reflecting an annualized growth rate of 3%
Media Release Zurich, February 10, 2022 |
| Asia Pacific (APAC) | ||||||||
| Reported results (in USD mn) | 4Q21 | 3Q21 | 4Q20 | ∆4Q20 | FY21 | FY20 | ∆FY20 | |
| Net revenues | 671 | 837 | 871 | (23)% | 3,548 | 3,378 | 5% | |
| Provision for credit losses | (14) | 7 | 7 | - | 29 | 248 | (88)% | |
| Operating expenses | 694 | 583 | 600 | 16% | 2,431 | 2,241 | 8% | |
| Pre-tax income/loss | (9) | 247 | 264 | - | 1,088 | 889 | 22% | |
| Cost/income ratio (%) | 103% | 70% | 69% | - | 69% | 66% | - | |
| Net New Assets (bn) | (3.2) | 3.2 | (1.3) | - | (1.3) | 8.9 | - | |
Adjusted results, excluding significant items* (in USD mn) | 4Q21 | 3Q21 | 4Q20 | ∆4Q20 | FY21 | FY20 | ∆FY20 | |
| Net revenues | 661 | 795 | 828 | (20)% | 3,345 | 3,309 | 1% | |
| Operating expenses | 581 | 582 | 599 | (3)% | 2,307 | 2,237 | 3% | |
| Pre-tax income | 94 | 206 | 222 | (58)% | 1,009 | 824 | 22% | |
| Cost/income ratio (%) | 88% | 73% | 72% | - | 69% | 68% | - | |
4Q21
– On an adjusted basis, excluding significant items*, pre-tax income of USD 94 mn, down 58% year on year, largely due to lower net revenues, driven mainly by lower transaction activity. Adjusted operating expenses, excluding significant items*, were down 3% year on year reflecting lower compensation expenses
– Reported net revenues of USD 671 mn, down 23% year on year, included a gain on the equity investment in Allfunds Group of USD 10 mn in 4Q21 compared to a gain of USD 43 mn in 4Q20. Reported operating expenses, up 17%, include a charge of USD 113 mn from Asia Pacific’s share of the goodwill impairment related to DLJ
– On an adjusted basis, excluding significant items*, net revenues of USD 661 mn were down 20%, as lower transaction-based revenues and lower net interest income were partially offset by higher recurring commissions and fees. Transaction-based revenues were down 33%, reflecting lower financing revenues20, lower structured equity origination revenues, lower brokerage and product issuing fees and lower revenues from GTS. Net interest income was down 13%, mainly reflecting lower loan margins and lower loan volumes due to de-risking measures and client deleveraging amid volatile markets, particularly in Greater China. Finally, recurring commissions and fees were up 19%, reflecting higher mandates and fund volumes
– Net asset outflows of USD 3.2 bn, including USD 2.9 bn from client deleveraging as well as de-risking measures we have taken
– Client business volume of USD 372 bn, down 7% year on year; AuM of CHF 218.8 mn
FY21
– On an adjusted basis, excluding significant items*, APAC recorded higher pre-tax income of USD 1.0 bn, up 22% year on year, reflecting significantly lower provision for credit losses and stable net revenues, more than offsetting higher operating expenses, up 3% due in part to our continued relationship manager hiring coupled with other investments in private banking compliance and digitalization initiatives. Reported pre-tax income included a gain on the equity investment in Allfunds Group of USD 196 mn in 2021 compared to a gain of USD 69 mn in 2020 and a charge of USD 113 mn from APAC’s share of the goodwill impairment on DLJ
– Reported net revenues were up 5% year on year; adjusted net revenues, excluding significant items*, of USD 3.3 bn were stable. Recurring commission and fees were higher, up 21%, driven by higher mandates and funds volumes and resulting in higher managed solutions penetration. Transaction-based revenues were higher, up 4%, as a strong 1Q21 was largely offset by weaker performance thereafter, impacted by negative China market sentiment and interest rate uncertainties. These revenue increases were largely offset by lower net interest income, down 9%, mainly from significantly lower deposit margins, despite higher average deposits volumes, and lower loan margins on a decreasing loan portfolio during the year due to client deleveraging and de-risking measures we have taken
– Net asset outflows of USD 1.3 bn, mainly reflecting outflows in North Asia, including client deleveraging as well as de-risking measures taken in 2021
Media Release Zurich, February 10, 2022 |
| Investment Bank (IB) | ||||||||
| Reported results (in USD mn) | 4Q21 | 3Q21 | 4Q20 | ∆4Q20 | FY21 | FY20 | ∆FY20 | |
| Net revenues | 1,605 | 2,465 | 2,337 | (31)% | 9,719 | 9,718 | - | |
| Provision for credit losses | (1) | (182) | 42 | - | 4,451 | 489 | - | |
| Operating expenses | 3,716 | 1,815 | 1,977 | 88% | 9,192 | 7,469 | 23% | |
| Pre-tax income/loss | (2,110) | 832 | 318 | - | (3,924) | 1,760 | - | |
| Cost/income ratio (%) | 232% | 74% | 85% | - | 95% | 77% | - | |
| Return on Regulatory Capital (%) | (53)% | 20% | 7% | - | (23)% | 10% | - | |
| Adjusted results, excluding Archegos* (in USD mn) | 4Q21 | 3Q21 | 4Q20 | ∆4Q20 | FY21 | FY20 | ∆FY20 | |
| Net revenues | 1,604 | 2,441 | 2,337 | (31)% | 10,236 | 9,718 | 5% | |
| Operating expenses | 1,833 | 1,839 | 1,938 | (5)% | 7,213 | 7,347 | (2)% | |
| Pre-tax income | (233) | 582 | 357 | - | 3,149 | 1,882 | 67% | |
| Cost/income ratio (%) | 114% | 75% | 83% | - | 70% | 76% | - | |
| Return on Regulatory Capital (%) | (6)% | 14% | 8% | - | 18% | 10% | - | |
4Q21
– On an adjusted basis, excluding Archegos*, the IB posted a pre-tax loss of USD 233 mn, down from pre-tax income of USD 357 mn in 4Q20, reflecting lower revenues in the quarter; total reported operating expenses, up 88% year on year, included a goodwill impairment of USD 1.7 bn relating to DLJ; adjusted operating expenses, excluding Archegos*, decreased by 5% year on year, primarily due to reduced compensation
– Reported net revenues of USD 1.6 bn, were down 31% year on year due to a strong comparable in 4Q20 and reflecting our strategy to reduce capital and risk across our businesses during 2021
– We saw continued momentum in our Advisory revenues, up 51% year on year and resulting in market share gains21
– Capital markets revenues decreased 48% year on year, reflecting a slowdown in SPAC activity, compared to a strong comparable in 4Q20, and lower risk appetite in our Leveraged Finance business
– Revenues in our Fixed Income Sales & Trading business were down 38% year on year, reflecting lower trading activity in Credit partly offset by continued growth in our number 1 ranked22 fee-based Asset Finance franchise and higher Macro revenues
– Equity Sales & Trading revenues declined by 26% year on year primarily due to our announced exit23 from Prime Services
– GTS revenues declined as strength in Equity Derivatives and Macro was offset by de-risking in our Emerging Markets franchise and fewer episodic transactions
– Risk Weighted Assets declined 13% year on year in line with our reduced risk appetite in 2021, and leverage exposure declined 16% year on year primarily due to reductions in Prime Services
FY21
– Strong adjusted pre-tax income, excluding Archegos*, of USD 3.1 bn, up 67% year on year, resulted in an adjusted return on regulatory capital, excluding Archegos*, of 18% underscoring the resilience of our client franchise despite a 15% reduction in allocated capital24. The reported pre-tax loss of USD 3.9 bn included losses from Archegos of approximately USD 5.1 bn as well as a goodwill impairment of USD 1.7 bn in 4Q21 relating to DLJ
– Adjusted net revenues, excluding Archegos*, of USD 10.2 bn, were up 5% compared to a strong FY20, driven by record25 fourth quarter performances across Capital Markets, M&A, Equity Derivatives and Securitized Products
Media Release Zurich, February 10, 2022 |
| Asset Management (AM) | ||||||||
| Reported results (in CHF m) | 4Q21 | 3Q21 | 4Q20 | ∆4Q20 | FY21 | FY20 | ∆FY20 | |
| Net revenues | 387 | 279 | (22) | - | 1,456 | 1,090 | 34% | |
| Provision for credit losses | (2) | 1 | (6) | - | 0 | 0 | - | |
| Operating expenses | 310 | 276 | 289 | 7% | 1,156 | 1,129 | 2% | |
| Pre-tax income | 79 | 2 | (305) | - | 300 | (39) | - | |
| Cost/income ratio (%) | 80% | 99% | - | - | 79% | 104% | - | |
| Net New Assets (bn) | 4.7 | (1.7) | 6.3 | - | 14.6 | 15.5 | - | |
Adjusted results, excluding significant items* (in CHF m) | 4Q21 | 3Q21 | 4Q20 | ∆4Q20 | FY21 | FY20 | ∆FY20 | |
| Net revenues | 387 | 392 | 392 | (1)% | 1,569 | 1,301 | 21% | |
| Operating expenses | 310 | 276 | 283 | 10% | 1,152 | 1,109 | 4% | |
| Pre-tax income / (loss) | 79 | 115 | 115 | (31)% | 417 | 192 | - | |
| Cost/income ratio (%) | 80% | 70% | 72% | - | 73% | 85% | - | |
4Q21
– On an adjusted basis, excluding significant items*, pre-tax income of CHF 79 mn, was down 31% year on year, mainly due to higher operating expenses, however, net revenues were stable year on year. Adjusted operating expenses, excluding significant items*, were up 10%, mainly due to higher variable compensation and higher expenses related to the SCFF matter
– Reported net revenues were up significantly year on year at CHF 387 mn; in 4Q20 revenues included an impairment of CHF 414 million to the valuation of our non-controlling interest in York Capital Management
– We recorded stable adjusted net revenues, excluding significant items*, of CHF 387 mn; revenues were driven by higher management fees, up 9% reflecting higher average AuM, and increased investment & partnership income, offset by lower performance and placement revenues, down 36%, reflecting very strong performance fees in 4Q20
– NNA of CHF 4.7 bn, implying a 4% annualized growth rate, driven by Index Solutions and our emerging markets joint venture, partly offset by outflows from fixed income; AuM of CHF 476.8 bn
FY21
– On an adjusted basis, excluding significant items*, AM had significantly higher pre-tax income, year on year, of CHF 417 mn compared to CHF 192 mn in 2020, driven mainly by higher net revenues, partially offset by higher operating expenses, up 4% year on year, primarily related to the SCFF matter and increased commission expenses
– Reported net revenues of CHF 1.5 bn were up 34% year on year; strong adjusted net revenues, excluding significant items*, of CHF 1.6 bn were up 21%, reflecting good momentum across all revenue lines with higher management fees, up 10% year on year, and higher performance and placement revenues, up 60%, as well as a significant improvement in investment and partnership income
– NNA of CHF 14.6 bn at annualized growth rate of 3% driven by our emerging markets joint venture, Index Solutions, credit and equities, partly offset by outflows from Insurance-Linked Strategies and fixed income
– Continued progress in deleveraging the non-core portfolio in investment and partnership
Media Release Zurich, February 10, 2022 |
Progress on our sustainability ambitions and investing for growth in light of our new Group strategy
Throughout 2021 and during the fourth quarter 2021, Credit Suisse continued to focus on its sustainability strategy and driving activity across divisions and functions. The bank continues to emphasize the importance of sustainability as a core element of our value proposition for our clients, shareholders and employees; we are committed to consistently executing on our sustainability strategy and ambitions.
Our key achievements in 4Q21 regarding sustainability include:
– 4Q21 Sustainable AuM of CHF 150 bn26, up 4% quarter on quarter, and 39% year on year; resulting in 9.3% Sustainable AuM penetration as of December 31, 2021
– The launch of our Sustainable Activities Framework to provide clarity on our approach to classification, as well as establish credibility, transparency and governance around how the Group accounts for and reports its sustainable finance activities contributing to our commitment of providing at least CHF 300 bn of sustainable finance by 2030
– The announcement relating to being one of the first recipients of the Terra Carta Seal from HRH The Prince of Wales as part of his Sustainable Markets Initiative, recognizing firms at the forefront of the sustainable transition
Furthermore, and in light of our new Group strategy, with a clear focus on investing for growth, we announced that Emma Crystal will become Chief Sustainability Officer for the Group effective April 1, 2022. Reporting directly into the Group CEO, her mandate will include partnering with the four global business divisions, the four geographic regions and our corporate functions, to deliver on our existing sustainability and ESG ambitions. Emma has a deep breadth of experience as the leader of the Sustainable Client Solutions unit in our IWM business and Head of Northern and Western Europe for IWM.
Media Release Zurich, February 10, 2022 |
CONTACT DETAILS
Kinner Lakhani, Investor Relations, Credit Suisse Tel: +41 44 333 71 49 Email: investor.relations@credit-suisse.com |
Dominik von Arx, Corporate Communications, Credit Suisse Tel: +41 844 33 88 44 Email: media.relations@credit-suisse.com |
The Earnings Release and Presentation Slides for 4Q21 and FY21 are available to download from 06:45 CET today at: https://www.credit-suisse.com/results |
PRESENTATION OF 4Q21 AND FY21 RESULTS
THURSDAY, FEBRUARY 10, 2022
| Event | Analyst Call | Media Call on 4Q21 Results |
| Time | 08:15 CET (Zurich) 07:15 GMT (London) 02:15 EDT (New York) | 10:30 CET (Zurich) 09:30 GMT (London) 04:30 EDT (New York) |
| Language | English | English |
| Access | Switzerland +41 44 580 71 45 UK +44 (0) 2071 928 338 USA +1 877 870 9135 Reference: Credit Suisse Analysts and Investors Call Conference ID: 6641537 Please dial in 10 minutes before the start of the call. When dialing in please enter the Passcode/Conference ID and leave your first, last name and company name after the tone. You will be joined automatically to the conference. Webcast link here. | Switzerland +41 44 580 71 45 UK +44 (0) 2071 928 338 USA +1 877 870 9135 Reference: "Credit Suisse Media Conference" Conference ID: 3386188 Please dial in 10 minutes before the start of the call. When dialing in please enter the Passcode/Conference ID and leave your first, last name and company name after the tone. You will be joined automatically to the conference. Webcast link here. |
| Q&A Session | Following the presentation, you will have the opportunity to ask the speakers questions | Following the presentation, you will have the opportunity to ask the speakers questions |
| Playback | Replay available at the webcast link. | Replay available at the webcast link. |
Media Release Zurich, February 10, 2022 |
* Refers to results excluding certain items included in our reported results. These results are non-GAAP financial measures. For a reconciliation to the most directly comparable US GAAP measures, see the Appendix of this Media Release.
Footnotes
1 In 4Q20 and FY20, leverage exposure excludes CHF 111 billion of central bank reserves, after adjusting for the dividend paid in 2020 as required by FINMA. FINMA announced the temporary exclusion for purposes of leverage ratio calculations in response to the COVID-19 pandemic, which temporary measure expired as of January 1, 2021
2 In 4Q20 and FY20, leverage exposure excludes CHF 111 billion of central bank reserves, after adjusting for the dividend paid in 2020 as required by FINMA. FINMA announced the temporary exclusion for purposes of leverage ratio calculations in response to the COVID-19 pandemic, which temporary measure expired as of January 1, 2021
3 With the exception of Index Access and APAC Delta One
4 With the exception of Index Access and APAC Delta One
5 As of market close on February 9, 2022
6 AUD / USD exchange rate of 0.7416 used for purposes of calculating GFG Australian amounts
7 RWA excluding methodology and FX impact of CHF (2) bn
8 Leverage exposure excluding HQLA and FX impact of CHF (8) bn
9 Allocated capital based on the average of 13.5% of risk-weighted assets and 4.25% of leverage exposure
10 RWA excluding methodology and FX impact of CHF (2) bn
11 Leverage exposure excluding HQLA and FX impact of CHF (6) bn
12 With the exception of Index Access and APAC Delta One
13 Since restated history commencing in 2016
14 With the exception of Index Access and APAC Delta One
15 Excludes Archegos loss of USD 517 mn from Equity Sales & Trading revenues in FY21
16 Only in jurisdictions where legally permitted
17 Since restated quarters, commencing 1Q18
18 Since restated quarters, commencing 1Q18
19 Since restated quarters, commencing 1Q18
20 4Q21 includes unrealized mark-to-market losses of USD (4) mn, net of hedges. 4Q20 included unrealized mark-to-market gains of USD 50 mn, net of hedges
21 Dealogic (Americas and EMEA) as of December 31, 2021
22 Thomson Reuters as of December 31, 2021
23 With the exception of Index Access and APAC Delta One
24 Allocated capital based on the average of 13.5% of risk-weighted assets and 4.25% of leverage exposure
25 Since restated history, commencing in 2016
26 F Credit Suisse’F the Credit Suisse Sustainable Investment Framework (Sustainable AuM), reflecting a combination of further product classifications, onboarding of new sustainable funds, net sales and market as well as FX movements
Abbreviations
AM – Asset Management; APAC – Asia Pacific; AUD – Australian dollar; AuM – assets under management; BCBS – Basel Committee on Banking Supervision; BIS – Bank for International Settlements; bn – billion; CET1 – common equity tier 1; CHF – Swiss francs; CSAM – Credit Suisse Asset Management; DLJ – Donaldson, Lufkin & Jenrette; EMEA – Europe, Middle East and Africa; ESG – Environmental, Social and Governance; ECM – Equity Capital Markets; FINMA – Swiss Financial Market Supervisory Authority FINMA; FX – Foreign Exchange; GAAP – Generally accepted accounting principles; GTS – Global Trading Solutions; HQLA – High-quality liquid assets; HRH – His Royal Highness; IB – Investment Bank; IWM – International Wealth Management; mn – million; M&A – Mergers & Acquisitions; NAV – Net Asset Value; NNA – net new assets; PC – Private Clients; RoTE – Return on Tangible Equity; RWA – risk weighted assets; SCFF – Supply Chain Finance Funds; SEC – US Securities and Exchange Commission; SIX – SIX Swiss Exchange; SPAC – Special-Purpose Acquisition Company; SRI – Sustainability, Research & Investment Solutions; SUB – Swiss Universal Bank; SCFF – Supply Chain Finance Funds; TBTF – Too big to fail; trn – trillion; (U)HNW – (Ultra) high-net-worth; UK – United Kingdom; US – United States; USD – US dollar.
Important information
This document contains select information from the full 4Q21 Earnings Release and 4Q21 Results Presentation slides that Credit Suisse believes is of particular interest to media professionals. The complete 4Q21 Earnings Release and 4Q21 Results Presentation slides, which have been distributed simultaneously, contain more comprehensive information about our results and operations for the reporting quarter, as well as important information about our reporting methodology and some of the terms used in these documents. The complete 4Q21 Earnings Release and 4Q21 Results Presentation slides are not incorporated by reference into this document.
Credit Suisse has not finalized its 2021 Annual Report and Credit Suisse’s independent registered public accounting firm has not completed its audit of the consolidated financial statements for the period. Accordingly, the financial information contained in this document is subject to completion of year-end procedures, which may result in changes to that information.
Media Release Zurich, February 10, 2022 |
This document contains certain unaudited interim financial information for the first quarter of 2022. This information has been derived from management accounts, is preliminary in nature, does not reflect the complete results of the first quarter of 2022 and is subject to change, including as a result of any normal quarterly adjustments in relation to the financial statements for the first quarter of 2022. This information has not been subject to any review by our independent registered public accounting firm. There can be no assurance that the final results for these periods will not differ from these preliminary results, and any such differences could be material. Quarterly financial results for the first quarter of 2022 will be included in our 1Q22 Financial Report. These interim results of operations are not necessarily indicative of the results to be achieved for the remainder of the full first quarter of 2022.
We may not achieve all of the expected benefits of our strategic initiatives. Factors beyond our control, including but not limited to the market and economic conditions (including macroeconomic and other challenges and uncertainties, for example, resulting from the COVID-19 pandemic), changes in laws, rules or regulations and other challenges discussed in our public filings, could limit our ability to achieve some or all of the expected benefits of these initiatives.
In particular, the terms “Estimate”, “Illustrative”, “Ambition”, “Objective”, “Outlook”, “Goal”, “Commitment” and “Aspiration” are not intended to be viewed as targets or projections, nor are they considered to be Key Performance Indicators. All such estimates, illustrations, ambitions, objectives, outlooks, goals, commitments and aspirations are subject to a large number of inherent risks, assumptions and uncertainties, many of which are completely outside of our control. These risks, assumptions and uncertainties include, but are not limited to, general market conditions, market volatility, increased inflation, interest rate volatility and levels, global and regional economic conditions, challenges and uncertainties resulting from the COVID-19 pandemic, political uncertainty, changes in tax policies, regulatory changes, changes in levels of client activity as a result of any of the foregoing and other factors. Accordingly, this information should not be relied on for any purpose. We do not intend to update these estimates, illustrations, ambitions, objectives, outlooks, goals, commitments or aspirations.
In preparing this document, management has made estimates and assumptions that affect the numbers presented. Actual results may differ. Annualized numbers do not take into account variations in operating results, seasonality and other factors and may not be indicative of actual, full-year results. Figures throughout this document may also be subject to rounding adjustments. All opinions and views constitute judgments as of the date of writing without regard to the date on which the reader may receive or access the information. This information is subject to change at any time without notice and we do not intend to update this information.
Return on tangible equity, a non-GAAP financial measure, is calculated as annualized net income attributable to shareholders divided by average tangible shareholders’ equity. Tangible shareholders’ equity, a non-GAAP financial measure, is calculated by deducting goodwill and other intangible assets from total shareholders’ equity as presented in our balance sheet. Management believes that return on tangible equity is meaningful as it is a measure used and relied upon by industry analysts and investors to assess valuations and capital adequacy. For end-4Q21, tangible shareholders’ equity excluded goodwill of CHF 2,917 million and other intangible assets of CHF 276 million from total shareholders’ equity of CHF 44,032 million as presented in our balance sheet. For end-3Q21, tangible shareholders’ equity excluded goodwill of CHF 4,615 million and other intangible assets of CHF 234 million from total shareholders’ equity of CHF 44,498 million as presented in our balance sheet. For end-4Q20, tangible shareholders’ equity excluded goodwill of CHF 4,426 million and other intangible assets of CHF 237 million from total shareholders’ equity of CHF 42,677 million as presented in our balance sheet.
Beginning in 3Q21, the return on regulatory capital calculation has been updated to closer align with the actual capital and leverage ratio levels under which Credit Suisse operates, rather than the previously used minimum requirements set by regulators. Regulatory capital is calculated as the average of 13.5% of RWA and 4.25% of leverage exposure and return on regulatory capital, a non-GAAP financial measure, is calculated using income/(loss) after tax and assumes a tax rate of 30% for periods prior to 2020 and 25% from 2020 onward. Prior periods have been restated. For periods in 2020, for purposes of calculating Group return on regulatory capital, leverage exposure excludes cash held at central banks, after adjusting for the dividend paid in 2020. For the Investment Bank division, return on regulatory capital is based on US dollar denominated numbers. Return on regulatory capital excluding certain items included in our reported results is calculated using results excluding such items, applying the same methodology.
Credit Suisse is subject to the Basel framework, as implemented in Switzerland, as well as Swiss legislation and regulations for systemically important banks, which include capital, liquidity, leverage and large exposure requirements and rules for emergency plans designed to maintain systemically relevant functions in the event of threatened insolvency. Credit Suisse has adopted the Bank for International Settlements (BIS) leverage ratio framework, as issued by the Basel Committee on Banking Supervision (BCBS) and implemented in Switzerland by the Swiss Financial Market Supervisory Authority FINMA (FINMA).
Unless otherwise noted, all CET1 ratio, Tier-1 leverage ratio, risk-weighted assets and leverage exposure figures in this document are as of the end of the respective period.
Unless otherwise noted, leverage exposure is based on the BIS leverage ratio framework and consists of period-end balance sheet assets and prescribed regulatory adjustments. The tier 1 leverage ratio and CET1 leverage ratio are calculated as BIS tier
Media Release Zurich, February 10, 2022 |
1 capital and CET1 capital, respectively, divided by period end leverage exposure. Unless otherwise noted, for periods in 2020, leverage exposure excludes cash held at central banks, after adjusting for the dividend paid in 2020.
Client business volume includes assets under management, custody assets (including assets under custody and commercial assets) and net loans.
References to Wealth Management mean SUB PC, IWM and APAC or their combined results. References to Wealth Management-related mean SUB, IWM, APAC and AM or their combined results.
Investors and others should note that we announce important company information (including quarterly earnings releases and financial reports as well as our annual sustainability report) to the investing public using press releases, SEC and Swiss ad hoc filings, our website and public conference calls and webcasts. We also routinely use our Twitter account @creditsuisse (https://twitter.com/creditsuisse), our LinkedIn account (https://www.linkedin.com/company/credit-suisse/), our Instagram accounts (https://www.instagram.com/creditsuisse_careers/ and https://www.instagram.com/creditsuisse_ch/), our Facebook account (https://www.facebook.com/creditsuisse/) and other social media channels as additional means to disclose public information, including to excerpt key messages from our public disclosures. We may share or retweet such messages through certain of our regional accounts, including through Twitter at @csschweiz (https://twitter.com/csschweiz) and @csapac (https://twitter.com/csapac). Investors and others should take care to consider such abbreviated messages in the context of the disclosures from which they are excerpted. The information we post on these social media accounts is not a part of this document.
Information referenced in this document, whether via website links or otherwise, is not incorporated into this document.
Certain material in this document has been prepared by Credit Suisse on the basis of publicly available information, internally developed data and other third-party sources believed to be reliable. Credit Suisse has not sought to independently verify information obtained from public and third-party sources and makes no representations or warranties as to accuracy, completeness or reliability of such information.
In various tables, use of “–” indicates not meaningful or not applicable.
The English language version of this document is the controlling version.
| Appendix |
| Key metrics | |||||||||||||||||
| in / end of | % change | in / end of | % change | ||||||||||||||
| 4Q21 | 3Q21 | 4Q20 | QoQ | YoY | 2021 | 2020 | YoY | ||||||||||
| Credit Suisse Group results (CHF million) | |||||||||||||||||
| Net revenues | 4,582 | 5,437 | 5,221 | (16) | (12) | 22,696 | 22,389 | 1 | |||||||||
| Provision for credit losses | (20) | (144) | 138 | (86) | – | 4,205 | 1,096 | 284 | |||||||||
| Compensation and benefits | 2,145 | 2,255 | 2,539 | (5) | (16) | 8,963 | 9,890 | (9) | |||||||||
| General and administrative expenses | 2,104 | 2,012 | 2,279 | 5 | (8) | 7,081 | 6,523 | 9 | |||||||||
| Commission expenses | 283 | 306 | 303 | (8) | (7) | 1,243 | 1,256 | (1) | |||||||||
| Goodwill impairment | 1,623 | 0 | 0 | – | – | 1,623 | 0 | – | |||||||||
| Restructuring expenses | 33 | – | 50 | – | (34) | 103 | 157 | (34) | |||||||||
| Total other operating expenses | 4,043 | 2,318 | 2,632 | 74 | 54 | 10,050 | 7,936 | 27 | |||||||||
| Total operating expenses | 6,188 | 4,573 | 5,171 | 35 | 20 | 19,013 | 17,826 | 7 | |||||||||
| Income/(loss) before taxes | (1,586) | 1,008 | (88) | – | – | (522) | 3,467 | – | |||||||||
| Net income/(loss) attributable to shareholders | (2,007) | 434 | (353) | – | 469 | (1,572) | 2,669 | – | |||||||||
| Statement of operations metrics (%) | |||||||||||||||||
| Return on regulatory capital | (12.7) | 7.9 | (0.7) | – | – | (1.0) | 6.9 | – | |||||||||
| Balance sheet statistics (CHF million) | |||||||||||||||||
| Total assets | 741,781 | 805,889 | 805,822 | (8) | (8) | 741,781 | 805,822 | (8) | |||||||||
| Risk-weighted assets | 267,787 | 278,139 | 275,084 | (4) | (3) | 267,787 | 275,084 | (3) | |||||||||
| Leverage exposure | 875,086 | 923,075 | 799,853 | (5) | 9 | 875,086 | 799,853 | 9 | |||||||||
| Assets under management and net new assets (CHF billion) | |||||||||||||||||
| Assets under management | 1,614.0 | 1,623.0 | 1,511.9 | (0.6) | 6.8 | 1,614.0 | 1,511.9 | 6.8 | |||||||||
| Net new assets | 1.6 | 5.6 | 8.4 | (71.4) | (81.0) | 30.9 | 42.0 | (26.4) | |||||||||
| Basel III regulatory capital and leverage statistics (%) | |||||||||||||||||
| CET1 ratio | 14.4 | 14.4 | 12.9 | – | – | 14.4 | 12.9 | – | |||||||||
| CET1 leverage ratio | 4.4 | 4.3 | 4.4 | – | – | 4.4 | 4.4 | – | |||||||||
| Tier 1 leverage ratio | 6.2 | 6.1 | 6.4 | – | – | 6.2 | 6.4 | – | |||||||||
Page A-1
| Appendix |
Results excluding certain items included in our reported results are non-GAAP financial measures. Management believes that such results provide a useful presentation of our operating results for purposes of assessing our Group and divisional performance consistently over time, on a basis that excludes items that management does not consider representative of our underlying performance. Provided below is a reconciliation to the most directly comparable US GAAP measures.
| Reconciliation of adjustment items | |||||||||||
| Group | |||||||||||
| in | 4Q21 | 3Q21 | 4Q20 | 2021 | 2020 | ||||||
| Results (CHF million) | |||||||||||
| Net revenues | 4,582 | 5,437 | 5,221 | 22,696 | 22,389 | ||||||
| Real estate (gains)/losses | (224) | (4) | (15) | (232) | (15) | ||||||
| (Gains)/losses on business sales | (13) | 42 | 0 | 29 | 0 | ||||||
| Major litigation recovery | 0 | 0 | 0 | (49) | 0 | ||||||
| Valuation adjustment related to major litigation | 0 | 69 | 0 | 69 | 0 | ||||||
| Adjusted net revenues | 4,345 | 5,544 | 5,206 | 22,513 | 22,374 | ||||||
| Significant items | |||||||||||
| Gain related to InvestLab transfer | 0 | 0 | 0 | 0 | (268) | ||||||
| Gain on equity investment in Allfunds Group | (31) | (130) | (127) | (622) | (127) | ||||||
| (Gain)/loss on equity investment in SIX Group AG | 70 | 0 | (158) | 70 | (158) | ||||||
| Gain on equity investment in Pfandbriefbank | 0 | 0 | 0 | 0 | (134) | ||||||
| Impairment on York Capital Management | 0 | 113 | 414 | 113 | 414 | ||||||
| Adjusted net revenues excluding significant items | 4,384 | 5,527 | 5,335 | 22,074 | 22,101 | ||||||
| Archegos | 0 | (23) | 0 | 470 | 0 | ||||||
| Adjusted net revenues excluding significant items and Archegos | 4,384 | 5,504 | 5,335 | 22,544 | 22,101 | ||||||
| Provision for credit losses | (20) | (144) | 138 | 4,205 | 1,096 | ||||||
| Archegos | 5 | 188 | 0 | (4,307) | 0 | ||||||
| Provision for credit losses excluding Archegos | (15) | 44 | 138 | (102) | 1,096 | ||||||
| Total operating expenses | 6,188 | 4,573 | 5,171 | 19,013 | 17,826 | ||||||
| Goodwill impairment | (1,623) | 0 | 0 | (1,623) | 0 | ||||||
| Restructuring expenses | (33) | – | (50) | (103) | (157) | ||||||
| Major litigation provisions | (436) | (495) | (757) | (1,143) | (988) | ||||||
| Expenses related to real estate disposals | (11) | (3) | (28) | (56) | (51) | ||||||
| Adjusted total operating expenses | 4,085 | 4,075 | 4,336 | 16,088 | 16,630 | ||||||
| Significant items | |||||||||||
| Expenses related to equity investment in Allfunds Group | 0 | (1) | 0 | (20) | 0 | ||||||
| Adjusted total operating expenses excluding significant items | 4,085 | 4,074 | 4,336 | 16,068 | 16,630 | ||||||
| Archegos | (14) | 24 | 0 | (21) | 0 | ||||||
| Adjusted total operating expenses excluding significant items and Archegos | 4,071 | 4,098 | 4,336 | 16,047 | 16,630 | ||||||
| Income/(loss) before taxes | (1,586) | 1,008 | (88) | (522) | 3,467 | ||||||
| Adjusted income before taxes | 280 | 1,613 | 732 | 2,220 | 4,648 | ||||||
| Adjusted income before taxes excluding significant items | 319 | 1,597 | 861 | 1,801 | 4,375 | ||||||
| Adjusted income before taxes excluding significant items and Archegos | 328 | 1,362 | 861 | 6,599 | 4,375 | ||||||
| Adjusted return on regulatory capital (%) | 2.2 | 12.6 | 6.1 | 4.4 | 9.3 | ||||||
| Adjusted return on regulatory capital excluding significant items (%) | 2.6 | 12.4 | 7.1 | 3.5 | 8.7 | ||||||
| Adjusted return on regulatory capital excluding significant items and Archegos (%) | 2.6 | 10.6 | 7.1 | 13.0 | 8.7 | ||||||
Page A-2
| Appendix |
| Swiss Universal Bank | |||||||||||||||||
| in / end of | % change | in / end of | % change | ||||||||||||||
| 4Q21 | 3Q21 | 4Q20 | QoQ | YoY | 2021 | 2020 | YoY | ||||||||||
| Results (CHF million) | |||||||||||||||||
| Net revenues | 1,484 | 1,391 | 1,393 | 7 | 7 | 5,801 | 5,615 | 3 | |||||||||
| of which Private Clients | 889 | 724 | 750 | 23 | 19 | 3,068 | 3,055 | 0 | |||||||||
| of which Corporate & Institutional Clients | 595 | 667 | 643 | (11) | (7) | 2,733 | 2,560 | 7 | |||||||||
| Provision for credit losses | (3) | 4 | 66 | – | – | 6 | 270 | (98) | |||||||||
| Total operating expenses | 771 | 764 | 840 | 1 | (8) | 3,066 | 3,241 | (5) | |||||||||
| Income before taxes | 716 | 623 | 487 | 15 | 47 | 2,729 | 2,104 | 30 | |||||||||
| of which Private Clients | 424 | 270 | 257 | 57 | 65 | 1,234 | 1,080 | 14 | |||||||||
| of which Corporate & Institutional Clients | 292 | 353 | 230 | (17) | 27 | 1,495 | 1,024 | 46 | |||||||||
| Metrics (%) | |||||||||||||||||
| Return on regulatory capital | 18.1 | 15.6 | 12.4 | – | – | 17.1 | 13.4 | – | |||||||||
| Cost/income ratio | 52.0 | 54.9 | 60.3 | – | – | 52.9 | 57.7 | – | |||||||||
| Private Clients | |||||||||||||||||
| Assets under management (CHF billion) | 217.5 | 217.3 | 208.6 | 0.1 | 4.3 | 217.5 | 208.6 | 4.3 | |||||||||
| Net new assets (CHF billion) | (1.8) | 1.9 | (2.1) | – | – | 1.4 | (5.9) | – | |||||||||
| Gross margin (annualized) (bp) | 163 | 133 | 146 | – | – | 143 | 149 | – | |||||||||
| Net margin (annualized) (bp) | 78 | 50 | 50 | – | – | 58 | 53 | – | |||||||||
| Corporate & Institutional Clients | |||||||||||||||||
| Assets under management (CHF billion) | 513.5 | 506.3 | 462.6 | 1.4 | 11.0 | 513.5 | 462.6 | 11.0 | |||||||||
| Net new assets (CHF billion) | 0.1 | (0.4) | 3.8 | – | – | 5.1 | 13.7 | – | |||||||||
| Reconciliation of adjustment items | |||||||||||||||||||
| Private Clients | Corporate & Institutional Clients | Swiss Universal Bank | |||||||||||||||||
| in | 4Q21 | 3Q21 | 4Q20 | 4Q21 | 3Q21 | 4Q20 | 4Q21 | 3Q21 | 4Q20 | ||||||||||
| Results (CHF million) | |||||||||||||||||||
| Net revenues | 889 | 724 | 750 | 595 | 667 | 643 | 1,484 | 1,391 | 1,393 | ||||||||||
| Real estate (gains)/losses | (205) | (4) | (15) | 0 | 0 | 0 | (205) | (4) | (15) | ||||||||||
| (Gains)/losses on business sales | 0 | 6 | 0 | 0 | 0 | 0 | 0 | 6 | 0 | ||||||||||
| Adjusted net revenues | 684 | 726 | 735 | 595 | 667 | 643 | 1,279 | 1,393 | 1,378 | ||||||||||
| Significant items | |||||||||||||||||||
| Gain on equity investment in Allfunds Group | 0 | 0 | 0 | (9) | (39) | (38) | (9) | (39) | (38) | ||||||||||
| (Gain)/loss on equity investment in SIX Group AG | 21 | 0 | (47) | 22 | 0 | (50) | 43 | 0 | (97) | ||||||||||
| Adjusted net revenues excluding significant items | 705 | 726 | 688 | 608 | 628 | 555 | 1,313 | 1,354 | 1,243 | ||||||||||
| Provision for credit losses | 11 | 9 | 17 | (14) | (5) | 49 | (3) | 4 | 66 | ||||||||||
| Total operating expenses | 454 | 445 | 476 | 317 | 319 | 364 | 771 | 764 | 840 | ||||||||||
| Restructuring expenses | 0 | – | 1 | 0 | – | (4) | 0 | – | (3) | ||||||||||
| Major litigation provisions | 0 | 0 | 0 | (1) | 0 | (44) | (1) | 0 | (44) | ||||||||||
| Expenses related to real estate disposals | 0 | 0 | (3) | 0 | 0 | 0 | 0 | 0 | (3) | ||||||||||
| Adjusted total operating expenses | 454 | 445 | 474 | 316 | 319 | 316 | 770 | 764 | 790 | ||||||||||
| Income before taxes | 424 | 270 | 257 | 292 | 353 | 230 | 716 | 623 | 487 | ||||||||||
| Adjusted income before taxes | 219 | 272 | 244 | 293 | 353 | 278 | 512 | 625 | 522 | ||||||||||
| Adjusted income before taxes excluding significant items | 240 | 272 | 197 | 306 | 314 | 190 | 546 | 586 | 387 | ||||||||||
| Adjusted return on regulatory capital (%) | – | – | – | – | – | – | 12.9 | 15.6 | 13.3 | ||||||||||
| Adjusted return on regulatory capital excluding significant items (%) | – | – | – | – | – | – | 13.8 | 14.6 | 9.9 | ||||||||||
Page A-3
| Appendix |
| Reconciliation of adjustment items (continued) | |||||||||||||
Private Clients | Corporate & Institutional Clients | Swiss Universal Bank | |||||||||||
| in | 2021 | 2020 | 2021 | 2020 | 2021 | 2020 | |||||||
| Results (CHF million) | |||||||||||||
| Net revenues | 3,068 | 3,055 | 2,733 | 2,560 | 5,801 | 5,615 | |||||||
| Real estate (gains)/losses | (213) | (15) | 0 | 0 | (213) | (15) | |||||||
| (Gains)/losses on business sales | 6 | 0 | 0 | 0 | 6 | 0 | |||||||
| Major litigation recovery | 0 | 0 | (49) | 0 | (49) | 0 | |||||||
| Adjusted net revenues | 2,861 | 3,040 | 2,684 | 2,560 | 5,545 | 5,600 | |||||||
| Significant items | |||||||||||||
| Gain related to InvestLab transfer | 0 | 0 | 0 | (25) | 0 | (25) | |||||||
| Gain on equity investment in Allfunds Group | 0 | 0 | (186) | (38) | (186) | (38) | |||||||
| (Gain)/loss on equity investment in SIX Group AG | 21 | (47) | 22 | (50) | 43 | (97) | |||||||
| Gain on equity investment in Pfandbriefbank | 0 | (134) | 0 | 0 | 0 | (134) | |||||||
| Adjusted net revenues excluding significant items | 2,882 | 2,859 | 2,520 | 2,447 | 5,402 | 5,306 | |||||||
| Provision for credit losses | 30 | 62 | (24) | 208 | 6 | 270 | |||||||
| Total operating expenses | 1,804 | 1,913 | 1,262 | 1,328 | 3,066 | 3,241 | |||||||
| Restructuring expenses | (6) | (35) | (8) | (9) | (14) | (44) | |||||||
| Major litigation provisions | 0 | 0 | (1) | (45) | (1) | (45) | |||||||
| Expenses related to real estate disposals | (4) | (3) | 0 | 0 | (4) | (3) | |||||||
| Adjusted total operating expenses | 1,794 | 1,875 | 1,253 | 1,274 | 3,047 | 3,149 | |||||||
| Significant items | |||||||||||||
| Expenses related to equity investment in Allfunds Group | 0 | 0 | (6) | 0 | (6) | 0 | |||||||
| Adjusted total operating expenses excluding significant items | 1,794 | 1,875 | 1,247 | 1,274 | 3,041 | 3,149 | |||||||
| Income before taxes | 1,234 | 1,080 | 1,495 | 1,024 | 2,729 | 2,104 | |||||||
| Adjusted income before taxes | 1,037 | 1,103 | 1,455 | 1,078 | 2,492 | 2,181 | |||||||
| Adjusted income before taxes excluding significant items | 1,058 | 922 | 1,297 | 965 | 2,355 | 1,887 | |||||||
| Adjusted return on regulatory capital (%) | – | – | – | – | 15.6 | 13.9 | |||||||
| Adjusted return on regulatory capital excluding significant items (%) | – | – | – | – | 14.8 | 12.0 | |||||||
Page A-4
| Appendix |
| International Wealth Management | |||||||||||||||||
| in / end of | % change | in / end of | % change | ||||||||||||||
| 4Q21 | 3Q21 | 4Q20 | QoQ | YoY | 2021 | 2020 | YoY | ||||||||||
| Results (CHF million) | |||||||||||||||||
| Net revenues | 716 | 829 | 974 | (14) | (26) | 3,462 | 3,747 | (8) | |||||||||
| Provision for credit losses | (1) | 12 | 31 | – | – | (14) | 110 | – | |||||||||
| Total operating expenses | 682 | 624 | 650 | 9 | 5 | 2,500 | 2,546 | (2) | |||||||||
| Income before taxes | 35 | 193 | 293 | (82) | (88) | 976 | 1,091 | (11) | |||||||||
| Metrics (%) | |||||||||||||||||
| Return on regulatory capital | 2.4 | 12.6 | 19.7 | – | – | 16.2 | 18.4 | – | |||||||||
| Cost/income ratio | 95.3 | 75.3 | 66.7 | – | – | 72.2 | 67.9 | – | |||||||||
| Assets under management (CHF billion) | 390.7 | 395.7 | 365.4 | (1.3) | 6.9 | 390.7 | 365.4 | 6.9 | |||||||||
| Net new assets (CHF billion) | 2.7 | 1.4 | 4.3 | – | – | 11.0 | 16.7 | – | |||||||||
| Gross margin (annualized) (bp) | 73 | 84 | 109 | – | – | 89 | 107 | – | |||||||||
| Net margin (annualized) (bp) | 4 | 20 | 33 | – | – | 25 | 31 | – | |||||||||
| Reconciliation of adjustment items | |||||||||||
| International Wealth Management | |||||||||||
| in | 4Q21 | 3Q21 | 4Q20 | 2021 | 2020 | ||||||
| Results (CHF million) | |||||||||||
| Net revenues | 716 | 829 | 974 | 3,462 | 3,747 | ||||||
| Real estate (gains)/losses | (19) | 0 | 0 | (19) | 0 | ||||||
| (Gains)/losses on business sales | (17) | 35 | 0 | 18 | 0 | ||||||
| Adjusted net revenues | 680 | 864 | 974 | 3,461 | 3,747 | ||||||
| Significant items | |||||||||||
| Gain related to InvestLab transfer | 0 | 0 | 0 | 0 | (15) | ||||||
| Gain on equity investment in Allfunds Group | (12) | (52) | (51) | (249) | (51) | ||||||
| (Gain)/loss on equity investment in SIX Group AG | 27 | 0 | (61) | 27 | (61) | ||||||
| Adjusted net revenues excluding significant items | 695 | 812 | 862 | 3,239 | 3,620 | ||||||
| Provision for credit losses | (1) | 12 | 31 | (14) | 110 | ||||||
| Total operating expenses | 682 | 624 | 650 | 2,500 | 2,546 | ||||||
| Restructuring expenses | (7) | – | (21) | (12) | (37) | ||||||
| Major litigation provisions | (2) | 0 | (1) | 9 | 11 | ||||||
| Expenses related to real estate disposals | (2) | 0 | (3) | (7) | (5) | ||||||
| Adjusted total operating expenses | 671 | 624 | 625 | 2,490 | 2,515 | ||||||
| Significant items | |||||||||||
| Expenses related to equity investment in Allfunds Group | 0 | 0 | 0 | (7) | 0 | ||||||
| Adjusted total operating expenses excluding significant items | 671 | 624 | 625 | 2,483 | 2,515 | ||||||
| Income before taxes | 35 | 193 | 293 | 976 | 1,091 | ||||||
| Adjusted income before taxes | 10 | 228 | 318 | 985 | 1,122 | ||||||
| Adjusted income before taxes excluding significant items | 25 | 176 | 206 | 770 | 995 | ||||||
| Adjusted return on regulatory capital (%) | 0.7 | 14.8 | 21.4 | 16.3 | 18.9 | ||||||
| Adjusted return on regulatory capital excluding significant items (%) | 1.8 | 11.5 | 13.8 | 12.8 | 16.8 | ||||||
Page A-5
| Appendix |
| Asia Pacific | |||||||||||||||||
| in / end of | % change | in / end of | % change | ||||||||||||||
| 4Q21 | 3Q21 | 4Q20 | QoQ | YoY | 2021 | 2020 | YoY | ||||||||||
| Results (CHF million) | |||||||||||||||||
| Net revenues | 613 | 771 | 784 | (20) | (22) | 3,242 | 3,155 | 3 | |||||||||
| Provision for credit losses | (13) | 7 | 6 | – | – | 27 | 236 | (89) | |||||||||
| Total operating expenses | 634 | 536 | 541 | 18 | 17 | 2,221 | 2,091 | 6 | |||||||||
| Income/(loss) before taxes | (8) | 228 | 237 | – | – | 994 | 828 | 20 | |||||||||
| Metrics (%) | |||||||||||||||||
| Return on regulatory capital | (0.7) | 19.2 | 21.1 | – | – | 21.3 | 17.1 | – | |||||||||
| Cost/income ratio | 103.4 | 69.5 | 69.0 | – | – | 68.5 | 66.3 | – | |||||||||
| Assets under management (CHF billion) | 218.8 | 230.1 | 221.3 | (4.9) | (1.1) | 218.8 | 221.3 | (1.1) | |||||||||
| Net new assets (CHF billion) | (2.9) | 2.9 | (1.1) | – | – | (1.1) | 8.6 | – | |||||||||
| Gross margin (annualized) (bp) | 108 | 134 | 141 | – | – | 141 | 147 | – | |||||||||
| Net margin (annualized) (bp) | (1) | 40 | 43 | – | – | 43 | 39 | – | |||||||||
| Results (USD million) | |||||||||||||||||
| Net revenues | 671 | 837 | 871 | (20) | (23) | 3,548 | 3,378 | 5 | |||||||||
| Provision for credit losses | (14) | 7 | 7 | – | – | 29 | 248 | (88) | |||||||||
| Total operating expenses | 694 | 583 | 600 | 19 | 16 | 2,431 | 2,241 | 8 | |||||||||
| Income/(loss) before taxes | (9) | 247 | 264 | – | – | 1,088 | 889 | 22 | |||||||||
| Reconciliation of adjustment items | |||||||||||
| Asia Pacific | |||||||||||
| in | 4Q21 | 3Q21 | 4Q20 | 2021 | 2020 | ||||||
| Results (CHF million) | |||||||||||
| Net revenues | 613 | 771 | 784 | 3,242 | 3,155 | ||||||
| Significant items | |||||||||||
| Gain related to InvestLab transfer | 0 | 0 | 0 | 0 | (25) | ||||||
| Gain on equity investment in Allfunds Group | (10) | (39) | (38) | (187) | (38) | ||||||
| Adjusted net revenues excluding significant items | 603 | 732 | 746 | 3,055 | 3,092 | ||||||
| Provision for credit losses | (13) | 7 | 6 | 27 | 236 | ||||||
| Total operating expenses | 634 | 536 | 541 | 2,221 | 2,091 | ||||||
| Goodwill impairment | (103) | 0 | 0 | (103) | 0 | ||||||
| Restructuring expenses | 0 | – | (2) | (4) | (4) | ||||||
| Adjusted total operating expenses | 531 | 536 | 539 | 2,114 | 2,087 | ||||||
| Significant items | |||||||||||
| Expenses related to equity investment in Allfunds Group | 0 | (1) | 0 | (7) | 0 | ||||||
| Adjusted total operating expenses excluding significant items | 531 | 535 | 539 | 2,107 | 2,087 | ||||||
| Income/(loss) before taxes | (8) | 228 | 237 | 994 | 828 | ||||||
| Adjusted income before taxes | 95 | 228 | 239 | 1,101 | 832 | ||||||
| Adjusted income before taxes excluding significant items | 85 | 190 | 201 | 921 | 769 | ||||||
| Adjusted return on regulatory capital (%) | 8.5 | 19.2 | 21.2 | 23.6 | 17.2 | ||||||
| Adjusted return on regulatory capital excluding significant items (%) | 7.7 | 16.0 | 17.8 | 19.7 | 15.9 | ||||||
Page A-6
| Appendix |
| Reconciliation of adjustment items | |||||||||||
| Asia Pacific | |||||||||||
| in | 4Q21 | 3Q21 | 4Q20 | 2021 | 2020 | ||||||
| Results (USD million) | |||||||||||
| Net revenues | 671 | 837 | 871 | 3,548 | 3,378 | ||||||
| Significant items | |||||||||||
| Gain related to InvestLab transfer | 0 | 0 | 0 | 0 | (26) | ||||||
| Gain on equity investment in Allfunds Group | (10) | (42) | (43) | (203) | (43) | ||||||
| Adjusted net revenues excluding significant items | 661 | 795 | 828 | 3,345 | 3,309 | ||||||
| Provision for credit losses | (14) | 7 | 7 | 29 | 248 | ||||||
| Total operating expenses | 694 | 583 | 600 | 2,431 | 2,241 | ||||||
| Restructuring expenses | 0 | – | (1) | (4) | (4) | ||||||
| Adjusted total operating expenses | 581 | 583 | 599 | 2,314 | 2,237 | ||||||
| Significant items | |||||||||||
| Expenses related to equity investment in Allfunds Group | 0 | (1) | 0 | (7) | 0 | ||||||
| Adjusted total operating expenses excluding significant items | 581 | 582 | 599 | 2,307 | 2,237 | ||||||
| Income/(loss) before taxes | (9) | 247 | 264 | 1,088 | 889 | ||||||
| Adjusted income before taxes | 104 | 247 | 265 | 1,205 | 893 | ||||||
| Adjusted income before taxes excluding significant items | 94 | 206 | 222 | 1,009 | 824 | ||||||
| Adjusted return on regulatory capital (%) | 8.6 | 19.4 | 21.2 | 23.7 | 17.3 | ||||||
| Adjusted return on regulatory capital excluding significant items (%) | 7.7 | 16.1 | 17.8 | 19.8 | 15.9 | ||||||
Page A-7
| Appendix |
| Asset Management | |||||||||||||||||
| in / end of | % change | in / end of | % change | ||||||||||||||
| 4Q21 | 3Q21 | 4Q20 | QoQ | YoY | 2021 | 2020 | YoY | ||||||||||
| Results (CHF million) | |||||||||||||||||
| Net revenues | 387 | 279 | (22) | 39 | – | 1,456 | 1,090 | 34 | |||||||||
| Provision for credit losses | (2) | 1 | (6) | – | (67) | 0 | 0 | – | |||||||||
| Total operating expenses | 310 | 276 | 289 | 12 | 7 | 1,156 | 1,129 | 2 | |||||||||
| Income/(loss) before taxes | 79 | 2 | (305) | – | – | 300 | (39) | – | |||||||||
| Metrics (%) | |||||||||||||||||
| Return on regulatory capital | 38.5 | 1.2 | (124.4) | – | – | 33.9 | (4.0) | – | |||||||||
| Cost/income ratio | 80.1 | 98.9 | – | – | – | 79.4 | 103.6 | – | |||||||||
| Reconciliation of adjustment items | |||||||||||
| Asset Management | |||||||||||
| in | 4Q21 | 3Q21 | 4Q20 | 2021 | 2020 | ||||||
| Results (CHF million) | |||||||||||
| Net revenues | 387 | 279 | (22) | 1,456 | 1,090 | ||||||
| Significant items | |||||||||||
| Gain related to InvestLab transfer | 0 | 0 | 0 | 0 | (203) | ||||||
| Impairment on York Capital Management | 0 | 113 | 414 | 113 | 414 | ||||||
| Adjusted net revenues excluding significant items | 387 | 392 | 392 | 1,569 | 1,301 | ||||||
| Provision for credit losses | (2) | 1 | (6) | 0 | 0 | ||||||
| Total operating expenses | 310 | 276 | 289 | 1,156 | 1,129 | ||||||
| Restructuring expenses | 0 | – | (5) | (3) | (18) | ||||||
| Expenses related to real estate disposals | 0 | 0 | (1) | (1) | (2) | ||||||
| Adjusted total operating expenses | 310 | 276 | 283 | 1,152 | 1,109 | ||||||
| Income/(loss) before taxes | 79 | 2 | (305) | 300 | (39) | ||||||
| Adjusted income/(loss) before taxes | 79 | 2 | (299) | 304 | (19) | ||||||
| Adjusted income before taxes excluding significant items | 79 | 115 | 115 | 417 | 192 | ||||||
| Adjusted return on regulatory capital (%) | 38.7 | 1.2 | (122.1) | 34.5 | (2.0) | ||||||
| Adjusted return on regulatory capital excluding significant items (%) | 38.7 | 52.1 | 47.0 | 47.3 | 19.4 | ||||||
Page A-8
| Appendix |
| Wealth Management-related - Reconciliation of adjustment items | |||||||||||
| Wealth Management-related | |||||||||||
| in | 4Q21 | 3Q21 | 4Q20 | 2021 | 2020 | ||||||
| Results (CHF million) | |||||||||||
| Net revenues | 3,200 | 3,270 | 3,129 | 13,961 | 13,607 | ||||||
| Real estate (gains)/losses | (224) | (4) | (15) | (232) | (15) | ||||||
| (Gains)/losses on business sales | (17) | 41 | 0 | 24 | 0 | ||||||
| Major litigation recovery | 0 | 0 | 0 | (49) | 0 | ||||||
| Valuation adjustment related to a major litigation | 0 | 0 | 0 | 0 | 0 | ||||||
| Adjusted net revenues | 2,959 | 3,307 | 3,114 | 13,704 | 13,592 | ||||||
| Significant items | |||||||||||
| Gain related to InvestLab transfer | 0 | 0 | 0 | 0 | (268) | ||||||
| Gain on equity investment in Allfunds Group | (31) | (130) | (127) | (622) | (127) | ||||||
| (Gain)/loss on equity investment in SIX Group AG | 70 | 0 | (158) | 70 | (158) | ||||||
| Gain on equity investment in Pfandbriefbank | 0 | 0 | 0 | 0 | (134) | ||||||
| Impairment on York Capital Management | 0 | 113 | 414 | 113 | 414 | ||||||
| Adjusted net revenues excluding significant items | 2,998 | 3,290 | 3,243 | 13,265 | 13,319 | ||||||
| Provision for credit losses | (19) | 24 | 97 | 19 | 616 | ||||||
| Total operating expenses | 2,397 | 2,200 | 2,320 | 8,943 | 9,007 | ||||||
| Goodwill impairment | (103) | 0 | 0 | (103) | 0 | ||||||
| Restructuring expenses | (7) | 0 | (31) | (33) | (103) | ||||||
| Major litigation provisions | (3) | 0 | (45) | 8 | (34) | ||||||
| Expenses related to real estate disposals | (2) | 0 | (7) | (12) | (10) | ||||||
| Adjusted total operating expenses | 2,282 | 2,200 | 2,237 | 8,803 | 8,860 | ||||||
| Significant items | |||||||||||
| Expenses related to equity investment in Allfunds Group | 0 | (1) | 0 | (20) | 0 | ||||||
| Adjusted total operating expenses excluding significant items | 2,282 | 2,199 | 2,237 | 8,783 | 8,860 | ||||||
| Income before taxes | 822 | 1,046 | 712 | 4,999 | 3,984 | ||||||
| Adjusted income before taxes | 696 | 1,083 | 780 | 4,882 | 4,116 | ||||||
| Adjusted income before taxes excluding significant items | 735 | 1,067 | 909 | 4,463 | 3,843 | ||||||
Page A-9
| Appendix |
| Investment Bank | |||||||||||||||||
| in / end of | % change | in / end of | % change | ||||||||||||||
| 4Q21 | 3Q21 | 4Q20 | QoQ | YoY | 2021 | 2020 | YoY | ||||||||||
| Results (CHF million) | |||||||||||||||||
| Net revenues | 1,469 | 2,266 | 2,109 | (35) | (30) | 8,888 | 9,098 | (2) | |||||||||
| Provision for credit losses | (1) | (170) | 38 | (99) | – | 4,193 | 471 | – | |||||||||
| Total operating expenses | 3,400 | 1,666 | 1,781 | 104 | 91 | 8,398 | 6,972 | 20 | |||||||||
| Income/(loss) before taxes | (1,930) | 770 | 290 | – | – | (3,703) | 1,655 | – | |||||||||
| Metrics (%) | |||||||||||||||||
| Return on regulatory capital | (53.1) | 20.4 | 6.9 | – | – | (22.9) | 9.6 | – | |||||||||
| Cost/income ratio | 231.4 | 73.5 | 84.4 | – | – | 94.5 | 76.6 | – | |||||||||
| Results (USD million) | |||||||||||||||||
| Net revenues | 1,605 | 2,465 | 2,337 | (35) | (31) | 9,719 | 9,718 | 0 | |||||||||
| Provision for credit losses | (1) | (182) | 42 | (99) | – | 4,451 | 489 | – | |||||||||
| Total operating expenses | 3,716 | 1,815 | 1,977 | 105 | 88 | 9,192 | 7,469 | 23 | |||||||||
| Income/(loss) before taxes | (2,110) | 832 | 318 | – | – | (3,924) | 1,760 | – | |||||||||
| Net revenue detail | |||||||||||
| in | 4Q21 | 3Q21 | 4Q20 | 2021 | 2020 | ||||||
| Net revenue detail (USD million) | |||||||||||
| Fixed income sales and trading | 491 | 801 | 788 | 3,751 | 4,266 | ||||||
| Equity sales and trading | 412 | 557 | 555 | 1,929 | 2,571 | ||||||
| Capital markets | 436 | 807 | 843 | 3,306 | 2,539 | ||||||
| Advisory and other fees | 300 | 330 | 199 | 967 | 645 | ||||||
| Other revenues | (34) | (30) | (48) | (234) | (303) | ||||||
| Net revenues | 1,605 | 2,465 | 2,337 | 9,719 | 9,718 | ||||||
Page A-10
| Appendix |
| Reconciliation of adjustment items | |||||||||||
| Investment Bank | |||||||||||
| in | 4Q21 | 3Q21 | 4Q20 | 2021 | 2020 | ||||||
| Results (CHF million) | |||||||||||
| Net revenues | 1,469 | 2,266 | 2,109 | 8,888 | 9,098 | ||||||
| Archegos | 0 | (23) | 0 | 470 | 0 | ||||||
| Adjusted net revenues excluding Archegos | 1,469 | 2,243 | 2,109 | 9,358 | 9,098 | ||||||
| Provision for credit losses | (1) | (170) | 38 | 4,193 | 471 | ||||||
| Archegos | 5 | 188 | 0 | (4,307) | 0 | ||||||
| Provision for credit losses excluding Archegos | 4 | 18 | 38 | (114) | 471 | ||||||
| Total operating expenses | 3,400 | 1,666 | 1,781 | 8,398 | 6,972 | ||||||
| Goodwill impairment | (1,520) | 0 | 0 | (1,520) | 0 | ||||||
| Restructuring expenses | (25) | – | (14) | (71) | (47) | ||||||
| Major litigation provisions | (149) | 0 | 0 | (149) | (24) | ||||||
| Expenses related to real estate disposals | (9) | (3) | (21) | (44) | (41) | ||||||
| Adjusted total operating expenses | 1,697 | 1,663 | 1,746 | 6,614 | 6,860 | ||||||
| Archegos | (19) | 24 | 0 | (26) | 0 | ||||||
| Adjusted total operating expenses excluding Archegos | 1,678 | 1,687 | 1,746 | 6,588 | 6,860 | ||||||
| Income/(loss) before taxes | (1,930) | 770 | 290 | (3,703) | 1,655 | ||||||
| Adjusted income/(loss) before taxes | (227) | 773 | 325 | (1,919) | 1,767 | ||||||
| Adjusted income/(loss) before taxes excluding Archegos | (213) | 538 | 325 | 2,884 | 1,767 | ||||||
| Adjusted return on regulatory capital (%) | (6.3) | 20.4 | 7.8 | (11.5) | 10.3 | ||||||
| Adjusted return on regulatory capital excluding Archegos (%) | (5.9) | 14.3 | 7.8 | 18.3 | 10.3 | ||||||
| Reconciliation of adjustment items | |||||||||||
| Investment Bank | |||||||||||
| in | 4Q21 | 3Q21 | 4Q20 | 2021 | 2020 | ||||||
| Results (USD million) | |||||||||||
| Net revenues | 1,605 | 2,465 | 2,337 | 9,719 | 9,718 | ||||||
| Archegos | 0 | (24) | 0 | 518 | 0 | ||||||
| Adjusted net revenues excluding Archegos | 1,604 | 2,441 | 2,337 | 10,236 | 9,718 | ||||||
| Provision for credit losses | (1) | (182) | 42 | 4,451 | 489 | ||||||
| Archegos | 5 | 202 | 0 | (4,577) | 0 | ||||||
| Provision for credit losses excluding Archegos | 4 | 20 | 42 | (126) | 489 | ||||||
| Total operating expenses | 3,716 | 1,815 | 1,977 | 9,192 | 7,469 | ||||||
| Restructuring expenses | (27) | – | (16) | (78) | (52) | ||||||
| Major litigation provisions | (163) | 0 | 0 | (163) | (25) | ||||||
| Expenses related to real estate disposals | (10) | (2) | (23) | (47) | (45) | ||||||
| Adjusted total operating expenses | 1,854 | 1,813 | 1,938 | 7,242 | 7,347 | ||||||
| Archegos | (21) | 26 | 0 | (29) | 0 | ||||||
| Adjusted total operating expenses excluding Archegos | 1,833 | 1,839 | 1,938 | 7,213 | 7,347 | ||||||
| Income/(loss) before taxes | (2,110) | 832 | 318 | (3,924) | 1,760 | ||||||
| Adjusted income/(loss) before taxes | (249) | 834 | 357 | (1,975) | 1,882 | ||||||
| Adjusted income/(loss) before taxes excluding Archegos | (233) | 582 | 357 | 3,149 | 1,882 | ||||||
| Adjusted return on regulatory capital (%) | (6.3) | 20.4 | 7.8 | (11.5) | 10.3 | ||||||
| Adjusted return on regulatory capital excluding Archegos (%) | (5.9) | 14.3 | 7.8 | 18.3 | 10.3 | ||||||
Page A-11
| Appendix |
| Global investment banking revenues | |||||||||||
| in | 4Q21 | 3Q21 | 4Q20 | 2021 | 2020 | ||||||
| Global investment banking revenues (USD million) | |||||||||||
| Fixed income sales and trading | 490 | 803 | 788 | 3,752 | 4,266 | ||||||
| Equity sales and trading | 408 | 536 | 555 | 2,446 | 2,571 | ||||||
| Capital markets | 497 | 892 | 950 | 3,649 | 2,917 | ||||||
| Advisory and other fees | 334 | 380 | 227 | 1,135 | 793 | ||||||
| Other revenues | (29) | (35) | (48) | (234) | (303) | ||||||
| Global investment banking revenues | 1,700 | 2,576 | 2,472 | 10,748 | 10,244 | ||||||
Page A-12
| Appendix |
Cautionary statement regarding forward-looking information
This document contains statements that constitute forward-looking statements. In addition, in the future we, and others on our behalf, may make statements that constitute forward-looking statements. Such forward-looking statements may include, without limitation, statements relating to the following:
■ our plans, targets or goals;
■ our future economic performance or prospects;
■ the potential effect on our future performance of certain contingencies; and
■ assumptions underlying any such statements.
Words such as “believes,” “anticipates,” “expects,” “intends” and “plans” and similar expressions are intended to identify forward-looking statements but are not the exclusive means of identifying such statements. We do not intend to update these forward-looking statements.
By their very nature, forward-looking statements involve inherent risks and uncertainties, both general and specific, and risks exist that predictions, forecasts, projections and other outcomes described or implied in forward-looking statements will not be achieved. We caution you that a number of important factors could cause results to differ materially from the plans, targets, goals, expectations, estimates and intentions expressed in such forward-looking statements and that the ongoing COVID-19 pandemic creates significantly greater uncertainty about forward-looking statements in addition to the factors that generally affect our business. These factors include:
■ the ability to maintain sufficient liquidity and access capital markets;
■ market volatility, increases in inflation and interest rate fluctuations or developments affecting interest rate levels;
■ the ongoing significant negative consequences of the Archegos and SCFF matters and our ability to successfully resolve these matters;
■ our ability to improve our risk management procedures and policies and hedging strategies;
■ the strength of the global economy in general and the strength of the economies of the countries in which we conduct our operations, in particular the risk of negative impacts of COVID-19 on the global economy and financial markets and the risk of continued slow economic recovery or downturn in the EU, the US or other developed countries or in emerging markets in 2022 and beyond;
■ the emergence of widespread health emergencies, infectious diseases or pandemics, such as COVID-19, and the actions that may be taken by governmental authorities to contain the outbreak or to counter its impact;
■ potential risks and uncertainties relating to the severity of impacts from COVID-19 and the duration of the pandemic, including potential material adverse effects on our business, financial condition and results of operations;
■ the direct and indirect impacts of deterioration or slow recovery in residential and commercial real estate markets;
■ adverse rating actions by credit rating agencies in respect of us, sovereign issuers, structured credit products or other credit-related exposures;
■ the ability to achieve our strategic goals, including those related to our targets, ambitions and financial goals;
■ the ability of counterparties to meet their obligations to us and the adequacy of our allowance for credit losses;
■ the effects of, and changes in, fiscal, monetary, exchange rate, trade and tax policies;
■ the effects of currency fluctuations, including the related impact on our business, financial condition and results of operations due to moves in foreign exchange rates;
■ political, social and environmental developments, including war, civil unrest or terrorist activity and climate change;
■ the ability to appropriately address social, environmental and sustainability concerns that may arise from our business activities;
■ the effects of, and the uncertainty arising from, the UK’s withdrawal from the EU;
■ the possibility of foreign exchange controls, expropriation, nationalization or confiscation of assets in countries in which we conduct our operations;
■ operational factors such as systems failure, human error, or the failure to implement procedures properly;
■ the risk of cyber attacks, information or security breaches or technology failures on our reputation, business or operations, the risk of which is increased while large portions of our employees work remotely;
■ the adverse resolution of litigation, regulatory proceedings and other contingencies;
■ actions taken by regulators with respect to our business and practices and possible resulting changes to our business organization, practices and policies in countries in which we conduct our operations;
■ the effects of changes in laws, regulations or accounting or tax standards, policies or practices in countries in which we conduct our operations;
■ the discontinuation of LIBOR and other interbank offered rates and the transition to alternative reference rates;
■ the potential effects of changes in our legal entity structure;
■ competition or changes in our competitive position in geographic and business areas in which we conduct our operations;
■ the ability to retain and recruit qualified personnel;
■ the ability to protect our reputation and promote our brand;
■ the ability to increase market share and control expenses;
■ technological changes instituted by us, our counterparties or competitors;
■ the timely development and acceptance of our new products and services and the perceived overall value of these products and services by users;
■ acquisitions, including the ability to integrate acquired businesses successfully, and divestitures, including the ability to sell non-core assets; and
■ other unforeseen or unexpected events and our success at managing these and the risks involved in the foregoing.
We caution you that the foregoing list of important factors is not exclusive. When evaluating forward-looking statements, you should carefully consider the foregoing factors and other uncertainties and events, including the information set forth in “Risk factors” in I – Information on the company in our Annual Report 2020 and in “Risk factor” in I – Credit Suisse results – Credit Suisse in our 1Q21 Financial Report.
Page A-13
Thomas Gottstein, Chief Executive OfficerDavid Mathers, Chief Financial OfficerFebruary 10, 2022 Credit SuisseFourth Quarter and Full Year 2021 ResultsAnalyst and Investor Call
Disclaimer (1/2) 2 February 10, 2022 Credit Suisse has not finalized its 2021 Annual Report and Credit Suisse’s independent registered public accounting firm has not completed its audit of the consolidated financial statements for the period. Accordingly, the financial information contained in this presentation is subject to completion of year-end procedures, which may result in changes to that information.This material does not purport to contain all of the information that you may wish to consider. This material is not to be relied upon as such or used in substitution for the exercise of independent judgment. Please also refer to the Fourth Quarter and Full Year 2021 Supplemental Information and our 4Q21 Earnings Release for additional information. Cautionary statement regarding forward-looking statements This presentation contains forward-looking statements that involve inherent risks and uncertainties, and we might not be able to achieve the predictions, forecasts, projections and other outcomes we describe or imply in forward-looking statements. A number of important factors could cause results to differ materially from the plans, targets, goals, expectations, estimates and intentions we express in these forward-looking statements, including those we identify in "Risk factors” in our Annual Report on Form 20-F for the fiscal year ended December 31, 2020, in “Credit Suisse – Risk factor” in our 1Q21 Financial Report published on May 6, 2021 and in the “Cautionary statement regarding forward-looking information" in our 4Q21 Earnings Release published on February 10, 2022 and filed with the US Securities and Exchange Commission, and in other public filings and press releases. We do not intend to update these forward-looking statements. In particular, the terms “Estimate”, “Illustrative”, “Ambition”, “Objective”, “Outlook”, “Goal”, “Commitment” and “Aspiration” are not intended to be viewed as targets or projections, nor are they considered to be Key Performance Indicators. All such estimates, illustrations, ambitions, objectives, outlooks, goals, commitments and aspirations are subject to a large number of inherent risks, assumptions and uncertainties, many of which are completely outside of our control. These risks, assumptions and uncertainties include, but are not limited to, general market conditions, market volatility, increased inflation, interest rate volatility and levels, global and regional economic conditions, challenges and uncertainties resulting from the COVID-19 pandemic, political uncertainty, changes in tax policies, regulatory changes, changes in levels of client activity as a result of any of the foregoing and other factors. Accordingly, this information should not be relied on for any purpose. We do not intend to update these estimates, illustrations, ambitions, objectives, outlooks, goals, commitments or aspirations. We may not achieve the benefits of our strategic initiativesWe may not achieve all of the expected benefits of our strategic initiatives. Factors beyond our control, including but not limited to the market and economic conditions (including macroeconomic and other challenges and uncertainties, for example, resulting from the COVID-19 pandemic), changes in laws, rules or regulations and other challenges discussed in our public filings, could limit our ability to achieve some or all of the expected benefits of these initiatives.Estimates and assumptionsIn preparing this presentation, management has made estimates and assumptions that affect the numbers presented. Actual results may differ. Annualized numbers do not take into account variations in operating results, seasonality and other factors and may not be indicative of actual, full-year results. Figures throughout this presentation may also be subject to rounding adjustments. All opinions and views constitute judgments as of the date of writing without regard to the date on which the reader may receive or access the information. This information is subject to change at any time without notice and we do not intend to update this information.Cautionary statements relating to interim financial informationThis document contains certain unaudited interim financial information for the first quarter of 2022. This information has been derived from management accounts, is preliminary in nature, does not reflect the complete results of the first quarter of 2022 and is subject to change, including as a result of any normal quarterly adjustments in relation to the financial statements for the first quarter of 2022. This information has not been subject to any review by our independent registered public accounting firm. There can be no assurance that the final results for these periods will not differ from these preliminary results, and any such differences could be material. Quarterly financial results for the first quarter of 2022 will be included in our 1Q22 Financial Report. These interim results of operations are not necessarily indicative of the results to be achieved for the remainder of the full first quarter of 2022.
Statement regarding non-GAAP financial measuresThis presentation contains non-GAAP financial measures, including results excluding certain items included in our reported results as well as return on regulatory capital and return on tangible equity (which is based on tangible shareholders’ equity). Further details and information needed to reconcile such non-GAAP financial measures to the most directly comparable measures under US GAAP can be found in the Fourth Quarter and Full Year 2021 Supplemental Information, which is available on our website at www.credit-suisse.com. Our estimates, ambitions, objectives and targets often include metrics that are non-GAAP financial measures and are unaudited. A reconciliation of the estimates, ambitions, objectives and targets to the nearest GAAP measures is unavailable without unreasonable efforts. Results excluding certain items included in our reported results do not include items such as goodwill impairment, major litigation provisions, real estate gains, impacts from foreign exchange and other revenue and expense items included in our reported results, all of which are unavailable on a prospective basis. Return on regulatory capital (a non-GAAP financial measure) is calculated using income/(loss) after tax and assumes a tax rate of 25% and capital allocated based on the average of 13.5% of risk-weighted assets and 4.25% of leverage exposure; the essential components of this calculation are unavailable on a prospective basis. Such estimates, ambitions, objectives and targets are calculated in a manner that is consistent with the accounting policies applied by us in preparing our financial statements.Statement regarding capital, liquidity and leverageCredit Suisse is subject to the Basel framework, as implemented in Switzerland, as well as Swiss legislation and regulations for systemically important banks, which include capital, liquidity, leverage and large exposure requirements and rules for emergency plans designed to maintain systemically relevant functions in the event of threatened insolvency. Credit Suisse has adopted the Bank for International Settlements (BIS) leverage ratio framework, as issued by the Basel Committee on Banking Supervision (BCBS) and implemented in Switzerland by the Swiss Financial Market Supervisory Authority FINMA.Unless otherwise noted, leverage exposure is based on the BIS leverage ratio framework and consists of period-end balance sheet assets and prescribed regulatory adjustments. The tier 1 leverage ratio and CET1 leverage ratio are calculated as BIS tier 1 capital and CET1 capital, respectively, divided by period-end leverage exposure. Unless otherwise noted, for periods in 2020, leverage exposure excludes cash held at central banks, after adjusting for the dividend paid in 2020.SourcesCertain material in this presentation has been prepared by Credit Suisse on the basis of publicly available information, internally developed data and other third-party sources believed to be reliable. Credit Suisse has not sought to independently verify information obtained from public and third-party sources and makes no representations or warranties as to accuracy, completeness or reliability of such information. Disclaimer (2/2) 3 February 10, 2022

2021 was a challenging year for Credit Suisse 4 February 10, 2022 Note: Results excluding certain items included in our reported results are non-GAAP financial measures. For further details and reconciliation information, see 4Q21 Supplemental Information 1 Includes major litigation recovery and valuation adjustments recorded in revenues 2 Refers to SUB PC, IWM and APAC 3 Based on average of 13.5% RWA and 4.25% Leverage Exposure 4 Measured using adjusted operating expenses, excluding significant items, at constant 2021 FX rates, progressively increasing from 2022-2024; does not include cost reductions from exited businesses RISK MANAGEMENT Strengthened leadership team and governance, including new Chief Compliance Officer and new Chief Risk OfficerCompleted comprehensive Group-wide Risk Review in 4Q21As part of Group strategy, continued reduction of risk in non-core products and markets FINANCIALS Reported pre-tax loss in 4Q21 of CHF 1.6 bn included a goodwill impairment of CHF 1.6 bn and major litigation provisions of CHF 0.4 bn, partly offset by real estate gains of CHF 0.2 bn. Adjusted PTI excluding significant items in 4Q21 of CHF 0.3 bn impacted by lower transaction-based revenues reflecting more normal trading conditions, client deleveraging, a significant reduction of our overall risk appetite in 2021 and related impacts on franchise momentumReported pre-tax loss in full year 2021 of CHF 0.5 bn included Archegos-related losses of CHF 4.8 bn, goodwill impairment of CHF 1.6 bn, major litigation provisions1 of CHF 1.2 bn, partly offset by Allfunds-related gains of CHF 0.6 bn and real estate gains of CHF 0.2 bn. Adjusted pre-tax income excluding significant items and Archegos in 2021 of CHF 6.6 bn with constrained risk appetite impacting performance in latter quarters of 2021CET1 ratio of 14.4%, CET1 leverage ratio at 4.4%Board will propose dividend of CHF 0.10 per share for 2021; subject to AGM approval STRATEGY Launched our new organizational structure on January 1, 2022 including the creation of unified Wealth Management division, globally-integrated Investment Bank and centralized Chief Technology and Operations OrganizationGrew Wealth Management2 recurring commissions & fees by 9% in 2021, supported by AuM growth (+4%) and +1.5 pp. increase in mandate penetration to ~31%; in addition, ~35% YoY growth in Alternatives and PE feeder funds and 13% growth in Relationship Managers in APAC (from 600 to 680 in 2021)Investment Bank released USD ~2.0 bn of allocated capital3 vs. end-2020, significant progress towards our ambition to release USD >3 bn over 2021-20224; reduced Prime chargeable balances by 66% since 1Q21, of which 1/3 came in 4Q21Entered into outsourcing agreement with third party to deliver centralized procurement savings, a key component of our ambition to deliver CHF ~1.0-1.5 bn of structural cost savings4 by 2024
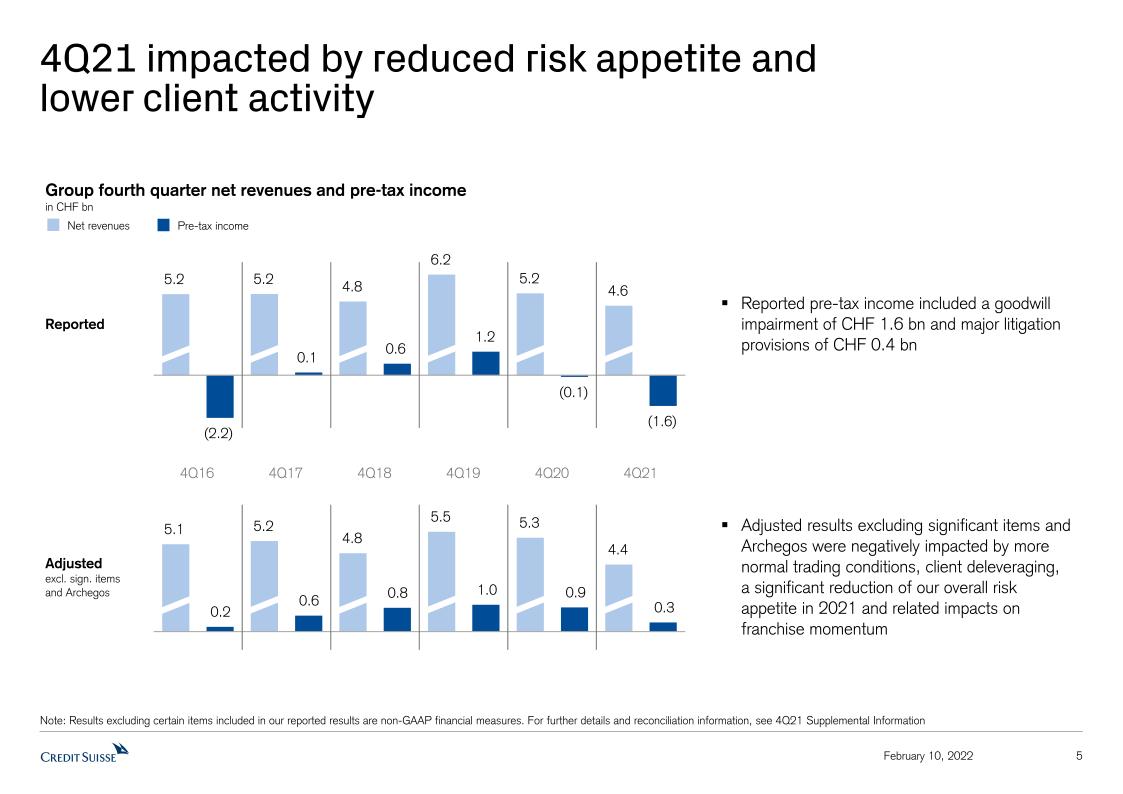
Reported pre-tax income included a goodwill impairment of CHF 1.6 bn and major litigation provisions of CHF 0.4 bn 4Q21 impacted by reduced risk appetite and lower client activity 5 February 10, 2022 Note: Results excluding certain items included in our reported results are non-GAAP financial measures. For further details and reconciliation information, see 4Q21 Supplemental Information Group fourth quarter net revenues and pre-tax incomein CHF bn Net revenues Pre-tax income 4Q16 4Q17 4Q18 4Q20 4Q19 4Q21 Reported Adjustedexcl. sign. items and Archegos Adjusted results excluding significant items and Archegos were negatively impacted by more normal trading conditions, client deleveraging, a significant reduction of our overall risk appetite in 2021 and related impacts on franchise momentum
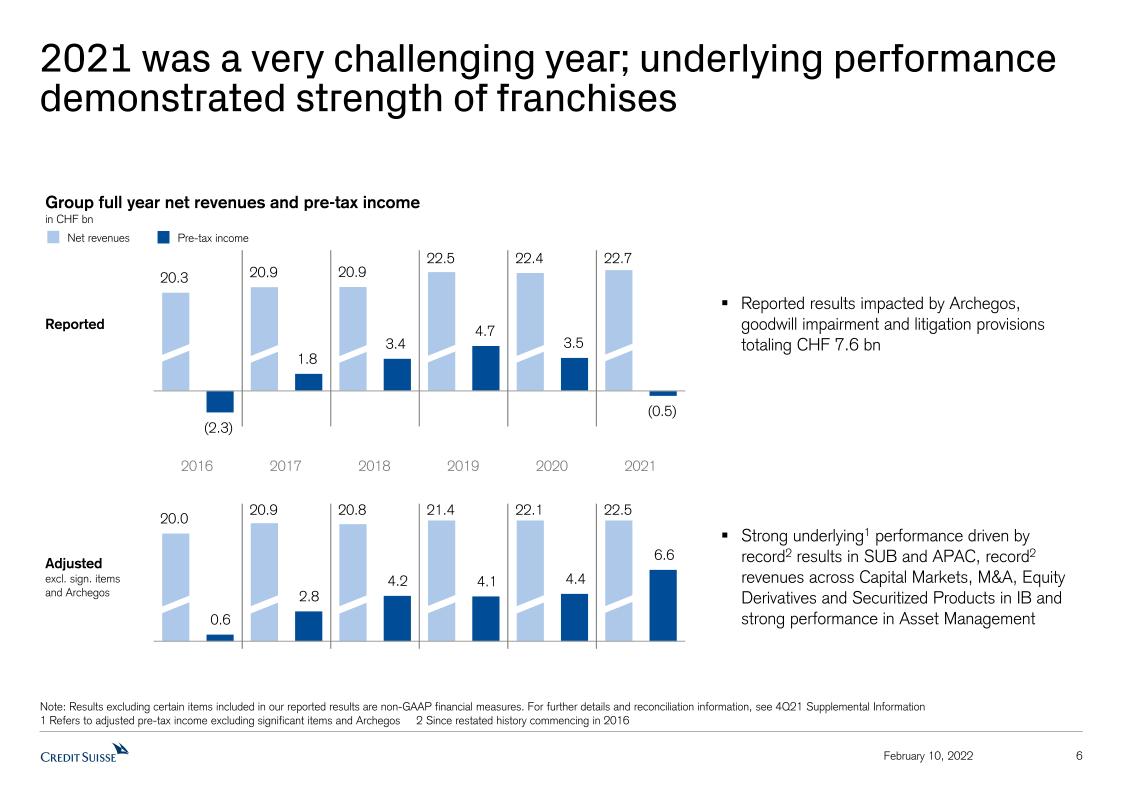
2021 was a very challenging year; underlying performance demonstrated strength of franchises 6 February 10, 2022 Note: Results excluding certain items included in our reported results are non-GAAP financial measures. For further details and reconciliation information, see 4Q21 Supplemental Information1 Refers to adjusted pre-tax income excluding significant items and Archegos 2 Since restated history commencing in 2016 Group full year net revenues and pre-tax incomein CHF bn Net revenues Pre-tax income 2016 2020 2021 Reported Adjustedexcl. sign. items and Archegos 2017 2018 2019 Reported results impacted by Archegos, goodwill impairment and litigation provisions totaling CHF 7.6 bn Strong underlying1 performance driven by record2 results in SUB and APAC, record2 revenues across Capital Markets, M&A, Equity Derivatives and Securitized Products in IB and strong performance in Asset Management
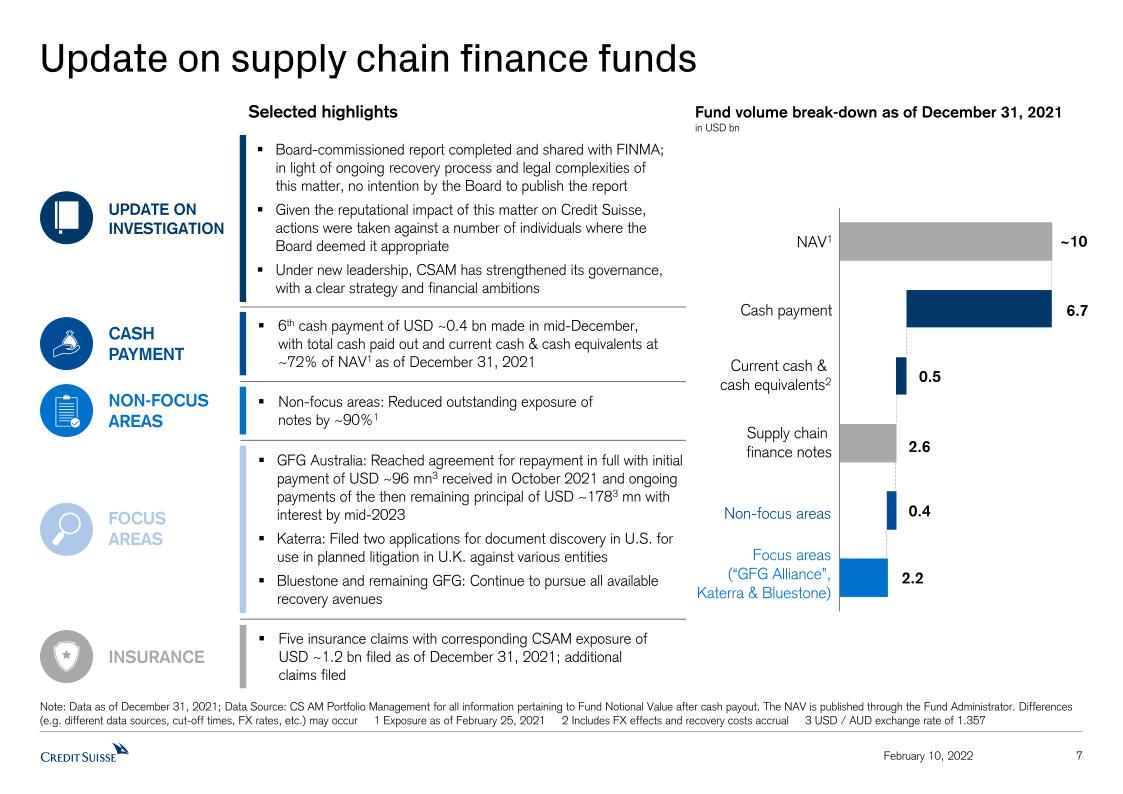
7 February 10, 2022 Update on supply chain finance funds Note: Data as of December 31, 2021; Data Source: CS AM Portfolio Management for all information pertaining to Fund Notional Value after cash payout. The NAV is published through the Fund Administrator. Differences (e.g. different data sources, cut-off times, FX rates, etc.) may occur 1 Exposure as of February 25, 2021 2 Includes FX effects and recovery costs accrual 3 USD / AUD exchange rate of 1.357 Selected highlights 6th cash payment of USD ~0.4 bn made in mid-December, with total cash paid out and current cash & cash equivalents at ~72% of NAV1 as of December 31, 2021 CASHPAYMENT Non-focus areas: Reduced outstanding exposure of notes by ~90%1 NON-FOCUS AREAS Five insurance claims with corresponding CSAM exposure of USD ~1.2 bn filed as of December 31, 2021; additional claims filed INSURANCE Fund volume break-down as of December 31, 2021in USD bn NAV1 Non-focus areas Supply chain finance notes Cash payment Current cash & cash equivalents2 Focus areas(“GFG Alliance”,Katerra & Bluestone) ~10 6.7 2.6 2.2 Board-commissioned report completed and shared with FINMA; in light of ongoing recovery process and legal complexities of this matter, no intention by the Board to publish the reportGiven the reputational impact of this matter on Credit Suisse, actions were taken against a number of individuals where the Board deemed it appropriateUnder new leadership, CSAM has strengthened its governance, with a clear strategy and financial ambitions UPDATE ON INVESTIGATION GFG Australia: Reached agreement for repayment in full with initial payment of USD ~96 mn3 received in October 2021 and ongoing payments of the then remaining principal of USD ~1783 mn with interest by mid-2023Katerra: Filed two applications for document discovery in U.S. for use in planned litigation in U.K. against various entitiesBluestone and remaining GFG: Continue to pursue all available recovery avenues FOCUSAREAS
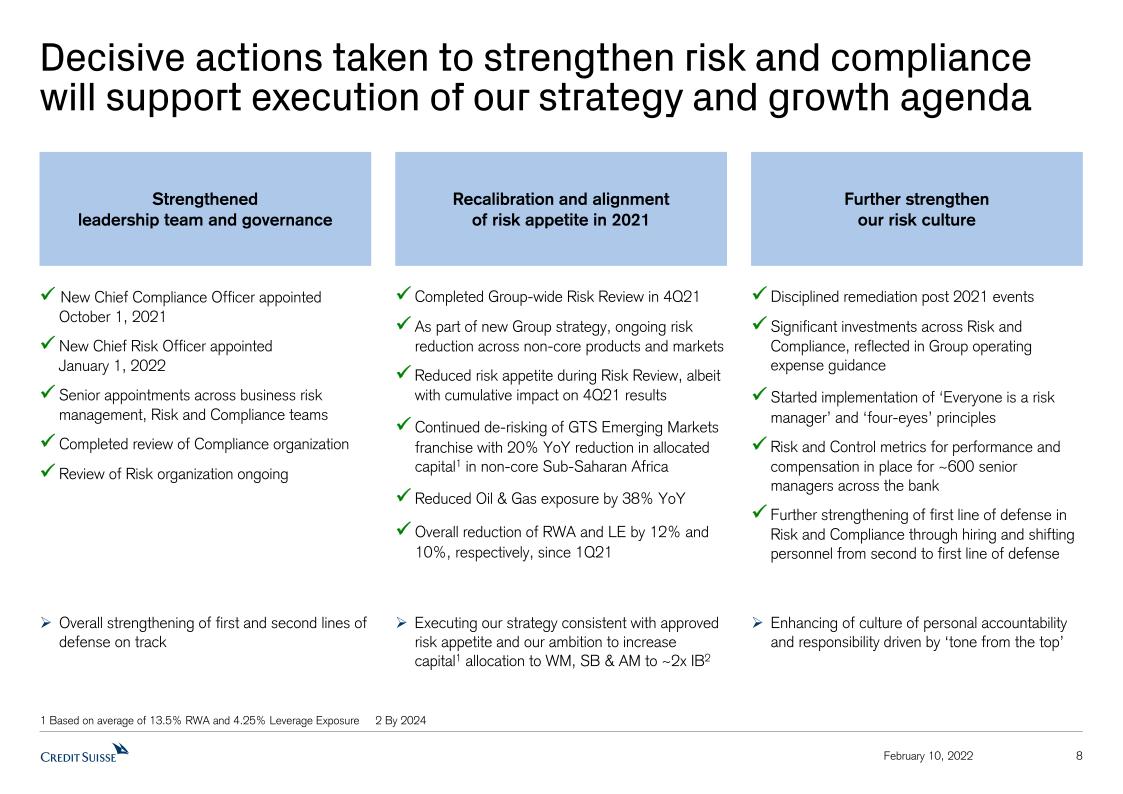
8 February 10, 2022 Decisive actions taken to strengthen risk and compliance will support execution of our strategy and growth agenda Strengthened leadership team and governance New Chief Compliance Officer appointed October 1, 2021 New Chief Risk Officer appointed January 1, 2022 Senior appointments across business risk management, Risk and Compliance teams Completed review of Compliance organization Review of Risk organization ongoing Further strengthen our risk culture Disciplined remediation post 2021 events Significant investments across Risk and Compliance, reflected in Group operating expense guidance Started implementation of ‘Everyone is a risk manager’ and ‘four-eyes’ principles Risk and Control metrics for performance and compensation in place for ~600 senior managers across the bank Further strengthening of first line of defense in Risk and Compliance through hiring and shifting personnel from second to first line of defense Recalibration and alignment of risk appetite in 2021 Completed Group-wide Risk Review in 4Q21 As part of new Group strategy, ongoing risk reduction across non-core products and markets Reduced risk appetite during Risk Review, albeit with cumulative impact on 4Q21 results Continued de-risking of GTS Emerging Markets franchise with 20% YoY reduction in allocated capital1 in non-core Sub-Saharan Africa Reduced Oil & Gas exposure by 38% YoY Overall reduction of RWA and LE by 12% and 10%, respectively, since 1Q21 1 Based on average of 13.5% RWA and 4.25% Leverage Exposure 2 By 2024 Overall strengthening of first and second lines of defense on track Executing our strategy consistent with approved risk appetite and our ambition to increase capital1 allocation to WM, SB & AM to ~2x IB2 Enhancing of culture of personal accountability and responsibility driven by ‘tone from the top’
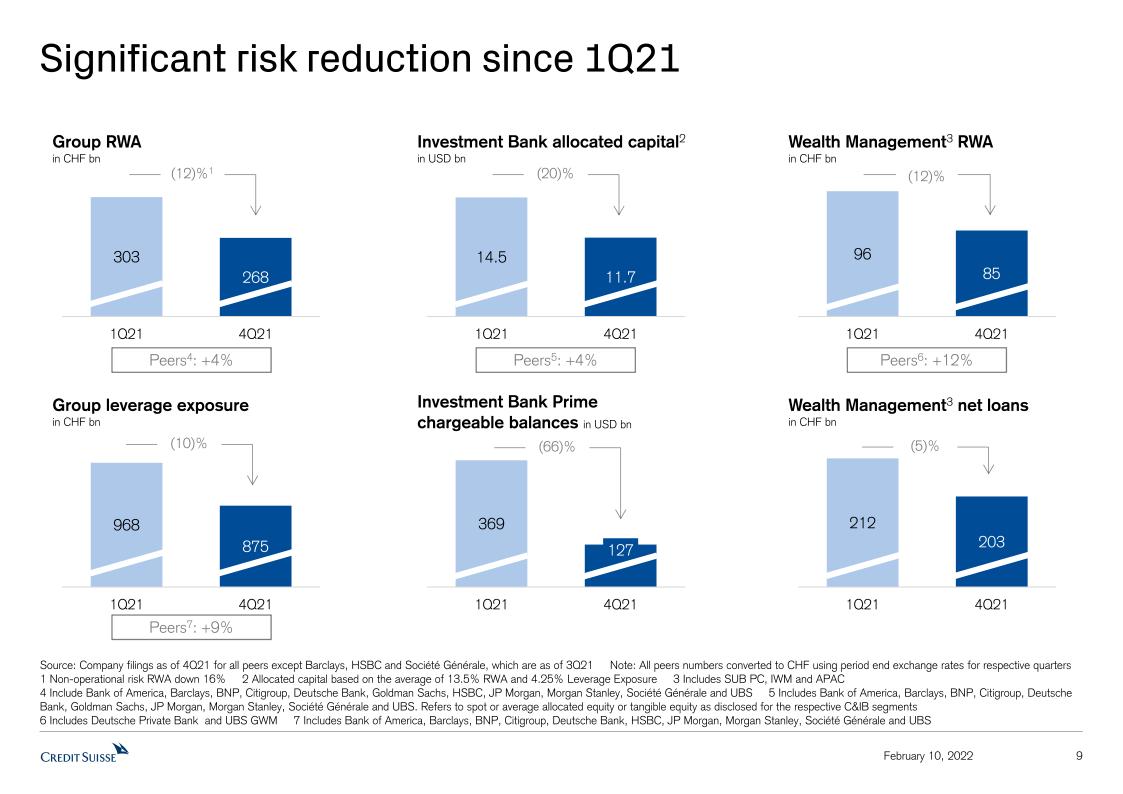
9 February 10, 2022 Significant risk reduction since 1Q21 Source: Company filings as of 4Q21 for all peers except Barclays, HSBC and Société Générale, which are as of 3Q21 Note: All peers numbers converted to CHF using period end exchange rates for respective quarters 1 Non-operational risk RWA down 16% 2 Allocated capital based on the average of 13.5% RWA and 4.25% Leverage Exposure 3 Includes SUB PC, IWM and APAC 4 Include Bank of America, Barclays, BNP, Citigroup, Deutsche Bank, Goldman Sachs, HSBC, JP Morgan, Morgan Stanley, Société Générale and UBS 5 Includes Bank of America, Barclays, BNP, Citigroup, Deutsche Bank, Goldman Sachs, JP Morgan, Morgan Stanley, Société Générale and UBS. Refers to spot or average allocated equity or tangible equity as disclosed for the respective C&IB segments 6 Includes Deutsche Private Bank and UBS GWM 7 Includes Bank of America, Barclays, BNP, Citigroup, Deutsche Bank, HSBC, JP Morgan, Morgan Stanley, Société Générale and UBS Group RWAin CHF bn (12)%1 Group leverage exposurein CHF bn (10)% Investment Bank allocated capital2in USD bn (20)% Investment Bank Prime chargeable balances in USD bn (66)% Wealth Management3 net loansin CHF bn (5)% Wealth Management3 RWAin CHF bn (12)% Peers4: +4% Peers5: +4% Peers7: +9% Peers6: +12%
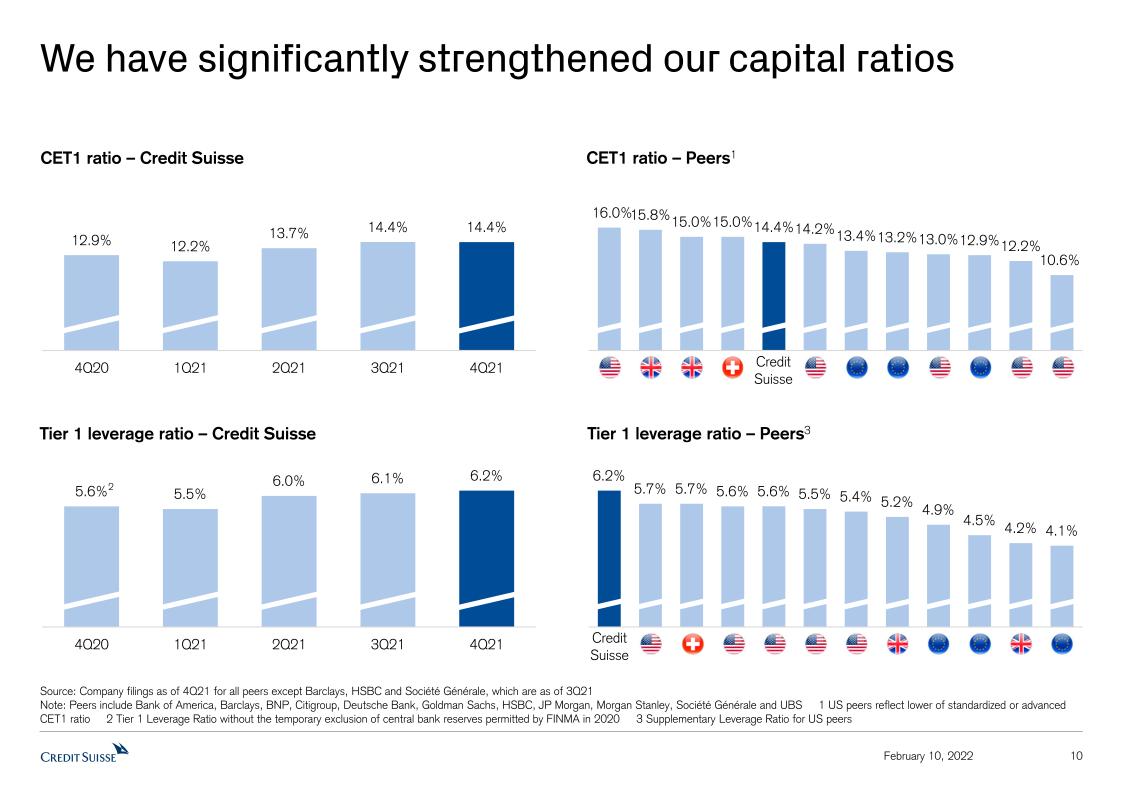
10 February 10, 2022 We have significantly strengthened our capital ratios Source: Company filings as of 4Q21 for all peers except Barclays, HSBC and Société Générale, which are as of 3Q21 Note: Peers include Bank of America, Barclays, BNP, Citigroup, Deutsche Bank, Goldman Sachs, HSBC, JP Morgan, Morgan Stanley, Société Générale and UBS 1 US peers reflect lower of standardized or advanced CET1 ratio 2 Tier 1 Leverage Ratio without the temporary exclusion of central bank reserves permitted by FINMA in 2020 3 Supplementary Leverage Ratio for US peers CET1 ratio – Credit Suisse CET1 ratio – Peers1 Tier 1 leverage ratio – Credit Suisse Tier 1 leverage ratio – Peers3 2 Credit Suisse Credit Suisse
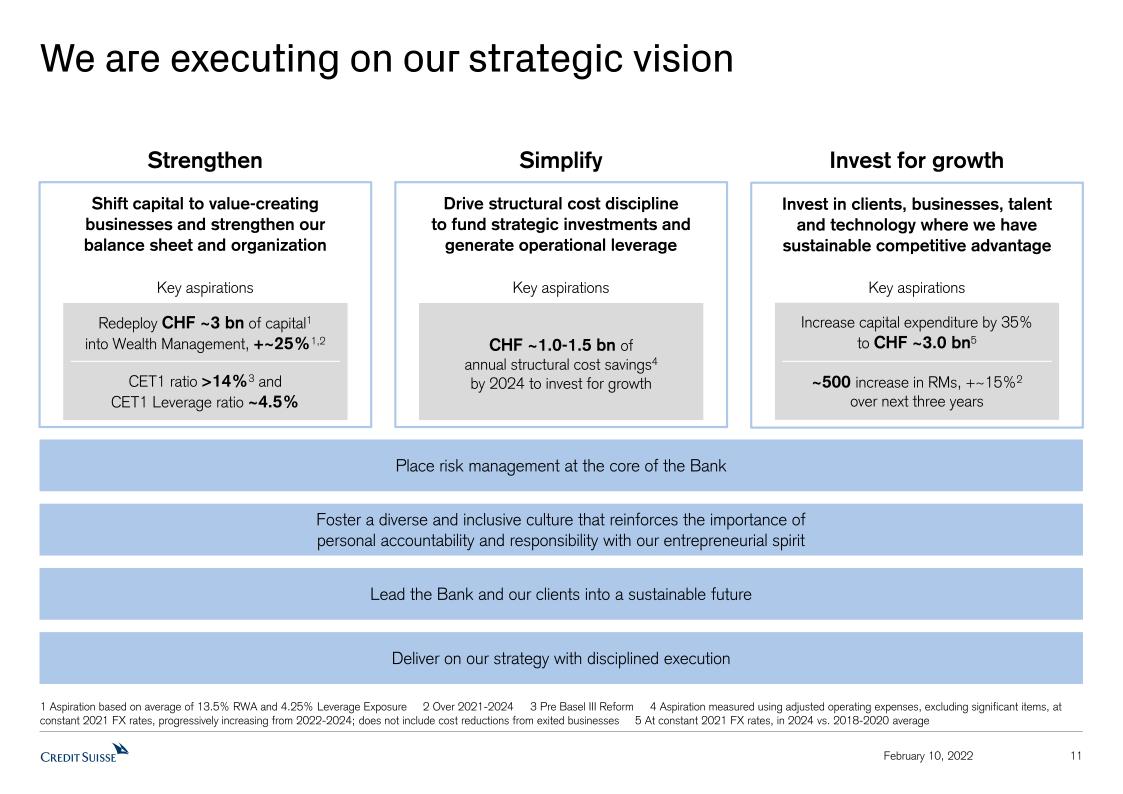
We are executing on our strategic vision 11 February 10, 2022 Place risk management at the core of the Bank Foster a diverse and inclusive culture that reinforces the importance of personal accountability and responsibility with our entrepreneurial spirit Deliver on our strategy with disciplined execution Simplify Invest for growth Lead the Bank and our clients into a sustainable future 1 Aspiration based on average of 13.5% RWA and 4.25% Leverage Exposure 2 Over 2021-2024 3 Pre Basel III Reform 4 Aspiration measured using adjusted operating expenses, excluding significant items, at constant 2021 FX rates, progressively increasing from 2022-2024; does not include cost reductions from exited businesses 5 At constant 2021 FX rates, in 2024 vs. 2018-2020 average Shift capital to value-creating businesses and strengthen our balance sheet and organization Strengthen Redeploy CHF ~3 bn of capital1 into Wealth Management, +~25%1,2 CET1 ratio >14%3 and CET1 Leverage ratio ~4.5% Key aspirations Drive structural cost discipline to fund strategic investments and generate operational leverage CHF ~1.0-1.5 bn ofannual structural cost savings4by 2024 to invest for growth Key aspirations Invest in clients, businesses, talent and technology where we have sustainable competitive advantage ~500 increase in RMs, +~15%2 over next three years Increase capital expenditure by 35%to CHF ~3.0 bn5 Key aspirations

Our Executive Board 12 Corporate Functions Divisions and Regions Thomas GottsteinChief Executive Officer Romeo CeruttiGeneral Counsel Christine GraeffGlobal Head ofHuman Resources David WildermuthChief Risk Officer Francesco De FerrariCEO Wealth ManagementCEO Region EMEA (a.i.) Ulrich KörnerCEO Asset Management Christian MeissnerCEO Investment BankCEO Region Americas Helman SitohangCEO Region Asia Pacific André HelfensteinCEO Swiss BankCEO Region Switzerland CEO David MathersChief Financial Officer Joanne HannafordChief Technology & Operations Officer Rafael Lopez LorenzoChief Compliance Officer February 10, 2022
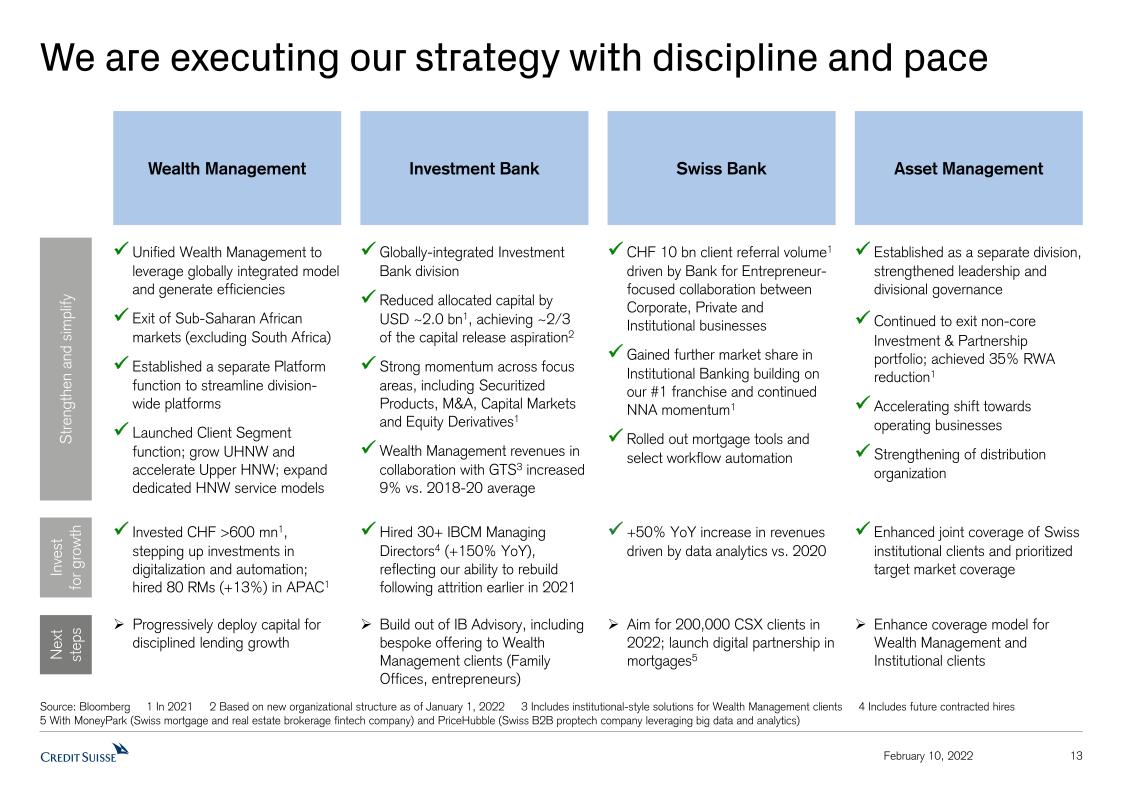
13 February 10, 2022 We are executing our strategy with discipline and pace Asset Management Wealth Management Swiss Bank Investment Bank Source: Bloomberg 1 In 2021 2 Based on new organizational structure as of January 1, 2022 3 Includes institutional-style solutions for Wealth Management clients 4 Includes future contracted hires 5 With MoneyPark (Swiss mortgage and real estate brokerage fintech company) and PriceHubble (Swiss B2B proptech company leveraging big data and analytics) Progressively deploy capital for disciplined lending growth Aim for 200,000 CSX clients in 2022; launch digital partnership in mortgages5 Enhance coverage model for Wealth Management and Institutional clients Nextsteps Build out of IB Advisory, including bespoke offering to Wealth Management clients (Family Offices, entrepreneurs) CHF 10 bn client referral volume1 driven by Bank for Entrepreneur-focused collaboration between Corporate, Private and Institutional businesses Gained further market share in Institutional Banking building on our #1 franchise and continued NNA momentum1 Rolled out mortgage tools and select workflow automation Strengthen and simplify Established as a separate division, strengthened leadership and divisional governance Continued to exit non-core Investment & Partnership portfolio; achieved 35% RWA reduction1 Accelerating shift towards operating businesses Strengthening of distribution organization Unified Wealth Management to leverage globally integrated model and generate efficiencies Exit of Sub-Saharan African markets (excluding South Africa) Established a separate Platform function to streamline division-wide platforms Launched Client Segment function; grow UHNW and accelerate Upper HNW; expand dedicated HNW service models Globally-integrated Investment Bank division Reduced allocated capital byUSD ~2.0 bn1, achieving ~2/3of the capital release aspiration2 Strong momentum across focus areas, including Securitized Products, M&A, Capital Markets and Equity Derivatives1 Wealth Management revenues in collaboration with GTS3 increased 9% vs. 2018-20 average Enhanced joint coverage of Swiss institutional clients and prioritized target market coverage Investfor growth +50% YoY increase in revenues driven by data analytics vs. 2020 Invested CHF >600 mn1, stepping up investments in digitalization and automation; hired 80 RMs (+13%) in APAC1 Hired 30+ IBCM Managing Directors4 (+150% YoY), reflecting our ability to rebuild following attrition earlier in 2021
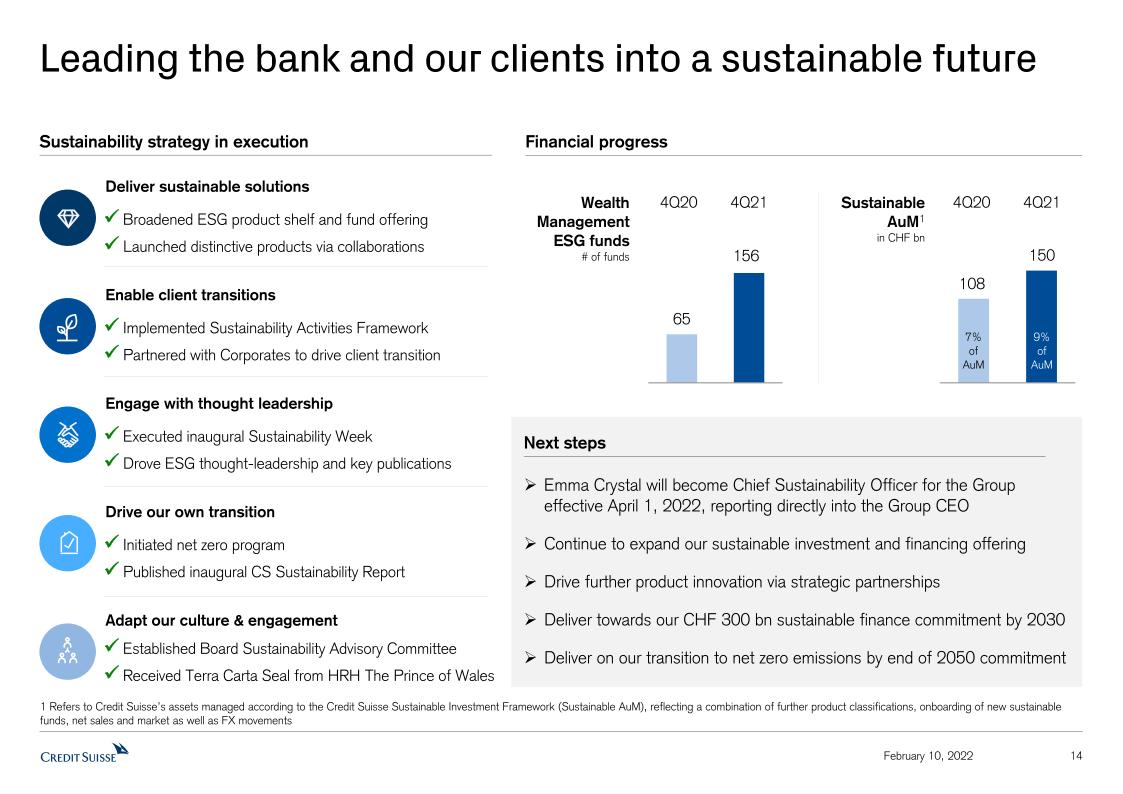
Leading the bank and our clients into a sustainable future 14 February 10, 2022 Emma Crystal will become Chief Sustainability Officer for the Group effective April 1, 2022, reporting directly into the Group CEOContinue to expand our sustainable investment and financing offeringDrive further product innovation via strategic partnershipsDeliver towards our CHF 300 bn sustainable finance commitment by 2030Deliver on our transition to net zero emissions by end of 2050 commitment 1 Refers to Credit Suisse’s assets managed according to the Credit Suisse Sustainable Investment Framework (Sustainable AuM), reflecting a combination of further product classifications, onboarding of new sustainable funds, net sales and market as well as FX movements 4Q20 4Q21 Wealth ManagementESG funds# of funds SustainableAuM1in CHF bn 108 150 9%ofAuM 7%ofAuM Broadened ESG product shelf and fund offering Launched distinctive products via collaborations Deliver sustainable solutions Implemented Sustainability Activities Framework Partnered with Corporates to drive client transition Enable client transitions Executed inaugural Sustainability Week Drove ESG thought-leadership and key publications Engage with thought leadership Initiated net zero program Published inaugural CS Sustainability Report Drive our own transition Established Board Sustainability Advisory Committee Received Terra Carta Seal from HRH The Prince of Wales Adapt our culture & engagement 4Q20 4Q21 Sustainability strategy in execution Financial progress Next steps
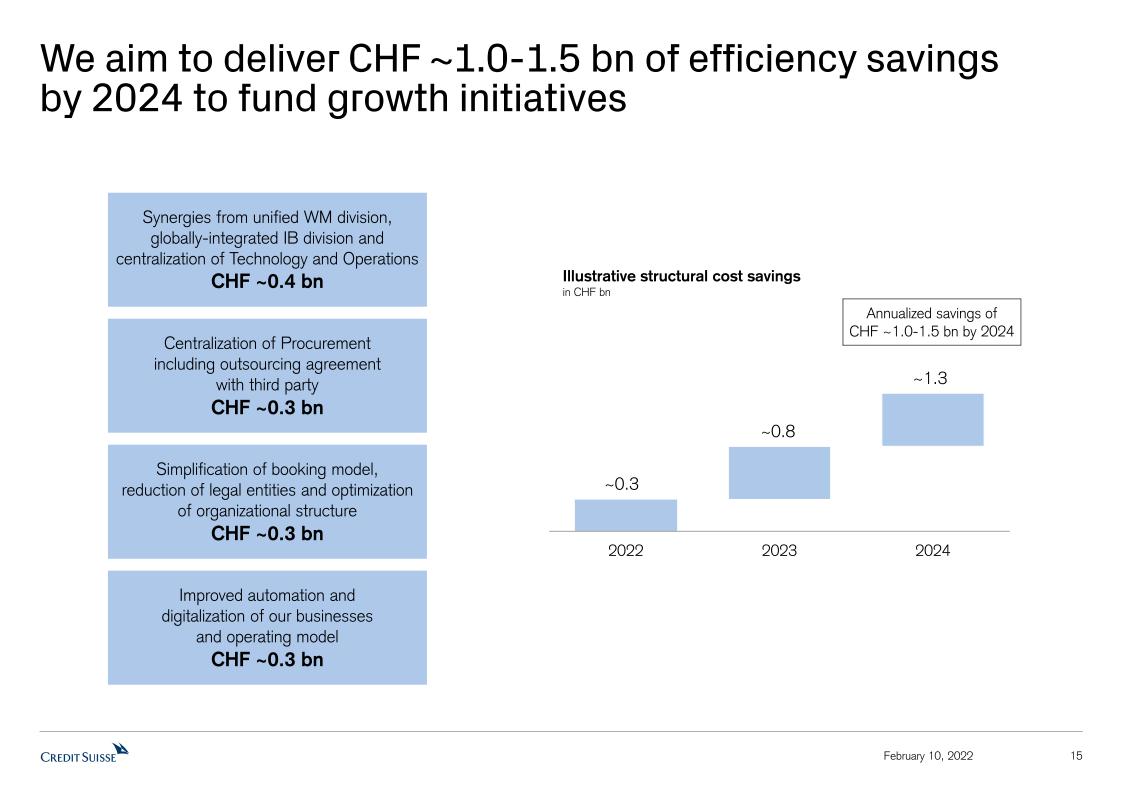
15 February 10, 2022 We aim to deliver CHF ~1.0-1.5 bn of efficiency savings by 2024 to fund growth initiatives Synergies from unified WM division, globally-integrated IB division and centralization of Technology and OperationsCHF ~0.4 bn Improved automation and digitalization of our businesses and operating modelCHF ~0.3 bn Simplification of booking model, reduction of legal entities and optimization of organizational structureCHF ~0.3 bn Centralization of Procurement including outsourcing agreement with third partyCHF ~0.3 bn Illustrative structural cost savings in CHF bn Annualized savings of CHF ~1.0-1.5 bn by 2024
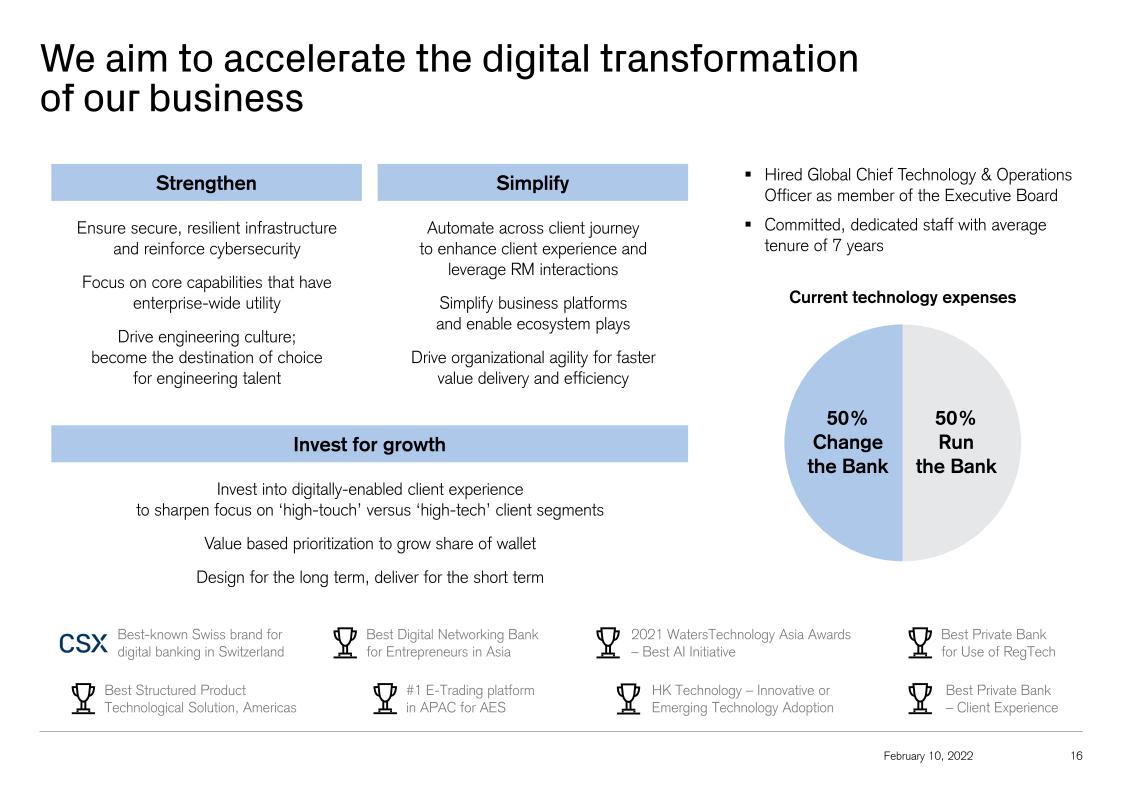
Ensure secure, resilient infrastructure and reinforce cybersecurityFocus on core capabilities that have enterprise-wide utilityDrive engineering culture; become the destination of choice for engineering talent Automate across client journey to enhance client experience and leverage RM interactionsSimplify business platforms and enable ecosystem playsDrive organizational agility for faster value delivery and efficiency Invest into digitally-enabled client experience to sharpen focus on ‘high-touch’ versus ‘high-tech’ client segmentsValue based prioritization to grow share of walletDesign for the long term, deliver for the short term Strengthen Simplify Invest for growth February 10, 2022 16 We aim to accelerate the digital transformation of our business 50% Change the Bank 50%Run the Bank Current technology expenses Best-known Swiss brand for digital banking in Switzerland Hired Global Chief Technology & Operations Officer as member of the Executive BoardCommitted, dedicated staff with average tenure of 7 years Best Private Bank for Use of RegTech Best Digital Networking Bank for Entrepreneurs in Asia 2021 WatersTechnology Asia Awards – Best AI Initiative Best Structured Product Technological Solution, Americas #1 E-Trading platform in APAC for AES HK Technology – Innovative or Emerging Technology Adoption Best Private Bank – Client Experience
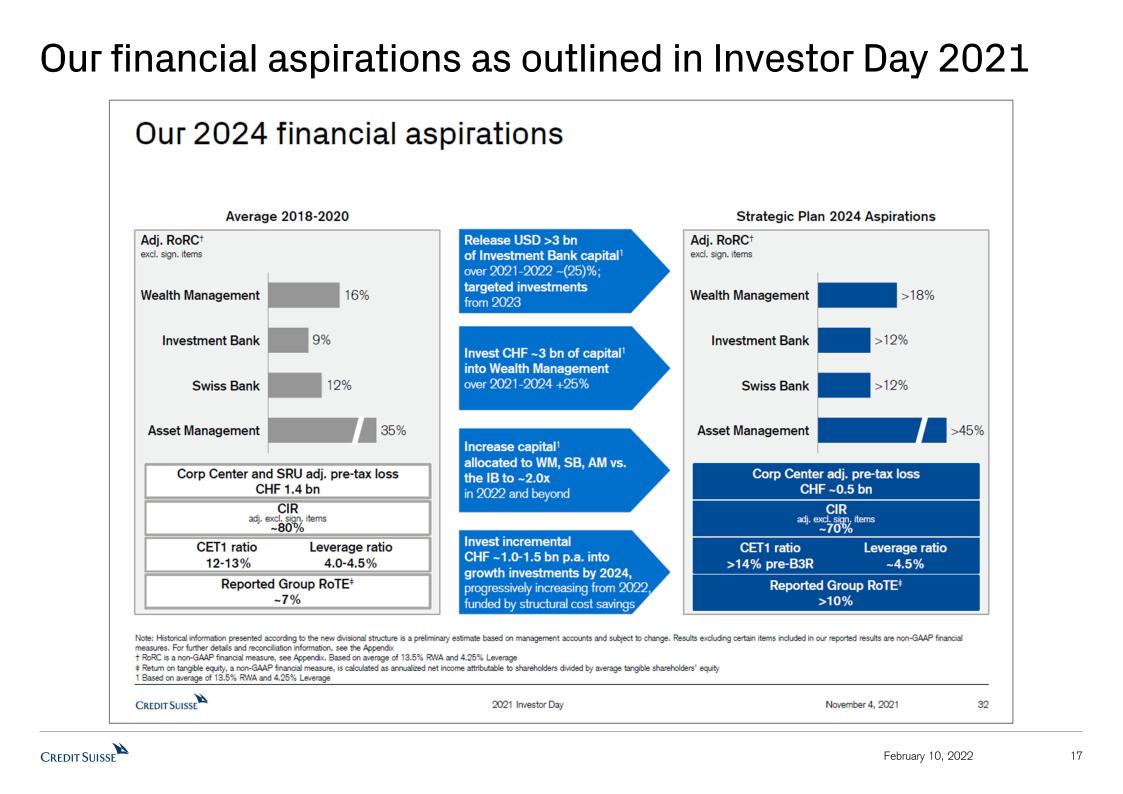
17 February 10, 2022 Our financial aspirations as outlined in Investor Day 2021

Detailed Financials 18 February 10, 2022
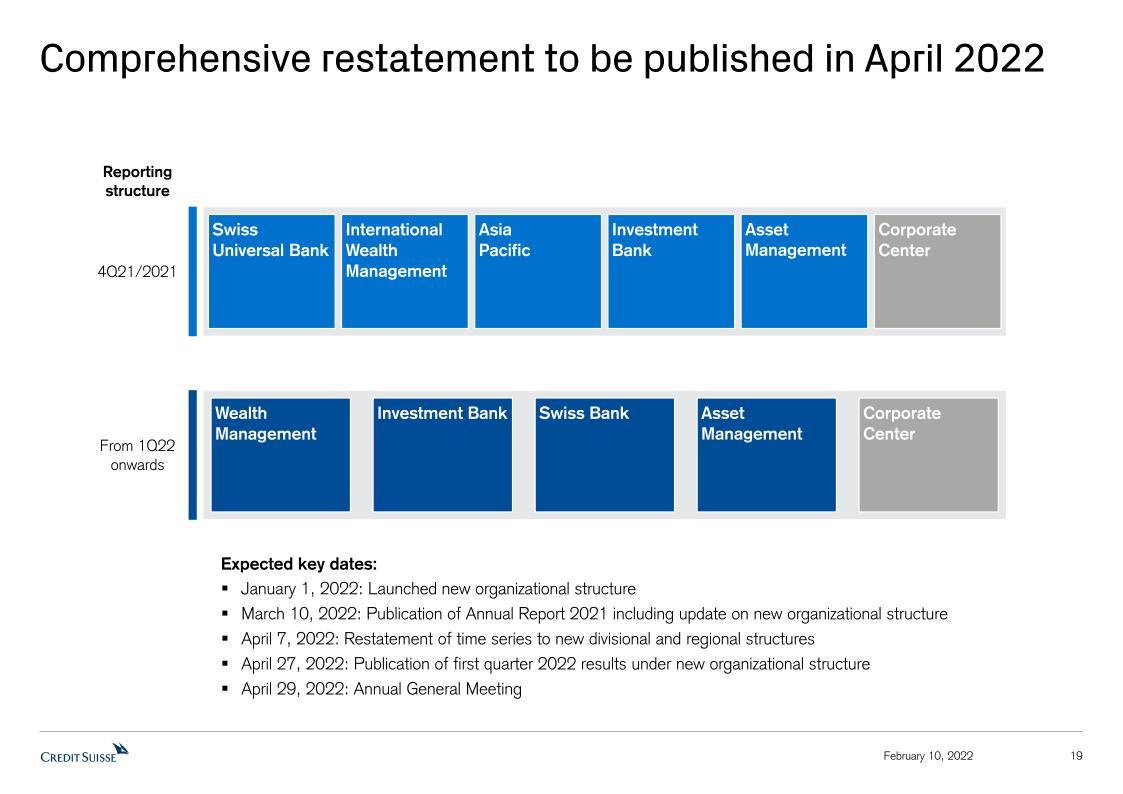
19 February 10, 2022 Comprehensive restatement to be published in April 2022 Expected key dates: January 1, 2022: Launched new organizational structureMarch 10, 2022: Publication of Annual Report 2021 including update on new organizational structureApril 7, 2022: Restatement of time series to new divisional and regional structuresApril 27, 2022: Publication of first quarter 2022 results under new organizational structureApril 29, 2022: Annual General Meeting 4Q21/2021 From 1Q22 onwards Swiss Universal Bank InternationalWealth Management Asia Pacific InvestmentBank Asset Management CorporateCenter Asset Management Corporate Center Wealth Management Swiss Bank Investment Bank Reporting structure
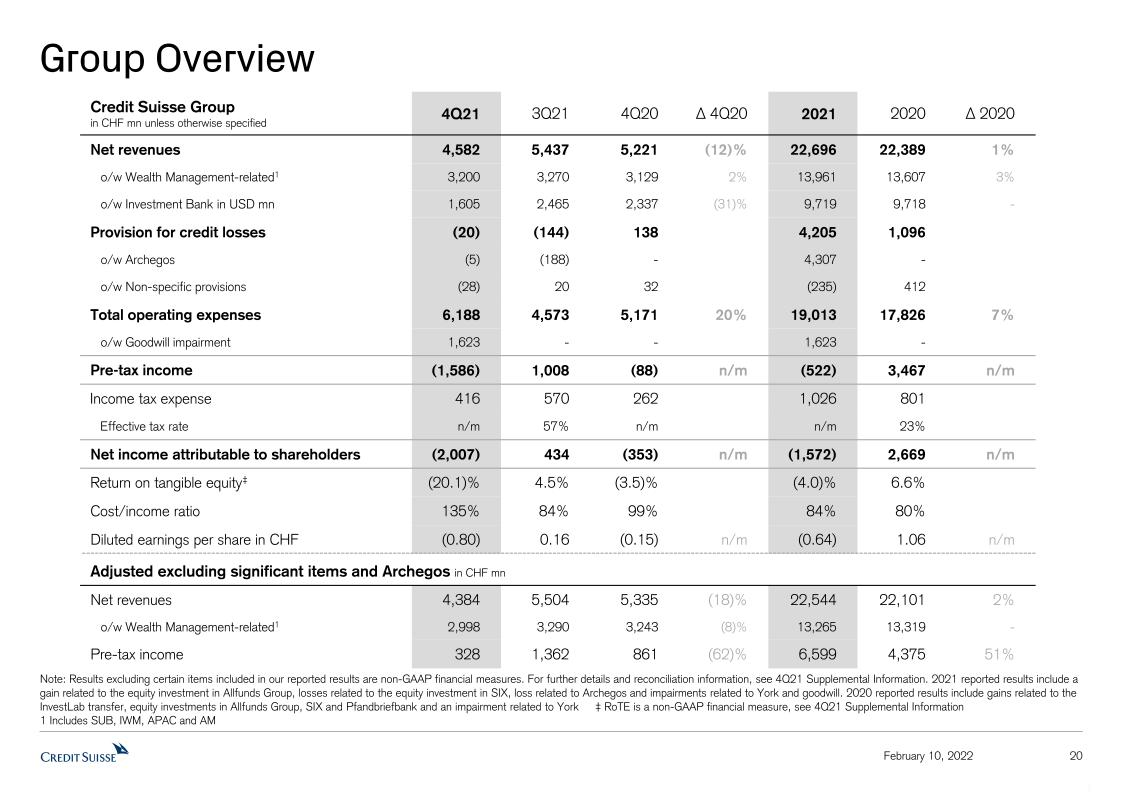
Group Overview 20 Note: Results excluding certain items included in our reported results are non-GAAP financial measures. For further details and reconciliation information, see 4Q21 Supplemental Information. 2021 reported results include a gain related to the equity investment in Allfunds Group, losses related to the equity investment in SIX, loss related to Archegos and impairments related to York and goodwill. 2020 reported results include gains related to the InvestLab transfer, equity investments in Allfunds Group, SIX and Pfandbriefbank and an impairment related to York ‡ RoTE is a non-GAAP financial measure, see 4Q21 Supplemental Information 1 Includes SUB, IWM, APAC and AM February 10, 2022 Credit Suisse Group in CHF mn unless otherwise specified 4Q21 3Q21 4Q20 Δ 4Q20 2021 2020 Δ 2020 Net revenues 4,582 5,437 5,221 (12)% 22,696 22,389 1% o/w Wealth Management-related1 3,200 3,270 3,129 2% 13,961 13,607 3% o/w Investment Bank in USD mn 1,605 2,465 2,337 (31)% 9,719 9,718 - Provision for credit losses (20) (144) 138 4,205 1,096 o/w Archegos (5) (188) - 4,307 - o/w Non-specific provisions (28) 20 32 (235) 412 Total operating expenses 6,188 4,573 5,171 20% 19,013 17,826 7% o/w Goodwill impairment 1,623 - - 1,623 - Pre-tax income (1,586) 1,008 (88) n/m (522) 3,467 n/m Income tax expense 416 570 262 1,026 801 Effective tax rate n/m 57% n/m n/m 23% Net income attributable to shareholders (2,007) 434 (353) n/m (1,572) 2,669 n/m Return on tangible equity‡ (20.1)% 4.5% (3.5)% (4.0)% 6.6% Cost/income ratio 135% 84% 99% 84% 80% Diluted earnings per share in CHF (0.80) 0.16 (0.15) n/m (0.64) 1.06 n/m Adjusted excluding significant items and Archegos in CHF mn Net revenues 4,384 5,504 5,335 (18)% 22,544 22,101 2% o/w Wealth Management-related1 2,998 3,290 3,243 (8)% 13,265 13,319 - Pre-tax income 328 1,362 861 (62)% 6,599 4,375 51%
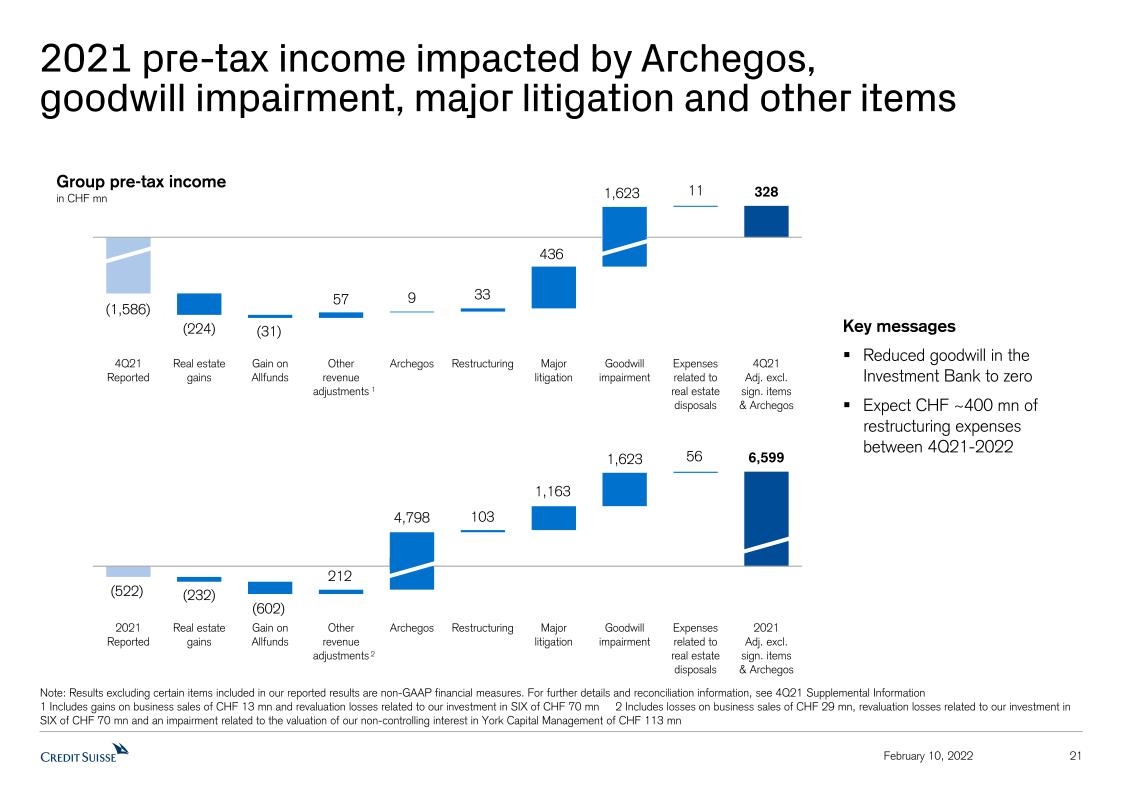
2021 pre-tax income impacted by Archegos, goodwill impairment, major litigation and other items 21 February 10, 2022 Group pre-tax incomein CHF mn Note: Results excluding certain items included in our reported results are non-GAAP financial measures. For further details and reconciliation information, see 4Q21 Supplemental Information1 Includes gains on business sales of CHF 13 mn and revaluation losses related to our investment in SIX of CHF 70 mn 2 Includes losses on business sales of CHF 29 mn, revaluation losses related to our investment in SIX of CHF 70 mn and an impairment related to the valuation of our non-controlling interest in York Capital Management of CHF 113 mn Key messagesReduced goodwill in the Investment Bank to zeroExpect CHF ~400 mn of restructuring expenses between 4Q21-2022 2 1
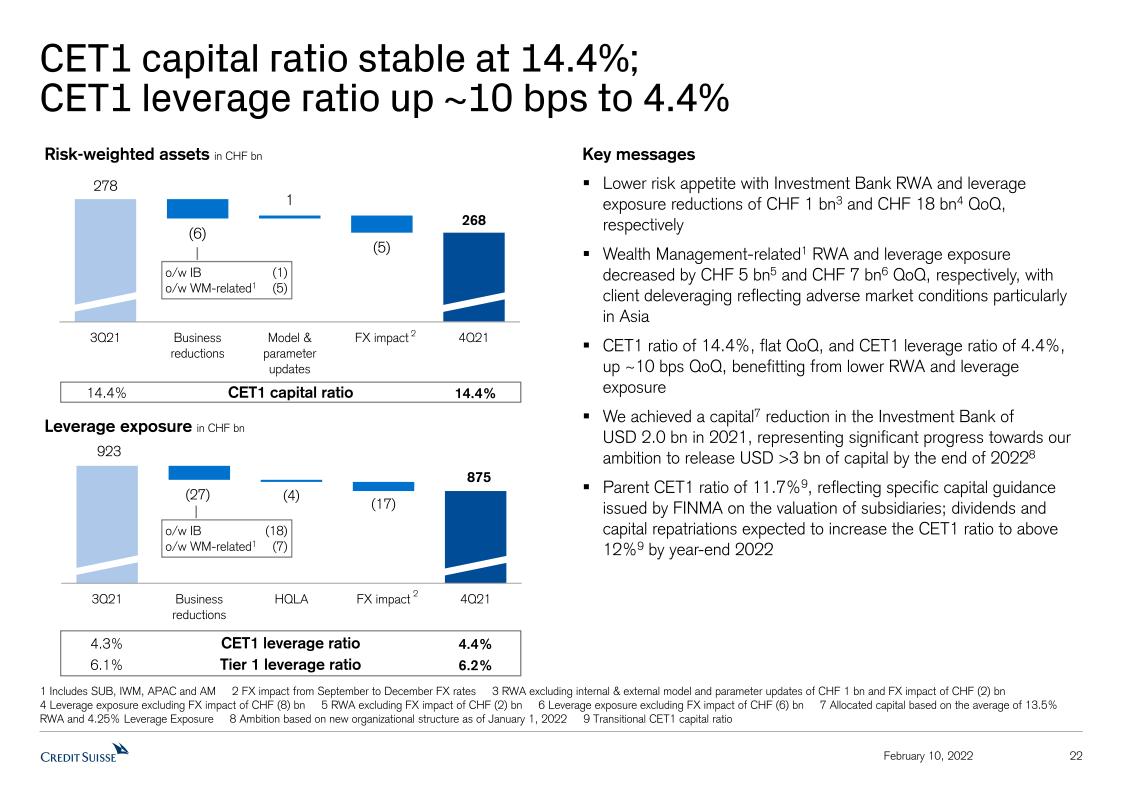
22 February 10, 2022 CET1 capital ratio stable at 14.4%; CET1 leverage ratio up ~10 bps to 4.4% Key messagesLower risk appetite with Investment Bank RWA and leverage exposure reductions of CHF 1 bn3 and CHF 18 bn4 QoQ, respectivelyWealth Management-related1 RWA and leverage exposure decreased by CHF 5 bn5 and CHF 7 bn6 QoQ, respectively, with client deleveraging reflecting adverse market conditions particularly in AsiaCET1 ratio of 14.4%, flat QoQ, and CET1 leverage ratio of 4.4%, up ~10 bps QoQ, benefitting from lower RWA and leverage exposureWe achieved a capital7 reduction in the Investment Bank of USD 2.0 bn in 2021, representing significant progress towards our ambition to release USD >3 bn of capital by the end of 20228Parent CET1 ratio of 11.7%9, reflecting specific capital guidance issued by FINMA on the valuation of subsidiaries; dividends and capital repatriations expected to increase the CET1 ratio to above 12%9 by year-end 2022 Leverage exposure in CHF bn 1 Includes SUB, IWM, APAC and AM 2 FX impact from September to December FX rates 3 RWA excluding internal & external model and parameter updates of CHF 1 bn and FX impact of CHF (2) bn 4 Leverage exposure excluding FX impact of CHF (8) bn 5 RWA excluding FX impact of CHF (2) bn 6 Leverage exposure excluding FX impact of CHF (6) bn 7 Allocated capital based on the average of 13.5% RWA and 4.25% Leverage Exposure 8 Ambition based on new organizational structure as of January 1, 2022 9 Transitional CET1 capital ratio Risk-weighted assets in CHF bn 14.4% CET1 capital ratio 14.4% 4.4% CET1 leverage ratio 4.3% 6.2% Tier 1 leverage ratio 6.1% o/w IB (1) o/w WM-related1 (5) o/w IB (18) o/w WM-related1 (7) 2 2
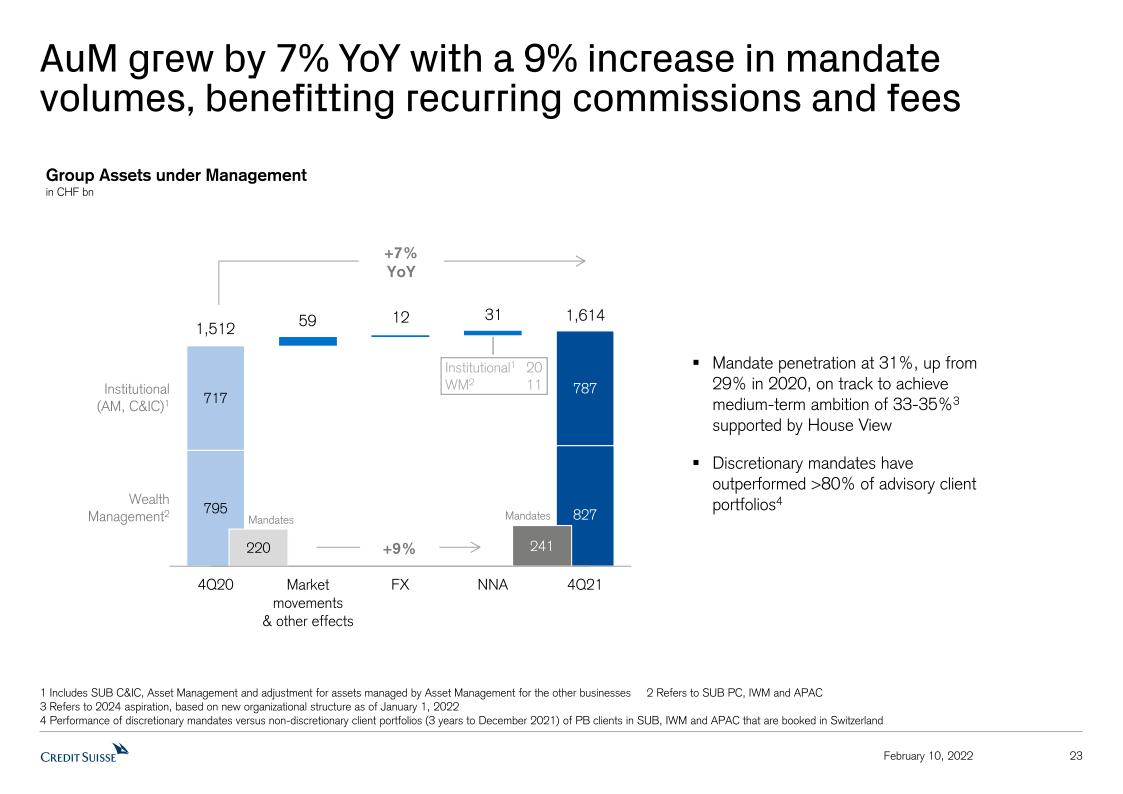
23 February 10, 2022 AuM grew by 7% YoY with a 9% increase in mandate volumes, benefitting recurring commissions and fees 1 Includes SUB C&IC, Asset Management and adjustment for assets managed by Asset Management for the other businesses 2 Refers to SUB PC, IWM and APAC 3 Refers to 2024 aspiration, based on new organizational structure as of January 1, 2022 4 Performance of discretionary mandates versus non-discretionary client portfolios (3 years to December 2021) of PB clients in SUB, IWM and APAC that are booked in Switzerland 1,512 1,614 +7%YoY 31 12 +9% Mandates Mandates Group Assets under Managementin CHF bn 59 Mandate penetration at 31%, up from 29% in 2020, on track to achieve medium-term ambition of 33-35%3 supported by House ViewDiscretionary mandates have outperformed >80% of advisory client portfolios4 Institutional1 20WM2 11 Wealth Management2 Institutional (AM, C&IC)1
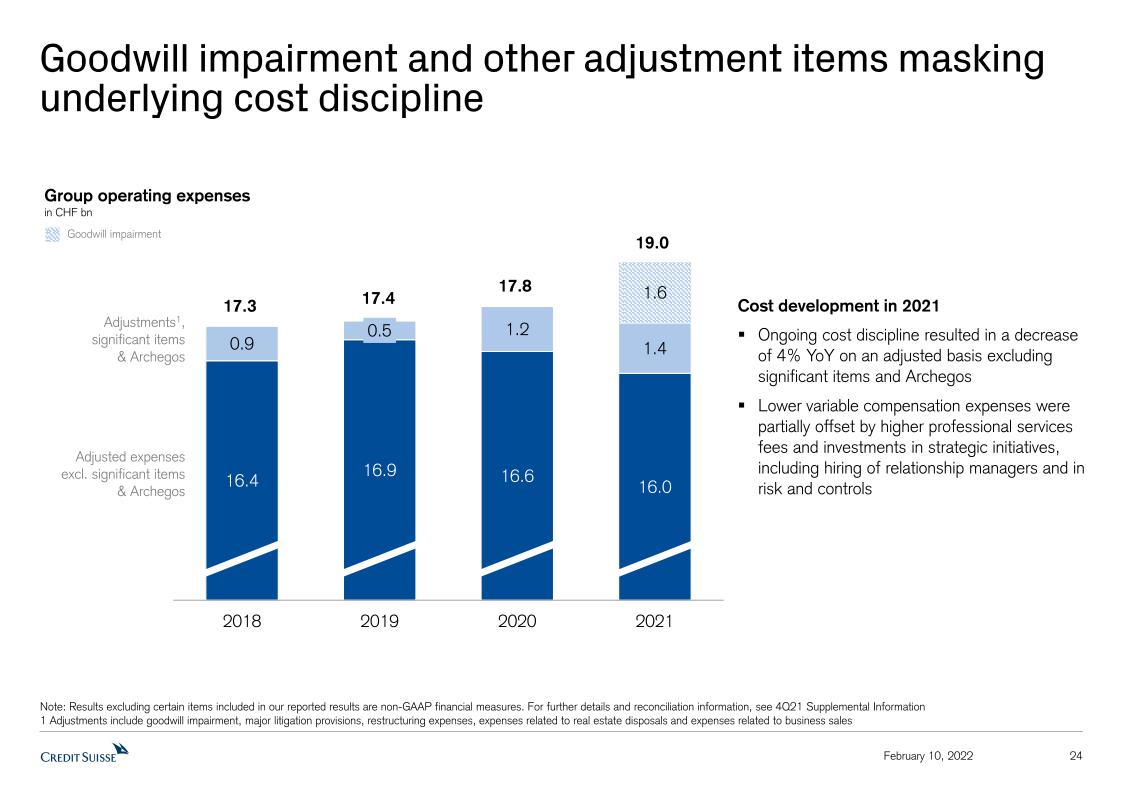
Goodwill impairment and other adjustment items masking underlying cost discipline 24 February 10, 2022 Group operating expensesin CHF bn Note: Results excluding certain items included in our reported results are non-GAAP financial measures. For further details and reconciliation information, see 4Q21 Supplemental Information 1 Adjustments include goodwill impairment, major litigation provisions, restructuring expenses, expenses related to real estate disposals and expenses related to business sales 17.3 Adjustments1,significant items& Archegos 17.4 17.8 19.0 Adjusted expensesexcl. significant items & Archegos Cost development in 2021Ongoing cost discipline resulted in a decrease of 4% YoY on an adjusted basis excluding significant items and ArchegosLower variable compensation expenses were partially offset by higher professional services fees and investments in strategic initiatives, including hiring of relationship managers and in risk and controls Goodwill impairment
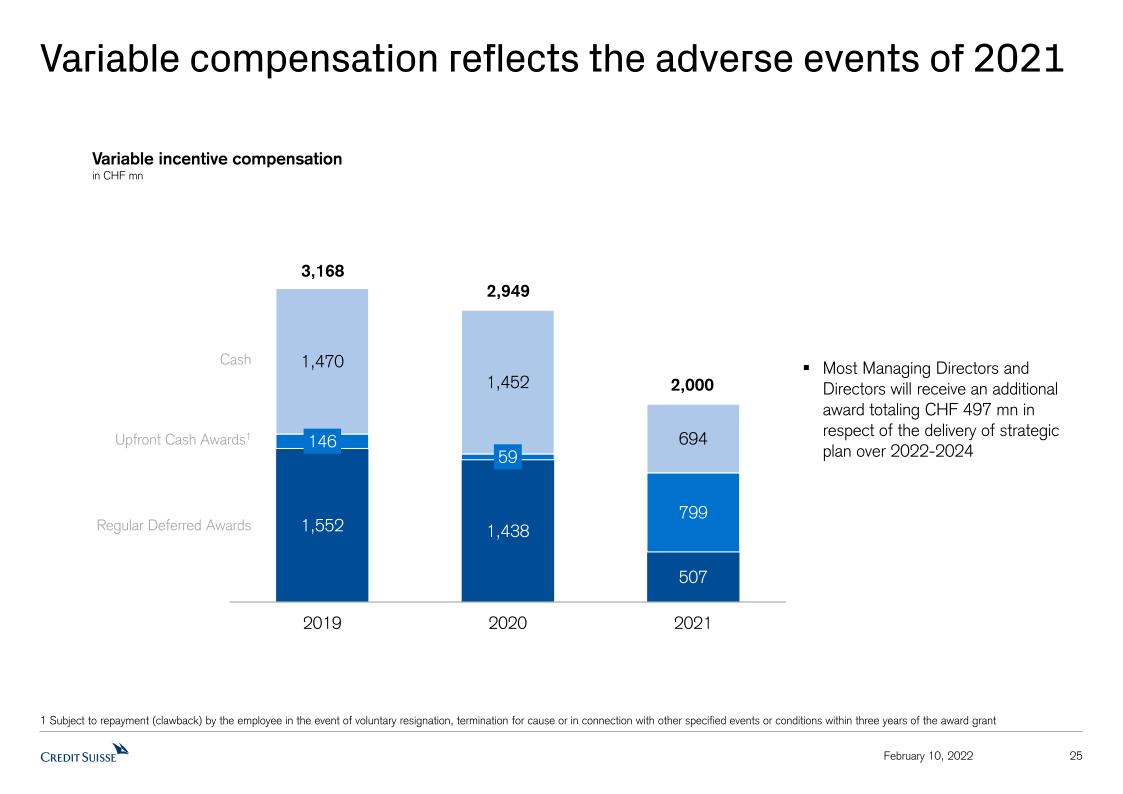
Variable incentive compensationin CHF mn 25 February 10, 2022 Variable compensation reflects the adverse events of 2021 1 Subject to repayment (clawback) by the employee in the event of voluntary resignation, termination for cause or in connection with other specified events or conditions within three years of the award grant 3,168 2,949 2,000 Cash Upfront Cash Awards1 Regular Deferred Awards Most Managing Directors and Directors will receive an additional award totaling CHF 497 mn in respect of the delivery of strategic plan over 2022-2024
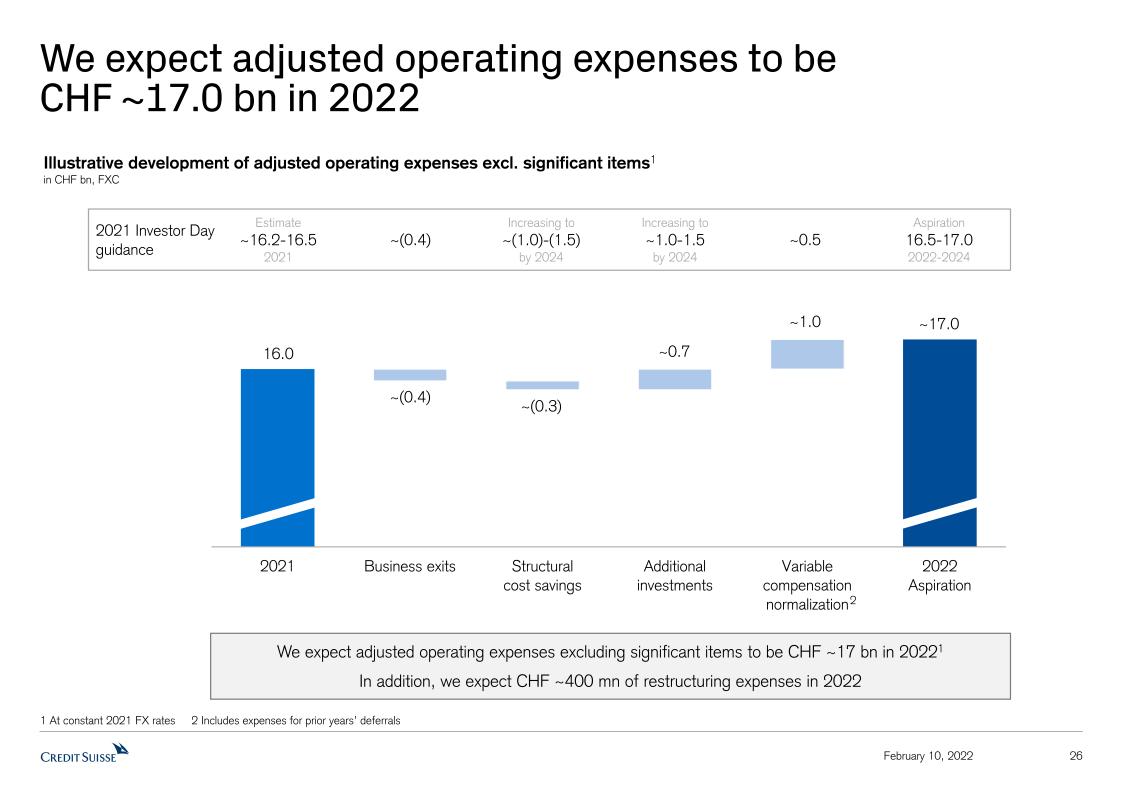
26 February 10, 2022 We expect adjusted operating expenses to be CHF ~17.0 bn in 2022 Illustrative development of adjusted operating expenses excl. significant items1in CHF bn, FXC 1 At constant 2021 FX rates 2 Includes expenses for prior years’ deferrals We expect adjusted operating expenses excluding significant items to be CHF ~17 bn in 20221In addition, we expect CHF ~400 mn of restructuring expenses in 2022 16.0 ~1.0 ~17.0 ~(0.3) ~(0.4) ~0.7 2 2021 Investor Dayguidance Estimate~16.2-16.52021 ~(0.4) Increasing to~1.0-1.5by 2024 Aspiration16.5-17.02022-2024 Increasing to~(1.0)-(1.5)by 2024 ~0.5
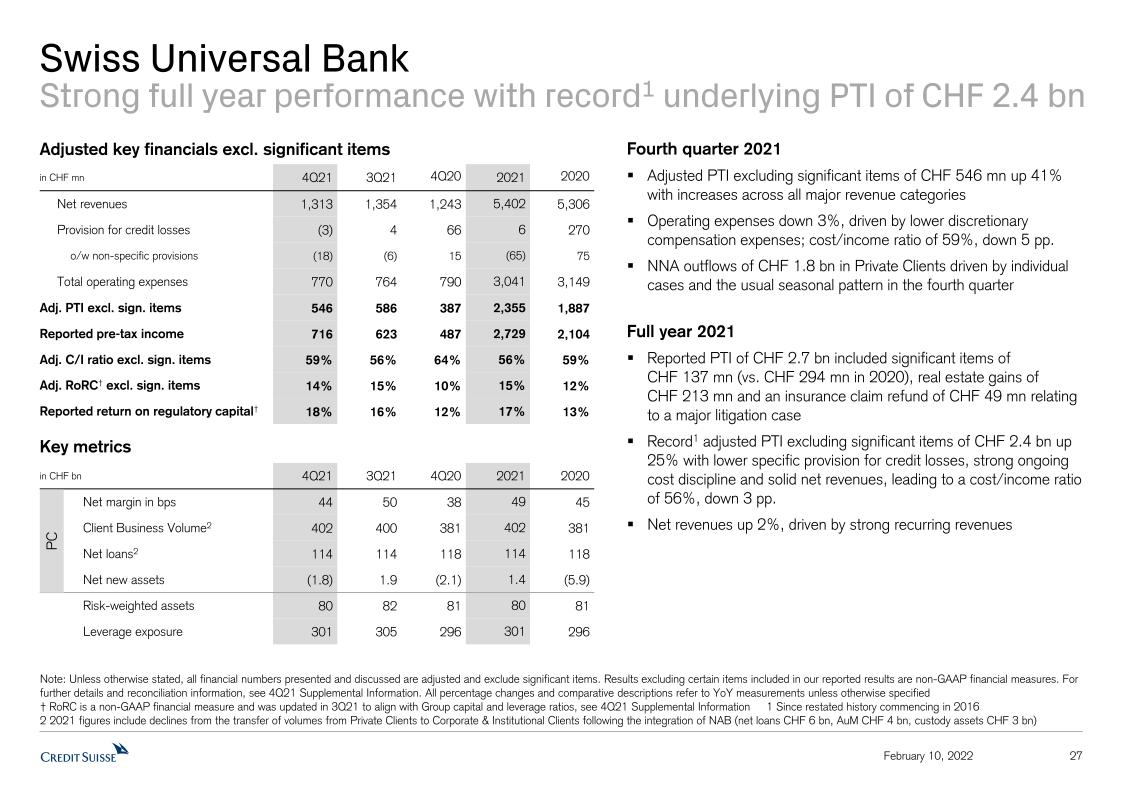
27 Note: Unless otherwise stated, all financial numbers presented and discussed are adjusted and exclude significant items. Results excluding certain items included in our reported results are non-GAAP financial measures. For further details and reconciliation information, see 4Q21 Supplemental Information. All percentage changes and comparative descriptions refer to YoY measurements unless otherwise specified † RoRC is a non-GAAP financial measure and was updated in 3Q21 to align with Group capital and leverage ratios, see 4Q21 Supplemental Information 1 Since restated history commencing in 20162 2021 figures include declines from the transfer of volumes from Private Clients to Corporate & Institutional Clients following the integration of NAB (net loans CHF 6 bn, AuM CHF 4 bn, custody assets CHF 3 bn) February 10, 2022 Key metrics in CHF bn 4Q21 3Q21 4Q20 2021 2020 Net margin in bps 44 50 38 49 45 Client Business Volume2 402 400 381 402 381 Net loans2 114 114 118 114 118 Net new assets (1.8) 1.9 (2.1) 1.4 (5.9) Risk-weighted assets 80 82 81 80 81 Leverage exposure 301 305 296 301 296 Adjusted key financials excl. significant items in CHF mn 4Q21 3Q21 4Q20 2021 2020 Net revenues 1,313 1,354 1,243 5,402 5,306 Provision for credit losses (3) 4 66 6 270 o/w non-specific provisions (18) (6) 15 (65) 75 Total operating expenses 770 764 790 3,041 3,149 Adj. PTI excl. sign. items 546 586 387 2,355 1,887 Reported pre-tax income 716 623 487 2,729 2,104 Adj. C/I ratio excl. sign. items 59% 56% 64% 56% 59% Adj. RoRC† excl. sign. items 14% 15% 10% 15% 12% Reported return on regulatory capital† 18% 16% 12% 17% 13% PC Swiss Universal BankStrong full year performance with record1 underlying PTI of CHF 2.4 bn Fourth quarter 2021Adjusted PTI excluding significant items of CHF 546 mn up 41% with increases across all major revenue categoriesOperating expenses down 3%, driven by lower discretionary compensation expenses; cost/income ratio of 59%, down 5 pp.NNA outflows of CHF 1.8 bn in Private Clients driven by individual cases and the usual seasonal pattern in the fourth quarterFull year 2021Reported PTI of CHF 2.7 bn included significant items of CHF 137 mn (vs. CHF 294 mn in 2020), real estate gains of CHF 213 mn and an insurance claim refund of CHF 49 mn relating to a major litigation caseRecord1 adjusted PTI excluding significant items of CHF 2.4 bn up 25% with lower specific provision for credit losses, strong ongoing cost discipline and solid net revenues, leading to a cost/income ratio of 56%, down 3 pp. Net revenues up 2%, driven by strong recurring revenues
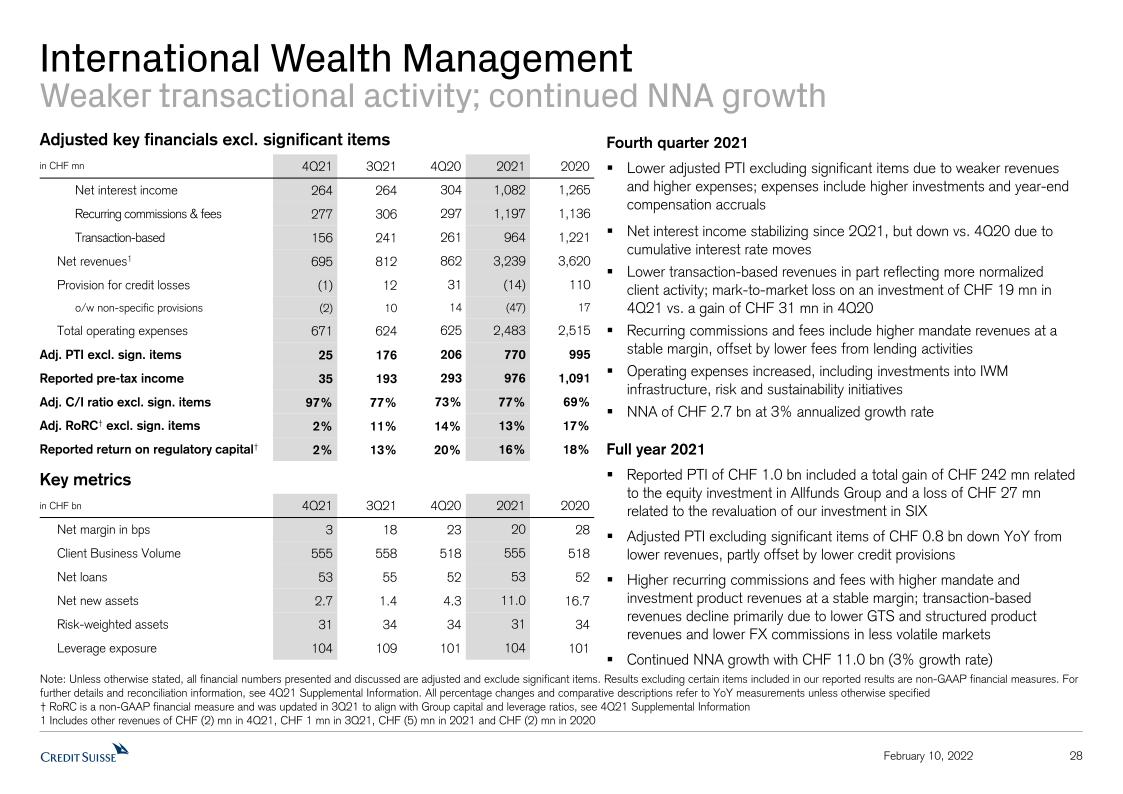
International Wealth ManagementWeaker transactional activity; continued NNA growth 28 February 10, 2022 Note: Unless otherwise stated, all financial numbers presented and discussed are adjusted and exclude significant items. Results excluding certain items included in our reported results are non-GAAP financial measures. For further details and reconciliation information, see 4Q21 Supplemental Information. All percentage changes and comparative descriptions refer to YoY measurements unless otherwise specified † RoRC is a non-GAAP financial measure and was updated in 3Q21 to align with Group capital and leverage ratios, see 4Q21 Supplemental Information 1 Includes other revenues of CHF (2) mn in 4Q21, CHF 1 mn in 3Q21, CHF (5) mn in 2021 and CHF (2) mn in 2020 Adjusted key financials excl. significant items in CHF mn 4Q21 3Q21 4Q20 2021 2020 Net interest income 264 264 304 1,082 1,265 Recurring commissions & fees 277 306 297 1,197 1,136 Transaction-based 156 241 261 964 1,221 Net revenues1 695 812 862 3,239 3,620 Provision for credit losses (1) 12 31 (14) 110 o/w non-specific provisions (2) 10 14 (47) 17 Total operating expenses 671 624 625 2,483 2,515 Adj. PTI excl. sign. items 25 176 206 770 995 Reported pre-tax income 35 193 293 976 1,091 Adj. C/I ratio excl. sign. items 97% 77% 73% 77% 69% Adj. RoRC† excl. sign. items 2% 11% 14% 13% 17% Reported return on regulatory capital† 2% 13% 20% 16% 18% Key metrics in CHF bn 4Q21 3Q21 4Q20 2021 2020 Net margin in bps 3 18 23 20 28 Client Business Volume 555 558 518 555 518 Net loans 53 55 52 53 52 Net new assets 2.7 1.4 4.3 11.0 16.7 Risk-weighted assets 31 34 34 31 34 Leverage exposure 104 109 101 104 101 Fourth quarter 2021Lower adjusted PTI excluding significant items due to weaker revenues and higher expenses; expenses include higher investments and year-end compensation accrualsNet interest income stabilizing since 2Q21, but down vs. 4Q20 due to cumulative interest rate movesLower transaction-based revenues in part reflecting more normalized client activity; mark-to-market loss on an investment of CHF 19 mn in 4Q21 vs. a gain of CHF 31 mn in 4Q20Recurring commissions and fees include higher mandate revenues at a stable margin, offset by lower fees from lending activitiesOperating expenses increased, including investments into IWM infrastructure, risk and sustainability initiativesNNA of CHF 2.7 bn at 3% annualized growth rateFull year 2021Reported PTI of CHF 1.0 bn included a total gain of CHF 242 mn related to the equity investment in Allfunds Group and a loss of CHF 27 mn related to the revaluation of our investment in SIXAdjusted PTI excluding significant items of CHF 0.8 bn down YoY from lower revenues, partly offset by lower credit provisionsHigher recurring commissions and fees with higher mandate and investment product revenues at a stable margin; transaction-based revenues decline primarily due to lower GTS and structured product revenues and lower FX commissions in less volatile marketsContinued NNA growth with CHF 11.0 bn (3% growth rate)
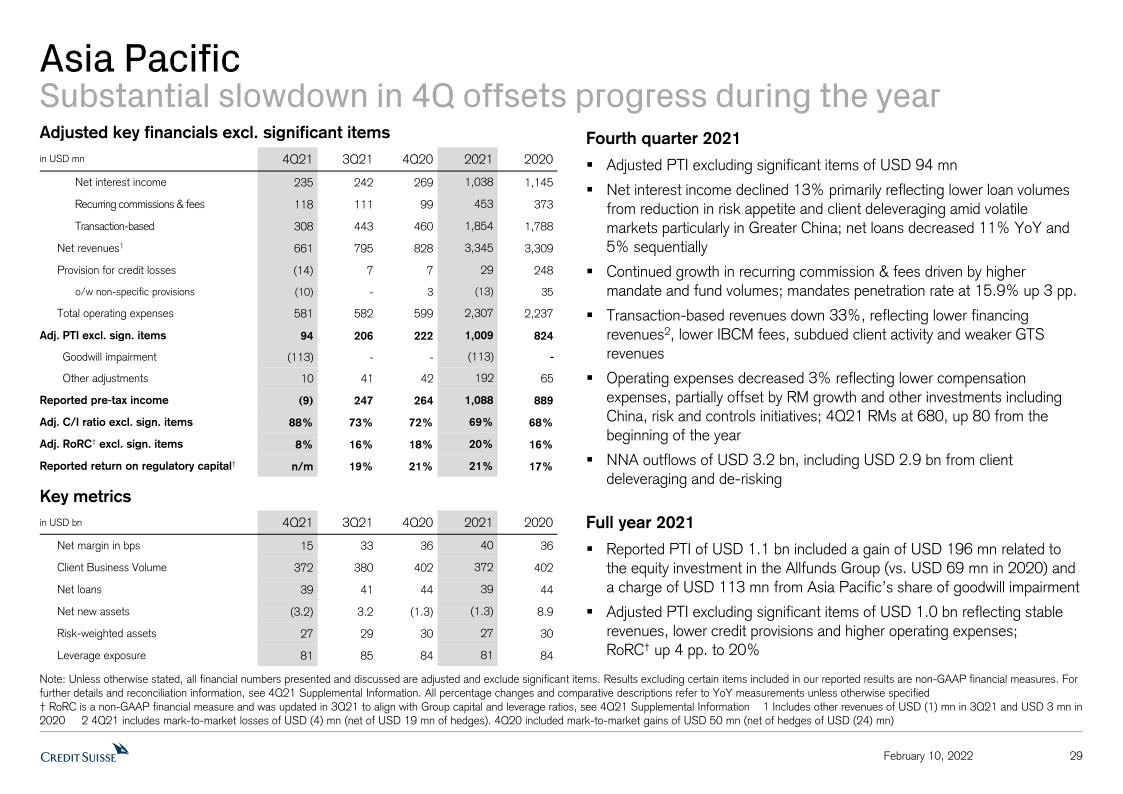
Asia PacificSubstantial slowdown in 4Q offsets progress during the year 29 February 10, 2022 Adjusted key financials excl. significant items in USD mn 4Q21 3Q21 4Q20 2021 2020 Net interest income 235 242 269 1,038 1,145 Recurring commissions & fees 118 111 99 453 373 Transaction-based 308 443 460 1,854 1,788 Net revenues1 661 795 828 3,345 3,309 Provision for credit losses (14) 7 7 29 248 o/w non-specific provisions (10) - 3 (13) 35 Total operating expenses 581 582 599 2,307 2,237 Adj. PTI excl. sign. items 94 206 222 1,009 824 Goodwill impairment (113) - - (113) - Other adjustments 10 41 42 192 65 Reported pre-tax income (9) 247 264 1,088 889 Adj. C/I ratio excl. sign. items 88% 73% 72% 69% 68% Adj. RoRC† excl. sign. items 8% 16% 18% 20% 16% Reported return on regulatory capital† n/m 19% 21% 21% 17% Key metrics in USD bn 4Q21 3Q21 4Q20 2021 2020 Net margin in bps 15 33 36 40 36 Client Business Volume 372 380 402 372 402 Net loans 39 41 44 39 44 Net new assets (3.2) 3.2 (1.3) (1.3) 8.9 Risk-weighted assets 27 29 30 27 30 Leverage exposure 81 85 84 81 84 Note: Unless otherwise stated, all financial numbers presented and discussed are adjusted and exclude significant items. Results excluding certain items included in our reported results are non-GAAP financial measures. For further details and reconciliation information, see 4Q21 Supplemental Information. All percentage changes and comparative descriptions refer to YoY measurements unless otherwise specified † RoRC is a non-GAAP financial measure and was updated in 3Q21 to align with Group capital and leverage ratios, see 4Q21 Supplemental Information 1 Includes other revenues of USD (1) mn in 3Q21 and USD 3 mn in 2020 2 4Q21 includes mark-to-market losses of USD (4) mn (net of USD 19 mn of hedges). 4Q20 included mark-to-market gains of USD 50 mn (net of hedges of USD (24) mn) Fourth quarter 2021Adjusted PTI excluding significant items of USD 94 mn Net interest income declined 13% primarily reflecting lower loan volumes from reduction in risk appetite and client deleveraging amid volatile markets particularly in Greater China; net loans decreased 11% YoY and 5% sequentiallyContinued growth in recurring commission & fees driven by higher mandate and fund volumes; mandates penetration rate at 15.9% up 3 pp.Transaction-based revenues down 33%, reflecting lower financing revenues2, lower IBCM fees, subdued client activity and weaker GTS revenuesOperating expenses decreased 3% reflecting lower compensation expenses, partially offset by RM growth and other investments including China, risk and controls initiatives; 4Q21 RMs at 680, up 80 from the beginning of the year NNA outflows of USD 3.2 bn, including USD 2.9 bn from client deleveraging and de-riskingFull year 2021Reported PTI of USD 1.1 bn included a gain of USD 196 mn related to the equity investment in the Allfunds Group (vs. USD 69 mn in 2020) and a charge of USD 113 mn from Asia Pacific’s share of goodwill impairmentAdjusted PTI excluding significant items of USD 1.0 bn reflecting stable revenues, lower credit provisions and higher operating expenses; RoRC† up 4 pp. to 20%
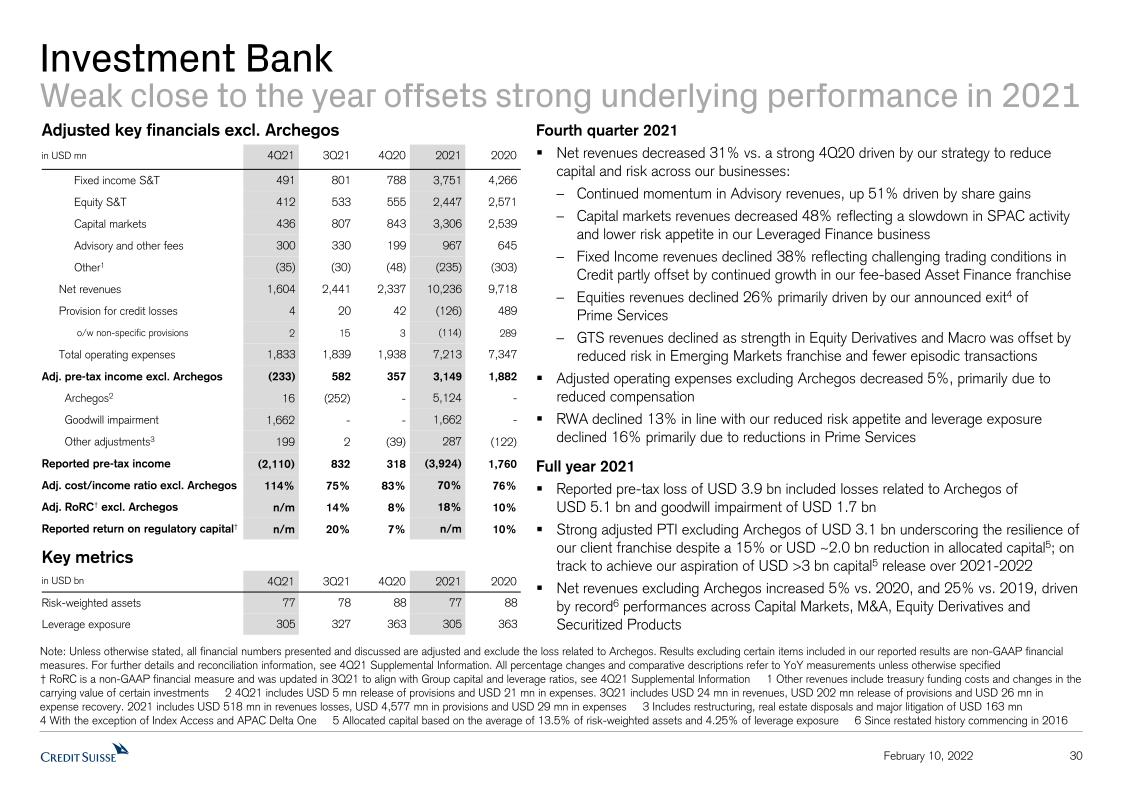
Investment BankWeak close to the year offsets strong underlying performance in 2021 30 February 10, 2022 Note: Unless otherwise stated, all financial numbers presented and discussed are adjusted and exclude the loss related to Archegos. Results excluding certain items included in our reported results are non-GAAP financial measures. For further details and reconciliation information, see 4Q21 Supplemental Information. All percentage changes and comparative descriptions refer to YoY measurements unless otherwise specified † RoRC is a non-GAAP financial measure and was updated in 3Q21 to align with Group capital and leverage ratios, see 4Q21 Supplemental Information 1 Other revenues include treasury funding costs and changes in the carrying value of certain investments 2 4Q21 includes USD 5 mn release of provisions and USD 21 mn in expenses. 3Q21 includes USD 24 mn in revenues, USD 202 mn release of provisions and USD 26 mn in expense recovery. 2021 includes USD 518 mn in revenues losses, USD 4,577 mn in provisions and USD 29 mn in expenses 3 Includes restructuring, real estate disposals and major litigation of USD 163 mn 4 With the exception of Index Access and APAC Delta One 5 Allocated capital based on the average of 13.5% of risk-weighted assets and 4.25% of leverage exposure 6 Since restated history commencing in 2016 Key metrics in USD bn 4Q21 3Q21 4Q20 2021 2020 Risk-weighted assets 77 78 88 77 88 Leverage exposure 305 327 363 305 363 Adjusted key financials excl. Archegos in USD mn 4Q21 3Q21 4Q20 2021 2020 Fixed income S&T 491 801 788 3,751 4,266 Equity S&T 412 533 555 2,447 2,571 Capital markets 436 807 843 3,306 2,539 Advisory and other fees 300 330 199 967 645 Other1 (35) (30) (48) (235) (303) Net revenues 1,604 2,441 2,337 10,236 9,718 Provision for credit losses 4 20 42 (126) 489 o/w non-specific provisions 2 15 3 (114) 289 Total operating expenses 1,833 1,839 1,938 7,213 7,347 Adj. pre-tax income excl. Archegos (233) 582 357 3,149 1,882 Archegos2 16 (252) - 5,124 - Goodwill impairment 1,662 - - 1,662 - Other adjustments3 199 2 (39) 287 (122) Reported pre-tax income (2,110) 832 318 (3,924) 1,760 Adj. cost/income ratio excl. Archegos 114% 75% 83% 70% 76% Adj. RoRC† excl. Archegos n/m 14% 8% 18% 10% Reported return on regulatory capital† n/m 20% 7% n/m 10% Fourth quarter 2021Net revenues decreased 31% vs. a strong 4Q20 driven by our strategy to reduce capital and risk across our businesses: Continued momentum in Advisory revenues, up 51% driven by share gainsCapital markets revenues decreased 48% reflecting a slowdown in SPAC activity and lower risk appetite in our Leveraged Finance businessFixed Income revenues declined 38% reflecting challenging trading conditions in Credit partly offset by continued growth in our fee-based Asset Finance franchiseEquities revenues declined 26% primarily driven by our announced exit4 of Prime ServicesGTS revenues declined as strength in Equity Derivatives and Macro was offset by reduced risk in Emerging Markets franchise and fewer episodic transactionsAdjusted operating expenses excluding Archegos decreased 5%, primarily due to reduced compensation RWA declined 13% in line with our reduced risk appetite and leverage exposure declined 16% primarily due to reductions in Prime ServicesFull year 2021Reported pre-tax loss of USD 3.9 bn included losses related to Archegos of USD 5.1 bn and goodwill impairment of USD 1.7 bnStrong adjusted PTI excluding Archegos of USD 3.1 bn underscoring the resilience of our client franchise despite a 15% or USD ~2.0 bn reduction in allocated capital5; on track to achieve our aspiration of USD >3 bn capital5 release over 2021-2022Net revenues excluding Archegos increased 5% vs. 2020, and 25% vs. 2019, driven by record6 performances across Capital Markets, M&A, Equity Derivatives and Securitized Products
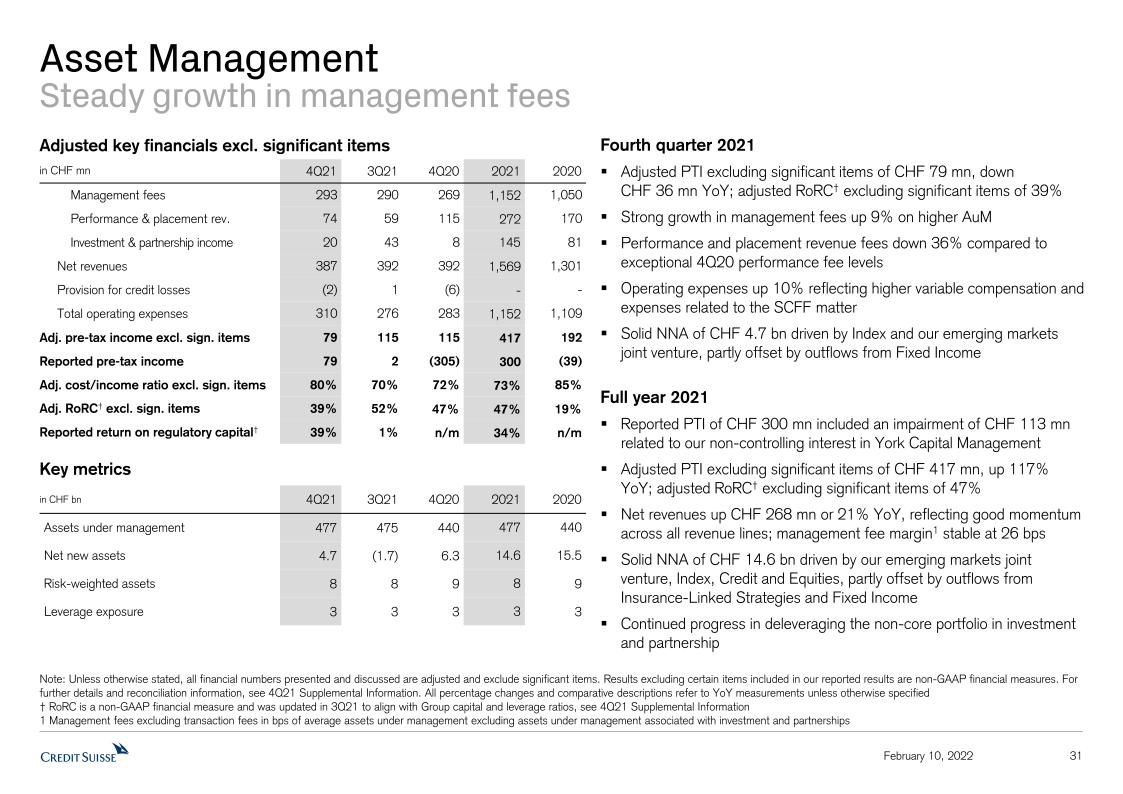
Asset ManagementSteady growth in management fees 31 February 10, 2022 Note: Unless otherwise stated, all financial numbers presented and discussed are adjusted and exclude significant items. Results excluding certain items included in our reported results are non-GAAP financial measures. For further details and reconciliation information, see 4Q21 Supplemental Information. All percentage changes and comparative descriptions refer to YoY measurements unless otherwise specified † RoRC is a non-GAAP financial measure and was updated in 3Q21 to align with Group capital and leverage ratios, see 4Q21 Supplemental Information 1 Management fees excluding transaction fees in bps of average assets under management excluding assets under management associated with investment and partnerships Fourth quarter 2021Adjusted PTI excluding significant items of CHF 79 mn, down CHF 36 mn YoY; adjusted RoRC† excluding significant items of 39%Strong growth in management fees up 9% on higher AuM Performance and placement revenue fees down 36% compared to exceptional 4Q20 performance fee levelsOperating expenses up 10% reflecting higher variable compensation and expenses related to the SCFF matterSolid NNA of CHF 4.7 bn driven by Index and our emerging markets joint venture, partly offset by outflows from Fixed IncomeFull year 2021Reported PTI of CHF 300 mn included an impairment of CHF 113 mn related to our non-controlling interest in York Capital ManagementAdjusted PTI excluding significant items of CHF 417 mn, up 117% YoY; adjusted RoRC† excluding significant items of 47%Net revenues up CHF 268 mn or 21% YoY, reflecting good momentum across all revenue lines; management fee margin1 stable at 26 bpsSolid NNA of CHF 14.6 bn driven by our emerging markets joint venture, Index, Credit and Equities, partly offset by outflows from Insurance-Linked Strategies and Fixed IncomeContinued progress in deleveraging the non-core portfolio in investment and partnership Adjusted key financials excl. significant items in CHF mn 4Q21 3Q21 4Q20 2021 2020 Management fees 293 290 269 1,152 1,050 Performance & placement rev. 74 59 115 272 170 Investment & partnership income 20 43 8 145 81 Net revenues 387 392 392 1,569 1,301 Provision for credit losses (2) 1 (6) - - Total operating expenses 310 276 283 1,152 1,109 Adj. pre-tax income excl. sign. items 79 115 115 417 192 Reported pre-tax income 79 2 (305) 300 (39) Adj. cost/income ratio excl. sign. items 80% 70% 72% 73% 85% Adj. RoRC† excl. sign. items 39% 52% 47% 47% 19% Reported return on regulatory capital† 39% 1% n/m 34% n/m Key metrics in CHF bn 4Q21 3Q21 4Q20 2021 2020 Assets under management 477 475 440 477 440 Net new assets 4.7 (1.7) 6.3 14.6 15.5 Risk-weighted assets 8 8 9 8 9 Leverage exposure 3 3 3 3 3
32 February 10, 2022 2022 will be a transition year 1Q22 results to reflect normalization of the market environment from the exceptional levels of 1Q21 Improving franchise momentum after weak start to January, including positive YTD NNA in our WM business Higher compensation and restructuring costs to increase 2022 expenses 2022 will be a year of tightening monetary policy Note: Estimates and assumptions are based on currently available information and beliefs, expectations and opinions of management and include all known facts and decisions as of February 10, 2022.Actual results may differ
Concluding Remarks 33 February 10, 2022
34 February 10, 2022 Concluding Remarks: priorities for 2022 Further strengthen risk culture Accelerate client and revenue momentum Execute strategic plan

February 10, 2022 35
February 10, 2022 Credit SuisseFourth Quarter and Full Year 2021 ResultsSupplemental Information
Disclaimer 2 February 10, 2022 This Fourth Quarter and Full Year 2021 Results Supplemental Information is intended as a supplement and should be read in connection with the Fourth Quarter and Full Year 2021 Credit Suisse Results Presentation slides.Credit Suisse has not finalized its 2021 Annual Report and Credit Suisse’s independent registered public accounting firm has not completed its audit of the consolidated financial statements for the period. Accordingly, the financial information contained in this presentation is subject to completion of year-end procedures, which may result in changes to that information. This material does not purport to contain all of the information that you may wish to consider. This material is not to be relied upon as such or used in substitution for the exercise of independent judgment.Estimates and assumptionsIn preparing this presentation, management has made estimates and assumptions that affect the numbers presented. Actual results may differ. Annualized numbers do not take into account variations in operating results, seasonality and other factors and may not be indicative of actual, full-year results. Figures throughout this presentation may also be subject to rounding adjustments. All opinions and views constitute judgments as of the date of writing without regard to the date on which the reader may receive or access the information. This information is subject to change at any time without notice and we do not intend to update this information.Statement regarding non-GAAP financial measuresThis presentation contains non-GAAP financial measures, including results excluding certain items included in our reported results. Further details and information needed to reconcile such non-GAAP financial measures to the most directly comparable measures under US GAAP can be found in this presentation, which is available on our website at www.credit-suisse.com.Statement regarding capital, liquidity and leverageCredit Suisse is subject to the Basel framework, as implemented in Switzerland, as well as Swiss legislation and regulations for systemically important banks, which include capital, liquidity, leverage and large exposure requirements and rules for emergency plans designed to maintain systemically relevant functions in the event of threatened insolvency. Credit Suisse has adopted the Bank for International Settlements (BIS) leverage ratio framework, as issued by the Basel Committee on Banking Supervision (BCBS) and implemented in Switzerland by the Swiss Financial Market Supervisory Authority FINMA.Unless otherwise noted, leverage exposure is based on the BIS leverage ratio framework and consists of period-end balance sheet assets and prescribed regulatory adjustments. The tier 1 leverage ratio and CET1 leverage ratio are calculated as BIS tier 1 capital and CET1 capital, respectively, divided by period-end leverage exposure. Unless otherwise noted, for periods in 2020, leverage exposure excludes cash held at central banks, after adjusting for the dividend paid in 2020.Sources Certain material in this presentation has been prepared by Credit Suisse on the basis of publicly available information, internally developed data and other third-party sources believed to be reliable. Credit Suisse has not sought to independently verify information obtained from public and third-party sources and makes no representations or warranties as to accuracy, completeness or reliability of such information.
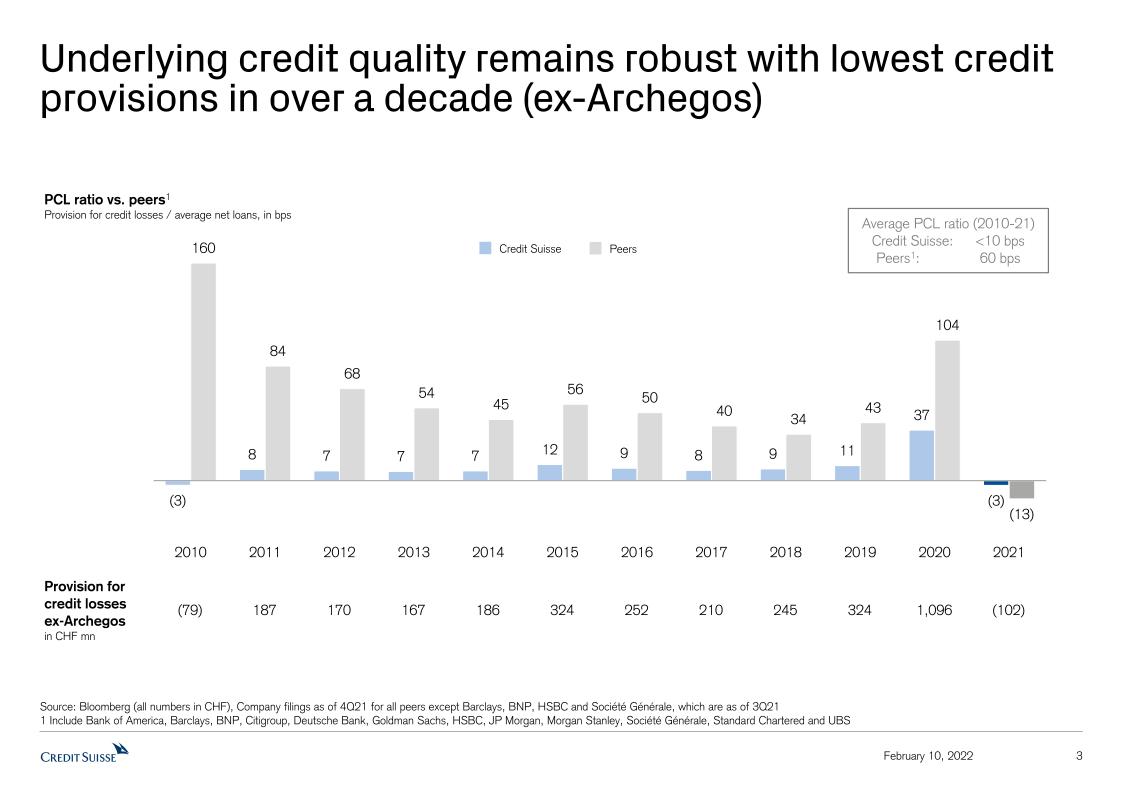
Underlying credit quality remains robust with lowest credit provisions in over a decade (ex-Archegos) 3 February 10, 2022 Provision for credit losses ex-Archegosin CHF mn Source: Bloomberg (all numbers in CHF), Company filings as of 4Q21 for all peers except Barclays, BNP, HSBC and Société Générale, which are as of 3Q211 Include Bank of America, Barclays, BNP, Citigroup, Deutsche Bank, Goldman Sachs, HSBC, JP Morgan, Morgan Stanley, Société Générale, Standard Chartered and UBS PCL ratio vs. peers1Provision for credit losses / average net loans, in bps Average PCL ratio (2010-21)Credit Suisse: <10 bpsPeers1: 60 bps (79) 187 170 167 186 324 252 210 245 324 1,096 (102) Credit Suisse Peers
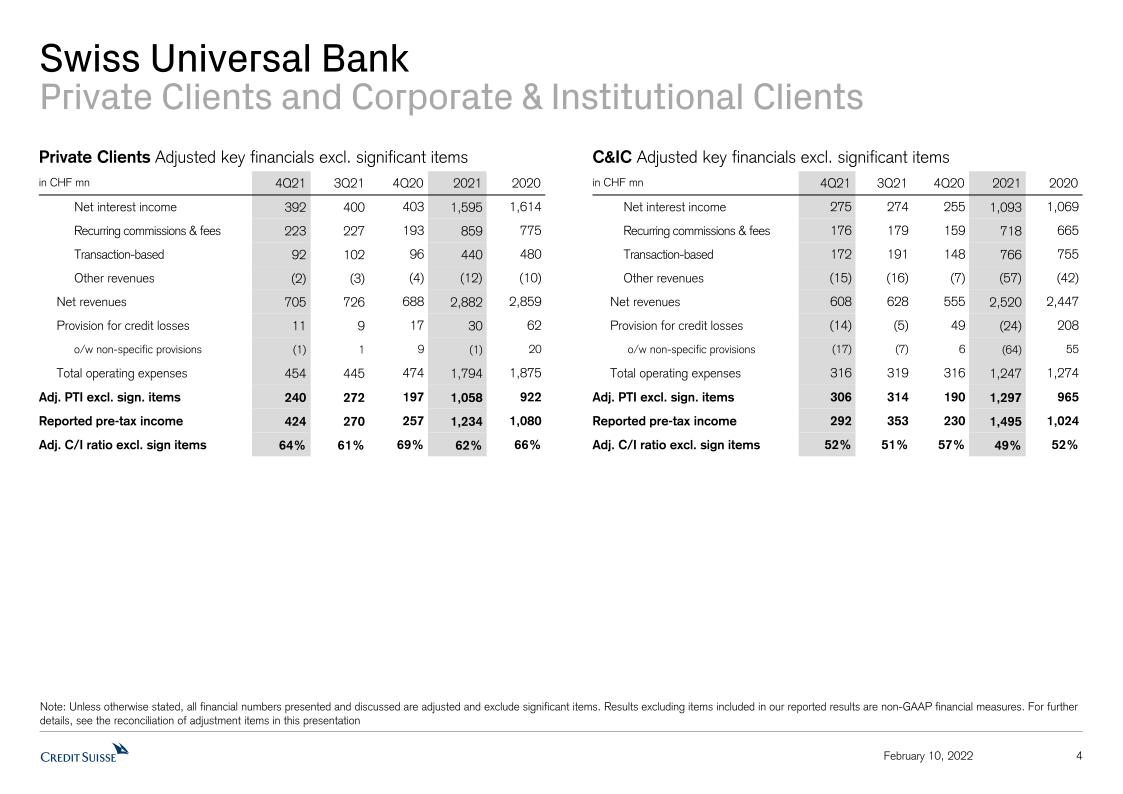
Swiss Universal BankPrivate Clients and Corporate & Institutional Clients 4 February 10, 2022 Note: Unless otherwise stated, all financial numbers presented and discussed are adjusted and exclude significant items. Results excluding items included in our reported results are non-GAAP financial measures. For further details, see the reconciliation of adjustment items in this presentation C&IC Adjusted key financials excl. significant items in CHF mn 4Q21 3Q21 4Q20 2021 2020 Net interest income 275 274 255 1,093 1,069 Recurring commissions & fees 176 179 159 718 665 Transaction-based 172 191 148 766 755 Other revenues (15) (16) (7) (57) (42) Net revenues 608 628 555 2,520 2,447 Provision for credit losses (14) (5) 49 (24) 208 o/w non-specific provisions (17) (7) 6 (64) 55 Total operating expenses 316 319 316 1,247 1,274 Adj. PTI excl. sign. items 306 314 190 1,297 965 Reported pre-tax income 292 353 230 1,495 1,024 Adj. C/I ratio excl. sign items 52% 51% 57% 49% 52% Private Clients Adjusted key financials excl. significant items in CHF mn 4Q21 3Q21 4Q20 2021 2020 Net interest income 392 400 403 1,595 1,614 Recurring commissions & fees 223 227 193 859 775 Transaction-based 92 102 96 440 480 Other revenues (2) (3) (4) (12) (10) Net revenues 705 726 688 2,882 2,859 Provision for credit losses 11 9 17 30 62 o/w non-specific provisions (1) 1 9 (1) 20 Total operating expenses 454 445 474 1,794 1,875 Adj. PTI excl. sign. items 240 272 197 1,058 922 Reported pre-tax income 424 270 257 1,234 1,080 Adj. C/I ratio excl. sign items 64% 61% 69% 62% 66%
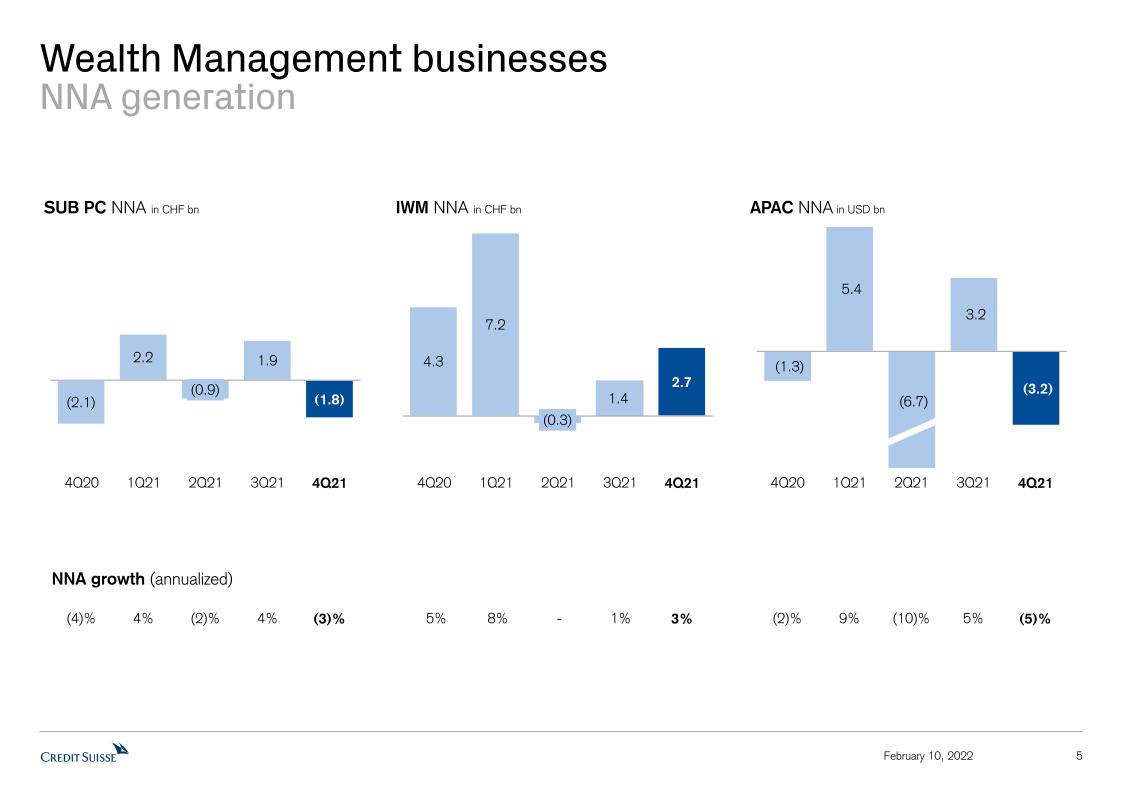
Wealth Management businessesNNA generation 5 IWM NNA in CHF bn 1% SUB PC NNA in CHF bn NNA growth (annualized) 4% 4Q21 4Q21 - 3% 8% 5% (2)% (3)% 4% (4)% 3Q21 4Q20 1Q21 2Q21 3Q21 4Q20 1Q21 2Q21 February 10, 2022 5% APAC NNA in USD bn 4Q21 (10)% (5)% 9% (2)% 3Q21 4Q20 1Q21 2Q21
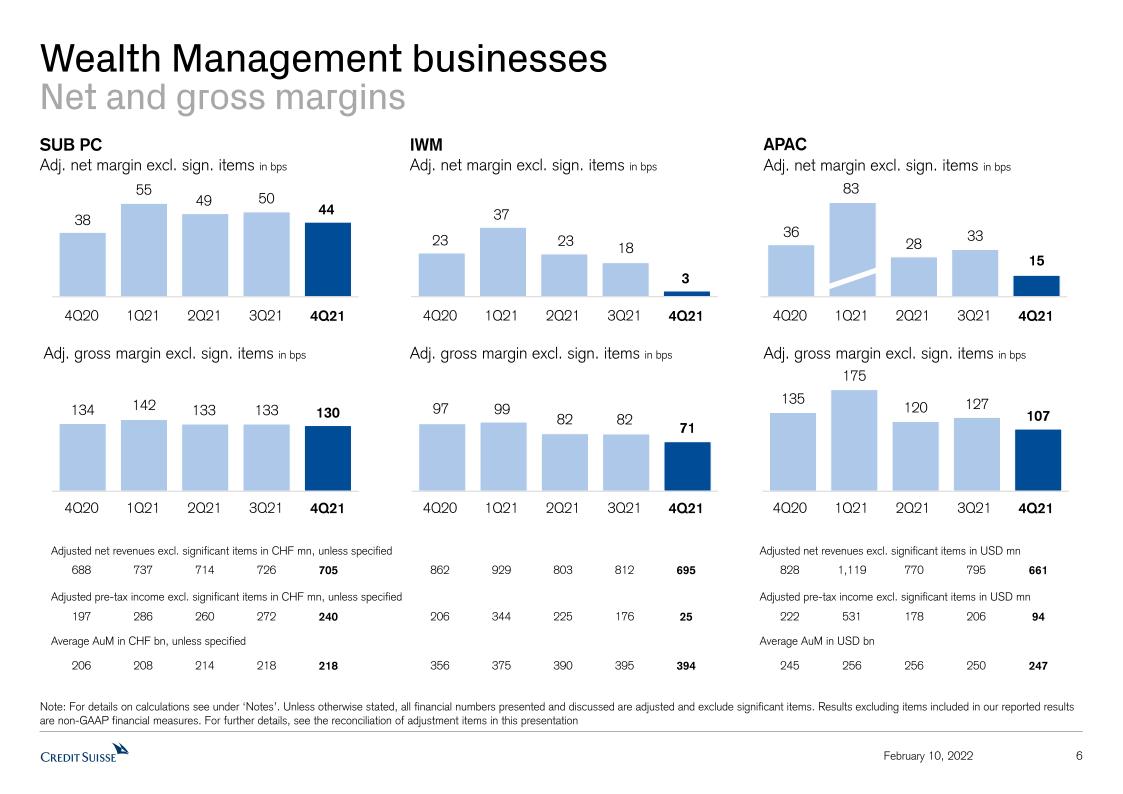
6 February 10, 2022 Wealth Management businessesNet and gross margins Note: For details on calculations see under ‘Notes’. Unless otherwise stated, all financial numbers presented and discussed are adjusted and exclude significant items. Results excluding items included in our reported results are non-GAAP financial measures. For further details, see the reconciliation of adjustment items in this presentation 206 197 Average AuM in CHF bn, unless specified Adjusted pre-tax income excl. significant items in CHF mn, unless specified Adjusted net revenues excl. significant items in CHF mn, unless specified 862 929 803 206 344 356 375 688 737 714 260 286 208 IWMAdj. net margin excl. sign. items in bps Adj. gross margin excl. sign. items in bps 4Q21 3Q21 1Q21 4Q20 2Q21 4Q21 3Q21 1Q21 4Q20 2Q21 SUB PCAdj. net margin excl. sign. items in bps Adj. gross margin excl. sign. items in bps 4Q21 3Q21 1Q21 4Q20 2Q21 4Q21 3Q21 1Q21 4Q20 2Q21 222 828 1,119 770 531 245 256 APAC Adj. net margin excl. sign. items in bps Adj. gross margin excl. sign. items in bps 4Q21 3Q21 1Q21 4Q20 2Q21 4Q21 3Q21 1Q21 4Q20 2Q21 Average AuM in USD bn Adjusted pre-tax income excl. significant items in USD mn Adjusted net revenues excl. significant items in USD mn 695 225 390 661 178 256 214 705 240 218 25 394 94 247 726 272 218 812 176 395 795 206 250
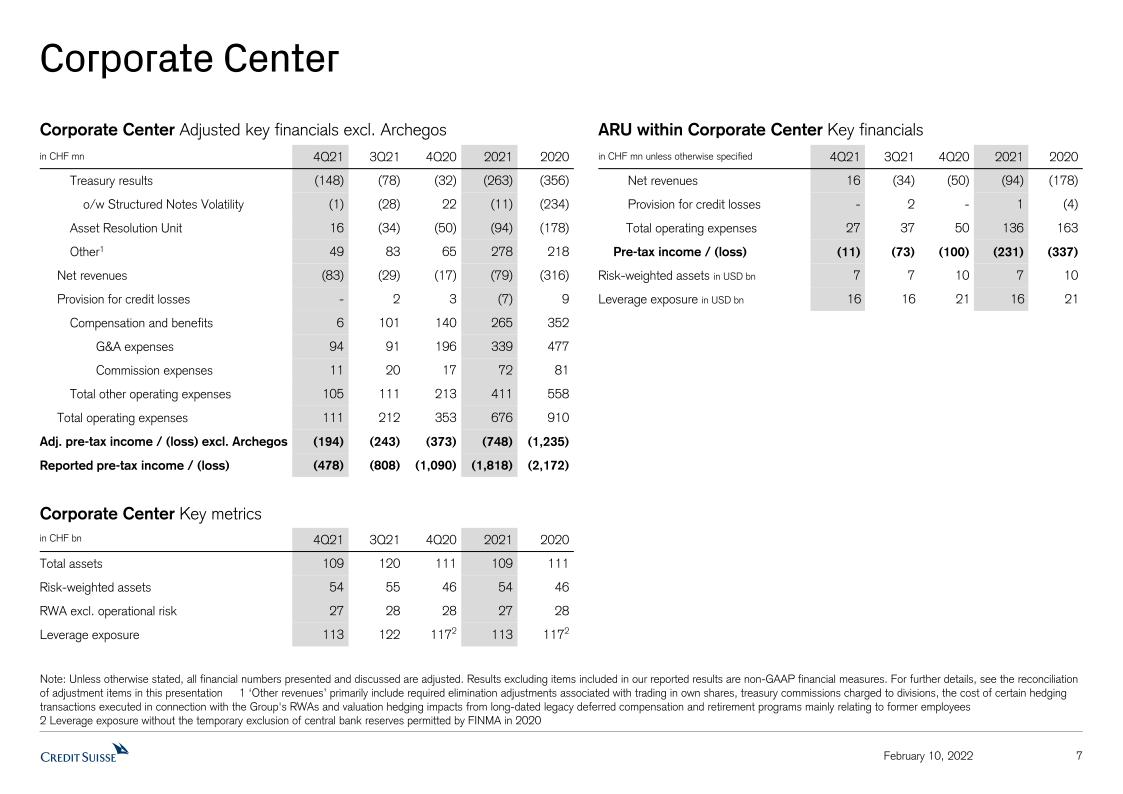
7 Corporate Center Note: Unless otherwise stated, all financial numbers presented and discussed are adjusted. Results excluding items included in our reported results are non-GAAP financial measures. For further details, see the reconciliation of adjustment items in this presentation 1 ‘Other revenues’ primarily include required elimination adjustments associated with trading in own shares, treasury commissions charged to divisions, the cost of certain hedging transactions executed in connection with the Group's RWAs and valuation hedging impacts from long-dated legacy deferred compensation and retirement programs mainly relating to former employees 2 Leverage exposure without the temporary exclusion of central bank reserves permitted by FINMA in 2020 ARU within Corporate Center Key financials in CHF mn unless otherwise specified 4Q21 3Q21 4Q20 2021 2020 Net revenues 16 (34) (50) (94) (178) Provision for credit losses - 2 - 1 (4) Total operating expenses 27 37 50 136 163 Pre-tax income / (loss) (11) (73) (100) (231) (337) Risk-weighted assets in USD bn 7 7 10 7 10 Leverage exposure in USD bn 16 16 21 16 21 Corporate Center Key metrics in CHF bn 4Q21 3Q21 4Q20 2021 2020 Total assets 109 120 111 109 111 Risk-weighted assets 54 55 46 54 46 RWA excl. operational risk 27 28 28 27 28 Leverage exposure 113 122 1172 113 1172 Corporate Center Adjusted key financials excl. Archegos in CHF mn 4Q21 3Q21 4Q20 2021 2020 Treasury results (148) (78) (32) (263) (356) o/w Structured Notes Volatility (1) (28) 22 (11) (234) Asset Resolution Unit 16 (34) (50) (94) (178) Other1 49 83 65 278 218 Net revenues (83) (29) (17) (79) (316) Provision for credit losses - 2 3 (7) 9 Compensation and benefits 6 101 140 265 352 G&A expenses 94 91 196 339 477 Commission expenses 11 20 17 72 81 Total other operating expenses 105 111 213 411 558 Total operating expenses 111 212 353 676 910 Adj. pre-tax income / (loss) excl. Archegos (194) (243) (373) (748) (1,235) Reported pre-tax income / (loss) (478) (808) (1,090) (1,818) (2,172) February 10, 2022
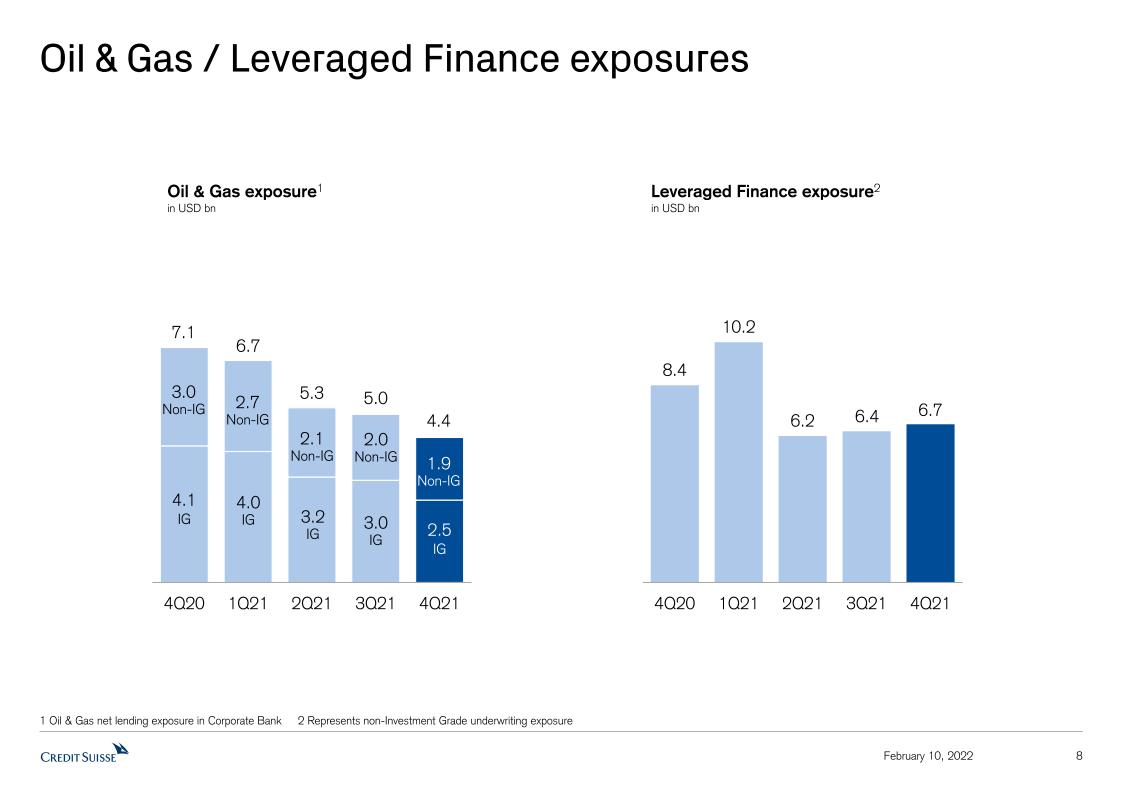
8 February 10, 2022 Oil & Gas / Leveraged Finance exposures Oil & Gas exposure1in USD bn Leveraged Finance exposure2in USD bn 1 Oil & Gas net lending exposure in Corporate Bank 2 Represents non-Investment Grade underwriting exposure 6.4 8.4 6.7 2.7Non-IG 4.0IG 10.2 5.3 2.1Non-IG 2.0Non-IG 3.2IG 5.0 3.0IG 6.2 1.9Non-IG 3.0Non-IG 7.1 4.4
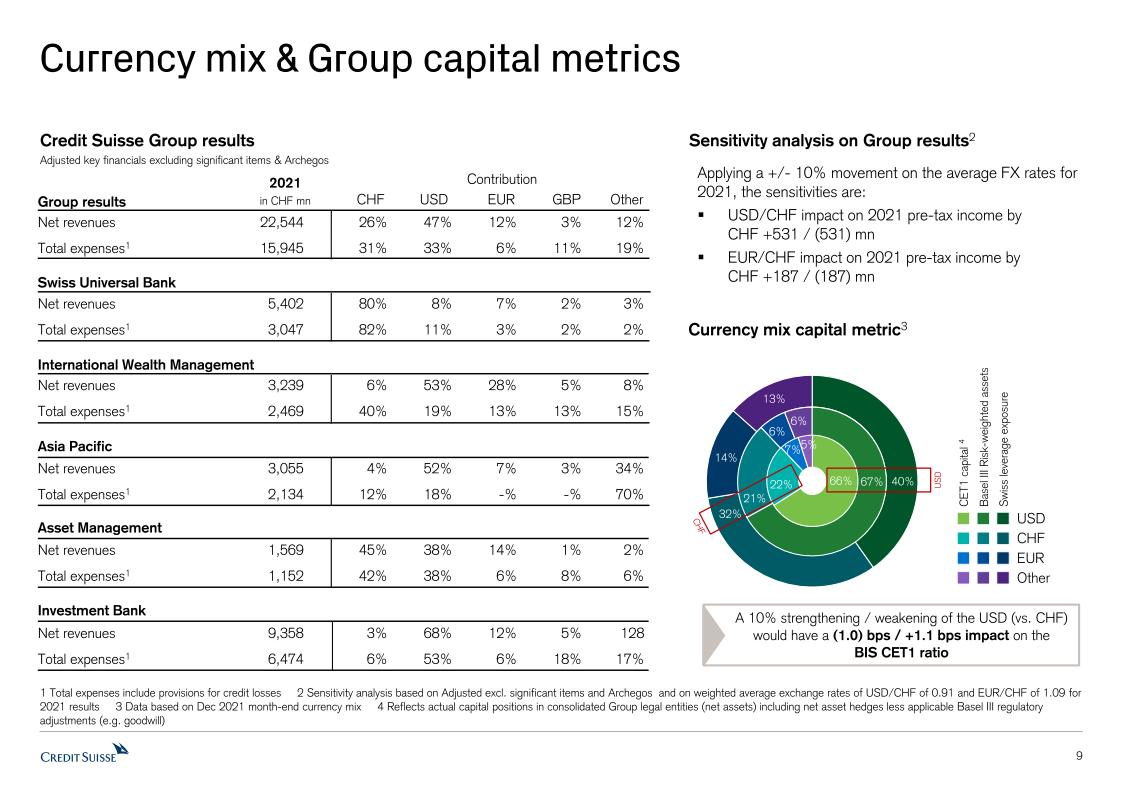
Currency mix & Group capital metrics 9 Credit Suisse Group resultsAdjusted key financials excluding significant items & Archegos Applying a +/- 10% movement on the average FX rates for 2021, the sensitivities are:USD/CHF impact on 2021 pre-tax income by CHF +531 / (531) mnEUR/CHF impact on 2021 pre-tax income by CHF +187 / (187) mn Sensitivity analysis on Group results2 1 Total expenses include provisions for credit losses 2 Sensitivity analysis based on Adjusted excl. significant items and Archegos and on weighted average exchange rates of USD/CHF of 0.91 and EUR/CHF of 1.09 for 2021 results 3 Data based on Dec 2021 month-end currency mix 4 Reflects actual capital positions in consolidated Group legal entities (net assets) including net asset hedges less applicable Basel III regulatory adjustments (e.g. goodwill) 2021in CHF mn Contribution Swiss Universal Bank International Wealth Management Asia Pacific Asset Management Group results CHF USD EUR GBP Other Investment Bank Net revenues 22,544 26% 47% 12% 3% 12%Total expenses1 15,945 31% 33% 6% 11% 19% Net revenues 5,402 80% 8% 7% 2% 3%Total expenses1 3,047 82% 11% 3% 2% 2% Net revenues 3,239 6% 53% 28% 5% 8%Total expenses1 2,469 40% 19% 13% 13% 15% Net revenues 3,055 4% 52% 7% 3% 34%Total expenses1 2,134 12% 18% -% -% 70% Net revenues 1,569 45% 38% 14% 1% 2%Total expenses1 1,152 42% 38% 6% 8% 6% Net revenues 9,358 3% 68% 12% 5% 128Total expenses1 6,474 6% 53% 6% 18% 17% Currency mix capital metric3 A 10% strengthening / weakening of the USD (vs. CHF) would have a (1.0) bps / +1.1 bps impact on theBIS CET1 ratio Basel III Risk-weighted assets Swiss leverage exposure CHF EUR Other USD USD CET1 capital 4 CHF
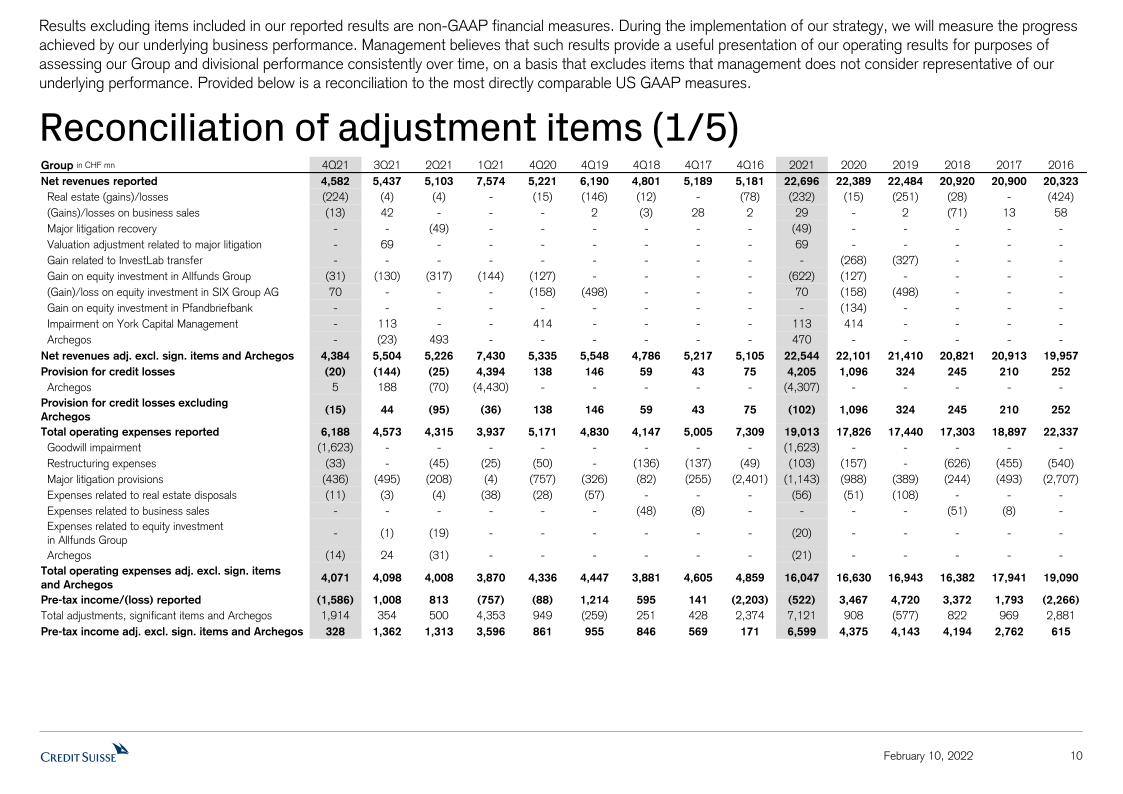
10 Reconciliation of adjustment items (1/5) Results excluding items included in our reported results are non-GAAP financial measures. During the implementation of our strategy, we will measure the progress achieved by our underlying business performance. Management believes that such results provide a useful presentation of our operating results for purposes of assessing our Group and divisional performance consistently over time, on a basis that excludes items that management does not consider representative of our underlying performance. Provided below is a reconciliation to the most directly comparable US GAAP measures. February 10, 2022 Group in CHF mn 4Q21 3Q21 2Q21 1Q21 4Q20 4Q19 4Q18 4Q17 4Q16 2021 2020 2019 2018 2017 2016 Net revenues reported 4,582 5,437 5,103 7,574 5,221 6,190 4,801 5,189 5,181 22,696 22,389 22,484 20,920 20,900 20,323 Real estate (gains)/losses (224) (4) (4) - (15) (146) (12) - (78) (232) (15) (251) (28) - (424) (Gains)/losses on business sales (13) 42 - - - 2 (3) 28 2 29 - 2 (71) 13 58 Major litigation recovery - - (49) - - - - - - (49) - - - - - Valuation adjustment related to major litigation - 69 - - - - - - - 69 - - - - - Gain related to InvestLab transfer - - - - - - - - - - (268) (327) - - - Gain on equity investment in Allfunds Group (31) (130) (317) (144) (127) - - - - (622) (127) - - - - (Gain)/loss on equity investment in SIX Group AG 70 - - - (158) (498) - - - 70 (158) (498) - - - Gain on equity investment in Pfandbriefbank - - - - - - - - - - (134) - - - - Impairment on York Capital Management - 113 - - 414 - - - - 113 414 - - - - Archegos - (23) 493 - - - - - - 470 - - - - - Net revenues adj. excl. sign. items and Archegos 4,384 5,504 5,226 7,430 5,335 5,548 4,786 5,217 5,105 22,544 22,101 ��21,410 20,821 20,913 19,957 Provision for credit losses (20) (144) (25) 4,394 138 146 59 43 75 4,205 1,096 324 245 210 252 Archegos 5 188 (70) (4,430) - - - - - (4,307) - - - - - Provision for credit losses excluding Archegos (15) 44 (95) (36) 138 146 59 43 75 (102) 1,096 324 245 210 252 Total operating expenses reported 6,188 4,573 4,315 3,937 5,171 4,830 4,147 5,005 7,309 19,013 17,826 17,440 17,303 18,897 22,337 Goodwill impairment (1,623) - - - - - - - - (1,623) - - - - - Restructuring expenses (33) - (45) (25) (50) - (136) (137) (49) (103) (157) - (626) (455) (540) Major litigation provisions (436) (495) (208) (4) (757) (326) (82) (255) (2,401) (1,143) (988) (389) (244) (493) (2,707) Expenses related to real estate disposals (11) (3) (4) (38) (28) (57) - - - (56) (51) (108) - - - Expenses related to business sales - - - - - - (48) (8) - - - - (51) (8) - Expenses related to equity investmentin Allfunds Group - (1) (19) - - - - - - (20) - - - - - Archegos (14) 24 (31) - - - - - - (21) - - - - - Total operating expenses adj. excl. sign. itemsand Archegos 4,071 4,098 4,008 3,870 4,336 4,447 3,881 4,605 4,859 16,047 16,630 16,943 16,382 17,941 19,090 Pre-tax income/(loss) reported (1,586) 1,008 813 (757) (88) 1,214 595 141 (2,203) (522) 3,467 4,720 3,372 1,793 (2,266) Total adjustments, significant items and Archegos 1,914 354 500 4,353 949 (259) 251 428 2,374 7,121 908 (577) 822 969 2,881 Pre-tax income adj. excl. sign. items and Archegos 328 1,362 1,313 3,596 861 955 846 569 171 6,599 4,375 4,143 4,194 2,762 615
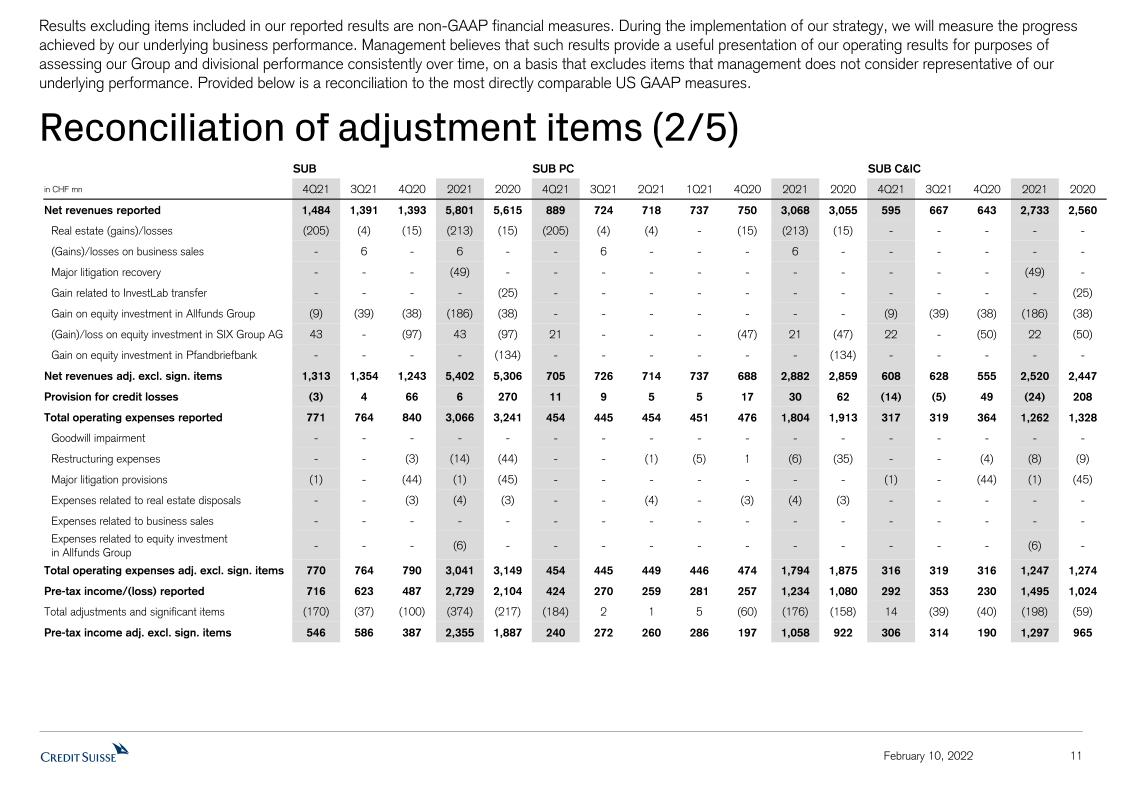
11 Reconciliation of adjustment items (2/5) Results excluding items included in our reported results are non-GAAP financial measures. During the implementation of our strategy, we will measure the progress achieved by our underlying business performance. Management believes that such results provide a useful presentation of our operating results for purposes of assessing our Group and divisional performance consistently over time, on a basis that excludes items that management does not consider representative of our underlying performance. Provided below is a reconciliation to the most directly comparable US GAAP measures. February 10, 2022 SUB SUB PC SUB C&IC in CHF mn 4Q21 3Q21 4Q20 2021 2020 4Q21 3Q21 2Q21 1Q21 4Q20 2021 2020 4Q21 3Q21 4Q20 2021 2020 Net revenues reported 1,484 1,391 1,393 5,801 5,615 889 724 718 737 750 3,068 3,055 595 667 643 2,733 2,560 Real estate (gains)/losses (205) (4) (15) (213) (15) (205) (4) (4) - (15) (213) (15) - - - - - (Gains)/losses on business sales - 6 - 6 - - 6 - - - 6 - - - - - - Major litigation recovery - - - (49) - - - - - - - - - - - (49) - Gain related to InvestLab transfer - - - - (25) - - - - - - - - - - - (25) Gain on equity investment in Allfunds Group (9) (39) (38) (186) (38) - - - - - - - (9) (39) (38) (186) (38) (Gain)/loss on equity investment in SIX Group AG 43 - (97) 43 (97) 21 - - - (47) 21 (47) 22 - (50) 22 (50) Gain on equity investment in Pfandbriefbank - - - - (134) - - - - - - (134) - - - - - Net revenues adj. excl. sign. items 1,313 1,354 1,243 5,402 5,306 705 726 714 737 688 2,882 2,859 608 628 555 2,520 2,447 Provision for credit losses (3) 4 66 6 270 11 9 5 5 17 30 62 (14) (5) 49 (24) 208 Total operating expenses reported 771 764 840 3,066 3,241 454 445 454 451 476 1,804 1,913 317 319 364 1,262 1,328 Goodwill impairment - - - - - - - - - - - - - - - - - Restructuring expenses - - (3) (14) (44) - - (1) (5) 1 (6) (35) - - (4) (8) (9) Major litigation provisions (1) - (44) (1) (45) - - - - - - - (1) - (44) (1) (45) Expenses related to real estate disposals - - (3) (4) (3) - - (4) - (3) (4) (3) - - - - - Expenses related to business sales - - - - - - - - - - - - - - - - - Expenses related to equity investmentin Allfunds Group - - - (6) - - - - - - - - - - - (6) - Total operating expenses adj. excl. sign. items 770 764 790 3,041 3,149 454 445 449 446 474 1,794 1,875 316 319 316 1,247 1,274 Pre-tax income/(loss) reported 716 623 487 2,729 2,104 424 270 259 281 257 1,234 1,080 292 353 230 1,495 1,024 Total adjustments and significant items (170) (37) (100) (374) (217) (184) 2 1 5 (60) (176) (158) 14 (39) (40) (198) (59) Pre-tax income adj. excl. sign. items 546 586 387 2,355 1,887 240 272 260 286 197 1,058 922 306 314 190 1,297 965
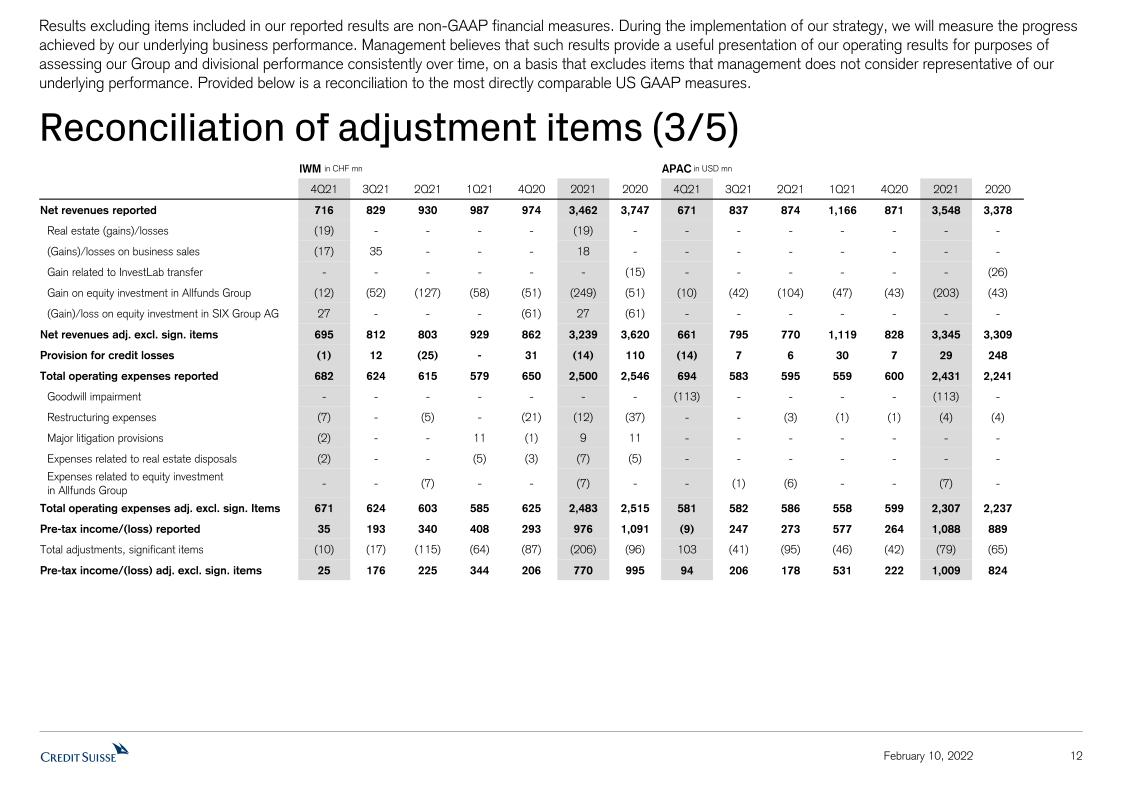
12 Reconciliation of adjustment items (3/5) Results excluding items included in our reported results are non-GAAP financial measures. During the implementation of our strategy, we will measure the progress achieved by our underlying business performance. Management believes that such results provide a useful presentation of our operating results for purposes of assessing our Group and divisional performance consistently over time, on a basis that excludes items that management does not consider representative of our underlying performance. Provided below is a reconciliation to the most directly comparable US GAAP measures. February 10, 2022 IWM in CHF mn APAC in USD mn 4Q21 3Q21 2Q21 1Q21 4Q20 2021 2020 4Q21 3Q21 2Q21 1Q21 4Q20 2021 2020 Net revenues reported 716 829 930 987 974 3,462 3,747 671 837 874 1,166 871 3,548 3,378 Real estate (gains)/losses (19) - - - - (19) - - - - - - - - (Gains)/losses on business sales (17) 35 - - - 18 - - - - - - - - Gain related to InvestLab transfer - - - - - - (15) - - - - - - (26) Gain on equity investment in Allfunds Group (12) (52) (127) (58) (51) (249) (51) (10) (42) (104) (47) (43) (203) (43) (Gain)/loss on equity investment in SIX Group AG 27 - - - (61) 27 (61) - - - - - - - Net revenues adj. excl. sign. items 695 812 803 929 862 3,239 3,620 661 795 770 1,119 828 3,345 3,309 Provision for credit losses (1) 12 (25) - 31 (14) 110 (14) 7 6 30 7 29 248 Total operating expenses reported 682 624 615 579 650 2,500 2,546 694 583 595 559 600 2,431 2,241 Goodwill impairment - - - - - - - (113) - - - - (113) - Restructuring expenses (7) - (5) - (21) (12) (37) - - (3) (1) (1) (4) (4) Major litigation provisions (2) - - 11 (1) 9 11 - - - - - - - Expenses related to real estate disposals (2) - - (5) (3) (7) (5) - - - - - - - Expenses related to equity investmentin Allfunds Group - - (7) - - (7) - - (1) (6) - - (7) - Total operating expenses adj. excl. sign. Items 671 624 603 585 625 2,483 2,515 581 582 586 558 599 2,307 2,237 Pre-tax income/(loss) reported 35 193 340 408 293 976 1,091 (9) 247 273 577 264 1,088 889 Total adjustments, significant items (10) (17) (115) (64) (87) (206) (96) 103 (41) (95) (46) (42) (79) (65) Pre-tax income/(loss) adj. excl. sign. items 25 176 225 344 206 770 995 94 206 178 531 222 1,009 824
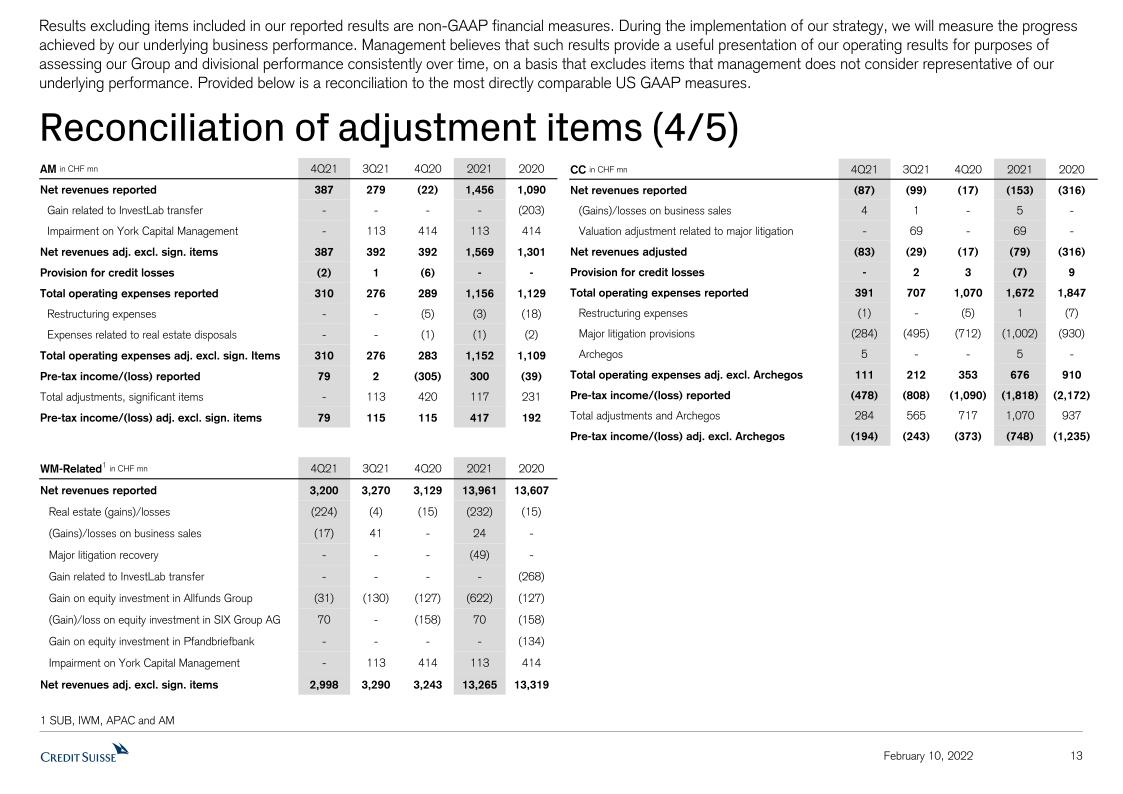
13 Reconciliation of adjustment items (4/5) Results excluding items included in our reported results are non-GAAP financial measures. During the implementation of our strategy, we will measure the progress achieved by our underlying business performance. Management believes that such results provide a useful presentation of our operating results for purposes of assessing our Group and divisional performance consistently over time, on a basis that excludes items that management does not consider representative of our underlying performance. Provided below is a reconciliation to the most directly comparable US GAAP measures. February 10, 2022 AM in CHF mn 4Q21 3Q21 4Q20 2021 2020 Net revenues reported 387 279 (22) 1,456 1,090 Gain related to InvestLab transfer - - - - (203) Impairment on York Capital Management - 113 414 113 414 Net revenues adj. excl. sign. items 387 392 392 1,569 1,301 Provision for credit losses (2) 1 (6) - - Total operating expenses reported 310 276 289 1,156 1,129 Restructuring expenses - - (5) (3) (18) Expenses related to real estate disposals - - (1) (1) (2) Total operating expenses adj. excl. sign. Items 310 276 283 1,152 1,109 Pre-tax income/(loss) reported 79 2 (305) 300 (39) Total adjustments, significant items - 113 420 117 231 Pre-tax income/(loss) adj. excl. sign. items 79 115 115 417 192 CC in CHF mn 4Q21 3Q21 4Q20 2021 2020 Net revenues reported (87) (99) (17) (153) (316) (Gains)/losses on business sales 4 1 - 5 - Valuation adjustment related to major litigation - 69 - 69 - Net revenues adjusted (83) (29) (17) (79) (316) Provision for credit losses - 2 3 (7) 9 Total operating expenses reported 391 707 1,070 1,672 1,847 Restructuring expenses (1) - (5) 1 (7) Major litigation provisions (284) (495) (712) (1,002) (930) Archegos 5 - - 5 - Total operating expenses adj. excl. Archegos 111 212 353 676 910 Pre-tax income/(loss) reported (478) (808) (1,090) (1,818) (2,172) Total adjustments and Archegos 284 565 717 1,070 937 Pre-tax income/(loss) adj. excl. Archegos (194) (243) (373) (748) (1,235) WM-Related1 in CHF mn 4Q21 3Q21 4Q20 2021 2020 Net revenues reported 3,200 3,270 3,129 13,961 13,607 Real estate (gains)/losses (224) (4) (15) (232) (15) (Gains)/losses on business sales (17) 41 - 24 - Major litigation recovery - - - (49) - Gain related to InvestLab transfer - - - - (268) Gain on equity investment in Allfunds Group (31) (130) (127) (622) (127) (Gain)/loss on equity investment in SIX Group AG 70 - (158) 70 (158) Gain on equity investment in Pfandbriefbank - - - - (134) Impairment on York Capital Management - 113 414 113 414 Net revenues adj. excl. sign. items 2,998 3,290 3,243 13,265 13,319 1 SUB, IWM, APAC and AM
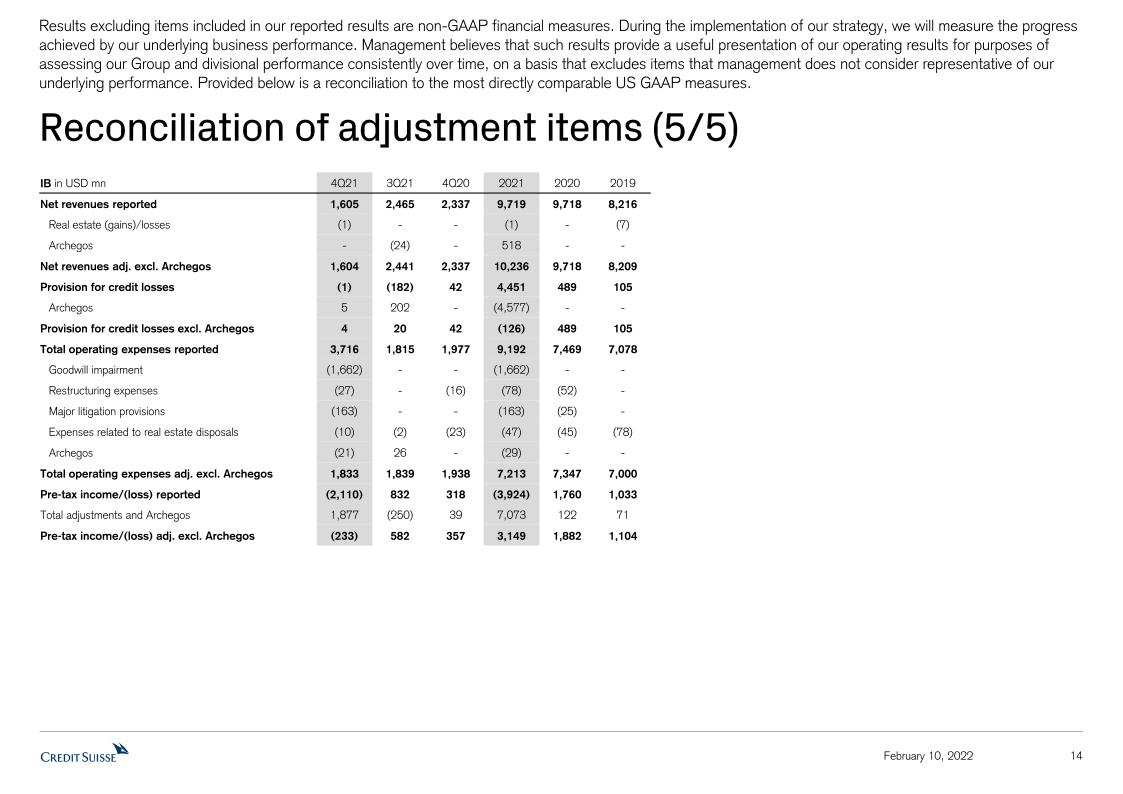
14 Reconciliation of adjustment items (5/5) Results excluding items included in our reported results are non-GAAP financial measures. During the implementation of our strategy, we will measure the progress achieved by our underlying business performance. Management believes that such results provide a useful presentation of our operating results for purposes of assessing our Group and divisional performance consistently over time, on a basis that excludes items that management does not consider representative of our underlying performance. Provided below is a reconciliation to the most directly comparable US GAAP measures. February 10, 2022 IB in USD mn 4Q21 3Q21 4Q20 2021 2020 2019 Net revenues reported 1,605 2,465 2,337 9,719 9,718 8,216 Real estate (gains)/losses (1) - - (1) - (7) Archegos - (24) - 518 - - Net revenues adj. excl. Archegos 1,604 2,441 2,337 10,236 9,718 8,209 Provision for credit losses (1) (182) 42 4,451 489 105 Archegos 5 202 - (4,577) - - Provision for credit losses excl. Archegos 4 20 42 (126) 489 105 Total operating expenses reported 3,716 1,815 1,977 9,192 7,469 7,078 Goodwill impairment (1,662) - - (1,662) - - Restructuring expenses (27) - (16) (78) (52) - Major litigation provisions (163) - - (163) (25) - Expenses related to real estate disposals (10) (2) (23) (47) (45) (78) Archegos (21) 26 - (29) - - Total operating expenses adj. excl. Archegos 1,833 1,839 1,938 7,213 7,347 7,000 Pre-tax income/(loss) reported (2,110) 832 318 (3,924) 1,760 1,033 Total adjustments and Archegos 1,877 (250) 39 7,073 122 71 Pre-tax income/(loss) adj. excl. Archegos (233) 582 357 3,149 1,882 1,104
Notes 15 February 10, 2022 General notesThroughout this presentation and the 4Q21 Results presentation rounding differences may occurUnless otherwise noted, all CET1 capital, CET1 ratio, Tier 1 leverage ratio, risk-weighted assets and leverage exposure figures shown in these presentations are as of the end of the respective period and, for periods prior to 2019, on a “look-through” basisGross and net margins are shown in basis pointsGross margin = net revenues annualized / average AuM; net margin = pre-tax income annualized / average AuM. Net margin excluding certain significant items, as disclosed herein, is calculated excluding those items applying the same methodologyMandates reflect advisory and discretionary mandate volumesMandate penetration reflects advisory and discretionary mandate volumes as a percentage of AuM, excluding those from the external asset manager businessUnless otherwise noted, FX impact is calculated by converting the CHF amount of net revenues, provision for credit losses and operating expenses for 2021 back to the original currency on a monthly basis at the respective spot FX rate. The respective amounts are then converted back to CHF applying the average 2020 FX rate from the period against which the FX impact is measured. Average FX rates apply a straight line average of monthly FX rates for major currenciesParent means Credit Suisse AG. All CET1 capital and CET1 ratio figures shown in these presentations for Parent are Swiss capital metricsWealth Management businesses include SUB PC, IWM and APAC and related figures refer to their combined resultsWealth Management-related businesses include SUB, IWM, APAC and AM and related figures refer to their combined resultsClient Business Volume includes assets under management, custody assets and net loansCustody assets includes assets under custody and commercial assetsSpecific notes† Beginning in 3Q21, the return on regulatory capital calculation has been updated to closer align with the actual capital and leverage ratio levels under which Credit Suisse operates, rather than the previously used minimum requirements set by regulators. Regulatory capital is calculated as the average of 13.5% of RWA and 4.25% of leverage exposure and return on regulatory capital, a non-GAAP financial measure, is calculated using income/(loss) after tax and assumes a tax rate of 30% for periods prior to 2020 and 25% from 2020 onward. Prior periods have been restated. For the Investment Bank, return on regulatory capital is based on US dollar denominated numbers. Return on regulatory capital excluding certain items included in our reported results is calculated using results excluding such items, applying the same methodology.‡ Return on tangible equity, a non-GAAP financial measure, is calculated as annualized net income attributable to shareholders divided by average tangible shareholders’ equity. Tangible shareholders’ equity, a non-GAAP financial measure, is calculated by deducting goodwill and other intangible assets from total shareholders’ equity as presented in our balance sheet. Tangible book value, a non-GAAP financial measure, is equal to tangible shareholders’ equity. Tangible book value per share, a non-GAAP financial measure, is calculated by dividing tangible shareholders' equity by total number of shares outstanding. Management believes that tangible shareholders’ equity/tangible book value, return on tangible equity and tangible book value per share are meaningful as they are measures used and relied upon by industry analysts and investors to assess valuations and capital adequacy.For end-4Q20, tangible shareholders’ equity excluded goodwill of CHF 4,426 mn and other intangible assets of CHF 237 mn from total shareholders’ equity of CHF 42,677 mn as presented in our balance sheet. For end-3Q21, tangible shareholders’ equity excluded goodwill of CHF 4,615 mn and other intangible assets of CHF 234 mn from total shareholders’ equity of CHF 44,498 mn as presented in our balance sheet.For end-4Q21, tangible shareholders’ equity excluded goodwill of CHF 2,917 mn and other intangible assets of CHF 276 mn from total shareholders’ equity of CHF 44,032 mn as presented in our balance sheet.Abbreviationsa.i. = Ad interim; ACL = Allowance for credit losses; Adj. = Adjusted; AM = Asset Management; APAC = Asia Pacific; AuM = Assets under Management; bps = basis points; C&IC = Corporate & Institutional Clients; CC = Corporate Center; CET1 = Common Equity Tier 1; Corp. = Corporate; CSAM = Credit Suisse Asset Management; Ctr. = Center; ECM = Equity Capital Markets; ESG = Environment, Social, Governance; excl. = excluding; FINMA = Swiss Financial Market Supervisory Authority; FX = Foreign Exchange; GAAP = Generally Accepted Accounting Principles; GTS = Global Trading Solutions; HQLA = High Quality Liquid Assets; IB = Investment Bank; IWM = International Wealth Management; LE = Leverage exposure; LTM = Last twelve months; M&A = Mergers & Acquisitions; NAB = Neue Aargauer Bank; NAV = Net asset value; NNA = Net New Assets; PC = Private Clients; PE = Private Equity; pp. = percentage points; prov. = provisions; PTI = Pre-tax income; QoQ = Quarter on Quarter; rev. = revenues; RM = Relationship Manager; RoRC = Return on Regulatory Capital; RWA = Risk-weighted assets; SB = Swiss Bank; SCFF = Supply Chain Finance Funds; sign. = significant; SUB = Swiss Universal Bank; vs. = versus; WM = Wealth Management; YoY = Year on year
February 10, 2022 35
Signatures
Pursuant to the requirements of the Securities Exchange Act of 1934, the registrants have duly caused this report to be signed on their behalf by the undersigned, thereunto duly authorized.
CREDIT SUISSE GROUP AG and CREDIT SUISSE AG
(Registrants)
Date: February 10, 2022
By:
/s/ Thomas Gottstein /s/ David R. Mathers
Thomas Gottstein David R. Mathers
Chief Executive Officer Chief Financial Officer