UNITED STATES
SECURITIES AND EXCHANGE COMMISSION
SECURITIES AND EXCHANGE COMMISSION
Washington, D.C. 20549
Form 6-K
REPORT OF FOREIGN PRIVATE ISSUER PURSUANT TO RULE 13a-16 OR 15d-16 UNDER THE SECURITIES EXCHANGE ACT OF 1934
October 27, 2022
Commission File Number 001-15244
Credit Suisse Group AG
(Translation of registrant’s name into English)
Paradeplatz 8, 8001 Zurich, Switzerland
(Address of principal executive office)
Commission File Number 001-33434
Credit Suisse AG
(Translation of registrant’s name into English)
Paradeplatz 8, 8001 Zurich, Switzerland
(Address of principal executive office)
Indicate by check mark whether the registrant files or will file annual reports under cover of Form 20-F or Form 40-F.
Form 20-F  Form 40-F
Form 40-F Indicate by check mark if the registrant is submitting the Form 6-K in paper as permitted by Regulation S-T Rule 101(b)(1):
Note: Regulation S-T Rule 101(b)(1) only permits the submission in paper of a Form 6-K if submitted solely to provide an attached annual report to security holders.
Indicate by check mark if the registrant is submitting the Form 6-K in paper as permitted by Regulation S-T Rule 101(b)(7):
Note: Regulation S-T Rule 101(b)(7) only permits the submission in paper of a Form 6-K if submitted to furnish a report or other document that the registrant foreign private issuer must furnish and make public under the laws of the jurisdiction in which the registrant is incorporated, domiciled or legally organized (the registrant’s “home country”), or under the rules of the home country exchange on which the registrant’s securities are traded, as long as the report or other document is not a press release, is not required to be and has not been distributed to the registrant’s security holders, and, if discussing a material event, has already been the subject of a Form 6-K submission or other Commission filing on EDGAR.
This report includes the media release and the slides for the presentation to investors in connection with the 3Q22 results.
Media Release Zurich, October 27, 2022 |
Credit Suisse reports net revenues of CHF 3.8 bn and pre-tax loss of CHF 342 mn along with a CET1 ratio of 12.6% in 3Q22
“The third quarter, and more broadly 2022 so far, have been significantly impacted by the continued challenging market and macroeconomic conditions, leading to a weaker performance for our Investment Bank in particular. Our recent Group level performance has been disappointing for our stakeholders. From today, we are taking a series of decisive actions to re-focus Credit Suisse around the needs of our clients and stakeholders. Our new, integrated model will be focused on Wealth Management, the Swiss Bank, as well as Asset Management, and we will radically restructure the Investment Bank, strengthen capital, and accelerate our cost transformation. We believe these actions will lead Credit Suisse to a more stable performance and generate lasting value for our shareholders.” Ulrich Körner, Chief Executive Officer of Credit Suisse Group AG Please refer to the additional media release relating to our Strategy Update published on October 27, 2022, which summarizes the conclusions of our strategic review. |
Credit Suisse Group results for 3Q22 and 9M22
Reported (CHF mn) | 3Q22 | 2Q22 | 3Q21 | Δ2Q22 | Δ3Q21 | 9M22 | 9M21 | Δ9M21 |
| Net revenues | 3,804 | 3,645 | 5,437 | 4% | (30)% | 11,861 | 18,114 | (35)% |
| Provision for credit losses | 21 | 64 | (144) | - | - | (25) | 4,225 | - |
| Total operating expenses | 4,125 | 4,754 | 4,573 | (13)% | (10)% | 13,829 | 12,825 | 8% |
| Pre-tax income/(loss) | (342) | (1,173) | 1,008 | - | - | (1,943) | 1,064 | - |
| Income tax expense/(benefit) | 3,698 | 419 | 570 | - | - | 3,966 | 610 | - |
| Net income/(loss) attributable to shareholders | (4,034) | (1,593) | 434 | - | - | (5,900) | 435 | - |
| Return on tangible equity | (38.3)% | (15.0)% | 4.5% | - | - | (18.7)% | 1.5% | - |
| Cost/income ratio | 108% | 130% | 84% | - | - | 117% | 71% | - |
Net New Assets (NNA)/(net asset outflows) in CHF bn | (12.9) | (7.7) | 5.6 | - | - | (12.7) | 29.3 | - |
| Assets under Management (AuM) in CHF bn | 1,401 | 1,454 | 1,623 | - | - | 1,401 | 1,623 | - |
Adjusted* (CHF mn) | 3Q22 | 2Q22 | 3Q21 | Δ2Q22 | Δ3Q21 | 9M22 | 9M21 | Δ9M21 |
| Net revenues | 3,798 | 3,820 | 5,504 | (1)% | (31)% | 12,200 | 18,160 | (33)% |
| Provision for credit losses | 21 | 64 | 44 | - | - | 130 | (87) | - |
| Total operating expenses | 3,869 | 4,198 | 4,098 | (8)% | (6)% | 12,304 | 11,976 | 3% |
| Pre-tax income/(loss) | (92) | (442) | 1,362 | - | - | (234) | 6,271 | - |
| Capital ratios | 3Q22 | 2Q22 | 3Q21 | Δ2Q22 | Δ3Q21 | 9M22 | 9M21 | Δ9M21 |
| CET1 ratio | 12.6% | 13.5% | 14.4% | - | - | 12.6% | 14.4% | - |
| Tier 1 leverage ratio | 6.0% | 6.1% | 6.0% | - | - | 6.0% | 6.0% | - |
| CET1 leverage ratio | 4.1% | 4.3% | 4.3% | - | - | 4.1% | 4.3% | - |
Page 1
Media Release Zurich, October 27, 2022 |
Summary of 3Q22 performance
Credit Suisse’s performance in the third quarter of 2022 continued to be challenged by the current economic and market environment. The combination of the geopolitical situation as well as the significant monetary tightening by major central banks worldwide in response to the continued and significant increase in inflation have resulted in continued heightened market volatility, weak customer flows and ongoing client deleveraging.
The performance in the Investment Bank (IB) was weak, impacted by extremely challenging market conditions driven by higher volatility, widened credit spreads and muted primary issuance. As a result, our areas of core strength across trading as well as Investment Banking & Capital Markets were affected by the significant slowdown in capital markets activity and the cumulative impact of our de-risking. Our performance in Wealth Management (WM) was challenged due to lower client activity, AuM and recurring revenues. However, WM benefited from the improved rates environment leading to higher net interest income. Swiss Bank’s (SB) performance was resilient notwithstanding the adverse impact of the recent change in interest rates by the Swiss National Bank (SNB). Asset Management’s (AM) performance year on year was adversely impacted by continued market uncertainty.
The Corporate Center’s performance in 3Q22 improved year on year with adjusted* net revenues up due to improved revenue performance in Treasury as well as lower legacy expenses in the Asset Resolution Unit. Adjusted* operating expenses were also down 62% year on year leading to a smaller adjusted* pre-tax loss for 3Q22 of CHF 41 mn, compared to CHF 212 mn in 3Q21.
In 3Q22, we saw net revenues decrease by 30% year on year, driven by a decline in IB net revenues, down 58%, on a USD basis; a decline in WM net revenues, down 18%; as well as a decline in SB net revenues, down 9%. We had a net revenue increase in AM, up 15% year on year. We had adjusted* net revenues of CHF 3.8 bn, down 31% year on year, driven by lower Equity Capital Markets and Leveraged Finance activity, as well as mark-to-market losses of USD 120 mn, in the IB and subdued client activity in WM.
Reported operating expenses of CHF 4.1 bn were down 10% year on year and included major litigation provisions of CHF 178 mn1. Our adjusted* operating expenses of CHF 3.9 bn were down 6%, driven by lower compensation and benefits, down CHF 398 mn and reflecting the revenue decline, partly offset by an impairment of CHF 145 mn relating to IT-related assets in WM.
We reported a pre-tax loss of CHF 342 mn compared to pre-tax income of CHF 1.0 bn in 3Q21; this included CHF 178 mn of major litigation provisions, primarily relating to legacy cases. We continue to take a proactive approach to reducing our litigation docket, including through the settlements of legacy cases, such as the French cross border matter and the New Jersey Attorney General RMBS case, for which we were fully provisioned. Our adjusted* pre-tax loss for 3Q22 was CHF 92 mn, down compared to adjusted* pre-tax income of CHF 1.4 bn in 3Q21.
We reported a net loss attributable to shareholders of CHF 4.0 bn, compared to net income attributable to shareholders of CHF 434 mn in 3Q21. Our reported net loss attributable to shareholders included an impairment of deferred tax assets related to our strategic review of CHF 3.7 bn.
The challenging market conditions in 3Q22 were the main driver of the decline in Group AuM which stood at CHF 1.4 trn, down CHF 53 bn from CHF 1.45 trn at the end of 2Q22. This included Group net asset outflows of CHF 12.9 bn in 3Q22, compared to NNA of CHF 5.6 bn in 3Q21.
Our CET1 capital ratio was 12.6% as of the end of 3Q22, down 90 basis points quarter on quarter, mainly driven by the impact of the impairment of deferred tax assets related to our strategic review, as well as by risk-weighted assets inflation and the Group pre-tax loss. Today, Credit Suisse Group AG announced its intention to raise capital with gross proceeds of CHF ~4.0 bn, subject to approval at a forthcoming Extraordinary General Meeting on November 23, 2022, which should support an increase in the 3Q22 CET1 ratio from 12.6% to a pro-forma CET1 ratio of ~14.0%. Our Tier 1 leverage ratio and our CET1 leverage ratio remained broadly flat at 6.0% and 4.1%, respectively, as of the end of 3Q22. Our Liquidity Coverage Ratio (LCR) in 3Q22 was 192%2, this compares to an LCR of 191% in 2Q22.
Summary of 9M22 performance
For the first nine months of 2022 we saw net revenues decrease by 35% year on year, driven by a decline in IB net revenues, down 51%, on a USD basis, and a decline in WM net revenues, down 33%. We also saw a decline in AM net revenues, down 9% year on year, whereas net revenues in SB were flat year on year. Our reported net revenues of CHF 11.9 bn included real estate gains of CHF 177 mn and a valuation loss of CHF 511 mn related to our equity investment in Allfunds Group. We had adjusted* net revenues of CHF 12.2 bn, down 33% year on year. The bank’s performance was impacted by the ongoing macro-economic and geopolitical challenges and market headwinds, particularly impacting the performance of the IB.
We had reported operating expenses of CHF 13.8 bn, up 8% year on year, which included major litigation provisions of CHF 1.3 bn and restructuring expenses CHF 181 mn. Our adjusted* operating expenses were CHF 12.3 bn, up 3%, driven by increased incremental investment spending, as well as increased remediation spending in Risk, Compliance and Infrastructure.
We reported a pre-tax loss of CHF 1.9 bn for 9M22, compared to a pre-tax income of CHF 1.1 bn for the same period in 2021. Our adjusted* pre-tax loss for the first nine months of 2022 was CHF 234 mn, which compares to an exceptionally strong adjusted* pre-tax income of CHF 6.3 bn for the same period in 2021.
Our Group net asset outflows for 9M22 were CHF 12.7 bn, compared to NNA of CHF 29.3 bn for the same period in 2021.
Page 2
Media Release Zurich, October 27, 2022 |
Net revenues for 3Q22 and 3Q21 by division3
| Wealth Management | 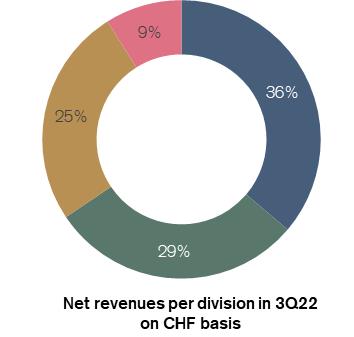 | Wealth Management | 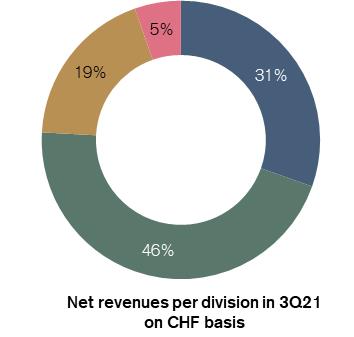 | |||
| Investment Bank | Investment Bank | |||||
| Swiss Bank | Swiss Bank | |||||
| Asset Management | Asset Management | |||||
| Outlook |
Our financial results for 9M22 have been significantly affected by the challenging economic and market environment, the combination of monetary tightening by major central banks and the ongoing geopolitical situation following Russia’s invasion of Ukraine, resulting in heightened volatility and client risk aversion. The Swiss Bank continues to deliver a resilient performance, notwithstanding the impact from the SNB’s decision to increase rates, and Wealth Management benefited from higher rates. However, the current market environment has had an adverse impact on client activity across our divisions. In particular, the Investment Bank has been notably impacted by the substantial industry-wide slowdown in capital markets and the challenging market backdrop. We would expect these market conditions to continue in the coming months. In the Investment Bank, although our pipeline remains robust, market conditions may delay deal completions. Client activity remains subdued in our Sales & Trading businesses, exacerbating normal seasonal declines. We would expect this division to report a loss in the fourth quarter. Likewise, client activity remains subdued in Wealth Management and recurring revenues are expected to continue to reflect lower assets under management. Moreover, during the first two weeks of October 2022, following negative press and social media coverage based on incorrect rumors, Credit Suisse experienced a significant level of deposit and assets under management outflows. While these outflows have stabilized since this period, they have not yet reversed. We have plans to address these matters through, among other things, accessing capital markets after October 27 and executing the strategic initiatives we announce today. We would note that the execution of these measures is also expected to generate liquidity and reduce the funding requirements of the Group. Our 3Q22 CET1 ratio of 12.6% included an adverse impact of 48 basis points in respect of the impairment of deferred tax assets from our strategic review. The measures we announced today, including our intention to raise capital with gross proceeds of CHF ~4.0 bn, subject to approval at a forthcoming Extraordinary General Meeting on November 23, 2022, should support an increase in the 3Q22 CET1 ratio from 12.6% to a pro-forma CET1 ratio of ~14.0%. In addition, the successful execution of our Securitized Products exposure reduction and other planned divestments as well as RWA and leverage reductions from the new Non-Core Unit is expected to release further significant amounts of capital to support the execution of our strategic transformation. Accordingly, we expect to maintain a pre-Basel III reform CET1 ratio of at least 13.0% throughout 2023-2025 with an expected 2025 pre-Basel III reform CET1 ratio in excess of 13.5%. In 4Q22, we expect to record a CHF ~75 mn loss related to the full disposal of our shareholding in Allfunds Group plc, the impact of which should be more than offset by the related capital release, as part of the simplification of Credit Suisse. Additionally, we would expect to incur restructuring charges, software and real estate impairments of CHF ~250 mn in 4Q22 as part of the cost of the strategic transformation. Together with the adverse revenue impact from the exit from our non-core businesses and exposures, we would expect a net loss for the Group in 4Q22. |
Page 3
Media Release Zurich, October 27, 2022 |
Divisional summaries
| Wealth Management (WM) | ||
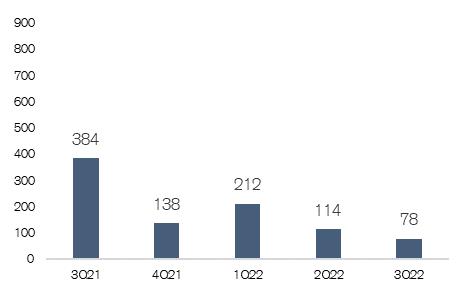 Adjusted* pre-tax income QoQ in CHF million | 3Q22 On an adjusted* basis, WM had a pre-tax income of CHF 78 mn, down 80% year on year, due to reduced transaction revenues, lower volumes impacting revenues and higher costs. Adjusted* pre-tax income was adversely impacted by an impairment of IT-related assets of CHF 145 mn, following a review of WM’s technology and platform strategy, and mark-to-market losses in APAC Financing Group of CHF 35 mn in 3Q22. The reported pre-tax income for the quarter of CHF 21 mn, included major litigation provisions of CHF 54 mn. WM had reported net revenues of CHF 1.4 bn, down 18% year on year. Adjusted* net revenues of CHF 1.4 bn were down 14% primarily reflecting lower transaction- and performance-based revenues and lower recurring commissions and fees. Transaction- and performance-based revenues were down 40% year on year, mainly in Asia Pacific (APAC), coupled with lower revenues from Global Trading Solutions and mark-to-market losses in APAC Financing Group. Recurring commissions and fees were down 18%, mainly reflecting lower average AuM and lower service-driven fees. These were slightly offset by significantly higher net interest income, up 20%, due to higher deposit revenues, reflecting higher interest rates, especially in USD. WM had higher adjusted* operating expenses, up 9%, mainly due to the impairment relating to IT-related assets, following a review of WM’s technology and platform strategy in 3Q22, partly offset by lower compensation and benefits. WM had net asset outflows of CHF 6.4 bn in 3Q22 mainly driven by client deleveraging and proactive de-risking. WM recorded AuM of CHF 635 bn, compared to CHF 761 bn in 3Q21 and CHF 662 bn in 2Q22, mainly reflecting unfavorable markets movements during the quarter. |
Page 4
Media Release Zurich, October 27, 2022 |
| Investment Bank (IB) | ||
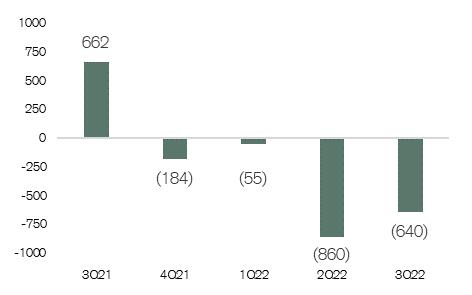 Adjusted* pre-tax income/loss QoQ in USD million | 3Q22 On an adjusted* basis, the IB posted a significant pre-tax loss of USD 640 mn, down from a pre-tax income of USD 662 mn in 3Q21, reflecting extremely challenging market conditions, particularly in our capital markets business, and the adverse impact of reduced capital usage as well as reduced risk appetite across businesses. The reported pre-tax loss was USD 691 mn. The division’s reported net revenues were USD 1.1 bn for 3Q22, down 58% year on year, in part due to a strong comparable in 3Q21; on an adjusted* basis, net revenues were down 58% year on year. Total reported operating expenses were down 9%, while adjusted* operating expenses were down 12% year on year, primarily due to lower compensation and benefits. Capital Markets revenues decreased 90% year on year, impacted by substantially lower ECM and Leveraged Finance market activity and included mark-to-market losses in Leveraged Finance of USD 120 mn. Excluding the mark-to-market losses, Capital Markets revenues declined 78% year on year in line with a reduction in Street fees4. Advisory revenues were also down 39% year on year, in line with reduced industry-wide deal closings. Revenues in our Fixed Income Sales & Trading business were down 32%, reflecting a decline in Securitized Products and Global Credit Products compared to a strong 3Q21 performance, partly offset by higher Macro revenues given increased volatility. On an adjusted* basis, Equity Sales & Trading revenues declined by 55%5 resulting from lower Equity Derivatives and Cash trading compared to a strong 3Q21 and reflecting the exit of Prime Services6. For 3Q22, we significantly reduced capital usage in the IB. Risk-weighted assets were down 10% year on year at USD 84 bn and Leverage Exposure was down 20% year on year, at USD 324 bn, reflecting reduced business activity. |
Page 5
Media Release Zurich, October 27, 2022 |
| Swiss Bank (SB) | ||
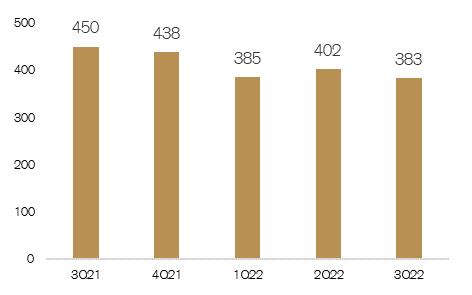 Adjusted* pre-tax income QoQ in CHF million | 3Q22 On an adjusted* basis, SB had a pre-tax income of CHF 383 mn, down 15% year on year, driven by a decline in net revenues with continued low provision for credit losses, partially offset by lower operating expenses, down 7%, driven by lower compensation and benefits. SB’s adjusted* cost to income ratio was 58%. SB’s reported net revenues were CHF 962 mn, down 9% year on year; adjusted* net revenues were also down 9%. Net interest income decreased by 11% year on year mainly driven by lower SNB threshold benefits from the recent SNB increase of interest rates, partially offset by higher deposit income. Recurring commissions and fees were down 3% due to lower AuM levels, partly offset by higher fees from lending activities. Transaction-based revenues were down 17%, mainly driven by a gain related to IBOR transition7 in 3Q21 and gains on equity investments8; excluding these items, transaction-based revenues were down 4%. SB had net asset outflows of CHF 1.5 bn with outflows of CHF 1.7 bn from private clients, partially offset by inflows of CHF 0.2 bn from institutional clients. The division’s AuM as of the end of 3Q22 were CHF 527 bn, down from CHF 589 bn at the end of 3Q21 and CHF 545 bn at the end of 2Q22, primarily due to declining markets. |
Page 6
Media Release Zurich, October 27, 2022 |
| Asset Management (AM) | ||
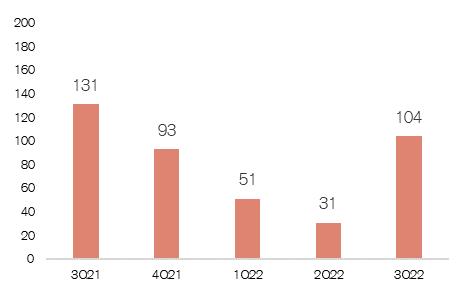 Adjusted* pre-tax income QoQ in CHF million | 3Q22 On adjusted* basis, AM had a pre-tax income of CHF 104 mn for 3Q22, down 21% year on year, driven by lower net revenue, down 15%. The lower adjusted* pre-tax income mainly reflects declining market levels. Adjusted* operating expenses were down 11% primarily due to reduced professional services fees related to the wind down and administration of the Supply Chain Finance Funds (SCFF) and lower compensation and benefits. AM’s reported net revenues were up 15% year on year at CHF 336 mn. The increase in net revenues was mainly due to significantly higher Investment and Partnership income due to an impairment loss of CHF 113 mn related to our non-controlling interest in York Capital Management in 3Q21. These net revenue increases were offset by lower performance, transaction and placement revenues, down 56% year on year, reflecting lower placement fees and investment related losses. Net revenues also reflected reduced management fees, down 13%, due to a combination of lower average AuM and increased investor bias towards passive products. AM had net asset outflows of CHF 4.2 bn for the quarter across traditional investments and alternative investments, partly offset by inflows from investments and partnerships. AM had AuM of CHF 411 bn at the end of 3Q22, down 13% year on year or CHF 63 bn, of which CHF 57 bn was due to market and FX-related movements. |
Page 7
Media Release Zurich, October 27, 2022 |
Progress on our sustainability ambitions and strategy
Credit Suisse continued to focus on its sustainability strategy, driving activity across divisions and functions in 3Q22. The bank continues to emphasize the importance of sustainability as a core element of its value proposition for its clients, shareholders, employees and society.
Summary of recent sustainability-related activity:
| • | 3Q22 Sustainable AuM of CHF 129 bn9, compared to CHF 144 bn in 3Q21, resulting in a penetration of 9.2% of total AuM as of September 30, 2022 |
| • | Number of Wealth Management ESG funds10 at 167 as of the end of 3Q22 compared to 147 at the end of 3Q21 |
| • | Hosted the 2nd annual Credit Suisse Sustainability Week in October 2022, clients and colleagues alike were invited to participate in virtual programs that brought together leading voices that explore how the global finance community can work together to create investment opportunities and mitigate the challenges faced by our planet and society |
| • | Published the Credit Suisse ‘Biodiversity: Concepts, themes and challenges’ report in October 2022, which examines the developments and challenges associated with biodiversity |
| • | Published the 2022 Credit Suisse Youth Barometer in September 2022, surveying young people globally about the most important economic and societal issues from their perspectives |
Page 8
Media Release Zurich, October 27, 2022 |
Contact details
Kinner Lakhani, Investor Relations, Credit Suisse
Tel: +41 44 333 71 49
Email: investor.relations@credit-suisse.com
Dominik von Arx, Corporate Communications, Credit Suisse
Tel: +41 844 33 88 44
Email: media.relations@credit-suisse.com
The Earnings Release and Presentation for 3Q22 are available to download from 06:45 CEST today at:
www.credit-suisse.com/results
Presentation of 3Q22 results and 2022 Strategy Update
Thursday, October 27, 2022
| Event | 3Q22 Analyst and Investor Call | 2022 Strategy Update call | Media Call |
| Time | 08:00 CEST (Zurich) 07:00 BST (London) 02:00 EDT (New York) | 10:30 CEST (Zurich) 09:30 BST (London) 04:30 EDT (New York) | 14:30 CEST (Zurich) 13:30 BST (London) 08:30 EDT (New York) |
| Language | English | English | English |
| Access | Switzerland: +41 58 310 51 26 Europe: +44 121 281 80 12 US: +1 631 232 79 97 Reference: Credit Suisse Analysts and Investors Call Conference ID: 20220533 Please dial in 10 minutes before the start of the call. When dialing in please enter the Passcode/Conference ID and leave your first, last name and company name after the tone. You will be joined automatically to the conference. Webcast link here. | Switzerland: +41 58 310 51 26 Europe: +44 121 281 80 12 US: +1 631 232 79 97 Reference: Credit Suisse 2022 Strategy Update Conference ID: 20220564 Please dial in 10 minutes before the start of the call. When dialing in please enter the Passcode/Conference ID and leave your first, last name and company name after the tone. You will be joined automatically to the conference. Webcast link here. | Switzerland: +41 (0) 583105126 UK: +44 (0) 1212818012 US: +1 (1) 6312327997 Reference: Credit Suisse Media Call Conference ID: 20220534 Please dial in 10 minutes before the start of the call. When dialing in please enter the Passcode/Conference ID and leave your first, last name and company name after the tone. You will be joined automatically to the conference. Webcast link here. |
| Q&A Session | Following the presentation, you will have the opportunity to ask the speakers questions if you are an analyst or investor | Following the presentation, you will have the opportunity to ask the speakers questions if you are an analyst or investor | Following the presentation, you will have the opportunity to ask the speakers questions |
| Playback | Replay available at the webcast link. | Replay available at the webcast link. | Replay available at the webcast link. |
Page 9
Media Release Zurich, October 27, 2022 |
Abbreviations
AM – Asset Management; APAC – Asia Pacific; AuM – assets under management; bn – billion; CET1 – common equity tier 1; CHF – Swiss francs; ECM – Equity Capital Markets; ESG – Environmental, Social and Governance; FINMA – Swiss Financial Market Supervisory Authority FINMA; FX – Foreign Exchange; GAAP – Generally accepted accounting principles; IB – Investment Bank; IBOR – interbank offered rates; IT – Information Technology; LCR – Liquidity Coverage Ratio; mn – million; M&A – Mergers & Acquisitions; NNA – net new assets; QoQ – Quarter on Quarter; RMBS – Residential Mortgage-Backed Security; RWA – risk-weighted assets; SB – Swiss Bank; SNB – Swiss National Bank; SCFF – Supply Chain Finance Funds; SEC – US Securities and Exchange Commission; trn – trillion; UK – United Kingdom; US – United States; USD – US dollar; WM – Wealth Management
Share Capital Increase
This document is not an offer to sell securities or the solicitation of any offer to buy securities, nor shall there be any offer of securities, in any jurisdiction in which such offer or sale would be unlawful.
This document does not constitute an offer or invitation to subscribe for or to purchase any securities in the United States of America. The securities referred to herein have not been and will not be registered under the US Securities Act of 1933, as amended (the “Securities Act”) or the laws of any US state and may not be offered or sold in the United States of America absent registration or an exemption from registration under the Securities Act. There will be no public offering of the securities in the United States of America.
Important information
This document contains select information from the full 3Q22 Earnings Release and 3Q22 Results Presentation slides that Credit Suisse believes is of particular interest to media professionals. The complete 3Q22 Earnings Release and 3Q22 Results Presentation slides, which have been distributed simultaneously, contain more comprehensive information about our results and operations for the reporting quarter, as well as important information about our reporting methodology and some of the terms used in these documents. The complete 3Q22 Earnings Release and 3Q22 Results Presentation slides are not incorporated by reference into this document.
Credit Suisse has not finalized its 3Q22 Financial Report and Credit Suisse’s independent registered public accounting firm has not completed its review of the condensed consolidated financial statements (unaudited) for the period. Accordingly, the financial information contained in this document is subject to completion of quarter-end procedures, which may result in changes to that information. In particular, the information contained herein relating to the anticipated accounting and capital impacts on certain deferred tax asset positions, Credit Suisse AG (Bank parent company) participation(s) valuations and other potential matters, continue to be analyzed in light of the changes to the Group’s strategic plans announced on October 27, 2022, making these and other closely-related metrics more susceptible to change as we complete our quarter-end procedures.
We may not achieve all of the expected benefits of our strategic initiatives, such as in relation to intended reshaping of the bank, cost reductions and strengthening and reallocating capital. Factors beyond our control, including but not limited to the market and economic conditions (including macroeconomic and other challenges and uncertainties, for example, resulting from Russia’s invasion of Ukraine), customer reaction to our proposed initiatives, enhanced risks to our businesses during the contemplated transitions, changes in laws, rules or regulations and other challenges discussed in our public filings, could limit our ability to achieve some or all of the expected benefits of these initiatives. Our ability to implement our strategy objectives could also be impacted by timing risks, obtaining all required approvals and other factors.
In particular, the terms “Estimate”, “Illustrative”, “Ambition”, “Objective”, “Outlook”, “Goal”, “Commitment” and “Aspiration” are not intended to be viewed as targets or projections, nor are they considered to be Key Performance Indicators. All such estimates, illustrations, ambitions, objectives, outlooks, goals, commitments and aspirations, as well as any other forward-looking statements described as targets or projections, are subject to a large number of inherent risks, assumptions and uncertainties, many of which are completely outside of our control. These risks, assumptions and uncertainties include, but are not limited to, general market conditions, market volatility, increased inflation, interest rate volatility and levels, global and regional economic conditions, challenges and uncertainties resulting from Russia’s invasion of Ukraine, political uncertainty, changes in tax policies, scientific or technological developments, evolving sustainability strategies, changes in the nature or scope of our operations, including as a result of our recently announced strategy initiatives, changes in carbon markets, regulatory changes, changes in levels of client activity as a result of any of the foregoing and other factors. Accordingly, these statements, which speak only as of the date made, are not guarantees of future performance and should not be relied on for any purpose. We do not intend to update these estimates, illustrations, ambitions, objectives, outlooks, goals, commitments, aspirations, targets, projections or any other forward-looking statements. For these reasons, we caution you not to place undue reliance upon any forward-looking statements.
In preparing this document, management has made estimates and assumptions that affect the numbers presented. Actual results may differ. Annualized numbers do not take into account variations in operating results, seasonality and other factors and may not be indicative of actual, full-year results. Figures throughout this document may also be subject to rounding adjustments. All opinions and views constitute good faith judgments as of the date of writing without regard to the date on which the reader may receive or access the information. This information is subject to change at any time without notice and we do not intend to update this information.
Return on tangible equity, a non-GAAP financial measure, is calculated as annualized net income attributable to shareholders divided by average tangible shareholders’ equity. Tangible shareholders’ equity, a non-GAAP financial measure, is calculated by deducting goodwill and other intangible assets from total shareholders’ equity as presented in our balance sheet. Management believes that return on tangible equity is meaningful as it is a measure used and relied upon by industry analysts and investors to assess valuations and capital adequacy. Adjusted return on tangible equity excluding certain items included in our reported results is calculated using results excluding such items, applying the same methodology. For end-3Q22, tangible shareholders’ equity excluded goodwill of CHF 3,018 million and other intangible assets of CHF 424 million from total shareholders’ equity of CHF 43,267 million as presented in our balance sheet. For end 2Q22, tangible shareholders’ equity excluded goodwill of CHF 2,974 million and other intangible assets of CHF 340 million from total shareholders’ equity of CHF 45,842 million as presented in our balance sheet. For end-3Q21, tangible shareholders’ equity excluded goodwill of CHF 4,615 million and other intangible assets of CHF 234 million from total shareholders’ equity of CHF 44,498 million as presented in our balance sheet.
Credit Suisse is subject to the Basel framework, as implemented in Switzerland, as well as Swiss legislation and regulations for systemically important banks, which include capital, liquidity, leverage and large exposure requirements and rules for emergency plans designed to maintain systemically relevant functions in the event of threatened insolvency. Credit Suisse has adopted the Bank for International Settlements (BIS) leverage ratio framework, as issued by the Basel Committee on Banking Supervision (BCBS) and implemented in Switzerland by the Swiss Financial Market Supervisory Authority FINMA (FINMA).
Unless otherwise noted, all CET1 ratio, CET1 leverage ratio, Tier-1 leverage ratio, risk-weighted assets and leverage exposure figures in this document are as of the end of the respective period.
Unless otherwise noted, leverage exposure is based on the BIS leverage ratio framework and consists of period-end balance sheet assets and prescribed regulatory adjustments. The tier 1 leverage ratio and CET1 leverage ratio are calculated as BIS tier 1 capital and CET1 capital, respectively, divided by period end leverage exposure.
Investors and others should note that we announce important company information (including quarterly earnings releases and financial reports as well as our annual sustainability report) to the investing public using press releases, SEC and Swiss ad hoc filings, our website and public conference calls and webcasts. We also routinely use our Twitter account @creditsuisse (https://twitter.com/creditsuisse), our LinkedIn account (https://www.linkedin.com/company/credit-suisse/), our Instagram accounts (https://www.instagram.com/creditsuisse_careers/ and https://www.instagram.com/creditsuisse_ch/), our Facebook account (https://www.facebook.com/creditsuisse/) and other social media channels as additional means to disclose public information, including to excerpt key messages from our public disclosures. We may share or retweet such messages through certain of our regional accounts, including through Twitter at @csschweiz (https://twitter.com/csschweiz) and @csapac (https://twitter.com/csapac). Investors and others should take care to consider
Page 10
Media Release Zurich, October 27, 2022 |
such abbreviated messages in the context of the disclosures from which they are excerpted. The information we post on these social media accounts is not a part of this document.
Information referenced in this document, whether via website links or otherwise, is not incorporated into this document.
Certain material in this document has been prepared by Credit Suisse on the basis of publicly available information, internally developed data and other third-party sources believed to be reliable. Credit Suisse has not sought to independently verify information obtained from public and third-party sources and makes no representations or warranties as to accuracy, completeness, reasonableness or reliability of such information.
In various tables, use of “–” indicates not meaningful or not applicable.
The English language version of this document is the controlling version.
*Refers to results excluding certain items included in our reported results. These are non-GAAP financial measures. For a reconciliation to the most directly comparable US GAAP measures, see the Appendix of this Media Release.
1 Net litigation provisions in 3Q22 of CHF 245 mn
2 Calculated using a three-month average, which is calculated on a daily basis
3 Excludes Corporate Center net revenues of 1% in 3Q22 and (1)% in 3Q21
4 Source: Dealogic (Global) as of September 30, 2022
5 Excludes Archegos gains of USD 24 mn from Equity Sales & Trading revenues in 3Q21
6 With the exception of Index Access and APAC Delta One
7 Gain related to IBOR transition in 3Q21 of CHF 16 mn
8 Gains on equity investments of CHF 1 mn in 3Q22 and CHF 5 mn in 3Q21
9 Refers to Credit Suisse’s assets managed according to the Credit Suisse Sustainable Investment Framework (Sustainable AuM). This includes only AuM balances from managed solutions that to date have been mapped to a sustainability rating of 2 and higher, based on the Framework scale (0-5). The movement vs. 3Q21 reflects a combination of adverse market and FX movements, partially offset by onboarding of new sustainable funds
10 Includes funds of our Wealth Management Lead Offering that as of September 30, 2022 have been mapped to a sustainability rating of 2 and higher, based on our internal Sustainable Investment Framework scale (0-5)
Page 11
| Appendix |
| Key metrics | |||||||||||||||||
| in / end of | % change | in / end of | % change | ||||||||||||||
| 3Q22 | 2Q22 | 3Q21 | QoQ | YoY | 9M22 | 9M21 | YoY | ||||||||||
| Credit Suisse Group results (CHF million) | |||||||||||||||||
| Net revenues | 3,804 | 3,645 | 5,437 | 4 | (30) | 11,861 | 18,114 | (35) | |||||||||
| Provision for credit losses | 21 | 64 | (144) | (67) | – | (25) | 4,225 | – | |||||||||
| Compensation and benefits | 1,901 | 2,392 | 2,255 | (21) | (16) | 6,751 | 6,818 | (1) | |||||||||
| General and administrative expenses | 1,919 | 2,005 | 2,012 | (4) | (5) | 6,072 | 4,977 | 22 | |||||||||
| Commission expenses | 250 | 254 | 306 | (2) | (18) | 802 | 960 | (16) | |||||||||
| Goodwill impairment | 0 | 23 | 0 | (100) | – | 23 | 0 | – | |||||||||
| Restructuring expenses | 55 | 80 | – | (31) | – | 181 | 70 | 159 | |||||||||
| Total other operating expenses | 2,224 | 2,362 | 2,318 | (6) | (4) | 7,078 | 6,007 | 18 | |||||||||
| Total operating expenses | 4,125 | 4,754 | 4,573 | (13) | (10) | 13,829 | 12,825 | 8 | |||||||||
| Income/(loss) before taxes | (342) | (1,173) | 1,008 | (71) | – | (1,943) | 1,064 | – | |||||||||
| Income tax expense | 3,698 | 419 | 570 | – | – | 3,966 | 610 | – | |||||||||
| Net income/(loss) attributable to shareholders | (4,034) | (1,593) | 434 | 153 | – | (5,900) | 435 | – | |||||||||
| Balance sheet statistics (CHF million) | |||||||||||||||||
| Total assets | 700,358 | 727,365 | 820,233 | (4) | (15) | 700,358 | 820,233 | (15) | |||||||||
| Risk-weighted assets | 273,598 | 274,442 | 278,139 | 0 | (2) | 273,598 | 278,139 | (2) | |||||||||
| Leverage exposure | 836,881 | 862,737 | 937,419 | (3) | (11) | 836,881 | 937,419 | (11) | |||||||||
| Assets under management and net new assets (CHF billion) | |||||||||||||||||
| Assets under management | 1,400.6 | 1,453.9 | 1,623.0 | (3.7) | (13.7) | 1,400.6 | 1,623.0 | (13.7) | |||||||||
| Net new assets/(net asset outflows) | (12.9) | (7.7) | 5.6 | 67.5 | – | (12.7) | 29.3 | – | |||||||||
| Basel III regulatory capital and leverage statistics (%) | |||||||||||||||||
| CET1 ratio | 12.6 | 13.5 | 14.4 | – | – | 12.6 | 14.4 | – | |||||||||
| CET1 leverage ratio | 4.1 | 4.3 | 4.3 | – | – | 4.1 | 4.3 | – | |||||||||
| Tier 1 leverage ratio | 6.0 | 6.1 | 6.0 | – | – | 6.0 | 6.0 | – | |||||||||
Page A-1
| Appendix |
Results excluding certain items included in our reported results are non-GAAP financial measures. Following the reorganization implemented at the beginning of 2022, we have amended the presentation of our adjusted results. Management believes that such results provide a useful presentation of our operating results for purposes of assessing our Group and divisional performance consistently over time, on a basis that excludes items that management does not consider representative of our underlying performance. Provided below is a reconciliation to the most directly comparable US GAAP measures.
| Reconciliation of adjustment items | |||||||||||
| Group | |||||||||||
| in | 3Q22 | 2Q22 | 3Q21 | 9M22 | 9M21 | ||||||
| Results (CHF million) | |||||||||||
| Net revenues | 3,804 | 3,645 | 5,437 | 11,861 | 18,114 | ||||||
| Real estate (gains)/losses | 0 | (13) | (4) | (177) | (8) | ||||||
| (Gains)/losses on business sales | 0 | 1 | 42 | 4 | 42 | ||||||
| Major litigation recovery | 0 | 0 | 0 | 0 | (49) | ||||||
| Valuation adjustment related to major litigation | 0 | 0 | 69 | 0 | 69 | ||||||
| (Gain)/loss on equity investment in Allfunds Group | (10) | 168 | (130) | 511 | (591) | ||||||
| (Gain)/loss on equity investment in SIX Group AG | 0 | 19 | 0 | 14 | 0 | ||||||
| (Gain)/loss on equity investment in Pfandbriefbank | (6) | 0 | 0 | (6) | 0 | ||||||
| Impairment on York Capital Management | 10 | 0 | 113 | 10 | 113 | ||||||
| Archegos | 0 | 0 | (23) | (17) | 470 | ||||||
| Adjusted net revenues | 3,798 | 3,820 | 5,504 | 12,200 | 18,160 | ||||||
| Provision for credit losses | 21 | 64 | (144) | (25) | 4,225 | ||||||
| Archegos | 0 | 0 | 188 | 155 | (4,312) | ||||||
| Adjusted provision for credit losses | 21 | 64 | 44 | 130 | (87) | ||||||
| Total operating expenses | 4,125 | 4,754 | 4,573 | 13,829 | 12,825 | ||||||
| Goodwill impairment | – | (23) | 0 | (23) | 0 | ||||||
| Restructuring expenses | (55) | (80) | – | (181) | (70) | ||||||
| Major litigation provisions | (178) | (434) | (495) | (1,265) | (707) | ||||||
| Expenses related to real estate disposals | (15) | (6) | (3) | (24) | (45) | ||||||
| Expenses related to equity investment in Allfunds Group | 0 | 0 | (1) | 0 | (20) | ||||||
| Archegos | (8) | (13) | 24 | (32) | (7) | ||||||
| Adjusted total operating expenses | 3,869 | 4,198 | 4,098 | 12,304 | 11,976 | ||||||
| Income/(loss) before taxes | (342) | (1,173) | 1,008 | (1,943) | 1,064 | ||||||
| Adjusted income/(loss) before taxes | (92) | (442) | 1,362 | (234) | 6,271 | ||||||
| Adjusted economic profit | (1,122) | (1,383) | (24) | (3,291) | 1,650 | ||||||
| Adjusted return on tangible equity (%) | (10.3) | (8.1) | 7.0 | (4.8) | 15.6 | ||||||
Page A-2
| Appendix |
| Wealth Management | |||||||||||||||||
| in / end of | % change | in / end of | % change | ||||||||||||||
| 3Q22 | 2Q22 | 3Q21 | QoQ | YoY | 9M22 | 9M21 | YoY | ||||||||||
| Results (CHF million) | |||||||||||||||||
| Net revenues | 1,365 | 1,266 | 1,656 | 8 | (18) | 3,808 | 5,654 | (33) | |||||||||
| Provision for credit losses | 7 | (11) | 18 | – | (61) | 20 | 7 | 186 | |||||||||
| Total operating expenses | 1,337 | 1,373 | 1,236 | (3) | 8 | 4,220 | 3,497 | 21 | |||||||||
| Income/(loss) before taxes | 21 | (96) | 402 | – | (95) | (432) | 2,150 | – | |||||||||
| Metrics | |||||||||||||||||
| Economic profit (CHF million) | (168) | (254) | 110 | (34) | – | (870) | 1,037 | – | |||||||||
| Cost/income ratio (%) | 97.9 | 108.5 | 74.6 | – | – | 110.8 | 61.9 | – | |||||||||
| Assets under management (CHF billion) | 635.4 | 661.5 | 760.6 | (3.9) | (16.5) | 635.4 | 760.6 | (16.5) | |||||||||
| Net new assets/(net asset outflows) (CHF billion) | (6.4) | (1.4) | 5.4 | – | – | (3.0) | 13.4 | – | |||||||||
| Gross margin (annualized) (bp) | 83 | 73 | 87 | – | – | 73 | 101 | – | |||||||||
| Net margin (annualized) (bp) | 1 | (6) | 21 | – | – | (8) | 38 | – | |||||||||
| Reconciliation of adjustment items | |||||||||||
| Wealth Management | |||||||||||
| in | 3Q22 | 2Q22 | 3Q21 | 9M22 | 9M21 | ||||||
| Results (CHF million) | |||||||||||
| Net revenues | 1,365 | 1,266 | 1,656 | 3,808 | 5,654 | ||||||
| Real estate (gains)/losses | 0 | 0 | 0 | (25) | 0 | ||||||
| (Gains)/losses on business sales | 0 | 1 | 41 | 4 | 41 | ||||||
| Major litigation recovery | 0 | 0 | 0 | 0 | (49) | ||||||
| (Gain)/loss on equity investment in Allfunds Group | (10) | 168 | (130) | 511 | (591) | ||||||
| (Gain)/loss on equity investment in SIX Group AG | 0 | 9 | 0 | 7 | 0 | ||||||
| Adjusted net revenues | 1,355 | 1,444 | 1,567 | 4,305 | 5,055 | ||||||
| Provision for credit losses | 7 | (11) | 18 | 20 | 7 | ||||||
| Total operating expenses | 1,337 | 1,373 | 1,236 | 4,220 | 3,497 | ||||||
| Restructuring expenses | (11) | (15) | – | (36) | (12) | ||||||
| Major litigation provisions | (54) | (16) | (70) | (300) | (59) | ||||||
| Expenses related to real estate disposals | (2) | (1) | 0 | (3) | (4) | ||||||
| Expenses related to equity investment in Allfunds Group | 0 | 0 | (1) | 0 | (20) | ||||||
| Adjusted total operating expenses | 1,270 | 1,341 | 1,165 | 3,881 | 3,402 | ||||||
| Income/(loss) before taxes | 21 | (96) | 402 | (432) | 2,150 | ||||||
| Adjusted income before taxes | 78 | 114 | 384 | 404 | 1,646 | ||||||
| Adjusted economic profit | (126) | (97) | 97 | (244) | 660 | ||||||
| Adjusted return on regulatory capital (%) | 2.5 | 3.8 | 12.0 | 4.4 | 17.3 | ||||||
Page A-3
| Appendix |
| Investment Bank | |||||||||||||||||
| in / end of | % change | in / end of | % change | ||||||||||||||
| 3Q22 | 2Q22 | 3Q21 | QoQ | YoY | 9M22 | 9M21 | YoY | ||||||||||
| Results (CHF million) | |||||||||||||||||
| Net revenues | 1,106 | 1,109 | 2,514 | 0 | (56) | 4,153 | 8,242 | (50) | |||||||||
| Provision for credit losses | (6) | 55 | (168) | – | (96) | (107) | 4,216 | – | |||||||||
| Total operating expenses | 1,778 | 2,170 | 1,841 | (18) | (3) | 5,918 | 5,511 | 7 | |||||||||
| Income/(loss) before taxes | (666) | (1,116) | 841 | (40) | – | (1,658) | (1,485) | 12 | |||||||||
| Metrics | |||||||||||||||||
| Economic profit (CHF million) | (873) | (1,220) | 211 | (28) | – | (2,390) | (2,450) | (2) | |||||||||
| Cost/income ratio (%) | 160.8 | 195.7 | 73.2 | – | – | 142.5 | 66.9 | – | |||||||||
| Results (USD million) | |||||||||||||||||
| Net revenues | 1,136 | 1,150 | 2,736 | (1) | (58) | 4,382 | 9,016 | (51) | |||||||||
| Provision for credit losses | (6) | 57 | (180) | – | (97) | (118) | 4,476 | – | |||||||||
| Total operating expenses | 1,833 | 2,258 | 2,005 | (19) | (9) | 6,222 | 6,038 | 3 | |||||||||
| Income/(loss) before taxes | (691) | (1,165) | 911 | (41) | – | (1,722) | (1,498) | 15 | |||||||||
| Net revenue detail | |||||||||||
| in / end of | 3Q22 | 2Q22 | 3Q21 | 9M22 | 9M21 | ||||||
| Net revenue detail (USD million) | |||||||||||
| Fixed income sales and trading | 558 | 622 | 825 | 1,982 | 3,357 | ||||||
| Equity sales and trading | 248 | 342 | 559 | 1,135 | 1,556 | ||||||
| Capital markets | 99 | 38 | 977 | 603 | 3,338 | ||||||
| Advisory and other fees | 232 | 190 | 379 | 643 | 775 | ||||||
| Other revenues | (1) | (42) | (4) | 19 | (10) | ||||||
| Net revenues | 1,136 | 1,150 | 2,736 | 4,382 | 9,016 | ||||||
Page A-4
| Appendix |
| Reconciliation of adjustment items | |||||||||||
| Investment Bank | |||||||||||
| in | 3Q22 | 2Q22 | 3Q21 | 9M22 | 9M21 | ||||||
| Results (CHF million) | |||||||||||
| Net revenues | 1,106 | 1,109 | 2,514 | 4,153 | 8,242 | ||||||
| Real estate (gains)/losses | 0 | 0 | 0 | (53) | 0 | ||||||
| Archegos | 0 | 0 | (23) | (17) | 470 | ||||||
| Adjusted net revenues | 1,106 | 1,109 | 2,491 | 4,083 | 8,712 | ||||||
| Provision for credit losses | (6) | 55 | (168) | (107) | 4,216 | ||||||
| Archegos | 0 | 0 | 188 | 155 | (4,312) | ||||||
| Adjusted provision for credit losses | (6) | 55 | 20 | 48 | (96) | ||||||
| Total operating expenses | 1,778 | 2,170 | 1,841 | 5,918 | 5,511 | ||||||
| Goodwill impairment | 0 | (23) | 0 | (23) | 0 | ||||||
| Restructuring expenses | (30) | (60) | – | (126) | (46) | ||||||
| Major litigation provisions | 0 | (191) | 0 | (191) | 0 | ||||||
| Expenses related to real estate disposals | (12) | (5) | (3) | (20) | (36) | ||||||
| Archegos | (8) | (13) | 24 | (32) | (7) | ||||||
| Adjusted total operating expenses | 1,728 | 1,878 | 1,862 | 5,526 | 5,422 | ||||||
| Income/(loss) before taxes | (666) | (1,116) | 841 | (1,658) | (1,485) | ||||||
| Adjusted income/(loss) before taxes | (616) | (824) | 609 | (1,491) | 3,386 | ||||||
| Adjusted economic profit | (835) | (1,001) | 37 | (2,264) | 1,203 | ||||||
| Adjusted return on regulatory capital (%) | (14.9) | (19.0) | 13.2 | (11.5) | 23.2 | ||||||
| Reconciliation of adjustment items | |||||||||||
| Investment Bank | |||||||||||
| in | 3Q22 | 2Q22 | 3Q21 | 9M22 | 9M21 | ||||||
| Results (USD million) | |||||||||||
| Net revenues | 1,136 | 1,150 | 2,736 | 4,382 | 9,016 | ||||||
| Real estate (gains)/losses | 0 | 0 | 0 | (57) | 0 | ||||||
| Archegos | 0 | 0 | (24) | (19) | 518 | ||||||
| Adjusted net revenues | 1,136 | 1,150 | 2,712 | 4,306 | 9,534 | ||||||
| Provision for credit losses | (6) | 57 | (180) | (118) | 4,476 | ||||||
| Archegos | 0 | 0 | 202 | 167 | (4,582) | ||||||
| Adjusted provision for credit losses | (6) | 57 | 22 | 49 | (106) | ||||||
| Total operating expenses | 1,833 | 2,258 | 2,005 | 6,222 | 6,038 | ||||||
| Goodwill impairment | – | (24) | – | (24) | – | ||||||
| Restructuring expenses | (30) | (63) | – | (132) | (51) | ||||||
| Major litigation provisions | 0 | (200) | 0 | (200) | 0 | ||||||
| Expenses related to real estate disposals | (13) | (4) | (3) | (20) | (38) | ||||||
| Archegos | (8) | (14) | 26 | (34) | (8) | ||||||
| Adjusted total operating expenses | 1,782 | 1,953 | 2,028 | 5,812 | 5,941 | ||||||
| Income/(loss) before taxes | (691) | (1,165) | 911 | (1,722) | (1,498) | ||||||
| Adjusted income/(loss) before taxes | (640) | (860) | 662 | (1,555) | 3,699 | ||||||
| Adjusted economic profit | (866) | (1,053) | 45 | (2,385) | 1,330 | ||||||
| Adjusted return on regulatory capital (%) | (14.9) | (19.0) | 13.2 | (11.5) | 23.2 | ||||||
Page A-5
| Appendix |
| Swiss Bank | |||||||||||||||||
| in / end of | % change | in / end of | % change | ||||||||||||||
| 3Q22 | 2Q22 | 3Q21 | QoQ | YoY | 9M22 | 9M21 | YoY | ||||||||||
| Results (CHF million) | |||||||||||||||||
| Net revenues | 962 | 1,050 | 1,053 | (8) | (9) | 3,121 | 3,107 | 0 | |||||||||
| Provision for credit losses | 21 | 18 | 3 | 17 | – | 62 | 8 | – | |||||||||
| Total operating expenses | 558 | 630 | 596 | (11) | (6) | 1,803 | 1,788 | 1 | |||||||||
| Income before taxes | 383 | 402 | 454 | (5) | (16) | 1,256 | 1,311 | (4) | |||||||||
| Metrics | |||||||||||||||||
| Economic profit (CHF million) | 88 | 101 | 139 | (13) | (37) | 343 | 373 | (8) | |||||||||
| Cost/income ratio (%) | 58.0 | 60.0 | 56.6 | – | – | 57.8 | 57.5 | – | |||||||||
| Assets under management (CHF billion) | 527.1 | 544.5 | 588.8 | (3.2) | (10.5) | 527.1 | 588.8 | (10.5) | |||||||||
| Net new assets/(net asset outflows) (CHF billion) | (1.5) | (1.6) | 0.4 | – | – | 2.9 | 4.9 | – | |||||||||
| Gross margin (annualized) (bp) | 71 | 74 | 71 | – | – | 73 | 72 | – | |||||||||
| Net margin (annualized) (bp) | 28 | 28 | 31 | – | – | 29 | 30 | – | |||||||||
| Reconciliation of adjustment items | |||||||||||
| Swiss Bank | |||||||||||
| in | 3Q22 | 2Q22 | 3Q21 | 9M22 | 9M21 | ||||||
| Results (CHF million) | |||||||||||
| Net revenues | 962 | 1,050 | 1,053 | 3,121 | 3,107 | ||||||
| Real estate (gains)/losses | 0 | (13) | (4) | (97) | (8) | ||||||
| (Gain)/loss on equity investment in SIX Group AG | 0 | 10 | 0 | 7 | 0 | ||||||
| (Gain)/loss on equity investment in Pfandbriefbank | (6) | 0 | 0 | (6) | 0 | ||||||
| Adjusted net revenues | 956 | 1,047 | 1,049 | 3,025 | 3,099 | ||||||
| Provision for credit losses | 21 | 18 | 3 | 62 | 8 | ||||||
| Total operating expenses | 558 | 630 | 596 | 1,803 | 1,788 | ||||||
| Restructuring expenses | (6) | (3) | – | (10) | (10) | ||||||
| Expenses related to real estate disposals | 0 | 0 | 0 | 0 | (4) | ||||||
| Adjusted total operating expenses | 552 | 627 | 596 | 1,793 | 1,774 | ||||||
| Income before taxes | 383 | 402 | 454 | 1,256 | 1,311 | ||||||
| Adjusted income before taxes | 383 | 402 | 450 | 1,170 | 1,317 | ||||||
| Adjusted economic profit | 88 | 101 | 136 | 279 | 377 | ||||||
| Adjusted return on regulatory capital (%) | 11.5 | 12.0 | 13.4 | 11.7 | 13.0 | ||||||
Page A-6
| Appendix |
| Asset Management | |||||||||||||||||
| in / end of | % change | in / end of | % change | ||||||||||||||
| 3Q22 | 2Q22 | 3Q21 | QoQ | YoY | 9M22 | 9M21 | YoY | ||||||||||
| Results (CHF million) | |||||||||||||||||
| Net revenues | 336 | 311 | 292 | 8 | 15 | 1,008 | 1,109 | (9) | |||||||||
| Provision for credit losses | (1) | 2 | 1 | – | – | 1 | 2 | (50) | |||||||||
| Total operating expenses | 247 | 279 | 273 | (11) | (10) | 834 | 838 | 0 | |||||||||
| Income before taxes | 90 | 30 | 18 | 200 | 400 | 173 | 269 | (36) | |||||||||
| Metrics | |||||||||||||||||
| Economic profit (CHF million) | 55 | 9 | – | – | – | 92 | 158 | (42) | |||||||||
| Cost/income ratio (%) | 73.5 | 89.7 | 93.5 | – | – | 82.7 | 75.6 | – | |||||||||
| Reconciliation of adjustment items | |||||||||||
| Asset Management | |||||||||||
| in | 3Q22 | 2Q22 | 3Q21 | 9M22 | 9M21 | ||||||
| Results (CHF million) | |||||||||||
| Net revenues | 336 | 311 | 292 | 1,008 | 1,109 | ||||||
| Real estate (gains)/losses | 0 | 0 | 0 | (2) | 0 | ||||||
| Impairment on York Capital Management | 10 | 0 | 113 | 10 | 113 | ||||||
| Adjusted net revenues | 346 | 311 | 405 | 1,016 | 1,222 | ||||||
| Provision for credit losses | (1) | 2 | 1 | 1 | 2 | ||||||
| Total operating expenses | 247 | 279 | 273 | 834 | 838 | ||||||
| Restructuring expenses | (3) | (1) | – | (4) | (3) | ||||||
| Expenses related to real estate disposals | (1) | 0 | 0 | (1) | (1) | ||||||
| Adjusted total operating expenses | 243 | 278 | 273 | 829 | 834 | ||||||
| Income before taxes | 90 | 30 | 18 | 173 | 269 | ||||||
| Adjusted income before taxes | 104 | 31 | 131 | 186 | 386 | ||||||
| Adjusted economic profit | 65 | 10 | 85 | 102 | 247 | ||||||
| Adjusted return on regulatory capital (%) | 48.7 | 14.6 | 57.2 | 29.6 | 54.6 | ||||||
Page A-7
| Appendix |
This document contains statements that constitute forward-looking statements. In addition, in the future we, and others on our behalf, may make statements that constitute forward-looking statements. Such forward-looking statements may include, without limitation, statements relating to the following:
■ our plans, targets or goals;
■ our future economic performance or prospects;
■ the potential effect on our future performance of certain contingencies; and
■ assumptions underlying any such statements.
Words such as “believes,” “anticipates,” “expects,” “intends” and “plans” and similar expressions are intended to identify forward-looking statements but are not the exclusive means of identifying such statements. We do not intend to update these forward-looking statements.
By their very nature, forward-looking statements involve inherent risks and uncertainties, both general and specific, and risks exist that predictions, forecasts, projections and other outcomes described or implied in forward-looking statements will not be achieved. We caution you that a number of important factors could cause results to differ materially from the plans, targets, goals, expectations, estimates and intentions expressed in such forward-looking statements. These factors include, but are not limited to:
■ the ability to maintain sufficient liquidity and access capital markets;
■ market volatility, increases in inflation and interest rate fluctuations or developments affecting interest rate levels;
■ the ongoing significant negative consequences, including reputational harm, of the Archegos and supply chain finance funds matters, as well as other recent events, and our ability to successfully resolve these matters;
■ the impact of social media speculation and unsubstantiated media reports about our business and its performance;
■ the extent of outflows of assets or future net new asset generation across our divisions;
■ our ability to improve our risk management procedures and policies and hedging strategies;
■ the strength of the global economy in general and the strength of the economies of the countries in which we conduct our operations, in particular, but not limited to, the risk of negative impacts of COVID-19 on the global economy and financial markets, Russia’s invasion of Ukraine, the resulting sanctions from the US, EU, UK, Switzerland and other countries and the risk of continued slow economic recovery or downturn in the EU, the US or other developed countries or in emerging markets in 2022 and beyond;
■ the emergence of widespread health emergencies, infectious diseases or pandemics, such as COVID-19, and the actions that may be taken by governmental authorities to contain the outbreak or to counter its impact;
■ potential risks and uncertainties relating to the severity of impacts from COVID-19 and the duration of the pandemic, including potential material adverse effects on our business, financial condition and results of operations;
■ the direct and indirect impacts of deterioration or slow recovery in residential and commercial real estate markets;
■ adverse rating actions by credit rating agencies in respect of us, sovereign issuers, structured credit products or other credit-related exposures;
■ the ability to achieve our strategic initiatives, including those related to our targets, ambitions and goals, such as our financial ambitions as well as various goals and commitments to incorporate certain environmental, social and governance considerations into our business strategy, products, services and risk management processes;
■ our ability to achieve our announced comprehensive new strategic direction for the Group and significant changes to its structure and organization;
■ our ability to successfully implement the divestment of any non-core business;
■ the future level of any impairments and write-downs, including from the revaluation of deferred tax assets, resulting from disposals and the implementation of the proposed strategic initiatives;
■ the ability of counterparties to meet their obligations to us and the adequacy of our allowance for credit losses;
■ the effects of, and changes in, fiscal, monetary, exchange rate, trade and tax policies;
■ the effects of currency fluctuations, including the related impact on our business, financial condition and results of operations due to moves in foreign exchange rates;
■ geopolitical and diplomatic tensions, instabilities and conflicts, including war, civil unrest, terrorist activity, sanctions or other geopolitical events or escalations of hostilities, such as Russia’s invasion of Ukraine;
■ political, social and environmental developments, including climate change;
■ the ability to appropriately address social, environmental and sustainability concerns that may arise from our business activities;
■ the effects of, and the uncertainty arising from, the UK’s withdrawal from the EU;
■ the possibility of foreign exchange controls, expropriation, nationalization or confiscation of assets in countries in which we conduct our operations;
■ operational factors such as systems failure, human error, or the failure to implement procedures properly;
■ the risk of cyber attacks, information or security breaches or technology failures on our reputation, business or operations, the risk of which is increased while large portions of our employees work remotely;
■ the adverse resolution of litigation, regulatory proceedings and other contingencies;
■ actions taken by regulators with respect to our business and practices and possible resulting changes to our business organization, practices and policies in countries in which we conduct our operations;
■ the effects of changes in laws, regulations or accounting or tax standards, policies or practices in countries in which we conduct our operations;
■ the discontinuation of LIBOR and other interbank offered rates and the transition to alternative reference rates;
■ the potential effects of changes in our legal entity structure;
■ competition or changes in our competitive position in geographic and business areas in which we conduct our operations;
■ the ability to retain and recruit qualified personnel;
■ the ability to protect our reputation and promote our brand;
■ the ability to increase market share and control expenses;
■ technological changes instituted by us, our counterparties or competitors;
■ the timely development and acceptance of our new products and services and the perceived overall value of these products and services by users;
■ acquisitions, including the ability to integrate acquired businesses successfully, and divestitures, including the ability to sell non-core assets; and
■ other unforeseen or unexpected events and our success at managing these and the risks involved in the foregoing.
We caution you that the foregoing list of important factors is not exclusive. When evaluating forward-looking statements, you should carefully consider the foregoing factors and other uncertainties and events, including the information set forth in “Risk factors” in I – Information on the company in our Annual Report 2021.
Page A-8

3Q22 Results Analyst and Investor Call Ulrich Körner Chief Executive Officer Dixit Joshi Chief Financial Officer October 27, 2022
Disclaimer (1/2) 2 Credit Suisse has not finalized its 3Q22 Financial Report and Credit Suisse’s independent registered public accounting firm has not completed its review of the condensed consolidated financial statements (unaudited) for the period. Accordingly, the financial information contained in this document is subject to completion of quarter-end procedures, which may result in changes to that information. In particular, the information contained herein relating to the anticipated accounting and capital impacts on certain deferred tax asset positions, Credit Suisse AG (Bank parent company) participation(s) valuations and other potential matters continue to be analyzed in light of the changes to the Group's strategic plans announced on October 27, 2022, making these and other closely-related metrics more susceptible to change as we complete our quarter-end procedures. This material does not purport to contain all of the information that you may wish to consider. This material is not to be relied upon as such or used in substitution for the exercise of independent judgment. Cautionary statement regarding forward-looking statements This document contains forward-looking statements that involve inherent risks and uncertainties, and we might not be able to achieve the predictions, forecasts, projections and other outcomes we describe or imply in forward-looking statements. In addition to our ability to successfully implement our strategic objectives announced today, a number of important factors could cause results to differ materially from the plans, targets, goals, expectations, estimates and intentions we express in these forward-looking statements, including those we identify in "Risk factors” in our Annual Report on Form 20-F for the fiscal year ended December 31, 2021 and in the “Cautionary statement regarding forward-looking information" in our 3Q22 Earnings Release published on October 27, 2022 and submitted to the US Securities and Exchange Commission, and in other public filings and press releases. We do not intend to update these forward-looking statements. In particular, the terms “Estimate”, “Illustrative”, “Ambition”, “Objective”, “Outlook”, “Goal”, “Commitment” and “Aspiration” are not intended to be viewed as targets or projections, nor are they considered to be Key Performance Indicators. All such estimates, illustrations, ambitions, objectives, outlooks, goals, commitments and aspirations, as well as any other forward-looking statements described as targets or projections, are subject to a large number of inherent risks, assumptions and uncertainties, many of which are completely outside of our control. These risks, assumptions and uncertainties include, but are not limited to, general market conditions, market volatility, increased inflation, interest rate volatility and levels, global and regional economic conditions, challenges and uncertainties resulting from Russia’s invasion of Ukraine, political uncertainty, changes in tax policies, scientific or technological developments, evolving sustainability strategies, changes in the nature or scope of our operations, including as a result of our recently announced strategy initiatives, changes in carbon markets, regulatory changes, changes in levels of client activity as a result of any of the foregoing and other factors. Accordingly, these statements, which speak only as of the date made, are not guarantees of future performance and should not be relied on for any purpose. We do not intend to update these estimates, illustrations, ambitions, objectives, outlooks, goals, commitments, aspirations, targets, projections or any other forward-looking statements. For these reasons, we caution you not to place undue reliance upon any forward-looking statements. We may not achieve the benefits of our strategic initiatives We may not achieve all of the expected benefits of our strategic initiatives, such as in relation to intended reshaping of the bank, cost reductions and strengthening and reallocating capital. Factors beyond our control, including but not limited to the market and economic conditions (including macroeconomic and other challenges and uncertainties, for example, resulting from Russia’s invasion of Ukraine), customer reaction to our proposed initiatives, enhanced risks to our businesses during the contemplated transitions, changes in laws, rules or regulations and other challenges discussed in our public filings, could limit our ability to achieve some or all of the expected benefits of these initiatives. Our ability to implement our strategy objectives could also be impacted by timing risks, obtaining all required approvals and other factors. Estimates and assumptions In preparing this document, management has made estimates and assumptions that affect the numbers presented. Actual results may differ. Annualized numbers do not take into account variations in operating results, seasonality and other factors and may not be indicative of actual, full-year results. Figures throughout this document may also be subject to rounding adjustments. All opinions and views constitute good faith judgments as of the date of writing without regard to the date on which the reader may receive or access the information. This information is subject to change at any time without notice and we do not intend to update this information. Statement regarding non-GAAP financial measures This document contains non-GAAP financial measures, including results excluding certain items included in our reported results as well as return on regulatory capital and return on tangible equity, which is based on tangible shareholders’ equity. Further details and information needed to reconcile such non-GAAP financial measures to the most directly comparable measures under US GAAP can be found in the Appendix of this document, as well as in the 3Q22 Earnings Release, which are both available on our website at www.credit-suisse.com.
Disclaimer (2/2) 3 Statement regarding capital, liquidity and leverage Credit Suisse is subject to the Basel framework, as implemented in Switzerland, as well as Swiss legislation and regulations for systemically important banks, which include capital, liquidity, leverage and large exposure requirements and rules for emergency plans designed to maintain systemically relevant functions in the event of threatened insolvency. Credit Suisse has adopted the Bank for International Settlements (BIS) leverage ratio framework, as issued by the Basel Committee on Banking Supervision (BCBS) and implemented in Switzerland by the Swiss Financial Market Supervisory Authority FINMA. Unless otherwise noted, leverage exposure is based on the BIS leverage ratio framework and consists of period-end balance sheet assets and prescribed regulatory adjustments. The tier 1 leverage ratio and CET1 leverage ratio are calculated as BIS tier 1 capital and CET1 capital, respectively, divided by period-end leverage exposure. Sources Certain material in this document has been prepared by Credit Suisse on the basis of publicly available information, internally developed data and other third-party sources believed to be reliable. Credit Suisse has not sought to independently verify information obtained from public and third-party sources and makes no representations or warranties as to accuracy, completeness, reasonableness or reliability of such information. Share capital increase This document is not an offer to sell securities or the solicitation of any offer to buy securities, nor shall there be any offer of securities, in any jurisdiction in which such offer or sale would be unlawful. This document does not constitute an offer or invitation to subscribe for or to purchase any securities in the United States of America. The securities referred to herein have not been and will not be registered under the US Securities Act of 1933, as amended (the “Securities Act”) or the laws of any US state and may not be offered or sold in the United States of America absent registration or an exemption from registration under the Securities Act. There will be no public offering of the securities in the United States of America.
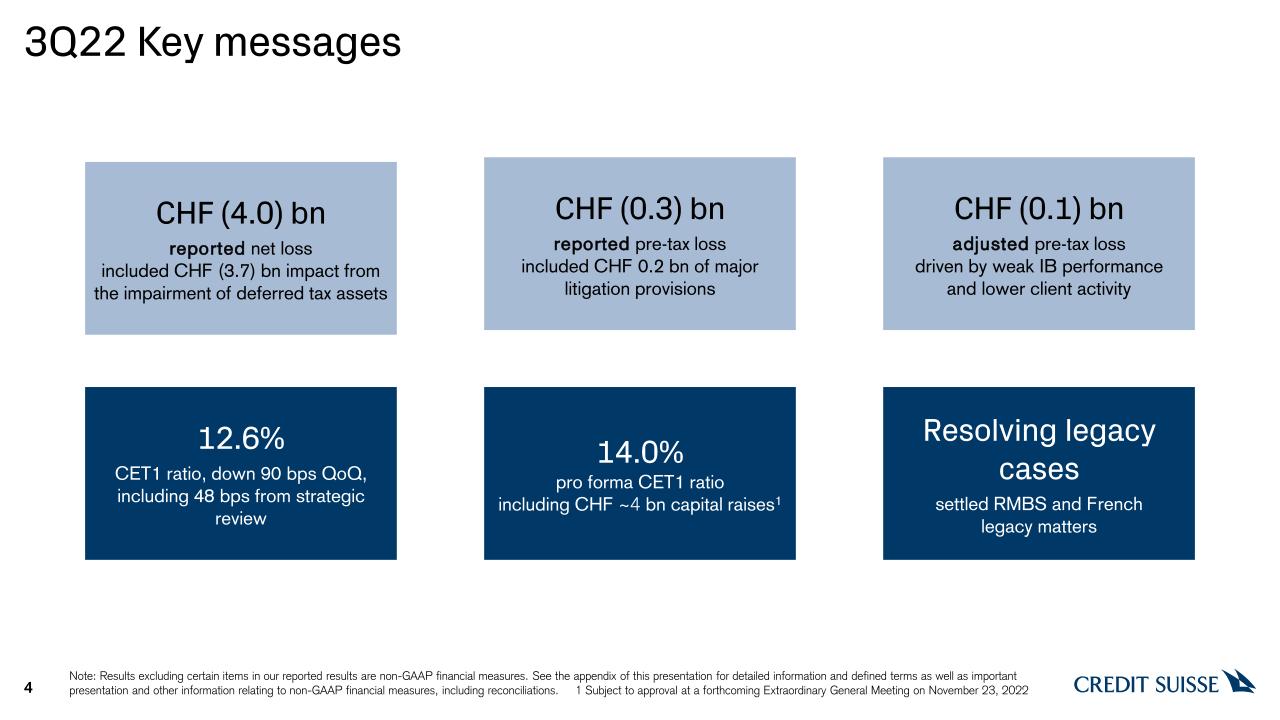
3Q22 Key messages 4 CHF (4.0) bn reported net lossincluded CHF (3.7) bn impact from the impairment of deferred tax assets CHF (0.3) bn reported pre-tax loss included CHF 0.2 bn of major litigation provisions Resolving legacy cases settled RMBS and Frenchlegacy matters CHF (0.1) bn adjusted pre-tax loss driven by weak IB performance and lower client activity Note: Results excluding certain items in our reported results are non-GAAP financial measures. See the appendix of this presentation for detailed information and defined terms as well as important presentation and other information relating to non-GAAP financial measures, including reconciliations. 1 Subject to approval at a forthcoming Extraordinary General Meeting on November 23, 2022 14.0% pro forma CET1 ratioincluding CHF ~4 bn capital raises1 12.6% CET1 ratio, down 90 bps QoQ, including 48 bps from strategic review
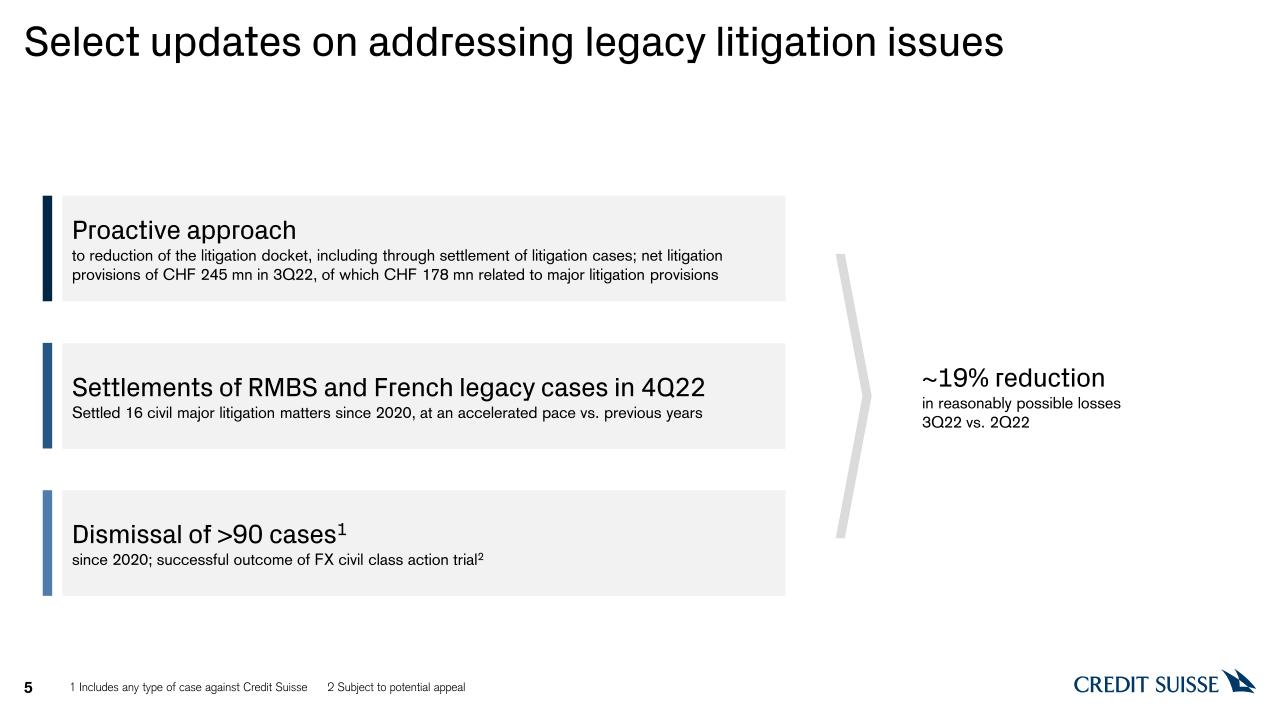
Select updates on addressing legacy litigation issues 1 Includes any type of case against Credit Suisse 2 Subject to potential appeal 5 ~19% reductionin reasonably possible losses 3Q22 vs. 2Q22 Proactive approach to reduction of the litigation docket, including through settlement of litigation cases; net litigation provisions of CHF 245 mn in 3Q22, of which CHF 178 mn related to major litigation provisions Settlements of RMBS and French legacy cases in 4Q22 Settled 16 civil major litigation matters since 2020, at an accelerated pace vs. previous years Dismissal of >90 cases1 since 2020; successful outcome of FX civil class action trial2
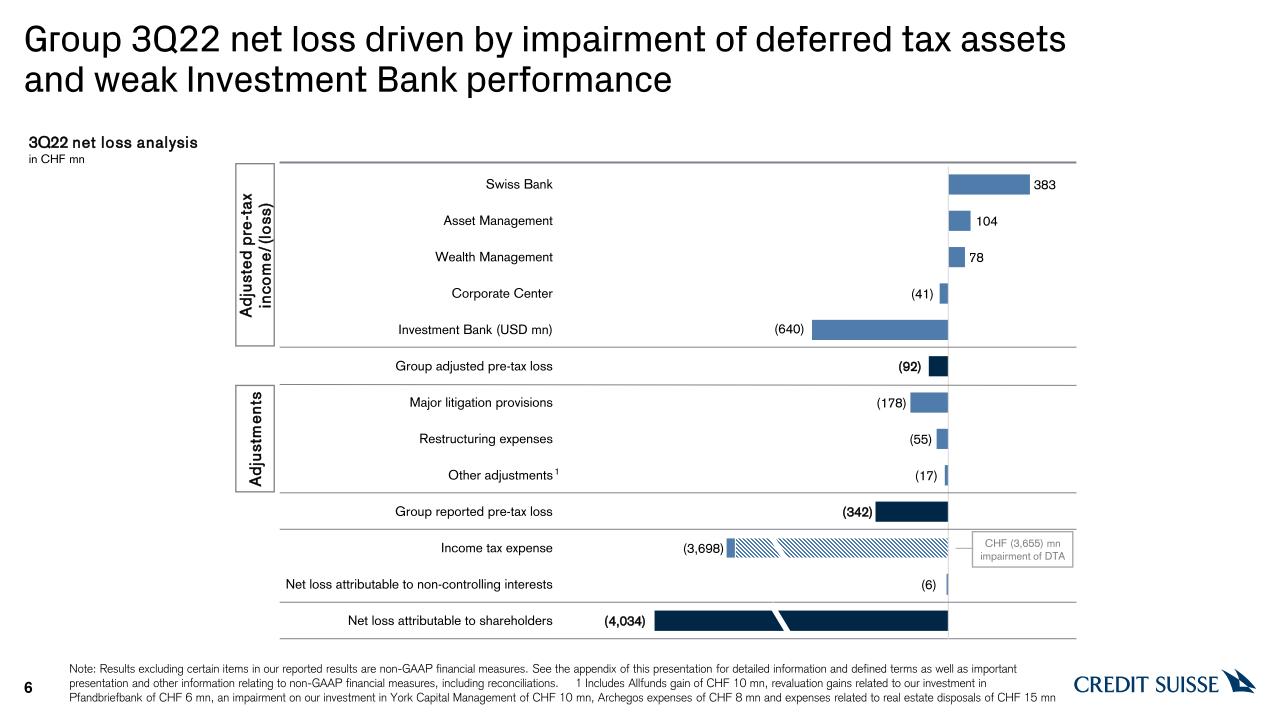
Group 3Q22 net loss driven by impairment of deferred tax assetsand weak Investment Bank performance 6 3Q22 net loss analysis in CHF mn Note: Results excluding certain items in our reported results are non-GAAP financial measures. See the appendix of this presentation for detailed information and defined terms as well as important presentation and other information relating to non-GAAP financial measures, including reconciliations. 1 Includes Allfunds gain of CHF 10 mn, revaluation gains related to our investment in Pfandbriefbank of CHF 6 mn, an impairment on our investment in York Capital Management of CHF 10 mn, Archegos expenses of CHF 8 mn and expenses related to real estate disposals of CHF 15 mn Adjusted pre-tax income/(loss) Adjustments 1 CHF (3,655) mnimpairment of DTA
Detailed Financials
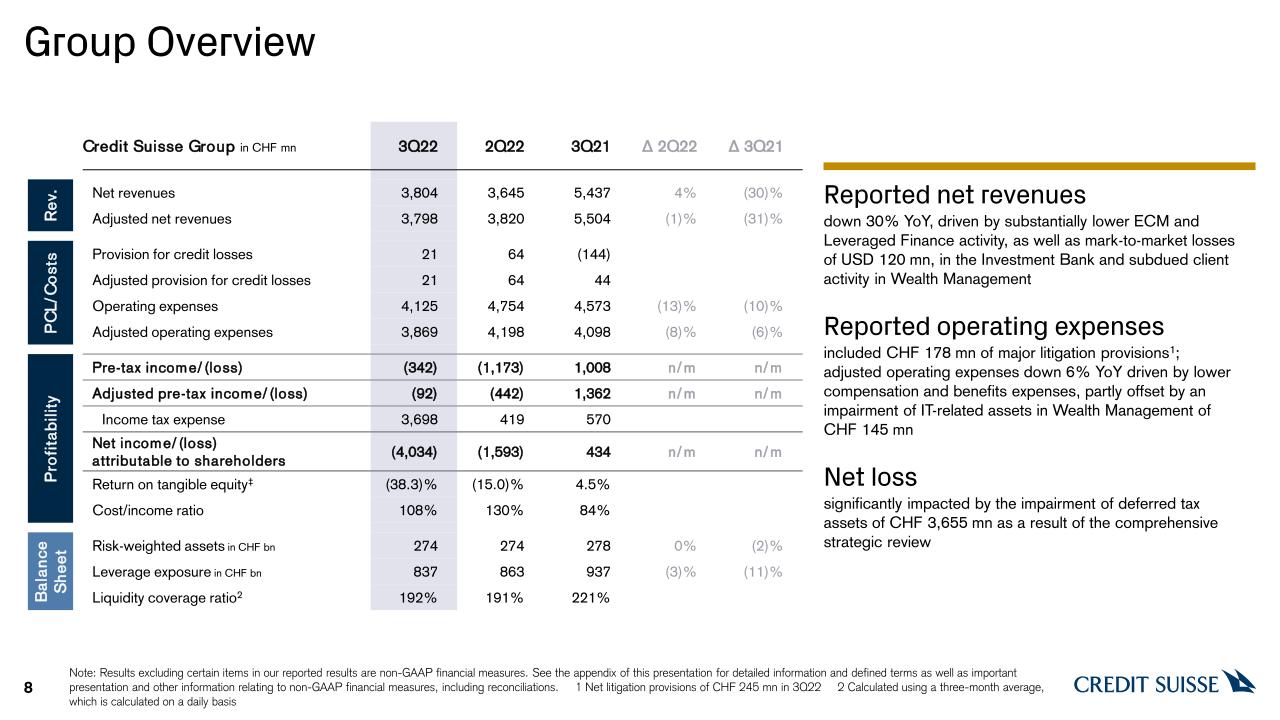
Group Overview 8 Reported net revenues down 30% YoY, driven by substantially lower ECM and Leveraged Finance activity, as well as mark-to-market losses of USD 120 mn, in the Investment Bank and subdued client activity in Wealth Management Reported operating expenses included CHF 178 mn of major litigation provisions1;adjusted operating expenses down 6% YoY driven by lower compensation and benefits expenses, partly offset by an impairment of IT-related assets in Wealth Management of CHF 145 mn Net loss significantly impacted by the impairment of deferred tax assets of CHF 3,655 mn as a result of the comprehensive strategic review Credit Suisse Group in CHF mn 3Q22 2Q22 3Q21 Δ 2Q22 Δ 3Q21 Rev. Net revenues 3,804 3,645 5,437 4% (30)% Adjusted net revenues 3,798 3,820 5,504 (1)% (31)% PCL/Costs Provision for credit losses 21 64 (144) Adjusted provision for credit losses 21 64 44 Operating expenses 4,125 4,754 4,573 (13)% (10)% Adjusted operating expenses 3,869 4,198 4,098 (8)% (6)% Profitability Pre-tax income/(loss) (342) (1,173) 1,008 n/m n/m Adjusted pre-tax income/(loss) (92) (442) 1,362 n/m n/m Income tax expense 3,698 419 570 Net income/(loss) attributable to shareholders (4,034) (1,593) 434 n/m n/m Return on tangible equity‡ (38.3)% (15.0)% 4.5% Cost/income ratio 108% 130% 84% Balance Sheet Risk-weighted assets in CHF bn 274 274 278 0% (2)% Leverage exposure in CHF bn 837 863 937 (3)% (11)% Liquidity coverage ratio2 192% 191% 221% Note: Results excluding certain items in our reported results are non-GAAP financial measures. See the appendix of this presentation for detailed information and defined terms as well as important presentation and other information relating to non-GAAP financial measures, including reconciliations. 1 Net litigation provisions of CHF 245 mn in 3Q22 2 Calculated using a three-month average, which is calculated on a daily basis
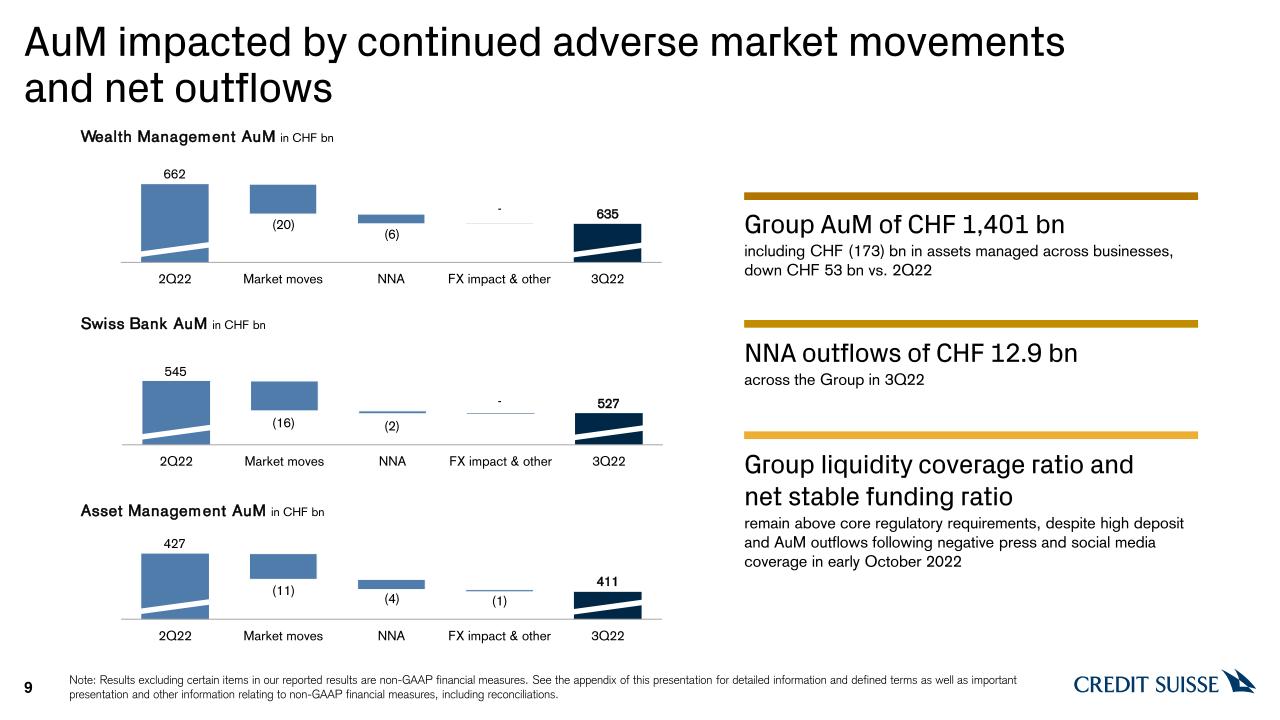
411 (1) (4) (11) 427 (20) (6) 635 662 - (16) 527 (2) 545 - AuM impacted by continued adverse market movements and net outflows 9 Note: Results excluding certain items in our reported results are non-GAAP financial measures. See the appendix of this presentation for detailed information and defined terms as well as important presentation and other information relating to non-GAAP financial measures, including reconciliations. Wealth Management AuM in CHF bn Swiss Bank AuM in CHF bn Asset Management AuM in CHF bn Group AuM of CHF 1,401 bn including CHF (173) bn in assets managed across businesses,down CHF 53 bn vs. 2Q22 NNA outflows of CHF 12.9 bn across the Group in 3Q22 Group liquidity coverage ratio and net stable funding ratio remain above core regulatory requirements, despite high deposit and AuM outflows following negative press and social media coverage in early October 2022
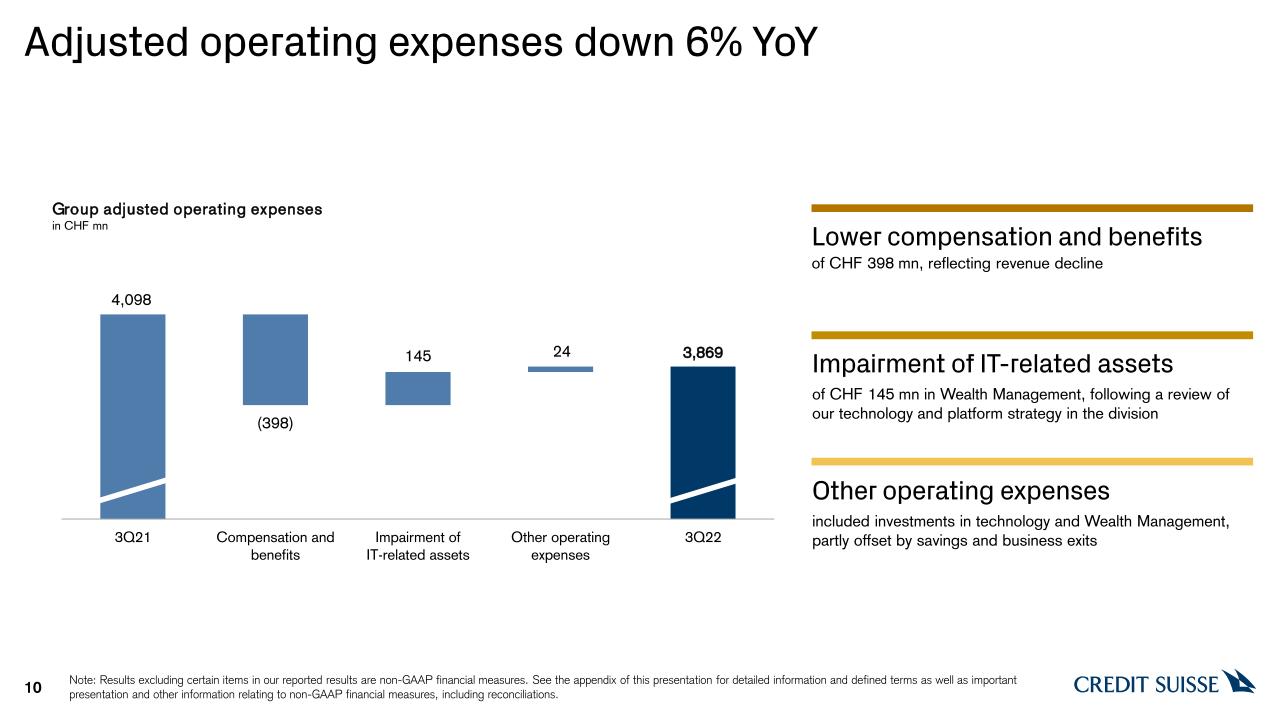
Adjusted operating expenses down 6% YoY 10 Group adjusted operating expenses in CHF mn Note: Results excluding certain items in our reported results are non-GAAP financial measures. See the appendix of this presentation for detailed information and defined terms as well as important presentation and other information relating to non-GAAP financial measures, including reconciliations. Lower compensation and benefits of CHF 398 mn, reflecting revenue decline Impairment of IT-related assets of CHF 145 mn in Wealth Management, following a review of our technology and platform strategy in the division Other operating expenses included investments in technology and Wealth Management, partly offset by savings and business exits
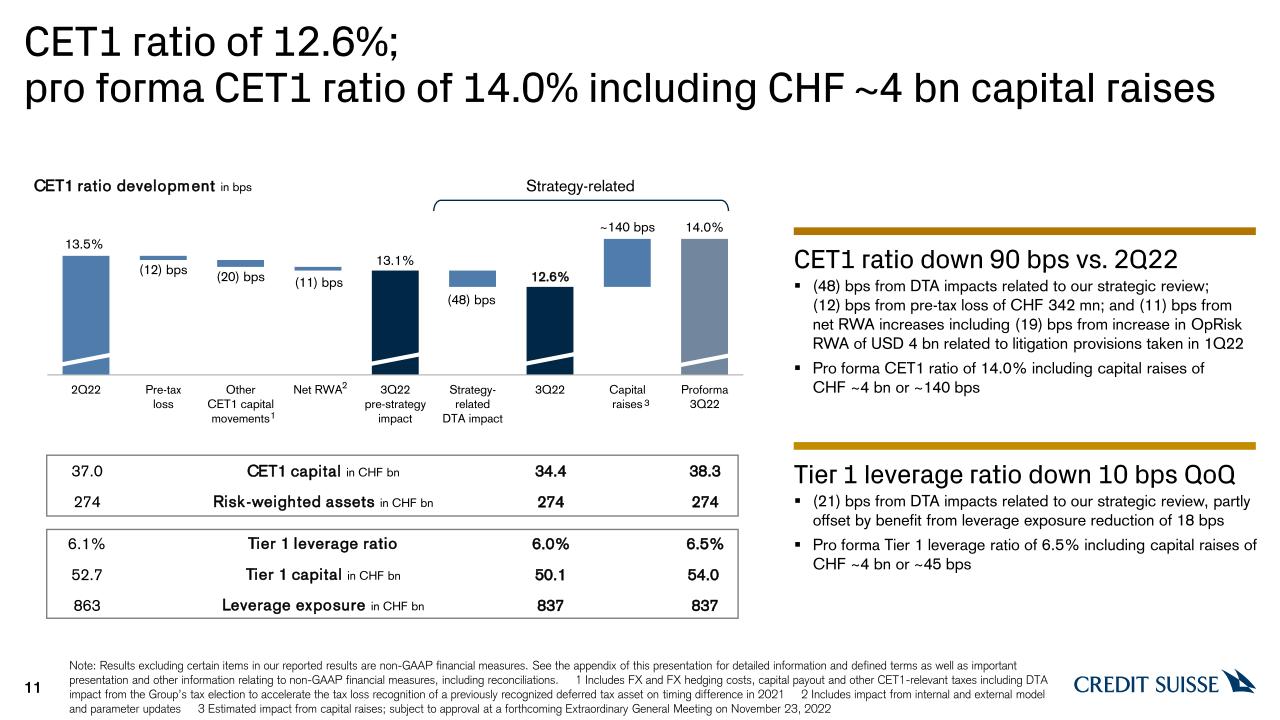
50.1 Tier 1 capital in CHF bn 52.7 837 Leverage exposure in CHF bn 863 34.4 CET1 capital in CHF bn 37.0 274 Risk-weighted assets in CHF bn 274 CET1 ratio development in bps 1 2 3 CET1 ratio of 12.6%; pro forma CET1 ratio of 14.0% including CHF ~4 bn capital raises 11 Note: Results excluding certain items in our reported results are non-GAAP financial measures. See the appendix of this presentation for detailed information and defined terms as well as important presentation and other information relating to non-GAAP financial measures, including reconciliations. 1 Includes FX and FX hedging costs, capital payout and other CET1-relevant taxes including DTA impact from the Group’s tax election to accelerate the tax loss recognition of a previously recognized deferred tax asset on timing difference in 2021 2 Includes impact from internal and external model and parameter updates 3 Estimated impact from capital raises; subject to approval at a forthcoming Extraordinary General Meeting on November 23, 2022 Strategy-related 6.0% Tier 1 leverage ratio 6.1% CET1 ratio down 90 bps vs. 2Q22 (48) bps from DTA impacts related to our strategic review; (12) bps from pre-tax loss of CHF 342 mn; and (11) bps from net RWA increases including (19) bps from increase in OpRisk RWA of USD 4 bn related to litigation provisions taken in 1Q22 Pro forma CET1 ratio of 14.0% including capital raises of CHF ~4 bn or ~140 bps Tier 1 leverage ratio down 10 bps QoQ (21) bps from DTA impacts related to our strategic review, partly offset by benefit from leverage exposure reduction of 18 bps Pro forma Tier 1 leverage ratio of 6.5% including capital raises of CHF ~4 bn or ~45 bps 837 38.3 274 6.5% 54.0
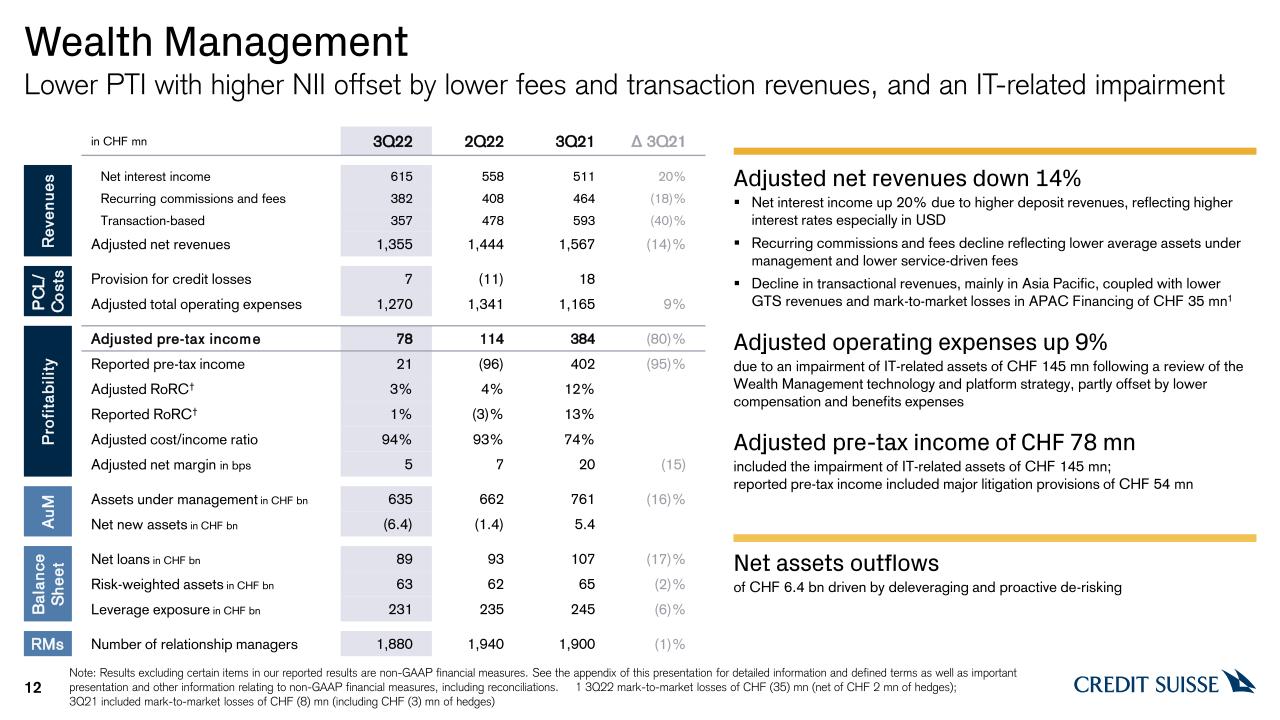
Wealth Management 12 Lower PTI with higher NII offset by lower fees and transaction revenues, and an IT-related impairment in CHF mn 3Q22 2Q22 3Q21 Δ 3Q21 Revenues Net interest income 615 558 511 20% Recurring commissions and fees 382 408 464 (18)% Transaction-based 357 478 593 (40)% Adjusted net revenues 1,355 1,444 1,567 (14)% PCL/ Costs Provision for credit losses 7 (11) 18 Adjusted total operating expenses 1,270 1,341 1,165 9% Profitability Adjusted pre-tax income 78 114 384 (80)% Reported pre-tax income 21 (96) 402 (95)% Adjusted RoRC† 3% 4% 12% Reported RoRC† 1% (3)% 13% Adjusted cost/income ratio 94% 93% 74% Adjusted net margin in bps 5 7 20 (15) AuM Assets under management in CHF bn 635 662 761 (16)% Net new assets in CHF bn (6.4) (1.4) 5.4 Balance Sheet Net loans in CHF bn 89 93 107 (17)% Risk-weighted assets in CHF bn 63 62 65 (2)% Leverage exposure in CHF bn 231 235 245 (6)% RMs Number of relationship managers 1,880 1,940 1,900 (1)% Adjusted net revenues down 14% Net interest income up 20% due to higher deposit revenues, reflecting higher interest rates especially in USD Recurring commissions and fees decline reflecting lower average assets under management and lower service-driven fees Decline in transactional revenues, mainly in Asia Pacific, coupled with lower GTS revenues and mark-to-market losses in APAC Financing of CHF 35 mn1 Adjusted operating expenses up 9% due to an impairment of IT-related assets of CHF 145 mn following a review of the Wealth Management technology and platform strategy, partly offset by lower compensation and benefits expenses Adjusted pre-tax income of CHF 78 mn included the impairment of IT-related assets of CHF 145 mn; reported pre-tax income included major litigation provisions of CHF 54 mn Net assets outflows of CHF 6.4 bn driven by deleveraging and proactive de-risking Note: Results excluding certain items in our reported results are non-GAAP financial measures. See the appendix of this presentation for detailed information and defined terms as well as important presentation and other information relating to non-GAAP financial measures, including reconciliations. 1 3Q22 mark-to-market losses of CHF (35) mn (net of CHF 2 mn of hedges); 3Q21 included mark-to-market losses of CHF (8) mn (including CHF (3) mn of hedges)

Swiss Bank 13 Resilient performance notwithstanding impact of Swiss threshold benefits in CHF mn 3Q22 2Q22 3Q21 Δ 3Q21 Revenues Net interest income 525 595 589 (11)% Recurring commissions and fees 323 334 333 (3)% Transaction-based 121 138 146 (17)% Adjusted net revenues1 956 1,047 1,049 (9)% PCL/ Costs Provision for credit losses 21 18 3 Adjusted total operating expenses 552 627 596 (7)% Profitability Adjusted pre-tax income 383 402 450 (15)% Reported pre-tax income 383 402 454 (16)% Adjusted RoRC† 12% 12% 13% Reported RoRC† 12% 12% 13% Adjusted cost/income ratio 58% 60% 57% Adjusted net margin in bps 28 28 30 (2) AuM Assets under management in CHF bn 527 545 589 (10)% Net new assets in CHF bn (1.5) (1.6) 0.4 Balance Sheet Net loans in CHF bn 161 162 163 (2)% Risk-weighted assets in CHF bn 71 72 70 2% Leverage exposure in CHF bn 240 244 250 (4)% RMs Number of relationship managers 1,660 1,680 1,650 1% Adjusted net revenues down 9% Net interest income down 11%, mainly driven by lower SNB threshold benefits from the recent SNB increase of interest rates, partly offset by higher deposit income Recurring commission and fees down 3% due to lower AuM levels, partly offset by higher fees from lending activities Transaction-based revenues down 17%; excluding a gain related to IBOR transition in 3Q212 and gains on equity investments3, transaction-based revenues down 4% Adjusted operating expenses down 7% driven by lower compensation and benefits expenses; cost/income ratio of 58% Adjusted pre-tax income down 15% with continued low provision for credit losses at 5 bps of our net loans Assets under management down 10% Lower assets under management due to declining markets NNA of CHF (1.5) bn with outflows of CHF 1.7 bn from private clients, partly offset by inflows of CHF 0.2 bn from institutional clients Note: Results excluding certain items in our reported results are non-GAAP financial measures. See the appendix of this presentation for detailed information and defined terms as well as important presentation and other information relating to non-GAAP financial measures, including reconciliations. 1 Includes other revenues of CHF (13) mn in 3Q22, CHF (20) mn in 2Q22 and CHF (19) mn in 3Q21 2 Gain related to IBOR transition of CHF 16 mn in 3Q21 3 Gains on equity investments of CHF 1 mn in 3Q22 and CHF 5 mn in 3Q21
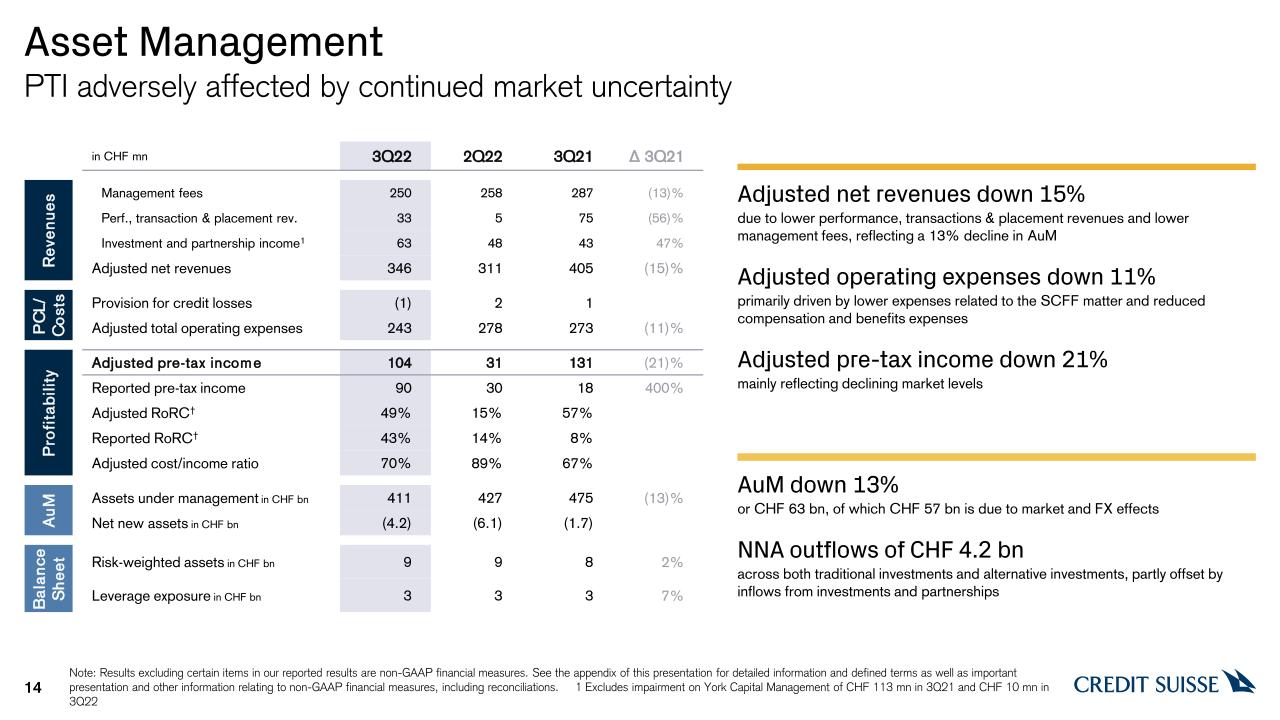
Asset Management 14 PTI adversely affected by continued market uncertainty in CHF mn 3Q22 2Q22 3Q21 Δ 3Q21 Revenues Management fees 250 258 287 (13)% Perf., transaction & placement rev. 33 5 75 (56)% Investment and partnership income1 63 48 43 47% Adjusted net revenues 346 311 405 (15)% PCL/ Costs Provision for credit losses (1) 2 1 Adjusted total operating expenses 243 278 273 (11)% Profitability Adjusted pre-tax income 104 31 131 (21)% Reported pre-tax income 90 30 18 400% Adjusted RoRC† 49% 15% 57% Reported RoRC† 43% 14% 8% Adjusted cost/income ratio 70% 89% 67% AuM Assets under management in CHF bn 411 427 475 (13)% Net new assets in CHF bn (4.2) (6.1) (1.7) Balance Sheet Risk-weighted assets in CHF bn 9 9 8 2% Leverage exposure in CHF bn 3 3 3 7% Adjusted net revenues down 15% due to lower performance, transactions & placement revenues and lower management fees, reflecting a 13% decline in AuM Adjusted operating expenses down 11% primarily driven by lower expenses related to the SCFF matter and reduced compensation and benefits expenses Adjusted pre-tax income down 21% mainly reflecting declining market levels AuM down 13% or CHF 63 bn, of which CHF 57 bn is due to market and FX effects NNA outflows of CHF 4.2 bn across both traditional investments and alternative investments, partly offset by inflows from investments and partnerships Note: Results excluding certain items in our reported results are non-GAAP financial measures. See the appendix of this presentation for detailed information and defined terms as well as important presentation and other information relating to non-GAAP financial measures, including reconciliations. 1 Excludes impairment on York Capital Management of CHF 113 mn in 3Q21 and CHF 10 mn in 3Q22
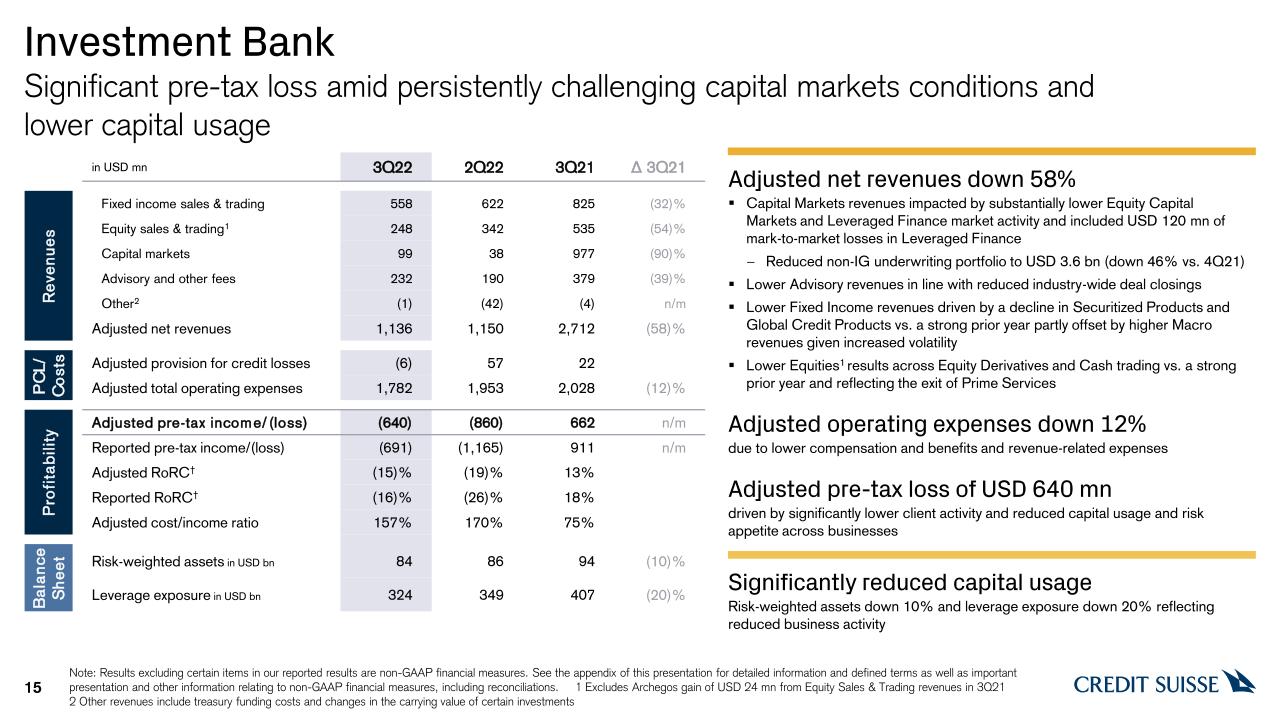
Investment Bank Note: Results excluding certain items in our reported results are non-GAAP financial measures. See the appendix of this presentation for detailed information and defined terms as well as important presentation and other information relating to non-GAAP financial measures, including reconciliations. 1 Excludes Archegos gain of USD 24 mn from Equity Sales & Trading revenues in 3Q21 2 Other revenues include treasury funding costs and changes in the carrying value of certain investments 15 Significant pre-tax loss amid persistently challenging capital markets conditions andlower capital usage in USD mn 3Q22 2Q22 3Q21 Δ 3Q21 Revenues Fixed income sales & trading 558 622 825 (32)% Equity sales & trading1 248 342 535 (54)% Capital markets 99 38 977 (90)% Advisory and other fees 232 190 379 (39)% Other2 (1) (42) (4) n/m Adjusted net revenues 1,136 1,150 2,712 (58)% PCL/ Costs Adjusted provision for credit losses (6) 57 22 Adjusted total operating expenses 1,782 1,953 2,028 (12)% Profitability Adjusted pre-tax income/(loss) (640) (860) 662 n/m Reported pre-tax income/(loss) (691) (1,165) 911 n/m Adjusted RoRC† (15)% (19)% 13% Reported RoRC† (16)% (26)% 18% Adjusted cost/income ratio 157% 170% 75% Balance Sheet Risk-weighted assets in USD bn 84 86 94 (10)% Leverage exposure in USD bn 324 349 407 (20)% Adjusted net revenues down 58% Capital Markets revenues impacted by substantially lower Equity Capital Markets and Leveraged Finance market activity and included USD 120 mn of mark-to-market losses in Leveraged Finance Reduced non-IG underwriting portfolio to USD 3.6 bn (down 46% vs. 4Q21) Lower Advisory revenues in line with reduced industry-wide deal closings Lower Fixed Income revenues driven by a decline in Securitized Products and Global Credit Products vs. a strong prior year partly offset by higher Macro revenues given increased volatility Lower Equities1 results across Equity Derivatives and Cash trading vs. a strong prior year and reflecting the exit of Prime Services Adjusted operating expenses down 12% due to lower compensation and benefits and revenue-related expenses Adjusted pre-tax loss of USD 640 mn driven by significantly lower client activity and reduced capital usage and risk appetite across businesses Significantly reduced capital usage Risk-weighted assets down 10% and leverage exposure down 20% reflecting reduced business activity
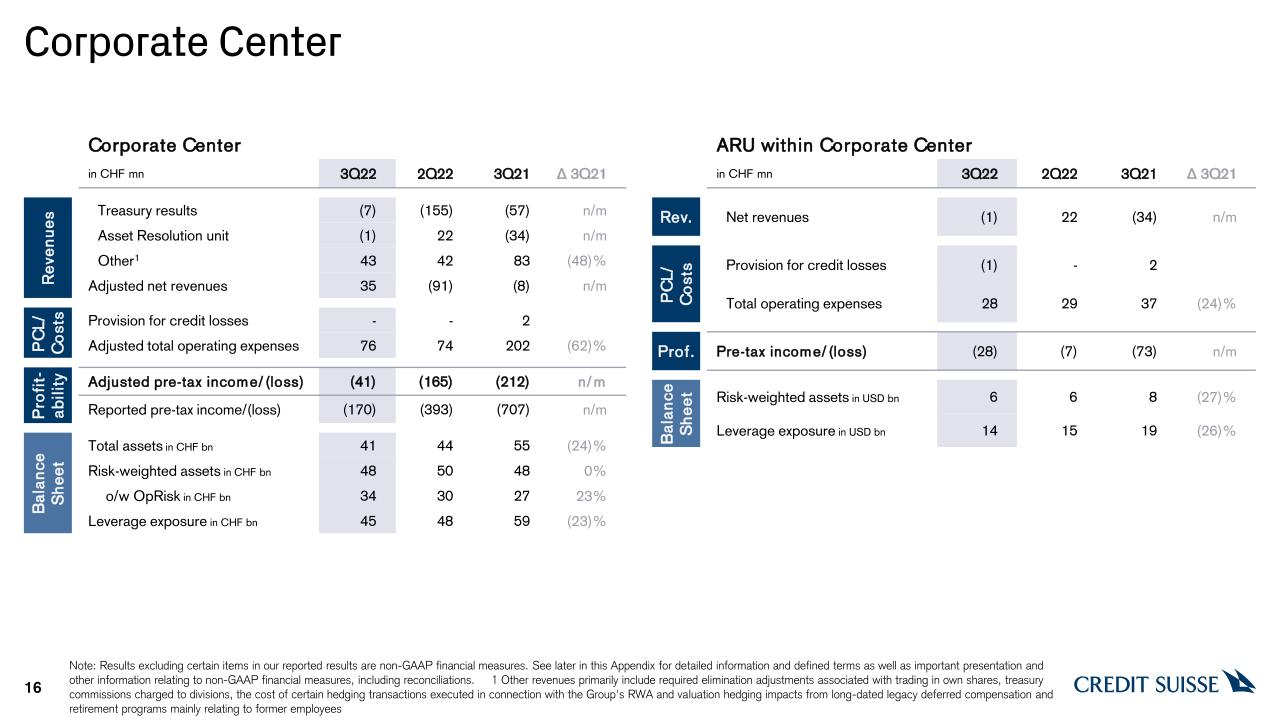
Corporate Center 16 Corporate Center in CHF mn 3Q22 2Q22 3Q21 Δ 3Q21 Revenues Treasury results (7) (155) (57) n/m Asset Resolution unit (1) 22 (34) n/m Other1 43 42 83 (48)% Adjusted net revenues 35 (91) (8) n/m PCL/ Costs Provision for credit losses - - 2 Adjusted total operating expenses 76 74 202 (62)% Profit-ability Adjusted pre-tax income/(loss) (41) (165) (212) n/m Reported pre-tax income/(loss) (170) (393) (707) n/m Balance Sheet Total assets in CHF bn 41 44 55 (24)% Risk-weighted assets in CHF bn 48 50 48 0% o/w OpRisk in CHF bn 34 30 27 23% Leverage exposure in CHF bn 45 48 59 (23)% ARU within Corporate Center in CHF mn 3Q22 2Q22 3Q21 Δ 3Q21 Rev. Net revenues (1) 22 (34) n/m PCL/ Costs Provision for credit losses (1) - 2 Total operating expenses 28 29 37 (24)% Prof. Pre-tax income/(loss) (28) (7) (73) n/m Balance Sheet Risk-weighted assets in USD bn 6 6 8 (27)% Leverage exposure in USD bn 14 15 19 (26)% Note: Results excluding certain items in our reported results are non-GAAP financial measures. See later in this Appendix for detailed information and defined terms as well as important presentation and other information relating to non-GAAP financial measures, including reconciliations. 1 Other revenues primarily include required elimination adjustments associated with trading in own shares, treasury commissions charged to divisions, the cost of certain hedging transactions executed in connection with the Group's RWA and valuation hedging impacts from long-dated legacy deferred compensation and retirement programs mainly relating to former employees
Appendix
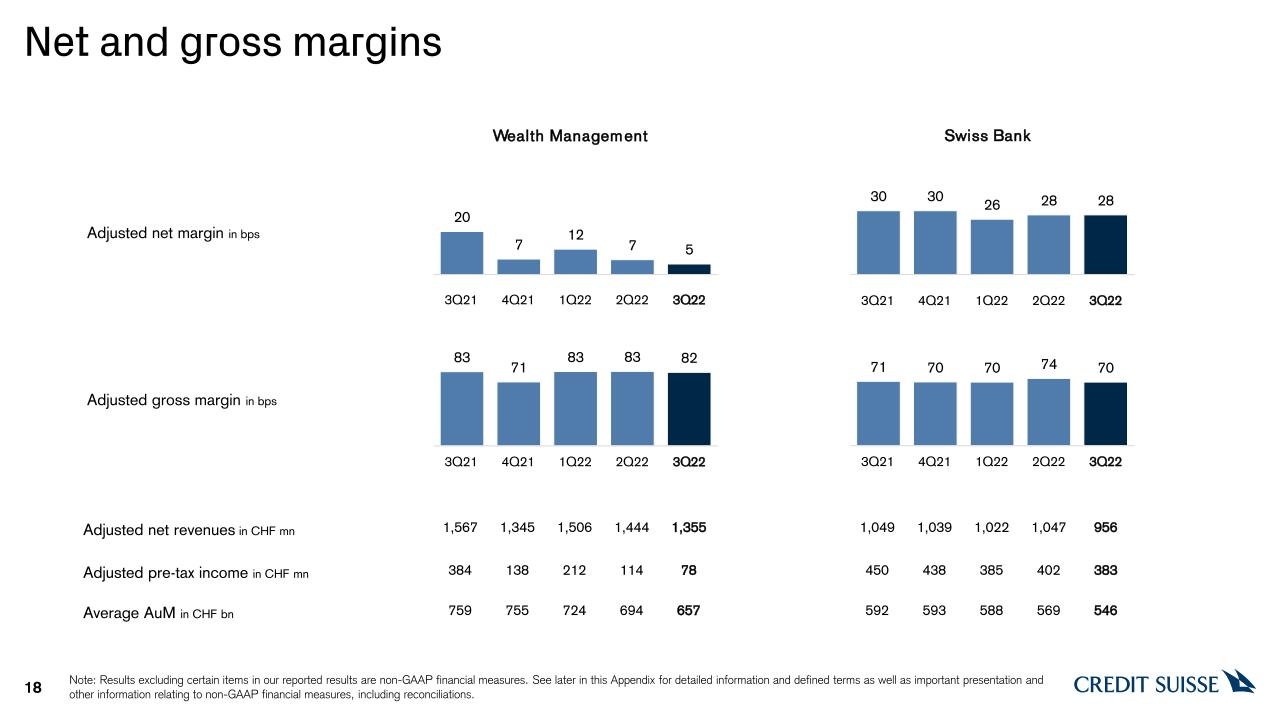
Net and gross margins 18 Adjusted gross margin in bps 3Q22 2Q22 4Q21 3Q21 1Q22 3Q22 2Q22 4Q21 3Q21 1Q22 759 384 Average AuM in CHF bn Adjusted pre-tax income in CHF mn Adjusted net revenues in CHF mn 1,567 1,345 1,506 212 138 755 724 1,355 78 657 1,444 114 694 Wealth Management 3Q22 2Q22 4Q21 3Q21 1Q22 592 450 1,049 1,039 1,022 385 438 593 588 956 383 546 1,047 402 569 Swiss Bank Adjusted net margin in bps 3Q22 2Q22 4Q21 3Q21 1Q22 Note: Results excluding certain items in our reported results are non-GAAP financial measures. See later in this Appendix for detailed information and defined terms as well as important presentation and other information relating to non-GAAP financial measures, including reconciliations.
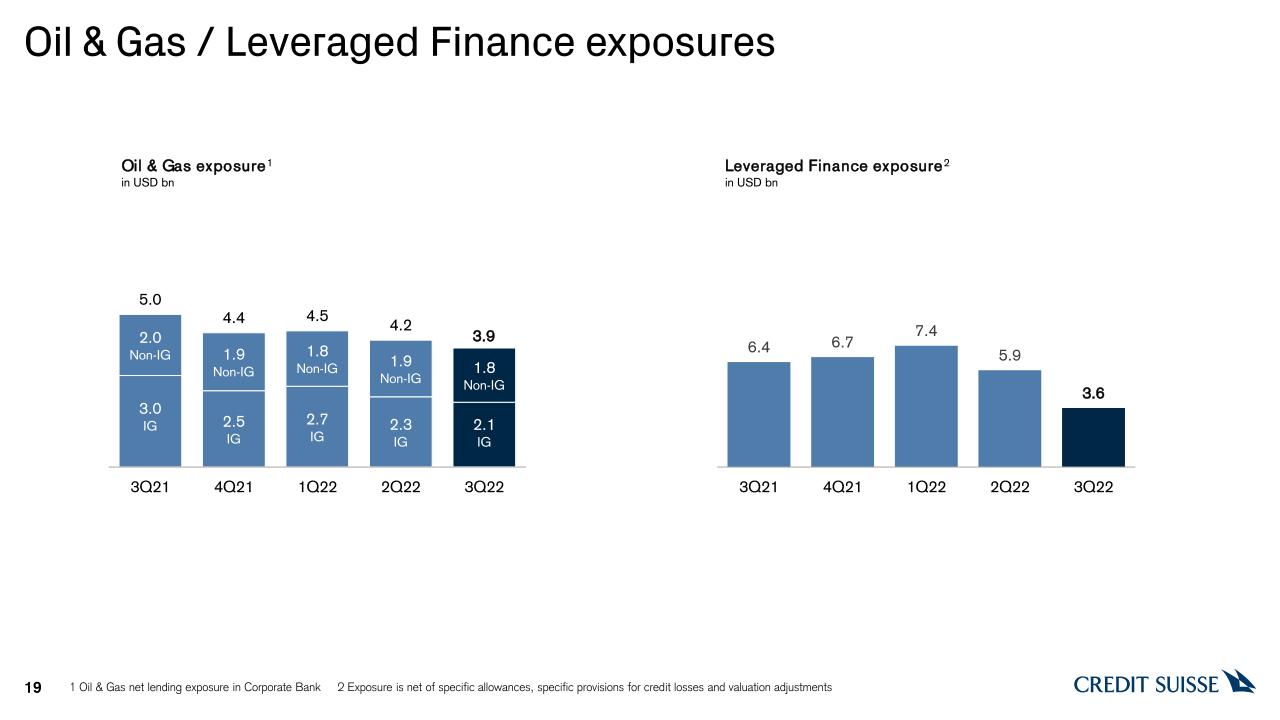
Oil & Gas / Leveraged Finance exposures 19 Oil & Gas exposure1 in USD bn 3.9 1 Oil & Gas net lending exposure in Corporate Bank 2 Exposure is net of specific allowances, specific provisions for credit losses and valuation adjustments Leveraged Finance exposure2 in USD bn
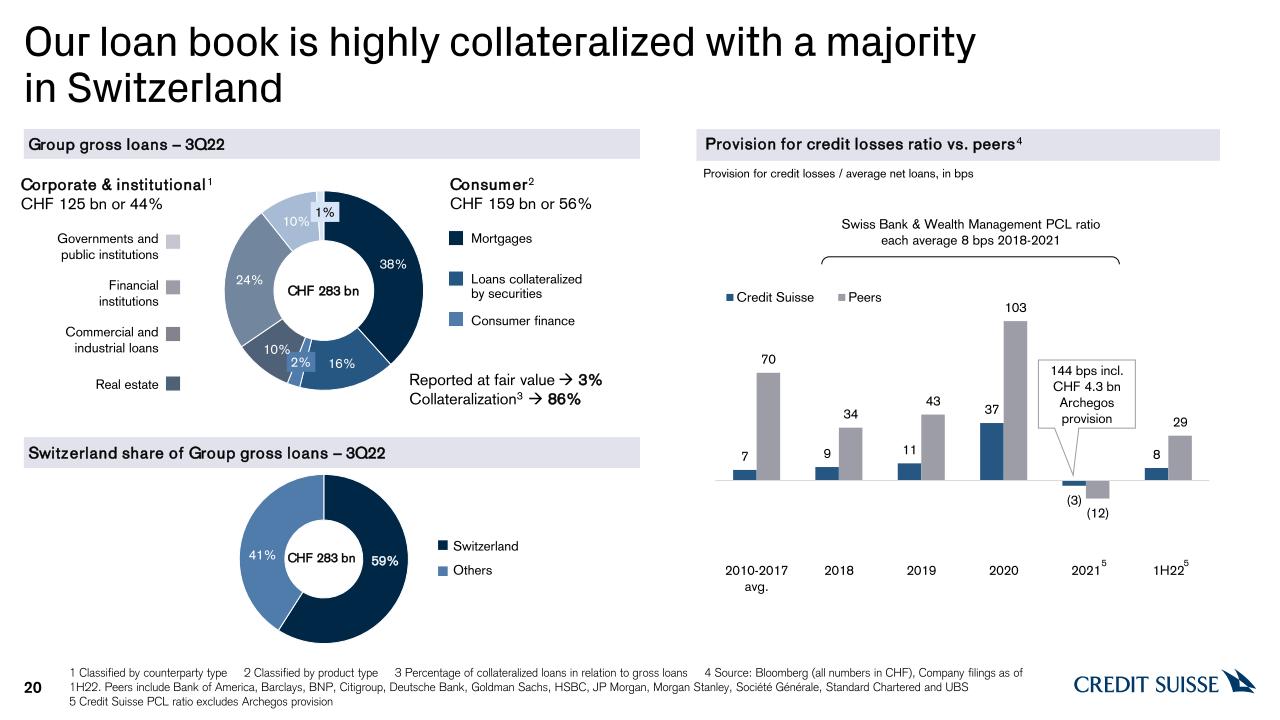
20 Switzerland share of Group gross loans – 3Q22 CHF 283 bn Switzerland Others Consumer finance Loans collateralized by securities Real estate Financial institutions Commercial and industrial loans Governments and public institutions Consumer2CHF 159 bn or 56% Corporate & institutional1 CHF 125 bn or 44% Mortgages CHF 283 bn Group gross loans – 3Q22 144 bps incl. CHF 4.3 bn Archegos provision Swiss Bank & Wealth Management PCL ratio each average 8 bps 2018-2021 Provision for credit losses ratio vs. peers4 Provision for credit losses / average net loans, in bps Our loan book is highly collateralized with a majority in Switzerland Reported at fair value 3% Collateralization3 86% 1 Classified by counterparty type 2 Classified by product type 3 Percentage of collateralized loans in relation to gross loans 4 Source: Bloomberg (all numbers in CHF), Company filings as of 1H22. Peers include Bank of America, Barclays, BNP, Citigroup, Deutsche Bank, Goldman Sachs, HSBC, JP Morgan, Morgan Stanley, Société Générale, Standard Chartered and UBS 5 Credit Suisse PCL ratio excludes Archegos provision 5 5
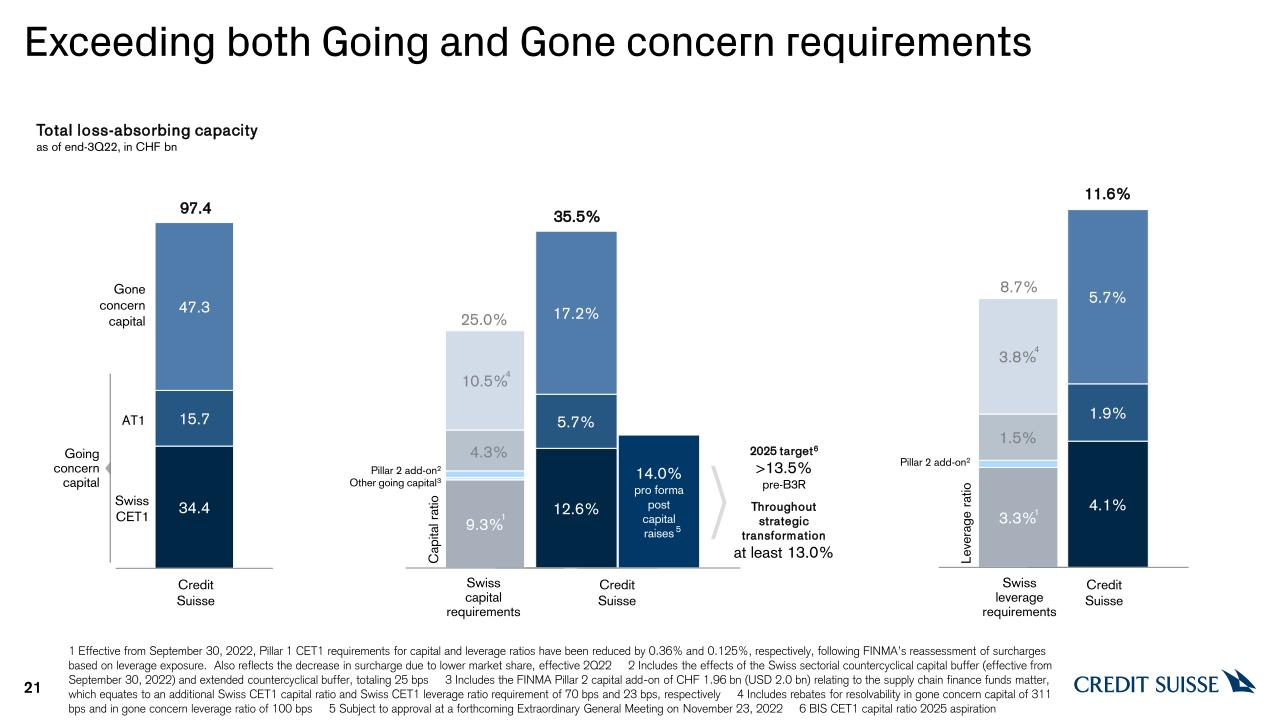
Exceeding both Going and Gone concern requirements 21 Total loss-absorbing capacityas of end-3Q22, in CHF bn 1 Effective from September 30, 2022, Pillar 1 CET1 requirements for capital and leverage ratios have been reduced by 0.36% and 0.125%, respectively, following FINMA’s reassessment of surcharges based on leverage exposure. Also reflects the decrease in surcharge due to lower market share, effective 2Q22 2 Includes the effects of the Swiss sectorial countercyclical capital buffer (effective from September 30, 2022) and extended countercyclical buffer, totaling 25 bps 3 Includes the FINMA Pillar 2 capital add-on of CHF 1.96 bn (USD 2.0 bn) relating to the supply chain finance funds matter, which equates to an additional Swiss CET1 capital ratio and Swiss CET1 leverage ratio requirement of 70 bps and 23 bps, respectively 4 Includes rebates for resolvability in gone concern capital of 311 bps and in gone concern leverage ratio of 100 bps 5 Subject to approval at a forthcoming Extraordinary General Meeting on November 23, 2022 6 BIS CET1 capital ratio 2025 aspiration Swiss CET1 Gone concern capital AT1 Going concern capital 97.4 Credit Suisse Leverage ratio 8.7% 4 11.6% Swiss leverage requirements Pillar 2 add-on2 Credit Suisse 1 Capital ratio 25.0% 4 35.5% Swiss capital requirements Other going capital3 Pillar 2 add-on2 Credit Suisse 1 2025 target6 >13.5% pre-B3R Throughout strategic transformation at least 13.0% 5
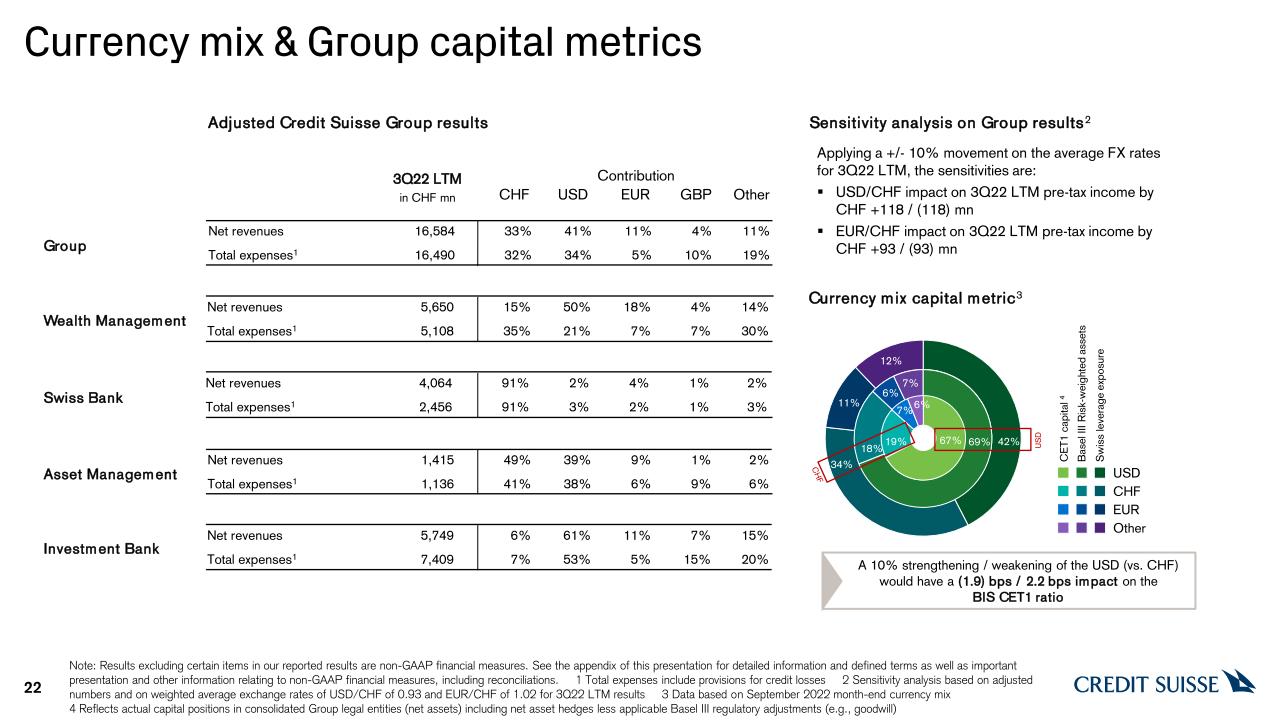
Currency mix & Group capital metrics 22 Adjusted Credit Suisse Group results Applying a +/- 10% movement on the average FX rates for 3Q22 LTM, the sensitivities are: USD/CHF impact on 3Q22 LTM pre-tax income by CHF +118 / (118) mn EUR/CHF impact on 3Q22 LTM pre-tax income by CHF +93 / (93) mn Sensitivity analysis on Group results2 3Q22 LTM in CHF mn Contribution Wealth Management Swiss Bank Asset Management Investment Bank Group CHF USD EUR GBP Other Currency mix capital metric3 A 10% strengthening / weakening of the USD (vs. CHF) would have a (1.9) bps / 2.2 bps impact on the BIS CET1 ratio Basel III Risk-weighted assets Swiss leverage exposure CHF EUR Other USD USD CET1 capital 4 CHF Net revenues 16,584 33% 41% 11% 4% 11% Total expenses1 16,490 32% 34% 5% 10% 19% Net revenues 5,650 15% 50% 18% 4% 14% Total expenses1 5,108 35% 21% 7% 7% 30% Net revenues 4,064 91% 2% 4% 1% 2% Total expenses1 2,456 91% 3% 2% 1% 3% Net revenues 1,415 49% 39% 9% 1% 2% Total expenses1 1,136 41% 38% 6% 9% 6% Net revenues 5,749 6% 61% 11% 7% 15% Total expenses1 7,409 7% 53% 5% 15% 20% Note: Results excluding certain items in our reported results are non-GAAP financial measures. See the appendix of this presentation for detailed information and defined terms as well as important presentation and other information relating to non-GAAP financial measures, including reconciliations. 1 Total expenses include provisions for credit losses 2 Sensitivity analysis based on adjusted numbers and on weighted average exchange rates of USD/CHF of 0.93 and EUR/CHF of 1.02 for 3Q22 LTM results 3 Data based on September 2022 month-end currency mix 4 Reflects actual capital positions in consolidated Group legal entities (net assets) including net asset hedges less applicable Basel III regulatory adjustments (e.g., goodwill)
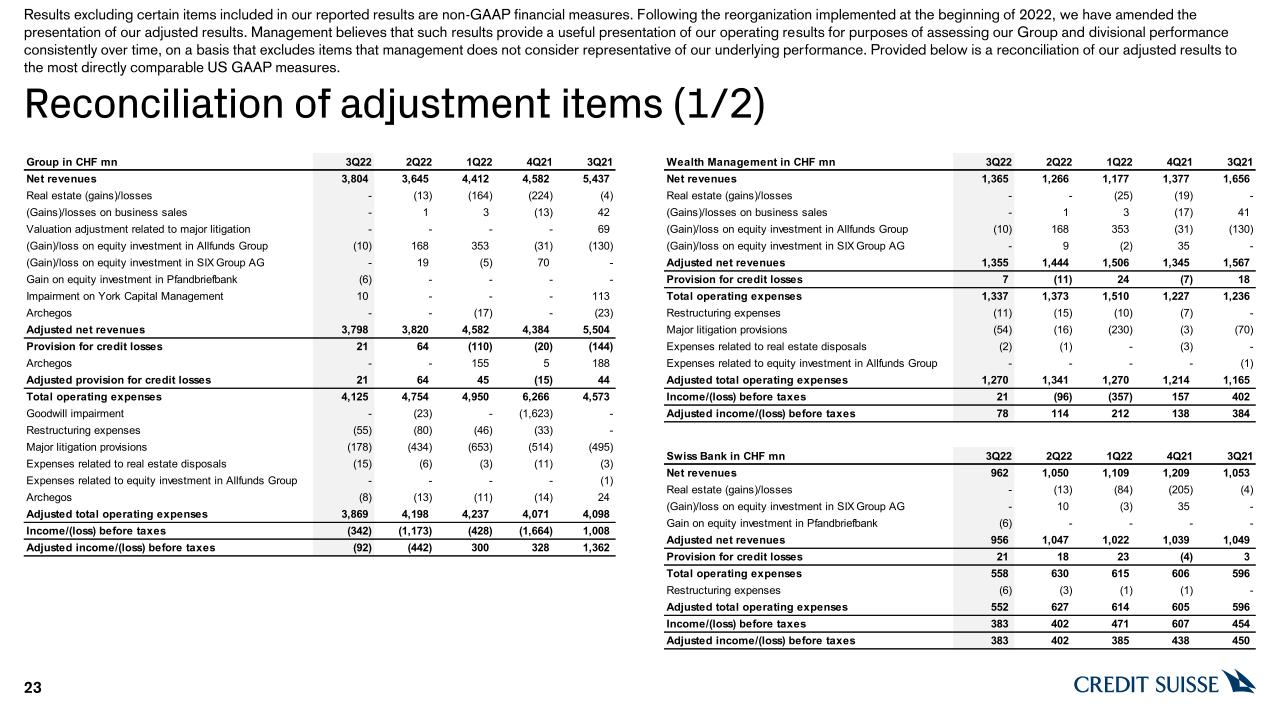
23 Results excluding certain items included in our reported results are non-GAAP financial measures. Following the reorganization implemented at the beginning of 2022, we have amended the presentation of our adjusted results. Management believes that such results provide a useful presentation of our operating results for purposes of assessing our Group and divisional performance consistently over time, on a basis that excludes items that management does not consider representative of our underlying performance. Provided below is a reconciliation of our adjusted results to the most directly comparable US GAAP measures. Reconciliation of adjustment items (1/2)
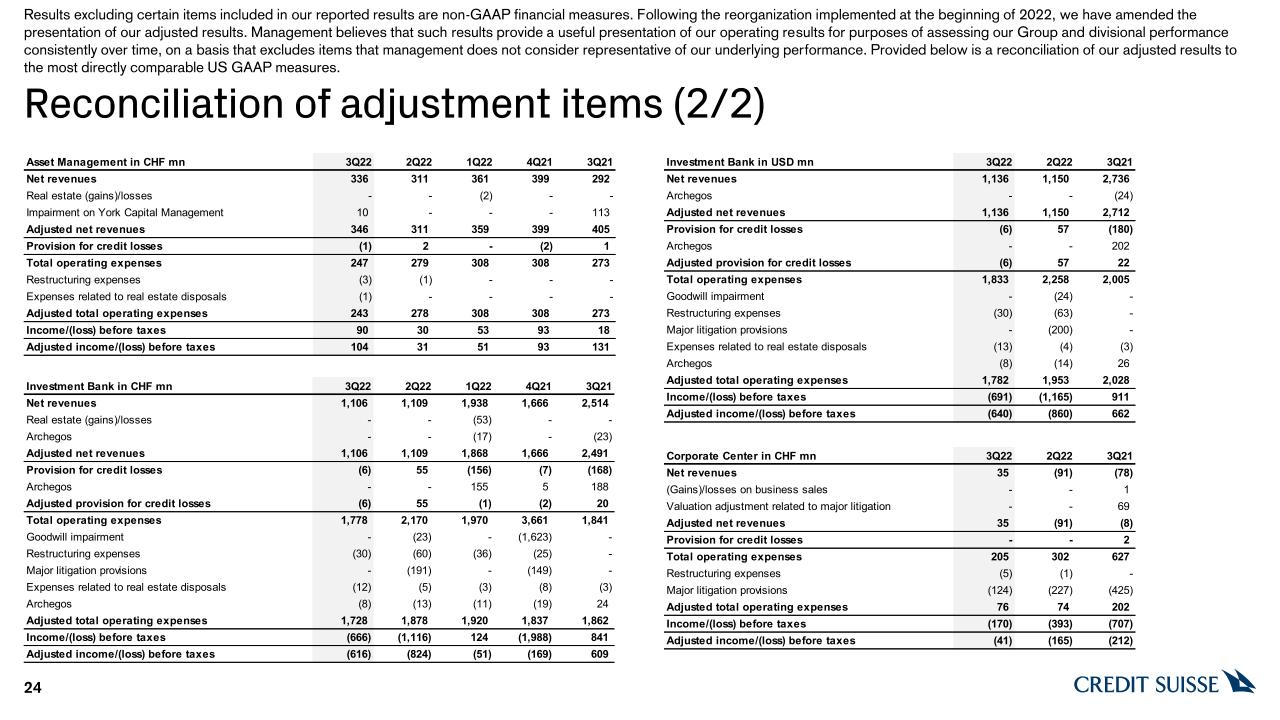
24 Results excluding certain items included in our reported results are non-GAAP financial measures. Following the reorganization implemented at the beginning of 2022, we have amended the presentation of our adjusted results. Management believes that such results provide a useful presentation of our operating results for purposes of assessing our Group and divisional performance consistently over time, on a basis that excludes items that management does not consider representative of our underlying performance. Provided below is a reconciliation of our adjusted results to the most directly comparable US GAAP measures. Reconciliation of adjustment items (2/2)
Notes 25 General notes Throughout this presentation rounding differences may occur Unless otherwise stated, all financial numbers presented and discussed are adjusted. Results excluding certain items included in our reported results are non-GAAP financial measures. All percentage changes and comparative descriptions refer to YoY measurements unless otherwise specified Estimates and assumptions are based on currently available information and beliefs, expectations and opinions of management and include all known facts and decisions as of October 27, 2022. Actual results may differ Unless otherwise noted, all CET1 capital, CET1 ratio, CET1 leverage ratio, Tier 1 leverage ratio, risk-weighted assets and leverage exposure figures shown in these presentations are as of the end of the respective period Gross and net margins are shown in basis points; gross margin = net revenues annualized / average AuM; net margin = pre-tax income annualized / average AuM. Adjusted net margin excluding certain items included in our reported results is calculated using results excluding such items, applying the same methodology Parent means Credit Suisse AG on a standalone basis. All CET1 capital and CET1 ratio figures shown in these presentations for Parent are Swiss capital metrics Specific notes † Regulatory capital is calculated as the average of 13.5% of RWA and 4.25% of leverage exposure and return on regulatory capital, a non-GAAP financial measure, is calculated using income/(loss) after tax and assumes a tax rate of 25% from 2020 onward. For the Investment Bank, return on regulatory capital is based on US dollar denominated numbers. Return on regulatory capital excluding certain items included in our reported results is calculated using results excluding such items, applying the same methodology. Adjusted return on regulatory capital excluding certain items included in our reported results is calculated using results excluding such items, applying the same methodology. ‡ Return on tangible equity, a non-GAAP financial measure, is calculated as annualized net income attributable to shareholders divided by average tangible shareholders’ equity. Tangible shareholders’ equity, a non-GAAP financial measure, is calculated by deducting goodwill and other intangible assets from total shareholders’ equity as presented in our balance sheet. For end-3Q21, tangible shareholders’ equity excluded goodwill of CHF 4,615 mn and other intangible assets of CHF 234 mn from total shareholders’ equity of CHF 44,498 mn as presented in our balance sheet. For end-2Q22, tangible shareholders’ equity excluded goodwill of CHF 2,974 mn and other intangible assets of CHF 340 mn from total shareholders’ equity of CHF 45,842 mn as presented in our balance sheet. For end-3Q22, tangible shareholders’ equity excluded goodwill of CHF 3,018 mn and other intangible assets of CHF 424 mn from total shareholders’ equity of CHF 43,267 mn as presented in our balance sheet. Abbreviations APAC = Asia Pacific; ARU = Asset Resolution Unit; AuM = Assets under Management; BIS = Bank of International Settlements; bps = basis points; CET1 = Common Equity Tier 1; CHF = Swiss Franc; CSSEL = Credit Suisse Securities (Europe) Limited; DTA = deferred tax assets; ECM = Equity Capital Markets; EUR = Euro; FINMA = Swiss Financial Market Supervisory Authority; FX = Foreign Exchange; GAAP = Generally Accepted Accounting Principles; GBP = British Pound; GTS = Global Trading Solutions; HQLA = High-quality Liquid Assets; IB = Investment Bank; IBOR = Interbank offered rate; IG = Investment Grade; IT = Information Technology; LTM = Last twelve months; NII = Net interest income; NNA = Net New Assets; OpRisk = Operational risk; PCL = provision for credit losses; PTI = Pre-tax income; QoQ = Quarter on Quarter; rev. = revenues; RM = Relationship Manager; RMBS = Residential Mortgage-backed Securities; RoRC = Return on Regulatory Capital; RWA = Risk-weighted assets; SCFF = Supply Chain Finance Funds; SNB = Swiss National Bank; USD = United States Dollar; vs. = versus; YoY = Year on year

Signatures
Pursuant to the requirements of the Securities Exchange Act of 1934, the registrants have duly caused this report to be signed on their behalf by the undersigned, thereunto duly authorized.
CREDIT SUISSE GROUP AG and CREDIT SUISSE AG
(Registrants)
Date: October 27, 2022
By:
/s/ Reto Hösli
/s/ Annina Müller
Reto Hösli
Annina Müller.
Director
Vice President