As of December 31, 2007, management believes that the Company’s capital levels met all minimum regulatory requirements and that HBC was considered “well capitalized” under the regulatory framework for prompt corrective action.
To enhance regulatory capital and to provide liquidity, the Company, through unconsolidated subsidiary grantor trusts, issued $23.7 million of trust preferred securities. These securities are currently included in our Tier I capital for purposes of determining the Company’s Tier I and total risk-based capital ratios. The FRB has promulgated a modification of the capital regulations affecting trust preferred securities. Under this modification, effective March 31, 2009, the Company will be required to use a more restrictive formula to determine the amount of trust preferred securities that can be included in regulatory Tier I capital. At that time, the Company will be allowed to include in Tier I capital an amount of trust preferred securities equal to no more than 25% of the sum of all core capital elements, which is generally defined as shareholders’ equity, less accumulated other comprehensive income and goodwill and other intanigble assets, net of any related deferred income tax liability. The regulations currently in effect through December 31, 2008, limit the amount of trust preferred securities that can be included in Tier I capital to 25% of the sum of core capital elements without a deduction for goodwill. Management has determined that the Company’s Tier I capital ratios would remain above the “well-capitalized” level had the modification of the capital regulations been in effect at December 31, 2007. Management expects that the Company’s Tier I capital ratios will be at or above the existing well capitalized levels on March 31, 2009, the first date on which the modified capital regulations must be applied.
Banks are prohibited from paying dividends or management fees to controlling persons or entities if, after making the payment the bank would be “undercapitalized,” that is, the bank fails to meet the required minimum level for any relevant capital measure. Asset growth and branching restrictions apply to “undercapitalized” banks. Banks classified as “undercapitalized” are required to submit acceptable capital plans guaranteed by its holding company, if any. Broad regulatory authority was granted with respect to “significantly undercapitalized” banks, including forced mergers, growth restrictions, ordering new elections for directors, forcing divestiture by its holding company, if any, requiring management changes, and prohibiting the payment of bonuses to senior management. Even more severe restrictions are applicable to “critically undercapitalized” banks, those with capital at or less than 2%. Restrictions for these banks include the appointment of a receiver or conservator. All of the federal banking agencies have promulgated substantially similar regulations to implement this system of prompt corrective action.
A bank, based upon its capital levels, that is classified as “well capitalized,” “adequately capitalized” or “undercapitalized” may be treated as though it were in the next lower capital category if the appropriate federal banking agency, after notice and opportunity for a hearing, determines that an unsafe or unsound condition, or an unsafe or unsound practice, warrants such treatment. At each successive lower capital category, an insured bank is subject to more restrictions. The federal banking agencies, however, may not treat an institution as “critically undercapitalized” unless its capital ratios actually warrant such treatment.
In addition to measures taken under the prompt corrective action provisions, insured banks may be subject to potential enforcement actions by the federal banking agencies for unsafe or unsound practices in conducting their businesses or for violations of any law, rule, regulation or any condition imposed in writing by the agency or any written agreement with the agency. Enforcement actions may include the imposition of a conservator or receiver, the issuance of a cease-and-desist order that can be judicially enforced, the termination of insurance of deposits (in the case of a depository institution), the imposition of civil money penalties, the issuance of directives to increase capital, the issuance of formal and informal agreements, the issuance of removal and prohibition orders against institution-affiliated parties. The enforcement of such actions through injunctions or restraining orders may be based upon a judicial determination that the agency would be harmed if such equitable relief was not granted.
The DFI, as the primary regulator for state-chartered banks, also has a broad range of enforcement measures, from cease and desist powers and the imposition of monetary penalties to the ability to take possession of a bank, including causing its liquidation.
As a result of the Federal Deposit Insurance Reform Act of 2005 (the “FDI Reform Act”) and regulations adopted by the FDIC effective as of November 2, 2006: (i) the BIF and the SAIF have been merged into the Deposit Insurance Fund (the “DIF”); (ii) the $100,000 insurance level has been indexed to reflect inflation (the first adjustment for inflation will be effective January 1, 2011 and thereafter adjustments will occur every 5 years); (iii) deposit insurance coverage for retirement accounts has been increased to $250,000, and will also be subject to adjustment every five years; (iv) banks that historically have capitalized the BIF are entitled to a one-time credit which can be used to off-set premiums otherwise due (this addresses the fact that institutions that have grown rapidly have not had to pay deposit premiums); (v) a cap on the level of the DIF has been imposed and dividends will be paid when the DIF grows beyond a specified threshold; and (vi) the previous risk-based system for assessing premiums has been revised.
Prior to January 1, 2007, the FDIC utilized a risk-based assessment system to set semi-annual insurance premium assessments which categorized banks into risk categories based on two criteria, (1) three capital levels and (2) three supervisory ratings, creating a nine-cell matrix for risk-based assessments. The new assessment system consolidates the previous nine risk categories into four and names them Risk Categories I, II, III and IV. The four new categories will continue to be defined based upon supervisory and capital evaluations. In practice, the subgroup evaluations will generally be based on an institution’s composite CAMELS rating assigned to it by the institution’s federal supervisor at the end of its examination. The CAMELS rating system is based upon an evaluation of the five critical elements of an institution’s operations: Capital adequacy, Asset quality, Management, Earnings, Liquidity, and Sensitivity to risk. This rating system is designed to take into account and reflect all significant financial and operational factors financial institution examiners assess in their evaluation of an institution’s performance. The consolidation creates four new Risk Categories as shown in following table:
The FDIC may terminate its insurance of deposits if it finds that HBC has engaged in unsafe and unsound practices, is in an unsafe or unsound condition to continue operations, or has violated any applicable law, regulation, rule, order or condition imposed by the FDIC.
Money Laundering and Currency Controls. Various federal statutory and regulatory provisions are designed to enhance record-keeping and reporting of currency and foreign transactions. Pursuant to the Bank Secrecy Act, financial institutions must report high levels of currency transactions or face the imposition of civil monetary penalties for reporting violations. The Money Laundering Control Act imposes sanctions, including revocation of federal deposit insurance, for institutions convicted of money laundering.
The International Money Laundering Abatement and Financial Anti-Terrorism Act of 2001 (“IMLAFATA”), a part of the Patriot Act, authorizes the Secretary of the Treasury, in consultation with the heads of other government agencies, to adopt special measures applicable to banks and other financial institutions to enhance record-keeping and reporting requirements for certain financial transactions that are of primary money laundering concern. Among its other provisions, IMLAFATA requires each financial institution to: (i) establish an anti-money laundering program; (ii) establish due diligence policies, procedures and controls with respect to its private banking accounts and correspondent banking accounts involving individuals and certain foreign banks; and (iii) avoid establishing, maintaining, administering, or managing correspondent accounts in the Untied States for, or on behalf of, a foreign bank that does not have a physical presence in any country. In addition, IMLAFATA contains a provision encouraging cooperation among financial institutions, regulatory authorities and law enforcement authorities with respect to individuals, entities and organizations engaged in, or reasonably suspected of engaging in, terrorist acts or money laundering activities.
The Treasury Department’s regulations implementing IMLAFATA mandate that federally-insured banks and other financial institutions establish customer identification programs designed to verify the identity of persons opening new accounts, maintain the records used for verification, and determine whether the person appears on any list of known or suspected terrorists or terrorist organizations.
Community Reinvestment Act (“CRA”). The CRA is intended to encourage insured depository institutions, while operating safely and soundly, to help meet the credit needs of their communities. The CRA specifically directs the federal bank regulatory agencies, in examining insured depository institutions, to assess their record of helping to meet the credit needs of their entire community, including low-and moderate-income neighborhoods, consistent with safe and sound banking practices. The CRA further requires the agencies to take a financial institution’s record of meeting its community credit needs into account when evaluating applications for, among other things, domestic branches, consummating mergers or acquisitions, or holding company formations.
The federal banking agencies have adopted regulations which measure a bank’s compliance with its CRA obligations on a performance-based evaluation system. This system bases CRA ratings on an institution’s actual lending service and investment performance rather than the extent to which the institution conducts needs assessments, documents community outreach or complies with other procedural requirements. The ratings range from “outstanding” to a low of “substantial noncompliance.” HBC had a CRA rating of “satisfactory” as of its most recent regulatory examination.
Other Consumer Protection Laws and Regulations. The bank regulatory agencies are increasingly focusing attention on compliance with consumer protection laws and regulations. Banks have been advised to carefully monitor compliance with various consumer protection laws and regulations. The federal Interagency Task Force on Fair Lending issued a policy statement on discrimination in home mortgage lending describing three methods that federal agencies will use to prove discrimination: overt evidence of discrimination, evidence of disparate treatment, and evidence of disparate impact. In addition to CRA and fair lending requirements, HBC is subject to numerous other federal consumer protection statutes and regulations. Due to heightened regulatory concern related to compliance with consumer protection laws and regulations generally, HBC may incur additional compliance costs or be required to expend additional funds for investments in the local communities it serves.
Environmental Regulation. Federal, state and local laws and regulations regarding the discharge of harmful materials into the environment may have an impact on HBC. Since HBC is not involved in any business that manufactures, uses or transports chemicals, waste, pollutants or toxins that might have a material adverse effect on the environment, HBC’s primary exposure to environmental laws is through its lending activities and through properties or businesses HBC may own, lease or acquire. Based on a general survey of HBC’s loan portfolio, conversations with local appraisers and the type of lending currently and historically done by HBC, management is not aware of any potential liability for hazardous waste contamination that would be reasonably likely to have a material adverse effect on the Company as of December 31, 2007.
Safeguarding of Customer Information and Privacy. The FRB and other bank regulatory agencies have adopted guidelines for safeguarding confidential, personal customer information. These guidelines require financial institutions to create, implement and maintain a comprehensive written information security program designed to ensure the security and confidentiality of customer information, protect against any anticipated threats or hazards to the security or integrity of such information and protect against unauthorized access to or use of such information that could result in substantial harm or inconvenience to any customer. HBC has adopted a customer information security program to comply with such requirements.
Financial institutions are also required to implement policies and procedures regarding the disclosure of nonpublic personal information about consumers to non-affiliated third parties. In general, financial institutions must provide explanations to consumers on policies and procedures regarding the disclosure of such nonpublic personal information, and, except as otherwise required by law, prohibits disclosing such information except as provided in HBC’s policies and procedures. HBC has implemented privacy policies addressing these restrictions which are distributed regularly to all existing and new customers of HBC.
USA Patriot Act of 2001. On October 26, 2001, President Bush signed the USA Patriot Act of 2001 (the “Patriot Act”). Enacted in response to the terrorist attacks in New York, Pennsylvania and Washington, D.C. on September 11, 2001, the Patriot Act is intended to strengthen the ability of U.S. law enforcement agencies and intelligence communities to work cohesively to combat terrorism on a variety of fronts. The impact of the Patriot Act on financial institutions of all kinds has been significant and wide ranging. The Patriot Act substantially enhanced existing anti-money laundering and financial transparency laws, and required appropriate regulatory authorities to adopt rules to promote cooperation among financial institutions, regulators, and law enforcement entities in identifying parties that may be involved in terrorism or money laundering. Under the Patriot Act, financial institutions are subject to prohibitions regarding specified financial transactions and account relationships, as well as enhanced due diligence and “know your customer” standards in their dealings with foreign financial institutions and foreign customers. For example, the enhanced due diligence policies, procedures, and controls generally require financial institutions to take reasonable steps:
| · | to conduct enhanced scrutiny of account relationships to guard against money laundering and report any suspicious transactions; |
| · | to ascertain the identity of the nominal and beneficial owners of, and the source of funds deposited into, each account as needed to guard against money laundering and report any suspicious transactions; |
| · | to ascertain for any foreign bank, the shares of which are not publicly traded, the identity of the owners of the foreign bank, and the nature and extent of the ownership interest of each such owner; and |
| · | to ascertain whether any foreign bank provides correspondent accounts to other foreign banks and, if so, the identity of those foreign banks and related due diligence information. |
The Patriot Act also requires all financial institutions to establish anti money laundering programs, which must include, at minimum:
| · | the development of internal policies, procedures, and controls; |
| · | the designation of a compliance officer; |
| · | an ongoing employee training program; and |
| · | an independent audit function to test the programs. |
HBC has incorporated the requirements of the Patriot Act into its operating procedures, and while these requirements have resulted in an additional time burden the financial impact on HBC is difficult to quantify.
Other Aspects of Banking Law. HBC is also subject to federal statutory and regulatory provisions covering, among other things, security procedures, insider and affiliated party transactions, management interlocks, electronic funds transfers, funds availability, and truth-in-savings.
Other Pending and Proposed Legislation
Other legislative and regulatory initiatives which could affect the Company, HBC and the banking industry in general are pending, and additional initiatives may be proposed or introduced before the United States Congress, the California legislature and other governmental bodies in the future. Such proposals, if enacted, may further alter the structure, regulation and competitive relationship among financial institutions, and may subject the Company or HBC to increased regulation, disclosure and reporting requirements. In addition, the various banking regulatory agencies often adopt new rules and regulations to implement and enforce existing legislation. It cannot be predicted whether, or in what form, any such legislation or regulations may be enacted or the extent to which the business of the Company or HBC would be affected.
At December 31, 2007, the Company had 225 full-time equivalent employees. The Company’s employees are not represented by any union or collective bargaining agreement and the Company believes its employee relations are satisfactory.
In addition to the other information in this Annual Report on Form 10-K, shareholders or prospective investors should carefully consider the following risk factors:
Our profitability is dependent upon the economic conditions of the markets in which we operate. We operate primarily in Santa Clara County, Contra Costa County and Alameda County and, as a result, our financial condition, results of operations and cash flows are subject to changes in the economic conditions in those areas. Our success depends upon the business activity, population, income levels, deposits and real estate activity in these markets. Although our customers’ business and financial interests may extend well beyond these market areas, adverse economic conditions that affect these market areas could reduce our growth rate, affect the ability of our customers to repay their loans to us and generally affect our financial condition and results of operations. While no specific industry concentration is considered significant, our lending operations are located in market areas dependent on technology and real estate industries and their supporting companies. Thus, the Company’s borrowers could be adversely impacted by a downturn in these sectors of the economy which could reduce the demand for loans and adversely impact the borrower’s ability to repay their loans. Because of our geographic concentration, we are less able than other regional or national financial institutions to diversify our credit risks across multiple markets.
Our growth must be effectively managed and our growth strategy involves risks that may impact our net income. As part of our general growth strategy, we may expand into additional communities or attempt to strengthen our position in our current markets to take advantage of expanding market share by opening new offices. To the extent that we undertake additional office openings, we are likely to experience the effects of higher operating expenses relative to operating income from the new operations for a period of time, which may have an adverse effect on our levels of reported net income, return on average equity and return on average assets. Our current growth strategies involve internal growth from our current offices and the addition of new branch offices over time, so that the additional overhead expenses associated with these openings is absorbed prior to opening other new offices.
We must compete with other banks and financial institutions in all lines of business. The banking and financial services business in our market is highly competitive. Our competitors include large regional banks, local community banks, savings institutions, securities and brokerage companies, mortgage companies, insurance companies, finance companies, money market mutual funds, credit unions and other non-bank financial service providers. Many of these competitors are not subject to the same regulatory restrictions we are and are able to provide customers with an alternative to traditional banking services. In addition, there is an increased importance on remaining current on technological changes because such technological advances may diminish the importance of depository institutions and financial intermediaries in the transfer of funds between parties. Increased competition in our market and market changes, such as interest rate changes, force management to better control costs in order to absorb any resultant narrowing of our net interest margin, i.e., the spread between the interest rates earned on investments and loans and the interest rates paid on deposits and other interest-bearing liabilities. Without effective management and cost controls, net income may be adversely impacted by changing conditions and competition.
Interest rates and other conditions impact our results of operations. The earnings of most financial institutions depend largely on the relationship between the cost of funds, primarily deposits and borrowings, and the yield on earning assets such as loans and investment securities. This relationship, known as the interest rate spread, is subject to fluctuation and is affected by economic, regulatory and competitive factors that influence interest rates, the volume and mix of interest-earning assets and interest-bearing liabilities, and the level of non-performing assets. Many of these factors are beyond our control. Fluctuations in interest rates affect the demand of customers for our products and services, and we are subject to interest rate risk to the degree that our interest-bearing liabilities re-price or mature more slowly or more rapidly or on a different basis than our interest-earning assets. Given the current volume, mix, and re-pricing characteristics of our interest-bearing liabilities and interest-earning assets, our interest rate spread is expected to increase slightly in a rising rate environment, and decrease slightly in a declining interest rate scenario. However, there are scenarios where fluctuations in interest rates in either direction could have a negative effect on net income. For example, if funding rates rise faster than asset yields in a rising rate environment (i.e., if basis compression occurs), or if we do not actively manage certain loan index rates in a declining rate environment, we would be negatively impacted.
We must effectively manage our credit risk. There are risks inherent in making any loan, including risks inherent in dealing with individual borrowers, risks of nonpayment, risks resulting from uncertainties as to the future value of collateral and risks resulting from changes in economic and industry conditions. We attempt to minimize our credit risk through prudent loan application approval procedures, careful monitoring of the concentration of our loans within specific industries and periodic independent reviews of outstanding loans by external parties. However, we cannot assure such approval and monitoring procedures will eliminate these credit risks.
Our allowance for loan losses must be managed to provide a sufficient amount to absorb probable incurred losses in our loan portfolio. We maintain our allowance for loan losses at a level considered adequate by management to absorb probable incurred loan losses. The amount of future loan losses is susceptible to changes in economic, operating and other conditions within our market, which may be beyond our control, and such losses may exceed current estimates. At December 31, 2007, our allowance for loan losses as a percentage of total loans was 1.18%. Although management believes that the allowance for loan losses is adequate to absorb probable incurred losses on existing loans, we cannot predict loan losses with certainty, and we cannot assure that our allowance for loan losses will prove sufficient to cover actual loan losses in the future. Loan losses in excess of our allowance may adversely affect our business, financial condition and results of operations. Additional information regarding our allowance for loan losses and the methodology we use to determine an appropriate level of the allowance is located in the “Management’s Discussion and Analysis of Financial Condition and Operations” section included under Item 7 of Part II of this Form 10-K.
Government regulation can result in limitations on our operations. We operate in a highly regulated environment and are subject to supervision and regulation by a number of governmental regulatory agencies, including the Board of Governors of the Federal Reserve System, the California Department of Financial Institutions and the Federal Deposit Insurance Corporation. Regulations adopted by these agencies, which are generally intended to provide protection for depositors and customers rather than for the benefit of shareholders, govern a comprehensive range of matters relating to ownership and control of our shares, our acquisition of other companies and businesses, permissible activities for us to engage in, maintenance of adequate capital levels and other aspects of our operations. These bank regulators possess broad authority to prevent or remedy unsafe or unsound practices or violations of law. The laws and regulations applicable to the banking industry could change at any time and we cannot predict the effects of these changes on our business and profitability. Increased regulation could increase our cost of compliance and adversely affect profitability.
Technology is continually changing and we must effectively implement new technologies. The financial services industry is undergoing rapid technological changes with frequent introductions of new technology-driven products and services. In addition to better serving customers, the effective use of technology increases efficiency and enables us to reduce costs. Our future success will depend in part upon our ability to address the needs of our customers by using technology to provide products and services that will satisfy customer demands for convenience as well as to create additional efficiencies in our operations as we continue to grow and expand our market areas. In order to anticipate and develop new technology, we employ a qualified staff of internal information system specialists and consider this area a core part of our business. We do not develop our own software products, but have been able to respond to technological changes in a timely manner through association with leading technology vendors. We must continue to make substantial investments in technology which may affect our net income.
System failure or breaches of our network security could subject us to increased operating costs as well as litigation and other liabilities. The computer systems and network infrastructure we use could be vulnerable to unforeseen problems. Our operations are dependent upon our ability to protect our computer equipment against damage from physical theft, fire, power loss, telecommunications failure or a similar catastrophic event, as well as from security breaches, denial of service attacks, viruses, worms and other disruptive problems caused by hackers. Any damage or failure that causes an interruption in our operations could have a material adverse effect on our financial condition and results of operations. Computer break-ins and other disruptions could also jeopardize the security of information stored in and transmitted through our computer systems and network infrastructure, which may result in significant liability to us and may cause existing and potential customers to refrain from doing business with us. On an outsourced basis, we engage auditors to conduct extensive auditing and testing for any weaknesses in our systems, controls, firewalls and encryption to reduce the likelihood of any security failures or breaches. Although we, with the help of third-party service providers and auditors, intend to continue to implement security technology and establish operational procedures to prevent such damage, there can be no assurance that these security measures will be successful. In addition, advances in computer capabilities, new discoveries in the field of cryptography or other developments could result in a compromise or breach of the algorithms we and our third-party service providers use to encrypt and protect customer transaction data. A failure of such security measures could have a material adverse affect on our financial condition and results of operations.
Our loan portfolio has a large concentration of real estate loans, which involve risks specific to real estate value. Real estate lending (including commercial and construction) is a large portion of our loan portfolio; however, it is within recently established regulatory guidelines based on a percentage of Tier 2 Capital. These categories constitute $621 million, or approximately 60% of our total loan portfolio as of December 31, 2007. The market value of real estate can fluctuate significantly in a short period of time as a result of market conditions in the geographic area in which the real estate is located. Although a significant portion of such loans is secured by real estate as a secondary form of collateral, adverse developments affecting real estate values in one or more of our markets could increase the credit risk associated with our loan portfolio. Commercial and residential properties have recently experienced a decrease in market value. Commercial real estate lending typically involves larger loan principal amounts and the repayment of the loans generally is dependent, in large part, on sufficient income from the properties securing the loans to cover operating expenses and debt service. Economic events or governmental regulations outside of the control of the borrower or lender could negatively impact the future cash flow and market values of the affected properties. If the loans that are collateralized by real estate become troubled during a time when market conditions are declining or have declined, we may not be able to realize the amount of security that we anticipated at the time of originating the loan, which could cause us to increase our provision for loan losses and adversely affect our operating results and financial condition.
Our construction and development loans are based upon estimates of costs and value associated with the complete project. These estimates may be inaccurate and we may be exposed to more losses on these projects than on other loans. At December 31, 2007, residential construction loans, including land acquisition and development, totaled $216 million or 21%, of our total loan portfolio. Of the $216 million, $157 million was construction loans comprised of $92 million residential and $65 million commercial. The other $59 million of construction loans represent land loans consisting of $46 million residential and $13 million commercial. Construction, land acquisition and development lending involve additional risks because funds are advanced upon the security of the project, which is of uncertain value prior to its completion. Because of the uncertainties inherent in estimating construction costs, as well as the market value of the completed project and the effects of governmental regulation on real property, it is relatively difficult to evaluate accurately the total funds required to complete a project and the related loan-to-value ratio. This process has become more difficult as commercial and residential properties have recently experienced decreases in market value. As a result, speculative construction loans often involve the disbursement of substantial funds with repayment dependent, in part, on the completion of the project and the ability of the borrower to sell the property, rather than the ability of the borrower or guarantor to repay principal and interest. If our appraisal of the value of the completed project proves to be overstated, we may have inadequate security for the repayment of the loan upon completion of construction of the project. If we are forced to foreclose on a project prior to or at completion due to a default, there can be no assurance that we will be able to recover all of the unpaid balance of, and accrued interest on, the loan as well as related foreclosure and holding costs. In addition, we may be required to fund additional amounts to complete the project and may have to hold the property for an unspecified period of time.
Acquisition risks. We have in the past and may in the future seek to grow our business by acquiring other businesses. We cannot predict the frequency, size or timing of our acquisitions, and we typically do not comment publicly on a possible acquisition until we have signed a definitive agreement. There can be no assurance that our acquisitions will have the anticipated positive results, including results related to: the total cost of integration; the time required to complete the integration; the amount of longer-term cost savings; continued growth; or the overall performance of the acquired company or combined entity. Integration of an acquired business can be complex and costly. If we are not able to integrate successfully past or future acquisitions, there is a risk that results of operations could be adversely affected.
Impairment of goodwill or amortizable intangible assets associated with acquisitions would result in a charge to earnings. Goodwill is evaluated for impairment at least annually, and amortizable intangible assets are evaluated for impairment annually or when events or circumstances indicate that the carrying value of those assets may not be recoverable. We may be required to record a charge to the earnings during the period in which any impairment of goodwill or intangibles is determined.
None
The main and executive offices of the Company and Heritage Bank of Commerce are located at 150 Almaden Boulevard in San Jose, California 95113, with branch offices located at 15575 Los Gatos Boulevard in Los Gatos, California 95032, at 387 Diablo Road in Danville, California 94526, at 3077 Stevenson Boulevard in Fremont, California 94538, at 300 Main Street in Pleasanton, California 94566, at 101 Ygnacio Valley Road in Walnut Creek, California 94596, at 18625 Sutter Boulevard in Morgan Hill, California 95037, at 7598 Monterey Street in Gilroy, California 95020, at 4546 El Camino Real in Los Altos, California 94022, at 369 S. San Antonio Road in Los Altos, California 94022, and at 175 E. El Camino Real in Mountain View, California 94040.
Main Offices
The main offices of Heritage Bank of Commerce are located at 150 Almaden Boulevard in San Jose, California on the first three floors in a fifteen-story Class-A type office building. The first two floors, which consist of approximately 22,417 square feet, were subleased from a non-affiliated third party under a lease dated February 12, 1996, as amended. The third floor, which consists of approximately 12,824 square feet, was acquired directly under a lease dated April 13, 2000, as amended. The current monthly rent payment for the third floor is $28,726 and is subject to annual increases of 3% until August 1, 2009, when the monthly rent payment will become fixed at $53,861 until the lease expires on May 31, 2015. The current monthly rent payment for the first two floors is $42,592 until the sublease expires on February 28, 2010; however, after the sublease expires, the first two floors will become part of the direct lease for the third floor, subject to all of the terms and conditions therein, except that the monthly rent will be based on the then prevailing market rate to be determined no later than January 15, 2010. The Company has reserved the right to extend the term of the direct lease for two additional periods of five years each.
In January of 1997, the Company leased approximately 1,255 square feet (referred to as the “Kiosk”) located next to the primary operating area at 150 Almaden Boulevard in San Jose, California to be used for meetings, staff training and marketing events. The current monthly rent payment is $2,811 and is subject to annual increases of 3% until August 1, 2009 when the monthly rent payment will then become fixed at $5,271 until the lease expires on May 31, 2015. The Company has reserved the right to extend the term of the lease for two additional periods of five years each.
Branch Offices
In March of 1999, the Company leased approximately 7,260 square feet in a one-story multi-tenant office building located at 18625 Sutter Boulevard in Morgan Hill, California. The current monthly rent payment is $11,944 and is subject to adjustment every 36 months, based on the Consumer Price Index of the Labor of Statistics as defined in the lease agreement, until the lease expires on October 31, 2014.
In October of 2000, as part of a merger the Company assumed a lease for approximately 7,889 square feet in a two-story multi-tenant shopping center located at 4546 El Camino Real in Los Altos, California. In October of 2001, the lease was amended to return 795 square feet, leaving 7,094 square feet remaining under the lease. The current monthly rent payment is $16,550 until the lease expires on September 30, 2008.
In October of 2000, as part of a merger the Company assumed a lease for approximately 3,471 square feet in a one-story stand-alone office building located at 369 S. San Antonio Road in Los Altos, California. The current monthly rent payment is $17,291 until the lease expires on September 30, 2008. The Company has reserved the right to extend the term of the lease for two additional periods of five years each.
In December of 2003, the Company leased approximately 1,920 square feet in a one-story stand-alone building located in an office complex at 15575 Los Gatos Boulevard in Los Gatos, California. The current monthly rent payment is $4,930 until the lease expires on November 30, 2008. The Company has reserved the right to extend the term of the lease for two additional periods of five years each.
In May of 2006, the Company leased approximately 2,505 square feet on the first floor in a three-story multi-tenant multi-use building located at 7598 Monterey Street in Gilroy, California. The current monthly rent payment is $4,509 and is subject to annual increases of 2% until the lease expires on September 30, 2016. However, as provided for in the lease, the monthly rent payment has been waived until January of 2009 in exchange for a tenant improvement allowance equal to the amount that would have been paid during the free rent period. The Company has reserved the right to extend the term of the lease for two additional periods of five years each.
In April of 2007, the Company leased approximately 3,850 square feet in a four-story multi-tenant office building located at 101 Ygnacio Valley Road in Walnut Creek, California. The current monthly rent payment is $12,705 and is subject to annual increases of 3% until the lease expires on August 15, 2014. The Company has reserved the right to extend the term of the lease for an additional five years.
In June of 2007, as part of the acquisition of Diablo Valley Bank the Company took ownership of an 8,300 square foot one-story commercial building, including the land, located at 387 Diablo Road in Danville, California. The Company also assumed a lease for approximately 4,096 square feet in a stand-alone office building located at 300 Main Street in Pleasanton, California. The current monthly rent payment is $14,983 and is subject to annual increases of 3% until the lease expires on October 31, 2010. The Company has reserved the right to extend the term of the lease for one additional period of seven years.
In August of 2007, the Company extended its lease for approximately 6,590 square feet in a stand-alone office building located at 3077 Stevenson Boulevard in Fremont, California. The current monthly rent payment is $13,180 and is subject to annual increases of 3% until the lease expires on February 28, 2013. The Company has reserved the right to extend the term of the lease for one additional period of five years.
In February 2008, the Company extended its lease for approximately 4,840 square feet in a multi-tenant shopping center located at 175 E. El Camino Real in Mountain View, California. The current monthly rent payment is $13,986 and is subject to annual increases based on the Consumer Price Index of the Bureau of Labor Statistics as defined in the lease agreement. The lease expires on May 30, 2013; however, the Company has reserved the right to extend the term of the lease for one additional period of five years.
Loan Production Offices
In October of 2007, the Company lease approximately 250 square feet of office space for a loan production office located at 740 Fourth Street in Santa Rosa, California 95404. The current monthly rent payment is $1,250 until the lease expires on October 7, 2008.
In November of 2007, the Company lease approximately 243 square feet of office space for a loan production office located at 1440 Broadway in Oakland, California 94612. The current monthly rent payment is $535 until the lease expires on November 18, 2008.
In January of 2008, the Company extended its lease for approximately 225 square feet of office space for a loan production office located at 8788 Elk Grove Boulevard in Elk Grove, California 95624. The current monthly rent payment for this space is $702 until the lease expires on January 31, 2009. The Company has reserved the right to extend the term of the lease for one additional period of one year.
In February of 2008, the Company renewed its lease for a loan production office located at 264 Clovis Avenue in Clovis, California 93612. The lease covers approximately 140 square feet of office space and expires on March 31, 2009. The current monthly rent payment for this space is $500.
For additional information on operating leases and rent expense, refer to Footnote 11 to the Consolidated Financial Statements following “Item 15 – Exhibits and Financial Statement Schedules.”
| ITEM 3 - LEGAL PROCEEDINGS |
The Company is involved in certain legal actions arising from normal business activities. Management, based upon the advice of legal counsel, believes the ultimate resolution of all pending legal actions will not have a material effect on the financial statements of the Company.
| ITEM 4 - SUBMISSION OF MATTERS TO A VOTE OF SECURITY HOLDERS |
There was no submission of matters to a vote of security holders during the fourth quarter of the year ended December 31, 2007.
PART II
| ITEM 5 - MARKET FOR REGISTRANT’S COMMON EQUITY, RELATED STOCKHOLDER MATTERS AND ISSUER PURCHASES OF EQUITY SECURITIES |
Market Information
The Company’s common stock is listed on the NASDAQ Global Select Market under the symbol “HTBK.” Management is aware of the following securities dealers which make a market in the Company’s common stock: Citigroup Global Markets Holdings Inc., Keefe, Brunette & Woods, Inc., Knight Equity Markets, L.P., Merrill Lynch, Morgan Stanley & Company, Inc., RBC Dain Rauscher Inc., UBS Capital Markets, Goldman Sachs & Co., Citadel Derivatives Markets, Howe Barnes Hoefer & Arnett, and E-Trade Capital Markets. These market makers have committed to make a market for the Company’s common stock, although they may discontinue making a market at any time. No assurance can be given that an active trading market will be sustained for the common stock at any time in the future.
The information in the following table for 2007 and 2006 indicates the high and low closing prices for the common stock, based upon information provided by the NASDAQ Global Select Market.
| | | | | | | Dividends Paid |
| Quarter | | High | | Low | | Per Share |
Year ended December 31, 2007: | | | | | | |
| Fourth quarter | | $ | 21.97 | | $ | 15.45 | | $ | 0.08 |
| Third quarter | | $ | 24.47 | | $ | 18.55 | | $ | 0.06 |
| Second quarter | | $ | 25.54 | | $ | 21.72 | | $ | 0.06 |
| First quarter | | $ | 27.34 | | $ | 24.68 | | $ | 0.06 |
| | | | | | | | | | |
Year ended December 31, 2006: | | | | | | | | | |
| Fourth quarter | | $ | 27.25 | | $ | 22.61 | | $ | 0.05 |
| Third quarter | | $ | 24.95 | | $ | 22.55 | | $ | 0.05 |
| Second quarter | | $ | 25.16 | | $ | 22.30 | | $ | 0.05 |
| First quarter | | $ | 25.00 | | $ | 21.08 | | $ | 0.05 |
As of February 15, 2008, there were approximately 2,500 holders of record of common stock. There are no other classes of common equity outstanding.
Dividends
As a bank holding company that currently has no significant assets other than its equity interest in HBC, the Company’s ability to declare dividends depends primarily upon dividends it receives from HBC. HBC’s dividend practices in turn depend upon legal restrictions, HBC’s earnings, financial position, current and anticipated capital requirements, and other factors deemed relevant by HBC’s Board of Directors at that time.
The Company declared a $0.08 per share quarterly cash dividend on January 30, 2008. The dividend will be paid on March 19, 2008, to shareholders of record on February 27, 2008.
The Company paid cash dividends totaling $3.25 million, or $0.26 per share in 2007 representing 23% of 2007 earnings. The Company’s general dividend policy is to pay cash dividends within the range of typical peer payout ratios, provided that such payments do not adversely affect the Company’s financial condition and are not overly restrictive to our growth capacity. However, no assurance can be given that earnings and/or growth expectations in any given year will justify the payment of such a dividend.
During any period in which the Company has deferred payment of interest otherwise due and payable on its subordinated debt securities, it may not make any dividends or distributions with respect to its capital stock (see “Item 7, Management’s Discussion and Analysis of Financial Condition and Results of Operations – Capital Resources”). The ability of HBC’s Board of Directors to declare cash dividends is also subject to statutory and regulatory restrictions which limit the amount available for cash dividends depending upon the earnings, financial condition and cash needs of HBC, as well as general business conditions. Under California banking law, HBC may declare dividends in an amount not exceeding the lesser of its retained earnings or its net income for the last three years (reduced by dividends paid during such period) or, with the prior approval of the California Commissioner of Financial Institutions, in an amount not exceeding the greatest of (i) the retained earnings of HBC, (ii) the net income of HBC for its last fiscal year, or (iii) the net income of HBC for its current fiscal year. The payment of any cash dividends by HBC will depend not only upon HBC’s earnings during a specified period, but also on HBC meeting certain regulatory capital requirements.
The Company’s ability to pay dividends is also limited by state corporation law. The California General Corporation Law prohibits the Company from paying dividends on the Common Stock unless: (i) its retained earnings, immediately prior to the dividend payment, equals or exceeds the amount of the dividend or (ii) immediately after giving effect to the dividend the sum of the Company’s assets (exclusive of goodwill and deferred charges) would be at least equal to 125% of its liabilities (not including deferred taxes, deferred income and other deferred liabilities) and the current assets of the Company would be at least equal to its current liabilities, or, if the average of its earnings before taxes on income and before interest expense for the two preceding fiscal years was less than the average of its interest expense for the two preceding fiscal years, at least equal to 125% of its current liabilities.
Additionally, the FRB’s policy regarding dividends provides that a bank holding company should not pay cash dividends exceeding its net income or which can only be funded in ways that weaken the bank holding company’s financial health, such as by borrowing.
The FDIC and the DFI have authority to prohibit a bank from engaging in business practices that are considered to be unsafe or unsound. Depending upon the financial condition of a bank and upon other factors, the FDIC or DFI could assert that payments of dividends or other payments by a bank might be such an unsafe or unsound practice. The FRB has similar authority with respect to a bank holding company.
For regulatory restrictions on payment of dividends by the Company, see Item 1- “BUSINESS - Regulation and Supervision – The Company - Limitations on Dividends Payments.”
Performance Graph
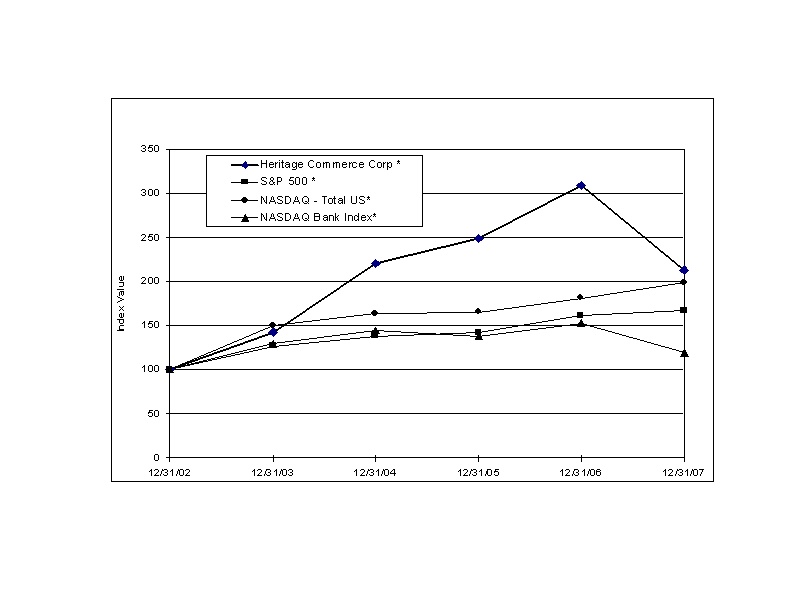
The following graph compares the stock performance of the Company from December 31, 2002 to December 31, 2007, to the performance of several specific industry indices. The performance of the S&P 500 index, Nasdaq Stock Index and Nasdaq Bank Stocks were used as comparisons to the Company’s stock performance. Management believes that a performance comparison to these indices provides meaningful information and has therefore included those comparisons in the following graph.
The following chart compares the stock performance of the Company from December 31, 2002 to December 31, 2007, to the performance of several specific industry indices. The performance of the S&P 500 index, Nasdaq Stock Index and Nasdaq Bank Stocks were used as comparisons to the Company’s stock performance.
| | | Period Ending | |
| Index | 12/31/02 | 12/31/03 | 12/31/04 | 12/31/05 | 12/31/06 | 12/31/07 |
| Heritage Commerce Corp * | 100 | 142 | 220 | 249 | 308 | 213 |
| S&P 500 * | 100 | 126 | 138 | 142 | 161 | 167 |
| NASDAQ - Total US* | 100 | 150 | 163 | 165 | 181 | 199 |
| NASDAQ Bank Index* | 100 | 130 | 144 | 138 | 153 | 119 |
* Source: SNL Financial Bank Information Group – (434) 977-1600
Stock Repurchase Program
In July 2007, the Company’s Board of Directors authorized the purchase of up to $30 million of its common stock, which represents approximately 1.48 million shares, or 11%, of its outstanding shares at the current market price on the date of authorization. The share repurchase authorization is valid through July, 2009. The Company intends to continue to finance the repurchase of shares using its available cash. Shares may be repurchased by the Company in open market purchases or in privately negotiated transactions as permitted under applicable rules and regulations. The repurchase program may be modified, suspended or terminated by the Board of Directors at any time without notice. The extent to which the Company repurchases its shares and the timing of such repurchases will depend upon market conditions and other corporate considerations.
The following table provides information concerning the Company’s repurchase of its common stock during the fourth quarter of 2007, which were all executed in accordance with SEC Rule 10b-18 in 2007.
| | | October | | | November | | | December | |
| Total Shares Purchased | | - | | | | 196,216 | | | | 162,274 | |
| Average Per Share Price | | $ | - | | | $ | 16.57 | | | $ | 18.02 | |
| Number of Shares as Part of Announced Plan or Program | | | - | | | | 196,216 | | | | 162,274 | |
| Maximum Amount Remaining for Purchase Under Plan or Program | | $ | 24,021,440 | | | $ | 20,769,336 | | | $ | 17,844,363 | |
Securities Authorized for Issuance Under Equity Compensation Plan
The information concerning our equity compensation plans is incorporated by reference herein to the section of the proxy statement entitled “Equity Compensation and Plan Information.”
ITEM 6 - SELECTED FINANCIAL DATA
The following table presents a summary of selected financial information that should be read in conjunction with the Company’s consolidated financial statements and notes thereto included under Item 8 - “FINANCIAL STATEMENTS AND SUPPLEMENTARY DATA.”
SELECTED FINANCIAL DATA
| | | AT OR FOR YEAR ENDED DECEMBER 31, | |
| (Dollars in thousands, except per share amounts and ratios) | | 2007 | | | 2006 | | | 2005 | | | 2004 | | | 2003 | |
| INCOME STATEMENT DATA: | | | | | | | | | | | | | | | |
| Interest income | | $ | 78,712 | | | $ | 72,957 | | | $ | 63,756 | | | $ | 50,685 | | | $ | 46,447 | |
| Interest expense | | | 27,012 | | | | 22,525 | | | | 15,907 | | | | 9,648 | | | | 10,003 | |
| Net interest income before provision for loan losses | | | 51,700 | | | | 50,432 | | | | 47,849 | | | | 41,037 | | | | 36,444 | |
| Provision for loan losses | | | (11 | ) | | | (503 | ) | | | 313 | | | | 666 | | | | 2,900 | |
| Net interest income after provision for loan losses | | | 51,711 | | | | 50,935 | | | | 47,536 | | | | 40,371 | | | | 33,544 | |
| Noninterest income | | | 8,052 | | | | 9,840 | | | | 9,423 | | | | 10,544 | | | | 10,812 | |
| Noninterest expense | | | 37,530 | | | | 34,268 | | | | 35,233 | | | | 39,238 | | | | 33,084 | |
| Income before income taxes | | | 22,233 | | | | 26,507 | | | | 21,726 | | | | 11,677 | | | | 11,272 | |
| Income tax expense | | | 8,137 | | | | 9,237 | | | | 7,280 | | | | 3,199 | | | | 3,496 | |
| Net income | | $ | 14,096 | | | $ | 17,270 | | | $ | 14,446 | | | $ | 8,478 | | | $ | 7,776 | |
| | | | | | | | | | | | | | | | | | | | | |
| PER SHARE DATA: | | | | | | | | | | | | | | | | | | | | |
Basic net income (1) | | $ | 1.14 | | | $ | 1.47 | | | $ | 1.22 | | | $ | 0.73 | | | $ | 0.69 | |
Diluted net income (2) | | $ | 1.12 | | | $ | 1.44 | | | $ | 1.19 | | | $ | 0.71 | | | $ | 0.67 | |
Book value (3) | | $ | 12.90 | | | $ | 10.54 | | | $ | 9.45 | | | $ | 8.45 | | | $ | 7.86 | |
| Tangible book value per share | | $ | 9.20 | | | $ | 10.54 | | | $ | 9.45 | | | $ | 8.45 | | | $ | 7.86 | |
| Weighted average number of shares outstanding - basic | | | 12,398,270 | | | | 11,725,671 | | | | 11,795,635 | | | | 11,559,155 | | | | 11,221,232 | |
| Weighted average number of shares outstanding - diluted | | | 12,536,740 | | | | 11,956,433 | | | | 12,107,230 | | | | 11,986,856 | | | | 11,572,588 | |
| Shares outstanding at period end | | | 12,774,926 | | | | 11,656,943 | | | | 11,807,649 | | | | 11,669,837 | | | | 11,381,037 | |
| | | | | | | | | | | | | | | | | | | | | |
| BALANCE SHEET DATA: | | | | | | | | | | | | | | | | | | | | |
| Securities | | $ | 135,402 | | | $ | 172,298 | | | $ | 198,495 | | | $ | 232,809 | | | $ | 153,473 | |
| Net loans | | $ | 1,024,247 | | | $ | 699,957 | | | $ | 669,901 | | | $ | 708,611 | | | $ | 636,221 | |
| Allowance for loan losses | | $ | 12,218 | | | $ | 9,279 | | | $ | 10,224 | | | $ | 12,497 | | | $ | 13,451 | |
| Goodwill and other intangible assets | | $ | 48,153 | | | $ | - | | | $ | - | | | $ | - | | | $ | - | |
| Total assets | | $ | 1,347,472 | | | $ | 1,037,138 | | | $ | 1,130,509 | | | $ | 1,108,173 | | | $ | 1,005,982 | |
| Total deposits | | $ | 1,064,226 | | | $ | 846,593 | | | $ | 939,759 | | | $ | 918,535 | | | $ | 835,410 | |
| Securities sold under agreement to repurchase | | $ | 10,900 | | | $ | 21,800 | | | $ | 32,700 | | | $ | 47,800 | | | $ | 43,600 | |
| Short-term borrowings | | $ | 60,000 | | | $ | - | | | $ | - | | | $ | - | | | $ | - | |
| Notes payable to subsidiary grantor trusts | | $ | 23,702 | | | $ | 23,702 | | | $ | 23,702 | | | $ | 23,702 | | | $ | 23,702 | |
| Total shareholders' equity | | $ | 164,824 | | | $ | 122,820 | | | $ | 111,617 | | | $ | 98,579 | | | $ | 89,485 | |
| | | | | | | | | | | | | | | | | | | | | |
SELECTED PERFORMANCE RATIOS: (4) | | | | | | | | | | | | | | | | | | | | |
| Return on average assets | | | 1.18 | % | | | 1.57 | % | | | 1.27 | % | | | 0.80 | % | | | 0.81 | % |
| Return on average tangible assets | | | 1.21 | % | | | 1.57 | % | | | 1.27 | % | | | 0.80 | % | | | 0.81 | % |
| Return on average equity | | | 9.47 | % | | | 14.62 | % | | | 13.73 | % | | | 9.04 | % | | | 9.04 | % |
| Return on average tangible equity | | | 11.43 | % | | | 14.62 | % | | | 13.73 | % | | | 9.04 | % | | | 9.04 | % |
| Net interest margin | | | 4.86 | % | | | 5.06 | % | | | 4.58 | % | | | 4.22 | % | | | 4.15 | % |
| Efficiency ratio | | | 62.81 | % | | | 56.86 | % | | | 61.52 | % | | | 76.07 | % | | | 70.01 | % |
| Average net loans (excludes loans held for sale) | | | | | | | | | | | | | | | | | | | | |
| as a percentage of average deposits | | | 84.06 | % | | | 77.61 | % | | | 73.55 | % | | | 77.11 | % | | | 77.21 | % |
| Average total shareholders' equity as a | | | | | | | | | | | | | | | | | | | | |
| percentage of average total assets | | | 12.47 | % | | | 10.75 | % | | | 9.25 | % | | | 8.80 | % | | | 8.95 | % |
| | | | | | | | | | | | | | | | | | | | | |
| SELECTED ASSET QUALITY RATIOS: | | | | | | | | | | | | | | | | | | | | |
| Net loan charge-offs (recoveries) to average loans | | | (0.10) | % | | | 0.06 | % | | | 0.28 | % | | | 0.19 | % | | | 0.41 | % |
| Allowance for loan losses to total loans | | | 1.18 | % | | | 1.31 | % | | | 1.51 | % | | | 1.73 | % | | | 2.03 | % |
| | | | | | | | | | | | | | | | | | | | | |
| CAPITAL RATIOS: | | | | | | | | | | | | | | | | | | | | |
| Tier 1 risk-based | | | 11.5 | % | | | 17.3 | % | | | 14.2 | % | | | 13.0 | % | | | 13.3 | % |
| Total risk-based | | | 12.5 | % | | | 18.4 | % | | | 15.3 | % | | | 14.3 | % | | | 14.5 | % |
| Leverage | | | 11.1 | % | | | 13.6 | % | | | 11.6 | % | | | 10.9 | % | | | 11.1 | % |
Notes:
| 1) | Represents net income divided by the average number of shares of common stock outstanding for the respective period. |
| 2) | Represents net income divided by the average number of shares of common stock and common stock-equivalents outstanding for the respective period. |
| 3) | Represents shareholders’ equity divided by the number of shares of common stock outstanding at the end of the period indicated. |
| 4) | Average balances used in this table and throughout this Annual Report are based on daily averages. |
| ITEM 7 - MANAGEMENT’S DISCUSSION AND ANALYSIS OF FINANCIAL CONDITION AND RESULTS OF OPERATIONS |
Executive Summary
This summary is intended to identify the most important matters on which management focuses when it evaluates the financial condition and performance of the Company. When evaluating financial condition and performance, management looks at certain key metrics and measures. The Company’s evaluation includes comparisons with peer group financial institutions and with its own performance objectives established in the internal planning process.
The primary activity of the Company is commercial banking. The Company’s operations are located entirely in the southern and eastern regions of the general San Francisco Bay area of California in the counties of Santa Clara, Alameda and Contra Costa. The largest city in this area is San Jose and the Company’s market includes the headquarters of a number of technology based companies in the region known commonly as Silicon Valley. The Company’s customers are primarily closely held businesses and professionals.
Performance Overview
Net income in 2007 was $14.1 million, a decrease of $3.2 million, or 18%, compared to $17.3 million in 2006. Net income in 2006 was $2.8 million higher than 2005 net income of $14.4 million. Net income per diluted share was $1.12 for 2007, as compared to $1.44 during 2006 and $1.19 in 2005. The Company’s Return on Average Assets was 1.18% and Return on Average Equity was 9.47% in 2007, as compared to 1.57% and 14.62%, respectively for 2006, and 1.27% and 13.73%, respectively in 2005. The Company’s return on average tangible assets and return on average tangible equity were 1.21% and 11.43%, respectively, for 2007, compared to 1.57% and 14.62%, respectively, for 2006, and 1.27% and 13.73%, respectively, for 2005.
The following are major factors impacting the Company’s results of operations in recent years:
| · | Net interest income increased by $1.3 million, or 3%, in 2007, and by $3.4 million, or 7%, in 2006. The growth in 2007 was largely driven by an increase in average interest earning assets and the growth in 2006 was largely driven by an increased rate on earning assets. |
| · | Noninterest income decreased by 18% in 2007 from 2006. The Company’s changed its strategy regarding its SBA loan business. The Company is now retaining most of its SBA production in lieu of selling loans. The Company’s noninterest income declined in 2007 as a result of the change in strategy. |
| · | The efficiency ratio was 62.81% in 2007, compared to 56.86% in 2006 and 61.52% in 2005. The higher efficiency ratio in 2007 reflects the additional senior level bankers and a new SBA team the Company hired during 2007 and costs associated with the acquisition of Diablo Valley Bank. |
| · | Noninterest expense increased to $37.5 million in 2007, compared to $34.3 million in 2006 and $35.2 million in 2005. Charges relative to the Diablo Valley Bank acquisition accounted for $1.3 million of the increase, including $352,000 for intangible asset amortization, $400,000 of consulting agreement expense, $40,000 of non-compete agreement expense, and compensation expense of $461,000 for employees who are no longer with the Company. Compensation expense increased 9% in 2007 compared to a year ago. The increase in compensation expense was primarily due to the merger with Diablo Valley Bank, the addition of senior level bankers and hiring of a new SBA team during 2007. Up front costs associated with the hiring of new bankers for the East Bay expansion and SBA team totaled $970,000 in 2007. |
| · | A credit provision for loan losses of $11,000 was recorded in 2007, compared to a credit provision of $503,000 in 2006 and a provision of $313,000 in 2005. This is the result of a general improvement in credit quality and recoveries in 2007 of loans previously charged off. |
The following are important factors in understanding our current financial condition and liquidity position:
| · | Total assets increased $310 million, or 30%, to $1.35 billion at the end of 2007 from $1.04 billion at the end of 2006. The increase in 2007 was primarily due to the acquisition of Diablo Valley Bank. |
| · | Total loans increased $327 million, or 46%, to $1.04 billion at the end of 2007. Total loans were $709 million at the end of 2006. The increase in 2007 was primarily due to the acquisition of Diablo Valley Bank and the addition of several experienced loan producers hired in the fourth quarter. |
| · | Nonperforming assets remained at nominal levels. Nonperforming assets were $4.5 million, or 0.34% of total assets, at December 31, 2007, compared to $4.3 million, or 0.42% of total assets, at December 31, 2006, and $3.7 million, or 0.32% of total assets, at December 31, 2005. Approximately $2.4 million of the nonperforming loans at year end of 2007 were acquired in the acquisition of Diablo Valley Bank. |
| · | Total deposits increased $218 million, or 26%, to $1.06 billion at the end of 2007 from $847 million at the end of 2006. The increase in 2007 was primarily due to the acquisition of Diablo Valley Bank. |
Deposits
Growth in deposits is an important metric management uses to measure market share. The Company’s depositors are predominately located in its primary market area. Depending on loan demand and other funding requirements, the Company will occasionally obtain deposits from wholesale sources including deposit brokers. The Company had $40 million in brokered deposits at December 31, 2007. The Company also seeks deposits from title insurance companies and real estate exchange facilitators. The Company has a policy to monitor all deposits that may be sensitive to interest rate changes to help assure that liquidity risk does not become excessive due to concentrations. The Company’s acquisition of Diablo Valley Bank during 2007 resulted a significant growth in deposits and expanded the Company’s market area.
Lending
Our lending business originates primarily through our branch offices located in our primary market. The economy in our primary service area continued to stabilize in 2007. Commercial loans increased from December 31, 2006 due to increased marketing focus and the acquisition of Diablo Valley Bank. Commercial real estate mortgage loans slightly increased from December 31, 2006 primarily due to general improvements in commercial income property markets and the Diablo Valley Bank acquisition. We will continue to use and improve existing products to expand market share at current locations, including our new branch in Walnut Creek, California that opened in 2007.
Net Interest Income
The management of interest income and interest expense is fundamental to the performance of the Company. Net interest income, the difference between interest income and interest expense, is the largest component of the Company’s total revenue. Management closely monitors both total net interest income and the net interest margin (net interest income divided by average earning assets).
Because of its focus on commercial lending to closely held businesses, the Company will continue to have a high percentage of floating rate loans and other assets. Given the current volume, mix and repricing characteristics of our interest-bearing liabilities and interest-earning assets, we believe our interest rate spread is expected to increase in a rising rate environment, and decrease in a declining interest rate scenario.
During the fourth quarter of 2007, the Board of Governors of the Federal Reserve System reduced short-term interest rates by 50 basis points. This decrease in short-term rates immediately affected the rates applicable to the majority of the Company’s loans. While the decrease in interest rates also lowered the cost of interest bearing deposits, which represent the Company’s primary funding source, these deposits tend to reprice more slowly than floating rate loans. The Federal Reserve reduced short-term interest rates by another 125 points in January 2008. Reductions in short-term interest rates can be expected to negatively affect the Company’s net interest margin and net interest income, at least in the near term.
The Company, through its asset and liability policies and practices, seeks to maximize net interest income without exposing the Company to an excessive level of interest rate risk. Interest rate risk is managed by monitoring the pricing, maturity and repricing options of all classes of interest bearing assets and liabilities. This is discussed in more detail under Liquidity and Asset/Liability Management.
Management of Credit Risk
Because of its focus on business banking, loans to single borrowing entities are often larger than would be found in a more consumer oriented bank with many smaller, more homogenous loans. The average size of its relationships makes the Company more susceptible to larger losses. As a result of this concentration of larger risks, the Company has maintained an allowance for loan losses which is substantially higher than would be indicated by its actual historic loss experience. The Company had a reverse provision for loan losses each of the last two years because of a general improvement in credit quality and net recoveries in 2007 of loans previously charged off. A complete discussion of the management of credit risk appears under Provision for Loan Losses and Allowance for Loan Losses.
Noninterest Income
While net interest income remains the largest single component of total revenues, noninterest income is an important component. Prior to the third quarter of 2007, a significant percentage of the Company’s noninterest income was associated with its SBA lending activity, as gains on the sale of loans sold in the secondary market and servicing income from loans sold in the secondary market with servicing rights retained. However, beginning in the third quarter of 2007, the Company started retaining new SBA loans in lieu of selling. As a result, the Company’s noninterest income declined in 2007 compared to 2006. SBA loan activity includes the origination, sale, and servicing of loans guaranteed by the U.S. Department of Agriculture. Noninterest income associated with SBA activity increased each year from 2003 through 2006.
Noninterest Expense
Management considers the control of operating expenses to be a critical element of the Company’s performance. Prior to 2007 the Company had undertaken several initiatives to reduce its noninterest expense and improve its efficiency, including a reduction in staff and the consolidation of operations under the common Heritage Bank brand and restructuring each department. In 2007, however, the Company’s efficiency ratio was significantly impacted by the acquisition of Diablo Valley Bank, the hiring of additional experienced bankers and a new SBA team. Management monitors progress in reducing expense through the review of the Company’s efficiency ratio. The Company’s efficiency ratio was 62.81% in 2007 compared with 56.86% in 2006, and 61.52% in 2005.
In the fourth quarter of 2005, the Company recognized additional expenses of $1.05 million, representing the present value of term insurance for participants in the Company’s Supplemental Executive Retirement Plan, substantially all of whom have split dollar life insurance agreements with the Company. Typically, under the split dollar life insurance agreements, the insureds’ beneficiary receives 80% of the excess of the death benefit over the cash surrender value of the policy. This accounting adjustment was undertaken after the Company’s review of split dollar life insurance agreements and recognition that the Company has contractually agreed with each participant to provide a benefit. This charge reflected the term insurance cost for all insureds.
Beginning in 2008, the Company will be impacted by the FASB Emerging Issues Task Force Issue No. 06-4, Accounting for Deferred Compensation and Postretirement Benefit Aspects of Endorsement Split-Dollar Life Insurance Arrangements. This issue requires that a liability be recorded during the service period when a split-dollar life insurance agreement continues after participants’ employment or retirement. With its existing split dollar life insurance agreements, the Company has contractually agreed with each participant to provide life insurance on an ongoing basis. Therefore, the Company would have to obtain term insurance for the remainder of the participant’s life, or a comparable death benefit if the respective life insurance policy were ever terminated. The required accrued liability will be based on either the post-employment benefit cost for the continuing life insurance or on the future death benefit depending on the contractual terms of the underlying agreement.
In September 2006, FASB issued Statement 158, Employers’ Accounting for Defined Benefit Pension and Other Postretirement Plans – an amendment of FASB Statements No. 87, 88, 106 and 132 (R). Adoption of Statement 158 did not affect the Company’s financial statements since the Company’s supplemental retirement plan has no assets and the liability for benefits is measured as of December 31 and recorded on the Company’s balance sheet.
Capital Management and Share Repurchases
Heritage Commerce Corp and Heritage Bank of Commerce meet the regulatory definition of “well capitalized” at December 31, 2007. As part of its asset and liability process, the Company continually assesses its capital position to take into consideration growth, expected earnings, risk profile and potential corporate activities that it may choose to pursue. As a part of this process, the Company determined in the second quarter of 2004 that its capital levels were higher than necessary. To adjust capital to levels consistent with its view of current market conditions, the Company commenced a stock repurchase plan of $10 million in June 2004. This repurchase program was completed at the end of third quarter of 2005. On February 7, 2006, the Board of Directors authorized the repurchase of up to an additional $10 million of common stock through June 30, 2007. This repurchase program was completed at the end of second quarter of 2007. On July, 2007, the Board of Directors authorized to purchase up to $30 million of common stock through July, 2009.
In 2006, the Company initiated the payment of quarterly cash dividends. The Company paid cash dividends totaling $3.25 million, or $0.26 per share in 2007, representing 23% of 2007 earnings. The Company’s general policy is to pay cash dividends within the range of typical peer payout ratios, provided that such payments do not adversely affect our financial condition and are not overly restrictive to our growth capacity. On January 30, 2008, the Company declared an $0.08 per share quarterly cash dividend. The dividend will be paid on March 19, 2008, to shareholders of record on February 27, 2008.
The Company earns income from two primary sources. The first is net interest income, which is interest income generated by earning assets less interest expense on interest-bearing liabilities. The second is non-interest income, which primarily consists of loan servicing fees, customer service charges and fees, and increase in cash surrender value of life insurance. The majority of the Company’s non-interest expenses are operating costs that relate to providing a full range of banking services to our customers.
Net Interest Income and Net Interest Margin
In 2007, net interest income was $51.7 million, an increase of 3% compared to $50.4 million in 2006. The level of net interest income depends on several factors in combination, including growth in earning assets, yields on earning assets, the cost of interest-bearing liabilities, the relative volumes of earning assets and interest-bearing liabilities, and the mix of products which comprise the Company’s earning assets, deposits, and other interest-bearing liabilities. To maintain its net interest margin, the Company must manage the relationship between interest earned and paid.
The following Distribution, Rate and Yield table presents for each of the past three years, the average amounts outstanding for the major categories of the Company’s balance sheet, the average interest rates earned or paid thereon, and the resulting net interest margin on average interest earning assets for the periods indicated. Average balances are based on daily averages.
Distribution, Rate and Yield
| | | Year Ended December 31, | |
| | | 2007 | | 2006 | | 2005 | |
| | | | | Interest | | Average | | | | Interest | | Average | | | | Interest | | Average | |
| | | Average | | Income / | | Yield / | | Average | | Income / | | Yield / | | Average | | Income / | | Yield / | |
| (Dollars in thousands) | | Balance | | Expense | | Rate | | Balance | | Expense | | Rate | | Balance | | Expense | | Rate | |
| Assets: | | | | | | | | | | | | | | | | | | | | | | | | | | | | |
Loans, gross (1) | | $ | 844,928 | | $ | 68,405 | | | 8.10% | | $ | 738,297 | | $ | 61,859 | | | 8.38% | | $ | 762,328 | | $ | 54,643 | | | 7.17 | % |
| Securities | | | 165,884 | | | 7,636 | | | 4.60% | | | 191,220 | | | 7,796 | | | 4.08% | | | 226,043 | | | 7,247 | | | 3.21 | % |
| Interest bearing deposits in other financial institutions | | | 3,132 | | | 141 | | | 4.50% | | | 2,826 | | | 132 | | | 4.67% | | | 3,234 | | | 97 | | | 3.00 | % |
| Federal funds sold | | | 49,118 | | | 2,530 | | | 5.15% | | | 63,739 | | | 3,170 | | | 4.97% | | | 52,438 | | | 1,769 | | | 3.37 | % |
| Total interest earning assets | | | 1,063,062 | | | 78,712 | | | 7.40% | | | 996,082 | | | 72,957 | | | 7.32% | | | 1,044,043 | | | 63,756 | | | 6.11 | % |
| Cash and due from banks | | | 37,435 | | | | | | | | | 34,810 | | | | | | | | | 38,670 | | | | | | | |
| Premises and equipment, net | | | 6,218 | | | | | | | | | 2,482 | | | | | | | | | 2,879 | | | | | | | |
| Other assets | | | 87,175 | | | | | | | | | 64,904 | | | | | | | | | 51,593 | | | | | | | |
| Total assets | | $ | 1,193,890 | | | | | | | | $ | 1,098,278 | | | | | | | | $ | 1,137,185 | | | | | | | |
| | | | | | | | | | | | | | | | | | | | | | | | | | | | | |
| Liabilities and shareholders' equity: | | | | | | | | | | | | | | | | | | | | | | | | | | | | |
| Deposits: | | | | | | | | | | | | | | | | | | | | | | | | | | | | |
| Demand, interest bearing | | $ | 143,801 | | $ | 3,154 | | | 2.19% | | $ | 145,471 | | $ | 3,220 | | | 2.21% | | $ | 134,412 | | $ | 1,749 | | | 1.30 | % |
| Savings and money market | | | 393,750 | | | 12,368 | | | 3.14% | | | 358,846 | | | 10,274 | | | 2.86% | | | 363,570 | | | 6,058 | | | 1.67 | % |
| Time deposits, under $100 | | | 32,196 | | | 1,243 | | | 3.86% | | | 31,967 | | | 1,037 | | | 3.24% | | | 37,260 | | | 862 | | | 2.31 | % |
| Time deposits, $100 and over | | | 119,812 | | | 5,151 | | | 4.30% | | | 107,387 | | | 3,762 | | | 3.50% | | | 115,104 | | | 2,867 | | | 2.49 | % |
| Brokered time deposits, $100 and over | | | 49,846 | | | 2,295 | | | 4.60% | | | 34,234 | | | 1,295 | | | 3.78% | | | 35,764 | | | 1,313 | | | 3.67 | % |
| Notes payable to subsidiary grantor trusts | | | 23,702 | | | 2,329 | | | 9.83% | | | 23,702 | | | 2,310 | | | 9.75% | | | 23,702 | | | 2,136 | | | 9.01 | % |
| Securities sold under agreement to repurchase | | | 14,529 | | | 387 | | | 2.66% | | | 25,429 | | | 627 | | | 2.47% | | | 40,748 | | | 922 | | | 2.26 | % |
| Other short-term borrowings | | | 1,726 | | | 85 | | | 4.92% | | | - | | | - | | | N/A | | | - | | | - | | | N/ | A |
| Total interest bearing liabilities | | | 779,362 | | | 27,012 | | | 3.47% | | | 727,036 | | | 22,525 | | | 3.10% | | | 750,560 | | | 15,907 | | | 2.12 | % |
| Demand, noninterest bearing | | | 242,308 | | | | | | | | | 229,190 | | | | | | | | | 259,881 | | | | | | | |
| Other liabilities | | | 23,385 | | | | | | | | | 23,957 | | | | | | | | | 21,536 | | | | | | | |
| Total liabilities | | | 1,045,055 | | | | | | | | | 980,183 | | | | | | | | | 1,031,977 | | | | | | | |
| Shareholders' equity | | | 148,835 | | | | | | | | | 118,095 | | | | | | | | | 105,208 | | | | | | | |
| Total liabilities and shareholders' equity | | $ | 1,193,890 | | | | | | | | $ | 1,098,278 | | | | | | | | $ | 1,137,185 | | | | | | | |
| | | | | | | | | | | | | | | | | | | | | | | | | | | | | |
| Net interest income / margin | | | | | $ | 51,700 | | | 4.86% | | | | | $ | 50,432 | | | 5.06% | | | | | $ | 47,849 | | | 4.58 | % |
| | | | | | | | | | | | | | | | | | | | | | | | | | | | | |
(1) Yields and amounts earned on loans include loan fees and costs. Nonaccrual loans are included in the average balance calculations above.
The Volume and Rate Variances table below sets forth the dollar difference in interest earned and paid for each major category of interest-earning assets and interest-bearing liabilities for the noted periods, and the amount of such change attributable to changes in average balances (volume) or changes in average interest rates. Volume variances are equal to the increase or decrease in the average balance times the prior period rate and rate variances are equal to the increase or decrease in the average rate times the prior period average balance. Variances attributable to both rate and volume changes are equal to the change in rate times the change in average balance and are included below in the average volume column.
Volume and Rate Variances
| | | 2007 vs. 2006 | | 2006 vs. 2005 |
| | | Increase (Decrease) Due to Change in: | | Increase (Decrease) Due to Change in: |
| | | Average | | Average | | Net | | Average | | Average | | Net |
| (Dollars in thousands) | | Volume | | Rate | | Change | | Volume | | Rate | | Change |
| Income from the interest earning assets: | | | | | | | | | | | | |
| Loans, gross | | $ | 8,633 | | $ | (2,087) | | $ | 6,546 | | $ | (2,024) | | $ | 9,240 | | $ | 7,216 |
| Securities | | | (1,160) | | | 1,000 | | | (160) | | | (1,427) | | | 1,976 | | | 549 |
| Interest bearing deposits in other financial institutions | | | 14 | | | (5) | | | 9 | | | (19) | | | 54 | | | 35 |
| Federal funds sold | | | (753) | | | 113 | | | (640) | | | 564 | | | 837 | | | 1,401 |
| Total interest income on interest earning assets | | $ | 6,734 | | $ | (979) | | $ | 5,755 | | $ | (2,906) | | $ | 12,107 | | $ | 9,201 |
| | | | | | | | | | | | | | | | | | | |
| Expense from the interest bearing liabilities: | | | | | | | | | | | | | | | | | | |
| Demand, interest bearing | | $ | (38) | | $ | (28) | | $ | (66) | | $ | 249 | | $ | 1,222 | | $ | 1,471 |
| Savings and money market | | | 1,100 | | | 994 | | | 2,094 | | | (124) | | | 4,340 | | | 4,216 |
| Time deposits, under $100 | | | 9 | | | 197 | | | 206 | | | (170) | | | 345 | | | 175 |
| Time deposits, $100 and over | | | 533 | | | 856 | | | 1,389 | | | (267) | | | 1,162 | | | 895 |
| Brokered time deposits, $100 and over | | | 720 | | | 280 | | | 1,000 | | | (57) | | | 39 | | | (18) |
| Notes payable to subsidiary grantor trusts | | | (1) | | | 20 | | | 19 | | | - | | | 174 | | | 174 |
| Securities sold under agreement to repurchase | | | (350) | | | 110 | | | (240) | | | (379) | | | 84 | | | (295) |
| Other short-term borrowings | | | 85 | | | - | | | 85 | | | - | | | - | | | - |
| Total interest expense on interest bearing liabilities | | $ | 2,059 | | $ | 2,428 | | $ | 4,487 | | $ | (748) | | $ | 7,366 | | $ | 6,618 |
| Net interest income | | $ | 4,675 | | $ | (3,407) | | $ | 1,268 | | $ | (2,158) | | $ | 4,741 | | $ | 2,583 |
| | | | | | | | | | | | | | | | | | | |
Net interest income for 2007 increased $1.3 million or 3% from 2006. The increase in 2007 was primarily due to growth in the loan portfolio. Average earning assets increased 7% in 2007 from 2006. This increase was primarily attributable to the acquisition of Diablo Valley Bank. The Company’s net interest margin, expressed as a percentage of average earning assets, was 4.86% in 2007 compared to 5.06% in 2006, a decrease of 20 basis points. A substantial portion of the Company’s earning assets are variable-rate loans that re-price when the Company’s prime lending rate is changed, in contrast to a large base of core deposits that are generally slower to re-price. This causes the Company’s balance sheet to be asset-sensitive which means that, all else being equal, the Company’s net interest margin will be lower during periods when short-term interest rates are falling and higher when rates are rising. Management anticipates that the Company’s net interest margin could experience some compression if short-term interest rates continue to fall in 2008.
The net interest margin increased 48 basis points to 5.06% in 2006 from 4.58% in 2005. Net interest income increased $2.6 million, or 5%, for 2006 to $50.4 million from $47.8 million for 2005, primarily due to higher in interest rate levels in 2006.
| Provision for Loan Losses |
Credit risk is inherent in the business of making loans. The Company sets aside an allowance or reserve for loan losses through charges to earnings, which are shown in the income statement as the provision for loan losses. Specifically identifiable and quantifiable losses are immediately charged off against the allowance. The loan loss provision is determined by conducting a monthly evaluation of the adequacy of the Company’s allowance for loan losses and charging the shortfall, if any, to the current month’s expense. This has the effect of creating variability in the amount and frequency of charges to the Company’s earnings. The loan loss provision and level of allowance for each period are dependent upon many factors, including loan growth, net charge-offs, changes in the composition of the loan portfolio, delinquencies, management’s assessment of the quality of the loan portfolio, the valuation of problem loans and the general economic conditions in the Company’s market area.
For 2007, the Company had a credit provision for loan losses of $11,000, compared to a credit provision for loan losses of $0.5 million for 2006 and provision for loan losses of $0.3 million for 2005. The allowance for loan losses represented 1.18%, 1.31% and 1.51% of total loans at December 31, 2007, 2006 and 2005, respectively. See “Allowance for Loan Losses” on page 34 for additional information.
Noninterest Income
Beginning in the third quarter of 2007, the Company decided to change its strategy regarding its SBA loan business. The Company is now retaining most new SBA production in lieu of selling the loans. Reflecting the strategic shift to retain SBA loan production, gains from sale of loans dropped substantially in 2007.
The following table sets forth the various components of the Company’s noninterest income:
| | | | | | | | | Increase (decrease) | | | Increase (decrease) |
| | | Year Ended December 31, | | 2007 versus 2006 | | | 2006 versus 2005 |
| (Dollars in thousands) | | 2007 | | 2006 | | 2005 | | Amount | | Percent | | | Amount | | Percent |
| Gain on sale of SBA loans | | $ | 1,766 | | $ | 3,337 | | $ | 2,871 | | $ | (1,571) | | -47 | % | | $ | 466 | | 16% |
| Gain on sale Capital Group loan portfolio | | | - | | | 671 | | | - | | | (671) | | -100 | % | | | 671 | | N/A |
| Servicing income | | | 2,181 | | | 1,860 | | | 1,838 | | | 321 | | 17 | % | | | 22 | | 1% |
| Increase in cash surrender value of life insurance | | | 1,443 | | | 1,439 | | | 1,236 | | | 4 | | - | % | | | 203 | | 16% |
| Service charges and fees on deposit accounts | | | 1,284 | | | 1,335 | | | 1,468 | | | (51) | | -4 | % | | | (133) | | -9% |
| Gain on sale of leased equipment | | | - | | | - | | | 299 | | | - | | N/ | A | | | (299) | | -100% |
| Equipment leasing | | | - | | | - | | | 131 | | | - | | N/ | A | | | (131) | | -100% |
| Other | | | 1,378 | | | 1,198 | | | 1,580 | | | 180 | | 15 | % | | | (382) | | -24% |
| Total | | $ | 8,052 | | $ | 9,840 | | $ | 9,423 | | $ | (1,788) | | -18 | % | | $ | 417 | | 4% |
| | | | | | | | | | | | | | | | | | | | | |
The decrease in noninterest income in 2007 compared to 2006 was primarily attributable to a $2.2 million decrease in gain on sale of loans. The net gain on sale of SBA loans was $1.8 million for 2007, compared to $3.3 million for 2006. The reduction in noninterest income should be offset in future years with higher interest income, as a result of retaining SBA loan production..
For periods the Company sold its SBA loan production, including the first nine months of 2007, gains or losses on SBA loans held for sale were recognized upon completion of the sale, and are based on the difference between the net sales proceeds and the relative fair value of the guaranteed portion of the loan sold compared to the relative fair value of the unguaranteed portion. The servicing assets that resulted from the sale of SBA loans, with servicing rights retained, are amortized over the term of the loans using a method approximating the interest method.
Noninterest Expense
The following table sets forth the various components of the Company’s noninterest expense:
Noninterest Expense
| | | | | | | | | Increase (decrease) | | | Increase (decrease) |
| | | Year Ended December 31, | | 2007 versus 2006 | | | 2006 versus 2005 |
| (Dollars in thousands) | | 2007 | | 2006 | | 2005 | | Amount | Percent | | | Amount | | Percent |
| Salaries and employee benefits | | $ | 21,160 | | $ | 19,414 | | $ | 19,845 | | $ | 1,746 | | 9 | % | | $ | (431) | | -2% |
| Occupancy | | | 3,557 | | | 3,110 | | | 3,254 | | | 447 | | 14 | % | | | (144) | | -4% |
| Professional fees | | | 2,342 | | | 1,688 | | | 1,617 | | | 654 | | 39 | % | | | 71 | | 4% |
| Advertising and promotion | | | 1,092 | | | 1,064 | | | 985 | | | 28 | | 3 | % | | | 79 | | 8% |
| Data processing expense | | | 867 | | | 806 | | | 661 | | | 61 | | 8 | % | | | 145 | | 22% |
| Low income housing investment losses and writedowns | | | 828 | | | 995 | | | 957 | | | (167) | | -17 | % | | | 38 | | 4% |
| Client services | | | 820 | | | 1,000 | | | 1,404 | | | (180) | | -18 | % | | | (404) | | -29% |
| Furniture and equipment | | | 638 | | | 517 | | | 734 | | | 121 | | 23 | % | | | (217) | | -30% |
| Intangible asset amortization | | | 352 | | | - | | | - | | | 352 | | N/ | A | | | - | | N/A |
| Retirement plan expense | | | 274 | | | 352 | | | 619 | | | (78) | | -22 | % | | | (267) | | -43% |
| Amortization of leased equipment | | | - | | | - | | | 334 | | | - | | N/ | A | | | (334) | | -100% |
| Other | | | 5,600 | | | 5,322 | | | 4,823 | | | 278 | | 5 | % | | | 499 | | 10% |
| Total | | $ | 37,530 | | $ | 34,268 | | $ | 35,233 | | $ | 3,262 | | 10 | % | | | (965) | | -3% |
| | | | | | | | | | | | | | | | | | | | | |
The following table indicates the percentage of noninterest expense in each category:
Noninterest Expense by Category
| | | 2007 | | | 2006 | | | 2005 |
| | | | | Percent | | | | | Percent | | | | | Percent |
| (Dollars in thousands) | | Amount | | of Total | | | Amount | | of Total | | | Amount | | of Total |
| Salaries and employee benefits | | $ | 21,160 | | | 56 | % | | $ | 19,414 | | | 57 | % | | $ | 19,845 | | 56% |
| Occupancy | | | 3,557 | | | 10 | % | | | 3,110 | | | 9 | % | | | 3,254 | | 9% |
| Professional fees | | | 2,342 | | | 6 | % | | | 1,688 | | | 5 | % | | | 1,617 | | 5% |
| Advertising and promotion | | | 1,092 | | | 3 | % | | | 1,064 | | | 3 | % | | | 985 | | 3% |
| Data processing expense | | | 867 | | | 2 | % | | | 806 | | | 2 | % | | | 661 | | 2% |
| Low income housing investment losses and writedowns | | | 828 | | | 2 | % | | | 995 | | | 3 | % | | | 957 | | 3% |
| Client services | | | 820 | | | 2 | % | | | 1,000 | | | 3 | % | | | 1,404 | | 4% |
| Furniture and equipment | | | 638 | | | 2 | % | | | 517 | | | 1 | % | | | 734 | | 2% |
| Intangible asset amortization | | | 352 | | | 1 | % | | | - | | | - | % | | | - | | -% |
| Retirement plan expense | | | 274 | | | 1 | % | | | 352 | | | 1 | % | | | 619 | | 2% |
| Amortization of leased equipment | | | - | | | - | % | | | - | | | - | % | | | 334 | | 1% |
| Other | | | 5,600 | | | 15 | % | | | 5,322 | | | 16 | % | | | 4,823 | | 13% |
| Total | | $ | 37,530 | | | 100 | % | | $ | 34,268 | | | 100 | % | | $ | 35,233 | | 100% |
| | | | | | | | | | | | | | | | | | | | |
Noninterest expense increased $3.3 million, or 10%, in 2007 compared to 2006. Noninterest expense for 2006 decreased $1.0 million, or 3%, from 2005. The efficiency ratio represents noninterest expense divided by the sum of net interest and noninterest income. The Company’s efficiency ratio was 62.81% in 2007, as compared to 56.86% in 2006 and 61.52% in 2005.
The increase in compensation expense was primarily due to the acquisition of Diablo Valley Bank and the Company hiring a number of experienced bankers during 2007. Salary and severance benefits for former Diablo Valley Bank employees totaled $461,000. Up-front costs associated with the hiring of new bankers for the East Bay expansion and SBA teams totaled $970,000 in 2007. The increase in occupancy, furniture and equipment was due to opening a new branch office in Walnut Creek during 2007, as well as the addition of the Diablo Valley Bank offices. The increase in professional fees and data processing fees in 2007 were due to the acquisition of Diablo Valley Bank and additional branches and customer accounts after the merger with Diablo Valley Bank. The Company also incurred amortization expense of $352,000 related to intangible assets from the Diablo Valley Bank acquisition.
Income Tax Expense
The Company computes its provision for income taxes on a monthly basis. As indicated in Note 9 to the Consolidated Financial Statements, the amount of such provision is determined by applying the Company’s statutory income tax rates to pre-tax book income as adjusted for permanent differences between pre-tax book income and actual taxable income. These permanent differences include, but are not limited to, tax-exempt interest income, increases in the cash surrender value of life insurance policies, California Enterprise Zone deductions, certain expenses that are not allowed as tax deductions, and tax credits.
The Company’s federal and state income tax expense was $8.1 million in 2007, compared to $9.2 million and $7.3 million for 2006 and 2005, respectively. This represents 36.6% of income before taxes in 2007, 34.8% in 2006, and 33.5% in 2005. The effective tax rate is higher in 2007, than in 2006 and 2005, because of adjustments in 2007 resulting from the audit of the Company’s California state tax returns by the State of California Franchise Tax Board.
Tax-exempt interest income is generated primarily by the Company’s investments in state, county and municipal securities, which provided $0.2 million in federal tax-exempt income in 2007, 2006 and 2005. Although not reflected in the investment portfolio, the Company also has total investments of $7.3 million in low-income housing limited partnerships as of December 31, 2007. These investments have generated tax credits for the past few years, with about $1.1 million in credits available for the 2007 tax year and $1.0 million in tax credits realized in 2006. The investments are expected to generate an additional $6.2 million in aggregate tax credits from 2008 through 2016; however, the credits are dependent upon the occupancy level of the housing projects and income of the tenants and cannot be projected with certainty.
Some items of income and expense are recognized in different years for tax purposes than when applying generally accepted accounting principles, leading to timing differences between the Company’s actual tax liability and the amount accrued for this liability based on book income. These temporary differences comprise the “deferred” portion of the Company’s tax expense, which is accumulated on the Company’s books as a deferred tax asset or deferred tax liability until such time as it reverses. At the end of 2007, the Company had a net deferred tax asset of $10.1 million.
As of December 31, 2007, total assets were $1.35 billion, an increase of 30% from $1.04 billion at year-end 2006. Total securities available-for-sale (at fair value) were $135 million, a decrease of 22% from $172 million at year-end 2006. The total loan portfolio (excluding loans held for sale) was $1.04 billion, an increase of 46% from $709 million at year-end 2006. Total deposits were $1.064 billion, an increase of 26% from $846 million at year-end 2006. Securities sold under agreement to repurchase decreased $10.9 million, or 50%, to $10.9 million at December 31, 2007, from $21.8 million at year-end 2006.
Securities Portfolio
The following table reflects the estimated fair value for each category of securities for the past three years.
Investment Portfolio
| | | December 31, |
| (Dollars in thousands) | | 2007 | | 2006 | | 2005 |
| Securities available-for-sale (at fair value) | | | | | | |
| U.S. Treasury | | $ | 4,991 | | $ | 5,963 | | $ | 6,920 |
| U.S. Government Agencies | | | 35,803 | | | 59,396 | | | 82,041 |
| Municipals - Tax Exempt | | | 4,114 | | | 8,142 | | | 8,268 |
| Mortgage-Backed Securities | | | 83,046 | | | 90,186 | | | 91,868 |
| Collateralized Mortgage Obligations | | | 7,448 | | | 8,611 | | | 9,398 |
| Total | | $ | 135,402 | | $ | 172,298 | | $ | 198,495 |
| | | | | | | | | | |
Securities classified as U.S. Government Agencies as of December 31, 2007 were issued by the Federal National Mortgage Association, Federal Home Loan Mortgage Corporation, and the Federal Home Loan Bank.
The following table summarizes the maturities and weighted average yields of securities as of December 31, 2007:
| | | December 31, 2007 |
| | | Maturity |
| | | | | | | | After One and | | | After Five and | | | | | | | | | | |
| | | Within One Year | | | Within Five Years | | | Within Ten Years | | | After Ten Years | | | Total | | |
| (Dollars in thousands) | | Amount | | Yield | | | Amount | | Yield | | | Amount | | Yield | | | Amount | | Yield | | | Amount | | Yield |
| Securities available-for-sale (at fair value): | | | | | | | | | | | | | | | | | | | | | | |
| U.S. Treasury | | $ | 4,991 | | 4.77 | % | | $ | - | | - | | | $ | - | | - | | | $ | - | | - | | | $ | 4,991 | | 4.77% |
| U.S. Government Agencies | | | 24,260 | | 4.92 | % | | | 11,543 | | 4.51 | % | | | - | | - | | | | - | | - | | | | 35,803 | | 4.79% |
| Municipals - non-taxable | | | 3,421 | | 3.04 | % | | | 693 | | 3.88 | % | | | - | | - | | | | - | | - | | | | 4,114 | | 3.18% |
| Mortgage Backed Securities | | | - | | - | | | | 1,743 | | 3.00 | % | | | 12,497 | | 4.64 | % | | | 68,806 | | 4.53 | % | | | 83,046 | | 4.51% |
| Collateralized Mortgage Obligations | | | - | | - | | | | - | | - | | | | 5,001 | | 5.50 | % | | | 2,447 | | 3.16 | % | | | 7,448 | | 4.73% |
| Total | | $ | 32,672 | | 4.70 | % | | $ | 13,979 | | 4.29 | % | | $ | 17,498 | | 4.89 | % | | $ | 71,253 | | 4.48 | % | | $ | 135,402 | | 4.57% |
| | | | | | | | | | | | | | | | | | | | | | | | | | | | | | |
The investment securities portfolio is the second largest component of the Company’s interest earning assets, and the structure and composition of this portfolio is important to any analysis of the financial condition of the Company. The investment portfolio serves the following purposes: (i) it can be readily reduced in size to provide liquidity for loan balance increases or deposit balance decreases; (ii) it provides a source of pledged assets for securing certain deposits and borrowed funds, as may be required by law or by specific agreement with a depositor or lender; (iii) it can be used as an interest rate risk management tool, since it provides a large base of assets, the maturity and interest rate characteristics of which can be changed more readily than the loan portfolio to better match changes in the deposit base and other funding sources of the Company; (iv) it is an alternative interest-earning use of funds when loan demand is weak or when deposits grow more rapidly than loans; and (v) it can enhance the Company’s tax position by providing partially tax exempt income.
The Company uses two portfolio classifications for its securities: “Held-to-maturity”, and “Available-for-sale”. Accounting rules also allow for a trading portfolio classification, but the Company has no securities that would be classified as such. The held-to-maturity portfolio can consist only of securities that the Company has both the intent and ability to hold until maturity, to be sold only in the event of concerns with an issuer’s credit worthiness, a change in tax law that eliminates their tax exempt status, or other infrequent situations as permitted by generally accepted accounting principles. Since the Company does not have a trading portfolio, the available-for-sale portfolio is comprised of all securities not included as “held-to-maturity”. Even though management currently has the intent and the ability to hold the Company’s securities for the foreseeable future, they are all currently classified as available-for-sale to allow flexibility with regard to the active management of the Company’s investment portfolio. FASB Statement 115 requires available-for-sale securities to be marked to market with an offset to accumulated other comprehensive income, a component of shareholders’ equity. Monthly adjustments are made to reflect changes in the market value of the Company’s available-for-sale securities.
The Company’s investment portfolio is currently composed primarily of: (i) U.S. Treasury and Agency issues for liquidity and pledging; (ii) mortgage-backed securities, which in many instances can also be used for pledging, and which generally enhance the yield of the portfolio; (iii) state, county and municipal obligations, which provide tax free income and limited pledging potential; and (iv) collateralized mortgage obligations, which generally enhance the yield of the portfolio. The amortized cost of securities pledged as collateral for repurchase agreements, public deposits and for other purposes as required or permitted by law was $42.2 million and $53.7 million at December 31, 2007 and 2006, respectively.
Except for obligations of the U.S. government or U.S. government agencies, no securities of a single issuer exceeded 10% of shareholders’ equity at December 31, 2007. The Company has not used interest rate swaps or other derivative instruments to hedge fixed rate loans or to otherwise mitigate interest rate risk.
In 2007, the investment portfolio declined by $37 million, or 21%, and decreased to 10% of total assets at the end of 2007 from 16.6% at the end of 2006. U.S. Treasury and U.S. Government Agency securities decreased to 30% of the portfolio at the end of 2007 from 38% at the end of 2006. The decrease was primarily due to maturities of U.S. Government Agency securities during 2007. Municipal securities also decreased by 49% in 2007, due to maturities. Mortgage-backed securities and collateralized mortgage obligations remained fairly constant in the portfolio in 2007 compared to 2006.
Loans
The Company’s loans represent the largest portion of earning assets, substantially greater than the securities portfolio or any other asset category, and the quality and diversification of the loan portfolio is an important consideration when reviewing the Company’s financial condition.
Gross loans represented 77% of total assets at December 31, 2007, as compared to 68% of at December 31, 2006. The ratio of loans to deposits increased to 97% at the end of 2007 from 84% at the end of 2006. Demand for loans remains relatively strong in many areas within the Company’s markets and competition continues to intensify. To help ensure that we remain competitive, we make every effort to be flexible and creative in our approach to structuring loans.
The Selected Financial Data table in Item 6 reflects the amount of loans outstanding at December 31st for each year from 2003 through 2007, net of deferred fees and origination costs and the allowance for loan losses. The Loan Distribution table that follows sets forth the Company’s gross loans outstanding and the percentage distribution in each category at the dates indicated. The amounts shown in the table do not reflect any deferred loan fees or deferred origination costs, nor is the allowance for loan loss deducted.
| | | December 31, |
| (Dollars in thousands) | | 2007 | | % to Total | | 2006 | | % to Total | | 2005 | | % to Total | | 2004 | | % to Total | | 2003 | | % to Total |
| Commercial | | $ | 411,251 | | 40 | % | | $ | 284,093 | | 40 | % | | $ | 248,060 | | 37 | % | | $ | 296,030 | | 41 | % | | $ | 269,076 | | 41% |
| Real estate - mortgage | | | 361,211 | | 35 | % | | | 239,041 | | 34 | % | | | 237,566 | | 35 | % | | | 250,984 | | 35 | % | | | 227,474 | | 35% |
| Real estate - land and construction | | | 215,597 | | 21 | % | | | 143,834 | | 20 | % | | | 149,851 | | 22 | % | | | 118,290 | | 17 | % | | | 101,082 | | 16% |
| Home equity | | | 44,187 | | 4 | % | | | 38,976 | | 6 | % | | | 41,772 | | 6 | % | | | 52,170 | | 7 | % | | | 49,434 | | 8% |
| Consumer | | | 3,044 | | 0 | % | | | 2,422 | | 0 | % | | | 1,721 | | 0 | % | | | 2,908 | | 0 | % | | | 1,743 | | 0% |
| Total loans | | | 1,035,290 | | 100 | % | | | 708,366 | | 100 | % | | | 678,970 | | 100 | % | | | 720,382 | | 100 | % | | | 648,809 | | 100% |
| Deferred loan costs, net | | | 1,175 | | | | | | 870 | | | | | | 1,155 | | | | | | 726 | | | | | | 863 | | |
| Allowance for loan losses | | | (12,218) | | | | | | (9,279) | | | | | | (10,224) | | | | | | (12,497) | | | | | | (13,451) | | |
| Loans, net | | $ | 1,024,247 | | | | | $ | 699,957 | | | | | $ | 669,901 | | | | | $ | 708,611 | | | | | $ | 636,221 | | |
| | | | | | | | | | | | | | | | | | | | | | | | | | | | | | |
Total loans (excluding loans held for sale) were $1.035 billion at December 31, 2007, an increase of 46% from $708 million at December 31, 2006. Total loans increased by $386 million, or 60%, from the end of 2003 to the end of 2007.
The Company’s loan portfolio is concentrated in commercial, primarily manufacturing, wholesale, and services and real estate, with the balance in land development and construction and home equity and consumer loans. The loan portfolio mix over the past five years has remained relatively the same.
The change in the Company’s loan portfolio in 2007 from 2006 is primarily due to the acquisition of DVB. The Company does not have any concentrations by industry or group of industries in its loan portfolio; however, 60% of its net loans were secured by real property as of December 31, 2007 and 2006. While no specific industry concentration is considered significant, the Company’s lending operations are located in areas that are dependent on the technology and real estate industries and their supporting companies. In the fourth quarter of 2005, the Company entered into negotiations for the sale of its Capital Group loan portfolio consisting primarily of “factoring” type loans. In contemplation of the sale, $32 million, net of the respective allowance loan loss, was moved from commercial loans into loans held-for-sale. The sale of the Capital Group loan portfolio was completed in 2006, resulting in a gain of $0.7 million.
The Company’s commercial loans are made for working capital, financing the purchase of equipment or for other business purposes. Such loans include loans with maturities ranging from thirty days to one year and “term loans,” with maturities normally ranging from one to five years. Short-term business loans are generally intended to finance current transactions and typically provide for periodic principal payments, with interest payable monthly. Term loans normally provide for floating interest rates, with monthly payments of both principal and interest. The Company’s commercial loans are centered in locally-oriented commercial activities in markets where the Company has a physical presence, and these markets have become more competitive as business activity has moderated.
The Company is an active participant in the Small Business Administration (“SBA”) and U.S. Department of Agriculture guaranteed lending programs, and has been approved by the SBA as a lender under the Preferred Lender Program. The Company regularly makes SBA-guaranteed loans. Prior to third quarter of 2007, the guaranteed portion of these loans were sold in the secondary market depending on market conditions. Once it was determined that these loans would be sold, these loans were classified as held for sale and carried at the lower of cost or market. When the guaranteed portion of an SBA loan, was sold, the Company retained the servicing rights for the sold portion. As of December 31, 2007, 2006, and 2005, $177 million, $189 million and $180 million, respectively, in SBA and U.S. Department of Agriculture loans were serviced by the Company for others. As discussed on page 28, beginning in the third quarter of 2007, the Company changed its strategy regarding its SBA loan business by retaining new SBA production in lieu of selling the loans.
As of December 31, 2007, real estate mortgage loans of $360 million consist of adjustable and fixed rate loans secured by commercial property, and loans secured by first mortgages on 1-4 family residential properties of $1 million. Of the $216 million in land and construction loans at Decemeber 31, 2007, $157 million was construction loans comprised of $92 million residential and $65 million commercial. The other $59 million of land and construction loans represent residential land loans of $46 million residential and $13 million of commercial land loans. Properties securing the real estate mortgage loans are primarily located in the Company’s market area. While no specific industry concentration is considered significant, the Company’s lending operations are located in market areas that are dependent on the technology and real estate industries and their supporting companies. Real estate values in portions of Santa Clara County and neighboring San Mateo County are among the highest in the country at present but have recently been experiencing a decrease in value from the levels experienced at the beginning of 2007. The Company’s borrowers could be adversely impacted by a downturn in these sectors of the economy, which could reduce the demand for loans and adversely impact the borrowers’ ability to repay their loans.
The Company’s real estate term loans consist primarily of loans made based on the borrower’s cash flow and are secured by deeds of trust on commercial and residential property to provide a secondary source of repayment. The Company generally restricts real estate term loans to no more than 80% of the property’s appraised value or the purchase price of the property, depending on the type of property and its utilization. The Company offers both fixed and floating rate loans. Maturities on such loans are generally between five and ten years (with amortization ranging from fifteen to twenty-five years and a balloon payment due at maturity); however, SBA and certain other real estate loans that are easily sold in the secondary market may be granted for longer maturities.
The Company’s land and construction loans are primarily short term interim loans to finance the construction of commercial and single family residential properties. The Company utilizes underwriting guidelines to assess the likelihood of repayment from sources such as sale of the property or permanent mortgage financing prior to making the construction loan.
The Company makes consumer loans for the purpose of financing automobiles, various types of consumer goods, and other personal purposes. Additionally, the Company makes home equity lines of credit available to its clientele. Consumer loans generally provide for the monthly payment of principal and interest. Most of the Company’s consumer loans are secured by the personal property being purchased or, in the instances of home equity loans or lines, real property.
With certain exceptions, state chartered banks are permitted to make extensions of credit to any one borrowing entity up to 15% of the bank’s capital and reserves for unsecured loans and up to 25% of the bank’s capital and reserves for secured loans. For HBC, these lending limits were $29 million and $48 million at December 31, 2007, respectively.
The following table presents the maturity distribution of the Company’s loans as of December 31, 2007. The table shows the distribution of such loans between those loans with predetermined (fixed) interest rates and those with variable (floating) interest rates. Floating rates generally fluctuate with changes in the prime rate as reflected in the western edition of The Wall Street Journal. As of December 31, 2007, approximately 71% of the Company’s loan portfolio consisted of floating interest rate loans.
Loan Maturities
| | | | | Over One | | | | |
| | | Due in | | Year But | | | | |
| | | One Year | | Less than | | Over | | |
| (Dollars in thousands) | | or Less | | Five Years | | Five Years | | Total |
| Commercial | | $ | 369,575 | | $ | 30,378 | | $ | 11,298 | | $ | 411,251 |
| Real estate - mortgage | | | 112,553 | | | 154,145 | | | 94,513 | | | 361,211 |
| Real estate - land and construction | | | 213,565 | | | 2,032 | | | - | | | 215,597 |
| Home equity | | | 38,097 | | | - | | | 6,090 | | | 44,187 |
| Consumer | | | 1,723 | | | 1,321 | | | - | | | 3,044 |
| Total loans | | $ | 735,513 | | $ | 187,876 | | $ | 111,901 | | $ | 1,035,290 |
| | | | | | | | | | | | | |
| Loans with variable interest rates | | $ | 668,970 | | $ | 52,081 | | $ | 9,333 | | $ | 730,384 |
| Loans with fixed interest rates | | | 66,543 | | | 135,795 | | | 102,568 | | | 304,906 |
| Total loans | | $ | 735,513 | | $ | 187,876 | | $ | 111,901 | | $ | 1,035,290 |
| | | | | | | | | | | | | |
Nonperforming Assets
Financial institutions generally have a certain level of exposure to asset quality risk, and could potentially receive less than a full return of principal and interest if a debtor becomes unable or unwilling to repay. Since loans are the most significant assets of the Company and generate the largest portion of its revenues, the Company’s management of asset quality risk is focused primarily on loan quality. Banks have generally suffered their most severe earnings declines as a result of customers’ inability to generate sufficient cash flow to service their debts, or as a result of the downturns in national and regional economies which have brought about declines in overall property values. In addition, certain debt securities that the Company may purchase have the potential of declining in value if the obligor’s financial capacity to repay deteriorates.
To help minimize credit quality concerns, we have established a sound approach to credit that includes well-defined goals and objectives and well-documented credit policies and procedures. The policies and procedures identify market segments, set goals for portfolio growth or contraction, and establish limits on industry and geographic credit concentrations. In addition, these policies establish the Company’s underwriting standards and the methods of monitoring ongoing credit quality. The Company’s internal credit risk controls are centered in underwriting practices, credit granting procedures, training, risk management techniques, and familiarity with loan and lease customers as well as the relative diversity and geographic concentration of our loan portfolio.
The Company’s credit risk may also be affected by external factors such as the level of interest rates, employment, general economic conditions, real estate values, and trends in particular industries or geographic markets. As a multi-community independent bank serving a specific geographic area, the Company must contend with the unpredictable changes of both the general California and, particularly, primary local markets. The Company’s asset quality has suffered in the past from the impact of national and regional economic recessions, consumer bankruptcies, and depressed real estate values.
Nonperforming assets are comprised of the following: Loans for which the Company is no longer accruing interest; loans 90 days or more past due and still accruing interest (although they are generally placed on non-accrual when they become 90 days past due unless they are both well secured and in the process of collection); loans restructured where the terms of repayment have been renegotiated, resulting in a deferral of interest or principal; and other real estate owned (“OREO”). Management’s classification of a loan as “non-accrual” is an indication that there is reasonable doubt as to the full recovery of principal or interest on the loan. At that point, the Company stops accruing interest income, reverses any uncollected interest that had been accrued as income, and begins recognizing interest income only as cash interest payments are received as long as the collection of all outstanding principal is not in doubt. The loans may or may not be collateralized, and collection efforts are continuously pursued. Loans may be restructured by management when a borrower has experienced some change in financial status causing an inability to meet the original repayment terms and where the Company believes the borrower will eventually overcome those circumstances and make full restitution. OREO consists of properties acquired by foreclosure or similar means that management is offering or will offer for sale.
The following table provides information with respect to components of the Company’s non-performing assets at the dates indicated.
| | | December 31, |
| (Dollars in thousands) | | 2007 | | 2006 | | 2005 | | 2004 | | 2003 |
| Nonaccrual loans | | $ | 3,363 | | $ | 3,866 | | $ | 3,672 | | $ | 1,028 | | $ | 3,972 |
| Loans 90 days past due and still accruing | | | 101 | | | 451 | | | - | | | 302 | | | 608 |
| Total nonperforming loans | | | 3,464 | | | 4,317 | | | 3,672 | | | 1,330 | | | 4,580 |
| Other real estate owned | | | 1,062 | | | - | | | - | | | - | | | - |
| Total nonperforming assets | | $ | 4,526 | | $ | 4,317 | | $ | 3,672 | | $ | 1,330 | | $ | 4,580 |
| | | | | | | | | | | | | | | | |
| Nonperforming assets as a percentage of | | | | | | | | | | | | | | | |
| loans plus other real estate owned | | | 0.44% | | | 0.61% | | | 0.54% | | | 0.18% | | | 0.70% |
The balance of nonperforming assets at the end of 2007 represents an increase of $0.2 million, or 5%, from year-end 2006 levels. Nonperforming assets increased by $0.6 million, or 18%, in 2006 as compared to 2005.
While the current level of nonperforming assets is relatively low, we recognize that an increase in the dollar amount of nonaccrual loans is possible in the normal course of business as we expand our lending activities.
Allowance for Loan Losses
The allowance for loan losses is an estimate of the losses in our loan portfolio. The allowance is based on two basic principles of accounting: (1) Statement of Financial Accounting Standards (“Statement”) No. 5 “Accounting for Contingencies,” which requires that losses be accrued when they are probable of occurring and estimable and (2) Statement No. 114, “Accounting by Creditors for Impairment of a Loan,” which requires that losses be accrued based on the differences between the impaired loan balance and value of collateral, if the loan is collateral dependent, or present value of future cash flows or values that are observable in the secondary market.
Management conducts a critical evaluation of the loan portfolio monthly. This evaluation includes periodic loan by loan review for certain loans to evaluate the level of impairment, as well as detailed reviews of other loans (either individually or in pools) based on an assessment of the following factors: past loan loss experience, known and inherent risks in the portfolio, adverse situations that may affect the borrower’s ability to repay, collateral values, loan volumes and concentrations, size and complexity of the loans, recent loss experience in particular segments of the portfolio, bank regulatory examination and independent loan review results, and current economic conditions in the Company’s marketplace, in particular the state of the technology industry and the real estate market. This process attempts to assess the risk of loss inherent in the portfolio by segregating loans into two categories for purposes of determining an appropriate level of the allowance: Loans graded “Pass through Special Mention” and “Substandard.”
Loans are charged against the allowance when management believes that the uncollectibility of the loan balance is confirmed. The Company’s methodology for assessing the appropriateness of the allowance consists of several key elements, which include the formula allowance and specific allowances.
Specific allowances are established for impaired loans. Management considers a loan to be impaired when it is probable that the Company will be unable to collect all amounts due according to the original contractual terms of the note agreement. When a loan is considered to be impaired, the amount of impairment is measured based on the fair value of the collateral if the loan is collateral dependent or on the present value of expected future cash flow.
The formula portion of the allowance is calculated by applying loss factors to pools of outstanding loans. Loss factors are based on the Company's historical loss experience, adjusted for significant factors that, in management's judgment, affect the collectibility of the portfolio as of the evaluation date. The adjustment factors for the formula allowance may include existing general economic and business conditions affecting the key lending areas of the Company, in particular the real estate market, credit quality trends, collateral values, loan volumes and concentrations, the technology industry and specific industry conditions within portfolio segments, recent loss experience in particular segments of the portfolio, duration of the current business cycle, and bank regulatory examination results. The evaluation of the inherent loss with respect to these conditions is subject to a higher degree of uncertainty.
Loans that demonstrate a weakness, for which there is a possibility of loss if the weakness is not corrected, are categorized as “classified.” Classified loans include all loans considered as substandard, doubtful, and loss and may result from problems specific to a borrower’s business or from economic downturns that affect the borrower’s ability to repay or that cause a decline in the value of the underlying collateral (particularly real estate). The principal balance of classified loans, which include all loans internally graded as substandard, doubtful, and loss, was $25.2 million, $24.5 million, and $16.3 million, respectively, at December 31, 2007, 2006, and 2005. At December 31, 2007 and 2006, all of the Company’s classified loans were graded as substandard.
In adjusting the historical loss factors applied to the respective segments of the loan portfolio, management considered the following factors:
| · | Levels and trends in delinquencies, non-accruals, charge offs and recoveries |
| · | Trends in volume and loan terms |
| · | Lending policy or procedural changes |
| · | Experience, ability, and depth of lending management and staff |
| · | National and local economic trends and conditions |
| · | Concentrations of Credit |
There can be no assurance that the adverse impact of any of these conditions on HBC will not be in excess of the current level of estimated losses.
It is the policy of management to maintain the allowance for loan losses at a level adequate for risks inherent in the loan portfolio. On an ongoing basis, we have engaged outside firms to independently assess our methodology and perform independent credit reviews of our loan portfolio. The Company’s credit review consultants, the FRB and the DFI also review the allowance for loan losses as an integral part of the examination process. Based on information currently available to analyze loan loss delinquency and a history of actual charge-offs, management believes that the loan loss allowance is adequate. However, the loan portfolio can be adversely affected if California economic conditions and the real estate market in the Company’s market area were to weaken. Also, any weakness of a prolonged nature in the technology industry would have a negative impact on the local market. The effect of such events, although uncertain at this time, could result in an increase in the level of nonperforming loans and increased loan losses, which could adversely affect the Company’s future growth and profitability. No assurance of the ultimate level of credit losses can be given with any certainty.
The following table summarizes the Company’s loan loss experience, as well as provisions and charges to the allowance for loan losses and certain pertinent ratios for the periods indicated:
| Allowance for Loan Losses |
| (Dollars in thousands) | | 2007 | | 2006 | | 2005 | | | 2004 | | | 2003 |
| Balance, beginning of year | | $ | 9,279 | | $ | 10,224 | | $ | 12,497 | | | $ | 13,451 | | | $ | 13,227 |
| Charge-offs: | | | | | | | | | | | | | | | | | |
| Commercial | | | (84) | | | (291) | | | (3,273) | | | | (2,901 | ) | | | (2,906) |
| Real estate - mortgage | | | - | | | - | | | - | | | | - | | | | - |
| Real estate - land and construction | | | - | | | - | | | - | | | | - | | | | - |
| Home equity | | | (20) | | | (540) | | | - | | | | - | | | | - |
| Consumer | | | - | | | - | | | - | | | | - | | | | - |
| Total charge-offs | | | (104) | | | (831) | | | (3,273) | | | | (2,901 | ) | | | (2,906) |
| | | | | | | | | | | | | | | | | | |
| Recoveries: | | | | | | | | | | | | | | | | | |
| Commercial | | | 929 | | | 389 | | | 1,358 | | | | 1,562 | | | | 230 |
| Real estate - mortgage | | | - | | | - | | | - | | | | - | | | | - |
| Real estate - land and construction | | | - | | | - | | | - | | | | - | | | | - |
| Home equity | | | - | | | - | | | - | | | | - | | | | - |
| Consumer | | | - | | | - | | | - | | | | - | | | | - |
| Total recoveries | | | 929 | | | 389 | | | 1,358 | | | | 1,562 | | | | 230 |
| Net recoveries (charge-offs) | | | 825 | | | (442) | | | (1,915) | | | | (1,339 | ) | | | (2,676) |
| Provision for loan losses | | | (11) | | | (503) | | | 313 | | | | 666 | | | | 2,900 |
| Reclassification of allowance for loan losses | | | - | | | - | | | (671) | (1) | | | - | | | | - |
| Reclassification to other liabilities | | | - | | | - | | | - | | | | (281) | (2) | | | - |
| Allowance acquired in bank acquisition | | | 2,125 | | | - | | | - | | | | - | | | | - |
| Balance, end of year | | $ | 12,218 | | $ | 9,279 | | $ | 10,224 | | | $ | 12,497 | | | $ | 13,451 |
| | | | | | | | | | | | | | | | | | |
| RATIOS: | | | | | | | | | | | | | | | | | |
| Net charge-offs to average loans * | | | (0.10)% | | | 0.06% | | | 0.28% | | | | 0.19% | | | | 0.41% |
| Allowance for loan losses to total loans * | | | 1.18% | | | 1.31% | | | 1.51% | | | | 1.73% | | | | 2.03% |
| Allowance for loan losses to nonperforming loans | | | 353% | | | 215% | | | 278% | | | | 940% | | | | 294% |
| * Average loans and total loans exclude loans held for sale |
| (1) | The Company reclassified $0.7 million of the allowance allocated to $32 million of commercial asset based loans that were reclassified to loans held-for-sale as of December 31, 2005. Thus, the carrying value of these loans held-for-sale includes an allowance for loan losses of $0.7 million. |
| (2) | The Company reclassified estimated losses on unused commitments of $0.3 million to other liabilities as of December 31, 2004. |
The Company’s allowance for loan losses increased $2.9 million in 2007 as compared to 2006. The allowance for loan losses increased primarily as a result of the Diablo Valley Bank acquistion. The Company had $929,000 in recoveries in 2007, which were partially offset by loan charge-offs of $104,000. The Company had a credit provision of $11,000 in 2007, compared to a credit provision of $503,000 in 2006. Previously, the Company’s allowance for loan losses had steadily decreased from 2003 through 2006.
Net loans charged-off reflect the realization of losses in the portfolio that were recognized previously though provisions for loan losses. Net recoveries were $0.8 million in 2007, compared to net charged-offs of $0.4 million, and $1.9 million in 2006 and 2005, respectively. The decrease in net loan charge-offs in 2007 was primarily due to continued improvement in credit quality and a $700,000 recovery on a loan charged off in 2005. Historical net loan charge-offs are not necessarily indicative of the amount of net charge-offs that the Company will realize in the future.
The Company’s unallocated allowance was $1.4 million as of December 31, 2007 and 2006. The unallocated component of the allowance is maintained to cover uncertainties that could affect management's estimate of probable losses.
The following table provides a summary of the allocation of the allowance for loan losses for specific categories at the dates indicated. The allocation presented should not be interpreted as an indication that charges to the allowance for loan losses will be incurred in these amounts or proportions, or that the portion of the allowance allocated to each category represents the total amount available for charge-offs that may occur within these categories.
| Allocation of Loan Loss Allowance |
| | | December 31, |
| | | 2007 | | 2006 | | 2005 | | 2004 | | 2003 |
| | | | | Percent | | | | Percent | | | | Percent | | | | Percent | | | | Percent |
| | | | | of Loans | | | | of Loans | | | | of Loans | | | | of Loans | | | | of Loans |
| | | | | in each | | | | in each | | | | in each | | | | in each | | | | in each |
| | | | | category | | | | category | | | | category | | | | category | | | | category |
| | | | | to total | | | | to total | | | | to total | | | | to total | | | | to total |
| (Dollars in thousands) | | Allowance | | loans | | Allowance | | loans | | Allowance | | loans | | Allowance | | loans | | Allowance | | loans |
| Commercial | | $ | 6,067 | | 40% | | $ | 4,872 | | 40% | | $ | 4,199 | | 37% | | $ | 8,691 | | 41% | | $ | 9,667 | | 41% |
| Real estate - mortgage | | | 2,416 | | 35% | | | 1,507 | | 34% | | | 2,631 | | 35% | | | 1,498 | | 35% | | | 1,846 | | 35% |
| Real estate - land and construction | | | 1,923 | | 21% | | | 1,243 | | 20% | | | 1,914 | | 22% | | | 1,711 | | 17% | | | 1,714 | | 16% |
| Home equity | | | 335 | | 4% | | | 244 | | 6% | | | 300 | | 6% | | | 173 | | 7% | | | 157 | | 8% |
| Consumer | | | 88 | | 0% | | | 24 | | 0% | | | 33 | | 0% | | | 38 | | 0% | | | 37 | | 0% |
| Unallocated | | | 1,389 | | 0% | | | 1,389 | | 0% | | | 1,147 | | 0% | | | 386 | | 0% | | | 30 | | 0% |
| %Total | | $ | 12,218 | | 100% | | $ | 9,279 | | 100% | | $ | 10,224 | | 100% | | $ | 12,497 | | 100% | | $ | 13,451 | | 100 |
| | | | | | | | | | | | | | | | | | | | | | | | | | |
Deposits
The composition and cost of the Company’s deposit base are important components in analyzing the Company’s net interest margin and balance sheet liquidity characteristics, both of which are discussed in greater detail in other sections herein. Our net interest margin is improved to the extent that growth in deposits can be concentrated in historically lower-cost deposits such as non-interest-bearing demand, NOW accounts, savings accounts and money market deposit accounts. The Company’s liquidity is impacted by the volatility of deposits or other funding instruments, or in other words, by the propensity of that money to leave the institution for rate-related or other reasons. Potentially, the most volatile deposits in a financial institution are jumbo certificates of deposit, meaning time deposits with balances that equal or exceed $100,000, as customers with balances of that magnitude are typically more rate-sensitive than customers with smaller balances.
The following table summarizes the distribution of deposits and the percentage of distribution in each category of deposits for the periods indicated:
| | | Years Ended December 31, |
| | | 2007 | | 2006 | | 2005 |
| (Dollars in thousands) | | Balance | | % to Total | | Balance | | % to Total | | Balance | | % to Total |
| Demand, noninterest bearing | | $ | 268,005 | | 25% | | $ | 231,841 | | 27% | | $ | 248,009 | | 26% |
| Demand, interest bearing | | | 150,527 | | 14% | | | 133,413 | | 16% | | | 157,330 | | 17% |
| Savings and money market | | | 432,293 | | 41% | | | 307,266 | | 36% | | | 353,798 | | 38% |
| Time deposits, under $100 | | | 34,092 | | 3% | | | 31,097 | | 4% | | | 35,209 | | 4% |
| Time deposits, $100 and over | | | 139,562 | | 13% | | | 111,017 | | 13% | | | 109,373 | | 12% |
| Brokered deposits, $100 and over | | | 39,747 | | 4% | | | 31,959 | | 4% | | | 36,040 | | 4% |
| Total deposits | | $ | 1,064,226 | | 100% | | $ | 846,593 | | 100% | | $ | 939,759 | | 100% |
| | | | | | | | | | | | | | | | |
Total deposits were $1.06 billion at December 31, 2007, an increase of $218 million, or 26%, compared to $846.6 million at December 31, 2006. The increases primarily reflect the acquisition of Diablo Valley Bank. At December 31, 2007, compared to December 31, 2006, noninterest bearing demand deposits increased $36 million, or 16%; interest bearing demand deposits increased $17 million, or 13%; savings and money market deposits increased $125 million, or 41%; time deposits increased $32 million, or 22%; and brokered deposits increased $8 million, or 24%.
As of December 31, 2007, approximately $7.7 million, or less than 1%, of deposits were from public sources, and approximately $117.1 million, or 11%, of deposits were from real estate exchange company and title company accounts. As of December 31, 2006, approximately $2.4 million, or less than 1%, of deposits were from public sources, and approximately $108.2 million, or 13%, of deposits were from real estate exchange company and title company accounts.
Among core deposits categories, noninterest demand deposits increased by $36 million or 16% in 2007. Furthermore, relatively low-cost NOW accounts increased by $17 million or 13%. Savings and money market accounts increased by $125 million, or 41%, and time deposits increased in absolute dollars but remained flat as a percentage of total deposits. Our increase in savings and money market accounts was primarily the result of the acquisition of Diablo Valley Bank. While our core deposit accounts increased in number to 15,400 at the end of 2007 from 13,200 at the end of 2006, the average balance per core deposit increased to about $57,000 at the end of 2007 from $53,000 at the end of 2006.
Without the acquisition of Diablo Valley Bank, total deposits would have been relatively flat. The Company faces intensified competition for deposits as core deposits migrate into higher-yielding alternatives, including equity markets.
The Company obtains deposits from a cross-section of the communities it serves. The Company’s business is not seasonal in nature. The Company had brokered deposits totaling approximately $39.7 million, and $32.0 million at December 31, 2007 and 2006, respectively. These brokered deposits generally mature within one to three years. The Company is not dependent upon funds from sources outside the United States.
The following table indicates the maturity schedule of the Company’s time deposits of $100,000 or more as of December 31, 2007:
| Deposit Maturity Distribution |
| (Dollars in thousands) | | Balance | | % of Total |
| Three months or less | | $ | 70,180 | | 39% |
| Over three months through six months | | | 52,505 | | 30% |
| Over six months through twelve months | | | 39,976 | | 22% |
| Over twelve months | | | 16,548 | | 9% |
| Total | | $ | 179,209 | | 100% |
| | | | | | |
The Company focuses primarily on providing and servicing business deposit accounts that are frequently over $100,000 in average balance per account. As a result, certain types of business clients that the Company serves typically carry average deposits in excess of $100,000. The account activity for some account types and client types necessitates appropriate liquidity management practices by the Company to ensure its ability to fund deposit withdrawals.
Return on Equity and Assets
The following table indicates the ratios for return on average assets and average equity, dividend payout, and average equity to average assets for 2007, 2006, and 2005:
| | | 2007 | | | 2006 | | | 2005 |
| Return on average assets | | 1.18 | % | | | 1.57 | % | | 1.27% |
| Return on average tangible assets | | 1.21 | % | | | 1.57 | % | | 1.27% |
| Return on average equity | | 9.47 | % | | | 14.62 | % | | 13.73% |
| Return on average tangible equity | | 11.43 | % | | | 14.62 | % | | 13.73% |
| Dividend payout ratio | | 23.06 | % | | | 13.65 | % | | - |
| Average equity to average assets ratio | | 12.47 | % | | | 10.75 | % | | 9.25% |
Off-Balance Sheet Arrangements
In the normal course of business, the Company makes commitments to extend credit to its customers as long as there are no violations of any conditions established in contractual arrangements. These commitments are obligations that represent a potential credit risk to the Company, yet are not reflected in any form within the Company’s consolidated balance sheets. Total unused commitments to extend credit were $465.3 million at December 31, 2007, as compared to $322.2 million at December 31, 2006. Unused commitments represented 45% of outstanding gross loans at December 31, 2007 and 2006.
The effect on the Company’s revenues, expenses, cash flows and liquidity from the unused portion of the commitments to provide credit cannot be reasonably predicted, because there is no certainty that the lines of credit will ever be fully utilized. For more information regarding the Company’s off-balance sheet arrangements, see Note 14 to the financial statements located elsewhere herein.
The following table presents the Company’s commitments to fund as of December 31, 2007, 2006, and 2005:
| | | December 31, |
| (Dollars in thousands) | | 2007 | | 2006 | | 2005 |
| Commitments to extend credit | | $ | 444,172 | | $ | 310,200 | | $ | 328,031 |
| Standby letters of credit | | | 21,143 | | | 12,020 | | | 6,104 |
| Commitments to funds | | $ | 465,315 | | $ | 322,220 | | $ | 334,135 |
| | | | | | | | | | |
Contractual Obligations
The contractual obligations of the Company, summarized by type of obligation and contractual maturity, at December 31, 2007, are as follows:
| | | Less Than | | One to | | Three to | | After | | |
| (Dollars in thousands) | | One Year | | Three Years | | Five Years | | Five Years | | Total |
| Securities sold under agreement to repurchase | | $ | 10,900 | | $ | - | | $ | - | | $ | - | | $ | 10,900 |
| Notes payable to subsidiary grantor trusts | | | - | | | - | | | - | | | 23,702 | | | 23,702 |
| Other short-term borrowings | | | 60,000 | | | - | | | - | | | - | | | 60,000 |
| Operating leases | | | 2,142 | | | 4,197 | | | 4,077 | | | 4,203 | | | 14,619 |
| Time deposits of $100 or more | | | 162,662 | | | 16,547 | | | - | | | - | | | 179,209 |
| Total debt and operating leases | | $ | 235,704 | | $ | 20,744 | | $ | 4,077 | | $ | 27,905 | | $ | 288,430 |
| | | | | | | | | | | | | | | | |
In addition to those obligations listed above, in the normal course of business, the Company will make cash distributions for the payment of interest on interest bearing deposit accounts and debt obligations, payments for quarterly income tax estimates and contributions to certain employee benefit plans.
Liquidity and Asset/Liability Management
Liquidity refers to the Company’s ability to maintain cash flows sufficient to fund operations, and to meet obligations and other commitments in a timely and cost-effective fashion. At various times the Company requires funds to meet short-term cash requirements brought about by loan growth or deposit outflows, the purchase of assets, or liability repayments. To manage liquidity needs properly, cash inflows must be timed to coincide with anticipated outflows or sufficient liquidity resources must be available to meet varying demands. The Company manages liquidity in such a fashion as to be able to meet unexpected sudden changes in levels of its assets or deposit liabilities without maintaining excessive amounts of on-balance sheet liquidity. Excess balance sheet liquidity can negatively impact the interest margin.
An integral part of the Company’s ability to manage its liquidity position appropriately is the Company’s large base of core deposits, which are generated by offering traditional banking services in its service area and which have, historically, been a stable source of funds. In addition to core deposits, the Company has the ability to raise deposits through various deposit brokers if required for liquidity purposes. The Company’s net loan to deposit ratio increased to 96% at the end of 2007 from 86% at the end of 2006.
To meet liquidity needs, the Company maintains a portion of its funds in cash deposits at other banks, in Federal funds sold and in securities available for sale. The “primary liquidity ratio” is composed of net cash, non-pledged securities, and other marketable assets, divided by total deposits and short-term liabilities minus liabilities secured by investments or other marketable assets. As of December 31, 2007, the Company’s primary liquidity ratio was 7.7%, comprised of $46.7 million in securities available-for-sale of maturities of up to five years, less $15.0 million of securities that were pledged to secure public and certain other deposits as required by law or contract, Federal funds sold of $9.3 million, and $39.8 million cash and due from banks, as a percentage of total unsecured deposits of $1,049.3 million. The decrease in the liquidity ratio from 2006 was primarily due to the growth of loans in 2007. As of December 31, 2006, the Company’s “primary liquidity ratio” was 13.6%, comprised of $75.5 million in securities available-for-sale of maturities of up to five years, less $10.9 million of securities that were pledged to secure public and certain other deposits as required by law and contract, Federal funds sold of $15.1 million and $34.3 million in cash and due from banks, as a percentage of total unsecured deposits of $835.7 million.
The following table summarizes the Company’s borrowings under its Federal funds purchased, security repurchase arrangements and lines of credit for the periods indicated:
| | | December 31, |
| (Dollars in thousands) | | 2007 | | 2006 | | 2005 |
| Average balance during the year | | $ | 16,255 | | $ | 25,429 | | $ | 40,748 |
| Average interest rate during the year | | | 2.90% | | | 2.46% | | | 2.26% |
| Maximum month-end balance | | $ | 70,900 | | $ | 32,700 | | $ | 57,800 |
| Average rate at December 31, | | | 2.83% | | | 2.56% | | | 2.34% |
Because most of the growth in loans in 2007 was funded with deposits, other liquidity ratios tracked by the Company, such as unfunded loan commitments to secondary reserves ratio, have been slightly outside of policy guidelines for several months. We continue to watch these ratios closely, and expect that these ratios will come back within guidelines.
Capital Resources
At December 31, 2007, the Company had total shareholders’ equity of $164.8 million included $92.4 million in common stock, $73.3 million in retained earnings, and $0.9 million of accumulated other comprehensive loss.
The Company paid cash dividends totaling $3.25 million, or $0.26 per share in 2007. The Company anticipates paying future dividends within the range of typical peer payout ratios provided, however, that no assurance can be given that earnings and/or growth expectations in any given year will justify the payment of such a dividend.
The Company uses a variety of measures to evaluate capital adequacy. Management reviews various capital measurements on a regular basis and takes appropriate action to ensure that such measurements are within established internal and external guidelines. The external guidelines, which are issued by the Federal Reserve Board and the FDIC, establish a risk-adjusted ratio relating capital to different categories of assets and off-balance sheet exposures. There are two categories of capital under the Federal Reserve Board and FDIC guidelines: Tier 1 and Tier 2 Capital. Our Tier 1 Capital currently includes common shareholders’ equity and the proceeds from the issuance of trust preferred securities (trust preferred securities are counted only up to a maximum of 25% of Tier 1 capital), less intangible assets, and the addition of the unrealized net losses (after tax adjustments) on securities available for sale and accumulated net losses on cash flow hedges, which are carried at fair market value. Our Tier 2 Capital includes the amount of trust preferred securities not includible in Tier 1 Capital, and the allowances for loan losses and off balance sheet credit losses.
The following table summarizes risk-based capital, risk-weighted assets, and risk-based capital ratios of the Company:
| | | December 31, | | |
| (Dollars in thousands) | | 2007 | | 2006 | | 2005 | | |
| Capital components: | | | | | | | | |
| Tier 1 Capital | | $ | 141,227 | | $ | 147,600 | | $ | 133,715 | | |
| Tier 2 Capital | | | 12,461 | | | 9,756 | | | 10,427 | | |
| Total risk-based capital | | $ | 153,688 | | $ | 157,356 | | $ | 144,142 | | |
| | | | | | | | | | | | |
| Risk-weighted assets | | $ | 1,227,628 | | $ | 855,715 | | $ | 941,567 | | |
| Average assets (regulatory purposes) | | $ | 1,278,207 | | $ | 1,087,502 | | $ | 1,157,704 | | |
| | | | | | | | | | | | Well Capitalized |
| | | | | | | | | | | | Regulatory |
| Capital ratios: | | | | | | | | | | | Requirements |
| Total risk-based capital | | | 12.5% | | | 18.4% | | | 15.3% | | 10.00% |
| Tier 1 risk-based capital | | | 11.5% | | | 17.3% | | | 14.2% | | 6.00% |
Leverage (1) | | | 11.1% | | | 13.6% | | | 11.6% | | 5.00% |
(1) Tier 1 capital divided by average assets (excluding goodwill).
The table above presents the capital ratios of the Company computed in accordance with applicable regulatory guidelines and compared to the standards for minimum capital adequacy requirements under the FDIC’s prompt corrective action authority as of December 31, 2007. The risk-based and leverage capital ratios are defined in Item 1 - “Business - Supervision and Regulation – Heritage Bank of Commerce” on page 10 and 11.
At December 31, 2007, 2006 and 2005, the Company’s capital met all minimum regulatory requirements. As of December 31, 2007, 2006 and 2005, management believes that HBC was considered “well capitalized” under the regulatory framework for prompt corrective action.
Mandatory Redeemable Cumulative Trust Preferred Securities.
To enhance regulatory capital and to provide liquidity, the Company, through unconsolidated subsidiary grantor trusts, issued the following mandatory redeemable cumulative trust preferred securities of subsidiary grantor trusts: In the first quarter of 2000, the Company issued $7 million aggregate principal amount of 10.875% subordinated debentures due on March 8, 2030 to a subsidiary trust, which in turn issued a similar amount of trust preferred securities. In the third quarter of 2000, the Company issued $7 million aggregate principal amount of 10.60% subordinated debentures due on September 7, 2030 to a subsidiary trust, which in turn issued a similar amount of trust preferred securities. In the third quarter of 2001, the Company issued $5 million aggregate principal amount of Floating Rate Junior Subordinated Deferrable Interest Debentures due on July 31, 2031 to a subsidiary trust, which in turn issued a similar amount of trust preferred securities. In the third quarter of 2002, the Company issued $4 million aggregate principal amount of Floating Rate Junior Subordinated Deferrable Interest Debentures due on September 26, 2032 to a subsidiary trust, which in turn issued a similar amount of trust preferred securities. Under applicable regulatory guidelines, the trust preferred securities currently qualify as Tier I capital. The subsidiary trusts are not consolidated in the Company’s consolidated financial statements and the subordinated debt payable to the subsidiary grantor trusts is recorded as debt of the Company to the related trusts. See Footnote 8 the Consolidated Financial Statements.
Market risk is the risk of loss to future earnings, to fair values, or to future cash flows that may result from changes in the price of a financial instrument. The value of a financial instrument may change as a result of changes in interest rates, foreign currency exchange rates, commodity prices, equity prices and other market changes that affect market risk sensitive instruments. Market risk is attributed to all market risk sensitive financial instruments, including securities, loans, deposits and borrowings, as well as the Company’s role as a financial intermediary in customer-related transactions. The objective of market risk management is to avoid excessive exposure of the Company’s earnings and equity to loss and to reduce the volatility inherent in certain financial instruments.
Market risk arises from changes in interest rates, exchange rates, commodity prices and equity prices. The Company’s market risk exposure is primarily that of interest rate risk, and it has established policies and procedures to monitor and limit earnings and balance sheet exposure to changes in interest rates. The Company does not engage in the trading of financial instruments, nor does the Company have exposure to currency exchange rates.
The principal objective of interest rate risk management (often referred to as “asset/liability management”) is to manage the financial components of the Company in a manner that will optimize the risk/reward equation for earnings and capital in relation to changing interest rates. The Company’s exposure to market risk is reviewed on a regular basis by the Asset/Liability Committee (“ALCO”). Interest rate risk is the potential of economic losses due to future interest rate changes. These economic losses can be reflected as a loss of future net interest income and/or a loss of current fair market values. The objective is to measure the effect on net interest income and to adjust the balance sheet to minimize the inherent risk while at the same time maximizing income. Management realizes certain risks are inherent, and that the goal is to identify and accept the risks. Management uses two methodologies to manage interest rate risk: (i) a standard GAP analysis; and (ii) an interest rate shock simulation model.
The planning of asset and liability maturities is an integral part of the management of an institution’s net interest margin. To the extent maturities of assets and liabilities do not match in a changing interest rate environment, the net interest margin may change over time. Even with perfectly matched repricing of assets and liabilities, risks remain in the form of prepayment of loans or securities or in the form of delays in the adjustment of rates of interest applying to either earning assets with floating rates or to interest bearing liabilities. The Company has generally been able to control its exposure to changing interest rates by maintaining primarily floating interest rate loans and a majority of its time certificates with relatively short maturities.
Interest rate changes do not affect all categories of assets and liabilities equally or at the same time. Varying interest rate environments can create unexpected changes in prepayment levels of assets and liabilities, which may have a significant effect on the net interest margin and are not reflected in the interest sensitivity analysis table. Because of these factors, an interest sensitivity gap report may not provide a complete assessment of the exposure to changes in interest rates.
The Company uses modeling software for asset/liability management in order to simulate the effects of potential interest rate changes on the Company’s net interest margin, and to calculate the estimated fair values of the Company’s financial instruments under different interest rate scenarios. The program imports current balances, interest rates, maturity dates and repricing information for individual financial instruments, and incorporates assumptions on the characteristics of embedded options along with pricing and duration for new volumes to project the effects of a given interest rate change on the Company’s interest income and interest expense. Rate scenarios consisting of key rate and yield curve projections are run against the Company’s investment, loan, deposit and borrowed funds portfolios. These rate projections can be shocked (an immediate and parallel change in all base rates, up or down), ramped (an incremental increase or decrease in rates over a specified time period), based on current trends and econometric models or economic conditions stable (unchanged from current actual levels).
The Company applies a market value (“MV”) methodology to gauge its interest rate risk exposure as derived from its simulation model. Generally, MV is the discounted present value of the difference between incoming cash flows on interest earning assets and other investments and outgoing cash flows on interest bearing liabilities and other liabilities. The application of the methodology attempts to quantify interest rate risk as the change in the MV which would result from a theoretical 200 basis point (1 basis point equals 0.01%) change in market interest rates. Both a 200 basis point increase and a 200 basis point decrease in market rates are considered.
At December 31, 2007, it was estimated that the Company’s MV would increase 18.54% in the event of a 200 basis point increase in market interest rates. The Company’s MV at the same date would decrease 26.35% in the event of a 200 basis point decrease in market interest rates.
Presented below, as of December 31, 2007 and 2006, is an analysis of the Company’s interest rate risk as measured by changes in MV for instantaneous and sustained parallel shifts of 200 basis points in market interest rates:
| | | 2007 | | 2006 |
| | | $ Change | | % Change | | Market Value as a % of | | $ Change | | % Change | | Market Value as a % of |
| | | in Market | | in Market | | Present Value of Assets | | in Market | | in Market | | Present Value of Assets |
| (Dollars in thousands) | | Value | | Value | | MV Ratio | | Change (bp) | | Value | | Value | | MV Ratio | | Change (bp) |
| Change in rates | | | | | | | | | | | | | | | | | | | | | | | | |
| + 200 bp | | $ | 38,716 | | | 18.54% | | | 18.5% | | | 290 | | $ | 31,607 | | | 17.16% | | | 21.1% | | | 309 |
| 0 bp | | $ | - | | | -% | | | 15.6% | | | - | | $ | - | | | -% | | | 18.0% | | | - |
| - 200 bp | | $ | (55,007) | | | -26.35% | | | 11.5% | | | (412) | | $ | (45,606) | | | -24.76% | | | 13.6% | | | (446) |
Management believes that the MV methodology overcomes three shortcomings of the typical maturity gap methodology. First, it does not use arbitrary repricing intervals and accounts for all expected future cash flows. Second, because the MV method projects cash flows of each financial instrument under different interest rate environments, it can incorporate the effect of embedded options on an institution’s interest rate risk exposure. Third, it allows interest rates on different instruments to change by varying amounts in response to a change in market interest rates, resulting in more accurate estimates of cash flows.
However, as with any method of gauging interest rate risk, there are certain shortcomings inherent to the MV methodology. The model assumes interest rate changes are instantaneous parallel shifts in the yield curve. In reality, rate changes are rarely instantaneous. The use of the simplifying assumption that short-term and long-term rates change by the same degree may also misstate historic rate patterns, which rarely show parallel yield curve shifts. Further, the model assumes that certain assets and liabilities of similar maturity or period to repricing will react in the same way to changes in rates. In reality, certain types of financial instruments may react in advance of changes in market rates, while the reaction of other types of financial instruments may lag behind the change in general market rates. Additionally, the MV methodology does not reflect the full impact of annual and lifetime restrictions on changes in rates for certain assets, such as adjustable rate loans. When interest rates change, actual loan prepayments and actual early withdrawals from certificates may deviate significantly from the assumptions used in the model. Finally, this methodology does not measure or reflect the impact that higher rates may have on adjustable-rate loan clients’ ability to service their debt. All of these factors are considered in monitoring the Company’s exposure to interest rate risk.
| CRITICAL ACCOUNTING POLICIES |
General
The Company’s consolidated financial statements are prepared in accordance with accounting principles generally accepted in the United States of America (“GAAP”). The financial information contained within our consolidated financial statements is, to a significant extent, based on approximate measures of the financial effects of transactions and events that have already occurred. A variety of factors could affect the ultimate value that is obtained either when earning income, recognizing an expense, recovering an asset or relieving a liability. In certain instances, we use a discount factor and prepayment assumptions to determine the present value of assets and liabilities. A change in the discount factor or prepayment speeds could increase or decrease the values of those assets and liabilities which would result in either a beneficial or adverse impact to our financial results. We use historical loss factors as one factor in determining the inherent loss that may be present in our loan portfolio. Actual losses could differ significantly from the historical factors that we use. The Company adopted Statement 123R on January 1, 2006, and elected the modified prospective method, under which prior periods are not revised for comparative purposes. Other estimates that we use are related to the expected useful lives of our depreciable assets. In addition, GAAP itself may change from one previously acceptable method to another method, although the economics of our transactions would be the same.
Allowance for Loan Losses
The allowance for loan losses is an estimate of the losses in our loan portfolio. Our accounting for estimated loan losses is discussed under the heading “Allowance for Loan Losses” beginning on page 34.
Loan Sales and Servicing
The amounts of gains recorded on sales of loans and the initial recording of servicing assets and I/O strips are based on the estimated fair values of the respective components. In recording the initial value of the servicing assets and the fair value of the I/O strips receivable, the Company uses estimates which are made on management’s expectations of future prepayment and discount rates as discussed in Note 3 to the consolidated financial statements.
Stock Based Compensation
We grant stock options to purchase our common stock to our employees and directors under the 2004 Plan. We also granted our chief executive officer restricted stock when he joined the Company. Additionally, we have outstanding options that were granted under an option plan from which we no longer make grants. The benefits provided under all of these plans are subject to the provisions of FASB Statement 123(Revised), “Share-Based Payments,” which we adopted effective January 1, 2006. We elected to use the modified prospective application in adopting Statement 123R and therefore have not restated results for prior periods. The valuation provisions of Statement 123R apply to new awards and to awards that are outstanding on the adoption date and subsequently modified or cancelled. Our results of operations for 2007 and 2006 were impacted by the recognition of non cash expense related to the fair value of our share-based compensation awards as discussed in Notes 1 and 10 to the consolidated financial statements.
The determination of fair value of stock-based payment awards on the date of grant using the Black-Scholes model is affected by our stock price, as well as the input of other subjective assumptions. These assumptions include, but are not limited to, the expected term of stock options and our expected stock price volatility over the term of the awards. Our stock options have characteristics significantly different from those of traded options, and changes in the assumptions can materially affect the fair value estimates.
Statement 123R requires forfeitures to be estimated at the time of grant and revised, if necessary, in subsequent periods if actual forfeitures differ from those estimates. If actual forfeitures vary from our estimates, we will recognize the difference in compensation expense in the period the actual forfeitures occur or when options vest.
Our accounting for stock options is disclosed primarily in Notes 1 and 10 to the consolidated financial statements.
Accounting for goodwill and other intangible assets
The Company accounts for acquisitions using the purchase method of accounting. Under the purchase method, assets acquired and liabilities assumed are recorded at their estimated fair values at the date of acquisition. Management utilizes various valuation techniques including discounted cash flow analyses to determine these fair values. Any excess of the purchase price over amounts allocated to the acquired assets, including identifiable intangible assets, and liabilities assumed is recorded as goodwill.
Goodwill and intangible assets are evaluated at least annually for impairment or more frequently if events or circumstances, such as changes in economic or market conditions, indicate that impairment may exist. Goodwill is tested for impairment at the reporting unit level. A reporting unit is an operating segment or one level below an operating segment for which discrete financial information is available and regularly reviewed by management. If the fair value of the reporting unit including goodwill is determined to be less than the carrying amount of the reporting unit, a further test is required to measure the amount of impairment. If an impairment loss exists, the carrying amount of the goodwill is adjusted to a new cost basis. For purposes of the goodwill impairment test, fair value techniques based on multiples of earnings or book value are used to determine the fair value of the Company’s reporting units. Management believes the multiples used in these calculations are consistent with current industry practice for valuing similar types of companies.
Intangible assets consist of core deposit intangibles and customer relationship intangible assets arising from the acquisition of Diablo Valley Bank in 2007. These assets are amortized over their estimated useful lives. Impairment testing of these assets is performed at the individual asset level. Impairment exists if the carrying amount of the asset exceeds its fair value at the date of the impairment test. For intangible assets, estimates of expected future cash flows (cash inflows less cash outflows) that are directly associated with an intangible asset are used to determine the fair value of that asset. Management makes certain estimates and assumptions in determining the expected future cash flows from core deposit and customer relationship intangibles including account attrition, expected lives, discount rates, interest rates, servicing costs and other factors. Significant changes in these estimates and assumptions could adversely impact the valuation of these intangible assets.
If an impairment loss exists, the carrying amount of the intangible asset is adjusted to a new cost basis. The new cost basis is amortized over the remaining useful life of the asset.
| ITEM 7A - QUANTITATIVE AND QUALITATIVE DISCLOSURES ABOUT MARKET RISK |
As a financial institution, the Company’s primary component of market risk is interest rate volatility. Fluctuations in interest rates will ultimately impact both the level of income and expense recorded on most of the Company’s assets and liabilities, and the market value of all interest-earning assets, other than those which have a short term to maturity. Based upon the nature of the Company’s operations, the Company is not subject to foreign exchange or commodity price risk. The Company has no market risk sensitive instruments held for trading purposes. As of December 31, 2007, the Company does not use interest rate derivatives to hedge its interest rate risk.
The information concerning quantitative and qualitative disclosure or market risk called for by Item 305 of Regulation S-K is included as part of Item 7 above. See page 41.
| ITEM 8 - FINANCIAL STATEMENTS AND SUPPLEMENTARY DATA |
The financial statements and report of the Independent Registered Public Accounting Firm are set forth on pages 49 through 77.
| ITEM 9 – CHANGES IN AND DISAGREEMENTS WITH ACCOUNTANTS ON ACCOUNTING AND FINANCIAL DISCLOSURES |
| ITEM 9A – CONTROLS AND PROCEDURES |
The Company has carried out an evaluation, under the supervision and with the participation of the Company’s management, including the Chief Executive Officer and Chief Financial Officer, of the effectiveness of the design and operation of the Company’s disclosure controls and procedures as of December 31, 2007. As defined in Rule 13a-15(e) under the Securities Exchange Act of 1934, as amended (the “Exchange Act”), disclosure controls and procedures are controls and procedures designed to reasonably assure that information required to be disclosed in our reports filed or submitted under the Exchange Act are recorded, processed, summarized and reported on a timely basis. Disclosure controls are also designed to reasonably assure that such information is accumulated and communicated to our management, including the Chief Executive Officer and Chief Financial Officer, as appropriate, to allow timely decisions regarding required disclosure. Based upon their evaluation, our Chief Executive Officer and Chief Financial Officer concluded the Company’s disclosure controls were effective as of December 31, 2007, the period covered by this report on Form 10K.
Management’s Annual Report on Internal Control over Financial Reporting
Management of the Company is responsible for establishing and maintaining adequate internal control over financial reporting. As defined in Rule 13a-15(f) under the Exchange Act, internal control over financial reporting is a process designed by, or under the supervision of, a company’s principal executive and principal financial officers and effected by a company’s board of directors, management and other personnel, to provide reasonable assurance regarding the reliability of financial reporting and the preparation of financial statements for external purposes in accordance with generally accepted accounting principles. It includes those policies and procedures that:
| · | Pertain to the maintenance of records that in reasonable detail accurately and fairly reflect the transactions and dispositions of the assets of a company; |
| · | Provide reasonable assurance that transactions are recorded as necessary to permit preparation of financial statements in accordance with generally accepted accounting principles, and that receipts and expenditures of a company are being made only in accordance with authorizations of management and the board of directors of the company; and |
| · | Provide reasonable assurance regarding prevention or timely detection of unauthorized acquisition, use or disposition of a company’s assets that could have a material effect on its financial statements. |
Because of the inherent limitations, internal control over financial reporting may not prevent or detect misstatements. Also, projections of any evaluation of effectiveness to future periods are subject to the risk that controls may become inadequate because of changes in conditions, or that the degree of compliance with the policies or procedures may deteriorate.
The Company’s management has used the criteria established in “Internal Control-Integrated Framework” issued by the Committee of Sponsoring Organizations of the Treadway Commission (“COSO”) to evaluate the effectiveness of the Company’s internal control over financial reporting. Based on our assessment, management has concluded that our internal control over financial reporting, based on criteria established in “Internal Control-Integrated Framework” issued by COSO was effective as of December 31, 2007.
The Company’s independent registered public accounting firm has audited the Company’s internal control over financial reporting. The report of Crowe Chizek and Company LLP precedes the consolidated financial statements in this annual report.
| Inherent Limitations on Effectiveness of Controls |
The Company’s management, including the CEO and CFO, does not expect that our disclosure controls or our internal control over financial reporting will prevent or detect all error and all fraud. A control system, no matter how well designed and operated, can provide only reasonable, not absolute, assurance that the control system’s objectives will be met. The design of a control system must reflect the fact that there are resource constraints, and the benefits of controls must be considered relative to their costs. Further, because of the inherent limitations in all control systems, no evaluation of controls can provide absolute assurance that misstatements due to error or fraud will not occur or that all control issues and instances of fraud, if any, within the company have been detected. These inherent limitations include the realities that judgments in decision-making can be faulty and that breakdowns can occur because of simple error or mistake. Controls can also be circumvented by the individual acts of some persons, by collusion of two or more people, or by management override of the controls. The design of any system of controls is based in part on certain assumptions about the likelihood of future events, and there can be no assurance that any design will succeed in achieving its stated goals under all potential future conditions. Projections of any evaluation of controls effectiveness to future periods are subject to risks. Over time, controls may become inadequate because of changes in conditions or deterioration in the degree of compliance with policies or procedures.
| Changes in Internal Control over Financial Reporting |
There was no change in our internal control over financial reporting that occurred during the quarter ended December 31, 2007 that has materially affected or is reasonably likely to materially affect our internal control over financial reporting.
| ITEM 9B – OTHER INFORMATION |
None
PART III
| ITEM 10 – DIRECTORS, EXECUTIVE OFFICERS AND CORPORATE GOVERNACE |
We have adopted a code of ethics that applies to our Chief Executive Officer, Chief Financial Officer, and to our other principal financial officers. The code of ethics is available at the Governance Documents section of our website at www.heritagecommercecorp.com. We intend to disclose future amendments to, or waivers from, certain provisions of our code of ethics on the above website within four business days following the date of such amendment or waiver.
| ITEM 11 - EXECUTIVE COMPENSATION |
| ITEM 12 - SECURITY OWNERSHIP OF CERTAIN BENEFICIAL OWNERS AND MANAGEMENT AND RELATED STOCKHOLDER MATTERS |
| ITEM 13 - CERTAIN RELATIONSHIPS AND RELATED TRANSACTIONS |
| ITEM 14 – PRINCIPAL ACCOUNTANT FEES AND SERVICES |
Information required by this item will be contained in our Definitive Proxy Statement for our 2008 Annual Meeting of Shareholders, to be filed pursuant to Regulation 14A, with the Securities and Exchange Commission within 120 days of December 31, 2007. Such information is incorporated herein by reference.
PART IV
| ITEM 15 - EXHIBITS AND FINANCIAL STATEMENT SCHEDULES |
(a)(1) FINANCIAL STATEMENTS
The Financial Statements of the Company and the Report of Independent Registered Public Accounting Firm are set forth on pages 49 through 77.
(a)(2) FINANCIAL STATEMENT SCHEDULES
All schedules to the Financial Statements are omitted because of the absence of the conditions under which they are required or because the required information is included in the Financial Statements or accompanying notes.
(a)(3) EXHIBITS
The exhibit list required by this Item is incorporated by reference to the Exhibit Index included in this report.
SIGNATURES
Pursuant to the requirements of Section 13 or 15(d) of the Securities Exchange Act of 1934, the Company has duly caused this report on Form 10-K to be signed on its behalf by the undersigned thereunto duly authorized.
| | Heritage Commerce Corp |
| DATE: March 17, 2008 | BY: /s/ Walter T. Kaczmarek Walter T. Kaczmarek Chief Executive Officer |
Pursuant to the requirements of Section 13 of the Securities Exchange Act of 1934, the registrant has duly caused this report to be signed below by the following persons on behalf of the registrant and in the capacities and on the date indicated:
| Signature | Title | Date |
/s/ FRANK BISCEGLIA Frank Bisceglia | Director | March 17, 2008 |
/s/ JAMES BLAIR James Blair | Director | March 17, 2008 |
/s/ JACK CONNER Jack Conner | Director and Chairman of the Board | March 17, 2008 |
/s/ WILLIAM DEL BIAGGIO, JR. William Del Biaggio, Jr. | Director | March 17, 2008 |
/s/ WALTER T. KACZMAREK Walter T. Kaczmarek | Director and Chief Executive Officer and President (Principle Executive Officer) | March 17, 2008 |
/s/ LAWRENCE D. MCGOVERN Lawrence D. McGovern | Executive Vice President and Chief Financial Officer (Principal Financial and Accounting Officer) | March 17, 2008 |
/s/ ROBERT MOLES Robert Moles | Director | March 17, 2008 |
/s/ LON NORMANDIN Lon Normandin | Director | March 17, 2008 |
/s/ JACK PECKHAM Jack Peckham | Director | March 17, 2008 |
/s/ HUMPHREY POLANEN Humphrey Polanen | Director | March 17, 2008 |
/s/ CHARLES TOENISKOETTER Charles Toeniskoetter | Director | March 17, 2008 |
/s/ RANSON WEBSTER Ranson Webster | Director | March 17, 2008 |
/s/ JOHN J. HOUNSLOW John J. Hounslow | Director | March 17, 2008 |
/s/ MARK LEFANOWICZ Mark Lefanowicz | Director | March 17, 2008 |
INDEX TO FINANCIAL STATEMENTS
DECEMBER 31, 2007
| | Page |
| Report of Independent Registered Public Accounting Firm | 49 |
| Consolidated Balance Sheets as of December 31, 2007 and 2006 | 50 |
Consolidated Income Statements for the years ended December 31, 2007, 2006 and 2005 | 51 |
Consolidated Statements of Changes in Shareholders’ Equity for the years ended December 31, 2007, 2006 and 2005 | 52 |
Consolidated Statements of Cash Flows for the years ended December 31, 2007, 2006 and 2005 | 53 |
Notes to Consolidated Financial Statements | 55 |
REPORT OF INDEPENDENT REGISTERED PUBLIC ACCOUNTING FIRM
Board of Directors
Heritage Commerce Corp
San Jose, California
We have audited the accompanying consolidated balance sheets of Heritage Commerce Corp as of December 31, 2007 and 2006, and the related consolidated income statements, statements of changes in shareholders’ equity and statements of cash flows for each of the three years in the period ended December 31, 2007. We also have audited Heritage Commerce Corp’s internal control over financial reporting as of December 31, 2007, based on criteria established in Internal Control—Integrated Framework issued by the Committee of Sponsoring Organizations of the Treadway Commission (COSO). Heritage Commerce Corp’s management is responsible for these financial statements, for maintaining effective internal control over financial reporting, and for its assessment of the effectiveness of internal control over financial reporting in the accompanying Management’s Annual Report on Internal Control over Financial Reporting included in Item 9A in Form 10-K. Our responsibility is to express an opinion on these financial statements and an opinion on the Company’s internal control over financial reporting based on our audits.
We conducted our audits in accordance with the standards of the Public Company Accounting Oversight Board (United States). Those standards require that we plan and perform the audits to obtain reasonable assurance about whether the financial statements are free of material misstatement and whether effective internal control over financial reporting was maintained in all material respects. Our audits of the financial statements included examining, on a test basis, evidence supporting the amounts and disclosures in the financial statements, assessing the accounting principles used and significant estimates made by management, and evaluating the overall financial statement presentation. Our audit of internal control over financial reporting included obtaining an understanding of internal control over financial reporting, assessing the risk that a material weakness exists, and testing and evaluating the design and operating effectiveness of internal control based on the assessed risk. Our audits also included performing such other procedures as we considered necessary in the circumestances. We believe that our audits provide a reasonable basis for our opinions.
A company’s internal control over financial reporting is a process designed to provide reasonable assurance regarding the reliability of financial reporting and the preparation of financial statements for external purposes in accordance generally accepted accounting principles. A company’s internal control over financial reporting includes those policies and procedures that (1) pertain to the maintenance of records that, in reasonable detail, accurately and fairly reflect the transactions and dispositions of the assets of the company; (2) provide reasonable assurance that transactions are recorded as necessary to permit preparation of financial statements in accordance with generally accepted accounting principles, and that receipts and expenditures of the company are being made only in accordance with authorizations of management and directors of the company; and (3) provide reasonable aasurance regarding prevention or timely detection of unauthorized acquisition, use, or disposition of the compnay’s assets that could have a material effect on the financial statements.
Because of its inherent limitations, internal control over financial reporting may not prevent or detect misstatements. Also, projections of any evaluation of effectiveness to future periods are subject to the risk that controls may become inadequate because of changes in conditions, or that the degree of compliance with the policies or procedures may deteriorate.
In our opinion, the consolidated financial statements referred to above present fairly, in all material respects, the financial position of Heritage Commerce Corp as of December 31, 2007 and 2006, and the results of its operations and its cash flows for each of the three years in the period ended December 31, 2007 in conformity with accounting principles generally accepted in the United States of America. Also in our opinion, Heritage Commerce Corp maintained, in all material respects, effective internal control over financial reporting as of December 31, 2007, based on criteria established in Internal Control—Integrated Framework issued by the Committee of Sponsoring Organizations of the Treadway Commission (COSO).
/s/ Crowe Chizek and Company LLP
Oak Brook, Illinois
March 17 , 2008
| HERITAGE COMMERCE CORP |
| CONSOLIDATED BALANCE SHEETS |
| | | December 31, | | December 31, |
| (Dollars in thousands) | | 2007 | | 2006 |
| Assets | | | | |
| Cash and due from banks | | $ | 39,793 | | $ | 34,285 |
| Federal funds sold | | | 9,300 | | | 15,100 |
| Total cash and cash equivalents | | | 49,093 | | | 49,385 |
| Securities available for sale, at fair value | | | 135,402 | | | 172,298 |
| Loans held for sale, at lower of cost or market | | | - | | | 33,752 |
| Loans, net of deferred costs | | | 1,036,465 | | | 709,236 |
| Allowance for loan losses | | | (12,218) | | | (9,279) |
| Loans, net | | | 1,024,247 | | | 699,957 |
| Federal Home Loan Bank and Federal Reserve Bank stock, at cost | | | 7,002 | | | 6,113 |
| Company owned life insurance | | | 38,643 | | | 36,174 |
| Premises and equipment, net | | | 9,308 | | | 2,539 |
| Goodwill | | | 43,181 | | | - |
| Intangible assets | | | 4,972 | | | - |
| Accrued interest receivable and other assets | | | 35,624 | | | 36,920 |
| Total assets | | $ | 1,347,472 | | $ | 1,037,138 |
| | | | | | | |
| Liabilities and Shareholders' Equity | | | | | | |
| Liabilities: | | | | | | |
| Deposits | | | | | | |
| Demand, noninterest bearing | | $ | 268,005 | | $ | 231,841 |
| Demand, interest bearing | | | 150,527 | | | 133,413 |
| Savings and money market | | | 432,293 | | | 307,266 |
| Time deposits, under $100 | | | 34,092 | | | 31,097 |
| Time deposits, $100 and over | | | 139,562 | | | 111,017 |
| Brokered deposits | | | 39,747 | | | 31,959 |
| Total deposits | | | 1,064,226 | | | 846,593 |
| Notes payable to subsidiary grantor trusts | | | 23,702 | | | 23,702 |
| Securities sold under agreement to repurchase | | | 10,900 | | | 21,800 |
| Other short-term borrowings | | | 60,000 | | | - |
| Accrued interest payable and other liabilities | | | 23,820 | | | 22,223 |
| Total liabilities | | | 1,182,648 | | | 914,318 |
| | | | | | | |
| Shareholders' equity: | | | | | | |
| Preferred stock, no par value; 10,000,000 | | | | | | |
| shares authorized; none outstanding | | | - | | | - |
| Common Stock, no par value; 30,000,000 shares authorized; | | | | | | |
| shares outstanding: 12,774,926 in 2007 and 11,656,943 in 2006 | | | 92,414 | | | 62,363 |
| Retained earnings | | | 73,298 | | | 62,452 |
| Accumulated other comprehensive loss | | | (888) | | | (1,995) |
| Total shareholders' equity | | | 164,824 | | | 122,820 |
| Total liabilities and shareholders' equity | | $ | 1,347,472 | | $ | 1,037,138 |
| | | | | | | |
| | | | | | | |
| See notes to consolidated financial statements | | | | | | |
| HERITAGE COMMERCE CORP |
| CONSOLIDATED INCOME STATEMENTS |
| | | Years Ended December 31, |
| (Dollars in thousands, except per share data) | | 2007 | | 2006 | | 2005 |
| Interest income: | | | | | | |
| Loans, including fees | | $ | 68,405 | | $ | 61,859 | | $ | 54,643 |
| Securities, taxable | | | 7,481 | | | 7,614 | | | 7,042 |
| Securities, non-taxable | | | 155 | | | 182 | | | 205 |
| Interest bearing deposits in other financial institutions | | | 141 | | | 132 | | | 97 |
| Federal funds sold | | | 2,530 | | | 3,170 | | | 1,769 |
| Total interest income | | | 78,712 | | | 72,957 | | | 63,756 |
| | | | | | | | | | |
| Interest expense: | | | | | | | | | |
| Deposits | | | 24,211 | | | 19,588 | | | 12,849 |
| Notes payable to subsidiary grantor trusts | | | 2,329 | | | 2,310 | | | 2,136 |
| Repurchase agreements | | | 387 | | | 627 | | | 922 |
| Other borrowings | | | 85 | | | - | | | - |
| Total interest expense | | | 27,012 | | | 22,525 | | | 15,907 |
| | | | | | | | | | |
| Net interest income before provision for loan losses | | | 51,700 | | | 50,432 | | | 47,849 |
| Provision for loan losses | | | (11) | | | (503) | | | 313 |
| Net interest income after provision for loan losses | | | 51,711 | | | 50,935 | | | 47,536 |
| | | | | | | | | | |
| Noninterest income: | | | | | | | | | |
| Gain on sale of SBA loans | | | 1,766 | | | 3,337 | | | 2,871 |
| Gain on sale of Capital Group loan portfolio | | | - | | | 671 | | | - |
| Servicing income | | | 2,181 | | | 1,860 | | | 1,838 |
| Increase in cash surrender value of life insurance | | | 1,443 | | | 1,439 | | | 1,236 |
| Service charges and fees on deposit accounts | | | 1,284 | | | 1,335 | | | 1,468 |
| Gain on sale of leased equipment | | | - | | | - | | | 299 |
| Equipment leasing | | | - | | | - | | | 131 |
| Other | | | 1,378 | | | 1,198 | | | 1,580 |
| Total noninterest income | | | 8,052 | | | 9,840 | | | 9,423 |
| | | | | | | | | | |
| Noninterest expense: | | | | | | | | | |
| Salaries and employee benefits | | | 21,160 | | | 19,414 | | | 19,845 |
| Occupancy | | | 3,557 | | | 3,110 | | | 3,254 |
| Professional fees | | | 2,342 | | | 1,688 | | | 1,617 |
| Advertising and promotion | | | 1,092 | | | 1,064 | | | 985 |
| Data processing | | | 867 | | | 806 | | | 661 |
| Low income housing investment losses and writedowns | | | 828 | | | 995 | | | 957 |
| Client services | | | 820 | | | 1,000 | | | 1,404 |
| Furniture and equipment | | | 638 | | | 517 | | | 734 |
| Intangible asset amortization | | | 352 | | | - | | | - |
| Retirement plan expense | | | 274 | | | 352 | | | 619 |
| Amortization of leased equipment | | | - | | | - | | | 334 |
| Other | | | 5,600 | | | 5,322 | | | 4,823 |
| Total noninterest expense | | | 37,530 | | | 34,268 | | | 35,233 |
| | | | | | | | | | |
| Income before income taxes | | | 22,233 | | | 26,507 | | | 21,726 |
| Income tax expense | | | 8,137 | | | 9,237 | | | 7,280 |
| Net income | | $ | 14,096 | | $ | 17,270 | | $ | 14,446 |
| | | | | | | | | | |
| Earnings per share: | | | | | | | | | |
| Basic | | $ | 1.14 | | $ | 1.47 | | $ | 1.22 |
| Diluted | | $ | 1.12 | | $ | 1.44 | | $ | 1.19 |
| | | | | | | | | | |
| See notes to consolidated financial statements |
| HERITAGE COMMERCE CORP |
| CONSOLIDATED STATEMENTS OF CHANGES IN SHAREHOLDERS' EQUITY |
| YEARS ENDED DECEMBER 31, 2007, 2006, AND 2005 |
| | | | | | | | | | | | | | | |
| | | | | | | Unearned | | | | Accumulated | | | | | | |
| | | | | Restricted | | Unallocated | | Other | | | | Total | | |
| | | Common Stock | | Stock | | ESOP | | Comprehensive | | Retained | | Shareholders' | | Comprehensive |
| (Dollars in thousands, except shares) | | Shares | | Amount | | Award | | Shares | | Income (Loss) | | Earnings | | Equity | | Income |
| Balance, January 1, 2005 | | | 11,669,837 | | $ | 67,409 | | $ | - | | $ | (193 | ) | $ | (1,730) | | $ | 33,093 | | $ | 98,579 | | |
| Net Income | | | - | | | - | | | - | | | - | | | - | | | 14,446 | | | 14,446 | | $ | 14,446 |
| Net change in unrealized gain/loss on securities | | | | | | | | | | | | | | | | | | | | | |
| available-for-sale and I/O strips, net of reclassification | | | | | | | | | | | | | | | | | | | | | |
| adjustment and deferred income taxes | | | - | | | - | | | - | | | - | | | (664) | | | - | | | (664) | | | (664) |
| Increase in pension liability, net of deferred income taxes | | | - | | | - | | | - | | | - | | | (327) | | | - | | | (327) | | | (327) |
| Total comprehensive income | | | | | | | | | | | | | | | | | | | | | | | $ | 13,455 |
| ESOP shares released | | | - | | | 284 | | | - | | | 193 | | | - | | | - | | | 477 | | | |
| Restricted stock award | | | 51,000 | | | 926 | | | (926) | | | - | | | - | | | - | | | - | | | |
| Amortization of restricted stock award | | | - | | | - | | | 123 | | | - | | | - | | | - | | | 123 | | | |
| Redemption payment on common stock | | | - | | | (12) | | | - | | | - | | | - | | | - | | | (12) | | | |
| Common stock repurchased | | | (300,160) | | | (5,732) | | | - | | | - | | | - | | | - | | | (5,732) | | | |
| Stock options exercised, including related tax benefits | | | 386,972 | | | 4,727 | | | - | | | - | | | - | | | - | | | 4,727 | | | |
| Balance, December 31, 2005 | | | 11,807,649 | | | 67,602 | | | (803) | | | - | | | (2,721) | | | 47,539 | | | 111,617 | | | |
| Net Income | | | - | | | - | | | - | | | - | | | - | | | 17,270 | | | 17,270 | | $ | 17,270 |
| Net change in unrealized gain/loss on securities | | | | | | | | | | | | | | | | | | | | | |
| available-for-sale and I/O strips, net of reclassification | | | | | | | | | | | | | | | | | | | | | |
| adjustment and deferred income taxes | | | - | | | - | | | - | | | - | | | 377 | | | - | | | 377 | | | 377 |
| Decrease in pension liability, net of deferred income taxes | | | - | | | - | | | - | | | - | | | 349 | | | - | | | 349 | | | 349 |
| Total comprehensive income | | | | | | | | | | | | | | | | | | | | | | | $ | 17,996 |
| Reclassification of unearned restricted stock award | | | | | | | | | | | | | | | |
| upon adoption of Statement 123 (revised 2004) | | | - | | | (803) | | | 803 | | | - | | | - | | | - | | | - | | | |
| Amortization of restricted stock award | | | - | | | 154 | | | - | | | - | | | - | | | - | | | 154 | | | |
| Cash dividend declared on common stock, $0.20 per share | | | - | | | - | | | - | | | - | | | - | | | (2,357) | | | (2,357) | | | |
| Common stock repurchased | | | (330,300) | | | (7,888) | | | - | | | - | | | - | | | - | | | (7,888) | | | |
| Stock option expense | | | - | | | 780 | | | - | | | - | | | - | | | - | | | 780 | | | |
| Stock options exercised, including related tax benefits | | | 179,594 | | | 2,518 | | | - | | | - | | | - | | | - | | | 2,518 | | | |
| Balance, December 31, 2006 | | | 11,656,943 | | | 62,363 | | | - | | | - | | | (1,995) | | | 62,452 | | | 122,820 | | | |
| Net Income | | | - | | | - | | | - | | | - | | | - | | | 14,096 | | | 14,096 | | $ | 14,096 |
| Net change in unrealized gain/loss on securities | | | | | | | | | | | | | | | | | | | | | |
| available-for-sale and I/O strips, net of reclassification | | | | | | | | | | | | | | | | | | | | | |
| adjustment and deferred income taxes | | | - | | | - | | | - | | | - | | | 1,028 | | | - | | | 1,028 | | | 1,028 |
| Decrease in pension liability, net of deferred income taxes | | | - | | | - | | | - | | | - | | | 79 | | | - | | | 79 | | | 79 |
| Total comprehensive income | | | | | | | | | | | | | | | | | | | | | | | $ | 15,203 |
| Issuance of 1,732,298 shares to acquire Diablo | | | | | | | | | | | | | | | | | |
| Valley Bank, net of offering costs of $214 | | | 1,732,298 | | | 41,183 | | | - | | | - | | | - | | | - | | | 41,183 | | | |
| Amortization of restricted stock award | | | - | | | 154 | | | - | | | - | | | - | | | - | | | 154 | | | |
| Cash dividend declared on common stock, $0.26 per share | | | - | | | - | | | - | | | - | | | - | | | (3,250) | | | (3,250) | | | |
| Common stock repurchased | | | (698,190) | | | (13,653) | | | - | | | - | | | - | | | - | | | (13,653) | | | |
| Stock option expense | | | - | | | 1,159 | | | - | | | - | | | - | | | - | | | 1,159 | | | |
| Stock options exercised, including related tax benefits | | | 83,875 | | | 1,208 | | | - | | | - | | | - | | | - | | | 1,208 | | | |
| Balance, December 31, 2007 | | | 12,774,926 | | $ | 92,414 | | $ | - | | $ | - | | $ | (888) | | $ | 73,298 | | $ | 164,824 | | | |
| | | | | | | | | | | | | | | | | | | | | | | | | |
| See notes to consolidated financial statements |
| HERITAGE COMMERCE CORP |
| CONSOLIDATED STATEMENTS OF CASH FLOWS |
| | | Years ended December 31, |
| (Dollars in thousands) | | 2007 | | 2006 | | 2005 |
| CASH FLOWS FROM OPERATING ACTIVITIES: | | | | | | |
| Net income | | $ | 14,096 | | $ | 17,270 | | $ | 14,446 |
| Adjustments to reconcile net income to net cash provided by | | | | | | | | | |
| operating activities: | | | | | | | | | |
| Depreciation and amortization | | | 776 | | | 662 | | | 988 |
| Provision for loan losses | | | (11) | | | (503) | | | 313 |
| Gain on sale of leased equipment | | | - | | | - | | | (299) |
| Deferred income tax benefit | | | (225) | | | (319) | | | (360) |
| Non-cash compensation expense related to ESOP plan | | | - | | | - | | | 477 |
| Stock option expense | | | 1,159 | | | 780 | | | - |
| Amortization of other intangible assets | | | 352 | | | - | | | - |
| Amortization of restricted stock award | | | 154 | | | 154 | | | 123 |
| Amortization (accretion) of discounts and premiums on securities | | | 95 | | | (1,087) | | | 928 |
| Gain on sale of Capital Group loan portfolio | | | - | | | (671) | | | - |
| Gain on sale of SBA loans | | | (1,766) | | | (3,337) | | | (2,871) |
| Proceeds from sales of loans held for sale | | | 35,529 | | | 65,466 | | | 51,176 |
| Change in SBA loans held for sale | | | (17,469) | | | (51,100) | | | (58,876) |
| Increase in cash surrender value of life insurance | | | (1,443) | | | (1,439) | | | (1,236) |
| Other non-cash income | | | (230) | | | - | | | - |
| Effect of changes in: | | | | | | | | | |
| Accrued interest receivable and other assets | | | 3,162 | | | 4,270 | | | (7,181) |
| Accrued interest payable and other liabilities | | | 352 | | | 1,562 | | | 4,909 |
| Net cash provided by operating activities | | | 34,531 | | | 31,708 | | | 2,537 |
| | | | | | | | | | |
| CASH FLOWS FROM INVESTING ACTIVITIES: | | | | | | | | | |
| Net change in loans (including purchase of $10,306 in 2006) | | | (104,078) | | | (27,591) | | | 11,768 |
| Proceeds from sale of Capital Group loan portfolio | | | - | | | 30,047 | | | - |
| Net decrease in Capital Group loan portfolio prior to sale | | | - | | | 2,681 | | | - |
| Purchases of securities available-for-sale | | | (9,322) | | | (64,018) | | | (26,087) |
| Maturities/Paydowns/Calls of securities available-for-sale | | | 61,344 | | | 92,274 | | | 57,707 |
| Sale of leased equipment | | | - | | | - | | | 687 |
| Purchases of company owned life insurance | | | - | | | - | | | (7,196) |
| Purchase of premises and equipment | | | (704) | | | (660) | | | (346) |
| Redemption (Purchase) of restricted stock and other investments | | | 58 | | | (254) | | | (1,164) |
| Cash received in bank acquisition, net of cash paid | | | 16,407 | | | - | | | - |
| Net cash provided by (used in) investing activities | | | (36,295) | | | 32,479 | | | 35,369 |
| | | | | | | | | | |
| CASH FLOWS FROM FINANCING ACTIVITIES: | | | | | | | | | |
| Net change in deposits | | | (31,390) | | | (93,166) | | | 21,224 |
| Payment of other liability | | | (329) | | | (1,469) | | | (2,299) |
| Exercise of stock options | | | 1,208 | | | 2,518 | | | 4,727 |
| Stock offering cost | | | (214) | | | - | | | - |
| Common stock repurchased | | | (13,653) | | | (7,888) | | | (5,744) |
| Payment of cash dividend | | | (3,250) | | | (2,357) | | | - |
| Proceeds from other short-term borrowings | | | 60,000 | | | - | | | - |
| Repayment of securities under agreement to repurchase | | | (10,900) | | | (10,900) | | | (15,100) |
| Net cash provided by (used in) financing activities | | | 1,472 | | | (113,262) | | | 2,808 |
| Net increase (decrease) in cash and cash equivalents | | | (292) | | | (49,075) | | | 40,714 |
| Cash and cash equivalents, beginning of year | | | 49,385 | | | 98,460 | | | 57,746 |
| Cash and cash equivalents, end of year | | $ | 49,093 | | $ | 49,385 | | $ | 98,460 |
| | | | | | | | | | |
| Supplemental disclosures of cash flow information: | | | | | | |
| Cash paid during the year for: | | | | | | |
| Interest | | $ | 27,216 | | $ | 22,285 | | $ | 15,291 |
| Income taxes | | $ | 6,319 | | $ | 4,781 | | $ | 13,828 |
| | | | | | | | | | |
| Supplemental schedule of non-cash investing activity: | | | | | | | | | |
| Transfer of commercial loans (Capital Group loan portfolio) to loans held-for-sale | | $ | - | | $ | - | | $ | 32,057 |
| Transfer of portfolio loans to loans held for sale | | $ | 972 | | $ | - | | $ | - |
| Transfer of loans held for sale to loan portfolio | | $ | 18,430 | | $ | 1,962 | | $ | 5,428 |
| Loans transferred to foreclosed assets | | $ | 1,062 | | $ | - | | $ | - |
| Summary of assets acquired, and liabilities assumed through acquisition: | | | |
| Cash and cash equivalents | | $ | 41,807 | | | - | | | - |
| Securities available-for-sale | | $ | 12,214 | | | - | | | - |
| Net loans | | $ | 203,805 | | | - | | | - |
| Goodwill and other intangible assets | | $ | 48,506 | | | - | | | - |
| Premises and equipment | | $ | 6,841 | | | - | | | - |
| Company owned life insurance | | $ | 1,026 | | | - | | | - |
| Federal Home Loan Bank Stock | | $ | 717 | | | - | | | - |
| Other assets, net | | $ | 2,615 | | | - | | | - |
| Deposits | | $ | (249,023) | | | - | | | - |
| Other liabilities | | $ | (1,711) | | | - | | | - |
| Common stock issued to acquire Diablo Valley Bank | | $ | 41,397 | | | - | | | - |
| | | | | | | | | | |
| See notes to consolidated financial statements |
HERITAGE COMMERCE CORP
NOTES TO CONSOLIDATED FINANCIAL STATEMENTS
(1) Summary of Significant Accounting Policies
Description of Business and Basis of Presentation
Heritage Commerce Corp (the “Company”) operates as a bank holding company for its wholly owned subsidy Heritage Bank of Commerce (“HBC” or “the Bank”). HBC is a California state chartered bank which offers a full range of commercial and personal banking services to residents and the business/professional community in Santa Clara, Alameda, and Contra Costa counties, California. As discussed in Note 6, the Company acquired Diablo Valley Bank (“DVB”) on June 20, 2007 and merged DVB into HBC. HBC was incorporated on November 23, 1993 and commenced operations on June 8, 1994.
The consolidated financial statements include the accounts of the Company and its subsidiary bank. All inter- company accounts and transactions have been eliminated.
The Company also has four other subsidiaries, Heritage Capital Trust I and Heritage Statutory Trust I, formed in 2000, Heritage Statutory Trust II, formed in 2001, and Heritage Statutory Trust III, formed in 2002, which are Delaware statutory business trusts formed for the exclusive purpose of issuing trust preferred securities. These subsidiary trusts are not consolidated in the Company’s consolidated financial statements and the subordinated debt payable to subsidiary grantor trusts is recorded as debt of the Company to the related trusts.
Use of Estimates
The preparation of financial statements in conformity with accounting principles generally accepted in the United States of America requires management to make estimates and assumptions that affect the reported amounts of assets and liabilities and disclosure of contingent assets and liabilities at the date of the financial statements and the reported amounts of revenues and expenses during the reporting period. Actual results could differ from those estimates. The allowance for loan losses, loan servicing rights, defined benefit pension obligation, interest-only strip receivables, purchase accounting adjustments, and the fair values of financial instruments are particularly subject to change.
Cash and Cash Equivalents
Cash and cash equivalents include cash on hand, amounts due from banks, and Federal funds sold. Generally, Federal funds are sold and purchased for one-day periods.
Cash Flows
Net cash flows are reported for customer loan and deposit transactions, Federal funds purchased, repurchase agreements and other short-term borrowings.
Securities
The Company classifies its securities as either available-for-sale or held-to-maturity at the time of purchase. Securities available-for-sale are recorded at fair value with a corresponding recognition of the net unrealized holding gain or loss, net of deferred income taxes, as a net amount within accumulated other comprehensive income (loss), which is a separate component of shareholders’ equity. Securities held-to-maturity are recorded at amortized cost, based on the Company’s positive intent and ability to hold the securities to maturity. As of December 31, 2007 and 2006, all the Company’s securities were classified as available-for-sale securities.
A decline in the fair value of any available-for-sale or held-to-maturity security below amortized cost that is deemed other than temporary results in a charge to earnings and the corresponding establishment of a new cost basis for the security. In estimating other-than-temporary losses, management considers (1) the length of time and extent that fair value has been less than cost, (2) the financial condition and near-term prospects of the issuer, and (3) the Company’s ability and intent to hold the security for a period sufficient to allow for any anticipated recovery in fair value.
Interest income includes amortization of purchase premiums or discount. Premiums and discounts are amortized, or accreted, over the life of the related security as an adjustment to income using a method that approximates the interest method. Realized gains and losses are recorded on the trade date and determined using the specific identification method for the cost of securities sold.
Federal Home Loan Bank (“FHLB”) and Federal Reserve Bank (“FRB”) Stock
The Bank is a member of the FHLB system. Members are required to own a certain amount of stock based on the level of borrowings and other factors, and may invest in additional amounts. The FHLB stock is carried at cost, classified as a restricted security, and periodically evaluated for impairment. Because this stock is viewed as a long term investment, impairment is based on ultimate recovery of par value. Both cash and stock dividends are reported as income. The Bank is also member of the FRB. FRB stock is classified as a restricted security, and cash dividends are reported as income.
Loans Held for Sale
The Company held for sale the guaranteed portion of certain loans guaranteed by the Small Business Administration or the U.S. Department of Agriculture (collectively referred to as “SBA loans”). These loans were carried at the lower of aggregate cost or market. Net unrealized losses, if any, were recorded as a valuation allowance and charged to earnings.
Gains or losses on SBA loans held for sale were recognized upon completion of the sale, based on the difference between the net sales proceeds and the relative fair value of the guaranteed portion of the loan sold compared to the relative fair value of the unguaranteed portion.
SBA loans were sold with servicing retained. The servicing assets that result from the sale of SBA loans consist of servicing rights and interest-only strip receivables (“I/O strips”).
The Company accounts for the sale and servicing of SBA loans based on the financial and servicing assets it controls and liabilities it has incurred, derecognizing financial assets when control has been surrendered, and derecognizing liabilities when extinguished. Servicing rights are measured at their fair value and are amortized in proportion to and over the period of net servicing income and are assessed for impairment on an ongoing basis. Impairment is determined by stratifying the servicing rights based on interest rates and terms. Any servicing assets in excess of the contractually specified servicing fees are reclassified at fair value as an I/O strip receivable and treated like an available for sale security. Fair value is determined using prices for similar assets with similar characteristics, when available, or based upon discounted cash flows using market-based assumptions. Impairment is recognized through a valuation allowance. The servicing rights, net of any required valuation allowance, and I/O strip receivable are included in other assets.
In March, 2006, FASB issued Statement 156, Accounting for Servicing of Financial Assets - An Amendment of FASB Statement No. 140. This standard amends the guidance in Statement 140, with respect to the accounting for separately recognized servicing assets and servicing liabilities. Among other requirements, Statement 156 requires an entity to recognize a servicing asset or servicing liability each time it undertakes an obligation to service a financial asset by entering into a servicing contract in certain situations, including a transfer of loans with servicing retained that meets the requirements for sale accounting. Statement 156 is effective as of the beginning of an entity’s first fiscal year that begins after September 15, 2006. The adoption of this standard did not have a material impact on the Company’s financial statements.
Loans
Loans that management has the intent and ability to hold for the foreseeable future or maturity or payoff are stated at the principal amount outstanding, net of deferred loan origination fees and costs. The majority of the Company’s loans have variable interest rates. Interest on loans is accrued on the unpaid principal balance and is credited to income using the effective yield interest method.
Generally, if a loan is classified as non-accrual, the accrual of interest is discontinued, any accrued and unpaid interest is reversed, and the amortization of deferred loan fees and costs is discontinued. Loans are classified as non-accrual when the payment of principal or interest is 90 days past due, unless the amount is well secured and in the process of collection. Any interest or principal payments received on nonaccrual loans are applied toward reduction of principal. Nonaccrual loans generally are not returned to performing status until the obligation is brought current, the loan has performed in accordance with the contract terms for a reasonable period of time, and the ultimate collectibility of the contractual principal and interest is no longer in doubt.
Non-refundable loan fees and direct origination costs are deferred and recognized over the expected lives of the related loans using the effective yield interest method.
Allowance for Loan Losses
The Company maintains an allowance for loan losses to absorb probable losses incurred in the loan portfolio. The allowance is based on ongoing, quarterly assessments of the probable estimated losses. Loans are charged against the allowance when management believes that the uncollectibility of a loan balance is confirmed. The allowance is increased by the provision for loan losses, which is charged against current period operating results, and decreased by loan charge-offs, net of recoveries. The Company’s methodology for assessing the adequacy of the allowance consists of several key elements, which include the formula allowance and specific allowances.
The formula allowance is calculated by applying loss factors to pools of outstanding loans. Loss factors are based on the Company’s historical loss experience, adjusted for significant factors that, in management’s judgment, affect the collectibility of the portfolio as of the evaluation date. The adjustment factors for the formula allowance may include current economic and business conditions affecting the key lending areas of the Company, in particular the technology industry and the real estate market, credit quality trends, collateral values, loan volumes and concentrations, specific industry conditions within portfolio segments, recent loss experience in particular segments of the portfolio, duration of the current business cycle, and bank regulatory examination results. The evaluation of the inherent loss with respect to these conditions is subject to a higher degree of uncertainty.
Specific allowances are established for impaired loans, but the entire allowance is available for any loan that, in management’s judgment, should be charged off. Management considers a loan to be impaired when it is probable that the Company will be unable to collect all amounts due according to the original contractual terms of the loan agreement. When a loan is considered to be impaired, the amount of impairment is measured based on the present value of expected future cash flows discounted at the loan’s effective interest rate, or the fair value of the collateral if the loan is collateral dependent. Commercial, land and construction and commercial real estate loans are individually evaluated for impairment. Large groups of smaller balance homogeneous loans, such as consumer and residential real estate loans, are collectively evaluated for impairment and, accordingly, they are not separately identified for impairment disclosures.
Loan Commitments and Related Financial Instruments
Financial instruments include off-balance sheet credit instruments, such as commitments to make loans and commercial letters of credit, issued to meet customer financing needs. The face amount for these items represents the exposure to loss, before considering customer collateral or ability to repay. Such financial instruments are recorded when they are funded.
Loss Contingencies
Loss contingencies, including claims and legal actions arising in the ordinary course of business, are recorded as liabilities when the likelihood of loss is probable and an amount or range of loss can be reasonably estimated. Management does not believe that the ultimate loss from such matters, if any, will have a material effect on the financial statements.
Company Owned Life Insurance
The Company has purchased life insurance policies on certain directors and officers. Upon adoption of EITF 06-5, which is discussed further below, Company owned life insurance is recorded at the amount that can be realized under the insurance contract at the balance sheet date, which is the cash surrender value adjusted for other charges or other amounts due that are probable at settlement. Prior to adoption of EITF 06-5, the Company recorded owned life insurance at its cash surrender value.
In September 2006, the FASB Emerging Issues Task Force (“EITF”) finalized Issue No. 06-5, Accounting for Purchases of Life Insurance - Determining the Amount That Could Be Realized in Accordance with FASB Technical Bulletin No. 85-4 (Accounting for Purchases of Life Insurance). This issue requires that a policyholder consider contractual terms of a life insurance policy in determining the amount that could be realized under the insurance contract. It also requires that if the contract provides for a greater surrender value if all individual policies in a group are surrendered at the same time, that the surrender value be determined based on the assumption that policies will be surrendered on an individual basis. Lastly, the issue discusses whether the cash surrender value should be discounted when the policyholder is contractually limited in its ability to surrender a policy. This issue is effective for fiscal years beginning after December 15, 2006. The adoption of this issue did not have a material impact on the financial statements.
In September 2006, the EITF finalized Issue No. 06-4, Accounting for Deferred Compensation and Postretirement Benefit Aspects of Endorsement Split-Dollar Life Insurance Arrangements. This issue requires that a liability be recorded during the service period when a split-dollar life insurance agreement continues after participants’ employment or retirement. The required accrued liability will be on either the post-employment benefit cost for the continuing life insurance or based on the future death benefit depending on the contractual terms of the underlying agreement. This issue is effective for fiscal years beginning after December 15, 2007.
The Company will adopt EITF 06-4 on January 1, 2008, which will result in a cumulative effect adjustment to decrease retained earnings. Management is in the process of completing its calculations and estimates that the cumulative effect will be a decrease to retained earnings in the range of $3.0 million to $4.0 million, net of deferred taxes.
Goodwill and Intangible Assets
Goodwill results from the acquisition of Diablo Valley Bank and represents the excess of the purchase price over the fair value of acquired tangible assets and liabilities and identifiable intangible assets. Goodwill is assessed at least annually for impairment and any such impairment will be recognized in the period identified.
Other intangible assets consist of core deposit and customer relationship intangible assets arising from the Diablo Valley Bank acquisition. They are initially measured at fair value and then are amortized on an accelerated method over their estimated useful lives. The core deposit and customer relationship intangible assets are being amortized over ten and seven years, respectively.
Retirement Plans
Pension expense is the net of service and interest cost, return on plan assets and amortization of gains and losses not immediately recognized. Employee 401(k) and profit sharing plan expense is the amount of matching contributions. Deferred compensation and supplemental retirement plan expense allocates the benefits over years of service.
Premises and Equipment
Land is carried at cost. Premises and equipment are stated at cost. Depreciation and amortization are computed on a straight-line basis over the lesser of the respective lease terms or estimated useful lives The Company owns one building which is being depreciated over 40 years. Furniture, equipment, and leasehold improvements are depreciated over estimated useful lives generally ranging from five to fifteen years. The Company evaluates the recoverability of long-lived assets on an on-going basis.
Income Taxes
The Company files consolidated Federal and combined state income tax returns. Income tax expense is the total of the current year income tax payable or refundable and the change in deferred tax assets and liabilities. Deferred tax assets and liabilities are the expected future tax amounts for the temporary differences between carrying amounts and tax basis of assets and liabilities, computed using enacted tax rates. A valuation allowance, if needed, reduces deferred tax assets to the amount expected to be realized.
The Company adopted FASB Interpretation 48 (“FIN 48”) “Accounting for Uncertainty in Income Taxes”, as of January 1, 2007. Under FIN 48, a tax position is recognized as a benefit only if it is “more likely than not” that the tax position would be sustained in a tax examination, with a tax examination being presumed to occur. The amount recognized is the largest amount of tax benefit that is greater than 50% likely of being realized on examination. For tax positions not meeting the “more likely than not” test, no tax benefit is recorded. The adoption of this standard did not have a material impact on the Company’s financial statements.
The Company recognizes interest related to income tax matters as interest expense and penalties related to income tax matters as other noninterest expense.
Earnings per Share
Basic earnings per share are computed by dividing net income by the weighted average common shares outstanding. Diluted earnings per share reflect potential dilution from outstanding stock options, using the treasury stock method. There were 447,526, 167,763 and 25,225 stock options for 2007, 2006, and 2005 that were considered to be antidilutive and excluded from the computation of diluted earnings per share. For each of the years presented, net income is the same for basic and diluted earnings per share. Reconciliation of weighted average shares used in computing basic and diluted earnings per share is as follows
| | | Year ended December 31, |
| | | | 2007 | | | 2006 | | | 2005 |
Weighted average common shares outstanding - used in computing basic earnings per share | | | 12,398,270 | | | 11,725,671 | | | 11,795,635 |
Dilutive effect of stock options outstanding,using the treasury stock method | | | 138,470 | | | 230,762 | | | 311,595 |
| Shares used in computing diluted earnings per share | | | 12,536,740 | | | 11,956,433 | | | 12,107,230 |
| | | | | | | | | | |
Stock-Based Compensation
Prior to 2006, the Company accounted for stock-based awards to employees using the intrinsic value method in accordance with Accounting Principles Board (“APB”) Opinion No. 25, “Accounting for Stock Issued to Employees.” No compensation expense was recognized in the financial statements for stock option arrangements, as the Company’s stock option plan provides for the issuance of options at a price of no less than the fair market value at the date of the grant.
Effective January 1, 2006, the Company adopted Statement of Financial Accounting Standards (“SFAS”) No. 123R, Share-based Payment, using the modified prospective transition method. Accordingly, the Company has recorded stock-based employee compensation cost using the fair value method starting in 2006.
Prior to January 1, 2006, employee compensation expense under stock options was reported using the intrinsic value method; therefore, no stock-based compensation cost is reflected in net income for the year ended December 31, 2005, as all options granted had an exercise price equal to or greater than the market price of the underlying common stock at date of grant.
The following table presents the effect on net income and earnings per share if expense was measured using the fair value recognition provisions of FASB Statement No. 123, Accounting for Stock-Based Compensation, for the year ended December 31, 2005;
| (Dollars in thousands, except per share data) | | December 31, 2005 |
| Net income as reported | | $ | 14,446 |
| Less: Compensation expense for stock options determined under fair value method | | | (438) |
| Pro forma net income | | $ | 14,008 |
| | | | |
| Net income per common share - basic | | | |
| As reported | | $ | 1.22 |
| Pro forma | | $ | 1.19 |
| Net income per common share - diluted | | | |
| As reported | | $ | 1.19 |
| Pro forma | | $ | 1.16 |
Comprehensive Income
Comprehensive income includes net income and other comprehensive income. The Company’s sources of other comprehensive income are unrealized gains and losses on securities available-for-sale and I/O strips, which are treated like available-for-sale securities, and the liability related to the Company’s supplemental retirement plan. The items in other comprehensive income are presented net of deferred income tax effects. Reclassification adjustments result from gains or losses on securities that were realized and included in net income of the current period that also had been included in other comprehensive income as unrealized holding gains and losses.
The following is a summary of the components of other comprehensive income (loss):
| | | Year ended December 31, |
| (Dollars in thousands) | | 2007 | | 2006 | | 2005 |
Net unrealized gains (losses) on available-for-sale of securities and I/O strips during the year | | $ | 1,766 | | $ | 650 | | $ | (1,212) |
| Less: Deferred income tax | | | (738) | | | (273) | | | 548 |
| Net unrealized gains (losses) on available-for-sale securities and I/O strips, net of deferred income tax | | | 1,028 | | | 377 | | | (664) |
| Pension liability adjustment during the year | | | 137 | | | 601 | | | (563) |
| Less: Deferred income tax | | | (58) | | | (252) | | | 236 |
| Pension liability adjustment, net of deferred income tax | | | 79 | | | 349 | | | (327) |
| Other comprehensive income (loss) | | $ | 1,107 | | $ | 726 | | $ | (991) |
| | | | | | | | | | |
Accumulated other comprehensive income (loss) consisted of the following items, net of deferred tax, at year-end.
| (Dollars in thousands) | | 2007 | | 2006 |
| Unrealized net losses on securities available-for-sale and I/O strips | | $ | 136 | | $ | (892) |
| Pension liability | | | (1,024) | | | (1,103) |
| Accumulated other comprehensive income (loss) | | $ | (888) | | $ | (1,995) |
| | | | | | | |
Segment Reporting
HBC is an independent community business bank with eleven branch offices that offer similar products to customers. No customer accounts for more than 10 percent of revenue for HBC or the Company. Management evaluates the Company’s performance as a whole and does not allocate resources based on the performance of different lending or transaction activities. Accordingly, the Company and its subsidiary bank all operate as one business segment.
Reclassifications
Certain amounts in the 2006 and 2005 financial statements have been reclassified to conform to the 2007 presentation.
Adoption of Other New Accounting Standards
In February, 2006, FASB issued Statement 155, Accounting for Certain Hybrid Instruments. This standard amended the guidance in Statement 133, Accounting for Derivative Instruments and Hedging Activities, and Statement 140, Accounting for Transfers and Servicing of Financial Assets and Extinguishments of Liabilities. Statement 155 permits fair value remeasurement for any hybrid financial instrument that contains an embedded derivative that otherwise would require bifurcation and clarifies which interest-only and principal-only strips are not subject to the requirements of Statement 133. Statement 155 is effective for all financial instruments acquired or issued after the beginning of an entity’s first fiscal year that begins after September 15, 2006. The adoption of this standard did not have a material impact on the Company’s financial statements.
Newly Issued but not yet Effective Accounting Standards
In September 2006, FASB issued Statement 157, Fair Value Measurements. This Statement defines fair value, establishes a framework for measuring fair value in generally accepted accounting principles (“GAAP”), and expands disclosures about fair value measurements. This Statement applies under other accounting pronouncements that require or permit fair value measurements, FASB having previously concluded in those accounting pronouncements that fair value is the relevant measurement attribute. This Statement is effective for financial statements issued for fiscal years beginning after November 15, 2007, and interim periods within those fiscal years. The adoption of this standard is not expected to have a material impact on the Company’s financial statements.
In February 2007, FASB issued Statement 159, The Fair Value Option for Financial Assets and Financial Liabilities. This statement provides companies with an option to report selected financial assets and liabilities at fair value. The Standard’s objective is to reduce both complexity in accounting for financial instruments and the volatility in earnings caused by measuring related assets and liabilities differently. The standard requires companies to provide additional information that will help investors and other users of financial statements to more easily understand the effect of the company’s choice to use fair value on its earnings. It also requires entities to display the fair value of those assets and liabilities for which the company has chosen to use fair value on the face of the balance sheet. The new Statement does not eliminate disclosure requirements included in other accounting standards, including requirements for disclosures about fair value measurements included in Statements 157, Fair Value Measurements, and 107, Disclosures about Fair Value of Financial Instruments. This Statement is effective as of the beginning of an entity’s first fiscal year that begins after November 15, 2007. The Company elected to not implement Statement 159.
On November 5, 2007, the SEC issued Staff Accounting Bulletin No. 109, Written Loan Commitments Recorded at Fair Value through Earnings (“SAB 109”). Previously, SAB 105, Application of Accounting Principles to Loan Commitments, stated that in measuring the fair value of a loan commitment, a company should not incorporate the expected net future cash flows related to the associated servicing of the loan. SAB 109 supersedes SAB 105 and indicates that the expected net future cash flows related to the associated servicing of the loan should be included in measuring fair value for all written loan commitments that are accounted for at fair value through earnings. SAB 105 also indicated that internally-developed intangible assets should not be recorded as part of the fair value of a derivative loan commitment, and SAB 109 retains that view. SAB 109 is effective for derivative loans commitments issued or modified in fiscal quarters beginning after December 15, 2007. The Company does not expect the impact of this standard to be material.
(2) Securities
The amortized cost and estimated fair value of securities at year-end were as follows:
| | | | | Gross | | Gross | | Estimated |
| 2007 | | Amortized | | Unrealized | | Unrealized | | Fair |
| (Dollars in thousands) | | Cost | | Gains | | Losses | | Value |
| Securities available-for-sale: | | | | | | | | |
| U.S. Treasury | | $ | 4,942 | | $ | 49 | | $ | - | | $ | 4,991 |
| U.S. Government Agencies | | | 35,578 | | | 256 | | | (31) | | | 35,803 |
| Municipals - Tax Exempt | | | 4,139 | | | - | | | (25) | | | 4,114 |
| Mortgage-Backed Securities | | | 83,811 | | | 322 | | | (1,087) | | | 83,046 |
| Collateralized Mortgage Obligations | | | 7,369 | | | 162 | | | (83) | | | 7,448 |
| Total securities available-for-sale | | $ | 135,839 | | $ | 789 | | $ | (1,226) | | $ | 135,402 |
| | | | | | | | | | | | | |
| | | | | Gross | | Gross | | Estimated |
| 2006 | | Amortized | | Unrealized | | Unrealized | | Fair |
| (Dollars in thousands) | | Cost | | Gains | | Losses | | Value |
| Securities available-for-sale: | | | | | | | | |
| U.S. Treasury | | $ | 6,000 | | $ | - | | $ | (37) | | $ | 5,963 |
| U.S. Government Agencies | | | 59,610 | | | 27 | | | (241) | | | 59,396 |
| Municipals - Tax Exempt | | | 8,299 | | | - | | | (157) | | | 8,142 |
| Mortgage-Backed Securities | | | 93,150 | | | 74 | | | (3,038) | | | 90,186 |
| Collateralized Mortgage Obligations | | | 8,683 | | | 76 | | | (148) | | | 8,611 |
| Total securities available-for-sale | | $ | 175,742 | | $ | 177 | | $ | (3,621) | | $ | 172,298 |
| | | | | | | | | | | | | |
Securities classified as U.S. Government Agencies as of December 31, 2007 were issued by the Federal National Mortgage Association, Federal Home Loan Mortgage Corporation, and the Federal Home Loan Bank.
At year end 2007 and 2006, there were no holdings of securities of any one issuer, other than the U.S. Government and its agencies, in an amount greater than 10% of shareholders’ equity.
No securities were sold in 2007, 2006 or 2005.
Securities with unrealized losses at year end, aggregated by investment category and length of time that individual securities have been in a continuous unrealized loss position, are as follows:
| | | Less Than 12 Months | | 12 Months or More | | Total |
| 2007 | | Fair | | Unrealized | | Fair | | Unrealized | | Fair | | Unrealized |
| (Dollars in thousands) | | Value | | Losses | | Value | | Losses | | Value | | Losses |
| U.S. Government Agencies | | | 1,251 | | | (1) | | | 2,969 | | | (30) | | | 4,220 | | | (31) |
| Mortgage-Backed Securities | | | 2,132 | | | (7) | | | 55,817 | | | (1,080) | | | 57,949 | | | (1,087) |
| Municipals - Tax Exempt | | | - | | | - | | | 4,117 | | | (25) | | | 4,117 | | | (25) |
| Collateralized Mortgage Obligations | | | - | | | - | | | 2,447 | | | (83) | | | 2,447 | | | (83) |
| Total | | $ | 3,383 | | $ | (8) | | $ | 65,350 | | $ | (1,218) | | $ | 68,733 | | $ | (1,226) |
| | | | | | | | | | | | | | | | | | | |
| | | Less Than 12 Months | | 12 Months or More | | Total |
| 2006 | | Fair | | Unrealized | | Fair | | Unrealized | | Fair | | Unrealized |
| (Dollars in thousands) | | Value | | Losses | | Value | | Losses | | Value | | Losses |
| U.S. Treasury | | $ | - | | $ | - | | $ | 5,963 | | $ | (37) | | $ | 5,963 | | $ | (37) |
| U.S. Government Agencies | | | 35,078 | | | (87) | | | 11,456 | | | (154) | | | 46,534 | | | (241) |
| Mortgage-Backed Securities | | | 11,691 | | | (65) | | | 68,421 | | | (2,973) | | | 80,112 | | | (3,038) |
| Municipals - Tax Exempt | | | - | | | - | | | 8,142 | | | (157) | | | 8,142 | | | (157) |
| Collateralized Mortgage Obligations | | | - | | | - | | | 3,257 | | | (148) | | | 3,257 | | | (148) |
| Total | | $ | 46,769 | | $ | (152) | | $ | 97,239 | | $ | (3,469) | | $ | 144,008 | | $ | (3,621) |
| | | | | | | | | | | | | | | | | | | |
At December 31, 2007, the Company held 78 securities, of which 34 had fair values below amortized cost. Thirty-one securities have been carried with an unrealized loss for over 12 months. Unrealized losses were primarily due to higher interest rates. No security sustained a downgrade in credit rating. The issuers are of high credit quality and all principal amounts are expected to be paid when securities mature. The fair value is expected to recover as the securities approach their maturity date and/or market rates decline. Because the Company has the ability and intent to hold these securities until a recovery of fair value, which may be maturity, the Company does not consider these securities to be other-than-temporarily impaired at December 31, 2007.
At December 31, 2006, the Company held 99 securities, of which 73 had fair values below amortized cost. Fifty-two securities have been carried with an unrealized loss for over 12 months. Unrealized losses were primarily due to higher interest rates. No security sustained a downgrade in credit rating. The issuers are of high credit quality and all principal amounts are expected to be paid when securities mature. The fair value is expected to recover as the securities approach their maturity date and/or market rates decline. Because the Company has the ability and intent to hold these securities until a recovery of fair value, which may be maturity, the Company did not consider these securities to be other-than-temporarily impaired at December 31, 2006.
The amortized cost and estimated fair values of securities as of December 31, 2007, by contractual maturity, are shown below. Expected maturities will differ from contractual maturities because borrowers may have the right to call or pre-pay obligations with or without call or pre-payment penalties.
| | | Available-for-sale |
| (Dollars in thousands) | | Amortized Cost | | Estimated Fair Value |
| Due within one year | | $ | 32,570 | | $ | 32,672 |
| Due after one through five years | | | 13,868 | | | 13,979 |
| Due after five through ten years | | | 17,317 | | | 17,498 |
| Due after ten years | | | 72,084 | | | 71,253 |
| Total | | $ | 135,839 | | $ | 135,402 |
| | | | | | | |
Securities with amortized cost of $42,174,000 and $53,708,000 as of December 31, 2007 and 2006 were pledged to secure public and certain other deposits as required by law or contract.
(3) Loans and Loan Servicing
Loans at year-end were as follows:
| | | | | |
| (Dollars in thousands) | | 2007 | | 2006 |
| Loans held for sale | | $ | - | | $ | 33,752 |
| | | | | | | |
| Loans held for investment | | | | | | |
| Commercial | | $ | 411,251 | | $ | 284,093 |
| Real estate - mortgage | | | 361,211 | | | 239,041 |
| Real estate - land and construction | | | 215,597 | | | 143,834 |
| Home equity | | | 44,187 | | | 38,976 |
| Consumer | | | 3,044 | | | 2,422 |
| Total loans | | | 1,035,290 | | | 708,366 |
| Deferred loan origination costs and fees, net | | | 1,175 | | | 870 |
| Allowance for loan losses | | | (12,218) | | | (9,279) |
| Loans, net | | $ | 1,024,247 | | $ | 699,957 |
| | | | | | | |
Real estate mortgage loans are primarily secured by mortgages on commercial property.
During 2006, HBC purchased $10,306,000 of home equity loans from another bank. The premium that HBC paid over the face value of the loans was insignificant. The purchased loans are considered to be of satisfactory credit quality.
Changes in the allowance for loan losses were as follows:
| | | | | | | | |
| | | Year ended December 31, | |
| (Dollars in thousands) | | 2007 | | 2006 | | 2005 | |
| Balance, beginning of year | | $ | 9,279 | | $ | 10,224 | | $ | 12,497 | |
| Loans charged-off | | | (104) | | | (831) | | | (3,273) | |
| Recoveries | | | 929 | | | 389 | | | 1,358 | |
| Net recoveries (charge-offs) | | | 825 | | | (442) | | | (1,915) | |
| Provision for loan losses | | | (11) | | | (503) | | | 313 | |
| Reclassification of allowance for loan losses | | | - | | | - | | | 671 | (1) |
| Allowance acquired in bank acquisition | | | 2,125 | | | - | | | - | |
| Balance, end of year | | $ | 12,218 | | $ | 9,279 | | $ | 10,224 | |
| | | | | | | | | | | |
| (1) | The Company reclassified $671,000 of the allowance allocated to $32 million of commercial asset based loans that were reclassified to loans held-for-sale as of December 31, 2005. Thus, the carrying value of these loans held-for-sale includes an allowance for loan losses of $671,000. |
Impaired loans were as follows:
| (Dollars in thousands) | | 2007 | | 2006 |
| Year-end loans with no allocated allowance for loan losses | | $ | 439 | | $ | 1,020 |
| Year-end loans with allocated allowance for loan losses | | | 6,620 | | | 8,011 |
| Total | | $ | 7,059 | | $ | 9,031 |
| | | | | | | |
| (Dollars in thousands) | | 2007 | | 2006 | | 2005 |
| Amount of the allowance for loan losses allocated at year-end | | $ | 1,478 | | $ | 1,226 | | $ | 2,656 |
| Average of impaired loans during the year | | $ | 8,329 | | $ | 13,551 | | $ | 16,823 |
| Cash basis interest income recognized during impairment | | $ | 103 | | $ | 28 | | $ | 110 |
| Interest income during impairment | | $ | 1,031 | | $ | 1,012 | | $ | 885 |
Nonperforming loans include both smaller dollar balance homogenous loans that are collectively evaluated for impairment and individually classified loans. Nonperforming loans were as follows at year-end:
| (Dollars in thousands) | | 2007 | | 2006 |
| Loans past due over 90 days still on accrual | | $ | 101 | | $ | 451 |
| Nonaccrual loans | | $ | 3,363 | | $ | 3,866 |
Concentrations of credit risk arise when a number of clients are engaged in similar business activities, or activities in the same geographic region, or have similar features that would cause their ability to meet contractual obligations to be similarly affected by changes in economic conditions. The Company’s loan portfolio is concentrated in commercial (primarily manufacturing, wholesale, and service) and real estate lending, with the balance in consumer loans. While no specific industry concentration is considered significant, the Company’s lending operations are located in the Company’s market areas that are dependent on the technology and real estate industries and their supporting companies. Thus, the Company’s borrowers could be adversely impacted by a downturn in these sectors of the economy which could reduce the demand for loans and adversely impact the borrowers’ ability to repay their loans.
HBC makes loans to executive officers, directors, and their affiliates. The following table presents the loans outstanding to these related parties:
| (Dollars in thousands) | | 2007 |
| Balance, beginning of year | | $ | 2 |
| Advances on loans during the year | | | 1,300 |
| Repayment on loans during the year | | | (1,301) |
| Balance, end of year | | $ | 1 |
| | | | |
At December 31, 2007 and 2006, the Company serviced SBA loans sold to the secondary market of approximately $177,161,000 and $188,844,000.
Activity for loan servicing rights follows:
| (Dollars in thousands) | | 2007 | | 2006 |
| Beginning of year balance | | $ | 2,154 | | $ | 2,171 |
| Additions | | | 575 | | | 1,195 |
| Amortization | | | (975) | | | (1,212) |
| End of year balance | | $ | 1,754 | | $ | 2,154 |
| | | | | | | |
Loan servicing income is reported net of amortization. There was no valuation allowance as of December 31, 2007 and 2006, as the fair market value of the assets was greater than the carrying value. The estimated fair value of loan servicing rights was $2,333,000 and $3,562,000 at December 31, 2007 and 2006.
Servicing assets represent the servicing spread generated from the sold guaranteed portions of SBA and other guaranteed loans. The weighted average servicing rate for all loans serviced was 1.60% and 1.70% at December 31, 2007 and 2006, respectively. In recording the initial value of the servicing rights and the fair value of the I/O strip receivable, the Company uses estimates which are based on management’s expectations of future prepayment and discount rates. Management’s estimate of constant prepayment rate (“CPR”) was 18.7% and 17.7% for the years ended December 31, 2007 and 2006, respectively. The weighted average discount rate assumption was 9.7% and 9.8% for the years ended December 31, 2007 and 2006, respectively. These prepayment and discount rates were based on current market conditions and historical performance of the various loan pools. If actual prepayments with respect to sold loans occur more quickly than projected, the carrying value of the servicing rights may have to be adjusted through a charge to earnings. A corresponding decrease in the value of the I/O strip receivable would also be expected.
Management reviews key economic assumptions used in the FASB Statement 140 accounting model to establish the value of the I/O strip on a quarterly basis. The Bank has completed a sensitivity analysis to determine the impact on the value of the asset in the event of a 10% and 20% adverse change, independently from any change in another key assumption. This test involved the CPR assumption and the discount rate assumptions. The value of the I/O strip can be adversely impacted by a significant increase in either the prepayment speed of the portfolio or a significant increase in the discount rate.
At December 31, 2007, key economic assumptions and the sensitivity of the current fair value of residual cash flows on the I/O strip to immediate 10 percent and 20 percent adverse changes in those assumptions are as follows:
| (Dollars in thousands) | | |
| Carrying amount/fair value of Interest-Only (I/O) strip | | $ | 2,332 |
| Weighted average life (in years) | | | 3.4 |
| Prepayment speed assumption (annual rate) | | | 21.4% |
| Impact on fair value of 10% adverse change in prepayment speed (CPR 23.5%) | | $ | (127) |
| Impact on fair value of 20% adverse change in prepayment speed (CPR 25.6%) | | $ | (245) |
| Residual cash flow discount rate assumption (annual) | | | 20.0% |
| Impact on fair value of 10% adverse change in discount rate (22.0% discount rate) | | $ | (96) |
| Impact on fair value of 20% adverse change in discount rate (24.0% discount rate) | | $ | (184) |
Activity for I/O strip receivables in 2007 and 2006 follows:| (Dollars in thousands) | | 2007 | | 2006 |
| Beginning of year balance | | $ | 4,537 | | $ | 4,679 |
| Additions | | | 27 | | | 1,272 |
| Amortization | | | (991) | | | (1,229) |
| Unrealized loss | | | (1,241) | | | (185) |
| End of year balance | | $ | 2,332 | | $ | 4,537 |
| | | | | | | |
(4) Premises and Equipment
Premises and equipment at year end were as follows:
| (Dollars in thousands) | | 2007 | | 2006 |
| Building | | $ | 3,243 | | $ | - |
| Land | | | 2,900 | | | - |
| Furniture and equipment | | | 6,031 | | | 4,704 |
| Leasehold improvements | | | 4,864 | | | 4,420 |
| | | | 17,038 | | | 9,124 |
| | | | | | | |
| Accumulated depreciation and amortization | | | (7,730) | | | (6,585) |
| Premises and equipment, net | | $ | 9,308 | | $ | 2,539 |
| | | | | | | |
Depreciation expense was $776,000, $662,000, and $988,000 in 2007, 2006, and 2005, respectively.
(5) Goodwill and Intangible Assets
Goodwill
The change in balance for goodwill during the year follows:
| (Dollars in thousands) | | 2007 |
| Beginning balance, January 1, 2007 | | $ | - |
| Recorded amounts during the year | | | 43,181 |
| Ending balance, December 31, 2007 | | $ | 43,181 |
| | | | |
Acquired Intangible Assets
Core deposit and customer relationship intangible assets acquired in the 2007 acquisition of Diablo Valley Bank were $5,049,000 and $276,000, respectively. Accumulated amortization of these intangible assets was $352,000 at December 31, 2007.
Estimated amortization expense for each of the next five years:
| (Dollars in thousands) | | |
| 2008 | | $ | 741 |
| 2009 | | | 642 |
| 2010 | | | 575 |
| 2011 | | | 523 |
| 2012 | | | 492 |
(6) Acquisition of Diablo Valley Bank
The Company completed its acquisition of Diablo Valley Bank on June 20, 2007. The transaction was valued at approximately $65 million, including payments for cancellation of options for Diablo Valley Bank common stock. The merger consideration consisted of approximately $24 million in cash and the issuance of 1,732,298 shares of the Company’s common stock in exchange for all outstanding Diablo Valley Bank shares and stock options. Prior to closing, Diablo Valley Bank redeemed all of its outstanding Series A Preferred Stock for an aggregate of approximately $6.7 million in cash (including dividend payments). The consolidated financial statements of the Company for the year ended December 31, 2007 include purchase accounting adjustments to record the assets and liabilities of Diablo Valley Bank at their estimated fair values.
The following table summarizes the estimated fair values of the assets acquired and liabilities assumed at the date of acquisition.
| Cash and cash equivalents | | $ | 41,807 |
| Securities available-for-sale | | | 12,214 |
| Net loans | | | 203,805 |
| Goodwill | | | 43,181 |
| Core deposit and customer relationship intangible assets | | | 5,325 |
| Premises and equipment | | | 6,841 |
| Corporate owned life insurance | | | 1,026 |
| Federal Home Loan Bank Stock | | | 717 |
| Other assets, net | | | 2,615 |
| Total assets acquired | | | 317,531 |
| | | | |
| Deposits | | | (249,023) |
| Other liabilities | | | (1,711) |
| Total liabilities | | | (250,734) |
| Net assets acquired | | $ | 66,797 |
| | | | |
None of the goodwill is deductible for tax purposes.
The Company’s cost to acquire Diablo Valley Bank is summarized as follows:
| Cash paid to Diablo Valley Bank common shareholders and stock option holders | | $ | 24,002 |
| Common stock issued to Diablo Valley Bank shareholders | | | 41,397 |
| Total consideration | | | 65,399 |
| Professional fees and other acquisition costs | | | 1,398 |
| Net assets acquired | | $ | 66,797 |
| | | | |
Diablo Valley Bank was acquired by the Company for several reasons. Diablo Valley Bank was a profitable and fast growing bank in a geographic area where the Company wants to expand. Diablo Valley Bank had experienced staff and the acquisition also enhanced the Company’s position in the East Bay area in the cities of Danville and Pleasanton. The Company believes it can achieve significant cost savings from merging Diablo Valley Bank into Heritage Bank of Commerce.
The following table presents pro forma information as if the acquisition had occurred at the beginning of 2007 and 2006. The pro forma financial information is not necessarily indicative of the results of operations as they would have been had the transaction been effected on the assumed date and is not intended to be a projection of future results.
| Unaudited |
| (Dollars in thousands, except per share data) | | 2007 | | 2006 |
| Net interest income | | $ | 56,805 | | $ | 59,854 |
| Net income | | $ | 15,193 | | $ | 18,360 |
| Net income per share - basic | | $ | 1.15 | | $ | 1.36 |
| Net income per share - diluted | | $ | 1.14 | | $ | 1.34 |
(7) Deposits
The following table presents the scheduled maturities of time deposits, including brokered deposits, for the next five years:
| (Dollars in thousands) | | December 31, 2007 |
| 2008 | | $ | 194,644 |
| 2009 | | | 17,482 |
| 2010 | | | 1,231 |
| 2011 | | | 44 |
| 2012 | | | - |
| Total | | $ | 213,401 |
| | | | |
Deposits from executive officers, directors, and their affiliates were $9,691,000 at December 31, 2007.
(8) Borrowing Arrangements
FHLB Borrowings & Available Lines of Credit
The Company maintains a collateralized line of credit with the Federal Home Loan Bank (“the FHLB”) of San Francisco. Under this line, the Company can borrow from the FHLB on a short-term (typically overnight) or long-term (over one year) basis. As of December 31, 2007, the Company had $60 million of overnight borrowings from the FHLB, bearing interest at 4.05%. There were no outstanding advances at December 31, 2006. The Company has $164 million of loans and $11 million of securities pledged to the FHLB as collarteral on a line of credit of $94 million at December 31, 2007.
At December 31, 2007, the Company has Federal funds purchase arrangements and lines of credit available of $72 million. There were no Fed Funds purchased at December 31, 2007 and 2006.
Securities sold under agreements to repurchase are secured by mortgage-backed securities carried at $12,993,000 and $27,694,000, respectively, at December 31, 2007 and 2006. The repurchase agreements, totaling $10,900,000 at December 31, 2007 mature in 2008.
Notes Payable to Subsidiary Grantor Trusts
The following is a summary of the notes payable to the Company’s subsidiary grantor trusts at December 31:
| (Dollars in thousands) | | 2007 | | 2006 |
| Subordinated debentures due to Heritage Capital Trust I with | | | | |
| interest payable semi-annually at 10.875%, redeemable with a | | | | |
| premium beginning March 8, 2010 and with no premium beginning | | | | |
| March 8, 2020 and due March 8, 2030 | | $ | 7,217 | | $ | 7,217 |
| | | | | | | |
| Subordinated debentures due to Heritage Statutory Trust I with | | | | | | |
| interest payable semi-annually at 10.6%, redeemable with a | | | | | | |
| premium beginning September 7, 2010 and with no premium beginning | | | | | | |
| September 7, 2020 and due September 7, 2030 | | | 7,206 | | | 7,206 |
| | | | | | | |
| Subordinated debentures due to Heritage Statutory Trust II with | | | | | | |
| interest payable semi-annually based on 3-month Libor plus 3.58% | | | | | | |
| (8.54% at December 31, 2007), redeemable with a premium beginning | | | | | | |
| July 31, 2006 and with no premium beginning July 31, 2011 and | | | | | | |
| due July 31, 2031 | | | 5,155 | | | 5,155 |
| | | | | | | |
| Subordinated debentures due to Heritage Statutory Trust III with | | | | | | |
| interest payable semi-annually based on 3-month Libor plus 3.40% | | | | | | |
| (8.26% at December 31, 2007), redeemable with no premium beginning | | | | | | |
| September 26, 2012 and due September 26, 2032 | | | 4,124 | | | 4,124 |
| | | | | | | |
| Total | | $ | 23,702 | | $ | 23,702 |
| | | | | | | |
The Company has guaranteed, on a subordinated basis, distributions and other payments due on the trust preferred securities issued by the subsidiary grantor trusts.
(9) Income Taxes
Income tax expense consisted of the following:
| | | December 31, |
| (Dollars in thousands) | | 2007 | | 2006 | | 2005 |
| Currently payable tax: | | | | | | |
| Federal | | $ | 6,013 | | $ | 7,472 | | $ | 5,921 |
| State | | | 2,349 | | | 2,084 | | | 1,719 |
| Total currently payable | | | 8,362 | | | 9,556 | | | 7,640 |
| | | | | | | | | | |
| Deferred tax (benefit) | | | | | | | | | |
| Federal | | | (223) | | | (258) | | | (292) |
| State | | | (2) | | | (61) | | | (68) |
| Total deferred tax (benefit) | | | (225) | | | (319) | | | (360) |
| Income tax expense | | $ | 8,137 | | $ | 9,237 | | $ | 7,280 |
| | | | | | | | | | |
The effective tax rate differs from the federal statutory rate for the years ended December 31, as follows:
| | | 2007 | | 2006 | | 2005 |
| Statutory Federal income tax rate | | 35.0% | | 35.0% | | 35.0% |
| State income taxes, net of federal tax benefit | | 7.2% | | 5.6% | | 4.9% |
| Low income housing credits | | -4.9% | | -3.9% | | -4.3% |
| Non-taxable interest income | | -0.2% | | -0.2% | | -0.3% |
| Increase in cash surrender value of life insurance | | -2.3% | | -1.9% | | -2.0% |
| Stock based compensation | | 1.1% | | 0.7% | | - |
| Other | | 0.7% | | -0.5% | | 0.2% |
| Effective tax rate | | 36.6% | | 34.8% | | 33.5% |
| | | | | | | |
Net deferred tax assets at year-end consist of the following:
| (Dollars in thousands) | | 2007 | | 2006 |
| Deferred tax assets: | | | | |
| Allowance for loan losses | | $ | 5,061 | | $ | 3,901 |
| Deferred compensation | | | 4,750 | | | 4,183 |
| Net operating loss carryforward | | | 163 | | | - |
| Fixed Assets | | | 780 | | | 924 |
| Postretirement benefit obligation | | | 741 | | | 799 |
| Accrued expenses | | | 717 | | | 524 |
| State income taxes | | | 715 | | | 729 |
| Loans | | | 373 | | | - |
| Loans held for sale | | | - | | | 389 |
| Securities available-for-sale and I/O strips | | | - | | | 646 |
| Other | | | 561 | | | 322 |
| Total deferred tax assets | | | 13,861 | | | 12,417 |
| | | | | | | |
| Deferred tax liabilities: | | | | | | |
| FHLB Stock | | | (253) | | | (150) |
| Loan fees | | | (456) | | | (606) |
| Securities available-for-sale and I/O strips | | | (95) | | | - |
| Intangible assets | | | (2,091) | | | - |
| Prepaid expenses | | | (332) | | | (277) |
| Other | | | (489) | | | (215) |
| Total deferred tax liabilities | | | (3,716) | | | (1,248) |
| Net deferred tax assets | | $ | 10,145 | | $ | 11,169 |
| | | | | | | |
The Company and its subsidiaries are subject to U.S. Federal income tax as well as income of the state of California. The Company is no longer subject to examination by taxing authorities for years before 2004.
At year end 2007, the Company has a California net operating loss carryforwards acquired from the Diablo Valley Bank acquisition of approximately $2,300,000 which will expire in 2022 if not utilized.
(10) Stock option plan
The Company has a stock option plan (the Plan) for directors, officers, and key employees. The Plan provides for the grant of incentive and non-qualified stock options. The Plan provides that the option price for both incentive and non-qualified stock options will be determined by the Board of Directors at no less than the fair value at the date of grant. Options granted vest on a schedule determined by the Board of Directors at the time of grant. Generally, options vest over four years. All options expire no later than ten years from the date of grant. On May 25, 2006, the Company’s shareholders approved an amendment to the Heritage Commerce Corp 2004 Stock Option Plan by authorizing 550,000 additional shares available for option grants. As of December 31, 2007, there are 73,134 shares available for future grants under the Plan.
Option activity under the Plan is as follows:
| | | | | | | Weighted Average | | |
| | | | | Weighted | | Remaining | | Aggregate |
| | | Number | | Average | | Contractual | | Intrinsic |
| Total Stock Options | | of Shares | | Exercise Price | | Life (Years) | | Value |
| Outstanding at January 1, 2007 | | | 752,983 | | $ | 16.56 | | | | |
| Granted | | | 384,000 | | $ | 21.97 | | | | |
| Exercised | | | (83,875) | | $ | 9.56 | | | | |
| Forfeited or expired | | | (42,446) | | $ | 20.97 | | | | |
| Outstanding at December 31, 2007 | | | 1,010,662 | | $ | 19.02 | | | 7.5 | | $ | 1,993,000 |
| Vested or expected to vest | | | 970,236 | | $ | 19.02 | | | 7.5 | | $ | 1,914,000 |
| Exercisable at December 31, 2007 | | | 492,664 | | $ | 16.02 | | | 6.0 | | $ | 1,854,000 |
| | | | | | | | | | | | | |
Information related to the stock option plan during each year follows:
| | | 2007 | | 2006 | | 2005 |
| Intrinsic value of options exercised | | $ | 1,105,000 | | $ | 2,435,000 | | $ | 3,791,000 |
| Cash received from option exercise | | $ | 802,000 | | $ | 1,812,000 | | $ | 3,641,000 |
| Tax benefit realized from option exercises | | $ | 406,000 | | $ | 706,000 | | $ | 1,086,000 |
| Weighted average fair value of options granted | | $ | 6.10 | | $ | 7.57 | | $ | 5.93 |
As of December 31, 2007, there was $3,545,000 of total unrecognized compensation cost related to nonvested share-based compensation arrangements granted under the Company’s stock option plan. That cost is expected to be recognized over a weighted-average period of approximately 2.9 years. The total fair value of options vested during 2007 is approximately $1,159,000.
The fair value of each option grant is estimated on the date of grant using the Black-Scholes option pricing model that uses the assumptions noted in the following table.
| | | 2007 | | 2006 | | 2005 |
Expected life in months (1) | | 72 | | 84 | | 84 |
Volatility (1) | | 22% | | 21% | | 21% |
Weighted average risk-free interest rate (2) | | 4.49% | | 4.85% | | 4.14% |
Expected dividends (3) | | 1.18% | | 0.85% | | 0% |
| (1) | The expected life of employee stock options represents the weighted average period the stock options are expected to remain outstanding. It is estimated based on historical experience. Volatility is based on the historical volatility of the stock price over the same period of the expected life of the option. |
| (2) | Based on the U.S. Treasury constant maturity interest rate with a term consistent with the expected life of the option granted. |
| (3) | The Company began paying cash dividends on the common stock in 2006. Each grant’s dividend yield is calculated by annualizing the most recent quarterly cash dividend and dividing that amount by the market price of the Company’s common stock as of the grant date. |
Forfeitures for options granted prior to 2006 were recognized as they occurred. Beginning in 2006, the Company estimates the impact of forfeitures based on historical experience, and has concluded that forfeitures have no significant effect on stock option expense. The Company issues new shares of common stock to satisfy stock option exercises.
The Company granted 51,000 restricted shares of its common stock to an executive officer pursuant to the terms of a restricted stock agreement, dated March 17, 2005. The grant price was $18.15. Under the terms of the agreement, the restricted shares will vest 25% per year at the end of years three, four, five and six, provided the executive officer is still with the Company, subject to accelerated vesting upon a change of control, termination without cause, termination by the executive officer for good reason (as defined by the executive employment agreement), death or disability. The fair value of stock award at the grant date was $926,000, which is being amortized to expense over the six-year vesting period on the straight-line method. Amortization expense was $154,000 in 2007 and 2006, and $123,000 in 2005.
(11) Leases
Operating Leases
The Company owns one of its offices and leases the others under non-cancelable operating leases with terms, including renewal options, ranging from five to fifteen years. Future minimum payments under the agreements are as follows:
| (Dollars in thousands) | | |
| Year ending December 31, | | |
| 2008 | | $ | 2,142 |
| 2009 | | | 2,022 |
| 2010 | | | 2,175 |
| 2011 | | | 2,033 |
| 2012 | | | 2,044 |
| Thereafter | | | 4,203 |
| Total | | $ | 14,619 |
| | | | |
Rent expense under operating leases was $2,644,000, $2,375,000, and $2,402,000, respectively, in 2007, 2006, and 2005.
(12) Benefit Plans
The Company offers a 401(k) savings plan that allows employees to contribute up to a maximum percentage of their compensation, as established by the Internal Revenue Code. The Company has made a discretionary matching contribution of up to $1,500 for each employee’s contributions in 2007, 2006 and 2005. Contribution expense was $315,000, $279,000, and $271,000 in 2007, 2006 and 2005.
The Company sponsors a non contributory employee stock ownership plan. To participate in this plan, an employee must have worked at least 1,000 hours during the year and must be employed by the Company. Employer contributions to the ESOP are discretionary. Contribution expense was $247,000, $400,000 and $177,087 in 2007, 2006, and 2005. At December 31, 2007, the ESOP owned approximately 142,000 shares of the Company’s stock.
On September 7, 2001, the ESOP borrowed $1,000,000 from an unaffiliated third party lender to fund the purchase of common stock of the Company. This loan was paid off in June 2005. The loan was collateralized by the shares of the Company’s common stock held by the ESOP.
The Company has a nonqualified deferred compensation plan for its directors (“Deferral Plan”). Under the Deferral Plan, a participating director may defer up to 100% of his monthly board fees into the Deferral Plan for up to ten years. Amounts deferred earn interest. The director may elect a distribution schedule of up to ten years. The Company’s deferred compensation obligation of $562,000 and $484,000 as of December 31, 2007 and 2006 is included in “Accrued interest payable and other liabilities.”
The Company has purchased life insurance policies on the lives of directors who have agreed to participate in the Deferral Plan. It is expected that the earnings on these policies will offset the cost of the program. In addition, the Company will receive death benefit payments upon the death of the director. The proceeds will permit the Company to “complete” the deferral program as the director originally intended if he dies prior to the completion of the deferral program. The disbursement of deferred fees is accelerated at death and commences one month after the director dies.
In the event of the director’s disability prior to attainment of his benefit eligibility date, the director may request that the Board permit him to receive an immediate disability benefit equal to the annualized value of the director’s deferral account.
The Company has a supplemental retirement plan covering key executives and directors (“Plan”). The Plan is a nonqualified defined benefit plan and is unsecured and unfunded and there are no Plan assets. The combined number of active and retired/terminated participants in the Plan was 52 at December 31, 2007. The defined benefit represents a stated amount for key executives and directors that generally vests over nine years and is reduced for early retirement. The Company has purchased insurance on the lives of the directors and executive officers in the plan. If the life insurance contract is terminated by the Company, the Company will have the obligation to pay the retirement and death benefits. The accrued pension obligation was $11,499,000 and $10,478,000 as of December 31, 2007 and 2006, respectively, and is included in “Accrued interest payable and other liabilities”. The Plan had accumulated other comprehensive loss before taxes of $1,765,000 and $1,902,000, respectively, as of December 31, 2007 and 2006. The measurement date of the plan is December 31.
The following table sets forth the Plan’s status at December 31:
| (Dollars in thousands) | | 2007 | | 2006 |
| Change in projected benefit obligation | | | | |
| Projected benefit obligation at beginning of year | | $ | 10,478 | | $ | 9,782 |
| Service cost | | | 734 | | | 799 |
| Interest cost | | | 619 | | | 552 |
| Actuarial (gain)/loss | | | (30) | | | (422) |
| Benefits paid | | | (302) | | | (233) |
| Projected benefit obligation at end of year | | $ | 11,499 | | $ | 10,478 |
| | | | | | | |
| Unfunded Status | | $ | (11,499) | | $ | (10,478) |
| Unrecognized net actuarial (gain)/loss | | | 1,765 | | | 1,902 |
| Net amount recognized | | $ | (9,734) | | $ | (8,576) |
| | | | | | | |
| Amounts recognized in accumulated other comprehensive loss | | | | | | |
| Net acturial loss | | $ | 1,594 | | $ | 1,694 |
| Prior service cost | | | 171 | | | 208 |
| Accumulated other comprehensive loss | | $ | 1,765 | | $ | 1,902 |
| | | | | | | |
| Weighted-average assumptions as of December 31 | | | | | | |
| Discount rate | | | 6.45% | | | 5.98% |
| Rate of compensation increase | | | N/A | | | N/A |
| Expected return on Plan assets | | | N/A | | | N/A |
Benefits, which reflect anticipated future events, service and others, are expected to be paid over the following years:
| | | Estimated |
| Year (Dollars in thousands) | | Benefit Payments |
| 2008 | | $ | 430 |
| 2009 | | | 451 |
| 2010 | | | 477 |
| 2011 | | | 595 |
| 2012 | | | 728 |
| 2013 to 2017 | | | 5,162 |
The components of pension cost for the nonqualified supplemental retirement defined benefit plan were as follows:
| (Dollars in thousands) | | 2007 | | 2006 |
| Components of net periodic benefits cost | | | | |
| Service cost | | $ | 734 | | $ | 799 |
| Interest cost | | | 619 | | | 552 |
| Amortization of net acturial and prior serice cost loss | | | 106 | | | 180 |
| Net periodic benefit cost | | $ | 1,459 | | $ | 1,531 |
| | | | | | | |
The net periodic benefit cost was determined using the following assumptions:
| | | 2007 | | 2006 |
| Discount rate | | 5.98% | | 5.68% |
| Rate of increase in future compensation levels for determining expense | | N/A | | N/A |
| Expected return on Plan assets | | N/A | | N/A |
| | | | | |
(13) Disclosures of Fair Value of Financial Instruments
The estimated fair value amounts have been determined by using available market information and appropriate valuation methodologies. However, considerable judgment is required to interpret market data to develop the estimates of fair value. Accordingly, the estimates presented are not necessarily indicative of the amounts that could be realized in a current market exchange. The use of different market assumptions and/or estimation techniques may have a material effect on the estimated fair value amounts.
The carrying amounts and estimated fair values of the Company’s financial instruments at year-end were as follows:
| | | 2007 | | 2006 |
| | | | | Estimated | | | | Estimated |
| | | Carrying | | Fair | | Carrying | | Fair |
| (Dollars in thousands) | | Amounts | | Value | | Amounts | | Value |
| Assets | | | | | | | | |
| Cash and cash equivalents | | $ | 49,093 | | $ | 49,093 | | $ | 49,385 | | $ | 49,385 |
| Securities | | | 135,402 | | | 135,402 | | | 172,298 | | | 172,298 |
| Loans, including loans held for sale, net | | | 1,024,247 | | | 1,011,683 | | | 733,709 | | | 723,302 |
| FHLB and FRB Stock | | | 7,002 | | | N/A | | | 6,113 | | | N/A |
| Accrued interest receivable | | | 5,131 | | | 5,131 | | | 4,876 | | | 4,876 |
| | | | | | | | | | | | | |
| Liabilities | | | | | | | | | | | | |
| Time deposits | | $ | 213,401 | | $ | 214,151 | | $ | 174,073 | | $ | 173,953 |
| Other deposits | | | 850,825 | | | 850,825 | | | 672,520 | | | 672,520 |
| Securities sold under agreement to repurchase | | | 10,900 | | | 10,881 | | | 21,800 | | | 21,421 |
| Other short-term borrowings | | | 60,000 | | | 60,000 | | | - | | | - |
| Notes payable subsidiary grantor trusts | | | 23,702 | | | 24,010 | | | 23,702 | | | 25,820 |
| Accrued interest payable | | | 1,844 | | | 1,844 | | | 2,048 | | | 2,048 |
The following methods and assumptions were used to estimate the fair value in the table, above:
Cash and Cash Equivalents and Accrued Interest Receivable and Payable
The carrying amount approximates fair value because of the short maturities of these instruments.
Securities
Security fair values are based on market prices or dealer quotes and, if no such information is available, on the rate and term of the security and information about the issuer. It was not practical to determine the fair value of FHLB and FRB stock due to the restrictions placed on transferability.
Loans
Loans with similar financial characteristics are grouped together for purposes of estimating their fair value. Loans are segregated by type such as commercial, term real estate, residential construction, and consumer. Each loan category is further segmented into fixed and adjustable rate interest terms.
The fair value of performing, fixed rate loans is calculated by discounting scheduled future cash flows using estimated market discount rates that reflect the credit and interest rate risk inherent in the loan. The fair value of variable rate loans approximates the carrying amount as these loans generally reprice within 90 days. The fair value of loans held for sale is based on estimated market values.
Deposits
The fair value of deposits with no stated maturity, such as non-interest bearing demand deposits, savings, and money market accounts, approximates the amount payable on demand. The carrying amount approximates the fair value of time deposits with a remaining maturity of less than 90 days. The fair value of all other time deposits is calculated based on discounting the future cash flows using rates currently offered by the Bank for time deposits with similar remaining maturities.
Notes Payable to Subsidiary Grantor Trusts and Securities Sold Under Agreement to Repurchase
The fair values of notes payable to subsidiary grantor trusts and securities sold under agreement to repurchase were determined based on the current market value for like kind instruments of a similar maturity and structure.
Other Short-term Borrowings
The carrying amount approximates the fair value of short-term borrowings that reprice frequently and fully.
Commitments to Fund Loans/Standby Letters of Credit
The fair values of commitments are estimated using the fees currently charged to enter into similar agreements, taking into account the remaining terms of the agreements and the present creditworthiness of the counterparties. The amounts of and differences between the carrying value of commitments to fund loans or stand by letters of credit and their fair value is not significant and therefore is not included in the table above.
Limitations
Fair value estimates are made at a specific point in time, based on relevant market information about the financial instruments. These estimates do not reflect any premium or discount that could result from offering for sale at one time the entire holdings of a particular financial instrument. Fair value estimates are based on judgments regarding future expected loss experience, current economic conditions, risk characteristics of various financial instruments, and other factors. These estimates are subjective in nature and involve uncertainties and matters of significant judgment and therefore cannot be determined with precision. Changes in assumptions could significantly affect the estimates.
(14) Commitments and Contingencies
Financial Instruments with Off-Balance Sheet Risk
HBC is a party to financial instruments with off-balance sheet risk in the normal course of business to meet the financing needs of its clients. These financial instruments include commitments to extend credit and standby letters of credit. Those instruments involve, to varying degrees, elements of credit and interest rate risk in excess of the amounts recognized in the balance sheets.
HBC’s exposure to credit loss in the event of non-performance of the other party to the financial instrument for commitments to extend credit and standby letters of credit is represented by the contractual amount of those instruments. HBC uses the same credit policies in making commitments and conditional obligations as it does for on-balance sheet instruments. Credit risk is the possibility that a loss may occur because a party to a transaction failed to perform according to the terms of the contract. HBC controls the credit risk of these transactions through credit approvals, limits, and monitoring procedures. Management does not anticipate any significant losses as a result of these transactions.
Commitments to extend credit as of December 31, 2007 and 2006 were as follows:
| (Dollars in thousands) | | 2007 | | 2006 |
| Commitments to extend credit | | $ | 444,172 | | $ | 310,200 |
| Standby letters of credit | | | 21,143 | | | 12,020 |
| Commitments to fund | | $ | 465,315 | | $ | 322,220 |
| | | | | | | |
Generally, commitments to extend credit as of December 31, 2007 are at variable rates, typically based on the prime rate (with a margin). Commitments generally expire within one year.
Commitments to extend credit are agreements to lend to a client as long as there is no violation of conditions established in the contract. Commitments generally have fixed expiration dates or other termination clauses. Since some of the commitments are expected to expire without being drawn upon, the total commitment amount does not necessarily represent future cash requirements. HBC evaluates each client’s creditworthiness on a case-by-case basis. The amount of collateral obtained, if deemed necessary by HBC upon the extension of credit, is based on management’s credit evaluation of the borrower. Collateral held varies but may include cash, marketable securities, accounts receivable, inventory, property, plant and equipment, income-producing commercial properties, and/or residential properties. Fair value of these instruments is not material.
Standby letters of credit are written with conditional commitments issued by HBC to guaranty the performance of a client to a third party. The credit risk involved in issuing letters of credit is essentially the same as that involved in extending loan facilities to clients.
The Company is required to maintain noninterest bearing reserves. Reserve requirements are based on a percentage of certain deposits. As of December 31, 2007, the Company maintained reserves of $3,289,000 in the form of vault cash and balances at the Federal Reserve Bank of San Francisco, which satisfied the regulatory requirements.
Claims
The Company is involved in certain legal actions arising from normal business activities. Management, based upon the advice of legal counsel, believes the ultimate resolution of all pending legal actions will not have a material effect on the financial statements of the Company.
(15) Capital Requirements
The Company and its subsidiary bank are subject to various regulatory capital requirements administered by the federal banking agencies. Failure to meet minimum capital requirements can initiate certain mandatory - and possibly additional discretionary - actions by regulators that, if undertaken, could have a direct material effect on the Company’s financial statements and operations. Under capital adequacy guidelines and the regulatory framework for prompt corrective action, the Company and HBC must meet specific capital guidelines that involve quantitative measures of assets, liabilities, and certain off-balance-sheet items as calculated under regulatory accounting practices. Capital amounts and classifications are also subject to qualitative judgments by the regulators about components, risk weightings, and other factors.
Quantitative measures established by regulation to ensure capital adequacy require the Company and HBC to maintain minimum amounts and ratios (set forth in the table below) of total and Tier I capital (as defined in the regulations) to risk-weighted assets (as defined), and of Tier I capital to average assets (as defined). Management believes that, as of December 31, 2007 and 2006, the Company and HBC meet all capital adequacy guidelines to which they are subject.
The most recent notification from the FDIC as of December 31, 2007 categorized HBC as “well capitalized” under the regulatory framework for prompt corrective action. There are no conditions or events since that notification that management believes have changed the Bank’s category.
The Company’s actual and required consolidated capital amounts and ratios are presented in the following table:
| | | Actual | | For Capital Adequacy Purposes |
| (Dollars in thousands) | | Amount | | Ratio | | Amount | | Ratio |
| As of December 31, 2007 | | | | | | | | |
| Total Capital | | $ | 153,687 | | 12.5% | | $ | 98,203 | | 8.0% |
| (to risk-weighted assets) | | | | | | | | | | |
| Tier 1 Capital | | $ | 141,226 | | 11.5% | | $ | 49,122 | | 4.0% |
| (to risk-weighted assets) | | | | | | | | | | |
| Tier 1 Capital | | $ | 141,226 | | 11.1% | | $ | 51,123 | | 4.0% |
| (to average assets) | | | | | | | | | | |
| | | | | | | | | | | |
| As of December 31, 2006 | | | | | | | | | | |
| Total Capital | | $ | 157,356 | | 18.4% | | $ | 68,416 | | 8.0% |
| (to risk-weighted assets) | | | | | | | | | | |
| Tier 1 Capital | | $ | 147,600 | | 17.3% | | $ | 34,127 | | 4.0% |
| (to risk-weighted assets) | | | | | | | | | | |
| Tier 1 Capital | | $ | 147,600 | | 13.6% | | $ | 43,412 | | 4.0% |
| (to average assets) | | | | | | | | | | |
HBC’s actual capital and required amounts and ratios are presented in the following table:
| | | | | | | | | | | To Be Well-Capitalized Under Prompt |
| | | Actual | | For Capital Adequacy Purposes | | Corrective Action Provisions |
| (Dollars in thousands) | | Amount | | Ratio | | Amount | | Ratio | | Amount | | Ratio |
| As of December 31, 2007 | | | | | | | | | | | | |
| Total Capital | | $ | 144,154 | | 11.8% | | $ | 98,064 | | 8.0% | | $ | 122,580 | | 10.0% |
| (to risk-weighted assets) | | | | | | | | | | | | | | | |
| Tier 1 Capital | | $ | 131,693 | | 10.7% | | $ | 49,048 | | 4.0% | | $ | 73,572 | | 6.0% |
| (to risk-weighted assets) | | | | | | | | | | | | | | | |
| Tier 1 Capital | | $ | 131,693 | | 10.4% | | $ | 50,798 | | 4.0% | | $ | 63,497 | | 5.0% |
| (to average assets) | | | | | | | | | | | | | | | |
| | | | | | | | | | | | | | | | |
| As of December 31, 2006 | | | | | | | | | | | | | | | |
| Total Capital | | $ | 154,711 | | 18.1% | | $ | 68,381 | | 8.0% | | $ | 85,476 | | 10.0% |
| (to risk-weighted assets) | | | | | | | | | | | | | | | |
| Tier 1 Capital | | $ | 144,955 | | 17.0% | | $ | 34,107 | | 4.0% | | $ | 51,161 | | 6.0% |
| (to risk-weighted assets) | | | | | | | | | | | | | | | |
| Tier 1 Capital | | $ | 144,955 | | 13.4% | | $ | 43,270 | | 4.0% | | $ | 54,088 | | 5.0% |
| (to average assets) | | | | | | | | | | | | | | | |
Under California law, the holders of common stock are entitled to receive dividends when and as declared by the Board of Directors, out of funds legally available therefore. The California Banking Law provides that a state-licensed bank may not make a cash distribution to its shareholders in excess of the lesser of the following: (i) the bank’s retained earnings, or (ii) the bank’s net income for its last three fiscal years, less the amount of any distributions made by the bank to its shareholders during such period. However, a bank, with the prior approval of the Commissioner, may make a distribution to its shareholders of an amount not to exceed the greater of (i) a bank’s retained earnings, (ii) its net income for its last fiscal year, or (iii) its net income for the current fiscal year. In the event that the Commissioner determines that the shareholders’ equity of a bank is inadequate or that the making of a distribution by a bank would be unsafe or unsound, the Commissioner may order a bank to refrain from making such a proposed distribution. At December 31, 2007, the amount available for such dividends without prior regulatory approval was approximately $17,503,000 for HBC. Similar restrictions apply to the amounts and sum of loan advances and other transfers of funds from HBC to the parent Company.
(16) Parent Company only Condensed Financial Information
The condensed financial statements of Heritage Commerce Corp (parent company only) are as follows:
| Condensed Balance Sheets |
| | | December 31, |
| (Dollars in thousands) | | 2007 | | 2006 |
| Assets | | | | |
| Cash and cash equivalents | | $ | 9,391 | | $ | 2,104 |
| Investment in subsidiary bank | | | 178,290 | | | 143,175 |
| Investment in subsidiary trusts | | | 702 | | | 702 |
| Other assets | | | 723 | | | 1,131 |
| Total assets | | $ | 189,106 | | $ | 147,112 |
| | | | | | | |
| Liabilities and Shareholders' Equity | | | | | | |
| Notes payable to subsidiary trusts | | $ | 23,702 | | $ | 23,702 |
| Other liabilities | | | 580 | | | 590 |
| Shareholders' equity | | | 164,824 | | | 122,820 |
| Total liabilities and shareholders' equity | | $ | 189,106 | | $ | 147,112 |
| | | | | | | |
| Condensed Statements of Income and Comprehensive Income |
| | | For the Year Ended December 31, |
| (Dollars in thousands) | | 2007 | | 2006 | | 2005 |
| Interest income | | $ | 24 | | $ | 27 | | $ | 63 |
| Dividend from subsidiary bank | | | 25,699 | | | 10,000 | | | - |
| Interest expense | | | (2,331) | | | (2,310) | | | (2,136) |
| Other expenses | | | (2,156) | | | (1,431) | | | (1,130) |
| Income (loss) before equity in undistributed net income of subsidiary bank | | | 21,236 | | | 6,286 | | | (3,203) |
| Equity in undistributed net income of subsidiary bank | | | (8,739) | | | 9,666 | | | 16,576 |
| Income tax benefit | | | 1,599 | | | 1,318 | | | 1,073 |
| Net income | | $ | 14,096 | | $ | 17,270 | | $ | 14,446 |
| | | | | | | | | | |
| Condensed Statements of Cash Flows |
| | | For the Year Ended December 31, |
| (Dollars in thousands) | | 2007 | | 2006 | | 2005 |
| Cash flows from operating activities: | | | | | | |
| Net Income | | $ | 14,096 | | $ | 17,270 | | $ | 14,446 |
| Adjustments to reconcile net income to net cash provided by (used in) operations: | | | | | | | | | |
| Amortization of restricted stock award | | | 154 | | | 154 | | | 123 |
| Equity in undistributed net income of subsidiary bank | | | 8,739 | | | (9,666) | | | (16,576) |
| Net change in other assets and liabilities | | | 399 | | | 3 | | | (944) |
| Net cash provided by (used in) operating activities | | | 23,388 | | | 7,761 | | | (2,951) |
| | | | | | | | | | |
| Cash flows from financing activities: | | | | | | | | | |
| Exercise of stock options | | | 802 | | | 1,812 | | | 3,641 |
| Common stock repurchased | | | (13,653) | | | (7,888) | | | (5,732) |
| Dividends paid | | | (3,250) | | | (2,357) | | | - |
| Other, net | | | - | | | - | | | (12) |
| Net cash provided by (used in) financing activities | | | (16,101) | | | (8,433) | | | (2,103) |
| Net increase (decrease) in cash and cash equivalents | | | 7,287 | | | (672) | | | (5,054) |
| Cash and cash equivalents, beginning of year | | | 2,104 | | | 2,776 | | | 7,830 |
| Cash and cash equivalents, end of year | | $ | 9,391 | | $ | 2,104 | | $ | 2,776 |
| | | | | | | | | | |
(17) Quarterly Financial Data (Unaudited)
The following table discloses the Company’s selected unaudited quarterly financial data:
| | | For the Quarters Ended |
| (Dollars in thousands, except per share amounts) | | 12/31/2007 (1) | | 9/30/2007 (1) | | 06/30/07 | | 03/31/07 |
| Interest income | | $ | 21,056 | | $ | 22,105 | | $ | 18,317 | | $ | 17,234 |
| Interest expense | | | 7,261 | | | 8,324 | | | 5,924 | | | 5,503 |
| Net interest income | | | 13,795 | | | 13,781 | | | 12,393 | | | 11,731 |
| Provision for loan losses | | | 725 | | | (500) | | | - | | | (236) |
| Net interest income after provision for loan losses | | | 13,070 | | | 14,281 | | | 12,393 | | | 11,967 |
Noninterest income (2) | | | 1,636 | | | 1,639 | | | 2,262 | | | 2,515 |
| Noninterest expense | | | 10,212 | | | 10,518 | | | 8,500 | | | 8,300 |
| Income before income taxes | | | 4,494 | | | 5,402 | | | 6,155 | | | 6,182 |
| Income tax expense | | | 1,686 | | | 2,162 | | | 2,140 | | | 2,149 |
| Net income | | $ | 2,808 | | $ | 3,240 | | $ | 4,015 | | $ | 4,033 |
| | | | | | | | | | | | | |
| Earnings per share | | | | | | | | | | | | |
| Basic | | $ | 0.22 | | $ | 0.24 | | $ | 0.34 | | $ | 0.35 |
| Diluted | | $ | 0.21 | | $ | 0.24 | | $ | 0.33 | | $ | 0.34 |
| | | | | | | | | | | | | |
(1) As Discussed in Note 1, the Company completed its acquisition of Diablo Valley Bank on June 20, 2007. The acquisition significantly increased the Company’s revenues and expenses.
(2) Noninterest income decreased in the third and fourth quarters due to a strategic decision to cease loan sales in favor of retaining SBA loans.
| | | For the Quarters Ended |
| (Dollars in thousands, except per share amounts) | | 12/31/06 | | 09/30/06 | | 06/30/06 | | 03/31/06 |
| Interest income | | $ | 18,737 | | $ | 18,568 | | $ | 18,392 | | $ | 17,260 |
| Interest expense | | | 5,936 | | | 5,754 | | | 5,766 | | | 5,069 |
| Net interest income | | | 12,801 | | | 12,814 | | | 12,626 | | | 12,191 |
| Provision for loan losses | | | 100 | | | - | | | (114) | | | (489) |
| Net interest income after provision for loan losses | | | 12,701 | | | 12,814 | | | 12,740 | | | 12,680 |
| Noninterest income | | | 2,390 | | | 2,299 | | | 2,257 | | | 2,894 |
| Noninterest expense | | | 8,703 | | | 8,312 | | | 8,492 | | | 8,761 |
| Income before income taxes | | | 6,388 | | | 6,801 | | | 6,505 | | | 6,813 |
| Income tax expense | | | 2,036 | | | 2,448 | | | 2,316 | | | 2,437 |
| Net income | | $ | 4,352 | | $ | 4,353 | | $ | 4,189 | | $ | 4,376 |
| | | | | | | | | | | | | |
| Earnings per share | | | | | | | | | | | | |
| Basic | | $ | 0.37 | | $ | 0.37 | | $ | 0.35 | | $ | 0.37 |
| Diluted | | $ | 0.37 | | $ | 0.36 | | $ | 0.35 | | $ | 0.36 |