Exhibit 99.1

Member FDIC Welcome to the Virtual Annual Meeting of Shareholders Thursday, May 25, 2023 at 1:00 p.m. Pacific Daylight Time (PDT)
Prepared for the North Bay Advisory Board Virtual Annual Meeting of Shareholders Agenda 1. Call to Order and Opening Remarks 2. New Business / Proposals a. To elect 10 members of the Board of Directors, each for a term of one year ; b. To approve Heritage Commerce Corp (the “Company”) 2023 Equity Incentive Plan; c. To approve an advisory proposal on the Company’s 2022 executive compensation ; and d. To ratify the selection of Crowe LLP as the Company’s independent registered public accounting firm for the year ended December 31, 2023 3. Voting on Proposals 4. Closing of the Formal Meeting / Begin Presentation 2
Member FDIC Virtual Annual Meeting of Shareholders Presentation May 25, 2023

Prepared for the North Bay Advisory Board Forward Looking Statement Disclaimer Forward - looking statements are based on management’s knowledge and belief as of today and include information concerning Heritage Commerce Corp, the holding company (the “Company”) for Heritage Bank of Commerce (the “Bank”), possible or assumed future financial condition, and its results of operations, business and earnings outlook. These forward - looking statements are subject to risks and uncertainties. For a discussion of risk factors which could cause results to differ, please see the Company’s reports on Forms 10 - K and 10 - Q as filed with the Securities and Exchange Commission and the Company’s press releases. Readers should not place undue reliance on the forward - looking statements, which reflect management's view only as of the date hereof. The Company undertakes no obligation to publicly revise these forward - looking statements to reflect subsequent events or circumstances. 4

Prepared for the North Bay Advisory Board Safety, Stability, Action Call ▪ The Company’s total liquidity and borrowing capacity was $3.073 billion, of which $2.773 billion was remaining available at March 31, 2023 . ▪ The remaining available liquidity and borrowing capacity of $2.773 billion was 62% of total deposits and approximately 110% of estimated uninsured deposits at March 31, 2023 . ▪ The Company borrowed $150.0 million on its line of credit with the FRB, and another $150.0 million on its line of credit with the FHLB during the first quarter of 2023, and both lines of credit were repaid in full on April 20, 2023. These short - term borrowings provided instant liquidity during an uncertain time and allowed the Company to test the lines for future contingency planning purposes . ▪ The Company’s consolidated capital ratios exceeded regulatory guidelines and the Bank’s capital ratios exceeded regulatory guidelines under the Basel III prompt corrective action (“PCA”) provisions for a well - capitalized financial institution, and the Basel III minimum regulatory requirements at March 31, 2023. Actions taken by Team: ▪ Activated Relationship Management team members to call all clients. ▪ Met directly with principals of all major deposit clients. ▪ Accelerated account opening procedures for new client acquisition. 5
Prepared for the North Bay Advisory Board Heritage Commerce Corp Profile History: ▪ Heritage Bank of Commerce, a community business bank founded in 1994 headquartered in San Jose, California ▪ Heritage Commerce Corp, a California corporation organized in 1997, the holding company for Heritage Bank of Commerce Relationship Banking: ▪ Offers a full range of banking services to small and medium - sized businesses, professional organizations, non - profits, and community groups and their employees using a “Consultative” relationship banking approach Customer Clientele: ▪ Small to medium - sized closely held businesses (and their principals and key employees) ▪ Professional organizations ▪ High net worth individuals ▪ Non - profits Specialty Expertise: ▪ Small Business Administration (“SBA”) Lending and loan sales ▪ Corporate Finance/Asset - Based Lending ▪ Factoring ▪ Construction Lending ▪ Cash Management ▪ Non - profit organizations, education, and churches ▪ Homeowner Association Services (“HOA”) 6
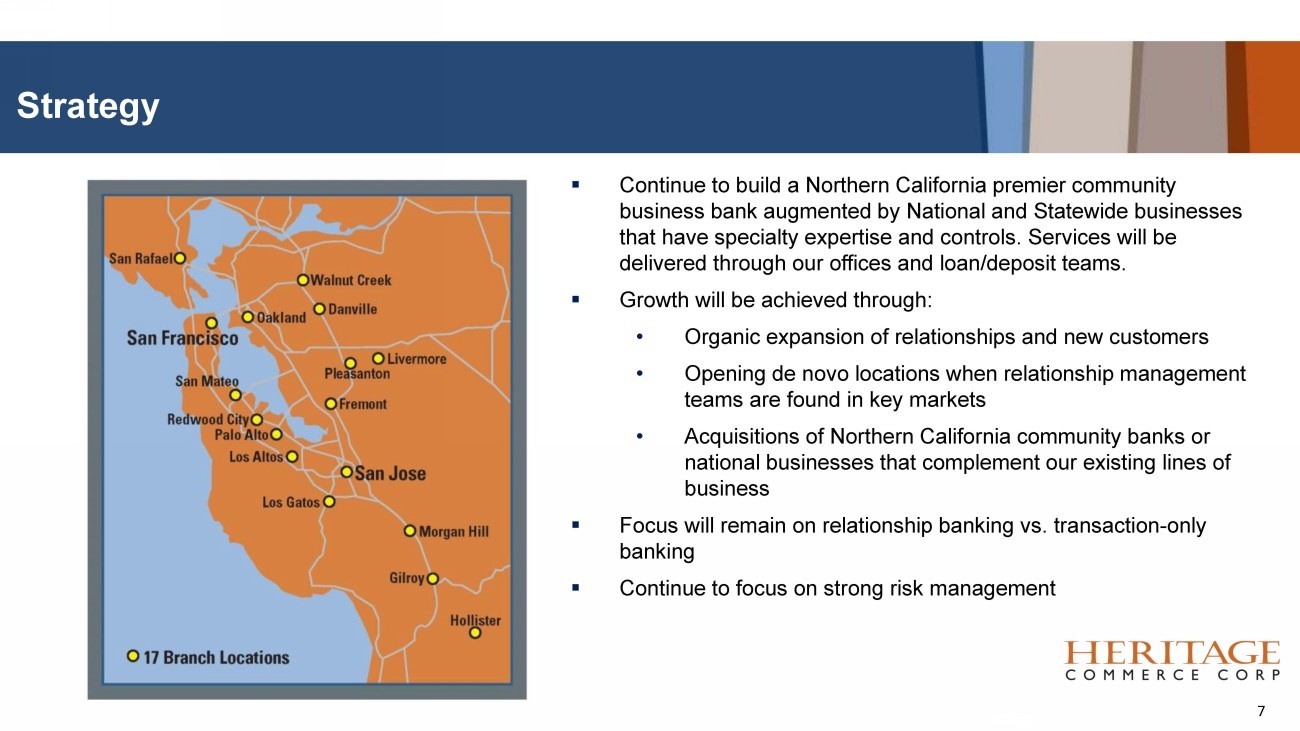
Prepared for the North Bay Advisory Board Strategy ▪ Continue to build a Northern California premier community business bank augmented by National and Statewide businesses that have specialty expertise and controls. Services will be delivered through our offices and loan/deposit teams. ▪ Growth will be achieved through: • Organic expansion of relationships and new customers • Opening de novo locations when relationship management teams are found in key markets • Acquisitions of Northern California community banks or national businesses that complement our existing lines of business ▪ Focus will remain on relationship banking vs. transaction - only banking ▪ Continue to focus on strong risk management 7

Prepared for the North Bay Advisory Board Balance Sheet Highlights (dollars in billions) 8 $3.1 B $4.1 B $4.6 B $5.5 B $5.2 B $5.5 B $1.9 B $2.5 B $2.6 B $3.1 B $3.3 B $3.3 B $2.6 B $3.4 B $3.9 B $4.8 B $4.4 B $4.4 B $0.0 B $1.0 B $2.0 B $3.0 B $4.0 B $5.0 B $6.0 B 2018 2019 2020 2021 2022 1Q23 Total assets Total loans Total deposits
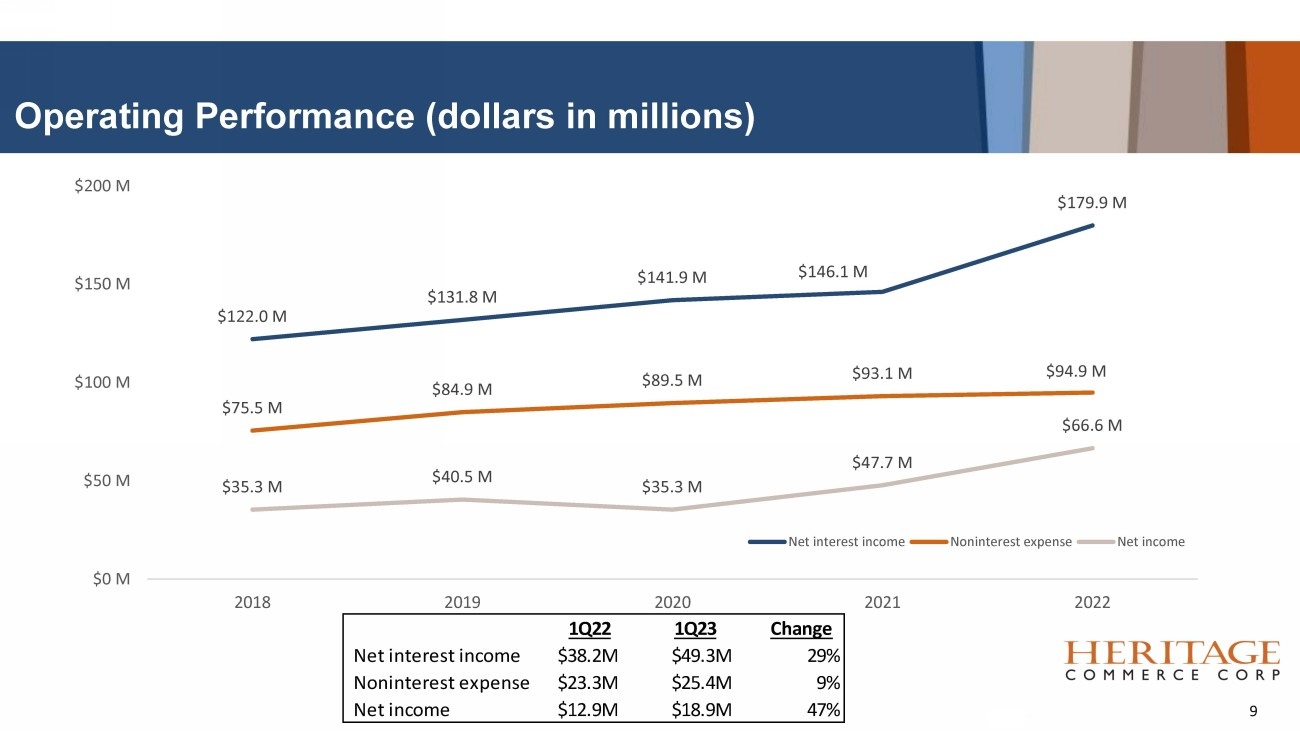
Prepared for the North Bay Advisory Board Operating Performance (dollars in millions) 9 $122.0 M $131.8 M $141.9 M $146.1 M $179.9 M $75.5 M $84.9 M $89.5 M $93.1 M $94.9 M $35.3 M $40.5 M $35.3 M $47.7 M $66.6 M $0 M $50 M $100 M $150 M $200 M 2018 2019 2020 2021 2022 Net interest income Noninterest expense Net income 1Q22 1Q23 Change Net interest income $38.2M $49.3M 29% Noninterest expense $23.3M $25.4M 9% Net income $12.9M $18.9M 47%
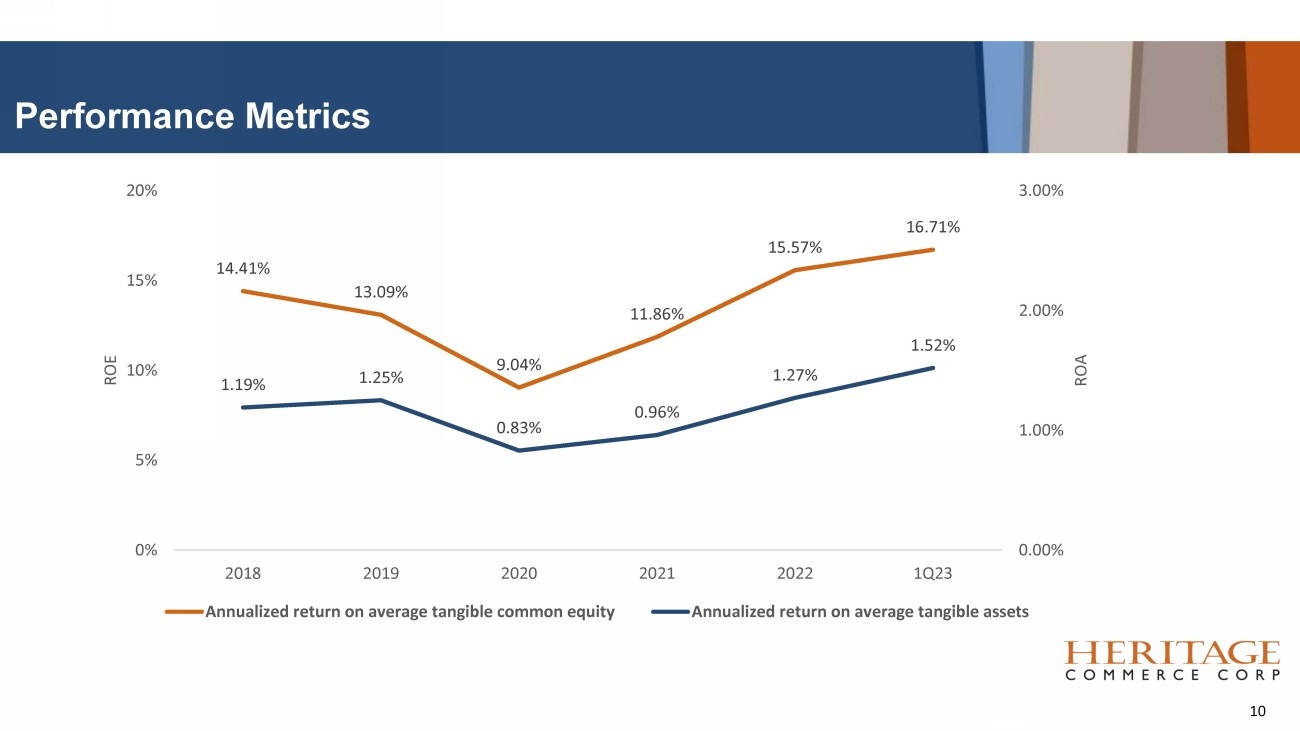
Prepared for the North Bay Advisory Board Performance Metrics 10 14.41% 13.09% 9.04% 11.86% 15.57% 16.71% 1.19% 1.25% 0.83% 0.96% 1.27% 1.52% 0.00% 1.00% 2.00% 3.00% 0% 5% 10% 15% 20% 2018 2019 2020 2021 2022 1Q23 ROA ROE Annualized return on average tangible common equity Annualized return on average tangible assets
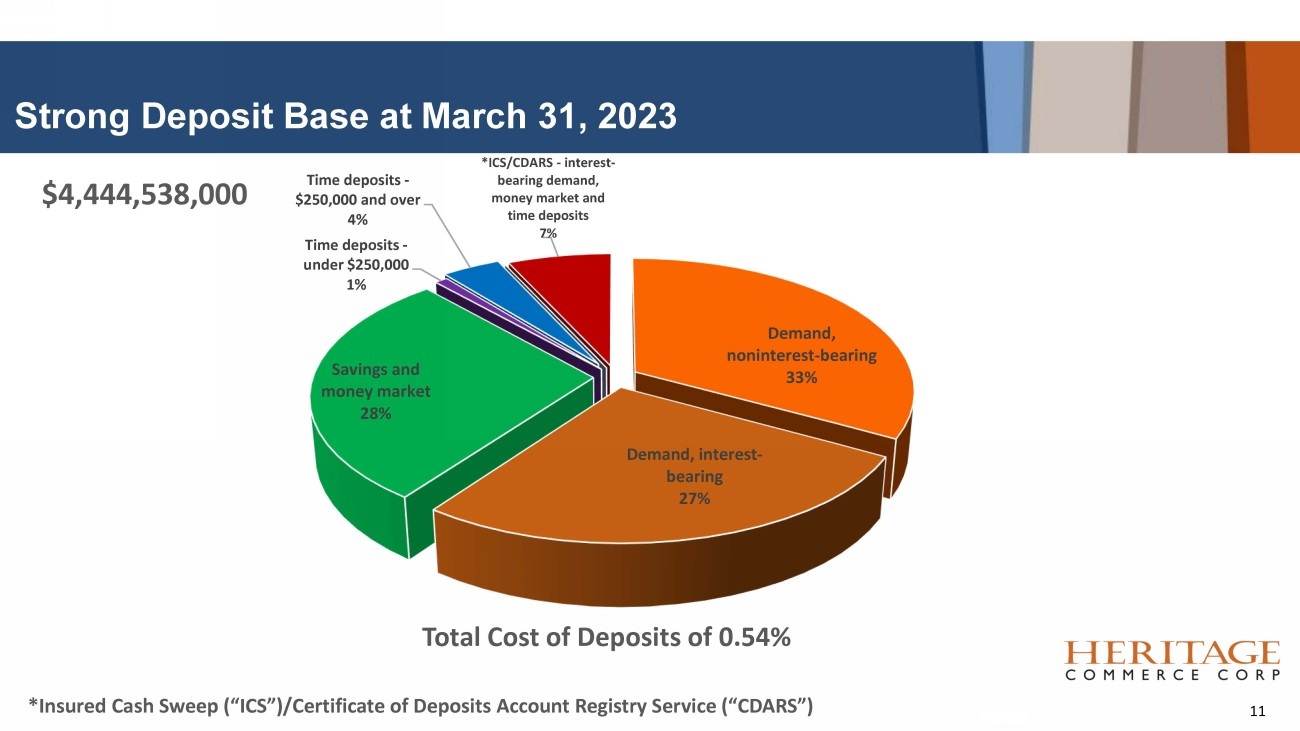
Prepared for the North Bay Advisory Board Strong Deposit Base at March 31, 2023 Demand, noninterest - bearing 33% Demand, interest - bearing 27% Savings and money market 28% Time deposits - under $250,000 1% Time deposits - $250,000 and over 4% *ICS/CDARS - interest - bearing demand, money market and time deposits 7% Total Cost of Deposits of 0.54% 11 *Insured Cash Sweep (“ICS”)/Certificate of Deposits Account Registry Service (“CDARS”) $4,444,538,000

Prepared for the North Bay Advisory Board Total Deposits Stable ▪ Total deposits increased $54.9 million, or 1%, to $4.445 billion at March 31, 2023 from December 31, 2022. ▪ ICS/CDARS deposits increased $273.7 million, or 901%, to $304.1 million at March 31, 2023 from $30.4 million at December 31, 2022, which included $128.0 million of off - balance sheet relationship - based client deposits brought onto the balance sheet, and an increase in client deposits of $145.8 million during the first quarter of 2023. ▪ Noninterest - bearing demand deposits decreased ($267.6) million, or (15%), to $1.469 billion at March 31, 2023 from December 31, 2022, primarily due to clients moving noninterest - bearing deposits to the Bank’s interest - bearing and ICS deposits. ▪ The Company had 24,103 deposits accounts at March 31, 2023, with an average balance of $184,000. ▪ Uninsured deposits represented approximately 57% of total deposits at March 31, 2023, down from 64% at December 31, 2022. 12
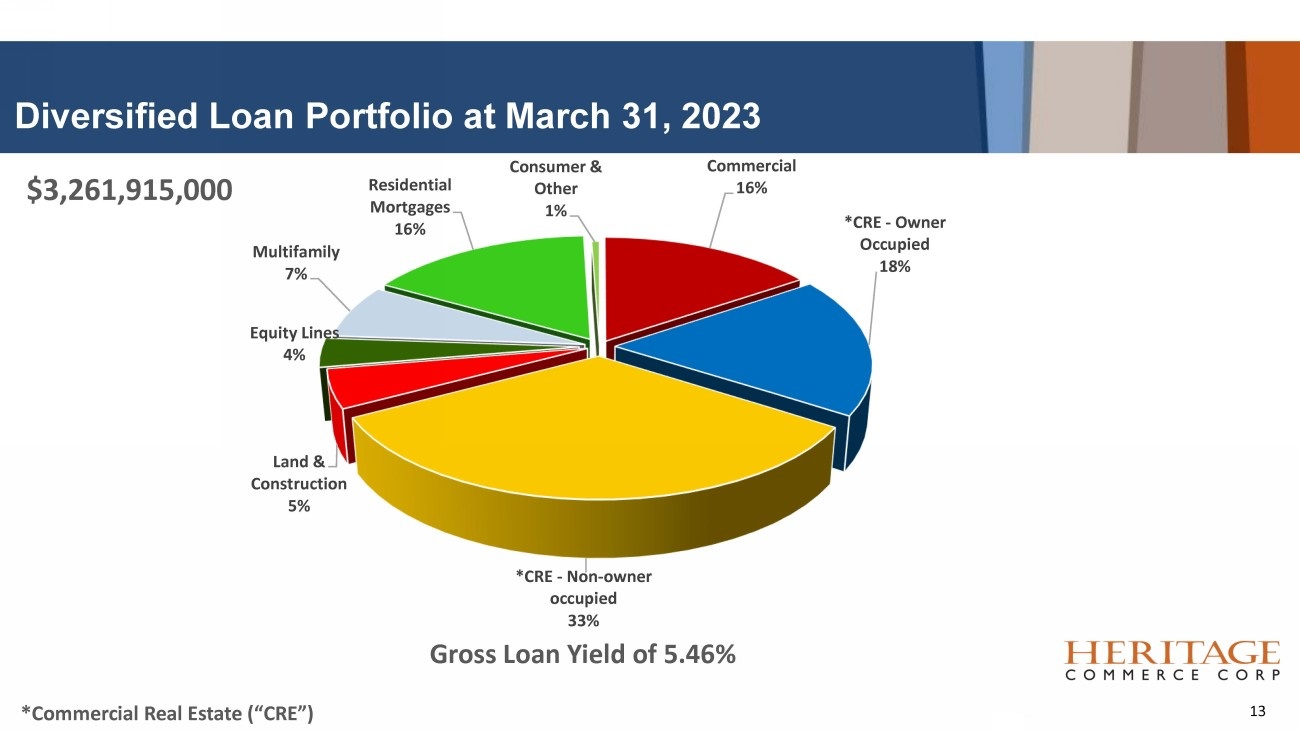
Prepared for the North Bay Advisory Board Diversified Loan Portfolio at March 31, 2023 Commercial 16% *CRE - Owner Occupied 18% *CRE - Non - owner occupied 33% Land & Construction 5% Equity Lines 4% Multifamily 7% Residential Mortgages 16% Consumer & Other 1% Gross Loan Yield of 5.46% 13 *Commercial Real Estate (“CRE”) $3,261,915,000

Prepared for the North Bay Advisory Board CRE Portfolio ▪ CRE loans totaled $1.687 billion at March 31, 2023, which included 36% of owner occupied loans and 64% of investor and other CRE loans. ▪ The average loan size for all CRE loans was $1.6 million, and the average loan size for office CRE loans was also $1.6 million. ▪ The Company has personal guarantees on 90% of its CRE portfolio, while 10% are unguaranteed. A substantial portion of the unguaranteed CRE loans were made to credit - worthy non - profit organizations. ▪ Office exposure in the CRE portfolio totaled $383 million, including 30 loans totaling approximately $70 million, in San Jose , 19 loans totaling approximately $28 million, in San Francisco, and 5 loans totaling approximately $10 million, in Oakland, at March 31, 2023. ▪ Of the $383 million of CRE loans with office exposure, approximately $29 million, or 8%, are situated in the Bay Area downtown business districts of San Jose and San Francisco, with an average balance of $2.2 million. ▪ At March 31, 2023, the weighted average loan - to - value and debt - service coverage for the entire non - owner occupied office portfolio were 43.2% and 2.09 times, respectively. For the ten non - owner occupied office loans in the City and County of San Francisco at March 31, 2023, the weighted average loan - to - value and debt - service coverage were 28.5% and 3.41 times, respectively. ▪ The average vacancy level for the San Francisco CRE loans was 5.8%, of which the vast majority are single - tenant small spaces in office buildings situated outside of downtown. 14
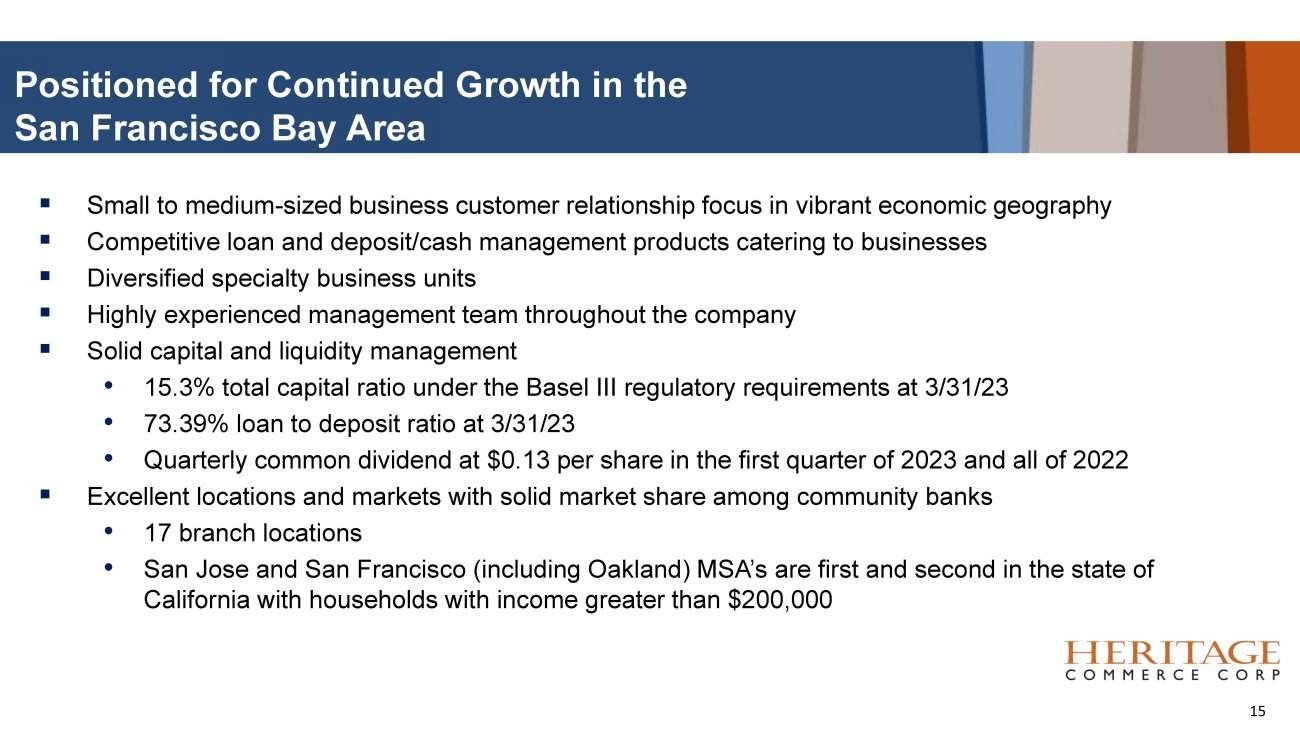
Prepared for the North Bay Advisory Board Positioned for Continued Growth in the San Francisco Bay Area ▪ Small to medium - sized business customer relationship focus in vibrant economic geography ▪ Competitive loan and deposit/cash management products catering to businesses ▪ Diversified specialty business units ▪ Highly experienced management team throughout the company ▪ Solid capital and liquidity management • 15.3% total capital ratio under the Basel III regulatory requirements at 3/31/23 • 73.39% loan to deposit ratio at 3/31/23 • Quarterly common dividend at $0.13 per share in the first quarter of 2023 and all of 2022 ▪ Excellent locations and markets with solid market share among community banks • 17 branch locations • San Jose and San Francisco (including Oakland) MSA’s are first and second in the state of California with households with income greater than $200,000 15
For the North Bay Advisory Board For more information contact: Deborah K. Reuter Executive Vice President Chief Risk Officer & Corporate Secretary 408 - 494 - 4542