UNITED STATES
SECURITIES AND EXCHANGE COMMISSION
Washington, D.C. 20549
FORM N-CSR
CERTIFIED SHAREHOLDER REPORT OF REGISTERED MANAGEMENT INVESTMENT COMPANIES
Investment Company Act file number: 811-08629
HARTFORD SERIES FUND, INC.
(Exact name of registrant as specified in charter)
690 Lee Road, Wayne, Pennsylvania 19087
(Address of Principal Executive Offices) (Zip Code)
Thomas R. Phillips, Esquire
Hartford Funds Management Company, LLC
690 Lee Road
Wayne, Pennsylvania 19087
(Name and Address of Agent for Service)
Registrant’s telephone number, including area code: (610) 386-4068
Date of fiscal year end: December 31
Date of reporting period: June 30, 2018
Form N-CSR is to be used by management investment companies to file reports with the Commission not later than 10 days after the transmission to stockholders of any report that is required to be transmitted to stockholders under Rule 30e-1 under the Investment Company Act of 1940 (17 CFR 270.30e-1). The Commission may use the information provided on Form N-CSR in its regulatory, disclosure review, inspection, and policymaking roles.
A registrant is required to disclose the information specified by Form N-CSR, and the Commission will make this information public. A registrant is not required to respond to the collection of information contained in Form N-CSR unless the Form displays a currently valid Office of Management and Budget (“OMB”) control number. Please direct comments concerning the accuracy of the information collection burden estimate and any suggestions for reducing the burden to Secretary, Securities and Exchange Commission, 100 F Street, NE, Washington, DC 20549. The OMB has reviewed this collection of information under the clearance requirements of 44 U.S.C. § 3507.
Item 1. Reports to Stockholders.
Dear Shareholders:
Thank you for investing in Hartford HLS Funds. The following is the Funds’ Semi-Annual Report covering the period from January 1, 2018 through June 30, 2018.
Market Review
While volatility has increased, U.S. stocks, as measured by the S&P 500 Index (the “Index”),1 have experienced a modest but positive return of 2.65% year-to-date as of June 30.
The Index has experienced more than 35 days with swings of 1% or more this year, compared to eight days for all of 2017. Rising interest rates, inflation anxiety, and concerns surrounding U.S. tariffs and trade policies have contributed to the return of volatility.
The U.S. Federal Reserve (Fed) continued its cycle of interest-rate increases. As of the end of June, short-term rates range from 1.5% to 1.75%. At the time of this writing, expectations were for a continued gradual increase throughout 2018. Central banks overseas are also expected to begin removing accommodative policies by raising interest rates, which may impact global markets.
Going forward, politics both at home and abroad are likely to continue playing a key role in driving market movements. Protectionist U.S. trade policies have sparked fear and uncertainty among some investors. Geopolitical tensions continue to persist around U.S. engagement with Syria, heightening market uncertainty.
In Europe, uncertainty remains with respect to Britain’s “Brexit” undertaking, and now Italy’s potential departure from the European Union, which could influence markets or cause an uptick in volatility.
We encourage you to maintain a strong relationship with your financial advisor, who can help guide you through shifting markets confidently. He or she can help you proactively build a portfolio that takes market uncertainty into account, along with your unique investment goals and risk tolerances. Your financial advisor can help you find a fit within our family of funds as you work toward those goals.
Thank you again for investing in Hartford HLS Funds. For the most up-to-date information on our funds, please take advantage of all the resources available at hartfordfunds.com.

James Davey
President
Hartford Funds
| 1 | S&P 500 Index is a market capitalization-weighted price index composed of 500 widely held common stocks. The index is unmanaged and not available for direct investment. Past performance is not indicative of future results. |
Hartford HLS Funds
Table of Contents
Fund Performance and Summary
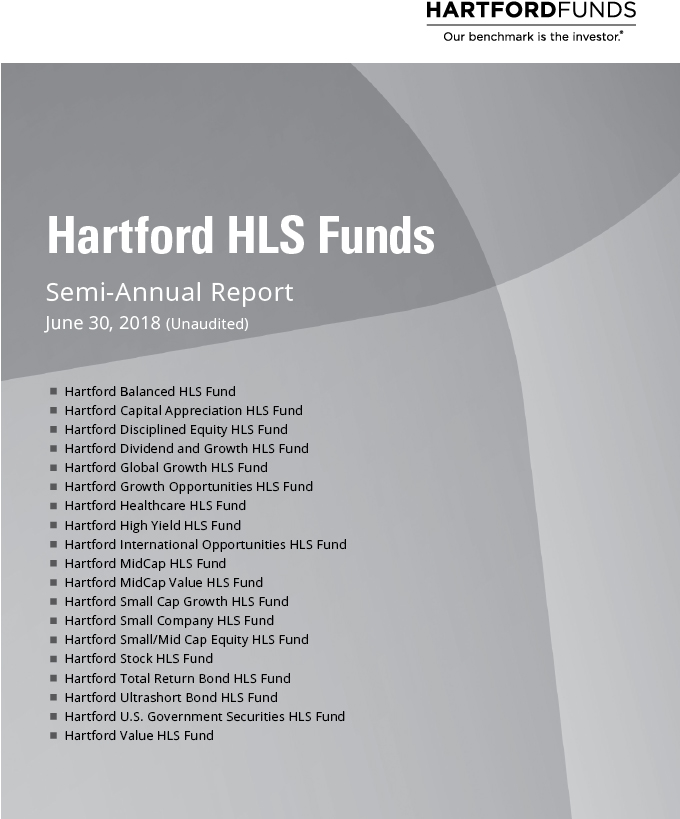
Hartford Balanced HLS Fund inception 03/31/1983
| | |
| (sub-advised by Wellington Management Company LLP) | | Investment objective – The Fund seeks long-term total return. |
The chart above represents the hypothetical growth of a $10,000 investment in Class IA. Growth results in classes other than Class IA will vary from what is seen above due to differences in the expenses charged to those share classes.
Average Annual Total Returns (as of 6/30/18)
| | | | | | | | | | | | | | | | |
| | | 6 Months1 | | | 1 Year | | | 5 Years | | | 10 Years | |
Class IA | | | 0.23% | | | | 8.61% | | | | 8.34% | | | | 7.51% | |
Class IB | | | 0.10% | | | | 8.37% | | | | 8.07% | | | | 7.24% | |
60% S&P 500 Index/ 35% Bloomberg Barclays Government/Credit Bond Index/5% ICE BofAML US 3-Month Treasury Bill Index | | | 1.02% | | | | 8.34% | | | | 8.88% | | | | 7.69% | |
S&P 500 Index | | | 2.65% | | | | 14.37% | | | | 13.42% | | | | 10.17% | |
Bloomberg Barclays Government/Credit Bond Index | | | -1.90% | | | | -0.63% | | | | 2.29% | | | | 3.78% | |
ICE BofAML US 3-Month Treasury Bill Index | | | 0.81% | | | | 1.36% | | | | 0.42% | | | | 0.35% | |
PERFORMANCE DATA QUOTED REPRESENTS PAST PERFORMANCE AND DOES NOT GUARANTEE FUTURE RESULTS. The investment return and principal value of the investment will fluctuate so that investors’ shares, when redeemed, may be worth more or less than their original cost. Current performance may be lower or higher than the performance data quoted. To obtain performance data current to the most recent month-end, please visit our website www.hartfordfunds.com.
Total returns presented above were calculated using the Fund’s net asset value available to shareholders for sale or redemption of Fund shares on June 30, 2018, which may exclude investment transactions as of this date. All share class returns assume the reinvestment of all distributions at net asset value and the deduction of all fund expenses.
60% S&P 500 Index/ 35% Bloomberg Barclays Government/Credit Bond Index/ 5% ICE BofAML US 3-Month Treasury Bill Index is calculated by Hartford Funds Management Company, LLC.
S&P 500 Index (reflects no deduction for fees, expenses or taxes) is a float-adjusted market capitalization-weighted price index composed of 500 widely held common stocks.
Bloomberg Barclays Government/Credit Bond Index (reflects no deduction for fees, expenses or taxes) measures the non-securitized component of the U.S. Aggregate Index. It includes investment grade, U.S. dollar-denominated, fixed-rate Treasuries, government-related and corporate securities.
ICE BofAML US 3-Month Treasury Bill Index (reflects no deduction for fees, expenses or taxes) is comprised of a single issue purchased at the beginning of the month and held for a full month. At the end of the month that issue is sold and rolled into a newly selected issue. The issue selected at each month-end rebalancing is the outstanding Treasury Bill that matures closest to, but not beyond, three months from the rebalancing date. To qualify for selection, an issue must have settled on or before the month-end rebalancing date. On October 20, 2017, the Bank of America Merrill Lynch 3-Month U.S. Treasury Bill Index was rebranded.
You cannot invest directly in an index.
As shown in the Fund’s current prospectus dated May 1, 2018, the total annual fund operating expense ratios for Class IA and Class IB were 0.66% and 0.91%, respectively. Actual expenses may be higher. Please see the accompanying Financial Highlights for expense ratios for the period ended June 30, 2018.
The chart and table do not reflect the deductions of taxes, sales charges or other fees which may be applied at the variable contract level or by a qualified pension or retirement plan. Any such additional sales charges or other fees or expenses would lower the contract’s or plan’s performance.
Performance information may reflect historical or current waivers/reimbursements without which performance would have been lower. For information on current expense waivers/reimbursements, please see the prospectus.
|
| Hartford Balanced HLS Fund |
Fund Performance and Summary – (continued)
June 30, 2018 (Unaudited)
The Fund is closed to certain qualified pension and retirement plans. For more information, please see the Fund’s prospectus.
Important Risks
Investing involves risk, including the possible loss of principal. The Fund seeks to achieve its investment objective by allocating assets among different asset classes. There is no guarantee the Fund will achieve its stated objective. Security prices fluctuate in value depending on general market and economic conditions and the prospects of individual companies. • Foreign investments may be more volatile and less liquid than U.S. investments and are subject to the risk of currency fluctuations and adverse political and economic developments. • Fixed income security risks include credit, liquidity, call, duration, and interest-rate risk. As interest rates rise, bond prices generally fall. • Mortgage related- and asset-backed securities’ risks include credit, interest-rate, prepayment, and extension risk. • Obligations of U.S. Government agencies are supported by varying degrees of credit but are generally not backed by the full faith and credit of the U.S. Government.
Composition by Security Type
as of June 30, 2018
| | | | |
| Category | | Percentage of
Net Assets | |
Equity Securities | | | | |
Common Stocks | | | 67.8 | % |
| | | | |
Total | | | 67.8 | % |
| | | | |
Fixed Income Securities | | | | |
Asset & Commercial Mortgage Backed Securities | | | 3.9 | % |
Corporate Bonds | | | 18.9 | |
Foreign Government Obligations | | | 0.8 | |
Municipal Bonds | | | 1.1 | |
U.S. Government Agencies | | | 0.3 | |
U.S. Government Securities | | | 6.6 | |
| | | | |
Total | | | 31.6 | % |
| | | | |
Short-Term Investments | | | 0.5 | |
Other Assets & Liabilities | | | 0.1 | |
| | | | |
Total | | | 100.0 | % |
| | | | |
Fund Performance and Summary
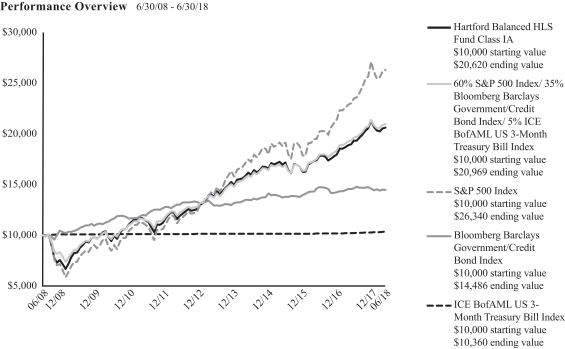
Hartford Capital Appreciation HLS Fund inception 04/02/1984
| | |
| (sub-advised by Wellington Management Company LLP) | | Investment objective – The Fund seeks growth of capital. |
The chart above represents the hypothetical growth of a $10,000 investment in Class IA. Growth results in classes other than Class IA will vary from what is seen above due to differences in the expenses charged to those share classes.
Average Annual Total Returns (as of 6/30/18)
| | | | | | | | | | | | | | | | |
| | | 6 Months1 | | | 1 Year | | | 5 Years | | | 10 Years | |
Class IA | | | 3.26% | | | | 12.29% | | | | 11.41% | | | | 7.88% | |
Class IB | | | 3.14% | | | | 11.98% | | | | 11.13% | | | | 7.61% | |
Class IC | | | 3.02% | | | | 11.71% | | | | 10.86% | | | | 7.34% | |
Russell 3000 Index | | | 3.22% | | | | 14.78% | | | | 13.29% | | | | 10.23% | |
S&P 500 Index | | | 2.65% | | | | 14.37% | | | | 13.42% | | | | 10.17% | |
PERFORMANCE DATA QUOTED REPRESENTS PAST PERFORMANCE AND DOES NOT GUARANTEE FUTURE RESULTS. The investment return and principal value of the investment will fluctuate so that investors’ shares, when redeemed, may be worth more or less than their original cost. Current performance may be lower or higher than the performance data quoted. To obtain performance data current to the most recent month-end, please visit our website www.hartfordfunds.com.
Total returns presented above were calculated using the Fund’s net asset value available to shareholders for sale or redemption of Fund shares on June 30, 2018, which may exclude investment transactions as of this date. All share class returns assume the reinvestment of all distributions at net asset value and the deduction of all fund expenses.
Class IC shares commenced operations on April 30, 2014. Class IC shares performance prior to that date reflects Class IA shares performance adjusted to reflect the 12b-1 fee of 0.25% and the administrative services fee of 0.25% applicable to Class IC shares. The performance after such date reflects actual Class IC shares performance.
Russell 3000 Index (reflects no deduction for fees, expenses or taxes) measures the performance of the 3,000 largest U.S. companies based on total market capitalization.
S&P 500 Index (reflects no deduction for fees, expenses or taxes) is a float-adjusted market capitalization-weighted price index composed of 500 widely held common stocks.
You cannot invest directly in an index.
As shown in the Fund’s current prospectus dated May 1, 2018, the total annual fund operating expense ratios for Class IA, Class IB and Class IC were 0.68%, 0.93% and 1.18%, respectively. Actual expenses may be higher. Please see the accompanying Financial Highlights for expense ratios for the period ended June 30, 2018.
The chart and table do not reflect the deductions of taxes, sales charges or other fees which may be applied at the variable contract level or by a qualified pension or retirement plan. Any such additional sales charges or other fees or expenses would lower the contract’s or plan’s performance.
Performance information may reflect historical waivers/reimbursements without which performance would have been lower.
The Fund is closed to certain qualified pension and retirement plans. For more information, please see the Fund’s prospectus.
Important Risks
Investing involves risk, including the possible loss of principal. The Fund seeks to achieve its investment objective by allocating assets among different asset classes and/or portfolio management teams. There is no guarantee the Fund will achieve its stated objective. Security prices fluctuate in value depending on general market and economic conditions and the prospects of individual companies. • Small- and mid-cap securities can have greater risk and volatility than large-cap securities. • Foreign investments may be more volatile
|
| Hartford Capital Appreciation HLS Fund |
Fund Performance and Summary – (continued)
June 30, 2018 (Unaudited)
and less liquid than U.S. investments and are subject to the risk of currency fluctuations and adverse political and economic developments. These risks are generally greater for investments in emerging markets. • The Fund’s focus on investments in particular sectors may increase its volatility and risk of loss if adverse developments occur.
Composition by Sector
as of June 30, 2018
| | | | |
| Sector | | Percentage of
Net Assets | |
Equity Securities | | | | |
Consumer Discretionary | | | 15.0 | % |
Consumer Staples | | | 6.6 | |
Energy | | | 5.0 | |
Financials | | | 13.1 | |
Health Care | | | 12.9 | |
Industrials | | | 11.8 | |
Information Technology | | | 22.0 | |
Materials | | | 3.8 | |
Real Estate | | | 4.1 | |
Telecommunication Services | | | 1.3 | |
Utilities | | | 2.2 | |
| | | | |
Total | | | 97.8 | % |
| | | | |
Short-Term Investments | | | 2.6 | |
Other Assets & Liabilities | | | (0.4 | ) |
| | | | |
Total | | | 100.0 | % |
| | | | |
A sector may be comprised of several industries. For Fund compliance purposes, the Fund may not use the same classification system. These sector classifications are used for financial reporting purposes.
Fund Performance and Summary
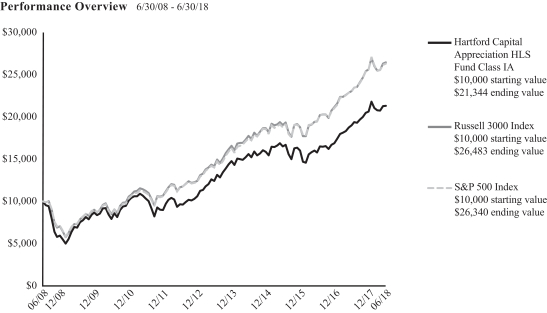
Hartford Disciplined Equity HLS Fund inception 05/29/1998
| | |
| (sub-advised by Wellington Management Company LLP) | | Investment objective – The Fund seeks growth of capital. |
The chart above represents the hypothetical growth of a $10,000 investment in Class IA. Growth results in classes other than Class IA will vary from what is seen above due to differences in the expenses charged to those share classes.
Average Annual Total Returns (as of 6/30/18)
| | | | | | | | | | | | | | | | |
| | | 6 Months1 | | | 1 Year | | | 5 Years | | | 10 Years | |
Class IA | | | 3.69% | | | | 14.78% | | | | 14.52% | | | | 10.64% | |
Class IB | | | 3.60% | | | | 14.53% | | | | 14.24% | | | | 10.36% | |
S&P 500 Index | | | 2.65% | | | | 14.37% | | | | 13.42% | | | | 10.17% | |
PERFORMANCE DATA QUOTED REPRESENTS PAST PERFORMANCE AND DOES NOT GUARANTEE FUTURE RESULTS. The investment return and principal value of the investment will fluctuate so that investors’ shares, when redeemed, may be worth more or less than their original cost. Current performance may be lower or higher than the performance data quoted. To obtain performance data current to the most recent month-end, please visit our website www.hartfordfunds.com.
Total returns presented above were calculated using the Fund’s net asset value available to shareholders for sale or redemption of Fund shares on June 30, 2018, which may exclude investment transactions as of this date. All share class returns assume the reinvestment of all distributions at net asset value and the deduction of all fund expenses.
S&P 500 Index (reflects no deduction for fees, expenses or taxes) is a float-adjusted market capitalization-weighted price index composed of 500 widely held common stocks.
You cannot invest directly in an index.
As shown in the Fund’s current prospectus dated May 1, 2018, the total annual fund operating expense ratios for Class IA and Class IB were 0.78% and 1.03%, respectively. Actual expenses may be higher. Please see the accompanying Financial Highlights for expense ratios for the period ended June 30, 2018.
The chart and table do not reflect the deductions of taxes, sales charges or other fees which may be applied at the variable contract level or by a qualified pension or retirement plan. Any such additional sales charges or other fees or expenses would lower the contract’s or plan’s performance.
Performance information may reflect historical waivers/reimbursements without which performance would have been lower.
The Fund is closed to certain qualified pension and retirement plans. For more information, please see the Fund’s prospectus.
Important Risks
Investing involves risk, including the possible loss of principal. There is no guarantee the Fund will achieve its stated objective. Security prices fluctuate in value depending on general market and economic conditions and the prospects of individual companies.
|
| Hartford Disciplined Equity HLS Fund |
Fund Performance and Summary – (continued)
June 30, 2018 (Unaudited)
Composition by Sector
as of June 30, 2018
| | | | |
| Sector | | Percentage of
Net Assets | |
Equity Securities | | | | |
Consumer Discretionary | | | 12.0 | % |
Consumer Staples | | | 7.3 | |
Energy | | | 2.8 | |
Financials | | | 14.5 | |
Health Care | | | 17.0 | |
Industrials | | | 10.9 | |
Information Technology | | | 26.4 | |
Materials | | | 2.2 | |
Telecommunication Services | | | 1.7 | |
Utilities | | | 4.8 | |
| | | | |
Total | | | 99.6 | % |
| | | | |
Short-Term Investments | | | 0.3 | |
Other Assets & Liabilities | | | 0.1 | |
| | | | |
Total | | | 100.0 | % |
| | | | |
A sector may be comprised of several industries. For Fund compliance purposes, the Fund may not use the same classification system. These sector classifications are used for financial reporting purposes.
Fund Performance and Summary
Hartford Dividend and Growth HLS Fund inception 03/09/1994
| | |
| (sub-advised by Wellington Management Company LLP) | | Investment objective – The Fund seeks a high level of current income consistent with growth of capital. |
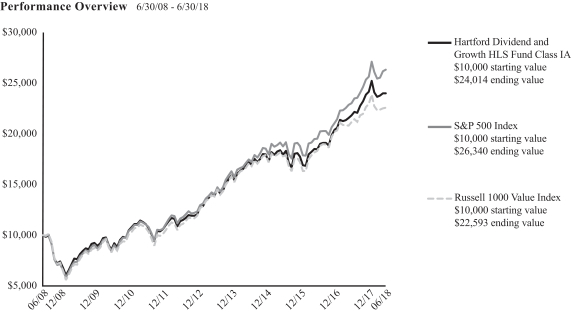
The chart above represents the hypothetical growth of a $10,000 investment in Class IA. Growth results in classes other than Class IA will vary from what is seen above due to differences in the expenses charged to those share classes.
Average Annual Total Returns (as of 6/30/18)
| | | | | | | | | | | | | | | | |
| | | 6 Months1 | | | 1 Year | | | 5 Years | | | 10 Years | |
Class IA | | | -0.58% | | | | 10.05% | | | | 11.57% | | | | 9.16% | |
Class IB | | | -0.75% | | | | 9.74% | | | | 11.28% | | | | 8.88% | |
S&P 500 Index | | | 2.65% | | | | 14.37% | | | | 13.42% | | | | 10.17% | |
Russell 1000 Value Index | | | -1.69% | | | | 6.77% | | | | 10.34% | | | | 8.49% | |
PERFORMANCE DATA QUOTED REPRESENTS PAST PERFORMANCE AND DOES NOT GUARANTEE FUTURE RESULTS. The investment return and principal value of the investment will fluctuate so that investors’ shares, when redeemed, may be worth more or less than their original cost. Current performance may be lower or higher than the performance data quoted. To obtain performance data current to the most recent month-end, please visit our website www.hartfordfunds.com.
Total returns presented above were calculated using the Fund’s net asset value available to shareholders for sale or redemption of Fund shares on June 30, 2018, which may exclude investment transactions as of this date. All share class returns assume the reinvestment of all distributions at net asset value and the deduction of all fund expenses.
S&P 500 Index (reflects no deduction for fees, expenses or taxes) is a float-adjusted market capitalization-weighted price index composed of 500 widely held common stocks.
Russell 1000 Value Index (reflects no deduction for fees, expenses or taxes) measures the performance of those Russell 1000 Index companies with lower price-to-book ratios and lower forecasted growth values. The Russell 1000 Index measures the performance of the 1,000 largest companies in the Russell 3000 Index based on their market capitalization and current index membership.
You cannot invest directly in an index.
As shown in the Fund’s current prospectus dated May 1, 2018, the total annual fund operating expense ratios for Class IA and Class IB were 0.68% and 0.93%, respectively. Actual expenses may be higher. Please see the accompanying Financial Highlights for expense ratios for the period ended June 30, 2018.
The chart and table do not reflect the deductions of taxes, sales charges or other fees which may be applied at the variable contract level or by a qualified pension or retirement plan. Any such additional sales charges or other fees or expenses would lower the contract’s or plan’s performance.
Performance information may reflect historical waivers/reimbursements without which performance would have been lower.
The Fund is closed to certain qualified pension and retirement plans. For more information, please see the Fund’s prospectus.
Important Risks
Investing involves risk, including the possible loss of principal. There is no guarantee the Fund will achieve its stated objective. Security prices fluctuate in value depending on general market and economic conditions and the prospects of individual companies. • For dividend-paying stocks, dividends are not guaranteed and may decrease without notice. • Foreign investments may be more volatile and less liquid than U.S. investments and are subject to the risk of currency fluctuations and adverse political and economic developments.
|
| Hartford Dividend and Growth HLS Fund |
Fund Performance and Summary – (continued)
June 30, 2018 (Unaudited)
Composition by Sector
as of June 30, 2018
| | | | |
| Sector | | Percentage of
Net Assets | |
Equity Securities | | | | |
Consumer Discretionary | | | 6.8 | % |
Consumer Staples | | | 5.3 | |
Energy | | | 10.1 | |
Financials | | | 21.1 | |
Health Care | | | 13.3 | |
Industrials | | | 7.5 | |
Information Technology | | | 18.7 | |
Materials | | | 4.8 | |
Real Estate | | | 2.5 | |
Telecommunication Services | | | 3.1 | |
Utilities | | | 4.8 | |
| | | | |
Total | | | 98.0 | % |
| | | | |
Short-Term Investments | | | 1.6 | |
Other Assets & Liabilities | | | 0.4 | |
| | | | |
Total | | | 100.0 | % |
| | | | |
A sector may be comprised of several industries. For Fund compliance purposes, the Fund may not use the same classification system. These sector classifications are used for financial reporting purposes.
Fund Performance and Summary
Hartford Global Growth HLS Fund inception 09/30/1998
| | |
| (sub-advised by Wellington Management Company LLP) | | Investment objective – The Fund seeks growth of capital. |
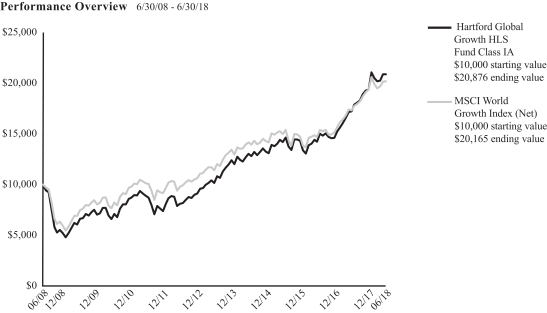
The chart above represents the hypothetical growth of a $10,000 investment in Class IA. Growth results in classes other than Class IA will vary from what is seen above due to differences in the expenses charged to those share classes.
Average Annual Total Returns (as of 6/30/18)
| | | | | | | | | | | | | | | | |
| | | 6 Months1 | | | 1 Year | | | 5 Years | | | 10 Years | |
Class IA | | | 7.89% | | | | 21.19% | | | | 15.55% | | | | 7.64% | |
Class IB | | | 7.75% | | | | 20.87% | | | | 15.26% | | | | 7.37% | |
MSCI World Growth Index (Net) | | | 4.17% | | | | 16.61% | | | | 12.09% | | | | 7.27% | |
PERFORMANCE DATA QUOTED REPRESENTS PAST PERFORMANCE AND DOES NOT GUARANTEE FUTURE RESULTS. The investment return and principal value of the investment will fluctuate so that investors’ shares, when redeemed, may be worth more or less than their original cost. Current performance may be lower or higher than the performance data quoted. To obtain performance data current to the most recent month-end, please visit our website www.hartfordfunds.com.
Total returns presented above were calculated using the Fund’s net asset value available to shareholders for sale or redemption of Fund shares on June 30, 2018, which may exclude investment transactions as of this date. All share class returns assume the reinvestment of all distributions at net asset value and the deduction of all fund expenses.
MSCI World Growth Index (Net) (reflects no deduction for fees,expenses or other taxes) is designed to capture large and mid cap securities exhibiting overall growth style characteristics across developed markets.
You cannot invest directly in an index.
As shown in the Fund’s current prospectus dated May 1, 2018, the total annual fund operating expense ratios for Class IA and Class IB were 0.81% and 1.06%, respectively. Actual expenses may be higher. Please see the accompanying Financial Highlights for expense ratios for the period ended June 30, 2018.
The chart and table do not reflect the deductions of taxes, sales charges or other fees which may be applied at the variable contract level or by a qualified pension or retirement plan. Any such additional sales charges or other fees or expenses would lower the contract’s or plan’s performance.
Performance information may reflect historical waivers/reimbursements without which performance would have been lower.
The Fund is closed to certain qualified pension and retirement plans. For more information, please see the Fund’s prospectus.
Important Risks
Investing involves risk, including the possible loss of principal. The Fund seeks to achieve its investment objective by allocating assets among different asset classes and/or different portfolio management teams. There is no guarantee the Fund will achieve its stated objective. Security prices fluctuate in value depending on general market and economic conditions and the prospects of individual companies. • Foreign investments may be more volatile and less liquid than U.S. investments and are subject to the risk of currency fluctuations and adverse political and economic developments. These risks may be greater for investments in emerging markets. • Mid-cap securities can have greater risk and volatility than large-cap securities. • Different investment styles may go in and out of favor, which may cause the Fund to underperform the broader stock market. The Fund’s focus on investments in particular sectors may increase its volatility and risk of loss if adverse developments occur.
|
| Hartford Global Growth HLS Fund |
Fund Performance and Summary – (continued)
June 30, 2018 (Unaudited)
Composition by Country
as of June 30, 2018
| | | | |
| Country | | Percentage of
Net Assets | |
Australia | | | 0.8 | % |
Canada | | | 2.3 | |
China | | | 5.1 | |
France | | | 2.5 | |
Germany | | | 2.5 | |
Hong Kong | | | 2.8 | |
India | | | 0.6 | |
Ireland | | | 0.6 | |
Italy | | | 1.0 | |
Japan | | | 5.1 | |
Luxembourg | | | 0.6 | |
Portugal | | | 0.6 | |
Russia | | | 0.5 | |
South Korea | | | 0.6 | |
Spain | | | 0.9 | |
Sweden | | | 1.1 | |
Switzerland | | | 2.6 | |
Taiwan | | | 0.5 | |
United Kingdom | | | 2.8 | |
United States | | | 65.6 | |
Short-Term Investments | | | 1.2 | |
Other Assets & Liabilities | | | (0.3 | ) |
| | | | |
Total | | | 100.0 | % |
| | | | |
The table above is based on Bloomberg’s country of risk classifications. For Fund compliance purposes, the Fund may not use the same classification system. These classifications are used for financial reporting purposes.
Fund Performance and Summary
Hartford Growth Opportunities HLS Fund inception 03/24/1987
| | |
| (sub-advised by Wellington Management Company LLP) | | Investment objective – The Fund seeks capital appreciation. |
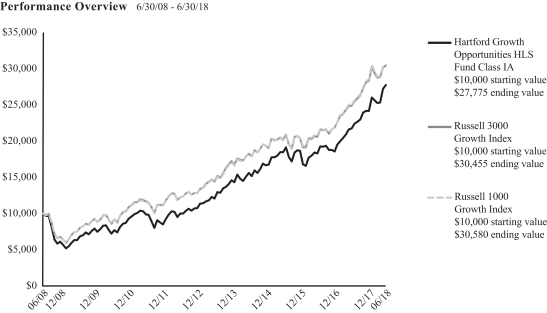
The chart above represents the hypothetical growth of a $10,000 investment in Class IA. Growth results in classes other than Class IA will vary from what is seen above due to differences in the expenses charged to those share classes.
Average Annual Total Returns (as of 6/30/18)
| | | | | | | | | | | | | | | | |
| | | 6 Months1 | | | 1 Year | | | 5 Years | | | 10 Years | |
Class IA | | | 14.76% | | | | 27.62% | | | | 18.11% | | | | 10.76% | |
Class IB | | | 14.63% | | | | 27.30% | | | | 17.81% | | | | 10.48% | |
Class IC | | | 14.48% | | | | 26.98% | | | | 17.52% | | | | 10.21% | |
Russell 3000 Growth Index | | | 7.44% | | | | 22.47% | | | | 16.14% | | | | 11.78% | |
Russell 1000 Growth Index | | | 7.25% | | | | 22.51% | | | | 16.36% | | | | 11.83% | |
PERFORMANCE DATA QUOTED REPRESENTS PAST PERFORMANCE AND DOES NOT GUARANTEE FUTURE RESULTS. The investment return and principal value of the investment will fluctuate so that investors’ shares, when redeemed, may be worth more or less than their original cost. Current performance may be lower or higher than the performance data quoted. To obtain performance data current to the most recent month-end, please visit our website www.hartfordfunds.com.
Total returns presented above were calculated using the Fund’s net asset value available to shareholders for sale or redemption of Fund shares on June 30, 2018, which may exclude investment transactions as of this date. All share class returns assume the reinvestment of all distributions at net asset value and the deduction of all fund expenses.
Class IC shares commenced operations on April 30, 2014. Class IC shares performance prior to that date reflects Class IA shares performance adjusted to reflect the 12b-1 fee of 0.25% and the administrative services fee of 0.25% applicable to Class IC shares. The performance after such date reflects actual Class IC shares performance.
Russell 3000 Growth Index (reflects no deduction for fees, expenses or taxes) measures the performance of those Russell 3000 Index companies with higher price-to-book ratios and higher forecasted growth values. The Russell 3000 Index
measures the performance of the 3,000 largest U.S. companies based on total market capitalization.
Russell 1000 Growth Index (reflects no deduction for fees, expenses or taxes) measures the performance of those Russell 1000 Index companies with higher price-to-book ratios and higher forecasted growth values. The Russell 1000 Index measures the performance of the 1,000 largest companies in the Russell 3000 Index based on their market capitalization and current index membership.
You cannot invest directly in an index.
As shown in the Fund’s current prospectus dated May 1, 2018, the total annual fund operating expense ratios for Class IA, Class IB and Class IC were 0.66%, 0.91% and 1.16%, respectively. Actual expenses may be higher. Please see the accompanying Financial Highlights for expense ratios for the period ended June 30, 2018.
The chart and table do not reflect the deductions of taxes, sales charges or other fees which may be applied at the variable contract level or by a qualified pension or retirement plan. Any such additional sales charges or other fees or expenses would lower the contract’s or plan’s performance.
Performance information may reflect historical waivers/reimbursements without which performance would have been lower.
The Fund is closed to certain qualified pension and retirement plans. For more information, please see the Fund’s prospectus.
Important Risks
Investing involves risk, including the possible loss of principal. There is no guarantee the Fund will achieve its stated objective. Security prices fluctuate in value depending on general market and economic conditions and the prospects of individual companies. • Foreign investments may be more volatile and less liquid than U.S. investments
|
| Hartford Growth Opportunities HLS Fund |
Fund Performance and Summary – (continued)
June 30, 2018 (Unaudited)
and are subject to the risk of currency fluctuations and adverse political and economic developments. • Mid-cap securities can have greater risk and volatility than large-cap securities. • The Fund’s focus on investments in particular sectors may increase its volatility and risk of loss if adverse developments occur. • Different investment styles may go in and out of favor, which may cause the Fund to underperform the broader stock market.
Composition by Sector
as of June 30, 2018
| | | | |
| Sector | | Percentage of
Net Assets | |
Equity Securities | |
Consumer Discretionary | | | 24.0 | % |
Consumer Staples | | | 1.0 | |
Energy | | | 2.0 | |
Financials | | | 4.2 | |
Health Care | | | 11.8 | |
Industrials | | | 10.4 | |
Information Technology | | | 40.9 | |
Materials | | | 2.4 | |
Real Estate | | | 0.1 | |
| | | | |
Total | | | 96.8 | % |
| | | | |
Short-Term Investments | | | 6.0 | |
Other Assets & Liabilities | | | (2.8 | ) |
| | | | |
Total | | | 100.0 | % |
| | | | |
A sector may be comprised of several industries. For Fund compliance purposes, the Fund may not use the same classification system. These sector classifications are used for financial reporting purposes.
Fund Performance and Summary
Hartford Healthcare HLS Fund inception 05/01/2000
| | |
| (sub-advised by Wellington Management Company LLP) | | Investment objective – The Fund seeks long-term capital appreciation. |
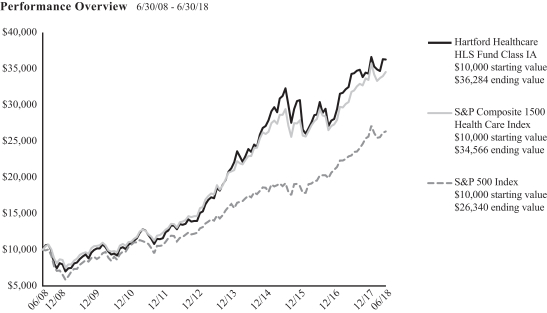
The chart above represents the hypothetical growth of a $10,000 investment in Class IA. Growth results in classes other than Class IA will vary from what is seen above due to differences in the expenses charged to those share classes.
Average Annual Total Returns (as of 6/30/18)
| | | | | | | | | | | | | | | | |
| | | 6 Months1 | | | 1 Year | | | 5 Years | | | 10 Years | |
Class IA | | | 5.65% | | | | 5.76% | | | | 16.23% | | | | 13.76% | |
Class IB | | | 5.53% | | | | 5.54% | | | | 15.94% | | | | 13.47% | |
S&P Composite 1500 Health Care Index | | | 3.28% | | | | 8.60% | | | | 14.38% | | | | 13.20% | |
S&P 500 Index | | | 2.65% | | | | 14.37% | | | | 13.42% | | | | 10.17% | |
PERFORMANCE DATA QUOTED REPRESENTS PAST PERFORMANCE AND DOES NOT GUARANTEE FUTURE RESULTS. The investment return and principal value of the investment will fluctuate so that investors’ shares, when redeemed, may be worth more or less than their original cost. Current performance may be lower or higher than the performance data quoted. To obtain performance data current to the most recent month-end, please visit our website www.hartfordfunds.com.
Total returns presented above were calculated using the Fund’s net asset value available to shareholders for sale or redemption of Fund shares on June 30, 2018, which may exclude investment transactions as of this date. All share class returns assume the reinvestment of all distributions at net asset value and the deduction of all fund expenses.
S&P Composite 1500 Health Care Index (reflects no deduction for fees, expenses or taxes) is a float-adjusted market capitalization-weighted index comprised of those companies included in the S&P Composite 1500 that are classified as members of the Global Industry Classification Standard (GICS®) health care sector.
S&P 500 Index (reflects no deduction for fees, expenses or taxes) is a float-adjusted market capitalization-weighted price index composed of 500 widely held common stocks.
You cannot invest directly in an index.
As shown in the Fund’s current prospectus dated May 1, 2018, the total annual fund operating expense ratios for Class IA and Class IB were 0.90% and 1.15%, respectively. Actual expenses may be higher. Please see the accompanying Financial Highlights for expense ratios for the period ended June 30, 2018.
The chart and table do not reflect the deductions of taxes, sales charges or other fees which may be applied at the variable contract level or by a qualified pension or retirement plan. Any such additional sales charges or other fees or expenses would lower the contract’s or plan’s performance.
Performance information may reflect historical waivers/reimbursements without which performance would have been lower.
The Fund is closed to certain qualified pension and retirement plans. For more information, please see the Fund’s prospectus.
Important Risks
Investing involves risk, including the possible loss of principal. There is no guarantee the Fund will achieve its stated objective. Security prices fluctuate in value depending on general market and economic conditions and the prospects of individual companies. • Risks of focusing investments on the healthcare related sector include regulatory and legal developments, patent considerations, intense competitive pressures, rapid technological changes, potential product obsolescence, and liquidity risk. • Foreign investments may be more volatile and less liquid than U.S. investments and are subject to the risk of currency fluctuations and adverse political and economic developments. These risks may be greater for investments in emerging markets. • Small- and mid-cap securities can have greater risk and volatility than large-cap securities.
|
| Hartford Healthcare HLS Fund |
Fund Performance and Summary – (continued)
June 30, 2018 (Unaudited)
Composition by Subsector
as of June 30, 2018
| | | | |
| Subsector | | Percentage of
Net Assets | |
Equity Securities | |
Biotechnology | | | 27.6 | % |
Food & Staples Retailing | | | 0.7 | |
Health Care Equipment & Supplies | | | 23.3 | |
Health Care Providers & Services | | | 17.1 | |
Health Care Technology | | | 3.0 | |
Life Sciences Tools & Services | | | 3.6 | |
Pharmaceuticals | | | 23.0 | |
| | | | |
Total | | | 98.3 | % |
| | | | |
Short-Term Investments | | | 6.0 | |
Other Assets & Liabilities | | | (4.3 | ) |
| | | | |
Total | | | 100.0 | % |
| | | | |
For Fund compliance purposes, the Fund may not use the same classification system. These subsector classifications are used for financial reporting purposes.
Fund Performance and Summary
Hartford High Yield HLS Fund inception 09/30/1998
| | |
| (sub-advised by Wellington Management Company LLP) | | Investment objective – The Fund seeks to provide high current income, and long-term total return. |
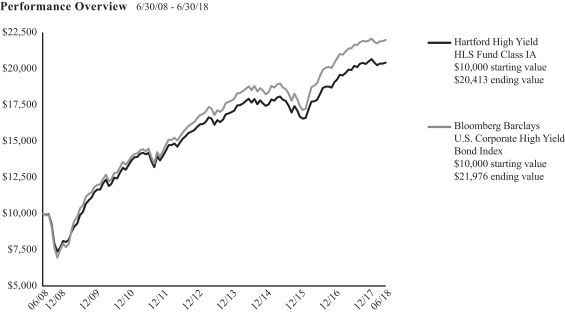
The chart above represents the hypothetical growth of a $10,000 investment in Class IA. Growth results in classes other than Class IA will vary from what is seen above due to differences in the expenses charged to those share classes.
Average Annual Total Returns (as of 6/30/18)
| | | | | | | | | | | | | | | | |
| | | 6 Months1 | | | 1 Year | | | 5 Years | | | 10 Years | |
Class IA | | | -0.49% | | | | 2.53% | | | | 4.83% | | | | 7.40% | |
Class IB | | | -0.62% | | | | 2.29% | | | | 4.56% | | | | 7.13% | |
Bloomberg Barclays U.S. Corporate High Yield Bond Index | | | 0.16% | | | | 2.62% | | | | 5.51% | | | | 8.19% | |
PERFORMANCE DATA QUOTED REPRESENTS PAST PERFORMANCE AND DOES NOT GUARANTEE FUTURE RESULTS. The investment return and principal value of the investment will fluctuate so that investors’ shares, when redeemed, may be worth more or less than their original cost. Current performance may be lower or higher than the performance data quoted. To obtain performance data current to the most recent month-end, please visit our website www.hartfordfunds.com.
Total returns presented above were calculated using the Fund’s net asset value available to shareholders for sale or redemption of Fund shares on June 30, 2018, which may exclude investment transactions as of this date. All share class returns assume the reinvestment of all distributions at net asset value and the deduction of all fund expenses.
Performance information through March 5, 2012 represents performance of the Fund’s previous sub-adviser, Hartford Investment Management Company (“HIMCO”). As of March 5, 2012 HIMCO no longer served as the sub-adviser to the Fund.
Bloomberg Barclays U.S. Corporate High Yield Bond Index (reflects no deduction for fees, expenses or taxes) is a market-value-weighted index that tracks the total return performance of non-investment grade, fixed-rate, publicly placed, dollar denominated and nonconvertible debt registered with the SEC.
You cannot invest directly in an index.
As shown in the Fund’s current prospectus dated May 1, 2018, the total annual fund operating expense ratios for Class IA and Class IB were 0.78% and 1.03%, respectively. Expenses shown include acquired fund fees and expenses. Actual expenses may be higher. Please see the accompanying Financial Highlights for expense ratios for the period ended June 30, 2018.
The chart and table do not reflect the deductions of taxes, sales charges or other fees which may be applied at the variable contract level or by a qualified pension or retirement plan. Any such additional sales charges or other fees or expenses would lower the contract’s or plan’s performance.
Performance information may reflect historical waivers/reimbursements without which performance would have been lower.
The Fund is closed to certain qualified pension and retirement plans. For more information, please see the Fund’s prospectus.
Important Risks
Investing involves risk, including the possible loss of principal. There is no guarantee the Fund will achieve its stated objective. Security prices fluctuate in value depending on general market and economic conditions and the prospects of individual companies. • Fixed income security risks include credit, liquidity, call, duration, and interest-rate risk. As interest rates rise, bond prices generally fall. • Investments in high-yield (“junk”) bonds involve greater risk of price volatility, illiquidity, and default than higher-rated debt securities. • Derivatives are generally more volatile and sensitive to changes in market or economic conditions than other securities; their risks include currency, leverage, liquidity, index, pricing, and counterparty risk. • Foreign investments may be more volatile and less liquid than U.S.
|
| Hartford High Yield HLS Fund |
Fund Performance and Summary – (continued)
June 30, 2018 (Unaudited)
investments and are subject to the risk of currency fluctuations and adverse political and economic developments. These risks may be greater for investments in emerging markets. • Privately placed, restricted (Rule 144A) securities may be more difficult to sell and price than other securities.
Composition by Security Type
as of June 30, 2018
| | | | |
| Category | | Percentage of
Net Assets | |
Equity Securities | |
Common Stocks | | | 1.2 | % |
Escrows | | | 0.0 | * |
Preferred Stocks | | | 0.2 | |
| | | | |
Total | | | 1.4 | % |
| | | | |
Fixed Income Securities | |
Asset & Commercial Mortgage-Backed Securities | | | 0.0 | %* |
Convertible Bonds | | | 1.6 | |
Corporate Bonds | | | 87.6 | |
Senior Floating Rate Interests | | | 5.4 | |
| | | | |
Total | | | 94.6 | % |
| | | | |
Short-Term Investments | | | 3.1 | |
Other Assets & Liabilities | | | 0.9 | |
| | | | |
Total | | | 100.0 | % |
| | | | |
| * | Percentage rounds to zero. |
Fund Performance and Summary
Hartford International Opportunities HLS Fund inception 07/02/1990
| | |
| (sub-advised by Wellington Management Company LLP) | | Investment objective – The Fund seeks long-term growth of capital. |
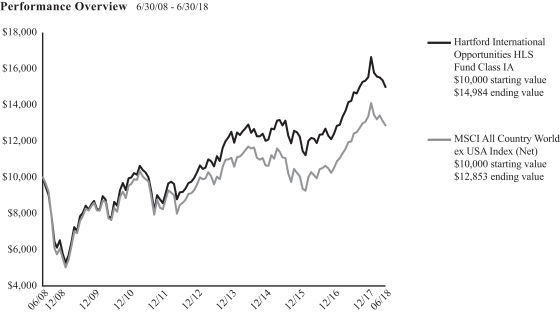
The chart above represents the hypothetical growth of a $10,000 investment in Class IA. Growth results in classes other than Class IA will vary from what is seen above due to differences in the expenses charged to those share classes.
Average Annual Total Returns (as of 6/30/18)
| | | | | | | | | | | | | | | | |
| | | 6 Months1 | | | 1 Year | | | 5 Years | | | 10 Years | |
Class IA | | | -3.49% | | | | 5.38% | | | | 7.19% | | | | 4.13% | |
Class IB | | | -3.62% | | | | 5.12% | | | | 6.92% | | | | 3.87% | |
MSCI All Country World ex USA Index (Net) | | | -3.77% | | | | 7.28% | | | | 5.99% | | | | 2.54% | |
PERFORMANCE DATA QUOTED REPRESENTS PAST PERFORMANCE AND DOES NOT GUARANTEE FUTURE RESULTS. The investment return and principal value of the investment will fluctuate so that investors’ shares, when redeemed, may be worth more or less than their original cost. Current performance may be lower or higher than the performance data quoted. To obtain performance data current to the most recent month-end, please visit our website www.hartfordfunds.com.
Total returns presented above were calculated using the Fund’s net asset value available to shareholders for sale or redemption of Fund shares on June 30, 2018, which may exclude investment transactions as of this date. All share class returns assume the reinvestment of all distributions at net asset value and the deduction of all fund expenses.
MSCI All Country World ex USA Index (Net) (reflects reinvested dividends net of withholding taxes but reflects no deduction for fees, expenses or other taxes) is designed to capture large and mid cap representation across developed markets (excluding the United States) and emerging market countries.
You cannot invest directly in an index.
As shown in the Fund’s current prospectus dated May 1, 2018, the total annual fund operating expense ratios for Class IA and Class IB were 0.73% and 0.98%, respectively. Actual expenses may be higher. Please see the accompanying Financial Highlights for expense ratios for the period ended June 30, 2018.
The chart and table do not reflect the deductions of taxes, sales charges or other fees which may be applied at the variable contract level or by a qualified pension or retirement plan. Any such additional sales charges or other fees or expenses would lower the contract’s or plan’s performance.
Performance information may reflect historical waivers/reimbursements without which performance would have been lower.
The Fund is closed to certain qualified pension and retirement plans. For more information, please see the Fund’s prospectus.
Important Risks
Investing involves risk, including the possible loss of principal. There is no guarantee the Fund will achieve its stated objective. Security prices fluctuate in value depending on general market and economic conditions and the prospects of individual companies. • Foreign investments may be more volatile and less liquid than U.S. investments and are subject to the risk of currency fluctuations and adverse political and economic developments. These risks may be greater for investments in emerging markets. • Mid-cap securities can have greater risks and volatility than large-cap securities. • The Fund’s focus on investments in particular sectors, geographic regions or countries may increase its volatility and risk of loss if adverse developments occur.
|
| Hartford International Opportunities HLS Fund |
Fund Performance and Summary – (continued)
June 30, 2018 (Unaudited)
Composition by Currency
as of June 30, 2018
| | | | |
| Description | | Percentage of
Net Assets | |
Australian Dollar | | | 1.0 | % |
British Pound | | | 11.4 | |
Canadian Dollar | | | 7.9 | |
Danish Krone | | | 0.2 | |
Euro | | | 26.1 | |
Hong Kong Dollar | | | 9.6 | |
Indian Rupee | | | 2.2 | |
Japanese Yen | | | 15.4 | |
Norwegian Krone | | | 0.3 | |
South Korean Won | | | 2.0 | |
Swedish Krona | | | 0.2 | |
Swiss Franc | | | 8.8 | |
Taiwanese Dollar | | | 2.5 | |
United States Dollar | | | 11.7 | |
Other Assets & Liabilities | | | 0.7 | |
| | | | |
Total | | | 100.0 | % |
| | | | |
Composition by Sector
as of June 30, 2018
| | | | |
| Sector | | Percentage of
Net Assets | |
Equity Securities | |
Consumer Discretionary | | | 15.6 | % |
Consumer Staples | | | 7.6 | |
Energy | | | 7.0 | |
Financials | | | 15.6 | |
Health Care | | | 8.0 | |
Industrials | | | 14.3 | |
Information Technology | | | 16.8 | |
Materials | | | 5.0 | |
Real Estate | | | 2.7 | |
Telecommunication Services | | | 1.7 | |
Utilities | | | 3.4 | |
| | | | |
Total | | | 97.7 | % |
| | | | |
Short-Term Investments | | | 1.6 | |
Other Assets & Liabilities | | | 0.7 | |
| | | | |
Total | | | 100.0 | % |
| | | | |
A sector may be comprised of several industries. For Fund compliance purposes, the Fund may not use the same classification system. These sector classifications are used for financial reporting purposes.
Fund Performance and Summary
Hartford MidCap HLS Fund inception 07/14/1997
| | |
| (sub-advised by Wellington Management Company LLP) | | Investment objective – The Fund seeks long-term growth of capital. |
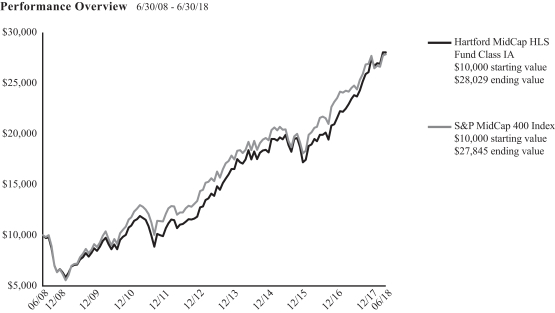
The chart above represents the hypothetical growth of a $10,000 investment in Class IA. Growth results in classes other than Class IA will vary from what is seen above due to differences in the expenses charged to those share classes.
Average Annual Total Returns (as of 6/30/18)
| | | | | | | | | | | | | | | | |
| | | 6 Months1 | | | 1 Year | | | 5 Years | | | 10 Years | |
Class IA | | | 7.51% | | | | 19.41% | | | | 15.12% | | | | 10.86% | |
Class IB | | | 7.38% | | | | 19.11% | | | | 14.83% | | | | 10.58% | |
S&P MidCap 400 Index | | | 3.49% | | | | 13.50% | | | | 12.69% | | | | 10.78% | |
PERFORMANCE DATA QUOTED REPRESENTS PAST PERFORMANCE AND DOES NOT GUARANTEE FUTURE RESULTS. The investment return and principal value of the investment will fluctuate so that investors’ shares, when redeemed, may be worth more or less than their original cost. Current performance may be lower or higher than the performance data quoted. To obtain performance data current to the most recent month-end, please visit our website www.hartfordfunds.com.
Total returns presented above were calculated using the Fund’s net asset value available to shareholders for sale or redemption of Fund shares on June 30, 2018, which may exclude investment transactions as of this date. All share class returns assume the reinvestment of all distributions at net asset value and the deduction of all fund expenses.
S&P MidCap 400 Index (reflects no deduction for fees, expenses or taxes) is a float-adjusted market capitalization-weighted index designed to measure the performance of the mid-cap segment of the market. The index is composed of 400 constituent companies.
You cannot invest directly in an index.
As shown in the Fund’s current prospectus dated May 1, 2018, the total annual fund operating expense ratios for Class IA and Class IB were 0.70% and 0.95%, respectively. Actual expenses may be higher. Please see the accompanying Financial Highlights for expense ratios for the period ended June 30, 2018.
The chart and table do not reflect the deductions of taxes, sales charges or other fees which may be applied at the variable contract level or by a qualified pension or retirement plan. Any such additional sales charges or other fees or expenses would lower the contract’s or plan’s performance.
Performance information may reflect historical waivers/reimbursements without which performance would have been lower.
The Fund is closed to certain qualified pension and retirement plans. For more information, please see the Fund’s prospectus.
Important Risks
Investing involves risk, including the possible loss of principal. There is no guarantee the Fund will achieve its stated objective. Security prices fluctuate in value depending on general market and economic conditions and the prospects of individual companies. • Mid-cap securities can have greater risk and volatility than large-cap securities. • The Fund’s focus on investments in particular sectors may increase its volatility and risk of loss if adverse developments occur.
Fund Performance and Summary – (continued)
June 30, 2018 (Unaudited)
Composition by Sector
as of June 30, 2018
| | | | |
| Sector | | Percentage of
Net Assets | |
Equity Securities | |
Consumer Discretionary | | | 5.5 | % |
Consumer Staples | | | 0.7 | |
Energy | | | 5.2 | |
Financials | | | 14.8 | |
Health Care | | | 17.8 | |
Industrials | | | 20.3 | |
Information Technology | | | 29.0 | |
Materials | | | 2.8 | |
Real Estate | | | 1.5 | |
Utilities | | | 2.1 | |
| | | | |
Total | | | 99.7 | % |
| | | | |
Short-Term Investments | | | 0.8 | |
Other Assets & Liabilities | | | (0.5 | ) |
| | | | |
Total | | | 100.0 | % |
| | | | |
A sector may be comprised of several industries. For Fund compliance purposes, the Fund may not use the same classification system. These sector classifications are used for financial reporting purposes.
Fund Performance and Summary
Hartford MidCap Value HLS Fund inception 04/30/2001
| | |
| (sub-advised by Wellington Management Company LLP) | | Investment objective – The Fund seeks long-term capital appreciation. |
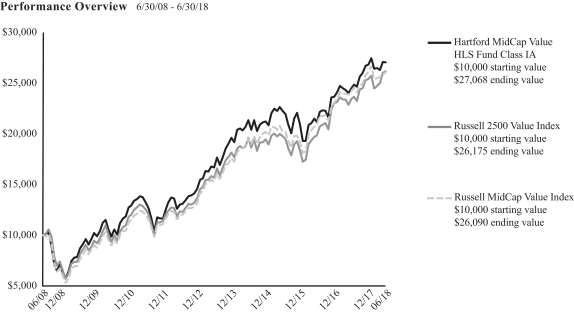
The chart above represents the hypothetical growth of a $10,000 investment in Class IA. Growth results in classes other than Class IA will vary from what is seen above due to differences in the expenses charged to those share classes.
Average Annual Total Returns (as of 6/30/18)
| | | | | | | | | | | | | | | | |
| | | 6 Months1 | | | 1 Year | | | 5 Years | | | 10 Years | |
Class IA | | | 0.79% | | | | 10.41% | | | | 10.15% | | | | 10.47% | |
Class IB | | | 0.72% | | | | 10.11% | | | | 9.88% | | | | 10.20% | |
Russell 2500 Value Index | | | 3.00% | | | | 11.49% | | | | 10.78% | | | | 10.10% | |
Russell MidCap Value Index | | | -0.16% | | | | 7.60% | | | | 11.27% | | | | 10.06% | |
PERFORMANCE DATA QUOTED REPRESENTS PAST PERFORMANCE AND DOES NOT GUARANTEE FUTURE RESULTS. The investment return and principal value of the investment will fluctuate so that investors’ shares, when redeemed, may be worth more or less than their original cost. Current performance may be lower or higher than the performance data quoted. To obtain performance data current to the most recent month-end, please visit our website www.hartfordfunds.com.
Total returns presented above were calculated using the Fund’s net asset value available to shareholders for sale or redemption of Fund shares on June 30, 2018, which may exclude investment transactions as of this date. All share class returns assume the reinvestment of all distributions at net asset value and the deduction of all fund expenses.
Russell 2500 Value Index (reflects no deduction for fees, expenses or taxes) measures the performance of those Russell 2500 Index companies with lower price-to-book ratios and lower forecasted growth values. The Russell 2500 Index measures the performance of the 2,500 smallest U.S. companies based on their market capitalization and current index membership.
Russell MidCap Value Index (reflects no deduction for fees, expenses or taxes) measures the performance of the mid-cap value segment of the U.S. equity universe. It includes those Russell MidCap Index companies with lower price-to-book ratios and lower forecasted growth values.
You cannot invest directly in an index.
As shown in the Fund’s current prospectus dated May 1, 2018, the total annual fund operating expense ratios for Class IA and Class IB were 0.86% and 1.11%, respectively. Actual expenses may be higher. Please see the accompanying Financial Highlights for expense ratios for the period ended June 30, 2018.
The chart and table do not reflect the deductions of taxes, sales charges or other fees which may be applied at the variable contract level or by a qualified pension or retirement plan. Any such additional sales charges or other fees or expenses would lower the contract’s or plan’s performance.
Performance information may reflect historical waivers/reimbursements without which performance would have been lower.
The Fund is closed to certain qualified pension and retirement plans. For more information, please see the Fund’s prospectus.
Important Risks
Investing involves risk, including the possible loss of principal. There is no guarantee the Fund will achieve its stated objective. Security prices fluctuate in value depending on general market and economic conditions and the prospects of individual companies. • Mid-cap securities can have greater risk and volatility than large-cap securities. • Foreign investments may be more volatile and less liquid than U.S. investments and are subject to the risk of currency fluctuations and adverse political and economic developments. • The Fund’s focus on investments in particular sectors may increase its volatility and risk of loss if adverse developments occur. • Different
|
| Hartford MidCap Value HLS Fund |
Fund Performance and Summary – (continued)
June 30, 2018 (Unaudited)
investment styles may go in and out of favor, which may cause the Fund to underperform the broader stock market.
Composition by Sector
as of June 30, 2018
| | | | |
| Sector | | Percentage of
Net Assets | |
Equity Securities | |
Consumer Discretionary | | | 4.2 | % |
Consumer Staples | | | 3.8 | |
Energy | | | 8.3 | |
Financials | | | 20.4 | |
Health Care | | | 4.3 | |
Industrials | | | 16.6 | |
Information Technology | | | 13.3 | |
Materials | | | 10.1 | |
Real Estate | | | 10.8 | |
Telecommunication Services | | | 1.1 | |
Utilities | | | 5.1 | |
| | | | |
Total | | | 98.0 | % |
| | | | |
Short-Term Investments | | | 3.0 | |
Other Assets & Liabilities | | | (1.0 | ) |
| | | | |
Total | | | 100.0 | % |
| | | | |
A sector may be comprised of several industries. For Fund compliance purposes, the Fund may not use the same classification system. These sector classifications are used for financial reporting purposes.
Fund Performance and Summary
Hartford Small Cap Growth HLS Fund inception 05/02/1994
| | |
| (sub-advised by Wellington Management Company LLP) | | Investment objective – The Fund seeks long-term capital appreciation. |
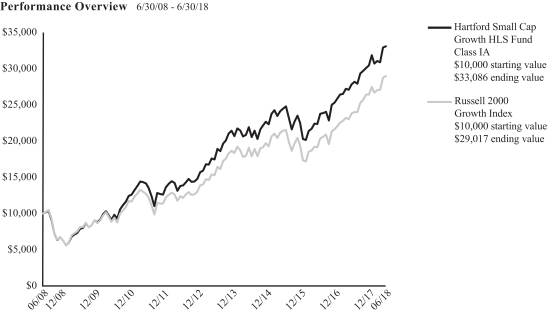
The chart above represents the hypothetical growth of a $10,000 investment in Class IA. Growth results in classes other than Class IA will vary from what is seen above due to differences in the expenses charged to those share classes.
Average Annual Total Returns (as of 6/30/18)
| | | | | | | | | | | | | | | | |
| | | 6 Months1 | | | 1 Year | | | 5 Years | | | 10 Years | |
Class IA | | | 8.71% | | | | 18.86% | | | | 13.64% | | | | 12.71% | |
Class IB | | | 8.60% | | | | 18.57% | | | | 13.36% | | | | 12.43% | |
Russell 2000 Growth Index | | | 9.70% | | | | 21.86% | | | | 13.65% | | | | 11.24% | |
PERFORMANCE DATA QUOTED REPRESENTS PAST PERFORMANCE AND DOES NOT GUARANTEE FUTURE RESULTS. The investment return and principal value of the investment will fluctuate so that investors’ shares, when redeemed, may be worth more or less than their original cost. Current performance may be lower or higher than the performance data quoted. To obtain performance data current to the most recent month-end, please visit our website www.hartfordfunds.com.
Total returns presented above were calculated using the Fund’s net asset value available to shareholders for sale or redemption of Fund shares on June 30, 2018, which may exclude investment transactions as of this date. All share class returns assume the reinvestment of all distributions at net asset value and the deduction of all fund expenses.
Russell 2000 Growth Index (reflects no deduction for fees, expenses or taxes) is an index of those Russell 2000 Index growth companies with higher price-to-book ratios and higher forecasted growth values. The Russell 2000 Index is an index comprised of 2,000 of the smallest U.S.-domiciled company common stocks based on a combination of their market capitalization and current index membership.
You cannot invest directly in an index.
As shown in the Fund’s current prospectus dated May 1, 2018, the total annual fund operating expense ratios for Class IA and Class IB were 0.66% and 0.91%, respectively. Expenses shown include acquired fund fees and expenses. Actual expenses may be higher. Please see the accompanying Financial Highlights for expense ratios for the period ended June 30, 2018.
Performance information through July 21, 2010 represents performance of the Fund’s previous additional sub-adviser, Hartford Investment Management Company (“HIMCO”). As of July 21, 2010, HIMCO no longer served as an additional sub-adviser to the Fund.
The chart and table do not reflect the deductions of taxes, sales charges or other fees which may be applied at the variable contract level or by a qualified pension or retirement plan. Any such additional sales charges or other fees or expenses would lower the contract’s or plan’s performance.
Performance information may reflect historical waivers/reimbursements without which performance would have been lower.
The Fund is closed to new investors, subject to certain exceptions. For more information, please see the Fund’s prospectus.
Important Risks
Investing involves risk, including the possible loss of principal. The Fund seeks to achieve its investment objective by allocating assets among different asset classes and/or portfolio management teams. There is no guarantee the Fund will achieve its stated objective. Security prices fluctuate in value depending on general market and economic conditions and the prospects of individual companies. • Small-cap securities can have greater risk and volatility than large-cap securities. • The Fund’s focus on investments in particular sectors may increase its volatility and risk of loss if adverse developments occur. • Different investment styles may go in and out favor, which may cause the Fund to underperform the broader stock market.
|
| Hartford Small Cap Growth HLS Fund |
Fund Performance and Summary – (continued)
June 30, 2018 (Unaudited)
Composition by Sector
as of June 30, 2018
| | | | |
| Sector | | Percentage of
Net Assets | |
Equity Securities | |
Consumer Discretionary | | | 14.6 | % |
Consumer Staples | | | 3.5 | |
Energy | | | 2.3 | |
Financials | | | 8.4 | |
Health Care | | | 25.3 | |
Industrials | | | 16.9 | |
Information Technology | | | 22.2 | |
Materials | | | 3.7 | |
Real Estate | | | 2.0 | |
Telecommunication Services | | | 0.9 | |
| | | | |
Total | | | 99.8 | % |
| | | | |
Short-Term Investments | | | 3.9 | |
Other Assets & Liabilities | | | (3.7 | ) |
| | | | |
Total | | | 100.0 | % |
| | | | |
A sector may be comprised of several industries. For Fund compliance purposes, the Fund may not use the same classification system. These sector classifications are used for financial reporting purposes.
Fund Performance and Summary
Hartford Small Company HLS Fund inception 08/09/1996
| | |
| (sub-advised by Wellington Management Company LLP) | | Investment objective – The Fund seeks growth of capital. |
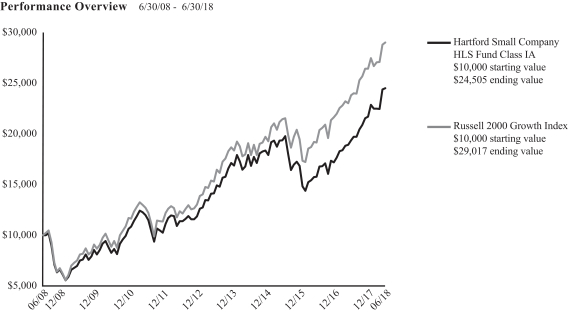
The chart above represents the hypothetical growth of a $10,000 investment in Class IA. Growth results in classes other than Class IA will vary from what is seen above due to differences in the expenses charged to those share classes.
Average Annual Total Returns (as of 6/30/18)
| | | | | | | | | | | | | | | | |
| | | 6 Months1 | | | 1 Year | | | 5 Years | | | 10 Years | |
Class IA | | | 12.83% | | | | 26.45% | | | | 11.64% | | | | 9.38% | |
Class IB | | | 12.70% | | | | 26.14% | | | | 11.37% | | | | 9.11% | |
Russell 2000 Growth Index | | | 9.70% | | | | 21.86% | | | | 13.65% | | | | 11.24% | |
PERFORMANCE DATA QUOTED REPRESENTS PAST PERFORMANCE AND DOES NOT GUARANTEE FUTURE RESULTS. The investment return and principal value of the investment will fluctuate so that investors’ shares, when redeemed, may be worth more or less than their original cost. Current performance may be lower or higher than the performance data quoted. To obtain performance data current to the most recent month-end, please visit our website www.hartfordfunds.com.
Total returns presented above were calculated using the Fund’s net asset value available to shareholders for sale or redemption of Fund shares on June 30, 2018, which may exclude investment transactions as of this date. All share class returns assume the reinvestment of all distributions at net asset value and the deduction of all fund expenses.
Russell 2000 Growth Index (reflects no deduction for fees, expenses or taxes) is an index of those Russell 2000 Index growth companies with higher price-to-book ratios and higher forecasted growth values. The Russell 2000 Index is an index comprised of 2,000 of the smallest U.S.-domiciled company common stocks based on a combination of their market capitalization and current index membership.
You cannot invest directly in an index.
As shown in the Fund’s current prospectus dated May 1, 2018, the total annual fund operating expense ratios for Class IA and Class IB were 0.78% and 1.03%, respectively. Actual expenses may be higher. Please see the accompanying Financial Highlights for expense ratios for the period ended June 30, 2018.
Performance information through July 21, 2010 represents performance of the Fund’s previous additional sub-adviser, Hartford Investment Management Company (“HIMCO”). As of July 21, 2010, HIMCO no longer served as an additional sub-adviser to the Fund.
The chart and table do not reflect the deductions of taxes, sales charges or other fees which may be applied at the variable contract level or by a qualified pension or retirement plan. Any such additional sales charges or other fees or expenses would lower the contract’s or plan’s performance.
Performance information may reflect historical waivers/reimbursements without which performance would have been lower.
The Fund is closed to new investors, subject to certain exceptions. For more information, please see the Fund’s prospectus.
Important Risks
Investing involves risk, including the possible loss of principal. The Fund seeks to achieve its investment objective by allocating assets among different asset classes and/or portfolio management teams. There is no guarantee the Fund will achieve its stated objective. Security prices fluctuate in value depending on general market and economic conditions and the prospects of individual companies. • Small-cap securities can have greater risk and volatility than large-cap securities. • Foreign investments may be more volatile and less liquid than U.S. investments and are subject to the risk of currency fluctuations and adverse political and economic developments. • The Fund’s focus on investments in particular sectors may increase its volatility and risk of loss if adverse developments occur. • Different investment styles may go in and out
|
| Hartford Small Company HLS Fund |
Fund Performance and Summary – (continued)
June 30, 2018 (Unaudited)
favor, which may cause the Fund to underperform the broader stock market.
Composition by Sector
as of June 30, 2018
| | | | |
| Sector | | Percentage of
Net Assets | |
Equity Securities | |
Consumer Discretionary | | | 17.1 | % |
Consumer Staples | | | 2.1 | |
Energy | | | 1.3 | |
Financials | | | 7.0 | |
Health Care | | | 21.5 | |
Industrials | | | 17.3 | |
Information Technology | | | 23.5 | |
Materials | | | 6.7 | |
Real Estate | | | 0.7 | |
Telecommunication Services | | | 0.7 | |
| | | | |
Total | | | 97.9 | % |
| | | | |
Short-Term Investments | | | 3.5 | |
Other Assets & Liabilities | | | (1.4 | ) |
| | | | |
Total | | | 100.0 | % |
| | | | |
A sector may be comprised of several industries. For Fund compliance purposes, the Fund may not use the same classification system. These sector classifications are used for financial reporting purposes.
Fund Performance and Summary
Hartford Small/Mid Cap Equity HLS Fund inception 05/01/1998
| | |
| (sub-advised by Wellington Management Company LLP) | | Investment objective – The Fund seeks long-term growth of capital. |
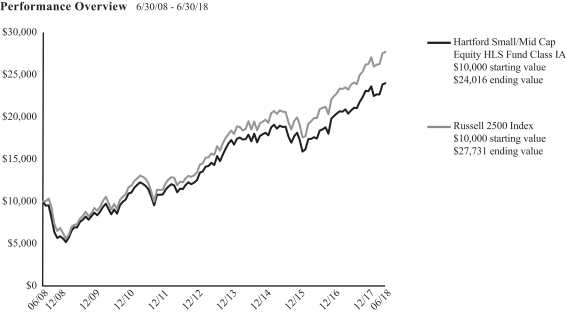
The chart above represents the hypothetical growth of a $10,000 investment in Class IA. Growth results in classes other than Class IA will vary from what is seen above due to differences in the expenses charged to those share classes.
Average Annual Total Returns (as of 6/30/18)
| | | | | | | | | | | | | | | | |
| | | 6 Months1 | | | 1 Year | | | 5 Years | | | 10 Years | |
Class IA | | | 4.09% | | | | 15.50% | | | | 10.86% | | | | 9.16% | |
Class IB | | | 4.00% | | | | 15.18% | | | | 10.57% | | | | 8.88% | |
Russell 2500 Index | | | 5.46% | | | | 16.24% | | | | 12.29% | | | | 10.74% | |
PERFORMANCE DATA QUOTED REPRESENTS PAST PERFORMANCE AND DOES NOT GUARANTEE FUTURE RESULTS. The investment return and principal value of the investment will fluctuate so that investors’ shares, when redeemed, may be worth more or less than their original cost. Current performance may be lower or higher than the performance data quoted. To obtain performance data current to the most recent month-end, please visit our website www.hartfordfunds.com.
Total returns presented above were calculated using the Fund’s net asset value available to shareholders for sale or redemption of Fund shares on June 30, 2018, which may exclude investment transactions as of this date. All share class returns assume the reinvestment of all distributions at net asset value and the deduction of all fund expenses.
Performance information through June 4, 2012 represents performance of the Fund’s previous sub-adviser, Hartford Investment Management Company (“HIMCO”). As of June 4, 2012, HIMCO no longer served as the sub-adviser to the Fund.
Includes the Fund’s performance when it invested, prior to February 1, 2010, at least 80% of its assets in common stocks of mid-capitalization companies.
Russell 2500 Index (reflects no deduction for fees, expenses or taxes) measures the performance of the small to mid-cap segment of the U.S. equity universe, commonly referred to as “smid” cap. The Russell 2500 Index is a subset of the Russell 3000 Index and includes approximately 2,500 of the smallest securities based on a combination of their market capitalization and current index membership.
You cannot invest directly in an index.
As shown in the Fund’s current prospectus dated May 1, 2018, the total annual fund operating expense ratios for Class IA and Class IB were 0.92% and 1.17%, respectively. Expenses shown include acquired fund fees and expenses. Actual expenses may be higher. Please see the accompanying Financial Highlights for expense ratios for the period ended June 30, 2018.
The chart and table do not reflect the deductions of taxes, sales charges or other fees which may be applied at the variable contract level or by a qualified pension or retirement plan. Any such additional sales charges or other fees or expenses would lower the contract’s or plan’s performance.
Performance information may reflect historical waivers/reimbursements without which performance would have been lower.
The Fund is closed to certain qualified pension and retirement plans. For more information, please see the Fund’s prospectus.
Important Risks
Investing involves risk, including the possible loss of principal. There is no guarantee the Fund will achieve its stated objective. Security prices fluctuate in value depending on general market and economic conditions and the prospects of individual companies. • Small- and mid-cap securities can have greater risk and volatility than large-cap securities. • Foreign investments may be more volatile and less liquid than U.S. investments and are subject to the risk of currency fluctuations and adverse political and economic developments. • The Fund’s focus on investments in particular sectors may increase its volatility and risk of loss if adverse developments occur.
|
| Hartford Small/Mid Cap Equity HLS Fund |
Fund Performance and Summary – (continued)
June 30, 2018 (Unaudited)
Composition by Sector
as of June 30, 2018
| | | | |
| Sector | | Percentage of
Net Assets | |
Equity Securities | |
Consumer Discretionary | | | 14.2 | % |
Consumer Staples | | | 3.5 | |
Energy | | | 5.5 | |
Financials | | | 13.7 | |
Health Care | | | 12.7 | |
Industrials | | | 13.2 | |
Information Technology | | | 16.0 | |
Materials | | | 3.9 | |
Real Estate | | | 10.6 | |
Telecommunication Services | | | 1.0 | |
Utilities | | | 4.5 | |
| | | | |
Total | | | 98.8 | % |
| | | | |
Short-Term Investments | | | 2.3 | |
Other Assets & Liabilities | | | (1.1 | ) |
| | | | |
Total | | | 100.0 | % |
| | | | |
A sector may be comprised of several industries. For Fund compliance purposes, the Fund may not use the same classification system. These sector classifications are used for financial reporting purposes.
Fund Performance and Summary
Hartford Stock HLS Fund inception 08/31/1977
| | |
| (sub-advised by Wellington Management Company LLP) | | Investment objective – The Fund seeks long-term growth of capital. |
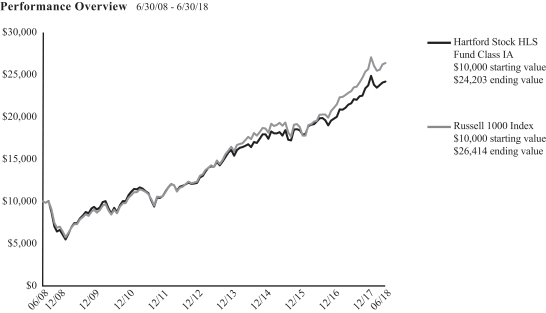
The chart above represents the hypothetical growth of a $10,000 investment in Class IA. Growth results in classes other than Class IA will vary from what is seen above due to differences in the expenses charged to those share classes.
Average Annual Total Returns (as of 6/30/18)
| | | | | | | | | | | | | | | | |
| | | 6 Months1 | | | 1 Year | | | 5 Years | | | 10 Years | |
Class IA | | | 1.94% | | | | 11.84% | | | | 11.39% | | | | 9.24% | |
Class IB | | | 1.81% | | | | 11.55% | | | | 11.11% | | | | 8.97% | |
Russell 1000 Index | | | 2.85% | | | | 14.54% | | | | 13.37% | | | | 10.20% | |
PERFORMANCE DATA QUOTED REPRESENTS PAST PERFORMANCE AND DOES NOT GUARANTEE FUTURE RESULTS. The investment return and principal value of the investment will fluctuate so that investors’ shares, when redeemed, may be worth more or less than their original cost. Current performance may be lower or higher than the performance data quoted. To obtain performance data current to the most recent month-end, please visit our website www.hartfordfunds.com.
Total returns presented above were calculated using the Fund’s net asset value available to shareholders for sale or redemption of Fund shares on June 30, 2018, which may exclude investment transactions as of this date. All share class returns assume the reinvestment of all distributions at net asset value and the deduction of all fund expenses.
Russell 1000 Index (reflects no deduction for fees, expenses or taxes) measures the performance of the 1,000 largest companies in the Russell 3000 Index, which measures the performance of the 3,000 largest U.S. companies, based on total market capitalizations.
You cannot invest directly in an index.
As shown in the Fund’s current prospectus dated May 1, 2018, the total annual fund operating expense ratios for Class IA and Class IB were 0.52% and 0.77%, respectively. Actual expenses may be higher. Please see the accompanying Financial Highlights for expense ratios for the period ended June 30, 2018.
The chart and table do not reflect the deductions of taxes, sales charges or other fees which may be applied at the variable contract level or by a qualified pension or retirement plan. Any such additional sales charges or other fees or expenses would lower the contract’s or plan’s performance.
Performance information may reflect historical waivers/reimbursements without which performance would have been lower.
The Fund is closed to certain qualified pension and retirement plans. For more information, please see the Fund’s prospectus.
Important Risks
Investing involves risk, including the possible loss of principal. There is no guarantee the Fund will achieve its stated objective. Security prices fluctuate in value depending on general market and economic conditions and the prospects of individual companies. • Foreign investments may be more volatile and less liquid than U.S. investments and are subject to the risk of currency fluctuations and adverse political and economic developments.
Fund Performance and Summary – (continued)
June 30, 2018 (Unaudited)
Composition by Sector
as of June 30, 2018
| | | | |
| Sector | | Percentage of
Net Assets | |
Equity Securities | |
Consumer Discretionary | | | 14.1 | % |
Consumer Staples | | | 15.2 | |
Energy | | | 3.2 | |
Financials | | | 11.5 | |
Health Care | | | 15.3 | |
Industrials | | | 19.1 | |
Information Technology | | | 10.4 | |
Materials | | | 4.2 | |
Real Estate | | | 5.4 | |
| | | | |
Total | | | 98.4 | % |
| | | | |
Short-Term Investments | | | 1.5 | |
Other Assets & Liabilities | | | 0.1 | |
| | | | |
Total | | | 100.0 | % |
| | | | |
A sector may be comprised of several industries. For Fund compliance purposes, the Fund may not use the same classification system. These sector classifications are used for financial reporting purposes.
Fund Performance and Summary
Hartford Total Return Bond HLS Fund inception 08/31/1977
| | |
| (sub-advised by Wellington Management Company LLP) | | Investment objective – The Fund seeks a competitive total return, with income as a secondary objective. |
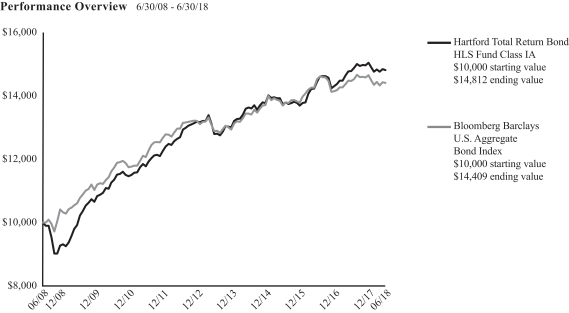
The chart above represents the hypothetical growth of a $10,000 investment in Class IA. Growth results in classes other than Class IA will vary from what is seen above due to differences in the expenses charged to those share classes.
Average Annual Total Returns (as of 6/30/18)
| | | | | | | | | | | | | | | | |
| | | 6 Months1 | | | 1 Year | | | 5 Years | | | 10 Years | |
Class IA | | | -1.50% | | | | 0.23% | | | | 2.98% | | | | 4.01% | |
Class IB | | | -1.51% | | | | -0.05% | | | | 2.73% | | | | 3.75% | |
Bloomberg Barclays U.S. Aggregate Bond Index | | | -1.62% | | | | -0.40% | | | | 2.27% | | | | 3.72% | |
PERFORMANCE DATA QUOTED REPRESENTS PAST PERFORMANCE AND DOES NOT GUARANTEE FUTURE RESULTS. The investment return and principal value of the investment will fluctuate so that investors’ shares, when redeemed, may be worth more or less than their original cost. Current performance may be lower or higher than the performance data quoted. To obtain performance data current to the most recent month-end, please visit our website www.hartfordfunds.com.
Total returns presented above were calculated using the Fund’s net asset value available to shareholders for sale or redemption of Fund shares on June 30, 2018, which may exclude investment transactions as of this date. All share class returns assume the reinvestment of all distributions at net asset value and the deduction of all fund expenses.
Performance information through March 5, 2012 represents performance of the Fund’s previous sub-adviser, Hartford Investment Management Company (“HIMCO”). As of March 5, 2012, HIMCO no longer served as the sub-adviser to the Fund.
Bloomberg Barclays U.S. Aggregate Bond Index (reflects no deduction for fees, expenses or taxes) is composed of securities that are SEC-registered, taxable, and dollar denominated. The index covers the U.S. investment grade fixed rate bond market, with index components for government and corporate securities, mortgage
pass-through securities, and asset-backed securities. These major sectors are subdivided into more specific indices that are calculated and reported on a regular basis.
You cannot invest directly in an index.
As shown in the Fund’s current prospectus dated May 1, 2018, the total annual fund operating expense ratios for Class IA and Class IB were 0.51% and 0.76%, respectively. Actual expenses may be higher. Please see the accompanying Financial Highlights for expense ratios for the period ended June 30, 2018.
The chart and table do not reflect the deductions of taxes, sales charges or other fees which may be applied at the variable contract level or by a qualified pension or retirement plan. Any such additional sales charges or other fees or expenses would lower the contract’s or plan’s performance.
Performance information may reflect historical waivers/reimbursements without which performance would have been lower.
The Fund is closed to certain qualified pension and retirement plans. For more information, please see the Fund’s prospectus.
Important Risks
Investing involves risk, including the possible loss of principal. The Fund may allocate a portion of its assets to specialist portfolio managers, which may not work as intended. There is no guarantee the Fund will achieve its stated objective. Security prices fluctuate in value depending on general market and economic conditions and the prospects of individual companies. • Fixed income security risks include credit, liquidity, call, duration, and interest-rate risk. As
|
| Hartford Total Return Bond HLS Fund |
Fund Performance and Summary – (continued)
June 30, 2018 (Unaudited)
interest rates rise, bond prices generally fall. • Investments in high-yield (“junk”) bonds involve greater risk of price volatility, illiquidity, and default than higher-rated debt securities. • Obligations of U.S. Government agencies are supported by varying degrees of credit but are generally not backed by the full faith and credit of the U.S. Government. • The risks associated with mortgage related- and asset-backed securities as well as collateralized loan obligations (CLOs) include credit, interest-rate, prepayment, liquidity, default and extension risk. • The purchase of securities in the To-Be-Announced (TBA) market can result in additional price and counterparty risk. • Derivatives are generally more volatile and sensitive to changes in market or economic conditions than other securities; their risks include currency, leverage, liquidity, index, pricing, and counterparty risk. • Foreign investments may be more volatile and less liquid than U.S. investments and are subject to the risk of currency fluctuations and adverse political and economic developments. These risks may be greater for investments in emerging markets. • Privately placed, restricted (Rule 144A) securities may be more difficult to sell and price than other securities.
Composition by Security Type
as of June 30, 2018
| | | | |
| Category | | Percentage of
Net Assets | |
Equity Securities | |
Common Stocks | | | 0.0 | %* |
Escrows | | | 0.0 | * |
Preferred Stocks | | | 0.1 | |
Warrants | | | 0.0 | * |
| | | | |
Total | | | 0.1 | % |
| | | | |
Fixed Income Securities | |
Asset & Commercial Mortgage-Backed Securities | | | 35.7 | |
Corporate Bonds | | | 28.0 | |
Foreign Government Obligations | | | 1.4 | |
Municipal Bonds | | | 1.1 | |
Senior Floating Rate Interests | | | 2.8 | |
U.S. Government Agencies | | | 57.0 | |
U.S. Government Securities | | | 4.8 | |
| | | | |
Total | | | 130.8 | % |
| | | | |
Short-Term Investments | | | 4.7 | |
Purchased Options | | | 0.3 | |
Other Assets & Liabilities | | | (35.9 | ) |
| | | | |
Total | | | 100.0 | % |
| | | | |
| * | Percentage rounds to zero. |
Fund Performance and Summary
Hartford Ultrashort Bond HLS Fund inception 08/31/1977
| | |
| (sub-advised by Wellington Management Company LLP) | | Investment objective – The Fund seeks total return and income consistent with preserving capital and maintaining liquidity. |
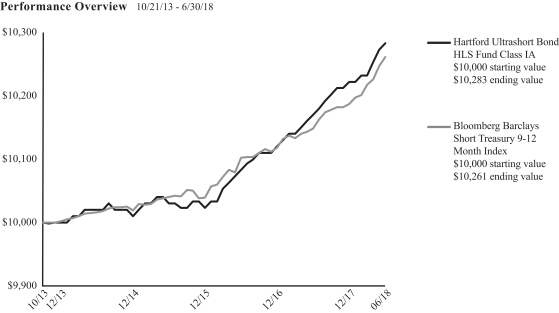
The chart above represents the hypothetical growth of a $10,000 investment in Class IA. Growth results in classes other than Class IA will vary from what is seen above due to differences in the expenses charged to those share classes.
Average Annual Total Returns (as of 6/30/18)
| | | | | | | | | | | | |
| | | 6 Months1 | | | 1 Year | | | Since
Inception2 | |
Class IA | | | 0.60% | | | | 1.11% | | | | 0.60% | |
Class IB | | | 0.50% | | | | 0.90% | | | | 0.35% | |
Bloomberg Barclays Short Treasury 9-12 Month Index | | | 0.73% | | | | 1.11% | | | | 0.55% | |
| 2 | On October 21, 2013, the Fund converted from a money market fund to an ultrashort bond fund. Total returns shown are from conversion date (October 21, 2013) to June 30, 2018. |
PERFORMANCE DATA QUOTED REPRESENTS PAST PERFORMANCE AND DOES NOT GUARANTEE FUTURE RESULTS. The investment return and principal value of the investment will fluctuate so that investors’ shares, when redeemed, may be worth more or less than their original cost. Current performance may be lower or higher than the performance data quoted. To obtain performance data current to the most recent month-end, please visit our website www.hartfordfunds.com.
Total returns presented above were calculated using the Fund’s net asset value available to shareholders for sale or redemption of Fund shares on June 30, 2018, which may exclude investment transactions as of this date. All share class returns assume the reinvestment of all distributions at net asset value and the deduction of all fund expenses.
Prior to October 21, 2013, the Fund was managed as a money market fund. Accordingly, performance of the Fund prior to October 21, 2013 is not shown. Past performance information for when the Fund was managed as a money market fund is available upon request by calling 1-888-843-7824.
Bloomberg Barclays Short Treasury 9-12 Month Index (reflects no deduction for fees, expenses or taxes) includes aged U.S. Treasury bills, notes and bonds with a
remaining maturity from 1 up to (but not including) 12 months. It excludes zero coupon strips.
You cannot invest directly in an index.
As shown in the Fund’s current prospectus dated May 1, 2018, the total annual fund operating expense ratios for Class IA and Class IB were 0.45% and 0.70%, respectively. Actual expenses may be higher. Please see the accompanying Financial Highlights for expense ratios for the period ended June 30, 2018.
The chart and table do not reflect the deductions of taxes, sales charges or other fees which may be applied at the variable contract level or by a qualified pension or retirement plan. Any such additional sales charges or other fees or expenses would lower the contract’s or plan’s performance.
Performance information may reflect historical waivers/reimbursements without which performance would have been lower.
The Fund is closed to certain qualified pension and retirement plans. For more information, please see the Fund’s prospectus.
Important Risks
Investing involves risk, including the possible loss of principal. There is no guarantee the Fund will achieve its stated objective. Security prices fluctuate in value depending on general market and economic conditions and the prospects of individual companies. • Fixed income security risks include credit, liquidity, call, duration, and interest-rate risk. As interest rates rise, bond prices generally fall. • Obligations of U.S. Government agencies are supported by varying degrees of credit but are generally not backed by the full faith and credit of the
|
| Hartford Ultrashort Bond HLS Fund |
Fund Performance and Summary – (continued)
June 30, 2018 (Unaudited)
U.S. Government. • The risks associated with mortgage related- and asset-backed securities include credit, interest-rate, prepayment, liquidity, default and extension risk. • Derivatives are generally more volatile and sensitive to changes in market or economic conditions than other securities; their risks include currency, leverage, liquidity, index, pricing, and counterparty risk. • Privately placed, restricted (Rule 144A) securities may be more difficult to sell and price than other securities. • Repurchase agreements may increase the Fund’s risk and volatility.
Composition by Security Type
as of June 30, 2018
| | | | |
| Category | | Percentage of
Net Assets | |
Fixed Income Securities | |
Asset & Commercial Mortgage-Backed Securities | | | 28.1 | % |
Corporate Bonds | | | 44.5 | |
Municipal Bonds | | | 0.3 | |
U.S. Government Agencies | | | 4.8 | |
U.S. Government Securities | | | 21.7 | |
| | | | |
Total | | | 99.4 | % |
| | | | |
Short-Term Investments | | | 0.5 | |
Other Assets & Liabilities | | | 0.1 | |
| | | | |
Total | | | 100.0 | % |
| | | | |
Fund Performance and Summary
Hartford U.S. Government Securities HLS Fund inception 03/24/1987
| | |
| (sub-advised by Wellington Management Company LLP) | | Investment objective – The Fund seeks to maximize total return while providing shareholders with a high level of current income consistent with prudent investment risk. |
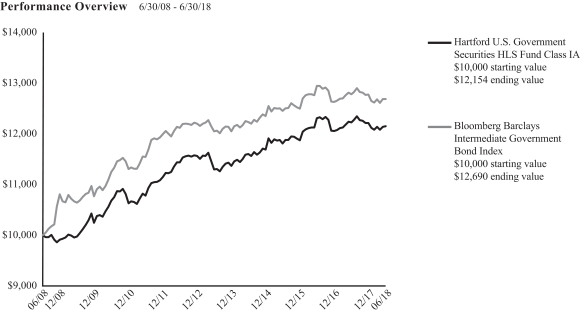
The chart above represents the hypothetical growth of a $10,000 investment in Class IA. Growth results in classes other than Class IA will vary from what is seen above due to differences in the expenses charged to those share classes.
Average Annual Total Returns (as of 6/30/18)
| | | | | | | | | | | | | | | | |
| | | 6 Months1 | | | 1 Year | | | 5 Years | | | 10 Years | |
Class IA | | | -0.49% | | | | -0.62% | | | | 1.47% | | | | 1.97% | |
Class IB | | | -0.69% | | | | -0.93% | | | | 1.21% | | | | 1.71% | |
Bloomberg Barclays Intermediate Government Bond Index | | | -0.67% | | | | -0.73% | | | | 1.04% | | | | 2.41% | |
PERFORMANCE DATA QUOTED REPRESENTS PAST PERFORMANCE AND DOES NOT GUARANTEE FUTURE RESULTS. The investment return and principal value of the investment will fluctuate so that investors’ shares, when redeemed, may be worth more or less than their original cost. Current performance may be lower or higher than the performance data quoted. To obtain performance data current to the most recent month-end, please visit our website www.hartfordfunds.com.
Total returns presented above were calculated using the Fund’s net asset value available to shareholders for sale or redemption of Fund shares on June 30, 2018, which may exclude investment transactions as of this date. All share class returns assume the reinvestment of all distributions at net asset value and the deduction of all fund expenses.
Performance information through March 5, 2012 represents performance of the Fund’s previous sub-adviser, Hartford Investment Management Company (“HIMCO”). As of March 5, 2012, HIMCO no longer served as the sub-adviser to the Fund.
Bloomberg Barclays Intermediate Government Bond Index (reflects no deduction for fees, expenses or taxes) is an unmanaged index of government bonds with maturities of between one and ten years.
You cannot invest directly in an index.
As shown in the Fund’s current prospectus dated May 1, 2018, the total annual fund operating expense ratios for Class IA and Class IB were 0.51% and 0.76%, respectively. Expenses shown include acquired fund fees and expenses. Actual expenses may be higher. Please see the accompanying Financial Highlights for expense ratios for the period ended June 30, 2018.
The chart and table do not reflect the deductions of taxes, sales charges or other fees which may be applied at the variable contract level or by a qualified pension or retirement plan. Any such additional sales charges or other fees or expenses would lower the contract’s or plan’s performance.
Performance information may reflect historical waivers/reimbursements without which performance would have been lower.
The Fund is closed to certain qualified pension and retirement plans. For more information, please see the Fund’s prospectus.
Important Risks
Investing involves risk, including the possible loss of principal. There is no guarantee the Fund will achieve its stated objective. Security prices fluctuate in value depending on general market and economic conditions and the prospects of individual companies. • Fixed income security risks include credit, liquidity, call, duration, and interest-rate risk. As interest rates rise, bond prices generally fall. • The purchase of securities in the To-Be-Announced (TBA) market can result in additional price and counterparty risk. • Derivatives are generally more volatile and sensitive to changes in market or economic
|
| Hartford U.S. Government Securities HLS Fund |
Fund Performance and Summary – (continued)
June 30, 2018 (Unaudited)
conditions than other securities; their risks include currency, leverage, liquidity, index, pricing, and counterparty risk. • The risks associated with mortgage related- and asset-backed securities include credit, interest-rate, prepayment, liquidity, default and extension risk. • The purchase of securities in the To-Be-Announced (TBA) market can result in additional price and counterparty risk. • Obligations of U.S. Government agencies are supported by varying degrees of credit but are generally not backed by the full faith and credit of the U.S. Government. • Privately placed, restricted (Rule 144A) securities may be more difficult to sell and price than other securities.
Composition by Security Type
as of June 30, 2018
| | | | |
| Category | | Percentage of
Net Assets | |
Fixed Income Securities | |
Asset & Commercial Mortgage-Backed Securities | | | 19.1 | % |
U.S. Government Agencies | | | 39.5 | |
U.S. Government Securities | | | 40.6 | |
| | | | |
Total | | | 99.2 | % |
| | | | |
Short-Term Investments | | | 4.7 | |
Other Assets & Liabilities | | | (3.9 | ) |
| | | | |
Total | | | 100.0 | % |
| | | | |
Fund Performance and Summary
Hartford Value HLS Fund inception 04/30/2001
| | |
| (sub-advised by Wellington Management Company LLP) | | Investment objective – The Fund seeks long-term total return. |
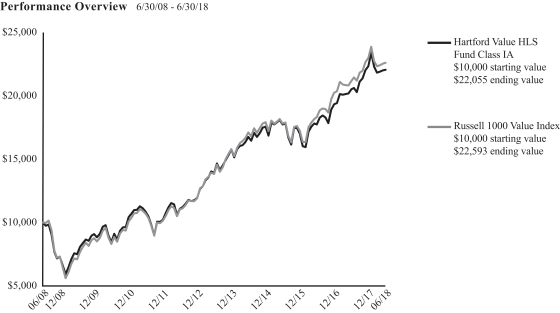
The chart above represents the hypothetical growth of a $10,000 investment in Class IA. Growth results in classes other than Class IA will vary from what is seen above due to differences in the expenses charged to those share classes.
Average Annual Total Returns (as of 6/30/18)
| | | | | | | | | | | | | | | | |
| | | 6 Months1 | | | 1 Year | | | 5 Years | | | 10 Years | |
Class IA | | | -1.18% | | | | 7.59% | | | | 9.68% | | | | 8.23% | |
Class IB | | | -1.25% | | | | 7.34% | | | | 9.41% | | | | 7.96% | |
Russell 1000 Value Index | | | -1.69% | | | | 6.77% | | | | 10.34% | | | | 8.49% | |
PERFORMANCE DATA QUOTED REPRESENTS PAST PERFORMANCE AND DOES NOT GUARANTEE FUTURE RESULTS. The investment return and principal value of the investment will fluctuate so that investors’ shares, when redeemed, may be worth more or less than their original cost. Current performance may be lower or higher than the performance data quoted. To obtain performance data current to the most recent month-end, please visit our website www.hartfordfunds.com.
Total returns presented above were calculated using the Fund’s net asset value available to shareholders for sale or redemption of Fund shares on June 30, 2018, which may exclude investment transactions as of this date. All share class returns assume the reinvestment of all distributions at net asset value and the deduction of all fund expenses.
Russell 1000 Value Index (reflects no deduction for fees, expenses or taxes) measures the performance of those Russell 1000 Index companies with lower price-to-book ratios and lower forecasted growth values. The Russell 1000 Index measures the performance of the 1,000 largest companies in the Russell 3000 Index based on their market capitalization and current index membership.
You cannot invest directly in an index.
As shown in the Fund’s current prospectus dated May 1, 2018, the total annual fund operating expense ratios for Class IA and Class IB were 0.71% and 0.96%,
respectively. Actual expenses may be higher. Please see the accompanying Financial Highlights for expense ratios for the period ended June 30, 2018.
The chart and table do not reflect the deductions of taxes, sales charges or other fees which may be applied at the variable contract level or by a qualified pension or retirement plan. Any such additional sales charges or other fees or expenses would lower the contract’s or plan’s performance.
Performance information may reflect historical waivers/reimbursements without which performance would have been lower.
The Fund is closed to certain qualified pension and retirement plans. For more information, please see the Fund’s prospectus.
Important Risks
Investing involves risk, including the possible loss of principal. There is no guarantee the Fund will achieve its stated objective. Security prices fluctuate in value depending on general market and economic conditions and the prospects of individual companies. • Foreign investments may be more volatile and less liquid than U.S. investments and are subject to the risk of currency fluctuations and adverse political and economic developments. • The Fund’s focus on investments in particular sectors may increase its volatility and risk of loss if adverse developments occur. • Different investment styles may go in and out of favor, which may cause the Fund to underperform the broader stock market.
Fund Performance and Summary – (continued)
June 30, 2018 (Unaudited)
Composition by Sector
as of June 30, 2018
| | | | |
| Sector | | Percentage of
Net Assets | |
Equity Securities | |
Consumer Discretionary | | | 10.5 | % |
Consumer Staples | | | 5.9 | |
Energy | | | 12.4 | |
Financials | | | 25.6 | |
Health Care | | | 13.2 | |
Industrials | | | 8.2 | |
Information Technology | | | 12.4 | |
Materials | | | 3.5 | |
Real Estate | | | 1.8 | |
Telecommunication Services | | | 1.6 | |
Utilities | | | 3.4 | |
| | | | |
Total | | | 98.5 | % |
| | | | |
Short-Term Investments | | | 1.9 | |
Other Assets & Liabilities | | | (0.4 | ) |
| | | | |
Total | | | 100.0 | % |
| | | | |
A sector may be comprised of several industries. For Fund compliance purposes, the Fund may not use the same classification system. These sector classifications are used for financial reporting purposes.
Expense Examples (Unaudited)
Your Fund’s Expenses
As a shareholder of a Fund, you incur two types of costs: (1) transaction costs and (2) ongoing costs, including investment management fees, distribution and/or service (12b-1) fees, if any, and other fund expenses. This example is intended to help you understand your ongoing costs (in dollars) of investing in a Fund and to compare these costs with the ongoing costs of investing in other mutual funds. The example is based on an investment of $1,000 invested at the beginning of the period and held for the entire period of January 1, 2018 through June 30, 2018. To the extent a Fund was subject to acquired fund fees and expenses during the period, acquired fund fees and expenses are not included in the annualized expense ratios below.
Actual Expenses
The first set of columns of the table below provides information about actual account values and actual expenses. You may use this information, together with the amount you invested, to estimate the expenses that you paid over the period. Simply divide your account value by $1,000 (for example, an $8,600 account value divided by $1,000 = 8.6), then multiply the result by the number in the line under the heading entitled “Expenses Paid During Period” to estimate the expenses you paid on your account during this period.
Hypothetical Example for Comparison Purposes
The second set of columns of the table below provides information about hypothetical account values and hypothetical expenses based on a Fund’s actual expense ratio and an assumed rate of return of 5% per year before expenses, which is not the Fund’s actual return. The hypothetical account values and expenses may not be used to estimate the actual ending account balance or expenses you paid for the period. You may use this information to compare the ongoing costs of investing in a Fund and other funds. To do so, compare this 5% hypothetical example with the 5% hypothetical examples that appear in the shareholder reports of the other funds.
Please note that the expenses shown in the table are meant to highlight your ongoing costs only and do not reflect any transactional costs, such as sales charges (loads) or fees which may be applied at the variable life insurance, variable annuity, or qualified retirement plan product level. Therefore, the second set of columns of the table is useful in comparing ongoing costs only, and will not help you determine the relative total costs of owning different funds. In addition, if these transactional costs were included, your costs would be higher. Expenses for a class of a Fund are equal to the class’ annualized expense ratio multiplied by average account value over the period, multiplied by 181/365 (to reflect the one-half year period).
Hartford Balanced HLS Fund
| | | | | | | | | | | | | | | | | | | | | | | | | | | | |
| | | Actual Return | | | Hypothetical (5% return before expenses) | | | | |
| | | Beginning
Account
Value
January 1,
2018 | | | Ending
Account
Value
June 30,
2018 | | | Expenses paid
during the period
January 1, 2018
through
June 30,
2018 | | | Beginning
Account
Value
January 1,
2018 | | | Ending
Account
Value
June 30,
2018 | | | Expenses paid
during the period
January 1, 2018
through
June 30,
2018 | | | Annualized
expense
ratio | |
Class IA | | $ | 1,000.00 | | | $ | 1,002.30 | | | $ | 3.13 | | | $ | 1,000.00 | | | $ | 1,021.67 | | | $ | 3.16 | | | | 0.63 | % |
Class IB | | $ | 1,000.00 | | | $ | 1,001.00 | | | $ | 4.37 | | | $ | 1,000.00 | | | $ | 1,020.43 | | | $ | 4.41 | | | | 0.88 | % |
Hartford Capital Appreciation HLS Fund
| | | | | | | | | | | | | | | | | | | | | | | | | | | | |
| | | Actual Return | | | Hypothetical (5% return before expenses) | | | | |
| | | Beginning
Account
Value
January 1,
2018 | | | Ending
Account
Value
June 30,
2018 | | | Expenses paid
during the period
January 1, 2018
through
June 30,
2018 | | | Beginning
Account
Value
January 1,
2018 | | | Ending
Account
Value
June 30,
2018 | | | Expenses paid
during the period
January 1, 2018
through
June 30,
2018 | | | Annualized
expense
ratio | |
Class IA | | $ | 1,000.00 | | | $ | 1,032.60 | | | $ | 3.43 | | | $ | 1,000.00 | | | $ | 1,021.42 | | | $ | 3.41 | | | | 0.68 | % |
Class IB | | $ | 1,000.00 | | | $ | 1,031.40 | | | $ | 4.68 | | | $ | 1,000.00 | | | $ | 1,020.18 | | | $ | 4.66 | | | | 0.93 | % |
Class IC | | $ | 1,000.00 | | | $ | 1,030.20 | | | $ | 5.94 | | | $ | 1,000.00 | | | $ | 1,018.94 | | | $ | 5.91 | | | | 1.18 | % |
Expense Examples (Unaudited) – (continued)
Hartford Disciplined Equity HLS Fund
| | | | | | | | | | | | | | | | | | | | | | | | | | | | |
| | | Actual Return | | | Hypothetical (5% return before expenses) | | | | |
| | | Beginning
Account
Value
January 1,
2018 | | | Ending
Account
Value
June 30,
2018 | | | Expenses paid
during the period
January 1, 2018
through
June 30,
2018 | | | Beginning
Account
Value
January 1,
2018 | | | Ending
Account
Value
June 30,
2018 | | | Expenses paid
during the period
January 1, 2018
through
June 30,
2018 | | | Annualized
expense
ratio | |
Class IA | | $ | 1,000.00 | | | $ | 1,036.90 | | | $ | 3.94 | | | $ | 1,000.00 | | | $ | 1,020.93 | | | $ | 3.91 | | | | 0.78 | % |
Class IB | | $ | 1,000.00 | | | $ | 1,036.00 | | | $ | 5.20 | | | $ | 1,000.00 | | | $ | 1,019.69 | | | $ | 5.16 | | | | 1.03 | % |
Hartford Dividend and Growth HLS Fund
| | | | | | | | | | | | | | | | | | | | | | | | | | | | |
| | | Actual Return | | | Hypothetical (5% return before expenses) | | | | |
| | | Beginning
Account
Value
January 1,
2018 | | | Ending
Account
Value
June 30,
2018 | | | Expenses paid
during the period
January 1, 2018
through
June 30,
2018 | | | Beginning
Account
Value
January 1,
2018 | | | Ending
Account
Value
June 30,
2018 | | | Expenses paid
during the period
January 1, 2018
through
June 30,
2018 | | | Annualized
expense
ratio | |
Class IA | | $ | 1,000.00 | | | $ | 994.20 | | | $ | 3.36 | | | $ | 1,000.00 | | | $ | 1,021.42 | | | $ | 3.41 | | | | 0.68 | % |
Class IB | | $ | 1,000.00 | | | $ | 992.50 | | | $ | 4.59 | | | $ | 1,000.00 | | | $ | 1,020.18 | | | $ | 4.66 | | | | 0.93 | % |
Hartford Global Growth HLS Fund
| | | | | | | | | | | | | | | | | | | | | | | | | | | | |
| | | Actual Return | | | Hypothetical (5% return before expenses) | | | | |
| | | Beginning
Account
Value
January 1,
2018 | | | Ending
Account
Value
June 30,
2018 | | | Expenses paid
during the period
January 1, 2018
through
June 30,
2018 | | | Beginning
Account
Value
January 1,
2018 | | | Ending
Account
Value
June 30,
2018 | | | Expenses paid
during the period
January 1, 2018
through
June 30,
2018 | | | Annualized
expense
ratio | |
Class IA | | $ | 1,000.00 | | | $ | 1,078.90 | | | $ | 4.12 | | | $ | 1,000.00 | | | $ | 1,020.83 | | | $ | 4.01 | | | | 0.80 | % |
Class IB | | $ | 1,000.00 | | | $ | 1,077.50 | | | $ | 5.41 | | | $ | 1,000.00 | | | $ | 1,019.59 | | | $ | 5.26 | | | | 1.05 | % |
Hartford Growth Opportunities HLS Fund
| | | | | | | | | | | | | | | | | | | | | | | | | | | | |
| | | Actual Return | | | Hypothetical (5% return before expenses) | | | | |
| | | Beginning
Account
Value
January 1,
2018 | | | Ending
Account
Value
June 30,
2018 | | | Expenses paid
during the period
January 1, 2018
through
June 30,
2018 | | | Beginning
Account
Value
January 1,
2018 | | | Ending
Account
Value
June 30,
2018 | | | Expenses paid
during the period
January 1, 2018
through
June 30,
2018 | | | Annualized
expense
ratio | |
Class IA | | $ | 1,000.00 | | | $ | 1,147.60 | | | $ | 3.46 | | | $ | 1,000.00 | | | $ | 1,021.57 | | | $ | 3.26 | | | | 0.65 | % |
Class IB | | $ | 1,000.00 | | | $ | 1,146.30 | | | $ | 4.79 | | | $ | 1,000.00 | | | $ | 1,020.33 | | | $ | 4.51 | | | | 0.90 | % |
Class IC | | $ | 1,000.00 | | | $ | 1,144.80 | | | $ | 6.12 | | | $ | 1,000.00 | | | $ | 1,019.09 | | | $ | 5.76 | | | | 1.15 | % |
Expense Examples (Unaudited) – (continued)
Hartford Healthcare HLS Fund
| | | | | | | | | | | | | | | | | | | | | | | | | | | | |
| | | Actual Return | | | Hypothetical (5% return before expenses) | | | | |
| | | Beginning
Account
Value
January 1,
2018 | | | Ending
Account
Value
June 30,
2018 | | | Expenses paid
during the period
January 1, 2018
through
June 30,
2018 | | | Beginning
Account
Value
January 1,
2018 | | | Ending
Account
Value
June 30,
2018 | | | Expenses paid
during the period
January 1, 2018
through
June 30,
2018 | | | Annualized
expense
ratio | |
Class IA | | $ | 1,000.00 | | | $ | 1,056.50 | | | $ | 4.54 | | | $ | 1,000.00 | | | $ | 1,020.38 | | | $ | 4.46 | | | | 0.89 | % |
Class IB | | $ | 1,000.00 | | | $ | 1,055.30 | | | $ | 5.81 | | | $ | 1,000.00 | | | $ | 1,019.14 | | | $ | 5.71 | | | | 1.14 | % |
Hartford High Yield HLS Fund
| | | | | | | | | | | | | | | | | | | | | | | | | | | | |
| | | Actual Return | | | Hypothetical (5% return before expenses) | | | | |
| | | Beginning
Account
Value
January 1,
2018 | | | Ending
Account
Value
June 30,
2018 | | | Expenses paid
during the period
January 1, 2018
through
June 30,
2018 | | | Beginning
Account
Value
January 1,
2018 | | | Ending
Account
Value
June 30,
2018 | | | Expenses paid
during the period
January 1, 2018
through
June 30,
2018 | | | Annualized
expense
ratio | |
Class IA | | $ | 1,000.00 | | | $ | 995.10 | | | $ | 3.81 | | | $ | 1,000.00 | | | $ | 1,020.98 | | | $ | 3.86 | | | | 0.77 | % |
Class IB | | $ | 1,000.00 | | | $ | 993.80 | | | $ | 5.04 | | | $ | 1,000.00 | | | $ | 1,019.74 | | | $ | 5.11 | | | | 1.02 | % |
Hartford International Opportunities HLS Fund
| | | | | | | | | | | | | | | | | | | | | | | | | | | | |
| | | Actual Return | | | Hypothetical (5% return before expenses) | | | | |
| | | Beginning
Account
Value
January 1,
2018 | | | Ending
Account
Value
June 30,
2018 | | | Expenses paid
during the period
January 1, 2018
through
June 30,
2018 | | | Beginning
Account
Value
January 1,
2018 | | | Ending
Account
Value
June 30,
2018 | | | Expenses paid
during the period
January 1, 2018
through
June 30,
2018 | | | Annualized
expense
ratio | |
Class IA | | $ | 1,000.00 | | | $ | 965.10 | | | $ | 3.56 | | | $ | 1,000.00 | | | $ | 1,021.18 | | | $ | 3.66 | | | | 0.73 | % |
Class IB | | $ | 1,000.00 | | | $ | 963.80 | | | $ | 4.77 | | | $ | 1,000.00 | | | $ | 1,019.94 | | | $ | 4.91 | | | | 0.98 | % |
Hartford MidCap HLS Fund
| | | | | | | | | | | | | | | | | | | | | | | | | | | | |
| | | Actual Return | | | Hypothetical (5% return before expenses) | | | | |
| | | Beginning
Account
Value
January 1,
2018 | | | Ending
Account
Value
June 30,
2018 | | | Expenses paid
during the period
January 1, 2018
through
June 30,
2018 | | | Beginning
Account
Value
January 1,
2018 | | | Ending
Account
Value
June 30,
2018 | | | Expenses paid
during the period
January 1, 2018
through
June 30,
2018 | | | Annualized
expense
ratio | |
Class IA | | $ | 1,000.00 | | | $ | 1,075.10 | | | $ | 3.55 | | | $ | 1,000.00 | | | $ | 1,021.37 | | | $ | 3.46 | | | | 0.69 | % |
Class IB | | $ | 1,000.00 | | | $ | 1,073.80 | | | $ | 4.83 | | | $ | 1,000.00 | | | $ | 1,020.13 | | | $ | 4.71 | | | | 0.94 | % |
Expense Examples (Unaudited) – (continued)
Hartford MidCap Value HLS Fund
| | | | | | | | | | | | | | | | | | | | | | | | | | | | |
| | | Actual Return | | | Hypothetical (5% return before expenses) | | | | |
| | | Beginning
Account
Value
January 1,
2018 | | | Ending
Account
Value
June 30,
2018 | | | Expenses paid
during the period
January 1, 2018
through
June 30,
2018 | | | Beginning
Account
Value
January 1,
2018 | | | Ending
Account
Value
June 30,
2018 | | | Expenses paid
during the period
January 1, 2018
through
June 30,
2018 | | | Annualized
expense
ratio | |
Class IA | | $ | 1,000.00 | | | $ | 1,007.90 | | | $ | 4.28 | | | $ | 1,000.00 | | | $ | 1,020.53 | | | $ | 4.31 | | | | 0.86 | % |
Class IB | | $ | 1,000.00 | | | $ | 1,007.20 | | | $ | 5.52 | | | $ | 1,000.00 | | | $ | 1,019.29 | | | $ | 5.56 | | | | 1.11 | % |
Hartford Small Cap Growth HLS Fund
| | | | | | | | | | | | | | | | | | | | | | | | | | | | |
| | | Actual Return | | | Hypothetical (5% return before expenses) | | | | |
| | | Beginning
Account
Value
January 1,
2018 | | | Ending
Account
Value
June 30,
2018 | | | Expenses paid
during the period
January 1, 2018
through
June 30,
2018 | | | Beginning
Account
Value
January 1,
2018 | | | Ending
Account
Value
June 30,
2018 | | | Expenses paid
during the period
January 1, 2018
through
June 30,
2018 | | | Annualized
expense
ratio | |
Class IA | | $ | 1,000.00 | | | $ | 1,087.10 | | | $ | 3.31 | | | $ | 1,000.00 | | | $ | 1,021.62 | | | $ | 3.21 | | | | 0.64 | % |
Class IB | | $ | 1,000.00 | | | $ | 1,086.00 | | | $ | 4.60 | | | $ | 1,000.00 | | | $ | 1,020.38 | | | $ | 4.46 | | | | 0.89 | % |
Hartford Small Company HLS Fund
| | | | | | | | | | | | | | | | | | | | | | | | | | | | |
| | | Actual Return | | | Hypothetical (5% return before expenses) | | | | |
| | | Beginning
Account
Value
January 1,
2018 | | | Ending
Account
Value
June 30,
2018 | | | Expenses paid
during the period
January 1, 2018
through
June 30,
2018 | | | Beginning
Account
Value
January 1,
2018 | | | Ending
Account
Value
June 30,
2018 | | | Expenses paid
during the period
January 1, 2018
through
June 30,
2018 | | | Annualized
expense
ratio | |
Class IA | | $ | 1,000.00 | | | $ | 1,128.30 | | | $ | 4.17 | | | $ | 1,000.00 | | | $ | 1,020.88 | | | $ | 3.96 | | | | 0.79 | % |
Class IB | | $ | 1,000.00 | | | $ | 1,127.00 | | | $ | 5.48 | | | $ | 1,000.00 | | | $ | 1,019.64 | | | $ | 5.21 | | | | 1.04 | % |
Hartford Small/Mid Cap Equity HLS Fund
| | | | | | | | | | | | | | | | | | | | | | | | | | | | |
| | | Actual Return | | | Hypothetical (5% return before expenses) | | | | |
| | | Beginning
Account
Value
January 1,
2018 | | | Ending
Account
Value
June 30,
2018 | | | Expenses paid
during the period
January 1, 2018
through
June 30,
2018 | | | Beginning
Account
Value
January 1,
2018 | | | Ending
Account
Value
June 30,
2018 | | | Expenses paid
during the period
January 1, 2018
through
June 30,
2018 | | | Annualized
expense
ratio | |
Class IA | | $ | 1,000.00 | | | $ | 1,040.90 | | | $ | 4.60 | | | $ | 1,000.00 | | | $ | 1,020.28 | | | $ | 4.56 | | | | 0.91 | % |
Class IB | | $ | 1,000.00 | | | $ | 1,040.00 | | | $ | 5.87 | | | $ | 1,000.00 | | | $ | 1,019.04 | | | $ | 5.81 | | | | 1.16 | % |
Expense Examples (Unaudited) – (continued)
Hartford Stock HLS Fund
| | | | | | | | | | | | | | | | | | | | | | | | | | | | |
| | | Actual Return | | | Hypothetical (5% return before expenses) | | | | |
| | | Beginning
Account
Value
January 1,
2018 | | | Ending
Account
Value
June 30,
2018 | | | Expenses paid
during the period
January 1, 2018
through
June 30,
2018 | | | Beginning
Account
Value
January 1,
2018 | | | Ending
Account
Value
June 30,
2018 | | | Expenses paid
during the period
January 1, 2018
through
June 30,
2018 | | | Annualized
expense
ratio | |
Class IA | | $ | 1,000.00 | | | $ | 1,019.40 | | | $ | 2.60 | | | $ | 1,000.00 | | | $ | 1,022.22 | | | $ | 2.61 | | | | 0.52 | % |
Class IB | | $ | 1,000.00 | | | $ | 1,018.10 | | | $ | 3.85 | | | $ | 1,000.00 | | | $ | 1,020.98 | | | $ | 3.86 | | | | 0.77 | % |
Hartford Total Return Bond HLS Fund
| | | | | | | | | | | | | | | | | | | | | | | | | | | | |
| | | Actual Return | | | Hypothetical (5% return before expenses) | | | | |
| | | Beginning
Account
Value
January 1,
2018 | | | Ending
Account
Value
June 30,
2018 | | | Expenses paid
during the period
January 1, 2018
through
June 30,
2018 | | | Beginning
Account
Value
January 1,
2018 | | | Ending
Account
Value
June 30,
2018 | | | Expenses paid
during the period
January 1, 2018
through
June 30,
2018 | | | Annualized
expense
ratio | |
Class IA | | $ | 1,000.00 | | | $ | 985.00 | | | $ | 2.51 | | | $ | 1,000.00 | | | $ | 1,022.27 | | | $ | 2.56 | | | | 0.51 | % |
Class IB | | $ | 1,000.00 | | | $ | 984.90 | | | $ | 3.74 | | | $ | 1,000.00 | | | $ | 1,021.03 | | | $ | 3.81 | | | | 0.76 | % |
Hartford Ultrashort Bond HLS Fund
| | | | | | | | | | | | | | | | | | | | | | | | | | | | |
| | | Actual Return | | | Hypothetical (5% return before expenses) | | | | |
| | | Beginning
Account
Value
January 1,
2018 | | | Ending
Account
Value
June 30,
2018 | | | Expenses paid
during the period
January 1, 2018
through
June 30,
2018 | | | Beginning
Account
Value
January 1,
2018 | | | Ending
Account
Value
June 30,
2018 | | | Expenses paid
during the period
January 1, 2018
through
June 30,
2018 | | | Annualized
expense
ratio | |
Class IA | | $ | 1,000.00 | | | $ | 1,006.00 | | | $ | 2.24 | | | $ | 1,000.00 | | | $ | 1,022.56 | | | $ | 2.26 | | | | 0.45 | % |
Class IB | | $ | 1,000.00 | | | $ | 1,005.00 | | | $ | 3.48 | | | $ | 1,000.00 | | | $ | 1,021.32 | | | $ | 3.51 | | | | 0.70 | % |
Hartford U.S. Government Securities HLS Fund
| | | | | | | | | | | | | | | | | | | | | | | | | | | | |
| | | Actual Return | | | Hypothetical (5% return before expenses) | | | | |
| | | Beginning
Account
Value
January 1,
2018 | | | Ending
Account
Value
June 30,
2018 | | | Expenses paid
during the period
January 1, 2018
through
June 30,
2018 | | | Beginning
Account
Value
January 1,
2018 | | | Ending
Account
Value
June 30,
2018 | | | Expenses paid
during the period
January 1, 2018
through
June 30,
2018 | | | Annualized
expense
ratio | |
Class IA | | $ | 1,000.00 | | | $ | 995.10 | | | $ | 2.52 | | | $ | 1,000.00 | | | $ | 1,022.27 | | | $ | 2.56 | | | | 0.51 | % |
Class IB | | $ | 1,000.00 | | | $ | 993.10 | | | $ | 3.76 | | | $ | 1,000.00 | | | $ | 1,021.03 | | | $ | 3.81 | | | | 0.76 | % |
Expense Examples (Unaudited) – (continued)
Hartford Value HLS Fund
| | | | | | | | | | | | | | | | | | | | | | | | | | | | |
| | | Actual Return | | | Hypothetical (5% return before expenses) | | | | |
| | | Beginning
Account
Value
January 1,
2018 | | | Ending
Account
Value
June 30,
2018 | | | Expenses paid
during the period
January 1, 2018
through
June 30,
2018 | | | Beginning
Account
Value
January 1,
2018 | | | Ending
Account
Value
June 30,
2018 | | | Expenses paid
during the period
January 1, 2018
through
June 30,
2018 | | | Annualized
expense
ratio | |
Class IA | | $ | 1,000.00 | | | $ | 988.20 | | | $ | 3.55 | | | $ | 1,000.00 | | | $ | 1,021.22 | | | $ | 3.61 | | | | 0.72 | % |
Class IB | | $ | 1,000.00 | | | $ | 987.50 | | | $ | 4.78 | | | $ | 1,000.00 | | | $ | 1,019.98 | | | $ | 4.86 | | | | 0.97 | % |
|
| Hartford Balanced HLS Fund |
Schedule of Investments
June 30, 2018 (Unaudited)
| | | | | | | | | | | | |
| Shares or Principal Amount | | Market Value† | |
| COMMON STOCKS - 67.8% | |
| | | | | | | Banks - 6.6% | |
| | | | | 1,142,040 | | | Bank of America Corp. | | $ | 32,194,107 | |
| | | | | 462,600 | | | Citigroup, Inc. | | | 30,957,192 | |
| | | | | 364,850 | | | JP Morgan Chase & Co. | | | 38,017,370 | |
| | | | | 139,480 | | | PNC Financial Services Group, Inc. | | | 18,843,748 | |
| | | | | 462,440 | | | Wells Fargo & Co. | | | 25,637,674 | |
| | | | | | | | | | | | |
| | | | | | | | | | | 145,650,091 | |
| | | | | | | | | | | | |
| | | | | | | Capital Goods - 4.5% | |
| | | | | 71,940 | | | 3M Co. | | | 14,152,037 | |
| | | | | 121,480 | | | Caterpillar, Inc. | | | 16,481,192 | |
| | | | | 261,090 | | | Eaton Corp. plc | | | 19,513,866 | |
| | | | | 260,200 | | | Fortune Brands Home & Security, Inc. | | | 13,970,138 | |
| | | | | 170,470 | | | Ingersoll-Rand plc | | | 15,296,273 | |
| | | | | 167,670 | | | United Technologies Corp. | | | 20,963,780 | |
| | | | | | | | | | | | |
| | | | | | | | | | | 100,377,286 | |
| | | | | | | | | | | | |
| | | | | | | Consumer Durables & Apparel - 1.6% | |
| | | | | 278,690 | | | Newell Brands, Inc. | | | 7,187,415 | |
| | | | | 175,880 | | | NIKE, Inc. Class B | | | 14,014,119 | |
| | | | | 481,440 | | | PulteGroup, Inc. | | | 13,841,400 | |
| | | | | | | | | | | | |
| | | | | | | | | | | 35,042,934 | |
| | | | | | | | | | | | |
| | | | | | | Consumer Services - 1.3% | |
| | | | | 212,686 | | | Hilton Worldwide Holdings, Inc. | | | 16,836,224 | |
| | | | | 241,850 | | | Norwegian Cruise Line Holdings Ltd.* | | | 11,427,412 | |
| | | | | | | | | | | | |
| | | | | | | | | | | 28,263,636 | |
| | | | | | | | | | | | |
| | | | | | | Diversified Financials - 1.3% | |
| | | | | 605,830 | | | Invesco Ltd. | | | 16,090,845 | |
| | | | | 798,160 | | | UBS Group AG* | | | 12,236,075 | |
| | | | | | | | | | | | |
| | | | | | | | | | | 28,326,920 | |
| | | | | | | | | | | | |
| | | | | | | Energy - 4.9% | |
| | | | | 250,635 | | | Chevron Corp. | | | 31,687,783 | |
| | | | | 157,170 | | | EOG Resources, Inc. | | | 19,556,663 | |
| | | | | 160,710 | | | Exxon Mobil Corp. | | | 13,295,538 | |
| | | | | 307,540 | | | Halliburton Co. | | | 13,857,753 | |
| | | | | 65,990 | | | Pioneer Natural Resources Co. | | | 12,487,948 | |
| | | | | 410,590 | | | Suncor Energy, Inc. | | | 16,702,801 | |
| | | | | | | | | | | | |
| | | | | | | | | | | 107,588,486 | |
| | | | | | | | | | | | |
| | | | | | | Food & Staples Retailing - 0.5% | |
| | | | | 292,350 | | | US Foods Holding Corp.* | | | 11,056,677 | |
| | | | | | | | | | | | |
| | | | | | | Food, Beverage & Tobacco - 2.6% | |
| | | | | 291,516 | | | British American Tobacco plc | | | 14,684,643 | |
| | | | | 159,786 | | | Kraft Heinz Co. | | | 10,037,757 | |
| | | | | 348,890 | | | Mondelez International, Inc. Class A | | | 14,304,490 | |
| | | | | 242,740 | | | Philip Morris International, Inc. | | | 19,598,828 | |
| | | | | | | | | | | | |
| | | | | | | | | | | 58,625,718 | |
| | | | | | | | | | | | |
| | | | | | | Health Care Equipment & Services - 4.7% | |
| | | | | 399,980 | | | Boston Scientific Corp.* | | | 13,079,346 | |
| | | | | 389,510 | | | Koninklijke Philips N.V. | | | 16,502,738 | |
| | | | | 306,965 | | | Medtronic plc | | | 26,279,274 | |
| | | | | 132,560 | | | UnitedHealth Group, Inc. | | | 32,522,270 | |
| | | | | 133,630 | | | Universal Health Services, Inc. Class B | | | 14,891,727 | |
| | | | | | | | | | | | |
| | | | | | | | | | | 103,275,355 | |
| | | | | | | | | | | | |
| | | | | | | Household & Personal Products - 0.7% | |
| | | | | 281,440 | | | Unilever N.V. | | | 15,681,837 | |
| | | | | | | | | | | | |
| | | | | | | Insurance - 2.2% | |
| | | | | 429,970 | | | American International Group, Inc. | | | 22,797,009 | |
| | | | | 225,450 | | | Marsh & McLennan Cos., Inc. | | | 18,480,137 | |
| | | | | | | | | | | | |
| Shares or Principal Amount | | Market Value† | |
| COMMON STOCKS - 67.8% - (continued) | |
| | | | | | | Insurance - 2.2% - (continued) | |
| | | | | 199,640 | | | Unum Group | | $ | 7,384,684 | |
| | | | | | | | | | | | |
| | | | | | | | | | | 48,661,830 | |
| | | | | | | | | | | | |
| | | | | | | Materials - 2.5% | |
| | | | | 429,850 | | | DowDuPont, Inc. | | | 28,335,712 | |
| | | | | 126,400 | | | FMC Corp. | | | 11,276,144 | |
| | | | | 317,680 | | | International Paper Co. | | | 16,544,774 | |
| | | | | | | | | | | | |
| | | | | | | | | | | 56,156,630 | |
| | | | | | | | | | | | |
| | | | | | | Media - 2.1% | |
| | | | | 828,430 | | | Comcast Corp. Class A | | | 27,180,789 | |
| | | | | 616,570 | | | Viacom, Inc. Class B | | | 18,595,751 | |
| | | | | | | | | | | | |
| | | | | | | | | | | 45,776,540 | |
| | | | | | | | | | | | |
| | | | �� | | | Pharmaceuticals, Biotechnology & Life Sciences - 6.4% | |
| | | | | 122,180 | | | Allergan plc | | | 20,369,849 | |
| | | | | 470,360 | | | AstraZeneca plc ADR | | | 16,514,340 | |
| | | | | 415,360 | | | Bristol-Myers Squibb Co. | | | 22,986,022 | |
| | | | | 131,630 | | | Eisai Co., Ltd. | | | 9,265,438 | |
| | | | | 274,810 | | | Eli Lilly & Co. | | | 23,449,537 | |
| | | | | 94,020 | | | Nektar Therapeutics* | | | 4,590,997 | |
| | | | | 196,730 | | | Novartis AG | | | 14,902,480 | |
| | | | | 69,735 | | | Roche Holding AG | | | 15,471,266 | |
| | | | | 77,290 | | | Vertex Pharmaceuticals, Inc.* | | | 13,136,208 | |
| | | | | | | | | | | | |
| | | | | | | | | | | 140,686,137 | |
| | | | | | | | | | | | |
| | | | | | | Real Estate - 0.7% | |
| | | | | 549,934 | | | Park Hotels & Resorts, Inc. REIT | | | 16,844,478 | |
| | | | | | | | | | | | |
| | | | | | | Retailing - 4.3% | |
| | | | | 11,702,200 | | | Allstar Co.*(1)(2)(3)(4) | | | 5,383,012 | |
| | | | | 7,840 | | | Booking Holdings, Inc.* | | | 15,892,386 | |
| | | | | 167,380 | | | Home Depot, Inc. | | | 32,655,838 | |
| | | | | 721,170 | | | Qurate Retail, Inc.* | | | 15,303,227 | |
| | | | | 233,280 | | | TJX Cos., Inc. | | | 22,203,590 | |
| | | | | 67,006 | | | Tory Burch LLC*(1)(2)(3)(4) | | | 3,637,095 | |
| | | | | | | | | | | | |
| | | | | | | | | | | 95,075,148 | |
| | | | | | | | | | | | |
| | | | | | | Semiconductors & Semiconductor Equipment - 4.5% | |
| | | | | 203,210 | | | Analog Devices, Inc. | | | 19,491,903 | |
| | | | | 62,630 | | | Broadcom, Inc. | | | 15,196,543 | |
| | | | | 422,170 | | | Intel Corp. | | | 20,986,071 | |
| | | | | 260,590 | | | Maxim Integrated Products, Inc. | | | 15,286,209 | |
| | | | | 497,240 | | | QUALCOMM, Inc. | | | 27,905,109 | |
| | | | | | | | | | | | |
| | | | | | | | | | | 98,865,835 | |
| | | | | | | | | | | | |
| | | | | | | Software & Services - 9.0% | |
| | | | | 64,015 | | | Alphabet, Inc. Class C* | | | 71,418,335 | |
| | | | | 201,310 | | | Cognizant Technology Solutions Corp. Class A | | | 15,901,477 | |
| | | | | 245,890 | | | Facebook, Inc. Class A* | | | 47,781,345 | |
| | | | | 655,610 | | | Microsoft Corp. | | | 64,649,702 | |
| | | | | | | | | | | | |
| | | | | | | | | | | 199,750,859 | |
| | | | | | | | | | | | |
| | | | | | | Technology Hardware & Equipment - 4.4% | |
| | | | | 90,420 | | | Apple, Inc. | | | 16,737,646 | |
| | | | | 894,410 | | | Cisco Systems, Inc. | | | 38,486,462 | |
| | | | | 286,270 | | | NetApp, Inc. | | | 22,480,783 | |
| | | | | 3,305,240 | | | Nokia Oyj | | | 18,958,448 | |
| | | | | | | | | | | | |
| | | | | | | | | | | 96,663,339 | |
| | | | | | | | | | | | |
| | | | | | | Transportation - 1.3% | |
| | | | | 199,130 | | | Union Pacific Corp. | | | 28,212,738 | |
| | | | | | | | | | | | |
The accompanying notes are an integral part of these financial statements.
|
| Hartford Balanced HLS Fund |
Schedule of Investments – (continued)
June 30, 2018 (Unaudited)
| | | | | | | | | | | | |
| Shares or Principal Amount | | Market Value† | |
| COMMON STOCKS - 67.8% - (continued) | |
| | | | | | | Utilities - 1.7% | |
| | | | | 227,050 | | | NextEra Energy, Inc. | | $ | 37,924,162 | |
| | | | | | | | | | | | |
| | | |
| | | | | | | | Total Common Stocks
(cost $1,102,127,408) | | $ | 1,498,506,636 | |
| | | | | | | | | | | | |
| | | |
| | | | | | | | | | | | |
| ASSET & COMMERCIAL MORTGAGE BACKED SECURITIES - 3.9% | |
| | | | Asset-Backed - Automobile - 0.5% | |
| | $ | | | | 296,742 | | | ARI Fleet Lease Trust
1.91%, 04/15/2026(2) | | $ | 295,062 | |
| | | | | 655,000 | | | Canadian Pacer Auto Receivables Trust
2.05%, 03/19/2021(2) | | | 649,229 | |
| | | | Chesapeake Funding LLC | |
| | | | | 1,168,299 | | | 1.91%, 08/15/2029(2) | | | 1,154,402 | |
| | | | | 859,699 | | | 1 mo. USD LIBOR + 0.450%,
2.52%, 05/15/2029(2)(5) | | | 859,723 | |
| | | | | 1,233,936 | | | 1 mo. USD LIBOR + 1.000%,
3.07%, 06/15/2028(2)(5) | | | 1,237,581 | |
| | | | Enterprise Fleet Financing LLC | |
| | | | | 778,271 | | | 1.97%, 01/20/2023(2) | | | 772,464 | |
| | | | | 373,697 | | | 2.13%, 07/20/2022(2) | | | 371,498 | |
| | | | | 905,000 | | | 2.13%, 05/22/2023(2) | | | 896,205 | |
| | | | First Investors Auto Owner Trust | |
| | | | | 238,787 | | | 1.86%, 10/15/2021(2) | | | 237,594 | |
| | | | | 878,212 | | | 2.00%, 03/15/2022(2) | | | 873,078 | |
| | | | | 645,000 | | | OneMain Direct Auto Receivables Trust
2.31%, 12/14/2021(2) | | | 640,171 | |
| | | | | 773 | | | Santander Drive Auto Receivables Trust
2.33%, 11/15/2019 | | | 773 | |
| | | | Securitized Term Auto Receivables Trust | |
| | | | | 1,191,730 | | | 1.52%, 03/25/2020(2) | | | 1,186,123 | |
| | | | | 550,000 | | | 2.04%, 04/26/2021(2) | | | 542,272 | |
| | | | Wheels SPV LLC | |
| | | | | 151,198 | | | 1.59%, 05/20/2025(2) | | | 150,558 | |
| | | | | 701,584 | | | 1.88%, 04/20/2026(2) | | | 695,271 | |
| | | | | | | | | | | | |
| | | | 10,562,004 | |
| | | | | | | | | | | | |
| | | | Asset-Backed - Credit Card - 0.1% | |
| | | | | 2,665,000 | | | CARDS Trust
1 mo. USD LIBOR + 0.700%,
2.77%, 07/15/2021(2)(5) | | | 2,665,679 | |
| | | | | | | | | | | | |
| | | | Asset-Backed - Finance & Insurance - 2.2% | |
| | | | | 2,568,169 | | | Ajax Mortgage Loan Trust
3.16%, 09/25/2056(2)(6) | | | 2,517,958 | |
| | | | | 1,780,000 | | | ALM VI Ltd.
3 mo. USD LIBOR + 1.400%,
3.75%, 07/15/2026(2)(5) | | | 1,777,819 | |
| | | | | 3,480,000 | | | Atlas Senior Loan Fund Ltd.
3 mo. USD LIBOR + 1.300%,
3.65%, 01/16/2030(2)(5) | | | 3,481,740 | |
| | | | Bayview Opportunity Master Fund Trust | |
| | | | | 686,052 | | | 3.50%, 01/28/2055(2)(6) | | | 684,778 | |
| | | | | 713,794 | | | 3.50%, 06/28/2057(2)(6) | | | 712,371 | |
| | | | | 1,323,113 | | | 3.50%, 07/28/2057(2)(6) | | | 1,319,665 | |
| | | | | 661,244 | | | 4.00%, 11/28/2053(2)(6) | | | 667,440 | |
| | | | | 903,741 | | | 4.00%, 10/28/2064(2)(6) | | | 911,639 | |
| | | | | 2,000,000 | | | BlueMountain CLO Ltd.
3 mo. USD LIBOR + 1.600%,
3.95%, 10/15/2026(2)(5) | | | 1,998,754 | |
| | | | | 3,500,000 | | | CIFC Funding Ltd.
3 mo. USD LIBOR + 1.050%,
3.16%, 04/24/2030(2)(5) | | | 3,479,942 | |
| | | | | | | | | | | | |
| Shares or Principal Amount | | Market Value† | |
| ASSET & COMMERCIAL MORTGAGE BACKED SECURITIES - 3.9% - (continued) | |
| | | | Asset-Backed - Finance & Insurance - 2.2% - (continued) | |
| | | | Ford Credit Floorplan Master Owner Trust | |
| | $ | | | | 2,575,000 | | | 1.75%, 07/15/2021 | | $ | 2,544,150 | |
| | | | | 430,000 | | | 2.09%, 03/15/2022(2) | | | 423,547 | |
| | | | GreatAmerica Leasing Receivables Funding LLC | |
| | | | | 1,040,000 | | | 2.36%, 01/20/2023(2) | | | 1,025,322 | |
| | | | | 470,000 | | | 2.60%, 06/15/2021(2) | | | 466,163 | |
| | | | | 332,000 | | | 2.83%, 06/17/2024(2) | | | 328,711 | |
| | | | | 1,465,000 | | | KKR CLO Ltd.
3 mo. USD LIBOR + 1.340%,
3.69%, 04/15/2029(2)(5) | | | 1,471,008 | |
| | | | Madison Park Funding Ltd. | |
| | | | | 2,635,000 | | | 3 mo. USD LIBOR + 0.750%,
3.09%, 04/15/2029(2)(5) | | | 2,606,713 | |
| | | | | 4,000,000 | | | 3 mo. USD LIBOR + 1.120%,
3.48%, 07/20/2026(2)(5) | | | 3,998,464 | |
| | | | | 2,690,000 | | | Magnetite VII Ltd.
3 mo. USD LIBOR + 0.800%,
3.15%, 01/15/2028(2)(5) | | | 2,674,124 | |
| | | | MMAF Equipment Finance LLC | |
| | | | | 322,609 | | | 1.73%, 05/18/2020(2) | | | 321,721 | |
| | | | | 665,000 | | | 2.21%, 10/17/2022(2) | | | 651,460 | |
| | | | | 1,000,000 | | | 2.21%, 12/15/2032(2) | | | 959,693 | |
| | | | Nationstar HECM Loan Trust | |
| | | | | 255,597 | | | 1.97%, 05/25/2027(2) | | | 254,728 | |
| | | | | 292,297 | | | 2.04%, 09/25/2027(2)(6) | | | 291,080 | |
| | | | | 2,465,000 | | | Octagon Loan Funding Ltd.
3 mo. USD LIBOR + 1.140%,
3.47%, 11/18/2026(2)(5) | | | 2,464,408 | |
| | | | OneMain Financial Issuance Trust | |
| | | | | 440,000 | | | 3.66%, 02/20/2029(2) | | | 442,759 | |
| | | | | 591,181 | | | 4.10%, 03/20/2028(2) | | | 594,727 | |
| | | | | 1,565,000 | | | SBA Tower Trust
2.90%, 10/15/2044(2)(7) | | | 1,555,082 | |
| | | | Springleaf Funding Trust | |
| | | | | 440,000 | | | 2.90%, 11/15/2029(2) | | | 437,733 | |
| | | | | 1,110,165 | | | 3.16%, 11/15/2024(2) | | | 1,109,738 | |
| | | | | 755,000 | | | 3.48%, 05/15/2028(2) | | | 754,545 | |
| | | | | 1,965,000 | | | SPS Servicer Advance Receivables Trust
2.53%, 11/16/2048(2) | | | 1,974,000 | |
| | | | Towd Point Mortgage Trust | |
| | | | | 1,217,075 | | | 2.75%, 10/25/2056(2)(6) | | | 1,191,555 | |
| | | | | 307,056 | | | 2.75%, 04/25/2057(2)(6) | | | 302,016 | |
| | | | | 864,657 | | | 2.75%, 06/25/2057(2)(6) | | | 843,846 | |
| | | | | 417,921 | | | 3.00%, 01/25/2058(2)(6) | | | 411,495 | |
| | | | | 812,283 | | | Vantage Data Centers Issuer LLC
4.07%, 02/16/2043(2) | | | 812,595 | |
| | | | | | | | | | | | |
| | | | 48,463,489 | |
| | | | | | | | | | | | |
| | | | Commercial Mortgage - Backed Securities - 0.7% | |
| | | | | 1,575,000 | | | Commercial Mortgage Trust
3.18%, 02/10/2048 | | | 1,537,404 | |
| | | | CSAIL Commercial Mortgage Trust | |
| | | | | 3,200,000 | | | 3.50%, 06/15/2057 | | | 3,170,786 | |
| | | | | 3,400,000 | | | 3.51%, 04/15/2050 | | | 3,382,315 | |
| | | | | 2,220,000 | | | CSMC Trust
2.76%, 04/05/2033(2) | | | 2,186,658 | |
| | | | FREMF Mortgage Trust | |
| | | | | 230,000 | | | 3.26%, 04/25/2046(2)(6) | | | 229,820 | |
| | | | | 385,000 | | | 3.48%, 05/25/2045(2)(6) | | | 385,871 | |
| | | | | 525,000 | | | 5.69%, 04/25/2020(2)(6) | | | 544,211 | |
The accompanying notes are an integral part of these financial statements.
|
| Hartford Balanced HLS Fund |
Schedule of Investments – (continued)
June 30, 2018 (Unaudited)
| | | | | | | | | | | | |
| Shares or Principal Amount | | Market Value† | |
| ASSET & COMMERCIAL MORTGAGE BACKED SECURITIES - 3.9% - (continued) | |
| | | | Commercial Mortgage - Backed Securities - 0.7% - (continued) | |
| | $ | | | | 710,000 | | | JP Morgan Chase Commercial Mortgage Securities Trust
3.91%, 01/15/2049 | | $ | 721,568 | |
| | | | | 317 | | | LB-UBS Commercial Mortgage Trust
6.32%, 04/15/2041(6) | | | 318 | |
| | | | | 3,100,000 | | | Morgan Stanley Bank of America Merrill Lynch Trust
3.31%, 04/15/2048 | | | 3,040,905 | |
| | | | | 1,000,000 | | | SFAVE Commercial Mortgage Securities Trust
4.14%, 01/05/2043(2)(6) | | | 965,478 | |
| | | | | | | | | | | | |
| | | | 16,165,334 | |
| | | | | | | | | | | | |
| | | | Whole Loan Collateral CMO - 0.4% | |
| | | | | 477,445 | | | Angel Oak Mortgage Trust LLC
2.71%, 11/25/2047(2)(6) | | | 474,255 | |
| | | | | 913,557 | | | COLT Mortgage Loan Trust
2.93%, 02/25/2048(2)(6) | | | 909,345 | |
| | | | Deephaven Residential Mortgage Trust | |
| | | | | 587,616 | | | 2.45%, 06/25/2047(2)(6) | | | 579,130 | |
| | | | | 539,153 | | | 2.58%, 10/25/2047(2)(6) | | | 535,813 | |
| | | | | 260,098 | | | 2.73%, 12/26/2046(2)(6) | | | 258,997 | |
| | | | | 836,035 | | | 2.98%, 12/25/2057(2)(6) | | | 831,057 | |
| | | | | 427,813 | | | Finance of America Structured Securities Trust
2.32%, 11/25/2027(2)(6) | | | 427,062 | |
| | | | | 815,651 | | | MetLife Securitization Trust
3.00%, 04/25/2055(2)(6) | | | 801,533 | |
| | | | Mill City Mortgage Loan Trust | |
| | | | | 387,122 | | | 2.50%, 04/25/2057(2)(6) | | | 379,811 | |
| | | | | 964,995 | | | 2.75%, 01/25/2061(2)(6) | | | 945,510 | |
| | | | | 1,129,742 | | | New Residential Mortgage Loan Trust
4.00%, 04/25/2057(2)(6) | | | 1,140,665 | |
| | | | | 871,052 | | | Towd Point Mortgage Trust
2.25%, 04/25/2056(2)(6) | | | 850,780 | |
| | | | | | | | | | | | |
| | | | 8,133,958 | |
| | | | | | | | | | | | |
| | |
| | | | Total Asset & Commercial Mortgage Backed Securities
(cost $87,483,776) | | $ | 85,990,464 | |
| | | | | | | | | | | | |
| | | |
| | | | | | | | | | | | |
| CORPORATE BONDS - 18.9% | |
| | | | Aerospace/Defense - 0.2% | |
| | $ | | | | 850,000 | | | BAE Systems Holdings, Inc.
3.85%, 12/15/2025(2) | | $ | 840,198 | |
| | | | | 2,345,000 | | | General Dynamics Corp.
2.88%, 05/11/2020 | | | 2,342,451 | |
| | | | Lockheed Martin Corp. | |
| | | | | 500,000 | | | 4.07%, 12/15/2042 | | | 481,056 | |
| | | | | 256,000 | | | 4.50%, 05/15/2036 | | | 265,690 | |
| | | | | 560,000 | | | 4.85%, 09/15/2041 | | | 594,237 | |
| | | | | | | | | | | | |
| | | | 4,523,632 | |
| | | | | | | | | | | | |
| | | | Agriculture - 0.4% | |
| | | | Altria Group, Inc. | |
| | | | | 560,000 | | | 4.50%, 05/02/2043 | | | 537,099 | |
| | | | | 1,995,000 | | | 4.75%, 05/05/2021 | | | 2,071,947 | |
| | | | | 2,160,000 | | | BAT Capital Corp.
3.56%, 08/15/2027(2) | | | 2,009,667 | |
| | | | | | | | | | | | |
| Shares or Principal Amount | | Market Value† | |
| CORPORATE BONDS - 18.9% - (continued) | |
| | | | Agriculture - 0.4% - (continued) | |
| | | | BAT International Finance plc | |
| | $ | | | | 685,000 | | | 2.75%, 06/15/2020(2) | | $ | 677,528 | |
| | | | | 2,775,000 | | | 3.25%, 06/07/2022(2) | | | 2,730,077 | |
| | | | | 290,000 | | | 3.50%, 06/15/2022(2) | | | 287,242 | |
| | | | | 1,065,000 | | | Imperial Brands Finance plc
3.75%, 07/21/2022(2) | | | 1,057,069 | |
| | | | | 325,000 | | | Philip Morris International, Inc.
4.88%, 11/15/2043 | | | 334,783 | |
| | | | | | | | | | | | |
| | | | 9,705,412 | |
| | | | | | | | | | | | |
| | | | Airlines - 0.2% | |
| | | | | 2,903,609 | | | Continental Airlines, Inc.
5.98%, 10/19/2023 | | | 3,074,050 | |
| | | | | 1,958,044 | | | Southwest Airlines Co.
6.15%, 02/01/2024 | | | 2,076,472 | |
| | | | | 170,000 | | | United Airlines Class B Pass Through Trust
4.60%, 09/01/2027 | | | 170,844 | |
| | | | | | | | | | | | |
| | | | 5,321,366 | |
| | | | | | | | | | | | |
| | | | Auto Manufacturers - 0.5% | |
| | | | Daimler Finance North America LLC | |
| | | | | 150,000 | | | 2.25%, 07/31/2019(2) | | | 148,807 | |
| | | | | 1,440,000 | | | 2.30%, 02/12/2021(2) | | | 1,398,756 | |
| | | | | 665,000 | | | Ford Motor Co.
4.35%, 12/08/2026 | | | 652,639 | |
| | | | | 4,200,000 | | | Ford Motor Credit Co. LLC
3.10%, 05/04/2023 | | | 3,999,794 | |
| | | | General Motors Financial Co., Inc. | |
| | | | | 3,185,000 | | | 3.70%, 05/09/2023 | | | 3,124,660 | |
| | | | | 1,245,000 | | | 3.95%, 04/13/2024 | | | 1,218,365 | |
| | | | | 580,000 | | | Volkswagen Group of America Finance LLC
2.45%, 11/20/2019(2) | | | 573,581 | |
| | | | | | | | | | | | |
| | | | 11,116,602 | |
| | | | | | | | | | | | |
| | | | Beverages - 0.3% | |
| | | | Anheuser-Busch InBev Finance, Inc. | |
| | | | | 1,750,000 | | | 3.65%, 02/01/2026 | | | 1,713,151 | |
| | | | | 310,000 | | | 4.70%, 02/01/2036 | | | 314,200 | |
| | | | | 280,000 | | | 4.90%, 02/01/2046 | | | 287,946 | |
| | | | Anheuser-Busch InBev Worldwide, Inc. | |
| | | | | 1,125,000 | | | 3.50%, 01/12/2024 | | | 1,118,053 | |
| | | | | 220,000 | | | 4.38%, 04/15/2038 | | | 213,577 | |
| | | | Coca-Cola Femsa S.A.B. de C.V. | |
| | | | | 530,000 | | | 2.38%, 11/26/2018 | | | 529,273 | |
| | | | | 1,300,000 | | | 3.88%, 11/26/2023 | | | 1,301,774 | |
| | | | | 245,000 | | | Constellation Brands, Inc.
2.70%, 05/09/2022 | | | 236,803 | |
| | | | | | | | Molson Coors Brewing Co. | |
| | | | | 765,000 | | | 3.50%, 05/01/2022 | | | 762,197 | |
| | | | | 215,000 | | | 5.00%, 05/01/2042 | | | 218,033 | |
| | | | | | | | | | | | |
| | | | | | | | | | | 6,695,007 | |
| | | | | | | | | | | | |
| | | | | | | Biotechnology - 0.1% | |
| | | | | 1,340,000 | | | Biogen, Inc.
2.90%, 09/15/2020 | | | 1,334,169 | |
| | | | | | | | Celgene Corp. | |
| | | | | 230,000 | | | 2.25%, 05/15/2019 | | | 228,888 | |
| | | | | 770,000 | | | 3.55%, 08/15/2022 | | | 764,143 | |
| | | | | 535,000 | | | 3.63%, 05/15/2024 | | | 521,948 | |
| | | | | 335,000 | | | Gilead Sciences, Inc.
2.55%, 09/01/2020 | | | 330,975 | |
| | | | | | | | | | | | |
| | | | | | | | | | | 3,180,123 | |
| | | | | | | | | | | | |
The accompanying notes are an integral part of these financial statements.
|
| Hartford Balanced HLS Fund |
Schedule of Investments – (continued)
June 30, 2018 (Unaudited)
| | | | | | | | | | | | |
| Shares or Principal Amount | | Market Value† | |
| CORPORATE BONDS - 18.9% - (continued) | |
| | | | | | | Chemicals - 0.2% | |
| | $ | | | | 2,740,000 | | | CNAC HK Synbridge Co., Ltd.
5.00%, 05/05/2020 | | $ | 2,748,768 | |
| | | | | 1,950,000 | | | Nutrien Ltd.
3.15%, 10/01/2022 | | | 1,896,768 | |
| | | | | | | | | | | | |
| | | | | | | | | | | 4,645,536 | |
| | | | | | | | | | | | |
| | | | | | | Commercial Banks - 5.1% | |
| | | | | | | | Banco Santander S.A. | |
| | | | | 1,400,000 | | | 3.13%, 02/23/2023 | | | 1,328,474 | |
| | | | | 1,000,000 | | | 3.85%, 04/12/2023 | | | 977,992 | |
| | | | | | | | Bank of America Corp. | |
| | | | | 1,220,000 | | | 2.63%, 10/19/2020 | | | 1,204,994 | |
| | | | | 1,799,000 | | | 3 mo. USD LIBOR + 1.040%,
3.42%, 12/20/2028(5) | | | 1,694,072 | |
| | | | | 1,610,000 | | | 3 mo. USD LIBOR + 1.370%,
3.59%, 07/21/2028(5) | | | 1,537,126 | |
| | | | | 2,950,000 | | | 4.20%, 08/26/2024 | | | 2,965,397 | |
| | | | | 2,020,000 | | | Bank of New York Mellon Corp.
2.15%, 02/24/2020 | | | 1,994,995 | |
| | | | | 2,830,000 | | | Banque Federative du Credit Mutuel S.A.
2.75%, 10/15/2020(2) | | | 2,794,335 | |
| | | | | 2,740,000 | | | Barclays plc
3.20%, 08/10/2021 | | | 2,684,501 | |
| | | | | 1,660,000 | | | BB&T Corp.
3.20%, 09/03/2021 | | | 1,654,752 | |
| | | | | | | | BNP Paribas S.A. | |
| | | | | 2,075,000 | | | 2.40%, 12/12/2018 | | | 2,073,840 | |
| | | | | 590,000 | | | 2.95%, 05/23/2022(2) | | | 569,542 | |
| | | | | 1,000,000 | | | 3.38%, 01/09/2025(2) | | | 944,683 | |
| | | | | 2,410,000 | | | 3.50%, 11/16/2027(2) | | | 2,235,795 | |
| | | | | | | | BPCE S.A. | |
| | | | | 365,000 | | | 2.50%, 12/10/2018 | | | 364,796 | |
| | | | | 305,000 | | | 3.00%, 05/22/2022(2) | | | 294,587 | |
| | | | | 2,025,000 | | | 3.50%, 10/23/2027(2) | | | 1,848,349 | |
| | | | | 2,225,000 | | | 5.15%, 07/21/2024(2) | | | 2,255,956 | |
| | | | | 1,425,000 | | | 5.70%, 10/22/2023(2) | | | 1,488,162 | |
| | | | | 2,875,000 | | | Capital One Financial Corp.
3.75%, 04/24/2024 | | | 2,819,911 | |
| | | | | | | | Citigroup, Inc. | |
| | | | | 1,220,000 | | | 2.50%, 07/29/2019 | | | 1,214,527 | |
| | | | | 2,355,000 | | | 3 mo. USD LIBOR + 1.151%,
3.52%, 10/27/2028(5) | | | 2,212,616 | |
| | | | | 533,000 | | | 5.30%, 05/06/2044 | | | 548,739 | |
| | | | | 290,000 | | | 8.13%, 07/15/2039 | | | 407,921 | |
| | | | | 1,695,000 | | | Citizens Bank NA
2.55%, 05/13/2021 | | | 1,653,048 | |
| | | | | 505,000 | | | Compass Bank
2.75%, 09/29/2019 | | | 502,230 | |
| | | | | | | | Credit Agricole S.A. | |
| | | | | 950,000 | | | 2.50%, 04/15/2019(2) | | | 947,936 | |
| | | | | 1,025,000 | | | 3.25%, 10/04/2024(2) | | | 965,236 | |
| | | | | 535,000 | | | 3.75%, 04/24/2023(2) | | | 524,165 | |
| | | | | 790,000 | | | 4.38%, 03/17/2025(2) | | | 762,127 | |
| | | | Credit Suisse AG | |
| | | | | 945,000 | | | 2.30%, 05/28/2019 | | | 940,458 | |
| | | | | 855,000 | | | 3.00%, 10/29/2021 | | | 843,560 | |
| | | | | 250,000 | | | 3.63%, 09/09/2024 | | | 245,822 | |
| | | | Credit Suisse Group AG | |
| | | | | 345,000 | | | 3 mo. USD LIBOR + 1.240%,
3.57%, 06/12/2024(2)(5) | | | 344,691 | |
| | | | | 530,000 | | | 3.57%, 01/09/2023(2) | | | 519,152 | |
| | | | | | | | | | | | |
| Shares or Principal Amount | | Market Value† | |
| CORPORATE BONDS - 18.9% - (continued) | |
| | | | | | | Commercial Banks - 5.1% - (continued) | |
| | $ | | | | 260,000 | | | 3 mo. USD LIBOR + 1.410%,
3.87%, 01/12/2029(2)(5) | | $ | 244,485 | |
| | | | Credit Suisse Group Funding Guernsey Ltd. | |
| | | | | 1,425,000 | | | 3.75%, 03/26/2025 | | | 1,370,521 | |
| | | | | 1,885,000 | | | 3.80%, 09/15/2022 | | | 1,876,727 | |
| | | | Deutsche Bank AG | |
| | | | | 1,925,000 | | | 3.15%, 01/22/2021 | | | 1,862,966 | |
| | | | | 2,210,000 | | | 4.25%, 10/14/2021 | | | 2,178,773 | |
| | | | Goldman Sachs Group, Inc. | |
| | | | | 250,000 | | | 3 mo. USD LIBOR + 1.158%,
3.81%, 04/23/2029(5) | | | 237,784 | |
| | | | | 2,590,000 | | | 6.25%, 02/01/2041 | | | 3,023,982 | |
| | | | HSBC Holdings plc | |
| | | | | 1,030,000 | | | 3.40%, 03/08/2021 | | | 1,029,629 | |
| | | | | 4,625,000 | | | 3.60%, 05/25/2023 | | | 4,579,661 | |
| | | | | 590,000 | | | 3 mo. USD LIBOR + 1.535%,
4.58%, 06/19/2029(5) | | | 595,920 | |
| | | | Huntington National Bank | |
| | | | | 2,120,000 | | | 2.20%, 11/06/2018 | | | 2,117,150 | |
| | | | | 1,490,000 | | | 2.40%, 04/01/2020 | | | 1,469,401 | |
| | | | ING Groep N.V. | |
| | | | | 345,000 | | | 3.15%, 03/29/2022 | | | 338,526 | |
| | | | | 1,100,000 | | | 3.95%, 03/29/2027 | | | 1,073,573 | |
| | | | JP Morgan Chase & Co. | |
| | | | | 2,240,000 | | | 3.25%, 09/23/2022 | | | 2,219,235 | |
| | | | | 2,000,000 | | | 4.95%, 03/25/2020 | | | 2,059,669 | |
| | | | | 2,600,000 | | | Korea Development Bank
2.50%, 03/11/2020 | | | 2,565,041 | |
| | | | | 470,000 | | | Macquarie Bank Ltd.
2.40%, 01/21/2020(2) | | | 463,884 | |
| | | | | 2,215,000 | | | Macquarie Group Ltd.
3 mo. USD LIBOR + 1.330%,
4.15%, 03/27/2024(2)(5) | | | 2,204,522 | |
| | | | Morgan Stanley | |
| | | | | 4,875,000 | | | 2.50%, 01/24/2019 | | | 4,867,312 | |
| | | | | 1,450,000 | | | 3.13%, 07/27/2026 | | | 1,348,827 | |
| | | | | 1,800,000 | | | 3.63%, 01/20/2027 | | | 1,728,407 | |
| | | | | 1,000,000 | | | 3.70%, 10/23/2024 | | | 987,246 | |
| | | | | 250,000 | | | 5.63%, 09/23/2019 | | | 257,614 | |
| | | | | 4,250,000 | | | National City Corp.
6.88%, 05/15/2019 | | | 4,390,974 | |
| | | | | 4,905,000 | | | NBK SPC Ltd.
2.75%, 05/30/2022(2) | | | 4,672,994 | |
| | | | | 1,755,000 | | | Santander Holdings USA, Inc.
3.40%, 01/18/2023 | | | 1,694,478 | |
| | | | Santander UK plc | |
| | | | | 1,375,000 | | | 2.50%, 03/14/2019 | | | 1,372,231 | |
| | | | | 2,150,000 | | | 5.00%, 11/07/2023(2) | | | 2,182,652 | |
| | | | | 1,775,000 | | | Societe Generale S.A.
3.25%, 01/12/2022(2) | | | 1,732,080 | |
| | | | | 640,000 | | | SunTrust Bank
3.30%, 05/15/2026 | | | 604,188 | |
| | | | UBS Group Funding Switzerland AG | |
| | | | | 1,665,000 | | | 2.95%, 09/24/2020(2) | | | 1,647,452 | |
| | | | | 1,900,000 | | | 3.00%, 04/15/2021(2) | | | 1,870,960 | |
| | | | Wells Fargo & Co. | |
| | | | | 4,344,000 | | | 4.48%, 01/16/2024 | | | 4,430,917 | |
| | | | | 850,000 | | | 4.75%, 12/07/2046 | | | 822,527 | |
| | | | | | | | | | | | |
| | | | | | | | | | | 112,486,795 | |
| | | | | | | | | | | | |
The accompanying notes are an integral part of these financial statements.
|
| Hartford Balanced HLS Fund |
Schedule of Investments – (continued)
June 30, 2018 (Unaudited)
| | | | | | | | | | | | |
| Shares or Principal Amount | | Market Value† | |
| CORPORATE BONDS - 18.9% - (continued) | |
| | | | | | | Commercial Services - 0.4% | |
| | | | | | | | Catholic Health Initiatives | |
| | $ | | | | 765,000 | | | 2.60%, 08/01/2018 | | $ | 765,007 | |
| | | | | 1,854,000 | | | 2.95%, 11/01/2022 | | | 1,790,181 | |
| | | | | 245,000 | | | 4.35%, 11/01/2042 | | | 231,839 | |
| | | | | | | | ERAC USA Finance LLC | |
| | | | | 655,000 | | | 2.35%, 10/15/2019(2) | | | 647,646 | |
| | | | | 1,800,000 | | | 4.50%, 08/16/2021(2) | | | 1,844,763 | |
| | | | | 1,500,000 | | | 5.63%, 03/15/2042(2) | | | 1,626,140 | |
| | | | | 2,545,000 | | | Total System Services, Inc.
3.80%, 04/01/2021 | | | 2,562,398 | |
| | | | | | | | | | | | |
| | | | | | | | | | | 9,467,974 | |
| | | | | | | | | | | | |
| | | | | | | Diversified Financial Services - 0.8% | |
| | | | | 1,655,000 | | | Capital One Bank USA NA
2.15%, 11/21/2018 | | | 1,652,079 | |
| | | | | 2,475,000 | | | CDP Financial, Inc.
4.40%, 11/25/2019(2) | | | 2,530,868 | |
| | | | | 1,910,000 | | | LeasePlan Corp. N.V.
2.88%, 01/22/2019(2) | | | 1,906,809 | |
| | | | | 6,929,923 | | | Postal Square L.P.
8.95%, 06/15/2022 | | | 7,826,073 | |
| | | | | | | | Synchrony Financial | |
| | | | | 2,045,000 | | | 2.60%, 01/15/2019 | | | 2,041,069 | |
| | | | | 520,000 | | | 2.70%, 02/03/2020 | | | 514,517 | |
| | | | | 355,000 | | | 3.00%, 08/15/2019 | | | 354,246 | |
| | | | | | | | | | | | |
| | | | | | | | | | | 16,825,661 | |
| | | | | | | | | | | | |
| | | | | | | Electric - 2.0% | |
| | | | | 1,960,000 | | | Cleveland Electric Illuminating Co.
3.50%, 04/01/2028(2) | | | 1,858,758 | |
| | | | | | | | Dominion Energy, Inc. | |
| | | | | 2,850,000 | | | 3.63%, 12/01/2024 | | | 2,794,756 | |
| | | | | 1,750,000 | | | 4.10%, 04/01/2021(7) | | | 1,774,412 | |
| | | | | 725,000 | | | Dominion Energy, Inc.
2.96%, 07/01/2019(7) | | | 723,386 | |
| | | | | 1,200,000 | | | Duke Energy Carolinas LLC
6.10%, 06/01/2037 | | | 1,507,630 | |
| | | | | 855,000 | | | Duke Energy Corp.
2.65%, 09/01/2026 | | | 770,075 | |
| | | | | 1,375,000 | | | Electricite de France S.A.
10 year USD Swap + 3.041%,
5.63%, 01/22/2024(2)(5)(8) | | | 1,347,500 | |
| | | | | 365,000 | | | Emera U.S. Finance L.P.
2.70%, 06/15/2021 | | | 355,259 | |
| | | | | 640,000 | | | Entergy Corp.
2.95%, 09/01/2026 | | | 583,933 | |
| | | | | 1,000,000 | | | FirstEnergy Corp.
3.90%, 07/15/2027 | | | 970,110 | |
| | | | | 1,705,000 | | | Fortis, Inc.
3.06%, 10/04/2026 | | | 1,553,433 | |
| | | | | 1,275,000 | | | Indianapolis Power and Light Co.
6.60%, 06/01/2037(2) | | | 1,632,889 | |
| | | | | 515,000 | | | Infraestructura Energetica Nova S.A.B. de C.V.
4.88%, 01/14/2048(2) | | | 441,612 | |
| | | | | 1,700,000 | | | NextEra Energy Capital Holdings, Inc.
3.55%, 05/01/2027 | | | 1,634,084 | |
| | | | | 750,000 | | | Oglethorpe Power Corp.
5.25%, 09/01/2050 | | | 820,616 | |
| | | | | | | | Oncor Electric Delivery Co. LLC | |
| | | | | 385,000 | | | 2.95%, 04/01/2025 | | | 369,373 | |
| | | | | 1,185,000 | | | 4.10%, 06/01/2022 | | | 1,214,468 | |
| | | | | | | | | | | | |
| Shares or Principal Amount | | Market Value† | |
| CORPORATE BONDS - 18.9% - (continued) | |
| | | | | | | Electric - 2.0% - (continued) | |
| | | | | | | | Pacific Gas & Electric Co. | |
| | $ | | | | 695,000 | | | 3.85%, 11/15/2023 | | $ | 685,267 | |
| | | | | 100,000 | | | 3.95%, 12/01/2047 | | | 85,545 | |
| | | | | 45,000 | | | 4.30%, 03/15/2045 | | | 40,464 | |
| | | | | 45,000 | | | 4.75%, 02/15/2044 | | | 42,656 | |
| | | | | 720,000 | | | 5.13%, 11/15/2043 | | | 708,696 | |
| | | | | 1,345,000 | | | 5.40%, 01/15/2040 | | | 1,367,865 | |
| | | | | 996,000 | | | 5.80%, 03/01/2037 | | | 1,041,149 | |
| | | | | 265,000 | | | 6.05%, 03/01/2034 | | | 286,166 | |
| | | | | 320,000 | | | 6.25%, 03/01/2039 | | | 350,752 | |
| | | | | 55,000 | | | 6.35%, 02/15/2038 | | | 59,234 | |
| | | | | | | | SCANA Corp. | |
| | | | | 2,031,000 | | | 4.13%, 02/01/2022 | | | 1,998,098 | |
| | | | | 2,780,000 | | | 4.75%, 05/15/2021(9) | | | 2,808,071 | |
| | | | | 1,100,000 | | | 6.25%, 04/01/2020 | | | 1,132,811 | |
| | | | | | | | South Carolina Electric & Gas Co. | |
| | | | | 215,000 | | | 4.35%, 02/01/2042 | | | 203,934 | |
| | | | | 205,000 | | | 4.60%, 06/15/2043 | | | 200,791 | |
| | | | | 1,180,000 | | | 6.05%, 01/15/2038 | | | 1,339,265 | |
| | | | | 2,000,000 | | | Southern California Edison Co.
5.55%, 01/15/2037 | | | 2,287,637 | |
| | | | | | | | Southern Co. | |
| | | | | 1,450,000 | | | 2.75%, 06/15/2020 | | | 1,437,533 | |
| | | | | 2,050,000 | | | 2.95%, 07/01/2023 | | | 1,977,448 | |
| | | | | | | | State Grid Overseas Investment Ltd. | |
| | | | | 1,795,000 | | | 2.75%, 05/07/2019(2) | | | 1,789,202 | |
| | | | | 1,485,000 | | | 2.75%, 05/04/2022(2) | | | 1,440,524 | |
| | | | | 1,490,000 | | | 3.50%, 05/04/2027(2) | | | 1,421,892 | |
| | | | | | | | | | | | |
| | | | | | | | | | | 43,057,294 | |
| | | | | | | | | | | | |
| | | | | | | Engineering & Construction - 0.1% | |
| | | | | 985,000 | | | Mexico City Airport Trust
5.50%, 07/31/2047(2) | | | 877,635 | |
| | | | | | | | SBA Tower Trust | |
| | | | | 1,235,000 | | | 2.88%, 07/10/2046(2) | | | 1,199,636 | |
| | | | | 225,000 | | | 3.45%, 03/15/2048(2) | | | 223,508 | |
| | | | | | | | | | | | |
| | | | | | | | | | | 2,300,779 | |
| | | | | | | | | | | | |
| | | | | | | Food - 0.3% | |
| | | | | | | | Kraft Heinz Foods Co. | |
| | | | | 530,000 | | | 3.00%, 06/01/2026 | | | 477,278 | |
| | | | | 2,030,000 | | | 3.50%, 07/15/2022 | | | 2,006,405 | |
| | | | | 1,890,000 | | | 4.38%, 06/01/2046 | | | 1,635,046 | |
| | | | | | | | Kroger Co. | |
| | | | | 620,000 | | | 3.30%, 01/15/2021 | | | 618,995 | |
| | | | | 1,065,000 | | | 4.00%, 02/01/2024 | | | 1,067,431 | |
| | | | | 250,000 | | | 4.45%, 02/01/2047 | | | 227,381 | |
| | | | | 680,000 | | | Sigma Alimentos S.A. de C.V.
4.13%, 05/02/2026(2) | | | 637,500 | |
| | | | | | | | | | | | |
| | | | | | | | | | | 6,670,036 | |
| | | | | | | | | | | | |
| | | | | | | Gas - 0.1% | |
| | | | | 330,000 | | | Boston Gas Co.
3.15%, 08/01/2027(2) | | | 311,310 | |
| | | | | 1,870,000 | | | KeySpan Gas East Corp.
2.74%, 08/15/2026(2) | | | 1,730,574 | |
| | | | | | | | | | | | |
| | | | | | | | | | | 2,041,884 | |
| | | | | | | | | | | | |
| | | | | | | Healthcare - Products - 0.1% | |
| | | | | | | | Medtronic, Inc. | |
| | | | | 545,000 | | | 2.50%, 03/15/2020 | | | 541,218 | |
| | | | | 775,000 | | | 3.15%, 03/15/2022 | | | 768,793 | |
The accompanying notes are an integral part of these financial statements.
|
| Hartford Balanced HLS Fund |
Schedule of Investments – (continued)
June 30, 2018 (Unaudited)
| | | | | | | | | | | | |
| Shares or Principal Amount | | Market Value† | |
| CORPORATE BONDS - 18.9% - (continued) | |
| | | | | | | Healthcare - Products - 0.1% - (continued) | |
| | $ | | | | 1,230,000 | | | 3.50%, 03/15/2025 | | $ | 1,217,104 | |
| | | | | 310,000 | | | 3.63%, 03/15/2024 | | | 311,137 | |
| | | | | | | | | | | | |
| | | | | | | | | | | 2,838,252 | |
| | | | | | | | | | | | |
| | | | | | | Healthcare - Services - 0.7% | |
| | | | | | | | Anthem, Inc. | |
| | | | | 421,000 | | | 3.30%, 01/15/2023 | | | 413,584 | |
| | | | | 1,360,000 | | | 4.10%, 03/01/2028 | | | 1,330,400 | |
| | | | | 675,000 | | | 4.65%, 08/15/2044 | | | 654,828 | |
| | | | | 590,000 | | | Catholic Health Initiatives
4.20%, 08/01/2023 | | | 594,789 | |
| | | | | | | | Dignity Health | |
| | | | | 180,000 | | | 2.64%, 11/01/2019 | | | 179,656 | |
| | | | | 714,000 | | | 3.81%, 11/01/2024 | | | 703,787 | |
| | | | | 1,353,000 | | | 4.50%, 11/01/2042 | | | 1,305,364 | |
| | | | | 1,770,000 | | | Humana, Inc.
2.90%, 12/15/2022 | | | 1,719,640 | |
| | | | | 521,000 | | | Kaiser Foundation Hospitals
3.50%, 04/01/2022 | | | 525,642 | |
| | | | | 2,000,000 | | | Mercy Health
3.56%, 08/01/2027 | | | 1,950,612 | |
| | | | | | | | Orlando Health OBL Group | |
| | | | | 395,000 | | | 3.78%, 10/01/2028 | | | 391,126 | |
| | | | | 105,000 | | | 4.09%, 10/01/2048 | | | 104,246 | |
| | | | | 465,000 | | | Providence St Joseph Health Obligated Group
3.93%, 10/01/2048 | | | 445,618 | |
| | | | | 1,810,000 | | | SSM Health Care Corp.
3.82%, 06/01/2027 | | | 1,803,109 | |
| | | | | 175,000 | | | Stanford Health Care
3.80%, 11/15/2048 | | | 168,019 | |
| | | | | | | | UnitedHealth Group, Inc. | |
| | | | | 920,000 | | | 3.35%, 07/15/2022 | | | 921,306 | |
| | | | | 1,440,000 | | | 3.75%, 07/15/2025 | | | 1,440,240 | |
| | | | | 910,000 | | | 3.85%, 06/15/2028 | | | 911,413 | |
| | | | | | | | | | | | |
| | | | | | | | | | | 15,563,379 | |
| | | | | | | | | | | | |
| | | | | | | Household Products - 0.2% | |
| | | | | 4,183,168 | | | Procter & Gamble Co.
9.36%, 01/01/2021 | | | 4,490,504 | |
| | | | | | | | | | | | |
| | | | | | | Insurance - 0.4% | |
| | | | | 1,000,000 | | | Berkshire Hathaway, Inc.
2.75%, 03/15/2023 | | | 978,613 | |
| | | | | | | | Chubb INA Holdings, Inc. | |
| | | | | 495,000 | | | 2.30%, 11/03/2020 | | | 486,191 | |
| | | | | 840,000 | | | 3.35%, 05/15/2024 | | | 827,746 | |
| | | | | 200,000 | | | Five Corners Funding Trust
4.42%, 11/15/2023(2) | | | 205,783 | |
| | | | | 550,000 | | | Liberty Mutual Group, Inc.
4.25%, 06/15/2023(2) | | | 555,559 | |
| | | | | | | | MetLife, Inc. | |
| | | | | 2,205,000 | | | 3.60%, 04/10/2024 | | | 2,186,886 | |
| | | | | 795,000 | | | 4.88%, 11/13/2043 | | | 839,035 | |
| | | | | 2,220,000 | | | Trinity Acquisition plc
4.40%, 03/15/2026 | | | 2,198,231 | |
| | | | | | | | | | | | |
| | | | | | | | | | | 8,278,044 | |
| | | | | | | | | | | | |
| | | | | | | Internet - 0.3% | |
| | | | | | | | Alibaba Group Holding Ltd. | |
| | | | | 200,000 | | | 2.50%, 11/28/2019 | | | 198,665 | |
| | | | | 1,775,000 | | | 3.40%, 12/06/2027 | | | 1,653,836 | |
| | | | | 1,045,000 | | | 3.60%, 11/28/2024 | | | 1,028,199 | |
| | | | | | | | | | | | |
| Shares or Principal Amount | | Market Value† | |
| CORPORATE BONDS - 18.9% - (continued) | |
| | | | | | | Internet - 0.3% - (continued) | |
| | | | | | | | Amazon.com, Inc. | |
| | $ | | | | 1,250,000 | | | 2.50%, 11/29/2022 | | $ | 1,213,118 | |
| | | | | 475,000 | | | 4.25%, 08/22/2057 | | | 468,366 | |
| | | | | 1,020,000 | | | 4.80%, 12/05/2034 | | | 1,117,554 | |
| | | | | 480,000 | | | 4.95%, 12/05/2044 | | | 532,654 | |
| | | | | 1,095,000 | | | Tencent Holdings Ltd.
3.60%, 01/19/2028(2) | | | 1,035,892 | |
| | | | | | | | | | | | |
| | | | | | | | | | | 7,248,284 | |
| | | | | | | | | | | | |
| | | | | | | IT Services - 0.1% | |
| | | | | | | | Apple, Inc. | |
| | | | | 80,000 | | | 2.45%, 08/04/2026 | | | 73,427 | |
| | | | | 546,000 | | | 3.25%, 02/23/2026 | | | 532,948 | |
| | | | | 1,360,000 | | | 3.45%, 05/06/2024 | | | 1,359,865 | |
| | | | | | | | | | | | |
| | | | | | | | | | | 1,966,240 | |
| | | | | | | | | | | | |
| | | | Lodging - 0.1% | |
| | | | | 1,900,000 | | | Marriott International, Inc.
2.88%, 03/01/2021 | | | 1,873,621 | |
| | | | | | | | | | | | |
| | | | Machinery - Construction & Mining - 0.1% | |
| | | | | 1,500,000 | | | Caterpillar Financial Services Corp.
3.30%, 06/09/2024 | | | 1,490,070 | |
| | | | | | | | | | | | |
| | | | Media - 0.8% | |
| | | | 21st Century Fox America, Inc. | |
| | | | | 385,000 | | | 4.00%, 10/01/2023 | | | 390,033 | |
| | | | | 1,275,000 | | | 4.50%, 02/15/2021 | | | 1,309,629 | |
| | | | Charter Communications Operating LLC / Charter Communications Operating Capital | | | | |
| | | | | 485,000 | | | 5.38%, 05/01/2047 | | | 440,427 | |
| | | | | 150,000 | | | 6.48%, 10/23/2045 | | | 158,105 | |
| | | | | 2,050,000 | | | Comcast Corp.
4.40%, 08/15/2035 | | | 1,994,634 | |
| | | | Cox Communications, Inc. | |
| | | | | 80,000 | | | 4.60%, 08/15/2047(2) | | | 73,107 | |
| | | | | 2,320,000 | | | 4.80%, 02/01/2035(2) | | | 2,136,373 | |
| | | | Sky plc | |
| | | | | 1,265,000 | | | 2.63%, 09/16/2019(2) | | | 1,256,068 | |
| | | | | 2,386,000 | | | 3.75%, 09/16/2024(2) | | | 2,372,219 | |
| | | | Time Warner Cable LLC | |
| | | | | 395,000 | | | 6.55%, 05/01/2037 | | | 419,041 | |
| | | | | 250,000 | | | 7.30%, 07/01/2038 | | | 283,377 | |
| | | | | 480,000 | | | 8.25%, 04/01/2019 | | | 497,874 | |
| | | | | 40,000 | | | 8.75%, 02/14/2019 | | | 41,335 | |
| | | | | 130,000 | | | Time Warner Entertainment Co., L.P.
8.38%, 03/15/2023 | | | 151,278 | |
| | | | Viacom, Inc. | |
| | | | | 835,000 | | | 3.88%, 12/15/2021 | | | 833,457 | |
| | | | | 2,175,000 | | | 4.25%, 09/01/2023 | | | 2,162,583 | |
| | | | | 2,325,000 | | | Warner Media LLC
3.60%, 07/15/2025 | | | 2,210,652 | |
| | | | | | | | | | | | |
| | | | | | | | | | | 16,730,192 | |
| | | | | | | | | | | | |
| | | | Mining - 0.1% | |
| | | | | 1,575,000 | | | Glencore Finance Canada Ltd.
4.25%, 10/25/2022(2) | | | 1,592,782 | |
| | | | | | | | | | | | |
| | | | Oil & Gas - 1.3% | |
| | | | | 1,665,000 | | | Anadarko Petroleum Corp.
4.85%, 03/15/2021 | | | 1,713,462 | |
| | | | | 1,200,000 | | | BG Energy Capital plc
4.00%, 10/15/2021(2) | | | 1,219,504 | |
The accompanying notes are an integral part of these financial statements.
|
| Hartford Balanced HLS Fund |
Schedule of Investments – (continued)
June 30, 2018 (Unaudited)
| | | | | | | | | | | | |
| Shares or Principal Amount | | Market Value† | |
| CORPORATE BONDS - 18.9% - (continued) | |
| | | | Oil & Gas - 1.3% - (continued) | |
| | | | BP Capital Markets plc | |
| | $ | | | | 655,000 | | | 3.25%, 05/06/2022 | | $ | 652,937 | |
| | | | | 140,000 | | | 3.99%, 09/26/2023 | | | 143,163 | |
| | | | | 2,850,000 | | | 4.75%, 03/10/2019 | | | 2,891,231 | |
| | | | ConocoPhillips Co. | |
| | | | | 75,000 | | | 4.30%, 11/15/2044 | | | 76,300 | |
| | | | | 130,000 | | | 4.95%, 03/15/2026 | | | 140,111 | |
| | | | Equinor ASA | |
| | | | | 340,000 | | | 2.25%, 11/08/2019 | | | 337,563 | |
| | | | | 160,000 | | | 2.45%, 01/17/2023 | | | 154,294 | |
| | | | | 495,000 | | | 2.75%, 11/10/2021 | | | 488,208 | |
| | | | | 1,850,000 | | | 2.90%, 11/08/2020 | | | 1,845,744 | |
| | | | | 210,000 | | | 3.25%, 11/10/2024 | | | 206,775 | |
| | | | | 45,000 | | | 3.70%, 03/01/2024 | | | 45,415 | |
| | | | | 920,000 | | | Marathon Oil Corp.
2.70%, 06/01/2020 | | | 906,081 | |
| | | | | 1,231,000 | | | Noble Energy, Inc.
4.15%, 12/15/2021 | | | 1,250,731 | |
| | | | Petroleos Mexicanos | |
| | | | | 40,000 | | | 5.38%, 03/13/2022 | | | 41,020 | |
| | | | | 2,900,000 | | | 5.50%, 01/21/2021 | | | 2,985,521 | |
| | | | | 670,000 | | | 6.35%, 02/12/2048(2) | | | 604,675 | |
| | | | | 2,425,000 | | | 6.75%, 09/21/2047 | | | 2,286,532 | |
| | | | | 3,540,000 | | | Pioneer Natural Resources Co.
7.50%, 01/15/2020 | | | 3,764,594 | |
| | | | Shell International Finance B.V. | |
| | | | | 691,000 | | | 3.25%, 05/11/2025 | | | 677,054 | |
| | | | | 500,000 | | | 4.38%, 03/25/2020 | | | 513,004 | |
| | | | | 3,950,000 | | | Sinopec Group Overseas Development Ltd.
2.50%, 04/28/2020(2) | | | 3,892,123 | |
| | | | | 1,375,000 | | | Total Capital International S.A.
2.70%, 01/25/2023 | | | 1,337,958 | |
| | | | | | | | | | | | |
| | | | | | | | | | | 28,174,000 | |
| | | | | | | | | | | | |
| | | | Oil & Gas Services - 0.0% | |
| | | | | 940,000 | | | Schlumberger Holdings Corp.
3.00%, 12/21/2020(2) | | | 934,363 | |
| | | | | | | | | | | | |
| | | | Pharmaceuticals - 1.2% | |
| | | | Allergan Funding SCS | |
| | | | | 1,195,000 | | | 3.00%, 03/12/2020 | | | 1,189,337 | |
| | | | | 645,000 | | | 3.45%, 03/15/2022 | | | 634,672 | |
| | | | | 1,950,000 | | | 3.80%, 03/15/2025 | | | 1,893,538 | |
| | | | | 770,000 | | | 4.55%, 03/15/2035 | | | 728,538 | |
| | | | | 20,000 | | | 4.75%, 03/15/2045 | | | 19,253 | |
| | | | | 600,000 | | | 4.85%, 06/15/2044 | | | 579,538 | |
| | | | Allergan Sales LLC | |
| | | | | 142,000 | | | 4.88%, 02/15/2021(2) | | | 146,153 | |
| | | | | 800,000 | | | 5.00%, 12/15/2021(2) | | | 827,717 | |
| | | | Bayer U.S. Finance LLC | |
| | | | | 260,000 | | | 2.38%, 10/08/2019(2) | | | 257,785 | |
| | | | | 1,230,000 | | | 4.25%, 12/15/2025(2) | | | 1,236,582 | |
| | | | Cardinal Health, Inc. | |
| | | | | 990,000 | | | 2.40%, 11/15/2019 | | | 979,739 | |
| | | | | 445,000 | | | 3.08%, 06/15/2024 | | | 419,250 | |
| | | | | 880,000 | | | 3.50%, 11/15/2024 | | | 845,867 | |
| | | | | 785,000 | | | 4.50%, 11/15/2044 | | | 708,663 | |
| | | | | 3,130,000 | | | CVS Health Corp.
4.10%, 03/25/2025 | | | 3,113,415 | |
| | | | | 2,015,000 | | | EMD Finance LLC
2.95%, 03/19/2022(2) | | | 1,969,709 | |
| | | | | | | | | | | | |
| Shares or Principal Amount | | Market Value† | |
| CORPORATE BONDS - 18.9% - (continued) | |
| | | | Pharmaceuticals - 1.2% - (continued) | |
| | $ | | | | 1,525,000 | | | Express Scripts Holding Co.
2.25%, 06/15/2019 | | $ | 1,513,944 | |
| | | | McKesson Corp. | |
| | | | | 100,000 | | | 2.85%, 03/15/2023 | | | 95,642 | |
| | | | | 650,000 | | | 3.80%, 03/15/2024 | | | 641,601 | |
| | | | Merck & Co., Inc. | |
| | | | | 1,960,000 | | | 2.75%, 02/10/2025 | | | 1,873,748 | |
| | | | | 1,640,000 | | | 2.80%, 05/18/2023 | | | 1,604,789 | |
| | | | | 325,000 | | | Mylan N.V.
3.95%, 06/15/2026 | | | 310,374 | |
| | | | Mylan, Inc. | |
| | | | | 1,025,000 | | | 4.55%, 04/15/2028(2) | | | 1,001,687 | |
| | | | | 455,000 | | | 5.20%, 04/15/2048(2) | | | 437,503 | |
| | | | | 755,000 | | | Teva Pharmaceutical Finance Co. B.V.
3.65%, 11/10/2021 | | | 723,063 | |
| | | | | 3,665,000 | | | Teva Pharmaceutical Finance Netherlands B.V.
2.80%, 07/21/2023 | | | 3,165,644 | |
| | | | | | | | | | | | |
| | | | | | | | | | | 26,917,751 | |
| | | | | | | | | | | | |
| | | | Pipelines - 0.6% | |
| | | | | 235,000 | | | Andeavor Logistics L.P. / Tesoro Logistics Finance Corp.
3.50%, 12/01/2022 | | | 229,613 | |
| | | | Energy Transfer Partners LP | |
| | | | | 375,000 | | | 4.50%, 11/01/2023 | | | 377,212 | |
| | | | | 872,000 | | | 7.60%, 02/01/2024 | | | 982,272 | |
| | | | | 2,395,000 | | | EQT Midstream Partners L.P.
4.75%, 07/15/2023 | | | 2,391,141 | |
| | | | | 1,840,000 | | | MPLX L.P.
4.00%, 03/15/2028 | | | 1,749,980 | |
| | | | | 2,425,000 | | | Phillips 66 Partners L.P.
3.61%, 02/15/2025 | | | 2,312,399 | |
| | | | Sunoco Logistics Partners Operations L.P. | |
| | | | | 1,200,000 | | | 3.90%, 07/15/2026 | | | 1,123,270 | |
| | | | | 509,000 | | | 4.40%, 04/01/2021 | | | 517,144 | |
| | | | | 800,000 | | | 5.35%, 05/15/2045 | | | 728,258 | |
| | | | | 2,470,000 | | | Western Gas Partners L.P.
4.00%, 07/01/2022 | | | 2,441,070 | |
| | | | | | | | | | | | |
| | | | | | | | | | | 12,852,359 | |
| | | | | | | | | | | | |
| | | | Real Estate - 0.1% | |
| | | | WEA Finance LLC / Westfield UK & Europe Finance plc | |
| | | | | 730,000 | | | 2.70%, 09/17/2019(2) | | | 726,973 | |
| | | | | 1,400,000 | | | 3.25%, 10/05/2020(2) | | | 1,397,215 | |
| | | | | | | | | | | | |
| | | | | | | | | | | 2,124,188 | |
| | | | | | | | | | | | |
| | | | Real Estate Investment Trusts - 0.5% | |
| | | | American Tower Corp. | |
| | | | | 975,000 | | | 3.45%, 09/15/2021 | | | 970,962 | |
| | | | | 375,000 | | | 4.40%, 02/15/2026 | | | 372,314 | |
| | | | | 1,110,000 | | | 5.00%, 02/15/2024 | | | 1,151,108 | |
| | | | | 760,000 | | | AvalonBay Communities, Inc.
3.63%, 10/01/2020 | | | 765,830 | |
| | | | | 1,950,000 | | | Brandywine Operating Partnership L.P.
3.95%, 11/15/2027 | | | 1,852,699 | |
| | | | Crown Castle International Corp. | |
| | | | | 635,000 | | | 3.65%, 09/01/2027 | | | 590,650 | |
| | | | | 525,000 | | | 3.80%, 02/15/2028 | | | 492,103 | |
| | | | | 2,960,000 | | | HCP, Inc.
4.00%, 06/01/2025 | | | 2,896,655 | |
The accompanying notes are an integral part of these financial statements.
|
| Hartford Balanced HLS Fund |
Schedule of Investments – (continued)
June 30, 2018 (Unaudited)
| | | | | | | | | | | | |
| Shares or Principal Amount | | Market Value† | |
| CORPORATE BONDS - 18.9% - (continued) | |
| | | | Real Estate Investment Trusts - 0.5% - (continued) | |
| | $ | | | | 1,735,000 | | | Scentre Group Trust
2.38%, 11/05/2019(2) | | $ | 1,713,060 | |
| | | | | | | | | | | | |
| | | | | | | | | | | 10,805,381 | |
| | | | | | | | | | | | |
| | | | Retail - 0.2% | |
| | | | CVS Health Corp. | |
| | | | | 2,100,000 | | | 4.00%, 12/05/2023 | | | 2,108,739 | |
| | | | | 685,000 | | | 4.88%, 07/20/2035 | | | 688,255 | |
| | | | | 600,000 | | | 5.13%, 07/20/2045 | | | 607,968 | |
| | | | | 850,000 | | | Lowe’s Cos., Inc.
4.63%, 04/15/2020 | | | 869,122 | |
| | | | | | | | | | | | |
| | | | | | | | | | | 4,274,084 | |
| | | | | | | | | | | | |
| | | | Semiconductors - 0.1% | |
| | | | | 1,855,000 | | | Broadcom Corp. / Broadcom Cayman Finance Ltd.
3.63%, 01/15/2024 | | | 1,795,655 | |
| | | | | 810,000 | | | Microchip Technology, Inc.
3.92%, 06/01/2021(2) | | | 811,345 | |
| | | | | | | | | | | | |
| | | | | | | | | | | 2,607,000 | |
| | | | | | | | | | | | |
| | | | Software - 0.2% | |
| | | | Microsoft Corp. | |
| | | | | 1,605,000 | | | 2.40%, 08/08/2026 | | | 1,484,699 | |
| | | | | 1,000,000 | | | 3.70%, 08/08/2046 | | | 972,486 | |
| | | | | 2,300,000 | | | Oracle Corp.
3.25%, 11/15/2027 | | | 2,199,205 | |
| | | | | | | | | | | | |
| | | | | | | | | | | 4,656,390 | |
| | | | | | | | | | | | |
| | | | Telecommunications - 0.8% | |
| | | | America Movil S.A.B. de C.V. | |
| | | | | 635,000 | | | 3.13%, 07/16/2022 | | | 624,089 | |
| | | | | 390,000 | | | 6.13%, 03/30/2040 | | | 456,655 | |
| | | | AT&T, Inc. | |
| | | | | 355,000 | | | 3.95%, 01/15/2025 | | | 347,200 | |
| | | | | 800,000 | | | 4.10%, 02/15/2028(2) | | | 764,458 | |
| | | | | 2,185,000 | | | 4.45%, 04/01/2024 | | | 2,205,887 | |
| | | | | 1,240,000 | | | 4.50%, 03/09/2048 | | | 1,068,991 | |
| | | | | 715,000 | | | GTP Acquisition Partners I LLC
2.35%, 06/15/2045(2) | | | 701,552 | |
| | | | Orange S.A. | |
| | | | | 2,200,000 | | | 4.13%, 09/14/2021 | | | 2,248,164 | |
| | | | | 576,000 | | | 9.00%, 03/01/2031 | | | 790,417 | |
| | | | | 2,440,000 | | | Sprint Spectrum Co. LLC / Sprint Spectrum Co. II LLC / Sprint Spectrum Co. III LLC
4.74%, 03/20/2025(2) | | | 2,421,212 | |
| | | | Verizon Communications, Inc. | |
| | | | | 2,300,000 | | | 2.95%, 03/15/2022(9) | | | 2,257,355 | |
| | | | | 2,486,000 | | | 4.52%, 09/15/2048 | | | 2,266,513 | |
| | | | | 715,000 | | | 4.75%, 11/01/2041 | | | 682,189 | |
| | | | | 283,000 | | | 4.81%, 03/15/2039 | | | 273,648 | |
| | | | | | | | | | | | |
| | | | | | | | | | | 17,108,330 | |
| | | | | | | | | | | | |
| | | | Transportation - 0.3% | |
| | | | | 1,435,000 | | | FedEx Corp.
5.10%, 01/15/2044 | | | 1,504,473 | |
| | | | Penske Truck Leasing Co. L.P. / PTL Finance Corp. | |
| | | | | 1,685,000 | | | 3.20%, 07/15/2020(2) | | | 1,680,848 | |
| | | | | 1,100,000 | | | 3.38%, 02/01/2022(2) | | | 1,084,215 | |
| | | | | 1,525,000 | | | 3.95%, 03/10/2025(2) | | | 1,507,215 | |
| | | | | | | | | | | | |
| | | | | | | | | | | 5,776,751 | |
| | | | | | | | | | | | |
| | | | | | | | | | | | |
| Shares or Principal Amount | | Market Value† | |
| CORPORATE BONDS - 18.9% - (continued) | |
| | | | Water - 0.0% | |
| | $ | | | | 625,000 | | | American Water Capital Corp.
2.95%, 09/01/2027 | | $ | 588,768 | |
| | | | | | | | | | | | |
| | | |
| | | | | | | | Total Corporate Bonds
(cost $422,210,984) | | $ | 416,928,834 | |
| | | | | | | | | | | | |
| | | |
| | | | | | | | | | | | |
| FOREIGN GOVERNMENT OBLIGATIONS - 0.8% | |
| | | | Mexico - 0.1% | |
| | | | Mexico Government International Bond | |
| | | | | 1,674,000 | | | 4.00%, 10/02/2023 | | $ | 1,679,022 | |
| | | | | 150,000 | | | 4.75%, 03/08/2044 | | | 139,183 | |
| | | | | | | | | | | | |
| | | | | | | | | | | 1,818,205 | |
| | | | | | | | | | | | |
| | | | Qatar - 0.4% | |
| | | | Qatar Government International Bond | |
| | | | | 4,990,000 | | | 2.38%, 06/02/2021(2) | | | 4,815,849 | |
| | | | | 1,680,000 | | | 3.88%, 04/23/2023(2) | | | 1,678,777 | |
| | | | | 645,000 | | | 5.10%, 04/23/2048(2) | | | 643,039 | |
| | | | | 2,635,000 | | | 5.25%, 01/20/2020(2) | | | 2,712,670 | |
| | | | | | | | | | | | |
| | | | | | | | | | | 9,850,335 | |
| | | | | | | | | | | | |
| | | | Saudi Arabia - 0.2% | |
| | | | Saudi Government International Bond | |
| | | | | 935,000 | | | 2.38%, 10/26/2021(2) | | | 897,787 | |
| | | | | 1,680,000 | | | 2.88%, 03/04/2023(2) | | | 1,615,999 | |
| | | | | 760,000 | | | 4.00%, 04/17/2025(2) | | | 756,245 | |
| | | | | | | | | | | | |
| | | | | | | | | | | 3,270,031 | |
| | | | | | | | | | | | |
| | | | South Korea - 0.1% | |
| | | | | 2,300,000 | | | Export-Import Bank of Korea
1.75%, 05/26/2019 | | | 2,273,976 | |
| | | | | | | | | | | | |
| | | |
| | | | | | | | Total Foreign Government Obligations
(cost $17,450,412) | | $ | 17,212,547 | |
| | | | | | | | | | | | |
| | | |
| | | | | | | | | | | | |
| MUNICIPAL BONDS - 1.1% | |
| | | | General - 0.3% | |
| | | | Chicago, IL, Transit Auth | |
| | | | | 265,000 | | | 6.30%, 12/01/2021 | | $ | 279,493 | |
| | | | | 1,985,000 | | | 6.90%, 12/01/2040 | | | 2,582,922 | |
| | | | | 365,000 | | | City of Sacramento, CA
6.42%, 08/01/2023 | | | 414,388 | |
| | | | | 1,345,000 | | | Kansas, Development FA
4.93%, 04/15/2045 | | | 1,473,918 | |
| | | | | 2,895,000 | | | New York State Urban Development Corp.
2.10%, 03/15/2022 | | | 2,844,743 | |
| | | | | 600,000 | | | San Jose Redev. Agcy. Successor Agcy.
3.38%, 08/01/2034 | | | 574,098 | |
| | | | | | | | | | | | |
| | | | | | | | | | | 8,169,562 | |
| | | | | | | | | | | | |
| | | | General Obligation - 0.4% | |
| | | | California State, GO Taxable | |
| | | | | 620,000 | | | 7.35%, 11/01/2039 | | | 882,551 | |
| | | | | 940,000 | | | 7.55%, 04/01/2039 | | | 1,386,162 | |
| | | | | 685,000 | | | Chicago, IL, Metropolitan Water Reclamation, GO
5.72%, 12/01/2038 | | | 847,838 | |
| | | | | 3,780,000 | | | Illinois State, GO
5.10%, 06/01/2033 | | | 3,577,241 | |
| | | | | 2,065,000 | | | State of Connecticut, GO
2.99%, 01/15/2023 | | | 2,019,363 | |
| | | | | | | | | | | | |
| | | | | | | | | | | 8,713,155 | |
| | | | | | | | | | | | |
The accompanying notes are an integral part of these financial statements.
|
| Hartford Balanced HLS Fund |
Schedule of Investments – (continued)
June 30, 2018 (Unaudited)
| | | | | | | | | | | | |
| Shares or Principal Amount | | Market Value† | |
| MUNICIPAL BONDS - 1.1% - (continued) | |
| | | | Medical - 0.1% | |
| | $ | | | | 840,000 | | | University of California, Regents MedCenter Pooled, Rev
6.58%, 05/15/2049 | | $ | 1,126,045 | |
| | | | | | | | | | | | |
| | | | Power - 0.0% | |
| | | | | 485,000 | | | New York, Utility Debt Securitization Auth
3.44%, 12/15/2025 | | | 488,671 | |
| | | | | | | | | | | | |
| | | | Transportation - 0.2% | |
| | | | | 1,875,000 | | | Illinois State Toll Highway Auth, Taxable Rev
6.18%, 01/01/2034 | | | 2,340,900 | |
| | | | New York and New Jersey PA, Taxable Rev | |
| | | | | 320,000 | | | 4.81%, 10/15/2065 | | | 360,134 | |
| | | | | 570,000 | | | 6.04%, 12/01/2029 | | | 688,811 | |
| | | | | 645,000 | | | North Texas Tollway Auth, Rev
6.72%, 01/01/2049 | | | 915,694 | |
| | | | | | | | | | | | |
| | | | | | | | | | | 4,305,539 | |
| | | | | | | | | | | | |
| | | | Utility - Electric - 0.1% | |
| | | | | 1,294,000 | | | Municipal Electric Auth Georgia
6.64%, 04/01/2057 | | | 1,636,121 | |
| | | | | | | | | | | | |
| | | |
| | | | | | | | Total Municipal Bonds
(cost $22,515,892) | | $ | 24,439,093 | |
| | | | | | | | | | | | |
| | | |
| | | | | | | | | | | | |
| U.S. GOVERNMENT AGENCIES - 0.3% | |
| | | | Mortgage-Backed Agencies - 0.3% | |
| | | | FHLMC - 0.0% | |
| | $ | | | | 28,430 | | | 1 year CMT + 2.249%, 3.83%, 04/01/2029(5) | | $ | 29,506 | |
| | | | | 31,683 | | | 4.00%, 03/01/2041 | | | 32,573 | |
| | | | | | | | | | | | |
| | | | | | | | | | | 62,079 | |
| | | | | | | | | | | | |
| | | | FNMA - 0.1% | |
| | $ | | | | 1,086,617 | | | 1 mo. USD LIBOR + 0.400%,
2.35%, 10/25/2024(5) | | $ | 1,088,470 | |
| | | | | 65,452 | | | 4.50%, 11/01/2023 | | | 68,203 | |
| | | | | 133,741 | | | 4.50%, 03/01/2038 | | | 140,661 | |
| | | | | 78,556 | | | 4.50%, 11/01/2039 | | | 82,607 | |
| | | | | 49,173 | | | 4.50%, 04/01/2040 | | | 51,737 | |
| | | | | 125,156 | | | 4.50%, 08/01/2040 | | | 131,684 | |
| | | | | 45,318 | | | 4.50%, 02/01/2041 | | | 47,673 | |
| | | | | 592,153 | | | 4.50%, 04/01/2041 | | | 623,013 | |
| | | | | 355,243 | | | 4.50%, 06/01/2041 | | | 372,125 | |
| | | | | 531,902 | | | 4.50%, 07/01/2041 | | | 559,102 | |
| | | | | 196,867 | | | 4.50%, 09/01/2041 | | | 206,729 | |
| | | | | 94,479 | | | 4.50%, 07/01/2044 | | | 98,960 | |
| | | | | 497 | | | 5.00%, 02/01/2019 | | | 506 | |
| | | | | 8,742 | | | 5.00%, 04/01/2019 | | | 8,891 | |
| | | | | | | | | | | | |
| | | | | | | | | | | 3,480,361 | |
| | | | | | | | | | | | |
| | | | GNMA - 0.2% | |
| | | | | 96,873 | | | 5.00%, 07/15/2037 | | | 103,222 | |
| | | | | 13,353 | | | 6.00%, 06/15/2024 | | | 14,597 | |
| | | | | 5,569 | | | 6.00%, 07/15/2026 | | | 6,087 | |
| | | | | 6,686 | | | 6.00%, 01/15/2028 | | | 7,308 | |
| | | | | 2,227 | | | 6.00%, 03/15/2028 | | | 2,456 | |
| | | | | 49,420 | | | 6.00%, 04/15/2028 | | | 54,067 | |
| | | | | 90,061 | | | 6.00%, 05/15/2028 | | | 98,451 | |
| | | | | 19,828 | | | 6.00%, 06/15/2028 | | | 21,675 | |
| | | | | 50,974 | | | 6.00%, 07/15/2028 | | | 55,723 | |
| | | | | 17,987 | | | 6.00%, 08/15/2028 | | | 19,663 | |
| | | | | 47,023 | | | 6.00%, 09/15/2028 | | | 51,404 | |
| | | | | | | | | | | | |
| Shares or Principal Amount | | Market Value† | |
| U.S. GOVERNMENT AGENCIES - 0.3% - (continued) | |
| | | | GNMA - 0.2% - (continued) | |
| | $ | | | | 106,511 | | | 6.00%, 10/15/2028 | | $ | 116,299 | |
| | | | | 109,035 | | | 6.00%, 11/15/2028 | | | 119,193 | |
| | | | | 121,893 | | | 6.00%, 12/15/2028 | | | 133,247 | |
| | | | | 3,167 | | | 6.00%, 12/15/2031 | | | 3,512 | |
| | | | | 27,948 | | | 6.00%, 09/15/2032 | | | 31,827 | |
| | | | | 9,355 | | | 6.00%, 11/15/2032 | | | 10,553 | |
| | | | | 2,012 | | | 6.00%, 04/15/2033 | | | 2,199 | |
| | | | | 89,905 | | | 6.00%, 06/15/2033 | | | 99,635 | |
| | | | | 37,461 | | | 6.00%, 10/15/2033 | | | 41,410 | |
| | | | | 4,930 | | | 6.00%, 11/15/2033 | | | 5,446 | |
| | | | | 70,779 | | | 6.00%, 10/15/2034 | | | 77,478 | |
| | | | | 59,174 | | | 6.00%, 01/15/2035 | | | 64,687 | |
| | | | | 7,496 | | | 6.00%, 05/15/2035 | | | 8,194 | |
| | | | | 11,650 | | | 6.00%, 06/15/2035 | | | 12,735 | |
| | | | | 706 | | | 6.50%, 03/15/2026 | | | 778 | |
| | | | | 4,843 | | | 6.50%, 01/15/2028 | | | 5,340 | |
| | | | | 59,141 | | | 6.50%, 03/15/2028 | | | 65,219 | |
| | | | | 113,758 | | | 6.50%, 04/15/2028 | | | 125,449 | |
| | | | | 36,593 | | | 6.50%, 05/15/2028 | | | 40,353 | |
| | | | | 182,346 | | | 6.50%, 06/15/2028 | | | 201,087 | |
| | | | | 6,917 | | | 6.50%, 10/15/2028 | | | 7,628 | |
| | | | | 3,176 | | | 6.50%, 02/15/2035 | | | 3,550 | |
| | | | | 19,417 | | | 7.00%, 11/15/2031 | | | 21,417 | |
| | | | | 9,682 | | | 7.00%, 03/15/2032 | | | 10,713 | |
| | | | | 1,238,571 | | | 7.00%, 11/15/2032 | | | 1,434,438 | |
| | | | | 171,365 | | | 7.00%, 01/15/2033 | | | 195,498 | |
| | | | | 181,670 | | | 7.00%, 05/15/2033 | | | 206,352 | |
| | | | | 33,853 | | | 7.00%, 07/15/2033 | | | 38,091 | |
| | | | | 218,177 | | | 7.00%, 11/15/2033 | | | 248,036 | |
| | | | | 86,880 | | | 7.50%, 09/16/2035 | | | 96,825 | |
| | | | | 176 | | | 8.00%, 09/15/2026 | | | 190 | |
| | | | | 119 | | | 8.00%, 11/15/2026 | | | 128 | |
| | | | | 10,016 | | | 8.00%, 12/15/2026 | | | 11,303 | |
| | | | | 142 | | | 8.00%, 09/15/2027 | | | 147 | |
| | | | | 6,626 | | | 8.00%, 07/15/2029 | | | 7,609 | |
| | | | | 2,927 | | | 8.00%, 11/15/2029 | | | 2,935 | |
| | | | | 15,261 | | | 8.00%, 12/15/2029 | | | 15,869 | |
| | | | | 4,206 | | | 8.00%, 01/15/2030 | | | 4,310 | |
| | | | | 5,993 | | | 8.00%, 02/15/2030 | | | 6,129 | |
| | | | | 905 | | | 8.00%, 03/15/2030 | | | 916 | |
| | | | | 52,578 | | | 8.00%, 04/15/2030 | | | 53,096 | |
| | | | | 5,386 | | | 8.00%, 05/15/2030 | | | 5,562 | |
| | | | | 39,372 | | | 8.00%, 06/15/2030 | | | 41,373 | |
| | | | | 2,276 | | | 8.00%, 07/15/2030 | | | 2,363 | |
| | | | | 70,311 | | | 8.00%, 08/15/2030 | | | 71,936 | |
| | | | | 16,008 | | | 8.00%, 09/15/2030 | | | 16,390 | |
| | | | | 8,499 | | | 8.00%, 11/15/2030 | | | 8,635 | |
| | | | | 140,264 | | | 8.00%, 12/15/2030 | | | 153,589 | |
| | | | | 257 | | | 8.00%, 02/15/2031 | | | 267 | |
| | | | | 4,470 | | | 9.00%, 06/15/2022 | | | 4,516 | |
| | | | | | | | | | | | |
| | | | | | | | | | | 4,269,105 | |
| | | | | | | | | | | | |
| | | | | | | | | | | 7,811,545 | |
| | | | | | | | | | | | |
| | | |
| | | | | | | | Total U.S. Government Agencies
(cost $7,473,156) | | $ | 7,811,545 | |
| | | | | | | | | | | | |
| | | |
| | | | | | | | | | | | |
The accompanying notes are an integral part of these financial statements.
|
| Hartford Balanced HLS Fund |
Schedule of Investments – (continued)
June 30, 2018 (Unaudited)
| | | | | | | | | | | | |
| Shares or Principal Amount | | Market Value† | |
| U.S. GOVERNMENT SECURITIES - 6.6% | |
| | | | U.S. Treasury Securities - 6.6% | |
| | | | U.S. Treasury Bonds - 3.7% | |
| | $ | | | | 19,450,000 | | | 2.50%, 02/15/2045(10) | | $ | 17,733,689 | |
| | | | | 2,280,000 | | | 2.50%, 05/15/2046 | | | 2,071,772 | |
| | | | | 2,705,000 | | | 2.75%, 08/15/2047 | | | 2,581,267 | |
| | | | | 6,964,000 | | | 2.75%, 11/15/2047 | | | 6,645,179 | |
| | | | | 10,450,800 | | | 2.88%, 05/15/2043 | | | 10,268,727 | |
| | | | | 410,000 | | | 3.00%, 02/15/2047 | | | 411,474 | |
| | | | | 480,000 | | | 3.00%, 05/15/2047 | | | 481,406 | |
| | | | | 2,755,000 | | | 3.00%, 02/15/2048 | | | 2,764,255 | |
| | | | | 8,195,000 | | | 3.13%, 08/15/2044 | | | 8,414,921 | |
| | | | | 10,000 | | | 3.13%, 05/15/2048 | | | 10,278 | |
| | | | | 4,630,000 | | | 3.38%, 05/15/2044 | | | 4,961,877 | |
| | | | | 21,300,000 | | | 4.38%, 02/15/2038 | | | 25,960,207 | |
| | | | | | | | | | | | |
| | | | | | | | | | | 82,305,052 | |
| | | | | | | | | | | | |
| | | | U.S. Treasury Notes - 2.9% | |
| | | | | 23,152,588 | | | 0.38%, 01/15/2027(11) | | | 22,495,073 | |
| | | | | 7,886,134 | | | 0.50%, 01/15/2028(11) | | | 7,715,272 | |
| | | | | 31,125,000 | | | 1.50%, 03/31/2023 | | | 29,436,226 | |
| | | | | 1,395,000 | | | 2.13%, 12/31/2022 | | | 1,359,961 | |
| | | | | 550,000 | | | 2.25%, 08/15/2027 | | | 523,467 | |
| | | | | 1,900,000 | | | 2.75%, 05/31/2023 | | | 1,902,375 | |
| | | | | | | | | | | | |
| | | | | | | | | | | 63,432,374 | |
| | | | | | | | | | | | |
| | | | | | | | | | | 145,737,426 | |
| | | | | | | | | | | | |
| | | |
| | | | | | | | Total U.S. Government Securities
(cost $142,744,877) | | $ | 145,737,426 | |
| | | | | | | | | | | | |
| | |
| | | | Total Long-Term Investments
(cost $1,802,006,505) | | $ | 2,196,626,545 | |
| | | | | | | | | | | | |
| | | |
| | | | | | | | | | | | |
| SHORT-TERM INVESTMENTS - 0.5% | |
| | | | Other Investment Pools & Funds - 0.4% | |
| | | | | 8,899,815 | | | Morgan Stanley Institutional Liquidity Funds, Government Portfolio, Institutional Class, 1.84%(12) | | | 8,899,815 | |
| | | | | | | | | | | | |
| | | | | | | | | | | | |
| Shares or Principal Amount | | Market Value† | |
| SHORT-TERM INVESTMENTS - 0.5% - (continued) | |
| | | | Securities Lending Collateral - 0.1% | |
| | | | | 147,199 | | | Citibank NA DDCA,
1.91%, 7/2/2018(12) | | $ | 147,199 | |
| | | | | 994,317 | | | Goldman Sachs Financial Square Funds, Government Institutional Fund,
1.81%(12) | | | 994,317 | |
| | | | | 923,923 | | | Invesco Government & Agency Portfolio,
1.81%(12) | | | 923,923 | |
| | | | | 272,582 | | | Morgan Stanley Institutional Liquidity Funds, Government Portfolio, Institutional Class,
1.84%(12) | | | 272,582 | |
| | | | | 605,952 | | | Western Asset Institutional Government Class A Fund,
1.79%(12) | | | 605,952 | |
| | | | | | | | | | | | |
| | | | | | | | | | | 2,943,973 | |
| | | | | | | | | | | | |
| | | |
| | | | | | | | Total Short-Term Investments
(cost $11,843,788) | | $ | 11,843,788 | |
| | | | | | | | | | | | |
| | | | | | | | | | | | | | | | |
| | | | |
| | | | | | | | Total Investments
(cost $1,813,850,293) | | | 99.9 | % | | $ | 2,208,470,333 | |
| | | | | | | | Other Assets and Liabilities | | | 0.1 | % | | | 2,592,948 | |
| | | | | | | | | | | | | | | | |
| | | | | | | | Total Net Assets | | | 100.0 | % | | $ | 2,211,063,281 | |
| | | | | | | | | | | | | | | | |
The accompanying notes are an integral part of these financial statements.
|
| Hartford Balanced HLS Fund |
Schedule of Investments – (continued)
June 30, 2018 (Unaudited)
| Note: | Percentage of investments as shown is the ratio of the total market value to total net assets. |
| | Prices of foreign equities that are principally traded on certain foreign markets will generally be adjusted daily pursuant to a fair value pricing service approved by the Board of Directors in order to reflect an adjustment for factors occurring after the close of certain foreign markets but before the close of the New York Stock Exchange. |
| | The Fund may refer to any one or more of the industry classifications used by one or more widely recognized market indices, ratings group and/or as defined by Fund management. Industry classifications may not be identical across all security types. |
| | Equity industry classifications used in this report are the Global Industry Classification Standard, which was developed by and is the exclusive property and service mark of MSCI, Inc. and Standard & Poor’s. |
| | For Fund compliance purposes, the Fund may not use the same classification system shown in this report as these classifications are used for financial reporting purposes. |
| (1) | Investment valued using significant unobservable inputs. |
| (2) | Securities issued within terms of a private placement memorandum and exempt from registration under Rule 144A under the Securities Act of 1933, as amended, and may be sold to qualified institutional buyers. Unless otherwise indicated, these holdings are determined to be liquid. At June 30, 2018, the aggregate value of these securities was $193,001,831, which represented 8.7% of total net assets. |
| (3) | These securities are valued in good faith at fair value as determined under policies and procedures established by and under the supervision of the Board of Directors. At June 30, 2018, the aggregate fair value of these securities was $9,020,107, which represented 0.4% of total net assets. This amount excludes securities that are principally traded in certain foreign markets and whose prices are adjusted pursuant to a third party pricing service methodology approved by the Board of Directors. |
| (4) | This security has been identified as illiquid. Illiquid securities are often purchased in private placement transactions, are often not registered under the Securities Act of 1933, as amended, and may have contractual restrictions on resale. A security may also be considered illiquid if the security lacks a readily available market or if its valuation has not changed for a certain period of time. The identification of illiquid securities is unaudited.At June 30, 2018, the aggregate value of these securities was $9,020,107, which represented 0.4% of total net assets. |
| (5) | Variable rate securities; the rate reported is the coupon rate in effect at June 30, 2018. |
| (6) | Variable or floating rate security, which interest rate adjusts periodically based on changes in current interest rates and prepayments on the underlying pool of assets. Rate shown is the rate in effect as of period end. |
| (7) | Security is a “step-up” bond where coupon increases or steps up at a predetermined date. Rate shown is current coupon rate. |
| (8) | Perpetual maturity security. Maturity date shown is the next call date or final legal maturity date, whichever comes first. |
| (9) | Represents entire or partial securities on loan. See Note 8 in the accompanying Notes to Financial Statements for securities lending information. |
| (10) | This security, or a portion of this security, has been pledged as collateral in connection with futures contracts. |
| (11) | The principal amount for these securities are adjusted for inflation and the interest payments equal a fixed percentage of the inflation-adjusted principal amount. |
| (12) | Current yield as of period end. |
| | | | | | | | | | | | | | | | |
| Futures Contracts Outstanding at June 30, 2018 | |
Description | | Number of
Contracts | | | Expiration
Date | | | Current
Notional
Amount | | | Value and
Unrealized
Appreciation/
(Depreciation) | |
Long position contracts: | |
U.S. Treasury 5-Year Note Future | | | 354 | | | | 09/28/2018 | | | $ | 40,220,485 | | | $ | 86,650 | |
| | | | | | | | | | | | | | | | |
Short position contracts: | |
U.S. Treasury 10-Year Note Future | | | 44 | | | | 09/19/2018 | | | $ | 5,288,250 | | | $ | (20,362 | ) |
U.S. Treasury 10-Year Ultra Future | | | 196 | | | | 09/19/2018 | | | | 25,133,938 | | | | 90,001 | |
U.S. Treasury Ultra Bond Future | | | 5 | | | | 09/19/2018 | | | | 797,812 | | | | (9,134 | ) |
| | | | | | | | | | | | | | | | |
Total | | | | | | | | | | | | | | $ | 60,505 | |
| | | | | | | | | | | | | | | | |
Total futures contracts | | | | | | | | | | | | | | $ | 147,155 | |
| | | | | | | | | | | | | | | | |
| † | See Significant Accounting Policies of accompanying Notes to Financial Statements regarding valuation of investments. |
The accompanying notes are an integral part of these financial statements.
|
| Hartford Balanced HLS Fund |
Schedule of Investments – (continued)
June 30, 2018 (Unaudited)
| | |
| GLOSSARY: (abbreviations used in preceding Schedule of Investments) |
|
| Other Abbreviations: |
CMT | | Constant Maturity Treasury Index |
|
| Other Abbreviations: |
ADR | | American Depositary Receipt |
CLO | | Collateralized Loan Obligation |
CMO | | Collateralized Mortgage Obligation |
DDCA | | Dollars on Deposit in Custody Account |
FHLMC | | Federal Home Loan Mortgage Corp. |
FNMA | | Federal National Mortgage Association |
GNMA | | Government National Mortgage Association |
LIBOR | | London Interbank Offered Rate |
REIT | | Real Estate Investment Trust |
| | |
| Municipal Abbreviations: |
FA | | Finance Authority |
GO | | General Obligation |
PA | | Port Authority |
Rev | | Revenue |
The accompanying notes are an integral part of these financial statements.
|
| Hartford Balanced HLS Fund |
Schedule of Investments – (continued)
June 30, 2018 (Unaudited)
Fair Valuation Summary
The following is a summary of the fair valuations according to the inputs used as of June 30, 2018 in valuing the Fund’s investments.
| | | | | | | | | | | | | | | | |
| | | Total | | | Level 1(1) | | | Level 2(1) | | | Level 3(1) | |
Assets | | | | | | | | | | | | | | | | |
Common Stocks | | | | | | | | | | | | | | | | |
Banks | | $ | 145,650,091 | | | $ | 145,650,091 | | | $ | — | | | $ | — | |
Capital Goods | | | 100,377,286 | | | | 100,377,286 | | | | — | | | | — | |
Consumer Durables & Apparel | | | 35,042,934 | | | | 35,042,934 | | | | — | | | | — | |
Consumer Services | | | 28,263,636 | | | | 28,263,636 | | | | — | | | | — | |
Diversified Financials | | | 28,326,920 | | | | 16,090,845 | | | | 12,236,075 | | | | — | |
Energy | | | 107,588,486 | | | | 107,588,486 | | | | — | | | | — | |
Food & Staples Retailing | | | 11,056,677 | | | | 11,056,677 | | | | — | | | | — | |
Food, Beverage & Tobacco | | | 58,625,718 | | | | 43,941,075 | | | | 14,684,643 | | | | — | |
Health Care Equipment & Services | | | 103,275,355 | | | | 86,772,617 | | | | 16,502,738 | | | | — | |
Household & Personal Products | | | 15,681,837 | | | | 15,681,837 | | | | — | | | | — | |
Insurance | | | 48,661,830 | | | | 48,661,830 | | | | — | | | | — | |
Materials | | | 56,156,630 | | | | 56,156,630 | | | | — | | | | — | |
Media | | | 45,776,540 | | | | 45,776,540 | | | | — | | | | — | |
Pharmaceuticals, Biotechnology & Life Sciences | | | 140,686,137 | | | | 101,046,953 | | | | 39,639,184 | | | | — | |
Real Estate | | | 16,844,478 | | | | 16,844,478 | | | | — | | | | — | |
Retailing | | | 95,075,148 | | | | 86,055,041 | | | | — | | | | 9,020,107 | |
Semiconductors & Semiconductor Equipment | | | 98,865,835 | | | | 98,865,835 | | | | — | | | | — | |
Software & Services | | | 199,750,859 | | | | 199,750,859 | | | | — | | | | — | |
Technology Hardware & Equipment | | | 96,663,339 | | | | 77,704,891 | | | | 18,958,448 | | | | — | |
Transportation | | | 28,212,738 | | | | 28,212,738 | | | | — | | | | — | |
Utilities | | | 37,924,162 | | | | 37,924,162 | | | | — | | | | — | |
Asset & Commercial Mortgage Backed Securities | | | 85,990,464 | | | | — | | | | 85,990,464 | | | | — | |
Corporate Bonds | | | 416,928,834 | | | | — | | | | 416,928,834 | | | | — | |
Foreign Government Obligations | | | 17,212,547 | | | | — | | | | 17,212,547 | | | | — | |
Municipal Bonds | | | 24,439,093 | | | | — | | | | 24,439,093 | | | | — | |
U.S. Government Agencies | | | 7,811,545 | | | | — | | | | 7,811,545 | | | | — | |
U.S. Government Securities | | | 145,737,426 | | | | — | | | | 145,737,426 | | | | — | |
Short-Term Investments | | | 11,843,788 | | | | 11,843,788 | | | | — | | | | — | |
Futures Contracts(2) | | | 176,651 | | | | 176,651 | | | | — | | | | — | |
| | | | | | | | | | | | | | | | |
Total | | $ | 2,208,646,984 | | | $ | 1,399,485,880 | | | $ | 800,140,997 | | | $ | 9,020,107 | |
| | | | | | | | | | | | | | | | |
Liabilities | | | | | | | | | | | | | | | | |
Futures Contracts(2) | | $ | (29,496 | ) | | $ | (29,496 | ) | | $ | — | | | $ | — | |
| | | | | | | | | | | | | | | | |
Total | | $ | (29,496 | ) | | $ | (29,496 | ) | | $ | — | | | $ | — | |
| | | | | | | | | | | | | | | | |
| (1) | For the six-month period ended June 30, 2018, there were no transfers between any levels. |
| (2) | Derivative instruments (excluding purchased and written options, if applicable) are valued at the unrealized appreciation/(depreciation) on the investments. |
Level 3 investments at the beginning and/or end of the period in relation to net assets were not significant and accordingly, a reconciliation of Level 3 assets for the period ended June 30, 2018 is not presented.
The accompanying notes are an integral part of these financial statements.
|
| Hartford Capital Appreciation HLS Fund |
Schedule of Investments
June 30, 2018 (Unaudited)
| | | | | | | | |
| Shares or Principal Amount | | Market Value† | |
| COMMON STOCKS - 96.1% | |
| | | | Automobiles & Components - 1.6% | |
| | 151,816 | | | Ferrari N.V. | | $ | 20,513,213 | |
| | 737,254 | | | General Motors Co. | | | 29,047,808 | |
| | 189,657 | | | Magna International, Inc. | | | 11,030,445 | |
| | 5,929 | | | Tesla, Inc.*(1) | | | 2,033,351 | |
| | 219,885 | | | Valeo S.A. | | | 11,988,916 | |
| | | | | | | | |
| | | | | | | 74,613,733 | |
| | | | | | | | |
| | | | Banks - 4.2% | |
| | 699,035 | | | Bank of America Corp. | | | 19,705,797 | |
| | 460,426 | | | Bank of the Ozarks, Inc. | | | 20,737,587 | |
| | 517,691 | | | Citigroup, Inc. | | | 34,643,882 | |
| | 146,995 | | | First Republic Bank | | | 14,227,646 | |
| | 587,789 | | | KeyCorp. | | | 11,485,397 | |
| | 517,853 | | | People’s United Financial, Inc. | | | 9,367,961 | |
| | 454,258 | | | PNC Financial Services Group, Inc. | | | 61,370,256 | |
| | 368,111 | | | Sumitomo Mitsui Financial Group, Inc. | | | 14,358,532 | |
| | 187,728 | | | SunTrust Banks, Inc. | | | 12,393,802 | |
| | | | | | | | |
| | | | | | | 198,290,860 | |
| | | | | | | | |
| | | | Capital Goods - 4.5% | |
| | 323,952 | | | AerCap Holdings N.V.* | | | 17,542,001 | |
| | 111,236 | | | Airbus SE | | | 12,980,662 | |
| | 59,278 | | | Deere & Co. | | | 8,287,064 | |
| | 177,997 | | | General Dynamics Corp. | | | 33,180,421 | |
| | 38,812 | | | Harris Corp. | | | 5,609,886 | |
| | 350,600 | | | Harry’s, Inc.*(2)(3)(4)(5) | | | 4,733,100 | |
| | 35,081 | | | IDEX Corp. | | | 4,787,855 | |
| | 158,587 | | | Ingersoll-Rand plc | | | 14,230,012 | |
| | 252,885 | | | JELD-WEN Holding, Inc.* | | | 7,229,982 | |
| | 341,900 | | | Johnson Controls International plc | | | 11,436,555 | |
| | 383,500 | | | Komatsu Ltd. | | | 10,917,694 | |
| | 64,102 | | | L3 Technologies, Inc. | | | 12,328,097 | |
| | 73,812 | | | Lockheed Martin Corp. | | | 21,806,279 | |
| | 54,524 | | | Rockwell Automation, Inc. | | | 9,063,525 | |
| | 138,146 | | | Safran S.A. | | | 16,730,150 | |
| | 1,031,730 | �� | | Sanwa Holdings Corp. | | | 10,902,813 | |
| | 175,467 | | | Xylem, Inc. | | | 11,822,966 | |
| | | | | | | | |
| | | | | | | 213,589,062 | |
| | | | | | | | |
| | | | Commercial & Professional Services - 3.4% | |
| | 90,015 | | | CoStar Group, Inc.* | | | 37,142,889 | |
| | 60,823 | | | Dun & Bradstreet Corp. | | | 7,459,941 | |
| | 71,209 | | | Equifax, Inc. | | | 8,908,958 | |
| | 360,459 | | | Herman Miller, Inc. | | | 12,219,560 | |
| | 355,405 | | | IHS Markit Ltd.* | | | 18,335,344 | |
| | 49,143 | | | Intertek Group plc | | | 3,695,090 | |
| | 290,229 | | | Republic Services, Inc. | | | 19,840,054 | |
| | 963,441 | | | Steelcase, Inc. Class A | | | 13,006,453 | |
| | 319,129 | | | TransUnion | | | 22,862,402 | |
| | 242,081 | | | Waste Connections, Inc. | | | 18,223,858 | |
| | | | | | | | |
| | | | | | | 161,694,549 | |
| | | | | | | | |
| | | | Consumer Durables & Apparel - 3.0% | |
| | 29,009 | | | Mohawk Industries, Inc.* | | | 6,215,758 | |
| | 551,868 | | | Newell Brands, Inc. | | | 14,232,676 | |
| | 835,708 | | | NIKE, Inc. Class B | | | 66,589,214 | |
| | 52,532 | | | Polaris Industries, Inc. | | | 6,418,360 | |
| | 349,327 | | | Sony Corp. | | | 17,890,554 | |
| | 316,847 | | | Tapestry, Inc. | | | 14,799,923 | |
| | 520,562 | | | Under Armour, Inc. Class A*(1) | | | 11,702,234 | |
| | 205,654 | | | Under Armour, Inc. Class C*(1) | | | 4,335,186 | |
| | | | | | | | |
| | | | | | | 142,183,905 | |
| | | | | | | | |
| | | | | | | | |
| Shares or Principal Amount | | Market Value† | |
| COMMON STOCKS - 96.1% - (continued) | |
| | | | Consumer Services - 2.9% | |
| | 55,711 | | | Domino’s Pizza, Inc. | | $ | 15,719,973 | |
| | 514,432 | | | DraftKings, Inc.*(2)(3)(4)(5) | | | 1,003,142 | |
| | 140,368 | | | Hilton Grand Vacations, Inc.* | | | 4,870,770 | |
| | 147,193 | | | Hilton Worldwide Holdings, Inc. | | | 11,651,798 | |
| | 251,503 | | | Las Vegas Sands Corp. | | | 19,204,769 | |
| | 49,995 | | | Marriott Vacations Worldwide Corp. | | | 5,647,435 | |
| | 144,719 | | | McDonald’s Corp. | | | 22,676,020 | |
| | 324,881 | | | Melco Resorts & Entertainment Ltd. ADR | | | 9,096,668 | |
| | 343,701 | | | MGM Resorts International | | | 9,977,640 | |
| | 167,855 | | | New Oriental Education & Technology Group, Inc. ADR | | | 15,889,154 | |
| | 131,921 | | | Planet Fitness, Inc. Class A* | | | 5,796,609 | |
| | 84,354 | | | Royal Caribbean Cruises Ltd. | | | 8,739,074 | |
| | 29,876 | | | Vail Resorts, Inc. | | | 8,191,701 | |
| | | | | | | | |
| | | | | | | 138,464,753 | |
| | | | | | | | |
| | | | Diversified Financials - 3.2% | |
| | 538,480 | | | American Express Co. | | | 52,771,040 | |
| | 35,318 | | | BlackRock, Inc. | | | 17,625,095 | |
| | 258,881 | | | Intercontinental Exchange, Inc. | | | 19,040,698 | |
| | 1,502,670 | | | SLM Corp.* | | | 17,205,571 | |
| | 590,211 | | | TD Ameritrade Holding Corp. | | | 32,325,856 | |
| | 1,023,854 | | | UBS Group AG* | | | 15,696,044 | |
| | | | | | | | |
| | | | | | | 154,664,304 | |
| | | | | | | | |
| | | | Energy - 5.0% | |
| | 156,603 | | | Anadarko Petroleum Corp. | | | 11,471,170 | |
| | 686,517 | | | Canadian Natural Resources Ltd. | | | 24,762,668 | |
| | 179,600 | | | Chevron Corp. | | | 22,706,828 | |
| | 202,315 | | | Cimarex Energy Co. | | | 20,583,528 | |
| | 116,200 | | | Concho Resources, Inc.* | | | 16,076,270 | |
| | 75,726 | | | Diamondback Energy, Inc. | | | 9,963,270 | |
| | 189,525 | | | EOG Resources, Inc. | | | 23,582,596 | |
| | 791,626 | | | Halliburton Co. | | | 35,670,668 | |
| | 942,062 | | | Laredo Petroleum, Inc.* | | | 9,062,636 | |
| | 560,063 | | | Marathon Oil Corp. | | | 11,682,914 | |
| | 562,624 | | | Noble Energy, Inc. | | | 19,849,375 | |
| | 290,040 | | | Tenaris S.A. ADR | | | 10,554,556 | |
| | 346,051 | | | TOTAL S.A.(1) | | | 21,014,201 | |
| | | | | | | | |
| | | | | | | 236,980,680 | |
| | | | | | | | |
| | | | Food & Staples Retailing - 1.6% | |
| | 189,788 | | | Costco Wholesale Corp. | | | 39,661,896 | |
| | 721,935 | | | Kroger Co. | | | 20,539,051 | |
| | 300,801 | | | Walgreens Boots Alliance, Inc. | | | 18,052,572 | |
| | | | | | | | |
| | | | | | | 78,253,519 | |
| | | | | | | | |
| | | | Food, Beverage & Tobacco - 4.2% | |
| | 352,529 | | | Altria Group, Inc. | | | 20,020,122 | |
| | 212,871 | | | Archer-Daniels-Midland Co. | | | 9,755,878 | |
| | 336,841 | | | British American Tobacco plc | | | 16,967,816 | |
| | 794,191 | | | Coca-Cola Co. | | | 34,833,217 | |
| | 1,031,431 | | | Diageo plc | | | 37,055,094 | |
| | 83,626 | | | Hershey Co. | | | 7,782,236 | |
| | 258,499 | | | Hormel Foods Corp. | | | 9,618,748 | |
| | 99,364 | | | Lamb Weston Holdings, Inc. | | | 6,807,428 | |
| | 242,220 | | | PepsiCo., Inc. | | | 26,370,491 | |
| | 188,601 | | | Philip Morris International, Inc. | | | 15,227,645 | |
| | 1,298,339 | | | Treasury Wine Estates Ltd. | | | 16,681,097 | |
| | | | | | | | |
| | | | | | | 201,119,772 | |
| | | | | | | | |
The accompanying notes are an integral part of these financial statements.
|
| Hartford Capital Appreciation HLS Fund |
Schedule of Investments – (continued)
June 30, 2018 (Unaudited)
| | | | | | | | |
| Shares or Principal Amount | | Market Value† | |
| COMMON STOCKS - 96.1% - (continued) | |
| | | | Health Care Equipment & Services - 5.9% | |
| | 30,655 | | | Align Technology, Inc.* | | $ | 10,488,302 | |
| | 443,503 | | | Baxter International, Inc. | | | 32,748,261 | |
| | 96,221 | | | Becton Dickinson and Co. | | | 23,050,703 | |
| | 237,627 | | | Danaher Corp. | | | 23,449,032 | |
| | 73,422 | | | DexCom, Inc.* | | | 6,973,622 | |
| | 64,109 | | | Edwards Lifesciences Corp.* | | | 9,332,347 | |
| | 91,639 | | | Insulet Corp.* | | | 7,853,462 | |
| | 314,478 | | | Koninklijke Philips N.V. | | | 13,292,985 | |
| | 252,377 | | | McKesson Corp. | | | 33,667,092 | |
| | 468,378 | | | Medtronic plc | | | 40,097,841 | |
| | 126,821 | | | Stryker Corp. | | | 21,414,994 | |
| | 66,537 | | | Teleflex, Inc. | | | 17,845,889 | |
| | 162,827 | | | UnitedHealth Group, Inc. | | | 39,947,976 | |
| | | | | | | | |
| | | | | | | 280,162,506 | |
| | | | | | | | |
| | | | Household & Personal Products - 0.8% | |
| | 455,541 | | | Colgate-Palmolive Co. | | | 29,523,612 | |
| | 736,971 | | | Coty, Inc. Class A | | | 10,391,291 | |
| | | | | | | | |
| | | | | | | 39,914,903 | |
| | | | | | | | |
| | | | Insurance - 5.1% | |
| | 379,750 | | | Aflac, Inc. | | | 16,336,845 | |
| | 457,250 | | | American International Group, Inc. | | | 24,243,395 | |
| | 193,449 | | | Arthur J Gallagher & Co. | | | 12,628,351 | |
| | 315,277 | | | Chubb Ltd. | | | 40,046,485 | |
| | 585,800 | | | CNO Financial Group, Inc. | | | 11,153,632 | |
| | 228,649 | | | FNF Group | | | 8,601,775 | |
| | 905,877 | | | Lancashire Holdings Ltd. | | | 6,769,207 | |
| | 144,030 | | | Lincoln National Corp. | | | 8,965,867 | |
| | 350,838 | | | Marsh & McLennan Cos., Inc. | | | 28,758,191 | |
| | 840,763 | | | MetLife, Inc. | | | 36,657,267 | |
| | 1,293,000 | | | Ping An Insurance Group Co. of China Ltd. Class H | | | 11,840,872 | |
| | 159,896 | | | RenaissanceRe Holdings Ltd. | | | 19,238,687 | |
| | 262,000 | | | Tokio Marine Holdings, Inc. | | | 12,257,211 | |
| | 204,001 | | | Unum Group | | | 7,545,997 | |
| | | | | | | | |
| | | | | | | 245,043,782 | |
| | | | | | | | |
| | | | Materials - 3.8% | |
| | 769,101 | | | Anglo American plc | | | 17,074,750 | |
| | 134,491 | | | Cabot Corp. | | | 8,307,509 | |
| | 232,899 | | | Celanese Corp. Series A | | | 25,865,763 | |
| | 391,429 | | | CRH plc | | | 13,730,250 | |
| | 129,043 | | | Eastman Chemical Co. | | | 12,899,138 | |
| | 153,333 | | | Nucor Corp. | | | 9,583,313 | |
| | 188,062 | | | Nutrien Ltd. | | | 10,231,008 | |
| | 222,746 | | | Packaging Corp. of America | | | 24,900,775 | |
| | 177,890 | | | Praxair, Inc. | | | 28,133,303 | |
| | 282,270 | | | Reliance Steel & Aluminum Co. | | | 24,709,916 | |
| | 54,374 | | | Vulcan Materials Co. | | | 7,017,508 | |
| | | | | | | | |
| | | | | | | 182,453,233 | |
| | | | | | | | |
| | | | Media - 0.7% | |
| | 832,300 | | | Comcast Corp. Class A | | | 27,307,763 | |
| | 63,843 | | | Walt Disney Co. | | | 6,691,385 | |
| | 29,800 | | | Weinstein Co. LLC*(2)(3)(4)(5) | | | — | |
| | | | | | | | |
| | | | | | | 33,999,148 | |
| | | | | | | | |
| | | | Pharmaceuticals, Biotechnology & Life Sciences - 7.0% | |
| | 295,109 | | | Agilent Technologies, Inc. | | | 18,249,541 | |
| | 354,193 | | | Alkermes plc* | | | 14,578,584 | |
| | 83,393 | | | Allergan plc | | | 13,903,281 | |
| | 211,425 | | | Alnylam Pharmaceuticals, Inc.* | | | 20,823,248 | |
| | | | | | | | |
| Shares or Principal Amount | | Market Value† | |
| COMMON STOCKS - 96.1% - (continued) | |
| | | | Pharmaceuticals, Biotechnology & Life Sciences - 7.0% -
(continued) | |
| | 91,847 | | | BeiGene Ltd. ADR* | | $ | 14,119,639 | |
| | 36,045 | | | Biogen, Inc.* | | | 10,461,701 | |
| | 1,154,571 | | | Bristol-Myers Squibb Co. | | | 63,893,959 | |
| | 236,351 | | | Exact Sciences Corp.* | | | 14,131,426 | |
| | 125,641 | | | Five Prime Therapeutics, Inc.* | | | 1,986,384 | |
| | 136,206 | | | Incyte Corp.* | | | 9,125,802 | |
| | 521,558 | | | Ionis Pharmaceuticals, Inc.*(1) | | | 21,733,322 | |
| | 160,172 | | | Johnson & Johnson | | | 19,435,271 | |
| | 330,000 | | | Merck & Co., Inc. | | | 20,031,000 | |
| | 31,356 | | | Mettler-Toledo International, Inc.* | | | 18,143,522 | |
| | 518,307 | | | Mylan N.V.* | | | 18,731,615 | |
| | 629,144 | | | Pfizer, Inc. | | | 22,825,344 | |
| | 31,412 | | | Sage Therapeutics, Inc.* | | | 4,916,921 | |
| | 117,929 | | | Seattle Genetics, Inc.* | | | 7,829,306 | |
| | 84,859 | | | Thermo Fisher Scientific, Inc. | | | 17,577,693 | |
| | | | | | | | |
| | | | | | | 332,497,559 | |
| | | | | | | | |
| | | | Real Estate - 4.1% | |
| | 306,230 | | | American Tower Corp. REIT | | | 44,149,179 | |
| | 90,809 | | | AvalonBay Communities, Inc. REIT | | | 15,609,159 | |
| | 668,664 | | | Brixmor Property Group, Inc. REIT | | | 11,654,814 | |
| | 517,800 | | | Columbia Property Trust, Inc. REIT | | | 11,759,238 | |
| | 1,021,047 | | | Host Hotels & Resorts, Inc. REIT | | | 21,513,460 | |
| | 206,356 | | | Public Storage REIT | | | 46,813,922 | |
| | 73,034 | | | Simon Property Group, Inc. REIT | | | 12,429,657 | |
| | 727,711 | | | STORE Capital Corp. REIT | | | 19,939,281 | |
| | 202,147 | | | Welltower, Inc. REIT | | | 12,672,595 | |
| | | | | | | | |
| | | | | | | 196,541,305 | |
| | | | | | | | |
| | | | Retailing - 6.7% | |
| | 8,451,700 | | | Allstar Co.*(2)(3)(4)(5) | | | 3,887,782 | |
| | 25,884 | | | Amazon.com, Inc.* | | | 43,997,623 | |
| | 17,903 | | | Booking Holdings, Inc.* | | | 36,290,992 | |
| | 264,844 | | | CarMax, Inc.* | | | 19,299,182 | |
| | 143,658 | | | Dollar Tree, Inc.* | | | 12,210,930 | |
| | 264,000 | | | Expedia Group, Inc. | | | 31,730,160 | |
| | 198,686 | | | Floor & Decor Holdings, Inc. Class A* | | | 9,801,180 | |
| | 108,998 | | | Genuine Parts Co. | | | 10,004,927 | |
| | 136,486 | | | Home Depot, Inc. | | | 26,628,419 | |
| | 468,053 | | | Industria de Diseno Textil S.A. | | | 15,939,121 | |
| | 49,028 | | | Netflix, Inc.* | | | 19,191,030 | |
| | 209,054 | | | Ross Stores, Inc. | | | 17,717,327 | |
| | 51,956 | | | Tiffany & Co. | | | 6,837,410 | |
| | 525,694 | | | TJX Cos., Inc. | | | 50,035,555 | |
| | 115,140 | | | Tory Burch LLC*(2)(3)(4)(5) | | | 6,249,782 | |
| | 95,738 | | | Wayfair, Inc. Class A*(1) | | | 11,369,845 | |
| | | | | | | | |
| | | | | | | 321,191,265 | |
| | | | | | | | |
| | | | Semiconductors & Semiconductor Equipment - 3.9% | |
| | 159,376 | | | Ams AG | | | 11,819,342 | |
| | 73,402 | | | Broadcom, Inc. | | | 17,810,261 | |
| | 317,125 | | | KLA-Tencor Corp. | | | 32,514,826 | |
| | 596,047 | | | Marvell Technology Group Ltd. | | | 12,779,248 | |
| | 126,680 | | | Microchip Technology, Inc. | | | 11,521,546 | |
| | 442,084 | | | Micron Technology, Inc.* | | | 23,182,885 | |
| | 75,693 | | | NVIDIA Corp. | | | 17,931,672 | |
| | 377,524 | | | QUALCOMM, Inc. | | | 21,186,647 | |
| | 194,946 | | | Silicon Motion Technology Corp. ADR | | | 10,310,694 | |
| | 1,693,190 | | | Taiwan Semiconductor Manufacturing Co., Ltd. | | | 12,023,467 | |
| | 358,758 | | | Teradyne, Inc. | | | 13,657,917 | |
| | | | | | | | |
| | | | | | | 184,738,505 | |
| | | | | | | | |
The accompanying notes are an integral part of these financial statements.
|
| Hartford Capital Appreciation HLS Fund |
Schedule of Investments – (continued)
June 30, 2018 (Unaudited)
| | | | | | | | |
| Shares or Principal Amount | | Market Value† | |
| COMMON STOCKS - 96.1% - (continued) | |
| | | | Software & Services - 14.4% | |
| | 235,408 | | | 2U, Inc.* | | $ | 19,670,693 | |
| | 214,166 | | | Accenture plc Class A | | | 35,035,416 | |
| | 75,256 | | | Adobe Systems, Inc.* | | | 18,348,165 | |
| | 213,661 | | | Alibaba Group Holding Ltd. ADR* | | | 39,640,525 | |
| | 23,757 | | | Alphabet, Inc. Class C* | | | 26,504,497 | |
| | 196,722 | | | Amdocs Ltd. | | | 13,021,029 | |
| | 334,321 | | | Atlassian Corp. plc Class A* | | | 20,901,749 | |
| | 45,298 | | | Autodesk, Inc.* | | | 5,938,115 | |
| | 352,442 | | | Delivery Hero AG*(3) | | | 18,681,181 | |
| | 58,183 | | | Dropbox, Inc. Class B*(2)(3)(4)(5)(6) | | | 1,800,352 | |
| | 237,280 | | | Facebook, Inc. Class A* | | | 46,108,250 | |
| | 104,702 | | | FleetCor Technologies, Inc.* | | | 22,055,476 | |
| | 1,152,304 | | | Genpact Ltd. | | | 33,336,155 | |
| | 329,935 | | | Global Payments, Inc. | | | 36,784,453 | |
| | 152,529 | | | Guidewire Software, Inc.* | | | 13,541,525 | |
| | 1,714,263 | | | Just Eat plc* | | | 17,578,884 | |
| | 556,153 | | | Microsoft Corp. | | | 54,842,247 | |
| | 385,409 | | | PayPal Holdings, Inc.* | | | 32,093,007 | |
| | 227,801 | | | salesforce.com, Inc.* | | | 31,072,056 | |
| | 261,869 | | | ServiceNow, Inc.* | | | 45,164,546 | |
| | 182,697 | | | Spotify Technology S.A.* | | | 30,736,943 | |
| | 304,600 | | | Tencent Holdings Ltd. | | | 15,295,603 | |
| | 162,908 | | | VeriSign, Inc.* | | | 22,386,817 | |
| | 234,102 | | | Visa, Inc. Class A | | | 31,006,810 | |
| | 140,932 | | | Workday, Inc. Class A* | | | 17,069,684 | |
| | 563,448 | | | Yandex N.V. Class A* | | | 20,227,783 | |
| | 317,779 | | | Zillow Group, Inc. Class A* | | | 18,987,295 | |
| | | | | | | | |
| | | | | | | 687,829,256 | |
| | | | | | | | |
| | | | Technology Hardware & Equipment - 2.7% | |
| | 192,815 | | | Acacia Communications, Inc.*(1) | | | 6,711,890 | |
| | 47,507 | | | Apple, Inc. | | | 8,794,021 | |
| | 272,582 | | | CDW Corp. | | | 22,021,900 | |
| | 1,098,330 | | | Flex Ltd.* | | | 15,497,436 | |
| | 40,782 | | | IPG Photonics Corp.* | | | 8,997,733 | |
| | 149,948 | | | Keysight Technologies, Inc.* | | | 8,851,430 | |
| | 510,563 | | | Samsung Electronics Co., Ltd. | | | 21,387,262 | |
| | 221,175 | | | TE Connectivity Ltd. | | | 19,919,021 | |
| | 227,180 | | | Western Digital Corp. | | | 17,586,004 | |
| | | | | | | | |
| | | | | | | 129,766,697 | |
| | | | | | | | |
| | | | Telecommunication Services - 1.3% | |
| | 677,416 | | | AT&T, Inc. | | | 21,751,828 | |
| | 166,235 | | | SoftBank Group Corp. | | | 11,870,524 | |
| | 584,491 | | | Verizon Communications, Inc. | | | 29,405,742 | |
| | | | | | | | |
| | | | | | | 63,028,094 | |
| | | | | | | | |
| | | | Transportation - 3.9% | |
| | 779,585 | | | Canadian National Railway Co. | | | 63,765,090 | |
| | 99,919 | | | CSX Corp. | �� | | 6,372,834 | |
| | 250,981 | | | Delta Air Lines, Inc. | | | 12,433,599 | |
| | 162,105 | | | Genesee & Wyoming, Inc. Class A* | | | 13,182,378 | |
| | 441,892 | | | JetBlue Airways Corp.* | | | 8,387,110 | |
| | 2,327 | | | Knight-Swift Transportation Holdings, Inc. | | | 88,915 | |
| | 262,372 | | | Southwest Airlines Co. | | | 13,349,487 | |
| | 300,133 | | | Union Pacific Corp. | | | 42,522,843 | |
| | 243,161 | | | United Parcel Service, Inc. Class B | | | 25,830,993 | |
| | | | | | | | |
| | | | | | | 185,933,249 | |
| | | | | | | | |
| | | | Utilities - 2.2% | |
| | 144,536 | | | Dominion Energy, Inc. | | | 9,854,464 | |
| | 190,618 | | | Edison International | | | 12,060,401 | |
| | | | | | | | |
| Shares or Principal Amount | | Market Value† | |
| COMMON STOCKS - 96.1% - (continued) | |
| | | | Utilities - 2.2% - (continued) | |
| | 343,774 | | | Exelon Corp. | | $ | 14,644,772 | |
| | 1,300,951 | | | Iberdrola S.A. | | | 10,032,610 | |
| | 576,010 | | | NRG Energy, Inc. | | | 17,683,507 | |
| | 356,041 | | | OGE Energy Corp. | | | 12,536,204 | |
| | 101,142 | | | Sempra Energy | | | 11,743,598 | |
| | 401,719 | | | Southern Co. | | | 18,603,607 | |
| | | | | | | | |
| | | | | | | 107,159,163 | |
| | | | | | | | |
| | |
| | | | Total Common Stocks
(cost $4,216,244,162) | | $ | 4,590,113,802 | |
| | | | | | | | |
|
| EXCHANGE-TRADED FUNDS - 0.6% | |
| | | | Other Investment Pools & Funds - 0.6% | |
| | 110,079 | | | SPDR S&P 500 ETF Trust | | $ | 29,862,231 | |
| | | | | | | | |
| | |
| | | | Total Exchange-Traded Funds
(cost $29,117,987) | | $ | 29,862,231 | |
| | | | | | | | |
|
| PREFERRED STOCKS - 1.1% | |
| | | | Consumer Services - 0.1% | |
| | 16,619 | | | Airbnb, Inc. Series E*(2)(3)(4)(5) | | $ | 1,744,995 | |
| | | | | | | | |
| | | | Diversified Financials - 0.0% | |
| | 85,350 | | | Social Finance, Inc. Series F*(2)(3)(4)(5) | | | 1,428,759 | |
| | | | | | | | |
| | | | Software & Services - 1.0% | |
| | 29,504 | | | Magic Leap, Inc. Series C*(2)(3)(4)(5) | | | 796,608 | |
| | 50,200 | | | Nanigans, Inc. Series D*(2)(3)(4)(5) | | | 277,104 | |
| | 793,410 | | | Pinterest, Inc. Series G*(2)(3)(4)(5) | | | 5,482,463 | |
| | 20,891 | | | Sharecare Series B2*(2)(3)(4)(5) | | | 5,618,217 | |
| | 782,192 | | | Uber Technologies, Inc. Series D*(2)(3)(4)(5) | | | 31,287,680 | |
| | 146,827 | | | Zuora, Inc. Series F*(2)(3)(4)(5)(6) | | | 3,765,166 | |
| | | | | | | | |
| | | | | | | 47,227,238 | |
| | | | | | | | |
| | |
| | | | Total Preferred Stocks
(cost $28,287,182) | | $ | 50,400,992 | |
| | | | | | | | |
|
| CONVERTIBLE PREFERRED STOCKS - 0.0% | |
| | | | Retailing - 0.0% | |
| | 40,566 | | | Honest Co. Series C*(2)(3)(4)(5) | | $ | 1,238,075 | |
| | | | | | | | |
| | |
| | | | Total Convertible Preferred Stocks
(cost $1,097,607) | | $ | 1,238,075 | |
| | | | | | | | |
|
| ESCROWS - 0.0% | |
| | | | Consumer Durables & Apparel - 0.0% | |
| | 127,917 | | | One Kings Lane, Inc., Escrow*(2)(3)(4)(5) | | $ | 23,025 | |
| | | | | | | | |
| | | | Telecommunication Services - 0.0% | |
| | 22,145 | | | Docusign Earnout, Escrow*(2)(3)(4)(5) | | | 49,826 | |
| | | | | | | | |
| | |
| | | | Total Escrows
(cost $—) | | $ | 72,851 | |
| | | | | | | | |
| | |
| | | | Total Long-Term Investments
(cost $4,274,746,938) | | $ | 4,671,687,951 | |
| | | | | | | | |
The accompanying notes are an integral part of these financial statements.
|
| Hartford Capital Appreciation HLS Fund |
Schedule of Investments – (continued)
June 30, 2018 (Unaudited)
| | | | | | | | |
| Shares or Principal Amount | | Market Value† | |
| SHORT-TERM INVESTMENTS - 2.6% | |
| | | | Other Investment Pools & Funds - 2.2% | | | |
| | 105,198,707 | | | BlackRock Liquidity Funds TempFund Portfolio, Institutional Class,
1.84%(7) | | $ | 105,198,707 | |
| | | | | | | | |
| | | | Securities Lending Collateral - 0.4% | | | |
| | 948,575 | | | Citibank NA DDCA,
1.91%, 7/2/2018(7) | | | 948,575 | |
| | 6,407,561 | | | Goldman Sachs Financial Square Funds, Government Institutional Fund,
1.81%(7) | | | 6,407,561 | |
| | 5,953,931 | | | Invesco Government & Agency Portfolio,
1.81%(7) | | | 5,953,931 | |
| | 1,756,568 | | | Morgan Stanley Institutional Liquidity Funds, Government Portfolio, Institutional Class,
1.84%(7) | | | 1,756,568 | |
| | 3,904,871 | | | Western Asset Institutional Government Class A Fund,
1.79%(7) | | | 3,904,871 | |
| | | | | | | | |
| | | | | | | 18,971,506 | |
| | | | | | | | |
| | |
| | | | Total Short-Term Investments
(cost $124,170,213) | | $ | 124,170,213 | |
| | | | | | | | |
| | | | | | | | | | | | |
| | | |
| | | | Total Investments
(cost $4,398,917,151) | | | 100.4 | % | | $ | 4,795,858,164 | |
| | | | Other Assets and Liabilities | | | (0.4 | )% | | | (20,392,146 | ) |
| | | | | | | | | | | | |
| | | | Total Net Assets | | | 100.0 | % | | $ | 4,775,466,018 | |
| | | | | | | | | | | | |
The accompanying notes are an integral part of these financial statements.
|
| Hartford Capital Appreciation HLS Fund |
Schedule of Investments – (continued)
June 30, 2018 (Unaudited)
| Note: | Percentage of investments as shown is the ratio of the total market value to total net assets. |
| | Prices of foreign equities that are principally traded on certain foreign markets will generally be adjusted daily pursuant to a fair value pricing service approved by the Board of Directors in order to reflect an adjustment for factors occurring after the close of certain foreign markets but before the close of the New York Stock Exchange. |
| | Equity industry classifications used in this report are the Global Industry Classification Standard, which was developed by and is the exclusive property and service mark of MSCI, Inc. and Standard & Poor’s. |
| | For Fund compliance purposes, the Fund may not use the same classification system shown in this report as these classifications are used for financial reporting purposes. |
| (1) | Represents entire or partial securities on loan. See Note 8 in the accompanying Notes to Financial Statements for securities lending information. |
| (2) | Investment valued using significant unobservable inputs. |
| (3) | Securities issued within terms of a private placement memorandum and exempt from registration under Rule 144A under the Securities Act of 1933, as amended, and may be sold to qualified institutional buyers. Unless otherwise indicated, these holdings are determined to be liquid. At June 30, 2018, the aggregate value of these securities was $88,067,257, which represented 1.8% of total net assets. |
| (4) | These securities are valued in good faith at fair value as determined under policies and procedures established by and under the supervision of the Board of Directors. At June 30, 2018, the aggregate fair value of these securities was $69,386,076, which represented 1.5% of total net assets. This amount excludes securities that are principally traded in certain foreign markets and whose prices are adjusted pursuant to a third party pricing service methodology approved by the Board of Directors. |
| (5) | This security has been identified as illiquid. Illiquid securities are often purchased in private placement transactions, are often not registered under the Securities Act of 1933, as amended, and may have contractual restrictions on resale. A security may also be considered illiquid if the security lacks a readily available market or if its valuation has not changed for a certain period of time. The identification of illiquid securities is unaudited. At June 30, 2018, the aggregate value of these securities was $69,386,076, which represented 1.5% of total net assets. |
| (6) | The following illiquid securities are considered restricted due to a contractual lock-up period associated with the securities. |
| | | | | | | | | | | | | | | | |
Period
Acquired | | | Security Name | | Shares/Par
Value | | | Base
Total Cost | | | Base
Market
Value | |
| | 05/2012 | | | Dropbox, Inc. Class B | | | 58,183 | | | $ | 789,978 | | | $ | 1,800,352 | |
| | 01/2015 | | | Zuora, Inc. Series F Preferred | | | 146,827 | | | | 1,115,683 | | | | 3,765,166 | |
| | | | | | | | | | | | | | | | |
| | | | | | | | | | $ | 1,905,661 | | | $ | 5,565,518 | |
| | | | | | | | | | | | | | | | |
| (7) | Current yield as of period end. |
| | | | | | | | | | | | | | | | |
| Futures Contracts Outstanding at June 30, 2018 | |
Description | | Number of
Contracts | | | Expiration
Date | | | Current
Notional
Amount | | | Value and
Unrealized
Appreciation/
(Depreciation) | |
Long position contracts: | |
S&P 500 (E-Mini) Future | | | 405 | | | | 09/21/2018 | | | $ | 55,112,400 | | | $ | (625,396 | ) |
| | | | | | | | | | | | | | | | |
Total futures contracts | | | $ | (625,396 | ) |
| | | | | | | | | | | | | | | | |
| | | | | | | | | | | | | | | | | | | | | | | | |
| Foreign Currency Contracts Outstanding at June 30, 2018 | |
Amount and Description
of Currency to be
Purchased | | Amount and Description
of Currency to be
Sold | | Counterparty | | | Settlement
Date | | Appreciation | | | Depreciation | |
| | 3,445,024 | | | USD | | | 2,896,000 | | | EUR | | | JPM | | | 09/19/18 | | $ | 42,431 | | | $ | — | |
| | 3,427,855 | | | USD | | | 2,897,000 | | | EUR | | | UBS | | | 09/19/18 | | | 24,087 | | | | — | |
| | 9,435,600 | | | USD | | | 1,035,944,000 | | | JPY | | | CBA | | | 09/19/18 | | | 25,862 | | | | — | |
| | | | | | | | | | | | | | | | | | | | | | | | |
| | Total | | $ | 92,380 | | | $ | — | |
| | | | | | | | | |
| | † | See Significant Accounting Policies of accompanying Notes to Financial Statements regarding valuation of investments. |
The accompanying notes are an integral part of these financial statements.
|
| Hartford Capital Appreciation HLS Fund |
Schedule of Investments – (continued)
June 30, 2018 (Unaudited)
| | |
| GLOSSARY: (abbreviations used in preceding Schedule of Investments) |
|
| Counterparty Abbreviations: |
CBA | | Commonwealth Bank of Australia |
JPM | | JP Morgan Chase & Co. |
UBS | | UBS AG |
|
| Currency Abbreviations: |
EUR | | Euro |
JPY | | Japanese Yen |
| | |
| Index Abbreviations: |
S&P | | Standard & Poors |
|
| Other Abbreviations: |
ADR | | American Depositary Receipt |
DDCA | | Dollars on Deposit in Custody Account |
ETF | | Exchange-Traded Fund |
REIT | | Real Estate Investment Trust |
SPDR | | Standard & Poor’s Depositary Receipt |
The accompanying notes are an integral part of these financial statements.
|
| Hartford Capital Appreciation HLS Fund |
Schedule of Investments – (continued)
June 30, 2018 (Unaudited)
Fair Valuation Summary
The following is a summary of the fair valuations according to the inputs used as of June 30, 2018 in valuing the Fund’s investments.
| | | | | | | | | | | | | | | | |
| | | Total | | | Level 1(1) | | | Level 2(1) | | | Level 3(1) | |
Assets | |
Common Stocks | |
Automobiles & Components | | $ | 74,613,733 | | | $ | 48,580,743 | | | $ | 26,032,990 | | | $ | — | |
Banks | | | 198,290,860 | | | | 183,932,328 | | | | 14,358,532 | | | | — | |
Capital Goods | | | 213,589,062 | | | | 157,324,643 | | | | 51,531,319 | | | | 4,733,100 | |
Commercial & Professional Services | | | 161,694,549 | | | | 157,999,459 | | | | 3,695,090 | | | | — | |
Consumer Durables & Apparel | | | 142,183,905 | | | | 124,293,351 | | | | 17,890,554 | | | | — | |
Consumer Services | | | 138,464,753 | | | | 137,461,611 | | | | — | | | | 1,003,142 | |
Diversified Financials | | | 154,664,304 | | | | 138,968,260 | | | | 15,696,044 | | | | — | |
Energy | | | 236,980,680 | | | | 215,966,479 | | | | 21,014,201 | | | | — | |
Food & Staples Retailing | | | 78,253,519 | | | | 78,253,519 | | | | — | | | | — | |
Food, Beverage & Tobacco | | | 201,119,772 | | | | 130,415,765 | | | | 70,704,007 | | | | — | |
Health Care Equipment & Services | | | 280,162,506 | | | | 280,162,506 | | | | — | | | | — | |
Household & Personal Products | | | 39,914,903 | | | | 39,914,903 | | | | — | | | | — | |
Insurance | | | 245,043,782 | | | | 214,176,492 | | | | 30,867,290 | | | | — | |
Materials | | | 182,453,233 | | | | 151,648,233 | | | | 30,805,000 | | | | — | |
Media | | | 33,999,148 | | | | 33,999,148 | | | | — | | | | — | |
Pharmaceuticals, Biotechnology & Life Sciences | | | 332,497,559 | | | | 332,497,559 | | | | — | | | | — | |
Real Estate | | | 196,541,305 | | | | 196,541,305 | | | | — | | | | — | |
Retailing | | | 321,191,265 | | | | 295,114,580 | | | | 15,939,121 | | | | 10,137,564 | |
Semiconductors & Semiconductor Equipment | | | 184,738,505 | | | | 160,895,696 | | | | 23,842,809 | | | | — | |
Software & Services | | | 687,829,256 | | | | 634,473,236 | | | | 51,555,668 | | | | 1,800,352 | |
Technology Hardware & Equipment | | | 129,766,697 | | | | 108,379,435 | | | | 21,387,262 | | | | — | |
Telecommunication Services | | | 63,028,094 | | | | 51,157,570 | | | | 11,870,524 | | | | — | |
Transportation | | | 185,933,249 | | | | 185,933,249 | | | | — | | | | — | |
Utilities | | | 107,159,163 | | | | 97,126,553 | | | | 10,032,610 | | | | — | |
Exchange-Traded Funds | | | 29,862,231 | | | | 29,862,231 | | | | — | | | | — | |
Preferred Stocks | | | 50,400,992 | | | | — | | | | — | | | | 50,400,992 | |
Convertible Preferred Stocks | | | 1,238,075 | | | | — | | | | — | | | | 1,238,075 | |
Escrows | | | 72,851 | | | | — | | | | — | | | | 72,851 | |
Short-Term Investments | | | 124,170,213 | | | | 124,170,213 | | | | — | | | | — | |
Foreign Currency Contracts(2) | | | 92,380 | | | | — | | | | 92,380 | | | | — | |
| | | | | | | | | | | | | | | | |
Total | | $ | 4,795,950,544 | | | $ | 4,309,249,067 | | | $ | 417,315,401 | | | $ | 69,386,076 | |
| | | | | | | | | | | | | | | | |
Liabilities | |
Futures Contracts(2) | | $ | (625,396 | ) | | $ | (625,396 | ) | | $ | — | | | $ | — | |
| | | | | | | | | | | | | | | | |
Total | | $ | (625,396 | ) | | $ | (625,396 | ) | | $ | — | | | $ | — | |
| | | | | | | | | | | | | | | | |
| (1) | For the six-month period ended June 30, 2018, investments valued at $9,293,705 were transferred from Level 1 to Level 2 due to the application of a fair valuation factor. There were no transfers between any other levels. |
| (2) | Derivative instruments (excluding purchased and written options, if applicable) are valued at the unrealized appreciation/ (depreciation) on the investments. |
The following is a rollforward of the Fund’s investments that were valued using unobservable inputs (Level 3) for the six-month period ended June 30, 2018:
| | | | | | | | | | | | | | | | | | | | |
| | | Common
Stocks | | | Preferred
Stocks | | | Convertible
Preferred
Stocks | | | Escrows | | | Total | |
Beginning balance | | $ | 14,720,609 | | | $ | 46,021,366 | | | $ | 1,238,075 | | | $ | — | | | $ | 61,980,050 | |
Conversions* | | | (31,979 | ) | | | — | | | | — | | | | 31,979 | | | | — | |
Purchases | | | — | | | | — | | | | — | | | | — | | | | — | |
Sales | | | (634,620 | ) | | | (1,086,156 | ) | | | — | | | | — | | | | (1,720,776 | ) |
Total realized gain/(loss) | | | (116,392 | ) | | | 574,722 | | | | — | | | | — | | | | 458,330 | |
Net change in unrealized appreciation/depreciation | | | 3,736,540 | | | | 4,891,060 | | | | — | | | | 40,872 | | | | 8,668,472 | |
Transfers into Level 3 | | | — | | | | — | | | | — | | | | — | | | | — | |
Transfers out of Level 3 | | | — | | | | — | | | | — | | | | — | | | | — | |
| | | | | | | | | | | | | | | | | | | | |
Ending balance | | $ | 17,674,158 | | | $ | 50,400,992 | | | $ | 1,238,075 | | | $ | 72,851 | | | $ | 69,386,076 | |
| | | | | | | | | | | | | | | | | | | | |
The change in net unrealized appreciation/(depreciation) relating to the Level 3 investments held at June 30, 2018 was $8,505,448.
| * | Private Equity securities that were a common stock are now trading as escrow. |
| Note: | For purposes of reporting transfers between different hierarchy levels, both transfers in and out of each level, as applicable, are shown as if they occurred at the beginning of the period. |
The accompanying notes are an integral part of these financial statements.
|
| Hartford Disciplined Equity HLS Fund |
Schedule of Investments
June 30, 2018 (Unaudited)
| | | | | | | | |
| Shares or Principal Amount | | Market Value† | |
| COMMON STOCKS - 99.6% | |
| | | | Banks - 8.6% | |
| | 641,622 | | | Bank of America Corp. | | $ | 18,087,324 | |
| | 205,798 | | | Fifth Third Bancorp | | | 5,906,402 | |
| | 174,574 | | | JP Morgan Chase & Co. | | | 18,190,611 | |
| | 108,658 | | | PNC Financial Services Group, Inc. | | | 14,679,696 | |
| | | | | | | | |
| | | | | | | 56,864,033 | |
| | | | | | | | |
| | | | Capital Goods - 6.5% | |
| | 96,981 | | | AMETEK, Inc. | | | 6,998,149 | |
| | 37,945 | | | Boeing Co. | | | 12,730,927 | |
| | 102,418 | | | Fortune Brands Home & Security, Inc. | | | 5,498,822 | |
| | 25,023 | | | General Dynamics Corp. | | | 4,664,538 | |
| | 50,389 | | | Illinois Tool Works, Inc. | | | 6,980,892 | |
| | 39,418 | | | Snap-on, Inc. | | | 6,335,261 | |
| | | | | | | | |
| | | | | | | 43,208,589 | |
| | | | | | | | |
| | | | Commercial & Professional Services - 2.3% | |
| | 29,142 | | | Equifax, Inc. | | | 3,645,956 | |
| | 97,679 | | | IHS Markit Ltd.* | | | 5,039,259 | |
| | 98,636 | | | Republic Services, Inc. | | | 6,742,757 | |
| | | | | | | | |
| | | | | | | 15,427,972 | |
| | | | | | | | |
| | | | Consumer Durables & Apparel - 3.1% | |
| | 146,905 | | | NIKE, Inc. Class B | | | 11,705,390 | |
| | 112,038 | | | VF Corp. | | | 9,133,338 | |
| | | | | | | | |
| | | | | | | 20,838,728 | |
| | | | | | | | |
| | | | Consumer Services - 3.2% | |
| | 171,067 | | | Aramark | | | 6,346,586 | |
| | 69,056 | | | Hilton Worldwide Holdings, Inc. | | | 5,466,473 | |
| | 58,230 | | | McDonald’s Corp. | | | 9,124,058 | |
| | | | | | | | |
| | | | | | | 20,937,117 | |
| | | | | | | | |
| | | | Diversified Financials - 2.2% | |
| | 87,366 | | | Capital One Financial Corp. | | | 8,028,936 | |
| | 195,122 | | | Synchrony Financial | | | 6,513,172 | |
| | | | | | | | |
| | | | | | | 14,542,108 | |
| | | | | | | | |
| | | | Energy - 2.8% | |
| | 102,995 | | | Continental Resources, Inc.* | | | 6,669,956 | |
| | 95,237 | | | EOG Resources, Inc. | | | 11,850,340 | |
| | | | | | | | |
| | | | | | | 18,520,296 | |
| | | | | | | | |
| | | | Food & Staples Retailing - 2.9% | |
| | 48,720 | | | Costco Wholesale Corp. | | | 10,181,506 | |
| | 108,913 | | | Walmart, Inc. | | | 9,328,398 | |
| | | | | | | | |
| | | | | | | 19,509,904 | |
| | | | | | | | |
| | | | Food, Beverage & Tobacco - 2.1% | |
| | 32,321 | | | Constellation Brands, Inc. Class A | | | 7,074,097 | |
| | 122,906 | | | Monster Beverage Corp.* | | | 7,042,514 | |
| | | | | | | | |
| | | | | | | 14,116,611 | |
| | | | | | | | |
| | | | Health Care Equipment & Services - 11.0% | |
| | 128,639 | | | Abbott Laboratories | | | 7,845,693 | |
| | 32,349 | | | Anthem, Inc. | | | 7,700,033 | |
| | 152,435 | | | Baxter International, Inc. | | | 11,255,800 | |
| | 61,352 | | | Danaher Corp. | | | 6,054,215 | |
| | 151,376 | | | Hologic, Inc.* | | | 6,017,196 | |
| | 45,148 | | | Laboratory Corp. of America Holdings* | | | 8,105,421 | |
| | 114,281 | | | Medtronic plc | | | 9,783,596 | |
| | 65,038 | | | UnitedHealth Group, Inc. | | | 15,956,423 | |
| | | | | | | | |
| | | | | | | 72,718,377 | |
| | | | | | | | |
| | | | | | | | |
| Shares or Principal Amount | | Market Value† | |
| COMMON STOCKS - 99.6% - (continued) | |
| | | | Household & Personal Products - 2.3% | |
| | 142,430 | | | Colgate-Palmolive Co. | | $ | 9,230,888 | |
| | 43,947 | | | Estee Lauder Cos., Inc. Class A | | | 6,270,798 | |
| | | | | | | | |
| | | | | | | 15,501,686 | |
| | | | | | | | |
| | | | Insurance - 3.7% | |
| | 95,713 | | | Allstate Corp. | | | 8,735,726 | |
| | 98,763 | | | Athene Holding Ltd. Class A* | | | 4,329,770 | |
| | 88,817 | | | Chubb Ltd. | | | 11,281,535 | |
| | | | | | | | |
| | | | | | | 24,347,031 | |
| | | | | | | | |
| | | | Materials - 2.2% | |
| | 97,593 | | | DowDuPont, Inc. | | | 6,433,330 | |
| | 59,148 | | | Ecolab, Inc. | | | 8,300,239 | |
| | | | | | | | |
| | | | | | | 14,733,569 | |
| | | | | | | | |
| | | | Media - 1.5% | |
| | 305,812 | | | Comcast Corp. Class A | | | 10,033,692 | |
| | | | | | | | |
| | | | Pharmaceuticals, Biotechnology & Life Sciences - 6.0% | |
| | 36,834 | | | Allergan plc | | | 6,140,964 | |
| | 118,118 | | | Bristol-Myers Squibb Co. | | | 6,536,650 | |
| | 109,336 | | | Eli Lilly & Co. | | | 9,329,641 | |
| | 146,262 | | | Merck & Co., Inc. | | | 8,878,103 | |
| | 41,832 | | | Thermo Fisher Scientific, Inc. | | | 8,665,081 | |
| | | | | | | | |
| | | | | | | 39,550,439 | |
| | | | | | | | |
| | | | Retailing - 4.2% | |
| | 4,616 | | | Booking Holdings, Inc.* | | | 9,357,047 | |
| | 100,632 | | | Dollar Tree, Inc.* | | | 8,553,720 | |
| | 104,583 | | | TJX Cos., Inc. | | | 9,954,210 | |
| | | | | | | | |
| | | | | | | 27,864,977 | |
| | | | | | | | |
| | | | Semiconductors & Semiconductor Equipment - 2.8% | |
| | 28,959 | | | Lam Research Corp. | | | 5,005,563 | |
| | 80,656 | | | Micron Technology, Inc.* | | | 4,229,600 | |
| | 191,620 | | | ON Semiconductor Corp.* | | | 4,260,671 | |
| | 125,255 | | | Teradyne, Inc. | | | 4,768,458 | |
| | | | | | | | |
| | | | | | | 18,264,292 | |
| | | | | | | | |
| | | | Software & Services - 18.2% | |
| | 16,736 | | | Alphabet, Inc. Class A* | | | 18,898,124 | |
| | 4,002 | | | Alphabet, Inc. Class C* | | | 4,464,831 | |
| | 146,475 | | | eBay, Inc.* | | | 5,311,183 | |
| | 78,868 | | | Facebook, Inc. Class A* | | | 15,325,630 | |
| | 144,618 | | | GoDaddy, Inc. Class A* | | | 10,210,031 | |
| | 98,929 | | | Leidos Holdings, Inc. | | | 5,836,811 | |
| | 103,864 | | | Mastercard, Inc. Class A | | | 20,411,353 | |
| | 163,379 | | | Microsoft Corp. | | | 16,110,803 | |
| | 58,172 | | | salesforce.com, Inc.* | | | 7,934,661 | |
| | 101,175 | | | SS&C Technologies Holdings, Inc. | | | 5,250,983 | |
| | 69,151 | | | Total System Services, Inc. | | | 5,844,643 | |
| | 39,501 | | | Workday, Inc. Class A* | | | 4,784,361 | |
| | | | | | | | |
| | | | | | | 120,383,414 | |
| | | | | | | | |
| | | | Technology Hardware & Equipment - 5.4% | |
| | 74,682 | | | Apple, Inc. | | | 13,824,385 | |
| | 57,078 | | | CDW Corp. | | | 4,611,331 | |
| | 63,659 | | | Motorola Solutions, Inc. | | | 7,407,998 | |
| | 123,660 | | | NetApp, Inc. | | | 9,711,020 | |
| | | | | | | | |
| | | | | | | 35,554,734 | |
| | | | | | | | |
| | | | Telecommunication Services - 1.7% | |
| | 220,125 | | | Verizon Communications, Inc. | | | 11,074,489 | |
| | | | | | | | |
The accompanying notes are an integral part of these financial statements.
|
| Hartford Disciplined Equity HLS Fund |
Schedule of Investments – (continued)
June 30, 2018 (Unaudited)
| | | | | | | | |
| Shares or Principal Amount | | Market Value† | |
| COMMON STOCKS - 99.6% - (continued) | |
| | | | Transportation - 2.1% | |
| | 35,529 | | | FedEx Corp. | | $ | 8,067,215 | |
| | 39,606 | | | Norfolk Southern Corp. | | | 5,975,357 | |
| | | | | | | | |
| | | | | | | 14,042,572 | |
| | | | | | | | |
| | | | Utilities - 4.8% | |
| | 147,520 | | | American Electric Power Co., Inc. | | | 10,215,760 | |
| | 85,172 | | | NextEra Energy, Inc. | | | 14,226,279 | |
| | 95,379 | | | Pinnacle West Capital Corp. | | | 7,683,733 | |
| | | | | | | | |
| | | | | | | 32,125,772 | |
| | | | | | | | |
| | |
| | | | Total Common Stocks
(cost $492,884,963) | | $ | 660,160,402 | |
| | | | | | | | |
| | |
| | | | Total Long-Term Investments
(cost $492,884,963) | | $ | 660,160,402 | |
| | | | | | | | |
|
| SHORT-TERM INVESTMENTS - 0.3% | |
| | | | Other Investment Pools & Funds - 0.3% | |
| | 1,698,794 | | | BlackRock Liquidity Funds TempFund Portfolio, Institutional Class, 1.84%(1) | | $ | 1,698,794 | |
| | | | | | | | |
| | |
| | | | Total Short-Term Investments
(cost $1,698,794) | | $ | 1,698,794 | |
| | | | | | | | |
| | | | | | | | | | | | |
| | | |
| | | | Total Investments
(cost $494,583,757) | | | 99.9 | % | | $ | 661,859,196 | |
| | | | Other Assets and Liabilities | | | 0.1 | % | | | 673,652 | |
| | | | | | | | | | | | |
| | | | Total Net Assets | | | 100.0 | % | | $ | 662,532,848 | |
| | | | | | | | | | | | |
The accompanying notes are an integral part of these financial statements.
|
| Hartford Disciplined Equity HLS Fund |
Schedule of Investments – (continued)
June 30, 2018 (Unaudited)
| Note: | Percentage of investments as shown is the ratio of the total market value to total net assets. |
| | Equity industry classifications used in this report are the Global Industry Classification Standard, which was developed by and is the exclusive property and service mark of MSCI, Inc. and Standard & Poor’s. |
| | For Fund compliance purposes, the Fund may not use the same classification system shown in this report as these classifications are used for financial reporting purposes. |
| (1) | Current yield as of period end. |
| † | See Significant Accounting Policies of accompanying Notes to Financial Statements regarding valuation of investments. |
The accompanying notes are an integral part of these financial statements.
|
| Hartford Disciplined Equity HLS Fund |
Schedule of Investments – (continued)
June 30, 2018 (Unaudited)
Fair Valuation Summary
The following is a summary of the fair valuations according to the inputs used as of June 30, 2018 in valuing the Fund’s investments.
| | | | | | | | | | | | | | | | |
| | | Total | | | Level 1(1) | | | Level 2(1) | | | Level 3(1) | |
Assets | |
Common Stocks | |
Banks | | $ | 56,864,033 | | | $ | 56,864,033 | | | $ | — | | | $ | — | |
Capital Goods | | | 43,208,589 | | | | 43,208,589 | | | | — | | | | — | |
Commercial & Professional Services | | | 15,427,972 | | | | 15,427,972 | | | | — | | | | — | |
Consumer Durables & Apparel | | | 20,838,728 | | | | 20,838,728 | | | | — | | | | — | |
Consumer Services | | | 20,937,117 | | | | 20,937,117 | | | | — | | | | — | |
Diversified Financials | | | 14,542,108 | | | | 14,542,108 | | | | — | | | | — | |
Energy | | | 18,520,296 | | | | 18,520,296 | | | | — | | | | — | |
Food & Staples Retailing | | | 19,509,904 | | | | 19,509,904 | | | | — | | | | — | |
Food, Beverage & Tobacco | | | 14,116,611 | | | | 14,116,611 | | | | — | | | | — | |
Health Care Equipment & Services | | | 72,718,377 | | | | 72,718,377 | | | | — | | | | — | |
Household & Personal Products | | | 15,501,686 | | | | 15,501,686 | | | | — | | | | — | |
Insurance | | | 24,347,031 | | | | 24,347,031 | | | | — | | | | — | |
Materials | | | 14,733,569 | | | | 14,733,569 | | | | — | | | | — | |
Media | | | 10,033,692 | | | | 10,033,692 | | | | — | | | | — | |
Pharmaceuticals, Biotechnology & Life Sciences | | | 39,550,439 | | | | 39,550,439 | | | | — | | | | — | |
Retailing | | | 27,864,977 | | | | 27,864,977 | | | | — | | | | — | |
Semiconductors & Semiconductor Equipment | | | 18,264,292 | | | | 18,264,292 | | | | — | | | | — | |
Software & Services | | | 120,383,414 | | | | 120,383,414 | | | | — | | | | — | |
Technology Hardware & Equipment | | | 35,554,734 | | | | 35,554,734 | | | | — | | | | — | |
Telecommunication Services | | | 11,074,489 | | | | 11,074,489 | | | | — | | | | — | |
Transportation | | | 14,042,572 | | | | 14,042,572 | | | | — | | | | — | |
Utilities | | | 32,125,772 | | | | 32,125,772 | | | | — | | | | — | |
Short-Term Investments | | | 1,698,794 | | | | 1,698,794 | | | | — | | | | — | |
| | | | | | | | | | | | | | | | |
Total | | $ | 661,859,196 | | | $ | 661,859,196 | | | $ | — | | | $ | — | |
| | | | | | | | | | | | | | | | |
| (1) | For the six-month period ended June 30, 2018, there were no transfers between any levels. |
The accompanying notes are an integral part of these financial statements.
|
| Hartford Dividend and Growth HLS Fund |
Schedule of Investments
June 30, 2018 (Unaudited)
| | | | | | | | |
| Shares or Principal Amount | | Market Value† | |
| COMMON STOCKS - 98.0% | |
| | | | Automobiles & Components - 0.3% | |
| | 808,257 | | | Ford Motor Co. | | $ | 8,947,405 | |
| | | | | | | | |
| | | | Banks - 10.5% | |
| | 3,956,013 | | | Bank of America Corp. | | | 111,520,006 | |
| | 437,662 | | | Bank of Nova Scotia | | | 25,043,020 | |
| | 574,093 | | | Citigroup, Inc. | | | 38,418,304 | |
| | 1,075,471 | | | JP Morgan Chase & Co. | | | 112,064,078 | |
| | 480,275 | | | PNC Financial Services Group, Inc. | | | 64,885,152 | |
| | | | | | | | |
| | | | | | | 351,930,560 | |
| | | | | | | | |
| | | | Capital Goods - 4.2% | |
| | 523,543 | | | ABB Ltd. ADR | | | 11,397,531 | |
| | 159,021 | | | Caterpillar, Inc. | | | 21,574,379 | |
| | 286,108 | | | Eaton Corp. plc | | | 21,383,712 | |
| | 154,881 | | | Honeywell International, Inc. | | | 22,310,608 | |
| | 877,898 | | | Johnson Controls International plc | | | 29,365,688 | |
| | 38,561 | | | Lockheed Martin Corp. | | | 11,392,076 | |
| | 190,858 | | | United Technologies Corp. | | | 23,862,976 | |
| | | | | | | | |
| | | | | | | 141,286,970 | |
| | | | | | | | |
| | | | Consumer Services - 1.0% | |
| | 405,717 | | | Hilton Worldwide Holdings, Inc. | | | 32,116,558 | |
| | | | | | | | |
| | | | Diversified Financials - 3.2% | |
| | 63,604 | | | BlackRock, Inc. | | | 31,740,940 | |
| | 503,669 | | | Intercontinental Exchange, Inc. | | | 37,044,855 | |
| | 362,207 | | | Northern Trust Corp. | | | 37,267,478 | |
| | | | | | | | |
| | | | | | | 106,053,273 | |
| | | | | | | | |
| | | | Energy - 10.1% | |
| | 429,019 | | | BP plc ADR | | | 19,589,008 | |
| | 287,181 | | | Canadian Natural Resources Ltd. | | | 10,358,619 | |
| | 710,822 | | | Chevron Corp. | | | 89,869,225 | |
| | 632,341 | | | ConocoPhillips | | | 44,023,580 | |
| | 641,348 | | | Halliburton Co. | | | 28,899,141 | |
| | 859,801 | | | Hess Corp. | | | 57,512,089 | |
| | 1,276,412 | | | Suncor Energy, Inc. | | | 51,924,440 | |
| | 612,357 | | | TOTAL S.A. ADR | | | 37,084,340 | |
| | | | | | | | |
| | | | | | | 339,260,442 | |
| | | | | | | | |
| | | | Food & Staples Retailing - 2.2% | |
| | 114,439 | | | Costco Wholesale Corp. | | | 23,915,462 | |
| | 429,362 | | | Sysco Corp. | | | 29,321,131 | |
| | 250,970 | | | Walmart, Inc. | | | 21,495,581 | |
| | | | | | | | |
| | | | | | | 74,732,174 | |
| | | | | | | | |
| | | | Food, Beverage & Tobacco - 2.3% | |
| | 420,459 | | | PepsiCo., Inc. | | | 45,775,371 | |
| | 371,067 | | | Philip Morris International, Inc. | | | 29,959,950 | |
| | | | | | | | |
| | | | | | | 75,735,321 | |
| | | | | | | | |
| | | | Health Care Equipment & Services - 5.5% | |
| | 398,067 | | | Abbott Laboratories | | | 24,278,106 | |
| | 387,356 | | | Cardinal Health, Inc. | | | 18,914,594 | |
| | 502,977 | | | CVS Health Corp. | | | 32,366,570 | |
| | 585,946 | | | Medtronic plc | | | 50,162,837 | |
| | 177,837 | | | UnitedHealth Group, Inc. | | | 43,630,530 | |
| | 146,416 | | | Universal Health Services, Inc. Class B | | | 16,316,599 | |
| | | | | | | | |
| | | | | | | 185,669,236 | |
| | | | | | | | |
| | | | Household & Personal Products - 0.8% | |
| | 476,246 | | | Unilever N.V. | | | 26,536,427 | |
| | | | | | | | |
| | | | Insurance - 7.4% | |
| | 624,404 | | | American International Group, Inc. | | | 33,105,900 | |
| | | | | | | | |
| Shares or Principal Amount | | Market Value† | |
| COMMON STOCKS - 98.0% - (continued) | |
| | | | Insurance - 7.4% - (continued) | |
| | 48,561 | | | Brighthouse Financial, Inc.* | | $ | 1,945,839 | |
| | 512,720 | | | Chubb Ltd. | | | 65,125,694 | |
| | 358,051 | | | Marsh & McLennan Cos., Inc. | | | 29,349,440 | |
| | 520,436 | | | MetLife, Inc. | | | 22,691,010 | |
| | 563,721 | | | Principal Financial Group, Inc. | | | 29,849,027 | |
| | 691,466 | | | Prudential Financial, Inc. | | | 64,658,986 | |
| | | | | | | | |
| | | | | | | 246,725,896 | |
| | | | | | | | |
| | | | Materials - 4.8% | |
| | 551,826 | | | Ball Corp. | | | 19,617,415 | |
| | 765,044 | | | BHP Billiton plc ADR | | | 34,388,728 | |
| | 185,620 | | | Celanese Corp. Series A | | | 20,614,957 | |
| | 188,015 | | | CRH plc ADR | | | 6,646,330 | |
| | 155,419 | | | FMC Corp. | | | 13,864,929 | |
| | 692,449 | | | International Paper Co. | | | 36,062,744 | |
| | 288,563 | | | PPG Industries, Inc. | | | 29,932,640 | |
| | | | | | | | |
| | | | | | | 161,127,743 | |
| | | | | | | | |
| | | | Media - 2.7% | |
| | 336,489 | | | CBS Corp. Class B | | | 18,917,411 | |
| | 2,200,902 | | | Comcast Corp. Class A | | | 72,211,595 | |
| | | | | | | | |
| | | | | | | 91,129,006 | |
| | | | | | | | |
| | | | Pharmaceuticals, Biotechnology & Life Sciences - 7.8% | |
| | 1,539,633 | | | AstraZeneca plc ADR | | | 54,056,514 | |
| | 1,163,864 | | | Bristol-Myers Squibb Co. | | | 64,408,234 | |
| | 400,465 | | | Eli Lilly & Co. | | | 34,171,678 | |
| | 845,644 | | | Merck & Co., Inc. | | | 51,330,591 | |
| | 83,000 | | | Novartis AG ADR | | | 6,269,820 | |
| | 1,432,338 | | | Pfizer, Inc. | | | 51,965,223 | |
| | | | | | | | |
| | | | | | | 262,202,060 | |
| | | | | | | | |
| | | | Real Estate - 2.5% | |
| | 201,036 | | | American Tower Corp. REIT | | | 28,983,360 | |
| | 71,023 | | | Boston Properties, Inc. REIT | | | 8,907,705 | |
| | 602,400 | | | Invitation Homes, Inc. REIT | | | 13,891,344 | |
| | 198,498 | | | Simon Property Group, Inc. REIT | | | 33,782,374 | |
| | | | | | | | |
| | | | | | | 85,564,783 | |
| | | | | | | | |
| | | | Retailing - 2.8% | |
| | 176,855 | | | Expedia Group, Inc. | | | 21,256,202 | |
| | 92,518 | | | Home Depot, Inc. | | | 18,050,262 | |
| | 251,675 | | | Lowe’s Cos., Inc. | | | 24,052,580 | |
| | 305,796 | | | TJX Cos., Inc. | | | 29,105,663 | |
| | | | | | | | |
| | | | | | | 92,464,707 | |
| | | | | | | | |
| | | | Semiconductors & Semiconductor Equipment - 4.2% | |
| | 1,345,555 | | | Intel Corp. | | | 66,887,539 | |
| | 202,041 | | | KLA-Tencor Corp. | | | 20,715,264 | |
| | 419,857 | | | QUALCOMM, Inc. | | | 23,562,375 | |
| | 269,972 | | | Texas Instruments, Inc. | | | 29,764,413 | |
| | | | | | | | |
| | | | | | | 140,929,591 | |
| | | | | | | | |
| | | | Software & Services - 9.6% | |
| | 160,156 | | | Accenture plc Class A | | | 26,199,920 | |
| | 65,146 | | | Alliance Data Systems Corp. | | | 15,192,047 | |
| | 81,013 | | | Alphabet, Inc. Class A* | | | 91,479,070 | |
| | 864,489 | | | eBay, Inc.* | | | 31,346,371 | |
| | 138,139 | | | International Business Machines Corp. | | | 19,298,018 | |
| | 1,394,029 | | | Microsoft Corp. | | | 137,465,200 | |
| | | | | | | | |
| | | | | | | 320,980,626 | |
| | | | | | | | |
The accompanying notes are an integral part of these financial statements.
|
| Hartford Dividend and Growth HLS Fund |
Schedule of Investments – (continued)
June 30, 2018 (Unaudited)
| | | | | | | | |
| Shares or Principal Amount | | Market Value† | |
| COMMON STOCKS - 98.0% - (continued) | |
| | | | Technology Hardware & Equipment - 4.9% | |
| | 250,184 | | | Apple, Inc. | | $ | 46,311,560 | |
| | 1,017,620 | | | Cisco Systems, Inc. | | | 43,788,189 | |
| | 1,500,863 | | | HP, Inc. | | | 34,054,581 | |
| | 334,591 | | | Motorola Solutions, Inc. | | | 38,936,355 | |
| | | | | | | | |
| | | | | | | 163,090,685 | |
| | | | | | | | |
| | | | Telecommunication Services - 3.1% | | | |
| | 523,366 | | | AT&T, Inc. | | | 16,805,282 | |
| | 1,746,610 | | | Verizon Communications, Inc. | | | 87,871,949 | |
| | | | | | | | |
| | | | | | | 104,677,231 | |
| | | | | | | | |
| | | | Transportation - 3.3% | | | |
| | 125,937 | | | Canadian Pacific Railway Ltd. | | | 23,048,990 | |
| | 379,801 | | | Delta Air Lines, Inc. | | | 18,815,342 | |
| | 228,513 | | | Union Pacific Corp. | | | 32,375,722 | |
| | 356,498 | | | United Parcel Service, Inc. Class B | | | 37,870,782 | |
| | | | | | | | |
| | | | | | | 112,110,836 | |
| | | | | | | | |
| | | | Utilities - 4.8% | | | |
| | 623,080 | | | Dominion Energy, Inc. | | | 42,481,594 | |
| | 544,162 | | | Edison International | | | 34,429,130 | |
| | 777,465 | | | Exelon Corp. | | | 33,120,009 | |
| | 311,904 | | | NextEra Energy, Inc. | | | 52,097,325 | |
| | | | | | | | |
| | | | | | | 162,128,058 | |
| | | | | | | | |
| | |
| | | | Total Common Stocks
(cost $2,382,520,133) | | $ | 3,285,399,588 | |
| | | | | | | | |
| | |
| | | | Total Long-Term Investments
(cost $2,382,520,133) | | $ | 3,285,399,588 | |
| | | | | | | | |
|
| SHORT-TERM INVESTMENTS - 1.6% | |
| | | | Other Investment Pools & Funds - 1.6% | | | |
| | 53,040,559 | | | Fidelity Institutional Government Fund, Institutional Class,
1.80%(1) | | | 53,040,559 | |
| | | | | | | | |
| | |
| | | | Total Short-Term Investments
(cost $53,040,559) | | $ | 53,040,559 | |
| | | | | | | | |
| | | | | | | | | | | | |
| | | |
| | | | Total Investments
(cost $2,435,560,692) | | | 99.6 | % | | $ | 3,338,440,147 | |
| | | | Other Assets and Liabilities | | | 0.4 | % | | | 13,088,910 | |
| | | | | | | | | | | | |
| | | | Total Net Assets | | | 100.0 | % | | $ | 3,351,529,057 | |
| | | | | | | | | | | | |
The accompanying notes are an integral part of these financial statements.
|
| Hartford Dividend and Growth HLS Fund |
Schedule of Investments – (continued)
June 30, 2018 (Unaudited)
| Note: | Percentage of investments as shown is the ratio of the total market value to total net assets. |
| | Equity industry classifications used in this report are the Global Industry Classification Standard, which was developed by and is the exclusive property and service mark of MSCI, Inc. and Standard & Poor’s. |
| | For Fund compliance purposes, the Fund may not use the same classification system shown in this report as these classifications are used for financial reporting purposes. |
| (1) | Current yield as of period end. |
| † | See Significant Accounting Policies of accompanying Notes to Financial Statements regarding valuation of investments. |
| | |
| GLOSSARY: (abbreviations used in preceding Schedule of Investments) |
|
| Other Abbreviations: |
ADR | | American Depositary Receipt |
REIT | | Real Estate Investment Trust |
The accompanying notes are an integral part of these financial statements.
|
| Hartford Dividend and Growth HLS Fund |
Schedule of Investments – (continued)
June 30, 2018 (Unaudited)
Fair Valuation Summary
The following is a summary of the fair valuations according to the inputs used as of June 30, 2018 in valuing the Fund’s investments.
| | | | | | | | | | | | | | | | |
| | | Total | | | Level 1(1) | | | Level 2(1) | | | Level 3(1) | |
Assets | |
Common Stocks | |
Automobiles & Components | | $ | 8,947,405 | | | $ | 8,947,405 | | | $ | — | | | $ | — | |
Banks | | | 351,930,560 | | | | 351,930,560 | | | | — | | | | — | |
Capital Goods | | | 141,286,970 | | | | 141,286,970 | | | | — | | | | — | |
Consumer Services | | | 32,116,558 | | | | 32,116,558 | | | | — | | | | — | |
Diversified Financials | | | 106,053,273 | | | | 106,053,273 | | | | — | | | | — | |
Energy | | | 339,260,442 | | | | 339,260,442 | | | | — | | | | — | |
Food & Staples Retailing | | | 74,732,174 | | | | 74,732,174 | | | | — | | | | — | |
Food, Beverage & Tobacco | | | 75,735,321 | | | | 75,735,321 | | | | — | | | | — | |
Health Care Equipment & Services | | | 185,669,236 | | | | 185,669,236 | | | | — | | | | — | |
Household & Personal Products | | | 26,536,427 | | | | 26,536,427 | | | | — | | | | — | |
Insurance | | | 246,725,896 | | | | 246,725,896 | | | | — | | | | — | |
Materials | | | 161,127,743 | | | | 161,127,743 | | | | — | | | | — | |
Media | | | 91,129,006 | | | | 91,129,006 | | | | — | | | | — | |
Pharmaceuticals, Biotechnology & Life Sciences | | | 262,202,060 | | | | 262,202,060 | | | | — | | | | — | |
Real Estate | | | 85,564,783 | | | | 85,564,783 | | | | — | | | | — | |
Retailing | | | 92,464,707 | | | | 92,464,707 | | | | — | | | | — | |
Semiconductors & Semiconductor Equipment | | | 140,929,591 | | | | 140,929,591 | | | | — | | | | — | |
Software & Services | | | 320,980,626 | | | | 320,980,626 | | | | — | | | | — | |
Technology Hardware & Equipment | | | 163,090,685 | | | | 163,090,685 | | | | — | | | | — | |
Telecommunication Services | | | 104,677,231 | | | | 104,677,231 | | | | — | | | | — | |
Transportation | | | 112,110,836 | | | | 112,110,836 | | | | — | | | | — | |
Utilities | | | 162,128,058 | | | | 162,128,058 | | | | — | | | | — | |
Short-Term Investments | | | 53,040,559 | | | | 53,040,559 | | | | — | | | | — | |
| | | | | | | | | | | | | | | | |
Total | | $ | 3,338,440,147 | | | $ | 3,338,440,147 | | | $ | — | | | $ | — | |
| | | | | | | | | | | | | | | | |
| (1) | For the six-month period ended June 30, 2018, there were no transfers between any levels. |
The accompanying notes are an integral part of these financial statements.
|
| Hartford Global Growth HLS Fund |
Schedule of Investments
June 30, 2018 (Unaudited)
| | | | | | | | |
| Shares or Principal Amount | | Market Value† | |
| COMMON STOCKS - 99.1% | |
| | | | Automobiles & Components - 1.0% | |
| | 50,705 | | | Magna International, Inc. | | $ | 2,949,001 | |
| | 16,356 | | | Volkswagen AG | | | 2,702,179 | |
| | | | | | | | |
| | | | | | | 5,651,180 | |
| | | | | | | | |
| | | | Banks - 4.3% | |
| | 375,972 | | | Banco Santander S.A. | | | 2,009,369 | |
| | 280,759 | | | Bank of America Corp. | | | 7,914,596 | |
| | 40,510 | | | BNP Paribas S.A. | | | 2,505,822 | |
| | 32,070 | | | HDFC Bank Ltd. ADR | | | 3,367,991 | |
| | 24,580 | | | JP Morgan Chase & Co. | | | 2,561,236 | |
| | 18,925 | | | PNC Financial Services Group, Inc. | | | 2,556,768 | |
| | 129,499 | | | UniCredit S.p.A. | | | 2,146,368 | |
| | | | | | | | |
| | | | | | | 23,062,150 | |
| | | | | | | | |
| | | | Capital Goods - 8.2% | |
| | 122,442 | | | ABB Ltd. | | | 2,670,939 | |
| | 35,075 | | | Airbus SE | | | 4,093,070 | |
| | 124,040 | | | Assa Abloy AB Class B | | | 2,631,086 | |
| | 112,160 | | | Atlas Copco AB Class A | | | 3,248,213 | |
| | 13,000 | | | FANUC Corp. | | | 2,576,753 | |
| | 45,507 | | | Fortune Brands Home & Security, Inc. | | | 2,443,271 | |
| | 15,814 | | | General Dynamics Corp. | | | 2,947,888 | |
| | 19,687 | | | Harris Corp. | | | 2,845,559 | |
| | 107,500 | | | Komatsu Ltd. | | | 3,060,370 | |
| | 23,982 | | | Lockheed Martin Corp. | | | 7,085,002 | |
| | 23,600 | | | Nidec Corp. | | | 3,530,314 | |
| | 34,588 | | | Safran S.A. | | | 4,188,774 | |
| | 7,372 | | | SMC Corp. | | | 2,698,819 | |
| | | | | | | | |
| | | | | | | 44,020,058 | |
| | | | | | | | |
| | | | Commercial & Professional Services - 1.8% | |
| | 85,246 | | | Edenred(1) | | | 2,692,640 | |
| | 64,502 | | | IHS Markit Ltd.* | | | 3,327,658 | |
| | 50,437 | | | TransUnion | | | 3,613,307 | |
| | | | | | | | |
| | | | | | | 9,633,605 | |
| | | | | | | | |
| | | | Consumer Durables & Apparel - 3.9% | |
| | 14,160 | | | adidas AG | | | 3,082,882 | |
| | 26,893 | | | Cie Financiere Richemont S.A. | | | 2,273,385 | |
| | 107,787 | | | NIKE, Inc. Class B | | | 8,588,468 | |
| | 1,067 | | | NVR, Inc.* | | | 3,169,363 | |
| | 75,600 | | | Sony Corp. | | | 3,871,805 | |
| | | | | | | | |
| | | | | | | 20,985,903 | |
| | | | | | | | |
| | | | Consumer Services - 3.6% | |
| | 76,285 | | | Hilton Worldwide Holdings, Inc. | | | 6,038,720 | |
| | 186,663 | | | Melco Resorts & Entertainment Ltd. ADR | | | 5,226,564 | |
| | 55,794 | | | New Oriental Education & Technology Group, Inc. ADR | | | 5,281,460 | |
| | 570,862 | | | Sands China Ltd. | | | 3,043,486 | |
| | | | | | | | |
| | | | | | | 19,590,230 | |
| | | | | | | | |
| | | | Diversified Financials - 7.6% | |
| | 74,662 | | | American Express Co. | | | 7,316,876 | |
| | 50,179 | | | Intercontinental Exchange, Inc. | | | 3,690,666 | |
| | 103,401 | | | Julius Baer Group Ltd.* | | | 6,056,344 | |
| | 18,138 | | | Moody’s Corp. | | | 3,093,617 | |
| | 21,145 | | | MSCI, Inc. | | | 3,498,017 | |
| | 29,448 | | | Northern Trust Corp. | | | 3,029,905 | |
| | 4,459 | | | Partners Group Holding AG | | | 3,259,731 | |
| | 17,260 | | | S&P Global, Inc. | | | 3,519,142 | |
| | 136,173 | | | TD Ameritrade Holding Corp. | | | 7,458,195 | |
| | | | | | | | |
| | | | | | | 40,922,493 | |
| | | | | | | | |
| | | | | | | | |
| Shares or Principal Amount | | Market Value† | |
| COMMON STOCKS - 99.1% - (continued) | |
| | | | Energy - 2.0% | |
| | 302,529 | | | Encana Corp. | | $ | 3,951,183 | |
| | 157,698 | | | Galp Energia SGPS S.A. | | | 2,999,992 | |
| | 122,737 | | | Newfield Exploration Co.* | | | 3,712,794 | |
| | | | | | | | |
| | | | | | | 10,663,969 | |
| | | | | | | | |
| | | | Food & Staples Retailing - 0.6% | |
| | 48,775 | | | Sysco Corp. | | | 3,330,845 | |
| | | | | | | | |
| | | | Food, Beverage & Tobacco - 2.5% | |
| | 16,752 | | | Constellation Brands, Inc. Class A | | | 3,666,510 | |
| | 386,569 | | | Davide Campari-Milano S.p.A. | | | 3,172,929 | |
| | 92,593 | | | Diageo plc | | | 3,326,487 | |
| | 54,415 | | | Monster Beverage Corp.* | | | 3,117,980 | |
| | | | | | | | |
| | | | | | | 13,283,906 | |
| | | | | | | | |
| | | | Health Care Equipment & Services - 6.9% | |
| | 55,636 | | | Abbott Laboratories | | | 3,393,239 | |
| | 12,924 | | | Anthem, Inc. | | | 3,076,300 | |
| | 47,336 | | | Baxter International, Inc. | | | 3,495,290 | |
| | 190,101 | | | Boston Scientific Corp.* | | | 6,216,303 | |
| | 26,508 | | | DexCom, Inc.* | | | 2,517,730 | |
| | 28,098 | | | Edwards Lifesciences Corp.* | | | 4,090,226 | |
| | 11,290 | | | Humana, Inc. | | | 3,360,243 | |
| | 23,746 | | | Stryker Corp. | | | 4,009,749 | |
| | 29,327 | | | UnitedHealth Group, Inc. | | | 7,195,086 | |
| | | | | | | | |
| | | | | | | 37,354,166 | |
| | | | | | | | |
| | | | Insurance - 1.8% | |
| | 497,600 | | | AIA Group Ltd. | | | 4,334,798 | |
| | 576,300 | | | Ping An Insurance Group Co. of China Ltd. Class H | | | 5,277,568 | |
| | | | | | | | |
| | | | | | | 9,612,366 | |
| | | | | | | | |
| | | | Materials - 1.7% | |
| | 183,021 | | | BHP Billiton plc | | | 4,107,434 | |
| | 182,863 | | | First Quantum Minerals Ltd. | | | 2,694,296 | |
| | 25,800 | | | Shin-Etsu Chemical Co., Ltd. | | | 2,292,805 | |
| | | | | | | | |
| | | | | | | 9,094,535 | |
| | | | | | | | |
| | | | Pharmaceuticals, Biotechnology & Life Sciences - 3.6% | |
| | 50,590 | | | AstraZeneca plc | | | 3,499,168 | |
| | 63,807 | | | Bristol-Myers Squibb Co. | | | 3,531,079 | |
| | 39,200 | | | Eisai Co., Ltd. | | | 2,759,289 | |
| | 22,783 | | | ICON plc* | | | 3,019,431 | |
| | 1,752,000 | | | Sino Biopharmaceutical Ltd. | | | 2,675,665 | |
| | 19,797 | | | Thermo Fisher Scientific, Inc. | | | 4,100,750 | |
| | | | | | | | |
| | | | | | | 19,585,382 | |
| | | | | | | | |
| | | | Real Estate - 0.7% | |
| | 26,122 | | | American Tower Corp. REIT | | | 3,766,009 | |
| | | | | | | | |
| | | | Retailing - 11.1% | |
| | 12,421 | | | Amazon.com, Inc.* | | | 21,113,216 | |
| | 510,677 | | | B&M European Value Retail S.A. | | | 2,712,903 | |
| | 1,804 | | | Booking Holdings, Inc.* | | | 3,656,870 | |
| | 33,653 | | | Home Depot, Inc. | | | 6,565,700 | |
| | 79,697 | | | Industria de Diseno Textil S.A. | | | 2,714,009 | |
| | 10,317 | | | Netflix, Inc.* | | | 4,038,383 | |
| | 49,775 | | | Ross Stores, Inc. | | | 4,218,431 | |
| | 82,600 | | | TJX Cos., Inc. | | | 7,861,868 | |
| | 25,910 | | | Wayfair, Inc. Class A*(1) | | | 3,077,072 | |
| | 71,830 | | | Zalando SE*(2) | | | 4,003,228 | |
| | | | | | | | |
| | | | | | | 59,961,680 | |
| | | | | | | | |
The accompanying notes are an integral part of these financial statements.
|
| Hartford Global Growth HLS Fund |
Schedule of Investments – (continued)
June 30, 2018 (Unaudited)
| | | | | | | | |
| Shares or Principal Amount | | Market Value† | |
| COMMON STOCKS - 99.1% - (continued) | |
| | | | Semiconductors & Semiconductor Equipment - 3.0% | |
| | 211,873 | | | Advanced Micro Devices, Inc.* | | $ | 3,175,976 | |
| | 139,299 | | | Infineon Technologies AG | | | 3,538,376 | |
| | 51,827 | | | Micron Technology, Inc.* | | | 2,717,808 | |
| | 16,318 | | | NVIDIA Corp. | | | 3,865,734 | |
| | 417,000 | | | Taiwan Semiconductor Manufacturing Co., Ltd. | | | 2,961,148 | |
| | | | | | | | |
| | | | | | | 16,259,042 | |
| | | | | | | | |
| | | | Software & Services - 29.9% | | | |
| | 28,747 | | | Accenture plc Class A | | | 4,702,722 | |
| | 44,045 | | | Adobe Systems, Inc.* | | | 10,738,611 | |
| | 36,653 | | | Alibaba Group Holding Ltd. ADR* | | | 6,800,231 | |
| | 19,835 | | | Alphabet, Inc. Class C* | | | 22,128,918 | |
| | 29,963 | | | Autodesk, Inc.* | | | 3,927,850 | |
| | 1,125 | | | Dropbox, Inc. Class B*(2)(3)(4)(5)(6) | | | 34,801 | |
| | 83,445 | | | eBay, Inc.* | | | 3,025,716 | |
| | 88,867 | | | Facebook, Inc. Class A* | | | 17,268,635 | |
| | 14,707 | | | FleetCor Technologies, Inc.* | | | 3,098,029 | |
| | 29,022 | | | Global Payments, Inc. | | | 3,235,663 | |
| | 20,848 | | | Intuit, Inc. | | | 4,259,351 | |
| | 252,154 | | | Just Eat plc* | | | 2,585,709 | |
| | 50,998 | | | Mastercard, Inc. Class A | | | 10,022,127 | |
| | 145,512 | | | Microsoft Corp. | | | 14,348,938 | |
| | 10,800 | | | Nintendo Co., Ltd. | | | 3,525,434 | |
| | 123,279 | | | PayPal Holdings, Inc.* | | | 10,265,442 | |
| | 69,918 | | | salesforce.com, Inc.* | | | 9,536,815 | |
| | 49,329 | | | ServiceNow, Inc.* | | | 8,507,773 | |
| | 19,670 | | | Spotify Technology S.A.* | | | 3,309,281 | |
| | 137,740 | | | Tencent Holdings Ltd. | | | 6,916,665 | |
| | 40,090 | | | Total System Services, Inc. | | | 3,388,407 | |
| | 50,640 | | | Visa, Inc. Class A | | | 6,707,268 | |
| | 82,719 | | | Yandex N.V. Class A* | | | 2,969,612 | |
| | | | | | | | |
| | | | | | | 161,303,998 | |
| | | | | | | | |
| | | | Technology Hardware & Equipment - 2.8% | | | |
| | 39,315 | | | CDW Corp. | | | 3,176,259 | |
| | 190,541 | | | Flex Ltd.* | | | 2,688,534 | |
| | 5,787 | | | Keyence Corp. | | | 3,263,950 | |
| | 82,488 | | | Samsung Electronics Co., Ltd. | | | 3,455,386 | |
| | 135,583 | | | Sunny Optical Technology Group Co., Ltd. | | | 2,514,706 | |
| | | | | | | | |
| | | | | | | 15,098,835 | |
| | | | | | | | |
| | | | Telecommunication Services - 0.7% | | | |
| | 58,816 | | | T-Mobile US, Inc.* | | | 3,514,256 | |
| | | | | | | | |
| | | | Transportation - 1.4% | | | |
| | 39,274 | | | Canadian National Railway Co. | | | 3,212,363 | |
| | 31,473 | | | Union Pacific Corp. | | | 4,459,095 | |
| | | | | | | | |
| | | | | | | 7,671,458 | |
| | | | | | | | |
| | |
| | | | Total Common Stocks
(cost $388,795,426) | | $ | 534,366,066 | |
| | | | | | | | |
|
| WARRANTS - 0.0% | |
| | | | Diversified Financials - 0.0% | | | |
| | 1,035 | | | Emergent Capital, Inc. Expires 4/11/19*(4)(6) | | $ | — | |
| | | | | | | | |
| | |
| | | | Total Warrants
(cost $—) | | $ | — | |
| | | | | | | | |
| | |
| | | | Total Long-Term Investments
(cost $388,795,426) | | $ | 534,366,066 | |
| | | | | | | | |
| | | | | | | | |
| Shares or Principal Amount | | Market Value† | |
| SHORT-TERM INVESTMENTS - 1.2% | |
| | | | Other Investment Pools & Funds - 0.9% | | | |
| | 4,875,125 | | | Fidelity Institutional Government Fund, Institutional Class,
1.80%(7) | | $ | 4,875,125 | |
| | | | | | | | |
| | | | Securities Lending Collateral - 0.3% | | | |
| | 68,688 | | | Citibank NA DDCA,
1.91%, 7/2/2018(7) | | | 68,688 | |
| | 463,982 | | | Goldman Sachs Financial Square Funds, Government Institutional Fund,
1.81%(7) | | | 463,982 | |
| | 431,134 | | | Invesco Government & Agency Portfolio,
1.81%(7) | | | 431,133 | |
| | 127,196 | | | Morgan Stanley Institutional Liquidity Funds, Government Portfolio, Institutional Class,
1.84%(7) | | | 127,196 | |
| | 282,758 | | | Western Asset Institutional Government Class A Fund,
1.79%(7) | | | 282,758 | |
| | | | | | | | |
| | | | | | | 1,373,757 | |
| | | | | | | | |
| | |
| | | | Total Short-Term Investments
(cost $6,248,882) | | $ | 6,248,882 | |
| | | | | | | | |
| | | | | | | | | | | | |
| | | |
| | | | Total Investments
(cost $395,044,308) | | | 100.3 | % | | $ | 540,614,948 | |
| | | | Other Assets and Liabilities | | | (0.3 | )% | | | (1,541,511 | ) |
| | | | | | | | | | | | |
| | | | Total Net Assets | | | 100.0 | % | | $ | 539,073,437 | |
| | | | | | | | | | | | |
The accompanying notes are an integral part of these financial statements.
|
| Hartford Global Growth HLS Fund |
Schedule of Investments – (continued)
June 30, 2018 (Unaudited)
| Note: | Percentage of investments as shown is the ratio of the total market value to total net assets. |
| | Prices of foreign equities that are principally traded on certain foreign markets will generally be adjusted daily pursuant to a fair value pricing service approved by the Board of Directors in order to reflect an adjustment for factors occurring after the close of certain foreign markets but before the close of the New York Stock Exchange. |
| | Equity industry classifications used in this report are the Global Industry Classification Standard, which was developed by and is the exclusive property and service mark of MSCI, Inc. and Standard & Poor’s. |
| | For Fund compliance purposes, the Fund may not use the same classification system shown in this report as these classifications are used for financial reporting purposes. |
| (1) | Represents entire or partial securities on loan. See Note 8 in the accompanying Notes to Financial Statements for securities lending information. |
| (2) | Securities issued within terms of a private placement memorandum and exempt from registration under Rule 144A under the Securities Act of 1933, as amended, and may be sold to qualified institutional buyers. Unless otherwise indicated, these holdings are determined to be liquid. At June 30, 2018, the aggregate value of these securities was $4,038,029, which represented 0.7% of total net assets. |
| (3) | Investment valued using significant unobservable inputs. |
| (4) | These securities are valued in good faith at fair value as determined under policies and procedures established by and under the supervision of the Board of Directors. At June 30, 2018, the aggregate fair value of these securities was $34,801, which represented 0.0% of total net assets. This amount excludes securities that are principally traded in certain foreign markets and whose prices are adjusted pursuant to a third party pricing service methodology approved by the Board of Directors. |
| (5) | The following illiquid securities are considered restricted due to a contractual lock-up period associated with the securities. |
| | | | | | | | | | | | |
Period
Acquired | | Security Name | | Shares/Par
Value | | Base
Total Cost | | | Base
Market
Value | |
| 05/2012 | | Dropbox, Inc. Class B | | 1,125 | | $ | 15,270 | | | $ | 34,801 | |
| (6) | This security has been identified as illiquid. Illiquid securities are often purchased in private placement transactions, are often not registered under the Securities Act of 1933, as amended, and may have contractual restrictions on resale. A security may also be considered illiquid if the security lacks a readily available market or if its valuation has not changed for a certain period of time. The identification of illiquid securities is unaudited.At June 30, 2018, the aggregate value of these securities was $34,801, which represented 0.0% of total net assets. |
| (7) | Current yield as of period end. |
| † | See Significant Accounting Policies of accompanying Notes to Financial Statements regarding valuation of investments. |
| | |
| GLOSSARY: (abbreviations used in preceding Schedule of Investments) |
|
| Other Abbreviations: |
ADR | | American Depositary Receipt |
DDCA | | Dollars on Deposit in Custody Account |
MSCI | | Morgan Stanley Capital International |
REIT | | Real Estate Investment Trust |
The accompanying notes are an integral part of these financial statements.
|
| Hartford Global Growth HLS Fund |
Schedule of Investments – (continued)
June 30, 2018 (Unaudited)
Fair Valuation Summary
The following is a summary of the fair valuations according to the inputs used as of June 30, 2018 in valuing the Fund’s investments.
| | | | | | | | | | | | | | | | |
| | | Total | | | Level 1(1) | | | Level 2(1) | | | Level 3(1) | |
Assets | |
Common Stocks | | | | | | | | | | | | | | | | |
Automobiles & Components | | $ | 5,651,180 | | | $ | 2,949,001 | | | $ | 2,702,179 | | | $ | — | |
Banks | | | 23,062,150 | | | | 16,400,591 | | | | 6,661,559 | | | | — | |
Capital Goods | | | 44,020,058 | | | | 15,321,720 | | | | 28,698,338 | | | | — | |
Commercial & Professional Services | | | 9,633,605 | | | | 6,940,965 | | | | 2,692,640 | | | | — | |
Consumer Durables & Apparel | | | 20,985,903 | | | | 11,757,831 | | | | 9,228,072 | | | | — | |
Consumer Services | | | 19,590,230 | | | | 16,546,744 | | | | 3,043,486 | | | | — | |
Diversified Financials | | | 40,922,493 | | | | 31,606,418 | | | | 9,316,075 | | | | — | |
Energy | | | 10,663,969 | | | | 7,663,977 | | | | 2,999,992 | | | | — | |
Food & Staples Retailing | | | 3,330,845 | | | | 3,330,845 | | | | — | | | | — | |
Food, Beverage & Tobacco | | | 13,283,906 | | | | 6,784,490 | | | | 6,499,416 | | | | — | |
Health Care Equipment & Services | | | 37,354,166 | | | | 37,354,166 | | | | — | | | | — | |
Insurance | | | 9,612,366 | | | | — | | | | 9,612,366 | | | | — | |
Materials | | | 9,094,535 | | | | 2,694,296 | | | | 6,400,239 | | | | — | |
Pharmaceuticals, Biotechnology & Life Sciences | | | 19,585,382 | | | | 10,651,260 | | | | 8,934,122 | | | | — | |
Real Estate | | | 3,766,009 | | | | 3,766,009 | | | | — | | | | — | |
Retailing | | | 59,961,680 | | | | 50,531,540 | | | | 9,430,140 | | | | — | |
Semiconductors & Semiconductor Equipment | | | 16,259,042 | | | | 9,759,518 | | | | 6,499,524 | | | | — | |
Software & Services | | | 161,303,998 | | | | 148,241,389 | | | | 13,027,808 | | | | 34,801 | |
Technology Hardware & Equipment | | | 15,098,835 | | | | 5,864,793 | | | | 9,234,042 | | | | — | |
Telecommunication Services | | | 3,514,256 | | | | 3,514,256 | | | | — | | | | — | |
Transportation | | | 7,671,458 | | | | 7,671,458 | | | | — | | | | — | |
Warrants | | | — | | | | — | | | | — | | | | — | |
Short-Term Investments | | | 6,248,882 | | | | 6,248,882 | | | | — | | | | — | |
| | | | | | | | | | | | | | | | |
Total | | $ | 540,614,948 | | | $ | 405,600,149 | | | $ | 134,979,998 | | | $ | 34,801 | |
| | | | | | | | | | | | | | | | |
| (1) | For the six-month period ended June 30, 2018, there were no transfers between any levels. |
Level 3 investments at the beginning and/or end of the period in relation to net assets were not significant and accordingly, a reconciliation of Level 3 assets for the period ended June 30, 2018 is not presented.
The accompanying notes are an integral part of these financial statements.
|
| Hartford Growth Opportunities HLS Fund |
Schedule of Investments
June 30, 2018 (Unaudited)
| | | | | | | | |
| Shares or Principal Amount | | Market Value† | |
| COMMON STOCKS - 91.7% | |
| | | | Automobiles & Components - 0.9% | |
| | 74,909 | | | Ferrari N.V. | | $ | 10,113,464 | |
| | 14,583 | | | Tesla, Inc.*(1) | | | 5,001,240 | |
| | | | | | | | |
| | | | | | | 15,114,704 | |
| | | | | | | | |
| | | | Capital Goods - 5.0% | |
| | 163,923 | | | Deere & Co. | | | 22,916,435 | |
| | 82,349 | | | Harris Corp. | | | 11,902,725 | |
| | 88,579 | | | IDEX Corp. | | | 12,089,262 | |
| | 118,179 | | | Rockwell Automation, Inc. | | | 19,644,895 | |
| | 964,461 | | | Williams Corp.*(1) | | | 14,274,023 | |
| | | | | | | | |
| | | | | | | 80,827,340 | |
| | | | | | | | |
| | | | Commercial & Professional Services - 3.5% | |
| | 1,908,353 | | | ADT, Inc.(1) | | | 16,507,253 | |
| | 81,484 | | | CoStar Group, Inc.* | | | 33,622,743 | |
| | 18,785 | | | Klarna Holding AB(2)(3)(4)(5) | | | 2,611,140 | |
| | 514,848 | | | Landscape Acquisition Holdings Ltd.* | | | 4,672,246 | |
| | | | | | | | |
| | | | | | | 57,413,382 | |
| | | | | | | | |
| | | | Consumer Durables & Apparel - 3.8% | |
| | 73,431 | | | Mohawk Industries, Inc.* | | | 15,734,060 | |
| | 107,738 | | | Polaris Industries, Inc. | | | 13,163,429 | |
| | 434,306 | | | Skechers USA, Inc. Class A* | | | 13,033,523 | |
| | 220,790 | | | Under Armour, Inc. Class A*(1) | | | 4,963,359 | |
| | 704,857 | | | Under Armour, Inc. Class C*(1) | | | 14,858,386 | |
| | | | | | | | |
| | | | | | | 61,752,757 | |
| | | | | | | | |
| | | | Consumer Services - 4.0% | |
| | 1,556,596 | | | DraftKings, Inc.*(2)(3)(4)(5) | | | 3,035,362 | |
| | 202,910 | | | Hilton Worldwide Holdings, Inc. | | | 16,062,356 | |
| | 189,346 | | | Marriott Vacations Worldwide Corp. | | | 21,388,524 | |
| | 441,600 | | | Melco Resorts & Entertainment Ltd. ADR | | | 12,364,800 | |
| | 45,536 | | | Vail Resorts, Inc. | | | 12,485,516 | |
| | | | | | | | |
| | | | | | | 65,336,558 | |
| | | | | | | | |
| | | | Diversified Financials - 4.2% | |
| | 348,650 | | | American Express Co. | | | 34,167,700 | |
| | 1,142,999 | | | J2 Acquisition Ltd.*(3) | | | 11,155,670 | |
| | 577,000 | | | Platinum Eagle Acquisition Corp.* | | | 5,798,850 | |
| | 306,063 | | | TD Ameritrade Holding Corp. | | | 16,763,071 | |
| | | | | | | | |
| | | | | | | 67,885,291 | |
| | | | | | | | |
| | | | Energy - 2.0% | |
| | 49,400 | | | Diamondback Energy, Inc. | | | 6,499,558 | |
| | 55,118 | | | EOG Resources, Inc. | | | 6,858,333 | |
| | 372,433 | | | Newfield Exploration Co.* | | | 11,266,098 | |
| | 415,095 | | | WPX Energy, Inc.* | | | 7,484,163 | |
| | | | | | | | |
| | | | | | | 32,108,152 | |
| | | | | | | | |
| | | | Food, Beverage & Tobacco - 1.0% | |
| | 234,128 | | | Lamb Weston Holdings, Inc. | | | 16,040,109 | |
| | | | | | | | |
| | | | Health Care Equipment & Services - 8.4% | |
| | 80,124 | | | Align Technology, Inc.* | | | 27,413,625 | |
| | 451,801 | | | Baxter International, Inc. | | | 33,360,986 | |
| | 125,375 | | | DexCom, Inc.* | | | 11,908,118 | |
| | 201,344 | | | Edwards Lifesciences Corp.* | | | 29,309,646 | |
| | 248,130 | | | Insulet Corp.* | | | 21,264,741 | |
| | 173,368 | | | Veeva Systems, Inc. Class A* | | | 13,325,064 | |
| | | | | | | | |
| | | | | | | 136,582,180 | |
| | | | | | | | |
| | | | Materials - 2.4% | |
| | 188,752 | | | Packaging Corp. of America | | | 21,100,586 | |
| | 143,504 | | | Vulcan Materials Co. | | | 18,520,626 | |
| | | | | | | | |
| | | | | | | 39,621,212 | |
| | | | | | | | |
| | | | | | | | |
| Shares or Principal Amount | | Market Value† | |
| COMMON STOCKS - 91.7% - (continued) | |
| | | | Media - 0.4% | |
| | 680,569 | | | Ocean Outdoor Ltd.*(2)(3)(4)(5) | | $ | 6,516,448 | |
| | | | | | | | |
| | | | Pharmaceuticals, Biotechnology & Life Sciences - 3.4% | |
| | 375,033 | | | AstraZeneca plc ADR | | | 13,167,408 | |
| | 24,902 | | | Bluebird Bio, Inc.* | | | 3,908,369 | |
| | 519,654 | | | Exact Sciences Corp.* | | | 31,070,113 | |
| | 120,215 | | | Seattle Genetics, Inc.* | | | 7,981,074 | |
| | | | | | | | |
| | | | | | | 56,126,964 | |
| | | | | | | | |
| | | | Real Estate - 0.0% | |
| | 10,657 | | | WeWork Companies, Inc. Class A, REIT*(2)(3)(4)(5) | | | 552,139 | |
| | | | | | | | |
| | | | Retailing - 13.8% | |
| | 52,492 | | | Amazon.com, Inc.* | | | 89,225,902 | |
| | 179,912 | | | Dollar Tree, Inc.* | | | 15,292,520 | |
| | 510,051 | | | Floor & Decor Holdings, Inc. Class A* | | | 25,160,816 | |
| | 41,578 | | | JAND, Inc. Class A(2)(3)(4)(5) | | | 564,629 | |
| | 78,268 | | | Netflix, Inc.* | | | 30,636,443 | |
| | 155,794 | | | Tiffany & Co. | | | 20,502,491 | |
| | 38,805 | | | Tory Burch LLC*(2)(3)(4)(5) | | | 2,106,337 | |
| | 314,578 | | | TripAdvisor, Inc.* | | | 17,525,140 | |
| | 202,192 | | | Wayfair, Inc. Class A*(1) | | | 24,012,322 | |
| | | | | | | | |
| | | | | | | 225,026,600 | |
| | | | | | | | |
| | | | Semiconductors & Semiconductor Equipment - 5.4% | |
| | 166,413 | | | Microchip Technology, Inc. | | | 15,135,262 | |
| | 434,595 | | | Micron Technology, Inc.* | | | 22,790,162 | |
| | 107,353 | | | NVIDIA Corp. | | | 25,431,926 | |
| | 661,529 | | | Teradyne, Inc. | | | 25,184,409 | |
| | | | | | | | |
| | | | | | | 88,541,759 | |
| | | | | | | | |
| | | | Software & Services - 30.1% | |
| | 178,338 | | | 2U, Inc.* | | | 14,901,923 | |
| | 99,828 | | | Adobe Systems, Inc.* | | | 24,339,065 | |
| | 113,540 | | | Atlassian Corp. plc Class A* | | | 7,098,521 | |
| | 165,618 | | | Autodesk, Inc.* | | | 21,710,864 | |
| | 466,791 | | | Facebook, Inc. Class A* | | | 90,706,827 | |
| | 82,558 | | | FleetCor Technologies, Inc.* | | | 17,390,843 | |
| | 152,025 | | | ForeScout Technologies, Inc.* | | | 5,208,376 | |
| | 390,890 | | | Guidewire Software, Inc.* | | | 34,703,214 | |
| | 90,400 | | | Okta, Inc.* | | | 4,553,448 | |
| | 382,267 | | | PayPal Holdings, Inc.* | | | 31,831,373 | |
| | 335,761 | | | salesforce.com, Inc.* | | | 45,797,800 | |
| | 168,112 | | | ServiceNow, Inc.* | | | 28,994,277 | |
| | 140,775 | | | Shopify, Inc. Class A*(1) | | | 20,537,665 | |
| | 190,982 | | | Spotify Technology S.A.* | | | 32,130,812 | |
| | 474,901 | | | SS&C Technologies Holdings, Inc. | | | 24,647,362 | |
| | 268,456 | | | Trade Desk, Inc. Class A*(1) | | | 25,181,173 | |
| | 94,966 | | | Weibo Corp. ADR* | | | 8,429,182 | |
| | 234,165 | | | Wix.com Ltd.* | | | 23,486,749 | |
| | 244,999 | | | Workday, Inc. Class A* | | | 29,674,279 | |
| | 23,388 | | | Zuora, Inc. Class A*(1) | | | 636,153 | |
| | | | | | | | |
| | | | | | | 491,959,906 | |
| | | | | | | | |
| | | | Technology Hardware & Equipment - 1.9% | |
| | 78,801 | | | IPG Photonics Corp.* | | | 17,385,864 | |
| | 92,103 | | | Zebra Technologies Corp. Class A* | | | 13,193,755 | |
| | | | | | | | |
| | | | | | | 30,579,619 | |
| | | | | | | | |
| | | | Transportation - 1.5% | |
| | 396,647 | | | CSX Corp. | | | 25,298,146 | |
| | | | | | | | |
| | |
| | | | Total Common Stocks
(cost $1,251,704,705) | | $ | 1,497,283,266 | |
| | | | | | | | |
The accompanying notes are an integral part of these financial statements.
|
| Hartford Growth Opportunities HLS Fund |
Schedule of Investments – (continued)
June 30, 2018 (Unaudited)
| | | | | | | | |
| Shares or Principal Amount | | Market Value† | |
| PREFERRED STOCKS - 4.6% | |
| | | | Real Estate - 0.8% | |
| | 114,486 | | | WeWork Companies, Inc. Class D-2*(2)(3)(4)(5) | | $ | 5,931,520 | |
| | 145,709 | | | WeWork Companies, Inc. Class D-1*(2)(3)(4)(5) | | | 7,549,183 | |
| | | | | | | | |
| | | | | | | 13,480,703 | |
| | | | | | | | |
| | | | Retailing - 0.6% | |
| | 1,605,750 | | | Coupang LLC*(2)(3)(4)(5) | | | 7,991,978 | |
| | 92,843 | | | JAND, Inc. Series D*(2)(3)(4)(5) | | | 1,295,160 | |
| | | | | | | | |
| | | | | | | 9,287,138 | |
| | | | | | | | |
| | | | Software & Services - 3.2% | |
| | 1,871,878 | | | Essence Group Holdings Corp. Series 3*(2)(3)(4)(5) | | | 4,005,819 | |
| | 287,204 | | | Lookout, Inc. Series F*(2)(3)(4)(5) | | | 2,469,954 | |
| | 366,944 | | | MarkLogic Corp. Series F*(2)(3)(4)(5) | | | 3,669,440 | |
| | 488,790 | | | Pinterest, Inc. Series G*(2)(3)(4)(5) | | | 3,377,539 | |
| | 589,628 | | | Uber Technologies, Inc. Series D*(2)(3)(4)(5) | | | 23,585,120 | |
| | 580,036 | | | Zuora, Inc. Series F*(2)(3)(4)(5)(6) | | | 14,874,186 | |
| | | | | | | | |
| | | | | | | 51,982,058 | |
| | | | | | | | |
| | |
| | | | Total Preferred Stocks
(cost $37,963,753) | | $ | 74,749,899 | |
| | | | | | | | |
|
| CONVERTIBLE PREFERRED STOCKS - 0.2% | |
| | | | Retailing - 0.2% | |
| | 102,040 | | | Honest Co. Series C*(2)(3)(4)(5) | | $ | 3,114,261 | |
| | | | | | | | |
| | |
| | | | Total Convertible Preferred Stocks
(cost $2,760,927) | | $ | 3,114,261 | |
| | | | | | | | |
|
| ESCROWS - 0.1% | |
| | | | Capital Goods - 0.0% | |
| | 1,458,400 | | | Lithium Technology Corp., Escrow(2)(3)(4)(5) | | $ | 437,520 | |
| | | | | | | | |
| | | | Software & Services - 0.1% | |
| | 1,070,278 | | | Birst, Inc. Escrow*(2)(3)(4)(5) | | | 101,677 | |
| | 210,735 | | | Veracode, Inc. Escrow*(2)(3)(4)(5) | | | 847,155 | |
| | | | | | | | |
| | | | | | | 948,832 | |
| | | | | | | | |
| | | | Telecommunication Services - 0.0% | |
| | 49,126 | | | Docusign Earnout, Escrow*(2)(3)(4)(5) | | | 110,533 | |
| | | | | | | | |
| | |
| | | | Total Escrows
(cost $—) | | $ | 1,496,885 | |
| | | | | | | | |
|
| WARRANTS - 0.2% | |
| | | | Capital Goods - 0.1% | |
| | 621,393 | | | Williams Corp. Expires 9/16/20* | | $ | 1,404,348 | |
| | | | | | | | |
| | | | Commercial & Professional Services - 0.0% | |
| | 516,400 | | | Landscape Acquisition Holdings Ltd. Expires 11/23/22* | | | 180,740 | |
| | | | | | | | |
| | | | Diversified Financials - 0.0% | |
| | 1,195,579 | | | J2 Acquisition Ltd. Expires 9/7/27* | | | 538,011 | |
| | | | | | | | |
| | | | Real Estate - 0.1% | |
| | 214,600 | | | Vinhomes JSC Expires 5/23/28* | | | 1,050,636 | |
| | | | | | | | |
| | |
| | | | Total Warrants
(cost $1,656,521) | | $ | 3,173,735 | |
| | | | | | | | |
| | |
| | | | Total Long-Term Investments
(cost $1,294,085,906) | | $ | 1,579,818,046 | |
| | | | | | | | |
| | | | | | | | |
| Shares or Principal Amount | | Market Value† | |
| SHORT-TERM INVESTMENTS - 6.0% | |
| | | | Other Investment Pools & Funds - 3.3% | | | |
| | 53,900,687 | | | Morgan Stanley Institutional Liquidity Funds, Government Portfolio, Institutional Class, 1.84%(7) | | $ | 53,900,687 | |
| | | | | | | | |
| | | | Securities Lending Collateral - 2.7% | | | |
| | 2,248,295 | | | Citibank NA DDCA,
1.91%, 7/2/2018(7) | | | 2,248,295 | |
| | 15,187,077 | | | Goldman Sachs Financial Square Funds, Government Institutional Fund, 1.81%(7) | | | 15,187,077 | |
| | 14,111,892 | | | Invesco Government & Agency Portfolio, 1.81%(7) | | | 14,111,892 | |
| | 4,163,385 | | | Morgan Stanley Institutional Liquidity Funds, Government Portfolio, Institutional Class, 1.84%(7) | | | 4,163,385 | |
| | 9,255,249 | | | Western Asset Institutional Government Class A Fund, 1.79%(7) | | | 9,255,249 | |
| | | | | | | | |
| | | | | | | 44,965,898 | |
| | | | | | | | |
| | |
| | | | Total Short-Term Investments
(cost $98,866,585) | | $ | 98,866,585 | |
| | | | | | | | |
| | | | | | | | | | | | |
| | | |
| | | | Total Investments
(cost $1,392,952,491) | | | 102.8 | % | | $ | 1,678,684,631 | |
| | | | Other Assets and Liabilities | | | (2.8 | )% | | | (46,233,818 | ) |
| | | | | | | | | | | | |
| | | | Total Net Assets | | | 100.0 | % | | $ | 1,632,450,813 | |
| | | | | | | | | | | | |
The accompanying notes are an integral part of these financial statements.
|
| Hartford Growth Opportunities HLS Fund |
Schedule of Investments – (continued)
June 30, 2018 (Unaudited)
| Note: | Percentage of investments as shown is the ratio of the total market value to total net assets. |
| | Prices of foreign equities that are principally traded on certain foreign markets will generally be adjusted daily pursuant to a fair value pricing service approved by the Board of Directors in order to reflect an adjustment for factors occurring after the close of certain foreign markets but before the close of the New York Stock Exchange. |
| | Equity industry classifications used in this report are the Global Industry Classification Standard, which was developed by and is the exclusive property and service mark of MSCI, Inc. and Standard & Poor’s. |
| | For Fund compliance purposes, the Fund may not use the same classification system shown in this report as these classifications are used for financial reporting purposes. |
| (1) | Represents entire or partial securities on loan. See Note 8 in the accompanying Notes to Financial Statements for securities lending information. |
| (2) | Investment valued using significant unobservable inputs. |
| (3) | Securities issued within terms of a private placement memorandum and exempt from registration under Rule 144A under the Securities Act of 1933, as amended, and may be sold to qualified institutional buyers. Unless otherwise indicated, these holdings are determined to be liquid. At June 30, 2018, the aggregate value of these securities was $105,902,770, which represented 6.5% of total net assets. |
| (4) | These securities are valued in good faith at fair value as determined under policies and procedures established by and under the supervision of the Board of Directors. At June 30, 2018, the aggregate fair value of these securities was $94,747,100, which represented 5.8% of total net assets. This amount excludes securities that are principally traded in certain foreign markets and whose prices are adjusted pursuant to a third party pricing service methodology approved by the Board of Directors. |
| (5) | This security has been identified as illiquid. Illiquid securities are often purchased in private placement transactions, are often not registered under the Securities Act of 1933, as amended, and may have contractual restrictions on resale. A security may also be considered illiquid if the security lacks a readily available market or if its valuation has not changed for a certain period of time. The identification of illiquid securities is unaudited. At June 30, 2018, the aggregate value of these securities was $94,747,100, which represented 5.8% of total net assets. |
| (6) | The following illiquid securities are considered restricted due to a contractual lock-up period associated with the securities. |
| | | | | | | | | | | | |
Period
Acquired | | Security Name | | Shares/Par
Value | | Base
Total Cost | | | Base
Market
Value | |
| 01/2015 | | Zuora, Inc. Series F Preferred | | 580,036 | | $ | 4,407,461 | | | $ | 14,874,186 | |
| (7) | Current yield as of period end. |
| † | See Significant Accounting Policies of accompanying Notes to Financial Statements regarding valuation of investments. |
| | |
| GLOSSARY: (abbreviations used in preceding Schedule of Investments) |
|
| Other Abbreviations: |
ADR | | American Depositary Receipt |
DDCA | | Dollars on Deposit in Custody Account |
JSC | | Joint Stock Company |
REIT | | Real Estate Investment Trust |
The accompanying notes are an integral part of these financial statements.
|
| Hartford Growth Opportunities HLS Fund |
Schedule of Investments – (continued)
June 30, 2018 (Unaudited)
Fair Valuation Summary
The following is a summary of the fair valuations according to the inputs used as of June 30, 2018 in valuing the Fund’s investments.
| | | | | | | | | | | | | | | | |
| | | Total | | | Level 1(1) | | | Level 2(1) | | | Level 3(1) | |
Assets | | | | | | | | | | | | | | | | |
Common Stocks | | | | | | | | | | | | | | | | |
Automobiles & Components | | $ | 15,114,704 | | | $ | 15,114,704 | | | $ | — | | | $ | — | |
Capital Goods | | | 80,827,340 | | | | 80,827,340 | | | | — | | | | — | |
Commercial & Professional Services | | | 57,413,382 | | | | 54,802,242 | | | | — | | | | 2,611,140 | |
Consumer Durables & Apparel | | | 61,752,757 | | | | 61,752,757 | | | | — | | | | — | |
Consumer Services | | | 65,336,558 | | | | 62,301,196 | | | | — | | | | 3,035,362 | |
Diversified Financials | | | 67,885,291 | | | | 67,885,291 | | | | — | | | | — | |
Energy | | | 32,108,152 | | | | 32,108,152 | | | | — | | | | — | |
Food, Beverage & Tobacco | | | 16,040,109 | | | | 16,040,109 | | | | — | | | | — | |
Health Care Equipment & Services | | | 136,582,180 | | | | 136,582,180 | | | | — | | | | — | |
Materials | | | 39,621,212 | | | | 39,621,212 | | | | — | | | | — | |
Media | | | 6,516,448 | | | | — | | | | — | | | | 6,516,448 | |
Pharmaceuticals, Biotechnology & Life Sciences | | | 56,126,964 | | | | 56,126,964 | | | | — | | | | — | |
Real Estate | | | 552,139 | | | | — | | | | — | | | | 552,139 | |
Retailing | | | 225,026,600 | | | | 222,355,634 | | | | — | | | | 2,670,966 | |
Semiconductors & Semiconductor Equipment | | | 88,541,759 | | | | 88,541,759 | | | | — | | | | — | |
Software & Services | | | 491,959,906 | | | | 491,959,906 | | | | — | | | | — | |
Technology Hardware & Equipment | | | 30,579,619 | | | | 30,579,619 | | | | — | | | | — | |
Transportation | | | 25,298,146 | | | | 25,298,146 | | | | — | | | | — | |
Preferred Stocks | | | 74,749,899 | | | | — | | | | — | | | | 74,749,899 | |
Convertible Preferred Stocks | | | 3,114,261 | | | | — | | | | — | | | | 3,114,261 | |
Escrows | | | 1,496,885 | | | | — | | | | — | | | | 1,496,885 | |
Warrants | | | 3,173,735 | | | | 2,123,099 | | | | 1,050,636 | | | | — | |
Short-Term Investments | | | 98,866,585 | | | | 98,866,585 | | | | — | | | | — | |
| | | | | | | | | | | | | | | | |
Total | | $ | 1,678,684,631 | | | $ | 1,582,886,895 | | | $ | 1,050,636 | | | $ | 94,747,100 | |
| | | | | | | | | | | | | | | | |
| (1) | For the six-month period ended June 30, 2018, there were no transfers from Level 1 to Level 2, investments valued at $4,900,099 were transferred from Level 1 to Level 3 due to the unavailability of active market pricing. |
The following is a rollforward of the Fund’s investments that were valued using unobservable inputs (Level 3) for the six-month period ended June 30, 2018:
| | | | | | | | | | | | | | | | | | | | |
| | | Common
Stocks | | | Preferred
Stocks | | | Convertible
Preferred
Stocks | | | Escrows | | | Total | |
Beginning balance | | $ | 22,670,128 | | | $ | 70,602,059 | | | $ | 3,114,261 | | | $ | — | | | $ | 96,386,448 | |
Conversions* | | | (1,430,104 | ) | | | — | | | | — | | | | 1,430,104 | | | | — | |
Purchases | | | 1,706,524 | | | | — | | | | — | | | | — | | | | 1,706,524 | |
Sales | | | (6,190,916 | ) | | | (9,033,437 | ) | | | — | | | | — | | | | (15,224,353 | ) |
Accrued discounts/(premiums) | | | — | | | | — | | | | — | | | | — | | | | — | |
Total realized gain/(loss) | | | (697,199 | ) | | | 3,901,816 | | | | — | | | | — | | | | 3,204,617 | |
Net change in unrealized appreciation/depreciation | | | (5,572,477 | ) | | | 9,279,461 | | | | — | | | | 66,781 | | | | 3,773,765 | |
Transfers into Level 3 | | | 4,900,099 | | | | — | | | | — | | | | — | | | | 4,900,099 | |
Transfers out of Level 3 | | | — | | | | — | | | | — | | | | — | | | | — | |
| | | | | | | | | | | | | | | | | | | | |
Ending balance | | $ | 15,386,055 | | | $ | 74,749,899 | | | $ | 3,114,261 | | | $ | 1,496,885 | | | $ | 94,747,100 | |
| | | | | | | | | | | | | | | | | | | | |
The change in net unrealized appreciation/(depreciation) relating to the Level 3 investments held at June 30, 2018 was $10,845,228.
| * | Private Equity securities that were a common stock are now trading as escrow. |
| Note: | For purposes of reporting transfers between different hierarchy levels, both transfers in and out of each level, as applicable, are shown as if they occurred at the beginning of the period. |
The accompanying notes are an integral part of these financial statements.
|
| Hartford Healthcare HLS Fund |
Schedule of Investments
June 30, 2018 (Unaudited)
| | | | | | | | |
| Shares or Principal Amount | | Market Value† | |
| COMMON STOCKS - 98.3% | | | |
| | | | Biotechnology - 27.6% | | | |
| | 183,372 | | | Aduro Biotech, Inc.*(1) | | $ | 1,283,604 | |
| | 28,553 | | | Aimmune Therapeutics, Inc.* | | | 767,790 | |
| | 68,373 | | | Alder Biopharmaceuticals, Inc.* | | | 1,080,293 | |
| | 119,016 | | | Alkermes plc* | | | 4,898,699 | |
| | 32,381 | | | Alnylam Pharmaceuticals, Inc.* | | | 3,189,205 | |
| | 43,204 | | | Arena Pharmaceuticals, Inc.* | | | 1,883,694 | |
| | 52,685 | | | Audentes Therapeutics, Inc.* | | | 2,013,094 | |
| | 9,692 | | | Biogen, Inc.* | | | 2,813,006 | |
| | 10,100 | | | Biohaven Pharmaceutical Holding Co., Ltd.* | | | 399,152 | |
| | 23,272 | | | Bluebird Bio, Inc.* | | | 3,652,540 | |
| | 58,961 | | | Calithera Biosciences, Inc.* | | | 294,805 | |
| | 35,698 | | | Celgene Corp.* | | | 2,835,135 | |
| | 89,370 | | | Clementia Pharmaceuticals, Inc.* | | | 1,176,109 | |
| | 209,100 | | | Coherus Biosciences, Inc.* | | | 2,927,400 | |
| | 105,055 | | | Cytokinetics, Inc.* | | | 871,957 | |
| | 59,600 | | | Forty Seven, Inc.* | | | 953,600 | |
| | 63,659 | | | G1 Therapeutics, Inc.*(1) | | | 2,766,620 | |
| | 17,631 | | | Galapagos N.V.* | | | 1,623,770 | |
| | 15,740 | | | Genmab A/S* | | | 2,421,883 | |
| | 57,559 | | | Global Blood Therapeutics, Inc.* | | | 2,601,667 | |
| | 118,341 | | | GlycoMimetics, Inc.* | | | 1,908,840 | |
| | 52,420 | | | Heron Therapeutics, Inc.* | | | 2,036,517 | |
| | 28,199 | | | Incyte Corp.* | | | 1,889,333 | |
| | 18,676 | | | Innate Pharma S.A.*(1) | | | 101,356 | |
| | 138,403 | | | Ironwood Pharmaceuticals, Inc.*(1) | | | 2,646,265 | |
| | 102,878 | | | Karyopharm Therapeutics, Inc.* | | | 1,747,897 | |
| | 49,882 | | | Loxo Oncology, Inc.* | | | 8,653,529 | |
| | 75,072 | | | Momenta Pharmaceuticals, Inc.* | | | 1,535,222 | |
| | 45,265 | | | Neon Therapeutics, Inc.* | | | 570,339 | |
| | 77,300 | | | Nightstar Therapeutics plc ADR*(1) | | | 1,236,800 | |
| | 113,258 | | | Portola Pharmaceuticals, Inc.*(1) | | | 4,277,755 | |
| | 39,780 | | | Radius Health, Inc.* | | | 1,172,317 | |
| | 8,374 | | | Regeneron Pharmaceuticals, Inc.* | | | 2,888,946 | |
| | 369,467 | | | Rigel Pharmaceuticals, Inc.* | | | 1,045,592 | |
| | 107,016 | | | Seattle Genetics, Inc.* | | | 7,104,792 | |
| | 136,257 | | | Syndax Pharmaceuticals, Inc.* | | | 956,524 | |
| | 23,676 | | | TESARO, Inc.*(1) | | | 1,052,872 | |
| | 147,278 | | | Trevena, Inc.*(1) | | | 212,080 | |
| | 22,957 | | | Ultragenyx Pharmaceutical, Inc.* | | | 1,764,705 | |
| | 31,460 | | | UroGen Pharma Ltd.* | | | 1,565,450 | |
| | 31,210 | | | Vertex Pharmaceuticals, Inc.* | | | 5,304,452 | |
| | 22,612 | | | Zealand Pharma A/S ADR* | | | 286,720 | |
| | | | | | | | |
| | | | | | | 90,412,326 | |
| | | | | | | | |
| | | | Drug Retail - 0.7% | | | |
| | 24,860 | | | Walgreens Boots Alliance, Inc. | | | 1,491,973 | |
| | 5,696 | | | Zur Rose Group AG* | | | 745,535 | |
| | | | | | | | |
| | | | | | | 2,237,508 | |
| | | | | | | | |
| | | | Health Care Distributors - 2.2% | | | |
| | 47,214 | | | Cardinal Health, Inc. | | | 2,305,460 | |
| | 36,094 | | | McKesson Corp. | | | 4,814,939 | |
| | | | | | | | |
| | | | | | | 7,120,399 | |
| | | | | | | | |
| | | | Health Care Equipment - 22.4% | | | |
| | 111,149 | | | Abbott Laboratories | | | 6,778,977 | |
| | 62,731 | | | AtriCure, Inc.* | | | 1,696,874 | |
| | 24,059 | | | Baxter International, Inc. | | | 1,776,517 | |
| | 24,547 | | | Becton Dickinson and Co. | | | 5,880,479 | |
| | 322,626 | | | Boston Scientific Corp.* | | | 10,549,870 | |
| | 25,817 | | | Danaher Corp. | | | 2,547,622 | |
| | 26,749 | | | Edwards Lifesciences Corp.* | | | 3,893,852 | |
| | | | | | | | |
| Shares or Principal Amount | | Market Value† | |
| COMMON STOCKS - 98.3% - (continued) | | | |
| | | | Health Care Equipment - 22.4% - (continued) | | | |
| | 123,344 | | | Globus Medical, Inc. Class A* | | $ | 6,223,938 | |
| | 132,389 | | | K2M Group Holdings, Inc.* | | | 2,978,752 | |
| | 39,203 | | | Koninklijke Philips N.V. | | | 1,660,951 | |
| | 166,850 | | | Medtronic plc | | | 14,284,028 | |
| | 21,507 | | | NuVasive, Inc.* | | | 1,120,945 | |
| | 11,600 | | | Siemens Healthineers AG*(2) | | | 478,020 | |
| | 51,981 | | | Stryker Corp. | | | 8,777,512 | |
| | 12,401 | | | Teleflex, Inc. | | | 3,326,072 | |
| | 15,112 | | | Zimmer Biomet Holdings, Inc. | | | 1,684,081 | |
| | | | | | | | |
| | | | | | | 73,658,490 | |
| | | | | | | | |
| | | | Health Care Facilities - 2.8% | | | |
| | 43,250 | | | Acadia Healthcare Co., Inc.* | | | 1,769,357 | |
| | 815,417 | | | China Resources Phoenix Healthcare Holdings Co., Ltd. | | | 995,284 | |
| | 135,445 | | | Georgia Healthcare Group plc*(2) | | | 451,372 | |
| | 37,449 | | | HCA Healthcare, Inc. | | | 3,842,267 | |
| | 21,142 | | | LifePoint Health, Inc.* | | | 1,031,730 | |
| | 9,472 | | | Universal Health Services, Inc. Class B | | | 1,055,560 | |
| | | | | | | | |
| | | | | | | 9,145,570 | |
| | | | | | | | |
| | | | Health Care Supplies - 0.9% | | | |
| | 21,279 | | | DENTSPLY SIRONA, Inc. | | | 931,382 | |
| | 91,421 | | | Endologix, Inc.* | | | 517,443 | |
| | 95,539 | | | OraSure Technologies, Inc.* | | | 1,573,527 | |
| | | | | | | | |
| | | | | | | 3,022,352 | |
| | | | | | | | |
| | | | Health Care Technology - 3.0% | | | |
| | 27,250 | | | athenahealth, Inc.* | | | 4,336,565 | |
| | 22,341 | | | Cerner Corp.* | | | 1,335,768 | |
| | 85,611 | | | HMS Holdings Corp.* | | | 1,850,910 | |
| | 40,210 | | | Teladoc, Inc.*(1) | | | 2,334,191 | |
| | | | | | | | |
| | | | | | | 9,857,434 | |
| | | | | | | | |
| | | | Life Sciences Tools & Services - 3.6% | | | |
| | 12,194 | | | ICON plc* | | | 1,616,071 | |
| | 35,887 | | | Syneos Health, Inc.* | | | 1,683,100 | |
| | 850 | | | Tecan Group AG | | | 206,282 | |
| | 40,796 | | | Thermo Fisher Scientific, Inc. | | | 8,450,483 | |
| | | | | | | | |
| | | | | | | 11,955,936 | |
| | | | | | | | |
| | | | Managed Health Care - 12.1% | | | |
| | 7,711 | | | Aetna, Inc. | | | 1,414,969 | |
| | 24,224 | | | Anthem, Inc. | | | 5,766,039 | |
| | 14,500 | | | Centene Corp.* | | | 1,786,545 | |
| | 26,290 | | | Cigna Corp. | | | 4,467,985 | |
| | 5,867 | | | Humana, Inc. | | | 1,746,195 | |
| | 10,991 | | | Molina Healthcare, Inc.* | | | 1,076,459 | |
| | 82,391 | | | UnitedHealth Group, Inc. | | | 20,213,808 | |
| | 12,881 | | | WellCare Health Plans, Inc.* | | | 3,171,817 | |
| | | | | | | | |
| | | | | | | 39,643,817 | |
| | | | | | | | |
| | | | Pharmaceuticals - 23.0% | | | |
| | 59,348 | | | Allergan plc | | | 9,894,498 | |
| | 43,525 | | | Amneal Pharmaceuticals, Inc.* | | | 714,245 | |
| | 206,674 | | | AstraZeneca plc ADR | | | 7,256,324 | |
| | 221,937 | | | Bristol-Myers Squibb Co. | | | 12,281,994 | |
| | 25,965 | | | Chugai Pharmaceutical Co., Ltd. | | | 1,359,541 | |
| | 93,300 | | | Clearside Biomedical, Inc.*(1) | | | 997,377 | |
| | 49,297 | | | Dermira, Inc.* | | | 453,532 | |
| | 54,154 | | | Eisai Co., Ltd. | | | 3,811,901 | |
| | 94,914 | | | Eli Lilly & Co. | | | 8,099,012 | |
| | 61,900 | | | Evolus, Inc.*(1) | | | 1,732,581 | |
The accompanying notes are an integral part of these financial statements.
|
| Hartford Healthcare HLS Fund |
Schedule of Investments – (continued)
June 30, 2018 (Unaudited)
| | | | | | | | |
| Shares or Principal Amount | | Market Value† | |
| COMMON STOCKS - 98.3% - (continued) | | | |
| | | | Pharmaceuticals - 23.0% - (continued) | | | |
| | 14,205 | | | Hikma Pharmaceuticals plc | | $ | 280,187 | |
| | 36,897 | | | Intersect ENT, Inc.* | | | 1,381,793 | |
| | 11,023 | | | Johnson & Johnson | | | 1,337,531 | |
| | 19,645 | | | Kala Pharmaceuticals, Inc.* | | | 269,726 | |
| | 104,897 | | | Medicines Co.* | | | 3,849,720 | |
| | 236,571 | | | MediWound Ltd.* | | | 1,632,340 | |
| | 105,556 | | | Mylan N.V.* | | | 3,814,794 | |
| | 70,473 | | | MyoKardia, Inc.* | | | 3,498,984 | |
| | 335,166 | | | Nabriva Therapeutics plc*(1) | | | 1,166,378 | |
| | 81,561 | | | Ono Pharmaceutical Co., Ltd. | | | 1,909,409 | |
| | 66,867 | | | Revance Therapeutics, Inc.* | | | 1,835,499 | |
| | 32,686 | | | Shionogi & Co., Ltd. | | | 1,677,246 | |
| | 807,736 | | | Sino Biopharmaceutical Ltd. | | | 1,233,579 | |
| | 15,824 | | | Takeda Pharmaceutical Co., Ltd. | | | 665,685 | |
| | 48,326 | | | Teva Pharmaceutical Industries Ltd. ADR | | | 1,175,288 | |
| | 17,900 | | | Tricida, Inc.* | | | 535,210 | |
| | 32,155 | | | UCB S.A. | | | 2,520,640 | |
| | | | | | | | |
| | | | | | | 75,385,014 | |
| | | | | | | | |
| | |
| | | | Total Common Stocks
(cost $257,023,227) | | $ | 322,438,846 | |
| | | | | | | | |
| | |
| | | | Total Long-Term Investments
(cost $257,023,227) | | $ | 322,438,846 | |
| | | | | | | | |
|
| SHORT-TERM INVESTMENTS - 6.0% | |
| | | | Other Investment Pools & Funds - 2.2% | | | |
| | 7,074,871 | | | Fidelity Institutional Government Fund, Institutional Class, 1.80%(3) | | | 7,074,871 | |
| | | | | | | | |
| | | | Securities Lending Collateral - 3.8% | | | |
| | 631,111 | | | Citibank NA DDCA, 1.91%, 7/2/2018(3) | | | 631,111 | |
| | 4,263,109 | | | Goldman Sachs Financial Square Funds, Government Institutional Fund, 1.81%(3) | | | 4,263,109 | |
| | 3,961,298 | | | Invesco Government & Agency Portfolio, 1.81%(3) | | | 3,961,298 | |
| | 1,168,689 | | | Morgan Stanley Institutional Liquidity Funds, Government Portfolio, Institutional Class, 1.84%(3) | | | 1,168,689 | |
| | 2,598,007 | | | Western Asset Institutional Government Class A Fund, 1.79%(3) | | | 2,598,007 | |
| | | | | | | | |
| | | | | | | 12,622,214 | |
| | | | | | | | |
| | |
| | | | Total Short-Term Investments
(cost $19,697,085) | | $ | 19,697,085 | |
| | | | | | | | |
| | | | | | | | |
| | | | | | | | | | | | |
| | | |
| | | | Total Investments
(cost $276,720,312) | | | 104.3 | % | | $ | 342,135,931 | |
| | | | Other Assets and Liabilities | | | (4.3 | )% | | | (14,037,852 | ) |
| | | | | | | | | | | | |
| | | | Total Net Assets | | | 100.0 | % | | $ | 328,098,079 | |
| | | | | | | | | | | | |
The accompanying notes are an integral part of these financial statements.
|
| Hartford Healthcare HLS Fund |
Schedule of Investments – (continued)
June 30, 2018 (Unaudited)
| Note: | Percentage of investments as shown is the ratio of the total market value to total net assets. |
| | Prices of foreign equities that are principally traded on certain foreign markets will generally be adjusted daily pursuant to a fair value pricing service approved by the Board of Directors in order to reflect an adjustment for factors occurring after the close of certain foreign markets but before the close of the New York Stock Exchange. |
| | Equity industry classifications used in this report are the Global Industry Classification Standard, which was developed by and is the exclusive property and service mark of MSCI, Inc. and Standard & Poor’s. |
| | For Fund compliance purposes, the Fund may not use the same classification system shown in this report as these classifications are used for financial reporting purposes. |
| (1) | Represents entire or partial securities on loan. See Note 8 in the accompanying Notes to Financial Statements for securities lending information. |
| (2) | Securities issued within terms of a private placement memorandum and exempt from registration under Rule 144A under the Securities Act of 1933, as amended, and may be sold to qualified institutional buyers. Unless otherwise indicated, these holdings are determined to be liquid. At June 30, 2018, the aggregate value of these securities was $929,392, which represented 0.3% of total net assets. |
| (3) | Current yield as of period end. |
| † | See Significant Accounting Policies of accompanying Notes to Financial Statements regarding valuation of investments. |
| | |
| GLOSSARY: (abbreviations used in preceding Schedule of Investments) |
|
| Other Abbreviations: |
ADR | | American Depositary Receipt |
DDCA | | Dollars on Deposit in Custody Account |
The accompanying notes are an integral part of these financial statements.
|
| Hartford Healthcare HLS Fund |
Schedule of Investments – (continued)
June 30, 2018 (Unaudited)
Fair Valuation Summary
The following is a summary of the fair valuations according to the inputs used as of June 30, 2018 in valuing the Fund’s investments.
| | | | | | | | | | | | | | | | |
| | | Total | | | Level 1(1) | | | Level 2(1) | | | Level 3(1) | |
Assets | | | | | | | | | | | | | | | | |
Common Stocks | | | | | | | | | | | | | | | | |
Biotechnology | | $ | 90,412,326 | | | $ | 86,265,317 | | | $ | 4,147,009 | | | $ | — | |
Drug Retail | | | 2,237,508 | | | | 1,491,973 | | | | 745,535 | | | | — | |
Health Care Distributors | | | 7,120,399 | | | | 7,120,399 | | | | — | | | | — | |
Health Care Equipment | | | 73,658,490 | | | | 73,180,470 | | | | 478,020 | | | | — | |
Health Care Facilities | | | 9,145,570 | | | | 7,698,914 | | | | 1,446,656 | | | | — | |
Health Care Supplies | | | 3,022,352 | | | | 3,022,352 | | | | — | | | | — | |
Health Care Technology | | | 9,857,434 | | | | 9,857,434 | | | | — | | | | — | |
Life Sciences Tools & Services | | | 11,955,936 | | | | 11,749,654 | | | | 206,282 | | | | — | |
Managed Health Care | | | 39,643,817 | | | | 39,643,817 | | | | — | | | | — | |
Pharmaceuticals | | | 75,385,014 | | | | 65,113,151 | | | | 10,271,863 | | | | — | |
Short-Term Investments | | | 19,697,085 | | | | 19,697,085 | | | | — | | | | — | |
| | | | | | | | | | | | | | | | |
Total | | $ | 342,135,931 | | | $ | 324,840,566 | | | $ | 17,295,365 | | | $ | — | |
| | | | | | | | | | | | | | | | |
| (1) | For the six-month period ended June 30, 2018, investments valued at $4,954,554 were transferred from Level 1 to Level 2 due to the application of a fair valuation model factor; there were no transfers from Level 2 to Level 1 and there were no transfers in and out of Level 3. |
| Note: | For purposes of reporting transfers between different hierarchy levels, both transfers in and out of each level, as applicable, are shown as if they occurred at the beginning of the period. |
The accompanying notes are an integral part of these financial statements.
|
| Hartford High Yield HLS Fund |
Schedule of Investments
June 30, 2018 (Unaudited)
| | | | | | | | | | | | |
| Shares or Principal Amount | | Market Value† | |
| COMMON STOCKS - 1.2% | |
| | | | Consumer Services - 0.2% | |
| | | | | 58,800 | | | Caesars Entertainment Corp.* | | $ | 629,160 | |
| | | | | | | | | | | | |
| | | | Energy - 0.8% | |
| | | | | 206,275,142 | | | KCA Deutag*(1)(2)(3)(4) | | | 1,204,647 | |
| | | | | 19,100 | | | Peabody Energy Corp. | | | 868,668 | |
| | | | | | | | | | | | |
| | | | | | | | | | | 2,073,315 | |
| | | | | | | | | | | | |
| | | | Materials - 0.2% | |
| | | | | 57,600 | | | Constellium N.V. Class A* | | | 593,280 | |
| | | | | | | | | | | | |
| | |
| | | | Total Common Stocks
(cost $5,098,075) | | $ | 3,295,755 | |
| | | | | | | | | | | | |
| | | |
| | | | | | | | | | | | |
| ASSET & COMMERCIAL MORTGAGE BACKED SECURITIES - 0.0% | |
| | | | Asset-Backed - Finance & Insurance - 0.0% | |
| | $ | | | | 2,490,000 | | | Soundview NIM Trust
8.25%, 12/25/2036(2) | | $ | — | |
| | | | | | | | | | | | |
| | |
| | | | Total Asset & Commercial Mortgage Backed Securities
(cost $2,478,958) | | $ | — | |
| | | | | | | | | | | | |
| | | |
| | | | | | | | | | | | |
| CORPORATE BONDS - 87.6% | |
| | | | Aerospace/Defense - 0.4% | |
| | | | DAE Funding LLC | |
| | $ | | | | 370,000 | | | 4.50%, 08/01/2022(2) | | $ | 358,900 | |
| | | | | 760,000 | | | 5.00%, 08/01/2024(2) | | | 729,980 | |
| | | | | | | | | | | | |
| | | | 1,088,880 | |
| | | | | | | | | | | | |
| | | | Auto Manufacturers - 0.1% | |
| | | | | 400,000 | | | Tesla, Inc.
5.30%, 08/15/2025(2) | | | 356,000 | |
| | | | | | | | | | | | |
| | | | Auto Parts & Equipment - 0.2% | |
| | | | | 685,000 | | | Goodyear Tire & Rubber Co.
5.00%, 05/31/2026 | | | 637,050 | |
| | | | | | | | | | | | |
| | | | Biotechnology - 0.1% | |
| | | | | 370,000 | | | Sotera Health Topco, Inc.
8.13%, 11/01/2021(2)(5) | | | 370,925 | |
| | | | | | | | | | | | |
| | | | Chemicals - 0.5% | |
| | | | Chemours Co. | |
| | | | | 970,000 | | | 6.63%, 05/15/2023 | | | 1,017,287 | |
| | | | | 305,000 | | | 7.00%, 05/15/2025 | | | 327,113 | |
| | | | | | | | | | | | |
| | | | 1,344,400 | |
| | | | | | | | | | | | |
| | | | | | | Coal - 2.8% | |
| | | | | 1,365,000 | | | Cloud Peak Energy Resources LLC / Cloud Peak Energy Finance Corp.
12.00%, 11/01/2021 | | | 1,409,363 | |
| | | | | 2,515,000 | | | Foresight Energy LLC / Foresight Energy Finance Corp.
11.50%, 04/01/2023(2) | | | 2,225,775 | |
| | | | | 2,390,000 | | | Peabody Energy Corp.
6.38%, 03/31/2025(2) | | | 2,467,675 | |
| | | | | 1,535,000 | | | Warrior Met Coal, Inc.
8.00%, 11/01/2024(2) | | | 1,584,887 | |
| | | | | | | | | | | | |
| | | | 7,687,700 | |
| | | | | | | | | | | | |
| | | | Commercial Banks - 5.0% | |
| | | | Banco Bilbao Vizcaya Argentaria S.A. | |
| | | | | 2,000,000 | | | 5 year USD Swap + 3.870%,
6.13%, 11/16/2027(6) | | | 1,765,000 | |
| | | | | | | | | | | | |
| Shares or Principal Amount | | Market Value† | |
| CORPORATE BONDS - 87.6% - (continued) | |
| | | | Commercial Banks - 5.0% - (continued) | |
| | EUR | | | | 800,000 | | | 5 year EUR Swap + 6.155%,
7.00%, 02/19/2019(6)(7)(8) | | $ | 955,266 | |
| | | | | 400,000 | | | 5 year EUR Swap + 9.177%,
8.88%, 04/14/2021(6)(7)(8) | | | 523,197 | |
| | | | | 1,400,000 | | | Banco de Sabadell S.A.
5 year EUR Swap + 6.414%,
6.50%, 05/18/2022(6)(7)(8) | | | 1,632,958 | |
| | | | BNP Paribas S.A. | |
| | $ | | | | 260,000 | | | 5 year USD Swap + 2.838%,
5.13%, 11/15/2027(2)(6)(7) | | | 229,029 | |
| | | | | 1,080,000 | | | 5 year USD Swap + 6.314%,
7.63%, 03/30/2021(2)(6)(7) | | | 1,127,250 | |
| | | | | 690,000 | | | Credit Agricole S.A.
5 year USD Swap + 4.898%,
7.88%, 01/23/2024(2)(6)(7) | | | 703,800 | |
| | | | | 1,180,000 | | | Credit Suisse Group AG
5 year USD Swap + 3.455%,
6.25%, 12/18/2024(6)(7)(8) | | | 1,153,577 | |
| | | | | 1,580,000 | | | Freedom Mortgage Corp.
8.13%, 11/15/2024(2) | | | 1,532,600 | |
| | | | | 730,000 | | | Intesa Sanpaolo S.p.A.
5 year USD Swap + 5.462%,
7.70%, 09/17/2025(2)(6)(7) | | | 681,820 | |
| | | | | | | | Royal Bank of Scotland Group plc | |
| | | | | 1,300,000 | | | 3 mo. USD LIBOR + 2.320%,
4.65%, 09/30/2027(6)(7) | | | 1,243,125 | |
| | | | | 385,000 | | | 5 year USD Swap + 7.598%,
8.63%, 08/15/2021(6)(7) | | | 409,159 | |
| | | | | 640,000 | | | Societe Generale S.A.
5 year USD Swap + 6.394%,
8.25%, 11/29/2018(6)(7)(8) | | | 647,200 | |
| | | | | 1,200,000 | | | UniCredit S.p.A.
5 year USD Swap + 5.180%,
8.00%, 06/03/2024(6)(7)(8) | | | 1,124,702 | |
| | | | | | | | | | | | |
| | | | | | | | | | | 13,728,683 | |
| | | | | | | | | | | | |
| | | | | | | Commercial Services - 4.7% | |
| | | | | 500,000 | | | ACE Cash Express, Inc.
12.00%, 12/15/2022(2) | | | 541,250 | |
| | | | | | | | APX Group, Inc. | |
| | | | | 1,180,000 | | | 7.63%, 09/01/2023 | | | 1,047,250 | |
| | | | | 2,050,000 | | | 7.88%, 12/01/2022 | | | 2,037,187 | |
| | | | | | | | Avis Budget Car Rental LLC / Avis Budget Finance, Inc. | | | | |
| | | | | 1,875,000 | | | 5.25%, 03/15/2025(2) | | | 1,706,250 | |
| | | | | 985,000 | | | 5.50%, 04/01/2023 | | | 960,375 | |
| | | | | 1,344,000 | | | Brand Industrial Services, Inc.
8.50%, 07/15/2025(2) | | | 1,360,800 | |
| | | | | 1,450,000 | | | Garda World Security Corp.
8.75%, 05/15/2025(2) | | | 1,482,625 | |
| | | | | | | | Herc Rentals, Inc. | |
| | | | | 760,000 | | | 7.50%, 06/01/2022(2) | | | 803,700 | |
| | | | | 1,353,000 | | | 7.75%, 06/01/2024(2) | | | 1,444,328 | |
| | | | | 385,000 | | | Service Corp. International
4.63%, 12/15/2027 | | | 363,671 | |
| | | | | | | | United Rentals North America, Inc. | |
| | | | | 440,000 | | | 4.63%, 10/15/2025 | | | 419,100 | |
| | | | | 875,000 | | | 5.88%, 09/15/2026 | | | 883,750 | |
| | | | | | | | | | | | |
| | | | | | | | | | | 13,050,286 | |
| | | | | | | | | | | | |
The accompanying notes are an integral part of these financial statements.
|
| Hartford High Yield HLS Fund |
Schedule of Investments – (continued)
June 30, 2018 (Unaudited)
| | | | | | | | | | | | |
| Shares or Principal Amount | | Market Value† | |
| CORPORATE BONDS - 87.6% - (continued) | |
| | | | | | | Construction Materials - 0.8% | |
| | $ | | | | 675,000 | | | Cemex Finance LLC
6.00%, 04/01/2024(2) | | $ | 683,438 | |
| | | | | 1,605,000 | | | Standard Industries, Inc.
5.38%, 11/15/2024(2) | | | 1,584,937 | |
| | | | | | | | | | | | |
| | | | | | | | | | | 2,268,375 | |
| | | | | | | | | | | | |
| | | | | | | Diversified Financial Services - 4.1% | |
| | | | | 620,000 | | | Fly Leasing Ltd.
5.25%, 10/15/2024 | | | 581,250 | |
| | | | | 1,370,000 | | | goeasy Ltd.
7.88%, 11/01/2022(2) | | | 1,448,775 | |
| | | | | | | | Navient Corp. | |
| | | | | 417,000 | | | 5.50%, 01/25/2023 | | | 409,703 | |
| | | | | 365,000 | | | 5.63%, 08/01/2033 | | | 308,425 | |
| | | | | 1,641,000 | | | 5.88%, 10/25/2024 | | | 1,585,616 | |
| | | | | 1,240,000 | | | 6.13%, 03/25/2024 | | | 1,224,500 | |
| | | | | 815,000 | | | 6.50%, 06/15/2022 | | | 834,356 | |
| | | | | 527,000 | | | 7.25%, 09/25/2023 | | | 552,032 | |
| | | | | | | | Springleaf Finance Corp. | |
| | | | | 490,000 | | | 5.25%, 12/15/2019 | | | 496,125 | |
| | | | | 410,000 | | | 6.88%, 03/15/2025 | | | 406,925 | |
| | | | | 675,000 | | | 7.75%, 10/01/2021 | | | 725,625 | |
| | | | | 1,730,000 | | | 8.25%, 12/15/2020 | | | 1,864,075 | |
| | | | | 720,000 | | | Tempo Acquisition LLC / Tempo Acquisition Finance Corp.
6.75%, 06/01/2025(2) | | | 691,200 | |
| | | | | 285,000 | | | Vantiv LLC / Vanity Issuer Corp.
4.38%, 11/15/2025(2) | | | 271,953 | |
| | | | | | | | | | | | |
| | | | 11,400,560 | |
| | | | | | | | | | | | |
| | | | Electric - 0.8% | |
| | | | | 2,220,000 | | | AES Corp.
5.13%, 09/01/2027 | | | 2,214,450 | |
| | | | | | | | | | | | |
| | | | Electrical Components & Equipment - 0.5% | |
| | EUR | | | | 1,085,000 | | | Energizer Gamma Acquisition B.V.
4.63%, 07/15/2026(2)(9) | | | 1,276,389 | |
| | | | | | | | | | | | |
| | | | Entertainment - 3.2% | |
| | $ | | | | 1,150,000 | | | Caesars Resort Collection LLC / CRC Finco, Inc.
5.25%, 10/15/2025(2) | | | 1,088,187 | |
| | | | | 1,350,000 | | | Eldorado Resorts, Inc.
6.00%, 04/01/2025 | | | 1,351,687 | |
| | | | | 1,655,000 | | | Jacobs Entertainment, Inc.
7.88%, 02/01/2024(2) | | | 1,729,475 | |
| | | | | 1,880,000 | | | Penn National Gaming, Inc.
5.63%, 01/15/2027(2) | | | 1,771,900 | |
| | | | | 1,225,000 | | | Pinnacle Entertainment, Inc.
5.63%, 05/01/2024 | | | 1,271,734 | |
| | | | Scientific Games International, Inc. | |
| | | | | 195,000 | | | 5.00%, 10/15/2025(2) | | | 185,738 | |
| | | | | 1,150,000 | | | 6.63%, 05/15/2021 | | | 1,164,375 | |
| | | | | 325,000 | | | WMG Acquisition Corp.
5.00%, 08/01/2023(2) | | | 323,375 | |
| | | | | | | | | | | | |
| | | | 8,886,471 | |
| | | | | | | | | | | | |
| | | | Environmental Control - 0.8% | |
| | | | | 2,107,000 | | | Tervita Escrow Corp.
7.63%, 12/01/2021(2) | | | 2,149,140 | |
| | | | | | | | | | | | |
| | | | | | | | | | | | |
| Shares or Principal Amount | | Market Value† | |
| CORPORATE BONDS - 87.6% - (continued) | |
| | | | Food - 2.1% | |
| | | | Post Holdings, Inc. | |
| | $ | | | | 2,510,000 | | | 5.00%, 08/15/2026(2) | | $ | 2,340,575 | |
| | | | | 1,151,000 | | | 5.63%, 01/15/2028(2) | | | 1,079,063 | |
| | | | | 660,000 | | | 5.75%, 03/01/2027(2) | | | 640,200 | |
| | | | | 1,665,000 | | | TreeHouse Foods, Inc.
4.88%, 03/15/2022 | | | 1,668,646 | |
| | | | | | | | | | | | |
| | | | 5,728,484 | |
| | | | | | | | | | | | |
| | | | Healthcare - Products - 1.1% | |
| | | | | 2,895,000 | | | Sotera Health Holdings LLC
6.50%, 05/15/2023(2) | | | 2,952,900 | |
| | | | | | | | | | | | |
| | | | Healthcare - Services - 3.4% | |
| | | | Envision Healthcare Corp. | |
| | | | | 370,000 | | | 5.13%, 07/01/2022(2) | | | 373,238 | |
| | | | | 940,000 | | | 5.63%, 07/15/2022 | | | 952,338 | |
| | | | | 1,835,000 | | | HCA Healthcare, Inc.
6.25%, 02/15/2021 | | | 1,903,812 | |
| | | | HCA, Inc. | |
| | | | | 1,340,000 | | | 5.25%, 06/15/2026 | | | 1,330,888 | |
| | | | | 1,085,000 | | | 5.38%, 02/01/2025 | | | 1,068,399 | |
| | | | | 1,599,000 | | | 7.50%, 11/15/2095 | | | 1,539,037 | |
| | | | | 2,340,000 | | | West Street Merger Sub, Inc.
6.38%, 09/01/2025(2) | | | 2,234,700 | |
| | | | | | | | | | | | |
| | | | 9,402,412 | |
| | | | | | | | | | | | |
| | | | Home Builders - 2.7% | |
| | | | | 1,690,000 | | | AV Homes, Inc.
6.63%, 05/15/2022 | | | 1,744,925 | |
| | | | Beazer Homes USA, Inc. | |
| | | | | 370,000 | | | 5.88%, 10/15/2027 | | | 322,277 | |
| | | | | 525,000 | | | 6.75%, 03/15/2025 | | | 501,375 | |
| | | | | 1,120,000 | | | 8.75%, 03/15/2022 | | | 1,190,000 | |
| | | | | 1,310,000 | | | KB Home
8.00%, 03/15/2020 | | | 1,395,150 | |
| | | | M/I Homes, Inc. | |
| | | | | 150,000 | | | 5.63%, 08/01/2025 | | | 140,250 | |
| | | | | 2,115,000 | | | 6.75%, 01/15/2021 | | | 2,180,650 | |
| | | | | | | | | | | | |
| | | | 7,474,627 | |
| | | | | | | | | | | | |
| | | | Household Products - 0.5% | |
| | | | | 2,400,000 | | | Revlon Consumer Products Corp.
6.25%, 08/01/2024 | | | 1,344,000 | |
| | | | | | | | | | | | |
| | | | Household Products/Wares - 0.5% | |
| | EUR | | | | 1,320,000 | | | Diamond (BC) B.V.
5.63%, 08/15/2025(2) | | | 1,381,489 | |
| | | | | | | | | | | | |
| | | | Insurance - 1.2% | |
| | | | Genworth Holdings, Inc. | |
| | $ | | | | 110,000 | | | 4.80%, 02/15/2024 | | | 95,425 | |
| | | | | 770,000 | | | 4.90%, 08/15/2023 | | | 673,750 | |
| | | | | 440,000 | | | 7.20%, 02/15/2021 | | | 447,700 | |
| | | | | 245,000 | | | 7.63%, 09/24/2021 | | | 250,174 | |
| | | | | 35,000 | | | 7.70%, 06/15/2020 | | | 36,050 | |
| | | | | 1,910,000 | | | USIS Merger Sub, Inc.
6.88%, 05/01/2025(2) | | | 1,900,450 | |
| | | | | | | | | | | | |
| | | | 3,403,549 | |
| | | | | | | | | | | | |
| | | | Internet - 1.2% | |
| | | | | 1,035,000 | | | Netflix, Inc.
5.88%, 02/15/2025 | | | 1,061,693 | |
| | | | | 2,145,000 | | | Zayo Group LLC / Zayo Capital, Inc.
6.00%, 04/01/2023 | | | 2,182,537 | |
| | | | | | | | | | | | |
| | | | 3,244,230 | |
| | | | | | | | | | | | |
The accompanying notes are an integral part of these financial statements.
|
| Hartford High Yield HLS Fund |
Schedule of Investments – (continued)
June 30, 2018 (Unaudited)
| | | | | | | | | | | | |
| Shares or Principal Amount | | Market Value† | |
| CORPORATE BONDS - 87.6% - (continued) | |
| | | | Iron/Steel - 1.1% | |
| | | | AK Steel Corp. | |
| | $ | | | | 760,000 | | | 7.00%, 03/15/2027 | | $ | 722,000 | |
| | | | | 1,015,000 | | | 7.63%, 10/01/2021 | | | 1,034,995 | |
| | | | Steel Dynamics, Inc. | |
| | | | | 230,000 | | | 4.13%, 09/15/2025 | | | 220,513 | |
| | | | | 1,130,000 | | | 5.50%, 10/01/2024 | | | 1,151,187 | |
| | | | | | | | | | | | |
| | | | 3,128,695 | |
| | | | | | | | | | | | |
| | | | IT Services - 0.6% | |
| | | | | 1,480,000 | | | Conduent Finance, Inc. / Conduent Business Services LLC
10.50%, 12/15/2024(2) | | | 1,770,450 | |
| | | | | | | | | | | | |
| | | | Lodging - 2.9% | |
| | | | Boyd Gaming Corp. | |
| | | | | 790,000 | | | 6.00%, 08/15/2026(2) | | | 782,100 | |
| | | | | 920,000 | | | 6.38%, 04/01/2026 | | | 931,500 | |
| | | | | 1,935,000 | | | FelCor Lodging L.P.
6.00%, 06/01/2025 | | | 1,983,375 | |
| | | | | 1,630,000 | | | Jack Ohio Finance LLC / Jack Ohio Finance Corp.
6.75%, 11/15/2021(2) | | | 1,678,900 | |
| | | | | 1,170,000 | | | Station Casinos LLC
5.00%, 10/01/2025(2) | | | 1,099,800 | |
| | | | | 1,585,000 | | | Sugarhouse HSP Gaming Prop Mezz L.P. / Sugarhouse HSP Gaming Finance Corp.
5.88%, 05/15/2025(2) | | | 1,489,900 | |
| | | | | | | | | | | | |
| | | | 7,965,575 | |
| | | | | | | | | | | | |
| | | | Machinery - Construction & Mining - 0.6% | |
| | | | | 1,555,000 | | | BlueLine Rental Finance Corp. / BlueLine Rental LLC
9.25%, 03/15/2024(2) | | | 1,654,365 | |
| | | | | | | | | | | | |
| | | | Machinery - Diversified - 0.8% | |
| | | | | 1,935,000 | | | Cloud Crane LLC
10.13%, 08/01/2024(2) | | | 2,080,125 | |
| | | | | | | | | | | | |
| | | | Media - 8.2% | |
| | | | | 2,370,000 | | | Altice France S.A.
7.38%, 05/01/2026(2) | | | 2,317,149 | |
| | | | | 940,000 | | | Altice Luxembourg S.A.
7.75%, 05/15/2022(2) | | | 909,450 | |
| | | | CCO Holdings LLC / CCO Holdings Capital Corp. | |
| | | | | 120,000 | | | 5.13%, 02/15/2023 | | | 118,763 | |
| | | | | 245,000 | | | 5.13%, 05/01/2023(2) | | | 241,864 | |
| | | | | 95,000 | | | 5.25%, 09/30/2022 | | | 95,297 | |
| | | | | 545,000 | | | 5.75%, 09/01/2023 | | | 549,088 | |
| | | | | 105,000 | | | 5.75%, 01/15/2024 | | | 105,263 | |
| | | | | 3,000,000 | | | 5.75%, 02/15/2026(2) | | | 2,947,500 | |
| | | | | 1,775,000 | | | Cequel Communications Holdings I LLC / Cequel Capital Corp.
5.13%, 12/15/2021(2) | | | 1,764,020 | |
| | | | | 1,195,000 | | | CSC Holdings LLC
5.25%, 06/01/2024 | | | 1,129,275 | |
| | | | DISH DBS Corp. | |
| | | | | 830,000 | | | 5.00%, 03/15/2023 | | | 720,025 | |
| | | | | 595,000 | | | 5.88%, 07/15/2022 | | | 559,300 | |
| | | | | 945,000 | | | 6.75%, 06/01/2021 | | | 946,181 | |
| | | | | 556,000 | | | 7.88%, 09/01/2019 | | | 576,850 | |
| | | | Gray Television, Inc. | |
| | | | | 1,255,000 | | | 5.13%, 10/15/2024(2) | | | 1,201,286 | |
| | | | | 380,000 | | | 5.88%, 07/15/2026(2) | | | 361,475 | |
| | | | | | | | | | | | |
| Shares or Principal Amount | | Market Value† | |
| CORPORATE BONDS - 87.6% - (continued) | |
| | | | Media - 8.2% - (continued) | |
| | $ | | | | 1,175,000 | | | Liberty Interactive LLC
8.25%, 02/01/2030 | | $ | 1,246,264 | |
| | | | Sinclair Television Group, Inc. | |
| | | | | 520,000 | | | 5.13%, 02/15/2027(2) | | | 478,400 | |
| | | | | 1,055,000 | | | 5.88%, 03/15/2026(2) | | | 1,025,987 | |
| | | | TEGNA, Inc. | |
| | | | | 1,515,000 | | | 4.88%, 09/15/2021(2) | | | 1,511,212 | |
| | | | | 1,528,000 | | | 5.13%, 10/15/2019 | | | 1,528,000 | |
| | | | | 1,565,000 | | | Tribune Media Co.
5.88%, 07/15/2022 | | | 1,579,476 | |
| | | | | 817,000 | | | WMG Acquisition Corp.
5.50%, 04/15/2026(2) | | | 809,851 | |
| | | | | | | | | | | | |
| | | | 22,721,976 | |
| | | | | | | | | | | | |
| | | | Metal Fabricate/Hardware - 0.7% | |
| | | | Novelis Corp. | |
| | | | | 605,000 | | | 5.88%, 09/30/2026(2) | | | 579,287 | |
| | | | | 1,115,000 | | | 6.25%, 08/15/2024(2) | | | 1,115,000 | |
| | | | | 340,000 | | | TriMas Corp.
4.88%, 10/15/2025(2) | | | 323,000 | |
| | | | | | | | | | | | |
| | | | 2,017,287 | |
| | | | | | | | | | | | |
| | | | Mining - 1.7% | |
| | | | | 545,000 | | | Alcoa Nederland Holding B.V.
6.13%, 05/15/2028(2) | | | 548,406 | |
| | | | | 520,000 | | | Constellium N.V.
5.88%, 02/15/2026(2) | | | 501,800 | |
| | | | First Quantum Minerals Ltd. | |
| | | | | 760,000 | | | 7.00%, 02/15/2021(2) | | | 767,600 | |
| | | | | 615,000 | | | 7.50%, 04/01/2025(2) | | | 606,944 | |
| | | | | 1,290,000 | | | Kaiser Aluminum Corp.
5.88%, 05/15/2024 | | | 1,315,800 | |
| | | | New Gold, Inc. | |
| | | | | 105,000 | | | 6.25%, 11/15/2022(2) | | | 106,050 | |
| | | | | 870,000 | | | 6.38%, 05/15/2025(2) | | | 856,950 | |
| | | | | | | | | | | | |
| | | | 4,703,550 | |
| | | | | | | | | | | | |
| | | | Miscellaneous Manufacturing - 0.6% | |
| | | | | 1,785,000 | | | Bombardier, Inc.
6.13%, 01/15/2023(2) | | | 1,789,462 | |
| | | | | | | | | | | | |
| | | | Office/Business Equipment - 0.5% | |
| | | | | 885,000 | | | CDW LLC / CDW Finance Corp.
5.00%, 09/01/2023 | | | 885,797 | |
| | | | Pitney Bowes, Inc. | |
| | | | | 280,000 | | | 4.63%, 03/15/2024 | | | 247,772 | |
| | | | | 270,000 | | | 4.70%, 04/01/2023 | | | 243,000 | |
| | | | | | | | | | | | |
| | | | 1,376,569 | |
| | | | | | | | | | | | |
| | | | Oil & Gas - 7.8% | |
| | | | | 2,260,000 | | | Blue Racer Midstream LLC / Blue Racer Finance Corp.
6.13%, 11/15/2022(2) | | | 2,282,600 | |
| | | | | 2,120,000 | | | California Resources Corp.
8.00%, 12/15/2022(2) | | | 1,923,900 | |
| | | | Continental Resources, Inc. | |
| | | | | 475,000 | | | 3.80%, 06/01/2024 | | | 463,382 | |
| | | | | 265,000 | | | 4.50%, 04/15/2023 | | | 268,917 | |
| | | | | 1,005,000 | | | 5.00%, 09/15/2022 | | | 1,018,279 | |
| | | | | 1,430,000 | | | Energen Corp.
4.63%, 09/01/2021 | | | 1,422,850 | |
| | | | | 670,000 | | | Ensco plc
5.75%, 10/01/2044 | | | 474,862 | |
The accompanying notes are an integral part of these financial statements.
|
| Hartford High Yield HLS Fund |
Schedule of Investments – (continued)
June 30, 2018 (Unaudited)
| | | | | | | | | | | | |
| Shares or Principal Amount | | Market Value† | |
| CORPORATE BONDS - 87.6% - (continued) | |
| | | | Oil & Gas - 7.8% - (continued) | |
| | $ | | | | 775,000 | | | Jagged Peak Energy LLC
5.88%, 05/01/2026(2) | | $ | 759,500 | |
| | | | MEG Energy Corp. | |
| | | | | 220,000 | | | 6.38%, 01/30/2023(2) | | | 204,600 | |
| | | | | 1,090,000 | | | 6.50%, 01/15/2025(2) | | | 1,087,275 | |
| | | | | 910,000 | | | 7.00%, 03/31/2024(2) | | | 848,575 | |
| | | | QEP Resources, Inc. | |
| | | | | 1,895,000 | | | 5.25%, 05/01/2023 | | | 1,852,362 | |
| | | | | 205,000 | | | 5.38%, 10/01/2022 | | | 208,588 | |
| | | | | 150,000 | | | 5.63%, 03/01/2026 | | | 143,625 | |
| | | | | 245,000 | | | 6.80%, 03/01/2020 | | | 256,025 | |
| | | | | 870,000 | | | Rowan Cos., Inc.
5.85%, 01/15/2044 | | | 643,800 | |
| | | | SM Energy Co. | |
| | | | | 1,680,000 | | | 5.00%, 01/15/2024 | | | 1,589,700 | |
| | | | | 240,000 | | | 6.13%, 11/15/2022 | | | 246,000 | |
| | | | | 115,000 | | | 6.50%, 11/15/2021 | | | 117,645 | |
| | | | Transocean, Inc. | |
| | | | | 365,000 | | | 6.80%, 03/15/2038 | | | 296,563 | |
| | | | | 110,000 | | | 7.50%, 04/15/2031 | | | 102,025 | |
| | | | | 435,000 | | | 9.35%, 12/15/2041 | | | 432,825 | |
| | | | | 1,230,000 | | | Tullow Oil plc
6.25%, 04/15/2022(2) | | | 1,193,100 | |
| | | | | 1,875,000 | | | Vine Oil & Gas L.P. / Vine Oil & Gas Finance Corp.
8.75%, 04/15/2023(2) | | | 1,734,375 | |
| | | | WPX Energy, Inc. | |
| | | | | 1,170,000 | | | 5.25%, 09/15/2024 | | | 1,150,987 | |
| | | | | 270,000 | | | 5.75%, 06/01/2026 | | | 269,241 | |
| | | | | 384,000 | | | 6.00%, 01/15/2022 | | | 399,360 | |
| | | | | 295,000 | | | 8.25%, 08/01/2023 | | | 334,088 | |
| | | | | | | | | | | | |
| | | | 21,725,049 | |
| | | | | | | | | | | | |
| | | | Oil & Gas Services - 0.3% | |
| | | | Weatherford International Ltd. | |
| | | | | 250,000 | | | 5.95%, 04/15/2042 | | | 186,875 | |
| | | | | 660,000 | | | 6.50%, 08/01/2036 | | | 516,450 | |
| | | | | 250,000 | | | 7.00%, 03/15/2038 | | | 199,375 | |
| | | | | | | | | | | | |
| | | | 902,700 | |
| | | | | | | | | | | | |
| | | | Packaging & Containers - 5.6% | |
| | | | | 1,700,000 | | | ARD Finance S.A. (cash)
7.13%, 09/15/2023(5) | | | 1,704,250 | |
| | | | | 530,000 | | | ARD Securities Finance S.a.r.l.
8.75%, 01/31/2023(2)(5) | | | 539,275 | |
| | | | Ardagh Packaging Finance plc / Ardagh Holdings USA, Inc. | | | | |
| | | | | 2,065,000 | | | 6.00%, 06/30/2021(2) | | | 2,088,231 | |
| | | | | 340,000 | | | 6.00%, 02/15/2025(2) | | | 331,075 | |
| | | | | 305,000 | | | 7.25%, 05/15/2024(2) | | | 317,200 | |
| | | | | 2,060,000 | | | Berry Global, Inc.
6.00%, 10/15/2022 | | | 2,120,255 | |
| | | | | 1,015,000 | | | Crown Americas LLC / Crown Americas Capital Corp.
4.75%, 02/01/2026(2) | | | 964,250 | |
| | | | Flex Acquisition Co., Inc. | |
| | | | | 1,875,000 | | | 6.88%, 01/15/2025(2) | | | 1,804,687 | |
| | | | | 575,000 | | | 7.88%, 07/15/2026(2) | | | 572,758 | |
| | | | | 1,410,000 | | | Multi-Color Corp.
4.88%, 11/01/2025(2) | | | 1,313,062 | |
| | | | | 535,000 | | | OI European Group B.V.
4.00%, 03/15/2023(2) | | | 498,888 | |
| | | | | | | | | | | | |
| Shares or Principal Amount | | Market Value† | |
| CORPORATE BONDS - 87.6% - (continued) | |
| | | | Packaging & Containers - 5.6% - (continued) | |
| | $ | | | | 445,000 | | | Plastipak Holdings, Inc.
6.25%, 10/15/2025(2) | | $ | 409,400 | |
| | | | Reynolds Group Issuer, Inc. / Reynolds Group Issuer LLC / Reynolds Group Issuer Lu | | | | |
| | | | | 2,070,000 | | | 5.13%, 07/15/2023(2) | | | 2,044,125 | |
| | | | | 805,000 | | | 7.00%, 07/15/2024(2) | | | 822,106 | |
| | | | | | | | | | | | |
| | | | 15,529,562 | |
| | | | | | | | | | | | |
| | | | Pharmaceuticals - 4.4% | |
| | | | | 280,000 | | | Catalent Pharma Solutions, Inc.
4.88%, 01/15/2026(2) | | | 268,881 | |
| | | | Endo Finance LLC | |
| | | | | 736,000 | | | 6.00%, 07/15/2023(2) | | | 605,360 | |
| | | | | 3,075,000 | | | 6.00%, 02/01/2025(2) | | | 2,398,500 | |
| | | | | 910,000 | | | Teva Pharmaceutical Finance IV LLC
2.25%, 03/18/2020 | | | 877,179 | |
| | | | | 620,000 | | | Teva Pharmaceutical Finance Netherlands III B.V.
3.15%, 10/01/2026 | | | 498,309 | |
| | | | Valeant Pharmaceuticals International, Inc. | | | | |
| | | | | 1,320,000 | | | 5.50%, 03/01/2023(2) | | | 1,227,600 | |
| | | | | 5,110,000 | | | 5.88%, 05/15/2023(2) | | | 4,800,206 | |
| | | | | 1,230,000 | | | 6.13%, 04/15/2025(2) | | | 1,133,138 | |
| | | | | 240,000 | | | 7.00%, 03/15/2024(2) | | | 251,628 | |
| | | | | | | | | | | | |
| | | | 12,060,801 | |
| | | | | | | | | | | | |
| | | | Pipelines - 0.8% | |
| | | | Energy Transfer Equity L.P. | |
| | | | | 230,000 | | | 4.25%, 03/15/2023 | | | 221,953 | |
| | | | | 1,773,000 | | | 7.50%, 10/15/2020 | | | 1,890,461 | |
| | | | | | | | | | | | |
| | | | 2,112,414 | |
| | | | | | | | | | | | |
| | | | Retail - 3.4% | |
| | | | | 3,670,000 | | | 1011778 BC ULC / New Red Finance, Inc.
5.00%, 10/15/2025(2) | | | 3,472,554 | |
| | | | | 895,000 | | | Beacon Roofing Supply, Inc.
4.88%, 11/01/2025(2) | | | 822,863 | |
| | | | | 419,000 | | | CEC Entertainment, Inc.
8.00%, 02/15/2022 | | | 368,720 | |
| | | | | 820,000 | | | Party City Holdings, Inc.
6.13%, 08/15/2023(2) | | | 824,100 | |
| | | | | 255,000 | | | PetSmart, Inc.
5.88%, 06/01/2025(2) | | | 196,376 | |
| | | | | 1,200,000 | | | Staples, Inc.
8.50%, 09/15/2025(2) | | | 1,119,000 | |
| | | | | 2,890,000 | | | United Rentals North America, Inc.
4.88%, 01/15/2028 | | | 2,675,995 | |
| | | | | | | | | | | | |
| | | | 9,479,608 | |
| | | | | | | | | | | | |
| | | | Semiconductors - 1.6% | |
| | | | | 480,000 | | | Entegris, Inc.
4.63%, 02/10/2026(2) | | | 457,200 | |
| | | | | 1,865,000 | | | Micron Technology, Inc.
5.50%, 02/01/2025 | | | 1,941,931 | |
| | | | Sensata Technologies B.V. | |
| | | | | 1,221,000 | | | 5.00%, 10/01/2025(2) | | | 1,230,158 | |
| | | | | 900,000 | | | 5.63%, 11/01/2024(2) | | | 933,750 | |
| | | | | | | | | | | | |
| | | | 4,563,039 | |
| | | | | | | | | | | | |
| | | | Software - 3.5% | |
| | | | | 751,000 | | | Camelot Finance S.A.
7.88%, 10/15/2024(2) | | | 752,878 | |
The accompanying notes are an integral part of these financial statements.
|
| Hartford High Yield HLS Fund |
Schedule of Investments – (continued)
June 30, 2018 (Unaudited)
| | | | | | | | | | | | |
| Shares or Principal Amount | | Market Value† | |
| CORPORATE BONDS - 87.6% - (continued) | |
| | | | Software - 3.5% - (continued) | |
| | $ | | | | 980,000 | | | Change Healthcare Holdings LLC / Change Healthcare Finance, Inc.
5.75%, 03/01/2025(2) | | $ | 927,178 | |
| | | | First Data Corp. | |
| | | | | 1,425,000 | | | 5.38%, 08/15/2023(2) | | | 1,438,181 | |
| | | | | 1,361,000 | | | 5.75%, 01/15/2024(2) | | | 1,361,027 | |
| | | | | 1,580,000 | | | 7.00%, 12/01/2023(2) | | | 1,645,697 | |
| | | | | 684,000 | | | Infor Software Parent LLC (cash)
7.13%, 05/01/2021(2)(5) | | | 685,710 | |
| | | | | 2,075,000 | | | Infor U.S., Inc.
6.50%, 05/15/2022 | | | 2,077,594 | |
| | | | | 630,000 | | | Workday, Inc.
0.25%, 10/01/2022(2) | | | 661,361 | |
| | | | | | | | | | | | |
| | | | 9,549,626 | |
| | | | | | | | | | | | |
| | | | Telecommunications - 5.3% | |
| | | | Altice Financing S.A. | |
| | | | | 380,000 | | | 6.63%, 02/15/2023(2) | | | 374,490 | |
| | | | | 2,270,000 | | | 7.50%, 05/15/2026(2) | | | 2,195,544 | |
| | | | CenturyLink, Inc. | |
| | | | | 2,144,000 | | | 5.63%, 04/01/2025 | | | 2,026,080 | |
| | | | | 466,000 | | | 7.50%, 04/01/2024 | | | 478,815 | |
| | | | | 690,000 | | | Frontier Communications Corp.
8.50%, 04/01/2026(2) | | | 665,850 | |
| | | | | 800,000 | | | Sprint Capital Corp.
6.88%, 11/15/2028 | | | 766,000 | |
| | | | Sprint Corp. | |
| | | | | 416,000 | | | 7.13%, 06/15/2024 | | | 419,990 | |
| | | | | 2,495,000 | | | 7.25%, 09/15/2021 | | | 2,594,800 | |
| | | | | 795,000 | | | 7.63%, 02/15/2025 | | | 810,908 | |
| | | | | 3,479,000 | | | 7.88%, 09/15/2023 | | | 3,607,288 | |
| | | | | 725,000 | | | Telecom Italia S.p.A.
5.30%, 05/30/2024(2) | | | 715,031 | |
| | | | | | | | | | | | |
| | | | 14,654,796 | |
| | | | | | | | | | | | |
| | | | Textiles - 0.5% | |
| | | | | 1,395,000 | | | Eagle Intermediate Global Holding B.V./Ruyi US Finance LLC
7.50%, 05/01/2025(2) | | | 1,393,256 | |
| | | | | | | | | | | | |
| | |
| | | | Total Corporate Bonds
(cost $244,584,122) | | $ | 242,569,905 | |
| | | | | | | | | | | | |
| | | |
| | | | | | | | | | | | |
| SENIOR FLOATING RATE INTERESTS - 5.4%(10) | |
| | | | Commercial Services - 0.9% | |
| | $ | | | | 1,785,000 | | | Asurion LLC
1 mo. USD LIBOR + 3.000%, 0.00%, 11/03/2023(9)(11) | | $ | 1,778,306 | |
| | | | | 770,000 | | | Blackhawk Network Holdings, Inc.
1 mo. USD LIBOR + 3.000%, 5.07%, 06/15/2025 | | | 767,113 | |
| | | | | | | | | | | | |
| | | | 2,545,419 | |
| | | | | | | | | | | | |
| | | | Diversified Financial Services - 0.4% | |
| | | | | 862,838 | | | Crown Finance U.S., Inc.
1 mo. USD LIBOR + 2.500%, 4.59%, 02/28/2025 | | | 855,754 | |
| | | | | 254,739 | | | SS&C Technologies Holdings Europe S.a.r.l.
1 mo. USD LIBOR + 2.500%, 4.59%, 04/16/2025 | | | 254,596 | |
| | | | | | | | | | | | |
| | | | 1,110,350 | |
| | | | | | | | | | | | |
| | | | | | | | | | | | |
| Shares or Principal Amount | | Market Value† | |
| SENIOR FLOATING RATE INTERESTS - 5.4%(10) - (continued) | |
| | | | Food - 0.1% | |
| | $ | | | | 250,000 | | | CHG PPC Parent LLC
1 mo. USD LIBOR + 2.750%, 4.84%, 03/31/2025 | | $ | 248,750 | |
| | | | | | | | | | | | |
| | | | Healthcare - Services - 0.4% | |
| | | | | 1,089,594 | | | Syneos Health, Inc.
1 mo. USD LIBOR + 2.000%, 4.09%, 08/01/2024 | | | 1,083,296 | |
| | | | | | | | | | | | |
| | | | Household Products - 0.2% | |
| | | | | 477,600 | | | Diamond (BC) B.V.
2 mo. USD LIBOR + 3.000%, 5.10%, 09/06/2024 | | | 468,048 | |
| | | | | | | | | | | | |
| | | | Insurance - 0.4% | |
| | | | | 180,000 | | | Genworth Financial, Inc.
1 mo. USD LIBOR + 4.500%, 6.55%, 02/22/2023 | | | 183,150 | |
| | | | | 790,000 | | | Hub International Ltd.
2 mo. USD LIBOR + 3.000%, 5.36%, 04/25/2025 | | | 784,770 | |
| | | | | | | | | | | | |
| | | | 967,920 | |
| | | | | | | | | | | | |
| | | | Internet - 0.4% | |
| | | | | 1,253,455 | | | Lands’ End, Inc.
1 mo. USD LIBOR + 3.250%, 5.34%, 04/04/2021 | | | 1,209,584 | |
| | | | | | | | | | | | |
| | | | IT Services - 0.2% | |
| | | | | 650,000 | | | Trans Union LLC
1 mo. USD LIBOR + 2.000%, 0.00%, 06/08/2025(9)(11) | | | 647,562 | |
| | | | | | | | | | | | |
| | | | Leisure Time - 0.7% | |
| | | | | 1,960,150 | | | Golden Entertainment, Inc.
1 mo. USD LIBOR + 3.000%, 5.10%, 10/20/2024 | | | 1,954,034 | |
| | | | | | | | | | | | |
| | | | Machinery-Diversified - 0.2% | |
| | | | | 624,044 | | | Gardner Denver, Inc.
3 mo. USD LIBOR + 2.750%, 4.84%, 07/30/2024 | | | 623,813 | |
| | | | | | | | | | | | |
| | | | Media - 1.0% | |
| | | | | 1,426,425 | | | PSAV Holdings LLC
3 mo. USD LIBOR + 3.250%, 5.23%, 03/01/2025 | | | 1,409,779 | |
| | | | | 1,360,000 | | | Shutterfly, Inc.
1 mo. USD LIBOR + 2.750%, 4.85%, 08/17/2024 | | | 1,360,571 | |
| | | | | | | | | | | | |
| | | | 2,770,350 | |
| | | | | | | | | | | | |
| | | | Semiconductors - 0.2% | |
| | | | | 635,000 | | | Microchip Technology, Inc.
1 mo. USD LIBOR + 2.000%, 4.10%, 05/29/2025 | | | 633,679 | |
| | | | | | | | | | | | |
| | | | Software - 0.3% | |
| | | | | 673,354 | | | SS&C Technologies, Inc.
1 mo. USD LIBOR + 2.500%, 4.59%, 04/16/2025 | | | 672,977 | |
| | | | | | | | | | | | |
| | |
| | | | Total Senior Floating Rate Interests
(cost $15,013,853) | | $ | 14,935,782 | |
| | | | | | | | | | | | |
The accompanying notes are an integral part of these financial statements.
|
| Hartford High Yield HLS Fund |
Schedule of Investments – (continued)
June 30, 2018 (Unaudited)
| | | | | | | | | | | | |
| Shares or Principal Amount | | Market Value† | |
| CONVERTIBLE BONDS - 1.6% | |
| | | | Commercial Services - 0.2% | |
| | $ | | | | 690,000 | | | Cardtronics, Inc.
1.00%, 12/01/2020 | | $ | 639,657 | |
| | | | | | | | | | | | |
| | | | Media - 0.3% | |
| | | | | 750,000 | | | DISH Network Corp.
3.38%, 08/15/2026 | | | 726,447 | |
| | | | | | | | | | | | |
| | | | Oil & Gas - 0.0% | |
| | | | | 1,790,000 | | | Cobalt International Energy, Inc.
2.63%, 12/01/2019*(12) | | | 2,327 | |
| | | | | | | | | | | | |
| | | | Semiconductors - 0.5% | |
| | | | Microchip Technology, Inc. | |
| | | | | 565,000 | | | 1.63%, 02/15/2027 | | | 656,958 | |
| | | | | 589,000 | | | 2.25%, 02/15/2037 | | | 700,862 | |
| | | | | | | | | | | | |
| | | | 1,357,820 | |
| | | | | | | | | | | | |
| | | | Software - 0.6% | |
| | | | | 1,052,000 | | | Western Digital Corp.
1.50%, 02/01/2024(2) | | | 1,063,594 | |
| | | | | 496,000 | | | Servicenow, Inc.
0.00%, 06/01/2022(13) | | | 671,899 | |
| | | | | | | | | | | | |
| | | | | | | | | | | 1,735,493 | |
| | | | | | | | | | | | |
| | | |
| | | | | | | | Total Convertible Bonds
(cost $6,199,882) | | $ | 4,461,744 | |
| | | | | | | | | | | | |
| | | |
| | | | | | | | | | | | |
| PREFERRED STOCKS - 0.2% | |
| | | | | | | Diversified Financials - 0.2% | |
| | | | | 16,525 | | | GMAC Capital Trust Series 2
3 mo. USD LIBOR + 5.785%,
8.13%(6) | | $ | 434,608 | |
| | | | | | | | | | | | |
| | | |
| | | | | | | | Total Preferred Stocks
(cost $433,019) | | $ | 434,608 | |
| | | | | | | | | | | | |
| | | |
| | | | | | | | | | | | |
| ESCROWS - 0.0% | |
| | | | | | | Electric - 0.0% | |
| | | | | 415,000 | | | Texas Competitive Electric Holdings Co. LLC
11.50%, 10/01/2020(1)(3)(4) | | $ | — | |
| | | | | | | | | | | | |
| | | | | | | Energy - Alternate Sources - 0.0% | |
| | | | | 4,525,000 | | | TCEH Corp.*(1)(3)(4) | | | 5 | |
| | | | | 82,554 | | | Vistra Energy Corp.* | | | 45,817 | |
| | | | | | | | | | | | |
| | | | | | | | | | | 45,822 | |
| | | | | | | | | | | | |
| | | |
| | | | | | | | Total Escrows
(cost $—) | | $ | 45,822 | |
| | | | | | | | | | | | |
| | | |
| | | | | | | | Total Long-Term Investments
(cost $273,807,909) | | $ | 265,743,616 | |
| | | | | | | | | | | | |
| | | |
| | | | | | | | | | | | |
| | | | | | | | | | | | |
| Shares or Principal Amount | | Market Value† | |
| SHORT-TERM INVESTMENTS - 3.1% | |
| | | | | | | Other Investment Pools & Funds - 3.1% | |
| | | | | 8,581,723 | | | Fidelity Institutional Government Fund, Institutional Class,
1.80%(14) | | $ | 8,581,723 | |
| | | | | | | | | | | | |
| | | | | | | | | | | | | | | | |
| | | | |
| | | | | | | | Total Short-Term Investments
(cost $8,581,723) | | | | | | $ | 8,581,723 | |
| | | | | | | | | | | | | | | | |
| | | | |
| | | | | | | | Total Investments
(cost $282,389,632) | | | 99.1 | % | | $ | 274,325,339 | |
| | | | | | | | Other Assets and Liabilities | | | 0.9 | % | | | 2,597,520 | |
| | | | | | | | | | | | | | | | |
| | | | | | | | Total Net Assets | | | 100.0 | % | | $ | 276,922,859 | |
| | | | | | | | | | | | | | | | |
The accompanying notes are an integral part of these financial statements.
|
| Hartford High Yield HLS Fund |
Schedule of Investments – (continued)
June 30, 2018 (Unaudited)
| Note: | Percentage of investments as shown is the ratio of the total market value to total net assets. |
| | The Fund may refer to any one or more of the industry classifications used by one or more widely recognized market indices, ratings group and/or as defined by Fund management. Industry classifications may not be identical across all security types. |
| | Equity Industry classifications used in this report are the Global Industry Classification Standard, which was developed by and is the exclusive property and service mark of MSCI, Inc. and Standard & Poor’s. |
| | For Fund compliance purposes, the Fund may not use the same classification system shown in this report as these classifications are used for financial reporting purposes. |
| (1) | Investment valued using significant unobservable inputs. |
| (2) | Securities issued within terms of a private placement memorandum and exempt from registration under Rule 144A under the Securities Act of 1933, as amended, and may be sold to qualified institutional buyers. Unless otherwise indicated, these holdings are determined to be liquid. At June 30, 2018, the aggregate value of these securities was $133,697,789, which represented 48.3% of total net assets. |
| (3) | These securities are valued in good faith at fair value as determined under policies and procedures established by and under the supervision of the Board of Directors. At June 30, 2018, the aggregate fair value of these securities was $1,204,652, which represented 0.4% of total net assets. This amount excludes securities that are principally traded in certain foreign markets and whose prices are adjusted pursuant to a third party pricing service methodology approved by the Board of Directors. |
| (4) | This security has been identified as illiquid. Illiquid securities are often purchased in private placement transactions, are often not registered under the Securities Act of 1933, as amended, and may have contractual restrictions on resale. A security may also be considered illiquid if the security lacks a readily available market or if its valuation has not changed for a certain period of time. The identification of illiquid securities is unaudited. At June 30, 2018, the aggregate value of these securities was $1,204,652, which represented 0.4% of total net assets. |
| (5) | Security has the ability to pay in kind (“PIK”) or pay income in cash. When applicable, separate rates of such payments are disclosed. |
| (6) | Variable or floating rate security, which interest rate adjusts periodically based on changes in current interest rates and prepayments on the underlying pool of assets. Rate shown is the rate in effect as of period end. |
| (7) | Perpetual maturity security. Maturity date shown is the next call date or final legal maturity date, whichever comes first. |
| (8) | These securities were sold to the Fund under Regulation S, rules governing offers and sales made outside the United States without registration under the Securities Act of 1933, as amended. The Fund may only be able to resell these securities in the United States if an exemption from registration under the federal and state securities laws is available, or the Fund may only be able to sell these securities outside of the United States (such as on a foreign exchange) to a non-U.S. person. Unless otherwise indicated, these holdings are determined to be liquid. At June 30, 2018, the aggregate value of these securities was $6,036,900, which represented 2.2% of total net assets. |
| (9) | This security, or a portion of this security, was purchased on a when-issued, delayed-delivery or delayed-draw basis. The cost of these securities was $3,687,520 at June 30, 2018. |
| (10) | Senior floating rate interests generally pay interest rates which are periodically adjusted by reference to a base short-term, floating lending rate plus a premium. The base lending rates are primarily the LIBOR, and secondarily the prime rate offered by one or more major United States banks (the “Prime Rate”) and the certificate of deposit rate or other base lending rates used by commercial lenders. Senior floating rate interests often require prepayments from excess cash flows or permit the borrower to repay at its election. The rate at which the borrower repays cannot be predicted with accuracy. As a result, the actual remaining maturity may be substantially less than the stated maturities shown. Unless otherwise noted, the interest rate disclosed for these securities represents the rate in effect as of June 30, 2018. |
| (11) | Represents an unsettled loan commitment. The coupon rate will be determined at time of settlement. |
| (12) | Non-income producing. For long-term debt securities, items identified are in default as to payment of interest and/or principal. |
| (13) | Security is a zero-coupon bond. |
| (14) | Current yield as of period end. |
| | | | | | | | | | | | | | | | | | | | | | | | | | |
| Foreign Currency Contracts Outstanding at June 30, 2018 | |
Amount and Description
of Currency to be
Purchased | | Amount and Description
of Currency to be
Sold | | Counterparty | | | Settlement
Date | | | Appreciation | | | Depreciation | |
| | 251,000 | | | EUR | | | 293,592 | | | USD | | | CBK | | | | 07/31/18 | | | $ | 183 | | | $ | — | |
| | 1,269,771 | | | USD | | | 1,088,000 | | | EUR | | | BNP | | | | 07/31/18 | | | | — | | | | (3,646 | ) |
| | 4,827,005 | | | USD | | | 4,139,000 | | | EUR | | | UBS | | | | 07/31/18 | | | | — | | | | (17,363 | ) |
| | | | | | | | | | | | | | | | | | | | | | | | | | |
| | Total | | | | | | | | | | | | | | | | | | | $ | 183 | | | $ | (21,009 | ) |
| | | | | | | | | | | | | | | | | | | | | | | | | | |
| † | See Significant Accounting Policies of accompanying Notes to Financial Statements regarding valuation of investments. |
The accompanying notes are an integral part of these financial statements.
|
| Hartford High Yield HLS Fund |
Schedule of Investments – (continued)
June 30, 2018 (Unaudited)
| | |
| GLOSSARY: (abbreviations used in preceding Schedule of Investments) |
|
| Counterparty Abbreviations: |
BNP | | BNP Paribas Securities Services |
CBK | | Citibank NA |
UBS | | UBS AG |
|
| Currency Abbreviations: |
EUR | | Euro |
USD | | United States Dollar |
|
| Other Abbreviations: |
LIBOR | | London Interbank Offered Rate |
MTN | | Medium Term Note |
The accompanying notes are an integral part of these financial statements.
|
| Hartford High Yield HLS Fund |
Schedule of Investments – (continued)
June 30, 2018 (Unaudited)
Fair Valuation Summary
The following is a summary of the fair valuations according to the inputs used as of June 30, 2018 in valuing the Fund’s investments.
| | | | | | | | | | | | | | | | |
| | | Total | | | Level 1(1) | | | Level 2(1) | | | Level 3(1) | |
Assets | |
Common Stocks | |
Consumer Services | | $ | 629,160 | | | $ | 629,160 | | | $ | — | | | $ | — | |
Energy | | | 2,073,315 | | | | 868,668 | | | | — | | | | 1,204,647 | |
Materials | | | 593,280 | | | | 593,280 | | | | — | | | | — | |
Asset & Commercial Mortgage Backed Securities | | | — | | | | — | | | | — | | | | — | |
Corporate Bonds | | | 242,569,905 | | | | — | | | | 242,569,905 | | | | — | |
Senior Floating Rate Interests | | | 14,935,782 | | | | — | | | | 14,935,782 | | | | — | |
Convertible Bonds | | | 4,461,744 | | | | — | | | | 4,461,744 | | | | — | |
Preferred Stocks | | | 434,608 | | | | 434,608 | | | | — | | | | — | |
Escrows | | | 45,822 | | | | — | | | | 45,817 | | | | 5 | |
Short-Term Investments | | | 8,581,723 | | | | 8,581,723 | | | | — | | | | — | |
Foreign Currency Contracts(2) | | | 183 | | | | — | | | | 183 | | | | — | |
| | | | | | | | | | | | | | | | |
Total | | $ | 274,325,522 | | | $ | 11,107,439 | | | $ | 262,013,431 | | | $ | 1,204,652 | |
| | | | | | | | | | | | | | | | |
Liabilities | |
Foreign Currency Contracts(2) | | $ | (21,009 | ) | | $ | — | | | $ | (21,009 | ) | | $ | — | |
| | | | | | | | | | | | | | | | |
Total | | $ | (21,009 | ) | | $ | — | | | $ | (21,009 | ) | | $ | — | |
| | | | | | | | | | | | | | | | |
| (1) | For the six-month period ended June 30, 2018, there were no transfers between any levels. |
| (2) | Derivative instruments (excluding purchased and written options, if applicable) are valued at the unrealized appreciation/(depreciation) on the investments. |
Level 3 investments at the beginning and/or end of the period in relation to net assets were not significant and accordingly, a reconciliation of Level 3 assets for the six-month period ended June 30, 2018 is not presented.
The accompanying notes are an integral part of these financial statements.
|
| Hartford International Opportunities HLS Fund |
Schedule of Investments
June 30, 2018 (Unaudited)
| | | | | | | | |
| Shares or Principal Amount | | Market Value† | |
| COMMON STOCKS - 97.7% | |
| | | | Australia - 1.0% | |
| | 1,092,189 | | | Treasury Wine Estates Ltd. | | $ | 14,032,476 | |
| | | | | | | | |
| | | | Austria - 1.0% | |
| | 189,113 | | | Ams AG | | | 14,024,641 | |
| | | | | | | | |
| | | | Brazil - 0.6% | |
| | 386,094 | | | Itau Unibanco Holding S.A. ADR | | | 4,007,656 | |
| | 519,951 | | | Petroleo Brasileiro S.A. ADR* | | | 5,215,108 | |
| | | | | | | | |
| | | | | | | 9,222,764 | |
| | | | | | | | |
| | | | Canada - 7.9% | |
| | 413,151 | | | Canadian National Railway Co. | | | 33,793,122 | |
| | 897,846 | | | Canadian Natural Resources Ltd. | | | 32,406,186 | |
| | 734,165 | | | Encana Corp. | | | 9,588,570 | |
| | 309,598 | | | Magna International, Inc. | | | 18,006,209 | |
| | 497,175 | | | TransCanada Corp. | | | 21,510,907 | |
| | | | | | | | |
| | | | | | | 115,304,994 | |
| | | | | | | | |
| | | | China - 14.7% | |
| | 339,000 | | | AAC Technologies Holdings, Inc. | | | 4,760,659 | |
| | 218,179 | | | Alibaba Group Holding Ltd. ADR* | | | 40,478,750 | |
| | 20,748,443 | | | China Construction Bank Corp. Class H | | | 18,985,672 | |
| | 5,311,000 | | | China Longyuan Power Group Corp. Ltd. Class H | | | 4,266,383 | |
| | 1,517,500 | | | China Merchants Bank Co., Ltd. Class H | | | 5,581,986 | |
| | 106,733 | | | Ctrip.com International Ltd. ADR* | | | 5,083,693 | |
| | 1,435,676 | | | ENN Energy Holdings Ltd. | | | 14,060,145 | |
| | 178,918 | | | JD.com, Inc. ADR* | | | 6,968,856 | |
| | 2,758,000 | | | Kingdee International Software Group Co., Ltd.* | | | 2,809,101 | |
| | 29,404 | | | NetEase, Inc. ADR | | | 7,429,509 | |
| | 252,804 | | | New Oriental Education & Technology Group, Inc. ADR | | | 23,930,427 | |
| | 2,071,500 | | | Ping An Insurance Group Co. of China Ltd. Class H | | | 18,970,122 | |
| | 674,100 | | | Sunny Optical Technology Group Co., Ltd. | | | 12,502,772 | |
| | 803,252 | | | Tencent Holdings Ltd. | | | 40,335,598 | |
| | 82,070 | | | Weibo Corp. ADR* | | | 7,284,533 | |
| | | | | | | | |
| | | | | | | 213,448,206 | |
| | | | | | | | |
| | | | Denmark - 0.2% | |
| | 37,119 | | | DSV A/S | | | 2,988,143 | |
| | | | | | | | |
| | | | France - 11.5% | |
| | 187,358 | | | Airbus SE | | | 21,863,703 | |
| | 60,672 | | | Capgemini SE | | | 8,130,642 | |
| | 116,447 | | | Cie Generale des Etablissements Michelin SCA | | | 14,087,530 | |
| | 131,234 | | | Essilor International Cie Generale d’Optique S.A. | | | 18,503,487 | |
| | 2,215,137 | | | Natixis S.A. | | | 15,673,315 | |
| | 454,846 | | | Peugeot S.A. | | | 10,363,788 | |
| | 240,137 | | | Safran S.A. | | | 29,081,754 | |
| | 494,302 | | | TOTAL S.A.(1) | | | 30,016,852 | |
| | 28,786 | | | Unibail-Rodamco-Westfield | | | 6,338,352 | |
| | 255,925 | | | Valeo S.A. | | | 13,953,946 | |
| | | | | | | | |
| | | | | | | 168,013,369 | |
| | | | | | | | |
| | | | Germany - 3.6% | |
| | 83,160 | | | Continental AG | | | 18,925,364 | |
| | 121,797 | | | Siemens AG | | | 16,047,463 | |
| | 376,509 | | | Vonovia SE | | | 17,895,234 | |
| | | | | | | | |
| | | | | | | 52,868,061 | |
| | | | | | | | |
| | | | Hong Kong - 1.5% | |
| | 3,212,000 | | | China Unicom Hong Kong Ltd. | | | 4,003,709 | |
| | | | | | | | |
| Shares or Principal Amount | | Market Value† | |
| COMMON STOCKS - 97.7% - (continued) | |
| | | | Hong Kong - 1.5% - (continued) | |
| | 1,282,600 | | | Henderson Land Development Co., Ltd. | | $ | 6,763,504 | |
| | 163,134 | | | Hong Kong Exchanges & Clearing Ltd. | | | 4,882,198 | |
| | 201,108 | | | Melco Resorts & Entertainment Ltd. ADR | | | 5,631,024 | |
| | | | | | | | |
| | | | | | | 21,280,435 | |
| | | | | | | | |
| | | | India - 2.2% | |
| | 345,987 | | | HDFC Bank Ltd. | | | 10,806,571 | |
| | 2,346,959 | | | ICICI Bank Ltd. | | | 9,439,784 | |
| | 1,524,871 | | | Power Grid Corp. of India Ltd. | | | 4,160,421 | |
| | 1,967,229 | | | State Bank of India* | | | 7,457,905 | |
| | | | | | | | |
| | | | | | | 31,864,681 | |
| | | | | | | | |
| | | | Italy - 2.9% | |
| | 161,564 | | | Banca Generali S.p.A. | | | 4,010,091 | |
| | 132,600 | | | Ferrari N.V. | | | 17,923,429 | |
| | 475,829 | | | FinecoBank Banca Fineco S.p.A. | | | 5,356,433 | |
| | 1,778,268 | | | Pirelli & C. S.p.A.*(2) | | | 14,808,051 | |
| | | | | | | | |
| | | | | | | 42,098,004 | |
| | | | | | | | |
| | | | Japan - 15.4% | |
| | 110,500 | | | Daikin Industries Ltd. | | | 13,206,193 | |
| | 235,515 | | | Daiwa House Industry Co., Ltd. | | | 8,012,650 | |
| | 25,230 | | | FANUC Corp. | | | 5,000,883 | |
| | 260,170 | | | ITOCHU Corp. | | | 4,705,391 | |
| | 9,900 | | | Keyence Corp. | | | 5,583,740 | |
| | 16,800 | | | Kobe Steel Ltd.* | | | 153,527 | |
| | 605,800 | | | Komatsu Ltd. | | | 17,246,256 | |
| | 1,012,200 | | | Mitsubishi UFJ Financial Group, Inc. | | | 5,733,991 | |
| | 493,900 | | | Nexon Co., Ltd.* | | | 7,166,170 | |
| | 45,700 | | | Nidec Corp. | | | 6,836,243 | |
| | 498,674 | | | Ono Pharmaceutical Co., Ltd. | | | 11,674,363 | |
| | 137,300 | | | Recruit Holdings Co., Ltd. | | | 3,792,040 | |
| | 212,900 | | | Seven & i Holdings Co., Ltd. | | | 9,285,775 | |
| | 277,742 | | | SoftBank Group Corp. | | | 19,833,027 | |
| | 488,341 | | | Sony Corp. | | | 25,010,065 | |
| | 448,287 | | | Sony Financial Holdings, Inc. | | | 8,541,256 | |
| | 759,030 | | | Sumitomo Mitsui Financial Group, Inc. | | | 29,606,713 | |
| | 107,100 | | | Sysmex Corp. | | | 9,978,999 | |
| | 127,900 | | | Terumo Corp. | | | 7,322,007 | |
| | 433,883 | | | Tokio Marine Holdings, Inc. | | | 20,298,456 | |
| | 155,300 | | | Yamato Holdings Co., Ltd. | | | 4,570,888 | |
| | | | | | | | |
| | | | | | | 223,558,633 | |
| | | | | | | | |
| | | | Luxembourg - 0.6% | |
| | 55,345 | | | Spotify Technology S.A.* | | | 9,311,243 | |
| | | | | | | | |
| | | | Netherlands - 4.3% | |
| | 401,176 | | | AerCap Holdings N.V.* | | | 21,723,680 | |
| | 746,700 | | | DP Eurasia N.V.*(2) | | | 1,560,965 | |
| | 964,464 | | | ING Groep N.V. | | | 13,844,412 | |
| | 590,469 | | | Koninklijke Philips N.V. | | | 25,016,958 | |
| | | | | | | | |
| | | | | | | 62,146,015 | |
| | | | | | | | |
| | | | Norway - 0.3% | |
| | 636,155 | | | Norsk Hydro ASA | | | 3,797,365 | |
| | | | | | | | |
| | | | Russia - 0.8% | |
| | 179,725 | | | Mail.Ru Group Ltd. GDR* | | | 5,191,062 | |
| | 195,678 | | | Yandex N.V. Class A* | | | 7,024,840 | |
| | | | | | | | |
| | | | | | | 12,215,902 | |
| | | | | | | | |
| | | | South Korea - 2.0% | |
| | 3,231 | | | Hugel, Inc.* | | | 1,397,283 | |
| | 648,558 | | | Samsung Electronics Co., Ltd. | | | 27,167,813 | |
| | | | | | | | |
| | | | | | | 28,565,096 | |
| | | | | | | | |
The accompanying notes are an integral part of these financial statements.
|
| Hartford International Opportunities HLS Fund |
Schedule of Investments – (continued)
June 30, 2018 (Unaudited)
| | | | | | | | |
| Shares or Principal Amount | | Market Value† | |
| COMMON STOCKS - 97.7% - (continued) | |
| | | | Spain - 3.4% | |
| | 3,443,874 | | | Iberdrola S.A. | | $ | 26,558,298 | |
| | 696,085 | | | Industria de Diseno Textil S.A. | | | 23,704,545 | |
| | | | | | | | |
| | | | | | | 50,262,843 | |
| | | | | | | | |
| | | | Sweden - 0.2% | |
| | 101,712 | | | Lundin Petroleum AB* | | | 3,228,345 | |
| | | | | | | | |
| | | | Switzerland - 7.8% | |
| | 134,678 | | | Julius Baer Group Ltd.* | | | 7,888,283 | |
| | 578,155 | | | Nestle S.A. | | | 44,807,477 | |
| | 343,739 | | | Novartis AG | | | 26,038,548 | |
| | 84,254 | | | Swiss Re AG | | | 7,356,120 | |
| | 1,797,799 | | | UBS Group AG* | | | 27,560,894 | |
| | | | | | | | |
| | | | | | | 113,651,322 | |
| | | | | | | | |
| | | | Taiwan - 2.5% | | | |
| | 2,531,617 | | | Hon Hai Precision Industry Co., Ltd. | | | 6,898,825 | |
| | 4,209,995 | | | Taiwan Semiconductor Manufacturing Co., Ltd. | | | 29,895,484 | |
| | | | | | | | |
| | | | | | | 36,794,309 | |
| | | | | | | | |
| | | | United Kingdom - 13.3% | | | |
| | 823,799 | | | Anglo American plc | | | 18,289,096 | |
| | 239,015 | | | AstraZeneca plc | | | 16,531,993 | |
| | 2,508,953 | | | BAE Systems plc | | | 21,344,443 | |
| | 549,549 | | | British American Tobacco plc | | | 27,682,636 | |
| | 736,269 | | | Compass Group plc | | | 15,694,034 | |
| | 748,839 | | | Fiat Chrysler Automobiles N.V.* | | | 14,126,278 | |
| | 4,008,834 | | | Glencore plc* | | | 19,033,098 | |
| | 71,895 | | | Intertek Group plc | | | 5,405,825 | |
| | 863,620 | | | Just Eat plc* | | | 8,855,978 | |
| | 586,517 | | | Rio Tinto plc | | | 32,327,930 | |
| | 258,479 | | | Unilever N.V. | | | 14,401,659 | |
| | | | | | | | |
| | | | | | | 193,692,970 | |
| | | | | | | | |
| | |
| | | | Total Common Stocks
(cost $1,363,831,337) | | $ | 1,422,369,817 | |
| | | | | | | | |
| | |
| | | | Total Long-Term Investments
(cost $1,363,831,337) | | $ | 1,422,369,817 | |
| | | | | | | | |
|
| SHORT-TERM INVESTMENTS - 1.6% | |
| | | | Other Investment Pools & Funds - 1.6% | | | |
| | 22,868,223 | | | BlackRock Liquidity Funds TempFund Portfolio, Institutional Class,
1.84%(3) | | $ | 22,868,223 | |
| | | | | | | | |
| | | | Securities Lending Collateral - 0.0% | | | |
| | 16,158 | | | Citibank NA DDCA,
1.91%, 7/2/2018(3) | | | 16,158 | |
| | 109,147 | | | Goldman Sachs Financial Square Funds, Government Institutional Fund,
1.81%(3) | | | 109,147 | |
| | 101,420 | | | Invesco Government & Agency Portfolio,
1.81%(3) | | | 101,420 | |
| | 29,922 | | | Morgan Stanley Institutional Liquidity Funds, Government Portfolio, Institutional Class,
1.84%(3) | | | 29,922 | |
| | | | | | | | |
| Shares or Principal Amount | | Market Value† | |
| SHORT-TERM INVESTMENTS - 1.6% - (continued) | |
| | | | Securities Lending Collateral - 0.0% - (continued) | |
| | 66,516 | | | Western Asset Institutional Government Class A Fund,
1.79%(3) | | $ | 66,516 | |
| | | | | | | | |
| | | | | | | 323,163 | |
| | | | | | | | |
| | |
| | | | Total Short-Term Investments
(cost $23,191,386) | | $ | 23,191,386 | |
| | | | | | | | |
| | | | | | | | | | | | |
| | | |
| | | | Total Investments
(cost $1,387,022,723) | | | 99.3 | % | | $ | 1,445,561,203 | |
| | | | Other Assets and Liabilities | | | 0.7 | % | | | 9,489,376 | |
| | | | | | | | | | | | |
| | | | Total Net Assets | | | 100.0 | % | | $ | 1,455,050,579 | |
| | | | | | | | | | | | |
The accompanying notes are an integral part of these financial statements.
|
| Hartford International Opportunities HLS Fund |
Schedule of Investments – (continued)
June 30, 2018 (Unaudited)
| Note: | Percentage of investments as shown is the ratio of the total market value to total net assets. |
| | Prices of foreign equities that are principally traded on certain foreign markets will generally be adjusted daily pursuant to a fair value pricing service approved by the Board of Directors in order to reflect an adjustment for factors occurring after the close of certain foreign markets but before the close of the New York Stock Exchange. |
| | Equity industry classifications used in this report are the Global Industry Classification Standard, which was developed by and is the exclusive property and service mark of MSCI, Inc. and Standard & Poor’s. |
| | For Fund compliance purposes, the Fund may not use the same classification system shown in this report as these classifications are used for financial reporting purposes. |
| (1) | Represents entire or partial securities on loan. See Note 8 in the accompanying Notes to Financial Statements for securities lending information. |
| (2) | Securities issued within terms of a private placement memorandum and exempt from registration under Rule 144A under the Securities Act of 1933, as amended, and may be sold to qualified institutional buyers. Unless otherwise indicated, these holdings are determined to be liquid. At June 30, 2018, the aggregate value of these securities was $16,369,016, which represented 1.1% of total net assets. |
| (3) | Current yield as of period end. |
| † | See Significant Accounting Policies of accompanying Notes to Financial Statements regarding valuation of investments. |
| | |
| GLOSSARY: (abbreviations used in preceding Schedule of Investments) |
|
| Other Abbreviations: |
ADR | | American Depositary Receipt |
DDCA | | Dollars on Deposit in Custody Account |
GDR | | Global Depositary Receipt |
The accompanying notes are an integral part of these financial statements.
|
| Hartford International Opportunities HLS Fund |
Schedule of Investments – (continued)
June 30, 2018 (Unaudited)
Fair Valuation Summary
The following is a summary of the fair valuations according to the inputs used as of June 30, 2018 in valuing the Fund’s investments.
| | | | | | | | | | | | | | | | |
| | | Total | | | Level 1(1) | | | Level 2(1) | | | Level 3(1) | |
Assets | | | | | | | | | | | | | | | | |
Common Stocks | | | | | | | | | | | | | | | | |
Australia | | $ | 14,032,476 | | | $ | — | | | $ | 14,032,476 | | | $ | — | |
Austria | | | 14,024,641 | | | | — | | | | 14,024,641 | | | | — | |
Brazil | | | 9,222,764 | | | | 9,222,764 | | | | — | | | | — | |
Canada | | | 115,304,994 | | | | 115,304,994 | | | | — | | | | — | |
China | | | 213,448,206 | | | | 91,175,768 | | | | 122,272,438 | | | | — | |
Denmark | | | 2,988,143 | | | | — | | | | 2,988,143 | | | | — | |
France | | | 168,013,369 | | | | 6,338,352 | | | | 161,675,017 | | | | — | |
Germany | | | 52,868,061 | | | | — | | | | 52,868,061 | | | | — | |
Hong Kong | | | 21,280,435 | | | | 5,631,024 | | | | 15,649,411 | | | | — | |
India | | | 31,864,681 | | | | — | | | | 31,864,681 | | | | — | |
Italy | | | 42,098,004 | | | | — | | | | 42,098,004 | | | | — | |
Japan | | | 223,558,633 | | | | — | | | | 223,558,633 | | | | — | |
Luxembourg | | | 9,311,243 | | | | 9,311,243 | | | | — | | | | — | |
Netherlands | | | 62,146,015 | | | | 23,284,645 | | | | 38,861,370 | | | | — | |
Norway | | | 3,797,365 | | | | — | | | | 3,797,365 | | | | — | |
Russia | | | 12,215,902 | | | | 7,024,840 | | | | 5,191,062 | | | | — | |
South Korea | | | 28,565,096 | | | | — | | | | 28,565,096 | | | | — | |
Spain | | | 50,262,843 | | | | — | | | | 50,262,843 | | | | — | |
Sweden | | | 3,228,345 | | | | — | | | | 3,228,345 | | | | — | |
Switzerland | | | 113,651,322 | | | | — | | | | 113,651,322 | | | | — | |
Taiwan | | | 36,794,309 | | | | — | | | | 36,794,309 | | | | — | |
United Kingdom | | | 193,692,970 | | | | — | | | | 193,692,970 | | | | — | |
Short-Term Investments | | | 23,191,386 | | | | 23,191,386 | | | | — | | | | — | |
| | | | | | | | | | | | | | | | |
Total | | $ | 1,445,561,203 | | | $ | 290,485,016 | | | $ | 1,155,076,187 | | | $ | — | |
| | | | | | | | | | | | | | | | |
| (1) | For the six-month period ended June 30, 2018, investments valued at $12,934,675 were transferred from Level 1 to Level 2 due to the application of a fair valuation model factor; there were no transfers from Level 2 to Level 1 and there were no transfers in and out of Level 3. |
| Note: | For purposes of reporting transfers between different hierarchy levels, both transfers in and out of each level, as applicable, are shown as if they occurred at the beginning of the period. |
The accompanying notes are an integral part of these financial statements.
Schedule of Investments
June 30, 2018 (Unaudited)
| | | | | | | | |
| Shares or Principal Amount | | Market Value† | |
| COMMON STOCKS - 99.7% | |
| | | | Banks - 6.2% | |
| | 174,455 | | | Cullen/Frost Bankers, Inc. | | $ | 18,883,009 | |
| | 156,059 | | | East West Bancorp, Inc. | | | 10,175,047 | |
| | 39,493 | | | First Citizens BancShares, Inc. Class A | | | 15,927,527 | |
| | 283,378 | | | First Republic Bank | | | 27,428,157 | |
| | 159,683 | | | M&T Bank Corp. | | | 27,170,062 | |
| | 167,707 | | | Pinnacle Financial Partners, Inc. | | | 10,288,824 | |
| | 236,618 | | | Prosperity Bancshares, Inc. | | | 16,175,207 | |
| | 187,568 | | | South State Corp. | | | 16,177,740 | |
| | | | | | | | |
| | | | | | | 142,225,573 | |
| | | | | | | | |
| | | | Capital Goods - 7.2% | |
| | 361,098 | | | Fastenal Co. | | | 17,379,647 | |
| | 353,560 | | | HEICO Corp. Class A | | | 21,549,482 | |
| | 275,225 | | | IDEX Corp. | | | 37,562,708 | |
| | 192,868 | | | Lennox International, Inc. | | | 38,602,530 | |
| | 256,502 | | | Lincoln Electric Holdings, Inc. | | | 22,510,615 | |
| | 126,430 | | | Middleby Corp.*(1) | | | 13,201,821 | |
| | 227,728 | | | PACCAR, Inc. | | | 14,110,027 | |
| | | | | | | | |
| | | | | | | 164,916,830 | |
| | | | | | | | |
| | | | Commercial & Professional Services - 9.4% | |
| | 108,498 | | | Cimpress N.V.* | | | 15,727,870 | |
| | 125,695 | | | Cintas Corp. | | | 23,262,374 | |
| | 66,301 | | | CoStar Group, Inc.* | | | 27,357,782 | |
| | 178,798 | | | Dun & Bradstreet Corp. | | | 21,929,575 | |
| | 356,689 | | | KAR Auction Services, Inc. | | | 19,546,557 | |
| | 354,432 | | | Robert Half International, Inc. | | | 23,073,523 | |
| | 723,643 | | | TransUnion | | | 51,841,784 | |
| | 66,694 | | | UniFirst Corp. | | | 11,798,168 | |
| | 293,653 | | | Waste Connections, Inc. | | | 22,106,198 | |
| | | | | | | | |
| | | | | | | 216,643,831 | |
| | | | | | | | |
| | | | Consumer Durables & Apparel - 2.0% | |
| | 10,583 | | | NVR, Inc.* | | | 31,435,214 | |
| | 699,051 | | | Under Armour, Inc. Class C*(1) | | | 14,735,995 | |
| | | | | | | | |
| | | | | | | 46,171,209 | |
| | | | | | | | |
| | | | Consumer Services - 1.0% | |
| | 313,691 | | | Choice Hotels International, Inc. | | | 23,715,040 | |
| | | | | | | | |
| | | | Diversified Financials - 3.3% | |
| | 65,549 | | | Credit Acceptance Corp.*(1) | | | 23,165,017 | |
| | 122,413 | | | FactSet Research Systems, Inc. | | | 24,250,015 | |
| | 41,288 | | | MSCI, Inc. | | | 6,830,274 | |
| | 218,718 | | | Northern Trust Corp. | | | 22,503,895 | |
| | | | | | | | |
| | | | | | | 76,749,201 | |
| | | | | | | | |
| | | | Energy - 5.2% | |
| | 132,277 | | | Cimarex Energy Co. | | | 13,457,862 | |
| | 164,419 | | | Diamondback Energy, Inc. | | | 21,632,608 | |
| | 930,743 | | | Newfield Exploration Co.* | | | 28,154,976 | |
| | 295,671 | | | RSP Permian, Inc.* | | | 13,015,437 | |
| | 2,414,346 | | | WPX Energy, Inc.* | | | 43,530,658 | |
| | | | | | | | |
| | | | | | | 119,791,541 | |
| | | | | | | | |
| | | | Food & Staples Retailing - 0.7% | |
| | 169,138 | | | PriceSmart, Inc. | | | 15,306,989 | |
| | | | | | | | |
| | | | Health Care Equipment & Services - 4.9% | |
| | 200,322 | | | Integra LifeSciences Holdings Corp.* | | | 12,902,740 | |
| | 266,149 | | | STERIS plc | | | 27,948,307 | |
| | 102,102 | | | Teleflex, Inc. | | | 27,384,777 | |
| | 198,031 | | | Varian Medical Systems, Inc.* | | | 22,520,085 | |
| | 299,022 | | | Veeva Systems, Inc. Class A* | | | 22,982,831 | |
| | | | | | | | |
| | | | | | | 113,738,740 | |
| | | | | | | | |
| | | | | | | | |
| Shares or Principal Amount | | Market Value† | |
| COMMON STOCKS - 99.7% - (continued) | |
| | | | Insurance - 5.3% | |
| | 29,133 | | | Alleghany Corp. | | $ | 16,750,601 | |
| | 35,288 | | | Fairfax Financial Holdings Ltd. | | | 19,773,520 | |
| | 352,791 | | | FNF Group | | | 13,271,998 | |
| | 36,681 | | | Markel Corp.* | | | 39,775,042 | |
| | 20,059 | | | White Mountains Insurance Group Ltd. | | | 18,185,690 | |
| | 207,195 | | | WR Berkley Corp. | | | 15,002,990 | |
| | | | | | | | |
| | | | | | | 122,759,841 | |
| | | | | | | | |
| | | | Materials - 2.8% | |
| | 653,437 | | | Ball Corp. | | | 23,229,685 | |
| | 273,411 | | | Packaging Corp. of America | | | 30,564,616 | |
| | 395,533 | | | Silgan Holdings, Inc. | | | 10,612,150 | |
| | | | | | | | |
| | | | | | | 64,406,451 | |
| | | | | | | | |
| | | | Pharmaceuticals, Biotechnology & Life Sciences - 12.9% | |
| | 326,584 | | | Aerie Pharmaceuticals, Inc.*(1) | | | 22,060,749 | |
| | 285,301 | | | Agios Pharmaceuticals, Inc.* | | | 24,030,903 | |
| | 541,136 | | | Alkermes plc* | | | 22,273,158 | |
| | 108,058 | | | Alnylam Pharmaceuticals, Inc.* | | | 10,642,632 | |
| | 87,582 | | | BeiGene Ltd. ADR* | | | 13,463,981 | |
| | 112,737 | | | Bluebird Bio, Inc.* | | | 17,694,072 | |
| | 532,153 | | | Ionis Pharmaceuticals, Inc.* | | | 22,174,816 | |
| | 893,908 | | | Ironwood Pharmaceuticals, Inc.* | | | 17,091,521 | |
| | 39,169 | | | Mettler-Toledo International, Inc.* | | | 22,664,358 | |
| | 245,218 | | | Neurocrine Biosciences, Inc.* | | | 24,090,216 | |
| | 172,386 | | | Sage Therapeutics, Inc.* | | | 26,983,581 | |
| | 171,583 | | | Seattle Genetics, Inc.* | | | 11,391,395 | |
| | 202,887 | | | Spark Therapeutics, Inc.* | | | 16,790,928 | |
| | 341,627 | | | Ultragenyx Pharmaceutical, Inc.* | | | 26,260,868 | |
| | 103,230 | | | Waters Corp.* | | | 19,984,296 | |
| | | | | | | | |
| | | | | | | 297,597,474 | |
| | | | | | | | |
| | | | Real Estate - 1.5% | |
| | 602,129 | | | Equity Commonwealth REIT* | | | 18,967,064 | |
| | 634,870 | | | Redfin Corp.*(1) | | | 14,659,148 | |
| | | | | | | | |
| | | | | | | 33,626,212 | |
| | | | | | | | |
| | | | Retailing - 2.5% | |
| | 436,770 | | | CarMax, Inc.* | | | 31,827,430 | |
| | 440,053 | | | TripAdvisor, Inc.* | | | 24,515,353 | |
| | | | | | | | |
| | | | | | | 56,342,783 | |
| | | | | | | | |
| | | | Semiconductors & Semiconductor Equipment - 2.1% | |
| | 244,261 | | | MKS Instruments, Inc. | | | 23,375,778 | |
| | 13,948 | | | Monolithic Power Systems, Inc. | | | 1,864,429 | |
| | 221,693 | | | Silicon Laboratories, Inc.* | | | 22,080,623 | |
| | | | | | | | |
| | | | | | | 47,320,830 | |
| | | | | | | | |
| | | | Software & Services - 19.6% | |
| | 240,269 | | | 2U, Inc.* | | | 20,076,878 | |
| | 439,095 | | | Akamai Technologies, Inc.* | | | 32,154,927 | |
| | 324,257 | | | Black Knight, Inc.* | | | 17,363,962 | |
| | 324,667 | | | Blackbaud, Inc. | | | 33,262,134 | |
| | 1,631,985 | | | Genpact Ltd. | | | 47,213,326 | |
| | 360,997 | | | Global Payments, Inc. | | | 40,247,556 | |
| | 155,734 | | | GrubHub, Inc.* | | | 16,338,054 | |
| | 281,788 | | | Guidewire Software, Inc.* | | | 25,017,139 | |
| | 88,390 | | | Proofpoint, Inc.* | | | 10,192,251 | |
| | 165,233 | | | PTC, Inc.* | | | 15,500,508 | |
| | 835,739 | | | Teradata Corp.* | | | 33,554,921 | |
| | 255,989 | | | Total System Services, Inc. | | | 21,636,190 | |
| | 353,506 | | | VeriSign, Inc.* | | | 48,578,794 | |
| | 290,601 | | | WEX, Inc.* | | | 55,353,678 | |
The accompanying notes are an integral part of these financial statements.
Schedule of Investments – (continued)
June 30, 2018 (Unaudited)
| | | | | | | | |
| Shares or Principal Amount | | Market Value† | |
| COMMON STOCKS - 99.7% - (continued) | |
| | | | Software & Services - 19.6% - (continued) | |
| | 210,478 | | | Zillow Group, Inc. Class A* | | $ | 12,576,060 | |
| | 367,477 | | | Zillow Group, Inc. Class C* | | | 21,703,192 | |
| | | | | | | | |
| | | | | | | 450,769,570 | |
| | | | | | | | |
| | | | Technology Hardware & Equipment - 7.3% | |
| | 519,013 | | | CDW Corp. | | | 41,931,060 | |
| | 869,642 | | | CommScope Holding Co., Inc.* | | | 25,397,894 | |
| | 71,738 | | | F5 Networks, Inc.* | | | 12,371,218 | |
| | 622,869 | | | II-VI, Inc.* | | | 27,063,658 | |
| | 530,888 | | | Keysight Technologies, Inc.* | | | 31,338,319 | |
| | 734,014 | | | National Instruments Corp. | | | 30,813,908 | |
| | | | | | | | |
| | | | | | | 168,916,057 | |
| | | | | | | | |
| | | | Transportation - 3.7% | | | |
| | 61,839 | | | AMERCO | | | 22,023,960 | |
| | 370,828 | | | Genesee & Wyoming, Inc. Class A* | | | 30,155,733 | |
| | 936,730 | | | JetBlue Airways Corp.* | | | 17,779,135 | |
| | 406,490 | | | Spirit Airlines, Inc.*(1) | | | 14,775,912 | |
| | | | | | | | |
| | | | | | | 84,734,740 | |
| | | | | | | | |
| | | | Utilities - 2.1% | | | |
| | 169,770 | | | Black Hills Corp. | | | 10,391,622 | |
| | 317,367 | | | NiSource, Inc. | | | 8,340,405 | |
| | 548,104 | | | UGI Corp. | | | 28,539,775 | |
| | | | | | | | |
| | | | | | | 47,271,802 | |
| | | | | | | | |
| | |
| | | | Total Common Stocks
(cost $1,670,443,755) | | $ | 2,293,004,714 | |
| | | | | | | | |
| | |
| | | | Total Long-Term Investments
(cost $1,670,443,755) | | $ | 2,293,004,714 | |
| | | | | | | | |
|
| SHORT-TERM INVESTMENTS - 0.8% | |
| | | | Other Investment Pools & Funds - 0.2% | | | |
| | 3,291,415 | | | Fidelity Institutional Government Fund, Institutional Class,
1.80%(2) | | $ | 3,291,415 | |
| | | | | | | | |
| | | | Securities Lending Collateral - 0.6% | | | |
| | 738,854 | | | Citibank NA DDCA,
1.91%, 7/2/2018(2) | | | 738,855 | |
| | 4,990,911 | | | Goldman Sachs Financial Square Funds, Government Institutional Fund,
1.81%(2) | | | 4,990,911 | |
| | 4,637,574 | | | Invesco Government & Agency Portfolio,
1.81%(2) | | | 4,637,574 | |
| | 1,368,208 | | | Morgan Stanley Institutional Liquidity Funds, Government Portfolio, Institutional Class,
1.84%(2) | | | 1,368,208 | |
| | 3,041,541 | | | Western Asset Institutional Government Class A Fund,
1.79%(2) | | | 3,041,541 | |
| | | | | | | | |
| | | | | | | 14,777,089 | |
| | | | | | | | |
| | |
| | | | Total Short-Term Investments
(cost $18,068,504) | | $ | 18,068,504 | |
| | | | | | | | |
| | | | | | | | | | | | |
| | | |
| | | | Total Investments
(cost $1,688,512,259) | | | 100.5 | % | | $ | 2,311,073,218 | |
| | | | Other Assets and Liabilities | | | (0.5 | )% | | | (12,264,310 | ) |
| | | | | | | | | | | | |
| | | | Total Net Assets | | | 100.0 | % | | $ | 2,298,808,908 | |
| | | | | | | | | | | | |
The accompanying notes are an integral part of these financial statements.
Schedule of Investments – (continued)
June 30, 2018 (Unaudited)
| Note: | Percentage of investments as shown is the ratio of the total market value to total net assets. |
| | Prices of foreign equities that are principally traded on certain foreign markets will generally be adjusted daily pursuant to a fair value pricing service approved by the Board of Directors in order to reflect an adjustment for factors occurring after the close of certain foreign markets but before the close of the New York Stock Exchange. |
| | Equity industry classifications used in this report are the Global Industry Classification Standard, which was developed by and is the exclusive property and service mark of MSCI, Inc. and Standard & Poor’s. |
| | For Fund compliance purposes, the Fund may not use the same classification system shown in this report as these classifications are used for financial reporting purposes. |
| (1) | Represents entire or partial securities on loan. See Note 8 in the accompanying Notes to Financial Statements for securities lending information. |
| (2) | Current yield as of period end. |
| † | See Significant Accounting Policies of accompanying Notes to Financial Statements regarding valuation of investments. |
| | |
| GLOSSARY: (abbreviations used in preceding Schedule of Investments) |
|
| Other Abbreviations: |
ADR | | American Depositary Receipt |
DDCA | | Dollars on Deposit in Custody Account |
MSCI | | Morgan Stanley Capital International |
REIT | | Real Estate Investment Trust |
The accompanying notes are an integral part of these financial statements.
Schedule of Investments – (continued)
June 30, 2018 (Unaudited)
Fair Valuation Summary
The following is a summary of the fair valuations according to the inputs used as of June 30, 2018 in valuing the Fund’s investments.
| | | | | | | | | | | | | | | | |
| | | Total | | | Level 1(1) | | | Level 2(1) | | | Level 3(1) | |
Assets | |
Common Stocks | |
Banks | | $ | 142,225,573 | | | $ | 142,225,573 | | | $ | — | | | $ | — | |
Capital Goods | | | 164,916,830 | | | | 164,916,830 | | | | — | | | | — | |
Commercial & Professional Services | | | 216,643,831 | | | | 216,643,831 | | | | — | | | | — | |
Consumer Durables & Apparel | | | 46,171,209 | | | | 46,171,209 | | | | — | | | | — | |
Consumer Services | | | 23,715,040 | | | | 23,715,040 | | | | — | | | | — | |
Diversified Financials | | | 76,749,201 | | | | 76,749,201 | | | | — | | | | — | |
Energy | | | 119,791,541 | | | | 119,791,541 | | | | — | | | | — | |
Food & Staples Retailing | | | 15,306,989 | | | | 15,306,989 | | | | — | | | | — | |
Health Care Equipment & Services | | | 113,738,740 | | | | 113,738,740 | | | | — | | | | — | |
Insurance | | | 122,759,841 | | | | 122,759,841 | | | | — | | | | — | |
Materials | | | 64,406,451 | | | | 64,406,451 | | | | — | | | | — | |
Pharmaceuticals, Biotechnology & Life Sciences | | | 297,597,474 | | | | 297,597,474 | | | | — | | | | — | |
Real Estate | | | 33,626,212 | | | | 33,626,212 | | | | — | | | | — | |
Retailing | | | 56,342,783 | | | | 56,342,783 | | | | — | | | | — | |
Semiconductors & Semiconductor Equipment | | | 47,320,830 | | | | 47,320,830 | | | | — | | | | — | |
Software & Services | | | 450,769,570 | | | | 450,769,570 | | | | — | | | | — | |
Technology Hardware & Equipment | | | 168,916,057 | | | | 168,916,057 | | | | — | | | | — | |
Transportation | | | 84,734,740 | | | | 84,734,740 | | | | — | | | | — | |
Utilities | | | 47,271,802 | | | | 47,271,802 | | | | — | | | | — | |
Short-Term Investments | | | 18,068,504 | | | | 18,068,504 | | | | — | | | | — | |
| | | | | | | | | | | | | | | | |
Total | | $ | 2,311,073,218 | | | $ | 2,311,073,218 | | | $ | — | | | $ | — | |
| | | | | | | | | | | | | | | | |
| (1) | For the six-month period ended June 30, 2018, there were no transfers between any levels. |
The accompanying notes are an integral part of these financial statements.
|
| Hartford MidCap Value HLS Fund |
Schedule of Investments
June 30, 2018 (Unaudited)
| | | | | | | | |
| Shares or Principal Amount | | Market Value† | |
| COMMON STOCKS - 98.0% | |
| | | | Automobiles & Components - 0.9% | |
| | 130,080 | | | Goodyear Tire & Rubber Co. | | $ | 3,029,563 | |
| | | | | | | | |
| | | | Banks - 12.6% | |
| | 111,254 | | | BancorpSouth Bank | | | 3,665,819 | |
| | 85,524 | | | Bank of the Ozarks, Inc. | | | 3,852,001 | |
| | 82,737 | | | Comerica, Inc. | | | 7,522,448 | |
| | 77,071 | | | First Midwest Bancorp, Inc. | | | 1,962,998 | |
| | 72,237 | | | IBERIABANK Corp. | | | 5,475,565 | |
| | 54,747 | | | Pinnacle Financial Partners, Inc. | | | 3,358,728 | |
| | 50,484 | | | South State Corp. | | | 4,354,245 | |
| | 227,276 | | | Sterling Bancorp | | | 5,340,986 | |
| | 74,888 | | | Western Alliance Bancorp* | | | 4,239,410 | |
| | 87,698 | | | Zions Bancorporation | | | 4,620,808 | |
| | | | | | | | |
| | | | | | | 44,393,008 | |
| | | | | | | | |
| | | | Capital Goods - 9.8% | |
| | 68,667 | | | Granite Construction, Inc. | | | 3,822,005 | |
| | 32,095 | | | Harris Corp. | | | 4,639,011 | |
| | 46,638 | | | Hubbell, Inc. | | | 4,931,502 | |
| | 95,317 | | | JELD-WEN Holding, Inc.* | | | 2,725,113 | |
| | 259,983 | | | Milacron Holdings Corp.* | | | 4,921,478 | |
| | 52,717 | | | Moog, Inc. Class A | | | 4,109,818 | |
| | 385,668 | | | Sanwa Holdings Corp. | | | 4,075,549 | |
| | 80,795 | | | Sensata Technologies Holding plc* | | | 3,844,226 | |
| | 27,427 | | | WESCO International, Inc.* | | | 1,566,082 | |
| | | | | | | | |
| | | | | | | 34,634,784 | |
| | | | | | | | |
| | | | Commercial & Professional Services - 2.9% | |
| | 197,524 | | | Atento S.A. | | | 1,353,039 | |
| | 89,039 | | | Clean Harbors, Inc.* | | | 4,946,117 | |
| | 31,116 | | | Dun & Bradstreet Corp. | | | 3,816,377 | |
| | | | | | | | |
| | | | | | | 10,115,533 | |
| | | | | | | | |
| | | | Consumer Durables & Apparel - 1.3% | |
| | 26,683 | | | D.R. Horton, Inc. | | | 1,094,003 | |
| | 27,424 | | | Lennar Corp. Class A | | | 1,439,760 | |
| | 50,386 | | | Toll Brothers, Inc. | | | 1,863,778 | |
| | | | | | | | |
| | | | | | | 4,397,541 | |
| | | | | | | | |
| | | | Consumer Services - 0.8% | |
| | 57,558 | | | Norwegian Cruise Line Holdings Ltd.* | | | 2,719,616 | |
| | | | | | | | |
| | | | Energy - 8.3% | |
| | 44,297 | | | Delek U.S. Holdings, Inc. | | | 2,222,381 | |
| | 95,225 | | | Diamondback Energy, Inc. | | | 12,528,753 | |
| | 32,206 | | | Energen Corp.* | | | 2,345,241 | |
| | 171,470 | | | Laredo Petroleum, Inc.* | | | 1,649,541 | |
| | 232,533 | | | Newfield Exploration Co.* | | | 7,034,123 | |
| | 191,600 | | | WPX Energy, Inc.* | | | 3,454,548 | |
| | | | | | | | |
| | | | | | | 29,234,587 | |
| | | | | | | | |
| | | | Food & Staples Retailing - 1.7% | |
| | 158,677 | | | US Foods Holding Corp.* | | | 6,001,164 | |
| | | | | | | | |
| | | | Food, Beverage & Tobacco - 2.1% | |
| | 22,419 | | | Ingredion, Inc. | | | 2,481,783 | |
| | 54,798 | | | Post Holdings, Inc.* | | | 4,713,724 | |
| | | | | | | | |
| | | | | | | 7,195,507 | |
| | | | | | | | |
| | | | Health Care Equipment & Services - 4.2% | |
| | 122,236 | | | Acadia Healthcare Co., Inc.* | | | 5,000,675 | |
| | 146,104 | | | Brookdale Senior Living, Inc.* | | | 1,328,085 | |
| | 39,691 | | | Hill-Rom Holdings, Inc. | | | 3,466,612 | |
| | 48,908 | | | STERIS plc | | | 5,135,829 | |
| | | | | | | | |
| | | | | | | 14,931,201 | |
| | | | | | | | |
| | | | | | | | |
| Shares or Principal Amount | | Market Value† | |
| COMMON STOCKS - 98.0% - (continued) | |
| | | | Insurance - 7.8% | |
| | 36,562 | | | Assurant, Inc. | | $ | 3,783,801 | |
| | 196,832 | | | CNO Financial Group, Inc. | | | 3,747,681 | |
| | 30,665 | | | Hanover Insurance Group, Inc. | | | 3,666,308 | |
| | 248,742 | | | Jardine Lloyd Thompson Group plc | | | 4,201,950 | |
| | 498,554 | | | Lancashire Holdings Ltd. | | | 3,725,468 | |
| | 39,528 | | | Reinsurance Group of America, Inc. | | | 5,276,198 | |
| | 85,793 | | | Unum Group | | | 3,173,483 | |
| | | | | | | | |
| | | | | | | 27,574,889 | |
| | | | | | | | |
| | | | Materials - 10.1% | |
| | 73,124 | | | Alcoa Corp.* | | | 3,428,053 | |
| | 115,168 | | | Buzzi Unicem S.p.A. | | | 2,813,905 | |
| | 84,082 | | | Cabot Corp. | | | 5,193,745 | |
| | 57,376 | | | Celanese Corp. Series A | | | 6,372,179 | |
| | 125,498 | | | Commercial Metals Co. | | | 2,649,263 | |
| | 62,337 | | | FMC Corp. | | | 5,561,084 | |
| | 73,377 | | | Olin Corp. | | | 2,107,387 | |
| | 65,510 | | | Reliance Steel & Aluminum Co. | | | 5,734,745 | |
| | 16,111 | | | Westlake Chemical Corp. | | | 1,734,027 | |
| | | | | | | | |
| | | | | | | 35,594,388 | |
| | | | | | | | |
| | | | Media - 0.5% | |
| | 160,242 | | | TEGNA, Inc. | | | 1,738,626 | |
| | | | | | | | |
| | | | Pharmaceuticals, Biotechnology & Life Sciences - 0.1% | |
| | 30,179 | | | Five Prime Therapeutics, Inc.* | | | 477,130 | |
| | | | | | | | |
| | | | Real Estate - 10.8% | |
| | 45,507 | | | American Assets Trust, Inc. REIT | | | 1,742,463 | |
| | 266,713 | | | Brixmor Property Group, Inc. REIT | | | 4,648,808 | |
| | 159,284 | | | Corporate Office Properties Trust REIT | | | 4,617,643 | |
| | 28,937 | | | Equity LifeStyle Properties, Inc. REIT | | | 2,659,310 | |
| | 35,352 | | | Extra Space Storage, Inc. REIT | | | 3,528,483 | |
| | 38,257 | | | Forest City Realty Trust, Inc. Class A, REIT | | | 872,642 | |
| | 31,358 | | | Life Storage, Inc. REIT | | | 3,051,447 | |
| | 145,894 | | | Park Hotels & Resorts, Inc. REIT | | | 4,468,733 | |
| | 43,884 | | | PS Business Parks, Inc. REIT | | | 5,639,094 | |
| | 242,556 | | | STORE Capital Corp. REIT | | | 6,646,035 | |
| | | | | | | | |
| | | | | | | 37,874,658 | |
| | | | | | | | |
| | | | Retailing - 0.7% | |
| | 70,800 | | | Caleres, Inc. | | | 2,434,812 | |
| | | | | | | | |
| | | | Semiconductors & Semiconductor Equipment - 4.1% | |
| | 86,030 | | | Axcelis Technologies, Inc.* | | | 1,703,394 | |
| | 128,423 | | | Ichor Holdings Ltd.*(1) | | | 2,725,136 | |
| | 114,366 | | | Silicon Motion Technology Corp. ADR | | | 6,048,818 | |
| | 102,403 | | | Teradyne, Inc. | | | 3,898,482 | |
| | | | | | | | |
| | | | | | | 14,375,830 | |
| | | | | | | | |
| | | | Software & Services - 3.7% | |
| | 83,508 | | | Booz Allen Hamilton Holding Corp. | | | 3,651,805 | |
| | 85,678 | | | SS&C Technologies Holdings, Inc. | | | 4,446,688 | |
| | 34,867 | | | VeriSign, Inc.* | | | 4,791,423 | |
| | | | | | | | |
| | | | | | | 12,889,916 | |
| | | | | | | | |
| | | | Technology Hardware & Equipment - 5.5% | |
| | 94,329 | | | Acacia Communications, Inc.*(1) | | | 3,283,593 | |
| | 112,661 | | | Arrow Electronics, Inc.* | | | 8,481,120 | |
| | 79,439 | | | KEMET Corp.* | | | 1,918,452 | |
| | 98,309 | | | Keysight Technologies, Inc.* | | | 5,803,180 | |
| | | | | | | | |
| | | | | | | 19,486,345 | |
| | | | | | | | |
| | | | Telecommunication Services - 1.1% | |
| | 68,121 | | | Millicom International Cellular S.A. | | | 4,003,613 | |
| | | | | | | | |
The accompanying notes are an integral part of these financial statements.
|
| Hartford MidCap Value HLS Fund |
Schedule of Investments – (continued)
June 30, 2018 (Unaudited)
| | | | | | | | |
| Shares or Principal Amount | | Market Value† | |
| COMMON STOCKS - 98.0% - (continued) | |
| | | | Transportation - 3.9% | | | |
| | 70,541 | | | Genesee & Wyoming, Inc. Class A* | | $ | 5,736,394 | |
| | 188,526 | | | JetBlue Airways Corp.* | | | 3,578,224 | |
| | 80,648 | | | Knight-Swift Transportation Holdings, Inc. | | | 3,081,560 | |
| | 52,645 | | | Schneider National, Inc. Class B | | | 1,448,264 | |
| | | | | | | | |
| | | | | | | 13,844,442 | |
| | | | | | | | |
| | | | Utilities - 5.1% | | | |
| | 134,149 | | | Alliant Energy Corp. | | | 5,677,186 | |
| | 58,622 | | | Evergy, Inc. | | | 3,291,625 | |
| | 174,277 | | | UGI Corp. | | | 9,074,603 | |
| | | | | | | | |
| | | | | | | 18,043,414 | |
| | | | | | | | |
| | |
| | | | Total Common Stocks
(cost $287,363,426) | | $ | 344,990,567 | |
| | | | | | | | |
| | |
| | | | Total Long-Term Investments
(cost $287,363,426) | | $ | 344,990,567 | |
| | | | | | | | |
|
| SHORT-TERM INVESTMENTS - 3.0% | |
| | | | Other Investment Pools & Funds - 1.9% | | | |
| | 6,610,595 | | | Morgan Stanley Institutional Liquidity Funds, Government Portfolio, Institutional Class,
1.84%(2) | | $ | 6,610,595 | |
| | | | | | | | |
| | | | Securities Lending Collateral - 1.1% | | | |
| | 196,904 | | | Citibank NA DDCA,
1.91%, 7/2/2018(2) | | | 196,904 | |
| | 1,330,072 | | | Goldman Sachs Financial Square Funds, Government Institutional Fund,
1.81%(2) | | | 1,330,071 | |
| | 1,235,908 | | | Invesco Government & Agency Portfolio,
1.81%(2) | | | 1,235,908 | |
| | 364,626 | | | Morgan Stanley Institutional Liquidity Funds, Government Portfolio, Institutional Class,
1.84%(2) | | | 364,626 | |
| | 810,567 | | | Western Asset Institutional Government Class A Fund,
1.79%(2) | | | 810,567 | |
| | | | | | | | |
| | | | | | | 3,938,076 | |
| | | | | | | | |
| | |
| | | | Total Short-Term Investments
(cost $10,548,671) | | $ | 10,548,671 | |
| | | | | | | | |
| | | | | | | | | | | | |
| | | |
| | | | Total Investments
(cost $297,912,097) | | | 101.0 | % | | $ | 355,539,238 | |
| | | | Other Assets and Liabilities | | | (1.0 | )% | | | (3,601,264 | ) |
| | | | | | | | | | | | |
| | | | Total Net Assets | | | 100.0 | % | | $ | 351,937,974 | |
| | | | | | | | | | | | |
The accompanying notes are an integral part of these financial statements.
|
| Hartford MidCap Value HLS Fund |
Schedule of Investments – (continued)
June 30, 2018 (Unaudited)
| Note: | Percentage of investments as shown is the ratio of the total market value to total net assets. |
| | Prices of foreign equities that are principally traded on certain foreign markets will generally be adjusted daily pursuant to a fair value pricing service approved by the Board of Directors in order to reflect an adjustment for factors occurring after the close of certain foreign markets but before the close of the New York Stock Exchange. |
| | Equity industry classifications used in this report are the Global Industry Classification Standard, which was developed by and is the exclusive property and service mark of MSCI, Inc. and Standard & Poor’s. |
| | For Fund compliance purposes, the Fund may not use the same classification system shown in this report as these classifications are used for financial reporting purposes. |
| (1) | Represents entire or partial securities on loan. See Note 8 in the accompanying Notes to Financial Statements for securities lending information. |
| (2) | Current yield as of period end. |
| † | See Significant Accounting Policies of accompanying Notes to Financial Statements regarding valuation of investments. |
| | |
| GLOSSARY: (abbreviations used in preceding Schedule of Investments) |
|
| Other Abbreviations: |
ADR | | American Depositary Receipt |
DDCA | | Dollars on Deposit in Custody Account |
REIT | | Real Estate Investment Trust |
The accompanying notes are an integral part of these financial statements.
|
| Hartford MidCap Value HLS Fund |
Schedule of Investments – (continued)
June 30, 2018 (Unaudited)
Fair Valuation Summary
The following is a summary of the fair valuations according to the inputs used as of June 30, 2018 in valuing the Fund’s investments.
| | | | | | | | | | | | | | | | |
| | | Total | | | Level 1(1) | | | Level 2(1) | | | Level 3(1) | |
Assets | | | | | | | | | | | | | | | | |
Common Stocks | | | | | | | | | | | | | | | | |
Automobiles & Components | | $ | 3,029,563 | | | $ | 3,029,563 | | | $ | — | | | $ | — | |
Banks | | | 44,393,008 | | | | 44,393,008 | | | | — | | | | — | |
Capital Goods | | | 34,634,784 | | | | 30,559,235 | | | | 4,075,549 | | | | — | |
Commercial & Professional Services | | | 10,115,533 | | | | 10,115,533 | | | | — | | | | — | |
Consumer Durables & Apparel | | | 4,397,541 | | | | 4,397,541 | | | | — | | | | — | |
Consumer Services | | | 2,719,616 | | | | 2,719,616 | | | | — | | | | — | |
Energy | | | 29,234,587 | | | | 29,234,587 | | | | — | | | | — | |
Food & Staples Retailing | | | 6,001,164 | | | | 6,001,164 | | | | — | | | | — | |
Food, Beverage & Tobacco | | | 7,195,507 | | | | 7,195,507 | | | | — | | | | — | |
Health Care Equipment & Services | | | 14,931,201 | | | | 14,931,201 | | | | — | | | | — | |
Insurance | | | 27,574,889 | | | | 23,849,421 | | | | 3,725,468 | | | | — | |
Materials | | | 35,594,388 | | | | 32,780,483 | | | | 2,813,905 | | | | — | |
Media | | | 1,738,626 | | | | 1,738,626 | | | | — | | | | — | |
Pharmaceuticals, Biotechnology & Life Sciences | | | 477,130 | | | | 477,130 | | | | — | | | | — | |
Real Estate | | | 37,874,658 | | | | 37,874,658 | | | | — | | | | — | |
Retailing | | | 2,434,812 | | | | 2,434,812 | | | | — | | | | — | |
Semiconductors & Semiconductor Equipment | | | 14,375,830 | | | | 14,375,830 | | | | — | | | | — | |
Software & Services | | | 12,889,916 | | | | 12,889,916 | | | | — | | | | — | |
Technology Hardware & Equipment | | | 19,486,345 | | | | 19,486,345 | | | | — | | | | — | |
Telecommunication Services | | | 4,003,613 | | | | — | | | | 4,003,613 | | | | — | |
Transportation | | | 13,844,442 | | | | 13,844,442 | | | | — | | | | — | |
Utilities | | | 18,043,414 | | | | 18,043,414 | | | | — | | | | — | |
Short-Term Investments | | | 10,548,671 | | | | 10,548,671 | | | | — | | | | — | |
| | | | | | | | | | | | | | | | |
Total | | $ | 355,539,238 | | | $ | 340,920,703 | | | $ | 14,618,535 | | | $ | — | |
| | | | | | | | | | | | | | | | |
| (1) | For the six-month period ended June 30, 2018, investments valued at $4,673,250 were transferred from Level 1 to Level 2 due to the application of a fair valuation model factor; there were no transfers from Level 2 to Level 1 and there were no transfers in and out of Level 3. |
| Note: | For purposes of reporting transfers between different hierarchy levels, both transfers in and out of each level, as applicable, are shown as if they occurred at the beginning of the period. |
The accompanying notes are an integral part of these financial statements.
|
| Hartford Small Cap Growth HLS Fund |
Schedule of Investments
June 30, 2018 (Unaudited)
| | | | | | | | |
| Shares or Principal Amount | | Market Value† | |
| COMMON STOCKS - 97.7% | |
| | | | Automobiles & Components - 1.6% | |
| | 169,249 | | | Cooper Tire & Rubber Co. | | $ | 4,451,249 | |
| | 239,744 | | | Tenneco, Inc. | | | 10,539,146 | |
| | 58,632 | | | Visteon Corp.* | | | 7,577,600 | |
| | | | | | | | |
| | | | | | | 22,567,995 | |
| | | | | | | | |
| | | | Banks - 3.6% | |
| | 24,370 | | | Bank of NT Butterfield & Son Ltd. | | | 1,114,196 | |
| | 22,522 | | | Cadence BanCorp. | | | 650,210 | |
| | 41,441 | | | Essent Group Ltd.* | | | 1,484,417 | |
| | 68,571 | | | FCB Financial Holdings, Inc. Class A* | | | 4,031,975 | |
| | 140,008 | | | First Busey Corp. | | | 4,441,054 | |
| | 182,036 | | | First Hawaiian, Inc. | | | 5,282,685 | |
| | 130,147 | | | Great Western Bancorp, Inc. | | | 5,464,872 | |
| | 98,477 | | | IBERIABANK Corp. | | | 7,464,557 | |
| | 638,182 | | | MGIC Investment Corp.* | | | 6,841,311 | |
| | 322,126 | | | Sterling Bancorp | | | 7,569,961 | |
| | 118,596 | | | Triumph Bancorp, Inc.* | | | 4,832,787 | |
| | 20,190 | | | Walker & Dunlop, Inc. | | | 1,123,573 | |
| | | | | | | | |
| | | | | | | 50,301,598 | |
| | | | | | | | |
| | | | Capital Goods - 10.2% | |
| | 231,828 | | | Aerojet Rocketdyne Holdings, Inc.* | | | 6,836,608 | |
| | 207,115 | | | Altra Industrial Motion Corp. | | | 8,926,656 | |
| | 71,760 | | | American Woodmark Corp.* | | | 6,569,628 | |
| | 130,939 | | | Applied Industrial Technologies, Inc. | | | 9,185,371 | |
| | 126,344 | | | Armstrong World Industries, Inc.* | | | 7,984,941 | |
| | 83,771 | | | Astec Industries, Inc. | | | 5,009,506 | |
| | 24,341 | | | Atkore International Group, Inc.* | | | 505,563 | |
| | 8,245 | | | Axon Enterprise, Inc.* | | | 520,919 | |
| | 133,067 | | | AZZ, Inc. | | | 5,781,761 | |
| | 3,231 | | | Barnes Group, Inc. | | | 190,306 | |
| | 228,196 | | | BMC Stock Holdings, Inc.* | | | 4,757,887 | |
| | 31,518 | | | Caesarstone Ltd.(1) | | | 475,922 | |
| | 59,288 | | | Continental Building Products, Inc.* | | | 1,870,536 | |
| | 24,070 | | | EMCOR Group, Inc. | | | 1,833,653 | |
| | 13,972 | | | EnerSys | | | 1,042,870 | |
| | 186,376 | | | Evoqua Water Technologies Corp.* | | | 3,820,708 | |
| | 227,546 | | | Generac Holdings, Inc.* | | | 11,770,955 | |
| | 29,540 | | | Global Brass & Copper Holdings, Inc. | | | 926,079 | |
| | 56,887 | | | Hillenbrand, Inc. | | | 2,682,222 | |
| | 13,544 | | | Hyster-Yale Materials Handling, Inc. | | | 870,202 | |
| | 178,156 | | | ITT, Inc. | | | 9,312,214 | |
| | 274,154 | | | JELD-WEN Holding, Inc.* | | | 7,838,063 | |
| | 119,300 | | | John Bean Technologies Corp. | | | 10,605,770 | |
| | 62,963 | | | KBR, Inc. | | | 1,128,297 | |
| | 90,800 | | | Mercury Systems, Inc.* | | | 3,455,848 | |
| | 44,967 | | | Meritor, Inc.* | | | 924,971 | |
| | 346,049 | | | Milacron Holdings Corp.* | | | 6,550,707 | |
| | 12,916 | | | Proto Labs, Inc.* | | | 1,536,358 | |
| | 275,588 | | | Rexnord Corp.* | | | 8,008,587 | |
| | 21,692 | | | Rush Enterprises, Inc. Class A* | | | 940,999 | |
| | 61,865 | | | SiteOne Landscape Supply, Inc.* | | | 5,194,804 | |
| | 32,683 | | | Wabash National Corp. | | | 609,865 | |
| | 186,924 | | | Welbilt, Inc.* | | | 4,170,274 | |
| | | | | | | | |
| | | | | | | 141,839,050 | |
| | | | | | | | |
| | | | Commercial & Professional Services - 5.0% | |
| | 202,351 | | | Advanced Disposal Services, Inc.* | | | 5,014,258 | |
| | 156,813 | | | ASGN, Inc.* | | | 12,261,208 | |
| | 33,914 | | | Brink’s Co. | | | 2,704,641 | |
| | 7,351 | | | Cimpress N.V.* | | | 1,065,601 | |
| | 129,824 | | | Clean Harbors, Inc.* | | | 7,211,723 | |
| | | | | | | | |
| Shares or Principal Amount | | Market Value† | |
| COMMON STOCKS - 97.7% - (continued) | |
| | | | Commercial & Professional Services - 5.0% - (continued) | |
| | 90,167 | | | Deluxe Corp. | | $ | 5,969,957 | |
| | 222,832 | | | Exponent, Inc. | | | 10,762,786 | |
| | 56,150 | | | Herman Miller, Inc. | | | 1,903,485 | |
| | 106,120 | | | Huron Consulting Group, Inc.* | | | 4,340,308 | |
| | 20,076 | | | Insperity, Inc. | | | 1,912,239 | |
| | 11,125 | | | Korn/Ferry International | | | 688,971 | |
| | 90,505 | | | MSA Safety, Inc. | | | 8,719,252 | |
| | 55,916 | | | Quad/Graphics, Inc. | | | 1,164,730 | |
| | 62,073 | | | Steelcase, Inc. Class A | | | 837,986 | |
| | 21,570 | | | TriNet Group, Inc.* | | | 1,206,626 | |
| | 20,250 | | | TrueBlue, Inc.* | | | 545,738 | |
| | 51,349 | | | WageWorks, Inc.* | | | 2,567,450 | |
| | | | | | | | |
| | | | | | | 68,876,959 | |
| | | | | | | | |
| | | | Consumer Durables & Apparel - 5.5% | |
| | 98,854 | | | Carter’s, Inc. | | | 10,714,785 | |
| | 60,268 | | | Crocs, Inc.* | | | 1,061,319 | |
| | 14,213 | | | Deckers Outdoor Corp.* | | | 1,604,506 | |
| | 18,546 | | | Fossil Group, Inc.* | | | 498,331 | |
| | 154,452 | | | Installed Building Products, Inc.* | | | 8,734,261 | |
| | 67,339 | | | KB Home | | | 1,834,314 | |
| | 34,308 | | | La-Z-Boy, Inc. | | | 1,049,825 | |
| | 13,303 | | | MDC Holdings, Inc. | | | 409,333 | |
| | 26,497 | | | Movado Group, Inc. | | | 1,279,805 | |
| | 105,114 | | | Oxford Industries, Inc. | | | 8,722,360 | |
| | 269,600 | | | Steven Madden Ltd. | | | 14,315,760 | |
| | 144,710 | | | TopBuild Corp.* | | | 11,336,581 | |
| | 403,782 | | | Wolverine World Wide, Inc. | | | 14,039,500 | |
| | 26,036 | | | ZAGG, Inc.* | | | 450,423 | |
| | | | | | | | |
| | | | | | | 76,051,103 | |
| | | | | | | | |
| | | | Consumer Services - 3.7% | |
| | 19,500 | | | American Public Education, Inc.* | | | 820,950 | |
| | 27,568 | | | BJ’s Restaurants, Inc. | | | 1,654,080 | |
| | 77,007 | | | Bloomin’ Brands, Inc. | | | 1,547,841 | |
| | 15,154 | | | Boyd Gaming Corp. | | | 525,238 | |
| | 14,654 | | | Brinker International, Inc.(1) | | | 697,530 | |
| | 3,716 | | | Churchill Downs, Inc. | | | 1,101,794 | |
| | 16,198 | | | DineEquity, Inc. | | | 1,211,610 | |
| | 142,560 | | | Dunkin’ Brands Group, Inc.(1) | | | 9,846,619 | |
| | 5,583 | | | Grand Canyon Education, Inc.* | | | 623,119 | |
| | 87,996 | | | Marriott Vacations Worldwide Corp. | | | 9,940,028 | |
| | 125,889 | | | Papa John’s International, Inc.(1) | | | 6,385,090 | |
| | 71,542 | | | Penn National Gaming, Inc.* | | | 2,403,096 | |
| | 28,362 | | | SeaWorld Entertainment, Inc.*(1) | | | 618,859 | |
| | 20,669 | | | Sotheby’s* | | | 1,123,154 | |
| | 12,983 | | | Texas Roadhouse, Inc. | | | 850,516 | |
| | 11,318 | | | Weight Watchers International, Inc.* | | | 1,144,250 | |
| | 217,337 | | | Wingstop, Inc. | | | 11,327,604 | |
| | | | | | | | |
| | | | | | | 51,821,378 | |
| | | | | | | | |
| | | | Diversified Financials - 2.0% | |
| | 36,001 | | | Enova International, Inc.* | | | 1,315,836 | |
| | 112,242 | | | Evercore, Inc. Class A | | | 11,835,919 | |
| | 13,408 | | | FirstCash, Inc. | | | 1,204,709 | |
| | 17,185 | | | Green Dot Corp. Class A* | | | 1,261,207 | |
| | 7,817 | | | Houlihan Lokey, Inc. | | | 400,387 | |
| | 28,613 | | | Moelis & Co. Class A | | | 1,678,152 | |
| | 130,347 | | | OneMain Holdings, Inc.* | | | 4,339,252 | |
| | 440,584 | | | SLM Corp.* | | | 5,044,687 | |
| | 16,277 | | | Virtu Financial, Inc. Class A | | | 432,154 | |
| | | | | | | | |
| | | | | | | 27,512,303 | |
| | | | | | | | |
The accompanying notes are an integral part of these financial statements.
|
| Hartford Small Cap Growth HLS Fund |
Schedule of Investments – (continued)
June 30, 2018 (Unaudited)
| | | | | | | | |
| Shares or Principal Amount | | Market Value† | |
| COMMON STOCKS - 97.7% - (continued) | |
| | | | Energy - 2.3% | |
| | 32,964 | | | CONSOL Energy, Inc.* | | $ | 1,264,169 | |
| | 40,584 | | | CVR Energy, Inc.(1) | | | 1,501,202 | |
| | 28,529 | | | Delek U.S. Holdings, Inc. | | | 1,431,300 | |
| | 230,530 | | | Newfield Exploration Co.* | | | 6,973,532 | |
| | 111,339 | | | PDC Energy, Inc.* | | | 6,730,442 | |
| | 288,400 | | | ProPetro Holding Corp.* | | | 4,522,112 | |
| | 20,315 | | | REX American Resources Corp.* | | | 1,644,906 | |
| | 91,078 | | | W&T Offshore, Inc.* | | | 651,208 | |
| | 298,346 | | | WildHorse Resource Development Corp.* | | | 7,566,055 | |
| | | | | | | | |
| | | | | | | 32,284,926 | |
| | | | | | | | |
| | | | Food & Staples Retailing - 1.8% | |
| | 61,761 | | | Casey’s General Stores, Inc. | | | 6,489,846 | |
| | 265,066 | | | Performance Food Group Co.* | | | 9,727,922 | |
| | 99,560 | | | PriceSmart, Inc. | | | 9,010,180 | |
| | | | | | | | |
| | | | | | | 25,227,948 | |
| | | | | | | | |
| | | | Food, Beverage & Tobacco - 1.2% | |
| | 10,697 | | | Boston Beer Co., Inc. Class A* | | | 3,205,891 | |
| | 498,573 | | | Hostess Brands, Inc.* | | | 6,780,593 | |
| | 30,590 | | | Pilgrim’s Pride Corp.* | | | 615,776 | |
| | 68,297 | | | Post Holdings, Inc.* | | | 5,874,908 | |
| | | | | | | | |
| | | | | | | 16,477,168 | |
| | | | | | | | |
| | | | Health Care Equipment & Services - 10.8% | |
| | 2,398 | | | AMN Healthcare Services, Inc.* | | | 140,523 | |
| | 255,735 | | | AtriCure, Inc.* | | | 6,917,632 | |
| | 211,420 | | | Cardiovascular Systems, Inc.* | | | 6,837,323 | |
| | 4,130 | | | Chemed Corp. | | | 1,329,075 | |
| | 29,525 | | | Encompass Health Corp. | | | 1,999,433 | |
| | 289,972 | | | Globus Medical, Inc. Class A* | | | 14,631,987 | |
| | 38,284 | | | Haemonetics Corp.* | | | 3,433,309 | |
| | 15,972 | | | HealthEquity, Inc.* | | | 1,199,497 | |
| | 332,961 | | | HMS Holdings Corp.* | | | 7,198,617 | |
| | 53,807 | | | ICU Medical, Inc.* | | | 15,800,426 | |
| | 5,716 | | | Inogen, Inc.* | | | 1,065,062 | |
| | 119,873 | | | Insulet Corp.* | | | 10,273,116 | |
| | 151,595 | | | Integra LifeSciences Holdings Corp.* | | | 9,764,234 | |
| | 5,736 | | | Magellan Health, Inc.* | | | 550,369 | |
| | 90,577 | | | Medidata Solutions, Inc.* | | | 7,296,883 | |
| | 190,730 | | | Merit Medical Systems, Inc.* | | | 9,765,376 | |
| | 99,443 | | | Molina Healthcare, Inc.* | | | 9,739,447 | |
| | 179,211 | | | Natus Medical, Inc.* | | | 6,182,780 | |
| | 184,304 | | | Omnicell, Inc.* | | | 9,666,745 | |
| | 349,267 | | | OraSure Technologies, Inc.* | | | 5,752,428 | |
| | 109,587 | | | Orthofix International N.V.* | | | 6,226,733 | |
| | 31,420 | | | Providence Service Corp.* | | | 2,468,041 | |
| | 12,796 | | | Quidel Corp.* | | | 850,934 | |
| | 38,416 | | | Tenet Healthcare Corp.* | | | 1,289,625 | |
| | 44,969 | | | Triple-S Management Corp. Class B* | | | 1,756,489 | |
| | 65,296 | | | U.S. Physical Therapy, Inc. | | | 6,268,416 | |
| | 5,501 | | | WellCare Health Plans, Inc.* | | | 1,354,566 | |
| | | | | | | | |
| | | | | | | 149,759,066 | |
| | | | | | | | |
| | | | Household & Personal Products - 0.4% | |
| | 17,438 | | | Medifast, Inc. | | | 2,792,870 | |
| | 25,765 | | | USANA Health Sciences, Inc.* | | | 2,970,705 | |
| | | | | | | | |
| | | | | | | 5,763,575 | |
| | | | | | | | |
| | | | Insurance - 0.7% | |
| | 39,282 | | | American Equity Investment Life Holding Co. | | | 1,414,152 | |
| | 192,835 | | | James River Group Holdings Ltd. | | | 7,576,487 | |
| | | | | | | | |
| Shares or Principal Amount | | Market Value† | |
| COMMON STOCKS - 97.7% - (continued) | |
| | | | Insurance - 0.7% - (continued) | |
| | 33,874 | | | Universal Insurance Holdings, Inc. | | $ | 1,188,978 | |
| | | | | | | | |
| | | | | | | 10,179,617 | |
| | | | | | | | |
| | | | Materials - 3.7% | |
| | 15,420 | | | AdvanSix, Inc.* | | | 564,835 | |
| | 202,445 | | | Boise Cascade Co. | | | 9,049,292 | |
| | 506,971 | | | Graphic Packaging Holding Co. | | | 7,356,149 | |
| | 6,492 | | | Koppers Holdings, Inc.* | | | 248,968 | |
| | 41,131 | | | Kronos Worldwide, Inc. | | | 926,681 | |
| | 355,099 | | | Louisiana-Pacific Corp. | | | 9,665,795 | |
| | 415,121 | | | OMNOVA Solutions, Inc.* | | | 4,317,258 | |
| | 260,801 | | | PolyOne Corp. | | | 11,271,819 | |
| | 19,159 | | | Stepan Co. | | | 1,494,594 | |
| | 222,084 | | | Summit Materials, Inc. Class A* | | | 5,829,705 | |
| | | | | | | | |
| | | | | | | 50,725,096 | |
| | | | | | | | |
| | | | Media - 0.3% | |
| | 32,439 | | | New York Times Co. Class A | | | 840,170 | |
| | 44,813 | | | World Wrestling Entertainment, Inc. Class A(1) | | | 3,263,283 | |
| | | | | | | | |
| | | | | | | 4,103,453 | |
| | | | | | | | |
| | | | Pharmaceuticals, Biotechnology & Life Sciences - 14.5% | |
| | 189,651 | | | Abeona Therapeutics, Inc.*(1) | | | 3,034,416 | |
| | 16,837 | | | Acorda Therapeutics, Inc.* | | | 483,222 | |
| | 100,648 | | | Aerie Pharmaceuticals, Inc.* | | | 6,798,772 | |
| | 45,527 | | | Agios Pharmaceuticals, Inc.* | | | 3,834,739 | |
| | 15,117 | | | Aimmune Therapeutics, Inc.* | | | 406,496 | |
| | 69,487 | | | Akebia Therapeutics, Inc.* | | | 693,480 | |
| | 21,906 | | | AMAG Pharmaceuticals, Inc.* | | | 427,167 | |
| | 547,779 | | | Amicus Therapeutics, Inc.* | | | 8,556,308 | |
| | 369,381 | | | Amneal Pharmaceuticals, Inc.* | | | 6,061,542 | |
| | 1,500 | | | AnaptysBio, Inc.* | | | 106,560 | |
| | 91,700 | | | Aptinyx, Inc.* | | | 2,216,389 | |
| | 166,246 | | | Arena Pharmaceuticals, Inc.* | | | 7,248,326 | |
| | 113,421 | | | Array BioPharma, Inc.* | | | 1,903,204 | |
| | 108,254 | | | Audentes Therapeutics, Inc.* | | | 4,136,385 | |
| | 119,521 | | | Blueprint Medicines Corp.* | | | 7,587,193 | |
| | 275,262 | | | Calithera Biosciences, Inc.* | | | 1,376,310 | |
| | 253,961 | | | Catalent, Inc.* | | | 10,638,426 | |
| | 168,454 | | | Coherus Biosciences, Inc.* | | | 2,358,356 | |
| | 20,887 | | | Collegium Pharmaceutical, Inc.* | | | 498,155 | |
| | 28,209 | | | Corcept Therapeutics, Inc.* | | | 443,445 | |
| | 244,473 | | | Cytokinetics, Inc.* | | | 2,029,126 | |
| | 184,805 | | | Dermira, Inc.* | | | 1,700,206 | |
| | 36,689 | | | Editas Medicine, Inc.*(1) | | | 1,314,567 | |
| | 45,222 | | | Emergent BioSolutions, Inc.* | | | 2,283,259 | |
| | 41,497 | | | Endocyte, Inc.*(1) | | | 572,659 | |
| | 12,935 | | | Esperion Therapeutics, Inc.*(1) | | | 506,923 | |
| | 206,438 | | | Five Prime Therapeutics, Inc.* | | | 3,263,785 | |
| | 132,686 | | | Flexion Therapeutics, Inc.*(1) | | | 3,429,933 | |
| | 70,118 | | | G1 Therapeutics, Inc.* | | | 3,047,328 | |
| | 10,717 | | | Global Blood Therapeutics, Inc.* | | | 484,408 | |
| | 151,859 | | | GlycoMimetics, Inc.*(1) | | | 2,449,486 | |
| | 97,945 | | | Halozyme Therapeutics, Inc.* | | | 1,652,332 | |
| | 236,265 | | | Heron Therapeutics, Inc.* | | | 9,178,895 | |
| | 116,549 | | | Horizon Pharma plc* | | | 1,930,051 | |
| | 106,953 | | | ImmunoGen, Inc.* | | | 1,040,653 | |
| | 49,571 | | | Innoviva, Inc.* | | | 684,080 | |
| | 5,816 | | | Intercept Pharmaceuticals, Inc.* | | | 488,021 | |
| | 297,431 | | | Intersect ENT, Inc.* | | | 11,138,791 | |
| | 31,437 | | | Iovance Biotherapeutics, Inc.* | | | 402,394 | |
| | 97,529 | | | Ironwood Pharmaceuticals, Inc.* | | | 1,864,754 | |
The accompanying notes are an integral part of these financial statements.
|
| Hartford Small Cap Growth HLS Fund |
Schedule of Investments – (continued)
June 30, 2018 (Unaudited)
| | | | | | | | |
| Shares or Principal Amount | | Market Value† | |
| COMMON STOCKS - 97.7% - (continued) | |
| | | | Pharmaceuticals, Biotechnology & Life Sciences - 14.5% -
(continued) | |
| | 89,780 | | | Jounce Therapeutics, Inc.*(1) | | $ | 687,715 | |
| | 104,900 | | | Karyopharm Therapeutics, Inc.* | | | 1,782,251 | |
| | 78,560 | | | Loxo Oncology, Inc.* | | | 13,628,589 | |
| | 65,703 | | | Luminex Corp. | | | 1,940,210 | |
| | 2,583 | | | Madrigal Pharmaceuticals, Inc.*(1) | | | 722,439 | |
| | 144,754 | | | Medicines Co.*(1) | | | 5,312,472 | |
| | 9,522 | | | Mirati Therapeutics, Inc.* | | | 469,435 | |
| | 59,351 | | | Momenta Pharmaceuticals, Inc.* | | | 1,213,728 | |
| | 124,984 | | | MyoKardia, Inc.* | | | 6,205,456 | |
| | 260,410 | | | NanoString Technologies, Inc.* | | | 3,562,409 | |
| | 666,280 | | | Novavax, Inc.* | | | 892,815 | |
| | 566,289 | | | PDL BioPharma, Inc.* | | | 1,325,116 | |
| | 132,180 | | | Portola Pharmaceuticals, Inc.* | | | 4,992,439 | |
| | 39,604 | | | Prothena Corp. plc* | | | 577,426 | |
| | 41,967 | | | PTC Therapeutics, Inc.* | | | 1,415,547 | |
| | 71,529 | | | REGENXBIO, Inc.*(1) | | | 5,132,206 | |
| | 98,022 | | | Revance Therapeutics, Inc.* | | | 2,690,704 | |
| | 839,133 | | | Rigel Pharmaceuticals, Inc.* | | | 2,374,746 | |
| | 68,727 | | | Sangamo Therapeutics, Inc.*(1) | | | 975,923 | |
| | 98,967 | | | Spark Therapeutics, Inc.* | | | 8,190,509 | |
| | 10,023 | | | Supernus Pharmaceuticals, Inc.* | | | 599,877 | |
| | 175,109 | | | Syneos Health, Inc.* | | | 8,212,612 | |
| | 122,364 | | | Ultragenyx Pharmaceutical, Inc.* | | | 9,406,121 | |
| | 47,177 | | | Vericel Corp.* | | | 457,617 | |
| | 20,707 | | | Zogenix, Inc.* | | | 915,249 | |
| | | | | | | | |
| | | | | | | 201,954,153 | |
| | | | | | | | |
| | | | Real Estate - 2.0% | |
| | 115,347 | | | CareTrust, Inc. REIT | | | 1,925,141 | |
| | 39,778 | | | Coresite Realty Corp. REIT | | | 4,408,198 | |
| | 150,026 | | | Corporate Office Properties Trust REIT | | | 4,349,254 | |
| | 186,080 | | | HFF, Inc. Class A, REIT | | | 6,391,848 | |
| | 29,203 | | | National Health Investors, Inc. REIT | | | 2,151,677 | |
| | 20,556 | | | Physicians Realty Trust REIT | | | 327,663 | |
| | 53,480 | | | RLJ Lodging Trust REIT | | | 1,179,234 | |
| | 440,385 | | | Sunstone Hotel Investors, Inc. REIT | | | 7,319,199 | |
| | | | | | | | |
| | | | | | | 28,052,214 | |
| | | | | | | | |
| | | | Retailing - 3.6% | |
| | 62,078 | | | American Eagle Outfitters, Inc. | | | 1,443,314 | |
| | 36,600 | | | BJ’s Wholesale Club Holdings, Inc.* | | | 865,590 | |
| | 35,253 | | | Buckle, Inc.(1) | | | 948,306 | |
| | 193,033 | | | Caleres, Inc. | | | 6,638,405 | |
| | 45,313 | | | Cato Corp. Class A | | | 1,115,606 | |
| | 280,377 | | | Core-Mark Holding Co., Inc. | | | 6,364,558 | |
| | 108,695 | | | Five Below, Inc.* | | | 10,620,588 | |
| | 211,080 | | | Floor & Decor Holdings, Inc. Class A* | | | 10,412,576 | |
| | 86,670 | | | Groupon, Inc.* | | | 372,681 | |
| | 38,674 | | | Liberty TripAdvisor Holdings, Inc. Class A* | | | 622,651 | |
| | 277,483 | | | Michaels Cos., Inc.* | | | 5,319,349 | |
| | 7,921 | | | RH*(1) | | | 1,106,564 | |
| | 29,994 | | | Shutterfly, Inc.* | | | 2,700,360 | |
| | 15,674 | | | Sleep Number Corp.* | | | 454,859 | |
| | 32,468 | | | Tailored Brands, Inc. | | | 828,583 | |
| | 27,711 | | | Zumiez, Inc.* | | | 694,161 | |
| | | | | | | | |
| | | | | | | 50,508,151 | |
| | | | | | | | |
| | | | Semiconductors & Semiconductor Equipment - 3.4% | |
| | 45,667 | | | Advanced Energy Industries, Inc.* | | | 2,652,796 | |
| | 163,642 | | | Amkor Technology, Inc.* | | | 1,405,685 | |
| | 13,590 | | | Axcelis Technologies, Inc.* | | | 269,082 | |
| | | | | | | | |
| Shares or Principal Amount | | Market Value† | |
| COMMON STOCKS - 97.7% - (continued) | |
| | | | Semiconductors & Semiconductor Equipment - 3.4% -
(continued) | |
| | 10,577 | | | Cabot Microelectronics Corp. | | $ | 1,137,662 | |
| | 244,388 | | | Cohu, Inc. | | | 5,989,950 | |
| | 163,721 | | | Diodes, Inc.* | | | 5,643,463 | |
| | 351,505 | | | Entegris, Inc. | | | 11,916,019 | |
| | 624,786 | | | FormFactor, Inc.* | | | 8,309,654 | |
| | 96,704 | | | Kulicke & Soffa Industries, Inc. | | | 2,303,489 | |
| | 62,280 | | | MKS Instruments, Inc. | | | 5,960,196 | |
| | 20,719 | | | Synaptics, Inc.* | | | 1,043,616 | |
| | | | | | | | |
| | | | | | | 46,631,612 | |
| | | | | | | | |
| | | | Software & Services - 16.2% | |
| | 100,002 | | | 2U, Inc.* | | | 8,356,167 | |
| | 247,165 | | | 8x8, Inc.* | | | 4,955,658 | |
| | 227,183 | | | Acxiom Corp.* | | | 6,804,131 | |
| | 21,499 | | | Apptio, Inc. Class A* | | | 778,264 | |
| | 67,345 | | | Blackbaud, Inc. | | | 6,899,495 | |
| | 221,623 | | | Blucora, Inc.* | | | 8,200,051 | |
| | 52,794 | | | Bottomline Technologies de, Inc.* | | | 2,630,725 | |
| | 53,300 | | | CACI International, Inc. Class A* | | | 8,983,715 | |
| | 144,613 | | | Carbonite, Inc.* | | | 5,046,994 | |
| | 367,617 | | | Cloudera, Inc.* | | | 5,014,296 | |
| | 2,682 | | | CommVault Systems, Inc.* | | | 176,610 | |
| | 10,387 | | | Cornerstone OnDemand, Inc.* | | | 492,655 | |
| | 8,925 | | | Coupa Software, Inc.* | | | 555,492 | |
| | 50,650 | | | CSG Systems International, Inc. | | | 2,070,065 | |
| | 76,621 | | | EPAM Systems, Inc.* | | | 9,526,289 | |
| | 327,663 | | | Etsy, Inc.* | | | 13,824,102 | |
| | 148,084 | | | Everbridge, Inc.* | | | 7,022,143 | |
| | 52,749 | | | Fair Isaac Corp.* | | | 10,197,437 | |
| | 233,322 | | | Five9, Inc.* | | | 8,065,942 | |
| | 165,055 | | | ForeScout Technologies, Inc.* | | | 5,654,784 | |
| | 248,693 | | | Glu Mobile, Inc.* | | | 1,594,122 | |
| | 46,076 | | | Hortonworks, Inc.* | | | 839,505 | |
| | 84,732 | | | HubSpot, Inc.* | | | 10,625,393 | |
| | 10,819 | | | Imperva, Inc.* | | | 522,017 | |
| | 156,154 | | | Instructure, Inc.* | | | 6,644,353 | |
| | 63,826 | | | LogMeIn, Inc. | | | 6,590,034 | |
| | 51,817 | | | MAXIMUS, Inc. | | | 3,218,354 | |
| | 8,195 | | | MicroStrategy, Inc. Class A* | | | 1,046,911 | |
| | 128,010 | | | MINDBODY, Inc. Class A* | | | 4,941,186 | |
| | 141,329 | | | MongoDB, Inc.*(1) | | | 7,014,158 | |
| | 14,393 | | | New Relic, Inc.* | | | 1,447,792 | |
| | 31,990 | | | NIC, Inc. | | | 497,445 | |
| | 96,738 | | | Okta, Inc.* | | | 4,872,693 | |
| | 129,256 | | | Paylocity Holding Corp.* | | | 7,608,008 | |
| | 145,884 | | | Pegasystems, Inc. | | | 7,994,443 | |
| | 166,808 | | | Pivotal Software, Inc. Class A* | | | 4,048,430 | |
| | 67,105 | | | Progress Software Corp. | | | 2,605,016 | |
| | 75,544 | | | Q2 Holdings, Inc.* | | | 4,309,785 | |
| | 38,005 | | | Qualys, Inc.* | | | 3,203,821 | |
| | 118,014 | | | Science Applications International Corp. | | | 9,550,873 | |
| | 47,239 | | | Shutterstock, Inc.* | | | 2,241,963 | |
| | 1,393 | | | Stamps.com, Inc.* | | | 352,499 | |
| | 58,266 | | | Sykes Enterprises, Inc.* | | | 1,676,895 | |
| | 33,329 | | | Syntel, Inc.* | | | 1,069,528 | |
| | 70,331 | | | Travelport Worldwide Ltd. | | | 1,303,937 | |
| | 413,032 | | | TrueCar, Inc.*(1) | | | 4,167,493 | |
| | 6,925 | | | Verint Systems, Inc.* | | | 307,124 | |
| | 34,673 | | | Yelp, Inc.* | | | 1,358,488 | |
| | 134,248 | | | Zendesk, Inc.* | | | 7,315,174 | |
| | | | | | | | |
| | | | | | | 224,222,455 | |
| | | | | | | | |
The accompanying notes are an integral part of these financial statements.
|
| Hartford Small Cap Growth HLS Fund |
Schedule of Investments – (continued)
June 30, 2018 (Unaudited)
| | | | | | | | |
| Shares or Principal Amount | | Market Value† | |
| COMMON STOCKS - 97.7% - (continued) | |
| | | | Technology Hardware & Equipment - 2.6% | |
| | 98,124 | | | ePlus, Inc.* | | $ | 9,233,468 | |
| | 183,154 | | | Fabrinet* | | | 6,756,551 | |
| | 117,121 | | | II-VI, Inc.* | | | 5,088,907 | |
| | 69,581 | | | Lumentum Holdings, Inc.* | | | 4,028,740 | |
| | 18,437 | | | Methode Electronics, Inc. | | | 743,011 | |
| | 8,863 | | | NETGEAR, Inc.* | | | 553,938 | |
| | 8,740 | | | Plantronics, Inc. | | | 666,425 | |
| | 53,377 | | | Rogers Corp.* | | | 5,949,400 | |
| | 10,874 | | | Tech Data Corp.* | | | 892,973 | |
| | 96,953 | | | Vishay Intertechnology, Inc. | | | 2,249,310 | |
| | | | | | | | |
| | | | | | | 36,162,723 | |
| | | | | | | | |
| | | | Telecommunication Services - 0.9% | |
| | 33,779 | | | Boingo Wireless, Inc.* | | | 763,068 | |
| | 338,405 | | | ORBCOMM, Inc.* | | | 3,417,890 | |
| | 600,573 | | | Vonage Holdings Corp.* | | | 7,741,386 | |
| | | | | | | | |
| | | | | | | 11,922,344 | |
| | | | | | | | |
| | | | Transportation - 1.7% | |
| | 21,017 | | | ArcBest Corp. | | | 960,477 | |
| | 33,132 | | | Avis Budget Group, Inc.* | | | 1,076,790 | |
| | 98,918 | | | Genesee & Wyoming, Inc. Class A* | | | 8,044,012 | |
| | 24,362 | | | Hawaiian Holdings, Inc. | | | 875,814 | |
| | 122,415 | | | Knight-Swift Transportation Holdings, Inc. | | | 4,677,477 | |
| | 260,634 | | | Marten Transport Ltd. | | | 6,111,867 | |
| | 11,829 | | | Saia, Inc.* | | | 956,375 | |
| | 30,844 | | | Werner Enterprises, Inc. | | | 1,158,192 | |
| | | | | | | | |
| | | | | | | 23,861,004 | |
| | | | | | | | |
| | |
| | | | Total Common Stocks
(cost $1,093,228,933) | | $ | 1,356,805,891 | |
| | | | | | | | |
|
| EXCHANGE-TRADED FUNDS - 2.1% | |
| | | | Other Investment Pools & Funds - 2.1% | | | |
| | 141,731 | | | iShares Russell 2000 Growth ETF(1) | | $ | 28,959,895 | |
| | | | | | | | |
| | |
| | | | Total Exchange-Traded Funds
(cost $28,759,354) | | $ | 28,959,895 | |
| | | | | | | | |
|
| WARRANTS - 0.0% | |
| | | | Diversified Financials - 0.0% | | | |
| | 891 | | | Emergent Capital, Inc. Expires 4/11/19*(2)(3) | | $ | — | |
| | | | | | | | |
| | |
| | | | Total Warrants
(cost $—) | | $ | — | |
| | | | | | | | |
| | |
| | | | Total Long-Term Investments
(cost $1,121,988,287) | | $ | 1,385,765,786 | |
| | | | | | | | |
|
| SHORT-TERM INVESTMENTS - 3.9% | |
| | | | Other Investment Pools & Funds - 0.2% | |
| | 3,020,955 | | | Morgan Stanley Institutional Liquidity Funds, Government Portfolio, Institutional Class, 1.84%(4) | | $ | 3,020,955 | |
| | | | | | | | |
| | | | Securities Lending Collateral - 3.7% | |
| | 2,557,821 | | | Citibank NA DDCA,
1.91%, 7/2/2018(4) | | | 2,557,821 | |
| | | | | | | | |
| Shares or Principal Amount | | Market Value† | |
| SHORT-TERM INVESTMENTS - 3.9% - (continued) | |
| | | | Securities Lending Collateral - 3.7% - (continued) | |
| | 17,277,907 | | | Goldman Sachs Financial Square Funds, Government Institutional Fund,
1.81%(4) | | $ | 17,277,907 | |
| | 16,054,699 | | | Invesco Government & Agency Portfolio,
1.81%(4) | | | 16,054,699 | |
| | 4,736,565 | | | Morgan Stanley Institutional Liquidity Funds, Government Portfolio, Institutional Class,
1.84%(4) | | | 4,736,565 | |
| | 10,529,434 | | | Western Asset Institutional Government Class A Fund,
1.79%(4) | | | 10,529,434 | |
| | | | | | | | |
| | | | | | | 51,156,426 | |
| | | | | | | | |
| | |
| | | | Total Short-Term Investments
(cost $54,177,381) | | $ | 54,177,381 | |
| | | | | | | | |
| | | | | | | | | | | | |
| | | |
| | | | Total Investments
(cost $1,176,165,668) | | | 103.7 | % | | $ | 1,439,943,167 | |
| | | | Other Assets and Liabilities | | | (3.7 | )% | | | (51,025,816 | ) |
| | | | | | | | | | | | |
| | | | Total Net Assets | | | 100.0 | % | | $ | 1,388,917,351 | |
| | | | | | | | | | | | |
The accompanying notes are an integral part of these financial statements.
|
| Hartford Small Cap Growth HLS Fund |
Schedule of Investments – (continued)
June 30, 2018 (Unaudited)
| Note: | Percentage of investments as shown is the ratio of the total market value to total net assets. |
| | Other than the industry classifications “Other Investment Pools & Funds,” equity industry classifications used in this report are the Global Industry Classification Standard, which was developed by and is the exclusive property and service mark of MSCI, Inc. and Standard & Poor’s. |
| | For Fund compliance purposes, the Fund may not use the same classification system shown in this report as these classifications are used for financial reporting purposes. |
| (1) | Represents entire or partial securities on loan. See Note 8 in the accompanying Notes to Financial Statements for securities lending information. |
| (2) | This security has been identified as illiquid. Illiquid securities are often purchased in private placement transactions, are often not registered under the Securities Act of 1933, as amended, and may have contractual restrictions on resale. A security may also be considered illiquid if the security lacks a readily available market or if its valuation has not changed for a certain period of time. The identification of illiquid securities is unaudited. At June 30, 2018, the aggregate value of this security was $0, which represented 0.0% of total net assets. |
| (3) | This security is valued in good faith at fair value as determined under policies and procedures established by and under the supervision of the Board of Directors. At June 30, 2018, the aggregate fair value of this security was $0, which represented 0.0% of total net assets. This amount excludes securities that are principally traded in certain foreign markets and whose prices are adjusted pursuant to a third party pricing service methodology approved by the Board of Directors. |
| (4) | Current yield as of period end. |
| † | See Significant Accounting Policies of accompanying Notes to Financial Statements regarding valuation of investments. |
| | |
| GLOSSARY: (abbreviations used in preceding Schedule of Investments) |
|
| Other Abbreviations: |
DDCA | | Dollars on Deposit in Custody Account |
ETF | | Exchange-Traded Fund |
REIT | | Real Estate Investment Trust |
The accompanying notes are an integral part of these financial statements.
|
| Hartford Small Cap Growth HLS Fund |
Schedule of Investments – (continued)
June 30, 2018 (Unaudited)
Fair Valuation Summary
The following is a summary of the fair valuations according to the inputs used as of June 30, 2018 in valuing the Fund’s investments.
| | | | | | | | | | | | | | | | |
| | | Total | | | Level 1(1) | | | Level 2(1) | | | Level 3(1) | |
Assets | | | | | | | | | | | | | | | | |
Common Stocks | | | | | | | | | | | | | | | | |
Automobiles & Components | | $ | 22,567,995 | | | $ | 22,567,995 | | | $ | — | | | $ | — | |
Banks | | | 50,301,598 | | | | 50,301,598 | | | | — | | | | — | |
Capital Goods | | | 141,839,050 | | | | 141,839,050 | | | | — | | | | — | |
Commercial & Professional Services | | | 68,876,959 | | | | 68,876,959 | | | | — | | | | — | |
Consumer Durables & Apparel | | | 76,051,103 | | | | 76,051,103 | | | | — | | | | — | |
Consumer Services | | | 51,821,378 | | | | 51,821,378 | | | | — | | | | — | |
Diversified Financials | | | 27,512,303 | | | | 27,512,303 | | | | — | | | | — | |
Energy | | | 32,284,926 | | | | 32,284,926 | | | | — | | | | — | |
Food & Staples Retailing | | | 25,227,948 | | | | 25,227,948 | | | | — | | | | — | |
Food, Beverage & Tobacco | | | 16,477,168 | | | | 16,477,168 | | | | — | | | | — | |
Health Care Equipment & Services | | | 149,759,066 | | | | 149,759,066 | | | | — | | | | — | |
Household & Personal Products | | | 5,763,575 | | | | 5,763,575 | | | | — | | | | — | |
Insurance | | | 10,179,617 | | | | 10,179,617 | | | | — | | | | — | |
Materials | | | 50,725,096 | | | | 50,725,096 | | | | — | | | | — | |
Media | | | 4,103,453 | | | | 4,103,453 | | | | — | | | | — | |
Pharmaceuticals, Biotechnology & Life Sciences | | | 201,954,153 | | | | 201,954,153 | | | | — | | | | — | |
Real Estate | | | 28,052,214 | | | | 28,052,214 | | | | — | | | | — | |
Retailing | | | 50,508,151 | | | | 50,508,151 | | | | — | | | | — | |
Semiconductors & Semiconductor Equipment | | | 46,631,612 | | | | 46,631,612 | | | | — | | | | — | |
Software & Services | | | 224,222,455 | | | | 224,222,455 | | | | — | | | | — | |
Technology Hardware & Equipment | | | 36,162,723 | | | | 36,162,723 | | | | — | | | | — | |
Telecommunication Services | | | 11,922,344 | | | | 11,922,344 | | | | — | | | | — | |
Transportation | | | 23,861,004 | | | | 23,861,004 | | | | — | | | | — | |
Exchange-Traded Funds | | | 28,959,895 | | | | 28,959,895 | | | | — | | | | — | |
Warrants | | | — | | | | — | | | | — | | | | — | |
Short-Term Investments | | | 54,177,381 | | | | 54,177,381 | | | | — | | | | — | |
| | | | | | | | | | | | | | | | |
Total | | $ | 1,439,943,167 | | | $ | 1,439,943,167 | | | $ | — | | | $ | — | |
| | | | | | | | | | | | | | | | |
| (1) | For the six-month period ended June 30, 2018, there were no transfers between any levels. |
The accompanying notes are an integral part of these financial statements.
|
| Hartford Small Company HLS Fund |
Schedule of Investments
June 30, 2018 (Unaudited)
| | | | | | | | |
| Shares or Principal Amount | | Market Value† | |
| COMMON STOCKS - 94.5% | |
| | | | Automobiles & Components - 0.1% | |
| | 4,621 | | | Cooper Tire & Rubber Co.(1) | | $ | 121,532 | |
| | 5,199 | | | Tenneco, Inc. | | | 228,548 | |
| | 1,532 | | | Visteon Corp.* | | | 197,996 | |
| | | | | | | | |
| | | | | | | 548,076 | |
| | | | | | | | |
| | | | Banks - 5.7% | |
| | 186,024 | | | BancorpSouth Bank | | | 6,129,491 | |
| | 189,598 | | | CenterState Bank Corp. | | | 5,653,812 | |
| | 1,791 | | | FCB Financial Holdings, Inc. Class A* | | | 105,311 | |
| | 3,699 | | | First Busey Corp. | | | 117,332 | |
| | 4,569 | | | First Hawaiian, Inc. | | | 132,592 | |
| | 3,571 | | | Great Western Bancorp, Inc. | | | 149,946 | |
| | 2,507 | | | IBERIABANK Corp. | | | 190,031 | |
| | 504,038 | | | MGIC Investment Corp.* | | | 5,403,287 | |
| | 291,531 | | | Sterling Bancorp | | | 6,850,979 | |
| | 66,650 | | | Texas Capital Bancshares, Inc.* | | | 6,098,475 | |
| | 3,111 | | | Triumph Bancorp, Inc.* | | | 126,773 | |
| | 148,726 | | | Union Bankshares Corp. | | | 5,782,467 | |
| | | | | | | | |
| | | | | | | 36,740,496 | |
| | | | | | | | |
| | | | Capital Goods - 11.7% | |
| | 320,531 | | | Actuant Corp. Class A | | | 9,407,585 | |
| | 5,317 | | | Aerojet Rocketdyne Holdings, Inc.* | | | 156,798 | |
| | 123,753 | | | Altra Industrial Motion Corp. | | | 5,333,754 | |
| | 1,888 | | | American Woodmark Corp.* | | | 172,846 | |
| | 2,844 | | | Applied Industrial Technologies, Inc. | | | 199,507 | |
| | 3,343 | | | Armstrong World Industries, Inc.* | | | 211,278 | |
| | 2,143 | | | Astec Industries, Inc. | | | 128,151 | |
| | 77,156 | | | Axon Enterprise, Inc.* | | | 4,874,716 | |
| | 3,345 | | | AZZ, Inc. | | | 145,340 | |
| | 148,417 | | | Beacon Roofing Supply, Inc.* | | | 6,325,533 | |
| | 5,829 | | | BMC Stock Holdings, Inc.* | | | 121,535 | |
| | 116,810 | | | EnerSys | | | 8,718,698 | |
| | 4,800 | | | Evoqua Water Technologies Corp.* | | | 98,400 | |
| | 4,661 | | | Generac Holdings, Inc.* | | | 241,113 | |
| | 201,436 | | | ITT, Inc. | | | 10,529,060 | |
| | 7,047 | | | JELD-WEN Holding, Inc.* | | | 201,474 | |
| | 3,121 | | | John Bean Technologies Corp. | | | 277,457 | |
| | 2,400 | | | Mercury Systems, Inc.* | | | 91,344 | |
| | 9,004 | | | Milacron Holdings Corp.* | | | 170,446 | |
| | 562,559 | | | Rexnord Corp.* | | | 16,347,964 | |
| | 36,412 | | | SiteOne Landscape Supply, Inc.* | | | 3,057,516 | |
| | 194,904 | | | SPX FLOW, Inc.* | | | 8,530,948 | |
| | 4,923 | | | Welbilt, Inc.* | | | 109,832 | |
| | | | | | | | |
| | | | | | | 75,451,295 | |
| | | | | | | | |
| | | | Commercial & Professional Services - 3.7% | |
| | 5,245 | | | Advanced Disposal Services, Inc.* | | | 129,971 | |
| | 4,024 | | | ASGN, Inc.* | | | 314,637 | |
| | 121,363 | | | Brink’s Co. | | | 9,678,699 | |
| | 3,422 | | | Clean Harbors, Inc.* | | | 190,092 | |
| | 17,617 | | | CoStar Group, Inc.* | | | 7,269,303 | |
| | 1,037 | | | Deluxe Corp. | | | 68,660 | |
| | 5,627 | | | Exponent, Inc. | | | 271,784 | |
| | 2,535 | | | Huron Consulting Group, Inc.* | | | 103,681 | |
| | 2,299 | | | MSA Safety, Inc. | | | 221,486 | |
| | 94,551 | | | TriNet Group, Inc.* | | | 5,289,183 | |
| | 1,928 | | | WageWorks, Inc.* | | | 96,400 | |
| | | | | | | | |
| | | | | | | 23,633,896 | |
| | | | | | | | |
| | | | Consumer Durables & Apparel - 3.8% | |
| | 2,560 | | | Carter’s, Inc. | | | 277,478 | |
| | | | | | | | |
| Shares or Principal Amount | | Market Value† | |
| COMMON STOCKS - 94.5% - (continued) | |
| | | | Consumer Durables & Apparel - 3.8% - (continued) | |
| | 4,030 | | | Installed Building Products, Inc.* | | $ | 227,897 | |
| | 2,705 | | | Oxford Industries, Inc. | | | 224,461 | |
| | 189,025 | | | Skechers USA, Inc. Class A* | | | 5,672,640 | |
| | 7,105 | | | Steven Madden Ltd. | | | 377,276 | |
| | 71,627 | | | TopBuild Corp.* | | | 5,611,259 | |
| | 279,286 | | | TRI Pointe Group, Inc.* | | | 4,569,119 | |
| | 334,100 | | | Under Armour, Inc. Class C*(1) | | | 7,042,828 | |
| | 19,230 | | | Under Armour, Inc. Class A* | | | 432,290 | |
| | 9,494 | | | Wolverine World Wide, Inc. | | | 330,106 | |
| | | | | | | | |
| | | | | | | 24,765,354 | |
| | | | | | | | |
| | | | Consumer Services - 7.4% | |
| | 292,438 | | | Boyd Gaming Corp. | | | 10,135,901 | |
| | 909,759 | | | DraftKings, Inc.*(2)(3)(4)(5) | | | 1,774,030 | |
| | 3,648 | | | Dunkin’ Brands Group, Inc.(1) | | | 251,967 | |
| | 91,030 | | | Marriott Vacations Worldwide Corp. | | | 10,282,749 | |
| | 3,269 | | | Papa John’s International, Inc. | | | 165,804 | |
| | 392,275 | | | Planet Fitness, Inc. Class A* | | | 17,236,564 | |
| | 147,768 | | | Wingstop, Inc. | | | 7,701,668 | |
| | | | | | | | |
| | | | | | | 47,548,683 | |
| | | | | | | | |
| | | | Diversified Financials - 1.1% | |
| | 2,735 | | | Evercore, Inc. Class A | | | 288,406 | |
| | 88,668 | | | Green Dot Corp. Class A* | | | 6,507,345 | |
| | 3,319 | | | OneMain Holdings, Inc.* | | | 110,489 | |
| | 11,538 | | | SLM Corp.* | | | 132,110 | |
| | | | | | | | |
| | | | | | | 7,038,350 | |
| | | | | | | | |
| | | | Energy - 1.3% | |
| | 442,997 | | | Centennial Resource Development, Inc. Class A* | | | 8,000,526 | |
| | 5,956 | | | Newfield Exploration Co.* | | | 180,169 | |
| | 3,038 | | | PDC Energy, Inc.* | | | 183,647 | |
| | 7,609 | | | ProPetro Holding Corp.* | | | 119,309 | |
| | 7,630 | | | WildHorse Resource Development Corp.* | | | 193,497 | |
| | | | | | | | |
| | | | | | | 8,677,148 | |
| | | | | | | | |
| | | | Food & Staples Retailing - 2.0% | |
| | 1,596 | | | Casey’s General Stores, Inc. | | | 167,708 | |
| | 331,699 | | | Performance Food Group Co.* | | | 12,173,353 | |
| | 2,530 | | | PriceSmart, Inc. | | | 228,965 | |
| | | | | | | | |
| | | | | | | 12,570,026 | |
| | | | | | | | |
| | | | Food, Beverage & Tobacco - 0.1% | |
| | 12,959 | | | Hostess Brands, Inc.* | | | 176,242 | |
| | 1,780 | | | Post Holdings, Inc.* | | | 153,116 | |
| | | | | | | | |
| | | | | | | 329,358 | |
| | | | | | | | |
| | | | Health Care Equipment & Services - 7.5% | |
| | 52,900 | | | Amedisys, Inc.* | | | 4,520,834 | |
| | 6,165 | | | AtriCure, Inc.* | | | 166,763 | |
| | 5,491 | | | Cardiovascular Systems, Inc.* | | | 177,579 | |
| | 37,694 | | | DexCom, Inc.* | | | 3,580,176 | |
| | 138,956 | | | Globus Medical, Inc. Class A* | | | 7,011,720 | |
| | 71,691 | | | Hill-Rom Holdings, Inc. | | | 6,261,492 | |
| | 8,730 | | | HMS Holdings Corp.* | | | 188,743 | |
| | 1,194 | | | ICU Medical, Inc.* | | | 350,618 | |
| | 199,144 | | | Insulet Corp.* | | | 17,066,641 | |
| | 3,997 | | | Integra LifeSciences Holdings Corp.* | | | 257,447 | |
| | 2,402 | | | Medidata Solutions, Inc.* | | | 193,505 | |
| | 4,649 | | | Merit Medical Systems, Inc.* | | | 238,029 | |
| | 2,159 | | | Molina Healthcare, Inc.* | | | 211,452 | |
| | 4,671 | | | Natus Medical, Inc.* | | | 161,149 | |
| | 142,034 | | | Omnicell, Inc.* | | | 7,449,683 | |
The accompanying notes are an integral part of these financial statements.
|
| Hartford Small Company HLS Fund |
Schedule of Investments – (continued)
June 30, 2018 (Unaudited)
| | | | | | | | |
| Shares or Principal Amount | | Market Value† | |
| COMMON STOCKS - 94.5% - (continued) | |
| | | | Health Care Equipment & Services - 7.5% - (continued) | |
| | 8,664 | | | OraSure Technologies, Inc.* | | $ | 142,696 | |
| | 2,823 | | | Orthofix International N.V.* | | | 160,403 | |
| | 1,200 | | | Providence Service Corp.* | | | 94,260 | |
| | 1,727 | | | U.S. Physical Therapy, Inc. | | | 165,792 | |
| | | | | | | | |
| | | | | | | 48,398,982 | |
| | | | | | | | |
| | | | Insurance - 0.0% | |
| | 5,150 | | | James River Group Holdings Ltd. | | | 202,343 | |
| | | | | | | | |
| | | | Materials - 6.7% | |
| | 4,615 | | | Boise Cascade Co. | | | 206,291 | |
| | 133,461 | | | Cabot Corp. | | | 8,243,886 | |
| | 184,848 | | | Carpenter Technology Corp. | | | 9,717,459 | |
| | 516,055 | | | Ferro Corp.* | | | 10,759,747 | |
| | 13,195 | | | Graphic Packaging Holding Co. | | | 191,460 | |
| | 73,040 | | | Ingevity Corp.* | | | 5,906,015 | |
| | 6,979 | | | Louisiana-Pacific Corp. | | | 189,968 | |
| | 10,656 | | | OMNOVA Solutions, Inc.* | | | 110,822 | |
| | 6,679 | | | PolyOne Corp. | | | 288,666 | |
| | 288,172 | | | Summit Materials, Inc. Class A* | | | 7,564,515 | |
| | | | | | | | |
| | | | | | | 43,178,829 | |
| | | | | | | | |
| | | | Pharmaceuticals, Biotechnology & Life Sciences - 14.0% | |
| | 4,968 | | | Abeona Therapeutics, Inc.*(1) | | | 79,488 | |
| | 117,935 | | | Aerie Pharmaceuticals, Inc.*(1) | | | 7,966,509 | |
| | 1,192 | | | Agios Pharmaceuticals, Inc.* | | | 100,402 | |
| | 163,772 | | | Amicus Therapeutics, Inc.* | | | 2,558,119 | |
| | 9,673 | | | Amneal Pharmaceuticals, Inc.* | | | 158,734 | |
| | 2,400 | | | Aptinyx, Inc.* | | | 58,008 | |
| | 64,498 | | | Arena Pharmaceuticals, Inc.* | | | 2,812,113 | |
| | 11,480 | | | Audentes Therapeutics, Inc.* | | | 438,651 | |
| | 63,031 | | | Blueprint Medicines Corp.* | | | 4,001,208 | |
| | 4,537 | | | Calithera Biosciences, Inc.* | | | 22,685 | |
| | 6,467 | | | Catalent, Inc.* | | | 270,903 | |
| | 3,881 | | | Coherus Biosciences, Inc.* | | | 54,334 | |
| | 65,000 | | | CRISPR Therapeutics AG*(1) | | | 3,819,400 | |
| | 5,990 | | | Cytokinetics, Inc.* | | | 49,717 | |
| | 4,590 | | | Dermira, Inc.* | | | 42,228 | |
| | 120,410 | | | Exact Sciences Corp.* | | | 7,199,314 | |
| | 5,233 | | | Five Prime Therapeutics, Inc.* | | | 82,734 | |
| | 3,476 | | | Flexion Therapeutics, Inc.*(1) | | | 89,855 | |
| | 42,748 | | | G1 Therapeutics, Inc.*(1) | | | 1,857,828 | |
| | 43,396 | | | Galapagos N.V. ADR* | | | 4,000,243 | |
| | 33,502 | | | Global Blood Therapeutics, Inc.* | | | 1,514,290 | |
| | 4,162 | | | GlycoMimetics, Inc.* | | | 67,133 | |
| | 109,144 | | | Heron Therapeutics, Inc.* | | | 4,240,244 | |
| | 7,473 | | | Intersect ENT, Inc.* | | | 279,864 | |
| | 275,288 | | | Ironwood Pharmaceuticals, Inc.* | | | 5,263,507 | |
| | 2,488 | | | Jounce Therapeutics, Inc.*(1) | | | 19,058 | |
| | 175,597 | | | Karyopharm Therapeutics, Inc.* | | | 2,983,393 | |
| | 32,106 | | | Loxo Oncology, Inc.* | | | 5,569,749 | |
| | 3,861 | | | Medicines Co.* | | | 141,699 | |
| | 62,816 | | | MyoKardia, Inc.* | | | 3,118,814 | |
| | 6,136 | | | NanoString Technologies, Inc.* | | | 83,940 | |
| | 54,995 | | | Neurocrine Biosciences, Inc.* | | | 5,402,709 | |
| | 72,049 | | | Portola Pharmaceuticals, Inc.* | | | 2,721,291 | |
| | 80,422 | | | PRA Health Sciences, Inc.* | | | 7,508,198 | |
| | 1,873 | | | REGENXBIO, Inc.*(1) | | | 134,388 | |
| | 2,508 | | | Revance Therapeutics, Inc.* | | | 68,845 | |
| | 71,600 | | | Rhythm Pharmaceuticals, Inc.* | | | 2,238,216 | |
| | 21,215 | | | Rigel Pharmaceuticals, Inc.* | | | 60,038 | |
| | 24,127 | | | Sage Therapeutics, Inc.* | | | 3,776,599 | |
| | | | | | | | |
| Shares or Principal Amount | | Market Value† | |
| COMMON STOCKS - 94.5% - (continued) | |
| | | | Pharmaceuticals, Biotechnology & Life Sciences - 14.0% -
(continued) | |
| | 49,503 | | | Spark Therapeutics, Inc.* | | $ | 4,096,868 | |
| | 98,195 | | | Syneos Health, Inc.* | | | 4,605,345 | |
| | 3,204 | | | Ultragenyx Pharmaceutical, Inc.* | | | 246,291 | |
| | | | | | | | |
| | | | | | | 89,802,952 | |
| | | | | | | | |
| | | | Real Estate - 0.7% | |
| | 1,049 | | | Coresite Realty Corp. REIT | | | 116,250 | |
| | 3,732 | | | Corporate Office Properties Trust REIT | | | 108,191 | |
| | 4,781 | | | HFF, Inc. Class A, REIT | | | 164,227 | |
| | 11,533 | | | Sunstone Hotel Investors, Inc. REIT | | | 191,679 | |
| | 163,762 | | | Xenia Hotels & Resorts, Inc. REIT | | | 3,989,242 | |
| | | | | | | | |
| | | | | | | 4,569,589 | |
| | | | | | | | |
| | | | Retailing - 5.7% | |
| | 5,016,400 | | | Allstar Co.*(2)(3)(4)(5) | | | 2,307,544 | |
| | 1,000 | | | BJ’s Wholesale Club Holdings, Inc.* | | | 23,650 | |
| | 5,045 | | | Caleres, Inc. | | | 173,498 | |
| | 7,239 | | | Core-Mark Holding Co., Inc. | | | 164,325 | |
| | 33,281 | | | Five Below, Inc.* | | | 3,251,887 | |
| | 235,657 | | | Floor & Decor Holdings, Inc. Class A* | | | 11,624,960 | |
| | 6,441 | | | Michaels Cos., Inc.* | | | 123,474 | |
| | 91,139 | | | Shutterfly, Inc.* | | | 8,205,244 | |
| | 43,094 | | | Tory Burch LLC*(2)(3)(4)(5) | | | 2,339,144 | |
| | 71,903 | | | Wayfair, Inc. Class A*(1) | | | 8,539,200 | |
| | | | | | | | |
| | | | | | | 36,752,926 | |
| | | | | | | | |
| | | | Semiconductors & Semiconductor Equipment - 0.7% | |
| | 917 | | | Advanced Energy Industries, Inc.* | | | 53,269 | |
| | 1,569 | | | Axcelis Technologies, Inc.* | | | 31,066 | |
| | 5,980 | | | Cohu, Inc. | | | 146,570 | |
| | 4,295 | | | Diodes, Inc.* | | | 148,049 | |
| | 91,998 | | | Entegris, Inc. | | | 3,118,732 | |
| | 16,218 | | | FormFactor, Inc.* | | | 215,699 | |
| | 1,611 | | | MKS Instruments, Inc. | | | 154,173 | |
| | 19,149 | | | Tower Semiconductor Ltd.* | | | 421,469 | |
| | | | | | | | |
| | | | | | | 4,289,027 | |
| | | | | | | | |
| | | | Software & Services - 17.7% | |
| | 80,046 | | | 2U, Inc.* | | | 6,688,644 | |
| | 6,474 | | | 8x8, Inc.* | | | 129,804 | |
| | 5,910 | | | Acxiom Corp.* | | | 177,004 | |
| | 1,753 | | | Blackbaud, Inc. | | | 179,595 | |
| | 4,817 | | | Blucora, Inc.* | | | 178,229 | |
| | 1,371 | | | CACI International, Inc. Class A* | | | 231,082 | |
| | 3,793 | | | Carbonite, Inc.* | | | 132,376 | |
| | 26,343 | | | Cloudera, Inc.* | | | 359,319 | |
| | 45,143 | | | EPAM Systems, Inc.* | | | 5,612,629 | |
| | 6,625 | | | Etsy, Inc.* | | | 279,509 | |
| | 132,267 | | | Everbridge, Inc.* | | | 6,272,101 | |
| | 50,737 | | | Fair Isaac Corp.* | | | 9,808,477 | |
| | 199,071 | | | Five9, Inc.* | | | 6,881,884 | |
| | 154,918 | | | ForeScout Technologies, Inc.* | | | 5,307,491 | |
| | 126,900 | | | Globant S.A.* | | | 7,206,651 | |
| | 65,081 | | | Guidewire Software, Inc.* | | | 5,777,891 | |
| | 64,187 | | | HubSpot, Inc.* | | | 8,049,050 | |
| | 3,996 | | | Instructure, Inc.* | | | 170,030 | |
| | 1,627 | | | LogMeIn, Inc. | | | 167,988 | |
| | 313,959 | | | Mimecast Ltd.* | | | 12,938,250 | |
| | 3,361 | | | MINDBODY, Inc. Class A* | | | 129,735 | |
| | 3,856 | | | MongoDB, Inc.* | | | 191,373 | |
| | 63,652 | | | Okta, Inc.* | | | 3,206,151 | |
The accompanying notes are an integral part of these financial statements.
|
| Hartford Small Company HLS Fund |
Schedule of Investments – (continued)
June 30, 2018 (Unaudited)
| | | | | | | | |
| Shares or Principal Amount | | Market Value† | |
| COMMON STOCKS - 94.5% - (continued) | |
| | | | Software & Services - 17.7% - (continued) | |
| | 3,378 | | | Paylocity Holding Corp.* | | $ | 198,829 | |
| | 3,819 | | | Pegasystems, Inc. | | | 209,281 | |
| | 4,321 | | | Pivotal Software, Inc. Class A* | | | 104,871 | |
| | 25,515 | | | Proofpoint, Inc.* | | | 2,942,135 | |
| | 2,002 | | | Q2 Holdings, Inc.* | | | 114,214 | |
| | 2,917 | | | Science Applications International Corp. | | | 236,073 | |
| | 230,991 | | | SendGrid, Inc.* | | | 6,125,881 | |
| | 127,730 | | | Trade Desk, Inc. Class A* | | | 11,981,074 | |
| | 10,804 | | | TrueCar, Inc.*(1) | | | 109,012 | |
| | 81,446 | | | Wix.com Ltd.* | | | 8,169,034 | |
| | 65,148 | | | Zendesk, Inc.* | | | 3,549,914 | |
| | | | | | | | |
| | | | | | | 113,815,581 | |
| | | | | | | | |
| | | | Technology Hardware & Equipment - 2.0% | |
| | 2,258 | | | ePlus, Inc.* | | | 212,478 | |
| | 4,726 | | | Fabrinet* | | | 174,342 | |
| | 181,889 | | | II-VI, Inc.* | | | 7,903,076 | |
| | 1,825 | | | Lumentum Holdings, Inc.* | | | 105,667 | |
| | 1,382 | | | Rogers Corp.* | | | 154,038 | |
| | 31,591 | | | Zebra Technologies Corp. Class A* | | | 4,525,411 | |
| | | | | | | | |
| | | | | | | 13,075,012 | |
| | | | | | | | |
| | | | Telecommunication Services - 0.7% | |
| | 160,066 | | | Boingo Wireless, Inc.* | | | 3,615,891 | |
| | 8,378 | | | ORBCOMM, Inc.* | | | 84,618 | |
| | 87,926 | | | Vonage Holdings Corp.* | | | 1,133,366 | |
| | | | | | | | |
| | | | | | | 4,833,875 | |
| | | | | | | | |
| | | | Transportation - 1.9% | |
| | 2,316 | | | Genesee & Wyoming, Inc. Class A* | | | 188,337 | |
| | 284,871 | | | JetBlue Airways Corp.* | | | 5,406,852 | |
| | 3,102 | | | Knight-Swift Transportation Holdings, Inc. | | | 118,527 | |
| | 6,850 | | | Marten Transport Ltd. | | | 160,633 | |
| | 225,024 | | | Schneider National, Inc. Class B | | | 6,190,410 | |
| | | | | | | | |
| | | | | | | 12,064,759 | |
| | | | | | | | |
| | |
| | | | Total Common Stocks
(cost $499,165,061) | | $ | 608,286,557 | |
| | | | | | | | |
|
| EXCHANGE-TRADED FUNDS - 0.2% | |
| | | | Other Investment Pools & Funds - 0.2% | |
| | 4,644 | | | iShares Russell 2000 Growth ETF(1) | | $ | 948,909 | |
| | | | | | | | |
| | |
| | | | Total Exchange-Traded Funds
(cost $867,119) | | $ | 948,909 | |
| | | | | | | | |
|
| PREFERRED STOCKS - 3.1% | |
| | | | Pharmaceuticals, Biotechnology & Life Sciences - 0.0% | |
| | 92,420 | | | Sancilio & Co., Inc.*(2)(3)(4)(5) | | $ | — | |
| | | | | | | | |
| | | | Retailing - 0.4% | |
| | 74,004 | | | Honest Co.*(2)(3)(4)(5) | | | 2,617,521 | |
| | | | | | | | |
| | | | Software & Services - 2.7% | |
| | 410,300 | | | MarkLogic Corp. Series F*(2)(3)(4)(5) | | | 4,103,000 | |
| | 513,066 | | | Zuora, Inc. Series F*(3)(4)(5)(6) | | | 13,156,837 | |
| | | | | | | | |
| | | | | | | 17,259,837 | |
| | | | | | | | |
| | |
| | | | Total Preferred Stocks
(cost $12,340,141) | | $ | 19,877,358 | |
| | | | | | | | |
| | | | | | | | |
| Shares or Principal Amount | | Market Value† | |
| ESCROWS - 0.1% | |
| | | | Software & Services - 0.1% | |
| | 157,023 | | | Veracode, Inc. Escrow*(2)(3)(4)(5) | | $ | 631,232 | |
| | | | | | | | |
| | | | Telecommunication Services - 0.0% | |
| | 41,522 | | | Docusign Earnout, Escrow*(2)(3)(4)(5) | | | 93,425 | |
| | | | | | | | |
| | |
| | | | Total Escrows
(cost $—) | | $ | 724,657 | |
| | | | | | | | |
| | |
| | | | Total Long-Term Investments
(cost $512,372,321) | | $ | 629,837,481 | |
| | | | | | | | |
|
| SHORT-TERM INVESTMENTS - 3.5% | |
| | | | Other Investment Pools & Funds - 1.8% | |
| | 11,494,642 | | | BlackRock Liquidity Funds TempFund Portfolio, Institutional Class,
1.84%(7) | | $ | 11,494,642 | |
| | | | | | | | |
| | | | Securities Lending Collateral - 1.7% | |
| | 564,128 | | | Citibank NA DDCA,
1.91%, 7/2/2018(7) | | | 564,128 | |
| | 3,810,647 | | | Goldman Sachs Financial Square Funds, Government Institutional Fund,
1.81%(7) | | | 3,810,647 | |
| | 3,540,868 | | | Invesco Government & Agency Portfolio,
1.81%(7) | | | 3,540,868 | |
| | 1,044,651 | | | Morgan Stanley Institutional Liquidity Funds, Government Portfolio, Institutional Class, 1.84%(7) | | | 1,044,651 | |
| | 2,322,270 | | | Western Asset Institutional Government Class A Fund,
1.79%(7) | | | 2,322,270 | |
| | | | | | | | |
| | | | | | | 11,282,564 | |
| | | | | | | | |
| | |
| | | | Total Short-Term Investments
(cost $22,777,206) | | $ | 22,777,206 | |
| | | | | | | | |
| | | | | | | | | | | | |
| | | |
| | | | Total Investments
(cost $535,149,527) | | | 101.4 | % | | $ | 652,614,687 | |
| | | | Other Assets and Liabilities | | | (1.4 | )% | | | (9,191,041 | ) |
| | | | | | | | | | | | |
| | | | Total Net Assets | | | 100.0 | % | | $ | 643,423,646 | |
| | | | | | | | | | | | |
The accompanying notes are an integral part of these financial statements.
|
| Hartford Small Company HLS Fund |
Schedule of Investments – (continued)
June 30, 2018 (Unaudited)
| Note: | Percentage of investments as shown is the ratio of the total market value to total net assets. |
| | Prices of foreign equities that are principally traded on certain foreign markets will generally be adjusted daily pursuant to a fair value pricing service approved by the Board of Directors in order to reflect an adjustment for factors occurring after the close of certain foreign markets but before the close of the New York Stock Exchange. |
| | Equity industry classifications used in this report are the Global Industry Classification Standard, which was developed by and is the exclusive property and service mark of MSCI, Inc. and Standard & Poor’s. |
| | For Fund compliance purposes, the Fund may not use the same classification system shown in this report as these classifications are used for financial reporting purposes. |
| (1) | Represents entire or partial securities on loan. See Note 8 in the accompanying Notes to Financial Statements for securities lending information. |
| (2) | Investment valued using significant unobservable inputs. |
| (3) | Securities issued within terms of a private placement memorandum and exempt from registration under Rule 144A under the Securities Act of 1933, as amended, and may be sold to qualified institutional buyers. Unless otherwise indicated, these holdings are determined to be liquid. At June 30, 2018, the aggregate value of these securities was $27,022,733, which represented 4.2% of total net assets. |
| (4) | These securities are valued in good faith at fair value as determined under policies and procedures established by and under the supervision of the Board of Directors. At June 30, 2018, the aggregate fair value of these securities was $27,022,733, which represented 4.2% of total net assets. This amount excludes securities that are principally traded in certain foreign markets and whose prices are adjusted pursuant to a third party pricing service methodology approved by the Board of Directors. |
| (5) | This security has been identified as illiquid. Illiquid securities are often purchased in private placement transactions, are often not registered under the Securities Act of 1933, as amended, and may have contractual restrictions on resale. A security may also be considered illiquid if the security lacks a readily available market or if its valuation has not changed for a certain period of time. The identification of illiquid securities is unaudited. At June 30, 2018, the aggregate value of these securities was $27,022,733, which represented 4.2% of total net assets. |
| (6) | The following illiquid securities are considered restricted due to a contractual lock-up period associated with the securities. |
| | | | | | | | | | | | |
Period
Acquired | | Security Name | | Shares/Par
Value | | Base
Total Cost | | | Base
Market
Value | |
| | Zuora, Inc. Series F Preferred | | 513,066 | | $ | 3,898,583 | | | $ | 13,156,837 | |
| (7) | Current yield as of period end. |
| † | See Significant Accounting Policies of accompanying Notes to Financial Statements regarding valuation of investments. |
| | |
| GLOSSARY: (abbreviations used in preceding Schedule of Investments) |
|
| Other Abbreviations: |
ADR | | American Depositary Receipt |
DDCA | | Dollars on Deposit in Custody Account |
ETF | | Exchange-Traded Fund |
REIT | | Real Estate Investment Trust |
The accompanying notes are an integral part of these financial statements.
|
| Hartford Small Company HLS Fund |
Schedule of Investments – (continued)
June 30, 2018 (Unaudited)
Fair Valuation Summary
The following is a summary of the fair valuations according to the inputs used as of June 30, 2018 in valuing the Fund’s investments.
| | | | | | | | | | | | | | | | |
| | | Total | | | Level 1(1) | | | Level 2(1) | | | Level 3(1) | |
Assets | |
Common Stocks | |
Automobiles & Components | | $ | 548,076 | | | $ | 548,076 | | | $ | — | | | $ | — | |
Banks | | | 36,740,496 | | | | 36,740,496 | | | | — | | | | — | |
Capital Goods | | | 75,451,295 | | | | 75,451,295 | | | | — | | | | — | |
Commercial & Professional Services | | | 23,633,896 | | | | 23,633,896 | | | | — | | | | — | |
Consumer Durables & Apparel | | | 24,765,354 | | | | 24,765,354 | | | | — | | | | — | |
Consumer Services | | | 47,548,683 | | | | 45,774,653 | | | | — | | | | 1,774,030 | |
Diversified Financials | | | 7,038,350 | | | | 7,038,350 | | | | — | | | | — | |
Energy | | | 8,677,148 | | | | 8,677,148 | | | | — | | | | — | |
Food & Staples Retailing | | | 12,570,026 | | | | 12,570,026 | | | | — | | | | — | |
Food, Beverage & Tobacco | | | 329,358 | | | | 329,358 | | | | — | | | | — | |
Health Care Equipment & Services | | | 48,398,982 | | | | 48,398,982 | | | | — | | | | — | |
Insurance | | | 202,343 | | | | 202,343 | | | | — | | | | — | |
Materials | | | 43,178,829 | | | | 43,178,829 | | | | — | | | | — | |
Pharmaceuticals, Biotechnology & Life Sciences | | | 89,802,952 | | | | 89,802,952 | | | | — | | | | — | |
Real Estate | | | 4,569,589 | | | | 4,569,589 | | | | — | | | | — | |
Retailing | | | 36,752,926 | | | | 32,106,238 | | | | — | | | | 4,646,688 | |
Semiconductors & Semiconductor Equipment | | | 4,289,027 | | | | 4,289,027 | | | | — | | | | — | |
Software & Services | | | 113,815,581 | | | | 113,815,581 | | | | — | | | | — | |
Technology Hardware & Equipment | | | 13,075,012 | | | | 13,075,012 | | | | — | | | | — | |
Telecommunication Services | | | 4,833,875 | | | | 4,833,875 | | | | — | | | | — | |
Transportation | | | 12,064,759 | | | | 12,064,759 | | | | — | | | | — | |
Exchange-Traded Funds | | | 948,909 | | | | 948,909 | | | | — | | | | — | |
Preferred Stocks | | | 19,877,358 | | | | — | | | | — | | | | 19,877,358 | |
Escrows | | | 724,657 | | | | — | | | | — | | | | 724,657 | |
Short-Term Investments | | | 22,777,206 | | | | 22,777,206 | | | | — | | | | — | |
| | | | | | | | | | | | | | | | |
Total | | $ | 652,614,687 | | | $ | 625,591,954 | | | $ | — | | | $ | 27,022,733 | |
| | | | | | | | | | | | | | | | |
| (1) | For the six-month period ended June 30, 2018, there were no transfers between any levels. |
The following is a rollforward of the Fund’s investments that were valued using unobservable inputs (Level 3) for the six-month period ended June 30, 2018:
| | | | | | | | | | | | | | | | |
| | | Common
Stocks | | | Preferred
Stocks | | | Escrows | | | Total | |
Beginning balance | | $ | 5,046,165 | | | $ | 12,389,626 | | | $ | — | | | $ | 17,435,791 | |
Conversion* | | | (631,232 | ) | | | | | | | 631,232 | | | | — | |
Purchases | | | — | | | | — | | | | — | | | | — | |
Sales | | | — | | | | — | | | | — | | | | — | |
Accrued discounts/(premiums) | | | — | | | | — | | | | — | | | | — | |
Total realized gain/(loss) | | | | | | | | | | | — | | | | — | |
Net change in unrealized appreciation/depreciation | | | 2,005,785 | | | | 7,487,732 | | | | 93,425 | | | | 9,586,942 | |
Transfers into Level 3 | | | — | | | | — | | | | — | | | | — | |
Transfers out of Level 3 | | | — | | | | — | | | | — | | | | — | |
| | | | | | | | | | | | | | | | |
Ending balance | | $ | 6,420,718 | | | $ | 19,877,358 | | | $ | 724,657 | | | $ | 27,022,733 | |
| | | | | | | | | | | | | | | | |
| * | Private Equity security that was a preferred stock is now trading as a common stock |
The change in net unrealized appreciation/(depreciation) relating to the Level 3 investments held at June 30, 2018 was $9,586,942.
The accompanying notes are an integral part of these financial statements.
|
| Hartford Small/Mid Cap Equity HLS Fund |
Schedule of Investments
June 30, 2018 (Unaudited)
| | | | | | | | |
| Shares or Principal Amount | | Market Value† | |
| COMMON STOCKS - 98.8% | |
| | | | Automobiles & Components - 1.2% | |
| | 6,004 | | | Lear Corp. | | $ | 1,115,603 | |
| | | | | | | | |
| | | | Banks - 5.4% | |
| | 6,123 | | | Bank of NT Butterfield & Son Ltd. | | | 279,943 | |
| | 17,133 | | | Cadence BanCorp. | | | 494,630 | |
| | 4,155 | | | Cullen/Frost Bankers, Inc. | | | 449,737 | |
| | 10,856 | | | Essent Group Ltd.* | | | 388,862 | |
| | 557 | | | First Citizens BancShares, Inc. Class A | | | 224,638 | |
| | 27,143 | | | MGIC Investment Corp.* | | | 290,973 | |
| | 34,892 | | | OFG Bancorp. | | | 490,233 | |
| | 5,006 | | | Opus Bank | | | 143,672 | |
| | 27,009 | | | Popular, Inc. | | | 1,221,077 | |
| | 2,126 | | | Preferred Bank | | | 130,664 | |
| | 29,855 | | | TCF Financial Corp. | | | 735,030 | |
| | 4,754 | | | Walker & Dunlop, Inc. | | | 264,560 | |
| | | | | | | | |
| | | | | | | 5,114,019 | |
| | | | | | | | |
| | | | Capital Goods - 7.5% | |
| | 3,137 | | | AGCO Corp. | | | 190,479 | |
| | 14,647 | | | Allison Transmission Holdings, Inc. | | | 593,057 | |
| | 9,813 | | | Briggs & Stratton Corp. | | | 172,807 | |
| | 8,072 | | | Continental Building Products, Inc.* | | | 254,672 | |
| | 6,682 | | | EMCOR Group, Inc. | | | 509,035 | |
| | 4,236 | | | EnerSys | | | 316,175 | |
| | 24,381 | | | Enphase Energy, Inc.*(1) | | | 164,084 | |
| | 4,323 | | | Fluor Corp. | | | 210,876 | |
| | 4,279 | | | Generac Holdings, Inc.* | | | 221,353 | |
| | 5,004 | | | Greenbrier Cos., Inc. | | | 263,961 | |
| | 5,009 | | | HD Supply Holdings, Inc.* | | | 214,836 | |
| | 2,551 | | | Huntington Ingalls Industries, Inc. | | | 553,031 | |
| | 1,840 | | | Hyster-Yale Materials Handling, Inc. | | | 118,220 | |
| | 10,355 | | | Owens Corning | | | 656,196 | |
| | 8,049 | | | Regal-Beloit Corp. | | | 658,408 | |
| | 3,154 | | | Rush Enterprises, Inc. Class A* | | | 136,820 | |
| | 15,326 | | | Spirit Aerosystems Holdings, Inc. Class A | | | 1,316,657 | |
| | 6,119 | | | Terex Corp. | | | 258,161 | |
| | 14,201 | | | Titan Machinery, Inc.* | | | 220,825 | |
| | 3,984 | | | Vectrus, Inc.* | | | 122,787 | |
| | | | | | | | |
| | | | | | | 7,152,440 | |
| | | | | | | | |
| | | | Commercial & Professional Services - 2.8% | |
| | 11,930 | | | ACCO Brands Corp. | | | 165,230 | |
| | 3,035 | | | Barrett Business Services, Inc. | | | 293,090 | |
| | 1,475 | | | Cimpress N.V.* | | | 213,816 | |
| | 1,567 | | | Insperity, Inc. | | | 149,257 | |
| | 6,310 | | | Kelly Services, Inc. Class A | | | 141,659 | |
| | 3,183 | | | Kimball International, Inc. Class B | | | 51,437 | |
| | 8,225 | | | LSC Communications, Inc. | | | 128,804 | |
| | 2,550 | | | ManpowerGroup, Inc. | | | 219,453 | |
| | 3,186 | | | McGrath Rent Corp. | | | 201,578 | |
| | 9,279 | | | Quad/Graphics, Inc. | | | 193,282 | |
| | 11,987 | | | Robert Half International, Inc. | | | 780,354 | |
| | 23,657 | | | RR Donnelley & Sons Co. | | | 136,264 | |
| | | | | | | | |
| | | | | | | 2,674,224 | |
| | | | | | | | |
| | | | Consumer Durables & Apparel - 3.3% | |
| | 12,092 | | | Beazer Homes USA, Inc.* | | | 178,357 | |
| | 8,670 | | | Crocs, Inc.* | | | 152,679 | |
| | 3,361 | | | CSS Industries, Inc. | | | 56,801 | |
| | 4,929 | | | Fossil Group, Inc.* | | | 132,442 | |
| | 8,795 | | | KB Home | | | 239,576 | |
| | 7,622 | | | La-Z-Boy, Inc. | | | 233,233 | |
| | | | | | | | |
| Shares or Principal Amount | | Market Value† | |
| COMMON STOCKS - 98.8% - (continued) | |
| | | | Consumer Durables & Apparel - 3.3% - (continued) | |
| | 7,755 | | | Lululemon Athletica, Inc.* | | $ | 968,212 | |
| | 6,448 | | | Michael Kors Holdings Ltd.* | | | 429,437 | |
| | 1,231 | | | Polaris Industries, Inc. | | | 150,403 | |
| | 6,919 | | | PulteGroup, Inc. | | | 198,921 | |
| | 1,939 | | | Ralph Lauren Corp. | | | 243,771 | |
| | 3,310 | | | Toll Brothers, Inc. | | | 122,437 | |
| | | | | | | | |
| | | | | | | 3,106,269 | |
| | | | | | | | |
| | | | Consumer Services - 4.9% | |
| | 8,500 | | | American Public Education, Inc.* | | | 357,850 | |
| | 3,811 | | | BJ’s Restaurants, Inc. | | | 228,660 | |
| | 6,638 | | | Bloomin’ Brands, Inc. | | | 133,424 | |
| | 576 | | | Churchill Downs, Inc. | | | 170,784 | |
| | 2,034 | | | DineEquity, Inc. | | | 152,143 | |
| | 823 | | | Graham Holdings Co. Class B | | | 482,360 | |
| | 3,008 | | | Grand Canyon Education, Inc.* | | | 335,723 | |
| | 9,825 | | | Hyatt Hotels Corp. Class A | | | 757,999 | |
| | 24,672 | | | International Speedway Corp. Class A | | | 1,102,838 | |
| | 9,031 | | | K12, Inc.* | | | 147,838 | |
| | 9,536 | | | Penn National Gaming, Inc.* | | | 320,314 | |
| | 15,798 | | | Ruth’s Hospitality Group, Inc. | | | 443,134 | |
| | | | | | | | |
| | | | | | | 4,633,067 | |
| | | | | | | | |
| | | | Diversified Financials - 5.1% | |
| | 14,900 | | | AG Mortgage Investment Trust, Inc. REIT | | | 279,971 | |
| | 14,129 | | | Apollo Commercial Real Estate Finance, Inc. REIT | | | 258,278 | |
| | 26,041 | | | ARMOUR Residential, Inc. REIT | | | 593,995 | |
| | 12,472 | | | Banco Latinoamericano de Comercio Exterior S.A. ADR | | | 306,936 | |
| | 8,171 | | | Cherry Hill Mortgage Investment Corp. REIT | | | 145,934 | |
| | 19,554 | | | Chimera Investment Corp. REIT | | | 357,447 | |
| | 17,081 | | | E*TRADE Financial Corp.* | | | 1,044,674 | |
| | 5,886 | | | Green Dot Corp. Class A* | | | 431,973 | |
| | 15,317 | | | Invesco Mortgage Capital, Inc. REIT | | | 243,540 | |
| | 7,070 | | | Legg Mason, Inc. | | | 245,541 | |
| | 3,866 | | | LPL Financial Holdings, Inc. | | | 253,378 | |
| | 3,000 | | | Redwood Trust, Inc. REIT | | | 49,410 | |
| | 23,650 | | | Two Harbors Investment Corp. REIT | | | 373,670 | |
| | 6,521 | | | Virtu Financial, Inc. Class A | | | 173,133 | |
| | 9,076 | | | Western Asset Mortgage Capital Corp. REIT | | | 94,572 | |
| | | | | | | | |
| | | | | | | 4,852,452 | |
| | | | | | | | |
| | | | Energy - 5.5% | |
| | 2,693 | | | Arch Coal, Inc. Class A | | | 211,212 | |
| | 7,967 | | | CVR Energy, Inc.(1) | | | 294,699 | |
| | 9,433 | | | Delek U.S. Holdings, Inc. | | | 473,254 | |
| | 13,760 | | | HollyFrontier Corp. | | | 941,597 | |
| | 13,943 | | | Matrix Service Co.* | | | 255,854 | |
| | 16,161 | | | Murphy Oil Corp. | | | 545,757 | |
| | 14,802 | | | Par Pacific Holdings, Inc.* | | | 257,259 | |
| | 11,148 | | | PBF Energy, Inc. Class A | | | 467,436 | |
| | 12,921 | | | Peabody Energy Corp. | | | 587,647 | |
| | 2,880 | | | REX American Resources Corp.* | | | 233,194 | |
| | 2,683 | | | SEACOR Holdings, Inc.* | | | 153,655 | |
| | 71,876 | | | W&T Offshore, Inc.* | | | 513,913 | |
| | 5,000 | | | Whiting Petroleum Corp.* | | | 263,600 | |
| | | | | | | | |
| | | | | | | 5,199,077 | |
| | | | | | | | |
| | | | Food & Staples Retailing - 0.2% | |
| | 3,231 | | | Weis Markets, Inc. | | | 172,342 | |
| | | | | | | | |
The accompanying notes are an integral part of these financial statements.
|
| Hartford Small/Mid Cap Equity HLS Fund |
Schedule of Investments – (continued)
June 30, 2018 (Unaudited)
| | | | | | | | |
| Shares or Principal Amount | | Market Value† | |
| COMMON STOCKS - 98.8% - (continued) | |
| | | | Food, Beverage & Tobacco - 1.3% | |
| | 2,018 | | | Boston Beer Co., Inc. Class A* | | $ | 604,795 | |
| | 31,200 | | | Pilgrim’s Pride Corp.* | | | 628,056 | |
| | | | | | | | |
| | | | | | | 1,232,851 | |
| | | | | | | | |
| | | | Health Care Equipment & Services - 5.6% | |
| | 7,536 | | | AngioDynamics, Inc.* | | | 167,601 | |
| | 856 | | | Chemed Corp. | | | 275,469 | |
| | 6,834 | | | Encompass Health Corp. | | | 462,798 | |
| | 8,628 | | | Haemonetics Corp.* | | | 773,759 | |
| | 10,030 | | | HealthStream, Inc. | | | 273,919 | |
| | 485 | | | ICU Medical, Inc.* | | | 142,420 | |
| | 15,234 | | | Meridian Bioscience, Inc. | | | 242,221 | |
| | 3,124 | | | Molina Healthcare, Inc.* | | | 305,965 | |
| | 2,100 | | | Providence Service Corp.* | | | 164,955 | |
| | 11,368 | | | Quality Systems, Inc.* | | | 221,676 | |
| | 12,264 | | | RadNet, Inc.* | | | 183,960 | |
| | 3,787 | | | SurModics, Inc.* | | | 209,042 | |
| | 5,759 | | | Tenet Healthcare Corp.* | | | 193,330 | |
| | 15,254 | | | Triple-S Management Corp. Class B* | | | 595,821 | |
| | 4,458 | | | WellCare Health Plans, Inc.* | | | 1,097,738 | |
| | | | | | | | |
| | | | | | | 5,310,674 | |
| | | | | | | | |
| | | | Household & Personal Products - 2.0% | |
| | 7,282 | | | Medifast, Inc. | | | 1,166,285 | |
| | 6,349 | | | USANA Health Sciences, Inc.* | | | 732,040 | |
| | | | | | | | |
| | | | | | | 1,898,325 | |
| | | | | | | | |
| | | | Insurance - 3.2% | |
| | 9,178 | | | Ambac Financial Group, Inc.* | | | 182,183 | |
| | 6,289 | | | American Equity Investment Life Holding Co. | | | 226,404 | |
| | 4,213 | | | American National Insurance Co. | | | 503,833 | |
| | 20,550 | | | Assured Guaranty Ltd. | | | 734,252 | |
| | 44,313 | | | Old Republic International Corp. | | | 882,272 | |
| | 6,462 | | | Torchmark Corp. | | | 526,071 | |
| | | | | | | | |
| | | | | | | 3,055,015 | |
| | | | | | | | |
| | | | Materials - 3.9% | |
| | 7,620 | | | Alcoa Corp.* | | | 357,226 | |
| | 3,296 | | | Boise Cascade Co. | | | 147,331 | |
| | 11,015 | | | CF Industries Holdings, Inc. | | | 489,066 | |
| | 3,995 | | | Chemours Co. | | | 177,218 | |
| | 15,515 | | | Domtar Corp. | | | 740,686 | |
| | 7,000 | | | Huntsman Corp. | | | 204,400 | |
| | 12,307 | | | Louisiana-Pacific Corp. | | | 334,996 | |
| | 2,670 | | | Steel Dynamics, Inc. | | | 122,686 | |
| | 7,881 | | | Stepan Co. | | | 614,797 | |
| | 13,734 | | | SunCoke Energy, Inc.* | | | 184,036 | |
| | 6,715 | | | United States Steel Corp. | | | 233,346 | |
| | 1,293 | | | Westlake Chemical Corp. | | | 139,166 | |
| | | | | | | | |
| | | | | | | 3,744,954 | |
| | | | | | | | |
| | | | Media - 1.5% | |
| | 10,789 | | | AMC Entertainment Holdings, Inc. Class A | | | 171,545 | |
| | 53,587 | | | Entravision Communications Corp. Class A | | | 267,935 | |
| | 14,783 | | | Gannett Co., Inc. | | | 158,178 | |
| | 18,896 | | | New Media Investment Group, Inc. | | | 349,198 | |
| | 7,233 | | | tronc, Inc.* | | | 124,986 | |
| | 5,054 | | | World Wrestling Entertainment, Inc. Class A(1) | | | 368,033 | |
| | | | | | | | |
| | | | | | | 1,439,875 | |
| | | | | | | | |
| | | | Pharmaceuticals, Biotechnology & Life Sciences - 7.1% | |
| | 6,541 | | | Acorda Therapeutics, Inc.* | | | 187,727 | |
| | 6,850 | | | AMAG Pharmaceuticals, Inc.* | | | 133,575 | |
| | | | | | | | |
| Shares or Principal Amount | | Market Value† | |
| COMMON STOCKS - 98.8% - (continued) | |
| | | | Pharmaceuticals, Biotechnology & Life Sciences - 7.1% -
(continued) | |
| | 37,767 | | | Ardelyx, Inc.* | | $ | 139,738 | |
| | 29,345 | | | ArQule, Inc.* | | | 162,278 | |
| | 8,681 | | | Array BioPharma, Inc.* | | | 145,667 | |
| | 13,329 | | | Bruker Corp. | | | 387,074 | |
| | 13,641 | | | ChemoCentryx, Inc.* | | | 179,652 | |
| | 11,420 | | | Concert Pharmaceuticals, Inc.* | | | 192,199 | |
| | 14,417 | | | CytomX Therapeutics, Inc.* | | | 329,573 | |
| | 27,858 | | | Edge Therapeutics, Inc.*(1) | | | 28,694 | |
| | 5,222 | | | Editas Medicine, Inc.* | | | 187,104 | |
| | 7,685 | | | Emergent BioSolutions, Inc.* | | | 388,016 | |
| | 4,310 | | | Enanta Pharmaceuticals, Inc.* | | | 499,529 | |
| | 28,113 | | | Horizon Pharma plc* | | | 465,551 | |
| | 21,260 | | | ImmunoGen, Inc.* | | | 206,860 | |
| | 28,968 | | | Inovio Pharmaceuticals, Inc.*(1) | | | 113,555 | |
| | 10,104 | | | Lannett Co., Inc.*(1) | | | 137,414 | |
| | 8,416 | | | Luminex Corp. | | | 248,524 | |
| | 7,555 | | | MacroGenics, Inc.* | | | 156,011 | |
| | 8,877 | | | Mallinckrodt plc* | | | 165,645 | |
| | 5,930 | | | Medpace Holdings, Inc.* | | | 254,990 | |
| | 111,984 | | | Novavax, Inc.* | | | 150,058 | |
| | 122,681 | | | PDL BioPharma, Inc.* | | | 287,073 | |
| | 29,731 | | | Pieris Pharmaceuticals, Inc.* | | | 150,736 | |
| | 19,931 | | | Retrophin, Inc.* | | | 543,319 | |
| | 12,364 | | | Sangamo Therapeutics, Inc.* | | | 175,569 | |
| | 6,356 | | | United Therapeutics Corp.* | | | 719,181 | |
| | | | | | | | |
| | | | | | | 6,735,312 | |
| | | | | | | | |
| | | | Real Estate - 10.6% | |
| | 5,297 | | | Agree Realty Corp. REIT | | | 279,523 | |
| | 55,800 | | | Brandywine Realty Trust REIT | | | 941,904 | |
| | 57,259 | | | Brixmor Property Group, Inc. REIT | | | 998,024 | |
| | 16,280 | | | Chatham Lodging Trust REIT | | | 345,462 | |
| | 18,505 | | | CoreCivic, Inc. REIT | | | 442,085 | |
| | 13,632 | | | Forestar Group, Inc.*(1) | | | 282,864 | |
| | 18,295 | | | Gaming and Leisure Properties, Inc. REIT | | | 654,961 | |
| | 10,659 | | | Global Net Lease, Inc. REIT | | | 217,763 | |
| | 14,037 | | | Hersha Hospitality Trust REIT | | | 301,094 | |
| | 25,723 | | | Hospitality Properties Trust REIT | | | 735,935 | |
| | 14,114 | | | Independence Realty Trust, Inc. REIT | | | 145,515 | |
| | 13,275 | | | iStar, Inc. REIT* | | | 143,237 | |
| | 2,301 | | | Jones Lang LaSalle, Inc. REIT | | | 381,943 | |
| | 2,094 | | | Life Storage, Inc. REIT | | | 203,767 | |
| | 4,651 | | | Park Hotels & Resorts, Inc. REIT | | | 142,460 | |
| | 31,138 | | | Piedmont Office Realty Trust, Inc. Class A, REIT | | | 620,580 | |
| | 31,400 | | | Ramco-Gershenson Properties Trust REIT | | | 414,794 | |
| | 75,372 | | | Retail Properties of America, Inc. Class A, REIT | | | 963,254 | |
| | 15,713 | | | Sabra Healthcare, Inc. REIT | | | 341,444 | |
| | 36,070 | | | Select Income REIT | | | 810,493 | |
| | 28,914 | | | Spirit Realty Capital, Inc. REIT | | | 232,180 | |
| | 4,451 | | | Weingarten Realty Investors REIT | | | 137,135 | |
| | 11,600 | | | Xenia Hotels & Resorts, Inc. REIT | | | 282,576 | |
| | | | | | | | |
| | | | | | | 10,018,993 | |
| | | | | | | | |
| | | | Retailing - 3.3% | |
| | 8,130 | | | Abercrombie & Fitch Co. Class A | | | 199,023 | |
| | 38,718 | | | Ascena Retail Group, Inc.* | | | 154,291 | |
| | 1,344 | | | Burlington Stores, Inc.* | | | 202,312 | |
| | 5,826 | | | Cato Corp. Class A | | | 143,436 | |
| | 17,405 | | | Chico’s FAS, Inc. | | | 141,677 | |
| | 5,699 | | | DSW, Inc. Class A | | | 147,148 | |
The accompanying notes are an integral part of these financial statements.
|
| Hartford Small/Mid Cap Equity HLS Fund |
Schedule of Investments – (continued)
June 30, 2018 (Unaudited)
| | | | | | | | |
| Shares or Principal Amount | | Market Value† | |
| COMMON STOCKS - 98.8% - (continued) | |
| | | | Retailing - 3.3% - (continued) | |
| | 3,599 | | | Genesco, Inc.* | | $ | 142,880 | |
| | 6,038 | | | Guess?, Inc. | | | 129,213 | |
| | 17,110 | | | J. Jill, Inc.* | | | 159,807 | |
| | 2,246 | | | Kohl’s Corp. | | | 163,733 | |
| | 5,643 | | | Lands’ End, Inc.* | | | 157,440 | |
| | 7,586 | | | Liberty Expedia Holdings, Inc. Class A* | | | 333,329 | |
| | 10,460 | | | Liberty TripAdvisor Holdings, Inc. Class A* | | | 168,406 | |
| | 4,461 | | | Shoe Carnival, Inc. | | | 144,760 | |
| | 4,560 | | | Shutterfly, Inc.* | | | 410,537 | |
| | 7,277 | | | Tailored Brands, Inc. | | | 185,709 | |
| | 4,531 | | | Urban Outfitters, Inc.* | | | 201,856 | |
| | | | | | | | |
| | | | | | | 3,185,557 | |
| | | | | | | | |
| | | | Semiconductors & Semiconductor Equipment - 2.0% | |
| | 24,666 | | | Amkor Technology, Inc.* | | | 211,881 | |
| | 4,517 | | | Diodes, Inc.* | | | 155,701 | |
| | 5,694 | | | First Solar, Inc.* | | | 299,846 | |
| | 23,801 | | | ON Semiconductor Corp.* | | | 529,215 | |
| | 14,321 | | | Teradyne, Inc. | | | 545,201 | |
| | 8,434 | | | Xperi Corp. | | | 135,787 | |
| | | | | | | | |
| | | | | | | 1,877,631 | |
| | | | | | | | |
| | | | Software & Services - 11.1% | |
| | 3,038 | | | Bottomline Technologies de, Inc.* | | | 151,383 | |
| | 2,626 | | | Broadridge Financial Solutions, Inc. | | | 302,253 | |
| | 6,081 | | | Cardtronics plc Class A* | | | 147,039 | |
| | 29,431 | | | Conduent, Inc.* | | | 534,761 | |
| | 18,250 | | | Convergys Corp. | | | 446,030 | |
| | 9,930 | | | Etsy, Inc.* | | | 418,947 | |
| | 2,444 | | | Euronet Worldwide, Inc.* | | | 204,734 | |
| | 21,255 | | | Fortinet, Inc.* | | | 1,326,950 | |
| | 27,822 | | | Glu Mobile, Inc.* | | | 178,339 | |
| | 5,489 | | | ManTech International Corp. Class A | | | 294,430 | |
| | 10,867 | | | MAXIMUS, Inc. | | | 674,949 | |
| | 1,092 | | | MicroStrategy, Inc. Class A* | | | 139,503 | |
| | 4,623 | | | New Relic, Inc.* | | | 465,027 | |
| | 5,800 | | | Perficient, Inc.* | | | 152,946 | |
| | 9,226 | | | Presidio, Inc.* | | | 120,861 | |
| | 9,895 | | | Progress Software Corp. | | | 384,124 | |
| | 15,680 | | | QuinStreet, Inc.* | | | 199,136 | |
| | 9,060 | | | Shutterstock, Inc.* | | | 429,988 | |
| | 11,975 | | | Sykes Enterprises, Inc.* | | | 344,640 | |
| | 16,306 | | | Synchronoss Technologies, Inc.* | | | 100,608 | |
| | 5,456 | | | Syntel, Inc.* | | | 175,083 | |
| | 7,668 | | | Tableau Software, Inc. Class A* | | | 749,547 | |
| | 13,648 | | | TechTarget, Inc.* | | | 387,603 | |
| | 21,393 | | | Teradata Corp.* | | | 858,929 | |
| | 13,152 | | | Travelport Worldwide Ltd. | | | 243,838 | |
| | 7,089 | | | TTEC Holdings, Inc. | | | 244,925 | |
| | 25,611 | | | Unisys Corp.* | | | 330,382 | |
| | 2,859 | | | Virtusa Corp.* | | | 139,176 | |
| | 7,596 | | | Yelp, Inc.* | | | 297,611 | |
| | 18,639 | | | Zynga, Inc. Class A* | | | 75,861 | |
| | | | | | | | |
| | | | | | | 10,519,603 | |
| | | | | | | | |
| | | | Technology Hardware & Equipment - 2.9% | |
| | 34,899 | | | AVX Corp. | | | 546,868 | |
| | 4,639 | | | Comtech Telecommunications Corp. | | | 147,891 | |
| | 9,312 | | | Immersion Corp.* | | | 143,777 | |
| | 17,752 | | | Jabil, Inc. | | | 491,020 | |
| | 6,273 | | | NETGEAR, Inc.* | | | 392,063 | |
| | 5,252 | | | Tech Data Corp.* | | | 431,294 | |
| | 24,331 | | | Vishay Intertechnology, Inc. | | | 564,479 | |
| | | | | | | | |
| | | | | | | 2,717,392 | |
| | | | | | | | |
| | | | | | | | |
| Shares or Principal Amount | | Market Value† | |
| COMMON STOCKS - 98.8% - (continued) | |
| | | | Telecommunication Services - 1.0% | |
| | 7,677 | | | Boingo Wireless, Inc.* | | $ | 173,423 | |
| | 27,100 | | | Telephone & Data Systems, Inc. | | | 743,082 | |
| | | | | | | | |
| | | | | | | 916,505 | |
| | | | | | | | |
| | | | Transportation - 2.9% | |
| | 4,114 | | | ArcBest Corp. | | | 188,010 | |
| | 4,253 | | | Avis Budget Group, Inc.* | | | 138,222 | |
| | 2,126 | | | Copa Holdings S.A. Class A | | | 201,162 | |
| | 5,767 | | | Hawaiian Holdings, Inc. | | | 207,324 | |
| | 3,684 | | | Hertz Global Holdings, Inc.* | | | 56,513 | |
| | 25,647 | | | JetBlue Airways Corp.* | | | 486,780 | |
| | 5,995 | | | Old Dominion Freight Line, Inc. | | | 893,015 | |
| | 6,120 | | | XPO Logistics, Inc.* | | | 613,102 | |
| | | | | | | | |
| | | | | | | 2,784,128 | |
| | | | | | | | |
| | | | Utilities - 4.5% | |
| | 18,520 | | | National Fuel Gas Co. | | | 980,819 | |
| | 12,163 | | | NRG Energy, Inc. | | | 373,404 | |
| | 14,391 | | | OGE Energy Corp. | | | 506,707 | |
| | 14,716 | | | Pinnacle West Capital Corp. | | | 1,185,522 | |
| | 12,947 | | | Portland General Electric Co. | | | 553,614 | |
| | 28,374 | | | Vistra Energy Corp.* | | | 671,329 | |
| | | | | | | | |
| | | | | | | 4,271,395 | |
| | | | | | | | |
| | |
| | | | Total Common Stocks
(cost $81,064,891) | | $ | 93,727,703 | |
| | | | | | | | |
| | |
| | | | Total Long-Term Investments
(cost $81,064,891) | | $ | 93,727,703 | |
| | | | | | | | |
|
| SHORT-TERM INVESTMENTS - 2.3% | |
| | | | Other Investment Pools & Funds - 1.1% | | | |
| | 1,063,213 | | | Morgan Stanley Institutional Liquidity Funds, Government Portfolio, Institutional Class,
1.84%(2) | | $ | 1,063,213 | |
| | | | | | | | |
| | | | Securities Lending Collateral - 1.2% | | | |
| | 56,531 | | | Citibank NA DDCA,
1.91%, 7/2/2018(2) | | | 56,531 | |
| | 381,860 | | | Goldman Sachs Financial Square Funds, Government Institutional Fund,
1.81%(2) | | | 381,860 | |
| | 354,825 | | | Invesco Government & Agency Portfolio,
1.81%(2) | | | 354,825 | |
| | 104,683 | | | Morgan Stanley Institutional Liquidity Funds, Government Portfolio, Institutional Class, 1.84%(2) | | | 104,683 | |
| | 232,711 | | | Western Asset Institutional Government Class A Fund,
1.79%(2) | | | 232,711 | |
| | | | | | | | |
| | | | | | | 1,130,610 | |
| | | | | | | | |
| | |
| | | | Total Short-Term Investments
(cost $2,193,823) | | $ | 2,193,823 | |
| | | | | | | | |
| | | | | | | | | | | | |
| | | |
| | | | Total Investments
(cost $83,258,714) | | | 101.1 | % | | $ | 95,921,526 | |
| | | | Other Assets and Liabilities | | | (1.1 | )% | | | (1,083,086 | ) |
| | | | | | | | | | | | |
| | | | Total Net Assets | | | 100.0 | % | | $ | 94,838,440 | |
| | | | | | | | | | | | |
The accompanying notes are an integral part of these financial statements.
|
| Hartford Small/Mid Cap Equity HLS Fund |
Schedule of Investments – (continued)
June 30, 2018 (Unaudited)
| Note: | Percentage of investments as shown is the ratio of the total market value to total net assets. |
| | Equity industry classifications used in this report are the Global Industry Classification Standard, which was developed by and is the exclusive property and service mark of MSCI, Inc. and Standard & Poor’s. |
| | For Fund compliance purposes, the Fund may not use the same classification system shown in this report as these classifications are used for financial reporting purposes. |
| (1) | Represents entire or partial securities on loan. See Note 8 in the accompanying Notes to Financial Statements for securities lending information. |
| (2) | Current yield as of period end. |
| † | See Significant Accounting Policies of accompanying Notes to Financial Statements regarding valuation of investments. |
| | |
| GLOSSARY: (abbreviations used in preceding Schedule of Investments) |
|
| Other Abbreviations: |
ADR | | American Depositary Receipt |
DDCA | | Dollars on Deposit in Custody Account |
REIT | | Real Estate Investment Trust |
The accompanying notes are an integral part of these financial statements.
|
| Hartford Small/Mid Cap Equity HLS Fund |
Schedule of Investments – (continued)
June 30, 2018 (Unaudited)
Fair Valuation Summary
The following is a summary of the fair valuations according to the inputs used as of June 30, 2018 in valuing the Fund’s investments.
| | | | | | | | | | | | | | | | |
| | | Total | | | Level 1(1) | | | Level 2(1) | | | Level 3(1) | |
Assets | | | | | | | | | | | | | | | | |
Common Stocks | | | | | | | | | | | | | | | | |
Automobiles & Components | | $ | 1,115,603 | | | $ | 1,115,603 | | | $ | — | | | $ | — | |
Banks | | | 5,114,019 | | | | 5,114,019 | | | | — | | | | — | |
Capital Goods | | | 7,152,440 | | | | 7,152,440 | | | | — | | | | — | |
Commercial & Professional Services | | | 2,674,224 | | | | 2,674,224 | | | | — | | | | — | |
Consumer Durables & Apparel | | | 3,106,269 | | | | 3,106,269 | | | | — | | | | — | |
Consumer Services | | | 4,633,067 | | | | 4,633,067 | | | | — | | | | — | |
Diversified Financials | | | 4,852,452 | | | | 4,852,452 | | | | — | | | | — | |
Energy | | | 5,199,077 | | | | 5,199,077 | | | | — | | | | — | |
Food & Staples Retailing | | | 172,342 | | | | 172,342 | | | | — | | | | — | |
Food, Beverage & Tobacco | | | 1,232,851 | | | | 1,232,851 | | | | — | | | | — | |
Health Care Equipment & Services | | | 5,310,674 | | | | 5,310,674 | | | | — | | | | — | |
Household & Personal Products | | | 1,898,325 | | | | 1,898,325 | | | | — | | | | — | |
Insurance | | | 3,055,015 | | | | 3,055,015 | | | | — | | | | — | |
Materials | | | 3,744,954 | | | | 3,744,954 | | | | — | | | | — | |
Media | | | 1,439,875 | | | | 1,439,875 | | | | — | | | | — | |
Pharmaceuticals, Biotechnology & Life Sciences | | | 6,735,312 | | | | 6,735,312 | | | | — | | | | — | |
Real Estate | | | 10,018,993 | | | | 10,018,993 | | | | — | | | | — | |
Retailing | | | 3,185,557 | | | | 3,185,557 | | | | — | | | | — | |
Semiconductors & Semiconductor Equipment | | | 1,877,631 | | | | 1,877,631 | | | | — | | | | — | |
Software & Services | | | 10,519,603 | | | | 10,519,603 | | | | — | | | | — | |
Technology Hardware & Equipment | | | 2,717,392 | | | | 2,717,392 | | | | — | | | | — | |
Telecommunication Services | | | 916,505 | | | | 916,505 | | | | — | | | | — | |
Transportation | | | 2,784,128 | | | | 2,784,128 | | | | — | | | | — | |
Utilities | | | 4,271,395 | | | | 4,271,395 | | | | — | | | | — | |
Short-Term Investments | | | 2,193,823 | | | | 2,193,823 | | | | — | | | | — | |
| | | | | | | | | | | | | | | | |
Total | | $ | 95,921,526 | | | $ | 95,921,526 | | | $ | — | | | $ | — | |
| | | | | | | | | | | | | | | | |
| (1) | For the six-month period ended June 30, 2018, there were no transfers between any levels. |
The accompanying notes are an integral part of these financial statements.
Schedule of Investments
June 30, 2018 (Unaudited)
| | | | | | | | |
| Shares or Principal Amount | | Market Value† | |
| COMMON STOCKS - 98.4% | |
| | | | Banks - 2.3% | |
| | 243,601 | | | PNC Financial Services Group, Inc. | | $ | 32,910,495 | |
| | | | | | | | |
| | | | Capital Goods - 10.8% | |
| | 181,929 | | | General Dynamics Corp. | | | 33,913,385 | |
| | 222,765 | | | Honeywell International, Inc. | | | 32,089,298 | |
| | 114,242 | | | Lockheed Martin Corp. | | | 33,750,514 | |
| | 113,701 | | | Northrop Grumman Corp. | | | 34,985,798 | |
| | 175,748 | | | United Technologies Corp. | | | 21,973,772 | |
| | | | | | | | |
| | | | | | | 156,712,767 | |
| | | | | | | | |
| | | | Consumer Durables & Apparel - 6.1% | |
| | 818,534 | | | NIKE, Inc. Class B | | | 65,220,789 | |
| | 275,423 | | | VF Corp. | | | 22,452,483 | |
| | | | | | | | |
| | | | | | | 87,673,272 | |
| | | | | | | | |
| | | | Consumer Services - 3.7% | |
| | 201,671 | | | McDonald’s Corp. | | | 31,599,829 | |
| | 444,810 | | | Starbucks Corp. | | | 21,728,968 | |
| | | | | | | | |
| | | | | | | 53,328,797 | |
| | | | | | | | |
| | | | Diversified Financials - 4.3% | |
| | 363,062 | | | American Express Co. | | | 35,580,076 | |
| | 54,691 | | | BlackRock, Inc. | | | 27,292,997 | |
| | | | | | | | |
| | | | | | | 62,873,073 | |
| | | | | | | | |
| | | | Energy - 3.2% | |
| | 267,009 | | | Exxon Mobil Corp. | | | 22,089,654 | |
| | 349,390 | | | Schlumberger Ltd. | | | 23,419,612 | |
| | | | | | | | |
| | | | | | | 45,509,266 | |
| | | | | | | | |
| | | | Food & Staples Retailing - 4.1% | |
| | 202,209 | | | Costco Wholesale Corp. | | | 42,257,637 | |
| | 277,648 | | | Walgreens Boots Alliance, Inc. | | | 16,663,044 | |
| | | | | | | | |
| | | | | | | 58,920,681 | |
| | | | | | | | |
| | | | Food, Beverage & Tobacco - 7.7% | |
| | 877,722 | | | Coca-Cola Co. | | | 38,496,887 | |
| | 898,224 | | | Diageo plc | | | 32,269,512 | |
| | 374,097 | | | PepsiCo., Inc. | | | 40,727,940 | |
| | | | | | | | |
| | | | | | | 111,494,339 | |
| | | | | | | | |
| | | | Health Care Equipment & Services - 9.7% | |
| | 332,347 | | | Cardinal Health, Inc. | | | 16,228,504 | |
| | 287,313 | | | Danaher Corp. | | | 28,352,047 | |
| | 167,506 | | | McKesson Corp. | | | 22,345,300 | |
| | 426,675 | | | Medtronic plc | | | 36,527,647 | |
| | 151,058 | | | UnitedHealth Group, Inc. | | | 37,060,570 | |
| | | | | | | | |
| | | | | | | 140,514,068 | |
| | | | | | | | |
| | | | Household & Personal Products - 3.4% | |
| | 528,605 | | | Colgate-Palmolive Co. | | | 34,258,890 | |
| | 198,429 | | | Procter & Gamble Co. | | | 15,489,368 | |
| | | | | | | | |
| | | | | | | 49,748,258 | |
| | | | | | | | |
| | | | Insurance - 4.9% | |
| | 298,509 | | | Chubb Ltd. | | | 37,916,613 | |
| | 407,270 | | | Marsh & McLennan Cos., Inc. | | | 33,383,922 | |
| | | | | | | | |
| | | | | | | 71,300,535 | |
| | | | | | | | |
| | | | Materials - 4.2% | |
| | 197,878 | | | Ecolab, Inc. | | | 27,768,220 | |
| | 209,886 | | | Praxair, Inc. | | | 33,193,471 | |
| | | | | | | | |
| | | | | | | 60,961,691 | |
| | | | | | | | |
| | | | | | | | |
| Shares or Principal Amount | | Market Value† | |
| COMMON STOCKS - 98.4% - (continued) | |
| | | | Pharmaceuticals, Biotechnology & Life Sciences - 5.6% | |
| | 147,059 | | | Amgen, Inc. | | $ | 27,145,621 | |
| | 262,170 | | | Johnson & Johnson | | | 31,811,708 | |
| | 366,316 | | | Merck & Co., Inc. | | | 22,235,381 | |
| | | | | | | | |
| | | | | | | 81,192,710 | |
| | | | | | | | |
| | | | Real Estate - 5.4% | | | |
| | 294,413 | | | American Tower Corp. REIT | | | 42,445,522 | |
| | 159,894 | | | Public Storage REIT | | | 36,273,553 | |
| | | | | | | | |
| | | | | | | 78,719,075 | |
| | | | | | | | |
| | | | Retailing - 4.3% | | | |
| | 9,440,100 | | | Allstar Co.*(1)(2)(3)(4) | | | 4,342,446 | |
| | 600,187 | | | TJX Cos., Inc. | | | 57,125,799 | |
| | | | | | | | |
| | | | | | | 61,468,245 | |
| | | | | | | | |
| | | | Software & Services - 10.4% | | | |
| | 237,220 | | | Accenture plc Class A | | | 38,806,820 | |
| | 142,689 | | | Automatic Data Processing, Inc. | | | 19,140,302 | |
| | 526,814 | | | Microsoft Corp. | | | 51,949,129 | |
| | 307,049 | | | Visa, Inc. Class A | | | 40,668,640 | |
| | | | | | | | |
| | | | | | | 150,564,891 | |
| | | | | | | | |
| | | | Transportation - 8.3% | | | |
| | 570,048 | | | Canadian National Railway Co. | | | 46,626,297 | |
| | 309,860 | | | Union Pacific Corp. | | | 43,900,965 | |
| | 282,563 | | | United Parcel Service, Inc. Class B | | | 30,016,667 | |
| | | | | | | | |
| | | | | | | 120,543,929 | |
| | | | | | | | |
| | |
| | | | Total Common Stocks
(cost $1,110,273,883) | | $ | 1,424,436,092 | |
| | | | | | | | |
| | |
| | | | Total Long-Term Investments
(cost $1,110,273,883) | | $ | 1,424,436,092 | |
| | | | | | | | |
|
| SHORT-TERM INVESTMENTS - 1.5% | |
| | | | Other Investment Pools & Funds - 1.5% | | | |
| | 21,840,468 | | | Fidelity Institutional Government Fund, Institutional Class,
1.80%(5) | | $ | 21,840,468 | |
| | | | | | | | |
| | |
| | | | Total Short-Term Investments
(cost $21,840,468) | | $ | 21,840,468 | |
| | | | | | | | |
| | | | | | | | | | | | |
| | | |
| | | | Total Investments
(cost $1,132,114,351) | | | 99.9 | % | | $ | 1,446,276,560 | |
| | | | Other Assets and Liabilities | | | 0.1 | % | | | 1,312,893 | |
| | | | | | | | | | | | |
| | | | Total Net Assets | | | 100.0 | % | | $ | 1,447,589,453 | |
| | | | | | | | | | | | |
The accompanying notes are an integral part of these financial statements.
Schedule of Investments – (continued)
June 30, 2018 (Unaudited)
| Note: | Percentage of investments as shown is the ratio of the total market value to total net assets. |
| | Prices of foreign equities that are principally traded on certain foreign markets will generally be adjusted daily pursuant to a fair value pricing service approved by the Board of Directors in order to reflect an adjustment for factors occurring after the close of certain foreign markets but before the close of the New York Stock Exchange. |
| | Equity industry classifications used in this report are the Global Industry Classification Standard, which was developed by and is the exclusive property and service mark of MSCI, Inc. and Standard & Poor’s. |
| | For Fund compliance purposes, the Fund may not use the same classification system shown in this report as these classifications are used for financial reporting purposes. |
| (1) | Investment valued using significant unobservable inputs. |
| (2) | Securities issued within terms of a private placement memorandum and exempt from registration under Rule 144A under the Securities Act of 1933, as amended, and may be sold to qualified institutional buyers. Unless otherwise indicated, this holding is determined to be liquid. At June 30, 2018, the aggregate value of this security was $4,342,446, which represented 0.3% of total net assets. |
| (3) | This security is valued in good faith at fair value as determined under policies and procedures established by and under the supervision of the Board of Directors. At June 30, 2018, the aggregate fair value of this security was $4,342,446, which represented 0.3% of total net assets. This amount excludes securities that are principally traded in certain foreign markets and whose prices are adjusted pursuant to a third party pricing service methodology approved by the Board of Directors. |
| (4) | This security has been identified as illiquid. Illiquid securities are often purchased in private placement transactions, are often not registered under the Securities Act of 1933, as amended, and may have contractual restrictions on resale. A security may also be considered illiquid if the security lacks a readily available market or if its valuation has not changed for a certain period of time. The identification of illiquid securities is unaudited. At June 30, 2018, the aggregate value of this security was $4,342,446, which represented 0.3% of total net assets. |
| (5) | Current yield as of period end. |
| † | See Significant Accounting Policies of accompanying Notes to Financial Statements regarding valuation of investments. |
| | |
| GLOSSARY: (abbreviations used in preceding Schedule of Investments) |
|
| Other Abbreviations: |
REIT | | Real Estate Investment Trust |
The accompanying notes are an integral part of these financial statements.
Schedule of Investments – (continued)
June 30, 2018 (Unaudited)
Fair Valuation Summary
The following is a summary of the fair valuations according to the inputs used as of June 30, 2018 in valuing the Fund’s investments.
| | | | | | | | | | | | | | | | |
| | | Total | | | Level 1(1) | | | Level 2(1) | | | Level 3(1) | |
Assets | | | | | | | | | | | | | | | | |
Common Stocks | | | | | | | | | | | | | | | | |
Banks | | $ | 32,910,495 | | | $ | 32,910,495 | | | $ | — | | | $ | — | |
Capital Goods | | | 156,712,767 | | | | 156,712,767 | | | | — | | | | — | |
Consumer Durables & Apparel | | | 87,673,272 | | | | 87,673,272 | | | | — | | | | — | |
Consumer Services | | | 53,328,797 | | | | 53,328,797 | | | | — | | | | — | |
Diversified Financials | | | 62,873,073 | | | | 62,873,073 | | | | — | | | | — | |
Energy | | | 45,509,266 | | | | 45,509,266 | | | | — | | | | — | |
Food & Staples Retailing | | | 58,920,681 | | | | 58,920,681 | | | | — | | | | — | |
Food, Beverage & Tobacco | | | 111,494,339 | | | | 79,224,827 | | | | 32,269,512 | | | | — | |
Health Care Equipment & Services | | | 140,514,068 | | | | 140,514,068 | | | | — | | | | — | |
Household & Personal Products | | | 49,748,258 | | | | 49,748,258 | | | | — | | | | — | |
Insurance | | | 71,300,535 | | | | 71,300,535 | | | | — | | | | — | |
Materials | | | 60,961,691 | | | | 60,961,691 | | | | — | | | | — | |
Pharmaceuticals, Biotechnology & Life Sciences | | | 81,192,710 | | | | 81,192,710 | | | | — | | | | — | |
Real Estate | | | 78,719,075 | | | | 78,719,075 | | | | — | | | | — | |
Retailing | | | 61,468,245 | | | | 57,125,799 | | | | — | | | | 4,342,446 | |
Software & Services | | | 150,564,891 | | | | 150,564,891 | | | | — | | | | — | |
Transportation | | | 120,543,929 | | | | 120,543,929 | | | | — | | | | — | |
Short-Term Investments | | | 21,840,468 | | | | 21,840,468 | | | | — | | | | — | |
| | | | | | | | | | | | | | | | |
Total | | $ | 1,446,276,560 | | | $ | 1,409,664,602 | | | $ | 32,269,512 | | | $ | 4,342,446 | |
| | | | | | | | | | | | | | | | |
| (1) | For the six-month period ended June 30, 2018, there were no transfers between any levels. |
Level 3 investments at the beginning and/or end of the period in relation to net assets were not significant and accordingly, a Reconciliation of Level 3 assets for the period ended June 30, 2018 is not presented.
The accompanying notes are an integral part of these financial statements.
|
| Hartford Total Return Bond HLS Fund |
Schedule of Investments
June 30, 2018 (Unaudited)
| | | | | | | | | | | | |
| Shares or Principal Amount | | Market Value† | |
| ASSET & COMMERCIAL MORTGAGE BACKED SECURITIES - 35.7% | |
| | | | Asset-Backed - Automobile - 0.6% | |
| | $ | | | | 1,115,319 | | | CIG Automobile Receivables Trust
2.71%, 05/15/2023(1) | | $ | 1,108,117 | |
| | | | | 2,625,000 | | | Credit Acceptance Auto Loan Trust
2.65%, 06/15/2026(1) | | | 2,595,364 | |
| | | | | 969,382 | | | First Investors Auto Owner Trust
2.39%, 11/16/2020(1) | | | 968,909 | |
| | | | | 799,020 | | | Honor Automobile Trust Securitization
2.94%, 11/15/2019(1) | | | 799,116 | |
| | | | | 3,758,762 | | | Skopos Auto Receivables Trust
3.19%, 09/15/2021(1) | | | 3,759,616 | |
| | | | | 4,810,000 | | | Westlake Automobile Receivables Trust
3.28%, 12/15/2022(1) | | | 4,780,113 | |
| | | | | | | | | | | | |
| | | | | | | | | | | 14,011,235 | |
| | | | | | | | | | | | |
| | | | | | | Asset-Backed - Finance & Insurance - 20.1% | |
| | | | | 9,180,000 | | | AMMC CLO Ltd.
3 mo. USD LIBOR + 1.250%, 3.61%, 07/25/2029(1)(2) | | | 9,184,911 | |
| | | | | 9,215,000 | | | Apex Credit CLO Ltd.
3 mo. USD LIBOR + 1.470%, 3.83%, 04/24/2029(1)(2) | | | 9,248,865 | |
| | | | | 4,478,506 | | | Apidos CLO
3 mo. USD LIBOR + 0.980%, 3.34%, 01/19/2025(1)(2) | | | 4,476,141 | |
| | | | | 4,560,000 | | | Atlas Senior Loan Fund X Ltd.
3 mo. USD LIBOR + 1.090%, 3.44%, 01/15/2031(1)(2) | | | 4,553,552 | |
| | | | Atrium CDO Corp. | |
| | | | | 6,700,000 | | | 3 mo. USD LIBOR + 0.830%, 3.19%, 04/22/2027(1)(2) | | | 6,697,086 | |
| | | | | 673,085 | | | 3 mo. USD LIBOR + 0.950%, 3.30%, 07/16/2025(1)(2) | | | 672,846 | |
| | | | Avery Point CLO Ltd. | |
| | | | | 10,050,000 | | | 3 mo. USD LIBOR + 1.100%, 3.46%, 04/25/2026(1)(2) | | | 10,046,131 | |
| | | | | 5,601,322 | | | 3 mo. USD LIBOR + 1.120%, 3.48%, 01/18/2025(1)(2) | | | 5,599,215 | |
| | | | | 2,330,000 | | | Babson CLO Ltd.
3 mo. USD LIBOR + 1.150%, 3.51%, 07/20/2025(1)(2) | | | 2,328,963 | |
| | | | Bayview Opportunity Master Fund Trust | |
| | | | | 3,498,103 | | | 2.98%, 10/28/2032(1)(3) | | | 3,479,577 | |
| | | | | 497,151 | | | 3.11%, 09/28/2032(1)(3) | | | 495,181 | |
| | | | | 3,802,921 | | | 3.35%, 11/28/2032(1)(3) | | | 3,783,902 | |
| | | | | 3,274,702 | | | 3.50%, 01/28/2055(1)(4) | | | 3,268,620 | |
| | | | | 3,808,252 | | | 3.50%, 06/28/2057(1)(4) | | | 3,800,661 | |
| | | | | 7,450,617 | | | 3.50%, 07/28/2057(1)(4) | | | 7,431,202 | |
| | | | | 4,964,311 | | | 3.50%, 01/28/2058(1)(4) | | | 4,956,007 | |
| | | | | 3,208,009 | | | 3.60%, 02/25/2033(1)(3) | | | 3,210,932 | |
| | | | | 2,856,095 | | | 4.00%, 11/28/2053(1)(4) | | | 2,882,859 | |
| | | | | 5,615,820 | | | 4.00%, 10/28/2064(1)(4) | | | 5,664,902 | |
| | | | | 840,000 | | | Benefit Street Partners CLO Ltd.
3 mo. USD LIBOR + 0.800%, 3.16%, 10/18/2029(1)(2) | | | 839,580 | |
| | | | BlueMountain CLO Ltd. | |
| | | | | 6,547,100 | | | 3 mo. USD LIBOR + 1.010%, 3.36%, 04/15/2025(1)(2) | | | 6,543,840 | |
| | | | | 7,372,821 | | | 3 mo. USD LIBOR + 1.260%, 3.62%, 04/30/2026(1)(2) | | | 7,369,724 | |
| | | | | 886,167 | | | Cal Funding Ltd.
3.47%, 10/25/2027(1) | | | 877,865 | |
| | | | | | | | | | | | |
| Shares or Principal Amount | | Market Value† | |
ASSET & COMMERCIAL MORTGAGE BACKED SECURITIES - 35.7% -
(continued) | |
| | | | | | | Asset-Backed - Finance & Insurance - 20.1% - (continued) | |
| | $ | | | | 7,890,000 | | | Carlyle Global Market Strategies CLO Ltd.
1 mo. USD LIBOR + 0.780%, 3.15%, 04/27/2027(1)(2) | | $ | 7,855,765 | |
| | | | | 7,305,000 | | | CBAM Ltd.
3 mo. USD LIBOR + 1.230%, 3.58%, 10/17/2029(1)(2) | | | 7,312,356 | |
| | | | Cent CLO Ltd. | |
| | | | | 8,980,014 | | | 3 mo. USD LIBOR + 1.100%, 3.46%, 01/25/2026(1)(2) | | | 8,978,155 | |
| | | | | 6,240,000 | | | 3 mo. USD LIBOR + 1.210%, 3.58%, 07/27/2026(1)(2) | | | 6,236,868 | |
| | | | CIFC Funding Ltd. | |
| | | | | 8,960,000 | | | 3 mo. USD LIBOR + 1.050%, 3.16%, 04/24/2030(1)(2) | | | 8,908,650 | |
| | | | | 646,273 | | | 3 mo. USD LIBOR + 0.850%, 3.20%, 07/16/2030(1)(2) | | | 646,240 | |
| | | | | 6,935,000 | | | 3 mo. USD LIBOR + 1.500%, 3.86%, 07/22/2026(1)(2) | | | 6,929,306 | |
| | | | | 1,821,537 | | | Civic Mortgage LLC
3.89%, 06/25/2022(1)(3) | | | 1,821,115 | |
| | | | | 514,926 | | | Conn’s Receivables Funding LLC
2.73%, 07/15/2020(1) | | | 514,846 | |
| | | | | 2,130,000 | | | Covenant Credit Partners CLO Ltd.
3 mo. USD LIBOR + 1.850%, 4.20%, 10/15/2029(1)(2) | | | 2,141,308 | |
| | | | | 3,275,000 | | | Domino’s Pizza Master Issuer LLC
4.12%, 07/25/2048(1) | | | 3,309,420 | |
| | | | Dryden Senior Loan Fund | |
| | | | | 7,264,000 | | | 3 mo. USD LIBOR + 0.820%,
3.16%, 11/15/2028(1)(2) | | | 7,223,264 | |
| | | | | 6,710,000 | | | 3 mo. USD LIBOR + 1.430%,
3.78%, 07/15/2027(1)(2) | | | 6,707,933 | |
| | | | | 7,852,000 | | | 3 mo. USD LIBOR + 1.430%,
3.78%, 10/15/2028(1)(2) | | | 7,869,518 | |
| | | | | 1,324,478 | | | Fieldstone Mortgage Investment Corp.
1 mo. USD LIBOR + 0.270%,
2.36%, 05/25/2036(2) | | | 1,017,422 | |
| | | | | 3,267,261 | | | First Franklin Mortgage Loan Trust
1 mo. USD LIBOR + 0.240%,
2.33%, 04/25/2036(2) | | | 2,854,369 | |
| | | | | 262,683 | | | GreatAmerica Leasing Receivables Funding LLC
1.72%, 04/22/2019(1) | | | 262,307 | |
| | | | | 3,603,282 | | | GSAMP Trust
1 mo. USD LIBOR + 0.090%,
2.18%, 01/25/2037(2) | | | 2,445,510 | |
| | | | | 2,295,000 | | | Highbridge Loan Management Ltd.
3 mo. USD LIBOR + 1.000%,
3.36%, 02/05/2031(1)(2) | | | 2,292,019 | |
| | | | | 4,578,000 | | | LCM Ltd.
3 mo. USD LIBOR + 1.210%,
3.57%, 07/20/2030(1)(2) | | | 4,589,509 | |
| | | | Lendmark Funding Trust | |
| | | | | 3,235,000 | | | 2.83%, 12/22/2025(1) | | | 3,202,599 | |
| | | | | 4,590,000 | | | 3.26%, 04/21/2025(1) | | | 4,595,677 | |
| | | | Madison Park Funding Ltd. | |
| | | | | 7,200,000 | | | 3 mo. USD LIBOR + 1.160%,
3.52%, 07/23/2029(1)(2) | | | 7,197,509 | |
| | | | | 3,582,000 | | | 3 mo. USD LIBOR + 1.190%,
3.55%, 10/21/2030(1)(2) | | | 3,586,993 | |
The accompanying notes are an integral part of these financial statements.
|
| Hartford Total Return Bond HLS Fund |
Schedule of Investments – (continued)
June 30, 2018 (Unaudited)
| | | | | | | | | | | | |
| Shares or Principal Amount | | Market Value† | |
ASSET & COMMERCIAL MORTGAGE BACKED SECURITIES - 35.7% -
(continued) | |
| | | | | | | Asset-Backed - Finance & Insurance - 20.1% - (continued) | |
| | $ | | | | 9,860,000 | | | 3 mo. USD LIBOR + 1.260%,
3.62%, 07/20/2026(1)(2) | | $ | 9,856,963 | |
| | | | Magnetite CLO Ltd. | |
| | | | | 8,310,000 | | | 3 mo. USD LIBOR + 1.000%,
3.36%, 07/25/2026(1)(2) | | | 8,299,712 | |
| | | | | 6,595,000 | | | 3 mo. USD LIBOR + 1.500%,
3.86%, 07/25/2026(1)(2) | | | 6,590,318 | |
| | | | | 1,803,656 | | | Marlette Funding Trust
2.36%, 12/15/2024(1) | | | 1,796,214 | |
| | | | | 5,611,745 | | | MFA Trust
3.35%, 11/25/2047(1)(3) | | | 5,567,103 | |
| | | | Nationstar HECM Loan Trust | |
| | | | | 664,192 | | | 1.97%, 05/25/2027(1) | | | 661,934 | |
| | | | | 1,291,477 | | | 2.04%, 09/25/2027(1)(4) | | | 1,286,100 | |
| | | | | 560,000 | | | 2.94%, 05/25/2027(1) | | | 555,615 | |
| | | | NRZ Advance Receivables Trust | |
| | | | | 6,250,000 | | | 3.11%, 12/15/2050(1) | | | 6,243,978 | |
| | | | | 5,421,000 | | | 3.21%, 02/15/2051(1) | | | 5,381,753 | |
| | | | NRZ Excess Spread-Collateralized Notes | |
| | | | | 5,176,734 | | | 3.19%, 01/25/2023(1) | | | 5,141,648 | |
| | | | | 3,182,084 | | | 3.27%, 02/25/2023(1) | | | 3,168,601 | |
| | | | | 2,190,899 | | | Oak Hill Advisors Residential Loan Trust
3.00%, 06/25/2057(1)(3) | | | 2,170,512 | |
| | | | | 3,030,000 | | | Oak Hill Credit Partners Ltd.
3 mo. USD LIBOR + 1.130%,
3.49%, 07/20/2026(1)(2) | | | 3,028,421 | |
| | | | | 2,495,000 | | | Oaktree EIF Ltd.
3 mo. USD LIBOR + 1.450%,
3.80%, 07/17/2029(1)(2) | | | 2,493,406 | |
| | | | | 6,780,000 | | | OCP CLO Ltd.
3 mo. USD LIBOR + 0.850%,
3.20%, 04/17/2027(1)(2) | | | 6,760,501 | |
| | | | | 3,715,000 | | | Octagon Investment Partners Ltd.
3 mo. USD LIBOR + 1.320%,
3.68%, 03/17/2030(1)(2) | | | 3,734,266 | |
| | | | OneMain Financial Issuance Trust | |
| | | | | 7,814,000 | | | 2.37%, 09/14/2032(1) | | | 7,661,264 | |
| | | | | 6,299,137 | | | 4.10%, 03/20/2028(1) | | | 6,336,921 | |
| | | | | 7,495,000 | | | OZLM Ltd.
3 mo. USD LIBOR + 1.450%,
3.81%, 04/30/2027(1)(2) | | | 7,492,407 | |
| | | | Pretium Mortgage Credit Partners LLC | |
| | | | | 1,074,753 | | | 3.33%, 12/30/2032(1)(4) | | | 1,070,049 | |
| | | | | 1,268,281 | | | 3.38%, 01/27/2033(1)(3) | | | 1,257,614 | |
| | | | | 1,788,660 | | | Prosper Marketplace Issuance Trust
2.36%, 11/15/2023(1) | | | 1,781,380 | |
| | | | | 5,250,000 | | | SBA Tower Trust
2.90%, 10/15/2044(1)(3) | | | 5,216,729 | |
| | | | | 463,660 | | | Securitized Asset Backed Receivables LLC Trust
1 mo. USD LIBOR + 0.090%,
2.18%, 07/25/2036(2) | | | 228,831 | |
| | | | | 7,305,000 | | | Shackleton CLO Ltd.
3 mo. USD LIBOR + 1.160%,
3.51%, 07/17/2026(1)(2) | | | 7,302,874 | |
| | | | SoFi Consumer Loan Program LLC | |
| | | | | 1,789,314 | | | 2.50%, 05/26/2026(1) | | | 1,766,668 | |
| | | | | 916,834 | | | 2.77%, 05/25/2026(1) | | | 909,469 | |
| | | | | 2,175,373 | | | 3.05%, 12/26/2025(1) | | | 2,168,583 | |
| | | | | 1,929,564 | | | 3.09%, 10/27/2025(1) | | | 1,926,107 | |
| | | | | | | | | | | | |
| Shares or Principal Amount | | Market Value† | |
ASSET & COMMERCIAL MORTGAGE BACKED SECURITIES - 35.7% -
(continued) | |
| | | | | | | Asset-Backed - Finance & Insurance - 20.1% - (continued) | |
| | $ | | | | 1,627,961 | | | 3.28%, 01/26/2026(1) | | $ | 1,626,588 | |
| | | | Sound Point CLO Ltd. | |
| | | | | 5,015,000 | | | 1 mo. USD LIBOR + 1.150%,
3.65%, 04/18/2031(1)(2) | | | 4,988,817 | |
| | | | | 2,575,000 | | | 3 mo. USD LIBOR + 1.390%,
3.75%, 01/23/2029(1)(2) | | | 2,581,731 | |
| | | | Springleaf Funding Trust | |
| | | | | 8,130,000 | | | 2.68%, 07/15/2030(1) | | | 7,996,262 | |
| | | | | 4,985,000 | | | 2.90%, 11/15/2029(1) | | | 4,959,315 | |
| | | | | 5,340,000 | | | SPS Servicer Advance Receivables Trust
2.75%, 11/15/2049(1) | | | 5,388,621 | |
| | | | | 8,660,000 | | | Symphony CLO Ltd.
3 mo. USD LIBOR + 1.280%,
3.63%, 07/14/2026(1)(2) | | | 8,657,315 | |
| | | | Towd Point Mortgage Trust | |
| | | | | 9,104,309 | | | 2.75%, 10/25/2056(1)(4) | | | 8,913,405 | |
| | | | | 2,358,577 | | | 2.75%, 04/25/2057(1)(4) | | | 2,319,866 | |
| | | | | 6,163,432 | | | 2.75%, 06/25/2057(1)(4) | | | 6,015,089 | |
| | | | | 4,427,725 | | | 2.75%, 07/25/2057(1)(4) | | | 4,332,956 | |
| | | | | 7,660,000 | | | Treman Park CLO Ltd.
3 mo. USD LIBOR + 1.370%,
3.73%, 04/20/2027(1)(2) | | | 7,658,070 | |
| | | | | 2,742,060 | | | U.S. Residential Opportunity Fund Trust
3.35%, 11/27/2037(1)(3) | | | 2,729,560 | |
| | | | | 7,072,867 | | | VOLT LLC
3.38%, 10/25/2047(1)(3) | | | 7,040,365 | |
| | | | | 1,609,659 | | | VOLT LX LLC
3.25%, 06/25/2047(1)(3) | | | 1,600,674 | |
| | | | | 1,393,924 | | | VOLT LXII LLC
3.13%, 09/25/2047(1)(3) | | | 1,380,501 | |
| | | | | 2,587,154 | | | VOLT LXIII LLC
3.00%, 10/25/2047(1)(3) | | | 2,558,716 | |
| | | | | 3,965,278 | | | VOLT LXVI
4.34%, 05/25/2048(1)(3) | | | 3,963,592 | |
| | | | Voya CLO Ltd. | |
| | | | | 7,550,000 | | | 3 mo. USD LIBOR + 0.900%,
3.26%, 01/18/2029(1)(2) | | | 7,535,859 | |
| | | | | 4,835,000 | | | 1 mo. USD LIBOR + 0.990%,
3.35%, 04/18/2031(1)(2) | | | 4,814,519 | |
| | | | | 2,915,000 | | | 3 mo. USD LIBOR + 1.250%,
3.60%, 04/17/2030(1)(2) | | | 2,918,781 | |
| | | | | 2,670,000 | | | 3 mo. USD LIBOR + 1.250%,
3.61%, 01/18/2029(1)(2) | | | 2,638,836 | |
| | | | | 2,069,600 | | | Wendy’s Funding LLC
3.88%, 03/15/2048(1) | | | 2,025,000 | |
| | | | | 10,785,000 | | | York CLO Ltd.
3 mo. USD LIBOR + 1.630%,
2.73%, 01/20/2030(1)(2) | | | 10,924,515 | |
| | | | | | | | | | | | |
| | | | | | | | | | | 449,336,114 | |
| | | | | | | | | | | | |
| | | | | | | Asset-Backed - Home Equity - 2.3% | |
| | | | GSAA Home Equity Trust | |
| | | | | 6,336,052 | | | 1 mo. USD LIBOR + 0.080%,
2.17%, 02/25/2037(2) | | | 3,334,011 | |
| | | | | 3,730,909 | | | 1 mo. USD LIBOR + 0.100%,
2.19%, 03/25/2037(2) | | | 1,854,904 | |
| | | | | 2,719,830 | | | 1 mo. USD LIBOR + 0.180%,
2.27%, 11/25/2036(2) | | | 1,349,211 | |
| | | | | 120,327 | | | 1 mo. USD LIBOR + 0.240%,
2.33%, 11/25/2036(2) | | | 71,536 | |
The accompanying notes are an integral part of these financial statements.
|
| Hartford Total Return Bond HLS Fund |
Schedule of Investments – (continued)
June 30, 2018 (Unaudited)
| | | | | | | | | | | | |
| Shares or Principal Amount | | Market Value† | |
ASSET & COMMERCIAL MORTGAGE BACKED SECURITIES - 35.7% -
(continued) | |
| | | | | | | Asset-Backed - Home Equity - 2.3% - (continued) | |
| | $ | | | | 662,397 | | | 5.99%, 06/25/2036(4) | | $ | 324,373 | |
| | | | | 7,808,741 | | | Legacy Mortgage Asset Trust
4.00%, 03/25/2058(1)(3) | | | 7,832,123 | |
| | | | | 176,747 | | | Morgan Stanley Asset-Backed Securities Capital, Inc. Trust
1 mo. USD LIBOR + 0.150%,
2.24%, 06/25/2036(2) | | | 151,055 | |
| | | | | 1,526,549 | | | Morgan Stanley Mortgage Loan Trust
1 mo. USD LIBOR + 0.170%,
2.26%, 11/25/2036(2) | | | 687,477 | |
| | | | New Residential Mortgage Loan Trust | |
| | | | | 6,665,863 | | | 1 mo. USD LIBOR + 1.500%,
3.59%, 06/25/2057(1)(2) | | | 6,844,367 | |
| | | | | 8,743,568 | | | 4.00%, 02/25/2057(1)(4) | | | 8,816,037 | |
| | | | | 7,255,030 | | | 4.00%, 08/27/2057(1)(4) | | | 7,320,129 | |
| | | | | 3,060,518 | | | 4.00%, 12/25/2057(1)(4) | | | 3,079,971 | |
| | | | | 6,531,000 | | | NRZ Advance Receivables Trust
2.58%, 10/15/2049(1) | | | 6,469,976 | |
| | | | Soundview Home Loan Trust | |
| | | | | 3,095,388 | | | 1 mo. USD LIBOR + 0.180%,
2.27%, 07/25/2037(2) | | | 2,687,249 | |
| | | | | 435,000 | | | 1 mo. USD LIBOR + 0.250%,
2.34%, 11/25/2036(2) | | | 393,275 | |
| | | | | | | | | | | | |
| | | | 51,215,694 | |
| | | | | | | | | | | | |
| | | | Collateralized - Mortgage Obligations - 0.3% | |
| | | | | 1,955,683 | | | COLT Mortgage Loan Trust
2.61%, 05/27/2047(1)(4) | | | 1,948,493 | |
| | | | | 3,571,616 | | | Consumer Loan Underlying Bond Credit Trust
2.61%, 01/15/2024(1) | | | 3,558,083 | |
| | | | | | | | | | | | |
| | | | 5,506,576 | |
| | | | | | | | | | | | |
| | | | Commercial Mortgage-Backed Securities - 6.1% | |
| | | | Banc of America Commercial Mortgage Trust | |
| | | | | 40,006,920 | | | 0.89%, 11/15/2050(4)(5) | | | 2,254,402 | |
| | | | | 4,722,098 | | | 0.96%, 11/15/2054(4)(5) | | | 283,469 | |
| | | | BBCMS Mortgage Trust | |
| | | | | 28,957,615 | | | 1.69%, 02/15/2050(4)(5) | | | 2,809,091 | |
| | | | | 8,553,000 | | | 1 mo. USD LIBOR + 0.850%,
2.92%, 08/15/2036(1)(2) | | | 8,552,919 | |
| | | | | 1,440,000 | | | 3.67%, 02/15/2050 | | | 1,426,159 | |
| | | | Benchmark Mortgage Trust | |
| | | | | 12,016,433 | | | 0.67%, 01/15/2051(4)(5) | | | 475,010 | |
| | | | | 20,356,000 | | | 0.70%, 07/15/2051 | | | 808,192 | |
| | | | CFCRE Commercial Mortgage Trust | |
| | | | | 1,145,000 | | | 3.57%, 06/15/2050 | | | 1,129,058 | |
| | | | | 1,000,000 | | | 3.84%, 12/10/2054 | | | 1,002,204 | |
| | | | Citigroup Commercial Mortgage Trust | |
| | | | | 23,803,580 | | | 1.19%, 07/10/2047(4)(5) | | | 1,148,016 | |
| | | | | 26,450,503 | | | 1.25%, 04/10/2048(4)(5) | | | 1,396,489 | |
| | | | | 3,074,752 | | | 2.94%, 10/10/2049 | | | 2,916,779 | |
| | | | | 975,000 | | | 3.62%, 02/10/2049 | | | 973,255 | |
| | | | | 1,040,000 | | | 3.76%, 06/10/2048 | | | 1,049,531 | |
| | | | | 970,000 | | | 3.82%, 11/10/2048 | | | 981,458 | |
| | | | Commercial Mortgage Pass-Through Certificates | |
| | | | | 9,371,739 | | | 0.88%, 02/10/2047(4)(5) | | | 227,186 | |
| | | | | 535,000 | | | 4.24%, 02/10/2047(4) | | | 554,900 | |
| | | | Commercial Mortgage Trust | |
| | | | | 4,473,689 | | | 0.95%, 08/10/2046(4)(5) | | | 128,687 | |
| | | | | | | | | | | | |
| Shares or Principal Amount | | Market Value† | |
ASSET & COMMERCIAL MORTGAGE BACKED SECURITIES - 35.7% -
(continued) | |
| | | | Commercial Mortgage-Backed Securities - 6.1% - (continued) | |
| | $ | | | | 6,884,413 | | | 2.08%, 07/10/2046(1)(4)(5) | | $ | 218,203 | |
| | | | | 1,035,000 | | | 2.54%, 12/10/2045 | | | 1,004,917 | |
| | | | | 960,889 | | | 2.82%, 10/15/2045 | | | 941,807 | |
| | | | | 1,670,000 | | | 2.85%, 10/15/2045 | | | 1,626,208 | |
| | | | | 1,145,000 | | | 3.10%, 03/10/2046 | | | 1,133,383 | |
| | | | | 930,000 | | | 3.21%, 03/10/2046 | | | 924,281 | |
| | | | | 1,760,000 | | | 3.35%, 02/10/2048 | | | 1,739,791 | |
| | | | | 6,780,000 | | | 3.42%, 03/10/2031(1) | | | 6,827,345 | |
| | | | | 1,260,000 | | | 3.61%, 06/10/2046(4) | | | 1,273,337 | |
| | | | | 705,000 | | | 3.62%, 07/10/2050 | | | 701,331 | |
| | | | | 2,120,000 | | | 3.69%, 08/10/2047 | | | 2,135,781 | |
| | | | | 1,490,000 | | | 3.77%, 02/10/2049 | | | 1,490,289 | |
| | | | | 1,150,133 | | | 3.80%, 08/10/2047 | | | 1,165,776 | |
| | | | | 1,485,000 | | | 3.83%, 07/15/2047 | | | 1,508,087 | |
| | | | | 1,140,000 | | | 3.90%, 07/10/2050 | | | 1,151,797 | |
| | | | | 575,125 | | | 3.96%, 03/10/2047 | | | 587,720 | |
| | | | | 1,299,199 | | | 4.02%, 07/10/2045 | | | 1,335,367 | |
| | | | | 630,000 | | | 4.07%, 02/10/2047(4) | | | 648,561 | |
| | | | | 1,045,000 | | | 4.21%, 08/10/2046(4) | | | 1,084,677 | |
| | | | | 615,085 | | | 4.38%, 07/10/2045(4) | | | 640,519 | |
| | | | | 720,000 | | | 4.73%, 10/15/2045(1)(4) | | | 131,746 | |
| | | | | 1,920,000 | | | 4.75%, 10/15/2045(1)(4) | | | 913,728 | |
| | | | | 545,178 | | | Credit Suisse First Boston Mortgage Securities Corp.
4.88%, 04/15/2037 | | | 541,276 | |
| | | | CSAIL Commercial Mortgage Trust | |
| | | | | 63,316,577 | | | 0.97%, 06/15/2057(4)(5) | | | 2,624,523 | |
| | | | | 3,869,782 | | | 1.19%, 11/15/2048(4)(5) | | | 198,026 | |
| | | | | 11,445,019 | | | 1.96%, 01/15/2049(4)(5) | | | 1,105,439 | |
| | | | | 470,000 | | | 3.45%, 08/15/2048 | | | 465,021 | |
| | | | | 790,000 | | | 3.50%, 11/15/2049 | | | 774,382 | |
| | | | | 545,000 | | | 3.54%, 11/15/2048 | | | 541,816 | |
| | | | | 550,000 | | | 3.72%, 08/15/2048 | | | 551,976 | |
| | | | | 83,000 | | | 3.76%, 11/15/2048 | | | 83,404 | |
| | | | | 980,000 | | | 3.81%, 11/15/2048 | | | 987,876 | |
| | | | | 7,544,468 | | | DBUBS Mortgage Trust
0.90%, 11/10/2046(1)(4)(5) | | | 95,465 | |
| | | | | 3,061,582 | | | Four Times Square Trust Commercial Mortgage Pass-Through Certificates
5.40%, 12/13/2028(1) | | | 3,208,002 | |
| | | | FREMF Mortgage Trust | |
| | | | | 4,680,000 | | | 3.07%, 10/25/2047(1)(4) | | | 4,653,391 | |
| | | | | 785,000 | | | 3.80%, 11/25/2049(1)(4) | | | 766,543 | |
| | | | | 1,380,000 | | | 3.88%, 11/25/2050(1)(4) | | | 1,319,382 | |
| | | | | 5,485,000 | | | 5.44%, 09/25/2043(1)(4) | | | 5,698,362 | |
| | | | | 1,292,129 | | | GE Business Loan Trust
1 mo. USD LIBOR + 1.000%,
3.07%, 05/15/2034(1)(2) | | | 1,207,987 | |
| | | | | 4,340,000 | | | GS Mortgage Securities Corp.
2.95%, 11/05/2034(1) | | | 4,233,632 | |
| | | | GS Mortgage Securities Trust | |
| | | | | 46,230,160 | | | 0.12%, 07/10/2046(4)(5) | | | 195,077 | |
| | | | | 6,585,204 | | | 1.52%, 08/10/2044(1)(4)(5) | | | 219,603 | |
| | | | | 1,580,166 | | | 3.67%, 04/10/2047(1) | | | 613,436 | |
| | | | | 1,165,000 | | | 3.67%, 03/10/2050 | | | 1,161,080 | |
| | | | | 785,121 | | | 4.07%, 01/10/2047 | | | 808,382 | |
| | | | | 2,215,000 | | | 5.02%, 04/10/2047(1)(4) | | | 1,818,134 | |
| | | | JP Morgan Chase Commercial Mortgage Securities Trust | |
| | | | | 2,185,000 | | | 2.73%, 10/15/2045(1)(4) | | | 1,023,498 | |
The accompanying notes are an integral part of these financial statements.
|
| Hartford Total Return Bond HLS Fund |
Schedule of Investments – (continued)
June 30, 2018 (Unaudited)
| | | | | | | | | | | | |
| Shares or Principal Amount | | Market Value† | |
ASSET & COMMERCIAL MORTGAGE BACKED SECURITIES - 35.7% -
(continued) | |
| | | | Commercial Mortgage-Backed Securities - 6.1% - (continued) | |
| | $ | | | | 765,128 | | | 2.84%, 12/15/2047 | | $ | 748,793 | |
| | | | | 1,290,924 | | | 4.52%, 12/15/2047(1)(4) | | | 1,028,365 | |
| | | | JPMBB Commercial Mortgage Securities Trust | |
| | | | | 28,798,232 | | | 0.94%, 09/15/2047(4)(5) | | | 772,426 | |
| | | | | 7,795,663 | | | 0.97%, 05/15/2048(4)(5) | | | 251,557 | |
| | | | | 825,000 | | | 2.91%, 10/15/2048 | | | 795,874 | |
| | | | | 1,135,000 | | | 3.36%, 07/15/2045 | | | 1,134,796 | |
| | | | | 810,060 | | | 3.61%, 05/15/2048 | | | 810,640 | |
| | | | | 435 | | | LB-UBS Commercial Mortgage Trust
6.32%, 04/15/2041(4) | | | 436 | |
| | | | | 29,707 | | | Lehman Brothers Small Balance Commercial Mortgage Trust
5.52%, 09/25/2030(1)(4) | | | 29,886 | |
| | | | Morgan Stanley Bank of America Merrill Lynch Trust | |
| | | | | 1,573,819 | | | 1.23%, 10/15/2048(4)(5) | | | 92,750 | |
| | | | | 15,862,555 | | | 1.26%, 12/15/2047(4)(5) | | | 672,609 | |
| | | | | 1,530,000 | | | 3.13%, 12/15/2048 | | | 1,512,979 | |
| | | | | 1,320,000 | | | 3.18%, 08/15/2045 | | | 1,310,030 | |
| | | | | 795,172 | | | 4.26%, 10/15/2046(4) | | | 823,437 | |
| | | | Morgan Stanley Capital Trust | |
| | | | | 35,035,800 | | | 0.57%, 09/15/2047(1)(4)(5) | | | 268,455 | |
| | | | | 8,262,017 | | | 1.61%, 06/15/2050(4)(5) | | | 729,561 | |
| | | | | 625,000 | | | 2.78%, 08/15/2049 | | | 585,234 | |
| | | | | 590,000 | | | 3.34%, 12/15/2049 | | | 573,907 | |
| | | | | 4,920,000 | | | 3.47%, 08/11/2033(1) | | | 4,911,797 | |
| | | | | 770,000 | | | 3.60%, 12/15/2049 | | | 761,766 | |
| | | | | 920,000 | | | 5.31%, 10/12/2052(1)(4) | | | 77,931 | |
| | | | | 1,460,000 | | | 5.33%, 07/15/2049(1)(4) | | | 1,260,353 | |
| | | | | 790,000 | | | SFAVE Commercial Mortgage Securities Trust
3.87%, 01/05/2043(1)(4) | | | 748,154 | |
| | | | UBS Commercial Mortgage Trust | |
| | | | | 4,949,254 | | | 1.30%, 08/15/2050(4)(5) | | | 375,865 | |
| | | | | 850,000 | | | 3.43%, 08/15/2050 | | | 826,887 | |
| | | | UBS-Barclays Commercial Mortgage Trust | |
| | | | | 790,000 | | | 2.85%, 12/10/2045 | | | 773,473 | |
| | | | | 2,295,000 | | | 3.09%, 08/10/2049 | | | 2,274,054 | |
| | | | | 2,065,000 | | | 3.19%, 03/10/2046 | | | 2,047,848 | |
| | | | | 775,000 | | | 3.24%, 04/10/2046 | | | 770,018 | |
| | | | Wells Fargo Commercial Mortgage Trust | |
| | | | | 21,272,579 | | | 1.30%, 05/15/2048(4)(5) | | | 1,107,450 | |
| | | | | 1,166,593 | | | 2.92%, 10/15/2045 | | | 1,149,112 | |
| | | | | 419,000 | | | 2.92%, 11/15/2049 | | | 394,401 | |
| | | | | 345,000 | | | 2.94%, 10/15/2049 | | | 326,982 | |
| | | | | 805,000 | | | 3.29%, 05/15/2048 | | | 792,225 | |
| | | | | 440,000 | | | 3.41%, 12/15/2047 | | | 435,169 | |
| | | | | 775,000 | | | 3.45%, 07/15/2050 | | | 758,100 | |
| | | | | 790,000 | | | 3.56%, 01/15/2059 | | | 785,332 | |
| | | | | 1,145,000 | | | 3.62%, 09/15/2057 | | | 1,144,042 | |
| | | | | 445,000 | | | 3.79%, 09/15/2048 | | | 448,788 | |
| | | | | 430,000 | | | 4.24%, 05/15/2048(4) | | | 373,389 | |
| | | | WF-RBS Commercial Mortgage Trust | |
| | | | | 255,115 | | | 2.88%, 12/15/2045 | | | 250,208 | |
| | | | | 1,215,000 | | | 3.00%, 08/15/2045 | | | 1,201,854 | |
| | | | | 1,150,000 | | | 3.07%, 03/15/2045 | | | 1,137,032 | |
| | | | | 450,000 | | | 3.35%, 05/15/2045 | | | 442,017 | |
| | | | | 1,015,000 | | | 3.61%, 11/15/2047 | | | 1,016,760 | |
| | | | | 990,000 | | | 3.72%, 05/15/2047 | | | 1,002,746 | |
| | | | | 925,000 | | | 4.00%, 05/15/2047 | | | 949,562 | |
| | | | | | | | | | | | |
| Shares or Principal Amount | | Market Value† | |
ASSET & COMMERCIAL MORTGAGE BACKED SECURITIES - 35.7% -
(continued) | |
| | | | Commercial Mortgage-Backed Securities - 6.1% - (continued) | |
| | $ | | | | 230,000 | | | 4.05%, 03/15/2047 | | $ | 236,751 | |
| | | | | 755,286 | | | 4.10%, 03/15/2047 | | | 780,088 | |
| | | | | 1,095,000 | | | 4.15%, 08/15/2046(4) | | | 1,133,133 | |
| | | | | 710,000 | | | 5.00%, 06/15/2044(1)(4) | | | 482,852 | |
| | | | | 790,000 | | | 5.77%, 04/15/2045(1)(4) | | | 803,884 | |
| | | | | | | | | | | | |
| | | | 136,318,927 | |
| | | | | | | | | | | | |
| | | | Diversified Financial Services - 0.1% | |
| | | | | 1,716,000 | | | Barings CLO Ltd.
1 mo. USD LIBOR + 0.950%,
3.02%, 07/20/2029(1)(2) | | | 1,713,733 | |
| | | | | | | | | | | | |
| | | | Whole Loan Collateral CMO - 6.2% | |
| | | | Alternative Loan Trust | |
| | | | | 1,240,255 | | | 1 mo. USD LIBOR + 0.320%,
2.41%, 11/25/2035(2) | | | 1,118,988 | |
| | | | | 252,054 | | | 1 mo. USD LIBOR + 0.270%,
2.63%, 01/25/2036(2) | | | 242,650 | |
| | | | | 1,162,827 | | | 5.75%, 05/25/2036 | | | 876,927 | |
| | | | Angel Oak Mortgage Trust LLC | |
| | | | | 2,600,915 | | | 2.48%, 07/25/2047(1)(4) | | | 2,576,310 | |
| | | | | 2,076,329 | | | 2.71%, 11/25/2047(1)(4) | | | 2,062,459 | |
| | | | | 699,179 | | | 2.81%, 01/25/2047(1)(4) | | | 695,284 | |
| | | | Banc of America Funding Trust | |
| | | | | 1,582,590 | | | 1 mo. USD LIBOR + 0.300%,
2.38%, 05/20/2047(2) | | | 1,453,702 | |
| | | | | 4,749,292 | | | 5.77%, 05/25/2037(4) | | | 4,716,541 | |
| | | | | 175,433 | | | 5.85%, 01/25/2037(3) | | | 161,025 | |
| | | | | 1,069,895 | | | BCAP LLC Trust
1 mo. USD LIBOR + 0.180%,
2.27%, 03/25/2037(2) | | | 1,044,836 | |
| | | | | 518,875 | | | Bear Stearns Adjustable Rate Mortgage Trust
1 year USD CMT + 2.300%,
3.52%, 10/25/2035(2) | | | 524,654 | |
| | | | | 1,430,660 | | | Bear Stearns Alt-A Trust
1 mo. USD LIBOR + 0.500%,
2.59%, 01/25/2036(2) | | | 1,481,023 | |
| | | | | 494,145 | | | Bear Stearns Mortgage Funding Trust
1 mo. USD LIBOR + 0.180%,
2.27%, 10/25/2036(2) | | | 461,565 | |
| | | | CHL Mortgage Pass-Through Trust | |
| | | | | 597,632 | | | 3.34%, 11/20/2035(4) | | | 544,633 | |
| | | | | 2,992,284 | | | 3.47%, 09/25/2047(4) | | | 2,798,097 | |
| | | | | 6,989,518 | | | CIM Trust
3.00%, 04/25/2057(1)(4) | | | 6,913,091 | |
| | | | | 2,801,038 | | | COLT Mortgage Loan Trust
2.93%, 02/25/2048(1)(4) | | | 2,788,125 | |
| | | | | 2,317,687 | | | Credit Suisse First Boston Mortgage Securities Corp.
5.50%, 06/25/2035 | | | 2,261,893 | |
| | | | | 2,732,288 | | | CSMC Trust
3.25%, 04/25/2047(1)(4) | | | 2,668,183 | |
| | | | Deephaven Residential Mortgage Trust | |
| | | | | 1,832,318 | | | 2.45%, 06/25/2047(1)(4) | | | 1,805,858 | |
| | | | | 2,347,925 | | | 2.58%, 10/25/2047(1)(4) | | | 2,333,378 | |
| | | | | 1,094,205 | | | 2.73%, 12/26/2046(1)(4) | | | 1,089,574 | |
| | | | Fannie Mae Connecticut Avenue Securities | |
| | | | | 2,025,000 | | | 1 mo. USD LIBOR + 3.550%, 5.64%, 07/25/2029(2) | | | 2,199,782 | |
The accompanying notes are an integral part of these financial statements.
|
| Hartford Total Return Bond HLS Fund |
Schedule of Investments – (continued)
June 30, 2018 (Unaudited)
| | | | | | | | | | | | |
| Shares or Principal Amount | | Market Value† | |
ASSET & COMMERCIAL MORTGAGE BACKED SECURITIES - 35.7% -
(continued) | |
| | | | Whole Loan Collateral CMO - 6.2% - (continued) | |
| | $ | | | | 4,065,143 | | | 1 mo. USD LIBOR + 4.350%, 6.44%, 05/25/2029(2) | | $ | 4,522,466 | |
| | | | | 1,423,308 | | | 1 mo. USD LIBOR + 4.900%, 6.99%, 11/25/2024(2) | | | 1,628,190 | |
| | | | | 784,881 | | | 1 mo. USD LIBOR + 5.700%, 7.79%, 04/25/2028(2) | | | 913,543 | |
| | | | | 616,000 | | | 1 mo. USD LIBOR + 6.000%, 8.09%, 09/25/2028(2) | | | 728,611 | |
| | | | | 2,266,642 | | | Galton Funding Mortgage Trust
3.50%, 11/25/2057(1)(4) | | | 2,264,517 | |
| | | | | 38,437 | | | GMACM Mortgage Loan Trust
3.83%, 04/19/2036(4) | | | 35,866 | |
| | | | GSR Mortgage Loan Trust | |
| | | | | 1,412,164 | | | 1 mo. USD LIBOR + 0.300%, 2.39%, 01/25/2037(2) | | | 829,154 | |
| | | | | 2,597,017 | | | 3.73%, 01/25/2036(4) | | | 2,564,872 | |
| | | | HarborView Mortgage Loan Trust | |
| | | | | 1,199,326 | | | 1 mo. USD LIBOR + 0.190%, 2.28%, 01/19/2038(2) | | | 1,175,869 | |
| | | | | 4,395,553 | | | 1 mo. USD LIBOR + 0.240%, 2.33%, 12/19/2036(2) | | | 4,068,826 | |
| | | | | 1,391,490 | | | IndyMac Index Mortgage Loan Trust
3.53%, 03/25/2036(4) | | | 1,244,899 | |
| | | | | 361,478 | | | JP Morgan Mortgage Trust
3.75%, 04/25/2037(4) | | | 346,656 | |
| | | | | 1,479,872 | | | Lehman XS Trust
1 mo. USD LIBOR + 0.210%,
2.30%, 07/25/2046(2) | | | 1,425,064 | |
| | | | LSTAR Securities Investment Ltd. | |
| | | | | 1,901,123 | | | 1 mo. USD LIBOR + 1.650%,
0.04%, 11/01/2022(1)(2) | | | 1,894,189 | |
| | | | | 2,997,001 | | | 1 mo. USD LIBOR + 1.750%,
0.04%, 10/01/2022(1)(2) | | | 2,985,348 | |
| | | | | 2,412,910 | | | 1 mo. USD LIBOR + 1.550%,
3.53%, 02/01/2023(1)(2) | | | 2,385,837 | |
| | | | | 1,776,404 | | | 1 mo. USD LIBOR + 1.750%,
3.73%, 09/01/2022(1)(2) | | | 1,778,541 | |
| | | | | 637,405 | | | MASTR Adjustable Rate Mortgages Trust
3.92%, 11/21/2034(4) | | | 654,387 | |
| | | | | 1,804,712 | | | MFA Trust
2.59%, 02/25/2057(1)(4) | | | 1,770,168 | |
| | | | New Residential Mortgage Loan Trust | |
| | | | | 5,138,705 | | | 3.75%, 11/26/2035(1)(4) | | | 5,154,780 | |
| | | | | 4,566,545 | | | 3.75%, 11/25/2056(1)(4) | | | 4,570,864 | |
| | | | | 8,480,306 | | | 4.00%, 03/25/2057(1)(4) | | | 8,598,874 | |
| | | | | 6,872,208 | | | 4.00%, 04/25/2057(1)(4) | | | 6,938,650 | |
| | | | | 5,587,923 | | | 4.00%, 05/25/2057(1)(4) | | | 5,654,139 | |
| | | | | 1,590,546 | | | RBSGC Mortgage Loan Trust
6.25%, 01/25/2037 | | | 1,560,029 | |
| | | | Residential Accredit Loans, Inc. | |
| | | | | 3,675,964 | | | 2.82%, 11/25/2037(4) | | | 3,183,043 | |
| | | | | 943,909 | | | 6.00%, 12/25/2035 | | | 908,227 | |
| | | | | 1,765,000 | | | Structured Agency Credit Risk Trust
1 mo. USD LIBOR + 1.650%,
3.74%, 04/25/2043(1)(2) | | | 1,771,508 | |
| | | | Towd Point Mortgage Trust | |
| | | | | 4,211,550 | | | 2.25%, 04/25/2056(1)(4) | | | 4,113,538 | |
| | | | | 6,267,632 | | | 1 mo. USD LIBOR + 0.600%,
2.69%, 02/25/2057(1)(2) | | | 6,256,432 | |
| | | | | 1,014,864 | | | 2.75%, 02/25/2055(1)(4) | | | 1,002,488 | |
| | | | | | | | | | | | |
| Shares or Principal Amount | | Market Value† | |
ASSET & COMMERCIAL MORTGAGE BACKED SECURITIES - 35.7% -
(continued) | |
| | | | Whole Loan Collateral CMO - 6.2% - (continued) | |
| | $ | | | | 3,539,549 | | | 2.75%, 08/25/2055(1)(4) | | $ | 3,472,538 | |
| | | | | 815,514 | | | 3.00%, 03/25/2054(1)(4) | | | 809,656 | |
| | | | WaMu Mortgage Pass-Through Certificates Trust | |
| | | | | 3,900,875 | | | 12 mo. USD MTA + 0.820%, 2.28%, 12/25/2046(2) | | | 3,526,254 | |
| | | | | 806,125 | | | 1 mo. USD LIBOR + 0.420%, 2.51%, 06/25/2044(2) | | | 779,175 | |
| | | | | 1,477,039 | | | 3.57%, 06/25/2037(4) | | | 1,383,572 | |
| | | | Wells Fargo Commercial Mortgage Trust | |
| | | | | 45,939,743 | | | 1.31%, 09/15/2057(4)(5) | | | 2,280,141 | |
| | | | | 1,015,000 | | | 3.84%, 09/15/2058 | | | 1,028,210 | |
| | | | | | | | | | | | |
| | | | 139,027,699 | |
| | | | | | | | | | | | |
| | |
| | | | Total Asset & Commercial Mortgage Backed Securities
(cost $803,715,701) | | $ | 797,129,978 | |
| | | | | | | | | | | | |
| | | |
| | | | | | | | | | | | |
| CORPORATE BONDS - 28.0% | |
| | | | Aerospace/Defense - 0.2% | |
| | | | DAE Funding LLC | |
| | | | | 75,000 | | | 4.50%, 08/01/2022(1) | | | 72,750 | |
| | | | | 80,000 | | | 5.00%, 08/01/2024(1) | | | 76,840 | |
| | | | | 4,347,000 | | | Lockheed Martin Corp.
4.09%, 09/15/2052 | | | 4,091,901 | |
| | | | | 140,000 | | | United Technologies Corp.
2.80%, 05/04/2024 | | | 132,693 | |
| | | | | | | | | | | | |
| | | | 4,374,184 | |
| | | | | | | | | | | | |
| | | | Agriculture - 0.9% | |
| | | | Altria Group, Inc. | |
| | | | | 5,890,000 | | | 2.85%, 08/09/2022 | | | 5,750,903 | |
| | | | | 2,345,000 | | | 3.88%, 09/16/2046 | | | 2,060,493 | |
| | | | BAT Capital Corp. | |
| | | | | 1,415,000 | | | 2.30%, 08/14/2020(1) | | | 1,382,774 | |
| | | | | 2,200,000 | | | 4.39%, 08/15/2037(1) | | | 2,063,912 | |
| | | | | 2,010,000 | | | BAT International Finance plc
2.75%, 06/15/2020(1) | | | 1,988,076 | |
| | | | Imperial Brands Finance plc | |
| | | | | 1,420,000 | | | 2.05%, 07/20/2018(1) | | | 1,419,718 | |
| | | | | 1,950,000 | | | 2.95%, 07/21/2020(1) | | | 1,929,902 | |
| | | | | 1,300,000 | | | 3.75%, 07/21/2022(1) | | | 1,290,318 | |
| | | | | 2,640,000 | | | Reynolds American, Inc.
3.25%, 06/12/2020 | | | 2,637,290 | |
| | | | | | | | | | | | |
| | | | 20,523,386 | |
| | | | | | | | | | | | |
| | | �� | Airlines - 0.1% | |
| | | | Delta Air Lines, Inc. | |
| | | | | 1,425,000 | | | 3.63%, 03/15/2022 | | | 1,408,918 | |
| | | | | 1,310,000 | | | 3.80%, 04/19/2023 | | | 1,294,542 | |
| | | | | | | | | | | | |
| | | | 2,703,460 | |
| | | | | | | | | | | | |
| | | | Auto Manufacturers - 0.3% | |
| | | | | 1,175,000 | | | Ford Motor Co.
5.29%, 12/08/2046 | | | 1,088,910 | |
| | | | General Motors Co. | |
| | | | | 2,220,000 | | | 5.40%, 04/01/2048 | | | 2,109,098 | |
| | | | | 1,000,000 | | | 6.25%, 10/02/2043 | | | 1,036,305 | |
| | | | | 1,035,000 | | | 6.75%, 04/01/2046 | | | 1,146,614 | |
| | | | General Motors Financial Co., Inc. | |
| | | | | 500,000 | | | 3.70%, 05/09/2023 | | | 490,528 | |
The accompanying notes are an integral part of these financial statements.
|
| Hartford Total Return Bond HLS Fund |
Schedule of Investments – (continued)
June 30, 2018 (Unaudited)
| | | | | | | | | | | | |
| Shares or Principal Amount | | Market Value† | |
| CORPORATE BONDS - 28.0% - (continued) | |
| | | | Auto Manufacturers - 0.3% - (continued) | |
| | $ | | | | 1,760,000 | | | 3.95%, 04/13/2024 | | $ | 1,722,348 | |
| | | | | | | | | | | | |
| | | | 7,593,803 | |
| | | | | | | | | | | | |
| | | | Auto Parts & Equipment - 0.0% | |
| | | | | 450,000 | | | Adient Global Holdings Ltd.
4.88%, 08/15/2026(1) | | | 403,875 | |
| | | | | 290,000 | | | Goodyear Tire & Rubber Co.
5.00%, 05/31/2026 | | | 269,700 | |
| | | | | | | | | | | | |
| | | | 673,575 | |
| | | | | | | | | | | | |
| | | | Beverages - 0.8% | |
| | | | Anheuser-Busch InBev Finance, Inc. | |
| | | | | 3,090,000 | | | 3.30%, 02/01/2023 | | | 3,064,163 | |
| | | | | 125,000 | | | 3.65%, 02/01/2026 | | | 122,368 | |
| | | | | 70,000 | | | 4.70%, 02/01/2036 | | | 70,948 | |
| | | | | 310,000 | | | 4.90%, 02/01/2046 | | | 318,797 | |
| | | | Anheuser-Busch InBev Worldwide, Inc. | |
| | | | | 1,385,000 | | | 3.50%, 01/12/2024 | | | 1,376,447 | |
| | | | | 2,120,000 | | | 3.75%, 07/15/2042 | | | 1,864,399 | |
| | | | | 1,580,000 | | | 4.60%, 04/15/2048 | | | 1,556,702 | |
| | | | | 2,035,000 | | | 4.75%, 04/15/2058 | | | 1,987,726 | |
| | | | Constellation Brands, Inc. | |
| | | | | 2,295,000 | | | 2.65%, 11/07/2022 | | | 2,199,545 | |
| | | | | 380,000 | | | 2.70%, 05/09/2022 | | | 367,286 | |
| | | | | 1,490,000 | | | 3.60%, 02/15/2028 | | | 1,408,396 | |
| | | | | 245,000 | | | 4.50%, 05/09/2047 | | | 233,171 | |
| | | | | 2,003,000 | | | 4.75%, 12/01/2025 | | | 2,073,506 | |
| | | | | | | | | | | | |
| | | | 16,643,454 | |
| | | | | | | | | | | | |
| | | | Biotechnology - 0.4% | |
| | | | | 1,815,000 | | | Amgen, Inc.
2.65%, 05/11/2022 | | | 1,757,692 | |
| | | | | 1,065,000 | | | Celgene Corp.
4.63%, 05/15/2044 | | | 988,561 | |
| | | | Gilead Sciences, Inc. | |
| | | | | 835,000 | | | 3.25%, 09/01/2022 | | | 830,187 | |
| | | | | 4,490,000 | | | 4.15%, 03/01/2047 | | | 4,291,891 | |
| | | | | | | | | | | | |
| | | | 7,868,331 | |
| | | | | | | | | | | | |
| | | | Chemicals - 0.5% | |
| | | | | 440,000 | | | CF Industries, Inc.
4.95%, 06/01/2043 | | | 371,800 | |
| | | | | 290,000 | | | Chemours Co.
5.38%, 05/15/2027 | | | 280,575 | |
| | | | | 1,080,000 | | | LyondellBasell Industries N.V.
4.63%, 02/26/2055 | | | 998,437 | |
| | | | Methanex Corp. | |
| | | | | 1,590,000 | | | 4.25%, 12/01/2024 | | | 1,561,983 | |
| | | | | 625,000 | | | 5.65%, 12/01/2044 | | | 607,258 | |
| | | | | 290,000 | | | Olin Corp.
5.13%, 09/15/2027 | | | 282,025 | |
| | | | Sherwin-Williams Co. | |
| | | | | 875,000 | | | 3.13%, 06/01/2024 | | | 835,738 | |
| | | | | 1,830,000 | | | 3.45%, 06/01/2027 | | | 1,728,929 | |
| | | | Syngenta Finance N.V. | |
| | | | | 2,570,000 | | | 4.44%, 04/24/2023(1) | | | 2,555,612 | |
| | | | | 1,810,000 | | | 4.89%, 04/24/2025(1) | | | 1,774,665 | |
| | | | | 265,000 | | | Versum Materials, Inc.
5.50%, 09/30/2024(1) | | | 268,683 | |
| | | | | | | | | | | | |
| | | | 11,265,705 | |
| | | | | | | | | | | | |
| | | | | | | | | | | | |
| Shares or Principal Amount | | Market Value† | |
| CORPORATE BONDS - 28.0% - (continued) | |
| | | | Commercial Banks - 9.1% | |
| | | | Banco Bilbao Vizcaya Argentaria S.A. | |
| | $ | | | | 4,000,000 | | | 5 year USD Swap + 3.870%,
6.13%, 11/16/2027(2)(6)(7) | | $ | 3,530,000 | |
| | EUR | | | | 600,000 | | | 5 year EUR Swap + 9.177%,
8.88%, 04/14/2021(2)(7)(8) | | | 784,795 | |
| | | | Banco de Sabadell S.A. | |
| | | | | 800,000 | | | 5 year EUR Swap + 6.051%,
6.13%, 11/23/2022(2)(7)(8) | | | 922,095 | |
| | | | | 2,200,000 | | | 5 year EUR Swap + 6.414%,
6.50%, 05/18/2022(2)(7)(8) | | | 2,566,077 | |
| | | | Banco Santander S.A. | |
| | $ | | | | 3,600,000 | | | 3.80%, 02/23/2028 | | | 3,288,177 | |
| | | | | 1,200,000 | | | 3.85%, 04/12/2023 | | | 1,173,591 | |
| | | | Bank of America Corp. | |
| | | | | 4,765,000 | | | 3 mo. USD LIBOR + 1.160%,
3.12%, 01/20/2023(2) | | | 4,686,298 | |
| | | | | 6,005,000 | | | 3 mo. USD LIBOR + 0.810%,
3.37%, 01/23/2026(2) | | | 5,777,509 | |
| | | | | 4,620,000 | | | 3 mo. USD LIBOR + 1.512%,
3.71%, 04/24/2028(2) | | | 4,455,674 | |
| | | | | 1,020,000 | | | 4.00%, 01/22/2025 | | | 1,006,895 | |
| | | | | 40,000 | | | 4.18%, 11/25/2027 | | | 38,956 | |
| | | | | 2,285,000 | | | 4.20%, 08/26/2024 | | | 2,296,926 | |
| | | | | 2,925,000 | | | 7.75%, 05/14/2038 | | | 3,960,964 | |
| | | | | 1,030,000 | | | Barclays Bank plc
2.65%, 01/11/2021 | | | 1,006,934 | |
| | | | | 1,450,000 | | | Barclays plc
5 year USD Swap + 6.772%,
7.88%, 03/15/2022(2)(7)(8) | | | 1,498,012 | |
| | | | BNP Paribas S.A. | |
| | | | | 1,065,000 | | | 2.95%, 05/23/2022(1) | | | 1,028,072 | |
| | | | | 2,890,000 | | | 3.38%, 01/09/2025(1) | | | 2,730,133 | |
| | | | | 1,505,000 | | | 5 year USD Swap + 2.838%,
5.13%, 11/15/2027(1)(2)(7) | | | 1,325,724 | |
| | | | | 1,940,000 | | | 5 year USD Swap + 6.314%,
7.63%, 03/30/2021(1)(2)(6)(7) | | | 2,024,875 | |
| | | | BPCE S.A. | |
| | | | | 1,265,000 | | | 2.75%, 01/11/2023(1) | | | 1,208,749 | |
| | | | | 1,245,000 | | | 3.00%, 05/22/2022(1) | | | 1,202,494 | |
| | | | | 1,020,000 | | | Branch Banking & Trust Co.
1.45%, 05/10/2019 | | | 1,008,931 | |
| | EUR | | | | 400,000 | | | Caixa Geral de Depositos S.A.
5 year EUR Swap + 10.925%,
10.75%, 03/30/2022(2)(7)(8) | | | 513,248 | |
| | | | | 1,200,000 | | | CaixaBank S.A.
5 year EUR Swap + 6.498%,
6.75%, 06/13/2024(2)(7)(8) | | | 1,488,945 | |
| | | | Citigroup, Inc. | |
| | $ | | | | 1,025,000 | | | 2.50%, 09/26/2018 | | | 1,024,709 | |
| | | | | 1,905,000 | | | 2.70%, 03/30/2021 | | | 1,868,377 | |
| | | | | 1,300,000 | | | 2.70%, 10/27/2022 | | | 1,248,420 | |
| | | | | 2,960,000 | | | 3 mo. USD LIBOR + 1.100%, 3.42%, 05/17/2024(2) | | | 2,974,801 | |
| | | | | 1,085,000 | | | 3 mo. USD LIBOR + 1.151%, 3.52%, 10/27/2028(2) | | | 1,019,400 | |
| | | | | 1,025,000 | | | 3 mo. USD LIBOR + 1.192%, 4.08%, 04/23/2029(2) | | | 1,005,680 | |
| | | | | 4,190,000 | | | 4.45%, 09/29/2027 | | | 4,121,418 | |
| | | | | 111,000 | | | 4.65%, 07/30/2045 | | | 110,459 | |
| | | | | 1,580,000 | | | 4.75%, 05/18/2046 | | | 1,502,460 | |
The accompanying notes are an integral part of these financial statements.
|
| Hartford Total Return Bond HLS Fund |
Schedule of Investments – (continued)
June 30, 2018 (Unaudited)
| | | | | | | | | | | | |
| Shares or Principal Amount | | Market Value† | |
| CORPORATE BONDS - 28.0% - (continued) | |
| | | | Commercial Banks - 9.1% - (continued) | |
| | | | Credit Agricole S.A. | |
| | $ | | | | 1,750,000 | | | 5 year USD Swap +1.644%,
4.00%, 01/10/2033(1)(2) | | $ | 1,597,416 | |
| | | | | 4,000,000 | | | 5 year USD Swap + 6.185%,
8.13%, 12/23/2025(1)(2)(7) | | | 4,235,000 | |
| | | | | 5,685,000 | | | Credit Suisse Group AG
5 year USD Swap + 3.455%,
6.25%, 12/18/2024(1)(2)(7) | | | 5,557,701 | |
| | | | | 685,000 | | | DNB Bank ASA
5 year USD Swap + 5.080%,
6.50%, 03/26/2022(2)(7)(8) | | | 699,556 | |
| | | | Goldman Sachs Group, Inc. | |
| | | | | 1,340,000 | | | 2.35%, 11/15/2021 | | | 1,288,666 | |
| | | | | 2,720,000 | | | 2.88%, 02/25/2021 | | | 2,684,619 | |
| | | | | 2,235,000 | | | 3 mo. USD LIBOR + 0.821%, 2.88%, 10/31/2022(2) | | | 2,181,852 | |
| | | | | 3,040,000 | | | 3 mo. USD LIBOR + 0.990%, 2.91%, 07/24/2023(2) | | | 2,928,036 | |
| | | | | 4,430,000 | | | 3 mo. USD LIBOR + 1.510%, 3.69%, 06/05/2028(2) | | | 4,199,566 | |
| | | | | 3,860,000 | | | 3 mo. USD LIBOR + 1.158%, 3.81%, 04/23/2029(2) | | | 3,671,391 | |
| | | | | 2,285,000 | | | 3 mo. USD LIBOR + 1.373%, 4.02%, 10/31/2038(2) | | | 2,081,968 | |
| | | | | 1,250,000 | | | 3 mo. USD LIBOR + 1.301%, 4.22%, 05/01/2029(2) | | | 1,231,138 | |
| | | | | 3,687,000 | | | 6.00%, 06/15/2020 | | | 3,877,581 | |
| | | | | 1,635,000 | | | 6.25%, 02/01/2041 | | | 1,908,962 | |
| | | | | 1,890,000 | | | 6.75%, 10/01/2037 | | | 2,243,131 | |
| | | | HSBC Holdings plc | |
| | | | | 1,305,000 | | | 2.95%, 05/25/2021 | | | 1,284,811 | |
| | | | | 3,095,000 | | | 3.40%, 03/08/2021 | | | 3,093,885 | |
| | | | | 3,010,000 | | | 4.25%, 08/18/2025 | | | 2,955,170 | |
| | | | | 1,200,000 | | | 3 mo. USD LIBOR + 1.535%, 4.58%, 06/19/2029(2) | | | 1,212,041 | |
| | | | | 2,925,000 | | | 5 year USD ICE Swap + 3.746%,
6.00%, 05/22/2027(2)(7) | | | 2,712,938 | |
| | | | | 1,075,000 | | | 5 year USD ICE Swap + 3.453%,
6.25%, 03/23/2023(2)(7) | | | 1,054,844 | |
| | | | Intesa Sanpaolo S.p.A. | |
| | | | | 1,015,000 | | | 3.38%, 01/12/2023(1) | | | 932,984 | |
| | | | | 1,410,000 | | | 3.88%, 01/12/2028(1) | | | 1,208,677 | |
| | | | | 2,250,000 | | | 5 year USD Swap + 5.462%,
7.70%, 09/17/2025(1)(2)(6)(7) | | | 2,101,500 | |
| | EUR | | | | 1,375,000 | | | 5 year EUR Swap + 7.192%,
7.75%, 01/11/2027(2)(7)(8) | | | 1,730,169 | |
| | | | JP Morgan Chase & Co. | |
| | $ | | | | 285,000 | | | 2.30%, 08/15/2021 | | | 275,342 | |
| | | | | 6,670,000 | | | 2.40%, 06/07/2021 | | | 6,498,330 | |
| | | | | 275,000 | | | 2.55%, 10/29/2020 | | | 270,826 | |
| | | | | 2,890,000 | | | 2.70%, 05/18/2023 | | | 2,774,406 | |
| | | | | 2,665,000 | | | 3 mo. USD LIBOR + 1.155%, 3.22%, 03/01/2025(2) | | | 2,570,997 | |
| | | | | 2,500,000 | | | 3 mo. USD LIBOR + 0.945%, 3.51%, 01/23/2029(2) | | | 2,368,637 | |
| | | | | 955,000 | | | 3 mo. USD LIBOR + 1.230%, 3.59%, 10/24/2023(2) | | | 972,213 | |
| | | | Morgan Stanley | |
| | | | | 3,220,000 | | | 2.50%, 04/21/2021 | | | 3,144,934 | |
| | | | | 3,240,000 | | | 2.75%, 05/19/2022 | | | 3,138,751 | |
| | | | | | | | | | | | |
| Shares or Principal Amount | | Market Value† | |
| CORPORATE BONDS - 28.0% - (continued) | |
| | | | Commercial Banks - 9.1% - (continued) | |
| | $ | | | | 5,935,000 | | | 3 mo. USD LIBOR + 1.340%, 3.59%, 07/22/2028(2) | | $ | 5,640,903 | |
| | | | | 2,120,000 | | | 3.63%, 01/20/2027 | | | 2,035,679 | |
| | | | | 2,110,000 | | | 3.95%, 04/23/2027 | | | 2,011,445 | |
| | | | | 3,275,000 | | | 4.00%, 07/23/2025 | | | 3,265,040 | |
| | | | | 4,900,000 | | | Royal Bank of Canada
2.15%, 10/26/2020 | | | 4,787,314 | |
| | | | | 685,000 | | | Royal Bank of Scotland Group plc
5 year USD Swap + 7.598%,
8.63%, 08/15/2021(2)(7) | | | 727,984 | |
| | | | | 1,825,000 | | | Santander Holdings USA, Inc.
3.70%, 03/28/2022 | | | 1,798,145 | |
| | | | Societe Generale S.A. | |
| | | | | 3,275,000 | | | 5 year USD Swap + 6.238%,
7.38%, 09/13/2021(1)(2)(7) | | | 3,332,312 | |
| | | | | 200,000 | | | 5 year USD Swap + 4.979%,
7.88%, 12/18/2023(1)(2)(7) | | | 204,500 | |
| | | | | 625,000 | | | 5 year USD ICE Swap + 5.873%,
8.00%, 09/29/2025(1)(2)(7) | | | 650,000 | |
| | | | | 1,950,000 | | | Standard Chartered plc
5 year USD Swap + 6.301%,
7.50%, 04/02/2022(2)(7)(8) | | | 1,998,750 | |
| | | | | 2,325,000 | | | UBS AG
2.45%, 12/01/2020(1) | | | 2,272,727 | |
| | | | UBS Group Funding Switzerland AG | |
| | | | | 3,045,000 | | | 2.65%, 02/01/2022(1) | | | 2,933,543 | |
| | | | | 3,050,000 | | | 5 year USD ICE Swap + 5.497%,
6.88%, 03/22/2021(2)(7)(8) | | | 3,125,420 | |
| | | | | 1,620,000 | | | 5 year USD Swap + 5.464%,
7.13%, 02/19/2020(2)(7)(8) | | | 1,662,616 | |
| | | | UniCredit S.p.A. | |
| | EUR | | | | 1,215,000 | | | 5 year USD Swap + 4.925%,
5.38%, 06/03/2025(2)(7)(8) | | | 1,269,895 | |
| | | | | 2,225,000 | | | 5 year EUR Swap + 6.387%,
6.63%, 06/03/2023(2)(7)(8) | | | 2,575,619 | |
| | $ | | | | 625,000 | | | 5 year USD Swap + 5.180%,
8.00%, 06/03/2024(2)(7)(8) | | | 585,783 | |
| | | | Wells Fargo & Co. | |
| | | | | 1,795,000 | | | 2.63%, 07/22/2022 | | | 1,728,915 | |
| | | | | 1,655,000 | | | 3.00%, 04/22/2026 | | | 1,534,262 | |
| | | | | 665,000 | | | 3.00%, 10/23/2026 | | | 614,018 | |
| | | | | 4,800,000 | | | 3.07%, 01/24/2023 | | | 4,667,692 | |
| | | | | 4,485,000 | | | 3 mo. USD LIBOR + 1.310%,
3.58%, 05/22/2028(2) | | | 4,297,184 | |
| | | | | 1,370,000 | | | 4.40%, 06/14/2046 | | | 1,254,244 | |
| | | | | 2,440,000 | | | 4.90%, 11/17/2045 | | | 2,409,878 | |
| | | | | 890,000 | | | 5.61%, 01/15/2044 | | | 957,503 | |
| | | | | | | | | | | | |
| | | | 203,429,207 | |
| | | | | | | | | | | | |
| | | | Commercial Services - 0.3% | |
| | | | | 6,128,000 | | | Acwa Power Management And Investments One Ltd.
5.95%, 12/15/2039(1) | | | 5,986,321 | |
| | | | Ashtead Capital, Inc. | |
| | | | | 200,000 | | | 4.13%, 08/15/2025(1) | | | 186,500 | |
| | | | | 200,000 | | | 4.38%, 08/15/2027(1) | | | 186,000 | |
| | | | | 445,000 | | | Cardtronics, Inc.
5.13%, 08/01/2022 | | | 424,975 | |
| | | | | 400,000 | | | United Rentals North America, Inc.
5.50%, 07/15/2025 | | | 403,000 | |
| | | | | | | | | | | | |
| | | | 7,186,796 | |
| | | | | | | | | | | | |
The accompanying notes are an integral part of these financial statements.
|
| Hartford Total Return Bond HLS Fund |
Schedule of Investments – (continued)
June 30, 2018 (Unaudited)
| | | | | | | | | | | | |
| Shares or Principal Amount | | Market Value† | |
| CORPORATE BONDS - 28.0% - (continued) | |
| | | | Construction Materials - 0.0% | |
| | | | Standard Industries, Inc. | |
| | $ | | | | 60,000 | | | 5.38%, 11/15/2024(1) | | $ | 59,250 | |
| | | | | 930,000 | | | 6.00%, 10/15/2025(1) | | | 932,325 | |
| | | | | | | | | | | | |
| | | | 991,575 | |
| | | | | | | | | | | | |
| | | | Diversified Financial Services - 0.2% | |
| | | | | 2,425,000 | | | American Express Co.
3.40%, 02/27/2023 | | | 2,396,849 | |
| | | | Navient Corp. | |
| | | | | 660,000 | | | 5.88%, 03/25/2021 | | | 669,900 | |
| | | | | 390,000 | | | 7.25%, 01/25/2022 | | | 408,038 | |
| | | | | | | | | | | | |
| | | | 3,474,787 | |
| | | | | | | | | | | | |
| | | | Electric - 1.3% | |
| | | | AES Corp. | |
| | | | | 1,080,000 | | | 4.00%, 03/15/2021 | | | 1,074,600 | |
| | | | | 220,000 | | | 4.50%, 03/15/2023 | | | 218,075 | |
| | | | | 620,000 | | | 4.88%, 05/15/2023 | | | 618,450 | |
| | | | | 50,000 | | | 5.13%, 09/01/2027 | | | 49,875 | |
| | | | | 1,180,000 | | | Berkshire Hathaway Energy Co.
3.25%, 04/15/2028 | | | 1,122,237 | |
| | | | | 1,605,000 | | | DTE Energy Co.
1.50%, 10/01/2019 | | | 1,573,775 | |
| | | | | 1,525,000 | | | Duke Energy Carolinas LLC
4.25%, 12/15/2041 | | | 1,553,960 | |
| | | | | 1,525,000 | | | Duke Energy Florida LLC
3.40%, 10/01/2046 | | | 1,337,392 | |
| | | | | 1,495,000 | | | Duke Energy Progress LLC
4.38%, 03/30/2044 | | | 1,548,101 | |
| | | | | 125,000 | | | Emera U.S. Finance L.P.
4.75%, 06/15/2046 | | | 122,825 | |
| | | | | 3,000,000 | | | Exelon Corp.
2.85%, 06/15/2020 | | | 2,973,296 | |
| | | | | 510,000 | | | FirstEnergy Corp.
4.25%, 03/15/2023 | | | 518,181 | |
| | | | | 645,000 | | | Fortis, Inc.
2.10%, 10/04/2021 | | | 615,484 | |
| | | | | 1,590,000 | | | IPALCO Enterprises, Inc.
3.70%, 09/01/2024 | | | 1,541,759 | |
| | | | | 565,000 | | | Oncor Electric Delivery Co. LLC
7.00%, 09/01/2022 | | | 643,646 | |
| | | | Pacific Gas & Electric Co. | |
| | | | | 785,000 | | | 2.95%, 03/01/2026 | | | 700,220 | |
| | | | | 4,390,000 | | | 3.30%, 12/01/2027 | | | 3,941,974 | |
| | | | | 2,760,000 | | | 6.05%, 03/01/2034 | | | 2,980,441 | |
| | | | | 2,275,000 | | | South Carolina Electric & Gas Co.
4.50%, 06/01/2064 | | | 2,072,070 | |
| | | | | 245,000 | | | Southern California Edison Co.
4.13%, 03/01/2048 | | | 231,802 | |
| | | | Southern Co. | |
| | | | | 1,360,000 | | | 1.85%, 07/01/2019 | | | 1,346,476 | |
| | | | | 2,450,000 | | | 2.75%, 06/15/2020 | | | 2,428,935 | |
| | | | | 625,000 | | | 2.95%, 07/01/2023 | | | 602,880 | |
| | | | | | | | | | | | |
| | | | 29,816,454 | |
| | | | | | | | | | | | |
| | | | Electronics - 0.1% | |
| | | | | 1,375,000 | | | Fortive Corp.
2.35%, 06/15/2021 | | | 1,332,609 | |
| | | | | | | | | | | | |
| | | | Engineering & Construction - 0.5% | |
| | | | | 1,215,000 | | | Mexico City Airport Trust
3.88%, 04/30/2028(1) | | | 1,102,977 | |
| | | | | | | | | | | | |
| Shares or Principal Amount | | Market Value† | |
| CORPORATE BONDS - 28.0% - (continued) | |
| | | | Engineering & Construction - 0.5% - (continued) | |
| | | | SBA Tower Trust | |
| | $ | | | | 4,815,000 | | | 3.17%, 04/09/2047(1) | | $ | 4,710,885 | |
| | | | | 4,540,000 | | | 3.45%, 03/15/2048(1) | | | 4,509,899 | |
| | | | | | | | | | | | |
| | | | 10,323,761 | |
| | | | | | | | | | | | |
| | | | Entertainment - 0.0% | |
| | | | | 275,000 | | | GLP Capital L.P. / GLP Financing II, Inc.
5.38%, 04/15/2026 | | | 272,250 | |
| | | | WMG Acquisition Corp. | |
| | | | | 445,000 | | | 4.88%, 11/01/2024(1) | | | 433,875 | |
| | | | | 260,000 | | | 5.00%, 08/01/2023(1) | | | 258,700 | |
| | | | | | | | | | | | |
| | | | 964,825 | |
| | | | | | | | | | | | |
| | | | Food - 0.2% | |
| | | | Kraft Heinz Foods Co. | |
| | | | | 1,485,000 | | | 4.38%, 06/01/2046 | | | 1,284,679 | |
| | | | | 1,620,000 | | | 4.63%, 01/30/2029 | | | 1,604,426 | |
| | | | | 1,730,000 | | | Sysco Corp.
2.50%, 07/15/2021 | | | 1,689,344 | |
| | | | | 285,000 | | | TreeHouse Foods, Inc.
6.00%, 02/15/2024(1)(6) | | | 289,988 | |
| | | | | | | | | | | | |
| | | | 4,868,437 | |
| | | | | | | | | | | | |
| | | | Food Service - 0.0% | |
| | | | | 585,000 | | | Aramark Services, Inc.
5.00%, 02/01/2028(1) | | | 558,675 | |
| | | | | | | | | | | | |
| | | | Gas - 0.1% | |
| | | | AmeriGas Partners L.P. / AmeriGas Finance Corp. | |
| | | | | 70,000 | | | 5.63%, 05/20/2024 | | | 68,863 | |
| | | | | 375,000 | | | 5.88%, 08/20/2026 | | | 365,625 | |
| | | | | 1,640,000 | | | Sempra Energy
2.40%, 02/01/2020 | | | 1,620,177 | |
| | | | | | | | | | | | |
| | | | 2,054,665 | |
| | | | | | | | | | | | |
| | | | Healthcare - Products - 0.5% | |
| | | | Becton Dickinson and Co. | |
| | | | | 4,645,000 | | | 3.36%, 06/06/2024 | | | 4,461,914 | |
| | | | | 2,610,000 | | | 3.70%, 06/06/2027 | | | 2,470,631 | |
| | | | | 2,385,000 | | | Boston Scientific Corp.
4.00%, 03/01/2028 | | | 2,331,862 | |
| | | | | 855,000 | | | Thermo Fisher Scientific, Inc.
3.00%, 04/15/2023 | | | 831,315 | |
| | | | | | | | | | | | |
| | | | 10,095,722 | |
| | | | | | | | | | | | |
| | | | Healthcare - Services - 0.5% | |
| | | | | 855,000 | | | Aetna, Inc.
2.80%, 06/15/2023 | | | 814,669 | |
| | | | Anthem, Inc. | |
| | | | | 3,625,000 | | | 3.50%, 08/15/2024 | | | 3,532,714 | |
| | | | | 2,305,000 | | | 3.65%, 12/01/2027 | | | 2,183,502 | |
| | | | | 410,000 | | | 4.63%, 05/15/2042 | | | 397,427 | |
| | | | Community Health Systems, Inc. | |
| | | | | 535,000 | | | 5.13%, 08/01/2021(6) | | | 494,875 | |
| | | | | 90,000 | | | 6.25%, 03/31/2023 | | | 82,463 | |
| | | | | 280,000 | | | Tenet Healthcare Corp.
6.00%, 10/01/2020 | | | 287,700 | |
| | | | UnitedHealth Group, Inc. | |
| | | | | 1,230,000 | | | 3.50%, 06/15/2023 | | | 1,231,472 | |
| | | | | 1,260,000 | | | 3.75%, 07/15/2025 | | | 1,260,210 | |
| | | | | 370,000 | | | 4.25%, 04/15/2047 | | | 368,336 | |
| | | | | 705,000 | | | 4.25%, 06/15/2048 | | | 706,955 | |
| | | | | 670,000 | | | 4.75%, 07/15/2045 | | | 715,835 | |
| | | | | | | | | | | | |
| | | | 12,076,158 | |
| | | | | | | | | | | | |
The accompanying notes are an integral part of these financial statements.
|
| Hartford Total Return Bond HLS Fund |
Schedule of Investments – (continued)
June 30, 2018 (Unaudited)
| | | | | | | | | | | | |
| Shares or Principal Amount | | Market Value† | |
| CORPORATE BONDS - 28.0% - (continued) | |
| | | | Home Builders - 0.1% | |
| | $ | | | | 595,000 | | | Lennar Corp.
4.75%, 11/29/2027 | | $ | 557,991 | |
| | | | | 285,000 | | | PulteGroup, Inc.
5.50%, 03/01/2026 | | | 282,150 | |
| | | | | 575,000 | | | Toll Brothers Finance Corp.
4.88%, 11/15/2025 | | | 553,437 | |
| | | | | | | | | | | | |
| | | | 1,393,578 | |
| | | | | | | | | | | | |
| | | | Insurance - 0.2% | |
| | | | | 1,335,000 | | | American International Group, Inc.
4.70%, 07/10/2035 | | | 1,298,715 | |
| | | | | 835,000 | | | CNO Financial Group, Inc.
5.25%, 05/30/2025 | | | 828,737 | |
| | | | Genworth Holdings, Inc. | |
| | | | | 20,000 | | | 4.80%, 02/15/2024 | | | 17,350 | |
| | | | | 380,000 | | | 4.90%, 08/15/2023 | | | 332,500 | |
| | | | | 15,000 | | | 7.63%, 09/24/2021 | | | 15,317 | |
| | | | | 338,000 | | | Massachusetts Mutual Life Insurance Co.
8.88%, 06/01/2039(1) | | | 529,094 | |
| | | | | 345,000 | | | MGIC Investment Corp.
5.75%, 08/15/2023 | | | 351,900 | |
| | | | | 1,035,000 | | | Willis North America, Inc.
3.60%, 05/15/2024 | | | 1,000,221 | |
| | | | | | | | | | | | |
| | | | 4,373,834 | |
| | | | | | | | | | | | |
| | | | Internet - 0.5% | |
| | | | Alibaba Group Holding Ltd. | |
| | | | | 3,400,000 | | | 3.40%, 12/06/2027 | | | 3,167,910 | |
| | | | | 630,000 | | | 4.00%, 12/06/2037 | | | 583,285 | |
| | | | | 1,050,000 | | | 4.20%, 12/06/2047 | | | 955,840 | |
| | | | Amazon.com, Inc. | |
| | | | | 730,000 | | | 2.80%, 08/22/2024 | | | 703,383 | |
| | | | | 2,885,000 | | | 3.88%, 08/22/2037 | | | 2,816,086 | |
| | | | Tencent Holdings Ltd. | |
| | | | | 2,345,000 | | | 2.99%, 01/19/2023(1) | | | 2,280,020 | |
| | | | | 1,210,000 | | | 3.60%, 01/19/2028(1) | | | 1,144,684 | |
| | | | | | | | | | | | |
| | | | 11,651,208 | |
| | | | | | | | | | | | |
| | | | Iron/Steel - 0.3% | |
| | | | | 525,000 | | | ArcelorMittal
6.13%, 06/01/2025(6) | | | 565,687 | |
| | | | | 285,000 | | | Commercial Metals Co
5.38%, 07/15/2027 | | | 270,750 | |
| | | | Steel Dynamics, Inc. | |
| | | | | 785,000 | | | 4.13%, 09/15/2025 | | | 752,619 | |
| | | | | 275,000 | | | 5.50%, 10/01/2024 | | | 280,156 | |
| | | | Vale Overseas Ltd. | |
| | | | | 3,910,000 | | | 6.25%, 08/10/2026 | | | 4,234,530 | |
| | | | | 405,000 | | | 6.88%, 11/10/2039 | | | 458,663 | |
| | | | | | | | | | | | |
| | | | 6,562,405 | |
| | | | | | | | | | | | |
| | | | IT Services - 0.2% | |
| | | | Apple, Inc. | |
| | | | | 865,000 | | | 3.35%, 02/09/2027 | | | 844,670 | |
| | | | | 1,995,000 | | | 3.45%, 02/09/2045 | | | 1,782,980 | |
| | | | | 250,000 | | | 3.85%, 08/04/2046 | | | 235,800 | |
| | | | | 1,035,000 | | | Hewlett Packard Enterprise Co.
6.35%, 10/15/2045 | | | 1,022,451 | |
| | | | | | | | | | | | |
| | | | 3,885,901 | |
| | | | | | | | | | | | |
| | | | Leisure Time - 0.0% | |
| | | | | 150,000 | | | VOC Escrow Ltd.
5.00%, 02/15/2028(1) | | | 141,706 | |
| | | | | | | | | | | | |
| | | | | | | | | | | | |
| Shares or Principal Amount | | Market Value† | |
| CORPORATE BONDS - 28.0% - (continued) | |
| | | | Machinery - Construction & Mining - 0.0% | |
| | $ | | | | 365,000 | | | Oshkosh Corp.
5.38%, 03/01/2025 | | $ | 374,125 | |
| | | | | | | | | | | | |
| | | | Media - 2.0% | |
| | | | 21st Century Fox America, Inc. | |
| | | | | 1,225,000 | | | 6.15%, 03/01/2037 | | | 1,436,820 | |
| | | | | 1,175,000 | | | 6.20%, 12/15/2034 | | | 1,387,916 | |
| | | | CCO Holdings LLC / CCO Holdings Capital Corp. | |
| | | | | 40,000 | | | 5.13%, 02/15/2023 | | | 39,588 | |
| | | | | 150,000 | | | 5.13%, 05/01/2027(1) | | | 140,344 | |
| | | | | 145,000 | | | 5.75%, 02/15/2026(1) | | | 142,462 | |
| | | | Charter Communications Operating LLC / Charter Communications Operating Capital | |
| | | | | 6,120,000 | | | 4.20%, 03/15/2028 | | | 5,729,419 | |
| | | | | 3,420,000 | | | 6.48%, 10/23/2045 | | | 3,604,801 | |
| | | | Comcast Corp. | |
| | | | | 150,000 | | | 2.35%, 01/15/2027 | | | 131,374 | |
| | | | | 490,000 | | | 3.20%, 07/15/2036 | | | 407,655 | |
| | | | | 195,000 | | | 3.40%, 07/15/2046 | | | 158,130 | |
| | | | | 1,815,000 | | | 4.05%, 11/01/2052 | | | 1,583,110 | |
| | | | Cox Communications, Inc. | |
| | | | | 3,425,000 | | | 3.15%, 08/15/2024(1) | | | 3,244,734 | |
| | | | | 45,000 | | | 3.85%, 02/01/2025(1) | | | 44,082 | |
| | | | | 600,000 | | | 4.80%, 02/01/2035(1) | | | 552,510 | |
| | | | | 430,000 | | | CSC Holdings LLC
5.50%, 04/15/2027(1) | | | 410,650 | |
| | | | Discovery Communications LLC | |
| | | | | 1,590,000 | | | 3.80%, 03/13/2024 | | | 1,564,850 | |
| | | | | 1,057,000 | | | 3.95%, 06/15/2025(1) | | | 1,030,404 | |
| | | | | 895,000 | | | 4.90%, 03/11/2026 | | | 917,962 | |
| | | | | 555,000 | | | DISH DBS Corp.
5.88%, 11/15/2024 | | | 469,669 | |
| | | | | 545,000 | | | Liberty Interactive LLC
8.25%, 02/01/2030 | | | 578,054 | |
| | | | | 1,715,000 | | | NBCUniversal Media LLC
5.95%, 04/01/2041 | | | 1,931,513 | |
| | | | | 520,000 | | | TEGNA, Inc.
5.50%, 09/15/2024(1)(6) | | | 520,000 | |
| | | | | 1,350,000 | | | Time Warner Cable LLC
8.75%, 02/14/2019 | | | 1,395,046 | |
| | | | | 5,520,000 | | | Time Warner Entertainment Co. L.P.
8.38%, 07/15/2033 | | | 6,815,184 | |
| | | | Viacom, Inc. | |
| | | | | 5,595,000 | | | 4.25%, 09/01/2023 | | | 5,563,059 | |
| | | | | 745,000 | | | 4.38%, 03/15/2043 | | | 625,091 | |
| | | | | 55,000 | | | 3 mo. USD LIBOR + 3.895%,
5.88%, 02/28/2057(2) | | | 51,975 | |
| | | | | 79,000 | | | 3 mo. USD LIBOR + 3.899%,
6.25%, 02/28/2057(2) | | | 74,853 | |
| | | | | 550,000 | | | Videotron Ltd.
5.38%, 06/15/2024(1) | | | 563,062 | |
| | | | Warner Media LLC | |
| | | | | 165,000 | | | 2.95%, 07/15/2026 | | | 148,329 | |
| | | | | 2,725,000 | | | 3.80%, 02/15/2027 | | | 2,573,420 | |
| | | | | 165,000 | | | 3.88%, 01/15/2026 | | | 158,518 | |
| | | | | | | | | | | | |
| | | | 43,994,584 | |
| | | | | | | | | | | | |
| | | | Mining - 0.3% | |
| | | | Anglo American Capital plc | |
| | | | | 1,835,000 | | | 3.75%, 04/10/2022(1) | | | 1,821,807 | |
| | | | | 1,805,000 | | | 4.13%, 09/27/2022(1) | | | 1,814,862 | |
The accompanying notes are an integral part of these financial statements.
|
| Hartford Total Return Bond HLS Fund |
Schedule of Investments – (continued)
June 30, 2018 (Unaudited)
| | | | | | | | | | | | |
| Shares or Principal Amount | | Market Value† | |
| CORPORATE BONDS - 28.0% - (continued) | |
| | | | Mining - 0.3% - (continued) | |
| | $ | | | | 940,000 | | | Corp. Nacional del Cobre de Chile
3.63%, 08/01/2027(1) | | $ | 895,378 | |
| | | | | 285,000 | | | FMG Resources August 2006 Pty Ltd.
5.13%, 05/15/2024(1) | | | 271,106 | |
| | | | | 1,000,000 | | | Glencore Funding LLC
3.88%, 10/27/2027(1) | | | 924,070 | |
| | | | | 560,000 | | | Kaiser Aluminum Corp.
5.88%, 05/15/2024 | | | 571,200 | |
| | | | | | | | | | | | |
| | | | 6,298,423 | |
| | | | | | | | | | | | |
| | | | Miscellaneous Manufacturing - 0.0% | |
| | | | | 1,000,000 | | | Ingersoll-Rand Global Holding Co., Ltd.
2.90%, 02/21/2021 | | | 990,215 | |
| | | | | | | | | | | | |
| | | | Office/Business Equipment - 0.1% | |
| | | | | 1,945,000 | | | Pitney Bowes, Inc.
4.70%, 04/01/2023 | | | 1,750,500 | |
| | | | | | | | | | | | |
| | | | Oil & Gas - 1.3% | |
| | | | | 150,000 | | | Aker BP ASA
5.88%, 03/31/2025(1) | | | 154,463 | |
| | | | Anadarko Petroleum Corp. | |
| | | | | 200,000 | | | 3.45%, 07/15/2024 | | | 192,179 | |
| | | | | 485,000 | | | 4.50%, 07/15/2044 | | | 451,654 | |
| | | | | 270,000 | | | 6.60%, 03/15/2046 | | | 324,503 | |
| | | | | 1,045,000 | | | Andeavor
3.80%, 04/01/2028 | | | 986,970 | |
| | | | | 280,000 | | | Antero Resources Corp.
5.63%, 06/01/2023 | | | 283,500 | |
| | | | | 3,385,000 | | | Canadian Natural Resources Ltd.
3.85%, 06/01/2027 | | | 3,302,608 | |
| | | | Continental Resources, Inc. | |
| | | | | 80,000 | | | 4.90%, 06/01/2044 | | | 78,351 | |
| | | | | 110,000 | | | 5.00%, 09/15/2022 | | | 111,453 | |
| | | | | 1,335,000 | | | EnCana Corp.
3.90%, 11/15/2021 | | | 1,345,717 | |
| | | | Hess Corp. | |
| | | | | 1,630,000 | | | 4.30%, 04/01/2027 | | | 1,574,299 | |
| | | | | 105,000 | | | 6.00%, 01/15/2040 | | | 108,180 | |
| | | | | 2,425,000 | | | Kerr-McGee Corp.
6.95%, 07/01/2024 | | | 2,751,499 | |
| | | | | 805,000 | | | Marathon Oil Corp.
3.85%, 06/01/2025 | | | 791,935 | |
| | | | | 295,000 | | | MEG Energy Corp.
6.50%, 01/15/2025(1) | | | 294,262 | |
| | | | Petroleos Mexicanos | |
| | | | | 45,000 | | | 6.50%, 03/13/2027 | | | 46,144 | |
| | | | | 2,730,000 | | | 6.63%, 06/15/2035(6) | | | 2,668,575 | |
| | | | | 515,000 | | | 6.75%, 09/21/2047 | | | 485,593 | |
| | | | | 2,215,000 | | | Phillips 66
3.90%, 03/15/2028 | | | 2,161,796 | |
| | | | | 2,090,000 | | | Pioneer Natural Resources Co.
7.50%, 01/15/2020 | | | 2,222,599 | |
| | | | QEP Resources, Inc. | |
| | | | | 385,000 | | | 5.25%, 05/01/2023 | | | 376,337 | |
| | | | | 10,000 | | | 5.38%, 10/01/2022 | | | 10,175 | |
| | | | | 1,840,000 | | | Shell International Finance B.V.
4.38%, 05/11/2045 | | | 1,885,786 | |
| | | | SM Energy Co. | |
| | | | | 255,000 | | | 6.13%, 11/15/2022(6) | | | 261,375 | |
| | | | | 70,000 | | | 6.75%, 09/15/2026 | | | 70,175 | |
| | | | | 295,000 | | | Sunoco L.P. / Sunoco Finance Corp.
5.50%, 02/15/2026(1) | | | 279,512 | |
| | | | | | | | | | | | |
| Shares or Principal Amount | | Market Value† | |
| CORPORATE BONDS - 28.0% - (continued) | |
| | | | Oil & Gas - 1.3% - (continued) | |
| | $ | | | | 2,320,000 | | | Tullow Oil plc
7.00%, 03/01/2025(1) | | $ | 2,195,300 | |
| | | | | 1,650,000 | | | Valero Energy Corp.
3.40%, 09/15/2026 | | | 1,562,274 | |
| | | | WPX Energy, Inc. | |
| | | | | 190,000 | | | 5.25%, 09/15/2024 | | | 186,913 | |
| | | | | 72,000 | | | 6.00%, 01/15/2022 | | | 74,880 | |
| | ARS | | | | 93,580,252 | | | YPF S.A.
16.50%, 05/09/2022(1) | | | 2,442,634 | |
| | | | | | | | | | | | |
| | | | 29,681,641 | |
| | | | | | | | | | | | |
| | | | Packaging & Containers - 0.1% | |
| | $ | | | | 695,000 | | | Owens-Brockway Glass Container, Inc.
5.88%, 08/15/2023(1) | | | 702,819 | |
| | | | | 295,000 | | | Reynolds Group Issuer, Inc. / Reynolds Group Issuer LLC / Reynolds Group Issuer Lu
5.13%, 07/15/2023(1) | | | 291,312 | |
| | | | | | | | | | | | |
| | | | 994,131 | |
| | | | | | | | | | | | |
| | | | Pharmaceuticals - 1.6% | |
| | | | Allergan Funding SCS | |
| | | | | 1,135,000 | | | 3.45%, 03/15/2022 | | | 1,116,826 | |
| | | | | 945,000 | | | 3.80%, 03/15/2025 | | | 917,638 | |
| | | | | 316,000 | | | Baxalta, Inc.
3.60%, 06/23/2022 | | | 312,753 | |
| | | | | 3,915,000 | | | Bayer U.S. Finance LLC
4.25%, 12/15/2025(1) | | | 3,935,949 | |
| | | | | 3,305,000 | | | Cardinal Health, Inc.
2.62%, 06/15/2022 | | | 3,168,219 | |
| | | | CVS Health Corp. | |
| | | | | 7,365,000 | | | 3.13%, 03/09/2020 | | | 7,355,487 | |
| | | | | 3,855,000 | | | 4.10%, 03/25/2025 | | | 3,834,573 | |
| | | | | 1,640,000 | | | 5.05%, 03/25/2048 | | | 1,669,022 | |
| | | | | 3,385,000 | | | GlaxoSmithKline Capital plc
3.13%, 05/14/2021 | | | 3,390,679 | |
| | | | | 2,875,000 | | | GlaxoSmithKline Capital, Inc.
3.63%, 05/15/2025 | | | 2,870,050 | |
| | | | | 280,000 | | | IQVIA, Inc.
4.88%, 05/15/2023(1) | | | 282,800 | |
| | | | Mylan N.V. | |
| | | | | 865,000 | | | 3.15%, 06/15/2021 | | | 855,502 | |
| | | | | 1,705,000 | | | 3.75%, 12/15/2020 | | | 1,715,651 | |
| | | | | 310,000 | | | 3.95%, 06/15/2026 | | | 296,049 | |
| | | | | 590,000 | | | Mylan, Inc.
5.20%, 04/15/2048(1) | | | 567,312 | |
| | | | | 2,440,000 | | | Shire Acquisitions Investments Ireland DAC
2.40%, 09/23/2021 | | | 2,335,968 | |
| | | | Valeant Pharmaceuticals International, Inc. | |
| | | | | 315,000 | | | 6.50%, 03/15/2022(1) | | | 326,025 | |
| | | | | 140,000 | | | 7.00%, 03/15/2024(1) | | | 146,783 | |
| | | | | | | | | | | | |
| | | | 35,097,286 | |
| | | | | | | | | | | | |
| | | | Pipelines - 1.0% | |
| | | | Andeavor Logistics L.P. / Tesoro Logistics Finance Corp. | |
| | | | | 1,970,000 | | | 4.25%, 12/01/2027 | | | 1,887,057 | |
| | | | | 211,000 | | | 6.25%, 10/15/2022 | | | 218,569 | |
| | | | DCP Midstream Operating L.P. | |
| | | | | 241,000 | | | 4.95%, 04/01/2022 | | | 243,711 | |
| | | | | 215,000 | | | 5.60%, 04/01/2044 | | | 202,906 | |
| | | | | 995,000 | | | Enbridge, Inc.
3.70%, 07/15/2027 | | | 942,872 | |
The accompanying notes are an integral part of these financial statements.
|
| Hartford Total Return Bond HLS Fund |
Schedule of Investments – (continued)
June 30, 2018 (Unaudited)
| | | | | | | | | | | | |
| Shares or Principal Amount | | Market Value† | |
| CORPORATE BONDS - 28.0% - (continued) | |
| | | | Pipelines - 1.0% - (continued) | |
| | $ | | | | 555,000 | | | Energy Transfer Equity L.P.
5.50%, 06/01/2027 | | $ | 555,000 | |
| | | | | 800,000 | | | Energy Transfer Partners L.P.
4.20%, 09/15/2023 | | | 799,607 | |
| | | | EQT Midstream Partners L.P. | |
| | | | | 1,000,000 | | | 4.75%, 07/15/2023 | | | 998,389 | |
| | | | | 1,250,000 | | | 5.50%, 07/15/2028 | | | 1,249,786 | |
| | | | | 1,285,000 | | | Kinder Morgan, Inc.
5.55%, 06/01/2045 | | | 1,293,525 | |
| | | | MPLX L.P. | |
| | | | | 875,000 | | | 4.00%, 03/15/2028 | | | 832,191 | |
| | | | | 1,740,000 | | | 4.13%, 03/01/2027 | | | 1,659,792 | |
| | | | | 510,000 | | | 4.70%, 04/15/2048 | | | 472,875 | |
| | | | | 325,000 | | | 5.20%, 03/01/2047 | | | 322,928 | |
| | | | | 735,000 | | | Sabine Pass Liquefaction LLC
4.20%, 03/15/2028 | | | 711,560 | |
| | | | Sunoco Logistics Partners Operations L.P. | |
| | | | | 175,000 | | | 5.30%, 04/01/2044 | | | 158,627 | |
| | | | | 180,000 | | | 5.35%, 05/15/2045 | | | 163,858 | |
| | | | Texas Eastern Transmission L.P. | |
| | | | | 2,080,000 | | | 2.80%, 10/15/2022(1) | | | 1,988,704 | |
| | | | | 475,000 | | | 3.50%, 01/15/2028(1) | | | 447,258 | |
| | | | | 645,000 | | | TransCanada PipeLines Ltd.
4.75%, 05/15/2038 | | | 644,758 | |
| | | | | 475,000 | | | Transcontinental Gas Pipe Line Co. LLC
4.00%, 03/15/2028(1) | | | 461,633 | |
| | | | | 2,140,000 | | | Valero Energy Partners L.P.
4.50%, 03/15/2028 | | | 2,103,947 | |
| | | | | 1,705,000 | | | Western Gas Partners L.P.
4.50%, 03/01/2028 | | | 1,640,818 | |
| | | | Williams Cos., Inc. | |
| | | | | 385,000 | | | 3.70%, 01/15/2023 | | | 372,488 | |
| | | | | 70,000 | | | 4.55%, 06/24/2024 | | | 70,000 | |
| | | | | 70,000 | | | 5.75%, 06/24/2044 | | | 72,363 | |
| | | | | 570,000 | | | Williams Partners L.P.
4.30%, 03/04/2024 | | | 572,039 | |
| | | | | | | | | | | | |
| | | | 21,087,261 | |
| | | | | | | | | | | | |
| | | | Real Estate Investment Trusts - 0.1% | |
| | | | Crown Castle International Corp. | |
| | | | | 500,000 | | | 3.15%, 07/15/2023 | | | 478,638 | |
| | | | | 600,000 | | | 3.20%, 09/01/2024 | | | 566,262 | |
| | | | | 650,000 | | | Equinix, Inc.
5.88%, 01/15/2026 | | | 658,450 | |
| | | | | | | | | | | | |
| | | | 1,703,350 | |
| | | | | | | | | | | | |
| | | | Retail - 0.6% | |
| | | | CVS Health Corp. | |
| | | | | 1,743,000 | | | 2.80%, 07/20/2020 | | | 1,726,542 | |
| | | | | 883,000 | | | 3.88%, 07/20/2025 | | | 855,568 | |
| | | | | 1,690,000 | | | 5.13%, 07/20/2045 | | | 1,712,444 | |
| | | | | 1,060,000 | | | Home Depot, Inc.
3.50%, 09/15/2056 | | | 910,597 | |
| | | | | 270,000 | | | Lowe’s Cos., Inc.
3.70%, 04/15/2046 | | | 240,731 | |
| | | | | 1,950,000 | | | McDonald’s Corp.
3.35%, 04/01/2023 | | | 1,943,870 | |
| | | | | 315,000 | | | Suburban Propane Partners L.P. / Suburban Energy Finance Corp.
5.88%, 03/01/2027 | | | 294,525 | |
| | | | | 445,000 | | | United Rentals North America, Inc.
4.88%, 01/15/2028 | | | 412,048 | |
| | | | | | | | | | | | |
| Shares or Principal Amount | | Market Value† | |
| CORPORATE BONDS - 28.0% - (continued) | |
| | | | Retail - 0.6% - (continued) | |
| | $ | | | | 5,615,000 | | | Walmart, Inc.
3.40%, 06/26/2023 | | $ | 5,656,792 | |
| | | | | | | | | | | | |
| | | | 13,753,117 | |
| | | | | | | | | | | | |
| | | | Semiconductors - 0.4% | |
| | | | Broadcom Corp. / Broadcom Cayman Finance Ltd. | |
| | | | | 1,385,000 | | | 3.00%, 01/15/2022 | | | 1,347,135 | |
| | | | | 745,000 | | | 3.13%, 01/15/2025 | | | 691,108 | |
| | | | | 4,135,000 | | | 3.63%, 01/15/2024 | | | 4,002,714 | |
| | | | | 1,115,000 | | | Intel Corp.
4.10%, 05/19/2046 | | | 1,120,463 | |
| | | | | 1,875,000 | | | Microchip Technology, Inc.
4.33%, 06/01/2023(1) | | | 1,878,188 | |
| | | | | 525,000 | | | Sensata Technologies B.V.
5.00%, 10/01/2025(1) | | | 528,938 | |
| | | | | 310,000 | | | Sensata Technologies UK Financing Co. plc
6.25%, 02/15/2026(1) | | | 322,400 | |
| | | | | | | | | | | | |
| | | | 9,890,946 | |
| | | | | | | | | | | | |
| | | | Software - 0.5% | |
| | | | | 30,000 | | | CDK Global, Inc.
5.88%, 06/15/2026 | | | 30,570 | |
| | | | | 905,000 | | | Fidelity National Information Services, Inc.
4.25%, 05/15/2028 | | | 901,286 | |
| | | | First Data Corp. | |
| | | | | 100,000 | | | 5.00%, 01/15/2024(1) | | | 99,250 | |
| | | | | 480,000 | | | 5.38%, 08/15/2023(1) | | | 484,440 | |
| | | | Microsoft Corp. | |
| | | | | 180,000 | | | 3.30%, 02/06/2027 | | | 177,243 | |
| | | | | 1,620,000 | | | 3.70%, 08/08/2046 | | | 1,575,428 | |
| | | | | 1,615,000 | | | 3.95%, 08/08/2056 | | | 1,578,755 | |
| | | | | 465,000 | | | MSCI, Inc.
5.75%, 08/15/2025(1) | | | 478,950 | |
| | | | | 50,000 | | | Open Text Corp.
5.88%, 06/01/2026(1) | | | 51,000 | |
| | | | | 945,000 | | | Oracle Corp.
4.00%, 11/15/2047 | | | 889,501 | |
| | | | salesforce.com, Inc. | |
| | | | | 1,165,000 | | | 3.25%, 04/11/2023 | | | 1,158,169 | |
| | | | | 780,000 | | | 3.70%, 04/11/2028 | | | 774,422 | |
| | | | | 3,810,000 | | | Western Digital Corp.
4.75%, 02/15/2026 | | | 3,705,225 | |
| | | | | | | | | | | | |
| | | | 11,904,239 | |
| | | | | | | | | | | | |
| | | | Telecommunications - 2.2% | |
| | | | AT&T, Inc. | |
| | | | | 620,000 | | | 4.10%, 02/15/2028(1) | | | 592,455 | |
| | | | | 120,000 | | | 4.13%, 02/17/2026 | | | 117,290 | |
| | | | | 715,000 | | | 4.25%, 03/01/2027 | | | 699,781 | |
| | | | | 4,889,000 | | | 4.30%, 02/15/2030(1) | | | 4,614,758 | |
| | | | | 530,000 | | | 4.50%, 05/15/2035 | | | 490,220 | |
| | | | | 3,640,000 | | | 4.75%, 05/15/2046 | | | 3,251,529 | |
| | | | | 205,000 | | | 5.80%, 02/15/2019 | | | 208,518 | |
| | | | | 7,400,000 | | | GTP Acquisition Partners LLC
3.48%, 06/15/2050(1) | | | 7,217,859 | |
| | | | Nokia Oyj | |
| | | | | 1,190,000 | | | 4.38%, 06/12/2027 | | | 1,118,600 | |
| | | | | 575,000 | | | 6.63%, 05/15/2039 | | | 599,438 | |
| | | | | 420,000 | | | Sprint Communications, Inc.
7.00%, 03/01/2020(1) | | | 435,750 | |
| | | | | 425,000 | | | Sprint Corp.
7.13%, 06/15/2024 | | | 429,076 | |
The accompanying notes are an integral part of these financial statements.
|
| Hartford Total Return Bond HLS Fund |
Schedule of Investments – (continued)
June 30, 2018 (Unaudited)
| | | | | | | | | | | | |
| Shares or Principal Amount | | Market Value† | |
| CORPORATE BONDS - 28.0% - (continued) | |
| | | | Telecommunications - 2.2% - (continued) | |
| | $ | | | | 5,350,000 | | | Sprint Spectrum Co. LLC / Sprint Spectrum Co. II LLC / Sprint Spectrum Co. III LLC
5.15%, 09/20/2029(1) | | $ | 5,243,000 | |
| | | | Telecom Italia Capital S.A. | |
| | | | | 265,000 | | | 6.00%, 09/30/2034 | | | 252,545 | |
| | | | | 160,000 | | | 7.72%, 06/04/2038 | | | 172,000 | |
| | | | | 4,430,000 | | | Telecom Italia S.p.A.
5.30%, 05/30/2024(1) | | | 4,369,088 | |
| | | | Telefonica Emisiones SAU | |
| | | | | 555,000 | | | 4.67%, 03/06/2038 | | | 519,128 | |
| | | | | 925,000 | | | 4.90%, 03/06/2048 | | | 852,623 | |
| | | | | 370,000 | | | 5.21%, 03/08/2047 | | | 356,648 | |
| | | | Verizon Communications, Inc. | |
| | | | | 3,353,000 | | | 4.27%, 01/15/2036 | | | 3,093,138 | |
| | | | | 3,185,000 | | | 4.40%, 11/01/2034 | | | 2,970,434 | |
| | | | | 1,280,000 | | | 4.50%, 08/10/2033 | | | 1,239,529 | |
| | | | | 2,910,000 | | | 4.52%, 09/15/2048 | | | 2,653,079 | |
| | | | | 100,000 | | | 4.81%, 03/15/2039 | | | 96,696 | |
| | | | | 610,000 | | | 4.86%, 08/21/2046 | | | 582,899 | |
| | | | | 1,220,000 | | | 5.01%, 08/21/2054 | | | 1,146,379 | |
| | | | | 1,800,000 | | | 5.25%, 03/16/2037 | | | 1,848,598 | |
| | | | | 3,785,000 | | | Vodafone Group plc
4.38%, 05/30/2028 | | | 3,740,008 | |
| | | | | | | | | | | | |
| | | | 48,911,066 | |
| | | | | | | | | | | | |
| | | | Transportation - 0.5% | |
| | | | | 620,000 | | | Canadian Pacific Railway Co.
9.45%, 08/01/2021 | | | 724,872 | |
| | | | | 2,980,000 | | | CSX Corp.
3.25%, 06/01/2027 | | | 2,800,332 | |
| | | | FedEx Corp. | |
| | | | | 2,800,000 | | | 4.05%, 02/15/2048 | | | 2,515,129 | |
| | | | | 895,000 | | | 4.55%, 04/01/2046 | | | 868,469 | |
| | | | | 395,000 | | | 4.75%, 11/15/2045 | | | 393,367 | |
| | | | | 1,735,000 | | | Norfolk Southern Corp.
2.90%, 06/15/2026 | | | 1,618,825 | |
| | | | | 3,150,000 | | | Union Pacific Corp.
4.38%, 09/10/2038 | | | 3,185,189 | |
| | | | | | | | | | | | |
| | | | 12,106,183 | |
| | | | | | | | | | | | |
| | |
| | | | Total Corporate Bonds
(cost $645,832,583) | | $ | 625,365,268 | |
| | | | | | | | | | | | |
| | | |
| | | | | | | | | | | | |
| FOREIGN GOVERNMENT OBLIGATIONS - 1.4% | |
| | | | Argentina - 0.1% | |
| | EUR | | | | 1,780,000 | | | Argentine Republic Government International Bond
5.25%, 01/15/2028 | | | 1,777,275 | |
| | | | | | | | | | | | |
| | | | Egypt - 0.0% | |
| | $ | | | | 720,000 | | | Egypt Government International Bond
8.50%, 01/31/2047(8) | | | 696,686 | |
| | | | | | | | | | | | |
| | | | Ghana - 0.1% | |
| | | | | 1,140,000 | | | Ghana Government International Bond
8.63%, 06/16/2049(1) | | | 1,109,243 | |
| | | | | | | | | | | | |
| | | | Oman - 0.1% | |
| | | | | 1,370,000 | | | Oman Government International Bond
6.75%, 01/17/2048(1) | | | 1,239,850 | |
| | | | | | | | | | | | |
| | | | | | | | | | | | |
| Shares or Principal Amount | | Market Value† | |
| FOREIGN GOVERNMENT OBLIGATIONS - 1.4% - (continued) | |
| | | | Panama - 0.1% | |
| | | | Panama Government International Bond | |
| | $ | | | | 2,464,000 | | | 4.30%, 04/29/2053 | | $ | 2,297,680 | |
| | | | | 665,000 | | | 4.50%, 04/16/2050 | | | 640,063 | |
| | | | | | | | | | | | |
| | | | | | | | | | | 2,937,743 | |
| | | | | | | | | | | | |
| | | | | | | Qatar - 0.1% | |
| | | | | 2,600,000 | | | Qatar Government International Bond
5.10%, 04/23/2048(1) | | | 2,592,096 | |
| | | | | | | | | | | | |
| | | | | | | Romania - 0.2% | |
| | | | | 3,902,000 | | | Romanian Government International Bond
6.13%, 01/22/2044(8) | | | 4,374,922 | |
| | | | | | | | | | | | |
| | | | | | | Saudi Arabia - 0.3% | |
| | | | | | | | Saudi Government International Bond | |
| | | | | 2,885,000 | | | 4.50%, 10/26/2046(8) | | | 2,662,930 | |
| | | | | 4,850,000 | | | 4.63%, 10/04/2047(1)(6) | | | 4,521,073 | |
| | | | | | | | | | | | |
| | | | | | | | | | | 7,184,003 | |
| | | | | | | | | | | | |
| | | | | | | United Arab Emirates - 0.4% | |
| | | | | | | | Abu Dhabi Government International Bond | |
| | | | | 1,395,000 | | | 3.13%, 10/11/2027(1) | | | 1,298,187 | |
| | | | | 7,260,000 | | | 4.13%, 10/11/2047(1) | | | 6,643,815 | |
| | | | | | | | | | | | |
| | | | | | | | | | | 7,942,002 | |
| | | | | | | | | | | | |
| | | |
| | | | | | | | Total Foreign Government Obligations
(cost $31,445,684) | | $ | 29,853,820 | |
| | | | | | | | | | | | |
| | | |
| | | | | | | | | | | | |
| MUNICIPAL BONDS - 1.1% | |
| | | | | | | Education - 0.1% | |
| | | | | | | | Chicago, IL, Board of Education | |
| | | | | 740,000 | | | 6.14%, 12/01/2039 | | | 711,155 | |
| | | | | 1,750,000 | | | 6.32%, 11/01/2029 | | | 1,728,353 | |
| | | | | | | | | | | | |
| | | | | | | | | | | 2,439,508 | |
| | | | | | | | | | | | |
| | | | | | | General - 0.4% | |
| | | | | 2,810,000 | | | Chicago, IL, Transit Auth
6.90%, 12/01/2040 | | | 3,656,428 | |
| | | | | | | | Puerto Rico Commonwealth Government Employees Retirement System | | | | |
| | | | | 4,575,000 | | | 6.15%, 07/01/2038 | | | 1,830,000 | |
| | | | | 6,705,000 | | | 6.30%, 07/01/2043 | | | 2,682,000 | |
| | | | | | | | | | | | |
| | | | | | | | | | | 8,168,428 | |
| | | | | | | | | | | | |
| | | | | | | General Obligation - 0.6% | |
| | | | | 2,485,000 | | | California State, GO Taxable
7.55%, 04/01/2039 | | | 3,664,480 | |
| | | | | | | | City of Chicago, IL, GO | |
| | | | | 1,015,000 | | | 7.05%, 01/01/2029 | | | 1,101,580 | |
| | | | | 3,945,000 | | | 7.38%, 01/01/2033 | | | 4,386,327 | |
| | | | | | | | Illinois State, GO | |
| | | | | 2,270,000 | | | 5.38%, 07/01/2018 | | | 2,270,000 | |
| | | | | 3,160,000 | | | 5.88%, 03/01/2019 | | | 3,215,995 | |
| | | | | | | | | | | | |
| | | | | | | | | | | 14,638,382 | |
| | | | | | | | | | | | |
| | | |
| | | | | | | | Total Municipal Bonds
(cost $26,503,205) | | $ | 25,246,318 | |
| | | | | | | | | | | | |
| | | |
| | | | | | | | | | | | |
The accompanying notes are an integral part of these financial statements.
|
| Hartford Total Return Bond HLS Fund |
Schedule of Investments – (continued)
June 30, 2018 (Unaudited)
| | | | | | | | | | | | |
| Shares or Principal Amount | | Market Value† | |
| SENIOR FLOATING RATE INTERESTS - 2.8%(9) | |
| | | | | | | Advertising - 0.0% | |
| | $ | | | | 604,683 | | | Acosta Holdco, Inc.
1 mo. USD LIBOR + 3.250%, 5.34%, 09/26/2021(2) | | $ | 454,268 | |
| | | | | | | | | | | | |
| | | | | | | Aerospace/Defense - 0.0% | |
| | | | | 358,200 | | | Circor International, Inc.
1 mo. USD LIBOR + 3.500%, 5.56%, 12/11/2024(2) | | $ | 357,154 | |
| | | | | 576,617 | | | TransDigm, Inc.
1 mo. USD LIBOR + 2.500%, 4.59%, 06/09/2023(2) | | | 572,580 | |
| | | | | | | | | | | | |
| | | | | | | | | | | 929,734 | |
| | | | | | | | | | | | |
| | | | | | | Agriculture - 0.0% | |
| | | | | 730,927 | | | Pinnacle Operating Corp.
1 mo. USD LIBOR + 7.250%, 9.34%, 11/15/2021(2) | | | 671,539 | |
| | | | | | | | | | | | |
| | | | | | | Auto Manufacturers - 0.0% | |
| | | | | 154,613 | | | Navistar International Corp.
1 mo. USD LIBOR + 3.500%, 5.53%, 11/06/2024(2) | | | 154,517 | |
| | | | | | | | | | | | |
| | | | | | | Biotechnology - 0.1% | |
| | | | | 225,000 | | | Lifescan Global Corp.
1 mo. USD LIBOR + 6.000%, 0.00%, 05/23/2025(2)(10) | | | 217,688 | |
| | | | | 768,744 | | | Sotera Health Holdings LLC
1 mo. USD LIBOR + 3.000%, 5.33%, 05/15/2022(2) | | | 765,861 | |
| | | | | | | | | | | | |
| | | | | | | | | | | 983,549 | |
| | | | | | | | | | | | |
| | | | | | | Chemicals - 0.1% | |
| | | | | 724,050 | | | Chemours Co.
1 mo. USD LIBOR + 1.750%, 3.85%, 04/03/2025(2) | | | 714,094 | |
| | | | | 425,419 | | | Univar, Inc.
1 mo. USD LIBOR + 2.500%, 4.59%, 07/01/2024(2) | | | 424,125 | |
| | | | | | | | | | | | |
| | | | | | | | | | | 1,138,219 | |
| | | | | | | | | | | | |
| | | | | | | Coal - 0.0% | |
| | | | | 704,813 | | | Foresight Energy LLC
3 mo. USD LIBOR + 5.750%, 8.11%, 03/28/2022(2) | | | 699,308 | |
| | | | | 175,615 | | | Peabody Energy Corp.
1 mo. USD LIBOR + 2.750%, 4.84%, 03/31/2025(2) | | | 174,191 | |
| | | | | | | | | | | | |
| | | | | | | | | | | 873,499 | |
| | | | | | | | | | | | |
| | | | | | | Commercial Services - 0.2% | |
| | | | | 119,700 | | | Aramark Services, Inc.
1 mo. USD LIBOR + 1.750%, 4.08%, 03/11/2025(2) | | | 119,476 | |
| | | | | 124,063 | | | Ascend Learning LLC
1 mo. USD LIBOR + 3.000%, 5.09%, 07/12/2024(2) | | | 123,597 | |
| | | | | 135,000 | | | Asurion LLC
1 mo. USD LIBOR + 6.500%, 0.00%, 08/04/2025(2)(10) | | | 136,856 | |
| | | | | 205,000 | | | Blackhawk Network Holdings, Inc.
1 mo. USD LIBOR + 3.000%, 5.07%, 06/15/2025(2) | | | 204,231 | |
| | | | | | | | | | | | |
| Shares or Principal Amount | | Market Value† | |
| SENIOR FLOATING RATE INTERESTS - 2.8%(9) - (continued) | |
| | | | | | | Commercial Services - 0.2% - (continued) | |
| | $ | | | | 160,158 | | | Capital Automotive L.P.
1 mo. USD LIBOR + 6.000%, 8.10%, 03/24/2025(2) | | $ | 160,826 | |
| | | | | 100,000 | | | Energizer Holdings, Inc.
1 mo. USD LIBOR + 2.250%, 0.00%, 06/30/2025(2)(10) | | | 99,958 | |
| | | | | 605,769 | | | Quikrete Holdings, Inc.
1 mo. USD LIBOR + 2.750%, 4.84%, 11/15/2023(2) | | | 602,486 | |
| | EUR | | | | 180,000 | | | Techem GmbH
EURIBOR + 3.000%,
3.00%, 10/02/2024(2) | | | 209,416 | |
| | $ | | | | 1,019,700 | | | Tempo Acquisition LLC
1 mo. USD LIBOR + 3.000%, 5.09%, 05/01/2024(2) | | | 1,014,602 | |
| | | | | 141,375 | | | Weight Watchers International, Inc.
3 mo. USD LIBOR + 4.750%, 7.01%, 11/29/2024(2) | | | 142,745 | |
| | | | | 522,050 | | | Xerox Business Services LLC
1 mo. USD LIBOR + 3.000%, 4.59%, 12/07/2023(2) | | | 520,312 | |
| | | | | | | | | | | | |
| | | | | | | | | | | 3,334,505 | |
| | | | | | | | | | | | |
| | | | | | | Construction Materials - 0.0% | |
| | | | | 270,000 | | | Pisces Midco, Inc.
1 mo. USD LIBOR + 3.750%, 6.09%, 04/12/2025(2) | | | 269,158 | |
| | | | | | | | | | | | |
| | | | | | | Distribution/Wholesale - 0.0% | |
| | | | | 130,000 | | | Reece Ltd.
0.00%, 05/30/2025(4)(10) | | | 129,350 | |
| | | | | | | | | | | | |
| | | | | | | Diversified Financial Services - 0.1% | |
| | | | | 464,125 | | | AlixPartners LLP
3 mo. USD LIBOR + 2.750%, 4.84%, 04/04/2024(2) | | | 463,313 | |
| | | | | 224,438 | | | Crown Finance U.S., Inc.
1 mo. USD LIBOR + 2.500%, 4.59%, 02/28/2025(2) | | | 222,595 | |
| | EUR | | | | 185,208 | | | Nets Holding A/S
EURIBOR + 3.250%,
3.25%, 02/06/2025(2) | | | 212,291 | |
| | $ | | | | 280,725 | | | RP Crown Parent LLC
1 mo. USD LIBOR + 2.750%, 4.84%, 10/12/2023(2) | | | 278,268 | |
| | | | | 73,649 | | | SS&C Technologies Holdings Europe S.a.r.l.
1 mo. USD LIBOR + 2.500%, 4.59%, 04/16/2025(2) | | | 73,608 | |
| | | | | | | | | | | | |
| | | | 1,250,075 | |
| | | | | | | | | | | | |
| | | | Electric - 0.0% | |
| | | | | 230,804 | | | Helix Gen Funding LLC
1 mo. USD LIBOR + 3.750%, 5.84%, 06/02/2024(2) | | | 231,044 | |
| | | | | 340,327 | | | Seadrill Partners Finco LLC
3 mo. USD LIBOR + 6.000%, 8.33%, 02/21/2021(2) | | | 304,263 | |
| | | | | | | | | | | | |
| | | | 535,307 | |
| | | | | | | | | | | | |
| | | | Energy - Alternate Sources - 0.0% | |
| | | | | 265,000 | | | BCP Renaissance Parent LLC
3 mo. USD LIBOR + 4.000%, 5.86%, 10/31/2024(2) | | | 264,295 | |
The accompanying notes are an integral part of these financial statements.
|
| Hartford Total Return Bond HLS Fund |
Schedule of Investments – (continued)
June 30, 2018 (Unaudited)
| | | | | | | | | | | | |
| Shares or Principal Amount | | Market Value† | |
| SENIOR FLOATING RATE INTERESTS - 2.8%(9) - (continued) | |
| | | | Energy - Alternate Sources - 0.0% - (continued) | |
| | $ | | | | 99,500 | | | Medallion Midland Acquisition LLC
1 mo. USD LIBOR + 3.250%,
5.34%, 10/30/2024(2) | | $ | 98,505 | |
| | | | | | | | | | | | |
| | | | 362,800 | |
| | | | | | | | | | | | |
| | | | Engineering & Construction - 0.0% | |
| | | | | 99,750 | | | ATS Consolidated, Inc.
1 mo. USD LIBOR + 3.750%,
5.84%, 02/28/2025(2) | | | 99,999 | |
| | | | | 742,500 | | | Brand Energy & Infrastructure Services, Inc.
3 mo. USD LIBOR + 4.250%,
6.61%, 06/21/2024(2) | | | 743,057 | |
| | | | | | | | | | | | |
| | | | 843,056 | |
| | | | | | | | | | | | |
| | | | Entertainment - 0.0% | |
| | | | | 230,985 | | | Camelot UK Holdco Ltd.
1 mo. USD LIBOR + 3.250%,
5.34%, 10/03/2023(2) | | | 230,062 | |
| | | | | 432,828 | | | Scientific Games International, Inc.
2 mo. USD LIBOR + 2.750%,
4.91%, 08/14/2024(2) | | | 429,581 | |
| | | | | | | | | | | | |
| | | | 659,643 | |
| | | | | | | | | | | | |
| | | | Food - 0.1% | |
| | | | | 100,000 | | | CHG PPC Parent LLC
1 mo. USD LIBOR + 2.750%,
4.84%, 03/31/2025(2) | | | 99,500 | |
| | | | | 498,426 | | | Hostess Brands LLC
1 mo. USD LIBOR + 2.250%,
4.34%, 08/03/2022(2) | | | 494,687 | |
| | | | | 782,100 | | | Post Holdings, Inc.
1 mo. USD LIBOR + 2.000%,
4.10%, 05/24/2024(2) | | | 776,829 | |
| | | | | | | | | | | | |
| | | | 1,371,016 | |
| | | | | | | | | | | | |
| | | | Healthcare - Products - 0.1% | |
| | | | | 273,625 | | | Avantor, Inc.
1 mo. USD LIBOR + 4.000%,
6.09%, 11/21/2024(2) | | | 274,766 | |
| | | | | 351,450 | | | Kinetic Concepts, Inc.
3 mo. USD LIBOR + 3.250%,
5.58%, 02/02/2024(2) | | | 351,559 | |
| | | | | 233,238 | | | Parexel International Corp.
1 mo. USD LIBOR + 2.750%,
4.84%, 09/27/2024(2) | | | 231,780 | |
| | | | | 294,750 | | | Revlon Consumer Products Corp.
1 mo. USD LIBOR + 3.500%,
5.59%, 09/07/2023(2) | | | 226,957 | |
| | | | | | | | | | | | |
| | | | 1,085,062 | |
| | | | | | | | | | | | |
| | | | Healthcare - Services - 0.2% | |
| | | | | 360,937 | | | CDRH Parent, Inc.
3 mo. USD LIBOR + 4.250%,
6.57%, 07/01/2021(2) | | | 337,476 | |
| | | | | 175,771 | | | Community Health Systems, Inc.
3 mo. USD LIBOR + 3.000%,
5.31%, 12/31/2019(2) | | | 175,414 | |
| | | | DentalCorp Perfect Smile ULC | |
| | | | | 26,420 | | | 0.00%, 06/06/2025(4)(10)(11) | | | 26,469 | |
| | | | | 105,678 | | | 1 mo. USD LIBOR + 3.750%,
5.76%, 06/06/2025(2) | | | 105,877 | |
| | | | | | | | | | | | |
| Shares or Principal Amount | | Market Value† | |
| SENIOR FLOATING RATE INTERESTS - 2.8%(9) - (continued) | |
| | | | Healthcare - Services - 0.2% - (continued) | |
| | $ | | | | 302,804 | | | Envision Healthcare Corp.
1 mo. USD LIBOR + 3.000%,
5.10%, 12/01/2023(2) | | $ | 302,174 | |
| | | | | 189,605 | | | Gentiva Health Services, Inc.
1 mo. USD LIBOR + 3.500%,
0.00%, 06/02/2025(2)(10) | | | 188,183 | |
| | | | | 311,595 | | | Global Medical Response, Inc.
1 mo. USD LIBOR + 3.250%,
5.28%, 04/28/2022(2) | | | 302,313 | |
| | EUR | | | | 220,000 | | | IQVIA, Inc.
EURIBOR + 2.000%,
2.50%, 06/07/2025(2) | | | 254,105 | |
| | | | | 686,637 | | | Jaguar Holding Co.
3 mo. USD LIBOR + 2.500%,
4.59%, 08/18/2022(2) | | | 682,607 | |
| | | | | 490,447 | | | MPH Acquisition Holdings LLC
3 mo. USD LIBOR + 2.750%,
5.08%, 06/07/2023(2) | | | 487,304 | |
| | | | | 233,404 | | | One Call Corp.
1 mo. USD LIBOR + 5.250%,
7.32%, 11/25/2022(2) | | | 222,901 | |
| | | | | 370,828 | | | Syneos Health, Inc.
1 mo. USD LIBOR + 2.000%,
4.09%, 08/01/2024(2) | | | 368,685 | |
| | | | | 1,015,428 | | | U.S. Renal Care, Inc.
3 mo. USD LIBOR + 4.250%,
6.55%, 12/31/2022(2) | | | 999,770 | |
| | | | | | | | | | | | |
| | | | 4,453,278 | |
| | | | | | | | | | | | |
| | | | Household Products - 0.0% | |
| | | | | 293,525 | | | Diamond (BC) B.V.
2 mo. USD LIBOR + 3.000%,
5.10%, 09/06/2024(2) | | | 287,654 | |
| | | | | | | | | | | | |
| | | | Insurance - 0.2% | |
| | | | Asurion LLC | |
| | | | | 898,912 | | | 1 mo. USD LIBOR + 2.750%,
4.84%, 08/04/2022(2) | | | 896,665 | |
| | | | | 240,000 | | | 1 mo. USD LIBOR + 6.000%,
8.09%, 08/04/2025(2) | | | 243,300 | |
| | | | | 427,687 | | | Evertec Group LLC
1 mo. USD LIBOR + 2.500%,
4.59%, 04/17/2020(2) | | | 425,549 | |
| | | | | 225,000 | | | Hub International Ltd.
2 mo. USD LIBOR + 3.000%,
5.36%, 04/25/2025(2) | | | 223,511 | |
| | | | Sedgwick Claims Management Services, Inc. | |
| | | | | 895,844 | | | 1 mo. USD LIBOR + 2.750%,
4.84%, 03/01/2021(2) | | | 890,057 | |
| | | | | 1,250,000 | | | 1 mo. USD LIBOR + 5.750%,
7.89%, 02/28/2022(2) | | | 1,253,912 | |
| | | | | 530,988 | | | USI, Inc.
3 mo. USD LIBOR + 3.000%,
5.33%, 05/16/2024(2) | | | 527,403 | |
| | | | | | | | | | | | |
| | | | 4,460,397 | |
| | | | | | | | | | | | |
| | | | Internet - 0.0% | |
| | | | | 613,887 | | | Lands’ End, Inc.
1 mo. USD LIBOR + 3.250%,
5.34%, 04/04/2021(2) | | | 592,401 | |
| | | | | | | | | | | | |
| | | | IT Services - 0.0% | |
| | | | | 155,000 | | | Trans Union LLC
1 mo. USD LIBOR + 2.000%,
0.00%, 06/08/2025(2)(10) | | | 154,419 | |
| | | | | | | | | | | | |
The accompanying notes are an integral part of these financial statements.
|
| Hartford Total Return Bond HLS Fund |
Schedule of Investments – (continued)
June 30, 2018 (Unaudited)
| | | | | | | | | | | | |
| Shares or Principal Amount | | Market Value† | |
| SENIOR FLOATING RATE INTERESTS - 2.8%(9) - (continued) | |
| | | | Leisure Time - 0.1% | |
| | $ | | | | 442,935 | | | Caesars Resort Collection LLC
1 mo. USD LIBOR + 2.750%,
4.84%, 12/22/2024(2) | | $ | 441,204 | |
| | | | | 1,120,546 | | | Delta (LUX) S.a.r.l.
1 mo. USD LIBOR + 2.500%,
4.59%, 02/01/2024(2) | | | 1,104,443 | |
| | | | | 756,200 | | | Golden Entertainment, Inc.
1 mo. USD LIBOR + 3.000%,
5.10%, 10/20/2024(2) | | | 753,841 | |
| | | | | | | | | | | | |
| | | | 2,299,488 | |
| | | | | | | | | | | | |
| | | | Lodging - 0.1% | |
| | | | | 252,056 | | | Boyd Gaming Corp.
1 Week USD LIBOR + 2.500%,
4.49%, 09/15/2023(2) | | | 252,405 | |
| | | | | 661,675 | | | Caesars Entertainment Operating Co.
1 mo. USD LIBOR + 2.000%,
4.09%, 10/06/2024(2) | | | 656,163 | |
| | | | | 120,000 | | | Wyndham Hotels & Resorts, Inc.
1 mo. USD LIBOR + 1.750%,
3.73%, 05/30/2025(2) | | | 119,700 | |
| | | | | | | | | | | | |
| | | | 1,028,268 | |
| | | | | | | | | | | | |
| | | | Machinery - Construction & Mining - 0.0% | |
| | | | | 94,545 | | | Pike Corp.
1 mo. USD LIBOR + 3.500%,
5.60%, 03/23/2025(2) | | | 94,742 | |
| | | | | | | | | | | | |
| | | | Machinery - Diversified - 0.0% | |
| | | | | 466,634 | | | Gates Global LLC
3 mo. USD LIBOR + 2.750%,
5.08%, 04/01/2024(2) | | | 465,882 | |
| | | | | 100,000 | | | Zodiac Pool Solutions LLC
1 mo. USD LIBOR + 2.250%,
0.00%, 03/31/2025(2)(10) | | | 99,542 | |
| | | | | | | | | | | | |
| | | | 565,424 | |
| | | | | | | | | | | | |
| | | | Media - 0.2% | |
| | | | | 194,025 | | | Altice Financing S.A.
3 mo. USD LIBOR + 2.750%, 5.10%, 01/31/2026(2) | | | 189,902 | |
| | | | | 1,543,827 | | | Charter Communications Operating LLC
1 mo. USD LIBOR + 2.000%, 4.10%, 04/30/2025(2) | | | 1,540,446 | |
| | EUR | | | | 104,738 | | | Crown Finance U.S., Inc.
EURIBOR + 2.625%,
2.63%, 02/28/2025(2) | | | 120,828 | |
| | $ | | | | 220,000 | | | CSC Holdings LLC
1 mo. USD LIBOR + 2.500%, 4.57%, 01/25/2026(2) | | | 219,083 | |
| | | | | 269,508 | | | MTN Infrastructure TopCo, Inc.
1 mo. USD LIBOR + 3.250%, 5.09%, 11/15/2024(2) | | | 269,591 | |
| | | | | 701,152 | | | Numericable Group S.A.
3 mo. USD LIBOR + 3.000%, 5.35%, 01/31/2026(2) | | | 688,384 | |
| | | | | 194,513 | | | PSAV Holdings LLC
3 mo. USD LIBOR + 3.250%, 5.24%, 03/01/2025(2) | | | 192,242 | |
| | | | | 160,000 | | | Shutterfly, Inc.
1 mo. USD LIBOR + 2.750%, 4.85%, 08/17/2024(2) | | | 160,067 | |
| | | | | | | | | | | | |
| Shares or Principal Amount | | Market Value† | |
| SENIOR FLOATING RATE INTERESTS - 2.8%(9) - (continued) | |
| | | | Media - 0.2% - (continued) | |
| | $ | | | | 395,000 | | | Sinclair Television Group, Inc.
1 mo. USD LIBOR + 2.250%, 0.00%, 12/12/2024(2)(10) | | $ | 393,274 | |
| | | | | 220,000 | | | Telenet Financing USD LLC
1 mo. USD LIBOR + 2.250%, 4.32%, 08/17/2026(2) | | | 217,708 | |
| | | | | 525,000 | | | UPC Financing Partnership
1 mo. USD LIBOR + 2.500%, 4.57%, 01/15/2026(2) | | | 518,584 | |
| | | | | | | | | | | | |
| | | | 4,510,109 | |
| | | | | | | | | | | | |
| | | | Metal Fabricate/Hardware - 0.0% | |
| | | | | 298,561 | | | Rexnord LLC
1 mo. USD LIBOR + 2.250%, 4.34%, 08/21/2024(2) | | | 298,003 | |
| | | | | | | | | | | | |
| | | | Miscellaneous Manufacturing - 0.0% | |
| | EUR | | | | 200,000 | | | CTC AcquiCo GmbH
EURIBOR + 3.000%,
3.00%, 03/07/2025(2) | | | 230,554 | |
| | $ | | | | 158,084 | | | H.B. Fuller Co.
1 mo. USD LIBOR + 2.000%, 4.08%, 10/20/2024(2) | | | 156,701 | |
| | | | | | | | | | | | |
| | | | 387,255 | |
| | | | | | | | | | | | |
| | | | Oil & Gas - 0.1% | |
| | | | | 90,000 | | | Ascent Resources - Marcellus LLC
1 mo. USD LIBOR + 6.500%, 8.50%, 03/30/2023(2) | | | 90,000 | |
| | | | | 257,400 | | | BCP Raptor LLC
2 mo. USD LIBOR + 4.250%, 6.42%, 06/24/2024(2) | | | 251,287 | |
| | | | | 455,000 | | | California Resources Corp.
1 mo. USD LIBOR + 10.375%, 12.47%, 12/31/2021(2) | | | 502,775 | |
| | | | | 470,000 | | | Chesapeake Energy Corp.
3 mo. USD LIBOR + 7.500%, 9.59%, 08/23/2021(2) | | | 491,248 | |
| | | | | 764,040 | | | Fieldwood Energy LLC
1 mo. USD LIBOR + 5.250%, 7.34%, 04/11/2022(2) | | | 764,422 | |
| | | | | 790,575 | | | Philadelphia Energy Solutions LLC
PRIME + 4.000%,
9.00%, 04/04/2019(2) | | | 735,235 | |
| | | | | 120,000 | | | Traverse Midstream Partners LLC
3 mo. USD LIBOR + 4.000%, 6.34%, 09/27/2024(2) | | | 119,850 | |
| | | | | | | | | | | | |
| | | | 2,954,817 | |
| | | | | | | | | | | | |
| | | | Oil & Gas Services - 0.0% | |
| | | | EG Group Ltd. | |
| | EUR | | | | 79,561 | | | 1 mo. USD LIBOR + 4.000%, 0.00%, 02/06/2025(2)(10)(11) | | | 91,711 | |
| | | | | 156,953 | | | EURIBOR + 4.000%,
4.00%, 02/06/2025(2) | | | 181,202 | |
| | | | | | | | | | | | |
| | | | 272,913 | |
| | | | | | | | | | | | |
| | | | Packaging & Containers - 0.1% | |
| | $ | | | | 1,179,988 | | | Berry Global, Inc.
1 mo. USD LIBOR + 1.750%, 3.92%, 02/08/2020(2) | | | 1,176,872 | |
| | | | | 115,000 | | | Crown Americas LLC
3 mo. USD LIBOR + 2.000%, 4.31%, 01/29/2025(2) | | | 114,952 | |
The accompanying notes are an integral part of these financial statements.
|
| Hartford Total Return Bond HLS Fund |
Schedule of Investments – (continued)
June 30, 2018 (Unaudited)
| | | | | | | | | | | | |
| Shares or Principal Amount | | Market Value† | |
| SENIOR FLOATING RATE INTERESTS - 2.8%(9) - (continued) | |
| | | | Packaging & Containers - 0.1% - (continued) | |
| | $ | | | | 405,900 | | | Flex Acquisition Co., Inc.
3 mo. USD LIBOR + 3.000%, 5.31%, 12/29/2023(2) | | $ | 403,806 | |
| | | | | 201,925 | | | Proampac PG Borrower LLC
1 mo. USD LIBOR + 3.500%, 5.61%, 11/18/2023(2) | | | 200,600 | |
| | | | | 1,198,117 | | | Reynolds Group Holdings, Inc.
1 mo. USD LIBOR + 2.750%, 4.84%, 02/05/2023(2) | | | 1,194,619 | |
| | | | | | | | | | | | |
| | | | 3,090,849 | |
| | | | | | | | | | | | |
| | | | Pharmaceuticals - 0.1% | |
| | | | | 811,800 | | | Endo Luxembourg Finance Co. I S.a r.l.
1 mo. USD LIBOR + 4.250%, 6.38%, 04/29/2024(2) | | | 809,771 | |
| | | | | 518,099 | | | Valeant Pharmaceuticals International, Inc.
1 mo. USD LIBOR + 3.000%, 4.98%, 06/01/2025(2) | | | 515,995 | |
| | | | | | | | | | | | |
| | | | 1,325,766 | |
| | | | | | | | | | | | |
| | | | Real Estate - 0.2% | |
| | | | | 721,166 | | | DTZ U.S. Borrower LLC
3 mo. USD LIBOR + 3.250%, 5.57%, 11/04/2021(2) | | | 719,442 | |
| | | | | 286,364 | | | VICI Properties LLC
1 mo. USD LIBOR + 2.000%, 4.08%, 12/20/2024(2) | | | 284,127 | |
| | | | | 2,900,000 | | | Willowbrook Dus
0.00%, 07/01/2030(4)(10) | | | 2,909,856 | |
| | | | | | | | | | | | |
| | | | 3,913,425 | |
| | | | | | | | | | | | |
| | | | Retail - 0.3% | |
| | | | Albertsons LLC | |
| | | | | 623,456 | | | 1 mo. USD LIBOR + 2.750%, 4.84%, 08/25/2021(2) | | | 616,941 | |
| | | | | 304,604 | | | 3 mo. USD LIBOR + 3.000%, 5.34%, 12/21/2022(2) | | | 301,616 | |
| | | | | 986,957 | | | American Builders & Contractors Supply Co., Inc.
1 mo. USD LIBOR + 2.000%, 4.09%, 10/31/2023(2) | | | 977,759 | |
| | | | | 664,975 | | | Bass Pro Group LLC
1 mo. USD LIBOR + 5.000%, 7.09%, 09/25/2024(2) | | | 665,394 | |
| | | | | 569,762 | | | Coty, Inc.
1 mo. USD LIBOR + 2.250%, 4.28%, 04/07/2025(2) | | | 556,230 | |
| | | | | 498,078 | | | Harbor Freight Tools USA, Inc.
1 mo. USD LIBOR + 2.500%, 4.59%, 08/18/2023(2) | | | 495,279 | |
| | | | | 949,313 | | | Neiman Marcus Group Ltd. LLC
1 mo. USD LIBOR + 3.250%, 5.26%, 10/25/2020(2) | | | 839,904 | |
| | | | | 135,000 | | | Rodan & Fields LLC
1 mo. USD LIBOR + 4.000%, 0.00%, 06/06/2025(2)(10) | | | 134,916 | |
| | | | | 389,045 | | | Staples, Inc.
3 mo. USD LIBOR + 4.000%, 6.36%, 09/12/2024(2) | | | 383,575 | |
| | | | | 503,399 | | | U.S. Foods, Inc.
1 mo. USD LIBOR + 2.500%, 4.09%, 06/27/2023(2) | | | 502,458 | |
| | | | | | | | | | | | |
| | | | 5,474,072 | |
| | | | | | | | | | | | |
| | | | | | | | | | | | |
| Shares or Principal Amount | | Market Value† | |
| SENIOR FLOATING RATE INTERESTS - 2.8%(9) - (continued) | |
| | | | Semiconductors - 0.0% | |
| | $ | | | | 210,000 | | | Microchip Technology, Inc.
1 mo. USD LIBOR + 2.000%, 4.10%, 05/29/2025(2) | | $ | 209,563 | |
| | | | | | | | | | | | |
| | | | Software - 0.4% | |
| | | | | 545,875 | | | Almonde, Inc.
3 mo. USD LIBOR + 3.500%, 5.81%, 06/13/2024(2) | | | 535,716 | |
| | | | | 228,851 | | | Aristocrat Technologies, Inc.
3 mo. USD LIBOR + 1.750%, 4.11%, 10/19/2024(2) | | | 227,098 | |
| | | | | 740,625 | | | Change Healthcare Holdings LLC
1 mo. USD LIBOR + 2.750%, 4.84%, 03/01/2024(2) | | | 737,729 | |
| | | | | 346,836 | | | Epicor Software Corp.
1 mo. USD LIBOR + 3.250%, 5.35%, 06/01/2022(2) | | | 345,536 | |
| | | | | 2,329,646 | | | First Data Corp.
1 mo. USD LIBOR + 2.250%, 4.09%, 04/26/2024(2) | | | 2,314,247 | |
| | | | | 816,757 | | | Hyland Software, Inc.
1 mo. USD LIBOR + 3.250%, 5.34%, 07/01/2022(2) | | | 817,607 | |
| | | | | 832,754 | | | Infor U.S., Inc.
1 mo. USD LIBOR + 2.750%, 4.84%, 02/01/2022(2) | | | 827,966 | |
| | | | | 140,000 | | | Quest Software U.S. Holdings, Inc.
3 mo. USD LIBOR + 4.250%, 6.58%, 05/16/2025(2) | | | 139,359 | |
| | | | | 194,677 | | | SS&C Technologies, Inc.
1 mo. USD LIBOR + 2.500%, 4.59%, 04/16/2025(2) | | | 194,568 | |
| | | | | 1,651,300 | | | WEX, Inc.
1 mo. USD LIBOR + 2.250%, 4.34%, 06/30/2023(2) | | | 1,649,698 | |
| | | | | | | | | | | | |
| | | | 7,789,524 | |
| | | | | | | | | | | | |
| | | | Telecommunications - 0.1% | |
| | | | | 300,000 | | | Level 3 Financing, Inc.
1 mo. USD LIBOR + 2.250%, 4.33%, 02/22/2024(2) | | | 298,875 | |
| | | | | 1,007,250 | | | Sprint Communications, Inc.
1 mo. USD LIBOR + 2.500%, 4.63%, 02/02/2024(2) | | | 1,001,791 | |
| | | | | 440,000 | | | Unitymedia Finance LLC
1 mo. USD LIBOR + 2.250%, 4.32%, 09/30/2025(2) | | | 436,427 | |
| | | | | 664,139 | | | Univision Communications, Inc.
1 mo. USD LIBOR + 2.750%, 4.84%, 03/15/2024(2) | | | 641,173 | |
| | | | | 160,000 | | | Zacapa LLC
1 mo. USD LIBOR + 5.000%, 0.00%, 07/03/2025(2)(10) | | | 159,200 | |
| | | | | 361,056 | | | Zayo Group LLC
1 mo. USD LIBOR + 2.250%, 4.34%, 01/19/2024(2) | | | 360,543 | |
| | | | | | | | | | | | |
| | | | 2,898,009 | |
| | | | | | | | | | | | |
| | |
| | | | Total Senior Floating Rate Interests
(cost $62,768,738) | | $ | 62,105,673 | |
| | | | | | | | | | | | |
The accompanying notes are an integral part of these financial statements.
|
| Hartford Total Return Bond HLS Fund |
Schedule of Investments – (continued)
June 30, 2018 (Unaudited)
| | | | | | | | | | | | |
| Shares or Principal Amount | | Market Value† | |
| U.S. GOVERNMENT AGENCIES - 57.0% | |
| | | | Mortgage-Backed Agencies - 57.0% | |
| | | | FHLMC - 17.9% | |
| | $ | | | | 146,600 | | | 0.00%, 11/15/2036(12) | | $ | 133,156 | |
| | | | | 54,797,170 | | | 0.32%, 10/25/2020(4)(5) | | | 202,097 | |
| | | | | 21,118,119 | | | 0.74%, 03/25/2027(4)(5) | | | 955,572 | |
| | | | | 2,531,432 | | | 1.75%, 10/15/2042 | | | 2,391,117 | |
| | | | | 11,483,953 | | | 2.06%, 08/25/2018(4)(5) | | | 10,704 | |
| | | | | 998,932 | | | 2.50%, 05/15/2028(5) | | | 75,049 | |
| | | | | 3,197,654 | | | 3.00%, 03/15/2028(5) | | | 251,899 | |
| | | | | 2,908,690 | | | 3.00%, 08/01/2029 | | | 2,903,041 | |
| | | | | 1,418,582 | | | 3.00%, 05/15/2032(5) | | | 104,322 | |
| | | | | 1,005,328 | | | 3.00%, 03/15/2033(5) | | | 124,517 | |
| | | | | 18,012,413 | | | 3.00%, 04/01/2033 | | | 17,894,257 | |
| | | | | 10,050,000 | | | 3.00%, 07/01/2033(13) | | | 9,978,904 | |
| | | | | 6,322,729 | | | 3.00%, 11/01/2036 | | | 6,234,993 | |
| | | | | 4,103,733 | | | 3.00%, 01/01/2037 | | | 4,040,440 | |
| | | | | 4,225,000 | | | 3.00%, 08/15/2043 | | | 4,052,718 | |
| | | | | 1,393,133 | | | 3.00%, 05/15/2046 | | | 1,376,052 | |
| | | | | 10,031,552 | | | 3.00%, 11/01/2046 | | | 9,738,198 | |
| | | | | 1,840,802 | | | 3.00%, 12/01/2046 | | | 1,788,311 | |
| | | | | 19,115,259 | | | 3.00%, 01/01/2048 | | | 18,514,526 | |
| | | | | 5,297,449 | | | 3.00%, 02/15/2048 | | | 5,255,622 | |
| | | | | 45,950,000 | | | 3.00%, 07/01/2048(13) | | | 44,473,829 | |
| | | | | 1,702,866 | | | 3.50%, 06/15/2026(5) | | | 113,335 | |
| | | | | 584,863 | | | 3.50%, 09/15/2026(5) | | | 53,072 | |
| | | | | 1,011,264 | | | 3.50%, 03/15/2027(5) | | | 88,668 | |
| | | | | 9,200,000 | | | 3.50%, 07/01/2033(13) | | | 9,303,049 | |
| | | | | 5,506,141 | | | 3.50%, 08/01/2034 | | | 5,565,965 | |
| | | | | 3,606,380 | | | 3.50%, 03/15/2041(5) | | | 443,451 | |
| | | | | 1,573,394 | | | 3.50%, 06/01/2046 | | | 1,569,538 | |
| | | | | 6,450,063 | | | 3.50%, 10/01/2047 | | | 6,420,591 | |
| | | | | 70,676,000 | | | 3.50%, 07/01/2048(13) | | | 70,305,007 | |
| | | | | 4,988,096 | | | 4.00%, 08/01/2025 | | | 5,132,117 | |
| | | | | 2,247,191 | | | 4.00%, 12/15/2026(5) | | | 194,110 | |
| | | | | 3,875,991 | | | 4.00%, 07/15/2027(5) | | | 367,524 | |
| | | | | 1,642,461 | | | 4.00%, 03/15/2028(5) | | | 166,139 | |
| | | | | 879,963 | | | 4.00%, 06/15/2028(5) | | | 92,120 | |
| | | | | 2,275,693 | | | 4.00%, 07/15/2030(5) | | | 243,819 | |
| | | | | 4,396,030 | | | 4.00%, 05/01/2042 | | | 4,519,312 | |
| | | | | 1,342,054 | | | 4.00%, 08/01/2042 | | | 1,379,758 | |
| | | | | 1,898,513 | | | 4.00%, 09/01/2042 | | | 1,950,091 | |
| | | | | 474,409 | | | 4.00%, 07/01/2044 | | | 487,590 | |
| | | | | 322,217 | | | 4.00%, 06/01/2045 | | | 329,365 | |
| | | | | 1,766,429 | | | 4.00%, 02/01/2046 | | | 1,807,814 | |
| | | | | 82,475,000 | | | 4.00%, 07/01/2048(13) | | | 84,064,359 | |
| | | | | 944,479 | | | 4.50%, 09/01/2044 | | | 984,116 | |
| | | | | 27,420,000 | | | 4.50%, 07/01/2048(13) | | | 28,530,888 | |
| | | | | 13,400,000 | | | 4.50%, 08/01/2048(13) | | | 13,917,767 | |
| | | | | 2,842,593 | | | 4.75%, 07/15/2039 | | | 3,023,138 | |
| | | | | 110,624 | | | 5.00%, 03/01/2028 | | | 116,794 | |
| | | | | 417,860 | | | 5.00%, 03/01/2031 | | | 443,826 | |
| | | | | 713,897 | | | 5.00%, 05/01/2031 | | | 758,473 | |
| | | | | 873,808 | | | 5.00%, 09/01/2031 | | | 922,547 | |
| | | | | 850,935 | | | 5.00%, 11/01/2031 | | | 899,813 | |
| | | | | 250,599 | | | 5.00%, 07/01/2032 | | | 265,156 | |
| | | | | 1,324,920 | | | 5.00%, 09/15/2033(5) | | | 255,744 | |
| | | | | 17,529 | | | 5.00%, 12/01/2034 | | | 18,507 | |
| | | | | 19,987 | | | 5.00%, 11/01/2035 | | | 21,264 | |
| | | | | 36,768 | | | 5.00%, 03/01/2039 | | | 39,193 | |
| | | | | 440,128 | | | 5.00%, 08/01/2039 | | | 469,660 | |
| | | | | 17,588 | | | 5.00%, 09/01/2039 | | | 18,689 | |
| | | | | | | | | | | | |
| Shares or Principal Amount | | Market Value† | |
| U.S. GOVERNMENT AGENCIES - 57.0% - (continued) | |
| | | | Mortgage-Backed Agencies - 57.0% - (continued) | |
| | | | FHLMC - 17.9% - (continued) | |
| | $ | | | | 16,705 | | | 5.00%, 12/01/2039 | | $ | 17,867 | |
| | | | | 18,647 | | | 5.00%, 04/01/2041 | | | 19,910 | |
| | | | | 44,449 | | | 5.00%, 04/01/2044 | | | 47,402 | |
| | | | | 23,579 | | | 5.00%, 05/01/2044 | | | 24,994 | |
| | | | | 4,450,000 | | | 5.00%, 07/01/2048(13) | | | 4,697,257 | |
| | | | | 50 | | | 5.50%, 10/01/2018 | | | 50 | |
| | | | | 54,687 | | | 5.50%, 03/01/2028 | | | 58,467 | |
| | | | | 93,509 | | | 5.50%, 04/01/2033 | | | 101,332 | |
| | | | | 1,073,987 | | | 5.50%, 05/01/2034 | | | 1,164,809 | |
| | | | | 1,440 | | | 5.50%, 11/01/2035 | | | 1,561 | |
| | | | | 22,482 | | | 5.50%, 05/01/2037 | | | 24,308 | |
| | | | | 56,847 | | | 5.50%, 11/01/2037 | | | 61,512 | |
| | | | | 99,998 | | | 5.50%, 02/01/2038 | | | 108,162 | |
| | | | | 41,973 | | | 5.50%, 04/01/2038 | | | 45,405 | |
| | | | | 52,038 | | | 5.50%, 06/01/2038 | | | 56,273 | |
| | | | | 5,804,234 | | | 5.50%, 08/01/2038 | | | 6,282,120 | |
| | | | | 575,264 | | | 5.50%, 09/01/2038 | | | 622,270 | |
| | | | | 11,455 | | | 5.50%, 12/01/2039 | | | 12,391 | |
| | | | | 150,423 | | | 5.50%, 02/01/2040 | | | 162,743 | |
| | | | | 490,303 | | | 5.50%, 05/01/2040 | | | 530,480 | |
| | | | | 488,627 | | | 5.50%, 08/01/2040 | | | 528,591 | |
| | | | | 2,052,254 | | | 5.50%, 06/01/2041 | | | 2,220,163 | |
| | | | | 1,530 | | | 6.00%, 07/01/2029 | | | 1,673 | |
| | | | | 264,101 | | | 6.00%, 10/01/2032 | | | 291,217 | |
| | | | | 310,514 | | | 6.00%, 11/01/2032 | | | 340,706 | |
| | | | | 327,078 | | | 6.00%, 12/01/2032 | | | 360,727 | |
| | | | | 22,195 | | | 6.00%, 11/01/2033 | | | 24,488 | |
| | | | | 37,427 | | | 6.00%, 01/01/2034 | | | 41,145 | |
| | | | | 25,369 | | | 6.00%, 02/01/2034 | | | 27,981 | |
| | | | | 275,441 | | | 6.00%, 08/01/2034 | | | 303,802 | |
| | | | | 283,516 | | | 6.00%, 09/01/2034 | | | 312,805 | |
| | | | | 273,981 | | | 6.00%, 01/01/2035 | | | 299,671 | |
| | | | | 2,090,676 | | | 6.00%, 11/01/2037 | | | 2,302,462 | |
| | | | | 108 | | | 6.50%, 07/01/2031 | | | 120 | |
| | | | | 341 | | | 6.50%, 08/01/2032 | | | 380 | |
| | | | | 1,000,133 | | | 6.50%, 07/15/2036 | | | 1,102,094 | |
| | | | | 185,400 | | | 6.50%, 12/01/2037 | | | 206,390 | |
| | | | | 115 | | | 7.50%, 09/01/2029 | | | 121 | |
| | | | | 1,160 | | | 7.50%, 11/01/2031 | | | 1,240 | |
| | | | | | | | | | | | |
| | | | 398,186,782 | |
| | | | | | | | | | | | |
| | | | FNMA - 23.6% | |
| | $ | | | | 161,782 | | | 0.00%, 03/25/2036(12) | | $ | 132,368 | |
| | | | | 1,342,156 | | | 0.00%, 06/25/2036(12) | | | 1,135,493 | |
| | | | | 4,676,211 | | | 1.31%, 05/25/2046(4)(5) | | | 220,626 | |
| | | | | 4,412,427 | | | 1.38%, 04/25/2055(4)(5) | | | 210,753 | |
| | | | | 3,226,026 | | | 1.43%, 06/25/2055(4)(5) | | | 152,519 | |
| | | | | 4,252,929 | | | 1.54%, 08/25/2044(4)(5) | | | 171,001 | |
| | | | | 2,800,574 | | | 1.75%, 12/25/2042 | | | 2,630,851 | |
| | | | | 2,200,084 | | | 2.00%, 09/25/2039 | | | 2,055,318 | |
| | | | | 1,350,585 | | | 2.00%, 08/25/2043 | | | 1,260,259 | |
| | | | | 1,044,860 | | | 2.50%, 06/25/2028(5) | | | 80,171 | |
| | | | | 27,650,000 | | | 2.50%, 07/01/2033(13) | | | 26,872,413 | |
| | | | | 261,976 | | | 2.50%, 01/01/2043 | | | 246,449 | |
| | | | | 5,038,370 | | | 2.50%, 02/01/2043 | | | 4,741,928 | |
| | | | | 1,976,552 | | | 2.50%, 03/01/2043 | | | 1,860,066 | |
| | | | | 4,090,743 | | | 2.50%, 05/01/2043 | | | 3,849,874 | |
| | | | | 2,743,541 | | | 2.50%, 06/01/2043 | | | 2,579,996 | |
| | | | | 1,879,343 | | | 2.50%, 04/01/2045 | | | 1,760,961 | |
The accompanying notes are an integral part of these financial statements.
|
| Hartford Total Return Bond HLS Fund |
Schedule of Investments – (continued)
June 30, 2018 (Unaudited)
| | | | | | | | | | | | |
| Shares or Principal Amount | | Market Value† | |
| U.S. GOVERNMENT AGENCIES - 57.0% - (continued) | |
| | | | FNMA - 23.6% - (continued) | |
| | $ | | | | 3,705,052 | | | 2.88%, 12/01/2027 | | $ | 3,538,146 | |
| | | | | 6,600,000 | | | 2.98%, 12/01/2029 | | | 6,252,077 | |
| | | | | 2,479,497 | | | 3.00%, 02/25/2027(5) | | | 187,285 | |
| | | | | 957,671 | | | 3.00%, 09/25/2027(5) | | | 92,878 | |
| | | | | 6,676,118 | | | 3.00%, 01/25/2028(5) | | | 567,789 | |
| | | | | 4,087,248 | | | 3.00%, 03/01/2037 | | | 4,027,533 | |
| | | | | 7,478,833 | | | 3.00%, 09/25/2047 | | | 7,364,214 | |
| | | | | 6,662,832 | | | 3.00%, 06/25/2048 | | | 6,454,576 | |
| | | | | 4,000,000 | | | 3.02%, 12/01/2029 | | | 3,803,156 | |
| | | | | 8,000,000 | | | 3.07%, 09/01/2029 | | | 7,642,710 | |
| | | | | 4,349,000 | | | 3.13%, 01/01/2030 | | | 4,180,473 | |
| | | | | 4,000,000 | | | 3.18%, 12/01/2029 | | | 3,858,179 | |
| | | | | 2,975,000 | | | 3.19%, 02/25/2030(4) | | | 2,843,012 | |
| | | | | 3,790,000 | | | 3.22%, 01/01/2030 | | | 3,661,783 | |
| | | | | 485,274 | | | 3.24%, 12/01/2026 | | | 481,037 | |
| | | | | 290,000 | | | 3.29%, 06/01/2029 | | | 283,610 | |
| | | | | 6,500,000 | | | 3.37%, 04/01/2028 | | | 6,441,058 | |
| | | | | 1,077,693 | | | 3.50%, 05/25/2027(5) | | | 110,094 | |
| | | | | 1,644,226 | | | 3.50%, 10/25/2027(5) | | | 159,195 | |
| | | | | 1,787,484 | | | 3.50%, 05/25/2030(5) | | | 213,629 | |
| | | | | 544,502 | | | 3.50%, 08/25/2030(5) | | | 62,438 | |
| | | | | 1,215,902 | | | 3.50%, 02/25/2031(5) | | | 109,796 | |
| | | | | 1,037,636 | | | 3.50%, 09/25/2035(5) | | | 162,254 | |
| | | | | 2,160,101 | | | 3.50%, 10/01/2044 | | | 2,162,095 | |
| | | | | 2,546,252 | | | 3.50%, 02/01/2045 | | | 2,541,899 | |
| | | | | 4,814,228 | | | 3.50%, 09/01/2046 | | | 4,806,000 | |
| | | | | 2,245,288 | | | 3.50%, 10/01/2046 | | | 2,241,449 | |
| | | | | 872,000 | | | 3.50%, 10/25/2046(5) | | | 202,769 | |
| | | | | 1,600,716 | | | 3.50%, 11/01/2046 | | | 1,599,468 | |
| | | | | 1,581,061 | | | 3.50%, 09/01/2047 | | | 1,575,470 | |
| | | | | 6,173,418 | | | 3.50%, 11/25/2047 | | | 6,208,584 | |
| | | | | 1,141,416 | | | 3.50%, 12/01/2047 | | | 1,137,681 | |
| | | | | 6,605,617 | | | 3.50%, 01/01/2048 | | | 6,577,808 | |
| | | | | 1,274,827 | | | 3.50%, 02/01/2048 | | | 1,272,023 | |
| | | | | 3,994,650 | | | 3.50%, 04/25/2048 | | | 4,025,371 | |
| | | | | 280,631,000 | | | 3.50%, 07/01/2048(13) | | | 279,310,912 | |
| | | | | 1,969,056 | | | 3.74%, 06/01/2026 | | | 2,016,300 | |
| | | | | 675,068 | | | 3.89%, 05/01/2030 | | | 692,521 | |
| | | | | 291,873 | | | 3.96%, 05/01/2034 | | | 298,355 | |
| | | | | 2,331,414 | | | 4.00%, 06/01/2025 | | | 2,400,158 | |
| | | | | 694,773 | | | 4.00%, 10/01/2025 | | | 713,375 | |
| | | | | 4,718,414 | | | 4.00%, 10/01/2040 | | | 4,845,207 | |
| | | | | 2,113,496 | | | 4.00%, 11/01/2040 | | | 2,170,656 | |
| | | | | 1,531,018 | | | 4.00%, 12/01/2040 | | | 1,572,385 | |
| | | | | 743,006 | | | 4.00%, 02/01/2041 | | | 763,534 | |
| | | | | 1,726,834 | | | 4.00%, 03/01/2041 | | | 1,773,343 | |
| | | | | 775,808 | | | 4.00%, 03/25/2042(5) | | | 116,206 | |
| | | | | 799,842 | | | 4.00%, 08/01/2042 | | | 821,502 | |
| | | | | 1,570,237 | | | 4.00%, 09/01/2042 | | | 1,612,755 | |
| | | | | 443,644 | | | 4.00%, 11/25/2042(5) | | | 68,756 | |
| | | | | 341,569 | | | 4.00%, 03/01/2045 | | | 348,835 | |
| | | | | 1,399,338 | | | 4.00%, 07/01/2045 | | | 1,439,091 | |
| | | | | 812,574 | | | 4.00%, 05/01/2046 | | | 829,049 | |
| | | | | 1,750,963 | | | 4.00%, 06/01/2046 | | | 1,786,452 | |
| | | | | 1,648,451 | | | 4.00%, 04/01/2047 | | | 1,691,553 | |
| | | | | 2,410,000 | | | 4.00%, 07/01/2048(13) | | | 2,456,999 | |
| | | | | 663,005 | | | 4.50%, 04/01/2025 | | | 685,208 | |
| | | | | 854,991 | | | 4.50%, 07/25/2027(5) | | | 90,299 | |
| | | | | 1,238,342 | | | 4.50%, 09/01/2035 | | | 1,295,792 | |
| | | | | 4,518,911 | | | 4.50%, 08/01/2040 | | | 4,750,158 | |
| | | | | 4,225,532 | | | 4.50%, 10/01/2040 | | | 4,445,537 | |
| | | | | | | | | | | | |
| Shares or Principal Amount | | Market Value† | |
| U.S. GOVERNMENT AGENCIES - 57.0% - (continued) | |
| | | | FNMA - 23.6% - (continued) | |
| | $ | | | | 1,828,013 | | | 4.50%, 10/01/2041 | | $ | 1,922,819 | |
| | | | | 1,670,346 | | | 4.50%, 09/01/2043 | | | 1,757,212 | |
| | | | | 32,700,000 | | | 4.50%, 07/01/2048(13) | | | 34,049,156 | |
| | | | | 29 | | | 5.00%, 07/01/2018 | | | 29 | |
| | | | | 661 | | | 5.00%, 09/01/2018 | | | 660 | |
| | | | | 86,966 | | | 5.00%, 01/01/2020 | | | 88,445 | |
| | | | | 744,571 | | | 5.00%, 06/01/2022 | | | 764,760 | |
| | | | | 295,674 | | | 5.00%, 06/01/2025 | | | 307,587 | |
| | | | | 683,468 | | | 5.00%, 04/25/2038 | | | 714,191 | |
| | | | | 3,452,231 | | | 5.00%, 06/01/2047 | | | 3,660,132 | |
| | | | | 472,229 | | | 5.46%, 05/25/2042(4)(5) | | | 48,776 | |
| | | | | 26 | | | 5.50%, 11/01/2018 | | | 26 | |
| | | | | 19,931 | | | 5.50%, 08/01/2019 | | | 20,037 | |
| | | | | 36,421 | | | 5.50%, 09/01/2019 | | | 36,646 | |
| | | | | 7,342 | | | 5.50%, 10/01/2019 | | | 7,387 | |
| | | | | 3,534 | | | 5.50%, 01/01/2020 | | | 3,565 | |
| | | | | 825 | | | 5.50%, 03/01/2020 | | | 833 | |
| | | | | 189,647 | | | 5.50%, 05/01/2020 | | | 191,797 | |
| | | | | 164,494 | | | 5.50%, 06/01/2022 | | | 169,432 | |
| | | | | 262,753 | | | 5.50%, 06/01/2033 | | | 286,471 | |
| | | | | 215,348 | | | 5.50%, 08/01/2033 | | | 232,981 | |
| | | | | 1,258,083 | | | 5.50%, 09/01/2033 | | | 1,364,803 | |
| | | | | 1,146,036 | | | 5.50%, 12/01/2033 | | | 1,252,134 | |
| | | | | 951,467 | | | 5.50%, 01/01/2034 | | | 1,031,259 | |
| | | | | 4,546,802 | | | 5.50%, 11/01/2035 | | | 4,938,734 | |
| | | | | 1,350,941 | | | 5.50%, 04/01/2036 | | | 1,466,093 | |
| | | | | 1,079,550 | | | 5.50%, 09/01/2036 | | | 1,174,250 | |
| | | | | 105,821 | | | 5.50%, 01/01/2037 | | | 114,434 | |
| | | | | 728,037 | | | 5.50%, 04/25/2037 | | | 788,875 | |
| | | | | 2,898,067 | | | 5.50%, 06/25/2042(5) | | | 640,991 | |
| | | | | 2,684 | | | 6.00%, 03/01/2022 | | | 2,700 | |
| | | | | 482,408 | | | 6.00%, 12/01/2032 | | | 536,051 | |
| | | | | 392,751 | | | 6.00%, 01/01/2033 | | | 430,237 | |
| | | | | 76,905 | | | 6.00%, 02/01/2033 | | | 84,049 | |
| | | | | 617,048 | | | 6.00%, 03/01/2033 | | | 679,644 | |
| | | | | 1,263,438 | | | 6.00%, 02/01/2037 | | | 1,389,936 | |
| | | | | 2,988,038 | | | 6.00%, 01/25/2042(5) | | | 576,215 | |
| | | | | 1,977,960 | | | 6.00%, 09/25/2047(5) | | | 462,318 | |
| | | | | 1,329 | | | 6.50%, 05/01/2031 | | | 1,465 | |
| | | | | 1,143 | | | 6.50%, 09/01/2031 | | �� | 1,263 | |
| | | | | 1,730 | | | 6.50%, 07/01/2032 | | | 1,944 | |
| | | | | 1,528 | | | 7.00%, 07/01/2029 | | | 1,717 | |
| | | | | 94 | | | 7.00%, 12/01/2030 | | | 95 | |
| | | | | 690 | | | 7.00%, 02/01/2032 | | | 717 | |
| | | | | 254 | | | 7.00%, 03/01/2032 | | | 284 | |
| | | | | 1,954 | | | 7.00%, 09/01/2032 | | | 2,048 | |
| | | | | 2,056 | | | 7.50%, 10/01/2022 | | | 2,197 | |
| | | | | 1,795 | | | 7.50%, 06/01/2027 | | | 2,014 | |
| | | | | 2,207 | | | 7.50%, 10/01/2029 | | | 2,246 | |
| | | | | 14,658 | | | 7.50%, 03/01/2030 | | | 16,082 | |
| | | | | 8,473 | | | 7.50%, 04/01/2030 | | | 8,902 | |
| | | | | 1,121 | | | 7.50%, 06/01/2030 | | | 1,261 | |
| | | | | 2,025 | | | 7.50%, 07/01/2030 | | | 2,264 | |
| | | | | 478 | | | 7.50%, 08/01/2030 | | | 523 | |
| | | | | 5,701 | | | 7.50%, 10/01/2030 | | | 5,752 | |
| | | | | 7,796 | | | 7.50%, 01/01/2031 | | | 7,935 | |
| | | | | 26,128 | | | 7.50%, 05/01/2031 | | | 29,725 | |
| | | | | 7,744 | | | 7.50%, 06/01/2031 | | | 7,955 | |
| | | | | 1,811 | | | 7.50%, 08/01/2031 | | | 2,003 | |
| | | | | 39,306 | | | 7.50%, 09/01/2031 | | | 40,693 | |
| | | | | 302 | | | 7.50%, 05/01/2032 | | | 344 | |
| | | | | | | | | | | | |
| | | | 527,138,617 | |
| | | | | | | | | | | | |
The accompanying notes are an integral part of these financial statements.
|
| Hartford Total Return Bond HLS Fund |
Schedule of Investments – (continued)
June 30, 2018 (Unaudited)
| | | | | | | | | | | | |
| Shares or Principal Amount | | Market Value† | |
| U.S. GOVERNMENT AGENCIES - 57.0% - (continued) | |
| | | | GNMA - 15.5% | |
| | $ | | | | 514,431 | | | 1.75%, 09/20/2043 | | $ | 486,511 | |
| | | | | 2,176,694 | | | 2.50%, 12/16/2039 | | | 2,119,486 | |
| | | | | 1,198,944 | | | 3.00%, 09/20/2028(5) | | | 104,804 | |
| | | | | 669,389 | | | 3.00%, 02/16/2043(5) | | | 110,316 | |
| | | | | 7,904,616 | | | 3.00%, 03/15/2045 | | | 7,740,956 | |
| | | | | 396,825 | | | 3.00%, 04/15/2045 | | | 388,609 | |
| | | | | 4,791,882 | | | 3.00%, 07/15/2045 | | | 4,692,668 | |
| | | | | 119,165 | | | 3.00%, 08/15/2045 | | | 116,698 | |
| | | | | 458,326 | | | 3.00%, 03/20/2047(14) | | | 396,468 | |
| | | | | 1,290,013 | | | 3.00%, 07/16/2047 | | | 1,201,885 | |
| | | | | 62,337,699 | | | 3.00%, 11/20/2047 | | | 61,027,775 | |
| | | | | 514,735 | | | 3.50%, 02/16/2027(5) | | | 46,745 | |
| | | | | 1,267,249 | | | 3.50%, 03/20/2027(5) | | | 126,240 | |
| | | | | 1,122,354 | | | 3.50%, 07/20/2040(5) | | | 129,147 | |
| | | | | 1,631,516 | | | 3.50%, 02/20/2041(5) | | | 199,293 | |
| | | | | 2,717,270 | | | 3.50%, 04/20/2042(5) | | | 355,205 | |
| | | | | 4,082,231 | | | 3.50%, 10/20/2042(5) | | | 720,158 | |
| | | | | 436,686 | | | 3.50%, 11/15/2042 | | | 440,749 | |
| | | | | 12,626 | | | 3.50%, 12/15/2042 | | | 12,728 | |
| | | | | 306,814 | | | 3.50%, 02/15/2043 | | | 309,289 | |
| | | | | 14,648 | | | 3.50%, 03/15/2043 | | | 14,766 | |
| | | | | 1,980,669 | | | 3.50%, 04/15/2043 | | | 1,996,653 | |
| | | | | 5,217,580 | | | 3.50%, 05/15/2043 | | | 5,254,225 | |
| | | | | 298,169 | | | 3.50%, 05/20/2043(5) | | | 51,092 | |
| | | | | 2,415,988 | | | 3.50%, 07/20/2043(5) | | | 374,454 | |
| | | | | 2,545,865 | | | 3.50%, 08/20/2047 | | | 2,557,971 | |
| | | | | 97,563,000 | | | 3.50%, 07/01/2048(13) | | | 97,938,383 | |
| | | | | 392,093 | | | 4.00%, 12/16/2026(5) | | | 35,026 | |
| | | | | 5,225,763 | | | 4.00%, 05/20/2029(5) | | | 536,484 | |
| | | | | 5,776,243 | | | 4.00%, 07/20/2040 | | | 5,973,009 | |
| | | | | 6,828,809 | | | 4.00%, 09/20/2040 | | | 7,062,058 | |
| | | | | 10,297,885 | | | 4.00%, 10/20/2040 | | | 10,649,571 | |
| | | | | 1,649,820 | | | 4.00%, 12/20/2040 | | | 1,706,299 | |
| | | | | 540,575 | | | 4.00%, 05/16/2042(5) | | | 76,681 | |
| | | | | 762,891 | | | 4.00%, 03/20/2043(5) | | | 165,332 | |
| | | | | 347,693 | | | 4.00%, 01/20/2044(5) | | | 78,556 | |
| | | | | 2,652,753 | | | 4.00%, 03/20/2047(5) | | | 512,306 | |
| | | | | 4,077,132 | | | 4.00%, 07/20/2047(5) | | | 758,419 | |
| | | | | 5,909,276 | | | 4.00%, 10/20/2047 | | | 6,061,942 | |
| | | | | 6,977,896 | | | 4.00%, 11/20/2047 | | | 7,164,881 | |
| | | | | 5,350,961 | | | 4.00%, 03/20/2048 | | | 5,501,441 | |
| | | | | 16,100,000 | | | 4.00%, 07/01/2048(13) | | | 16,501,243 | |
| | | | | 278,800 | | | 4.50%, 11/15/2039 | | | 295,000 | |
| | | | | 2,195,971 | | | 4.50%, 05/15/2040 | | | 2,323,574 | |
| | | | | 6,850,345 | | | 4.50%, 05/20/2040 | | | 7,199,197 | |
| | | | | 405,410 | | | 4.50%, 07/15/2041 | | | 427,651 | |
| | | | | 1,294,744 | | | 4.50%, 04/20/2045(5) | | | 302,516 | |
| | | | | 641,424 | | | 4.50%, 01/20/2046 | | | 675,066 | |
| | | | | 35,625,000 | | | 4.50%, 07/01/2048(13) | | | 37,028,041 | |
| | | | | 3,208,458 | | | 5.00%, 02/16/2040(5) | | | 756,939 | |
| | | | | 743,148 | | | 5.00%, 05/20/2040 | | | 797,628 | |
| | | | | 1,782,688 | | | 5.00%, 06/15/2041 | | | 1,899,219 | |
| | | | | 2,318,528 | | | 5.00%, 10/16/2041(5) | | | 396,294 | |
| | | | | 2,799,249 | | | 5.00%, 03/15/2044 | | | 2,982,983 | |
| | | | | 798,899 | | | 5.00%, 01/16/2047(5) | | | 195,240 | |
| | | | | 21,655,000 | | | 5.00%, 07/01/2048(13) | | | 22,710,622 | |
| | | | | 587,654 | | | 5.50%, 03/15/2033 | | | 649,156 | |
| | | | | 846,650 | | | 5.50%, 04/15/2033 | | | 946,292 | |
| | | | | 912,600 | | | 5.50%, 05/15/2033 | | | 1,010,053 | |
| | | | | 1,292,699 | | | 5.50%, 10/20/2034 | | | 1,411,191 | |
| | | | | | | | | | | | |
| Shares or Principal Amount | | Market Value† | |
| U.S. GOVERNMENT AGENCIES - 57.0% - (continued) | |
| | | | GNMA - 15.5% - (continued) | |
| | $ | | | | 2,743,185 | | | 5.50%, 03/20/2039(5) | | $ | 618,137 | |
| | | | | 2,408,816 | | | 5.50%, 02/16/2047(5) | | | 540,357 | |
| | | | | 1,446,939 | | | 5.50%, 02/20/2047(5) | | | 315,193 | |
| | | | | 1,712 | | | 6.00%, 12/15/2023 | | | 1,872 | |
| | | | | 1,110 | | | 6.00%, 01/15/2029 | | | 1,213 | |
| | | | | 1,445 | | | 6.00%, 04/15/2029 | | | 1,595 | |
| | | | | 47,520 | | | 6.00%, 12/15/2031 | | | 51,946 | |
| | | | | 1,005 | | | 6.00%, 10/15/2032 | | | 1,125 | |
| | | | | 26,329 | | | 6.00%, 06/15/2033 | | | 29,104 | |
| | | | | 2,691 | | | 6.00%, 03/15/2034 | | | 3,003 | |
| | | | | 60,705 | | | 6.00%, 08/15/2034 | | | 67,084 | |
| | | | | 84,769 | | | 6.00%, 09/15/2034 | | | 93,372 | |
| | | | | 46,219 | | | 6.00%, 02/15/2035 | | | 51,084 | |
| | | | | 293,967 | | | 6.00%, 12/15/2035 | | | 322,962 | |
| | | | | 27,365 | | | 6.00%, 02/15/2036 | | | 29,914 | |
| | | | | 205,554 | | | 6.00%, 03/15/2036 | | | 226,667 | |
| | | | | 32,244 | | | 6.00%, 04/15/2036 | | | 35,248 | |
| | | | | 128,846 | | | 6.00%, 05/15/2036 | | | 140,921 | |
| | | | | 276,011 | | | 6.00%, 06/15/2036 | | | 304,133 | |
| | | | | 71,643 | | | 6.00%, 07/15/2036 | | | 78,484 | |
| | | | | 28,511 | | | 6.00%, 08/15/2036 | | | 31,174 | |
| | | | | 189,744 | | | 6.00%, 02/15/2037 | | | 209,058 | |
| | | | | 646 | | | 6.00%, 05/15/2037 | | | 712 | |
| | | | | 427,042 | | | 6.00%, 06/15/2037 | | | 471,167 | |
| | | | | 305,741 | | | 6.00%, 07/15/2037 | | | 334,221 | |
| | | | | 85,390 | | | 6.00%, 08/15/2037 | | | 93,977 | |
| | | | | 106,894 | | | 6.00%, 10/15/2037 | | | 116,851 | |
| | | | | 84,005 | | | 6.00%, 11/15/2037 | | | 91,830 | |
| | | | | 105,961 | | | 6.00%, 12/15/2037 | | | 118,347 | |
| | | | | 187,017 | | | 6.00%, 01/15/2038 | | | 205,716 | |
| | | | | 15,947 | | | 6.00%, 02/15/2038 | | | 17,433 | |
| | | | | 35,315 | | | 6.00%, 05/15/2038 | | | 38,609 | |
| | | | | 9,379 | | | 6.00%, 06/15/2038 | | | 10,255 | |
| | | | | 43,967 | | | 6.00%, 08/15/2038 | | | 48,104 | |
| | | | | 97,701 | | | 6.00%, 09/15/2038 | | | 106,802 | |
| | | | | 163,461 | | | 6.00%, 10/15/2038 | | | 182,914 | |
| | | | | 292,821 | | | 6.00%, 11/15/2038 | | | 320,098 | |
| | | | | 152,402 | | | 6.00%, 12/15/2038 | | | 166,599 | |
| | | | | 1,977 | | | 6.00%, 01/15/2039 | | | 2,161 | |
| | | | | 41,597 | | | 6.00%, 08/15/2039 | | | 45,472 | |
| | | | | 78,783 | | | 6.00%, 11/15/2039 | | | 86,122 | |
| | | | | 26,995 | | | 6.00%, 02/15/2040 | | | 29,509 | |
| | | | | 989,154 | | | 6.00%, 06/15/2040 | | | 1,081,294 | |
| | | | | 184,237 | | | 6.00%, 07/15/2040 | | | 201,399 | |
| | | | | 2,137,480 | | | 6.00%, 09/20/2040(5) | | | 508,439 | |
| | | | | 1,023,149 | | | 6.00%, 06/15/2041 | | | 1,120,374 | |
| | | | | 2,102,260 | | | 6.00%, 02/20/2046(5) | | | 484,539 | |
| | | | | 24,130 | | | 6.50%, 06/15/2028 | | | 26,610 | |
| | | | | 511 | | | 6.50%, 07/15/2028 | | | 564 | |
| | | | | 2,158 | | | 6.50%, 08/15/2028 | | | 2,379 | |
| | | | | 17,401 | | | 6.50%, 09/15/2028 | | | 19,190 | |
| | | | | 1,505 | | | 6.50%, 10/15/2028 | | | 1,660 | |
| | | | | 3,162 | | | 6.50%, 11/15/2028 | | | 3,487 | |
| | | | | 5,093 | | | 6.50%, 12/15/2028 | | | 5,616 | |
| | | | | 8,084 | | | 6.50%, 01/15/2029 | | | 8,915 | |
| | | | | 24,575 | | | 6.50%, 02/15/2029 | | | 27,100 | |
| | | | | 243,283 | | | 6.50%, 03/15/2029 | | | 268,287 | |
| | | | | 35,410 | | | 6.50%, 04/15/2029 | | | 39,049 | |
| | | | | 26,487 | | | 6.50%, 05/15/2029 | | | 29,210 | |
| | | | | 176,374 | | | 6.50%, 06/15/2029 | | | 194,503 | |
| | | | | 8,063 | | | 6.50%, 07/15/2029 | | | 8,891 | |
The accompanying notes are an integral part of these financial statements.
|
| Hartford Total Return Bond HLS Fund |
Schedule of Investments – (continued)
June 30, 2018 (Unaudited)
| | | | | | | | | | | | |
| Shares or Principal Amount | | Market Value† | |
| U.S. GOVERNMENT AGENCIES - 57.0% - (continued) | |
| | | | GNMA - 15.5% - (continued) | |
| | $ | | | | 287 | | | 6.50%, 03/15/2031 | | $ | 316 | |
| | | | | 228,264 | | | 6.50%, 04/15/2031 | | | 251,725 | |
| | | | | 53,026 | | | 6.50%, 05/15/2031 | | | 59,198 | |
| | | | | 8,860 | | | 6.50%, 06/15/2031 | | | 9,911 | |
| | | | | 188,902 | | | 6.50%, 07/15/2031 | | | 208,318 | |
| | | | | 102,473 | | | 6.50%, 08/15/2031 | | | 113,004 | |
| | | | | 134,814 | | | 6.50%, 09/15/2031 | | | 148,670 | |
| | | | | 154,743 | | | 6.50%, 10/15/2031 | | | 170,647 | |
| | | | | 336,662 | | | 6.50%, 11/15/2031 | | | 371,264 | |
| | | | | 83,369 | | | 6.50%, 12/15/2031 | | | 91,937 | |
| | | | | 313,725 | | | 6.50%, 01/15/2032 | | | 346,042 | |
| | | | | 62,723 | | | 6.50%, 02/15/2032 | | | 70,678 | |
| | | | | 46,050 | | | 6.50%, 03/15/2032 | | | 50,783 | |
| | | | | 229,713 | | | 6.50%, 04/15/2032 | | | 255,875 | |
| | | | | 739 | | | 6.50%, 05/15/2032 | | | 815 | |
| | | | | 37,257 | | | 6.50%, 06/15/2032 | | | 41,086 | |
| | | | | 5,816 | | | 7.00%, 06/20/2030 | | | 6,276 | |
| | | | | 702 | | | 7.00%, 02/15/2031 | | | 759 | |
| | | | | 195 | | | 7.00%, 06/15/2031 | | | 204 | |
| | | | | 186 | | | 7.00%, 08/15/2031 | | | 206 | |
| | | | | 691 | | | 8.50%, 11/15/2024 | | | 693 | |
| | | | | | | | | | | | |
| | | | | | | | | | | 345,573,642 | |
| | | | | | | | | | | | |
| | | | | | | | | | | 1,270,899,041 | |
| | | | | | | | | | | | |
| | | |
| | | | | | | | Total U.S. Government Agencies
(cost $1,274,820,714) | | $ | 1,270,899,041 | |
| | | | | | | | | | | | |
| | | |
| | | | | | | | | | | | |
| U.S. GOVERNMENT SECURITIES - 4.8% | |
| | | | | | | U.S. Treasury Securities - 4.8% | |
| | | | | | | U.S. Treasury Bonds - 1.3% | |
| | | | | | | | U.S. Treasury Bonds | |
| | $ | | | | 5,119,000 | | | 2.50%, 02/15/2046(15) | | $ | 4,654,091 | |
| | | | | 13,709,000 | | | 2.88%, 11/15/2046(15) | | | 13,422,503 | |
| | | | | 1,095,000 | | | 3.00%, 05/15/2045(15) | | | 1,099,235 | |
| | | | | 8,990,000 | | | 3.13%, 08/15/2044(15)(16) | | | 9,231,255 | |
| | | | | | | | | | | | |
| | | | | | | | | | | 28,407,084 | |
| | | | | | | | | | | | |
| | | | | | | U.S. Treasury Notes - 3.5% | |
| | | | | | | | U.S. Treasury Notes | |
| | | | | 66,161,981 | | | 0.38%, 07/15/2027(17) | | | 64,366,363 | |
| | | | | 13,574,113 | | | 0.63%, 01/15/2026(17) | | | 13,500,266 | |
| | | | | | | | | | | | |
| | | | | | | | | | | 77,866,629 | |
| | | | | | | | | | | | |
| | | | | | | | | | | 106,273,713 | |
| | | | | | | | | | | | |
| | | |
| | | | | | | | Total U.S. Government Securities
(cost $108,543,802) | | $ | 106,273,713 | |
| | | | | | | | | | | | |
| | | |
| | | | | | | | | | | | |
| COMMON STOCKS - 0.0% | |
| | | | | | | Energy - 0.0% | |
| | | | | 64,657 | | | Ascent Resources - Marcellus LLC Class A(18)(19)(20) | | | 203,670 | |
| | | | | 14,557 | | | Templar Energy LLC Class A | | | 14,557 | |
| | | | | | | | | | | | |
| | | | | | | | | | | 218,227 | |
| | | | | | | | | | | | |
| | | |
| | | | | | | | Total Common Stocks
(cost $328,313) | | $ | 218,227 | |
| | | | | | | | | | | | |
| | | | | | | | | | | | |
| Shares or Principal Amount | | Market Value† | |
| PREFERRED STOCKS - 0.1% | |
| | | | | | | Banks - 0.1% | |
| | $ | | | | 2,242 | | | U.S. Bancorp
Series A 3 mo. USD LIBOR + 1.020%,
3.50%(2)(7) | | $ | 2,094,140 | |
| | | | | | | | | | | | |
| | | |
| | | | | | | | Total Preferred Stocks
(cost $1,591,820) | | $ | 2,094,140 | |
| | | | | | | | | | | | |
| | | |
| | | | | | | | | | | | |
| WARRANTS - 0.0% | |
| | | | | | | Energy - 0.0% | |
| | | | | 16,740 | | | Ascent Resources - Marcellus LLC Expires 3/30/23*(18)(19)(20) | | | 1,339 | |
| | | | | | | | | | | | |
| | | |
| | | | | | | | Total Warrants
(cost $1,339) | | $ | 1,339 | |
| | | | | | | | | | | | |
| | | |
| | | | | | | | Total Long-Term Investments
(cost $2,955,551,899) | | $ | 2,919,187,518 | |
| | | | | | | | | | | | |
| | | |
| | | | | | | | | | | | |
| ESCROWS - 0.0% | |
| | | | | | | Energy-Alternate Sources - 0.0% | |
| | | | | 800,000 | | | TCEH Corp.*(18)(19)(20) | | | 1 | |
| | | | | | | | | | | | |
| | | |
| | | | | | | | Total Escrows
(cost $—) | | $ | 1 | |
| | | | | | | | | | | | |
| | | |
| | | | | | | | | | | | |
| SHORT-TERM INVESTMENTS - 4.7% | |
| | | | | | | Other Investment Pools & Funds - 3.3% | |
| | | | | 74,677,999 | | | Morgan Stanley Institutional Liquidity Funds, Government Portfolio,
Institutional Class,
1.84%(21) | | $ | 74,677,999 | |
| | | | | | | | | | | | |
| | | | | | | Securities Lending Collateral - 0.5% | |
| | | | | 525,466 | | | Citibank NA DDCA,
1.91%, 7/2/2018(21) | | | 525,466 | |
| | | | | 3,549,489 | | | Goldman Sachs Financial Square Funds, Government Institutional Fund,
1.81%(21) | | | 3,549,489 | |
| | | | | 3,298,199 | | | Invesco Government & Agency Portfolio,
1.81%(21) | | | 3,298,199 | |
| | | | | 973,057 | | | Morgan Stanley Institutional Liquidity Funds, Government Portfolio, Institutional Class,
1.84%(21) | | | 973,057 | |
| | | | | 2,163,115 | | | Western Asset Institutional Government
Class A Fund,
1.79%(21) | | | 2,163,115 | |
| | | | | | | | | | | | |
| | | | | | | | | | | 10,509,326 | |
| | | | | | | | | | | | |
The accompanying notes are an integral part of these financial statements.
|
| Hartford Total Return Bond HLS Fund |
Schedule of Investments – (continued)
June 30, 2018 (Unaudited)
| | | | | | | | | | | | |
| Shares or Principal Amount | | Market Value† | |
| SHORT-TERM INVESTMENTS - 4.7% - (continued) | |
| | | | | | | U.S. Treasury Bill - 0.9% | |
| | | | | | | Sovereign - 0.9% | |
| | $ | | | | 20,000,000 | | | U.S. Treasury Bill
1.84%, 08/23/2018(15)(22) | | $ | 19,945,616 | |
| | | | | | | | | | | | |
| | | | | | | | | | | 19,945,616 | |
| | | | | | | | | | | | |
| | | |
| | | | | | | | Total Short-Term Investments
(cost $105,132,941) | | $ | 105,132,941 | |
| | | | | | | | | | | | |
| | | | | | | | | | | | | | | | |
| | | | |
| | | | | | | | Total Investments Excluding Purchased Options
(cost $3,060,684,840) | | | 135.6 | % | | $ | 3,024,320,459 | |
| | | | |
| | | | | | | | Total Purchased Options
(cost $7,751,675) | | | 0.3 | % | | $ | 6,705,508 | |
| | | | | | | | | | | | | | | | |
| | | | |
| | | | | | | | Total Investments
(cost $3,068,436,515) | | | 135.9 | % | | $ | 3,031,025,967 | |
| | | | | | | | Other Assets and Liabilities | | | (35.9 | )% | | | (800,499,537 | ) |
| | | | | | | | | | | | | | | | |
| | | | | | | | Total Net Assets | | | 100.0 | % | | $ | 2,230,526,430 | |
| | | | | | | | | | | | | | | | |
The accompanying notes are an integral part of these financial statements.
|
| Hartford Total Return Bond HLS Fund |
Schedule of Investments – (continued)
June 30, 2018 (Unaudited)
| Note: | Percentage of investments as shown is the ratio of the total market value to total net assets. |
| | The Fund may refer to any one or more of the industry classifications used by one or more widely recognized market indices, ratings group and/or as defined by Fund management. Industry classifications may not be identical across all security types. |
| | Equity Industry classifications used in this report are the Global Industry Classification Standard, which was developed by and is the exclusive property and service mark of MSCI, Inc. and Standard & Poor’s. |
| | For Fund compliance purposes, the Fund may not use the same classification system shown in this report as these classifications are used for financial reporting purposes. |
| (1) | Securities issued within terms of a private placement memorandum and exempt from registration under Rule 144A under the Securities Act of 1933, as amended, and may be sold to qualified institutional buyers. Unless otherwise indicated, these holdings are determined to be liquid. At June 30, 2018, the aggregate value of these securities was $783,548,519, which represented 35.1% of total net assets. |
| (2) | Variable rate securities; the rate reported is the coupon rate in effect at June 30, 2018. |
| (3) | Security is a “step-up” bond where coupon increases or steps up at a predetermined date. Rate shown is current coupon rate. |
| (4) | Variable or floating rate security, which interest rate adjusts periodically based on changes in current interest rates and prepayments on the underlying pool of assets. Rate shown is the rate in effect as of period end. |
| (5) | Securities disclosed are interest-only strips. |
| (6) | Represents entire or partial securities on loan. See Note 8 in the accompanying Notes to Financial Statements for securities lending information. |
| (7) | Perpetual maturity security. Maturity date shown is the next call date or final legal maturity date, whichever comes first. |
| (8) | These securities were sold to the Fund under Regulation S, rules governing offers and sales made outside the United States without registration under the Securities Act of 1933, as amended. The Fund may only be able to resell these securities in the United States if an exemption from registration under the federal and state securities laws is available, or the Fund may only be able to sell these securities outside of the United States (such as on a foreign exchange) to a non-U.S. person. Unless otherwise indicated, these holdings are determined to be liquid. At June 30, 2018, the aggregate value of these securities was $29,155,518, which represented 1.3% of total net assets. |
| (9) | Senior floating rate interests generally pay interest rates which are periodically adjusted by reference to a base short-term, floating lending rate plus a premium. The base lending rates are primarily the LIBOR, and secondarily the prime rate offered by one or more major United States banks (the “Prime Rate”) and the certificate of deposit rate or other base lending rates used by commercial lenders. Senior floating rate interests often require prepayments from excess cash flows or permit the borrower to repay at its election. The rate at which the borrower repays cannot be predicted with accuracy. As a result, the actual remaining maturity may be substantially less than the stated maturities shown. Unless otherwise noted, the interest rate disclosed for these securities represents the rate in effect as of June 30, 2018. |
| (10) | Represents an unsettled loan commitment. The coupon rate will be determined at time of settlement. |
| (11) | This security, or a portion of this security, has unfunded loan commitments. As of June 30, 2018, the aggregate value of the unfunded commitment was $118,180, which rounds to zero percent of total net assets. |
| (12) | Securities disclosed are principal-only strips. |
| (13) | Represents or includes a TBA transaction. |
| (14) | These securities pay no principal or interest during their initial accrual period, but accrue additional principal at a specified coupon rate. |
| (15) | This security, or a portion of this security, has been pledged as collateral in connection with OTC swap contracts. |
| (16) | This security, or a portion of this security, has been pledged as collateral in connection with futures contracts. |
| (17) | The principal amount for these securities are adjusted for inflation and the interest payments equal a fixed percentage of the inflation-adjusted principal amount. |
| (18) | These securities are valued in good faith at fair value as determined under policies and procedures established by and under the supervision of the Board of Directors. At June 30, 2018, the aggregate fair value of these securities was $205,010, which represented 0.0% of total net assets. This amount excludes securities that are principally traded in certain foreign markets and whose prices are adjusted pursuant to a third party pricing service methodology approved by the Board of Directors. |
| (19) | This security has been identified as illiquid. Illiquid securities are often purchased in private placement transactions, are often not registered under the Securities Act of 1933, as amended, and may have contractual restrictions on resale. A security may also be considered illiquid if the security lacks a readily available market or if its valuation has not changed for a certain period of time. The identification of illiquid securities is unaudited. At June 30, 2018, the aggregate value of these securities was $205,010, which represented 0.0% of total net assets. |
| (20) | Investment valued using significant unobservable inputs. |
The accompanying notes are an integral part of these financial statements.
|
| Hartford Total Return Bond HLS Fund |
Schedule of Investments – (continued)
June 30, 2018 (Unaudited)
| (21) | Current yield as of period end. |
| (22) | The rate shown represents current yield to maturity. |
| | | | | | | | | | | | | | | | | | | | | | | | | | | | | | | | | | | | | | | | |
| OTC Swaption Contracts Outstanding at June 30, 2018 | |
Description | | Counter-
party | | | Exercise
Price/FX
Rate/
Rate | | | Pay/
Receive
Floating
Rate | | | Expiration
Date | | | Notional
Amount | | | Number of
Contracts | | | Market
Value† | | | Premiums
Paid
(Received)
by Fund | | | Unrealized
Appreciation/
(Depreciation) | |
Purchased swaption contracts: | | | | | | | | | | | | | | | | | | | | | | | | | | | | | | | | | | | | | | | | |
Calls | | | | | | | | | | | | | | | | | | | | | | | | | | | | | | | | | | | | | | | | |
3 Month USD-LIBOR-BBA-Interest Rate Swap Expiring 08/04/57 | | | JPM | | | | 2.45% | | | | Pay | | | | 08/02/27 | | | | USD | | | | 2,800,000 | | | | 2,800,000 | | | $ | 313,353 | | | $ | 327,600 | | | $ | (14,247 | ) |
3 Month USD-LIBOR-BBA-Interest Rate Swap Expiring 08/04/57 | | | BCLY | | | | 2.45% | | | | Receive | | | | 08/02/27 | | | | USD | | | | 11,200,000 | | | | 11,200,000 | | | | 1,253,413 | | | | 1,614,914 | | | | (361,501 | ) |
| | | | | | | | | | | | | | | | | | | | | | | | | | | | | | | | | | | | | | | | |
Total Calls | | | | | | | | | | | | | | | | | | | | | | | | | | | 14,000,000 | | | $ | 1,566,766 | | | $ | 1,942,514 | | | $ | (375,748 | ) |
| | | | | | | | | | | | | | | | | | | | | | | | | | | | | | | | | | | | | | | | |
Puts | | | | | | | | | | | | | | | | | | | | | | | | | | | | | | | | | | | | | | | | |
3 Month USD-LIBOR-BBA-Interest Rate Swap Expiring 02/28/19 | | | BCLY | | | | 2.45% | | | | Pay | | | | 08/02/27 | | | | USD | | | | 11,200,000 | | | | 11,200,000 | | | $ | 2,269,069 | | | $ | 2,205,407 | | | $ | 63,662 | |
3 Month USD-LIBOR-BBA-Interest Rate Swap Expiring 08/04/57 | | | JPM | | | | 2.45% | | | | Receive | | | | 08/02/27 | | | | USD | | | | 2,800,000 | | | | 2,800,000 | | | | 567,267 | | | | 562,520 | | | | 4,747 | |
3 Month USD-LIBOR-BBA-Interest Rate Swap Expiring 05/15/29 | | | BOA | | | | 3.25% | | | | Receive | | | | 05/13/19 | | | | USD | | | | 59,245,000 | | | | 59,245,000 | | | | 696,970 | | | | 953,844 | | | | (256,874 | ) |
3 Month USD-LIBOR-BBA-Interest Rate Swap Expiring 05/15/29 | | | BOA | | | | 3.25% | | | | Receive | | | | 05/13/19 | | | | USD | | | | 18,924,000 | | | | 18,924,000 | | | | 222,626 | | | | 297,343 | | | | (74,717 | ) |
3 Month USD-LIBOR-BBA-Interest Rate Swap Expiring 06/03/29 | | | BOA | | | | 3.20% | | | | Receive | | | | 05/30/19 | | | | USD | | | | 59,540,000 | | | | 59,540,000 | | | | 700,464 | | | | 925,847 | | | | (225,383 | ) |
3 Month USD-LIBOR-BBA-Interest Rate Swap Expiring 06/03/29 | | | DEUT | | | | 3.20% | | | | Receive | | | | 05/30/19 | | | | USD | | | | 58,000,000 | | | | 58,000,000 | | | | 682,346 | | | | 864,200 | | | | (181,854 | ) |
| | | | | | | | | | | | | | | | | | | | | | | | | | | | | | | | | | | | | | | | |
Total Puts | | | | | | | | | | | | | | | | | | | | | | | | | | | 209,709,000 | | | $ | 5,138,742 | | | $ | 5,809,161 | | | $ | (670,419 | ) |
| | | | | | | | | | | | | | | | | | | | | | | | | | | | | | | | | | | | | | | | |
Total purchased swaption contracts | | | | | | | | | | | | | | | | | | | | | | | | | | | 223,709,000 | | | $ | 6,705,508 | | | $ | 7,751,675 | | | $ | (1,046,167 | ) |
| | | | | | | | | | | | | | | | | | | | | | | | | | | | | | | | | | | | | | | | |
| | | | | | | | | | | | | | | | |
| Futures Contracts Outstanding at June 30, 2018 | |
Description | | Number of
Contracts | | | Expiration
Date | | | Current
Notional
Amount | | | Value and
Unrealized
Appreciation/
(Depreciation) | |
Long position contracts: | |
90-Day Euro Future | | | 928 | | | | 03/18/2019 | | | $ | 225,596,800 | | | $ | (28,965 | ) |
U.S. Treasury 2-Year Note Future | | | 669 | | | | 09/28/2018 | | | | 141,713,016 | | | | (60,434 | ) |
U.S. Treasury 5-Year Note Future | | | 2,601 | | | | 09/28/2018 | | | | 295,518,306 | | | | 659,592 | |
U.S. Treasury Long Bond Future | | | 63 | | | | 09/19/2018 | | | | 9,135,000 | | | | 75,993 | |
U.S. Treasury Ultra Bond Future | | | 681 | | | | 09/19/2018 | | | | 108,662,063 | | | | 2,712,004 | |
| | | | | | | | | | | | | | | | |
Total | | | $ | 3,358,190 | |
| | | | | | | | | | | | | | | | |
Short position contracts: | |
90-Day Euro Future | | | 928 | | | | 03/16/2020 | | | $ | 225,086,400 | | | $ | 218,699 | |
Long Gilt Future | | | 173 | | | | 09/26/2018 | | | | 28,096,669 | | | | (75,031 | ) |
U.S. Treasury 10-Year Note Future | | | 464 | | | | 09/19/2018 | | | | 55,767,000 | | | | (189,997 | ) |
U.S. Treasury 10-Year Ultra Future | | | 573 | | | | 09/19/2018 | | | | 73,478,297 | | | | (884,668 | ) |
| | | | | | | | | | | | | | | | |
Total | | | $ | (930,997 | ) |
| | | | | | | | | | | | | | | | |
Total futures contracts | | | $ | 2,427,193 | |
| | | | | | | | | | | | | | | | |
The accompanying notes are an integral part of these financial statements.
|
| Hartford Total Return Bond HLS Fund |
Schedule of Investments – (continued)
June 30, 2018 (Unaudited)
| | | | | | | | | | | | | | | | |
| TBA Sale Commitments Outstanding at June 30, 2018 | |
Description | | Principal
Amount | | | Maturity
Date | | | Market
Value† | | | Unrealized
Appreciation/
(Depreciation) | |
FHLMC, 5.50% | | $ | 5,100,000 | | | | 07/01/2048 | | | $ | (5,454,809 | ) | | $ | 6,176 | |
FNMA, 2.50% | | | 32,170,000 | | | | 07/01/2033 | | | | (31,265,299 | ) | | | (172,492 | ) |
FNMA, 3.00% | | | 54,318,000 | | | | 07/01/2033 | | | | (53,999,132 | ) | | | (284,747 | ) |
FNMA, 3.00% | | | 5,824,000 | | | | 07/01/2048 | | | | (5,641,772 | ) | | | (37,992 | ) |
FNMA, 3.50% | | | 775,000 | | | | 07/01/2033 | | | | (784,264 | ) | | | (2,967 | ) |
FNMA, 4.00% | | | 3,200,000 | | | | 07/01/2033 | | | | (3,282,750 | ) | | | (4,250 | ) |
FNMA, 4.50% | | | 75,595,000 | | | | 07/01/2048 | | | | (78,713,944 | ) | | | (181,670 | ) |
FNMA, 4.50% | | | 21,100,000 | | | | 08/01/2048 | | | | (21,930,994 | ) | | | (31,502 | ) |
FNMA, 5.00% | | | 9,327,000 | | | | 07/01/2048 | | | | (9,880,193 | ) | | | (31,664 | ) |
FNMA, 5.50% | | | 13,400,000 | | | | 07/01/2048 | | | | (14,368,359 | ) | | | (21,984 | ) |
FNMA, 6.00% | | | 3,300,000 | | | | 07/01/2048 | | | | (3,609,375 | ) | | | (8,766 | ) |
GNMA, 3.00% | | | 47,535,000 | | | | 07/01/2048 | | | | (46,505,382 | ) | | | (369,475 | ) |
GNMA, 3.50% | | | 13,910,000 | | | | 07/01/2048 | | | | (13,963,520 | ) | | | 4,889 | |
GNMA, 4.00% | | | 11,969,000 | | | | 07/01/2048 | | | | (12,267,290 | ) | | | (54,702 | ) |
| | | | | | | | | | | | | | | | |
Total (proceeds receivable $300,475,937) | | | $ | (301,667,083 | ) | | $ | (1,191,146 | ) |
| | | | | | | | | | | | | | | | |
At June 30, 2018, the aggregate market value of TBA Sale Commitments represents (13.5)% of total net assets.
| | | | | | | | | | | | | | | | | | | | | | | | | | | | | | | | | | | | |
| OTC Credit Default Swap Contracts Outstanding at June 30, 2018 | |
Reference Entity | | Counter-
party | | Notional
Amount (a) | | | (Pay)/Receive
Fixed Rate | | Expiration
Date | | | Periodic
Payment
Frequency | | | Upfront
Premiums
Paid | | | Upfront
Premiums
Received | | | Market
Value† | | | Unrealized
Appreciation/
(Depreciation) | |
Credit default swaps on indices: | |
Buy protection: | |
ABX.HE.AAA.07 | | GSC | | | USD | | | | 1,475,578 | | | (0.09%) | | | 08/25/37 | | | | Monthly | | | $ | 312,371 | | | $ | — | | | $ | 70,072 | | | $ | (242,299 | ) |
ABX.HE.AAA.07 | | CSI | | | USD | | | | 3,586,841 | | | (0.09%) | | | 08/25/37 | | | | Monthly | | | | 873,071 | | | | — | | | | 170,330 | | | | (702,741 | ) |
ABX.HE.PENAAA.06 | | MSC | | | USD | | | | 801,363 | | | (0.11%) | | | 05/25/46 | | | | Monthly | | | | 86,913 | | | | — | | | | 51,074 | | | | (35,839 | ) |
ABX.HE.PENAAA.06 | | JPM | | | USD | | | | 1,829,448 | | | (0.11%) | | | 05/25/46 | | | | Monthly | | | | 197,945 | | | | — | | | | 116,594 | | | | (81,351 | ) |
ABX.HE.PENAAA.06 | | GSC | | | USD | | | | 750,927 | | | (0.11%) | | | 05/25/46 | | | | Monthly | | | $ | 185,647 | | | $ | — | | | $ | 47,860 | | | $ | (137,787 | ) |
| | | | | | | | | | | | | | | | | | | | | | | | | | | | | | | | | | | | |
Total | | | | | | | | | | | | | $ | 1,655,947 | | | $ | — | | | $ | 455,930 | | | $ | (1,200,017 | ) |
| | | | | | | | | | | | | | | | | | | | | | | | | | | | | | | | | | | | |
Sell protection: | |
ABX.HE.AAA.07 | | MSC | | | USD | | | | 1,475,577 | | | 0.09% | | | 08/25/37 | | | | Monthly | | | $ | 14,074 | | | $ | — | | | $ | (70,068 | ) | | $ | (84,142 | ) |
ABX.HE.AAA.07 | | MSC | | | USD | | | | 3,586,839 | | | 0.09% | | | 08/25/37 | | | | Monthly | | | | 34,264 | | | | — | | | | (170,321 | ) | | | (204,585 | ) |
ABX.HE.PENAAA.06 | | BCLY | | | USD | | | | 3,381,743 | | | 0.11% | | | 05/25/46 | | | | Monthly | | | | — | | | | (88,652 | ) | | | (215,534 | ) | | | (126,882 | ) |
CMBX.NA.BB.6 | | CSI | | | USD | | | | 3,270,000 | | | 5.00% | | | 05/11/63 | | | | Monthly | | | | — | | | | (669,533 | ) | | | (612,195 | ) | | | 57,338 | |
CMBX.NA.BB.6 | | CSI | | | USD | | | | 1,825,000 | | | 5.00% | | | 05/11/63 | | | | Monthly | | | | — | | | | (360,641 | ) | | | (341,668 | ) | | | 18,973 | |
CMBX.NA.BB.6 | | MSC | | | USD | | | | 1,065,000 | | | 5.00% | | | 05/11/63 | | | | Monthly | | | | — | | | | (190,743 | ) | | | (203,675 | ) | | | (12,932 | ) |
CMBX.NA.BB.6 | | CSI | | | USD | | | | 2,671,000 | | | 5.00% | | | 05/11/63 | | | | Monthly | | | | — | | | | (478,351 | ) | | | (510,812 | ) | | | (32,461 | ) |
CMBX.NA.BB.6 | | CSI | | | USD | | | | 2,795,000 | | | 5.00% | | | 05/11/63 | | | | Monthly | | | | — | | | | (500,558 | ) | | | (534,525 | ) | | | (33,967 | ) |
CMBX.NA.BB.6 | | CSI | | | USD | | | | 2,795,000 | | | 5.00% | | | 05/11/63 | | | | Monthly | | | | — | | | | (500,558 | ) | | | (534,525 | ) | | | (33,967 | ) |
CMBX.NA.BB.6 | | CSI | | | USD | | | | 2,800,000 | | | 5.00% | | | 05/11/63 | | | | Monthly | | | | — | | | | (501,454 | ) | | | (535,482 | ) | | | (34,028 | ) |
CMBX.NA.BB.6 | | CSI | | | USD | | | | 965,000 | | | 5.00% | | | 05/11/63 | | | | Monthly | | | | — | | | | (139,534 | ) | | | (180,664 | ) | | | (41,130 | ) |
CMBX.NA.BB.6 | | GSC | | | USD | | | | 2,855,000 | | | 5.00% | | | 05/11/63 | | | | Monthly | | | | — | | | | (304,012 | ) | | | (546,000 | ) | | | (241,988 | ) |
CMBX.NA.BB.8 | | DEUT | | | USD | | | | 1,455,000 | | | 5.00% | | | 10/17/57 | | | | Monthly | | | | — | | | | (355,363 | ) | | | (298,460 | ) | | | 56,903 | |
CMBX.NA.BB.8 | | MSC | | | USD | | | | 5,083,000 | | | 5.00% | | | 10/17/57 | | | | Monthly | | | | — | | | | (1,380,456 | ) | | | (1,084,299 | ) | | | 296,157 | |
CMBX.NA.BB.8 | | CSI | | | USD | | | | 2,507,000 | | | 5.00% | | | 10/17/57 | | | | Monthly | | | | — | | | | (680,813 | ) | | | (524,351 | ) | | | 156,462 | |
CMBX.NA.BB.8 | | GSC | | | USD | | | | 3,445,000 | | | 5.00% | | | 10/17/57 | | | | Monthly | | | | — | | | | (837,673 | ) | | | (706,663 | ) | | | 131,010 | |
CMBX.NA.BB.8 | | GSC | | | USD | | | | 240,000 | | | 5.00% | | | 10/17/57 | | | | Monthly | | | | — | | | | (27,028 | ) | | | (50,197 | ) | | | (23,169 | ) |
CMBX.NA.BBB-.6 | | MSC | | | USD | | | | 465,000 | | | 3.00% | | | 05/11/63 | | | | Monthly | | | | — | | | | (39,880 | ) | | | (48,006 | ) | | | (8,126 | ) |
CMBX.NA.BBB-.6 | | MSC | | | USD | | | | 4,245,000 | | | 3.00% | | | 05/11/63 | | | | Monthly | | | | — | | | | (626,976 | ) | | | (438,245 | ) | | | 188,731 | |
CMBX.NA.BBB-.6 | | MSC | | | USD | | | | 2,265,000 | | | 3.00% | | | 05/11/63 | | | | Monthly | | | | — | | | | (368,188 | ) | | | (228,359 | ) | | | 139,829 | |
CMBX.NA.BBB-.6 | | DEUT | | | USD | | | | 2,180,000 | | | 3.00% | | | 05/11/63 | | | | Monthly | | | | — | | | | (325,388 | ) | | | (225,058 | ) | | | 100,330 | |
CMBX.NA.BBB-.6 | | CSI | | | USD | | | | 2,060,000 | | | 3.00% | | | 05/11/63 | | | | Monthly | | | | — | | | | (297,539 | ) | | | (212,670 | ) | | | 84,869 | |
CMBX.NA.BBB-.6 | | GSC | | | USD | | | | 1,255,000 | | | 3.00% | | | 05/11/63 | | | | Monthly | | | | — | | | | (209,613 | ) | | | (126,635 | ) | | | 82,978 | |
CMBX.NA.BBB-.6 | | MSC | | | USD | | | | 1,130,000 | | | 3.00% | | | 05/11/63 | | | | Monthly | | | | — | | | | (186,755 | ) | | | (113,927 | ) | | | 72,828 | |
The accompanying notes are an integral part of these financial statements.
|
| Hartford Total Return Bond HLS Fund |
Schedule of Investments – (continued)
June 30, 2018 (Unaudited)
| | | | | | | | | | | | | | | | | | | | | | | | | | | | | | | | | | | | |
| OTC Credit Default Swap Contracts Outstanding at June 30, 2018 (continued) | |
Reference Entity | | Counter-
party | | Notional
Amount (a) | | | (Pay)/Receive
Fixed Rate | | Expiration
Date | | | Periodic
Payment
Frequency | | | Upfront
Premiums
Paid | | | Upfront
Premiums
Received | | | Market
Value† | | | Unrealized
Appreciation/
(Depreciation) | |
Credit default swaps on indices: - (continued) | |
Sell protection: - (continued) | |
CMBX.NA.BBB-.6 | | DEUT | | | USD | | | | 1,005,000 | | | 3.00% | | | 05/11/63 | | | | Monthly | | | $ | — | | | $ | (169,021 | ) | | $ | (101,325 | ) | | $ | 67,696 | |
CMBX.NA.BBB-.6 | | MSC | | | USD | | | | 1,000,000 | | | 3.00% | | | 05/11/63 | | | | Monthly | | | | — | | | | (168,421 | ) | | | (100,905 | ) | | | 67,516 | |
CMBX.NA.BBB-.6 | | MSC | | | USD | | | | 610,000 | | | 3.00% | | | 05/11/63 | | | | Monthly | | | | — | | | | (102,789 | ) | | | (61,501 | ) | | | 41,288 | |
CMBX.NA.BBB-.6 | | CSI | | | USD | | | | 920,000 | | | 3.00% | | | 05/11/63 | | | | Monthly | | | | — | | | | (128,182 | ) | | | (92,756 | ) | | | 35,426 | |
CMBX.NA.BBB-.6 | | GSC | | | USD | | | | 2,725,000 | | | 3.00% | | | 05/11/63 | | | | Monthly | | | | — | | | | (302,153 | ) | | | (274,511 | ) | | | 27,642 | |
| | | | | | | | | | | | | | | | | | | | | | | | | | | | | | | | | | | | |
Total | | | | | | | | | | | | | $ | 48,338 | | | $ | (9,940,274 | ) | | $ | (9,143,336 | ) | | $ | 748,600 | |
| | | | | | | | | | | | | | | | | | | | | | | | | | | | | | | | | | | | |
Total traded indices | | | | | | | | | | | | | $ | 1,704,285 | | | $ | (9,940,274 | ) | | $ | (8,687,406 | ) | | $ | (451,417 | ) |
| | | | | | | | | | | | | | | | | | | | | | | | | | | | | | | | | | | | |
Total OTC contracts | | | | | | | | | | | | | $ | 1,704,285 | | | $ | (9,940,274 | ) | | $ | (8,687,406 | ) | | $ | (451,417 | ) |
| | | | | | | | | | | | | | | | | | | | | | | | | | | | | | | | | | | | |
| (a) | The maximum potential amount the Fund could be required to pay as a seller of credit protection or receive as a buyer of credit protection if a credit event occurs as defined under the terms of that particular swap agreement. |
| | | | | | | | | | | | | | | | | | | | | | | | | | | | | | |
| Centrally Cleared Credit Default Swap Contracts Outstanding at June 30, 2018 | |
Reference Entity | | Notional
Amount (a) | | | (Pay)/Receive
Fixed Rate | | | Expiration
Date | | | Periodic
Payment
Frequency | | | Cost
Basis | | | Value† | | | Unrealized
Appreciation/
(Depreciation) | |
Credit default swaps on indices: | |
Buy protection: | |
CDX.EM.29 | | USD | | | 9,780,000 | | | | (1.00 | %) | | | 06/20/23 | | | | Quarterly | | | $ | 257,246 | | | $ | 383,235 | | | $ | 125,989 | |
ITRAXX.EUR.29 | | EUR | | | 23,660,000 | | | | (1.00 | %) | | | 06/20/23 | | | | Quarterly | | | | (411,667 | ) | | | (362,601 | ) | | | 49,066 | |
ITRAXX.XOV.29 | | EUR | | | 8,730,000 | | | | (5.00 | %) | | | 06/20/23 | | | | Quarterly | | | | (898,338 | ) | | | (809,634 | ) | | | 88,704 | |
| | | | | | | | | | | | | | | | | | | | | | | | | | | | | | |
Total | | | | | | | | | | | $ | (1,052,759 | ) | | $ | (789,000 | ) | | $ | 263,759 | |
| | | | | | | | | | | | | | | | | | | | | | | | | | | | | | |
Credit default swaps on indices: | |
Sell protection: | |
CDX.NA.HY.30 | | USD | | | 48,183,000 | | | | 5.00 | % | | | 06/20/23 | | | | Quarterly | | | $ | 2,879,224 | | | $ | 2,829,988 | | | $ | (49,236 | ) |
| | | | | | | | | | | | | | | | | | | | | | | | | | | | | | |
Total | | | | | | | | | | | $ | 1,826,465 | | | $ | 2,040,988 | | | $ | (214,523 | ) |
| | | | | | | | | | | | | | | | | | | | | | | | | | | | | | |
| (a) | The maximum potential amount the Fund could be required to pay as a seller of credit protection or receive as a buyer of credit protection if a credit event occurs as defined under the terms of that particular swap agreement. |
| | | | | | | | | | | | | | | | | | | | | | | | | | | | | | | | |
| Centrally Cleared Interest Rate Swap Contracts Outstanding at June 30, 2018 | |
Payments made by Fund | | Payments received
by Fund | | Notional
Amount | | | Expiration
Date | | | Periodic
Payment
Frequency | | Upfront
Premiums
Paid | | | Upfront
Premiums
Received | | | Value† | | | Unrealized
Appreciation/
(Depreciation) | |
12 Mo. Federal Funds Rate | | 2.18% Fixed | | | USD | | | | 9,530,000 | | | | 11/15/24 | | | Annual | | $ | — | | | $ | (9,337 | ) | | $ | 179,075 | | | $ | 188,412 | |
12 Mo. Federal Funds Rate | | 2.18% Fixed | | | USD | | | | 9,640,000 | | | | 11/15/24 | | | Annual | | | — | | | | — | | | | 181,142 | | | | 181,142 | |
12 Mo. Federal Funds Rate | | 2.06% Fixed | | | USD | | | | 13,585,000 | | | | 11/15/24 | | | Annual | | | 292,019 | | | | — | | | | 354,836 | | | | 62,817 | |
12 Mo. Federal Funds Rate | | 2.56% Fixed | | | USD | | | | 14,026,010 | | | | 11/15/24 | | | Annual | | | — | | | | — | | | | 35,384 | | | | 35,384 | |
12 Mo. Federal Funds Rate | | 2.53% Fixed | | | USD | | | | 17,661,015 | | | | 11/15/24 | | | Annual | | | — | | | | — | | | | 22,586 | | | | 22,586 | |
12 Mo. Federal Funds Rate | | 2.56% Fixed | | | USD | | | | 5,965,000 | | | | 11/15/24 | | | Annual | | | — | | | | — | | | | 15,356 | | | | 15,356 | |
12 Mo. Federal Funds Rate | | 2.53% Fixed | | | USD | | | | 14,122,975 | | | | 11/15/24 | | | Annual | | | — | | | | — | | | | 13,363 | | | | 13,363 | |
12 Mo. Federal Funds Rate | | 2.25% Fixed | | | USD | | | | 4,555,000 | | | | 11/15/24 | | | Annual | | | 52,821 | | | | — | | | | 65,588 | | | | 12,767 | |
12 Mo. Federal Funds Rate | | 2.45% Fixed | | | USD | | | | 6,670,000 | | | | 11/15/24 | | | Annual | | | — | | | | — | | | | 12,320 | | | | 12,320 | |
12 Mo. Federal Funds Rate | | 2.45% Fixed | | | USD | | | | 5,840,000 | | | | 11/15/24 | | | Annual | | | — | | | | — | | | | 11,054 | | | | 11,054 | |
12 Mo. Federal Funds Rate | | 2.46% Fixed | | | USD | | | | 6,645,000 | | | | 11/15/24 | | | Annual | | | — | | | | — | | | | 10,216 | | | | 10,216 | |
12 Mo. Federal Funds Rate | | 2.25% Fixed | | | USD | | | | 1,240,000 | | | | 11/15/24 | | | Annual | | | 14,397 | | | | — | | | | 17,855 | | | | 3,458 | |
12 Mo. Federal Funds Rate | | 2.51% Fixed | | | USD | | | | 7,870,000 | | | | 11/15/24 | | | Annual | | | — | | | | — | | | | (3,513 | ) | | | (3,513 | ) |
12 Mo. Federal Funds Rate | | 1.63% Fixed | | | USD | | | | 13,700,000 | | | | 11/14/26 | | | Annual | | | — | | | | — | | | | 929,166 | | | | 929,166 | |
12 Mo. Federal Funds Rate | | 2.50% Fixed | | | USD | | | | 16,600,000 | | | | 03/01/28 | | | Annual | | | 53,273 | | | | — | | | | 11,225 | | | | (42,048 | ) |
3 Mo. USD LIBOR | | 2.00% Fixed | | | USD | | | | 17,550,000 | | | | 03/21/23 | | | Semi-Annual | | | 89,961 | | | | — | | | | 584,760 | | | | 494,799 | |
The accompanying notes are an integral part of these financial statements.
|
| Hartford Total Return Bond HLS Fund |
Schedule of Investments – (continued)
June 30, 2018 (Unaudited)
| | | | | | | | | | | | | | | | | | | | | | | | | | | | | | | | | | |
| Centrally Cleared Interest Rate Swap Contracts Outstanding at June 30, 2018 (continued) | |
Payments made by Fund | | Payments received
by Fund | | Notional
Amount | | | Expiration
Date | | | Periodic
Payment
Frequency | | | Upfront
Premiums
Paid | | | Upfront
Premiums
Received | | | Value† | | | Unrealized
Appreciation/
(Depreciation) | |
3 Mo. USD LIBOR | | 3.00% Fixed | | | USD | | | | 35,246,000 | | | | 04/30/25 | | | | Semi-Annual | | | $ | 131,578 | | | $ | — | | | $ | (181,922 | ) | | $ | (313,500 | ) |
3 Mo. USD LIBOR | | 3.00% Fixed | | | USD | | | | 13,187,000 | | | | 06/18/28 | | | | Semi-Annual | | | | — | | | | — | | | | (102,400 | ) | | | (102,400 | ) |
3 Mo. USD LIBOR | | 2.25% Fixed | | | USD | | | | 103,083,000 | | | | 06/20/28 | | | | Semi-Annual | | | | 5,586,456 | | | | — | | | | 6,105,749 | | | | 519,293 | |
3 Mo. USD LIBOR | | 2.75% Fixed | | | USD | | | | 22,395,000 | | | | 12/20/47 | | | | Semi-Annual | | | | — | | | | (493,978 | ) | | | 806,149 | | | | 1,300,127 | |
| | | | | | | | | | | | | | | | | | | | | | | | | | | | | | | | | | |
Total | | | | | | | | | | | $ | 6,220,505 | | | $ | (503,315 | ) | | $ | 9,067,989 | | | $ | 3,350,799 | |
| | | | | | | | | | | | | | | | | | | | | | | | | | | | | | | | | | |
| |
| | | | | | | | | | | | | | | | | | | | | | | | | | | | | | | | | | | | |
| OTC Total Return Swap Contracts Outstanding at June 30, 2018 | |
Reference Entity | | Counter-party | | Notional
Amount | | Payments received
(paid) by the Fund | | | Expiration
Date | | | Periodic
Payment
Frequency | | | Upfront
Premiums
Paid | | | Upfront
Premiums
Received | | | Market
Value† | | | Unrealized
Appreciation/
(Depreciation) | |
iBoxx USD liquid High Yield | | MSC | | | USD | | | 23,795,000 | | | (1.00 | %) | | | 12/20/18 | | | | Quarterly | | | $ | 25,650 | | | $ | — | | | $ | (211,590 | ) | | $ | (237,240 | ) |
iBoxx USD liquid High Yield | | GSC | | | USD | | | 23,677,000 | | | (1.00 | %) | | | 12/20/18 | | | | Quarterly | | | | 28,513 | | | | — | | | | (515,146 | ) | | | (543,659 | ) |
| | | | | | | | | | | | | | | | | | | | | | | | | | | | | | | | | | | | |
Total | | | | | | | $ | 54,163 | | | $ | — | | | $ | (726,736 | ) | | $ | (780,899 | ) |
| | | | | | | | | | | | | | | | | | | | | | | | | | | | | | | | | | | | |
| | | | | | | | | | | | | | | | | | | | | | | | | | | | | | |
| Foreign Currency Contracts Outstanding at June 30, 2018 | |
Amount and Description
of Currency to be
Purchased | | | Amount and Description
of Currency to be
Sold | | | Counterparty | | | Settlement
Date | | | Appreciation | | | Depreciation | |
| | 250,000 | | | | CAD | | | | 197,111 | | | | USD | | | | BOA | | | | 07/30/18 | | | $ | — | | | $ | (6,843 | ) |
| | 200,000 | | | | CAD | | | | 157,696 | | | | USD | | | | BOA | | | | 08/01/18 | | | | — | | | | (5,479 | ) |
| | 60,490,000 | | | | EGP | | | | 3,172,830 | | | | USD | | | | MSC | | | | 04/22/19 | | | | — | | | | (73,969 | ) |
| | 273,000 | | | | EUR | | | | 319,325 | | | | USD | | | | CBK | | | | 07/31/18 | | | | 199 | | | | — | |
| | 317,000,000 | | | | JPY | | | | 2,990,530 | | | | USD | | | | MSC | | | | 07/09/18 | | | | — | | | | (125,617 | ) |
| | 196,550 | | | | USD | | | | 250,000 | | | | CAD | | | | CIBC | | | | 07/30/18 | | | | 6,282 | | | | — | |
| | 157,245 | | | | USD | | | | 200,000 | | | | CAD | | | | CIBC | | | | 08/01/18 | | | | 5,029 | | | | — | |
| | 1,113,027 | | | | USD | | | | 951,000 | | | | EUR | | | | GSC | | | | 07/31/18 | | | | — | | | | (43 | ) |
| | 230,909 | | | | USD | | | | 199,000 | | | | EUR | | | | GSC | | | | 07/31/18 | | | | — | | | | (2,004 | ) |
| | 12,279,183 | | | | USD | | | | 10,529,000 | | | | EUR | | | | UBS | | | | 07/31/18 | | | | — | | | | (44,169 | ) |
| | 1,053,968 | | | | USD | | | | 886,000 | | | | EUR | | | | JPM | | | | 09/19/18 | | | | 12,981 | | | | — | |
| | 1,049,536 | | | | USD | | | | 887,000 | | | | EUR | | | | UBS | | | | 09/19/18 | | | | 7,375 | | | | — | |
| | 2,981,949 | | | | USD | | | | 317,000,000 | | | | JPY | | | | CBK | | | | 07/09/18 | | | | 117,036 | | | | — | |
| | | | | | | | | | | | | | | | | | | | | | | | | | | | | | |
| | Total | | | | | | | | | | | | | | | | | | | | | | | $ | 148,902 | | | $ | (258,124 | ) |
| | | | | | | | | | | | | | | | | | | | | | | | | | | | | | |
| † | See Significant Accounting Policies of accompanying Notes to Financial Statements regarding valuation of investments. |
The accompanying notes are an integral part of these financial statements.
|
| Hartford Total Return Bond HLS Fund |
Schedule of Investments – (continued)
June 30, 2018 (Unaudited)
| | |
| GLOSSARY: (abbreviations used in preceding Schedule of Investments) |
|
| Counterparty Abbreviations: |
BCLY | | Barclays |
BOA | | Banc of America Securities LLC |
CBK | | Citibank NA |
CIBC | | Canadian Imperial Bank of Commerce |
CSI | | Credit Suisse International |
DEUT | | Deutsche Bank Securities, Inc. |
GSC | | Goldman Sachs & Co. |
JPM | | JP Morgan Chase & Co. |
MSC | | Morgan Stanley |
UBS | | UBS AG |
|
| Currency Abbreviations: |
ARS | | Argentine Peso |
CAD | | Canadian Dollar |
EGP | | Egyptian Pound |
EUR | | Euro |
JPY | | Japanese Yen |
USD | | United States Dollar |
|
| Index Abbreviations: |
ABX.HE | | Markit Asset Backed Security Home Equity |
ABX.HE.PEN | | Markit Asset Backed Security Home Equity Penultimate |
CDX.EM | | Credit Derivatives Emerging Markets |
CDX.NA.HY | | Credit Derivatives North American High Yield |
CMBX.NA | | Markit Commercial Mortgage Backed North American |
CMT | | Constant Maturity Treasury Index |
ICE | | Intercontinental Exchange, Inc. |
ITRAXX.EUR | | Markit iTraxx - Europe |
ITRAXX.XOV | | Markit iTraxx Index - Europe Crossover |
iBoxx | | Markit iBoxx Indices - Euro, Sterling, Asian, US Dollar and European High-Yield Bond Markets |
| | |
| Other Abbreviations: |
CDO | | Collateralized Debt Obligation |
CLO | | Collateralized Loan Obligation |
CMO | | Collateralized Mortgage Obligation |
DDCA | | Dollars on Deposit in Custody Account |
EURIBOR | | Euro Interbank Offered Rate |
FHLMC | | Federal Home Loan Mortgage Corp. |
FNMA | | Federal National Mortgage Association |
GNMA | | Government National Mortgage Association |
LIBOR | | London Interbank Offered Rate |
MSCI | | Morgan Stanley Capital International |
MTA | | Monthly Treasury Average |
MTN | | Medium Term Note |
PRIME | | Prime Rate |
OTC | | Over-the-Counter |
TBA | | To Be Announced |
|
| Municipal Abbreviations: |
GO | | General Obligation |
The accompanying notes are an integral part of these financial statements.
|
| Hartford Total Return Bond HLS Fund |
Schedule of Investments – (continued)
June 30, 2018 (Unaudited)
Fair Valuation Summary
The following is a summary of the fair valuations according to the inputs used as of June 30, 2018 in valuing the Fund’s investments.
| | | | | | | | | | | | | | | | |
| | | Total | | | Level 1(1) | | | Level 2(1) | | | Level 3(1) | |
Assets | |
Asset & Commercial Mortgage Backed Securities | | $ | 797,129,978 | | | $ | — | | | $ | 797,129,978 | | | $ | — | |
Corporate Bonds | | | 625,365,268 | | | | — | | | | 625,365,268 | | | | — | |
Foreign Government Obligations | | | 29,853,820 | | | | — | | | | 29,853,820 | | | | — | |
Municipal Bonds | | | 25,246,318 | | | | — | | | | 25,246,318 | | | | — | |
Senior Floating Rate Interests | | | 62,105,673 | | | | — | | | | 62,105,673 | | | | — | |
U.S. Government Agencies | | | 1,270,899,041 | | | | — | | | | 1,270,899,041 | | | | — | |
U.S. Government Securities | | | 106,273,713 | | | | — | | | | 106,273,713 | | | | — | |
Common Stocks | |
Energy | | | 218,227 | | | | — | | | | 14,557 | | | | 203,670 | |
Preferred Stocks | | | 2,094,140 | | | | 2,094,140 | | | | — | | | | — | |
Warrants | | | 1,339 | | | | — | | | | — | | | | 1,339 | |
Escrows | | | 1 | | | | — | | | | — | | | | 1 | |
Short-Term Investments | | | 105,132,941 | | | | 85,187,325 | | | | 19,945,616 | | | | — | |
Purchased Options | | | 6,705,508 | | | | — | | | | 6,705,508 | | | | — | |
Foreign Currency Contracts(2) | | | 148,902 | | | | — | | | | 148,902 | | | | — | |
Futures Contracts(2) | | | 3,666,288 | | | | 3,666,288 | | | | — | | | | — | |
Swaps - Credit Default(2) | | | 1,910,900 | | | | — | | | | 1,910,900 | | | | — | |
Swaps - Interest Rate(2) | | | 3,796,750 | | | | — | | | | 3,796,750 | | | | — | |
| | | | | | | | | | | | | | | | |
Total | | $ | 3,040,548,807 | | | $ | 90,947,753 | | | $ | 2,949,396,044 | | | $ | 205,010 | |
| | | | | | | | | | | | | | | | |
Liabilities | |
Foreign Currency Contracts(2) | | $ | (258,124 | ) | | $ | — | | | $ | (258,124 | ) | | $ | — | |
Futures Contracts(2) | | | (1,239,095 | ) | | | (1,239,095 | ) | | | — | | | | — | |
Swaps - Credit Default(2) | | | (2,132,284 | ) | | | — | | | | (2,132,284 | ) | | | — | |
Swaps - Interest Rate(2) | | | (461,461 | ) | | | — | | | | (461,461 | ) | | | — | |
Swaps - Total Return(2) | | | (780,899 | ) | | | — | | | | (780,899 | ) | | | — | |
TBA Sale Commitments | | | (301,667,083 | ) | | | — | | | | (301,667,083 | ) | | | — | |
| | | | | | | | | | | | | | | | |
Total | | $ | (306,538,946 | ) | | $ | (1,239,095 | ) | | $ | (305,299,851 | ) | | $ | — | |
| | | | | | | | | | | | | | | | |
| (1) | For the six-month period ended June 30, 2018, there were no transfers between any levels. |
| (2) | Derivative instruments (excluding purchased and written options, if applicable) are valued at the unrealized appreciation/(depreciation) on the investments. |
Level 3 investments at the beginning and/or end of the period in relation to net assets were not significant and accordingly, a reconciliation of Level 3 assets for the period ended June 30, 2018 is not presented.
The accompanying notes are an integral part of these financial statements.
|
| Hartford Ultrashort Bond HLS Fund |
Schedule of Investments
June 30, 2018 (Unaudited)
| | | | | | | | | | | | |
| Shares or Principal Amount | | Market Value† | |
| ASSET & COMMERCIAL MORTGAGE BACKED SECURITIES - 28.1% | |
| | | | | | | Asset-Backed - Automobile - 15.0% | |
| | | | | | | | Ally Auto Receivables Trust | |
| | $ | | | | 453,096 | | | 1.38%, 10/15/2019 | | $ | 452,850 | |
| | | | | 1,478,286 | | | 1.53%, 03/16/2020 | | | 1,474,533 | |
| | | | | 1,310,000 | | | 2.72%, 05/17/2021 | | | 1,309,967 | |
| | | | | | | | American Credit Acceptance Receivables Trust | |
| | | | | 270,464 | | | 1.84%, 07/13/2020(1) | | | 270,351 | |
| | | | | 705,155 | | | 2.72%, 03/10/2021(1) | | | 704,809 | |
| | | | | 2,130,000 | | | 2.94%, 01/10/2022(1) | | | 2,130,583 | |
| | | | | | | | AmeriCredit Automobile Receivables Trust | |
| | | | | 407,475 | | | 1.46%, 05/10/2021 | | | 405,158 | |
| | | | | 141,586 | | | 1.51%, 05/18/2020 | | | 141,337 | |
| | | | | 395,021 | | | 1.65%, 09/18/2020 | | | 393,804 | |
| | | | | 512,953 | | | 1.69%, 12/18/2020 | | | 510,733 | |
| | | | | 1,160,000 | | | 2.71%, 07/19/2021 | | | 1,159,207 | |
| | | | | | | | ARI Fleet Lease Trust | |
| | | | | 1,161,163 | | | 1.91%, 04/15/2026(1) | | | 1,154,591 | |
| | | | | 240,000 | | | 2.55%, 10/15/2026(1) | | | 238,810 | |
| | | | | 565,000 | | | BMW Floorplan Master Owner Trust
1 mo. USD LIBOR + 0.320%,
2.35%, 05/15/2023(1)(2) | | | 564,999 | |
| | | | | 443,894 | | | BMW Vehicle Lease Trust
1.64%, 07/22/2019 | | | 443,113 | |
| | | | | | | | Canadian Pacer Auto Receivables Trust | |
| | | | | 320,000 | | | 2.05%, 03/19/2021(1) | | | 317,181 | |
| | | | | 1,400,000 | | | 2.70%, 08/19/2020(1) | | | 1,399,621 | |
| | | | | | | | Capital Auto Receivables Asset Trust | |
| | | | | 119,330 | | | 1.86%, 10/21/2019 | | | 119,282 | |
| | | | | 335,000 | | | 2.02%, 08/20/2021(1) | | | 331,918 | |
| | | | | | | | CarMax Auto Owner Trust | |
| | | | | 2,000,000 | | | 1.40%, 08/15/2021 | | | 1,972,285 | |
| | | | | 365,932 | | | 1.54%, 02/18/2020 | | | 365,386 | |
| | | | | 1,792,816 | | | 1.56%, 11/16/2020 | | | 1,784,312 | |
| | | | | 1,955,000 | | | 2.23%, 05/17/2021 | | | 1,946,245 | |
| | | | | | | | Chesapeake Funding LLC | |
| | | | | 1,123,536 | | | 1.91%, 08/15/2029(1) | | | 1,110,172 | |
| | | | | 1,520,000 | | | 2.12%, 11/15/2029(1) | | | 1,503,010 | |
| | | | | 601,789 | | | 1 mo. USD LIBOR + 0.450%,
2.52%, 05/15/2029(1)(2)(3) | | | 601,806 | |
| | | | | 930,000 | | | 3.04%, 04/15/2030(1) | | | 926,886 | |
| | | | | 665,112 | | | 1 mo. USD LIBOR + 1.150%,
3.22%, 03/15/2028(1)(2) | | | 667,600 | |
| | | | | | | | CPS Auto Receivables Trust | |
| | | | | 113,173 | | | 1.78%, 09/15/2020(1) | | | 112,785 | |
| | | | | 380,382 | | | 1.87%, 03/15/2021(1) | | | 378,614 | |
| | | | | 444,525 | | | 2.16%, 05/17/2021(1) | | | 442,952 | |
| | | | | 800,000 | | | DT Auto Owner Trust
2.84%, 09/15/2021(1) | | | 800,041 | |
| | | | | | | | Enterprise Fleet Financing LLC | |
| | | | | 1,348,944 | | | 1.74%, 02/22/2022(1) | | | 1,343,242 | |
| | | | | 755,109 | | | 1.97%, 01/20/2023(1) | | | 749,474 | |
| | | | | 940,000 | | | 2.13%, 05/22/2023(1) | | | 930,865 | |
| | | | | 523,089 | | | Exeter Automobile Receivables Trust
2.21%, 05/17/2021(1) | | | 521,432 | |
| | | | | 405,653 | | | Fifth Third Auto Trust
1.42%, 03/16/2020 | | | 404,590 | |
| | | | | | | | First Investors Auto Owner Trust | |
| | | | | 219,242 | | | 1.69%, 04/15/2021(1) | | | 218,422 | |
| | | | | 263,660 | | | 1.86%, 10/15/2021(1) | | | 262,344 | |
| | | | | 788,810 | | | 2.84%, 05/16/2022(1) | | | 788,717 | |
| | | | | | | | Flagship Credit Auto Trust | |
| | | | | 468,040 | | | 1.85%, 07/15/2021(1) | | | 465,052 | |
| | | | | 1,793,027 | | | 1.88%, 10/15/2021(1) | | | 1,782,998 | |
| | | | | | | | | | | | |
| Shares or Principal Amount | | Market Value† | |
| ASSET & COMMERCIAL MORTGAGE BACKED SECURITIES - 28.1% - (continued) | |
| | | | | | | Asset-Backed - Automobile - 15.0% - (continued) | |
| | | | | | | | Ford Credit Auto Lease Trust | |
| | $ | | | | 443,998 | | | 1.56%, 11/15/2019 | | $ | 443,060 | |
| | | | | 1,430,000 | | | 2.71%, 12/15/2020 | | | 1,429,148 | |
| | | | | | | | Ford Credit Auto Owner Trust | |
| | | | | 259,697 | | | 1.04%, 09/15/2019 | | | 259,400 | |
| | | | | 1,000,000 | | | 2.12%, 07/15/2026(1) | | | 986,518 | |
| | | | | 1,500,000 | | | 2.26%, 11/15/2025(1) | | | 1,493,088 | |
| | | | | | | | GM Financial Automobile Leasing Trust | |
| | | | | 533,629 | | | 1.61%, 12/20/2019 | | | 531,325 | |
| | | | | 291,622 | | | 1.67%, 09/20/2019 | | | 291,049 | |
| | | | | 600,000 | | | 2.39%, 04/20/2020 | | | 598,186 | |
| | | | | 2,410,000 | | | 2.83%, 07/20/2020 | | | 2,409,946 | |
| | | | | | | | GM Financial Consumer Automobile | |
| | | | | 195,391 | | | 1.51%, 03/16/2020(1) | | | 194,937 | |
| | | | | 227,957 | | | 1 mo. USD LIBOR + 0.120%,
2.21%, 03/16/2020(1)(2) | | | 227,907 | |
| | | | | | | | GM Financial Consumer Automobile Receivables Trust | | | | |
| | | | | 854,333 | | | 1.71%, 09/16/2020(1) | | | 851,184 | |
| | | | | 2,635,000 | | | 2.08%, 01/19/2021 | | | 2,624,141 | |
| | | | | 306,292 | | | Harley-Davidson Motorcycle Trust
1.41%, 06/15/2020 | | | 305,734 | |
| | | | | | | | Hyundai Auto Lease Securitization Trust | |
| | | | | 446,277 | | | 1.52%, 10/15/2019(1) | | | 445,527 | |
| | | | | 3,290,000 | | | 1.88%, 08/17/2020(1) | | | 3,275,171 | |
| | | | | 2,500,000 | | | 2.81%, 12/15/2020(1) | | | 2,500,184 | |
| | | | | | | | Hyundai Auto Receivables Trust | |
| | | | | 809,827 | | | 1.48%, 02/18/2020 | | | 807,449 | |
| | | | | 520,000 | | | 2.55%, 04/15/2021 | | | 519,358 | |
| | | | | 1,401,257 | | | Mercedes-Benz Auto Lease Trust
1.53%, 08/15/2019 | | | 1,398,938 | |
| | | | | 949,399 | | | Mercedes-Benz Auto Receivables Trust
1.26%, 02/16/2021 | | | 940,499 | |
| | | | | 1,960,000 | | | OneMain Direct Auto Receivables Trust
2.31%, 12/14/2021(1) | | | 1,945,326 | |
| | | | | | | | Prestige Auto Receivables Trust | |
| | | | | 329,137 | | | 1.46%, 07/15/2020(1) | | | 328,556 | |
| | | | | 830,530 | | | 1.80%, 11/16/2020(1) | | | 827,819 | |
| | | | | | | | Santander Drive Auto Receivables Trust | |
| | | | | 18,095 | | | 1.49%, 02/18/2020 | | | 18,085 | |
| | | | | 2,500,000 | | | 1.87%, 12/15/2020 | | | 2,495,229 | |
| | | | | 755,000 | | | 3.03%, 02/15/2022 | | | 755,311 | |
| | | | | | | | Securitized Term Auto Receivables Trust | |
| | | | | 45,260 | | | 1.51%, 04/25/2019(1) | | | 45,225 | |
| | | | | 488,668 | | | 1.78%, 01/27/2020(1) | | | 486,614 | |
| | | | | 1,500,000 | | | 2.21%, 06/25/2021(1) | | | 1,481,317 | |
| | | | | 2,500,000 | | | 2.81%, 12/29/2020(1) | �� | | 2,499,550 | |
| | | | | 260,763 | | | Toyota Auto Receivables Owner Trust
1.30%, 04/15/2020 | | | 259,393 | |
| | | | | 1,190,000 | | | Volkswagen Auto Loan Enhanced Trust
2.81%, 07/20/2021 | | | 1,189,990 | |
| | | | | | | | Westlake Automobile Receivables Trust | |
| | | | | 338,551 | | | 1.78%, 04/15/2020(1) | | | 338,131 | |
| | | | | 614,997 | | | 1.80%, 07/15/2020(1) | | | 613,055 | |
| | | | | 1,615,000 | | | 2.24%, 12/15/2020(1) | | | 1,610,131 | |
| | | | | 1,185,000 | | | 2.84%, 09/15/2021(1) | | | 1,185,055 | |
| | | | | | | | Wheels SPV LLC | |
| | | | | 162,829 | | | 1.59%, 05/20/2025(1) | | | 162,139 | |
| | | | | 495,236 | | | 1.88%, 04/20/2026(1) | | | 490,780 | |
| | | | | | | | World Omni Automobile Lease Securitization Trust | | | | |
| | | | | 546,236 | | | 1.68%, 12/16/2019 | | | 544,333 | |
The accompanying notes are an integral part of these financial statements.
|
| Hartford Ultrashort Bond HLS Fund |
Schedule of Investments – (continued)
June 30, 2018 (Unaudited)
| | | | | | | | | | | | |
| Shares or Principal Amount | | Market Value† | |
| ASSET & COMMERCIAL MORTGAGE BACKED SECURITIES - 28.1% - (continued) | |
| | | | | | | Asset-Backed - Automobile - 15.0% - (continued) | |
| | $ | | | | 2,010,000 | | | 2.59%, 11/16/2020 | | $ | 2,006,181 | |
| | | | | | | | | | | | |
| | | | | | | | | | | 75,417,046 | |
| | | | | | | | | | | | |
| | | | | | | Asset-Backed - Credit Card - 4.7% | |
| | | | | 2,995,000 | | | BA Credit Card Trust
1 mo. USD LIBOR + 0.380%, 2.45%, 06/15/2021(2) | | | 2,999,792 | |
| | | | | 915,000 | | | Barclays Dryrock Issuance Trust
1 mo. USD LIBOR + 0.330%, 2.40%, 03/15/2023(2) | | | 916,356 | |
| | | | | | | | Cabela’s Credit Card Master Note Trust | |
| | | | | 1,785,000 | | | 1.78%, 06/15/2022 | | | 1,766,165 | |
| | | | | 3,000,000 | | | 1 mo. USD LIBOR + 0.450%, 2.52%, 07/15/2022(2) | | | 3,007,442 | |
| | | | | 2,500,000 | | | Capital One Multi-Asset Execution Trust
1 mo. USD LIBOR + 0.450%,
2.52%, 02/15/2022(2) | | | 2,506,659 | |
| | | | | | | | CARDS Trust | | | | |
| | | | | 1,815,000 | | | 1 mo. USD LIBOR + 0.370%,
2.44%, 04/18/2022(1)(2) | | | 1,816,766 | |
| | | | | 2,480,000 | | | 1 mo. USD LIBOR + 0.700%,
2.77%, 07/15/2021(1)(2)(3) | | | 2,480,632 | |
| | | | | | | | Chase Issuance Trust | | | | |
| | | | | 2,250,000 | | | 1.27%, 07/15/2021 | | | 2,217,425 | |
| | | | | 6,000,000 | | | 1 mo. USD LIBOR + 0.420%,
2.49%, 11/16/2020(2) | | | 6,007,580 | |
| | | | | | | | | | | | |
| | | | | | | | 23,718,817 | |
| | | | | | | | | | | | |
| | | | | | | Asset-Backed - Finance & Insurance - 6.0% | |
| | | | | | | | CNH Equipment Trust | | | | |
| | | | | 289,216 | | | 1.26%, 02/18/2020 | | | 288,887 | |
| | | | | 1,064,203 | | | 1.64%, 07/15/2020 | | | 1,060,922 | |
| | | | | 1,625,000 | | | 1.84%, 03/15/2021 | | | 1,615,871 | |
| | | | | 1,800,000 | | | 2.78%, 08/16/2021 | | | 1,799,833 | |
| | | | | | | | DLL Securitization Trust | |
| | | | | 860,000 | | | 1.89%, 07/15/2020(1) | | | 856,688 | |
| | | | | 2,495,000 | | | 2.81%, 11/17/2020(1) | | | 2,495,398 | |
| | | | | 486,358 | | | Engs Commercial Finance Trust
2.97%, 02/22/2021(1) | | | 485,896 | |
| | | | | | | | Ford Credit Floorplan Master Owner Trust | | | | |
| | | | | 1,745,000 | | | 1 mo. USD LIBOR + 0.530%,
2.60%, 07/15/2020(2) | | | 1,745,348 | |
| | | | | 1,380,000 | | | 1 mo. USD LIBOR + 0.600%,
2.67%, 08/15/2020(2) | | | 1,380,636 | |
| | | | | | | | GMF Floorplan Owner Revolving Trust | | | | |
| | | | | 2,675,000 | | | 1 mo. USD LIBOR + 0.430%,
2.50%, 07/15/2022(1)(2) | | | 2,682,036 | |
| | | | | 1,440,000 | | | 1 mo. USD LIBOR + 0.570%,
2.64%, 01/18/2022(1)(2) | | | 1,446,099 | |
| | | | | | | | GreatAmerica Leasing Receivables Funding LLC | | | | |
| | | | | 318,350 | | | 1.72%, 04/22/2019(1) | | | 317,896 | |
| | | | | 760,000 | | | 2.35%, 05/15/2020(1) | | | 757,470 | |
| | | | | | | | John Deere Owner Trust | |
| | | | | 315,587 | | | 1.50%, 10/15/2019 | | | 315,051 | |
| | | | | 285,872 | | | 1.59%, 04/15/2020 | | | 284,787 | |
| | | | | 1,310,000 | | | Kubota Credit Owner Trust
2.80%, 02/16/2021(1) | | | 1,308,831 | |
| | | | | | | | MMAF Equipment Finance LLC | |
| | | | | 527,658 | | | 1.73%, 05/18/2020(1) | | | 526,204 | |
| | | | | 1,880,000 | | | 1.93%, 10/15/2020(1) | | | 1,867,449 | |
| | | | | 1,365,000 | | | 2.92%, 07/12/2021(1) | | | 1,364,346 | |
| | | | | | | | | | | | |
| Shares or Principal Amount | | Market Value† | |
| ASSET & COMMERCIAL MORTGAGE BACKED SECURITIES - 28.1% - (continued) | |
| | | | | | | Asset-Backed - Finance & Insurance - 6.0% - (continued) | |
| | $ | | | | 362,067 | | | Nationstar HECM Loan Trust
2.76%, 02/25/2028(1)(3)(4)(5) | | $ | 362,067 | |
| | | | | | | | New York City Tax Lien | |
| | | | | 55,164 | | | 1.47%, 11/10/2029(1) | | | 54,232 | |
| | | | | 1,019,563 | | | 1.87%, 11/10/2030(1) | | | 1,006,785 | |
| | | | | | | | Verizon Owner Trust | |
| | | | | 2,250,000 | | | 1.42%, 01/20/2021(1) | | | 2,235,983 | |
| | | | | 730,000 | | | 1.92%, 12/20/2021(1) | | | 719,667 | |
| | | | | 905,000 | | | 2.06%, 09/20/2021(1) | | | 894,691 | |
| | | | | 1,982,044 | | | Volvo Financial Equipment LLC
1.55%, 10/15/2019(1) | | | 1,977,604 | |
| | | | | 230,000 | | | Volvo Financial Equipment Master Owner Trust
1 mo. USD LIBOR + 0.500%,
2.57%, 11/15/2022(1)(2) | | | 230,430 | |
| | | | | | | | | | | | |
| | | | | | | | 30,081,107 | |
| | | | | | | | | | | | |
| | | | | | | Asset-Backed - Home Equity - 0.3% | | | |
| | | | | 1,411,484 | | | New Residential Mortgage Loan Trust
4.00%, 08/27/2057(1)(3) | | | 1,424,150 | |
| | | | | | | | | | | | |
| | | | | | | Asset-Backed - Student Loan - 1.0% | | | |
| | | | | | | | Navient Student Loan Trust | | | | |
| | | | | 386,011 | | | 1 mo. USD LIBOR + 0.400%, 2.49%, 07/26/2066(1)(2) | | | 386,177 | |
| | | | | 203,024 | | | 1 mo. USD LIBOR + 0.480%, 2.57%, 03/25/2066(1)(2) | | | 203,359 | |
| | | | | | | | SLM Student Loan Trust | | | | |
| | | | | 883,229 | | | 3 mo. USD LIBOR + 0.090%, 2.45%, 10/25/2024(2) | | | 882,541 | |
| | | | | 798,229 | | | 3 mo. USD LIBOR + 0.120%, 2.48%, 01/25/2027(2) | | | 795,296 | |
| | | | | 891,194 | | | 1 mo. USD LIBOR + 0.520%, 2.61%, 03/25/2026(2) | | | 893,615 | |
| | | | | 1,534,756 | | | 1 mo. USD LIBOR + 0.600%, 2.69%, 11/25/2027(2) | | | 1,541,136 | |
| | | | | 494,687 | | | SoFi Professional Loan Program LLC
1 mo. USD LIBOR + 1.600%,
3.69%, 06/25/2025(1)(2) | | | 499,444 | |
| | | | | | | | | | | | |
| | | | 5,201,568 | |
| | | | | | | | | | | | |
| | | | | | | Commercial Mortgage-Backed Securities - 0.9% | |
| | | | | 1,365,000 | | | FREMF Mortgage Trust
1 mo. USD LIBOR + 0.320%,
2.40%, 02/25/2020(2) | | | 1,368,144 | |
| | | | | 800,000 | | | GS Mortgage Securities Corp. Trust
1 mo. USD LIBOR + 0.700%,
2.77%, 07/15/2032(1)(2) | | | 799,693 | |
| | | | | 500,000 | | | JP Morgan Chase Commercial Mortgage Securities Trust
5.63%, 12/05/2027(1) | | | 519,104 | |
| | | | | 1,472 | | | LB-UBS Commercial Mortgage Trust
6.32%, 04/15/2041(3) | | | 1,474 | |
| | | | | 1,892,889 | | | SG Residential Mortgage Trust
3.43%, 04/27/2048(1)(3) | | | 1,892,889 | |
| | | | | | | | | | | | |
| | | | 4,581,304 | |
| | | | | | | | | | | | |
| | | | | | | Whole Loan Collateral CMO - 0.2% | |
| | | | | 247,141 | | | OBX Trust
1 mo. USD LIBOR + 0.650%,
2.74%, 06/25/2057(1)(2) | | | 247,435 | |
The accompanying notes are an integral part of these financial statements.
|
| Hartford Ultrashort Bond HLS Fund |
Schedule of Investments – (continued)
June 30, 2018 (Unaudited)
| | | | | | | | | | | | |
| Shares or Principal Amount | | Market Value† | |
| ASSET & COMMERCIAL MORTGAGE BACKED SECURITIES - 28.1% - (continued) | |
| | | | | | | Whole Loan Collateral CMO - 0.2% - (continued) | |
| | $ | | | | 690,703 | | | Verus Securitization Trust
2.93%, 02/25/2048(1)(3) | | $ | 684,927 | |
| | | | | | | | | | | | |
| | | | 932,362 | |
| | | | | | | | | | | | |
| | |
| | | | Total Asset & Commercial Mortgage Backed Securities
(cost $141,773,632) | | $ | 141,356,354 | |
| | | | | | | | | | | | |
| | | |
| | | | | | | | | | | | |
| CORPORATE BONDS - 44.5% | |
| | | | Agriculture - 0.4% | |
| | $ | | | | 1,750,000 | | | Philip Morris International, Inc.
3 mo. USD LIBOR + 0.420%,
2.75%, 02/21/2020(2) | | $ | 1,756,556 | |
| | | | | | | | | | | | |
| | | | Auto Manufacturers - 3.7% | |
| | | | | 2,000,000 | | | American Honda Finance Corp.
2.00%, 11/13/2019 | | | 1,977,022 | |
| | | | Daimler Finance North America LLC | |
| | | | | 1,750,000 | | | 1.50%, 07/05/2019(1) | | | 1,724,521 | |
| | | | | 715,000 | | | 3 mo. USD LIBOR + 0.390%,
2.75%, 05/04/2020(1)(2) | | | 714,748 | |
| | | | Ford Motor Credit Co. LLC | |
| | | | | 1,500,000 | | | 2.26%, 03/28/2019 | | | 1,491,933 | |
| | | | | 2,500,000 | | | 3 mo. USD LIBOR + 0.830%,
3.16%, 03/12/2019(2) | | | 2,507,818 | |
| | | | | 1,000,000 | | | General Motors Financial Co., Inc.
3 mo. USD LIBOR + 0.850%,
3.19%, 04/09/2021(2) | | | 1,005,201 | |
| | | | | 1,500,000 | | | Harley-Davidson Financial Services, Inc.
2.25%, 01/15/2019(1) | | | 1,495,920 | |
| | | | | 1,250,000 | | | Hyundai Capital America
3 mo. USD LIBOR + 0.940%,
3.26%, 07/08/2021(1)(2) | | | 1,250,600 | |
| | | | | 1,900,000 | | | Nissan Motor Acceptance Corp.
3 mo. USD LIBOR + 0.390%,
2.73%, 09/28/2020(1)(2) | | | 1,901,240 | |
| | | | | 1,500,000 | | | PACCAR Financial Corp.
3 mo. USD LIBOR + 0.600%, 2.91%, 12/06/2018(2) | | | 1,503,390 | |
| | | | Toyota Motor Credit Corp. | |
| | | | | 1,000,000 | | | 2.20%, 01/10/2020 | | | 990,840 | |
| | | | | 2,000,000 | | | 3 mo. USD LIBOR + 0.260%, 2.61%, 04/17/2020(2) | | | 2,005,607 | |
| | | | | | | | | | | | |
| | | | 18,568,840 | |
| | | | | | | | | | | | |
| | | | Beverages - 2.4% | |
| | | | | 5,000,000 | | | Anheuser-Busch InBev Finance, Inc.
3 mo. USD LIBOR + 0.400%, 2.76%, 02/01/2019(2) | | | 5,010,078 | |
| | | | | 6,000,000 | | | Anheuser-Busch InBev Worldwide, Inc.
3 mo. USD LIBOR + 0.690%, 3.05%, 08/01/2018(2) | | | 6,004,220 | |
| | | | | 1,250,000 | | | PepsiCo, Inc.
3 mo. USD LIBOR + 0.040%, 2.40%, 05/02/2019(2) | | | 1,250,725 | |
| | | | | | | | | | | | |
| | | | 12,265,023 | |
| | | | | | | | | | | | |
| | | | Biotechnology - 0.7% | |
| | | | | 2,148,000 | | | Amgen, Inc.
3 mo. USD LIBOR + 0.320%, 2.67%, 05/10/2019(2) | | | 2,152,581 | |
| | | | | | | | | | | | |
| Shares or Principal Amount | | Market Value† | |
| CORPORATE BONDS - 44.5% - (continued) | |
| | | | Biotechnology - 0.7% - (continued) | |
| | $ | | | | 1,205,000 | | | Gilead Sciences, Inc.
1.85%, 09/20/2019 | | $ | 1,190,354 | |
| | | | | | | | | | | | |
| | | | 3,342,935 | |
| | | | | | | | | | | | |
| | | | Chemicals - 0.5% | |
| | | | | 1,250,000 | | | Air Liquide Finance S.A.
1.38%, 09/27/2019(1) | | | 1,226,983 | |
| | | | | 1,450,000 | | | EI du Pont de Nemours & Co.
3 mo. USD LIBOR + 0.530%,
2.89%, 05/01/2020(2) | | | 1,454,956 | |
| | | | | | | | | | | | |
| | | | 2,681,939 | |
| | | | | | | | | | | | |
| | | | Commercial Banks - 19.3% | |
| | | | | 2,200,000 | | | ABN Amro Bank N.V.
3 mo. USD LIBOR + 0.640%,
3.00%, 01/18/2019(1)(2) | | | 2,205,918 | |
| | | | Bank of America Corp. | |
| | | | | 1,500,000 | | | 3 mo. USD LIBOR + 0.650%, 2.99%, 10/01/2021(2) | | | 1,505,312 | |
| | | | | 2,000,000 | | | 3 mo. USD LIBOR + 1.040%, 3.39%, 01/15/2019(2) | | | 2,010,067 | |
| | | | | 1,350,000 | | | Bank of Montreal
1.35%, 08/28/2018(3) | | | 1,347,731 | |
| | | | | 1,750,000 | | | Bank of Nova Scotia
1.65%, 06/14/2019 | | | 1,731,092 | |
| | | | BB&T Corp. | |
| | | | | 1,500,000 | | | 3 mo. USD LIBOR + 0.570%, 2.91%, 06/15/2020(2) | | | 1,507,610 | |
| | | | | 2,500,000 | | | 3 mo. USD LIBOR + 0.660%, 3.02%, 02/01/2019(2) | | | 2,506,408 | |
| | | | | 1,750,000 | | | Canadian Imperial Bank of Commerce
3 mo. USD LIBOR + 0.320%,
2.68%, 02/02/2021(2) | | | 1,749,524 | |
| | | | Capital One Financial Corp. | |
| | | | | 1,250,000 | | | 3 mo. USD LIBOR + 0.760%, 3.12%, 05/12/2020(2) | | | 1,255,250 | |
| | | | | 1,500,000 | | | 3 mo. USD LIBOR + 0.950%, 3.28%, 03/09/2022(2) | | | 1,505,693 | |
| | | | | 4,000,000 | | | Citigroup, Inc.
3 mo. USD LIBOR + 0.770%,
3.10%, 04/08/2019(2) | | | 4,016,911 | |
| | | | | 1,500,000 | | | Citizens Bank NA
3 mo. USD LIBOR + 0.540%,
2.86%, 03/02/2020(2) | | | 1,503,082 | |
| | | | | 2,070,000 | | | Commonwealth Bank of Australia
3 mo. USD LIBOR + 0.640%,
3.00%, 11/07/2019(1)(2) | | | 2,081,104 | |
| | | | | 2,500,000 | | | Credit Agricole S.A.
3 mo. USD LIBOR + 0.970%,
3.30%, 06/10/2020(1)(2) | | | 2,530,290 | |
| | | | Danske Bank A/S | |
| | | | | 1,500,000 | | | 3 mo. USD LIBOR + 0.510%,
2.83%, 03/02/2020(1)(2) | | | 1,503,950 | |
| | | | | 2,000,000 | | | 3 mo. USD LIBOR + 0.580%,
2.89%, 09/06/2019(1)(2) | | | 2,008,010 | |
| | | | | 1,500,000 | | | Deutsche Bank AG
3 mo. USD LIBOR + 0.970%,
3.31%, 07/13/2020(2) | | | 1,490,576 | |
| | | | | 1,500,000 | | | DNB Bank ASA
3 mo. USD LIBOR + 0.370%,
2.71%, 10/02/2020(1)(2) | | | 1,502,607 | |
The accompanying notes are an integral part of these financial statements.
|
| Hartford Ultrashort Bond HLS Fund |
Schedule of Investments – (continued)
June 30, 2018 (Unaudited)
| | | | | | | | | | | | |
| Shares or Principal Amount | | Market Value† | |
| CORPORATE BONDS - 44.5% - (continued) | |
| | | | Commercial Banks - 19.3% - (continued) | |
| | | | Fifth Third Bank | |
| | $ | | | | 500,000 | | | 2.20%, 10/30/2020 | | $ | 488,673 | |
| | | | | 1,000,000 | | | 3 mo. USD LIBOR + 0.250%, 2.61%, 10/30/2020(2) | | | 999,075 | |
| | | | | 2,350,000 | | | 3 mo. USD LIBOR + 0.590%, 2.93%, 09/27/2019(2) | | | 2,356,859 | |
| | | | Goldman Sachs Group, Inc. | |
| | | | | 3,500,000 | | | 3 mo. USD LIBOR + 1.170%, 3.51%, 11/15/2021(2) | | | 3,542,952 | |
| | | | | 2,000,000 | | | 3 mo. USD LIBOR + 1.160%, 3.52%, 04/23/2020(2) | | | 2,025,944 | |
| | | | | 1,785,000 | | | HSBC Holdings plc
3 mo. USD LIBOR + 0.600%,
2.93%, 05/18/2021(2) | | | 1,787,601 | |
| | | | Huntington National Bank | |
| | | | | 1,500,000 | | | 2.20%, 11/06/2018 | | | 1,497,983 | |
| | | | | 1,500,000 | | | 3 mo. USD LIBOR + 0.510%, 2.84%, 03/10/2020(2) | | | 1,503,169 | |
| | | | | 1,000,000 | | | ING Bank N.V.
1.65%, 08/15/2019(1) | | | 985,003 | |
| | | | JP Morgan Chase & Co. | |
| | | | | 1,500,000 | | | 3 mo. USD LIBOR + 0.680%, 2.98%, 06/01/2021(2) | | | 1,507,125 | |
| | | | | 3,000,000 | | | 3 mo. USD LIBOR + 0.630%, 2.99%, 01/28/2019(2) | | | 3,009,076 | |
| | | | | 1,000,000 | | | KeyBank NA
1.60%, 08/22/2019 | | | 985,256 | |
| | | | | 1,250,000 | | | Manufacturers & Traders Trust Co.
3 mo. USD LIBOR + 0.270%, 2.63%, 01/25/2021(2) | | | 1,249,318 | |
| | | | | 3,000,000 | | | Morgan Stanley
3 mo. USD LIBOR + 0.850%, 3.21%, 01/24/2019(2) | | | 3,011,592 | |
| | | | PNC Bank NA | |
| | | | | 2,000,000 | | | 1.45%, 07/29/2019 | | | 1,972,012 | |
| | | | | 870,000 | | | 1.70%, 12/07/2018 | | | 866,665 | |
| | | | | 750,000 | | | 2.50%, 01/22/2021 | | | 736,308 | |
| | | | | 1,500,000 | | | Regions Bank
3 mo. USD LIBOR + 0.380%, 2.72%, 04/01/2021(2) | | | 1,498,162 | |
| | | | | 3,000,000 | | | Royal Bank of Canada
3 mo. USD LIBOR + 0.450%, 2.79%, 01/10/2019(2) | | | 3,005,990 | |
| | | | | | | | Santander UK plc | | | | |
| | | | | 1,500,000 | | | 3 mo. USD LIBOR + 0.620%, 2.92%, 06/01/2021(2) | | | 1,499,148 | |
| | | | | 2,500,000 | | | 3 mo. USD LIBOR + 0.850%, 3.18%, 08/24/2018(2) | | | 2,503,349 | |
| | | | | 3,000,000 | | | Societe Generale S.A.
3 mo. USD LIBOR + 1.080%, 3.42%, 10/01/2018(2) | | | 3,007,097 | |
| | | | | | | | Sumitomo Mitsui Banking Corp. | | | | |
| | | | | 1,000,000 | | | 2.51%, 01/17/2020 | | | 989,449 | |
| | | | | 1,000,000 | | | 3 mo. USD LIBOR + 0.350%, 2.70%, 01/17/2020(2) | | | 999,979 | |
| | | | SunTrust Bank | | | | |
| | | | | 1,000,000 | | | 3 mo. USD LIBOR + 0.300%, 2.59%, 01/29/2021(2) | | | 991,145 | |
| | | | | 3,000,000 | | | 3 mo. USD LIBOR + 0.530%, 2.89%, 01/31/2020(2) | | | 3,010,563 | |
| | | | | | | | | | | | |
| Shares or Principal Amount | | Market Value† | |
| CORPORATE BONDS - 44.5% - (continued) | |
| | | | Commercial Banks - 19.3% - (continued) | |
| | | | Svenska Handelsbanken AB | |
| | $ | | | | 1,250,000 | | | 3 mo. USD LIBOR + 0.360%, 2.68%, 09/08/2020(2) | | $ | 1,252,332 | |
| | | | | 1,250,000 | | | 3 mo. USD LIBOR + 0.470%, 2.80%, 05/24/2021(2) | | | 1,250,275 | |
| | | | | 1,665,000 | | | 3 mo. USD LIBOR + 0.490%, 2.80%, 09/06/2019(2) | | | 1,670,770 | |
| | | | | 2,250,000 | | | Toronto-Dominion Bank
1.45%, 08/13/2019 | | | 2,217,325 | |
| | | | | 875,000 | | | U.S. Bancorp
3 mo. USD LIBOR + 0.490%, 2.83%, 11/15/2018(2) | | | 876,195 | |
| | | | U.S. Bank NA | |
| | | | | 1,000,000 | | | 2.05%, 10/23/2020 | | | 976,362 | |
| | | | | 1,775,000 | | | 3 mo. USD LIBOR + 0.290%, 2.62%, 05/21/2021(2) | | | 1,772,449 | |
| | | | | 1,250,000 | | | 3 mo. USD LIBOR + 0.320%, 2.68%, 01/24/2020(2) | | | 1,252,666 | |
| | | | UBS AG | |
| | | | | 715,000 | | | 2.45%, 12/01/2020(1) | | | 698,925 | |
| | | | | 1,250,000 | | | 3 mo. USD LIBOR + 0.320%, 2.64%, 12/07/2018(1)(2) | | | 1,251,012 | |
| | | | | 800,000 | | | 3 mo. USD LIBOR + 0.580%, 2.90%, 06/08/2020(1)(2) | | | 802,192 | |
| | | | Wells Fargo Bank NA | |
| | | | | 1,025,000 | | | 2.60%, 01/15/2021 | | | 1,008,669 | |
| | | | | 2,000,000 | | | 3 mo. USD LIBOR + 0.650%, 2.96%, 12/06/2019(2) | | | 2,013,368 | |
| | | | | | | | | | | | |
| | | | 97,033,168 | |
| | | | | | | | | | | | |
| | | | Commercial Services - 0.2% | |
| | | | | 915,000 | | | Equifax, Inc.
3 mo. USD LIBOR + 0.870%, 3.20%, 08/15/2021(2) | | | 917,734 | |
| | | | | | | | | | | | |
| | | | Diversified Financial Services - 2.1% | |
| | | | | 1,250,000 | | | AIG Global Funding
3 mo. USD LIBOR + 0.460%, 2.80%, 06/25/2021(1)(2) | | | 1,250,711 | |
| | | | | 1,000,000 | | | American Express Co.
3 mo. USD LIBOR + 0.525%, 2.85%, 05/17/2021(2) | | | 1,002,784 | |
| | | | American Express Credit Corp. | |
| | | | | 1,000,000 | | | 3 mo. USD LIBOR + 0.330%, 2.68%, 05/03/2019(2) | | | 1,001,767 | |
| | | | | 2,500,000 | | | 3 mo. USD LIBOR + 0.550%, 2.89%, 03/18/2019(2) | | | 2,507,980 | |
| | | | | 1,395,000 | | | Private Export Funding Corp.
2.10%, 12/19/2019(1) | | | 1,383,480 | |
| | | | | 1,465,000 | | | Protective Life Global Funding
1.72%, 04/15/2019(1) | | | 1,451,862 | |
| | | | | 1,700,000 | | | Synchrony Financial
3 mo. USD LIBOR + 1.230%, 3.58%, 02/03/2020(2) | | | 1,715,940 | |
| | | | | | | | | | | | |
| | | | 10,314,524 | |
| | | | | | | | | | | | |
| | | | Electric - 1.2% | |
| | | | | 1,250,000 | | | American Electric Power Co., Inc.
2.15%, 11/13/2020 | | | 1,219,464 | |
| | | | | 1,500,000 | | | Duke Energy Florida LLC
2.10%, 12/15/2019 | | | 1,491,345 | |
The accompanying notes are an integral part of these financial statements.
|
| Hartford Ultrashort Bond HLS Fund |
Schedule of Investments – (continued)
June 30, 2018 (Unaudited)
| | | | | | | | | | | | |
| Shares or Principal Amount | | Market Value† | |
| CORPORATE BONDS - 44.5% - (continued) | |
| | | | Electric - 1.2% - (continued) | |
| | $ | | | | 3,475,000 | | | Pacific Gas & Electric Co.
3 mo. USD LIBOR + 0.230%, 2.55%, 11/28/2018(2) | | $ | 3,461,369 | |
| | | | | | | | | | | | |
| | | | 6,172,178 | |
| | | | | | | | | | | | |
| | | | Electronics - 0.6% | |
| | | | Honeywell International, Inc. | |
| | | | | 1,000,000 | | | 1.80%, 10/30/2019 | | | 987,543 | |
| | | | | 2,000,000 | | | 3 mo. USD LIBOR + 0.280%, 2.64%, 10/30/2019(2) | | | 2,006,271 | |
| | | | | | | | | | | | |
| | | | 2,993,814 | |
| | | | | | | | | | | | |
| | | | Food - 0.6% | |
| | | | | 1,500,000 | | | JM Smucker Co.
2.20%, 12/06/2019 | | | 1,483,985 | |
| | | | | 1,500,000 | | | Kraft Heinz Foods Co.
3 mo. USD LIBOR + 0.570%, 2.92%, 02/10/2021(2) | | | 1,501,722 | |
| | | | | | | | | | | | |
| | | | 2,985,707 | |
| | | | | | | | | | | | |
| | | | Healthcare - Services - 0.8% | |
| | | | | 490,000 | | | Orlando Health OBL Group
2.28%, 10/01/2018 | | | 489,412 | |
| | | | | 2,500,000 | | | Roche Holdings, Inc.
3 mo. USD LIBOR + 0.340%, 2.67%, 09/30/2019(1)(2) | | | 2,509,477 | |
| | | | | 1,000,000 | | | UnitedHealth Group, Inc.
1.95%, 10/15/2020 | | | 975,614 | |
| | | | | | | | | | | | |
| | | | 3,974,503 | |
| | | | | | | | | | | | |
| | | | Insurance - 2.8% | |
| | | | | 440,000 | | | Allstate Corp.
3 mo. USD LIBOR + 0.430%, 2.76%, 03/29/2021(2) | | | 440,210 | |
| | | | | 1,400,000 | | | Jackson National Life Global Funding
3 mo. USD LIBOR + 0.250%, 2.59%, 12/27/2018(1)(2) | | | 1,400,817 | |
| | | | MassMutual Global Funding II | |
| | | | | 1,500,000 | | | 1.55%, 10/11/2019(1) | | | 1,475,199 | |
| | | | | 704,000 | | | 1.95%, 09/22/2020(1) | | | 684,881 | |
| | | | Metropolitan Life Global Funding I | |
| | | | | 2,460,000 | | | 1.75%, 12/19/2018(1) | | | 2,451,562 | |
| | | | | 795,000 | | | 2.40%, 01/08/2021(1) | | | 780,054 | |
| | | | | 2,000,000 | | | New York Life Global Funding
3 mo. USD LIBOR + 0.270%, 2.60%, 04/09/2020(1)(2) | | | 2,004,998 | |
| | | | | 1,000,000 | | | Protective Life Global Funding
3 mo. USD LIBOR + 0.520%, 2.86%, 06/28/2021(1)(2) | | | 999,712 | |
| | | | | 4,000,000 | | | Prudential Financial, Inc.
3 mo. USD LIBOR + 0.780%, 3.12%, 08/15/2018(2) | | | 4,003,613 | |
| | | | | | | | | | | | |
| | | | 14,241,046 | |
| | | | | | | | | | | | |
| | | | Iron/Steel - 0.3% | |
| | | | | 1,500,000 | | | Glencore Funding LLC
2.50%, 01/15/2019(1) | | | 1,491,840 | |
| | | | | | | | | | | | |
| | | | IT Services - 0.7% | |
| | | | | 1,425,000 | | | Apple, Inc.
3 mo. USD LIBOR + 0.070%, 2.43%, 05/11/2020(2) | | | 1,426,001 | |
| | | | | | | | | | | | |
| Shares or Principal Amount | | Market Value† | |
| CORPORATE BONDS - 44.5% - (continued) | |
| | | | IT Services - 0.7% - (continued) | |
| | $ | | | | 2,000,000 | | | Hewlett Packard Enterprise Co.
2.10%, 10/04/2019(1) | | $ | 1,974,824 | |
| | | | | | | | | | | | |
| | | | 3,400,825 | |
| | | | | | | | | | | | |
| | | | Machinery - Construction & Mining - 0.6% | |
| | | | Caterpillar Financial Services Corp. | |
| | | | | 1,000,000 | | | 2.00%, 11/29/2019 | | | 988,142 | |
| | | | | 1,750,000 | | | 3 mo. USD LIBOR + 0.280%, 2.61%, 03/22/2019(2) | | | 1,751,671 | |
| | | | | | | | | | | | |
| | | | 2,739,813 | |
| | | | | | | | | | | | |
| | | | Machinery - Diversified - 1.1% | |
| | | | John Deere Capital Corp. | |
| | | | | 1,125,000 | | | 3 mo. USD LIBOR + 0.290%, 2.62%, 06/22/2020(2) | | | 1,127,371 | |
| | | | | 2,000,000 | | | 3 mo. USD LIBOR + 0.300%, 2.63%, 03/13/2020(2) | | | 2,004,641 | |
| | | | | 2,500,000 | | | Roper Technologies, Inc.
2.05%, 10/01/2018 | | | 2,496,870 | |
| | | | | | | | | | | | |
| | | | | | | | | | | 5,628,882 | |
| | | | | | | | | | | | |
| | | | | | | Media - 0.5% | |
| | | | | 1,125,000 | | | NBCUniversal Enterprise, Inc.
3 mo. USD LIBOR + 0.400%, 2.74%, 04/01/2021(1)(2) | | | 1,126,557 | |
| | | | | 1,315,000 | | | Walt Disney Co.
0.88%, 07/12/2019 | | | 1,290,045 | |
| | | | | | | | | | | | |
| | | | | | | | | | | 2,416,602 | |
| | | | | | | | | | | | |
| | | | | | | Miscellaneous Manufacturing - 0.6% | |
| | | | | | | | Siemens Financieringsmaatschappij N.V. | | | | |
| | | | | 1,700,000 | | | 3 mo. USD LIBOR + 0.320%, 2.65%, 09/13/2019(1)(2) | | | 1,704,873 | |
| | | | | 1,500,000 | | | 3 mo. USD LIBOR + 0.340%, 2.68%, 03/16/2020(1)(2) | | | 1,505,424 | |
| | | | | | | | | | | | |
| | | | | | | | | | | 3,210,297 | |
| | | | | | | | | | | | |
| | | | | | | Oil & Gas - 2.2% | |
| | | | | | | | BP Capital Markets plc | | | | |
| | | | | 980,000 | | | 1.77%, 09/19/2019 | | | 967,798 | |
| | | | | 4,000,000 | | | 3 mo. USD LIBOR + 0.630%, 2.97%, 09/26/2018(2) | | | 4,006,203 | |
| | | | | 1,500,000 | | | Chevron Corp.
3 mo. USD LIBOR + 0.210%, 2.53%, 03/03/2020(2) | | | 1,503,500 | |
| | | | | 3,000,000 | | | Equinor ASA
3 mo. USD LIBOR + 0.460%, 2.82%, 11/08/2018(2) | | | 3,005,083 | |
| | | | | 1,660,000 | | | Phillips 66
3 mo. USD LIBOR + 0.750%, 3.10%, 04/15/2020(1)(2) | | | 1,660,701 | |
| | | | | | | | | | | | |
| | | | | | | | | | | 11,143,285 | |
| | | | | | | | | | | | |
| | | | | | | Oil & Gas Services - 0.2% | |
| | | | | 1,250,000 | | | Schlumberger Finance Canada Ltd.
2.20%, 11/20/2020(1) | | | 1,219,379 | |
| | | | | | | | | | | | |
| | | | | | | Pharmaceuticals - 0.7% | |
| | | | | 1,500,000 | | | Bayer U.S. Finance LLC
3 mo. USD LIBOR + 0.630%, 2.97%, 06/25/2021(1)(2) | | | 1,502,107 | |
| | | | | 1,425,000 | | | Cardinal Health, Inc.
1.95%, 06/14/2019 | | | 1,413,154 | |
The accompanying notes are an integral part of these financial statements.
|
| Hartford Ultrashort Bond HLS Fund |
Schedule of Investments – (continued)
June 30, 2018 (Unaudited)
| | | | | | | | | | | | |
| Shares or Principal Amount | | Market Value† | |
| CORPORATE BONDS - 44.5% - (continued) | |
| | | | | | | Pharmaceuticals - 0.7% - (continued) | |
| | $ | | | | 700,000 | | | CVS Health Corp.
3 mo. USD LIBOR + 0.720%, 3.05%, 03/09/2021(2) | | $ | 703,529 | |
| | | | | | | | | | | | |
| | | | | | | | | | | 3,618,790 | |
| | | | | | | | | | | | |
| | | | | | | REITS - 0.4% | |
| | | | | 2,000,000 | | | Boston Properties L.P.
5.88%, 10/15/2019 | | | 2,059,883 | |
| | | | | | | | | | | | |
| | | | | | | Retail - 1.2% | |
| | | | | 2,000,000 | | | Alimentation Couche-Tard, Inc.
2.35%, 12/13/2019(1) | | | 1,975,536 | |
| | | | | 1,500,000 | | | CVS Health Corp.
1.90%, 07/20/2018 | | | 1,499,685 | |
| | | | | 1,100,000 | | | Dollar Tree, Inc.
3 mo. USD LIBOR + 0.700%, 3.06%, 04/17/2020(2) | | | 1,102,249 | |
| | | | | 1,500,000 | | | Home Depot, Inc.
3 mo. USD LIBOR + 0.150%, 2.47%, 06/05/2020(2) | | | 1,503,997 | |
| | | | | | | | | | | | |
| | | | | | | | | | | 6,081,467 | |
| | | | | | | | | | | | |
| | | | | | | Semiconductors - 0.4% | |
| | | | | 2,000,000 | | | QUALCOMM, Inc.
3 mo. USD LIBOR + 0.450%, 2.78%, 05/20/2020(2) | | | 2,019,292 | |
| | | | | | | | | | | | |
| | | | | | | Telecommunications - 0.3% | |
| | | | | 1,510,000 | | | Juniper Networks, Inc.
3.13%, 02/26/2019 | | | 1,512,866 | |
| | | | | | | | | | | | |
| | | |
| | | | | | | | Total Corporate Bonds
(cost $224,010,220) | | $ | 223,791,188 | |
| | | | | | | | | | | | |
| | | |
| | | | | | | | | | | | |
| MUNICIPAL BONDS - 0.3% | |
| | | | | | | General - 0.0% | |
| | $ | | | | 170,000 | | | Fresno County, CA
4.66%, 08/15/2018 | | $ | 170,376 | |
| | | | | | | | | | | | |
| | | | | | | Transportation - 0.3% | |
| | | | | 1,490,000 | | | New York & New Jersey PA
2.29%, 09/15/2019 | | | 1,482,431 | |
| | | | | | | | | | | | |
| | | |
| | | | | | | | Total Municipal Bonds
(cost $1,660,353) | | $ | 1,652,807 | |
| | | | | | | | | | | | |
| | | |
| | | | | | | | | | | | |
| U.S. GOVERNMENT AGENCIES - 4.8% | |
| | | | | | | U.S. Government Agencies - 4.8% | |
| | | | | | | FHLB - 4.4% | |
| | | | | | | | FHLB | |
| | $ | | | | 7,250,000 | | | 1.25%, 01/16/2019 | | $ | 7,212,256 | |
| | | | | 15,000,000 | | | 1.38%, 05/28/2019 | | | 14,867,280 | |
| | | �� | | | | | | | | | |
| | | | | | | | | | | 22,079,536 | |
| | | | | | | | | | | | |
| | | | | | | FHLMC - 0.4% | |
| | | | | 2,000,000 | | | FHLMC
1 mo. USD LIBOR + 0.200%, 2.20%, 10/25/2019(2) | | | 2,000,002 | |
| | | | | | | | | | | | |
| | | | | | | | | | | 2,000,002 | |
| | | | | | | | | | | | |
| | | | | | | | | | | 24,079,538 | |
| | | | | | | | | | | | |
| | | |
| | | | | | | | Total U.S. Government Agencies
(cost $24,223,703) | | $ | 24,079,538 | |
| | | | | | | | | | | | |
| | | | | | | | | | | | |
| Shares or Principal Amount | | Market Value† | |
| U.S. GOVERNMENT SECURITIES - 21.7% | |
| | | | | | | U.S. Treasury Securities - 21.7% | |
| | | | | | | U.S. Treasury Notes - 21.7% | |
| | | | | | | | U.S. Treasury Notes | |
| | $ | | | | 12,500,000 | | | 0.75%, 07/31/2018 | | $ | 12,489,344 | |
| | | | | 27,500,000 | | | 0.88%, 10/15/2018 | | | 27,411,459 | |
| | | | | 7,500,000 | | | 0.88%, 04/15/2019 | | | 7,416,504 | |
| | | | | 11,250,000 | | | 1.00%, 03/15/2019 | | | 11,152,002 | |
| | | | | 15,000,000 | | | 1.13%, 01/31/2019 | | | 14,907,422 | |
| | | | | 10,000,000 | | | 1.25%, 11/15/2018 | | | 9,969,922 | |
| | | | | 15,000,000 | | | 1.25%, 12/31/2018 | | | 14,932,031 | |
| | | | | 5,000,000 | | | 1.50%, 12/31/2018 | | | 4,983,203 | |
| | | | | 6,000,000 | | | 1.50%, 05/31/2019 | | | 5,954,765 | |
| | | | | | | | | | | | |
| | | | | | | | | | | 109,216,652 | |
| | | | | | | | | | | | |
| | | | | | | | | | | 109,216,652 | |
| | | | | | | | | | | | |
| | | |
| | | | | | | | Total U.S. Government Securities
(cost $109,351,686) | | $ | 109,216,652 | |
| | | | | | | | | | | | |
| | | |
| | | | | | | | Total Long-Term Investments
(cost $501,019,594) | | $ | 500,096,539 | |
| | | | | | | | | | | | |
| | | |
| | | | | | | | | | | | |
| SHORT-TERM INVESTMENTS - 0.5% | |
| | | | | | | Commercial Paper - 0.4% | |
| | $ | | | | 2,000,000 | | | Bank of Montreal
3 mo. USD LIBOR + 0.260%, 2.62%, 11/04/2019(2)(6) | | $ | 2,000,778 | |
| | | | | | | | | | | | |
| | | | | | | Other Investment Pools & Funds - 0.1% | |
| | | | | 744,504 | | | Fidelity Institutional Government Fund,
Institutional Class,
1.80%(7) | | | 744,504 | |
| | | | | | | | | | | | |
| | | |
| | | | | | | | Total Short-Term Investments
(cost $2,744,504) | | $ | 2,745,282 | |
| | | | | | | | | | | | |
| | | | | | | | | | | | | | | | |
| | | | |
| | | | | | | | Total Investments
(cost $503,764,098) | | | 99.9 | % | | $ | 502,841,821 | |
| | | | | | | | Other Assets and Liabilities | | | 0.1 | % | | | 512,845 | |
| | | | | | | | | | | | | | | | |
| | | | | | | | Total Net Assets | | | 100.0 | % | | $ | 503,354,666 | |
| | | | | | | | | | | | | | | | |
The accompanying notes are an integral part of these financial statements.
|
| Hartford Ultrashort Bond HLS Fund |
Schedule of Investments – (continued)
June 30, 2018 (Unaudited)
| Note: | Percentage of investments as shown is the ratio of the total market value to total net assets. |
| | The Fund may refer to any one or more of the industry classifications used by one or more widely recognized market indices, ratings group and/or as defined by Fund management. Industry classifications may not be identical across all security types. |
| | For Fund compliance purposes, the Fund may not use the same classification system shown in this report as these classifications are used for financial reporting purposes. |
| (1) | Securities issued within terms of a private placement memorandum and exempt from registration under Rule 144A under the Securities Act of 1933, as amended, and may be sold to qualified institutional buyers. Unless otherwise indicated, these holdings are determined to be liquid. At June 30, 2018, the aggregate value of these securities was $129,688,854, which represented 25.8% of total net assets. |
| (2) | Variable rate securities; the rate reported is the coupon rate in effect at June 30, 2018. |
| (3) | Variable or floating rate security, which interest rate adjusts periodically based on changes in current interest rates and prepayments on the underlying pool of assets. Rate shown is the rate in effect as of period end. |
| (4) | This security is valued in good faith at fair value as determined under policies and procedures established by and under the supervision of the Board of Directors. At June 30, 2018, the aggregate fair value of this security was $362,067, which represented 0.1% of total net assets. This amount excludes securities that are principally traded in certain foreign markets and whose prices are adjusted pursuant to a third party pricing service methodology approved by the Board of Directors. |
| (5) | This security has been identified as illiquid. Illiquid securities are often purchased in private placement transactions, are often not registered under the Securities Act of 1933, as amended, and may have contractual restrictions on resale. A security may also be considered illiquid if the security lacks a readily available market or if its valuation has not changed for a certain period of time. The identification of illiquid securities is unaudited. At June 30, 2018, the aggregate value of this security was $362,067, which represented 0.1% of total net assets. |
| (6) | The rate shown represents current yield to maturity. |
| (7) | Current yield as of period end. |
| † | See Significant Accounting Policies of accompanying Notes to Financial Statements regarding valuation of investments. |
| | |
| GLOSSARY: (abbreviations used in preceding Schedule of Investments) |
|
| Other Abbreviations: |
CMO | | Collateralized Mortgage Obligation |
FHLB | | Federal Home Loan Bank |
FHLMC | | Federal Home Loan Mortgage Corp. |
LIBOR | | London Interbank Offered Rate |
|
| Municipal Abbreviations: |
PA | | Port Authority |
The accompanying notes are an integral part of these financial statements.
|
| Hartford Ultrashort Bond HLS Fund |
Schedule of Investments – (continued)
June 30, 2018 (Unaudited)
Fair Valuation Summary
The following is a summary of the fair valuations according to the inputs used as of June 30, 2018 in valuing the Fund’s investments.
| | | | | | | | | | | | | | | | |
| | | Total | | | Level 1(1) | | | Level 2(1) | | | Level 3(1) | |
Assets | | | | | | | | | | | | | | | | |
Asset & Commercial Mortgage Backed Securities | | $ | 141,356,354 | | | $ | — | | | $ | 140,994,287 | | | $ | 362,067 | |
Corporate Bonds | | | 223,791,188 | | | | — | | | | 223,791,188 | | | | — | |
Municipal Bonds | | | 1,652,807 | | | | — | | | | 1,652,807 | | | | — | |
U.S. Government Agencies | | | 24,079,538 | | | | — | | | | 24,079,538 | | | | — | |
U.S. Government Securities | | | 109,216,652 | | | | — | | | | 109,216,652 | | | | — | |
Short-Term Investments | | | 2,745,282 | | | | 744,504 | | | | 2,000,778 | | | | — | |
| | | | | | | | | | | | | | | | |
Total | | $ | 502,841,821 | | | $ | 744,504 | | | $ | 501,735,250 | | | $ | 362,067 | |
| | | | | | | | | | | | | | | | |
| (1) | For the six-month period ended June 30, 2018, there were no transfers between any levels. |
Level 3 investments at the beginning and/or end of the period in relation to net assets were not significant and accordingly, a reconciliation of Level 3 assets for the six-month period ended June 30, 2018 is not presented.
The accompanying notes are an integral part of these financial statements.
|
| Hartford U.S. Government Securities HLS Fund |
Schedule of Investments
June 30, 2018 (Unaudited)
| | | | | | | | | | | | |
| Shares or Principal Amount | | Market Value† | |
| ASSET & COMMERCIAL MORTGAGE BACKED SECURITIES - 19.1% | |
| | | | | | | Asset-Backed - Automobile - 1.6% | |
| | $ | | | | 350,000 | | | Avis Budget Rental Car Funding AESOP LLC
2.99%, 06/20/2022(1) | | $ | 346,426 | |
| | | | | 2,907,000 | | | Capital Auto Receivables Asset Trust
3.62%, 05/20/2021 | | | 2,922,723 | |
| | | | | 2,522,947 | | | Westlake Automobile Receivables Trust
3.40%, 01/15/2021(1) | | | 2,525,505 | |
| | | | | | | | | | | | |
| | | | | | | | | | | 5,794,654 | |
| | | | | | | | | | | | |
| | | | | | | Asset-Backed - Finance & Insurance - 4.2% | |
| | | | | 2,990,000 | | | Ares CLO Ltd.
3 mo. USD LIBOR + 1.190%, 3.54%, 04/17/2026(1)(2) | | | 2,989,142 | |
| | | | | 1,463,761 | | | Limerock CLO Ltd.
3 mo. USD LIBOR + 1.300%, 3.66%, 04/18/2026(1)(2) | | | 1,463,442 | |
| | | | | 1,721,142 | | | NRZ Excess Spread-Collateralized Notes
3.19%, 01/25/2023(1) | | | 1,709,477 | |
| | | | | 1,285,000 | | | Shackleton CLO Ltd.
3 mo. USD LIBOR + 1.950%, 4.30%, 04/15/2027(1)(2) | | | 1,283,883 | |
| | | | | 2,968,825 | | | Springleaf Funding Trust
3.16%, 11/15/2024(1) | | | 2,967,685 | |
| | | | | 562,969 | | | Structured Asset Securities Corp.
1 mo. USD LIBOR + 1.500%, 3.59%, 02/25/2033(2) | | | 568,872 | |
| | | | | | | | Towd Point Mortgage Trust | |
| | | | | 632,789 | | | 2.75%, 04/25/2057(1)(3) | | | 622,403 | |
| | | | | 2,632,000 | | | 3.75%, 05/25/2058(1)(3) | | | 2,632,957 | |
| | | | | 1,185,000 | | | Tryon Park CLO, Ltd.
3 mo. USD LIBOR + 0.890%, 3.24%, 04/15/2029(1)(2) | | | 1,179,696 | |
| | | | | | | | | | | | |
| | | | | | | | | | | 15,417,557 | |
| | | | | | | | | | | | |
| | | | | | | Asset-Backed - Home Equity - 1.2% | |
| | | | | | | | Morgan Stanley Asset Backed Securities Capital I, Inc. Trust | | | | |
| | | | | 7,640,000 | | | 1.00%, 07/15/2051(4) | | | 480,982 | |
| | | | | 634,801 | | | 1 mo. USD LIBOR + 1.500%, 3.59%, 11/25/2032(2) | | | 631,392 | |
| | | | | 3,606,000 | | | NRZ Advance Receivables Trust
2.58%, 10/15/2049(1) | | | 3,572,307 | |
| | | | | | | | | | | | |
| | | | | | | | | | | 4,684,681 | |
| | | | | | | | | | | | |
| | | | | | | Commercial Mortgage - Backed Securities - 7.1% | |
| | | | | 3,400,000 | | | CSMC Trust
2.76%, 04/05/2033(1) | | | 3,348,935 | |
| | | | | | | | FREMF Mortgage Trust | |
| | | | | 5,845,000 | | | 1 mo. USD LIBOR + 0.320%, 2.40%, 02/25/2020(2) | | | 5,858,463 | |
| | | | | 435,000 | | | 3.48%, 05/25/2045(1)(3) | | | 435,984 | |
| | | | | 955,000 | | | 3.76%, 11/25/2050(1)(3) | | | 932,158 | |
| | | | | 1,225,000 | | | 3.82%, 04/25/2048(1)(3) | | | 1,191,303 | |
| | | | | 1,325,000 | | | 3.85%, 10/25/2049(1)(3) | | | 1,274,678 | |
| | | | | 1,005,000 | | | 3.93%, 02/25/2050(1)(3) | | | 979,656 | |
| | | | | 2,645,000 | | | 3.94%, 06/25/2047(1)(3) | | | 2,663,426 | |
| | | | | 700,000 | | | 3.98%, 08/25/2027(1)(3) | | | 681,939 | |
| | | | | 660,000 | | | 4.08%, 09/25/2049(1)(3) | | | 650,062 | |
| | | | | 4,580,000 | | | 4.11%, 03/25/2028(1)(3) | | | 4,460,507 | |
| | | | | 1,665,000 | | | 4.17%, 11/25/2044(1)(3) | | | 1,665,757 | |
| | | | | 1,990,000 | | | 5.69%, 04/25/2020(1)(3) | | | 2,062,820 | |
| | | | | | | | | | | | |
| | | | | | | | | | | 26,205,688 | |
| | | | | | | | | | | | |
| | | | | | | | | | | | |
| Shares or Principal Amount | | Market Value† | |
ASSET & COMMERCIAL MORTGAGE BACKED SECURITIES - 19.1% -
(continued) | |
| | | | | | | Whole Loan Collateral CMO - 5.0% | |
| | $ | | | | 264,738 | | | Angel Oak Mortgage Trust LLC
2.81%, 01/25/2047(1)(3) | | $ | 263,263 | |
| | | | | 3,377,702 | | | CIM Trust
3.00%, 04/25/2057(1)(3) | | | 3,340,768 | |
| | | | | 551,587 | | | Deephaven Residential Mortgage Trust
2.73%, 12/26/2046(1)(3) | | | 549,253 | |
| | | | | 771,167 | | | LSTAR Securities Investment Ltd.
1 mo. USD LIBOR + 1.750%, 0.04%, 10/01/2022(1)(2) | | | 768,168 | |
| | | | | 516,163 | | | Mill City Mortgage Loan Trust
2.50%, 04/25/2057(1)(3) | | | 506,415 | |
| | | | | | | | New Residential Mortgage Loan Trust | |
| | | | | 1,173,657 | | | 3.25%, 09/25/2056(1)(3) | | | 1,158,862 | |
| | | | | 1,470,795 | | | 3.75%, 03/25/2056(1)(3) | | | 1,473,006 | |
| | | | | 1,003,167 | | | Sequoia Mortgage Trust
1 mo. USD LIBOR + 0.460%, 2.54%, 02/20/2035(2) | | | 995,276 | |
| | | | | 1,572,915 | | | Thornburg Mortgage Securities Trust
3.38%, 04/25/2045(3) | | | 1,582,263 | |
| | | | | | | | Towd Point Mortgage Trust | |
| | | | | 56,829 | | | 2.75%, 04/25/2055(1)(3) | | | 55,907 | |
| | | | | 66,041 | | | 2.75%, 05/25/2055(1)(3) | | | 65,095 | |
| | | | | 1,500,237 | | | 3.00%, 03/25/2054(1)(3) | | | 1,489,462 | |
| | | | | 2,399,000 | | | 3.75%, 04/25/2055(1)(3) | | | 2,409,340 | |
| | | | | | | | WaMu Mortgage Pass-Through Certificates Trust | | | | |
| | | | | 1,395,290 | | | 3.28%, 10/25/2035(3) | | | 1,408,509 | |
| | | | | 1,313,624 | | | 3.45%, 03/25/2033(3) | | | 1,329,563 | |
| | | | | 969,649 | | | Wells Fargo Mortgage Backed Securities Trust
3.62%, 09/25/2033(3) | | | 992,990 | |
| | | | | | | | | | | | |
| | | | | | | | 18,388,140 | |
| | | | | | | | | | | | |
| | | |
| | | | | | | | Total Asset & Commercial Mortgage Backed Securities
(cost $70,769,691) | | $ | 70,490,720 | |
| | | | | | | | | | | | |
| | | |
| | | | | | | | | | | | |
| U.S. GOVERNMENT AGENCIES - 39.5% | |
| | | | | | | Mortgage-Backed Agencies - 39.5% | |
| | | | | | | FHLMC - 15.4% | |
| | $ | | | | 7,027,262 | | | 1.57%, 01/25/2022 | | $ | 6,862,576 | |
| | | | | 2,574,981 | | | 1 mo. USD LIBOR + 0.380%, 2.38%, 04/25/2020(2) | | | 2,579,401 | |
| | | | | 880,183 | | | 2.50%, 12/15/2026(5) | | | 44,459 | |
| | | | | 867,119 | | | 2.50%, 03/15/2028(5) | | | 66,770 | |
| | | | | 614,387 | | | 2.50%, 05/15/2028(5) | | | 46,159 | |
| | | | | 1,080,623 | | | 3.00%, 04/15/2028(5) | | | 93,093 | |
| | | | | 872,165 | | | 3.00%, 05/15/2032(5) | | | 64,139 | |
| | | | | 638,664 | | | 3.00%, 03/15/2033(5) | | | 79,103 | |
| | | | | 4,126,785 | | | 3.00%, 11/01/2036 | | | 4,069,520 | |
| | | | | 146,278 | | | 3.00%, 09/01/2045 | | | 142,791 | |
| | | | | 3,807,897 | | | 3.00%, 05/15/2046 | | | 3,761,208 | |
| | | | | 981,334 | | | 3.00%, 08/15/2047 | | | 973,029 | |
| | | | | 14,800,000 | | | 3.00%, 07/01/2048(4)(6) | | | 14,324,541 | |
| | | | | 5,400,000 | | | 3.19%, 07/25/2027 | | | 5,311,422 | |
| | | | | 6,205,000 | | | 3.50%, 11/15/2025 | | | 6,340,358 | |
| | | | | 1,045,510 | | | 3.50%, 06/15/2026(5) | | | 69,584 | |
| | | | | 364,892 | | | 3.50%, 09/15/2026(5) | | | 33,111 | |
| | | | | 630,836 | | | 3.50%, 03/15/2027(5) | | | 55,312 | |
| | | | | 1,950,138 | | | 3.50%, 01/15/2028(5) | | | 190,392 | |
| | | | | 355,869 | | | 4.00%, 07/15/2027(5) | | | 35,460 | |
The accompanying notes are an integral part of these financial statements.
|
| Hartford U.S. Government Securities HLS Fund |
Schedule of Investments – (continued)
June 30, 2018 (Unaudited)
| | | | | | | | | | | | |
| Shares or Principal Amount | | Market Value† | |
| U.S. GOVERNMENT AGENCIES - 39.5% - (continued) | |
| | | | | | | Mortgage-Backed Agencies - 39.5% - (continued) | |
| | | | | | | FHLMC - 15.4% - (continued) | |
| | $ | | | | 1,041,312 | | | 4.00%, 03/15/2028(5) | | $ | 105,331 | |
| | | | | 554,051 | | | 4.00%, 06/15/2028(5) | | | 58,002 | |
| | | | | 1,329,282 | | | 4.00%, 07/15/2030(5) | | | 142,420 | |
| | | | | 276,840 | | | 4.00%, 06/01/2044 | | | 283,331 | |
| | | | | 600,000 | | | 4.00%, 07/01/2048(4)(6) | | | 611,562 | |
| | | | | 4,820 | | | 4.50%, 12/01/2018 | | | 4,858 | |
| | | | | 2,084,862 | | | 4.50%, 02/15/2027(5) | | | 224,548 | |
| | | | | 2,347,564 | | | 4.50%, 05/15/2034 | | | 2,390,595 | |
| | | | | 808,898 | | | 5.00%, 09/15/2033(5) | | | 156,138 | |
| | | | | 3,501 | | | 5.50%, 06/01/2034 | | | 3,764 | |
| | | | | 33,311 | | | 5.50%, 10/01/2035 | | | 36,128 | |
| | | | | 51,698 | | | 5.50%, 04/01/2037 | | | 55,953 | |
| | | | | 742,276 | | | 5.50%, 12/01/2037 | | | 802,513 | |
| | | | | 250,257 | | | 5.50%, 04/01/2038 | | | 270,106 | |
| | | | | 16,067 | | | 5.50%, 05/01/2038 | | | 17,366 | |
| | | | | 1,301,745 | | | 5.50%, 08/01/2038 | | | 1,408,971 | |
| | | | | 2,614 | | | 5.50%, 12/01/2039 | | | 2,827 | |
| | | | | 29,903 | | | 6.00%, 10/01/2021 | | | 32,666 | |
| | | | | 41,913 | | | 6.00%, 10/01/2022 | | | 45,785 | |
| | | | | 61,880 | | | 6.00%, 01/01/2028 | | | 67,606 | |
| | | | | 17,848 | | | 6.00%, 04/15/2028 | | | 19,204 | |
| | | | | 36,020 | | | 6.00%, 05/15/2028(7) | | | 38,825 | |
| | | | | 44,852 | | | 6.00%, 11/15/2028 | | | 48,199 | |
| | | | | 81,841 | | | 6.00%, 12/15/2028 | | | 88,565 | |
| | | | | 185,654 | | | 6.00%, 01/15/2029 | | | 203,019 | |
| | | | | 40,790 | | | 6.00%, 02/15/2029 | | | 43,912 | |
| | | | | 47,969 | | | 6.00%, 03/15/2029 | | | 52,683 | |
| | | | | 30,252 | | | 6.00%, 05/15/2029 | | | 32,492 | |
| | | | | 7,289 | | | 6.00%, 06/15/2029 | | | 7,885 | |
| | | | | 2,014 | | | 6.00%, 03/15/2031 | | | 2,225 | |
| | | | | 83,910 | | | 6.00%, 04/15/2031 | | | 92,210 | |
| | | | | 34,607 | | | 6.00%, 10/15/2031 | | | 37,722 | |
| | | | | 48,220 | | | 6.00%, 12/01/2031 | | | 53,194 | |
| | | | | 270,270 | | | 6.00%, 12/15/2031(7) | | | 298,442 | |
| | | | | 381,447 | | | 6.00%, 12/15/2031 | | | 420,445 | |
| | | | | 13,628 | | | 6.00%, 05/15/2032 | | | 14,970 | |
| | | | | 850,392 | | | 6.00%, 06/15/2032 | | | 933,773 | |
| | | | | 693,174 | | | 6.00%, 09/15/2032 | | | 755,340 | |
| | | | | 63,914 | | | 6.00%, 10/15/2032 | | | 71,598 | |
| | | | | 494 | | | 6.00%, 11/01/2032 | | | 544 | |
| | | | | 47,132 | | | 6.00%, 11/15/2032 | | | 51,507 | |
| | | | | 14,866 | | | 6.00%, 04/01/2033 | | | 16,246 | |
| | | | | 15,121 | | | 6.00%, 09/01/2034 | | | 16,749 | |
| | | | | 5,619 | | | 6.50%, 04/01/2028 | | | 6,255 | |
| | | | | 265,761 | | | 6.50%, 08/15/2028 | | | 289,413 | |
| | | | | 574,031 | | | 6.50%, 05/15/2032 | | | 631,435 | |
| | | | | 94,397 | | | 6.50%, 08/01/2032 | | | 105,084 | |
| | | | | 222,469 | | | 6.50%, 09/01/2032 | | | 247,655 | |
| | | | | 23,978 | | | 7.00%, 10/01/2026 | | | 24,533 | |
| | | | | 3,587 | | | 7.00%, 03/01/2027 | | | 3,848 | |
| | | | | 1,816 | | | 7.00%, 12/01/2027 | | | 1,818 | |
| | | | | 897 | | | 7.00%, 02/01/2029 | | | 988 | |
| | | | | 558 | | | 7.00%, 05/01/2029 | | | 616 | |
| | | | | 875 | | | 7.00%, 09/01/2029 | | | 909 | |
| | | | | 491 | | | 7.00%, 02/01/2031 | | | 544 | |
| | | | | 76,075 | | | 7.00%, 04/01/2032 | | | 86,154 | |
| | | | | 58,003 | | | 7.00%, 05/01/2032 | | | 59,018 | |
| | | | | 54,841 | | | 7.00%, 06/01/2032 | | | 61,744 | |
| | | | | 75,964 | | | 7.00%, 11/01/2032 | | | 83,473 | |
| | | | | 2,671 | | | 7.50%, 05/01/2024 | | | 2,858 | |
| | | | | | | | | | | | |
| Shares or Principal Amount | | Market Value† | |
| U.S. GOVERNMENT AGENCIES - 39.5% - (continued) | |
| | | | | | | Mortgage-Backed Agencies - 39.5% - (continued) | |
| | | | | | | FHLMC - 15.4% - (continued) | |
| | $ | | | | 460 | | | 7.50%, 06/01/2024 | | $ | 461 | |
| | | | | 1,054 | | | 7.50%, 06/01/2025 | | | 1,120 | |
| | | | | 4,375 | | | 8.00%, 08/01/2024 | | | 4,464 | |
| | | | | 4,557 | | | 8.00%, 09/01/2024 | | | 4,664 | |
| | | | | 83 | | | 8.00%, 10/01/2024 | | | 88 | |
| | | | | | | | | | | | |
| | | | | | | | 56,779,789 | |
| | | | | | | | | | | | |
| | | | | | | FNMA - 20.7% | |
| | | | | 1,660,121 | | | 1.38%, 04/25/2055(3)(5) | | | 79,293 | |
| | | | | 2,090,212 | | | 1.43%, 06/25/2055(3)(5) | | | 98,821 | |
| | | | | 2,810,894 | | | 1.54%, 08/25/2044(3)(5) | | | 113,020 | |
| | | | | 6,400,000 | | | 1.97%, 11/01/2023 | | | 6,065,095 | |
| | | | | 1,343,884 | | | 2.00%, 09/25/2039 | | | 1,255,457 | |
| | | | | 679,473 | | | 2.05%, 11/01/2023 | | | 647,247 | |
| | | | | 3,365,325 | | | 2.22%, 10/01/2022 | | | 3,254,877 | |
| | | | | 2,300,000 | | | 2.23%, 11/01/2023 | | | 2,206,877 | |
| | | | | 1,724,631 | | | 1 mo. USD LIBOR + 0.400%, 2.35%, 10/25/2024(2) | | | 1,727,571 | |
| | | | | 2,412,590 | | | 1 mo. USD LIBOR + 0.490%, 2.44%, 04/25/2024(2) | | | 2,420,983 | |
| | | | | 200,000 | | | 2.45%, 11/01/2022 | | | 195,279 | |
| | | | | 24,488 | | | 2.50%, 01/01/2043 | | | 23,045 | |
| | | | | 271,380 | | | 2.54%, 03/01/2023 | | | 265,822 | |
| | | | | 2,500,000 | | | 2.68%, 05/01/2025 | | | 2,418,585 | |
| | | | | 91,757 | | | 2.74%, 04/01/2022 | | | 90,762 | |
| | | | | 88,221 | | | 2.83%, 06/01/2022 | | | 87,185 | |
| | | | | 1,290,286 | | | 2.88%, 12/01/2027 | | | 1,232,161 | |
| | | | | 245,666 | | | 2.94%, 06/01/2022 | | | 244,574 | |
| | | | | 1,548,599 | | | 3.00%, 02/25/2027(5) | | | 116,971 | |
| | | | | 1,662,546 | | | 3.00%, 07/25/2027(5) | | | 140,631 | |
| | | | | 622,549 | | | 3.00%, 09/25/2027(5) | | | 60,377 | |
| | | | | 68,110 | | | 3.00%, 12/01/2030 | | | 67,743 | |
| | | | | 1,495,368 | | | 3.00%, 06/25/2043 | | | 1,484,828 | |
| | | | | 179,471 | | | 3.02%, 04/01/2022 | | | 179,854 | |
| | | | | 515,000 | | | 3.07%, 06/01/2027 | | | 501,608 | |
| | | | | 7,418,259 | | | 3.11%, 10/01/2021 | | | 7,429,156 | |
| | | | | 576,521 | | | 3.25%, 12/01/2021 | | | 579,950 | |
| | | | | 387,533 | | | 3.26%, 01/01/2022 | | | 389,291 | |
| | | | | 218,499 | | | 3.50%, 11/01/2020 | | | 221,048 | |
| | | | | 3,765,527 | | | 3.50%, 04/25/2027(5) | | | 364,487 | |
| | | | | 669,156 | | | 3.50%, 05/25/2027(5) | | | 68,359 | |
| | | | | 1,099,230 | | | 3.50%, 10/25/2027(5) | | | 106,428 | |
| | | | | 340,113 | | | 3.50%, 08/25/2030(5) | | | 39,001 | |
| | | | | 758,304 | | | 3.50%, 02/25/2031(5) | | | 68,475 | |
| | | | | 642,564 | | | 3.50%, 09/25/2035(5) | | | 100,477 | |
| | | | | 11,520,769 | | | 3.50%, 04/25/2044 | | | 11,507,415 | |
| | | | | 3,743,961 | | | 3.50%, 03/25/2045 | | | 3,778,460 | |
| | | | | 531,707 | | | 3.50%, 10/25/2046(5) | | | 123,640 | |
| | | | | 1,417,000 | | | 3.50%, 07/01/2048(4)(6) | | | 1,410,334 | |
| | | | | 484,945 | | | 3.51%, 11/01/2021 | | | 491,657 | |
| | | | | 1,035,050 | | | 3.59%, 09/01/2030 | | | 1,042,383 | |
| | | | | 1,736,236 | | | 3.65%, 11/01/2021 | | | 1,767,787 | |
| | | | | 83,785 | | | 3.65%, 08/01/2023 | | | 85,338 | |
| | | | | 1,063,011 | | | 3.73%, 07/01/2022 | | | 1,083,154 | |
| | | | | 1,015,160 | | | 3.75%, 09/01/2023 | | | 1,038,814 | |
| | | | | 93,164 | | | 3.81%, 11/01/2023 | | | 95,669 | |
| | | | | 282,109 | | | 3.85%, 01/01/2024 | | | 289,259 | |
| | | | | 374,616 | | | 3.87%, 01/01/2024 | | | 384,446 | |
| | | | | 381,405 | | | 3.89%, 10/01/2023 | | | 391,434 | |
| | | | | 2,700,000 | | | 3.98%, 07/01/2021 | | | 2,764,628 | |
The accompanying notes are an integral part of these financial statements.
|
| Hartford U.S. Government Securities HLS Fund |
Schedule of Investments – (continued)
June 30, 2018 (Unaudited)
| | | | | | | | | | | | |
| Shares or Principal Amount | | Market Value† | |
| U.S. GOVERNMENT AGENCIES - 39.5% - (continued) | |
| | | | | | | Mortgage-Backed Agencies - 39.5% - (continued) | |
| | | | | | | FNMA - 20.7% - (continued) | |
| | $ | | | | 148,160 | | | 3.99%, 07/01/2021 | | $ | 151,749 | |
| | | | | 1,078,106 | | | 4.00%, 05/25/2027(5) | | | 98,283 | |
| | | | | 1,353,275 | | | 4.50%, 10/01/2040 | | | 1,423,734 | |
| | | | | 585,442 | | | 4.50%, 10/01/2041 | | | 615,805 | |
| | | | | 1,753,984 | | | 4.50%, 01/01/2043 | | | 1,845,391 | |
| | | | | 534,947 | | | 4.50%, 09/01/2043 | | | 562,768 | |
| | | | | 1,710,237 | | | 4.50%, 08/01/2044 | | | 1,799,227 | |
| | | | | 652 | | | 5.00%, 08/01/2018 | | | 662 | |
| | | | | 9,394 | | | 5.00%, 10/01/2018 | | | 9,554 | |
| | | | | 120,740 | | | 5.00%, 06/01/2025 | | | 125,605 | |
| | | | | 263,151 | | | 5.24%, 07/01/2019 | | | 267,548 | |
| | | | | 298,807 | | | 5.46%, 05/25/2042(3)(5) | | | 30,864 | |
| | | | | 199,957 | | | 5.50%, 08/01/2019 | | | 201,622 | |
| | | | | 196,657 | | | 6.00%, 10/01/2023 | | | 214,926 | |
| | | | | 26,928 | | | 6.00%, 10/25/2028 | | | 29,441 | |
| | | | | 9,568 | | | 6.00%, 11/25/2028 | | | 10,347 | |
| | | | | 35,978 | | | 6.00%, 04/25/2029 | | | 38,668 | |
| | | | | 594 | | | 6.00%, 05/01/2029 | | | 651 | |
| | | | | 32,127 | | | 6.00%, 05/25/2029 | | | 34,631 | |
| | | | | 24,757 | | | 6.00%, 06/25/2029(7) | | | 27,074 | |
| | | | | 60,620 | | | 6.00%, 07/25/2029 | | | 65,519 | |
| | | | | 300,412 | | | 6.00%, 05/25/2031(7) | | | 324,550 | |
| | | | | 101,247 | | | 6.00%, 09/25/2031 | | | 111,444 | |
| | | | | 24,003 | | | 6.00%, 11/25/2031 | | | 26,244 | |
| | | | | 466,520 | | | 6.00%, 12/25/2031 | | | 504,640 | |
| | | | | 222,530 | | | 6.00%, 01/01/2032 | | | 244,594 | |
| | | | | 237 | | | 6.00%, 04/01/2032 | | | 259 | |
| | | | | 339 | | | 6.00%, 05/01/2032 | | | 374 | |
| | | | | 1,633 | | | 6.00%, 09/25/2032 | | | 1,789 | |
| | | | | 87,533 | | | 6.00%, 11/01/2032 | | | 95,665 | |
| | | | | 41,303 | | | 6.00%, 02/01/2033 | | | 45,504 | |
| | | | | 224,761 | | | 6.00%, 03/01/2033 | | | 247,605 | |
| | | | | 724,863 | | | 6.00%, 05/01/2033 | | | 799,119 | |
| | | | | 7,861 | | | 6.00%, 08/01/2034 | | | 8,594 | |
| | | | | 165,263 | | | 6.00%, 01/01/2035 | | | 181,815 | |
| | | | | 2,258,267 | | | 6.00%, 02/01/2037 | | | 2,484,369 | |
| | | | | 1,764,082 | | | 6.00%, 01/25/2042(5) | | | 340,187 | |
| | | | | 1,201,084 | | | 6.00%, 09/25/2047(5) | | | 280,735 | |
| | | | | 25 | | | 6.50%, 04/01/2024 | | | 27 | |
| | | | | 192 | | | 6.50%, 04/01/2027 | | | 211 | |
| | | | | 14,198 | | | 6.50%, 04/01/2028 | | | 15,651 | |
| | | | | 117 | | | 6.50%, 05/01/2028 | | | 129 | |
| | | | | 7,317 | | | 6.50%, 10/01/2028 | | | 8,066 | |
| | | | | 123,171 | | | 6.50%, 11/01/2028 | | | 135,772 | |
| | | | | 66,861 | | | 6.50%, 12/01/2028 | | | 73,702 | |
| | | | | 335,634 | | | 6.50%, 06/25/2029 | | | 352,885 | |
| | | | | 191,563 | | | 6.50%, 08/01/2029 | | | 211,162 | |
| | | | | 844 | | | 6.50%, 11/01/2030 | | | 930 | |
| | | | | 4,504 | | | 6.50%, 05/01/2031 | | | 5,023 | |
| | | | | 157,699 | | | 6.50%, 10/25/2031 | | | 173,671 | |
| | | | | 1,027,951 | | | 6.50%, 08/01/2032 | | | 1,144,653 | |
| | | | | 52,443 | | | 6.50%, 09/01/2032 | | | 57,808 | |
| | | | | 210 | | | 7.00%, 11/01/2031 | | | 214 | |
| | | | | 320 | | | 7.00%, 12/01/2031 | | | 325 | |
| | | | | 205,138 | | | 7.00%, 02/01/2032 | | | 227,418 | |
| | | | | 4,914 | | | 7.50%, 06/01/2023 | | | 5,196 | |
| | | | | 1,715 | | | 8.00%, 10/01/2029 | | | 1,938 | |
| | | | | 86 | | | 8.00%, 03/01/2030 | | | 87 | |
| | | | | 5,586 | | | 8.00%, 04/01/2030 | | | 6,463 | |
| | | | | 20 | | | 8.00%, 06/01/2030 | | | 20 | |
| | | | | 14,035 | | | 8.00%, 10/01/2030 | | | 16,244 | |
| | | | | | | | | | | | |
| Shares or Principal Amount | | Market Value† | |
| U.S. GOVERNMENT AGENCIES - 39.5% - (continued) | |
| | | | | | | Mortgage-Backed Agencies - 39.5% - (continued) | |
| | | | | | | FNMA - 20.7% - (continued) | |
| | $ | | | | 25,979 | | | 8.00%, 12/01/2030 | | $ | 28,952 | |
| | | | | 90 | | | 9.00%, 08/01/2020 | | | 93 | |
| | | | | 13,775 | | | 9.00%, 09/01/2021 | | | 13,839 | |
| | | | | | | | | | | | |
| | | | | | | | 76,331,791 | |
| | | | | | | | | | | | |
| | | | | | | GNMA - 3.4% | �� |
| | | | | 301,131 | | | 1.75%, 09/20/2043 | | | 284,787 | |
| | | | | 2,192,582 | | | 2.50%, 12/16/2039 | | | 2,134,957 | |
| | | | | 755,499 | | | 3.00%, 09/20/2028(5) | | | 66,041 | |
| | | | | 423,491 | | | 3.00%, 02/16/2043(5) | | | 69,792 | |
| | | | | 318,646 | | | 3.50%, 02/16/2027(5) | | | 28,937 | |
| | | | | 774,795 | | | 3.50%, 03/20/2027(5) | | | 77,183 | |
| | | | | 689,165 | | | 3.50%, 07/20/2040(5) | | | 79,301 | |
| | | | | 1,019,698 | | | 3.50%, 02/20/2041(5) | | | 124,558 | |
| | | | | 1,698,294 | | | 3.50%, 04/20/2042(5) | | | 222,003 | |
| | | | | 2,464,989 | | | 3.50%, 10/20/2042(5) | | | 434,856 | |
| | | | | 193,810 | | | 3.50%, 05/20/2043(5) | | | 33,210 | |
| | | | | 1,528,844 | | | 3.50%, 07/20/2043(5) | | | 236,956 | |
| | | | | 242,175 | | | 4.00%, 12/16/2026(5) | | | 21,634 | |
| | | | | 3,310,640 | | | 4.00%, 05/20/2029(5) | | | 339,875 | |
| | | | | 473,519 | | | 4.00%, 03/20/2043(5) | | | 102,620 | |
| | | | | 231,796 | | | 4.00%, 01/20/2044(5) | | | 52,370 | |
| | | | | 1,596,338 | | | 4.00%, 03/20/2047(5) | | | 308,288 | |
| | | | | 2,450,993 | | | 4.00%, 07/20/2047(5) | | | 455,928 | |
| | | | | 671,026 | | | 4.50%, 04/20/2045(5) | | | 156,785 | |
| | | | | 750,437 | | | 5.00%, 01/20/2034 | | | 803,412 | |
| | | | | 1,964,767 | | | 5.00%, 02/16/2040(5) | | | 463,527 | |
| | | | | 577,899 | | | 5.00%, 05/20/2040(5) | | | 140,382 | |
| | | | | 1,732,138 | | | 5.00%, 03/16/2044(5) | | | 351,817 | |
| | | | | 475,535 | | | 5.00%, 01/16/2047(5) | | | 116,214 | |
| | | | | 948,786 | | | 5.50%, 09/20/2033 | | | 1,025,885 | |
| | | | | 1,484,809 | | | 5.50%, 03/20/2039(5) | | | 334,580 | |
| | | | | 1,483,831 | | | 5.50%, 02/16/2047(5) | | | 332,860 | |
| | | | | 894,818 | | | 5.50%, 02/20/2047(5) | | | 194,922 | |
| | | | | 418,301 | | | 6.00%, 01/15/2033 | | | 462,245 | |
| | | | | 314,341 | | | 6.00%, 02/15/2033 | | | 348,447 | |
| | | | | 1,569,357 | | | 6.00%, 09/20/2040(5) | | | 373,300 | |
| | | | | 1,285,554 | | | 6.00%, 02/20/2046(5) | | | 296,301 | |
| | | | | 34,136 | | | 6.50%, 12/15/2028 | | | 38,006 | |
| | | | | 28,041 | | | 6.50%, 05/15/2029 | | | 31,268 | |
| | | | | 410,469 | | | 6.50%, 05/16/2031 | | | 452,096 | |
| | | | | 28,359 | | | 6.50%, 09/15/2031 | | | 31,273 | |
| | | | | 194,235 | | | 6.50%, 10/15/2031 | | | 214,198 | |
| | | | | 222,907 | | | 6.50%, 11/15/2031 | | | 245,817 | |
| | | | | 236,444 | | | 6.50%, 01/15/2032 | | | 260,745 | |
| | | | | 10,747 | | | 7.00%, 06/20/2030 | | | 11,598 | |
| | | | | 12,620 | | | 7.00%, 05/15/2032 | | | 14,291 | |
| | | | | 44,606 | | | 7.00%, 07/15/2032 | | | 48,606 | |
| | | | | 94,390 | | | 7.00%, 09/15/2032 | | | 98,759 | |
| | | | | 603,522 | | | 7.00%, 10/15/2032 | | | 677,223 | |
| | | | | 971 | | | 7.50%, 04/15/2022 | | | 973 | |
| | | | | 2,983 | | | 7.50%, 01/15/2023 | | | 2,989 | |
| | | | | 600 | | | 7.50%, 05/15/2023 | | | 624 | |
| | | | | 2,946 | | | 7.50%, 06/15/2023 | | | 3,053 | |
| | | | | 1,153 | | | 7.50%, 07/15/2023 | | | 1,156 | |
| | | | | 12,980 | | | 7.50%, 08/15/2023 | | | 13,068 | |
| | | | | 5,601 | | | 7.50%, 09/15/2023 | | | 5,613 | |
| | | | | 8,591 | | | 7.50%, 10/15/2023 | | | 8,805 | |
| | | | | 11,848 | | | 7.50%, 11/15/2023 | | | 12,254 | |
| | | | | 1,770 | | | 7.50%, 12/15/2023 | | | 1,774 | |
| | | | | 7,558 | | | 7.50%, 02/15/2024 | | | 7,723 | |
The accompanying notes are an integral part of these financial statements.
|
| Hartford U.S. Government Securities HLS Fund |
Schedule of Investments – (continued)
June 30, 2018 (Unaudited)
| | | | | | | | | | | | |
| Shares or Principal Amount | | Market Value† | |
| U.S. GOVERNMENT AGENCIES - 39.5% - (continued) | |
| | | | | | | Mortgage-Backed Agencies - 39.5% - (continued) | |
| | | | | | | GNMA - 3.4% - (continued) | |
| | $ | | | | 147 | | | 7.50%, 05/15/2024 | | $ | 155 | |
| | | | | 37,533 | | | 7.50%, 07/15/2027 | | | 40,034 | |
| | | | | 34,384 | | | 7.50%, 04/20/2030 | | | 39,346 | |
| | | | | 18 | | | 8.50%, 09/15/2019 | | | 18 | |
| | | | | 8,139 | | | 8.50%, 09/15/2024 | | | 8,763 | |
| | | | | 976 | | | 8.50%, 06/15/2029 | | | 1,005 | |
| | | | | 54 | | | 8.50%, 09/15/2029 | | | 54 | |
| | | | | 3,595 | | | 8.50%, 10/15/2029 | | | 3,684 | |
| | | | | 2,332 | | | 8.50%, 01/15/2030 | | | 2,576 | |
| | | | | 8,033 | | | 8.50%, 02/15/2030 | | | 8,089 | |
| | | | | 868 | | | 8.50%, 03/15/2030 | | | 910 | |
| | | | | | | | | | | | |
| | | | | | | | 12,760,519 | |
| | | | | | | | | | | | |
| | | | | | | | 145,872,099 | |
| | | | | | | | | | | | |
| | | |
| | | | | | | | Total U.S. Government Agencies
(cost $148,008,835) | | $ | 145,872,099 | |
| | | | | | | | | | | | |
| | | |
| | | | | | | | | | | | |
| U.S. GOVERNMENT SECURITIES - 40.6% | |
| | | | | | | Other Direct Federal Obligations - 19.5% | |
| | | | | | | FHLB - 1.3% | |
| | $ | | | | 4,825,000 | | | 1.88%, 08/01/2019 | | $ | 4,793,763 | |
| | | | | | | | | | | | |
| | | | | | | | 4,793,763 | |
| | | | | | | | | | | | |
| | | | | | | FHLMC - 18.2% | |
| | | | | 68,450,000 | | | 1.38%, 05/01/2020 | | | 67,041,231 | |
| | | | | | | | | | | | �� |
| | | | | | | | 67,041,231 | |
| | | | | | | | | | | | |
| | | | | | | | 71,834,994 | |
| | | | | | | | | | | | |
| | | | | | | U.S. Treasury Securities - 21.1% | |
| | | | | | | U.S. Treasury Notes - 21.1% | |
| | | | | 25,891,499 | | | 0.63%, 01/15/2026(8) | | | 25,750,643 | |
| | | | | 10,299,000 | | | 1.88%, 07/31/2022 | | | 9,970,317 | |
| | | | | 4,303,000 | | | 2.25%, 11/15/2024 | | | 4,163,489 | |
| | | | | 34,550,000 | | | 2.75%, 11/15/2023 | | | 34,536,504 | |
| | | | | 3,525,000 | | | 2.88%, 05/31/2025 | | | 3,538,494 | |
| | | | | | | | | | | | |
| | | | | | | | 77,959,447 | |
| | | | | | | | | | | | |
| | | | | | | | 77,959,447 | |
| | | | | | | | | | | | |
| | | |
| | | | | | | | Total U.S. Government Securities
(cost $152,024,170) | | $ | 149,794,441 | |
| | | | | | | | | | | | |
| | | |
| | | | | | | | Total Long-Term Investments
(cost $370,802,696) | | $ | 366,157,260 | |
| | | | | | | | | | | | |
| | | |
| | | | | | | | | | | | |
| | | | | | | | | | | | |
| Shares or Principal Amount | | Market Value† | |
| SHORT-TERM INVESTMENTS - 4.7% | |
| | | | | | | Other Investment Pools & Funds - 4.7% | |
| | | | | 17,245,611 | | | Fidelity Institutional Government Fund, Institutional Class,
1.80%(9) | | $ | 17,245,611 | |
| | | | | | | | | | | | |
| | | |
| | | | | | | | Total Short-Term Investments
(cost $17,245,611) | | $ | 17,245,611 | |
| | | | | | | | | | | | |
| | | | | | | | | | | | | | | | |
| | | | |
| | | | | | | | Total Investments
(cost $388,048,307) | | | 103.9 | % | | $ | 383,402,871 | |
| | | | | | | | Other Assets and Liabilities | | | (3.9 | )% | | | (14,368,454 | ) |
| | | | | | | | | | | | | | | | |
| | | | | | | | Total Net Assets | | | 100.0 | % | | $ | 369,034,417 | |
| | | | | | | | | | | | | | | | |
The accompanying notes are an integral part of these financial statements.
|
| Hartford U.S. Government Securities HLS Fund |
Schedule of Investments – (continued)
June 30, 2018 (Unaudited)
| Note: | Percentage of investments as shown is the ratio of the total market value to total net assets. |
| | The Fund may refer to any one or more of the industry classifications used by one or more widely recognized market indices, ratings group and/or as defined by Fund management. Industry classifications may not be identical across all security types. |
| | For Fund compliance purposes, the Fund may not use the same classification system shown in this report as these classifications are used for financial reporting purposes. |
| (1) | Securities issued within terms of a private placement memorandum and exempt from registration under Rule 144A under the Securities Act of 1933, as amended, and may be sold to qualified institutional buyers. Unless otherwise indicated, these holdings are determined to be liquid. At June 30, 2018, the aggregate value of these securities was $53,719,687, which represented 14.6% of total net assets. |
| (2) | Variable rate securities; the rate reported is the coupon rate in effect at June 30, 2018. |
| (3) | Variable or floating rate security, which interest rate adjusts periodically based on changes in current interest rates and prepayments on the underlying pool of assets. Rate shown is the rate in effect as of period end. |
| (4) | This security, or a portion of this security, was purchased on a when-issued, delayed-delivery or delayed-draw basis. The cost of these securities was $16,726,544 at June 30, 2018. |
| (5) | Securities disclosed are interest-only strips. |
| (6) | Represents or includes a TBA transaction. |
| (7) | These securities pay no principal or interest during their initial accrual period, but accrue additional principal at a specified coupon rate. |
| (8) | The principal amount for this security is adjusted for inflation and the interest payments equal a fixed percentage of the inflation-adjusted principal amount. |
| (9) | Current yield as of period end. |
| | | | | | | | | | | | | | | | |
| Futures Contracts Outstanding at June 30, 2018 | |
Description | | Number of
Contracts | | | Expiration
Date | | | Current
Notional
Amount | | | Value and
Unrealized
Appreciation/
(Depreciation) | |
Long position contracts: | | | | | | | | | | | | | | | | |
U.S. Treasury 5-Year Note Future | | | 434 | | | | 09/28/2018 | | | $ | 49,309,860 | | | $ | 127,141 | |
U.S. Treasury 10-Year Ultra Bond Future | | | 192 | | | | 09/19/2018 | | | | 24,621,000 | | | | 306,695 | |
U.S. Treasury Long Bond Future | | | 5 | | | | 09/19/2018 | | | | 725,000 | | | | 5,303 | |
U.S. Treasury Ultra Bond Future | | | 30 | | | | 09/19/2018 | | | | 4,786,875 | | | | 121,820 | |
| | | | | | | | | | | | | | | | |
Total | | | $ | 560,959 | |
| | | | | | | | | | | | | | | | |
Short position contracts: | | | | | | | | | | | | | | | | |
U.S. Treasury 2-Year Note Future | | | 63 | | | | 09/28/2018 | | | $ | 13,345,172 | | | $ | (7,989 | ) |
U.S. Treasury 10-Year Note Future | | | 113 | | | | 09/19/2018 | | | | 13,581,188 | | | | (29,243 | ) |
| | | | | | | | | | | | | | | | |
Total | | | $ | (37,232 | ) |
| | | | | | | | | | | | | | | | |
Total futures contracts | | | $ | 523,727 | |
| | | | | | | | | | | | | | | | |
| | | | | | | | | | | | | | | | | | | | | | | | | | | | | | | | | | |
| Centrally Cleared Interest Rate Swap Contracts Outstanding at June 30, 2018 | |
Payments made
by Fund | | Payments received
by Fund | | Notional
Amount | | | Expiration
Date | | | Periodic
Payment
Frequency | | | Upfront
Premiums
Paid | | | Upfront
Premiums
Received | | | Value† | | | Unrealized
Appreciation/
(Depreciation) | |
12 Mo. Federal Funds Rate | | 2.50% Fixed | | | USD | | | | 12,500,000 | | | | 03/01/28 | | | | Annual | | | $ | 40,115 | | | $ | — | | | $ | 8,452 | | | $ | (31,663 | ) |
2.95% Fixed | | 3 Mo. USD LIBOR | | | USD | | | | 6,201,000 | | | | 06/18/23 | | | | Semi-Annual | | | | — | | | | — | | | | (27,434 | ) | | | (27,434 | ) |
3 Mo. USD LIBOR | | 3.00% Fixed | | | USD | | | | 10,975,000 | | | | 04/30/25 | | | | Semi-Annual | | | | — | | | | (88 | ) | | | (51,725 | ) | | | (51,637 | ) |
3 Mo. USD LIBOR | | 2.25% Fixed | | | USD | | | | 7,750,000 | | | | 03/21/28 | | | | Quarterly | | | | 86,866 | | | | — | | | | 490,207 | | | | 403,341 | |
| | | | | | | | | | | | | | | | | | | | | | | | | | | | | | | | | | |
Total | | | | | | | | | | | $ | 126,981 | | | $ | (88 | ) | | $ | 419,500 | | | $ | 292,607 | |
| | | | | | | | | | | | | | | | | | | | | | | | | | | | | | | | | | |
| † | See Significant Accounting Policies of accompanying Notes to Financial Statements regarding valuation of investments. |
The accompanying notes are an integral part of these financial statements.
|
| Hartford U.S. Government Securities HLS Fund |
Schedule of Investments – (continued)
June 30, 2018 (Unaudited)
| | |
| GLOSSARY: (abbreviations used in preceding Schedule of Investments) |
|
| Counterparty Abbreviations: |
GSC | | Goldman Sachs & Co. |
|
| Other Abbreviations: |
CLO | | Collateralized Loan Obligation |
CMO | | Collateralized Mortgage Obligation |
FHLB | | Federal Home Loan Bank |
FHLMC | | Federal Home Loan Mortgage Corp. |
FNMA | | Federal National Mortgage Association |
GNMA | | Government National Mortgage Association |
LIBOR | | London Interbank Offered Rate |
TBA | | To Be Announced |
The accompanying notes are an integral part of these financial statements.
|
| Hartford U.S. Government Securities HLS Fund |
Schedule of Investments – (continued)
June 30, 2018 (Unaudited)
Fair Valuation Summary
The following is a summary of the fair valuations according to the inputs used as of June 30, 2018 in valuing the Fund’s investments.
| | | | | | | | | | | | | | | | |
| | | Total | | | Level 1(1) | | | Level 2(1) | | | Level 3(1) | |
Assets | | | | | | | | | | | | | | | | |
Asset & Commercial Mortgage Backed Securities | | $ | 70,490,720 | | | $ | — | | | $ | 70,490,720 | | | $ | — | |
U.S. Government Agencies | | | 145,872,099 | | | | — | | | | 145,872,099 | | | | — | |
U.S. Government Securities | | | 149,794,441 | | | | — | | | | 149,794,441 | | | | — | |
Short-Term Investments | | | 17,245,611 | | | | 17,245,611 | | | | — | | | | — | |
Futures Contracts(2) | | | 560,959 | | | | 560,959 | | | | — | | | | — | |
Swaps - Interest Rate(2) | | | 403,341 | | | | — | | | | 403,341 | | | | — | |
| | | | | | | | | | | | | | | | |
Total | | $ | 384,367,171 | | | $ | 17,806,570 | | | $ | 366,560,601 | | | $ | — | |
| | | | | | | | | | | | | | | | |
Liabilities | | | | | | | | | | | | | | | | |
Futures Contracts(2) | | $ | (37,232 | ) | | $ | (37,232 | ) | | $ | — | | | $ | — | |
Swaps - Interest Rate(2) | | | (110,734 | ) | | | — | | | | (110,734 | ) | | | — | |
| | | | | | | | | | | | | | | | |
Total | | $ | (147,966 | ) | | $ | (37,232 | ) | | $ | (110,734 | ) | | $ | — | |
| | | | | | | | | | | | | | | | |
| (1) | For the six-month period ended June 30, 2018, there were no transfers between any levels. |
| (2) | Derivative instruments (excluding purchased and written options, if applicable) are valued at the unrealized appreciation/(depreciation) on the investments. |
The accompanying notes are an integral part of these financial statements.
Schedule of Investments
June 30, 2018 (Unaudited)
| | | | | | | | |
| Shares or Principal Amount | | Market Value† | |
| COMMON STOCKS - 98.5% | |
| | | | Banks - 16.0% | |
| | 440,480 | | | Bank of America Corp. | | $ | 12,417,131 | |
| | 186,965 | | | Citigroup, Inc. | | | 12,511,698 | |
| | 213,702 | | | JP Morgan Chase & Co. | | | 22,267,748 | |
| | 39,870 | | | M&T Bank Corp. | | | 6,783,881 | |
| | 84,400 | | | PNC Financial Services Group, Inc. | | | 11,402,440 | |
| | 216,675 | | | Wells Fargo & Co. | | | 12,012,462 | |
| | | | | | | | |
| | | | | | | 77,395,360 | |
| | | | | | | | |
| | | | Capital Goods - 6.7% | |
| | 41,210 | | | Caterpillar, Inc. | | | 5,590,961 | |
| | 99,735 | | | Eaton Corp. plc | | | 7,454,194 | |
| | 96,060 | | | Fortune Brands Home & Security, Inc. | | | 5,157,461 | |
| | 80,535 | | | Ingersoll-Rand plc | | | 7,226,406 | |
| | 58,000 | | | United Technologies Corp. | | | 7,251,740 | |
| | | | | | | | |
| | | | | | | 32,680,762 | |
| | | | | | | | |
| | | | Consumer Durables & Apparel - 1.5% | |
| | 119,120 | | | Newell Brands, Inc. | | | 3,072,105 | |
| | 146,195 | | | PulteGroup, Inc. | | | 4,203,106 | |
| | | | | | | | |
| | | | | | | 7,275,211 | |
| | | | | | | | |
| | | | Consumer Services - 1.9% | |
| | 73,273 | | | Hilton Worldwide Holdings, Inc. | | | 5,800,291 | |
| | 75,150 | | | Norwegian Cruise Line Holdings Ltd.* | | | 3,550,837 | |
| | | | | | | | |
| | | | | | | 9,351,128 | |
| | | | | | | | |
| | | | Diversified Financials - 4.2% | |
| | 10,625 | | | BlackRock, Inc. | | | 5,302,300 | |
| | 24,270 | | | Goldman Sachs Group, Inc. | | | 5,353,234 | |
| | 193,950 | | | Invesco Ltd. | | | 5,151,312 | |
| | 49,170 | | | Nasdaq, Inc. | | | 4,487,746 | |
| | | | | | | | |
| | | | | | | 20,294,592 | |
| | | | | | | | |
| | | | Energy - 12.4% | |
| | 190,790 | | | Canadian Natural Resources Ltd. | | | 6,881,796 | |
| | 118,535 | | | Chevron Corp. | | | 14,986,380 | |
| | 75,740 | | | EOG Resources, Inc. | | | 9,424,328 | |
| | 76,055 | | | Exxon Mobil Corp. | | | 6,292,030 | |
| | 134,755 | | | Halliburton Co. | | | 6,072,060 | |
| | 324,529 | | | Marathon Oil Corp. | | | 6,769,675 | |
| | 54,030 | | | Occidental Petroleum Corp. | | | 4,521,231 | |
| | 26,180 | | | Pioneer Natural Resources Co. | | | 4,954,303 | |
| | | | | | | | |
| | | | | | | 59,901,803 | |
| | | | | | | | |
| | | | Food & Staples Retailing - 1.2% | |
| | 150,690 | | | US Foods Holding Corp.* | | | 5,699,096 | |
| | | | | | | | |
| | | | Food, Beverage & Tobacco - 3.8% | |
| | 71,486 | | | British American Tobacco plc | | | 3,600,991 | |
| | 41,083 | | | Kraft Heinz Co. | | | 2,580,834 | |
| | 127,940 | | | Mondelez International, Inc. Class A | | | 5,245,540 | |
| | 84,590 | | | Philip Morris International, Inc. | | | 6,829,796 | |
| | | | | | | | |
| | | | | | | 18,257,161 | |
| | | | | | | | |
| | | | Health Care Equipment & Services - 5.3% | |
| | 127,032 | | | Koninklijke Philips N.V. | | | 5,382,084 | |
| | 90,716 | | | Medtronic plc | | | 7,766,197 | |
| | 30,835 | | | UnitedHealth Group, Inc. | | | 7,565,059 | |
| | 45,320 | | | Zimmer Biomet Holdings, Inc. | | | 5,050,461 | |
| | | | | | | | |
| | | | | | | 25,763,801 | |
| | | | | | | | |
| | | | Household & Personal Products - 0.9% | |
| | 75,150 | | | Unilever N.V. | | | 4,187,358 | |
| | | | | | | | |
| | | | | | | | |
| Shares or Principal Amount | | Market Value† | |
| COMMON STOCKS - 98.5% - (continued) | |
| | | | Insurance - 5.4% | |
| | 89,045 | | | American International Group, Inc. | | $ | 4,721,166 | |
| | 52,100 | | | Chubb Ltd. | | | 6,617,742 | |
| | 71,220 | | | Marsh & McLennan Cos., Inc. | | | 5,837,903 | |
| | 101,400 | | | MetLife, Inc. | | | 4,421,040 | |
| | 41,575 | | | Principal Financial Group, Inc. | | | 2,201,396 | |
| | 66,215 | | | Unum Group | | | 2,449,293 | |
| | | | | | | | |
| | | | | | | 26,248,540 | |
| | | | | | | | |
| | | | Materials - 3.5% | |
| | 112,470 | | | DowDuPont, Inc. | | | 7,414,022 | |
| | 39,860 | | | FMC Corp. | | | 3,555,911 | |
| | 116,735 | | | International Paper Co. | | | 6,079,559 | |
| | | | | | | | |
| | | | | | | 17,049,492 | |
| | | | | | | | |
| | | | Media - 3.3% | |
| | 68,000 | | | CBS Corp. Class B | | | 3,822,960 | |
| | 276,170 | | | Comcast Corp. Class A | | | 9,061,138 | |
| | 100,440 | | | Viacom, Inc. Class B | | | 3,029,270 | |
| | | | | | | | |
| | | | | | | 15,913,368 | |
| | | | | | | | |
| | | | Pharmaceuticals, Biotechnology & Life Sciences - 7.9% | |
| | 32,860 | | | Allergan plc | | | 5,478,419 | |
| | 146,480 | | | AstraZeneca plc ADR | | | 5,142,913 | |
| | 107,830 | | | Bristol-Myers Squibb Co. | | | 5,967,312 | |
| | 69,070 | | | Eli Lilly & Co. | | | 5,893,743 | |
| | 156,410 | | | Merck & Co., Inc. | | | 9,494,087 | |
| | 27,618 | | | Roche Holding AG | | | 6,127,274 | |
| | | | | | | | |
| | | | | | | 38,103,748 | |
| | | | | | | | |
| | | | Real Estate - 1.8% | |
| | 168,850 | | | Brixmor Property Group, Inc. REIT | | | 2,943,055 | |
| | 181,190 | | | Park Hotels & Resorts, Inc. REIT | | | 5,549,850 | |
| | | | | | | | |
| | | | | | | 8,492,905 | |
| | | | | | | | |
| | | | Retailing - 3.8% | |
| | 28,130 | | | Home Depot, Inc. | | | 5,488,163 | |
| | 78,340 | | | L Brands, Inc. | | | 2,889,179 | |
| | 239,020 | | | Qurate Retail, Inc.* | | | 5,072,005 | |
| | 50,040 | | | TJX Cos., Inc. | | | 4,762,807 | |
| | | | | | | | |
| | | | | | | 18,212,154 | |
| | | | | | | | |
| | | | Semiconductors & Semiconductor Equipment - 5.4% | |
| | 45,590 | | | Analog Devices, Inc. | | | 4,372,993 | |
| | 216,960 | | | Intel Corp. | | | 10,785,081 | |
| | 86,585 | | | Maxim Integrated Products, Inc. | | | 5,079,076 | |
| | 109,080 | | | QUALCOMM, Inc. | | | 6,121,570 | |
| | | | | | | | |
| | | | | | | 26,358,720 | |
| | | | | | | | |
| | | | Software & Services - 1.9% | |
| | 54,640 | | | Cognizant Technology Solutions Corp. Class A | | | 4,316,013 | |
| | 49,085 | | | Microsoft Corp. | | | 4,840,272 | |
| | | | | | | | |
| | | | | | | 9,156,285 | |
| | | | | | | | |
| | | | Technology Hardware & Equipment - 5.1% | |
| | 289,520 | | | Cisco Systems, Inc. | | | 12,458,046 | |
| | 94,370 | | | NetApp, Inc. | | | 7,410,876 | |
| | 807,760 | | | Nokia Oyj ADR(1) | | | 4,644,620 | |
| | | | | | | | |
| | | | | | | 24,513,542 | |
| | | | | | | | |
| | | | Telecommunication Services - 1.6% | |
| | 153,520 | | | Verizon Communications, Inc. | | | 7,723,591 | |
| | | | | | | | |
| | | | Transportation - 1.5% | |
| | 52,860 | | | Union Pacific Corp. | | | 7,489,205 | |
| | | | | | | | |
The accompanying notes are an integral part of these financial statements.
Schedule of Investments – (continued)
June 30, 2018 (Unaudited)
| | | | | | | | |
| Shares or Principal Amount | | Market Value† | |
| COMMON STOCKS - 98.5% - (continued) | |
| | | | Utilities - 3.4% | |
| | 37,940 | | | Dominion Energy, Inc. | | $ | 2,586,749 | |
| | 72,030 | | | Edison International | | | 4,557,338 | |
| | 98,455 | | | Eversource Energy | | | 5,770,448 | |
| | 21,635 | | | NextEra Energy, Inc. | | | 3,613,694 | |
| | | | | | | | |
| | | | | | | 16,528,229 | |
| | | | | | | | |
| | |
| | | | Total Common Stocks
(cost $358,703,823) | | $ | 476,596,051 | |
| | | | | | | | |
| | |
| | | | Total Long-Term Investments
(cost $358,703,823) | | $ | 476,596,051 | |
| | | | | | | | |
|
| SHORT-TERM INVESTMENTS - 1.9% | |
| | | | Other Investment Pools & Funds - 1.4% | | | |
| | 7,018,285 | | | BlackRock Liquidity Funds TempFund Portfolio,
Institutional Class,
1.84%(2) | | $ | 7,018,285 | |
| | | | | | | | |
| | | | Securities Lending Collateral - 0.5% | | | |
| | 116,401 | | | Citibank NA DDCA,
1.91%, 7/2/2018(2) | | | 116,401 | |
| | 786,279 | | | Goldman Sachs Financial Square Funds,
Government Institutional Fund,
1.81%(2) | | | 786,279 | |
| | 730,614 | | | Invesco Government & Agency Portfolio,
1.81%(2) | | | 730,614 | |
| | 215,551 | | | Morgan Stanley Institutional Liquidity Funds, Government Portfolio, Institutional Class,
1.84%(2) | | | 215,550 | |
| | 479,171 | | | Western Asset Institutional Government
Class A Fund,
1.79%(2) | | | 479,171 | |
| | | | | | | | |
| | | | | | | 2,328,015 | |
| | | | | | | | |
| | |
| | | | Total Short-Term Investments
(cost $9,346,300) | | $ | 9,346,300 | |
| | | | | | | | |
| | | | | | | | | | | | |
| | | |
| | | | Total Investments
(cost $368,050,123) | | | 100.4 | % | | $ | 485,942,351 | |
| | | | Other Assets and Liabilities | | | (0.4 | )% | | | (1,968,416 | ) |
| | | | | | | | | | | | |
| | | | Total Net Assets | | | 100.0 | % | | $ | 483,973,935 | |
| | | | | | | | | | | | |
The accompanying notes are an integral part of these financial statements.
Schedule of Investments – (continued)
June 30, 2018 (Unaudited)
| Note: | Percentage of investments as shown is the ratio of the total market value to total net assets. |
| | Prices of foreign equities that are principally traded on certain foreign markets will generally be adjusted daily pursuant to a fair value pricing service approved by the Board of Directors in order to reflect an adjustment for factors occurring after the close of certain foreign markets but before the close of the New York Stock Exchange. |
| | Equity industry classifications used in this report are the Global Industry Classification Standard, which was developed by and is the exclusive property and service mark of MSCI, Inc. and Standard & Poor’s. |
| | For Fund compliance purposes, the Fund may not use the same classification system shown in this report as these classifications are used for financial reporting purposes. |
| (1) | Represents entire or partial securities on loan. See Note 8 in the accompanying Notes to Financial Statements for securities lending information. |
| (2) | Current yield as of period end. |
| † | See Significant Accounting Policies of accompanying Notes to Financial Statements regarding valuation of investments. |
| | |
| GLOSSARY: (abbreviations used in preceding Schedule of Investments) |
|
| Other Abbreviations: |
ADR | | American Depositary Receipt |
DDCA | | Dollars on Deposit in Custody Account |
REIT | | Real Estate Investment Trust |
The accompanying notes are an integral part of these financial statements.
Schedule of Investments – (continued)
June 30, 2018 (Unaudited)
Fair Valuation Summary
The following is a summary of the fair valuations according to the inputs used as of June 30, 2018 in valuing the Fund’s investments.
| | | | | | | | | | | | | | | | |
| | | Total | | | Level 1(1) | | | Level 2(1) | | | Level 3(1) | |
Assets | | | | | | | | | | | | | | | | |
Common Stocks | | | | | | | | | | | | | | | | |
Banks | | $ | 77,395,360 | | | $ | 77,395,360 | | | $ | — | | | $ | — | |
Capital Goods | | | 32,680,762 | | | | 32,680,762 | | | | — | | | | — | |
Consumer Durables & Apparel | | | 7,275,211 | | | | 7,275,211 | | | | — | | | | — | |
Consumer Services | | | 9,351,128 | | | | 9,351,128 | | | | — | | | | — | |
Diversified Financials | | | 20,294,592 | | | | 20,294,592 | | | | — | | | | — | |
Energy | | | 59,901,803 | | | | 59,901,803 | | | | — | | | | — | |
Food & Staples Retailing | | | 5,699,096 | | | | 5,699,096 | | | | — | | | | — | |
Food, Beverage & Tobacco | | | 18,257,161 | | | | 14,656,170 | | | | 3,600,991 | | | | — | |
Health Care Equipment & Services | | | 25,763,801 | | | | 20,381,717 | | | | 5,382,084 | | | | — | |
Household & Personal Products | | | 4,187,358 | | | | 4,187,358 | | | | — | | | | — | |
Insurance | | | 26,248,540 | | | | 26,248,540 | | | | — | | | | — | |
Materials | | | 17,049,492 | | | | 17,049,492 | | | | — | | | | — | |
Media | | | 15,913,368 | | | | 15,913,368 | | | | — | | | | — | |
Pharmaceuticals, Biotechnology & Life Sciences | | | 38,103,748 | | | | 31,976,474 | | | | 6,127,274 | | | | — | |
Real Estate | | | 8,492,905 | | | | 8,492,905 | | | | — | | | | — | |
Retailing | | | 18,212,154 | | | | 18,212,154 | | | | — | | | | — | |
Semiconductors & Semiconductor Equipment | | | 26,358,720 | | | | 26,358,720 | | | | — | | | | — | |
Software & Services | | | 9,156,285 | | | | 9,156,285 | | | | — | | | | — | |
Technology Hardware & Equipment | | | 24,513,542 | | | | 24,513,542 | | | | — | | | | — | |
Telecommunication Services | | | 7,723,591 | | | | 7,723,591 | | | | — | | | | — | |
Transportation | | | 7,489,205 | | | | 7,489,205 | | | | — | | | | — | |
Utilities | | | 16,528,229 | | | | 16,528,229 | | | | — | | | | — | |
Short-Term Investments | | | 9,346,300 | | | | 9,346,300 | | | | — | | | | — | |
| | | | | | | | | | | | | | | | |
Total | | $ | 485,942,351 | | | $ | 470,832,002 | | | $ | 15,110,349 | | | $ | — | |
| | | | | | | | | | | | | | | | |
| (1) | For the six-month period ended June 30, 2018, there were no transfers between any levels. |
The accompanying notes are an integral part of these financial statements.
[This page is intentionally left blank]
Statements of Assets and Liabilities
June 30, 2018 (Unaudited)
| | | | | | | | | | | | |
| | |
Hartford
Balanced HLS
Fund | | | Hartford
Capital Appreciation
HLS Fund | | | Hartford
Disciplined Equity
HLS Fund | |
Assets: | | | | | | | | | | | | |
Investments in securities, at market value(1) | | $ | 2,208,470,333 | | | $ | 4,795,858,164 | | | $ | 661,859,196 | |
Foreign currency | | | — | | | | 494,251 | | | | — | |
Unrealized appreciation on foreign currency contracts | | | — | | | | 92,380 | | | | — | |
Receivables: | | | | | | | | | | | | |
Investment securities sold | | | — | | | | 32,259,877 | | | | 985,646 | |
Fund shares sold | | | 35,107 | | | | 275,962 | | | | 2,631 | |
Dividends and interest | | | 7,311,270 | | | | 5,394,675 | | | | 459,786 | |
Securities lending income | | | 45,404 | | | | 43,380 | | | | — | |
Tax reclaims | | | 815,183 | | | | 1,216,497 | | | | — | |
Variation margin on futures contracts | | | — | | | | 2,606,382 | | | | — | |
Other assets | | | 4,301 | | | | 616 | | | | 10,471 | |
| | | | | | | | | | | | |
Total assets | | | 2,216,681,598 | | | | 4,838,242,184 | | | | 663,317,730 | |
| | | | | | | | | | | | |
Liabilities: | | | | | | | | | | | | |
Unrealized depreciation on foreign currency contracts | | | — | | | | — | | | | — | |
Bank overdraft | | | 1,165 | | | | — | | | | — | |
Obligation to return securities lending collateral | | | 2,943,973 | | | | 18,971,506 | | | | — | |
Cash collateral due to broker on futures contracts | | | — | | | | — | | | | 39 | |
Payables: | | | | | | | | | | | | |
Investment securities purchased | | | 241,662 | | | | 37,961,143 | | | | — | |
Fund shares redeemed | | | 1,036,892 | | | | 2,603,351 | | | | 216,263 | |
Investment management fees | | | 1,093,477 | | | | 2,568,175 | | | | 405,418 | |
Transfer agent fees | | | 1,265 | | | | 1,896 | | | | 1,238 | |
Accounting services fees | | | 33,233 | | | | 67,642 | | | | 7,769 | |
Board of Directors’ fees | | | 14,611 | | | | 32,208 | | | | 4,232 | |
Variation margin on futures contracts | | | 8,004 | | | | — | | | | — | |
Distribution fees | | | 8,901 | | | | 18,849 | | | | 2,748 | |
Accrued expenses | | | 235,134 | | | | 551,396 | | | | 147,175 | |
| | | | | | | | | | | | |
Total liabilities | | | 5,618,317 | | | | 62,776,166 | | | | 784,882 | |
| | | | | | | | | | | | |
Net assets | | $ | 2,211,063,281 | | | $ | 4,775,466,018 | | | $ | 662,532,848 | |
| | | | | | | | | | | | |
Summary of Net Assets: | | | | | | | | | | | | |
Capital stock and paid-in-capital | | $ | 1,603,590,486 | | | $ | 3,593,149,036 | | | $ | 391,757,953 | |
Undistributed (distributions in excess of) net investment income | | | 23,543,663 | | | | 28,088,762 | | | | 2,666,626 | |
Accumulated net realized gain (loss) | | | 189,183,113 | | | | 757,883,264 | | | | 100,832,830 | |
Unrealized appreciation (depreciation) of investments and the translation of assets and liabilities denominated in foreign currency | | | 394,746,019 | | | | 396,344,956 | | | | 167,275,439 | |
| | | | | | | | | | | | |
Net assets | | $ | 2,211,063,281 | | | $ | 4,775,466,018 | | | $ | 662,532,848 | |
| | | | | | | | | | | | |
Shares authorized | | | 9,700,000,000 | | | | 5,450,000,000 | | | | 3,500,000,000 | |
| | | | | | | | | | | | |
Par value | | $ | 0.0010 | | | $ | 0.0010 | | | $ | 0.0010 | |
| | | | | | | | | | | | |
Class IA: Net asset value per share | | $ | 31.09 | | | $ | 49.73 | | | $ | 16.00 | |
| | | | | | | | | | | | |
Shares outstanding | | | 62,742,969 | | | | 84,969,193 | | | | 36,387,739 | |
| | | | | | | | | | | | |
Net Assets | | $ | 1,950,595,189 | | | $ | 4,225,369,186 | | | $ | 582,370,215 | |
| | | | | | | | | | | | |
Class IB: Net asset value per share | | $ | 31.51 | | | $ | 48.97 | | | $ | 15.82 | |
| | | | | | | | | | | | |
Shares outstanding | | | 8,266,978 | | | | 10,611,491 | | | | 5,067,666 | |
| | | | | | | | | | | | |
Net Assets | | $ | 260,468,092 | | | $ | 519,647,347 | | | $ | 80,162,633 | |
| | | | | | | | | | | | |
Class IC: Net asset value per share | | $ | — | | | $ | 49.20 | | | $ | — | |
| | | | | | | | | | | | |
Shares outstanding | | | — | | | | 618,874 | | | | — | |
| | | | | | | | | | | | |
Net Assets | | $ | — | | | $ | 30,449,485 | | | $ | — | |
| | | | | | | | | | | | |
Cost of investments | | $ | 1,813,850,293 | | | $ | 4,398,917,151 | | | $ | 494,583,757 | |
Cost of foreign currency | | $ | — | | | $ | 491,990 | | | $ | — | |
(1) Includes Investment in securities on loan, at value | | $ | 2,891,187 | | | $ | 18,582,748 | | | $ | — | |
The accompanying notes are an integral part of these financial statements.
Statements of Assets and Liabilities – (continued)
June 30, 2018 (Unaudited)
| | | | | | | | | | | | | | | | | | | | | | | | | | |
Hartford
Dividend and
Growth HLS
Fund | | | Hartford
Global Growth
HLS Fund | | | Hartford
Growth Opportunities
HLS Fund | | | Hartford
Healthcare HLS
Fund | | | Hartford
High Yield
HLS Fund | | | Hartford
International
Opportunities
HLS Fund | | | Hartford
MidCap HLS
Fund | |
| | | | | | | | | | | | | | | | | | | | | | | | | | |
| $ | 3,338,440,147 | | | $ | 540,614,948 | | | $ | 1,678,684,631 | | | $ | 342,135,931 | | | $ | 274,325,339 | | | $ | 1,445,561,203 | | | $ | 2,311,073,218 | |
| | — | | | | 163,056 | | | | — | | | | 12,225 | | | | — | | | | 4,152,243 | | | | — | |
| | — | | | | — | | | | — | | | | — | | | | 183 | | | | — | | | | — | |
| | | | | | | | | | | | | | | | | | | | | | | | | | |
| | 18,945,430 | | | | 291,033 | | | | 28,019 | | | | — | | | | 2,949,408 | | | | 5,721,954 | | | | 1,688,452 | |
| | 48,729 | | | | 41,664 | | | | 205,069 | | | | 192,216 | | | | 6,372 | | | | 789,483 | | | | 3,059,124 | |
| | 3,790,494 | | | | 408,727 | | | | 579,355 | | | | 112,590 | | | | 4,213,205 | | | | 2,852,062 | | | | 1,078,965 | |
| | 2,108 | | | | 833 | | | | 45,126 | | | | 16,417 | | | | — | | | | 27,186 | | | | 9,083 | |
| | 624,887 | | | | 593,216 | | | | 164,571 | | | | 24,937 | | | | — | | | | 3,423,332 | | | | — | |
| | — | | | | — | | | | — | | | | — | | | | — | | | | — | | | | — | |
| | 4,973 | | | | 10,917 | | | | 14,797 | | | | 9,999 | | | | 11,827 | | | | 9,902 | | | | 10,930 | |
| | | | | | | | | | | | | | | | | | | | | | | | | | |
| | 3,361,856,768 | | | | 542,124,394 | | | | 1,679,721,568 | | | | 342,504,315 | | | | 281,506,334 | | | | 1,462,537,365 | | | | 2,316,919,772 | |
| | | | | | | | | | | | | | | | | | | | | | | | | | |
| | | | | | | | | | | | | | | | | | | | | | | | | | |
| | — | | | | — | | | | — | | | | — | | | | 21,009 | | | | — | | | | — | |
| | — | | | | — | | | | — | | | | — | | | | — | | | | — | | | | — | |
| | — | | | | 1,373,757 | | | | 44,965,898 | | | | 12,622,214 | | | | — | | | | 323,163 | | | | 14,777,089 | |
| | — | | | | — | | | | — | | | | — | | | | — | | | | — | | | | — | |
| | | | | | | | | | | | | | | | | | | | | | | | | | |
| | 6,824,228 | | | | 1,053,783 | | | | 702,095 | | | | 1,471,297 | | | | 4,195,705 | | | | 3,108,761 | | | | 1,602,978 | |
| | 1,279,060 | | | | 145,189 | | | | 461,891 | | | | 35,085 | | | | 101,372 | | | | 2,902,682 | | | | 295,327 | |
| | 1,823,306 | | | | 336,457 | | | | 830,406 | | | | 230,507 | | | | 161,047 | | | | 853,840 | | | | 1,298,439 | |
| | 1,346 | | | | 1,239 | | | | 1,831 | | | | 1,266 | | | | 1,182 | | | | 1,641 | | | | 1,810 | |
| | 39,316 | | | | 6,339 | | | | 24,666 | | | | 3,854 | | | | 3,221 | | | | 17,515 | | | | 27,474 | |
| | 21,777 | | | | 2,969 | | | | 8,848 | | | | 2,171 | | | | 1,957 | | | | 8,888 | | | | 12,107 | |
| | — | | | | — | | | | — | | | | — | | | | — | | | | — | | | | — | |
| | 13,908 | | | | 2,975 | | | | 6,833 | | | | 1,459 | | | | 2,258 | | | | 5,041 | | | | 1,999 | |
| | 324,770 | | | | 128,249 | | | | 268,287 | | | | 38,383 | | | | 95,724 | | | | 265,255 | | | | 93,641 | |
| | | | | | | | | | | | | | | | | | | | | | | | | | |
| | 10,327,711 | | | | 3,050,957 | | | | 47,270,755 | | | | 14,406,236 | | | | 4,583,475 | | | | 7,486,786 | | | | 18,110,864 | |
| | | | | | | | | | | | | | | | | | | | | | | | | | |
| $ | 3,351,529,057 | | | $ | 539,073,437 | | | $ | 1,632,450,813 | | | $ | 328,098,079 | | | $ | 276,922,859 | | | $ | 1,455,050,579 | | | $ | 2,298,808,908 | |
| | | | | | | | | | | | | | | | | | | | | | | | | | |
| | | | | | | | | | | | | | | | | | | | | | | | | | |
| $ | 1,854,804,310 | | | $ | 312,930,814 | | | $ | 946,373,192 | | | $ | 235,247,543 | | | $ | 274,589,513 | | | $ | 1,273,521,583 | | | $ | 1,341,214,798 | |
| | 35,731,762 | | | | 3,985,503 | | | | (2,447,104 | ) | | | (134,175 | ) | | | 24,118,870 | | | | 43,790,722 | | | | (709,631 | ) |
| | 558,113,065 | | | | 76,605,051 | | | | 402,803,311 | | | | 27,569,842 | | | | (13,695,077 | ) | | | 79,265,460 | | | | 335,742,782 | |
| 902,879,920 | | | | 145,552,069 | | | | 285,721,414 | | | | 65,414,869 | | | | (8,090,447 | ) | | | 58,472,814 | | | | 622,560,959 | |
| | | | | | | | | | | | | | | | | | | | | | | | | | |
| $ | 3,351,529,057 | | | $ | 539,073,437 | | | $ | 1,632,450,813 | | | $ | 328,098,079 | | | $ | 276,922,859 | | | $ | 1,455,050,579 | | | $ | 2,298,808,908 | |
| | | | | | | | | | | | | | | | | | | | | | | | | | |
| | 4,200,000,000 | | | | 3,600,000,000 | | | | 900,000,000 | | | | 800,000,000 | | | | 2,800,000,000 | | | | 2,825,000,000 | | | | 2,600,000,000 | |
| | | | | | | | | | | | | | | | | | | | | | | | | | |
| $ | 0.0010 | | | $ | 0.0010 | | | $ | 0.0010 | | | $ | 0.0010 | | | $ | 0.0010 | | | $ | 0.0010 | | | $ | 0.0010 | |
| | | | | | | | | | | | | | | | | | | | | | | | | | |
| $ | 23.81 | | | $ | 30.09 | | | $ | 44.09 | | | $ | 23.73 | | | $ | 8.16 | | | $ | 16.85 | | | $ | 43.11 | |
| | | | | | | | | | | | | | | | | | | | | | | | | | |
| | 123,739,601 | | | | 15,014,684 | | | | 32,498,837 | | | | 12,037,201 | | | | 25,884,067 | | | | 77,574,521 | | | | 51,969,039 | |
| | | | | | | | | | | | | | | | | | | | | | | | | | |
| $ | 2,945,795,863 | | | $ | 451,787,262 | | | $ | 1,432,965,869 | | | $ | 285,645,457 | | | $ | 211,095,207 | | | $ | 1,306,992,178 | | | $ | 2,240,565,052 | |
| | | | | | | | | | | | | | | | | | | | | | | | | | |
| $ | 23.67 | | | $ | 29.77 | | | $ | 42.31 | | | $ | 22.53 | | | $ | 8.01 | | | $ | 17.04 | | | $ | 42.07 | |
| | | | | | | | | | | | | | | | | | | | | | | | | | |
| | 17,139,290 | | | | 2,931,974 | | | | 3,800,121 | | | | 1,884,385 | | | | 8,220,264 | | | | 8,690,560 | | | | 1,384,307 | |
| | | | | | | | | | | | | | | | | | | | | | | | | | |
| $ | 405,733,194 | | | $ | 87,286,175 | | | $ | 160,792,633 | | | $ | 42,452,622 | | | $ | 65,827,652 | | | $ | 148,058,401 | | | $ | 58,243,856 | |
| | | | | | | | | | | | | | | | | | | | | | | | | | |
| $ | — | | | $ | — | | | $ | 43.17 | | | $ | — | | | $ | — | | | $ | — | | | $ | — | |
| | | | | | | | | | | | | | | | | | | | | | | | | | |
| | — | | | | — | | | | 896,210 | | | | — | | | | — | | | | — | | | | — | |
| | | | | | | | | | | | | | | | | | | | | | | | | | |
| $ | — | | | $ | — | | | $ | 38,692,311 | | | $ | — | | | $ | — | | | $ | — | | | $ | — | |
| | | | | | | | | | | | | | | | | | | | | | | | | | |
| $ | 2,435,560,692 | | | $ | 395,044,308 | | | $ | 1,392,952,491 | | | $ | 276,720,312 | | | $ | 282,389,632 | | | $ | 1,387,022,723 | | | $ | 1,688,512,259 | |
| $ | — | | | $ | 163,762 | | | $ | — | | | $ | 12,248 | | | $ | — | | | $ | 4,150,551 | | | $ | — | |
| $ | — | | | $ | 1,347,988 | | | $ | 43,764,332 | | | $ | 12,302,156 | | | $ | — | | | $ | 307,775 | | | $ | 14,390,331 | |
The accompanying notes are an integral part of these financial statements.
Statements of Assets and Liabilities – (continued)
June 30, 2018 (Unaudited)
| | | | | | | | | | | | |
| | | Hartford
MidCap Value
HLS Fund | | | Hartford
Small Cap Growth
HLS Fund | | | Hartford
Small Company
HLS Fund | |
Assets: | |
Investments in securities, at market value(1) | | $ | 355,539,238 | | | $ | 1,439,943,167 | | | $ | 652,614,687 | |
Cash | | | — | | | | — | | | | — | |
Cash collateral due from broker on swap contracts | | | — | | | | — | | | | — | |
Foreign currency | | | 320,557 | | | | — | | | | 5 | |
Unrealized appreciation on OTC swap contracts | | | — | | | | — | | | | — | |
Unrealized appreciation on foreign currency contracts | | | — | | | | — | | | | — | |
Receivables: | |
Investment securities sold | | | 740,090 | | | | 36,794,283 | | | | 7,147,918 | |
Fund shares sold | | | 9,983 | | | | 688,068 | | | | 303,275 | |
Dividends and interest | | | 443,714 | | | | 557,496 | | | | 143,962 | |
Securities lending income | | | 1,680 | | | | 21,867 | | | | 8,602 | |
Tax reclaims | | | 10,645 | | | | — | | | | — | |
Variation margin on centrally cleared swap contracts | | | — | | | | — | | | | — | |
OTC swap contracts premiums paid | | | — | | | | — | | | | — | |
Other assets | | | 11,940 | | | | 11,980 | | | | 11,972 | |
| | | | | | | | | | | | |
Total assets | | | 357,077,847 | | | | 1,478,016,861 | | | | 660,230,421 | |
| | | | | | | | | | | | |
Liabilities: | |
Bank overdraft | | | — | | | | 941,658 | | | | — | |
Unrealized depreciation on foreign currency contracts | | | — | | | | — | | | | — | |
Obligation to return securities lending collateral | | | 3,938,076 | | | | 51,156,426 | | | | 11,282,564 | |
Unrealized depreciation on OTC Swap contracts | | | — | | | | — | | | | — | |
TBA sale commitments, at market value | | | — | | | | — | | | | — | |
Unfunded loan commitments | | | — | | | | — | | | | — | |
Payables: | |
Investment securities purchased | | | 780,463 | | | | 10,994,889 | | | | 4,891,515 | |
Fund shares redeemed | | | 93,599 | | | | 25,124,809 | | | | 108,387 | |
Investment management fees | | | 234,945 | | | | 717,996 | | | | 400,015 | |
Transfer agent fees | | | 1,155 | | | | 1,784 | | | | 1,330 | |
Accounting services fees | | | 4,112 | | | | 21,293 | | | | 9,845 | |
Board of Directors’ fees | | | 2,283 | | | | 7,835 | | | | 4,246 | |
Variation margin on centrally cleared swap contracts | | | — | | | | — | | | | — | |
Variation margin on futures contracts | | | — | | | | — | | | | — | |
Distribution fees | | | 2,803 | | | | 13,649 | | | | 2,034 | |
Accrued expenses | | | 82,437 | | | | 119,171 | | | | 106,839 | |
OTC swap contracts premiums received | | | — | | | | — | | | | — | |
| | | | | | | | | | | | |
Total liabilities | | | 5,139,873 | | | | 89,099,510 | | | | 16,806,775 | |
| | | | | | | | | | | | |
Net assets | | $ | 351,937,974 | | | $ | 1,388,917,351 | | | $ | 643,423,646 | |
| | | | | | | | | | | | |
Summary of Net Assets: | |
Capital stock and paid-in-capital | | $ | 239,872,492 | | | $ | 904,693,153 | | | $ | 414,118,559 | |
Undistributed (distributions in excess of) net investment income | | | 2,222,149 | | | | 240,506 | | | | (1,177,871 | ) |
Accumulated net realized gain (loss) | | | 52,222,843 | | | | 220,206,193 | | | | 113,017,798 | |
Unrealized appreciation (depreciation) of investments and the translation of assets and liabilities denominated in foreign currency | | | 57,620,490 | | | | 263,777,499 | | | | 117,465,160 | |
| | | | | | | | | | | | |
Net assets | | $ | 351,937,974 | | | $ | 1,388,917,351 | | | $ | 643,423,646 | |
| | | | | | | | | | | | |
Shares authorized | | | 1,200,000,000 | | | | 700,000,000 | | | | 1,500,000,000 | |
| | | | | | | | | | | | |
Par value | | $ | 0.0010 | | | $ | 0.0010 | | | $ | 0.0010 | |
| | | | | | | | | | | | |
Class IA: Net asset value per share | | $ | 12.70 | | | $ | 34.93 | | | $ | 23.04 | |
| | | | | | | | | | | | |
Shares outstanding | | | 21,276,550 | | | | 29,095,781 | | | | 25,356,422 | |
| | | | | | | | | | | | |
Net Assets | | $ | 270,227,047 | | | $ | 1,016,227,062 | | | $ | 584,242,864 | |
| | | | | | | | | | | | |
Class IB: Net asset value per share | | $ | 12.59 | | | $ | 33.97 | | | $ | 21.38 | |
| | | | | | | | | | | | |
Shares outstanding | | | 6,492,595 | | | | 10,972,089 | | | | 2,768,119 | |
| | | | | | | | | | | | |
Net Assets | | $ | 81,710,927 | | | $ | 372,690,289 | | | $ | 59,180,782 | |
| | | | | | | | | | | | |
Cost of investments | | $ | 297,912,097 | | | $ | 1,176,165,668 | | | $ | 535,149,527 | |
Cost of foreign currency | | $ | 325,847 | | | $ | — | | | $ | 5 | |
Proceeds of TBA sale commitments | | $ | — | | | $ | — | | | $ | — | |
(1) Includes Investment in securities on loan, at value | | $ | 3,862,865 | | | $ | 49,968,235 | | | $ | 11,026,358 | |
The accompanying notes are an integral part of these financial statements.
Statements of Assets and Liabilities – (continued)
June 30, 2018 (Unaudited)
| | | | | | | | | | | | | | | | | | | | | | |
Hartford
Small/Mid Cap
Equity HLS Fund | | | Hartford
Stock HLS Fund | | | Hartford
Total Return Bond
HLS Fund | | | Hartford
Ultrashort Bond
HLS Fund | | | Hartford
U.S. Government
Securities HLS
Fund | | | Hartford
Value HLS Fund | |
| | | | | | | | | | | | | | | | | | | | | | |
| $ | 95,921,526 | | | $ | 1,446,276,560 | | | $ | 3,031,025,967 | | | $ | 502,841,821 | | | $ | 383,402,871 | | | $ | 485,942,351 | |
| | — | | | | — | | | | 139,853 | | | | — | | | | — | | | | — | |
| | — | | | | — | | | | 382,000 | | | | — | | | | — | | | | — | |
| | — | | | | 167,699 | | | | 127,809 | | | | — | | | | — | | | | — | |
| | — | | | | — | | | | 1,625,976 | | | | — | | | | — | | | | — | |
| | — | | | | — | | | | 148,902 | | | | — | | | | — | | | | — | |
| | | | | | | | | | | | | | | | | | | | | | |
| | — | | | | — | | | | 377,166,947 | | | | — | | | | 5,075,391 | | | | 2,396,603 | |
| | 1,539 | | | | 9,695 | | | | 523,467 | | | | 537,387 | | | | 5,603 | | | | 70,062 | |
| | 141,704 | | | | 1,765,718 | | | | 12,911,535 | | | | 1,513,958 | | | | 1,285,697 | | | | 645,668 | |
| | 1,294 | | | | — | | | | 6,021 | | | | — | | | | — | | | | 7,732 | |
| | — | | | | 918,829 | | | | 12,084 | | | | 908 | | | | — | | | | 253,186 | |
| | — | | | | — | | | | — | | | | — | | | | 1,427,927 | | | | — | |
| | — | | | | — | | | | 1,758,448 | | | | — | | | | — | | | | — | |
| | 15,808 | | | | 6,745 | | | | 6,577 | | | | 10,970 | | | | 16,488 | | | | 13,505 | |
| | | | | | | | | | | | | | | | | | | | | | |
| | 96,081,871 | | | | 1,449,145,246 | | | | 3,425,835,586 | | | | 504,905,044 | | | | 391,213,977 | | | | 489,329,107 | |
| | | | | | | | | | | | | | | | | | | | | | |
| | | | | | | | | | | | | | | | | | | | | | |
| | — | | | | — | | | | — | | | | 66 | | | | — | | | | — | |
| | — | | | | — | | | | 258,124 | | | | — | | | | — | | | | — | |
| | 1,130,610 | | | | — | | | | 10,509,326 | | | | — | | | | — | | | | 2,328,015 | |
| | — | | | | — | | | | 2,858,292 | | | | — | | | | — | | | | — | |
| | — | | | | — | | | | 301,667,083 | | | | — | | | | — | | | | — | |
| | — | | | | — | | | | 26,420 | | | | — | | | | — | | | | — | |
| | | | | | | | | | | | | | | | | | | | | | |
| | — | | | | — | | | | 867,870,788 | | | | 1,189,990 | | | | 21,798,026 | | | | 2,485,999 | |
| | 10,631 | | | | 741,711 | | | | 762,626 | | | | 76,757 | | | | 120,170 | | | | 163,572 | |
| | 63,655 | | | | 579,205 | | | | 863,858 | | | | 164,871 | | | | 136,946 | | | | 268,728 | |
| | 1,126 | | | | 1,211 | | | | 1,296 | | | | 1,238 | | | | 1,181 | | | | 1,275 | |
| | 1,114 | | | | 16,901 | | | | 33,116 | | | | 5,770 | | | | 4,261 | | | | 5,643 | |
| | 607 | | | | 9,335 | | | | 15,221 | | | | 3,478 | | | | 2,662 | | | | 3,243 | |
| | — | | | | — | | | | 109,671 | | | | — | | | | — | | | | — | |
| | — | | | | — | | | | 68,078 | | | | — | | | | 9,945 | | | | — | |
| | 487 | | | | 4,535 | | | | 7,887 | | | | 2,148 | | | | 2,217 | | | | 2,367 | |
| | 35,201 | | | | 202,895 | | | | 317,096 | | | | 106,060 | | | | 104,152 | | | | 96,330 | |
| | — | | | | — | | | | 9,940,274 | | | | — | | | | — | | | | — | |
| | | | | | | | | | | | | | | | | | | | | | |
| | 1,243,431 | | | | 1,555,793 | | | | 1,195,309,156 | | | | 1,550,378 | | | | 22,179,560 | | | | 5,355,172 | |
| | | | | | | | | | | | | | | | | | | | | | |
| $ | 94,838,440 | | | $ | 1,447,589,453 | | | $ | 2,230,526,430 | | | $ | 503,354,666 | | | $ | 369,034,417 | | | $ | 483,973,935 | |
| | | | | | | | | | | | | | | | | | | | | | |
| | | | | | | | | | | | | | | | | | | | | | |
| $ | 63,537,034 | | | $ | 1,059,567,346 | | | $ | 2,153,299,915 | | | $ | 495,601,390 | | | $ | 450,281,628 | | | $ | 302,997,865 | |
| | 1,351,360 | | | | 12,129,651 | | | | 125,535,139 | | | | 9,369,878 | | | | 12,335,704 | | | | 4,495,842 | |
| | 17,287,234 | | | | 61,760,816 | | | | (14,339,267 | ) | | | (694,325 | ) | | | (89,753,813 | ) | | | 58,593,261 | |
| 12,662,812 | | | | 314,131,640 | | | | (33,969,357 | ) | | | (922,277 | ) | | | (3,829,102 | ) | | | 117,886,967 | |
| | | | | | | | | | | | | | | | | | | | | | |
| $ | 94,838,440 | | | $ | 1,447,589,453 | | | $ | 2,230,526,430 | | | $ | 503,354,666 | | | $ | 369,034,417 | | | $ | 483,973,935 | |
| | | | | | | | | | | | | | | | | | | | | | |
| | 900,000,000 | | | | 4,200,000,000 | | | | 5,000,000,000 | | | | 14,000,000,000 | | | | 700,000,000 | | | | 800,000,000 | |
| | | | | | | | | | | | | | | | | | | | | | |
| $ | 0.0010 | | | $ | 0.0010 | | | $ | 0.0010 | | | $ | 0.0010 | | | $ | 0.0010 | | | $ | 0.0010 | |
| | | | | | | | | | | | | | | | | | | | | | |
| $ | 9.17 | | | $ | 81.11 | | | $ | 11.15 | | | $ | 10.12 | | | $ | 10.16 | | | $ | 15.86 | |
| | | | | | | | | | | | | | | | | | | | | | |
| | 8,805,423 | | | | 16,212,468 | | | | 179,370,065 | | | | 43,550,434 | | | | 29,947,402 | | | | 26,147,836 | |
| | | | | | | | | | | | | | | | | | | | | | |
| $ | 80,745,881 | | | $ | 1,314,951,679 | | | $ | 2,000,366,474 | | | $ | 440,723,304 | | | $ | 304,330,658 | | | $ | 414,685,505 | |
| | | | | | | | | | | | | | | | | | | | | | |
| $ | 9.10 | | | $ | 80.98 | | | $ | 11.08 | | | $ | 10.10 | | | $ | 10.13 | | | $ | 15.82 | |
| | | | | | | | | | | | | | | | | | | | | | |
| | 1,548,237 | | | | 1,637,911 | | | | 20,776,063 | | | | 6,202,999 | | | | 6,384,936 | | | | 4,379,898 | |
| | | | | | | | | | | | | | | | | | | | | | |
| $ | 14,092,559 | | | $ | 132,637,774 | | | $ | 230,159,956 | | | $ | 62,631,362 | | | $ | 64,703,759 | | | $ | 69,288,430 | |
| | | | | | | | | | | | | | | | | | | | | | |
| $ | 83,258,714 | | | $ | 1,132,114,351 | | | $ | 3,068,436,515 | | | $ | 503,764,098 | | | $ | 388,048,307 | | | $ | 368,050,123 | |
| $ | — | | | $ | 166,201 | | | $ | 153,152 | | | $ | — | | | $ | — | | | $ | — | |
| $ | — | | | $ | — | | | $ | 300,475,937 | | | $ | — | | | $ | — | | | $ | — | |
| $ | 1,102,803 | | | $ | — | | | $ | 10,317,843 | | | $ | — | | | $ | — | | | $ | 2,221,761 | |
The accompanying notes are an integral part of these financial statements.
Statements of Operations
For the Six-Month Period Ended June 30, 2018 (Unaudited)
| | | | | | | | | | | | |
| | | Hartford
Balanced HLS
Fund | | | Hartford
Capital Appreciation
HLS Fund | | |
Hartford
Disciplined Equity
HLS Fund | |
Investment Income: | |
Dividends | | $ | 17,817,759 | | | $ | 42,354,294 | | | $ | 4,896,657 | |
Interest | | | 12,661,890 | | | | 307,457 | | | | 25,519 | |
Securities lending | | | 49,282 | | | | 242,509 | | | | — | |
Less: Foreign tax withheld | | | (430,379 | ) | | | (838,417 | ) | | | — | |
| | | | | | | | | | | | |
Total investment income, net | | | 30,098,552 | | | | 42,065,843 | | | | 4,922,176 | |
| | | | | | | | | | | | |
Expenses: | | | | | | | | | | | | |
Investment management fees | | | 7,099,492 | | | | 15,718,828 | | | | 2,475,535 | |
Administrative services fees | | | | | | | | | | | | |
Class IC | | | — | | | | 37,741 | | | | — | |
Transfer agent fees | | | | | | | | | | | | |
Class IA | | | 2,376 | | | | 3,515 | | | | 2,286 | |
Class IB | | | 316 | | | | 437 | | | | 315 | |
Class IC | | | — | | | | 25 | | | | — | |
Distribution fees | | | | | | | | | | | | |
Class IB | | | 335,369 | | | | 674,146 | | | | 102,793 | |
Class IC | | | — | | | | 37,741 | | | | — | |
Custodian fees | | | 9,490 | | | | 93,912 | | | | 1,721 | |
Registration and filing fees | | | 16,847 | | | | 22,640 | | | | 16,311 | |
Accounting services fees | | | 205,586 | | | | 413,195 | | | | 47,488 | |
Board of Directors’ fees | | | 33,230 | | | | 71,429 | | | | 9,777 | |
Audit fees | | | 20,393 | | | | 19,366 | | | | 14,317 | |
Other expenses | | | 150,288 | | | | 300,966 | | | | 75,496 | |
| | | | | | | | | | | | |
Total expenses (before waivers and fees paid indirectly) | | | 7,873,387 | | | | 17,393,941 | | | | 2,746,039 | |
| | | | | | | | | | | | |
Management fee waivers | | | (342,643 | ) | | | — | | | | — | |
Commission recapture | | | (708 | ) | | | (20,257 | ) | | | (271 | ) |
| | | | | | | | | | | | |
Total waivers and fees paid indirectly | | | (343,351 | ) | | | (20,257 | ) | | | (271 | ) |
| | | | | | | | | | | | |
Total expenses, net | | | 7,530,036 | | | | 17,373,684 | | | | 2,745,768 | |
| | | | | | | | | | | | |
Net Investment Income (Loss) | | | 22,568,516 | | | | 24,692,159 | | | | 2,176,408 | |
| | | | | | | | | | | | |
Net Realized Gain (Loss) on Investments, Other Financial Instruments and Foreign Currency Transactions: | | | | | | | | | | | | |
Net realized gain (loss) on investments | | | 108,058,873 | | | | 391,382,861 | | | | 41,749,206 | |
Net realized gain (loss) on futures contracts | | | 1,479,444 | | | | — | | | | — | |
Net realized gain (loss) on foreign currency contracts | | | — | | | | (18,367 | ) | | | — | |
Net realized gain (loss) on other foreign currency transactions | | | (9,632 | ) | | | (280,333 | ) | | | — | |
| | | | | | | | | | | | |
Net Realized Gain (Loss) on Investments, Other Financial Instruments and Foreign Currency Transactions | | | 109,528,685 | | | | 391,084,161 | | | | 41,749,206 | |
| | | | | | | | | | | | |
Net Changes in Unrealized Appreciation (Depreciation) of Investments, Other Financial Instruments and Foreign Currency Transactions: | | | | | | | | | | | | |
Net unrealized appreciation (depreciation) of investments | | | (126,984,058 | ) | | | (253,788,989 | ) | | | (18,705,188 | ) |
Net unrealized appreciation (depreciation) of futures contracts | | | (41,147 | ) | | | (625,396 | ) | | | — | |
Net unrealized appreciation (depreciation) of foreign currency contracts | | | — | | | | 322,583 | | | | — | |
Net unrealized appreciation (depreciation) of translation of other assets and liabilities in foreign currencies | | | (11,716 | ) | | | (36,918 | ) | | | — | |
| | | | | | | | | | | | |
Net Changes in Unrealized Appreciation (Depreciation) of Investments, Other Financial Instruments and Foreign Currency Transactions | | | (127,036,921 | ) | | | (254,128,720 | ) | | | (18,705,188 | ) |
| | | | | | | | | | | | |
Net Gain (Loss) on Investments, Other Financial Instruments and Foreign Currency Transactions | | | (17,508,236 | ) | | | 136,955,441 | | | | 23,044,018 | |
| | | | | | | | | | | | |
Net Increase (Decrease) in Net Assets Resulting from Operations | | $ | 5,060,280 | | | $ | 161,647,600 | | | $ | 25,220,426 | |
| | | | | | | | | | | | |
The accompanying notes are an integral part of these financial statements.
Statements of Operations – (continued)
For the Six-Month Period Ended June 30, 2018 (Unaudited)
| | | | | | | | | | | | | | | | | | | | | | | | | | |
Hartford
Dividend and
Growth HLS
Fund | | | Hartford
Global Growth
HLS Fund | | | Hartford
Growth Opportunities
HLS Fund | | | Hartford
Healthcare HLS
Fund | | | Hartford
High Yield
HLS Fund | | | Hartford
International
Opportunities
HLS Fund | | | Hartford
MidCap HLS
Fund | |
| | | | | | | | | | | | | | | | | | | | | | | | | | |
| $ | 43,999,269 | | | $ | 3,975,483 | | | $ | 3,890,446 | | | $ | 1,473,573 | | | $ | 19,782 | | | $ | 24,871,136 | | | $ | 7,430,673 | |
| | 387,706 | | | | 41,560 | | | | 66,745 | | | | 47,696 | | | | 8,799,953 | | | | 234,567 | | | | 22,784 | |
| | 15,630 | | | | 16,526 | | | | 168,802 | | | | 27,625 | | | | — | | | | 85,263 | | | | 43,366 | |
| | (509,545 | ) | | | (250,133 | ) | | | (9,253 | ) | | | (22,259 | ) | | | — | | | | (2,491,647 | ) | | | (67,126 | ) |
| | | | | | | | | | | | | | | | | | | | | | | | | | |
| | 43,893,060 | | | | 3,783,436 | | | | 4,116,740 | | | | 1,526,635 | | | | 8,819,735 | | | | 22,699,319 | | | | 7,429,697 | |
| | | | | | | | | | | | | | | | | | | | | | | | | | |
| | | | | | | | | | | | | | | | | | | | | | | | | | |
| | 11,253,245 | | | | 2,008,909 | | | | 4,746,911 | | | | 1,387,988 | | | | 1,004,666 | | | | 5,339,968 | | | | 7,546,617 | |
| | | | | | | | | | | | | | | | | | | | | | | | | | |
| | — | | | | — | | | | 45,301 | | | | — | | | | — | | | | — | | | | — | |
| | | | | | | | | | | | | | | | | | | | | | | | | | |
| | 2,496 | | | | 2,197 | | | | 3,392 | | | | 2,322 | | | | 1,898 | | | | 3,192 | | | | 3,932 | |
| | 344 | | | | 424 | | | | 381 | | | | 352 | | | | 590 | | | | 359 | | | | 103 | |
| | — | | | | — | | | | 89 | | | | — | | | | — | | | | — | | | | — | |
| | | | | | | | | | | | | | | | | | | | | | | | | | |
| | 525,716 | | | | 109,277 | | | | 192,973 | | | | 54,586 | | | | 85,161 | | | | 198,625 | | | | 72,670 | |
| | — | | | | — | | | | 45,301 | | | | — | | | | — | | | | — | | | | — | |
| | 7,656 | | | | 8,045 | | | | 15,802 | | | | 1,954 | | | | 2,126 | | | | 55,130 | | | | 4,666 | |
| | 16,831 | | | | 16,305 | | | | 22,657 | | | | 15,997 | | | | 15,807 | | | | 18,572 | | | | 24,092 | |
| | 242,417 | | | | 37,809 | | | | 140,920 | | | | 23,205 | | | | 20,093 | | | | 109,896 | | | | 159,325 | |
| | 50,635 | | | | 7,435 | | | | 21,547 | | | | 4,795 | | | | 4,248 | | | | 22,319 | | | | 30,818 | |
| | 13,797 | | | | 20,997 | | | | 11,816 | | | | 18,021 | | | | 20,790 | | | | 24,635 | | | | 14,102 | |
| | 217,375 | | | | 59,232 | | | | 142,096 | | | | 16,197 | | | | 41,138 | | | | 132,491 | | | | 87,966 | |
| | | | | | | | | | | | | | | | | | | | | | | | | | |
| | 12,330,512 | | | | 2,270,630 | | | | 5,389,186 | | | | 1,525,417 | | | | 1,196,517 | | | | 5,905,187 | | | | 7,944,291 | |
| | | | | | | | | | | | | | | | | | | | | | | | | | |
| | — | | | | — | | | | — | | | | — | | | | — | | | | — | | | | — | |
| | (7,516 | ) | | | (144 | ) | | | (8,434 | ) | | | (208 | ) | | | — | | | | (10,938 | ) | | | (6,200 | ) |
| | | | | | | | | | | | | | | | | | | | | | | | | | |
| | (7,516 | ) | | | (144 | ) | | | (8,434 | ) | | | (208 | ) | | | — | | | | (10,938 | ) | | | (6,200 | ) |
| | | | | | | | | | | | | | | | | | | | | | | | | | |
| | 12,322,996 | | | | 2,270,486 | | | | 5,380,752 | | | | 1,525,209 | | | | 1,196,517 | | | | 5,894,249 | | | | 7,938,091 | |
| | | | | | | | | | | | | | | | | | | | | | | | | | |
| | 31,570,064 | | | | 1,512,950 | | | | (1,264,012 | ) | | | 1,426 | | | | 7,623,218 | | | | 16,805,070 | | | | (508,394 | ) |
| | | | | | | | | | | | | | | | | | | | | | | | | | |
| | | | | | | | | | | | | | | | | | | | | | | | | | |
| | 203,248,013 | | | | 33,138,192 | | | | 201,349,876 | | | | 12,948,519 | | | | 1,858,652 | | | | 85,510,606 | | | | 137,870,892 | |
| | — | | | | — | | | | — | | | | — | | | | — | | | | — | | | | — | |
| | — | | | | — | | | | — | | | | — | | | | 152,096 | | | | — | | | | — | |
| | 15,017 | | | | 26,385 | | | | (7,123 | ) | | | (1,402 | ) | | | 1,761 | | | | (386,568 | ) | | | (171 | ) |
| | | | | | | | | | | | | | | | | | | | | | | | | | |
|
203,263,030 |
| | | 33,164,577 | | | | 201,342,753 | | | | 12,947,117 | | | | 2,012,509 | | | | 85,124,038 | | | | 137,870,721 | |
| | | | | | | | | | | | | | | | | | | | | | | | | | |
| | | | | | | | | | | | | | | | | | | | | | | | | | |
| | (254,723,556 | ) | | | 5,705,569 | | | | 16,188,853 | | | | 5,431,207 | | | | (11,257,504 | ) | | | (153,971,505 | ) | | | 28,155,144 | |
| | — | | | | — | | | | — | | | | — | | | | — | | | | — | | | | — | |
| | — | | | | — | | | | — | | | | — | | | | 39,717 | | | | — | | | | — | |
| | (9,870 | ) | | | (16,660 | ) | | | (2,378 | ) | | | (501 | ) | | | (6,351 | ) | | | (89,531 | ) | | | — | |
| | | | | | | | | | | | | | | | | | | | | | | | | | |
|
(254,733,426 |
) | | | 5,688,909 | | | | 16,186,475 | | | | 5,430,706 | | | | (11,224,138 | ) | | | (154,061,036 | ) | | | 28,155,144 | |
| | | | | | | | | | | | | | | | | | | | | | | | | | |
| | (51,470,396 | ) | | | 38,853,486 | | | | 217,529,228 | | | | 18,377,823 | | | | (9,211,629 | ) | | | (68,936,998 | ) | | | 166,025,865 | |
| | | | | | | | | | | | | | | | | | | | | | | | | | |
| $ | (19,900,332 | ) | | $ | 40,366,436 | | | $ | 216,265,216 | | | $ | 18,379,249 | | | $ | (1,588,411 | ) | | $ | (52,131,928 | ) | | $ | 165,517,471 | |
| | | | | | | | | | | | | | | | | | | | | | | | | | |
The accompanying notes are an integral part of these financial statements.
Statements of Operations – (continued)
For the Six-Month Period Ended June 30, 2018 (Unaudited)
| | | | | | | | | | | | |
| | |
Hartford
MidCap Value
HLS Fund | | | Hartford
Small Cap Growth
HLS Fund | | | Hartford
Small Company
HLS Fund | |
Investment Income: | |
Dividends | | $ | 2,575,849 | | | $ | 4,882,691 | | | $ | 1,265,634 | |
Interest | | | 36,101 | | | | 141,964 | | | | 48,202 | |
Securities lending | | | 41,976 | | | | 67,561 | | | | 25,368 | |
Less: Foreign tax withheld | | | (24,569 | ) | | | (1,828 | ) | | | — | |
| | | | | | | | | | | | |
Total investment income, net | | | 2,629,357 | | | | 5,090,388 | | | | 1,339,204 | |
| | | | | | | | | | | | |
Expenses: | |
Investment management fees | | | 1,438,001 | | | | 4,125,228 | | | | 2,288,302 | |
Transfer agent fees | |
Class IA | | | 1,868 | | | | 2,592 | | | | 2,440 | |
Class IB | | | 564 | | | | 1,012 | | | | 246 | |
Distribution fees | |
Class IB | | | 104,267 | | | | 476,900 | | | | 71,437 | |
Custodian fees | | | 3,197 | | | | 3,122 | | | | 5,032 | |
Registration and filing fees | | | 16,304 | | | | 18,280 | | | | 17,212 | |
Accounting services fees | | | 25,165 | | | | 122,269 | | | | 56,063 | |
Board of Directors’ fees | | | 5,233 | | | | 18,886 | | | | 8,812 | |
Audit fees | | | 14,420 | | | | 11,699 | | | | 17,859 | |
Other expenses | | | 38,441 | | | | 72,787 | | | | 56,121 | |
| | | | | | | | | | | | |
Total expenses (before waivers and fees paid indirectly) | | | 1,647,460 | | | | 4,852,775 | | | | 2,523,524 | |
| | | | | | | | | | | | |
Commission recapture | | | (2,666 | ) | | | (2,893 | ) | | | (6,449 | ) |
| | | | | | | | | | | | |
Total waivers and fees paid indirectly | | | (2,666 | ) | | | (2,893 | ) | | | (6,449 | ) |
| | | | | | | | | | | | |
Total expenses, net | | | 1,644,794 | | | | 4,849,882 | | | | 2,517,075 | |
| | | | | | | | | | | | |
Net Investment Income (Loss) | | | 984,563 | | | | 240,506 | | | | (1,177,871 | ) |
| | | | | | | | | | | | |
Net Realized Gain (Loss) on Investments, Other Financial Instruments and Foreign Currency Transactions: | |
Net realized gain (loss) on investments | | | 30,102,741 | | | | 138,113,835 | | | | 73,997,860 | |
Net realized gain (loss) on purchased options contracts | | | — | | | | — | | | | — | |
Net realized gain (loss) on futures contracts | | | — | | | | — | | | | — | |
Net realized gain (loss) on written options contracts | | | — | | | | — | | | | — | |
Net realized gain (loss) on swap contracts | | | — | | | | — | | | | — | |
Net realized gain (loss) on foreign currency contracts | | | — | | | | — | | | | — | |
Net realized gain (loss) on other foreign currency transactions | | | (88,370 | ) | | | — | | | | 1,045 | |
| | | | | | | | | | | | |
Net Realized Gain (Loss) on Investments, Other Financial Instruments and Foreign Currency Transactions | | | 30,014,371 | | | | 138,113,835 | | | | 73,998,905 | |
| | | | | | | | | | | | |
Net Changes in Unrealized Appreciation (Depreciation) of Investments, Other Financial Instruments and Foreign Currency Transactions: | | | | | | | | | | | | |
Net unrealized appreciation (depreciation) of investments | | | (28,298,775 | ) | | | (24,481,364 | ) | | | 2,539,613 | |
Net unrealized appreciation (depreciation) of purchased options contracts | | | — | | | | — | | | | — | |
Net unrealized appreciation (depreciation) of futures contracts | | | — | | | | — | | | | — | |
Net unrealized appreciation (depreciation) of swap contracts | | | — | | | | — | | | | — | |
Net unrealized appreciation (depreciation) of foreign currency contracts | | | — | | | | — | | | | — | |
Net unrealized appreciation (depreciation) of translation of other assets and liabilities in foreign currencies | | | (5,476 | ) | | | — | | | | — | |
| | | | | | | | | | | | |
Net Changes in Unrealized Appreciation (Depreciation) of Investments, Other Financial Instruments and Foreign Currency Transactions | | | (28,304,251 | ) | | | (24,481,364 | ) | | | 2,539,613 | |
| | | | | | | | | | | | |
Net Gain (Loss) on Investments, Other Financial Instruments and Foreign Currency Transactions | | | 1,710,120 | | | | 113,632,471 | | | | 76,538,518 | |
| | | | | | | | | | | | |
Net Increase (Decrease) in Net Assets Resulting from Operations | | $ | 2,694,683 | | | $ | 113,872,977 | | | $ | 75,360,647 | |
| | | | | | | | | | | | |
The accompanying notes are an integral part of these financial statements.
Statements of Operations – (continued)
For the Six-Month Period Ended June 30, 2018 (Unaudited)
| | | | | | | | | | | | | | | | | | | | | | |
Hartford
Small/Mid Cap
Equity HLS Fund | | | Hartford
Stock HLS Fund | | | Hartford
Total Return Bond
HLS Fund | | | Hartford
Ultrashort Bond
HLS Fund | | | Hartford
U.S. Government
Securities HLS
Fund | | | Hartford
Value HLS Fund | |
| | | | | | | | | | | | | | | | | | | | | | |
| $ | 869,598 | | | $ | 15,153,617 | | | $ | 49,353 | | | $ | — | | | $ | — | | | $ | 6,436,105 | |
| | 7,715 | | | | 131,208 | | | | 42,164,476 | | | | 5,047,215 | | | | 4,975,328 | | | | 47,893 | |
| | 3,352 | | | | — | | | | 11,615 | | | | — | | | | — | | | | 10,897 | |
| | (2,081 | ) | | | (58,695 | ) | | | — | | | | (1,187 | ) | | | — | | | | (109,158 | ) |
| | | | | | | | | | | | | | | | | | | | | | |
| | 878,584 | | | | 15,226,130 | | | | 42,225,444 | | | | 5,046,028 | | | | 4,975,328 | | | | 6,385,737 | |
| | | | | | | | | | | | | | | | | | | | | | |
| | | | | | | | | | | | | | | | | | | | | | |
| | 379,231 | | | | 3,535,680 | | | | 5,370,215 | | | | 1,015,125 | | | | 858,791 | | | | 1,672,736 | |
| | | | | | | | | | | | | | | | | | | | | | |
| | 2,016 | | | | 2,306 | | | | 2,435 | | | | 2,279 | | | | 2,046 | | | | 2,297 | |
| | 360 | | | | 237 | | | | 280 | | | | 326 | | | | 437 | | | | 387 | |
| | | | | | | | | | | | | | | | | | | | | | |
| | 17,941 | | | | 172,085 | | | | 295,549 | | | | 79,520 | | | | 83,898 | | | | 90,497 | |
| | 425 | | | | 3,932 | | | | 18,407 | | | | 1,404 | | | | 1,949 | | | | 1,754 | |
| | 16,066 | | | | 16,330 | | | | 17,000 | | | | 16,359 | | | | 17,617 | | | | 16,301 | |
| | 6,637 | | | | 103,249 | | | | 206,130 | | | | 35,529 | | | | 26,718 | | | | 35,177 | |
| | 1,389 | | | | 21,339 | | | | 33,513 | | | | 7,409 | | | | 5,646 | | | | 7,387 | |
| | 11,904 | | | | 14,143 | | | | 23,119 | | | | 20,714 | | | | 15,819 | | | | 14,398 | |
| | 14,257 | | | | 120,830 | | | | 185,719 | | | | 52,160 | | | | 47,011 | | | | 48,961 | |
| | | | | | | | | | | | | | | | | | | | | | |
| | 450,226 | | | | 3,990,131 | | | | 6,152,367 | | | | 1,230,825 | | | | 1,059,932 | | | | 1,889,895 | |
| | | | | | | | | | | | | | | | | | | | | | |
| | — | | | | (181 | ) | | | — | | | | — | | | | — | | | | — | |
| | | | | | | | | | | | | | | | | | | | | | |
| | — | | | | (181 | ) | | | — | | | | — | | | | — | | | | — | |
| | | | | | | | | | | | | | | | | | | | | | |
| | 450,226 | | | | 3,989,950 | | | | 6,152,367 | | | | 1,230,825 | | | | 1,059,932 | | | | 1,889,895 | |
| | | | | | | | | | | | | | | | | | | | | | |
| | 428,358 | | | | 11,236,180 | | | | 36,073,077 | | | | 3,815,203 | | | | 3,915,396 | | | | 4,495,842 | |
| | | | | | | | | | | | | | | | | | | | | | |
| | | | | | | | | | | | | | | | | | | | | | |
| | 8,783,808 | | | | 67,142,150 | | | | (7,490,811 | ) | | | (9,235 | ) | | | (2,219,640 | ) | | | 19,353,540 | |
| | — | | | | — | | | | 423,547 | | | | — | | | | — | | | | — | |
| | — | | | | — | | | | (17,370,649 | ) | | | — | | | | (2,695,576 | ) | | | — | |
| | — | | | | — | | | | 364,271 | | | | — | | | | (96,204 | ) | | | — | |
| | — | | | | — | | | | 1,385,355 | | | | — | | | | 1,245,737 | | | | — | |
| | — | | | | — | | | | (1,392,118 | ) | | | — | | | | — | | | | — | |
| | — | | | | (9,810 | ) | | | (125,875 | ) | | | — | | | | — | | | | (5,535 | ) |
| | | | | | | | | | | | | | | | | | | | | | |
| | 8,783,808 | | | | 67,132,340 | | | | (24,206,280 | ) | | | (9,235 | ) | | | (3,765,683 | ) | | | 19,348,005 | |
| | | | | | | | | | | | | | | | | | | | | | |
| | | | | | | | | | | | | | | | | | | | | | |
| | (5,456,872 | ) | | | (49,874,215 | ) | | | (56,549,934 | ) | | | (723,944 | ) | | | (3,662,319 | ) | | | (29,469,976 | ) |
| | — | | | | — | | | | (455,374 | ) | | | — | | | | — | | | | — | |
| | — | | | | — | | | | 4,075,641 | | | | — | | | | 889,450 | | | | — | |
| | — | | | | — | | | | 5,172,081 | | | | — | | | | 348,902 | | | | — | |
| | — | | | | — | | | | 372,472 | | | | — | | | | — | | | | — | |
| | — | | | | (16,531 | ) | | | (18,481 | ) | | | — | | | | — | | | | (5,931 | ) |
| | | | | | | | | | | | | | | | | | | | | | |
| (5,456,872 | ) | | | (49,890,746 | ) | | | (47,403,595 | ) | | | (723,944 | ) | | | (2,423,967 | ) | | | (29,475,907 | ) |
| | | | | | | | | | | | | | | | | | | | | | |
| | 3,326,936 | | | | 17,241,594 | | | | (71,609,875 | ) | | | (733,179 | ) | | | (6,189,650 | ) | | | (10,127,902 | ) |
| | | | | | | | | | | | | | | | | | | | | | |
| $ | 3,755,294 | | | $ | 28,477,774 | | | $ | (35,536,798 | ) | | $ | 3,082,024 | | | $ | (2,274,254 | ) | | $ | (5,632,060 | ) |
| | | | | | | | | | | | | | | | | | | | | | |
The accompanying notes are an integral part of these financial statements.
Statements of Changes in Net Assets
| | | | | | | | |
| | | Hartford Balanced
HLS Fund | |
| | | For the
Six-Month
Period Ended
June 30, 2018
(Unaudited) | | | For the
Year Ended
December 31,
2017 | |
Operations: | |
Net investment income (loss) | | $ | 22,568,516 | | | $ | 42,692,836 | |
Net realized gain (loss) on investments, other financial instruments and foreign currency transactions | | | 109,528,685 | | | | 173,385,809 | |
Net changes in unrealized appreciation (depreciation) of investments, other financial instruments and foreign currency transactions | | | (127,036,921 | ) | | | 122,002,272 | |
| | | | | | | | |
Net Increase (Decrease) in Net Assets Resulting from Operations | | | 5,060,280 | | | | 338,080,917 | |
| | | | | | | | |
Distributions to Shareholders: | |
From net investment income | |
Class IA | | | — | | | | (47,464,119 | ) |
Class IB | | | — | | | | (5,534,060 | ) |
Class IC | | | — | | | | — | |
| | | | | | | | |
Total from net investment income | | | — | | | | (52,998,179 | ) |
| | | | | | | | |
From net realized gain on investments | |
Class IA | | | — | | | | — | |
Class IB | | | — | | | | — | |
Class IC | | | — | | | | — | |
| | | | | | | | |
Total from net realized gain on investments | | | — | | | | — | |
| | | | | | | | |
Total distributions | | | — | | | | (52,998,179 | ) |
| | | | | | | | |
Capital Share Transactions: | |
Sold | | | 11,029,876 | | | | 27,191,961 | |
Issued on reinvestment of distributions | | | — | | | | 52,998,179 | |
Redeemed | | | (178,007,913 | ) | | | (311,772,955 | ) |
| | | | | | | | |
Net (decrease) from capital share transactions | | | (166,978,037 | ) | | | (231,582,815 | ) |
| | | | | | | | |
Net Increase (Decrease) in Net Assets | | | (161,917,757 | ) | | | 53,499,923 | |
| | | | | | | | |
Net Assets: | |
Beginning of period | | | 2,372,981,038 | | | | 2,319,481,115 | |
| | | | | | | | |
End of period | | $ | 2,211,063,281 | | | $ | 2,372,981,038 | |
| | | | | | | | |
Undistributed (distributions in excess of) net investment income | | $ | 23,543,663 | | | $ | 975,147 | |
| | | | | | | | |
The accompanying notes are an integral part of these financial statements.
Statements of Changes in Net Assets – (continued)
| | | | | | | | | | | | | | | | | | | | | | | | | | | | | | |
Hartford Capital Appreciation
HLS Fund | | | Hartford Disciplined Equity
HLS Fund | | | Hartford Dividend and Growth
HLS Fund | | | Hartford Global Growth
HLS Fund | |
For the
Six-Month
Period Ended
June 30, 2018
(Unaudited) | | | For the
Year Ended
December 31,
2017 | | | For the
Six-Month
Period Ended
June 30, 2018
(Unaudited) | | | For the
Year Ended
December 31,
2017 | | | For the
Six-Month
Period Ended
June 30, 2018
(Unaudited) | | | For the
Year Ended
December 31,
2017 | | | For the
Six-Month
Period Ended
June 30, 2018
(Unaudited) | | | For the
Year Ended
December 31,
2017 | |
| | | | | | | | | | | | | | | | | | | | | | | | | | | | | | |
| $ | 24,692,159 | | | $ | 45,424,632 | | | $ | 2,176,408 | | | $ | 6,623,756 | | | $ | 31,570,064 | | | $ | 60,240,785 | | | $ | 1,512,950 | | | $ | 2,465,165 | |
| | 391,084,161 | | | | 641,921,865 | | | | 41,749,206 | | | | 66,406,606 | | | | 203,263,030 | | | | 372,570,368 | | | | 33,164,577 | | | | 43,958,518 | |
| | (254,128,720 | ) | | | 340,712,360 | | | | (18,705,188 | ) | | | 61,943,262 | | | | (254,733,426 | ) | | | 160,622,809 | | | | 5,688,909 | | | | 86,452,802 | |
| | | | | | | | | | | | | | | | | | | | | | | | | | | | | | |
| | 161,647,600 | | | | 1,028,058,857 | | | | 25,220,426 | | | | 134,973,624 | | | | (19,900,332 | ) | | | 593,433,962 | | | | 40,366,436 | | | | 132,876,485 | |
| | | | | | | | | | | | | | | | | | | | | | | | | | | | | | |
| | | | | | | | | | | | | | | | | | | | | | | | | | | | | | |
| | | | | | | | | | | | | | | | | | | | | | | | | | | | | | |
| | — | | | | (47,670,675 | ) | | | — | | | | (5,455,397 | ) | | | — | | | | (50,138,723 | ) | | | — | | | | (2,060,335 | ) |
| | — | | | | (4,773,231 | ) | | | — | | | | (551,499 | ) | | | — | | | | (5,905,716 | ) | | | — | | | | (217,828 | ) |
| | — | | | | (188,398 | ) | | | — | | | | — | | | | — | | | | — | | | | — | | | | — | |
| | | | | | | | | | | | | | | | | | | | | | | | | | | | | | |
| | — | | | | (52,632,304 | ) | | | — | | | | (6,006,896 | ) | | | — | | | | (56,044,439 | ) | | | — | | | | (2,278,163 | ) |
| | | | | | | | | | | | | | | | | | | | | | | | | | | | | | |
| | | | | | | | | | | | | | | | | | | | | | | | | | | | | | |
| | — | | | | (232,329,918 | ) | | | — | | | | (63,822,541 | ) | | | — | | | | (211,321,994 | ) | | | — | | | | (18,738,294 | ) |
| | — | | | | (30,241,181 | ) | | | — | | | | (8,899,981 | ) | | | — | | | | (29,746,780 | ) | | | — | | | | (3,764,027 | ) |
| | — | | | | (1,534,584 | ) | | | — | | | | — | | | | — | | | | — | | | | — | | | | — | |
| | | | | | | | | | | | | | | | | | | | | | | | | | | | | | |
| | — | | | | (264,105,683 | ) | | | — | | | | (72,722,522 | ) | | | — | | | | (241,068,774 | ) | | | — | | | | (22,502,321 | ) |
| | | | | | | | | | | | | | | | | | | | | | | | | | | | | | |
| | — | | | | (316,737,987 | ) | | | — | | | | (78,729,418 | ) | | | — | | | | (297,113,213 | ) | | | — | | | | (24,780,484 | ) |
| | | | | | | | | | | | | | | | | | | | | | | | | | | | | | |
| | | | | | | | | | | | | | | | | | | | | | | | | | | | | | |
| | 17,313,347 | | | | 80,762,993 | | | | 2,402,666 | | | | 6,573,433 | | | | 37,203,833 | | | | 104,640,250 | | | | 26,422,470 | | | | 35,466,468 | |
| | — | | | | 316,737,987 | | | | — | | | | 78,729,418 | | | | — | | | | 297,113,212 | | | | — | | | | 24,780,485 | |
| | (460,690,943 | ) | | | (1,186,680,309 | ) | | | (62,504,721 | ) | | | (112,526,090 | ) | | | (285,425,226 | ) | | | (530,411,682 | ) | | | (44,737,990 | ) | | | (71,226,539 | ) |
| | | | | | | | | | | | | | | | | | | | | | | | | | | | | | |
| | (443,377,596 | ) | | | (789,179,329 | ) | | | (60,102,055 | ) | | | (27,223,239 | ) | | | (248,221,393 | ) | | | (128,658,220 | ) | | | (18,315,520 | ) | | | (10,979,586 | ) |
| | | | | | | | | | | | | | | | | | | | | | | | | | | | | | |
| | (281,729,996 | ) | | | (77,858,459 | ) | | | (34,881,629 | ) | | | 29,020,967 | | | | (268,121,725 | ) | | | 167,662,529 | | | | 22,050,916 | | | | 97,116,415 | |
| | | | | | | | | | | | | | | | | | | | | | | | | | | | | | |
| | | | | | | | | | | | | | | | | | | | | | | | | | | | | | |
| | 5,057,196,014 | | | | 5,135,054,473 | | | | 697,414,477 | | | | 668,393,510 | | | | 3,619,650,782 | | | | 3,451,988,253 | | | | 517,022,521 | | | | 419,906,106 | |
| | | | | | | | | | | | | | | | | | | | | | | | | | | | | | |
| $ | 4,775,466,018 | | | $ | 5,057,196,014 | | | $ | 662,532,848 | | | $ | 697,414,477 | | | $ | 3,351,529,057 | | | $ | 3,619,650,782 | | | $ | 539,073,437 | | | $ | 517,022,521 | |
| | | | | | | | | | | | | | | | | | | | | | | | | | | | | | |
| $ | 28,088,762 | | | $ | 3,396,603 | | | $ | 2,666,626 | | | $ | 490,218 | | | $ | 35,731,762 | | | $ | 4,161,698 | | | $ | 3,985,503 | | | $ | 2,472,553 | |
| | | | | | | | | | | | | | | | | | | | | | | | | | | | | | |
The accompanying notes are an integral part of these financial statements.
Statements of Changes in Net Assets – (continued)
| | | | | | | | |
| | | Hartford Growth Opportunities
HLS Fund | |
| | | For the
Six-Month
Period Ended
June 30, 2018
(Unaudited) | | | For the
Year Ended
December 31,
2017
| |
Operations: | |
Net investment income (loss) | | $ | (1,264,012 | ) | | $ | (2,643,363 | ) |
Net realized gain (loss) on investments, other financial instruments and foreign currency transactions | | | 201,342,753 | | | | 215,967,758 | |
Net changes in unrealized appreciation (depreciation) of investments, other financial instruments and foreign currency transactions | | | 16,186,475 | | | | 164,605,261 | |
| | | | | | | | |
Net Increase (Decrease) in Net Assets Resulting from Operations | | | 216,265,216 | | | | 377,929,656 | |
| | | | | | | | |
Distributions to Shareholders: | |
From net investment income | |
Class IA | | | — | | | | — | |
Class IB | | | — | | | | — | |
| | | | | | | | |
Total from net investment income | | | — | | | | — | |
| | | | | | | | |
From net realized gain on investments | |
Class IA | | | — | | | | (16,106,762 | ) |
Class IB | | | — | | | | (1,881,415 | ) |
Class IC | | | — | | | | (403,653 | ) |
| | | | | | | | |
Total from net realized gain on investments | | | — | | | | (18,391,830 | ) |
| | | | | | | | |
Total distributions | | | — | | | | (18,391,830 | ) |
| | | | | | | | |
Capital Share Transactions: | |
Sold | | | 19,207,638 | | | | 46,904,728 | |
Issued on reinvestment of distributions | | | — | | | | 18,391,829 | |
Redeemed | | | (112,467,304 | ) | | | (218,264,877 | ) |
| | | | | | | | |
Net increase (decrease) from capital share transactions | | | (93,259,666 | ) | | | (152,968,320 | ) |
| | | | | | | | |
Net Increase (Decrease) in Net Assets | | | 123,005,550 | | | | 206,569,506 | |
| | | | | | | | |
Net Assets: | |
Beginning of period | | | 1,509,445,263 | | | | 1,302,875,757 | |
| | | | | | | | |
End of period | | $ | 1,632,450,813 | | | $ | 1,509,445,263 | |
| | | | | | | | |
Undistributed (distributions in excess of) net investment income | | $ | (2,447,104 | ) | | $ | (1,183,092 | ) |
| | | | | | | | |
The accompanying notes are an integral part of these financial statements.
Statements of Changes in Net Assets – (continued)
| | | | | | | | | | | | | | | | | | | | | | | | | | | | | | |
Hartford Healthcare
HLS Fund | | | Hartford High Yield
HLS Fund | | | Hartford International Opportunities
HLS Fund | | | Hartford MidCap
HLS Fund | |
For the
Six-Month
Period Ended
June 30, 2018
(Unaudited) | | | For the
Year Ended
December 31,
2017 | | | For the
Six-Month
Period Ended
June 30, 2018
(Unaudited) | | | For the
Year Ended
December 31,
2017 | | | For the
Six-Month
Period Ended
June 30, 2018
(Unaudited) | | | For the
Year Ended
December 31,
2017 | | | For the
Six-Month
Period Ended
June 30, 2018
(Unaudited) | | | For the
Year Ended
December 31,
2017 | |
| | | | | | | | | | | | | | | | | | | | | | | | | | | | | | |
| $ | 1,426 | | | $ | 21,704 | | | $ | 7,623,218 | | | $ | 16,752,837 | | | $ | 16,805,070 | | | $ | 20,447,179 | | | $ | (508,394 | ) | | $ | 161,392 | |
| | 12,947,117 | | | | 20,678,238 | | | | 2,012,509 | | | | 5,132,805 | | | | 85,124,038 | | | | 112,396,083 | | | | 137,870,721 | | | | 232,241,276 | |
| | 5,430,706 | | | | 42,617,943 | | | | (11,224,138 | ) | | | 769,720 | | | | (154,061,036 | ) | | | 178,814,146 | | | | 28,155,144 | | | | 210,733,817 | |
| | | | | | | | | | | | | | | | | | | | | | | | | | | | | | |
| | 18,379,249 | | | | 63,317,885 | | | | (1,588,411 | ) | | | 22,655,362 | | | | (52,131,928 | ) | | | 311,657,408 | | | | 165,517,471 | | | | 443,136,485 | |
| | | | | | | | | | | | | | | | | | | | | | | | | | | | | | |
| | | | | | | | | | | | | | | | | | | | | | | | | | | | | | |
| | | | | | | | | | | | | | | | | | | | | | | | | | | | | | |
| | — | | | | (3,196 | ) | | | — | | | | (14,107,895 | ) | | | — | | | | (19,083,304 | ) | | | — | | | | — | |
| | — | | | | — | | | | — | | | | (4,345,488 | ) | | | — | | | | (1,824,269 | ) | | | — | | | | — | |
| | | | | | | | | | | | | | | | | | | | | | | | | | | | | | |
| | — | | | | (3,196 | ) | | | — | | | | (18,453,383 | ) | | | — | | | | (20,907,573 | ) | | | — | | | | — | |
| | | | | | | | | | | | | | | | | | | | | | | | | | | | | | |
| | | | | | | | | | | | | | | | | | | | | | | | | | | | | | |
| | — | | | | (42,554,097 | ) | | | — | | | | — | | | | — | | | | — | | | | — | | | | (94,658,887 | ) |
| | — | | | | (7,184,474 | ) | | | — | | | | — | | | | — | | | | — | | | | — | | | | (5,084,893 | ) |
| | — | | | | — | | | | — | | | | — | | | | — | | | | — | | | | — | | | | — | |
| | | | | | | | | | | | | | | | | | | | | | | | | | | | | | |
| | — | | | | (49,738,571 | ) | | | — | | | | — | | | | — | | | | — | | | | — | | | | (99,743,780 | ) |
| | | | | | | | | | | | | | | | | | | | | | | | | | | | | | |
| | — | | | | (49,741,767 | ) | | | — | | | | (18,453,383 | ) | | | — | | | | (20,907,573 | ) | | | — | | | | (99,743,780 | ) |
| | | | | | | | | | | | | | | | | | | | | | | | | | | | | | |
| | | | | | | | | | | | | | | | | | | | | | | | | | | | | | |
| | 14,196,797 | | | | 47,830,448 | | | | 6,963,598 | | | | 16,051,926 | | | | 88,073,095 | | | | 238,539,464 | | | | 166,686,705 | | | | 371,154,622 | |
| | — | | | | 49,741,767 | | | | — | | | | 18,453,383 | | | | — | | | | 20,907,573 | | | | — | | | | 99,743,781 | |
| | (39,876,168 | ) | | | (66,393,210 | ) | | | (29,942,198 | ) | | | (59,002,412 | ) | | | (161,410,808 | ) | | | (203,781,844 | ) | | | (248,289,309 | ) | | | (413,993,325 | ) |
| | | | | | | | | | | | | | | | | | | | | | | | | | | | | | |
| | (25,679,371 | ) | | | 31,179,005 | | | | (22,978,600 | ) | | | (24,497,103 | ) | | | (73,337,713 | ) | | | 55,665,193 | | | | (81,602,604 | ) | | | 56,905,078 | |
| | | | | | | | | | | | | | | | | | | | | | | | | | | | | | |
| | (7,300,122 | ) | | | 44,755,123 | | | | (24,567,011 | ) | | | (20,295,124 | ) | | | (125,469,641 | ) | | | 346,415,028 | | | | 83,914,867 | | | | 400,297,783 | |
| | | | | | | | | | | | | | | | | | | | | | | | | | | | | | |
| | | | | | | | | | | | | | | | | | | | | | | | | | | | | | |
| | 335,398,201 | | | | 290,643,078 | | | | 301,489,870 | | | | 321,784,994 | | | | 1,580,520,220 | | | | 1,234,105,192 | | | | 2,214,894,041 | | | | 1,814,596,258 | |
| | | | | | | | | | | | | | | | | | | | | | | | | | | | | | |
| $ | 328,098,079 | | | $ | 335,398,201 | | | $ | 276,922,859 | | | $ | 301,489,870 | | | $ | 1,455,050,579 | | | $ | 1,580,520,220 | | | $ | 2,298,808,908 | | | $ | 2,214,894,041 | |
| | | | | | | | | | | | | | | | | | | | | | | | | | | | | | |
| $ | (134,175 | ) | | $ | (135,601 | ) | | $ | 24,118,870 | | | $ | 16,495,652 | | | $ | 43,790,722 | | | $ | 26,985,652 | | | $ | (709,631 | ) | | $ | (201,237 | ) |
| | | | | | | | | | | | | | | | | | | | | | | | | | | | | | |
The accompanying notes are an integral part of these financial statements.
Statements of Changes in Net Assets – (continued)
| | | | | | | | |
| | | Hartford MidCap Value
HLS Fund | |
| | | For the
Six-Month
Period Ended
June 30, 2018
(Unaudited) | | | For the
Year Ended
December 31,
2017
| |
Operations: | |
Net investment income (loss) | | $ | 984,563 | | | $ | 1,239,709 | |
Net realized gain (loss) on investments and foreign currency transactions | | | 30,014,371 | | | | 23,401,263 | |
Net changes in unrealized appreciation (depreciation) of investments and foreign currency transactions | | | (28,304,251 | ) | | | 22,239,620 | |
| | | | | | | | |
Net Increase (Decrease) in Net Assets Resulting from Operations | | | 2,694,683 | | | | 46,880,592 | |
| | | | | | | | |
Distributions to Shareholders: | |
From net investment income | |
Class IA | | | — | | | | (1,563,056 | ) |
Class IB | | | — | | | | (264,904 | ) |
| | | | | | | | |
Total from net investment income | | | — | | | | (1,827,960 | ) |
| | | | | | | | |
From net realized gain on investments | |
Class IA | | | — | | | | (18,745,883 | ) |
Class IB | | | — | | | | (5,766,845 | ) |
| | | | | | | | |
Total from net realized gain on investments | | | — | | | | (24,512,728 | ) |
| | | | | | | | |
Total distributions | | | — | | | | (26,340,688 | ) |
| | | | | | | | |
Capital Share Transactions: | |
Sold | | | 1,135,172 | | | | 6,974,933 | |
Issued on reinvestment of distributions | | | — | | | | 26,340,688 | |
Redeemed | | | (26,729,351 | ) | | | (58,594,091 | ) |
| | | | | | | | |
Net (decrease) from capital share transactions | | | (25,594,179 | ) | | | (25,278,470 | ) |
| | | | | | | | |
Net Increase (Decrease) in Net Assets | | | (22,899,496 | ) | | | (4,738,566 | ) |
| | | | | | | | |
Net Assets: | |
Beginning of period | | | 374,837,470 | | | | 379,576,036 | |
| | | | | | | | |
End of period | | $ | 351,937,974 | | | $ | 374,837,470 | |
| | | | | | | | |
Undistributed (distributions in excess of) net investment income | | $ | 2,222,149 | | | $ | 1,237,586 | |
| | | | | | | | |
The accompanying notes are an integral part of these financial statements.
Statements of Changes in Net Assets – (continued)
| | | | | | | | | | | | | | | | | | | | | | | | | | | | | | |
Hartford Small Cap Growth
HLS Fund | | | Hartford Small Company
HLS Fund | | | Hartford Small/Mid Cap Equity
HLS Fund | | | Hartford Stock
HLS Fund | |
For the
Six-Month
Period Ended
June 30, 2018
(Unaudited) | | | For the
Year Ended
December 31,
2017
| | | For the
Six-Month
Period Ended
June 30, 2018
(Unaudited) | | | For the
Year Ended
December 31,
2017
| | | For the
Six-Month
Period Ended
June 30, 2018
(Unaudited) | | | For the
Year Ended
December 31,
2017
| | | For the
Six-Month
Period Ended
June 30, 2018
(Unaudited) | | | For the
Year Ended
December 31,
2017
| |
| | | | | | | | | | | | | | | | | | | | | | | | | | | | | | |
| $ | 240,506 | | | $ | (1,454,879 | ) | | $ | (1,177,871 | ) | | $ | (2,511,265 | ) | | $ | 428,358 | | | $ | 857,365 | | | $ | 11,236,180 | | | $ | 25,878,193 | |
| | 138,113,835 | | | | 99,838,478 | | | | 73,998,905 | | | | 136,468,650 | | | | 8,783,808 | | | | 8,513,724 | | | | 67,132,340 | | | | 127,954,070 | |
| | (24,481,364 | ) | | | 137,585,826 | | | | 2,539,613 | | | | 35,311,309 | | | | (5,456,872 | ) | | | 3,773,225 | | | | (49,890,746 | ) | | | 115,361,860 | |
| | | | | | | | | | | | | | | | | | | | | | | | | | | | | | |
| | 113,872,977 | | | | 235,969,425 | | | | 75,360,647 | | | | 169,268,694 | | | | 3,755,294 | | | | 13,144,314 | | | | 28,477,774 | | | | 269,194,123 | |
| | | | | | | | | | | | | | | | | | | | | | | | | | | | | | |
| | | | | | | | | | | | | | | | | | | | | | | | | | | | | | |
| | | | | | | | | | | | | | | | | | | | | | | | | | | | | | |
| | — | | | | (446,628 | ) | | | — | | | | — | | | | — | | | | (703,323 | ) | | | — | | | | (23,707,000 | ) |
| | — | | | | — | | | | — | | | | — | | | | — | | | | (87,957 | ) | | | — | | | | (2,111,519 | ) |
| | | | | | | | | | | | | | | | | | | | | | | | | | | | | | |
| | — | | | | (446,628 | ) | | | — | | | | — | | | | — | | | | (791,280 | ) | | | — | | | | (25,818,519 | ) |
| | | | | | | | | | | | | | | | | | | | | | | | | | | | | | |
| | | | | | | | | | | | | | | | | | | | | | | | | | | | | | |
| | — | | | | — | | | | — | | | | — | | | | — | | | | (2,584,547 | ) | | | — | | | | — | |
| | — | | | | — | | | | — | | | | — | | | | — | | | | (462,535 | ) | | | — | | | | — | |
| | | | | | | | | | | | | | | | | | | | | | | | | | | | | | |
| | — | | | | — | | | | — | | | | — | | | | — | | | | (3,047,082 | ) | | | — | | | | — | |
| | | | | | | | | | | | | | | | | | | | | | | | | | | | | | |
| | — | | | | (446,628 | ) | | | — | | | | — | | | | — | | | | (3,838,362 | ) | | | — | | | | (25,818,519 | ) |
| | | | | | | | | | | | | | | | | | | | | | | | | | | | | | |
| | | | | | | | | | | | | | | | | | | | | | | | | | | | | | |
| | 93,244,028 | | | | 341,821,699 | | | | 26,367,473 | | | | 35,844,453 | | | | 2,711,057 | | | | 6,228,487 | | | | 4,520,545 | | | | 7,902,822 | |
| | — | | | | 391,968 | | | | — | | | | — | | | | — | | | | 3,838,362 | | | | — | | | | 25,818,519 | |
| | (153,231,976 | ) | | | (441,836,449 | ) | | | (66,507,202 | ) | | | (504,062,833 | ) | | | (10,623,648 | ) | | | (25,253,892 | ) | | | (107,024,742 | ) | | | (208,424,356 | ) |
| | | | | | | | | | | | | | | | | | | | | | | | | | | | | | |
| | (59,987,948 | ) | | | (99,622,782 | ) | | | (40,139,729 | ) | | | (468,218,380 | ) | | | (7,912,591 | ) | | | (15,187,043 | ) | | | (102,504,197 | ) | | | (174,703,015 | ) |
| | | | | | | | | | | | | | | | | | | | | | | | | | | | | | |
| | 53,885,029 | | | | 135,900,015 | | | | 35,220,918 | | | | (298,949,686 | ) | | | (4,157,297 | ) | | | (5,881,091 | ) | | | (74,026,423 | ) | | | 68,672,589 | |
| | | | | | | | | | | | | | | | | | | | | | | | | | | | | | |
| | | | | | | | | | | | | | | | | | | | | | | | | | | | | | |
| | 1,335,032,322 | | | | 1,199,132,307 | | | | 608,202,728 | | | | 907,152,414 | | | | 98,995,737 | | | | 104,876,828 | | | | 1,521,615,876 | | | | 1,452,943,287 | |
| | | | | | | | | | | | | | | | | | | | | | | | | | | | | | |
| $ | 1,388,917,351 | | | $ | 1,335,032,322 | | | $ | 643,423,646 | | | $ | 608,202,728 | | | $ | 94,838,440 | | | $ | 98,995,737 | | | $ | 1,447,589,453 | | | $ | 1,521,615,876 | |
| | | | | | | | | | | | | | | | | | | | | | | | | | | | | | |
| $ | 240,506 | | | $ | — | | | $ | (1,177,871 | ) | | $ | — | | | $ | 1,351,360 | | | $ | 923,002 | | | $ | 12,129,651 | | | $ | 893,471 | |
| | | | | | | | | | | | | | | | | | | | | | | | | | | | | | |
The accompanying notes are an integral part of these financial statements.
Statements of Changes in Net Assets – (continued)
| | | | | | | | |
| | | Hartford Total Return Bond
HLS Fund | |
| | | For the
Six-Month
Period Ended
June 30, 2018
(Unaudited) | | | For the
Year Ended
December 31,
2017
| |
Operations: | | | | | | | | |
Net investment income (loss) | | $ | 36,073,077 | | | $ | 72,397,790 | |
Net realized gain (loss) on investments, other financial instruments and foreign currency transactions | | | (24,188,128 | ) | | | 46,924,738 | |
Net changes in unrealized appreciation (depreciation) of investments, other financial instruments and foreign currency transactions | | | (47,421,747 | ) | | | 3,063,744 | |
| | | | | | | | |
Net Increase (Decrease) in Net Assets Resulting from Operations | | | (35,536,798 | ) | | | 122,386,272 | |
| | | | | | | | |
Distributions to Shareholders: | | | | | | | | |
From net investment income | | | | | | | | |
Class IA | | | — | | | | (64,104,099 | ) |
Class IB | | | — | | | | (6,840,084 | ) |
| | | | | | | | |
Total from net investment income | | | — | | | | (70,944,183 | ) |
| | | | | | | | |
From net realized gain on investments | | | | | | | | |
Class IA | | | — | | | | — | |
Class IB | | | — | | | | — | |
| | | | | | | | |
Total from net realized gain on investments | | | — | | | | — | |
| | | | | | | | |
Total distributions | | | — | | | | (70,944,183 | ) |
| | | | | | | | |
Capital Share Transactions: | | | | | | | | |
Sold | | | 51,266,658 | | | | 133,249,068 | |
Issued on reinvestment of distributions | | | — | | | | 70,944,183 | |
Redeemed | | | (191,494,657 | ) | | | (356,036,471 | ) |
| | | | | | | | |
Net (decrease) from capital share transactions | | | (140,227,999 | ) | | | (151,843,220 | ) |
| | | | | | | | |
Net Increase (Decrease) in Net Assets | | | (175,764,797 | ) | | | (100,401,131 | ) |
| | | | | | | | |
Net Assets: | | | | | | | | |
Beginning of period | | | 2,406,291,227 | | | | 2,506,692,358 | |
| | | | | | | | |
End of period | | $ | 2,230,526,430 | | | $ | 2,406,291,227 | |
| | | | | | | | |
Undistributed (distributions in excess of) net investment income | | $ | 125,535,139 | | | $ | 89,462,062 | |
| | | | | | | | |
The accompanying notes are an integral part of these financial statements.
Statements of Changes in Net Assets – (continued)
| | | | | | | | | | | | | | | | | | | | | | |
Hartford Ultrashort Bond
HLS Fund | | | Hartford U.S. Government
Securities HLS Fund | | | Hartford Value
HLS Fund | |
For the
Six-Month
Period Ended
June 30, 2018
(Unaudited) | | | For the
Year Ended
December 31,
2017 | | | For the
Six-Month
Period Ended
June 30, 2018
(Unaudited) | | | For the
Year Ended
December 31,
2017 | | | For the
Six-Month
Period Ended
June 30, 2018
(Unaudited) | | | For the
Year Ended
December 31,
2017 | |
| | | | | | | | | | | | | | | | | | | | | | |
| $ | 3,815,203 | | | $ | 5,426,975 | | | $ | 3,915,396 | | | $ | 7,433,049 | | | $ | 4,495,842 | | | $ | 7,919,163 | |
| | (9,235 | ) | | | 110,447 | | | | (3,765,683 | ) | | | (2,529,210 | ) | | | 19,348,005 | | | | 43,232,153 | |
| | (723,944 | ) | | | (117,494 | ) | | | (2,423,967 | ) | | | 749,426 | | | | (29,475,907 | ) | | | 23,121,521 | |
| | | | | | | | | | | | | | | | | | | | | | |
| | 3,082,024 | | | | 5,419,928 | | | | (2,274,254 | ) | | | 5,653,265 | | | | (5,632,060 | ) | | | 74,272,837 | |
| | | | | | | | | | | | | | | | | | | | | | |
| | | | | | | | | | | | | | | | | | | | | | |
| | | | | | | | | | | | | | | | | | | | | | |
| | — | | | | (3,863,181 | ) | | | — | | | | (7,516,833 | ) | | | — | | | | (7,642,825 | ) |
| | — | | | | (353,222 | ) | | | — | | | | (1,395,249 | ) | | | — | | | | (1,096,859 | ) |
| | | | | | | | | | | | | | | | | | | | | | |
| | — | | | | (4,216,403 | ) | | | — | | | | (8,912,082 | ) | | | — | | | | (8,739,684 | ) |
| | | | | | | | | | | | | | | | | | | | | | |
| | | | | | | | | | | | | | | | | | | | | | |
| | — | | | | — | | | | — | | | | — | | | | — | | | | (31,542,050 | ) |
| | — | | | | — | | | | — | | | | — | | | | — | | | | (5,401,252 | ) |
| | | | | | | | | | | | | | | | | | | | | | |
| | — | | | | — | | | | — | | | | — | | | | — | | | | (36,943,302 | ) |
| | | | | | | | | | | | | | | | | | | | | | |
| | — | | | | (4,216,403 | ) | | | — | | | | (8,912,082 | ) | | | — | | | | (45,682,986 | ) |
| | | | | | | | | | | | | | | | | | | | | | |
| | | | | | | | | | | | | | | | | | | | | | |
| | 29,572,478 | | | | 40,599,916 | | | | 10,000,095 | | | | 25,399,365 | | | | 6,391,936 | | | | 12,186,616 | |
| | — | | | | 4,216,403 | | | | — | | | | 8,912,083 | | | | — | | | | 45,682,987 | |
| | (55,366,916 | ) | | | (131,702,061 | ) | | | (38,765,425 | ) | | | (79,206,757 | ) | | | (43,271,750 | ) | | | (84,180,318 | ) |
| | | | | | | | | | | | | | | | | | | | | | |
| | (25,794,438 | ) | | | (86,885,742 | ) | | | (28,765,330 | ) | | | (44,895,309 | ) | | | (36,879,814 | ) | | | (26,310,715 | ) |
| | | | | | | | | | | | | | | | | | | | | | |
| | (22,712,414 | ) | | | (85,682,217 | ) | | | (31,039,584 | ) | | | (48,154,126 | ) | | | (42,511,874 | ) | | | 2,279,136 | |
| | | | | | | | | | | | | | | | | | | | | | |
| | | | | | | | | | | | | | | | | | | | | | |
| | 526,067,080 | | | | 611,749,297 | | | | 400,074,001 | | | | 448,228,127 | | | | 526,485,809 | | | | 524,206,673 | |
| | | | | | | | | | | | | | | | | | | | | | |
| $ | 503,354,666 | | | $ | 526,067,080 | | | $ | 369,034,417 | | | $ | 400,074,001 | | | $ | 483,973,935 | | | $ | 526,485,809 | |
| | | | | | | | | | | | | | | | | | | | | | |
| $ | 9,369,878 | | | $ | 5,554,675 | | | $ | 12,335,704 | | | $ | 8,420,308 | | | $ | 4,495,842 | | | $ | — | |
| | | | | | | | | | | | | | | | | | | | | | |
The accompanying notes are an integral part of these financial statements.
Financial Highlights
| | | | | | | | | | | | | | | | | | | | | | | | | | | | | | | | | | | | | | | | | | | | | | | | | | | | | | | | |
| | | — Selected Per-Share Data(1) — | | | — Ratios and Supplemental Data — | |
Class | | Net Asset
Value at
Beginning
of Period | | | Net
Investment
Income
(Loss) | | | Net
Realized
and
Unrealized
Gain (Loss)
on
Investments | | | Total from
Investment
Operations | | | Dividends
from Net
Investment
Income | | | Distributions
from
Capital
Gains | | | Total
Dividends
and
Distributions | | | Net
Asset
Value at
End of
Period | | | Total
Return(2) | | | Net
Assets at
End of
Period
(000s) | | | Ratio of
Expenses
to
Average
Net
Assets
Before
Adjust-
ments(3) | | | Ratio of
Expenses
to
Average
Net
Assets
After
Adjust-
ments(3) | | | Ratio of
Net
Investment
Income
(Loss) to
Average
Net Assets | | | Portfolio
Turnover | |
| Hartford Balanced HLS Fund | |
For the Six-Month Period Ended June 30, 2018 (Unaudited) | |
IA | | $ | 31.02 | | | $ | 0.31 | | | $ | (0.24 | ) | | $ | 0.07 | | | $ | — | | | $ | — | | | $ | — | | | $ | 31.09 | | | | 0.23 | %(4) | | $ | 1,950,595 | | | | 0.66 | %(5) | | | 0.63 | %(5) | | | 2.01 | %(5) | | | 15 | % |
IB | | | 31.48 | | | | 0.28 | | | | (0.25 | ) | | | 0.03 | | | | — | | | | — | | | | — | | | | 31.51 | | | | 0.10 | (4) | | | 260,468 | | | | 0.91 | (5) | | | 0.88 | (5) | | | 1.76 | (5) | | | 15 | |
|
For the Year Ended December 31, 2017 | |
IA | | $ | 27.46 | | | $ | 0.55 | | | $ | 3.72 | | | $ | 4.27 | | | $ | (0.71 | ) | | $ | — | | | $ | (0.71 | ) | | $ | 31.02 | | | | 15.59 | % | | $ | 2,095,246 | | | | 0.66 | % | | | 0.63 | % | | | 1.86 | % | | | 26 | % |
IB | | | 27.86 | | | | 0.48 | | | | 3.77 | | | | 4.25 | | | | (0.63 | ) | | | — | | | | (0.63 | ) | | | 31.48 | | | | 15.30 | | | | 277,735 | | | | 0.91 | | | | 0.88 | | | | 1.61 | | | | 26 | |
|
For the Year Ended December 31, 2016 | |
IA | | $ | 26.62 | | | $ | 0.56 | | | $ | 1.05 | | | $ | 1.61 | | | $ | (0.77 | ) | | $ | — | | | $ | (0.77 | ) | | $ | 27.46 | | | | 6.04 | % | | $ | 2,043,556 | | | | 0.66 | % | | | 0.64 | % | | | 2.05 | % | | | 25 | % |
IB | | | 26.99 | | | | 0.50 | | | | 1.07 | | | | 1.57 | | | | (0.70 | ) | | | — | | | | (0.70 | ) | | | 27.86 | | | | 5.79 | | | | 275,925 | | | | 0.91 | | | | 0.89 | | | | 1.80 | | | | 25 | |
|
For the Year Ended December 31, 2015 | |
IA | | $ | 27.09 | | | $ | 0.51 | | | $ | (0.46 | ) | | $ | 0.05 | | | $ | (0.52 | ) | | $ | — | | | $ | (0.52 | ) | | $ | 26.62 | | | | 0.18 | % | | $ | 2,210,938 | | | | 0.65 | % | | | 0.63 | % | | | 1.87 | % | | | 18 | % |
IB | | | 27.45 | | | | 0.45 | | | | (0.47 | ) | | | (0.02 | ) | | | (0.44 | ) | | | — | | | | (0.44 | ) | | | 26.99 | | | | (0.07 | ) | | | 300,945 | | | | 0.90 | | | | 0.88 | | | | 1.62 | | | | 18 | |
|
For the Year Ended December 31, 2014 | |
IA | | $ | 25.11 | | | $ | 0.45 | | | $ | 2.01 | | | $ | 2.46 | | | $ | (0.48 | ) | | $ | — | | | $ | (0.48 | ) | | $ | 27.09 | | | | 9.79 | % | | $ | 2,561,814 | | | | 0.65 | % | | | 0.65 | % | | | 1.73 | % | | | 29 | % |
IB | | | 25.44 | | | | 0.39 | | | | 2.03 | | | | 2.42 | | | | (0.41 | ) | | | — | | | | (0.41 | ) | | | 27.45 | | | | 9.51 | | | | 362,210 | | | | 0.90 | | | | 0.90 | | | | 1.49 | | | | 29 | |
|
For the Year Ended December 31, 2013 | |
IA | | $ | 21.03 | | | $ | 0.41 | | | $ | 4.04 | | | $ | 4.45 | | | $ | (0.37 | ) | | $ | — | | | $ | (0.37 | ) | | $ | 25.11 | | | | 21.19 | % | | $ | 2,782,698 | | | | 0.65 | % | | | 0.65 | % | | | 1.75 | % | | | 31 | % |
IB | | | 21.30 | | | | 0.35 | | | | 4.10 | | | | 4.45 | | | | (0.31 | ) | | | — | | | | (0.31 | ) | | | 25.44 | | | | 20.88 | | | | 399,681 | | | | 0.90 | | | | 0.90 | | | | 1.50 | | | | 31 | |
|
| Hartford Capital Appreciation HLS Fund | |
For the Six-Month Period Ended June 30, 2018 (Unaudited) | |
IA | | $ | 48.16 | | | $ | 0.25 | | | $ | 1.32 | | | $ | 1.57 | | | $ | — | | | $ | — | | | $ | — | | | $ | 49.73 | | | | 3.26 | %(4) | | $ | 4,225,369 | | | | 0.68 | %(5) | | | 0.68 | %(5) | | | 1.04 | %(5) | | | 47 | % |
IB | | | 47.48 | | | | 0.19 | | | | 1.30 | | | | 1.49 | | | | — | | | | — | | | | — | | | | 48.97 | | | | 3.14 | (4) | | | 519,647 | | | | 0.93 | (5) | | | 0.93 | (5) | | | 0.78 | (5) | | | 47 | |
IC | | | 47.76 | | | | 0.13 | | | | 1.31 | | | | 1.44 | | | | — | | | | — | | | | — | | | | 49.20 | | | | 3.02 | (4) | | | 30,449 | | | | 1.18 | (5) | | | 1.18 | (4) | | | 0.54 | (5) | | | 47 | |
|
For the Year Ended December 31, 2017 | |
IA | | $ | 42.05 | | | $ | 0.43 | | | $ | 8.83 | | | $ | 9.26 | | | $ | (0.54 | ) | | $ | (2.61 | ) | | $ | (3.15 | ) | | $ | 48.16 | | | | 22.14 | % | | $ | 4,457,603 | | | | 0.68 | % | | | 0.68 | % | | | 0.91 | % | | | 75 | % |
IB | | | 41.50 | | | | 0.30 | | | | 8.70 | | | | 9.00 | | | | (0.41 | ) | | | (2.61 | ) | | | (3.02 | ) | | | 47.48 | | | | 21.82 | | | | 569,615 | | | | 0.93 | | | | 0.93 | | | | 0.66 | | | | 75 | |
IC | | | 41.76 | | | | 0.19 | | | | 8.74 | | | | 8.93 | | | | (0.32 | ) | | | (2.61 | ) | | | (2.93 | ) | | | 47.76 | | | | 21.50 | | | | 29,979 | | | | 1.18 | | | | 1.18 | | | | 0.41 | | | | 75 | |
|
For the Year Ended December 31, 2016 | |
IA | | $ | 44.44 | | | $ | 0.41 | | | $ | 1.94 | | | $ | 2.35 | | | $ | (0.47 | ) | | $ | (4.27 | ) | | $ | (4.74 | ) | | $ | 42.05 | | | | 5.52 | % | | $ | 4,555,454 | | | | 0.68 | % | | | 0.68 | % | | | 0.97 | % | | | 103 | % |
IB | | | 43.93 | | | | 0.30 | | | | 1.90 | | | | 2.20 | | | | (0.36 | ) | | | (4.27 | ) | | | (4.63 | ) | | | 41.50 | | | | 5.24 | | | | 558,022 | | | | 0.93 | | | | 0.93 | | | | 0.72 | | | | 103 | |
IC | | | 44.21 | | | | 0.19 | | | | 1.92 | | | | 2.11 | | | | (0.29 | ) | | | (4.27 | ) | | | (4.56 | ) | | | 41.76 | | | | 4.99 | | | | 21,579 | | | | 1.18 | | | | 1.18 | | | | 0.46 | | | | 103 | |
|
For the Year Ended December 31, 2015 | |
IA | | $ | 54.71 | | | $ | 0.43 | | | $ | 0.38 | | | $ | 0.81 | | | $ | (0.43 | ) | | $ | (10.65 | ) | | $ | (11.08 | ) | | $ | 44.44 | | | | 1.02 | % | | $ | 5,701,269 | | | | 0.67 | % | | | 0.67 | % | | | 0.84 | % | | | 75 | % |
IB | | | 54.20 | | | | 0.30 | | | | 0.39 | | | | 0.69 | | | | (0.31 | ) | | | (10.65 | ) | | | (10.96 | ) | | | 43.93 | | | | 0.79 | | | | 641,548 | | | | 0.92 | | | | 0.92 | | | | 0.59 | | | | 75 | |
IC | | | 54.59 | | | | 0.17 | | | | 0.39 | | | | 0.56 | | | | (0.29 | ) | | | (10.65 | ) | | | (10.94 | ) | | | 44.21 | | | | 0.53 | | | | 16,215 | | | | 1.17 | | | | 1.17 | | | | 0.34 | | | | 75 | |
|
For the Year Ended December 31, 2014 | |
IA | | $ | 59.65 | | | $ | 0.56 | | | $ | 3.81 | | | $ | 4.37 | | | $ | (0.50 | ) | | $ | (8.81 | ) | | $ | (9.31 | ) | | $ | 54.71 | | | | 7.31 | % | | $ | 6,470,599 | | | | 0.66 | % | | | 0.66 | % | | | 0.96 | % | | | 89 | % |
IB | | | 59.18 | | | | 0.42 | | | | 3.77 | | | | 4.19 | | | | (0.36 | ) | | | (8.81 | ) | | | (9.17 | ) | | | 54.20 | | | | 7.04 | | | | 764,541 | | | | 0.91 | | | | 0.91 | | | | 0.72 | | | | 89 | |
IC(6) | | | 60.21 | | | | 0.09 | | | | 3.53 | | | | 3.62 | | | | (0.43 | ) | | | (8.81 | ) | | | (9.24 | ) | | | 54.59 | | | | 5.97 | (4) | | | 3,453 | | | | 1.16 | (5) | | | 1.16 | (5) | | | 0.23 | (5) | | | 89 | |
|
For the Year Ended December 31, 2013 | |
IA | | $ | 43.37 | | | $ | 0.45 | | | $ | 16.49 | | | $ | 16.94 | | | $ | (0.51 | ) | | $ | (0.15 | ) | | $ | (0.66 | ) | | $ | 59.65 | | | | 39.08 | % | | $ | 7,029,201 | | | | 0.67 | % | | | 0.67 | % | | | 0.88 | % | | | 86 | % |
IB | | | 43.05 | | | | 0.32 | | | | 16.33 | | | | 16.65 | | | | (0.37 | ) | | | (0.15 | ) | | | (0.52 | ) | | | 59.18 | | | | 38.72 | | | | 969,611 | | | | 0.92 | | | | 0.92 | | | | 0.63 | | | | 86 | |
The accompanying notes are an integral part of these financial statements.
Financial Highlights – (continued)
| | | | | | | | | | | | | | | | | | | | | | | | | | | | | | | | | | | | | | | | | | | | | | | | | | | | | | | | |
| | | — Selected Per-Share Data(1) — | | | — Ratios and Supplemental Data — | |
Class | | Net Asset
Value at
Beginning
of Period | | | Net
Investment
Income
(Loss) | | | Net
Realized
and
Unrealized
Gain (Loss)
on
Investments | | | Total from
Investment
Operations | | | Dividends
from Net
Investment
Income | | | Distributions
from
Capital
Gains | | | Total
Dividends
and
Distributions | | | Net
Asset
Value at
End of
Period | | | Total
Return(2) | | | Net
Assets at
End of
Period
(000s) | | | Ratio of
Expenses
to
Average
Net
Assets
Before
Adjust-
ments(3) | | | Ratio of
Expenses
to
Average
Net
Assets
After
Adjust-
ments(3) | | | Ratio of
Net
Investment
Income
(Loss) to
Average
Net Assets | | | Portfolio
Turnover | |
| Hartford Disciplined Equity HLS Fund | |
For the Six-Month Period Ended June 30, 2018 (Unaudited) | |
IA | | $ | 15.43 | | | $ | 0.05 | | | $ | 0.52 | | | $ | 0.57 | | | $ | — | | | $ | — | | | $ | — | | | $ | 16.00 | | | | 3.69 | %(4) | | $ | 582,370 | | | | 0.78 | %(5) | | | 0.78 | %(5) | | | 0.67 | %(5) | | | 13 | % |
IB | | | 15.27 | | | | 0.03 | | | | 0.52 | | | | 0.55 | | | | — | | | | — | | | | — | | | | 15.82 | | | | 3.60 | (4) | | | 80,163 | | | | 1.03 | (5) | | | 1.03 | (5) | | | 0.42 | (5) | | | 13 | |
|
For the Year Ended December 31, 2017 | |
IA | | $ | 14.30 | | | $ | 0.15 | | | $ | 2.83 | | | $ | 2.98 | | | $ | (0.14 | ) | | $ | (1.71 | ) | | $ | (1.85 | ) | | $ | 15.43 | | | | 21.92 | % | | $ | 613,037 | | | | 0.78 | % | | | 0.78 | % | | | 1.00 | % | | | 30 | % |
IB | | | 14.17 | | | | 0.11 | | | | 2.80 | | | | 2.91 | | | | (0.10 | ) | | | (1.71 | ) | | | (1.81 | ) | | | 15.27 | | | | 21.63 | | | | 84,377 | | | | 1.03 | | | | 1.03 | | | | 0.76 | | | | 30 | |
|
For the Year Ended December 31, 2016 | |
IA | | $ | 15.58 | | | $ | 0.11 | | | $ | 0.77 | | | $ | 0.88 | | | $ | (0.13 | ) | | $ | (2.03 | ) | | $ | (2.16 | ) | | $ | 14.30 | | | | 5.76 | % | | $ | 587,089 | | | | 0.79 | % | | | 0.79 | % | | | 0.76 | % | | | 33 | % |
IB | | | 15.46 | | | | 0.08 | | | | 0.75 | | | | 0.83 | | | | (0.09 | ) | | | (2.03 | ) | | | (2.12 | ) | | | 14.17 | | | | 5.49 | | | | 81,304 | | | | 1.04 | | | | 1.04 | | | | 0.51 | | | | 33 | |
|
For the Year Ended December 31, 2015 | |
IA | | $ | 20.99 | | | $ | 0.14 | | | $ | 1.41 | | | $ | 1.55 | | | $ | (0.13 | ) | | $ | (6.83 | ) | | $ | (6.96 | ) | | $ | 15.58 | | | | 6.83 | % | | $ | 648,747 | | | | 0.76 | % | | | 0.76 | % | | | 0.76 | % | | | 29 | % |
IB | | | 20.88 | | | | 0.10 | | | | 1.40 | | | | 1.50 | | | | (0.09 | ) | | | (6.83 | ) | | | (6.92 | ) | | | 15.46 | | | | 6.59 | | | | 91,844 | | | | 1.01 | | | | 1.01 | | | | 0.51 | | | | 29 | |
|
For the Year Ended December 31, 2014 | |
IA | | $ | 18.36 | | | $ | 0.14 | | | $ | 2.83 | | | $ | 2.97 | | | $ | (0.14 | ) | | $ | (0.20 | ) | | $ | (0.34 | ) | | $ | 20.99 | | | | 16.18 | % | | $ | 734,110 | | | | 0.75 | % | | | 0.75 | % | | | 0.73 | % | | | 63 | % |
IB | | | 18.27 | | | | 0.09 | | | | 2.81 | | | | 2.90 | | | | (0.09 | ) | | | (0.20 | ) | | | (0.29 | ) | | | 20.88 | | | | 15.87 | | | | 107,577 | | | | 1.00 | | | | 1.00 | | | | 0.47 | | | | 63 | |
|
For the Year Ended December 31, 2013 | |
IA | | $ | 13.64 | | | $ | 0.17 | | | $ | 4.72 | | | $ | 4.89 | | | $ | (0.17 | ) | | $ | — | | | $ | (0.17 | ) | | $ | 18.36 | | | | 35.82 | % | | $ | 811,099 | | | | 0.76 | % | | | 0.76 | % | | | 1.07 | % | | | 23 | % |
IB | | | 13.58 | | | | 0.13 | | | | 4.68 | | | | 4.81 | | | | (0.12 | ) | | | — | | | | (0.12 | ) | | | 18.27 | | | | 35.47 | | | | 118,598 | | | | 1.01 | | | | 1.01 | | | | 0.82 | | | | 23 | |
|
| Hartford Dividend and Growth HLS Fund | |
For the Six-Month Period Ended June 30, 2018 (Unaudited) | |
IA | | $ | 23.95 | | | $ | 0.22 | | | $ | (0.36 | ) | | $ | (0.14 | ) | | $ | — | | | $ | — | | | $ | — | | | $ | 23.81 | | | | (0.58 | )%(4) | | $ | 2,945,796 | | | | 0.68 | %(5) | | | 0.68 | %(5) | | | 1.85 | %(5) | | | 15 | % |
IB | | | 23.85 | | | | 0.19 | | | | (0.37 | ) | | | (0.18 | ) | | | — | | | | — | | | | — | | | | 23.67 | | | | (0.75 | )(4) | | | 405,733 | | | | 0.93 | (5) | | | 0.93 | (5) | | | 1.60 | (5) | | | 15 | |
|
For the Year Ended December 31, 2017 | |
IA | | $ | 22.10 | | | $ | 0.41 | | | $ | 3.48 | | | $ | 3.89 | | | $ | (0.38 | ) | | $ | (1.66 | ) | | $ | (2.04 | ) | | $ | 23.95 | | | | 18.36 | % | | $ | 3,179,540 | | | | 0.68 | % | | | 0.68 | % | | | 1.75 | % | | | 25 | % |
IB | | | 22.01 | | | | 0.35 | | | | 3.47 | | | | 3.82 | | | | (0.32 | ) | | | (1.66 | ) | | | (1.98 | ) | | | 23.85 | | | | 18.11 | | | | 440,111 | | | | 0.93 | | | | 0.93 | | | | 1.50 | | | | 25 | |
|
For the Year Ended December 31, 2016 | |
IA | | $ | 22.09 | | | $ | 0.43 | | | $ | 2.67 | | | $ | 3.10 | | | $ | (0.44 | ) | | $ | (2.65 | ) | | $ | (3.09 | ) | | $ | 22.10 | | | | 14.89 | % | | $ | 3,013,788 | | | | 0.69 | % | | | 0.69 | % | | | 1.98 | % | | | 20 | % |
IB | | | 22.02 | | | | 0.38 | | | | 2.65 | | | | 3.03 | | | | (0.39 | ) | | | (2.65 | ) | | | (3.04 | ) | | | 22.01 | | | | 14.58 | | | | 438,200 | | | | 0.94 | | | | 0.94 | | | | 1.73 | | | | 20 | |
|
For the Year Ended December 31, 2015 | |
IA | | $ | 26.45 | | | $ | 0.46 | | | $ | (0.70 | ) | | $ | (0.24 | ) | | $ | (0.43 | ) | | $ | (3.69 | ) | | $ | (4.12 | ) | | $ | 22.09 | | | | (1.16 | )% | | $ | 2,991,811 | | | | 0.67 | % | | | 0.67 | % | | | 1.84 | % | | | 20 | % |
IB | | | 26.38 | | | | 0.40 | | | | (0.70 | ) | | | (0.30 | ) | | | (0.37 | ) | | | (3.69 | ) | | | (4.06 | ) | | | 22.02 | | | | (1.41 | ) | | | 449,693 | | | | 0.92 | | | | 0.92 | | | | 1.59 | | | | 20 | |
|
For the Year Ended December 31, 2014 | |
IA | | $ | 27.05 | | | $ | 0.49 | | | $ | 2.92 | | | $ | 3.41 | | | $ | (0.49 | ) | | $ | (3.52 | ) | | $ | (4.01 | ) | | $ | 26.45 | | | | 12.96 | % | | $ | 3,502,492 | | | | 0.67 | % | | | 0.67 | % | | | 1.78 | % | | | 19 | % |
IB | | | 26.99 | | | | 0.42 | | | | 2.91 | | | | 3.33 | | | | (0.42 | ) | | | (3.52 | ) | | | (3.94 | ) | | | 26.38 | | | | 12.68 | | | | 546,006 | | | | 0.92 | | | | 0.92 | | | | 1.53 | | | | 19 | |
|
For the Year Ended December 31, 2013 | |
IA | | $ | 21.46 | | | $ | 0.46 | | | $ | 6.33 | | | $ | 6.79 | | | $ | (0.51 | ) | | $ | (0.69 | ) | | $ | (1.20 | ) | | $ | 27.05 | | | | 31.92 | % | | $ | 3,760,183 | | | | 0.67 | % | | | 0.67 | % | | | 1.88 | % | | | 25 | % |
IB | | | 21.42 | | | | 0.40 | | | | 6.31 | | | | 6.71 | | | | (0.45 | ) | | | (0.69 | ) | | | (1.14 | ) | | | 26.99 | | | | 31.58 | | | | 621,751 | | | | 0.92 | | | | 0.92 | | | | 1.62 | | | | 25 | |
The accompanying notes are an integral part of these financial statements.
Financial Highlights – (continued)
| | | | | | | | | | | | | | | | | | | | | | | | | | | | | | | | | | | | | | | | | | | | | | | | | | | | | | | | |
| | | — Selected Per-Share Data(1) — | | | — Ratios and Supplemental Data — | |
Class | | Net Asset
Value at
Beginning
of Period | | | Net
Investment
Income
(Loss) | | | Net
Realized
and
Unrealized
Gain (Loss)
on
Investments | | | Total from
Investment
Operations | | | Dividends
from Net
Investment
Income | | | Distributions
from
Capital
Gains | | | Total
Dividends
and
Distributions | | | Net
Asset
Value at
End of
Period | | | Total
Return(2) | | | Net
Assets at
End of
Period
(000s) | | | Ratio of
Expenses
to
Average
Net
Assets
Before
Adjust-
ments(3) | | | Ratio of
Expenses
to
Average
Net
Assets
After
Adjust-
ments(3) | | | Ratio of
Net
Investment
Income
(Loss) to
Average
Net Assets | | | Portfolio
Turnover | |
| Hartford Global Growth HLS Fund | |
For the Six-Month Period Ended June 30, 2018 (Unaudited) | |
IA | | $ | 27.89 | | | $ | 0.09 | | | $ | 2.11 | | | $ | 2.20 | | | $ | — | | | $ | — | | | $ | — | | | $ | 30.09 | | | | 7.89 | %(4) | | $ | 451,787 | | | | 0.80 | %(5) | | | 0.80 | %(5) | | | 0.60 | %(5) | | | 26 | % |
IB | | | 27.63 | | | | 0.05 | | | | 2.09 | | | | 2.14 | | | | — | | | | — | | | | — | | | | 29.77 | | | | 7.75 | (4) | | | 87,286 | | | | 1.05 | (5) | | | 1.05 | (5) | | | 0.35 | (5) | | | 26 | |
|
For the Year Ended December 31, 2017 | |
IA | | $ | 22.14 | | | $ | 0.14 | | | $ | 6.99 | | | $ | 7.13 | | | $ | (0.14 | ) | | $ | (1.24 | ) | | $ | (1.38 | ) | | $ | 27.89 | | | | 32.73 | % | | $ | 432,581 | | | | 0.81 | % | | | 0.81 | % | | | 0.56 | % | | | 58 | % |
IB | | | 21.95 | | | | 0.08 | | | | 6.91 | | | | 6.99 | | | | (0.07 | ) | | | (1.24 | ) | | | (1.31 | ) | | | 27.63 | | | | 32.37 | | | | 84,442 | | | | 1.06 | | | | 1.06 | | | | 0.31 | | | | 58 | |
|
For the Year Ended December 31, 2016 | |
IA | | $ | 24.39 | | | $ | 0.13 | | | $ | 0.40 | | | $ | 0.53 | | | $ | (0.17 | ) | | $ | (2.61 | ) | | $ | (2.78 | ) | | $ | 22.14 | | | | 1.95 | % | | $ | 347,375 | | | | 0.82 | % | | | 0.82 | % | | | 0.55 | % | | | 65 | % |
IB | | | 24.19 | | | | 0.07 | | | | 0.39 | | | | 0.46 | | | | (0.09 | ) | | | (2.61 | ) | | | (2.70 | ) | | | 21.95 | | | | 1.71 | | | | 72,531 | | | | 1.07 | | | | 1.07 | | | | 0.30 | | | | 65 | |
|
For the Year Ended December 31, 2015 | |
IA | | $ | 23.74 | | | $ | 0.15 | | | $ | 1.77 | | | $ | 1.92 | | | $ | (0.13 | ) | | $ | (1.14 | ) | | $ | (1.27 | ) | | $ | 24.39 | | | | 8.04 | % | | $ | 392,302 | | | | 0.81 | % | | | 0.81 | % | | | 0.62 | % | | | 67 | % |
IB | | | 23.56 | | | | 0.09 | | | | 1.75 | | | | 1.84 | | | | (0.07 | ) | | | (1.14 | ) | | | (1.21 | ) | | | 24.19 | | | | 7.76 | | | | 86,759 | | | | 1.06 | | | | 1.06 | | | | 0.38 | | | | 67 | |
|
For the Year Ended December 31, 2014 | |
IA | | $ | 22.33 | | | $ | 0.13 | | | $ | 1.39 | | | $ | 1.52 | | | $ | (0.11 | ) | | $ | — | | | $ | (0.11 | ) | | $ | 23.74 | | | | 6.79 | % | | $ | 388,542 | | | | 0.81 | % | | | 0.81 | % | | | 0.57 | % | | | 82 | %(7) |
IB | | | 22.16 | | | | 0.07 | | | | 1.39 | | | | 1.46 | | | | (0.06 | ) | | | — | | | | (0.06 | ) | | | 23.56 | | | | 6.58 | | | | 92,979 | | | | 1.06 | | | | 1.06 | | | | 0.30 | | | | 82 | (7) |
|
For the Year Ended December 31, 2013 | |
IA | | $ | 16.50 | | | $ | 0.11 | | | $ | 5.86 | | | $ | 5.97 | | | $ | (0.14 | ) | | $ | — | | | $ | (0.14 | ) | | $ | 22.33 | | | | 36.30 | % | | $ | 360,086 | | | | 0.82 | % | | | 0.82 | % | | | 0.56 | % | | | 71 | % |
IB | | | 16.38 | | | | 0.06 | | | | 5.81 | | | | 5.87 | | | | (0.09 | ) | | | — | | | | (0.09 | ) | | | 22.16 | | | | 35.90 | | | | 79,823 | | | | 1.07 | | | | 1.07 | | | | 0.32 | | | | 71 | |
|
| Hartford Growth Opportunities HLS Fund | |
For the Six-Month Period Ended June 30, 2018 (Unaudited) | |
IA | | $ | 38.42 | | | $ | (0.03 | ) | | $ | 5.70 | | | $ | 5.67 | | | $ | — | | | $ | — | | | $ | — | | | $ | 44.09 | | | | 14.76 | %(4) | | $ | 1,432,966 | | | | 0.65 | %(5) | | | 0.65 | %(5) | | | (0.13 | )%(5) | | | 60 | % |
IB | | | 36.91 | | | | (0.07 | ) | | | 5.47 | | | | 5.40 | | | | — | | | | — | | | | — | | | | 42.31 | | | | 14.63 | (4) | | | 160,793 | | | | 0.90 | (5) | | | 0.90 | (5) | | | (0.38 | )(5) | | | 60 | |
IC | | | 37.71 | | | | (0.13 | ) | | | 5.59 | | | | 5.46 | | | | — | | | | — | | | | — | | | | 43.17 | | | | 14.48 | (4) | | | 38,692 | | | | 1.15 | (5) | | | 1.15 | (5) | | | (0.62 | )(5) | | | 60 | |
|
For the Year Ended December 31, 2017 | |
IA | | $ | 29.83 | | | $ | (0.05 | ) | | $ | 9.09 | | | $ | 9.04 | | | $ | — | | | $ | (0.45 | ) | | $ | (0.45 | ) | | $ | 38.42 | | | | 30.45 | % | | $ | 1,326,201 | | | | 0.66 | % | | | 0.66 | % | | | (0.15 | )% | | | 99 | % |
IB | | | 28.74 | | | | (0.13 | ) | | | 8.75 | | | | 8.62 | | | | — | | | | (0.45 | ) | | | (0.45 | ) | | | 36.91 | | | | 30.14 | | | | 149,212 | | | | 0.91 | | | | 0.91 | | | | (0.40 | ) | | | 99 | |
IC | | | 29.43 | | | | (0.22 | ) | | | 8.95 | | | | 8.73 | | | | — | | | | (0.45 | ) | | | (0.45 | ) | | | 37.71 | | | | 29.80 | | | | 34,033 | | | | 1.16 | | | | 1.16 | | | | (0.65 | ) | | | 99 | |
|
For the Year Ended December 31, 2016 | |
IA | | $ | 34.86 | | | $ | (0.04 | ) | | $ | 0.06 | (8) | | $ | 0.02 | | | $ | (0.15 | ) | | $ | (4.90 | ) | | $ | (5.05 | ) | | $ | 29.83 | | | | (0.49 | )% | | $ | 1,145,176 | | | | 0.65 | % | | | 0.65 | % | | | (0.11 | )% | | | 138 | % |
IB | | | 33.76 | | | | (0.11 | ) | | | 0.04 | (8) | | | (0.07 | ) | | | (0.05 | ) | | | (4.90 | ) | | | (4.95 | ) | | | 28.74 | | | | (0.77 | ) | | | 132,149 | | | | 0.90 | | | | 0.90 | | | | (0.35 | ) | | | 138 | |
IC | | | 34.57 | | | | (0.19 | ) | | | 0.04 | (8) | | | (0.15 | ) | | | (0.09 | ) | | | (4.90 | ) | | | (4.99 | ) | | | 29.43 | | | | (1.01 | ) | | | 25,550 | | | | 1.15 | | | | 1.15 | | | | (0.61 | ) | | | 138 | |
|
For the Year Ended December 31, 2015 | |
IA | | $ | 38.88 | | | $ | 0.02 | | | $ | 4.66 | | | $ | 4.68 | | | $ | (0.05 | ) | | $ | (8.65 | ) | | $ | (8.70 | ) | | $ | 34.86 | | | | 11.74 | % | | $ | 1,197,187 | | | | 0.65 | % | | | 0.65 | % | | | 0.05 | % | | | 109 | % |
IB | | | 37.93 | | | | (0.08 | ) | | | 4.56 | | | | 4.48 | | | | — | | | | (8.65 | ) | | | (8.65 | ) | | | 33.76 | | | | 11.47 | | | | 158,304 | | | | 0.90 | | | | 0.90 | | | | (0.20 | ) | | | 109 | |
IC | | | 38.75 | | | | (0.18 | ) | | | 4.65 | | | | 4.47 | | | | — | | | | (8.65 | ) | | | (8.65 | ) | | | 34.57 | | | | 11.18 | | | | 20,495 | | | | 1.16 | | | | 1.16 | | | | (0.48 | ) | | | 109 | |
|
For the Year Ended December 31, 2014 | |
IA | | $ | 40.58 | | | $ | 0.06 | | | $ | 5.31 | | | $ | 5.37 | | | $ | (0.07 | ) | | $ | (7.00 | ) | | $ | (7.07 | ) | | $ | 38.88 | | | | 14.14 | % | | $ | 1,203,366 | | | | 0.64 | % | | | 0.64 | % | | | 0.16 | % | | | 145 | %(9) |
IB | | | 39.79 | | | | (0.04 | ) | | | 5.18 | | | | 5.14 | | | | — | | | | (7.00 | ) | | | (7.00 | ) | | | 37.93 | | | | 13.82 | | | | 160,040 | | | | 0.89 | | | | 0.89 | | | | (0.11 | ) | | | 145 | (9) |
IC(6) | | | 40.23 | | | | (0.10 | ) | | | 5.69 | | | | 5.59 | | | | (0.07 | ) | | | (7.00 | ) | | | (7.07 | ) | | | 38.75 | | | | 14.79 | (4) | | | 1,717 | | | | 1.14 | (5) | | | 1.14 | (5) | | | (0.37 | )(5) | | | 145 | (9) |
|
For the Year Ended December 31, 2013 | |
IA | | $ | 29.90 | | | $ | 0.07 | | | $ | 10.61 | | | $ | 10.68 | | | $ | — | | | $ | — | | | $ | — | | | $ | 40.58 | | | | 35.74 | % | | $ | 1,097,380 | | | | 0.65 | % | | | 0.65 | % | | | 0.21 | % | | | 119 | % |
IB | | | 29.38 | | | | (0.01 | ) | | | 10.42 | | | | 10.41 | | | | — | | | | — | | | | — | | | | 39.79 | | | | 35.42 | | | | 111,230 | | | | 0.90 | | | | 0.90 | | | | (0.04 | ) | | | 119 | |
The accompanying notes are an integral part of these financial statements.
Financial Highlights – (continued)
| | | | | | | | | | | | | | | | | | | | | | | | | | | | | | | | | | | | | | | | | | | | | | | | | | | | | | | | |
| | | — Selected Per-Share Data(1) — | | | — Ratios and Supplemental Data — | |
Class | | Net Asset
Value at
Beginning
of Period | | | Net
Investment
Income
(Loss) | | | Net
Realized
and
Unrealized
Gain (Loss)
on
Investments | | | Total from
Investment
Operations | | | Dividends
from Net
Investment
Income | | | Distributions
from
Capital
Gains | | | Total
Dividends
and
Distributions | | | Net
Asset
Value at
End of
Period | | | Total
Return(2) | | | Net
Assets at
End of
Period
(000s) | | | Ratio of
Expenses
to
Average
Net
Assets
Before
Adjust-
ments(3) | | | Ratio of
Expenses
to
Average
Net
Assets
After
Adjust-
ments(3) | | | Ratio of
Net
Investment
Income
(Loss) to
Average
Net Assets | | | Portfolio
Turnover | |
| Hartford Healthcare HLS Fund | |
For the Six-Month Period Ended June 30, 2018 (Unaudited) | |
IA | | $ | 22.46 | | | $ | — | | | $ | 1.27 | | | $ | 1.27 | | | $ | — | | | $ | — | | | $ | — | | | $ | 23.73 | | | | 5.65 | %(4) | | $ | 285,645 | | | | 0.89 | %(5) | | | 0.89 | %(5) | | | 0.03 | %(5) | | | 14 | % |
IB | | | 21.35 | | | | (0.02 | ) | | | 1.20 | | | | 1.18 | | | | — | | | | — | | | | — | | | | 22.53 | | | | 5.53 | (4) | | | 42,453 | | | | 1.14 | (5) | | | 1.14 | (5) | | | (0.22 | )(5) | | | 14 | |
|
For the Year Ended December 31, 2017 | |
IA | | $ | 21.46 | | | $ | 0.01 | | | $ | 4.69 | | | $ | 4.70 | | | $ | — | | | $ | (3.70 | ) | | $ | (3.70 | ) | | $ | 22.46 | | | | 22.26 | % | | $ | 290,603 | | | | 0.89 | % | | | 0.89 | % | | | 0.04 | % | | | 18 | % |
IB | | | 20.60 | | | | (0.05 | ) | | | 4.50 | | | | 4.45 | | | | — | | | | (3.70 | ) | | | (3.70 | ) | | | 21.35 | | | | 21.96 | | | | 44,796 | | | | 1.14 | | | | 1.14 | | | | (0.21 | ) | | | 18 | |
|
For the Year Ended December 31, 2016 | |
IA | | $ | 30.32 | | | $ | 0.01 | | | $ | (2.37 | ) | | $ | (2.36 | ) | | $ | (0.99 | ) | | $ | (5.51 | ) | | $ | (6.50 | ) | | $ | 21.46 | | | | (8.39 | )% | | $ | 246,494 | | | | 0.89 | % | | | 0.89 | % | | | 0.05 | % | | | 36 | % |
IB | | | 29.36 | | | | (0.05 | ) | | | (2.30 | ) | | | (2.35 | ) | | | (0.90 | ) | | | (5.51 | ) | | | (6.41 | ) | | | 20.60 | | | | (8.64 | ) | | | 44,149 | | | | 1.14 | | | | 1.14 | | | | (0.20 | ) | | | 36 | |
|
For the Year Ended December 31, 2015 | |
IA | | $ | 30.02 | | | $ | — | | | $ | 4.08 | | | $ | 4.08 | | | $ | — | | | $ | (3.78 | ) | | $ | (3.78 | ) | | $ | 30.32 | | | | 13.21 | % | | $ | 360,783 | | | | 0.86 | % | | | 0.86 | % | | | (0.01 | )% | | | 38 | % |
IB | | | 29.23 | | | | (0.08 | ) | | | 3.99 | | | | 3.91 | | | | — | | | | (3.78 | ) | | | (3.78 | ) | | | 29.36 | | | | 12.98 | | | | 62,644 | | | | 1.11 | | | | 1.11 | | | | (0.26 | ) | | | 38 | |
|
For the Year Ended December 31, 2014 | |
IA | | $ | 25.67 | | | $ | 0.01 | | | $ | 6.75 | | | $ | 6.76 | | | $ | (0.07 | ) | | $ | (2.34 | ) | | $ | (2.41 | ) | | $ | 30.02 | | | | 27.39 | % | | $ | 301,580 | | | | 0.88 | % | | | 0.88 | % | | | 0.03 | % | | | 33 | % |
IB | | | 25.07 | | | | (0.06 | ) | | | 6.57 | | | | 6.51 | | | | (0.01 | ) | | | (2.34 | ) | | | (2.35 | ) | | | 29.23 | | | | 27.00 | | | | 60,413 | | | | 1.13 | | | | 1.13 | | | | (0.22 | ) | | | 33 | |
|
For the Year Ended December 31, 2013 | |
IA | | $ | 18.11 | | | $ | 0.04 | | | $ | 9.12 | | | $ | 9.16 | | | $ | (0.12 | ) | | $ | (1.48 | ) | | $ | (1.60 | ) | | $ | 25.67 | | | | 51.84 | % | | $ | 243,719 | | | | 0.89 | % | | | 0.89 | % | | | 0.19 | % | | | 33 | % |
IB | | | 17.71 | | | | (0.01 | ) | | | 8.92 | | | | 8.91 | | | | (0.07 | ) | | | (1.48 | ) | | | (1.55 | ) | | | 25.07 | | | | 51.50 | | | | 57,187 | | | | 1.14 | | | | 1.14 | | | | (0.06 | ) | | | 33 | |
|
| Hartford High Yield HLS Fund | |
For the Six-Month Period Ended June 30, 2018 (Unaudited) | |
IA | | $ | 8.20 | | | $ | 0.22 | | | $ | (0.26 | ) | | $ | (0.04 | ) | | $ | — | | | $ | — | | | $ | — | | | $ | 8.16 | | | | (0.49 | )%(4) | | $ | 211,095 | | | | 0.77 | %(5) | | | 0.77 | %(5) | | | 5.37 | %(5) | | | 16 | % |
IB | | | 8.06 | | | | 0.20 | | | | (0.25 | ) | | | (0.05 | ) | | | — | | | | — | | | | — | | | | 8.01 | | | | (0.62 | )(4) | | | 65,828 | | | | 1.02 | (5) | | | 1.02 | (5) | | | 5.12 | (5) | | | 16 | |
|
For the Year Ended December 31, 2017 | |
IA | | $ | 8.11 | | | $ | 0.45 | | | $ | 0.15 | | | $ | 0.60 | | | $ | (0.51 | ) | | $ | — | | | $ | (0.51 | ) | | $ | 8.20 | | | | 7.60 | % | | $ | 230,101 | | | | 0.77 | % | | | 0.77 | % | | | 5.42 | % | | | 43 | % |
IB | | | 7.98 | | | | 0.42 | | | | 0.15 | | | | 0.57 | | | | (0.49 | ) | | | — | | | | (0.49 | ) | | | 8.06 | | | | 7.31 | | | | 71,389 | | | | 1.02 | | | | 1.02 | | | | 5.17 | | | | 43 | |
|
For the Year Ended December 31, 2016 | |
IA | | $ | 7.55 | | | $ | 0.44 | | | $ | 0.62 | | | $ | 1.06 | | | $ | (0.50 | ) | | $ | — | | | $ | (0.50 | ) | | $ | 8.11 | | | | 14.25 | % | | $ | 244,212 | | | | 0.79 | % | | | 0.79 | % | | | 5.52 | % | | | 41 | % |
IB | | | 7.43 | | | | 0.41 | | | | 0.62 | | | | 1.03 | | | | (0.48 | ) | | | — | | | | (0.48 | ) | | | 7.98 | | | | 13.99 | | | | 77,573 | | | | 1.04 | | | | 1.04 | | | | 5.27 | | | | 41 | |
|
For the Year Ended December 31, 2015 | |
IA | | $ | 8.45 | | | $ | 0.45 | | | $ | (0.79 | ) | | $ | (0.34 | ) | | $ | (0.56 | ) | | $ | — | | | $ | (0.56 | ) | | $ | 7.55 | | | | (4.30 | )% | | $ | 251,313 | | | | 0.76 | % | | | 0.76 | % | | | 5.40 | % | | | 34 | % |
IB | | | 8.32 | | | | 0.42 | | | | (0.77 | ) | | | (0.35 | ) | | | (0.54 | ) | | | — | | | | (0.54 | ) | | | 7.43 | | | | (4.56 | ) | | | 77,013 | | | | 1.01 | | | | 1.01 | | | | 5.15 | | | | 34 | |
|
For the Year Ended December 31, 2014 | |
IA | | $ | 8.90 | | | $ | 0.47 | | | $ | (0.22 | ) | | $ | 0.25 | | | $ | (0.70 | ) | | $ | — | | | $ | (0.70 | ) | | $ | 8.45 | | | | 2.58 | % | | $ | 321,650 | | | | 0.75 | % | | | 0.75 | % | | | 5.28 | % | | | 39 | % |
IB | | | 8.77 | | | | 0.44 | | | | (0.22 | ) | | | 0.22 | | | | (0.67 | ) | | | — | | | | (0.67 | ) | | | 8.32 | | | | 2.31 | | | | 105,579 | | | | 1.00 | | | | 1.00 | | | | 5.02 | | | | 39 | |
|
For the Year Ended December 31, 2013 | |
IA | | $ | 9.09 | | | $ | 0.54 | | | $ | 0.01 | | | $ | 0.55 | | | $ | (0.74 | ) | | $ | — | | | $ | (0.74 | ) | | $ | 8.90 | | | | 6.43 | % | | $ | 389,340 | | | | 0.75 | % | | | 0.75 | % | | | 5.90 | % | | | 46 | % |
IB | | | 8.96 | | | | 0.50 | | | | 0.03 | | | | 0.53 | | | | (0.72 | ) | | | — | | | | (0.72 | ) | | | 8.77 | | | | 6.17 | | | | 125,701 | | | | 1.00 | | | | 1.00 | | | | 5.64 | | | | 46 | |
The accompanying notes are an integral part of these financial statements.
Financial Highlights – (continued)
| | | | | | | | | | | | | | | | | | | | | | | | | | | | | | | | | | | | | | | | | | | | | | | | | | | | | | | | |
| | | — Selected Per-Share Data(1) — | | | — Ratios and Supplemental Data — | |
Class | | Net Asset
Value at
Beginning
of Period | | | Net
Investment
Income
(Loss) | | | Net
Realized
and
Unrealized
Gain (Loss)
on
Investments | | | Total from
Investment
Operations | | | Dividends
from Net
Investment
Income | | | Distributions
from
Capital
Gains | | | Total
Dividends
and
Distributions | | | Net
Asset
Value at
End of
Period | | | Total
Return(2) | | | Net
Assets at
End of
Period
(000s) | | | Ratio of
Expenses
to
Average
Net
Assets
Before
Adjust-
ments(3) | | | Ratio of
Expenses
to
Average
Net
Assets
After
Adjust-
ments(3) | | | Ratio of
Net
Investment
Income
(Loss) to
Average
Net Assets | | | Portfolio
Turnover | |
| Hartford International Opportunities HLS Fund | |
For the Six-Month Period Ended June 30, 2018 (Unaudited) | |
IA | | $ | 17.46 | | | $ | 0.19 | | | $ | (0.80 | ) | | $ | (0.61 | ) | | $ | — | | | $ | — | | | $ | — | | | $ | 16.85 | | | | (3.49 | )%(4) | | $ | 1,306,992 | | | | 0.73 | %(5) | | | 0.73 | %(5) | | | 2.17 | %(5) | | | 40 | % |
IB | | | 17.68 | | | | 0.17 | | | | (0.81 | ) | | | (0.64 | ) | | | — | | | | — | | | | — | | | | 17.04 | | | | (3.62 | )(4) | | | 148,058 | | | | 0.98 | (5) | | | 0.98 | (5) | | | 1.91 | (5) | | | 40 | |
|
For the Year Ended December 31, 2017 | |
IA | | $ | 14.14 | | | $ | 0.24 | | | $ | 3.31 | | | $ | 3.55 | | | $ | (0.23 | ) | | $ | — | | | $ | (0.23 | ) | | $ | 17.46 | | | | 25.25 | % | | $ | 1,418,078 | | | | 0.73 | % | | | 0.73 | % | | | 1.46 | % | | | 91 | % |
IB | | | 14.31 | | | | 0.21 | | | | 3.35 | | | | 3.56 | | | | (0.19 | ) | | | — | | | | (0.19 | ) | | | 17.68 | | | | 24.99 | | | | 162,442 | | | | 0.98 | | | | 0.98 | | | | 1.28 | | | | 91 | |
|
For the Year Ended December 31, 2016 | |
IA | | $ | 14.19 | | | $ | 0.24 | | | $ | (0.06 | ) | | $ | 0.18 | | | $ | (0.23 | ) | | $ | — | | | $ | (0.23 | ) | | $ | 14.14 | | | | 1.26 | % | | $ | 1,086,762 | | | | 0.76 | % | | | 0.76 | % | | | 1.74 | % | | | 95 | % |
IB | | | 14.36 | | | | 0.21 | | | | (0.07 | ) | | | 0.14 | | | | (0.19 | ) | | | — | | | | (0.19 | ) | | | 14.31 | | | | 0.94 | | | | 147,343 | | | | 1.01 | | | | 1.01 | | | | 1.50 | | | | 95 | |
|
For the Year Ended December 31, 2015 | |
IA | | $ | 14.13 | | | $ | 0.22 | | | $ | 0.06 | | | $ | 0.28 | | | $ | (0.22 | ) | | $ | — | | | $ | (0.22 | ) | | $ | 14.19 | | | | 1.88 | % | | $ | 1,146,250 | | | | 0.74 | % | | | 0.74 | % | | | 1.47 | % | | | 68 | % |
IB | | | 14.29 | | | | 0.18 | | | | 0.06 | | | | 0.24 | | | | (0.17 | ) | | | — | | | | (0.17 | ) | | | 14.36 | | | | 1.65 | | | | 171,538 | | | | 0.99 | | | | 0.99 | | | | 1.21 | | | | 68 | |
|
For the Year Ended December 31, 2014 | |
IA | | $ | 15.03 | | | $ | 0.19 | | | $ | (0.75 | ) | | $ | (0.56 | ) | | $ | (0.34 | ) | | $ | — | | | $ | (0.34 | ) | | $ | 14.13 | | | | (3.87 | )% | | $ | 1,239,946 | | | | 0.73 | % | | | 0.73 | % | | | 1.30 | % | | | 90 | % |
IB | | | 15.20 | | | | 0.15 | | | | (0.76 | ) | | | (0.61 | ) | | | (0.30 | ) | | | — | | | | (0.30 | ) | | | 14.29 | | | | (4.14 | ) | | | 189,053 | | | | 0.98 | | | | 0.98 | | | | 1.02 | | | | 90 | |
|
For the Year Ended December 31, 2013 | |
IA | | $ | 12.63 | | | $ | 0.24 | | | $ | 2.45 | | | $ | 2.69 | | | $ | (0.29 | ) | | $ | — | | | $ | (0.29 | ) | | $ | 15.03 | | | | 21.55 | % | | $ | 1,454,018 | | | | 0.74 | % | | | 0.74 | % | | | 1.76 | % | | | 100 | % |
IB | | | 12.76 | | | | 0.21 | | | | 2.49 | | | | 2.70 | | | | (0.26 | ) | | | — | | | | (0.26 | ) | | | 15.20 | | | | 21.28 | | | | 215,447 | | | | 0.99 | | | | 0.99 | | | | 1.55 | | | | 100 | |
|
| Hartford MidCap HLS Fund | |
For the Six-Month Period Ended June 30, 2018 (Unaudited) | |
IA | | $ | 40.10 | | | $ | (0.01 | ) | | $ | 3.02 | | | $ | 3.01 | | | $ | — | | | $ | — | | | $ | — | | | $ | 43.11 | | | | 7.51 | %(4) | | $ | 2,240,565 | | | | 0.69 | %(5) | | | 0.69 | %(5) | | | (0.04 | )%(5) | | | 18 | % |
IB | | | 39.18 | | | | (0.06 | ) | | | 2.95 | | | | 2.89 | | | | — | | | | — | | | | — | | | | 42.07 | | | | 7.38 | (4) | | | 58,244 | | | | 0.94 | (5) | | | 0.94 | (5) | | | (0.29 | )(5) | | | 18 | |
|
For the Year Ended December 31, 2017 | |
IA | | $ | 33.83 | | | $ | 0.01 | | | $ | 8.11 | | | $ | 8.12 | | | $ | — | | | $ | (1.85 | ) | | $ | (1.85 | ) | | $ | 40.10 | | | | 24.47 | % | | $ | 2,156,044 | | | | 0.70 | % | | | 0.70 | % | | | 0.02 | % | | | 36 | % |
IB | | | 33.17 | | | | (0.08 | ) | | | 7.94 | | | | 7.86 | | | | — | | | | (1.85 | ) | | | (1.85 | ) | | | 39.18 | | | | 24.17 | | | | 58,850 | | | | 0.95 | | | | 0.95 | | | | (0.23 | ) | | | 36 | |
|
For the Year Ended December 31, 2016 | |
IA | | $ | 33.66 | | | $ | 0.05 | | | $ | 3.80 | | | $ | 3.85 | | | $ | (0.06 | ) | | $ | (3.62 | ) | | $ | (3.68 | ) | | $ | 33.83 | | | | 11.98 | % | | $ | 1,721,029 | | | | 0.71 | % | | | 0.71 | % | | | 0.16 | % | | | 32 | % |
IB | | | 33.11 | | | | (0.03 | ) | | | 3.72 | | | | 3.69 | | | | (0.01 | ) | | | (3.62 | ) | | | (3.63 | ) | | | 33.17 | | | | 11.69 | | | | 93,567 | | | | 0.96 | | | | 0.96 | | | | (0.09 | ) | | | 32 | |
|
For the Year Ended December 31, 2015 | |
IA | | $ | 37.28 | | | $ | 0.03 | | | $ | 0.83 | | | $ | 0.86 | | | $ | (0.03 | ) | | $ | (4.45 | ) | | $ | (4.48 | ) | | $ | 33.66 | | | | 1.60 | % | | $ | 1,647,715 | | | | 0.70 | % | | | 0.70 | % | | | 0.08 | % | | | 38 | % |
IB | | | 36.83 | | | | (0.06 | ) | | | 0.82 | | | | 0.76 | | | | (0.03 | ) | | | (4.45 | ) | | | (4.48 | ) | | | 33.11 | | | | 1.34 | | | | 104,395 | | | | 0.95 | | | | 0.95 | | | | (0.16 | ) | | | 38 | |
|
For the Year Ended December 31, 2014 | |
IA | | $ | 37.87 | | | $ | 0.04 | | | $ | 4.22 | | | $ | 4.26 | | | $ | (0.04 | ) | | $ | (4.81 | ) | | $ | (4.85 | ) | | $ | 37.28 | | | | 11.37 | % | | $ | 1,669,393 | | | | 0.70 | % | | | 0.70 | % | | | 0.10 | % | | | 42 | % |
IB | | | 37.52 | | | | (0.06 | ) | | | 4.18 | | | | 4.12 | | | | — | | | | (4.81 | ) | | | (4.81 | ) | | | 36.83 | | | | 11.09 | | | | 83,562 | | | | 0.95 | | | | 0.95 | | | | (0.15 | ) | | | 42 | |
|
For the Year Ended December 31, 2013 | |
IA | | $ | 28.16 | | | $ | 0.07 | | | $ | 11.02 | | | $ | 11.09 | | | $ | (0.04 | ) | | $ | (1.34 | ) | | $ | (1.38 | ) | | $ | 37.87 | | | | 39.82 | % | | $ | 1,483,626 | | | | 0.71 | % | | | 0.71 | % | | | 0.21 | % | | | 34 | % |
IB | | | 27.95 | | | | (0.02 | ) | | | 10.94 | | | | 10.92 | | | | (0.01 | ) | | | (1.34 | ) | | | (1.35 | ) | | | 37.52 | | | | 39.46 | | | | 82,483 | | | | 0.96 | | | | 0.96 | | | | (0.05 | ) | | | 34 | |
The accompanying notes are an integral part of these financial statements.
Financial Highlights – (continued)
| | | | | | | | | | | | | | | | | | | | | | | | | | | | | | | | | | | | | | | | | | | | | | | | | | | | | | | | |
| | | — Selected Per-Share Data(1) — | | | — Ratios and Supplemental Data — | |
Class | | Net Asset
Value at
Beginning
of Period | | | Net
Investment
Income
(Loss) | | | Net
Realized
and
Unrealized
Gain (Loss)
on
Investments | | | Total from
Investment
Operations | | | Dividends
from Net
Investment
Income | | | Distributions
from
Capital
Gains | | | Total
Dividends
and
Distributions | | | Net
Asset
Value at
End of
Period | | | Total
Return(2) | | | Net
Assets at
End of
Period
(000s) | | | Ratio of
Expenses
to
Average
Net
Assets
Before
Adjust-
ments(3) | | | Ratio of
Expenses
to
Average
Net
Assets
After
Adjust-
ments(3) | | | Ratio of
Net
Investment
Income
(Loss) to
Average
Net Assets | | | Portfolio
Turnover | |
| Hartford MidCap Value HLS Fund | |
For the Six-Month Period Ended June 30, 2018 (Unaudited) | |
IA | | $ | 12.60 | | | $ | 0.04 | | | $ | 0.06 | | | $ | 0.10 | | | $ | — | | | $ | — | | | $ | — | | | $ | 12.70 | | | | 0.79 | %(4) | | $ | 270,227 | | | | 0.86 | %(5) | | | 0.86 | %(5) | | | 0.61 | %(5) | | | 22 | % |
IB | | | 12.50 | | | | 0.02 | | | | 0.07 | | | | 0.09 | | | | — | | | | — | | | | — | | | | 12.59 | | | | 0.72 | (4) | | | 81,711 | | | | 1.11 | (5) | | | 1.11 | (5) | | | 0.36 | (5) | | | 22 | |
|
For the Year Ended December 31, 2017 | |
IA | | $ | 12.00 | | | $ | 0.05 | | | $ | 1.47 | | | $ | 1.52 | | | $ | (0.07 | ) | | $ | (0.85 | ) | | $ | (0.92 | ) | | $ | 12.60 | | | | 13.47 | % | | $ | 287,688 | | | | 0.86 | % | | | 0.86 | % | | | 0.39 | % | | | 32 | % |
IB | | | 11.91 | | | | 0.02 | | | | 1.46 | | | | 1.48 | | | | (0.04 | ) | | | (0.85 | ) | | | (0.89 | ) | | | 12.50 | | | | 13.18 | | | | 87,149 | | | | 1.11 | | | | 1.11 | | | | 0.14 | | | | 32 | |
|
For the Year Ended December 31, 2016 | |
IA | | $ | 12.33 | | | $ | 0.07 | | | $ | 1.40 | | | $ | 1.47 | | | $ | (0.07 | ) | | $ | (1.73 | ) | | $ | (1.80 | ) | | $ | 12.00 | | | | 12.82 | % | | $ | 289,872 | | | | 0.86 | % | | | 0.86 | % | | | 0.61 | % | | | 38 | % |
IB | | | 12.24 | | | | 0.04 | | | | 1.39 | | | | 1.43 | | | | (0.03 | ) | | | (1.73 | ) | | | (1.76 | ) | | | 11.91 | | | | 12.56 | | | | 89,704 | | | | 1.11 | | | | 1.11 | | | | 0.36 | | | | 38 | |
|
For the Year Ended December 31, 2015 | |
IA | | $ | 14.60 | | | $ | 0.07 | | | $ | (0.15 | ) | | $ | (0.08 | ) | | $ | (0.09 | ) | | $ | (2.10 | ) | | $ | (2.19 | ) | | $ | 12.33 | | | | (1.21 | )% | | $ | 291,174 | | | | 0.84 | % | | | 0.84 | % | | | 0.49 | % | | | 29 | % |
IB | | | 14.50 | | | | 0.03 | | | | (0.15 | ) | | | (0.12 | ) | | | (0.04 | ) | | | (2.10 | ) | | | (2.14 | ) | | | 12.24 | | | | (1.45 | ) | | | 91,720 | | | | 1.09 | | | | 1.09 | | | | 0.24 | | | | 29 | |
|
For the Year Ended December 31, 2014 | |
IA | | $ | 15.51 | | | $ | 0.09 | | | $ | 1.19 | | | $ | 1.28 | | | $ | (0.11 | ) | | $ | (2.08 | ) | | $ | (2.19 | ) | | $ | 14.60 | | | | 8.22 | % | | $ | 345,084 | | | | 0.84 | % | | | 0.84 | % | | | 0.60 | % | | | 31 | % |
IB | | | 15.42 | | | | 0.05 | | | | 1.18 | | | | 1.23 | | | | (0.07 | ) | | | (2.08 | ) | | | (2.15 | ) | | | 14.50 | | | | 7.91 | | | | 110,819 | | | | 1.09 | | | | 1.09 | | | | 0.35 | | | | 31 | |
|
For the Year Ended December 31, 2013 | |
IA | | $ | 11.65 | | | $ | 0.08 | | | $ | 3.95 | | | $ | 4.03 | | | $ | (0.17 | ) | | $ | — | | | $ | (0.17 | ) | | $ | 15.51 | | | | 34.71 | % | | $ | 377,272 | | | | 0.84 | % | | | 0.84 | % | | | 0.56 | % | | | 49 | % |
IB | | | 11.59 | | | | 0.04 | | | | 3.93 | | | | 3.97 | | | | (0.14 | ) | | | — | | | | (0.14 | ) | | | 15.42 | | | | 34.37 | | | | 123,884 | | | | 1.09 | | | | 1.09 | | | | 0.31 | | | | 49 | |
|
| Hartford Small Cap Growth HLS Fund | |
For the Six-Month Period Ended June 30, 2018 (Unaudited) | |
IA | | $ | 32.13 | | | $ | 0.02 | | | $ | 2.78 | | | $ | 2.80 | | | $ | — | | | $ | — | | | $ | — | | | $ | 34.93 | | | | 8.71 | %(4) | | $ | 1,016,227 | | | | 0.64 | %(5) | | | 0.64 | %(5) | | | 0.11 | %(5) | | | 35 | % |
IB | | | 31.28 | | | | (0.02 | ) | | | 2.71 | | | | 2.69 | | | | — | | | | — | | | | — | | | | 33.97 | | | | 8.60 | (4) | | | 372,690 | | | | 0.89 | (5) | | | 0.89 | (5) | | | (0.14 | )(5) | | | 35 | |
|
For the Year Ended December 31, 2017 | |
IA | | $ | 26.77 | | | $ | (0.02 | ) | | $ | 5.39 | | | $ | 5.37 | | | $ | (0.01 | ) | | $ | — | | | $ | (0.01 | ) | | $ | 32.13 | | | | 20.07 | % | | $ | 960,690 | | | | 0.65 | % | | | 0.65 | % | | | (0.06 | )% | | | 51 | % |
IB | | | 26.12 | | | | (0.09 | ) | | | 5.25 | | | | 5.16 | | | | — | | | | — | | | | — | | | | 31.28 | | | | 19.75 | | | | 374,342 | | | | 0.90 | | | | 0.90 | | | | (0.31 | ) | | | 51 | |
|
For the Year Ended December 31, 2016 | |
IA | | $ | 24.93 | | | $ | 0.04 | | | $ | 2.98 | | | $ | 3.02 | | | $ | (0.04 | ) | | $ | (1.14 | ) | | $ | (1.18 | ) | | $ | 26.77 | | | | 12.37 | % | | $ | 972,576 | | | | 0.65 | % | | | 0.65 | % | | | 0.17 | % | | | 51 | % |
IB | | | 24.38 | | | | (0.02 | ) | | | 2.90 | | | | 2.88 | | | | — | | | | (1.14 | ) | | | (1.14 | ) | | | 26.12 | | | | 12.08 | | | | 226,557 | | | | 0.90 | | | | 0.90 | | | | (0.08 | ) | | | 51 | |
|
For the Year Ended December 31, 2015 | |
IA | | $ | 27.95 | | | $ | 0.07 | | | $ | (0.02 | ) | | $ | 0.05 | | | $ | (0.02 | ) | | $ | (3.05 | ) | | $ | (3.07 | ) | | $ | 24.93 | | | | (0.55 | )% | | $ | 913,414 | | | | 0.65 | % | | | 0.65 | % | | | 0.25 | % | | | 59 | % |
IB | | | 27.44 | | | | (0.01 | ) | | | — | | | | (0.01 | ) | | | — | | | | (3.05 | ) | | | (3.05 | ) | | | 24.38 | | | | (0.79 | ) | | | 209,948 | | | | 0.90 | | | | 0.90 | | | | (0.03 | ) | | | 59 | |
|
For the Year Ended December 31, 2014 | |
IA | | $ | 32.60 | | | $ | 0.06 | | | $ | 1.48 | | | $ | 1.54 | | | $ | (0.02 | ) | | $ | (6.17 | ) | | $ | (6.19 | ) | | $ | 27.95 | | | | 5.83 | % | | $ | 557,200 | | | | 0.65 | % | | | 0.65 | % | | | 0.19 | % | | | 117 | % |
IB | | | 32.17 | | | | (0.02 | ) | | | 1.46 | | | | 1.44 | | | | — | | | | (6.17 | ) | | | (6.17 | ) | | | 27.44 | | | | 5.57 | | | | 115,230 | | | | 0.90 | | | | 0.90 | | | | (0.06 | ) | | | 117 | |
|
For the Year Ended December 31, 2013 | |
IA | | $ | 25.44 | | | $ | 0.05 | | | $ | 10.92 | | | $ | 10.97 | | | $ | (0.12 | ) | | $ | (3.69 | ) | | $ | (3.81 | ) | | $ | 32.60 | | | | 44.87 | % | | $ | 466,173 | | | | 0.67 | % | | | 0.67 | % | | | 0.16 | % | | | 81 | % |
IB | | | 25.14 | | | | (0.02 | ) | | | 10.77 | | | | 10.75 | | | | (0.03 | ) | | | (3.69 | ) | | | (3.72 | ) | | | 32.17 | | | | 44.50 | | | | 123,966 | | | | 0.92 | | | | 0.92 | | | | (0.08 | ) | | | 81 | |
The accompanying notes are an integral part of these financial statements.
Financial Highlights – (continued)
| | | | | | | | | | | | | | | | | | | | | | | | | | | | | | | | | | | | | | | | | | | | | | | | | | | | | | | | |
| | | — Selected Per-Share Data(1) — | | | — Ratios and Supplemental Data — | |
Class | | Net Asset
Value at
Beginning
of Period | | | Net
Investment
Income
(Loss) | | | Net
Realized
and
Unrealized
Gain (Loss)
on
Investments | | | Total from
Investment
Operations | | | Dividends
from Net
Investment
Income | | | Distributions
from
Capital
Gains | | | Total
Dividends
and
Distributions | | | Net
Asset
Value at
End of
Period | | | Total
Return(2) | | | Net
Assets at
End of
Period
(000s) | | | Ratio of
Expenses
to
Average
Net
Assets
Before
Adjust-
ments(3) | | | Ratio of
Expenses
to
Average
Net
Assets
After
Adjust-
ments(3) | | | Ratio of
Net
Investment
Income
(Loss) to
Average
Net Assets | | | Portfolio
Turnover | |
| Hartford Small Company HLS Fund | |
For the Six-Month Period Ended June 30, 2018 (Unaudited) | |
IA | | $ | 20.42 | | | $ | (0.04 | ) | | $ | 2.66 | | | $ | 2.62 | | | $ | — | | | $ | — | | | $ | — | | | $ | 23.04 | | | | 12.83 | %(4) | | $ | 584,243 | | | | 0.79 | %(5) | | | 0.79 | %(5) | | | (0.36 | )%(5) | | | 48 | % |
IB | | | 18.97 | | | | (0.06 | ) | | | 2.47 | | | | 2.41 | | | | — | | | | — | | | | — | | | | 21.38 | | | | 12.70 | (4) | | | 59,181 | | | | 1.04 | (5) | | | 1.04 | (5) | | | (0.61 | )(5) | | | 48 | |
|
For the Year Ended December 31, 2017 | |
IA | | $ | 16.16 | | | $ | (0.06 | ) | | $ | 4.32 | | | $ | 4.26 | | | $ | — | | | $ | — | | | $ | — | | | $ | 20.42 | | | | 26.36 | % | | $ | 551,010 | | | | 0.78 | % | | | 0.78 | % | | | (0.33 | )% | | | 107 | % |
IB | | | 15.05 | | | | (0.10 | ) | | | 4.02 | | | | 3.92 | | | | — | | | | — | | | | — | | | | 18.97 | | | | 26.05 | | | | 57,193 | | | | 1.03 | | | | 1.03 | | | | (0.58 | ) | | | 107 | |
|
For the Year Ended December 31, 2016 | |
IA | | $ | 17.52 | | | $ | (0.01 | ) | | $ | 0.33 | (8) | | $ | 0.32 | | | $ | — | | | $ | (1.68 | ) | | $ | (1.68 | ) | | $ | 16.16 | | | | 2.04 | % | | $ | 834,044 | | | | 0.76 | % | | | 0.76 | % | | | (0.08 | )% | | | 94 | % |
IB | | | 16.47 | | | | (0.05 | ) | | | 0.31 | (8) | | | 0.26 | | | | — | | | | (1.68 | ) | | | (1.68 | ) | | | 15.05 | | | | 1.81 | | | | 73,108 | | | | 1.01 | | | | 1.01 | | | | (0.34 | ) | | | 94 | |
|
For the Year Ended December 31, 2015 | |
IA | | $ | 23.33 | | | $ | (0.02 | ) | | $ | (1.43 | ) | | $ | (1.45 | ) | | $ | — | | | $ | (4.36 | ) | | $ | (4.36 | ) | | $ | 17.52 | | | | (8.21 | )% | | $ | 1,117,778 | | | | 0.71 | % | | | 0.71 | % | | | (0.11 | )% | | | 88 | % |
IB | | | 22.24 | | | | (0.07 | ) | | | (1.34 | ) | | | (1.41 | ) | | | — | | | | (4.36 | ) | | | (4.36 | ) | | | 16.47 | | | | (8.45 | ) | | | 98,501 | | | | 0.96 | | | | 0.96 | | | | (0.36 | ) | | | 88 | |
|
For the Year Ended December 31, 2014 | |
IA | | $ | 26.43 | | | $ | (0.09 | ) | | $ | 1.78 | | | $ | 1.69 | | | $ | — | | | $ | (4.79 | ) | | $ | (4.79 | ) | | $ | 23.33 | | | | 7.07 | % | | $ | 1,279,533 | | | | 0.71 | % | | | 0.71 | % | | | (0.35 | )% | | | 90 | % |
IB | | | 25.46 | | | | (0.15 | ) | | | 1.72 | | | | 1.57 | | | | — | | | | (4.79 | ) | | | (4.79 | ) | | | 22.24 | | | | 6.85 | | | | 123,799 | | | | 0.96 | | | | 0.96 | | | | (0.60 | ) | | | 90 | |
|
For the Year Ended December 31, 2013 | |
IA | | $ | 19.74 | | | $ | (0.07 | ) | | $ | 8.60 | | | $ | 8.53 | | | $ | (0.02 | ) | | $ | (1.82 | ) | | $ | (1.84 | ) | | $ | 26.43 | | | | 44.38 | % | | $ | 1,354,821 | | | | 0.71 | % | | | 0.71 | % | | | (0.29 | )% | | | 96 | % |
IB | | | 19.06 | | | | (0.12 | ) | | | 8.34 | | | | 8.22 | | | | — | | | | (1.82 | ) | | | (1.82 | ) | | | 25.46 | | | | 44.28 | | | | 141,791 | | | | 0.96 | | | | 0.96 | | | | (0.54 | ) | | | 96 | |
|
| Hartford Small/Mid Cap Equity HLS Fund | |
For the Six-Month Period Ended June 30, 2018 (Unaudited) | |
IA | | $ | 8.81 | | | $ | 0.04 | | | $ | 0.32 | | | $ | 0.36 | | | $ | — | | | $ | — | | | $ | — | | | $ | 9.17 | | | | 4.09 | %(4) | | $ | 80,746 | | | | 0.91 | %(5) | | | 0.91 | %(5) | | | 0.94 | %(5) | | | 45 | % |
IB | | | 8.75 | | | | 0.03 | | | | 0.32 | | | | 0.35 | | | | — | | | | — | | | | — | | | | 9.10 | | | | 4.00 | (4) | | | 14,093 | | | | 1.16 | (5) | | | 1.16 | (5) | | | 0.69 | (5) | | | 45 | |
|
For the Year Ended December 31, 2017 | |
IA | | $ | 8.03 | | | $ | 0.08 | | | $ | 1.04 | | | $ | 1.12 | | | $ | (0.07 | ) | | $ | (0.27 | ) | | $ | (0.34 | ) | | $ | 8.81 | | | | 14.43 | % | | $ | 84,144 | | | | 0.92 | % | | | 0.92 | % | | | 0.91 | % | | | 82 | % |
IB | | | 7.99 | | | | 0.05 | | | | 1.03 | | | | 1.08 | | | | (0.05 | ) | | | (0.27 | ) | | | (0.32 | ) | | | 8.75 | | | | 13.94 | | | | 14,851 | | | | 1.17 | | | | 1.17 | | | | 0.66 | | | | 82 | |
|
For the Year Ended December 31, 2016 | |
IA | | $ | 7.45 | | | $ | 0.09 | | | $ | 1.09 | | | $ | 1.18 | | | $ | (0.11 | ) | | $ | (0.49 | ) | | $ | (0.60 | ) | | $ | 8.03 | | | | 16.48 | % | | $ | 87,752 | | | | 0.92 | % | | | 0.92 | % | | | 1.25 | % | | | 96 | % |
IB | | | 7.40 | | | | 0.07 | | | | 1.09 | | | | 1.16 | | | | (0.08 | ) | | | (0.49 | ) | | | (0.57 | ) | | | 7.99 | | | | 16.33 | | | | 17,125 | | | | 1.17 | | | | 1.17 | | | | 1.01 | | | | 96 | |
|
For the Year Ended December 31, 2015 | |
IA | | $ | 9.47 | | | $ | 0.12 | | | $ | (0.46 | ) | | $ | (0.34 | ) | | $ | (0.12 | ) | | $ | (1.56 | ) | | $ | (1.68 | ) | | $ | 7.45 | | | | (4.73 | )% | | $ | 79,379 | | | | 0.88 | % | | | 0.88 | % | | | 1.39 | % | | | 80 | % |
IB | | | 9.41 | | | | 0.10 | | | | (0.46 | ) | | | (0.36 | ) | | | (0.09 | ) | | | (1.56 | ) | | | (1.65 | ) | | | 7.40 | | | | (4.97 | ) | | | 16,501 | | | | 1.13 | | | | 1.13 | | | | 1.12 | | | | 80 | |
|
For the Year Ended December 31, 2014 | |
IA | | $ | 11.29 | | | $ | 0.13 | | | $ | 0.43 | | | $ | 0.56 | | | $ | (0.18 | ) | | $ | (2.20 | ) | | $ | (2.38 | ) | | $ | 9.47 | | | | 5.22 | % | | $ | 98,069 | | | | 0.85 | % | | | 0.85 | % | | | 1.20 | % | | | 108 | % |
IB | | | 11.22 | | | | 0.10 | | | | 0.44 | | | | 0.54 | | | | (0.15 | ) | | | (2.20 | ) | | | (2.35 | ) | | | 9.41 | | | | 5.00 | | | | 23,239 | | | | 1.10 | | | | 1.10 | | | | 0.96 | | | | 108 | |
|
For the Year Ended December 31, 2013 | |
IA | | $ | 8.90 | | | $ | 0.16 | | | $ | 3.08 | | | $ | 3.24 | | | $ | (0.14 | ) | | $ | (0.71 | ) | | $ | (0.85 | ) | | $ | 11.29 | | | | 37.51 | % | | $ | 117,395 | | | | 0.85 | % | | | 0.85 | % | | | 1.58 | % | | | 128 | % |
IB | | | 8.85 | | | | 0.13 | | | | 3.07 | | | | 3.20 | | | | (0.12 | ) | | | (0.71 | ) | | | (0.83 | ) | | | 11.22 | | | | 37.08 | | | | 26,362 | | | | 1.10 | | | | 1.10 | | | | 1.32 | | | | 128 | |
The accompanying notes are an integral part of these financial statements.
Financial Highlights – (continued)
| | | | | | | | | | | | | | | | | | | | | | | | | | | | | | | | | | | | | | | | | | | | | | | | | | | | | | | | |
| | | — Selected Per-Share Data(1) — | | | — Ratios and Supplemental Data — | |
Class | | Net Asset
Value at
Beginning
of Period | | | Net
Investment
Income
(Loss) | | | Net
Realized
and
Unrealized
Gain (Loss)
on
Investments | | | Total from
Investment
Operations | | | Dividends
from Net
Investment
Income | | | Distributions
from
Capital
Gains | | | Total
Dividends
and
Distributions | | | Net
Asset
Value at
End of
Period | | | Total
Return(2) | | | Net
Assets at
End of
Period
(000s) | | | Ratio of
Expenses
to
Average
Net
Assets
Before
Adjust-
ments(3) | | | Ratio of
Expenses
to
Average
Net
Assets
After
Adjust-
ments(3) | | | Ratio of
Net
Investment
Income
(Loss) to
Average
Net Assets | | | Portfolio
Turnover | |
| Hartford Stock HLS Fund | |
For the Six-Month Period Ended June 30, 2018 (Unaudited) | |
IA | | $ | 79.57 | | | $ | 0.62 | | | $ | 0.92 | | | $ | 1.54 | | | $ | — | | | $ | — | | | $ | — | | | $ | 81.11 | | | | 1.94 | %(4) | | $ | 1,314,952 | | | | 0.52 | %(5) | | | 0.52 | %(5) | | | 1.55 | %(5) | | | 10 | % |
IB | | | 79.54 | | | | 0.52 | | | | 0.92 | | | | 1.44 | | | | — | | | | — | | | | — | | | | 80.98 | | | | 1.81 | (4) | | | 132,638 | | | | 0.77 | (5) | | | 0.77 | (5) | | | 1.29 | (5) | | | 10 | |
|
For the Year Ended December 31, 2017 | |
IA | | $ | 67.55 | | | $ | 1.30 | | | $ | 12.10 | | | $ | 13.40 | | | $ | (1.38 | ) | | $ | — | | | $ | (1.38 | ) | | $ | 79.57 | | | | 19.85 | % | | $ | 1,378,245 | | | | 0.52 | % | | | 0.52 | % | | | 1.76 | % | | | 14 | % |
IB | | | 67.53 | | | | 1.11 | | | | 12.08 | | | | 13.19 | | | | (1.18 | ) | | | — | | | | (1.18 | ) | | | 79.54 | | | | 19.54 | | | | 143,370 | | | | 0.77 | | | | 0.77 | | | | 1.51 | | | | 14 | |
|
For the Year Ended December 31, 2016 | |
IA | | $ | 64.06 | | | $ | 1.14 | | | $ | 3.61 | | | $ | 4.75 | | | $ | (1.26 | ) | | $ | — | | | $ | (1.26 | ) | | $ | 67.55 | | | | 7.41 | % | | $ | 1,312,626 | | | | 0.52 | % | | | 0.52 | % | | | 1.72 | % | | | 29 | % |
IB | | | 64.03 | | | | 0.97 | | | | 3.61 | | | | 4.58 | | | | (1.08 | ) | | | — | | | | (1.08 | ) | | | 67.53 | | | | 7.14 | | | | 140,317 | | | | 0.77 | | | | 0.77 | | | | 1.47 | | | | 29 | |
|
For the Year Ended December 31, 2015 | |
IA | | $ | 63.49 | | | $ | 1.19 | | | $ | 0.56 | | | $ | 1.75 | | | $ | (1.18 | ) | | $ | — | | | $ | (1.18 | ) | | $ | 64.06 | | | | 2.74 | % | | $ | 1,388,110 | | | | 0.51 | % | | | 0.51 | % | | | 1.86 | % | | | 23 | % |
IB | | | 63.46 | | | | 1.03 | | | | 0.54 | | | | 1.57 | | | | (1.00 | ) | | | — | | | | (1.00 | ) | | | 64.03 | | | | 2.48 | | | | 155,722 | | | | 0.76 | | | | 0.76 | | | | 1.61 | | | | 23 | |
|
For the Year Ended December 31, 2014 | |
IA | | $ | 58.07 | | | $ | 1.07 | | | $ | 5.51 | | | $ | 6.58 | | | $ | (1.16 | ) | | $ | — | | | $ | (1.16 | ) | | $ | 63.49 | | | | 11.31 | % | | $ | 1,552,777 | | | | 0.50 | % | | | 0.50 | % | | | 1.79 | % | | | 20 | % |
IB | | | 58.04 | | | | 0.92 | | | | 5.50 | | | | 6.42 | | | | (1.00 | ) | | | — | | | | (1.00 | ) | | | 63.46 | | | | 11.04 | | | | 182,112 | | | | 0.75 | | | | 0.75 | | | | 1.54 | | | | 20 | |
|
For the Year Ended December 31, 2013 | |
IA | | $ | 44.73 | | | $ | 0.99 | | | $ | 13.41 | | | $ | 14.40 | | | $ | (1.06 | ) | | $ | — | | | $ | (1.06 | ) | | $ | 58.07 | | | | 32.25 | % | | $ | 1,667,278 | | | | 0.51 | % | | | 0.51 | % | | | 1.89 | % | | | 27 | % |
IB | | | 44.71 | | | | 0.85 | | | | 13.40 | | | | 14.25 | | | | (0.92 | ) | | | — | | | | (0.92 | ) | | | 58.04 | | | | 31.92 | | | | 204,437 | | | | 0.76 | | | | 0.76 | | | | 1.64 | | | | 27 | |
|
| Hartford Total Return Bond HLS Fund | |
For the Six-Month Period Ended June 30, 2018 (Unaudited) | |
IA | | $ | 11.32 | | | $ | 0.18 | | | $ | (0.35 | ) | | $ | (0.17 | ) | | $ | — | | | $ | — | | | $ | — | | | $ | 11.15 | | | | (1.50 | )%(4) | | $ | 2,000,366 | | | | 0.51 | %(5) | | | 0.51 | %(5) | | | 3.18 | %(5) | | | 28 | % |
IB | | | 11.25 | | | | 0.16 | | | | (0.33 | ) | | | (0.17 | ) | | | — | | | | — | | | | — | | | | 11.08 | | | | (1.51 | )(4) | | | 230,160 | | | | 0.76 | (5) | | | 0.76 | (5) | | | 2.92 | (5) | | | 28 | |
|
For the Year Ended December 31, 2017 | |
IA | | $ | 11.09 | | | $ | 0.34 | | | $ | 0.23 | | | $ | 0.57 | | | $ | (0.34 | ) | | $ | — | | | $ | (0.34 | ) | | $ | 11.32 | | | | 5.16 | % | | $ | 2,157,506 | | | | 0.51 | % | | | 0.51 | % | | | 2.99 | % | | | 89 | % |
IB | | | 11.03 | | | | 0.31 | | | | 0.22 | | | | 0.53 | | | | (0.31 | ) | | | — | | | | (0.31 | ) | | | 11.25 | | | | 4.80 | | | | 248,785 | | | | 0.76 | | | | 0.76 | | | | 2.74 | | | | 89 | |
|
For the Year Ended December 31, 2016 | |
IA | | $ | 10.93 | | | $ | 0.36 | | | $ | 0.13 | | | $ | 0.49 | | | $ | (0.29 | ) | | $ | (0.04 | ) | | $ | (0.33 | ) | | $ | 11.09 | | | | 4.49 | % | | $ | 2,244,505 | | | | 0.52 | % | | | 0.52 | % | | | 3.16 | % | | | 36 | % |
IB | | | 10.87 | | | | 0.33 | | | | 0.13 | | | | 0.46 | | | | (0.26 | ) | | | (0.04 | ) | | | (0.30 | ) | | | 11.03 | | | | 4.22 | | | | 262,187 | | | | 0.77 | | | | 0.77 | | | | 2.91 | | | | 36 | |
|
For the Year Ended December 31, 2015 | |
IA | | $ | 11.63 | | | $ | 0.33 | | | $ | (0.39 | ) | | $ | (0.06 | ) | | $ | (0.36 | ) | | $ | (0.28 | ) | | $ | (0.64 | ) | | $ | 10.93 | | | | (0.59 | )% | | $ | 2,448,280 | | | | 0.51 | % | | | 0.51 | % | | | 2.88 | % | | | 66 | % |
IB | | | 11.56 | | | | 0.30 | | | | (0.39 | ) | | | (0.09 | ) | | | (0.32 | ) | | | (0.28 | ) | | | (0.60 | ) | | | 10.87 | | | | (0.81 | ) | | | 295,006 | | | | 0.76 | | | | 0.76 | | | | 2.63 | | | | 66 | |
|
For the Year Ended December 31, 2014 | |
IA | | $ | 11.35 | | | $ | 0.33 | | | $ | 0.34 | | | $ | 0.67 | | | $ | (0.39 | ) | | $ | — | | | $ | (0.39 | ) | | $ | 11.63 | | | | 5.89 | % | | $ | 2,879,633 | | | | 0.50 | % | | | 0.50 | % | | | 2.85 | % | | | 84 | % |
IB | | | 11.27 | | | | 0.30 | | | | 0.34 | | | | 0.64 | | | | (0.35 | ) | | | — | | | | (0.35 | ) | | | 11.56 | | | | 5.68 | | | | 360,006 | | | | 0.75 | | | | 0.75 | | | | 2.60 | | | | 84 | |
|
For the Year Ended December 31, 2013 | |
IA | | $ | 11.99 | | | $ | 0.32 | | | $ | (0.49 | ) | | $ | (0.17 | ) | | $ | (0.47 | ) | | $ | — | | | $ | (0.47 | ) | | $ | 11.35 | | | | (1.36 | )% | | $ | 3,290,622 | | | | 0.50 | % | | | 0.50 | % | | | 2.76 | % | | | 81 | % |
IB | | | 11.91 | | | | 0.29 | | | | (0.50 | ) | | | (0.21 | ) | | | (0.43 | ) | | | — | | | | (0.43 | ) | | | 11.27 | | | | (1.66 | ) | | | 414,910 | | | | 0.75 | | | | 0.75 | | | | 2.51 | | | | 81 | |
The accompanying notes are an integral part of these financial statements.
Financial Highlights – (continued)
| | | | | | | | | | | | | | | | | | | | | | | | | | | | | | | | | | | | | | | | | | | | | | | | | | | | | | | | |
| | | — Selected Per-Share Data(1) — | | | — Ratios and Supplemental Data — | |
Class | | Net Asset
Value at
Beginning
of Period | | | Net
Investment
Income
(Loss) | | | Net
Realized
and
Unrealized
Gain (Loss)
on
Investments | | | Total from
Investment
Operations | | | Dividends
from Net
Investment
Income | | | Distributions
from
Capital
Gains | | | Total
Dividends
and
Distributions | | | Net
Asset
Value at
End of
Period | | | Total
Return(2) | | | Net
Assets at
End of
Period
(000s) | | | Ratio of
Expenses
to
Average
Net
Assets
Before
Adjust-
ments(3) | | | Ratio of
Expenses
to
Average
Net
Assets
After
Adjust-
ments(3) | | | Ratio of
Net
Investment
Income
(Loss) to
Average
Net Assets | | | Portfolio
Turnover | |
| Hartford Ultrashort Bond HLS Fund | |
For the Six-Month Period Ended June 30, 2018 (Unaudited) | |
IA | | $ | 10.06 | | | $ | 0.08 | | | $ | (0.02 | ) | | $ | 0.06 | | | $ | — | | | $ | — | | | $ | — | | | $ | 10.12 | | | | 0.60 | %(4) | | $ | 440,723 | | | | 0.45 | %(5) | | | 0.45 | %(5) | | | 1.53 | %(5) | | | 18 | % |
IB | | | 10.05 | | | | 0.06 | | | | (0.01 | ) | | | 0.05 | | | | — | | | | — | | | | — | | | | 10.10 | | | | 0.50 | (4) | | | 62,631 | | | | 0.70 | (5) | | | 0.70 | (5) | | | 1.29 | (5) | | | 18 | |
|
For the Year Ended December 31, 2017 | |
IA | | $ | 10.04 | | | $ | 0.10 | | | $ | — | (8) | | $ | 0.10 | | | $ | (0.08 | ) | | $ | — | | | $ | (0.08 | ) | | $ | 10.06 | | | | 1.01 | % | | $ | 460,643 | | | | 0.45 | % | | | 0.45 | % | | | 1.00 | % | | | 60 | % |
IB | | | 10.02 | | | | 0.07 | | | | 0.01 | (8) | | | 0.08 | | | | (0.05 | ) | | | — | | | | (0.05 | ) | | | 10.05 | | | | 0.80 | | | | 65,424 | | | | 0.70 | | | | 0.70 | | | | 0.75 | | | | 60 | |
|
For the Year Ended December 31, 2016 | |
IA | | $ | 9.99 | | | $ | 0.06 | | | $ | 0.04 | | | $ | 0.10 | | | $ | (0.05 | ) | | $ | — | | | $ | (0.05 | ) | | $ | 10.04 | | | | 0.97 | % | | $ | 533,091 | | | | 0.45 | % | | | 0.45 | % | | | 0.61 | % | | | 51 | % |
IB | | | 9.97 | | | | 0.04 | | | | 0.02 | | | | 0.06 | | | | (0.01 | ) | | | — | | | | (0.01 | ) | | | 10.02 | | | | 0.64 | | | | 78,658 | | | | 0.70 | | | | 0.70 | | | | 0.35 | | | | 51 | |
|
For the Year Ended December 31, 2015 | |
IA | | $ | 10.01 | | | $ | 0.03 | | | $ | (0.02 | ) | | $ | 0.01 | | | $ | (0.03 | ) | | $ | — | | | $ | (0.03 | ) | | $ | 9.99 | | | | 0.13 | % | | $ | 611,087 | | | | 0.43 | % | | | 0.43 | % | | | 0.33 | % | | | 35 | % |
IB | | | 9.98 | | | | 0.01 | | | | (0.02 | ) | | | (0.01 | ) | | | — | | | | — | | | | — | | | | 9.97 | | | | (0.09 | ) | | | 96,970 | | | | 0.68 | | | | 0.68 | | | | 0.08 | | | | 35 | |
|
For the Year Ended December 31, 2014 | |
IA | | $ | 10.00 | | | $ | 0.02 | | | $ | (0.01 | ) | | $ | 0.01 | | | $ | — | | | $ | — | | | $ | — | | | $ | 10.01 | | | | 0.10 | % | | $ | 745,597 | | | | 0.43 | % | | | 0.43 | % | | | 0.23 | % | | | 40 | % |
IB | | | 9.99 | | | | — | | | | (0.01 | ) | | | (0.01 | ) | | | — | | | | — | | | | — | | | | 9.98 | | | | (0.10 | ) | | | 121,168 | | | | 0.68 | | | | 0.68 | | | | (0.02 | ) | | | 40 | |
|
For the Year Ended December 31, 2013(10)(11) | |
IA | | $ | 10.00 | | | $ | — | | | $ | — | | | $ | — | | | $ | — | | | $ | — | | | $ | — | | | $ | 10.00 | | | | — | % | | $ | 1,013,110 | | | | 0.45 | % | | | 0.21 | % | | | (0.02 | )% | | | 6 | %(12) |
IB | | | 10.00 | | | | (0.01 | ) | | | — | | | | (0.01 | ) | | | — | | | | — | | | | — | | | | 9.99 | | | | (0.10 | ) | | | 163,058 | | | | 0.49 | | | | 0.25 | | | | (0.06 | ) | | | 6 | (12) |
|
| Hartford U.S. Government Securities HLS Fund | |
For the Six-Month Period Ended June 30, 2018 (Unaudited) | |
IA | | $ | 10.21 | | | $ | 0.11 | | | $ | (0.16 | ) | | $ | (0.05 | ) | | $ | — | | | $ | — | | | $ | — | | | $ | 10.16 | | | | (0.49 | )%(4) | | $ | 304,331 | | | | 0.51 | %(5) | | | 0.51 | %(5) | | | 2.10 | %(5) | | | 18 | % |
IB | | | 10.20 | | | | 0.09 | | | | (0.16 | ) | | | (0.07 | ) | | | — | | | | — | | | | — | | | | 10.13 | | | | (0.69 | )(4) | | | 64,704 | | | | 0.76 | (5) | | | 0.76 | (5) | | | 1.85 | (5) | | | 18 | |
|
For the Year Ended December 31, 2017 | |
IA | | $ | 10.30 | | | $ | 0.19 | | | $ | (0.05 | ) | | $ | 0.14 | | | $ | (0.23 | ) | | $ | — | | | $ | (0.23 | ) | | $ | 10.21 | | | | 1.32 | % | | $ | 329,889 | | | | 0.51 | % | | | 0.51 | % | | | 1.79 | % | | | 109 | % |
IB | | | 10.28 | | | | 0.16 | | | | (0.04 | ) | | | 0.12 | | | | (0.20 | ) | | | — | | | | (0.20 | ) | | | 10.20 | | | | 1.11 | | | | 70,185 | | | | 0.76 | | | | 0.76 | | | | 1.54 | | | | 109 | |
|
For the Year Ended December 31, 2016 | |
IA | | $ | 10.34 | | | $ | 0.18 | | | $ | (0.02 | )(8) | | $ | 0.16 | | | $ | (0.20 | ) | | $ | — | | | $ | (0.20 | ) | | $ | 10.30 | | | | 1.54 | % | | $ | 368,740 | | | | 0.51 | % | | | 0.51 | % | | | 1.67 | % | | | 81 | % |
IB | | | 10.32 | | | | 0.15 | | | | (0.02 | )(8) | | | 0.13 | | | | (0.17 | ) | | | — | | | | (0.17 | ) | | | 10.28 | | | | 1.27 | | | | 79,489 | | | | 0.76 | | | | 0.76 | | | | 1.42 | | | | 81 | |
|
For the Year Ended December 31, 2015 | |
IA | | $ | 10.37 | | | $ | 0.16 | | | $ | — | | | $ | 0.16 | | | $ | (0.19 | ) | | $ | — | | | $ | (0.19 | ) | | $ | 10.34 | | | | 1.56 | % | | $ | 412,060 | | | | 0.49 | % | | | 0.49 | % | | | 1.53 | % | | | 42 | % |
IB | | | 10.34 | | | | 0.13 | | | | 0.01 | | | | 0.14 | | | | (0.16 | ) | | | — | | | | (0.16 | ) | | | 10.32 | | | | 1.35 | | | | 90,088 | | | | 0.74 | | | | 0.74 | | | | 1.28 | | | | 42 | |
|
For the Year Ended December 31, 2014 | |
IA | | $ | 10.32 | | | $ | 0.15 | | | $ | 0.14 | | | $ | 0.29 | | | $ | (0.24 | ) | | $ | — | | | $ | (0.24 | ) | | $ | 10.37 | | | | 2.81 | % | | $ | 468,967 | | | | 0.48 | % | | | 0.48 | % | | | 1.40 | % | | | 37 | % |
IB | | | 10.28 | | | | 0.12 | | | | 0.15 | | | | 0.27 | | | | (0.21 | ) | | | — | | | | (0.21 | ) | | | 10.34 | | | | 2.59 | | | | 102,235 | | | | 0.73 | | | | 0.73 | | | | 1.15 | | | | 37 | |
|
For the Year Ended December 31, 2013 | |
IA | | $ | 10.75 | | | $ | 0.12 | | | $ | (0.30 | ) | | $ | (0.18 | ) | | $ | (0.25 | ) | | $ | — | | | $ | (0.25 | ) | | $ | 10.32 | | | | (1.68 | )% | | $ | 556,169 | | | | 0.49 | % | | | 0.49 | % | | | 1.14 | % | | | 39 | % |
IB | | | 10.71 | | | | 0.09 | | | | (0.30 | ) | | | (0.21 | ) | | | (0.22 | ) | | | — | | | | (0.22 | ) | | | 10.28 | | | | (1.97 | ) | | | 123,908 | | | | 0.74 | | | | 0.74 | | | | 0.89 | | | | 39 | |
The accompanying notes are an integral part of these financial statements.
Financial Highlights – (continued)
| | | | | | | | | | | | | | | | | | | | | | | | | | | | | | | | | | | | | | | | | | | | | | | | | | | | | | | | |
| | | — Selected Per-Share Data(1) — | | | — Ratios and Supplemental Data — | |
Class | | Net Asset
Value at
Beginning
of Period | | | Net
Investment
Income
(Loss) | | | Net
Realized
and
Unrealized
Gain (Loss)
on
Investments | | | Total from
Investment
Operations | | | Dividends
from Net
Investment
Income | | | Distributions
from
Capital
Gains | | | Total
Dividends
and
Distributions | | | Net
Asset
Value at
End of
Period | | | Total
Return(2) | | | Net
Assets at
End of
Period
(000s) | | | Ratio of
Expenses
to
Average
Net
Assets
Before
Adjust-
ments(3) | | | Ratio of
Expenses
to
Average
Net
Assets
After
Adjust-
ments(3) | | | Ratio of
Net
Investment
Income
(Loss) to
Average
Net Assets | | | Portfolio
Turnover | |
| Hartford Value HLS Fund | |
For the Six-Month Period Ended June 30, 2018 (Unaudited) | |
IA | | $ | 16.05 | | | $ | 0.15 | | | $ | (0.34 | ) | | $ | (0.19 | ) | | $ | — | | | $ | — | | | $ | — | | | $ | 15.86 | | | | (1.18 | )%(4) | | $ | 414,686 | | | | 0.72 | %(5) | | | 0.72 | %(5) | | | 1.83 | %(5) | | | 11 | % |
IB | | | 16.02 | | | | 0.13 | | | | (0.33 | ) | | | (0.20 | ) | | | — | | | | — | | | | — | | | | 15.82 | | | | (1.25 | )(4) | | | 69,288 | | | | 0.97 | (5) | | | 0.97 | (5) | | | 1.57 | (5) | | | 11 | |
|
For the Year Ended December 31, 2017 | |
IA | | $ | 15.27 | | | $ | 0.25 | | | $ | 1.98 | | | $ | 2.23 | | | $ | (0.28 | ) | | $ | (1.17 | ) | | $ | (1.45 | ) | | $ | 16.05 | | | | 15.44 | % | | $ | 450,788 | | | | 0.80 | % | | | 0.80 | % | | | 1.56 | % | | | 14 | % |
IB | | | 15.26 | | | | 0.21 | | | | 1.96 | | | | 2.17 | | | | (0.24 | ) | | | (1.17 | ) | | | (1.41 | ) | | | 16.02 | | | | 15.04 | | | | 75,698 | | | | 1.05 | | | | 1.05 | | | | 1.31 | | | | 14 | |
|
For the Year Ended December 31, 2016 | |
IA | | $ | 15.58 | | | $ | 0.28 | | | $ | 1.75 | | | $ | 2.03 | | | $ | (0.26 | ) | | $ | (2.08 | ) | | $ | (2.34 | ) | | $ | 15.27 | | | | 13.69 | % | | $ | 446,411 | | | | 0.80 | % | | | 0.80 | % | | | 1.83 | % | | | 15 | % |
IB | | | 15.57 | | | | 0.24 | | | | 1.75 | | | | 1.99 | | | | (0.22 | ) | | | (2.08 | ) | | | (2.30 | ) | | | 15.26 | | | | 13.46 | | | | 77,796 | | | | 1.05 | | | | 1.05 | | | | 1.58 | | | | 15 | |
|
For the Year Ended December 31, 2015 | |
IA | | $ | 16.89 | | | $ | 0.26 | | | $ | (0.77 | ) | | $ | (0.51 | ) | | $ | (0.26 | ) | | $ | (0.54 | ) | | $ | (0.80 | ) | | $ | 15.58 | | | | (3.08 | )% | | $ | 455,713 | | | | 0.78 | % | | | 0.78 | % | | | 1.56 | % | | | 19 | % |
IB | | | 16.88 | | | | 0.22 | | | | (0.77 | ) | | | (0.55 | ) | | | (0.22 | ) | | | (0.54 | ) | | | (0.76 | ) | | | 15.57 | | | | (3.35 | ) | | | 80,052 | | | | 1.03 | | | | 1.03 | | | | 1.30 | | | | 19 | |
|
For the Year Ended December 31, 2014 | |
IA | | $ | 15.39 | | | $ | 0.24 | | | $ | 1.51 | | | $ | 1.75 | | | $ | (0.25 | ) | | $ | — | | | $ | (0.25 | ) | | $ | 16.89 | | | | 11.37 | % | | $ | 523,661 | | | | 0.77 | % | | | 0.77 | % | | | 1.51 | % | | | 14 | % |
IB | | | 15.38 | | | | 0.20 | | | | 1.51 | | | | 1.71 | | | | (0.21 | ) | | | — | | | | (0.21 | ) | | | 16.88 | | | | 11.10 | | | | 98,407 | | | | 1.02 | | | | 1.02 | | | | 1.26 | | | | 14 | |
|
For the Year Ended December 31, 2013 | |
IA | | $ | 11.86 | | | $ | 0.23 | | | $ | 3.55 | | | $ | 3.78 | | | $ | (0.25 | ) | | $ | — | | | $ | (0.25 | ) | | $ | 15.39 | | | | 31.94 | % | | $ | 551,350 | | | | 0.76 | % | | | 0.76 | % | | | 1.66 | % | | | 19 | % |
IB | | | 11.85 | | | | 0.20 | | | | 3.54 | | | | 3.74 | | | | (0.21 | ) | | | — | | | | (0.21 | ) | | | 15.38 | | | | 31.65 | | | | 109,081 | | | | 1.01 | | | | 1.01 | | | | 1.41 | | | | 19 | |
| (1) | Information presented relates to a share outstanding throughout the indicated period. Net investment income (loss) per share amounts are calculated based on average shares outstanding unless otherwise noted. |
| (2) | The figures do not include sales charges or other fees which may be applied at the variable contract level or by a qualified pension or retirement plan. Any such additional sales charges or other fees would lower the Fund’s performance. |
| (3) | Adjustments include waivers and reimbursements, if applicable. Ratios do not include fees paid indirectly (see Expenses in the accompanying Notes to Financial Statements). |
| (6) | Commenced operations on April 30, 2014. |
| (7) | During the year ended December 31, 2014, the Fund incurred $61.8 million in sales associated with the transition of assets from Hartford Global Research HLS Fund, which merged into the Fund on June 23, 2014. These sales were excluded from the portfolio turnover rate calculation. |
| (8) | Per share amount was not in accord with the net realized and unrealized gain (loss) for the period because of the timing of transactions in shares of the Fund and the amount and timing of per-share net realized and unrealized gain (loss) on such shares. |
| (9) | During the year ended December 31, 2014, the Fund incurred $137.9 million in sales associated with the transition of assets from Hartford Growth HLS Fund, which merged into the Fund on June 23, 2014. These sales were excluded from the portfolio turnover rate calculation. |
| (10) | Net investment income (loss) per share amounts have been calculated using the Securities and Exchange Commission method. |
| (11) | Per share amounts have been restated to reflect a reverse stock split effective October 21, 2013. Please see Notes to Financial Statements. |
| (12) | Portfolio turnover shown is from October 21, 2013 (conversion date) through December 31, 2013. |
The accompanying notes are an integral part of these financial statements.
Notes to Financial Statements
June 30, 2018 (Unaudited)
Hartford Series Fund, Inc. and Hartford HLS Series Fund II, Inc. (each, a “Company” and collectively, the “Companies”) are each an open-end registered management investment company comprised of fifteen and four series, respectively, as of June 30, 2018. Financial statements for the series of each Company listed below (each, a “Fund” and collectively, the “Funds”) are included in this report.
Hartford Series Fund, Inc.:
Hartford Balanced HLS Fund (the “Balanced HLS Fund”)
Hartford Capital Appreciation HLS Fund (the “Capital Appreciation HLS Fund”)
Hartford Disciplined Equity HLS Fund (the “Disciplined Equity HLS Fund”)
Hartford Dividend and Growth HLS Fund (the “Dividend and Growth HLS Fund”)
Hartford Global Growth HLS Fund (the “Global Growth HLS Fund”)
Hartford Healthcare HLS Fund (the “Healthcare HLS Fund”)
Hartford High Yield HLS Fund (the “High Yield HLS Fund”)
Hartford International Opportunities HLS Fund (the “International Opportunities HLS Fund”)
Hartford MidCap HLS Fund (the “MidCap HLS Fund”)
Hartford MidCap Value HLS Fund (the “MidCap Value HLS Fund”)
Hartford Small Company HLS Fund (the “Small Company HLS Fund”)
Hartford Stock HLS Fund (the “Stock HLS Fund”)
Hartford Total Return Bond HLS Fund (the “Total Return Bond HLS Fund”)
Hartford Ultrashort Bond HLS Fund (the “Ultrashort Bond HLS Fund”)
Hartford Value HLS Fund (the “Value HLS Fund”)
Hartford HLS Series Fund II, Inc.:
Hartford Growth Opportunities HLS Fund (the “Growth Opportunities HLS Fund”)
Hartford Small Cap Growth HLS Fund (the “Small Cap Growth HLS Fund”)
Hartford Small/Mid Cap Equity HLS Fund (the “Small/Mid Cap Equity HLS Fund”)
Hartford U.S. Government Securities HLS Fund (the “U.S. Government Securities HLS Fund”)
The assets of each Fund are separate, and a shareholder’s interest is limited to the Fund in which shares are held. Each Company is organized under the laws of the State of Maryland and is registered with the Securities and Exchange Commission (the “SEC”) under the Investment Company Act of 1940, as amended (the “1940 Act”). Each Fund serves as an underlying investment option for certain variable annuity and variable life insurance separate accounts. Owners of variable annuity contracts and policyholders of variable life insurance contracts may choose the Funds if permitted in the variable insurance contract prospectus. In addition, participants in certain qualified pension or retirement plans may choose the Funds if permitted by their plans.
Each Fund is a diversified open-end management investment company. Each Fund applies specialized accounting and reporting standards under Accounting Standards Codification Topic 946, “Financial Services – Investment Companies.”
Each Fund, except Balanced HLS Fund, Capital Appreciation HLS Fund, Dividend and Growth HLS Fund, Global Growth HLS Fund, Growth Opportunities HLS Fund, International Opportunities HLS Fund, MidCap HLS Fund, Small/Mid Cap Equity HLS Fund and Stock HLS, is divided into Class IA and Class IB shares. Balanced HLS Fund, Capital Appreciation HLS Fund, Dividend and Growth HLS Fund, Global Growth HLS Fund, Growth Opportunities HLS Fund, International Opportunities HLS Fund, MidCap HLS Fund, Small/Mid Cap Equity HLS Fund and Stock HLS Fund are divided into Class IA, Class IB and Class IC shares. Class IC shares have not commenced operations for Balanced HLS Fund, Dividend and Growth HLS Fund, Global Growth HLS Fund, International Opportunities HLS Fund, MidCap HLS Fund, Small/Mid Cap Equity HLS Fund and Stock HLS Fund as of the date of this report. Each of Balanced HLS Fund, Capital Appreciation HLS Fund, Disciplined Equity HLS Fund, Dividend and Growth HLS Fund, Global Growth HLS Fund, Growth Opportunities HLS Fund, Healthcare HLS Fund, High Yield HLS Fund, International Opportunities HLS Fund, MidCap HLS Fund, MidCap Value HLS Fund, Small/Mid Cap Equity HLS Fund, Stock HLS Fund, Total Return Bond HLS Fund, Ultrashort Bond HLS Fund, U.S. Government Securities HLS Fund and Value HLS Fund is closed to new qualified pension and retirement plans until further notice, subject to certain exceptions. Small Cap Growth HLS Fund and Small Company HLS Fund are closed to new investors until further notice, subject to certain exceptions. For more information please see the Fund’s prospectus. Each class is offered at the per share net asset value (“NAV”) without a sales charge and is subject to the same expenses, except certain class specific expenses. Class IB shares are subject to distribution and service fees charged pursuant to a Distribution Plan adopted in accordance with Rule 12b-1 under the 1940 Act. Class IC
Notes to Financial Statements – (continued)
June 30, 2018 (Unaudited)
shares are subject to distribution fees charged pursuant to a Distribution Plan adopted in accordance with Rule 12b-1 under the 1940 Act and Class IC shares are also subject to an administrative service fee.
| 2. | Significant Accounting Policies: |
The following is a summary of significant accounting policies of each Fund used in the preparation of its financial statements, which are in accordance with United States Generally Accepted Accounting Principles (“U.S. GAAP”). The preparation of financial statements in accordance with U.S. GAAP may require management to make estimates and assumptions that affect the reported amounts of assets and liabilities and disclosure of contingent assets and liabilities at the date of the financial statements and the reported amounts of increases and decreases in net assets from operations during the reporting period. Actual results could differ from those estimates.
| | a) | Determination of Net Asset Value – The NAV of each class of each Fund’s shares is determined as of the close of regular trading (normally 4:00 p.m. Eastern Time) (the “NYSE Close”) on each day that the New York Stock Exchange (the “Exchange”) is open (“Valuation Date”). Information that becomes known to the Funds after the NAV has been calculated on a particular day will not generally be used to retroactively adjust the NAV determined earlier that day. |
| | b) | Investment Valuation and Fair Value Measurements – For purposes of calculating the NAV of each Fund, portfolio securities and other assets held in the Fund’s portfolio for which market prices are readily available are valued at market value. Market value is generally determined on the basis of last reported trade prices or official close price. If no trades were reported, market value is based on prices obtained from a quotation reporting system, established market makers, or independent pricing services. If market prices are not readily available or are deemed unreliable, a Fund will use the fair value of the security or other instrument as determined in good faith under policies and procedures established by and under the supervision of the respective Company’s Board of Directors. Market prices are considered not readily available where there is an absence of current or reliable market-based data (e.g., trade information or broker quotes), including where events occur after the close of the relevant market, but prior to the NYSE Close, that materially affect the values of a Fund’s portfolio holdings or assets. In addition, market prices are considered not readily available when, due to extraordinary circumstances, the exchanges or markets on which the securities or other instruments trade do not open for trading for the entire day and no other market prices are available. In addition, prices of foreign equities that are principally traded on certain foreign markets will generally be adjusted daily pursuant to a fair value pricing service approved by the respective Company’s Board of Directors in order to reflect an adjustment for the factors occurring after the close of certain foreign markets but before the NYSE Close. Securities and other instruments that are primarily traded on foreign markets may trade on days that are not business days of the Funds. The value of the foreign securities or other instruments in which a Fund invests may change on days when a shareholder will not be able to purchase or redeem shares of the Fund. Fair value pricing is subjective in nature and the use of fair value pricing by a Fund may cause the NAV of its shares to differ significantly from the NAV that would have been calculated using market prices at the close of the exchange on which a portfolio holding is primarily traded. There can be no assurance that a Fund could obtain the fair value assigned to an investment if the Fund were to sell the investment at approximately the time at which the Fund determines its NAV. |
Fixed income investments (other than short-term obligations and senior floating rate interests), non-exchange-traded derivatives and centrally cleared swaps held by a Fund are normally valued on the basis of quotes obtained from brokers and dealers or independent pricing services in accordance with procedures established by the respective Company’s Board of Directors. Prices obtained from independent pricing services use information provided by market makers or estimates of market values obtained from yield data relating to investments or securities with similar characteristics. Senior floating rate interests generally trade in over-the-counter (“OTC”) markets and are priced through an independent pricing service utilizing independent market quotations from loan dealers or financial institutions. Generally, a Fund may use fair valuation in regard to fixed income positions when the Fund holds defaulted or distressed investments or investments in a company in which a reorganization is pending. Short-term investments maturing in 60 days or less are generally valued at amortized cost if their original term to maturity was 60 days or less, or by amortizing their value on the 61st day prior to maturity, if the original term exceeded 60 days.
Exchange-traded options, futures and options on futures are valued at the settlement price or last trade price determined by the relevant exchange as of the NYSE Close. If a last trade price is not available, the value will be the mean of the bid and ask prices as of the NYSE Close. If a mean of the bid and ask prices cannot be calculated for the day, the value will be the bid price as of the NYSE Close. In the case of options privately negotiated in the OTC market (“OTC options”) and such instruments that do not trade on an exchange, values may be supplied by a pricing service using a formula or other objective method that may take into consideration the style, direction, expiration, strike price, notional value and volatility or other special adjustments.
Notes to Financial Statements – (continued)
June 30, 2018 (Unaudited)
Investments valued in currencies other than U.S. dollars are converted to U.S. dollars using exchange rates obtained from independent pricing services for calculation of the NAV. As a result, the NAV of a Fund’s shares may be affected by changes in the value of currencies in relation to the U.S. dollar. The value of securities or other instruments traded in markets outside the United States or denominated in currencies other than the U.S. dollar may be affected significantly on a day that the NYSE is closed and the market value may change on days when an investor is not able to purchase, redeem or exchange shares of a Fund.
Foreign currency contracts represent agreements to exchange currencies on specific future dates at predetermined rates. Foreign currency contracts are valued using foreign currency exchange rates and forward rates as provided by an independent pricing service on the Valuation Date.
Investments in open-end mutual funds are valued at the respective NAV of each open-end mutual fund as determined in accordance with its valuation procedures. Such open-end mutual funds may use fair value pricing as disclosed in their prospectus.
Financial instruments for which prices are not available from an independent pricing service may be valued using market quotations obtained from one or more dealers that make markets in the respective financial instrument in accordance with procedures established by the respective Company’s Board of Directors.
U.S. GAAP defines fair value as the price that a Fund would receive to sell an asset or pay to transfer a liability in an orderly transaction between market participants. The U.S. GAAP fair value measurement standards require disclosure of a fair value hierarchy for each major category of assets and liabilities. Various inputs are used in determining the fair value of each Fund‘s investments. These inputs are summarized into three broad hierarchy levels. This hierarchy is based on whether the valuation inputs are observable or unobservable. These levels are:
| | • | | Level 1 – Quoted prices in active markets for identical investments. Level 1 may include exchange-traded instruments, such as domestic equities, some foreign equities, options, futures, mutual funds, exchange-traded funds, rights and warrants. |
| | • | | Level 2 – Observable inputs other than Level 1 prices, such as quoted prices for similar investments; quoted prices in markets that are not active; or other inputs that are observable or can be corroborated by observable market data. Level 2 may include debt investments that are traded less frequently than exchange-traded instruments and which are valued using independent pricing services; foreign equities, which are principally traded on certain foreign markets and are adjusted daily pursuant to a fair value pricing service in order to reflect an adjustment for the factors occurring after the close of certain foreign markets but before the NYSE Close; senior floating rate interests, which are valued using an aggregate of dealer bids; short-term investments, which are valued at amortized cost; and swaps, which are valued based upon the terms of each swap contract. |
| | • | | Level 3 – Significant unobservable inputs that are supported by limited or no market activity. Level 3 may include financial instruments whose values are determined using indicative market quotes or require significant management judgment or estimation. These unobservable valuation inputs may include estimates for current yields, maturity/duration, prepayment speed, and indicative market quotes for comparable investments along with other assumptions relating to credit quality, collateral value, complexity of the investment structure, general market conditions and liquidity. This category may include investments where trading has been halted or there are certain restrictions on trading. While these investments are priced using unobservable inputs, the valuation of these investments reflects the best available data and management believes the prices are a reasonable representation of exit price. |
The Board of Directors of each Company generally reviews and approves the “Procedures for Valuation of Portfolio Investments” at least once a year. These procedures define how investments are to be valued, including the formation and activities of a Valuation Committee. The Valuation Committee is responsible for determining in good faith the fair value of investments when the value cannot be obtained from primary pricing services or alternative sources or if the valuation of an investment as provided by the primary pricing service or alternative source is believed not to reflect the investment’s fair value as of the Valuation Date. The Valuation Committee will consider all relevant factors in determining an investment’s fair value, and may seek the advice of such Fund’s sub-adviser, as applicable, knowledgeable brokers, and legal counsel in making such determination. The Valuation Committee reports to the Audit Committee of each Company’s Board of Directors. The Audit Committee receives quarterly written reports which include details of all fair-valued investments, including the reason for the fair valuation, and an indication, when possible, of the accuracy of the valuation by disclosing the next available reliable public price quotation or the disposition price of such investments (the “lookback” test). The Board of Directors of each Company then must consider for ratification all of the fair value determinations made during the previous quarter.
Notes to Financial Statements – (continued)
June 30, 2018 (Unaudited)
Valuation levels are not necessarily indicative of the risk associated with investing in such investments. Individual investments within any of the above mentioned asset classes may be assigned a different hierarchical level than those presented above, as individual circumstances dictate.
For additional information, refer to the Fair Valuation Summary and the Level 3 roll-forward reconciliation, if applicable, which follows each Fund’s Schedule of Investments.
Following is quantitative information about Level 3 fair value measurements:
Growth Opportunities HLS Fund Level 3 Holdings on June 30, 2018
Quantitative Information about Level 3 Fair Value Measurements:
| | | | | | | | | | |
Security Type / Valuation Technique* | | Unobservable Input | | Input Value(s)
Range | | | Fair Value at
June 30, 2018 | |
Common Stock | | | | | | | | | | |
Cost | | Trade Price | | | $0.00 to $61.81 | | | $ | 8,565,473 | |
Model | | EV/Estimated Revenue | | | 2.3x to 3.8x | | | | 5,706,328 | |
Model | | Price/Earnings | | | 18.7x | | | | 2,611,140 | |
| | | |
Preferred Stock | | | | | | | | | | |
Model | | EV/Estimated Revenue | | | 2.1x to 3.8x | | | | 7,675,259 | |
Cost | | Trade Price | | | $4.97 to $40.00 | | | | 34,691,359 | |
| | | |
Convertible Preferred Stock | | | | | | | | | | |
Model | | EV/Estimated Revenue | | | 3.8x to 6.4x | | | | 7,142,652 | |
Cost | | Trade Price | | | $25.64 to $61.81 | | | | 28,354,889 | |
| | | | | | | | | | |
Total | | | | | | | | $ | 94,747,100 | |
| | | | | | | | | | |
| | * | The Valuation Committee may consider applying appropriate valuation methodologies, which may include, but are not limited to: valuation through use of a “proxy” investment or index, discount from market value of a similar freely traded investment, a discount or premium which may consider market or regulatory sentiment (or other subjective determinations, inputs or factors not otherwise quantifiable), and any other appropriate method. |
Small Company HLS Fund Level 3 Holdings on June 30, 2018
Quantitative Information about Level 3 Fair Value Measurements:
| | | | | | | | | | |
Security Type / Valuation Technique* | | Unobservable Input | | Input Value(s)
Range | | | Fair Value at
June 30, 2018 | |
Common Stock | | | | | | | | | | |
Cost | | Trade Price | | | $0.00 to $4.02 | | | $ | 724,657 | |
Model | | EV/EBITDA | | | 6.2x | | | | 2,307,544 | |
Model | | EV/Estimated Revenue | | | 2.3x to 2.8x | | | | 4,113,174 | |
| | | |
Preferred Stock | | | | | | | | | | |
Model | | EV/Estimated Revenue | | | 2.1x | | | | 4,103,000 | |
Cost | | Trade Price | | | $36.37 | | | | 2,617,521 | |
| | | |
Convertible Preferred Stock | | | | | | | | | | |
Cost | | Trade Price | | | $25.64 | | | | 13,156,837 | |
| | | | | | | | | | |
Total | | | | | | | | $ | 27,022,733 | |
| | | | | | | | | | |
| | * | The Valuation Committee may consider applying appropriate valuation methodologies, which may include, but are not limited to: valuation through use of a “proxy” investment or index, discount from market value of a similar freely traded investment, a discount or premium which may consider market or regulatory sentiment (or other subjective determinations, inputs or factors not otherwise quantifiable), and any other appropriate method. |
| | c) | Investment Transactions and Investment Income – Investment transactions are recorded as of the trade date (the date the order to buy or sell is executed) for financial reporting purposes. Investments purchased or sold on a when-issued or delayed-delivery basis may be settled a month or more after the trade date. Realized gains and losses are determined on the basis of identified cost. |
Trade date for senior floating rate interests purchased in the primary loan market is considered the date on which the loan allocations are determined. Trade date for senior floating rate interests purchased in the secondary loan market is the date on which the transaction is entered into.
Notes to Financial Statements – (continued)
June 30, 2018 (Unaudited)
Dividend income from domestic securities is accrued on the ex-dividend date. In general, dividend income from foreign securities is recorded on the ex-date; however, dividend notifications in certain foreign jurisdictions may not be available in a timely manner and as a result, a Fund will record the dividend as soon as the relevant details (i.e., rate per share, payment date, shareholders of record, etc.) are publicly available. Interest income, including amortization of premium, accretion of discounts, inflation adjustments and additional principal received in-kind in lieu of cash, is accrued on a daily basis. Paydown gains and losses on mortgage-related and other asset-backed securities are included in interest income in the Statements of Operations, as applicable.
| | d) | Taxes – A Fund may be subject to taxes imposed on realized gains on securities of certain foreign countries in which such a Fund invests. A Fund may also be subject to taxes withheld on foreign dividends from securities in which the Fund invests. The amount of any foreign taxes withheld and foreign tax expense is included on the accompanying Statements of Operations as a reduction to investment income or net realized gain on investments in these securities, if applicable. |
| | e) | Foreign Currency Transactions – Assets and liabilities denominated in currencies other than U.S. dollars are translated into U.S. dollars at the exchange rates in effect on the Valuation Date. Purchases and sales of investments, income and expenses are translated into U.S. dollars at the exchange rates on the dates of such transactions. |
A Fund does not isolate that portion of portfolio investment valuation resulting from fluctuations in the foreign currency exchange rates from the fluctuations arising from changes in the market prices of investments held. Exchange rate fluctuations are included with the net realized and unrealized gain or loss on investments in the accompanying financial statements.
Net realized foreign exchange gains or losses arise from sales of foreign currencies and the difference between asset and liability amounts initially stated in foreign currencies and the U.S. dollar value of the amounts actually received or paid. Net unrealized foreign exchange gains or losses arise from changes in the value of other assets and liabilities at the end of the reporting period, resulting from changes in the exchange rates.
| | f) | Joint Trading Account – A Fund may invest cash balances into a joint trading account that may be invested in one or more repurchase agreements. |
| | g) | Fund Share Valuation and Dividend Distributions to Shareholders – Orders for each Fund’s shares are executed in accordance with the investment instructions of the contract holders and plan participants. The NAV of each Fund’s shares is determined as of the close of business on each business day of the Exchange (see Note 2(a)). The NAV is determined separately for each class of shares of a Fund by dividing the Fund’s net assets attributable to that class by the number of shares of the class outstanding. Each class of shares offered by a Fund has equal rights as to assets and voting privileges (except that shareholders of a class have exclusive voting rights regarding any matter relating solely to that class of shares). Income and non-class specific expenses are allocated daily to each class on the basis of the relative net assets of the class of the Fund. Realized and unrealized gains and losses are allocated daily based on the relative net assets of each class of shares of each Fund. |
Orders for the purchase of a Fund’s shares received prior to the close of the Exchange on any day the Exchange is open for business are priced at the NAV determined as of the close of the Exchange. Orders received after the close of the Exchange, or on a day on which the Exchange and/or the Funds are not open for business, are priced at the next determined NAV.
Dividends are declared pursuant to a policy adopted by the respective Company’s Board of Directors. Dividends and/or distributions to shareholders are recorded on ex-date. The policy of each Fund is to pay dividends from net investment income and realized gains, if any, at least once a year.
Income dividends and capital gains distributions are determined in accordance with federal income tax regulations, which may differ from U.S. GAAP with respect to character and timing (see Federal Income Taxes: Distributions and Components of Distributable Earnings and Reclassification of Capital Accounts notes).
| 3. | Securities and Other Investments: |
| | a) | Illiquid and Restricted Investments – Each Fund is permitted to invest up to 15% of its net assets in illiquid investments. Illiquid investments are those that may not be sold or disposed of in the ordinary course of business within seven days, at approximately the price used to determine a Fund’s NAV. A Fund may not be able to sell illiquid investments when its sub-adviser considers it desirable |
Notes to Financial Statements – (continued)
June 30, 2018 (Unaudited)
| | to do so or may have to sell such investments at a price that is lower than the price that could be obtained if the investments were more liquid. A sale of illiquid investments may require more time and may result in higher dealer discounts and other selling expenses than does the sale of those that are liquid. Illiquid investments also may be more difficult to value due to the unavailability of reliable market quotations for such investments, and an investment in them may have an adverse impact on a Fund’s NAV. Each Fund may also purchase certain investments that can only be resold to certain qualified investors and may be determined to be liquid pursuant to policies and guidelines established by the respective Company’s Board of Directors. See each Fund’s Schedule of Investments, if applicable, for illiquid or restricted investments as of June 30, 2018. |
| | b) | Investments Purchased on a When-Issued or Delayed-Delivery Basis – Delivery and payment for investments that have been purchased by a Fund on a forward commitment, or when-issued or delayed-delivery basis, take place beyond the customary settlement period. A Fund may dispose of or renegotiate a delayed-delivery transaction after it is entered into, and may sell delayed-delivery investments before they are delivered, which may result in a realized gain or loss. During this period, such investments are subject to market fluctuations, and a Fund identifies investments segregated in its records with a value at least equal to the amount of the commitment. See each Fund’s Schedule of Investments, if applicable, for when-issued or delayed-delivery investments as of June 30, 2018. |
In connection with a Fund’s ability to purchase investments on a when-issued or forward commitment basis, the Fund may enter into to-be announced (“TBA”) commitments. TBA commitments are forward agreements for the purchase or sale of mortgage-backed securities for a fixed price, with payment and delivery on an agreed-upon future settlement date. The specific securities to be delivered are not identified at the trade date; however, delivered securities must meet specified terms, including issuer, rate and mortgage terms. Although a Fund may enter into TBA commitments with the intention of acquiring or delivering securities for its portfolio, the Fund can extend the settlement date, roll the transaction, or dispose of a commitment prior to settlement if deemed appropriate to do so. If the TBA commitment is closed through the acquisition of an offsetting TBA commitment, a Fund realizes a gain or loss. In a TBA roll transaction, a Fund generally purchases or sells the initial TBA commitment prior to the agreed upon settlement date and enters into a new TBA commitment for future delivery or receipt of the mortgage backed securities. TBA commitments involve a risk of loss if the value of the security to be purchased or sold declines or increases, respectively, prior to settlement date. These transactions are excluded from a Fund’s portfolio turnover rate. See each Fund’s Schedule of Investments, if applicable, for TBA commitments as of June 30, 2018.
| | c) | Senior Floating Rate Interests – Certain Funds may invest in senior floating rate interests. Senior floating rate interests generally hold the most senior position in the capital structure of a business entity (the “Borrower”), are typically secured by specific collateral and have a claim on the assets and/or stock of the Borrower that is senior to that held by subordinated debtholders and stockholders of the Borrower. Senior floating rate interests are typically structured and administered by a financial institution that acts as the agent of the lenders participating in the senior floating rate interest. A Fund may invest in multiple series or tranches of a senior floating rate interest, which may have varying terms and carry different associated risks. A Fund may also enter into unfunded loan commitments, which are contractual obligations for future funding. Unfunded loan commitments may include revolving credit facilities, which may obligate the Fund to supply additional cash to the Borrower on demand. Unfunded loan commitments represent a future obligation in full. A Fund may receive a commitment fee based on the undrawn portion of the underlying line of credit portion of a senior floating rate interest. In certain circumstances, a Fund may receive various fees upon the restructure of a senior floating rate interest by a borrower. Fees earned/paid may be recorded as a component of income or realized gain/loss in the Statements of Operations. |
Senior floating rate interests are typically rated below-investment-grade, which suggests they are more likely to default and generally pay higher interest rates than investment-grade loans. A default could lead to non-payment of income, which would result in a reduction of income to a Fund, and there can be no assurance that the liquidation of any collateral would satisfy the Borrower’s obligation in the event of non-payment of scheduled interest or principal payments, or that such collateral could be readily liquidated. See each Fund’s Schedule of Investments, if applicable, for outstanding senior floating rate interests as of June 30, 2018.
| | d) | Mortgage-Related and Other Asset-Backed Securities – A Fund may invest in mortgage-related and other asset-backed securities. These securities include mortgage pass-through securities, collateralized mortgage obligations, commercial mortgage-backed securities, stripped mortgage-backed securities, asset-backed securities, collateralized debt obligations and other securities that directly or indirectly represent a participation in, or are secured by and payable from, mortgage loans on real property. Mortgage-related securities are created from pools of residential or commercial mortgage loans, including mortgage loans made by savings and loan institutions, mortgage bankers, commercial banks and others. Asset-backed securities are created from many types of assets, including auto loans, credit card receivables, home equity loans, and student loans. These securities provide a monthly payment that |
Notes to Financial Statements – (continued)
June 30, 2018 (Unaudited)
| | consists of both interest and principal payments. Interest payments may be determined by fixed or adjustable rates. The rate of prepayments on underlying mortgages will affect the price and volatility of a mortgage-related security, and may have the effect of shortening or extending the effective duration of the security relative to what was anticipated at the time of purchase. The timely payment of principal and interest of certain mortgage-related securities is guaranteed by the full faith and credit of the United States Government. Mortgage-related and other asset-backed securities created and guaranteed by non-governmental issuers, including government-sponsored corporations, may be supported by various forms of insurance or guarantees, but there can be no assurance that the private insurers or guarantors can meet their obligations under the insurance policies or guarantee arrangements. See each Fund’s Schedule of Investments, if applicable, for mortgage-related and other asset-backed securities as of June 30, 2018. |
| | e) | Inflation-Indexed Bonds – A Fund may invest in inflation-indexed bonds. Inflation-indexed bonds are fixed income investments whose principal value is periodically adjusted to the rate of inflation. The interest rate on these bonds is generally fixed at issuance at a rate lower than typical bonds. Over the life of an inflation-indexed bond, however, interest will be paid based on a principal value, which is adjusted for inflation. Any increase or decrease in the principal amount of an inflation-indexed bond will be included as interest income on the Statements of Operations, even though investors do not receive the principal amount until maturity. See each Fund’s Schedule of Investments, if applicable, for inflation-indexed bonds as of June 30, 2018. |
| 4. | Financial Derivative Instruments: |
The following disclosures contain information on how and why a Fund may use derivative instruments, the credit-risk-related contingent features in certain derivative instruments, and how derivative instruments affect a Fund’s financial position and results of operations. The location and fair value amounts of these instruments on the Statements of Assets and Liabilities and the realized gains and losses and changes in unrealized gains and losses on the Statements of Operations, each categorized by type of derivative contract, are included in the following Additional Derivative Instrument Information footnote. The derivative instruments outstanding as of period-end are disclosed in the notes to the Schedules of Investments, if applicable. The amounts of realized gains and losses and changes in unrealized gains and losses on derivative instruments during the period are disclosed in the Statements of Operations.
| | a) | Foreign Currency Contracts – A Fund may enter into foreign currency contracts that obligate the Fund to purchase or sell currencies at specified future dates. Foreign currency contracts may be used in connection with settling purchases or sales of securities to hedge the currency exposure associated with some or all of a Fund’s investments and/or as part of an investment strategy. Foreign currency contracts are marked to market daily and the change in value is recorded by a Fund as an unrealized gain or loss. A Fund will record a realized gain or loss when the foreign currency contract is settled. |
Foreign currency contracts involve elements of market risk in excess of the amounts reflected in the Statements of Assets and Liabilities. In addition, risks may arise upon entering into these contracts from the potential inability of the counterparties to meet the terms of the contracts and from unanticipated movements in the value of the foreign currencies relative to the U.S. dollar. Upon entering into a foreign currency contract, a Fund may be required to post margin equal to its outstanding exposure thereunder.
During the six-month period ended June 30, 2018, Capital Appreciation HLS Fund, High Yield HLS Fund and Total Return Bond HLS Fund had used Foreign Currency Contracts.
| | b) | Futures Contracts – A Fund may enter into futures contracts. A futures contract is an agreement between two parties to buy or sell an asset at a set price on a future date. A Fund may use futures contracts to manage risk or obtain exposure to the investment markets, commodities, or movements in interest rates and currency values. The primary risks associated with the use of futures contracts are the imperfect correlation between the change in market value of the investments held by a Fund and the prices of futures contracts and the possibility of an illiquid market. Upon entering into a futures contract, a Fund is required to deposit with a futures commission merchant (“FCM”) an amount of cash or U.S. Government or Agency Obligations in accordance with the initial margin requirements of the broker or exchange. Futures contracts are marked to market daily and an appropriate amount equal to the change in value (“variation margin”) is paid or received by a Fund. Gains or losses are recognized but not considered realized until the contracts expire or are closed. Futures contracts involve, to varying degrees, risk of loss in excess of the variation margin disclosed on the Statements of Assets and Liabilities. |
During the six-month period ended June 30, 2018, Balanced HLS Fund, Capital Appreciation HLS Fund, Total Return Bond HLS Fund and U.S. Government Securities HLS Fund had used Futures Contracts.
| | c) | Options Contracts – An option contract is a contract sold by one party to another party that offers the buyer the right, but not the obligation, to buy (call) or sell (put) an investment or other financial asset at an agreed-upon price during a specific period of time or |
Notes to Financial Statements – (continued)
June 30, 2018 (Unaudited)
| | on a specific date. Option contracts are either OTC options or executed in a registered exchange (“exchange-traded options”). A Fund may write (sell) covered call and put options on futures, swaps (“swaptions”), securities, commodities or currencies. “Covered” means that so long as a Fund is obligated as the writer of an option, it will own either the underlying investments or currency or an option to purchase the same underlying investments or currency having an expiration date of the covered option and an exercise price equal to or less than the exercise price of the covered option, or will segregate or earmark cash or other liquid investments having, for written call options, a value equal to the greater of the exercise price or the market value of the underlying instrument and, for written put options, a value equal to the exercise price. Writing put options may increase a Fund’s exposure to the underlying instrument. Writing call options may decrease a Fund’s exposure to the underlying instrument. Premiums received from writing options that expire are treated as realized gains. Premiums received from writing options that are exercised or closed are added to the proceeds or offset amounts paid on the underlying futures, swap, investment or currency transaction to determine the realized gain or loss. A Fund, as a writer of an option, has no control over whether the underlying instrument may be sold (call) or purchased (put) and as a result bears the market risk of an unfavorable change in the price of the instrument underlying the written option. There is the risk a Fund may not be able to enter into a closing transaction because of an illiquid market. A Fund may also purchase put and call options. Purchasing call options may increase a Fund’s exposure to the underlying instrument. Purchasing put options may decrease a Fund’s exposure to the underlying instrument. A Fund pays a premium, which is included on the Fund’s Statements of Assets and Liabilities as an investment and is subsequently marked to market to reflect the current value of the option. Premiums paid for purchasing options that expire are treated as realized losses. Certain options may be purchased with premiums to be determined on a future date. The premiums for these options are based upon implied volatility parameters at specified terms. The risk associated with purchasing put and call options is generally limited to the premium paid. Premiums paid for purchasing options that are exercised or closed are added to the amounts paid or offset against the proceeds on the underlying investment transaction to determine the realized gain or loss. Entering into OTC options also exposes a Fund to counterparty risk. Counterparty risk is the possibility that the counterparty to the agreements may default on its obligation to perform or disagree as to the meaning of the contractual terms in the agreements. |
During the six-month period ended June 30, 2018, Total Return Bond HLS Fund had used Options Contracts.
| | d) | Swap Contracts – A Fund may invest in swap contracts. Swap contracts are agreements to exchange or swap investment cash flows, assets, foreign currencies or market-linked returns at specified, future intervals. Swap contracts are either privately negotiated in the over-the-counter market (“OTC swaps”) or cleared through a central counterparty or derivatives clearing organization (“centrally cleared swaps”). A Fund may enter into credit default, total return, cross-currency, interest rate, inflation and other forms of swap contracts to manage its exposure to credit, currency, interest rate, commodity and inflation risk. Swap contracts are also used to gain exposure to certain markets. In connection with these contracts, investments or cash may be identified as collateral or margin in accordance with the terms of the respective swap contracts and/or master netting arrangement to provide assets of value and recourse in the event of default or bankruptcy/insolvency. |
Swaps are valued based on custom valuations furnished by an independent pricing service. Swaps for which prices are not available from an independent pricing service are valued in accordance with procedures established by the respective Company’s Board of Directors. Changes in market value, if any, are reflected as a component of net changes in unrealized appreciation or depreciation on the Statements of Operations. Daily changes in valuation of centrally cleared swaps, if any, are recorded as a receivable or payable for the change in value (“variation margin”) on the Statements of Assets and Liabilities. Realized gains or losses on centrally cleared swaps are recorded upon the termination of the swap. OTC swap payments received or paid at the beginning of the measurement period are reflected as such on the Statements of Assets and Liabilities and represent premiums paid or received upon entering into the swap contract to compensate for differences between the stated terms of the swap contract and prevailing market conditions (credit spreads, currency exchange rates, interest rates and other relevant factors). These upfront premiums are recorded as realized gains or losses on the Statements of Operations upon termination or maturity of the swap. A liquidation payment received or made at the termination or maturity of the swap is recorded as a realized gain or loss on the Statements of Operations. Net periodic payments received or paid by a Fund are included as part of realized gains or losses on the Statements of Operations.
Entering into these contracts involves, to varying degrees, elements of liquidation, counterparty, credit and market risk in excess of the amounts recognized on the Statements of Assets and Liabilities. Such risks involve the possibility that there will be no liquid market for these contracts, that the counterparty to the contracts may default on its obligation to perform or disagree as to the meaning of contractual terms in the contracts, and that there may be unfavorable changes in market conditions (credit spreads, currency exchange rates, interest rates and other relevant factors).
Notes to Financial Statements – (continued)
June 30, 2018 (Unaudited)
A Fund’s maximum risk of loss from counterparty risk for OTC swaps is the net value of the discounted cash flows to be received from the counterparty over the contract’s remaining life, and current market value, to the extent that amount is positive. The risk is mitigated by having a master netting arrangement between a Fund and the counterparty, which allows for the netting of payments made or received (although such amounts are presented on a gross basis within the Statements of Assets and Liabilities, as applicable) as well as the posting of collateral to a Fund to cover the Fund’s exposure to the counterparty. In a centrally cleared swap, while a Fund enters into an agreement with a clearing broker to execute contracts with a counterparty, the performance of the swap is guaranteed by the central clearinghouse, which reduces the Fund’s exposure to counterparty risk. However, the Fund is still exposed to a certain amount of counterparty risk through the clearing broker and clearinghouse. The clearinghouse attempts to minimize this risk to its participants through the use of mandatory margin requirements, daily cash settlements and other procedures. Likewise, the clearing broker reduces its risk through margin requirements and required segregation of customer balances.
Credit Default Swap Contracts – The credit default swap market allows a Fund to manage credit risk through buying and selling credit protection on a specific issuer, asset or basket of assets. Certain credit default swaps involve the exchange of a fixed rate premium for protection against the loss in value of an underlying investment or index in the event of a credit event, such as payment default or bankruptcy.
Under a credit default swap contract, one party acts as guarantor by receiving the fixed periodic payment in exchange for the commitment to purchase the underlying investment at par if the defined credit event occurs. Upon the occurrence of a defined credit event, the difference between the value of the reference obligation and the swap’s notional amount is recorded as realized gain or loss on swap transactions in the Statements of Operations. A “buyer” of credit protection agrees to pay a counterparty to assume the credit risk of an issuer upon the occurrence of certain events. The “seller” of the protection receives periodic payments and agrees to assume the credit risk of an issuer upon the occurrence of certain events. Although specified events are contract specific, credit events are generally defined as bankruptcy, failure to pay, restructuring, obligation acceleration, obligation default or repudiation/moratorium. A “seller’s” exposure is limited to the total notional amount of the credit default swap contract. These potential amounts would be partially offset by any recovery values of the respective referenced obligations or upfront payments received upon entering into the contract.
Implied credit spreads, represented in absolute terms, utilized in determining the market value of credit default swap contracts on corporate issues, sovereign government issues or U.S. municipal issues as of year-end are disclosed in the notes to the Schedules of Investments, as applicable, and serve as an indicator of the current status of the payment/performance risk and represent the likelihood or risk of default for the credit derivative. The implied credit spread of a particular referenced entity reflects the cost of buying/selling protection and there may also be upfront payments required to be made to enter into the contract. Wider credit spreads represent a deterioration of the referenced entity’s credit soundness and a greater likelihood or risk of default or other credit event occurring as defined under the terms of the contract. For credit default swap contracts on credit indices, the quoted market prices and resulting values serve as the indicator of the current status of the payment/performance risk. Increasing market values, in absolute terms when compared to the notional amount of the swap, represent a deterioration of the referenced equity’s credit soundness and a greater likelihood or risk of default or other credit event occurring as defined under the terms of the contract.
During the six-month period ended June 30, 2018, Total Return Bond HLS Fund had used Credit Default Swap Contracts.
Interest Rate Swap Contracts – Certain Funds are subject to interest rate risk exposure in the normal course of pursuing its investment objectives. A Fund may use interest rate swaps to hedge interest rate and duration risk across a portfolio at particular duration points to maintain its ability to generate income at prevailing market rates. In a typical interest rate swap, one party agrees to make regular payments equal to a floating interest rate, based on a specified interest rate or benchmark (e.g. London Interbank Offered Rate (“LIBOR”)), multiplied by a notional amount, in return for payments equal to a fixed rate multiplied by the same amount, for a specific period of time. The net interest received or paid on interest rate swap contracts is recorded as a realized gain or loss. Interest rate swaps are marked to market daily and the change, if any, is recorded as an unrealized gain or loss in the Statements of Operations. When the interest rate swap contract is terminated early, a Fund records a realized gain or loss equal to the difference between the current market value and the upfront premium or cost.
If an interest rate swap contract provides for payments in different currencies, the parties might agree to exchange the notional amount as well. Interest rate swaps may also depend on other prices or rates, such as the value of an index. The risks of interest rate swaps include changes in market conditions which will affect the value of the contract or the cash flows and the possible inability of the counterparty to fulfill its obligations under the contract. A Fund’s maximum risk of loss from counterparty credit risk is the discounted net value of the cash flows to be received from the counterparty over the contract’s remaining life, to the extent that amount is positive.
Notes to Financial Statements – (continued)
June 30, 2018 (Unaudited)
During the six-month period ended June 30, 2018, Total Return Bond HLS Fund and U.S. Government Securities HLS Fund had used Interest Rate Swap Contracts.
Total Return Swap Contracts – Certain Funds may invest in total return swap contracts in pursuit of the Fund’s investment objective or for hedging purposes. An investment in a total return swap allows a Fund to gain or mitigate exposure to underlying reference assets. Total return swap contracts involve commitments where cash flows are exchanged based on the price of underlying reference assets and based on a fixed or variable interest rate. One party receives payments based on the price appreciation or depreciation of the underlying reference asset, in exchange for paying to or receiving from the counterparty seller an agreed-upon interest rate. A variable interest rate may be correlated to a base rate, such as the LIBOR, and is adjusted each reset period, which is defined at the beginning of the contract. Therefore, if interest rates increase over the term of the swap contract, the party paying the rate may be required to pay a higher rate at each swap reset date.
Total return swap contracts on indices involve commitments to pay interest in exchange for a market-linked return. One party pays out the total return of a specific reference asset, which may be an equity, index, or bond, and in return receives a regular stream of payments. To the extent the total return of the security or index underlying the transaction exceeds or falls short of the offsetting interest rate obligation, a Fund will receive a payment from or make a payment to the counterparty. If the Fund is a payer in a total return swap, it may be subject to unlimited losses. They are also subject to counterparty risk. If the counterparty fails to meet its obligations, the Fund may lose money.
During the six-month period ended June 30, 2018, Total Return Bond HLS Fund had used Total Return Swap Contracts.
| | e) | Additional Derivative Instrument Information: |
Balanced HLS Fund
Fair Value of Derivative Instruments on the Statement of Assets and Liabilities as of June 30, 2018:
| | | | | | | | | | | | | | | | | | | | | | | | | | | | |
| | | Risk Exposure Category | |
| | | Interest Rate
Contracts | | | Foreign
Exchange
Contracts | | | Credit
Contracts | | | Equity
Contracts | | | Commodity
Contracts | | | Other
Contracts | | | Total | |
Assets: | |
Unrealized appreciation on futures contracts(1) | | $ | 176,651 | | | $ | — | | | $ | — | | | $ | — | | | $ | — | | | $ | — | | | $ | 176,651 | |
| | | | | | | | | | | | | | | | | | | | | | | | | | | | |
Total | | $ | 176,651 | | | $ | — | | | $ | — | | | $ | — | | | $ | — | | | $ | — | | | $ | 176,651 | |
| | | | | | | | | | | | | | | | | | | | | | | | | | | | |
|
Liabilities: | |
Unrealized depreciation on futures contracts(1) | | $ | 29,496 | | | $ | — | | | $ | — | | | $ | — | | | $ | — | | | $ | — | | | $ | 29,496 | |
| | | | | | | | | | | | | | | | | | | | | | | | | | | | |
Total | | $ | 29,496 | | | $ | — | | | $ | — | | | $ | — | | | $ | — | | | $ | — | | | $ | 29,496 | |
| | | | | | | | | | | | | | | | | | | | | | | | | | | | |
The Effect of Derivative Instruments on the Statement of Operations for the period ended June 30, 2018
| | | | | | | | | | | | | | | | | | | | | | | | | | | | |
| | | Risk Exposure Category | |
| | | Interest Rate
Contracts | | | Foreign
Exchange
Contracts | | | Credit
Contracts | | | Equity
Contracts | | | Commodity
Contracts | | | Other
Contracts | | | Total | |
Realized Gain (Loss) on Derivatives Recognized as a Result of Operations: | |
Net realized gain (loss) on futures contracts | | $ | 1,479,444 | | | $ | — | | | $ | — | | | $ | — | | | $ | — | | | $ | — | | | $ | 1,479,444 | |
| | | | | | | | | | | | | | | | | | | | | | | | | | | | |
Total | | $ | 1,479,444 | | | $ | — | | | $ | — | | | $ | — | | | $ | — | | | $ | — | | | $ | 1,479,444 | |
| | | | | | | | | | | | | | | | | | | | | | | | | | | | |
|
Net Change in Unrealized Appreciation (Depreciation) on Derivatives Recognized as a Result of Operations: | |
Net change in unrealized appreciation (depreciation) of futures contracts | | $ | (41,147 | ) | | $ | — | | | $ | — | | | $ | — | | | $ | — | | | $ | — | | | $ | (41,147 | ) |
| | | | | | | | | | | | | | | | | | | | | | | | | | | | |
Total | | $ | (41,147 | ) | | $ | — | | | $ | — | | | $ | — | | | $ | — | | | $ | — | | | $ | (41,147 | ) |
| | | | | | | | | | | | | | | | | | | | | | | | | | | | |
Notes to Financial Statements – (continued)
June 30, 2018 (Unaudited)
Balanced HLS Fund – (continued)
For the period ended June 30, 2018, the average amount or number per contract outstanding for each derivative type was as follows:
| | | | |
Derivative Description | | Average Notional
Par, Contracts
or Face Amount | |
Futures Contracts Long at Number of Contracts | | | 354 | |
Futures Contracts Short at Number of Contracts | | | (282 | ) |
Capital Appreciation HLS Fund
Fair Value of Derivative Instruments on the Statement of Assets and Liabilities as of June 30, 2018:
| | | | | | | | | | | | | | | | | | | | | | | | | | | | |
| | | Risk Exposure Category | |
| | | Interest Rate
Contracts | | | Foreign
Exchange
Contracts | | | Credit
Contracts | | | Equity
Contracts | | | Commodity
Contracts | | | Other
Contracts | | | Total | |
Assets: | |
Unrealized appreciation on foreign currency contracts | | $ | — | | | $ | 92,380 | | | $ | — | | | $ | — | | | $ | — | | | $ | — | | | $ | 92,380 | |
| | | | | | | | | | | | | | | | | | | | | | | | | | | | |
Total | | $ | — | | | $ | 92,380 | | | $ | — | | | $ | — | | | $ | — | | | $ | — | | | $ | 92,380 | |
| | | | | | | | | | | | | | | | | | | | | | | | | | | | |
|
Liabilities: | |
Unrealized depreciation on futures contracts(1) | | $ | — | | | $ | — | | | $ | — | | | $ | 625,396 | | | $ | — | | | $ | — | | | $ | 625,396 | |
| | | | | | | | | | | | | | | | | | | | | | | | | | | | |
Total | | $ | — | | | $ | — | | | $ | — | | | $ | 625,396 | | | $ | — | | | $ | — | | | $ | 625,396 | |
| | | | | | | | | | | | | | | | | | | | | | | | | | | | |
The Effect of Derivative Instruments on the Statement of Operations for the period ended June 30, 2018
| | | | | | | | | | | | | | | | | | | | | | | | | | | | |
| | | Risk Exposure Category | |
| | | Interest Rate
Contracts | | | Foreign
Exchange
Contracts | | | Credit
Contracts | | | Equity
Contracts | | | Commodity
Contracts | | | Other
Contracts | | | Total | |
Realized Gain (Loss) on Derivatives Recognized as a Result of Operations: | |
Net realized gain (loss) on foreign currency contracts | | $ | — | | | $ | (18,367 | ) | | $ | — | | | $ | — | | | $ | — | | | $ | — | | | $ | (18,367 | ) |
| | | | | | | | | | | | | | | | | | | | | | | | | | | | |
Total | | $ | — | | | $ | (18,367 | ) | | $ | — | | | $ | — | | | $ | — | | | $ | — | | | $ | (18,367 | ) |
| | | | | | | | | | | | | | | | | | | | | | | | | | | | |
|
Net Change in Unrealized Appreciation (Depreciation) on Derivatives Recognized as a Result of Operations: | |
Net change in unrealized appreciation (depreciation) of futures contracts | | $ | — | | | $ | — | | | $ | — | | | $ | (625,396 | ) | | $ | — | | | $ | — | | | $ | (625,396 | ) |
Net change in unrealized appreciation (depreciation) of foreign currency contracts | | | — | | | | 322,583 | | | | — | | | | — | | | | — | | | | — | | | | 322,583 | |
| | | | | | | | | | | | | | | | | | | | | | | | | | | | |
Total | | $ | — | | | $ | 322,583 | | | $ | — | | | $ | (625,396 | ) | | $ | — | | | $ | — | | | $ | (302,813 | ) |
| | | | | | | | | | | | | | | | | | | | | | | | | | | | |
For the period ended June 30, 2018, the average amount or number per contract outstanding for each derivative type was as follows:
| | | | |
Derivative Description | | Average Notional
Par, Contracts
or Face Amount | |
Futures Contracts Long at Number of Contracts | | | 405 | |
Foreign Currency Contracts Purchased at Contract Amount | | $ | 6,116,812 | |
Foreign Currency Contracts Sold at Contract Amount | | $ | 21,756,469 | |
Notes to Financial Statements – (continued)
June 30, 2018 (Unaudited)
High Yield HLS Fund
Fair Value of Derivative Instruments on the Statement of Assets and Liabilities as of June 30, 2018:
| | | | | | | | | | | | | | | | | | | | | | | | | | | | |
| | | Risk Exposure Category | |
| | | Interest Rate
Contracts | | | Foreign
Exchange
Contracts | | | Credit
Contracts | | | Equity
Contracts | | | Commodity
Contracts | | | Other
Contracts | | | Total | |
Assets: | |
Unrealized appreciation on foreign currency contracts | | $ | — | | | $ | 183 | | | $ | — | | | $ | — | | | $ | — | | | $ | — | | | $ | 183 | |
| | | | | | | | | | | | | | | | | | | | | | | | | | | | |
Total | | $ | — | | | $ | 183 | | | $ | — | | | $ | — | | | $ | — | | | $ | — | | | $ | 183 | |
| | | | | | | | | | | | | | | | | | | | | | | | | | | | |
|
Liabilities: | |
Unrealized depreciation on foreign currency contracts | | $ | — | | | $ | 21,009 | | | $ | — | | | $ | — | | | $ | — | | | $ | — | | | $ | 21,009 | |
| | | | | | | | | | | | | | | | | | | | | | | | | | | | |
Total | | $ | — | | | $ | 21,009 | | | $ | — | | | $ | — | | | $ | — | | | $ | — | | | $ | 21,009 | |
| | | | | | | | | | | | | | | | | | | | | | | | | | | | |
The Effect of Derivative Instruments on the Statement of Operations for the period ended June 30, 2018
| | | | | | | | | | | | | | | | | | | | | | | | | | | | |
| | | Risk Exposure Category | |
| | | Interest Rate
Contracts | | | Foreign
Exchange
Contracts | | | Credit
Contracts | | | Equity
Contracts | | | Commodity
Contracts | | | Other
Contracts | | | Total | |
Realized Gain (Loss) on Derivatives Recognized as a Result of Operations: | |
Net realized gain (loss) on foreign currency contracts | | $ | — | | | $ | 152,096 | | | $ | — | | | $ | — | | | $ | — | | | $ | — | | | $ | 152,096 | |
| | | | | | | | | | | | | | | | | | | | | | | | | | | | |
Total | | $ | — | | | $ | 152,096 | | | $ | — | | | $ | — | | | $ | — | | | $ | — | | | $ | 152,096 | |
| | | | | | | | | | | | | | | | | | | | | | | | | | | | |
|
Net Change in Unrealized Appreciation (Depreciation) on Derivatives Recognized as a Result of Operations: | |
Net change in unrealized appreciation (depreciation) of foreign currency contracts | | $ | — | | | $ | 39,717 | | | $ | — | | | $ | — | | | $ | — | | | $ | — | | | $ | 39,717 | |
| | | | | | | | | | | | | | | | | | | | | | | | | | | | |
Total | | $ | — | | | $ | 39,717 | | | $ | — | | | $ | — | | | $ | — | | | $ | — | | | $ | 39,717 | |
| | | | | | | | | | | | | | | | | | | | | | | | | | | | |
For the period ended June 30, 2018, the average amount or number per contract outstanding for each derivative type was as follows:
| | | | |
Derivative Description | | Average Notional
Par, Contracts
or Face Amount | |
Foreign Currency Contracts Purchased at Contract Amount | | $ | 3,465,145 | |
Foreign Currency Contracts Sold at Contract Amount | | $ | 5,256,081 | |
Total Return Bond HLS Fund
Fair Value of Derivative Instruments on the Statement of Assets and Liabilities as of June 30, 2018:
| | | | | | | | | | | | | | | | | | | | | | | | | | | | |
| | | Risk Exposure Category | |
| | | Interest Rate
Contracts | | | Foreign
Exchange
Contracts | | | Credit
Contracts | | | Equity
Contracts | | | Commodity
Contracts | | | Other
Contracts | | | Total | |
Assets: | |
Investments in securities, at value (purchased options), market value | | $ | 6,705,508 | | | $ | — | | | $ | — | | | $ | — | | | $ | — | | | $ | — | | | $ | 6,705,508 | |
Unrealized appreciation on futures contracts(1) | | | 3,666,288 | | | | — | | | | — | | | | — | | | | — | | | | — | | | | 3,666,288 | |
Unrealized appreciation on foreign currency contracts | | | — | | | | 148,902 | | | | — | | | | — | | | | — | | | | — | | | | 148,902 | |
Unrealized appreciation on swap contracts(2) | | | 3,796,750 | | | | — | | | | 1,910,900 | | | | — | | | | — | | | | — | | | | 5,707,650 | |
| | | | | | | | | | | | | | | | | | | | | | | | | | | | |
Total | | $ | 14,168,546 | | | $ | 148,902 | | | $ | 1,910,900 | | | $ | — | | | $ | — | | | $ | — | | | $ | 16,228,348 | |
| | | | | | | | | | | | | | | | | | | | | | | | | | | | |
|
Liabilities: | |
Unrealized depreciation on futures contracts(1) | | $ | 1,239,095 | | | $ | — | | | $ | — | | | $ | — | | | $ | — | | | $ | — | | | $ | 1,239,095 | |
Unrealized depreciation on foreign currency contracts | | | — | | | | 258,124 | | | | — | | | | — | | | | — | | | | — | | | | 258,124 | |
Unrealized depreciation on swap contracts(2) | | | 1,242,360 | | | | — | | | | 2,132,284 | | | | — | | | | — | | | | — | | | | 3,374,644 | |
| | | | | | | | | | | | | | | | | | | | | | | | | | | | |
Total | | $ | 2,481,455 | | | $ | 258,124 | | | $ | 2,132,284 | | | $ | — | | | $ | — | | | $ | — | | | $ | 4,871,863 | |
| | | | | | | | | | | | | | | | | | | | | | | | | | | | |
Notes to Financial Statements – (continued)
June 30, 2018 (Unaudited)
Total Return Bond HLS Fund – (continued)
The Effect of Derivative Instruments on the Statement of Operations for the period ended June 30, 2018
| | | | | | | | | | | | | | | | | | | | | | | | | | | | |
| | | Risk Exposure Category | |
| | | Interest Rate
Contracts | | | Foreign
Exchange
Contracts | | | Credit
Contracts | | | Equity
Contracts | | | Commodity
Contracts | | | Other
Contracts | | | Total | |
Realized Gain (Loss) on Derivatives Recognized as a Result of Operations: | |
Net realized gain (loss) on purchased options contracts | | $ | 423,547 | | | $ | — | | | $ | — | | | $ | — | | | $ | — | | | $ | — | | | $ | 423,547 | |
Net realized gain (loss) on futures contracts | | | (17,370,649 | ) | | | — | | | | — | | | | — | | | | — | | | | — | | | | (17,370,649 | ) |
Net realized gain (loss) on written options contracts | | | 468,606 | | | | — | | | | — | | | | (104,335 | ) | | | — | | | | — | | | | 364,271 | |
Net realized gain (loss) on swap contracts | | | 3,093,485 | | | | — | | | | (1,708,130 | ) | | | — | | | | — | | | | — | | | | 1,385,355 | |
Net realized gain (loss) on foreign currency contracts | | | — | | | | (1,392,118 | ) | | | — | | | | — | | | | — | | | | — | | | | (1,392,118 | ) |
| | | | | | | | | | | | | | | | | | | | | | | | | | | | |
Total | | $ | (13,385,011 | ) | | $ | (1,392,118 | ) | | $ | (1,708,130 | ) | | $ | (104,335 | ) | | $ | — | | | $ | — | | | $ | (16,589,594 | ) |
| | | | | | | | | | | | | | | | | | | | | | | | | | | | |
|
Net Change in Unrealized Appreciation (Depreciation) on Derivatives Recognized as a Result of Operations: | |
Net change in unrealized appreciation (depreciation) of investments in purchased options contracts | | $ | (455,374 | ) | | $ | — | | | $ | — | | | $ | — | | | $ | — | | | $ | — | | | $ | (455,374 | ) |
Net change in unrealized appreciation (depreciation) of futures contracts | | | 4,075,641 | | | | — | | | | — | | | | — | | | | — | | | | — | | | | 4,075,641 | |
Net change in unrealized appreciation (depreciation) of swap contracts | | | 2,319,400 | | | | — | | | | 2,852,681 | | | | — | | | | — | | | | — | | | | 5,172,081 | |
Net change in unrealized appreciation (depreciation) of foreign currency contracts | | | — | | | | 372,472 | | | | — | | | | — | | | | — | | | | — | | | | 372,472 | |
| | | | | | | | | | | | | | | | | | | | | | | | | | | | |
Total | | $ | 5,939,667 | | | $ | 372,472 | | | $ | 2,852,681 | | | $ | — | | | $ | — | | | $ | — | | | $ | 9,164,820 | |
| | | | | | | | | | | | | | | | | | | | | | | | | | | | |
For the period ended June 30, 2018, the average amount or number per contract outstanding for each derivative type was as follows:
| | | | |
Derivative Description | | Average Notional
Par, Contracts
or Face Amount | |
Purchased Options Contracts at Number of Contracts | | | 174,981,333 | |
Futures Contracts Long at Number of Contracts | | | 4,679 | |
Futures Contracts Short at Number of Contracts | | | (1,662 | ) |
Written Options Contracts at Number of Contracts | | | (263,572,110 | ) |
Swap Contracts at Notional Amount | | $ | 497,953,791 | |
Foreign Currency Contracts Purchased at Contract Amount | | $ | 7,819,423 | |
Foreign Currency Contracts Sold at Contract Amount | | $ | 40,342,143 | |
U.S. Government Securities HLS Fund
Fair Value of Derivative Instruments on the Statement of Assets and Liabilities as of June 30, 2018:
| | | | | | | | | | | | | | | | | | | | | | | | | | | | |
| | | Risk Exposure Category | |
| | | Interest Rate
Contracts | | | Foreign
Exchange
Contracts | | | Credit
Contracts | | | Equity
Contracts | | | Commodity
Contracts | | | Other
Contracts | | | Total | |
Assets: | |
Unrealized appreciation on futures contracts(1) | | $ | 560,959 | | | $ | — | | | $ | — | | | $ | — | | | $ | — | | | $ | — | | | $ | 560,959 | |
Unrealized appreciation on swap contracts(2) | | | 403,341 | | | | — | | | | — | | | | — | | | | — | | | | — | | | | 403,341 | |
| | | | | | | | | | | | | | | | | | | | | | | | | | | | |
Total | | $ | 964,300 | | | $ | — | | | $ | — | | | $ | — | | | $ | — | | | $ | — | | | $ | 964,300 | |
| | | | | | | | | | | | | | | | | | | | | | | | | | | | |
|
Liabilities: | |
Unrealized depreciation on futures contracts(1) | | $ | 37,232 | | | $ | — | | | $ | — | | | $ | — | | | $ | — | | | $ | — | | | $ | 37,232 | |
Unrealized depreciation on swap contracts(2) | | | 110,734 | | | | — | | | | — | | | | — | | | | — | | | | — | | | | 110,734 | |
| | | | | | | | | | | | | | | | | | | | | | | | | | | | |
Total | | $ | 147,966 | | | $ | — | | | $ | — | | | $ | — | | | $ | — | | | $ | — | | | $ | 147,966 | |
| | | | | | | | | | | | | | | | | | | | | | | | | | | | |
Notes to Financial Statements – (continued)
June 30, 2018 (Unaudited)
U.S. Government Securities HLS Fund – (continued)
The Effect of Derivative Instruments on the Statement of Operations for the period ended June 30, 2018
| | | | | | | | | | | | | | | | | | | | | | | | | | | | |
| | | Risk Exposure Category | |
| | | Interest Rate
Contracts | | | Foreign
Exchange
Contracts | | | Credit
Contracts | | | Equity
Contracts | | | Commodity
Contracts | | | Other
Contracts | | | Total | |
Realized Gain (Loss) on Derivatives Recognized as a Result of Operations: | | | | | | | | | | | | | |
Net realized gain (loss) on futures contracts | | $ | (2,695,576 | ) | | $ | — | | | $ | — | | | $ | — | | | $ | — | | | $ | — | | | $ | (2,695,576 | ) |
Net realized gain (loss) on written options contracts | | | (96,204 | ) | | | — | | | | — | | | | — | | | | — | | | | — | | | | (96,204 | ) |
Net realized gain (loss) on swap contracts | | | 1,211,160 | | | | — | | | | 34,577 | | | | — | | | | — | | | | — | | | | 1,245,737 | |
| | | | | | | | | | | | | | | | | | | | | | | | | | | | |
Total | | $ | (1,580,620) | | | $ | — | | | $ | 34,577 | | | $ | — | | | $ | — | | | $ | — | | | $ | (1,546,043) | |
| | | | | | | | | | | | | | | | | | | | | | | | | | | | |
| | | |
Net Change in Unrealized Appreciation (Depreciation) on Derivatives Recognized as a Result of Operations: | | | | | | | | | | | | | |
Net change in unrealized appreciation (depreciation) of futures contracts | | $ | 889,450 | | | $ | — | | | $ | — | | | $ | — | | | $ | — | | | $ | — | | | $ | 889,450 | |
Net change in unrealized appreciation (depreciation) of swap contracts | | | 393,991 | | | | — | | | | (45,089 | ) | | | — | | | | — | | | | — | | | | 348,902 | |
| | | | | | | | | | | | | | | | | | | | | | | | | | | | |
Total | | $ | 1,283,441 | | | $ | — | | | $ | (45,089 | ) | | $ | — | | | $ | — | | | $ | — | | | $ | 1,283,352 | |
| | | | | | | | | | | | | | | | | | | | | | | | | | | | |
For the period ended June 30, 2018, the average amount or number per contract outstanding for each derivative type was as follows:
| | | | |
Derivative Description | | Average Notional
Par, Contracts
or Face Amount | |
Futures Contracts Long at Number of Contracts | | | 793 | |
Futures Contracts Short at Number of Contracts | | | (229 | ) |
Written Options Contracts at Number of Contracts | | | (240 | ) |
Swap Contracts at Notional Amount | | $ | 35,354,333 | |
| | (1) | Amount represents the cumulative appreciation (depreciation) on futures contracts as disclosed within the Schedule of Investments under the open “Futures Contracts” section. Only current day’s variation margin, if any, is reported within the Statements of Assets and Liabilities. |
| | (2) | Amount represents the cumulative appreciation (depreciation) on centrally cleared swaps, if applicable, as disclosed within the Schedule of Investments. Only the current day’s variation margin, if any, are reported within the Statements of Assets and Liabilities. OTC swaps are reported within the Statement of Assets and Liabilities within Unrealized appreciation (depreciation) on OTC swap contracts, if applicable. |
| | f) | Balance Sheet Offsetting Information – Set forth below are tables which disclose both gross information and net information about instruments and transactions eligible for offset in the financial statements, and instruments and transactions that are subject to a master netting arrangement, as well as amounts related to margin, reflected as financial collateral (including cash collateral), held at clearing brokers, counterparties and a Fund’s custodian. The master netting arrangements allow the clearing brokers to net any collateral held in or on behalf of a Fund, or liabilities or payment obligations of the clearing brokers to the Fund, against any liabilities or payment obligations of the Fund to the clearing brokers. A Fund is required to deposit financial collateral (including cash collateral) at the Fund’s custodian on behalf of clearing brokers and counterparties to continually meet the original and maintenance requirements established by the clearing brokers and counterparties. Such requirements are specific to the respective clearing broker or counterparty. Certain master netting arrangements may not be enforceable in a bankruptcy. |
The following tables present the Funds’ derivative assets and liabilities, presented on a gross basis as no amounts are netted within the Statements of Assets and Liabilities, by counterparty net of amounts available for offset under a master netting agreement or similar agreement (“MNA”) and net of the related collateral received/pledged by the Funds as of June 30, 2018:
Balanced HLS Fund
| | | | | | | | |
Derivative Financial Instruments: | | Assets | | | Liabilities | |
Futures contracts | | $ | 176,651 | | | $ | (29,496 | ) |
| | | | | | | | |
Total gross amount of derivative assets and liabilities in the Statement of Assets and Liabilities | | | 176,651 | | | | (29,496 | ) |
| | | | | | | | |
Derivatives not subject to a MNA | | | (176,651 | ) | | | 29,496 | |
| | | | | | | | |
Total gross amount of assets and liabilities subject to MNA or similar agreements | | $ | — | | | $ | — | |
| | | | | | | | |
Notes to Financial Statements – (continued)
June 30, 2018 (Unaudited)
Capital Appreciation HLS Fund
| | | | | | | | |
Derivative Financial Instruments: | | Assets | | | Liabilities | |
Foreign currency contracts | | $ | 92,380 | | | $ | — | |
Futures contracts | | | — | | | | (625,396 | ) |
| | | | | | | | |
Total gross amount of derivative assets and liabilities in the Statement of Assets and Liabilities | | | 92,380 | | | | (625,396 | ) |
| | | | | | | | |
Derivatives not subject to a MNA | | | — | | | | 625,396 | |
| | | | | | | | |
Total gross amount of assets and liabilities subject to MNA or similar agreements | | $ | 92,380 | | | $ | — | |
| | | | | | | | |
| | | | | | | | | | | | | | | | | | | | |
Counterparty | | Gross Amount
of Assets | | | Financial
Instruments
and Derivatives
Available for
Offset | | | Non-cash
Collateral
Received* | | | Cash
Collateral
Received* | | | Net Amount
of Assets | |
Commonwealth Bank of Australia | | $ | 25,862 | | | $ | — | | | $ | — | | | $ | — | | | $ | 25,862 | |
JP Morgan Chase & Co. | | | 42,431 | | | | — | | | | — | | | | — | | | | 42,431 | |
UBS AG | | | 24,087 | | | | — | | | | — | | | | — | | | | 24,087 | |
| | | | | | | | | | | | | | | | | | | | |
Total | | $ | 92,380 | | | $ | — | | | $ | — | | | $ | — | | | $ | 92,380 | |
| | | | | | | | | | | | | | | | | | | | |
| | * | In some instances, the actual collateral received and/or pledged may be more than the amount shown. |
High Yield HLS Fund
| | | | | | | | |
Derivative Financial Instruments: | | Assets | | | Liabilities | |
Foreign currency contracts | | $ | 183 | | | $ | (21,009 | ) |
| | | | | | | | |
Total gross amount of derivative assets and liabilities in the Statement of Assets and Liabilities | | | 183 | | | | (21,009 | ) |
| | | | | | | | |
Derivatives not subject to a MNA | | | — | | | | — | |
| | | | | | | | |
Total gross amount of assets and liabilities subject to MNA or similar agreements | | $ | 183 | | | $ | (21,009 | ) |
| | | | | | | | |
| | | | | | | | | | | | | | | | | | | | |
Counterparty | | Gross Amount
of Assets | | | Financial
Instruments
and Derivatives
Available for
Offset | | | Non-cash
Collateral
Received* | | | Cash
Collateral
Received* | | | Net Amount
of Assets | |
Citibank NA | | $ | 183 | | | $ | — | | | $ | — | | | $ | — | | | $ | 183 | |
| | | | | | | | | | | | | | | | | | | | |
| | | | | | | | | | | | | | | | | | | | |
Counterparty | | Gross Amount
of Liabilities | | | Financial
Instruments
and Derivatives
Available for
Offset | | | Non-cash
Collateral
Pledged* | | | Cash
Collateral
Pledged* | | | Net Amount
of Liabilities | |
BNP Paribas Securities Services | | $ | (3,646 | ) | | $ | — | | | $ | — | | | $ | — | | | $ | (3,646 | ) |
UBS AG | | | (17,363 | ) | | | — | | | | — | | | | — | | | | (17,363 | ) |
| | | | | | | | | | | | | | | | | | | | |
Total | | $ | (21,009 | ) | | $ | — | | | $ | — | | | $ | — | | | $ | (21,009 | ) |
| | | | | | | | | | | | | | | | | | | | |
| | * | In some instances, the actual collateral received and/or pledged may be more than the amount shown. |
Notes to Financial Statements – (continued)
June 30, 2018 (Unaudited)
Total Return Bond HLS Fund
| | | | | | | | |
Derivative Financial Instruments: | | Assets | | | Liabilities | |
Foreign currency contracts | | $ | 148,902 | | | $ | (258,124 | ) |
Futures contracts | | | 3,666,288 | | | | (1,239,095 | ) |
Purchased options | | | 2,370,815 | | | | (375,748 | ) |
Swap contracts | | | 5,707,650 | | | | (3,374,644 | ) |
| | | | | | | | |
Total gross amount of derivative assets and liabilities in the Statement of Assets and Liabilities | | | 11,893,655 | | | | (5,247,611 | ) |
| | | | | | | | |
Derivatives not subject to a MNA | | | (7,726,797 | ) | | | 1,755,446 | |
| | | | | | | | |
Total gross amount of assets and liabilities subject to MNA or similar agreements | | $ | 4,166,858 | | | $ | (3,492,165 | ) |
| | | | | | | | |
| | | | | | | | | | | | | | | | | | | | |
Counterparty | | Gross Amount
of Assets | | | Financial
Instruments
and Derivatives
Available for
Offset | | | Non-cash
Collateral
Received* | | | Cash
Collateral
Received* | | | Net Amount
of Assets | |
Banc of America Securities LLC | | $ | 1,620,060 | | | $ | (12,322 | ) | | $ | — | | | $ | — | | | $ | 1,607,738 | |
Barclays | | | 63,662 | | | | (63,662 | ) | | | — | | | | — | | | | — | |
Canadian Imperial Bank of Commerce | | | 11,311 | | | | — | | | | — | | | | — | | | | 11,311 | |
Citibank NA | | | 117,235 | | | | — | | | | — | | | | — | | | | 117,235 | |
Credit Suisse International | | | 353,068 | | | | (353,068 | ) | | | — | | | | — | | | | — | |
Deutsche Bank Securities, Inc. | | | 907,275 | | | | — | | | | — | | | | — | | | | 907,275 | |
Goldman Sachs & Co. | | | 241,630 | | | | (241,630 | ) | | | — | | | | — | | | | — | |
JP Morgan Chase & Co. | | | 17,728 | | | | (17,728 | ) | | | — | | | | — | | | | — | |
Morgan Stanley | | | 827,514 | | | | (782,450 | ) | | | — | | | | — | | | | 45,064 | |
UBS AG | | | 7,375 | | | | (7,375 | ) | | | — | | | | — | | | | — | |
| | | | | | | | | | | | | | | | | | | | |
Total | | $ | 4,166,858 | | | $ | (1,478,235 | ) | | $ | — | | | $ | — | | | $ | 2,688,623 | |
| | | | | | | | | | | | | | | | | | | | |
| | | | | | | | | | | | | | | | | | | | |
Counterparty | | Gross Amount
of Liabilities | | | Financial
Instruments
and Derivatives
Available for
Offset | | | Non-cash
Collateral
Pledged* | | | Cash
Collateral
Pledged* | | | Net Amount
of Liabilities | |
Banc of America Securities LLC | | $ | (12,322 | ) | | $ | 12,322 | | | $ | — | | | $ | — | | | $ | — | |
Barclays | | | (488,383 | ) | | | 63,662 | | | | — | | | | — | | | | (424,721 | ) |
Credit Suisse International | | | (878,294 | ) | | | 353,068 | | | | — | | | | — | | | | (525,226 | ) |
Goldman Sachs & Co. | | | (1,190,949 | ) | | | 241,630 | | | | — | | | | — | | | | (949,319 | ) |
JP Morgan Chase & Co. | | | (95,598 | ) | | | 17,728 | | | | — | | | | — | | | | (77,870 | ) |
Morgan Stanley | | | (782,450 | ) | | | 782,450 | | | | — | | | | — | | | | — | |
UBS AG | | | (44,169 | ) | | | 7,375 | | | | — | | | | — | | | | (36,794 | ) |
| | | | | | | | | | | | | | | | | | | | |
Total | | $ | (3,492,165 | ) | | $ | 1,478,235 | | | $ | — | | | $ | — | | | $ | (2,013,930 | ) |
| | | | | | | | | | | | | | | | | | | | |
| | * | In some instances, the actual collateral received and/or pledged may be more than the amount shown. |
Notes to Financial Statements – (continued)
June 30, 2018 (Unaudited)
U.S. Government Securities HLS Fund
| | | | | | | | |
Derivative Financial Instruments: | | Assets | | | Liabilities | |
Futures contracts | | $ | 560,959 | | | $ | (37,232) | |
Swap contracts | | | 403,341 | | | | (110,734 | ) |
| | | | | | | | |
Total gross amount of derivative assets and liabilities in the Statement of Assets and Liabilities | | | 964,300 | | | | (147,966 | ) |
| | | | | | | | |
Derivatives not subject to a MNA | | | (964,300 | ) | | | 147,966 | |
| | | | | | | | |
Total gross amount of assets and liabilities subject to MNA or similar agreements | | $ | — | | | $ | — | |
| | | | | | | | |
A Fund’s investments expose it to various types of risks associated with financial instruments and the markets. A Fund may be exposed to the risks described below. Each Fund’s prospectus provides details of its principal risks.
The market values of equity securities, such as common stocks and preferred stocks, or equity related derivative investments, such as futures and options, may decline due to general market conditions which are not specifically related to a particular company, such as real or perceived adverse economic conditions, changes in the general outlook for corporate earnings, changes in interest or currency rates or adverse investor sentiment generally. The market value of equity securities may also decline due to factors which affect a particular industry or industries, such as labor shortages or increased production costs and competitive conditions within an industry. Equity securities and equity related investments generally have greater market price volatility than fixed income securities. The extent of each Fund’s exposure to market risk is the market value of the investments held as shown in the Fund’s Schedule of Investments.
Certain investments held by a Fund expose the Fund to various risks which may include, but are not limited to, interest rate, prepayment, and extension risks. Interest rate risk is the risk that fixed income securities will decline in value because of changes in interest rates. As nominal interest rates rise, the values of certain fixed income securities held by a Fund are likely to decrease. A nominal interest rate can be described as the sum of a real interest rate and an expected inflation rate. Fixed income securities with longer durations tend to be more sensitive to changes in interest rates, usually making them more volatile than securities with shorter durations. Duration is useful primarily as a measure of the sensitivity of a fixed income security’s market price to interest rate (i.e., yield) movements. Senior floating rate interests and securities subject to prepayment and extension risk generally offer less potential for gains when interest rates decline. Rising interest rates may cause prepayments to occur at a slower than expected rate, thereby effectively lengthening the maturity of the security and making the security more sensitive to interest rate changes. Prepayment and extension risk are major risks of mortgage-backed securities, senior floating rate interests and certain asset-backed securities. For certain asset-backed securities, the actual maturity may be less than the stated maturity shown in the Schedule of Investments, if applicable. As a result, the timing of income recognition relating to these securities may vary based upon the actual maturity.
Investing in the securities of non-U.S. issuers, whether directly or indirectly, involves certain considerations and risks not typically associated with securities of U.S. issuers. Such risks include, but are not limited to: generally less liquid and less efficient securities markets; generally greater price volatility; exchange rate fluctuations; imposition of restrictions on the expatriation of funds or other protectionist measures; less publicly available information about issuers; the imposition of withholding or other taxes; higher transaction and custody costs; settlement delays and risk of loss attendant in settlement procedures; difficulties in enforcing contractual obligations; less regulation of securities markets; different accounting, disclosure and reporting requirements; more substantial governmental involvement in the economy; higher inflation rates; and greater social, economic and political uncertainties. These risks are heightened for investments in issuers from countries with less developed markets.
Credit risk depends largely on the perceived financial health of bond issuers. In general, the credit rating is inversely related to the credit risk of the issuer. Higher rated bonds generally are deemed to have less credit risk, while lower or unrated bonds are deemed to have higher risk of default. The share price, yield and total return of a fund that holds securities with higher credit risk may be more volatile than those of a fund that holds bonds with lower credit risk. A Fund may be exposed to counterparty risk, or the risk that an institution or other entity with which a Fund has unsettled or open transactions will default.
| | a) | Each Fund intends to continue to qualify as a Regulated Investment Company (“RIC”) under Subchapter M of the Internal Revenue Code (“IRC”) by distributing substantially all of its taxable net investment income and net realized capital gains to its shareholders |
Notes to Financial Statements – (continued)
June 30, 2018 (Unaudited)
| | each year. Each Fund has distributed substantially all of its income and capital gains in prior years, if applicable, and intends to distribute substantially all of its income and capital gains during the calendar year ending December 31, 2018. Accordingly, no provision for federal income or excise taxes has been made in the accompanying financial statements. Distributions from short-term capital gains are treated as ordinary income distributions for federal income tax purposes. |
| | b) | Capital Loss Carryforward – On December 22, 2010, the Regulated Investment Company Modernization Act of 2010 (the “Act”) was enacted, which made changes to the capital loss carryforward rules. The changes are effective for taxable years beginning after the date of enactment. Under the Act, funds are permitted to carry forward capital losses for an unlimited period. However, any losses incurred during those future taxable years will be required to be utilized prior to the losses incurred in pre-enactment taxable years, which carry an expiration date. As a result of this ordering rule, pre-enactment capital loss carryforwards may be more likely to expire unused. Additionally, post-enactment capital loss carryforwards retain their character as either short-term or long-term capital losses rather than being considered all short-term as permitted under prior regulation. |
At December 31, 2017 (tax year end), the capital loss carryforwards for U.S. federal income tax purposes were as follows:
| | | | | | | | | | | | |
| | | Year of Expiration | | | Perpetual
Short-Term
Capital Loss
Carryforward | | | Perpetual
Long-Term
Capital Loss
Carryforward | |
Fund | | 2018 | |
High Yield HLS Fund | | $ | — | | | $ | 2,204,643 | | | $ | 13,477,579 | |
Ultrashort Bond HLS Fund | | | — | | | | 309,366 | | | | 375,724 | |
U.S. Government Securities HLS Fund | | | 58,149,395 | | | | 2,231,528 | | | | 25,703,203 | |
Balanced HLS Fund, Capital Appreciation HLS Fund, Disciplined Equity HLS Fund, Dividend and Growth HLS Fund, Global Growth HLS Fund, Growth Opportunities HLS Fund, Healthcare HLS Fund, International Opportunities HLS Fund, MidCap HLS Fund, MidCap Value HLS Fund, Small Cap Growth HLS Fund, Small Company HLS Fund, Small/Mid Cap Equity HLS Fund, Stock HLS Fund, Total Return Bond HLS Fund and Value HLS Fund had no capital loss carryforwards for U.S. federal income tax purposes as of December 31, 2017.
During the fiscal year ended December 31, 2017, the Balanced HLS Fund, High Yield HLS Fund, International Opportunities HLS Fund, Small Cap Growth HLS Fund, Small Company HLS Fund, Stock HLS Fund and Total Return Bond HLS Fund utilized $81,394,802, $5,006,208, $104,728,215, $14,202,092, $91,646,492, $128,342,761 and $13,673,254 of prior year capital loss carryforwards, respectively.
During the year ended December 31, 2017, High Yield HLS Fund, International Opportunities HLS Fund, Stock HLS Fund and U.S. Government Securities HLS Fund had expired $9,709,378, $195,309,855, $5,476,238 and $25,163,377 of prior year capital loss carryforwards, respectively.
| | c) | Tax Basis of Investments – The aggregate cost of investments for federal income tax purposes at June 30, 2018 was substantially the same for book purposes. The net unrealized appreciation/(depreciation) on investments, which consists of gross unrealized appreciation and depreciation, is disclosed below: |
| | | | | | | | | | | | | | | | |
Fund | | Tax Cost | | | Gross
Unrealized
Appreciation | | | Gross
Unrealized
(Depreciation) | | | Net
Unrealized
Appreciation
(Depreciation) | |
Balanced HLS Fund | | $ | 1,813,850,293 | | | $ | 456,219,376 | | | $ | (61,452,180 | ) | | $ | 394,767,196 | |
Capital Appreciation HLS Fund | | | 4,398,917,151 | | | | 560,404,691 | | | | (163,996,694 | ) | | | 396,407,997 | |
Disciplined Equity HLS Fund | | | 494,583,757 | | | | 172,675,025 | | | | (5,399,586 | ) | | | 167,275,439 | |
Dividend and Growth HLS Fund | | | 2,435,560,692 | | | | 930,927,797 | | | | (28,048,342 | ) | | | 902,879,455 | |
Global Growth HLS Fund | | | 395,044,308 | | | | 149,822,194 | | | | (4,251,554 | ) | | | 145,570,640 | |
Growth Opportunities HLS Fund | | | 1,392,952,491 | | | | 314,227,895 | | | | (28,495,754 | ) | | | 285,732,141 | |
Healthcare HLS Fund | | | 276,720,312 | | | | 87,402,673 | | | | (21,987,054 | ) | | | 65,415,619 | |
High Yield HLS Fund | | | 282,389,632 | | | | 5,480,979 | | | | (13,566,098 | ) | | | (8,085,119 | ) |
Notes to Financial Statements – (continued)
June 30, 2018 (Unaudited)
| | | | | | | | | | | | | | | | |
Fund | | Tax Cost | | | Gross
Unrealized
Appreciation | | | Gross
Unrealized
(Depreciation) | | | Net
Unrealized
Appreciation
(Depreciation) | |
International Opportunities HLS Fund | | $ | 1,387,022,723 | | | $ | 115,379,331 | | | $ | (56,840,851 | ) | | $ | 58,538,480 | |
MidCap HLS Fund | | | 1,688,512,259 | | | | 639,541,530 | | | | (16,980,571 | ) | | | 622,560,959 | |
MidCap Value HLS Fund | | | 297,912,097 | | | | 68,431,133 | | | | (10,803,992 | ) | | | 57,627,141 | |
Small Cap Growth HLS Fund | | | 1,176,165,668 | | | | 301,588,935 | | | | (37,811,436 | ) | | | 263,777,499 | |
Small Company HLS Fund | | | 535,149,527 | | | | 133,427,097 | | | | (15,961,937 | ) | | | 117,465,160 | |
Small/Mid Cap Equity HLS Fund | | | 83,258,714 | | | | 15,796,917 | | | | (3,134,105 | ) | | | 12,662,812 | |
Stock HLS Fund | | | 1,132,114,351 | | | | 338,282,037 | | | | (24,119,828 | ) | | | 314,162,209 | |
Total Return Bond HLS Fund | | | 3,068,436,514 | | | | 27,620,610 | | | | (61,571,327 | ) | | | (33,950,717 | ) |
Ultrashort Bond HLS Fund | | | 503,764,098 | | | | 504,372 | | | | (1,426,649 | ) | | | (922,277 | ) |
U.S. Government Securities HLS Fund | | | 388,048,307 | | | | 2,848,931 | | | | (6,678,033 | ) | | | (3,829,102 | ) |
Value HLS Fund | | | 368,050,123 | | | | 129,723,577 | | | | (11,831,349 | ) | | | 117,892,228 | |
| | a) | Investment Management Agreement – Hartford Funds Management Company, LLC (“HFMC”) serves as each Fund’s investment manager. Each Company, on behalf of its respective Funds, has entered into an Investment Management Agreement with HFMC. HFMC is an indirect subsidiary of The Hartford Financial Services Group, Inc. (“The Hartford”). HFMC has overall investment supervisory responsibility for each Fund. In addition, HFMC provides administrative personnel, services, equipment, facilities and office space for proper operation of each Fund. HFMC has contracted with Wellington Management Company LLP (“Wellington Management”) under a sub-advisory agreement and Wellington Management performs the daily investment of the assets of each Fund, in accordance with the Fund’s investment objective and policies. Each Fund pays a fee to HFMC, a portion of which may be used to compensate Wellington Management. |
The schedule below reflects the rates of compensation paid to HFMC for investment management services rendered as of June 30, 2018; the rates are accrued daily and paid monthly based on each Fund’s average daily net assets, at the following annual rates:
| | |
Fund | | Management Fee Rates |
Balanced HLS Fund | | 0.6800% on first $250 million and; |
| | 0.6550% on next $250 million and; |
| | 0.6450% on next $500 million and; |
| | 0.5950% on next $4 billion and; |
| | 0.5925% on next $5 billion and; |
| | 0.5900% over $10 billion |
| |
Capital Appreciation HLS Fund | | 0.7750% on first $250 million and; |
| | 0.7250% on next $250 million and; |
| | 0.6750% on next $500 million and; |
| | 0.6250% on next $1.5 billion and; |
| | 0.6200% on next $2.5 billion and; |
| | 0.6150% on next $5 billion and; |
| | 0.6100% over $10 billion |
| |
Disciplined Equity HLS Fund | | 0.7750% on first $250 million and; |
| | 0.7250% on next $250 million and; |
| | 0.6750% on next $500 million and; |
| | 0.6250% on next $4 billion and; |
| | 0.6225% on next $5 billion and; |
| | 0.6200% over $10 billion |
Notes to Financial Statements – (continued)
June 30, 2018 (Unaudited)
| | |
Fund | | Management Fee Rates |
Dividend and Growth HLS Fund | | 0.7750% on first $250 million and; |
| | 0.7250% on next $250 million and; |
| | 0.6750% on next $500 million and; |
| | 0.6250% on next $1.5 billion and; |
| | 0.6200% on next $2.5 billion and; |
| | 0.6150% on next $5 billion and; |
| | 0.6100% over $10 billion |
| |
Global Growth HLS Fund | | 0.7750% on first $250 million and; |
| | 0.7250% on next $250 million and; |
| | 0.6750% on next $500 million and; |
| | 0.6250% on next $4 billion and; |
| | 0.6225% on next $5 billion and; |
| | 0.6200% over $10 billion |
| |
Growth Opportunities HLS Fund | | 0.7000% on first $100 million and; |
| | 0.6000% on next $4.9 billion and; |
| | 0.5975% on next $5 billion and; |
| | 0.5950% over $10 billion |
| |
Healthcare HLS Fund | | 0.8500% on first $250 million and; |
| | 0.8000% on next $250 million and; |
| | 0.7500% on next $4.5 billion and; |
| | 0.7475% on next $5 billion and; |
| | 0.7450% over $10 billion |
| |
High Yield HLS Fund | | 0.7000% on first $500 million and; |
| | 0.6750% on next $500 million and; |
| | 0.6250% on next $1.5 billion and; |
| | 0.6150% on next $2.5 billion and; |
| | 0.6050% on next $5 billion and; |
| | 0.5950% over $10 billion |
| |
International Opportunities HLS Fund | | 0.7750% on first $250 million and; |
| | 0.7250% on next $250 million and; |
| | 0.6750% on next $500 million and; |
| | 0.6250% on next $1.5 billion and; |
| | 0.6200% on next $2.5 billion and; |
| | 0.6150% on next $5 billion and; |
| | 0.6100% over $10 billion |
| |
MidCap HLS Fund | | 0.7750% on first $250 million and; |
| | 0.7250% on next $250 million and; |
| | 0.6750% on next $500 million and; |
| | 0.6250% on next $4 billion and; |
| | 0.6225% on next $5 billion and; |
| | 0.6200% over $10 billion |
| |
MidCap Value HLS Fund | | 0.8000% on first $500 million and; |
| | 0.7250% on next $500 million and; |
| | 0.6750% on next $1.5 billion and; |
| | 0.6700% on next $2.5 billion and; |
| | 0.6650% on next $5 billion and; |
| | 0.6600% over $10 billion |
Notes to Financial Statements – (continued)
June 30, 2018 (Unaudited)
| | |
Fund | | Management Fee Rates |
Small Cap Growth HLS Fund | | 0.7000% on first $100 million and; |
| | 0.6000% on next $4.9 billion and; |
| | 0.5800% on next $5 billion and; |
| | 0.5700% over $10 billion |
| |
Small Company HLS Fund | | 0.7750% on first $250 million and; |
| | 0.7250% on next $250 million and; |
| | 0.6750% on next $500 million and; |
| | 0.6000% on next $500 million and; |
| | 0.5500% on next $3.5 billion and; |
| | 0.5300% on next $5 billion and; |
| | 0.5200% over $10 billion |
| |
Small/Mid Cap Equity HLS Fund | | 0.8000% on first $500 million and; |
| | 0.7500% on next $500 million and; |
| | 0.7000% on next $2 billion and; |
| | 0.6900% on next $2 billion and; |
| | 0.6800% on next $5 billion and; |
| | 0.6700% over $10 billion |
| |
Stock HLS Fund | | 0.5250% on first $250 million and; |
| | 0.5000% on next $250 million and; |
| | 0.4750% on next $500 million and; |
| | 0.4500% on next $4 billion and; |
| | 0.4475% on next $5 billion and; |
| | 0.4450% over $10 billion |
| |
Total Return Bond HLS Fund | | 0.5250% on first $250 million and; |
| | 0.5000% on next $250 million and; |
| | 0.4750% on next $500 million and; |
| | 0.4500% on next $1.5 billion and; |
| | 0.4450% on next $2.5 billion and; |
| | 0.4300% on next $5 billion and; |
| | 0.4200% over $10 billion |
| |
Ultrashort Bond HLS Fund | | 0.4000% on first $5 billion and; |
| | 0.3800% on next $5 billion and; |
| | 0.3700% over $10 billion |
| |
U.S. Government Securities HLS Fund | | 0.4500% on first $500 million and; |
| | 0.4450% on next $500 million and; |
| | 0.4400% on next $1.5 billion and; |
| | 0.4350% on next $2.5 billion and; |
| | 0.4300% on next $5 billion and; |
| | 0.4200% over $10 billion |
| |
Value HLS Fund | | 0.6900% on first $250 million and; |
| | 0.6425% on next $250 million and; |
| | 0.6325% on next $500 million and; |
| | 0.6250% on next $1.5 billion and; |
| | 0.6200% on next $2.5 billion and; |
| | 0.6150% on next $5 billion and; |
| | 0.6100% over $10 billion |
Notes to Financial Statements – (continued)
June 30, 2018 (Unaudited)
Prior to January 1, 2018, the Value HLS Fund paid the following rate to HFMC for investment management services rendered:
| | |
Fund | | Management Fee Rates |
Value HLS Fund | | 0.7750% on first $250 million and; |
| | 0.7250% on next $250 million and; |
| | 0.6750% on next $500 million and; |
| | 0.6250% on next $1.5 billion and; |
| | 0.6200% on next $2.5 billion and; |
| | 0.6150% on next $5 billion and; |
| | 0.6100% over $10 billion |
HFMC contractually agreed to waive investment management fees of 0.03% of average daily net assets until December 31, 2018, for the Balanced HLS Fund.
| | b) | Accounting Services Agreement – Pursuant to the Fund Accounting Agreement between HFMC and each Company, on behalf of its respective Funds, HFMC provides accounting services to each Fund and receives monthly compensation based on each Fund’s average daily net assets at the rates set forth below. Each Fund’s accounting services fees are accrued daily and paid monthly. |
| | |
Fund | | Accounting Services Fee Rates |
Balanced HLS Fund | | 0.018% on first $3.5 billion and; |
| | 0.014% on next $3.5 billion and; |
| | 0.010% over $7 billion |
| |
Capital Appreciation HLS Fund | | 0.018% on first $3.5 billion and; |
| | 0.014% on next $3.5 billion and; |
| | 0.010% over $7 billion |
| |
Disciplined Equity HLS Fund | | 0.014% on first $3.5 billion and; |
| | 0.012% on next $3.5 billion and; |
| | 0.010% over $7 billion |
| |
Dividend and Growth HLS Fund | | 0.014% on first $3.5 billion and; |
| | 0.012% on next $3.5 billion and; |
| | 0.010% over $7 billion |
| |
Global Growth HLS Fund | | 0.014% on first $3.5 billion and; |
| | 0.012% on next $3.5 billion and; |
| | 0.010% over $7 billion |
| |
Growth Opportunities HLS Fund | | 0.018% on first $3.5 billion and; |
| | 0.014% on next $3.5 billion and; |
| | 0.010% over $7 billion |
| |
Healthcare HLS Fund | | 0.014% on first $3.5 billion and; |
| | 0.012% on next $3.5 billion and; |
| | 0.010% over $7 billion |
| |
High Yield HLS Fund | | 0.014% on first $3.5 billion and; |
| | 0.012% on next $3.5 billion and; |
| | 0.010% over $7 billion |
| |
International Opportunities HLS Fund | | 0.014% on first $3.5 billion and; |
| | 0.012% on next $3.5 billion and; |
| | 0.010% over $7 billion |
| |
MidCap HLS Fund | | 0.014% on first $3.5 billion and; |
| | 0.012% on next $3.5 billion and; |
| | 0.010% over $7 billion |
Notes to Financial Statements – (continued)
June 30, 2018 (Unaudited)
| | |
Fund | | Accounting Services Fee Rates |
MidCap Value HLS Fund | | 0.014% on first $3.5 billion and; |
| | 0.012% on next $3.5 billion and; |
| | 0.010% over $7 billion |
| |
Small Cap Growth HLS Fund | | 0.018% on first $3.5 billion and; |
| | 0.014% on next $3.5 billion and; |
| | 0.010% over $7 billion |
| |
Small Company HLS Fund | | 0.018% on first $3.5 billion and; |
| | 0.014% on next $3.5 billion and; |
| | 0.010% over $7 billion |
| |
Small/Mid Cap Equity HLS Fund | | 0.014% on first $3.5 billion and; |
| | 0.012% on next $3.5 billion and; |
| | 0.010% over $7 billion |
| |
Stock HLS Fund | | 0.014% on first $3.5 billion and; |
| | 0.012% on next $3.5 billion and; |
| | 0.010% over $7 billion |
| |
Total Return Bond HLS Fund | | 0.018% on first $3.5 billion and; |
| | 0.014% on next $3.5 billion and; |
| | 0.010% over $7 billion |
| |
Ultrashort Bond HLS Fund | | 0.014% on first $3.5 billion and; |
| | 0.012% on next $3.5 billion and; |
| | 0.010% over $7 billion |
| |
U.S. Government Securities HLS Fund | | 0.014% on first $3.5 billion and; |
| | 0.012% on next $3.5 billion and; |
| | 0.010% over $7 billion |
| |
Value HLS Fund | | 0.014% on first $3.5 billion and; |
| | 0.012% on next $3.5 billion and; |
| | 0.010% over $7 billion |
HFMC has delegated certain accounting and administrative services functions to State Street Bank and Trust Company (“State Street”). The costs and expenses of such delegation are borne by HFMC, not by the Funds, and HFMC compensates State Street for its services out of its own resources.
| | c) | Operating Expenses – Allocable expenses incurred by a Company are allocated to each series within such Company, and allocated to classes within each such series, in proportion to the average daily net assets of such series and classes, except where allocation of certain expenses is more fairly made directly to a Fund or to specific classes within a Fund. |
| | d) | Fees Paid Indirectly – Hartford HLS Series Fund II, Inc., on behalf of its series except U.S. Government Securities HLS Fund, and Hartford Series Fund, Inc., on behalf of its series except High Yield HLS Fund, Total Return Bond HLS Fund and Ultrashort Bond HLS Fund, have entered into agreements with State Street Global Markets, LLC and Russell Implementation Services, Inc. to partially recapture non-discounted trade commissions. Such rebates are used to pay a portion of the Funds’ expenses. In addition, the Funds’ custodian bank has agreed to reduce its fees when a Fund maintains cash on deposit in a non-interest-bearing custody account. For the fiscal period ended June 30, 2018, these amounts, if any, are included in the Statements of Operations. |
Notes to Financial Statements – (continued)
June 30, 2018 (Unaudited)
The ratio of expenses to average net assets in the accompanying financial highlights excludes the reduction in expenses related to fees paid indirectly. The annualized expense ratio after waivers reflecting the reduction for fees paid indirectly for the period is as follows:
| | | | | | | | | | | | |
Fund | | Class IA | | | Class IB | | | Class IC | |
Balanced HLS Fund | | | 0.63 | % | | | 0.88 | % | | | — | |
Capital Appreciation HLS Fund | | | 0.68 | % | | | 0.93 | % | | | 1.18 | % |
Disciplined Equity HLS Fund | | | 0.78 | % | | | 1.03 | % | | | — | |
Dividend and Growth HLS Fund | | | 0.68 | % | | | 0.93 | % | | | — | |
Global Growth HLS Fund | | | 0.80 | % | | | 1.05 | % | | | — | |
Growth Opportunities HLS Fund | | | 0.65 | % | | | 0.90 | % | | | 1.15 | % |
Healthcare HLS Fund | | | 0.89 | % | | | 1.14 | % | | | — | |
High Yield HLS Fund | | | 0.77 | % | | | 1.02 | % | | | — | |
International Opportunities HLS Fund | | | 0.73 | % | | | 0.98 | % | | | — | |
MidCap HLS Fund | | | 0.69 | % | | | 0.94 | % | | | — | |
MidCap Value HLS Fund | | | 0.86 | % | | | 1.11 | % | | | — | |
Small Cap Growth HLS Fund | | | 0.64 | % | | | 0.89 | % | | | — | |
Small Company HLS Fund | | | 0.79 | % | | | 1.04 | % | | | — | |
Small/Mid Cap Equity HLS Fund | | | 0.91 | % | | | 1.16 | % | | | — | |
Stock HLS Fund | | | 0.52 | % | | | 0.77 | % | | | — | |
Total Return Bond HLS Fund | | | 0.51 | % | | | 0.76 | % | | | — | |
Ultrashort Bond HLS Fund | | | 0.45 | % | | | 0.70 | % | | | — | |
U.S. Government Securities HLS Fund | | | 0.51 | % | | | 0.76 | % | | | — | |
Value HLS Fund | | | 0.72 | % | | | 0.97 | % | | | — | |
| | e) | Distribution Plans for Class IB and Class IC Shares – Hartford Funds Distributors, LLC (“HFD”), an indirect subsidiary of The Hartford, is the principal underwriter and distributor of each Fund. Each Company, on behalf of its respective Funds, has adopted a Distribution Plan pursuant to Rule 12b-1 of the 1940 Act for Class IB shares and each Company, on behalf of certain Funds, has adopted a Distribution Plan pursuant to Rule 12b-1 of the 1940 Act for Class IC shares. |
Pursuant to the Class IB Distribution Plans, a Fund may pay HFD a fee of up to 0.25% of the average daily net assets of the Fund attributable to its Class IB shares for distribution financing activities and shareholder account servicing activities. The entire amount of the fee may be used for shareholder servicing expenses and/or distribution expenses. Pursuant to the Class IC Distribution Plans, a Fund may pay HFD a fee of up to 0.25% of the average daily net assets of the Fund attributable to its Class IC shares for distribution financing activities.
Each Board has the authority to suspend or reduce these payments at any point in time. The distribution fees paid during the period can be found on the Statements of Operations. Each Fund’s 12b-1 fees are accrued daily and paid monthly or at such other intervals as the respective Company’s Board of Directors may determine.
| | f) | Administrative Services Fee for Class IC Shares – Certain Funds may pay an administrative services fee to third party insurance companies annually up to 0.25% of the average daily net assets of the Fund attributable to its Class IC shares for recordkeeping and/or other administrative services provided to such Class IC shares. The total administrative services fees paid during the period are shown on the Statements of Operations. These fees are accrued daily and paid monthly. |
| | g) | Other Related Party Transactions – Certain officers of each Company are directors and/or officers of HFMC and/or The Hartford or its subsidiaries. For the six-month period ended June 30, 2018, a portion of each Company’s Chief Compliance Officer’s (“CCO”) compensation was paid by all of the investment companies in the Hartford fund complex. The portion allocated to each Fund, as represented in other expenses on the Statement of Operations, is outlined in the table below. |
| | | | |
Fund | | CCO Compensation
Paid by Fund | |
Balanced HLS Fund | | $ | 3,775 | |
Capital Appreciation HLS Fund | | | 8,116 | |
Disciplined Equity HLS Fund | | | 1,121 | |
Dividend and Growth HLS Fund | | | 5,735 | |
Notes to Financial Statements – (continued)
June 30, 2018 (Unaudited)
| | | | |
Fund | | CCO Compensation
Paid by Fund | |
Global Growth HLS Fund | | $ | 892 | |
Growth Opportunities HLS Fund | | | 2,588 | |
Healthcare HLS Fund | | | 548 | |
High Yield HLS Fund | | | 474 | |
International Opportunities HLS Fund | | | 2,595 | |
MidCap HLS Fund | | | 3,762 | |
MidCap Value HLS Fund | | | 594 | |
Small Cap Growth HLS Fund | | | 2,245 | |
Small Company HLS Fund | | | 1,029 | |
Small/Mid Cap Equity HLS Fund | | | 157 | |
Stock HLS Fund | | | 2,438 | |
Total Return Bond HLS Fund | | | 3,785 | |
Ultrashort Bond HLS Fund | | | 839 | |
U.S. Government Securities HLS Fund | | | 631 | |
Value HLS Fund | | | 831 | |
Hartford Administrative Services Company (“HASCO”), an indirect subsidiary of The Hartford, provides transfer agent services to each Fund. Pursuant to a sub-transfer agency agreement between HASCO and DST Asset Manager Solutions, Inc. (“DST”). HASCO has delegated certain transfer agent, dividend disbursing agent and shareholder servicing agent functions to DST. The costs and expenses of such delegation are borne by HASCO, not by the Funds. Each Fund pays HASCO a fixed fee annually, plus out of pocket expenses for providing such services. The accrued amount shown in the Statements of Operations reflects the amounts charged by HASCO. These fees are accrued daily and paid monthly.
For the six-month period ended June 30, 2018, the effective rate of compensation paid to HASCO for transfer agency services on a gross and net basis as a percentage of each Class’ average daily net assets is as follows:
| | | | | | | | | | | | |
Fund | | Class IA | | | Class IB | | | Class IC | |
Balanced HLS Fund | | | 0.00 | %* | | | 0.00 | %* | | | — | |
Capital Appreciation HLS Fund | | | 0.00 | %* | | | 0.00 | %* | | | 0.00 | %* |
Disciplined Equity HLS Fund | | | 0.00 | %* | | | 0.00 | %* | | | — | |
Dividend and Growth HLS Fund | | | 0.00 | %* | | | 0.00 | %* | | | — | |
Global Growth HLS Fund | | | 0.00 | %* | | | 0.00 | %* | | | — | |
Growth Opportunities HLS Fund | | | 0.00 | %* | | | 0.00 | %* | | | 0.00 | %* |
Healthcare HLS Fund | | | 0.00 | %* | | | 0.00 | %* | | | — | |
High Yield HLS Fund | | | 0.00 | %* | | | 0.00 | %* | | | — | |
International Opportunities HLS Fund | | | 0.00 | %* | | | 0.00 | %* | | | — | |
MidCap HLS Fund | | | 0.00 | %* | | | 0.00 | %* | | | — | |
MidCap Value HLS Fund | | | 0.00 | %* | | | 0.00 | %* | | | — | |
Small Cap Growth HLS Fund | | | 0.00 | %* | | | 0.00 | %* | | | — | |
Small Company HLS Fund | | | 0.00 | %* | | | 0.00 | %* | | | — | |
Small/Mid Cap Equity HLS Fund | | | 0.01 | % | | | 0.01 | % | | | — | |
Stock HLS Fund | | | 0.00 | %* | | | 0.00 | %* | | | — | |
Total Return Bond HLS Fund | | | 0.00 | %* | | | 0.00 | %* | | | — | |
Ultrashort Bond HLS Fund | | | 0.00 | %* | | | 0.00 | %* | | | — | |
U.S. Government Securities HLS Fund | | | 0.00 | %* | | | 0.00 | %* | | | — | |
Value HLS Fund | | | 0.00 | %* | | | 0.00 | %* | | | — | |
| | * | Percentage rounds to zero. |
Notes to Financial Statements – (continued)
June 30, 2018 (Unaudited)
A Fund may lend portfolio securities to certain borrowers in U.S. and non-U.S. markets in an amount not to exceed one third (33 1/3%) of the value of its total assets. If a Fund security is on loan, under the lending agreement, the borrower is required to deposit cash or liquid securities as collateral at least equal to 100% of the market value of the loaned securities; cash collateral is invested for the benefit of the Fund by the Fund’s lending agent pursuant to collateral investment guidelines. The collateral is marked to market daily, in an amount at least equal to the current market value of the securities loaned. A Fund is subject to certain risks while its securities are on loan, including the following: (i) the risk that the borrower defaults on the loan and the collateral is inadequate to cover the Fund’s loss; (ii) the risk that the earnings on the collateral invested are not sufficient to pay fees incurred in connection with the loan; (iii) the risk that the principal value of the collateral invested may decline; (iv) the risk that the borrower may use the loaned securities to cover a short sale, which may in turn place downward pressure on the market prices of the loaned securities; (v) the risk that return of loaned securities could be delayed and interfere with portfolio management decisions; and (vi) the risk that any efforts to restrict the securities for purposes of voting may not be effective. These events could also trigger adverse tax consequences for the Fund.
At June 30, 2018, the following Funds had securities on loan at value, cash collateral and non-cash collateral as follows:
| | | | | | | | | | | | |
Fund | | Market Value
of Securities
on Loan | | | Cash
Collateral | | | Non-Cash
Collateral | |
Balanced HLS Fund | | $ | 2,891,187 | | | $ | 2,943,973 | | | $ | — | |
Capital Appreciation HLS Fund | | | 18,582,748 | | | | 18,971,506 | | | | — | |
Global Growth HLS Fund | | | 1,347,988 | | | | 1,373,757 | | | | — | |
Growth Opportunities HLS Fund | | | 43,764,332 | | | | 44,965,898 | | | | — | |
Healthcare HLS Fund | | | 12,302,156 | | | | 12,622,214 | | | | — | |
International Opportunities HLS Fund | | | 307,775 | | | | 323,163 | | | | — | |
MidCap HLS Fund | | | 14,390,331 | | | | 14,777,089 | | | | — | |
MidCap Value HLS Fund | | | 3,862,865 | | | | 3,938,076 | | | | — | |
Small Cap Growth HLS Fund | | | 49,968,235 | | | | 51,156,426 | | | | — | |
Small Company HLS Fund | | | 11,026,358 | | | | 11,282,564 | | | | — | |
Small/Mid Cap Equity HLS Fund | | | 1,102,803 | | | | 1,130,610 | | | | — | |
Total Return Bond HLS Fund | | | 10,317,843 | | | | 10,509,326 | | | | — | |
Value HLS Fund | | | 2,221,761 | | | | 2,328,015 | | | | — | |
The following table reflects a breakdown of transactions accounted for as secured borrowings, the gross obligation by the type of collateral pledged, and the remaining contractual maturity of those transactions as of June 30, 2018.
Balanced HLS Fund
CERTAIN TRANSFERS ACCOUNTED FOR AS SECURED BORROWINGS
Remaining Contractual Maturity of the Agreements
| | | | | | | | | | | | | | | | | | | | |
| | | Overnight and
Continuous | | | <30 days | | | Between
30 & 90 days | | | >90 days | | | Total | |
Securities Lending Transactions(1) | |
Corporate Bonds | | $ | 2,943,973 | | | $ | — | | | $ | — | | | $ | — | | | $ | 2,943,973 | |
| | | | | | | | | | | | | | | | | | | | |
Total Borrowings | | $ | 2,943,973 | | | $ | — | | | $ | — | | | $ | — | | | $ | 2,943,973 | |
| | | | | | | | | | | | | | | | | | | | |
Gross amount of recognized liabilities for securities lending transactions | | | $ | 2,943,973 | |
| | | | | | | | | | | | | | | | | | | | |
| | (1) | Amount represents the payable for cash collateral received on securities on loan. This will generally be in the “Overnight and Continuous” column as the securities are typically callable on demand. |
Notes to Financial Statements – (continued)
June 30, 2018 (Unaudited)
Capital Appreciation HLS Fund
CERTAIN TRANSFERS ACCOUNTED FOR AS SECURED BORROWINGS
Remaining Contractual Maturity of the Agreements
| | | | | | | | | | | | | | | | | | | | |
| | | Overnight and
Continuous | | | <30 days | | | Between
30 & 90 days | | | >90 days | | | Total | |
Securities Lending Transactions(1) | |
Common Stocks | | $ | 18,971,506 | | | $ | — | | | $ | — | | | $ | — | | | $ | 18,971,506 | |
| | | | | | | | | | | | | | | | | | | | |
Total Borrowings | | $ | 18,971,506 | | | $ | — | | | $ | — | | | $ | — | | | $ | 18,971,506 | |
| | | | | | | | | | | | | | | | | | | | |
Gross amount of recognized liabilities for securities lending transactions | | | $ | 18,971,506 | |
| | | | | | | | | | | | | | | | | | | | |
| | (1) | Amount represents the payable for cash collateral received on securities on loan. This will generally be in the “Overnight and Continuous” column as the securities are typically callable on demand. |
Global Growth HLS Fund
CERTAIN TRANSFERS ACCOUNTED FOR AS SECURED BORROWINGS
Remaining Contractual Maturity of the Agreements
| | | | | | | | | | | | | | | | | | | | |
| | | Overnight and
Continuous | | | <30 days | | | Between
30 & 90 days | | | >90 days | | | Total | |
Securities Lending Transactions(1) | |
Common Stocks | | $ | 1,373,757 | | | $ | — | | | $ | — | | | $ | — | | | $ | 1,373,757 | |
| | | | | | | | | | | | | | | | | | | | |
Total Borrowings | | $ | 1,373,757 | | | $ | — | | | $ | — | | | $ | — | | | $ | 1,373,757 | |
| | | | | | | | | | | | | | | | | | | | |
Gross amount of recognized liabilities for securities lending transactions | | | $ | 1,373,757 | |
| | | | | | | | | | | | | | | | | | | | |
| | (1) | Amount represents the payable for cash collateral received on securities on loan. This will generally be in the “Overnight and Continuous” column as the securities are typically callable on demand. |
Growth Opportunities HLS Fund
CERTAIN TRANSFERS ACCOUNTED FOR AS SECURED BORROWINGS
Remaining Contractual Maturity of the Agreements
| | | | | | | | | | | | | | | | | | | | |
| | | Overnight and
Continuous | | | <30 days | | | Between
30 & 90 days | | | >90 days | | | Total | |
Securities Lending Transactions(1) | |
Common Stocks | | $ | 44,965,898 | | | $ | — | | | $ | — | | | $ | — | | | $ | 44,965,898 | |
| | | | | | | | | | | | | | | | | | | | |
Total Borrowings | | $ | 44,965,898 | | | $ | — | | | $ | — | | | $ | — | | | $ | 44,965,898 | |
| | | | | | | | | | | | | | | | | | | | |
Gross amount of recognized liabilities for securities lending transactions | | | $ | 44,965,898 | |
| | | | | | | | | | | | | | | | | | | | |
| | (1) | Amount represents the payable for cash collateral received on securities on loan. This will generally be in the “Overnight and Continuous” column as the securities are typically callable on demand. |
Notes to Financial Statements – (continued)
June 30, 2018 (Unaudited)
Healthcare HLS Fund
CERTAIN TRANSFERS ACCOUNTED FOR AS SECURED BORROWINGS
Remaining Contractual Maturity of the Agreements
| | | | | | | | | | | | | | | | | | | | |
| | | Overnight and
Continuous | | | <30 days | | | Between
30 & 90 days | | | >90 days | | | Total | |
Securities Lending Transactions(1) | |
Common Stocks | | $ | 12,622,214 | | | $ | — | | | $ | — | | | $ | — | | | $ | 12,622,214 | |
| | | | | | | | | | | | | | | | | | | | |
Total Borrowings | | $ | 12,622,214 | | | $ | — | | | $ | — | | | $ | — | | | $ | 12,622,214 | |
| | | | | | | | | | | | | | | | | | | | |
Gross amount of recognized liabilities for securities lending transactions | | | $ | 12,622,214 | |
| | | | | | | | | | | | | | | | | | | | |
| | (1) | Amount represents the payable for cash collateral received on securities on loan. This will generally be in the “Overnight and Continuous” column as the securities are typically callable on demand. |
International Opportunities HLS Fund
CERTAIN TRANSFERS ACCOUNTED FOR AS SECURED BORROWINGS
Remaining Contractual Maturity of the Agreements
| | | | | | | | | | | | | | | | | | | | |
| | | Overnight and
Continuous | | | <30 days | | | Between
30 & 90 days | | | >90 days | | | Total | |
Securities Lending Transactions(1) | |
Common Stocks | | $ | 323,163 | | | $ | — | | | $ | — | | | $ | — | | | $ | 323,163 | |
| | | | | | | | | | | | | | | | | | | | |
Total Borrowings | | $ | 323,163 | | | $ | — | | | $ | — | | | $ | — | | | $ | 323,163 | |
| | | | | | | | | | | | | | | | | | | | |
Gross amount of recognized liabilities for securities lending transactions | | | $ | 323,163 | |
| | | | | | | | | | | | | | | | | | | | |
| | (1) | Amount represents the payable for cash collateral received on securities on loan. This will generally be in the “Overnight and Continuous” column as the securities are typically callable on demand. |
MidCap HLS Fund
CERTAIN TRANSFERS ACCOUNTED FOR AS SECURED BORROWINGS
Remaining Contractual Maturity of the Agreements
| | | | | | | | | | | | | | | | | | | | |
| | | Overnight and
Continuous | | | <30 days | | | Between
30 & 90 days | | | >90 days | | | Total | |
Securities Lending Transactions(1) | |
Common Stocks | | $ | 14,777,089 | | | $ | — | | | $ | — | | | $ | — | | | $ | 14,777,089 | |
| | | | | | | | | | | | | | | | | | | | |
Total Borrowings | | $ | 14,777,089 | | | $ | — | | | $ | — | | | $ | — | | | $ | 14,777,089 | |
| | | | | | | | | | | | | | | | | | | | |
Gross amount of recognized liabilities for securities lending transactions | | | $ | 14,777,089 | |
| | | | | | | | | | | | | | | | | | | | |
| | (1) | Amount represents the payable for cash collateral received on securities on loan. This will generally be in the “Overnight and Continuous” column as the securities are typically callable on demand. |
Notes to Financial Statements – (continued)
June 30, 2018 (Unaudited)
MidCap Value HLS Fund
CERTAIN TRANSFERS ACCOUNTED FOR AS SECURED BORROWINGS
Remaining Contractual Maturity of the Agreements
| | | | | | | | | | | | | | | | | | | | |
| | | Overnight and
Continuous | | | <30 days | | | Between
30 & 90 days | | | >90 days | | | Total | |
Securities Lending Transactions(1) | |
Common Stocks | | $ | 3,938,076 | | | $ | — | | | $ | — | | | $ | — | | | $ | 3,938,076 | |
| | | | | | | | | | | | | | | | | | | | |
Total Borrowings | | $ | 3,938,076 | | | $ | — | | | $ | — | | | $ | — | | | $ | 3,938,076 | |
| | | | | | | | | | | | | | | | | | | | |
Gross amount of recognized liabilities for securities lending transactions | | | $ | 3,938,076 | |
| | | | | | | | | | | | | | | | | | | | |
| | (1) | Amount represents the payable for cash collateral received on securities on loan. This will generally be in the “Overnight and Continuous” column as the securities are typically callable on demand. |
Small Cap Growth HLS Fund
CERTAIN TRANSFERS ACCOUNTED FOR AS SECURED BORROWINGS
Remaining Contractual Maturity of the Agreements
| | | | | | | | | | | | | | | | | | | | |
| | | Overnight and
Continuous | | | <30 days | | | Between
30 & 90 days | | | >90 days | | | Total | |
Securities Lending Transactions(1) | |
Common Stocks | | $ | 19,773,614 | | | $ | — | | | $ | — | | | $ | — | | | $ | 19,773,614 | |
Exchange-Traded Funds | | | 31,382,812 | | | | — | | | | — | | | | — | | | | 31,382,812 | |
| | | | | | | | | | | | | | | | | | | | |
Total | | $ | 51,156,426 | | | $ | — | | | $ | — | | | $ | — | | | $ | 51,156,426 | |
| | | | | | | | | | | | | | | | | | | | |
Total Borrowings | | $ | 51,156,426 | | | $ | — | | | $ | — | | | $ | — | | | $ | 51,156,426 | |
| | | | | | | | | | | | | | | | | | | | |
Gross amount of recognized liabilities for securities lending transactions | | | $ | 51,156,426 | |
| | | | | | | | | | | | | | | | | | | | |
| | (1) | Amount represents the payable for cash collateral received on securities on loan. This will generally be in the “Overnight and Continuous” column as the securities are typically callable on demand. |
Small Company HLS Fund
CERTAIN TRANSFERS ACCOUNTED FOR AS SECURED BORROWINGS
Remaining Contractual Maturity of the Agreements
| | | | | | | | | | | | | | | | | | | | |
| | | Overnight and
Continuous | | | <30 days | | | Between
30 & 90 days | | | >90 days | | | Total | |
Securities Lending Transactions(1) | |
Common Stocks | | $ | 9,251,690 | | | $ | — | | | $ | — | | | $ | — | | | $ | 9,251,690 | |
Exchange-Traded Funds | | | 2,030,874 | | | | — | | | | — | | | | — | | | | 2,030,874 | |
| | | | | | | | | | | | | | | | | | | | |
Total | | $ | 11,282,564 | | | $ | — | | | $ | — | | | $ | — | | | $ | 11,282,564 | |
| | | | | | | | | | | | | | | | | | | | |
Total Borrowings | | $ | 11,282,564 | | | $ | — | | | $ | — | | | $ | — | | | $ | 11,282,564 | |
| | | | | | | | | | | | | | | | | | | | |
Gross amount of recognized liabilities for securities lending transactions | | | $ | 11,282,564 | |
| | | | | | | | | | | | | | | | | | | | |
| | (1) | Amount represents the payable for cash collateral received on securities on loan. This will generally be in the “Overnight and Continuous” column as the securities are typically callable on demand. |
Notes to Financial Statements – (continued)
June 30, 2018 (Unaudited)
Small/Mid Cap Equity HLS Fund
CERTAIN TRANSFERS ACCOUNTED FOR AS SECURED BORROWINGS
Remaining Contractual Maturity of the Agreements
| | | | | | | | | | | | | | | | | | | | |
| | | Overnight and
Continuous | | | <30 days | | | Between
30 & 90 days | | | >90 days | | | Total | |
Securities Lending Transactions(1) | |
Common Stocks | | $ | 1,130,610 | | | $ | — | | | $ | — | | | $ | — | | | $ | 1,130,610 | |
| | | | | | | | | | | | | | | | | | | | |
Total Borrowings | | $ | 1,130,610 | | | $ | — | | | $ | — | | | $ | — | | | $ | 1,130,610 | |
| | | | | | | | | | | | | | | | | | | | |
Gross amount of recognized liabilities for securities lending transactions | | | $ | 1,130,610 | |
| | | | | | | | | | | | | | | | | | | | |
| | (1) | Amount represents the payable for cash collateral received on securities on loan. This will generally be in the “Overnight and Continuous” column as the securities are typically callable on demand. |
Total Return Bond HLS Fund
CERTAIN TRANSFERS ACCOUNTED FOR AS SECURED BORROWINGS
Remaining Contractual Maturity of the Agreements
| | | | | | | | | | | | | | | | | | | | |
| | | Overnight and
Continuous | | | <30 days | | | Between
30 & 90 days | | | >90 days | | | Total | |
Securities Lending Transactions(1) | |
Corporate Bonds | | $ | 10,200,915 | | | $ | — | | | $ | — | | | $ | — | | | $ | 10,200,915 | |
Foreign Government Obligations | | | 308,411 | | | | — | | | | — | | | | — | | | | 308,411 | |
| | | | | | | | | | | | | | | | | | | | |
Total | | $ | 10,509,326 | | | $ | — | | | $ | — | | | $ | — | | | $ | 10,509,326 | |
| | | | | | | | | | | | | | | | | | | | |
Total Borrowings | | $ | 10,509,326 | | | $ | — | | | $ | — | | | $ | — | | | $ | 10,509,326 | |
| | | | | | | | | | | | | | | | | | | | |
Gross amount of recognized liabilities for securities lending transactions | | | $ | 10,509,326 | |
| | | | | | | | | | | | | | | | | | | | |
| | (1) | Amount represents the payable for cash collateral received on securities on loan. This will generally be in the “Overnight and Continuous” column as the securities are typically callable on demand. |
Value HLS Fund
CERTAIN TRANSFERS ACCOUNTED FOR AS SECURED BORROWINGS
Remaining Contractual Maturity of the Agreements
| | | | | | | | | | | | | | | | | | | | |
| | | Overnight and
Continuous | | | <30 days | | | Between
30 & 90 days | | | >90 days | | | Total | |
Securities Lending Transactions(1) | |
Common Stocks | | $ | 2,328,015 | | | $ | — | | | $ | — | | | $ | — | | | $ | 2,328,015 | |
| | | | | | | | | | | | | | | | | | | | |
Total Borrowings | | $ | 2,328,015 | | | $ | — | | | $ | — | | | $ | — | | | $ | 2,328,015 | |
| | | | | | | | | | | | | | | | | | | | |
Gross amount of recognized liabilities for securities lending transactions | | | $ | 2,328,015 | |
| | | | | | | | | | | | | | | | | | | | |
| | (1) | Amount represents the payable for cash collateral received on securities on loan. This will generally be in the “Overnight and Continuous” column as the securities are typically callable on demand. |
Notes to Financial Statements – (continued)
June 30, 2018 (Unaudited)
| 9. | Investment Transactions: |
For the six-month period ended June 30, 2018, the cost of purchases and proceeds from sales of investment securities (excluding short-term investments) were as follows:
| | | | | | | | |
Fund | | Cost of Purchases
Excluding U.S.
Government
Obligations | | | Sales Proceeds
Excluding U.S.
Government
Obligations | |
Balanced HLS Fund | | $ | 302,903,756 | | | $ | 414,176,427 | |
Capital Appreciation HLS Fund | | | 2,286,550,165 | | | | 2,716,827,101 | |
Disciplined Equity HLS Fund | | | 88,862,737 | | | | 142,165,994 | |
Dividend and Growth HLS Fund | | | 499,950,652 | | | | 733,406,486 | |
Global Growth HLS Fund | | | 137,029,910 | | | | 155,664,042 | |
Growth Opportunities HLS Fund | | | 929,448,589 | | | | 1,066,138,664 | |
Healthcare HLS Fund | | | 45,351,877 | | | | 70,563,192 | |
High Yield HLS Fund | | | 43,260,654 | | | | 56,103,963 | |
International Opportunities HLS Fund | | | 616,444,695 | | | | 695,402,932 | |
MidCap HLS Fund | | | 399,203,632 | | | | 482,720,101 | |
MidCap Value HLS Fund | | | 79,301,385 | | | | 106,391,269 | |
Small Cap Growth HLS Fund | | | 469,731,572 | | | | 519,540,879 | |
Small Company HLS Fund | | | 298,057,250 | | | | 347,153,993 | |
Small/Mid Cap Equity HLS Fund | | | 41,896,958 | | | | 49,762,199 | |
Stock HLS Fund | | | 150,095,349 | | | | 243,158,194 | |
Total Return Bond HLS Fund | | | 400,406,946 | | | | 406,848,898 | |
Ultrashort Bond HLS Fund | | | 80,718,683 | | | | 125,039,582 | |
U.S. Government Securities HLS Fund | | | 29,705,067 | | | | 26,498,214 | |
Value HLS Fund | | | 54,062,905 | | | | 82,665,711 | |
| | |
Fund | | Cost of Purchases
For U.S.
Government
Obligations | | | Sales Proceeds
For U.S.
Government
Obligations | |
Balanced HLS Fund | | $ | 31,408,886 | | | $ | 61,380,547 | |
Capital Appreciation HLS Fund | | | — | | | | — | |
Disciplined Equity HLS Fund | | | — | | | | — | |
Dividend and Growth HLS Fund | | | — | | | | — | |
Global Growth HLS Fund | | | — | | | | — | |
Growth Opportunities HLS Fund | | | — | | | | — | |
Healthcare HLS Fund | | | — | | | | — | |
High Yield HLS Fund | | | — | | | | — | |
International Opportunities HLS Fund | | | — | | | | — | |
MidCap HLS Fund | | | — | | | | — | |
MidCap Value HLS Fund | | | — | | | | — | |
Small Cap Growth HLS Fund | | | — | | | | — | |
Small Company HLS Fund | | | — | | | | — | |
Small/Mid Cap Equity HLS Fund | | | — | | | | — | |
Stock HLS Fund | | | — | | | | — | |
Total Return Bond HLS Fund | | | 213,299,936 | | | | 281,730,805 | |
Ultrashort Bond HLS Fund | | | — | | | | 37,480,063 | |
U.S. Government Securities HLS Fund | | | 38,067,913 | | | | 79,660,408 | |
Value HLS Fund | | | — | | | | — | |
Notes to Financial Statements – (continued)
June 30, 2018 (Unaudited)
| | | | | | | | |
Fund | | Total Cost of
Purchases | | | Total Sales Proceeds | |
Balanced HLS Fund | | $ | 334,312,642 | | | $ | 475,556,974 | |
Capital Appreciation HLS Fund | | | 2,286,550,165 | | | | 2,716,827,101 | |
Disciplined Equity HLS Fund | | | 88,862,737 | | | | 142,165,994 | |
Dividend and Growth HLS Fund | | | 499,950,652 | | | | 733,406,486 | |
Global Growth HLS Fund | | | 137,029,910 | | | | 155,664,042 | |
Growth Opportunities HLS Fund | | | 929,448,589 | | | | 1,066,138,664 | |
Healthcare HLS Fund | | | 45,351,877 | | | | 70,563,192 | |
High Yield HLS Fund | | | 43,260,654 | | | | 56,103,963 | |
International Opportunities HLS Fund | | | 616,444,695 | | | | 695,402,932 | |
MidCap HLS Fund | | | 399,203,632 | | | | 482,720,101 | |
MidCap Value HLS Fund | | | 79,301,385 | | | | 106,391,269 | |
Small Cap Growth HLS Fund | | | 469,731,572 | | | | 519,540,879 | |
Small Company HLS Fund | | | 298,057,250 | | | | 347,153,993 | |
Small/Mid Cap Equity HLS Fund | | | 41,896,958 | | | | 49,762,199 | |
Stock HLS Fund | | | 150,095,349 | | | | 243,158,194 | |
Total Return Bond HLS Fund | | | 613,706,882 | | | | 688,579,703 | |
Ultrashort Bond HLS Fund | | | 80,718,683 | | | | 162,519,645 | |
U.S. Government Securities HLS Fund | | | 67,772,980 | | | | 106,158,622 | |
Value HLS Fund | | | 54,062,905 | | | | 82,665,711 | |
| 10. | Capital Share Transactions: |
The following information is for the six-month period ended June 30, 2018, and the year ended December 31, 2017:
| | | | | | | | | | | | | | | | |
| Balanced HLS Fund | | | | | | | | | | | | |
| | | For the Six-Month Period
Ended June 30, 2018 | | | For the Year Ended
December 31, 2017 | |
| | | Shares | | | Amount | | | Shares | | | Amount | |
Class IA | | | | | | | | | | | | | | | | |
Shares Sold | | | 231,714 | | | $ | 7,225,924 | | | | 806,404 | | | $ | 24,243,642 | |
Shares Issued for Reinvested Dividends | | | — | | | | — | | | | 1,550,612 | | | | 47,464,119 | |
Shares Redeemed | | | (5,027,105 | ) | | | (156,689,415 | ) | | | (9,237,441 | ) | | | (271,385,497 | ) |
| | | | | | | | | | | | | | | | |
Net Increase (Decrease) | | | (4,795,391 | ) | | | (149,463,491 | ) | | | (6,880,425 | ) | | | (199,677,736 | ) |
| | | | | | | | | | | | | | | | |
Class IB | | | | | | | | | | | | | | | | |
Shares Sold | | | 120,674 | | | $ | 3,803,952 | | | | 98,155 | | | $ | 2,948,319 | |
Shares Issued for Reinvested Dividends | | | — | | | | — | | | | 178,485 | | | | 5,534,060 | |
Shares Redeemed | | | (676,424 | ) | | | (21,318,498 | ) | | | (1,359,464 | ) | | | (40,387,458 | ) |
| | | | | | | | | | | | | | | | |
Net Increase (Decrease) | | | (555,750 | ) | | | (17,514,546 | ) | | | (1,082,824 | ) | | | (31,905,079 | ) |
| | | | | | | | | | | | | | | | |
Total Net Increase (Decrease) | | | (5,351,141 | ) | | $ | (166,978,037 | ) | | | (7,963,249 | ) | | $ | (231,582,815 | ) |
| | | | | | | | | | | | | | | | |
Notes to Financial Statements – (continued)
June 30, 2018 (Unaudited)
| | | | | | | | | | | | | | | | |
| Capital Appreciation HLS Fund | |
| | | For the Six-Month Period
Ended June 30, 2018 | | | For the Year Ended
December 31, 2017 | |
| | | Shares | | | Amount | | | Shares | | | Amount | |
Class IA | | | | | | | | | | | | | | | | |
Shares Sold | | | 248,833 | | | $ | 12,320,200 | | | | 1,520,224 | | | $ | 69,676,765 | |
Shares Issued for Reinvested Dividends | | | — | | | | — | | | | 5,849,271 | | | | 280,000,593 | |
Shares Redeemed | | | (7,844,755 | ) | | | (387,615,235 | ) | | | (23,141,724 | ) | | | (1,078,423,340 | ) |
| | | | | | | | | | | | | | | | |
Net Increase (Decrease) | | | (7,595,922 | ) | | | (375,295,035 | ) | | | (15,772,229 | ) | | | (728,745,982 | ) |
| | | | | | | | | | | | | | | | |
Class IB | | | | | | | | | | | | | | | | |
Shares Sold | | | 63,199 | | | $ | 3,042,933 | | | | 111,613 | | | $ | 5,150,495 | |
Shares Issued for Reinvested Dividends | | | — | | | | — | | | | 742,165 | | | | 35,014,412 | |
Shares Redeemed | | | (1,448,320 | ) | | | (70,703,807 | ) | | | (2,304,465 | ) | | | (105,783,037 | ) |
| | | | | | | | | | | | | | | | |
Net Increase (Decrease) | | | (1,385,121 | ) | | | (67,660,874 | ) | | | (1,450,687 | ) | | | (65,618,130 | ) |
| | | | | | | | | | | | | | | | |
Class IC | | | | | | | | | | | | | | | | |
Shares Sold | | | 39,777 | | | $ | 1,950,214 | | | | 127,654 | | | $ | 5,935,733 | |
Shares Issued for Reinvested Dividends | | | — | | | | — | | | | 36,298 | | | | 1,722,982 | |
Shares Redeemed | | | (48,544 | ) | | | (2,371,901 | ) | | | (53,091 | ) | | | (2,473,932 | ) |
| | | | | | | | | | | | | | | | |
Net Increase (Decrease) | | | (8,767 | ) | | | (421,687 | ) | | | 110,861 | | | | 5,184,783 | |
| | | | | | | | | | | | | | | | |
Total Net Increase (Decrease) | | | (8,989,810 | ) | | $ | (443,377,596 | ) | | | (17,112,055 | ) | | $ | (789,179,329 | ) |
| | | | | | | | | | | | | | | | |
| | | | |
| Disciplined Equity HLS Fund | | | | | | | | | | | | |
| | | For the Six-Month Period
Ended June 30, 2018 | | | For the Year Ended
December 31, 2017 | |
| | | Shares | | | Amount | | | Shares | | | Amount | |
Class IA | | | | | | | | | | | | | | | | |
Shares Sold | | | 101,894 | | | $ | 1,621,572 | | | | 283,728 | | | $ | 4,383,156 | |
Shares Issued for Reinvested Dividends | | | — | | | | — | | | | 4,779,020 | | | | 69,277,938 | |
Shares Redeemed | | | (3,433,045 | ) | | | (54,521,474 | ) | | | (6,394,841 | ) | | | (97,244,218 | ) |
| | | | | | | | | | | | | | | | |
Net Increase (Decrease) | | | (3,331,151 | ) | | | (52,899,902 | ) | | | (1,332,093 | ) | | | (23,583,124 | ) |
| | | | | | | | | | | | | | | | |
Class IB | | | | | | | | | | | | | | | | |
Shares Sold | | | 50,679 | | | $ | 781,094 | | | | 144,937 | | | $ | 2,190,277 | |
Shares Issued for Reinvested Dividends | | | — | | | | — | | | | 660,646 | | | | 9,451,480 | |
Shares Redeemed | | | (507,292 | ) | | | (7,983,247 | ) | | | (1,017,854 | ) | | | (15,281,872 | ) |
| | | | | | | | | | | | | | | | |
Net Increase (Decrease) | | | (456,613 | ) | | | (7,202,153 | ) | | | (212,271 | ) | | | (3,640,115 | ) |
| | | | | | | | | | | | | | | | |
Total Net Increase (Decrease) | | | (3,787,764 | ) | | $ | (60,102,055 | ) | | | (1,544,364 | ) | | $ | (27,223,239 | ) |
| | | | | | | | | | | | | | | | |
| | | | |
| Dividend and Growth HLS Fund | | | | | | | | | | | | |
| | | For the Six-Month Period
Ended June 30, 2018 | | | For the Year Ended
December 31, 2017 | |
| | | Shares | | | Amount | | | Shares | | | Amount | |
Class IA | | | | | | | | | | | | | | | | |
Shares Sold | | | 1,328,945 | | | $ | 31,962,831 | | | | 4,155,891 | | | $ | 95,954,389 | |
Shares Issued for Reinvested Dividends | | | — | | | | — | | | | 11,597,227 | | | | 261,460,717 | |
Shares Redeemed | | | (10,320,676 | ) | | | (248,749,061 | ) | | | (19,421,429 | ) | | | (451,326,930 | ) |
| | | | | | | | | | | | | | | | |
Net Increase (Decrease) | | | (8,991,731 | ) | | | (216,786,230 | ) | | | (3,668,311 | ) | | | (93,911,824 | ) |
| | | | | | | | | | | | | | | | |
Notes to Financial Statements – (continued)
June 30, 2018 (Unaudited)
| | | | | | | | | | | | | | | | |
| Dividend and Growth HLS Fund – (continued) | | | | | | | | | | | | |
| | | For the Six-Month Period
Ended June 30, 2018 | | | For the Year Ended
December 31, 2017 | |
| | | Shares | | | Amount | | | Shares | | | Amount | |
Class IB | | | | | | | | | | | | | | | | |
Shares Sold | | | 220,213 | | | $ | 5,241,002 | | | | 375,911 | | | $ | 8,685,861 | |
Shares Issued for Reinvested Dividends | | | — | | | | — | | | | 1,593,174 | | | | 35,652,495 | |
Shares Redeemed | | | (1,534,462 | ) | | | (36,676,165 | ) | | | (3,425,042 | ) | | | (79,084,752 | ) |
| | | | | | | | | | | | | | | | |
Net Increase (Decrease) | | | (1,314,249 | ) | | | (31,435,163 | ) | | | (1,455,957 | ) | | | (34,746,396 | ) |
| | | | | | | | | | | | | | | | |
Total Net Increase (Decrease) | | | (10,305,980 | ) | | $ | (248,221,393 | ) | | | (5,124,268 | ) | | $ | (128,658,220 | ) |
| | | | | | | | | | | | | | | | |
|
| Global Growth HLS Fund | |
| | | For the Six-Month Period
Ended June 30, 2018 | | | For the Year Ended
December 31, 2017 | |
| | | Shares | | | Amount | | | Shares | | | Amount | |
Class IA | | | | | | | | | | | | | | | | |
Shares Sold | | | 763,646 | | | $ | 22,538,533 | | | | 1,167,362 | | | $ | 30,260,457 | |
Shares Issued for Reinvested Dividends | | | — | | | | — | | | | 811,179 | | | | 20,798,629 | |
Shares Redeemed | | | (1,256,709 | ) | | | (37,179,659 | ) | | | (2,159,005 | ) | | | (55,663,972 | ) |
| | | | | | | | | | | | | | | | |
Net Increase (Decrease) | | | (493,063 | ) | | | (14,641,126 | ) | | | (180,464 | ) | | | (4,604,886 | ) |
| | | | | | | | | | | | | | | | |
Class IB | | | | | | | | | | | | | | | | |
Shares Sold | | | 133,196 | | | $ | 3,883,937 | | | | 205,454 | | | $ | 5,206,011 | |
Shares Issued for Reinvested Dividends | | | — | | | | — | | | | 156,643 | | | | 3,981,856 | |
Shares Redeemed | | | (257,085 | ) | | | (7,558,331 | ) | | | (611,170 | ) | | | (15,562,567 | ) |
| | | | | | | | | | | | | | | | |
Net Increase (Decrease) | | | (123,889 | ) | | | (3,674,394 | ) | | | (249,073 | ) | | | (6,374,700 | ) |
| | | | | | | | | | | | | | | | |
Total Net Increase (Decrease) | | | (616,952 | ) | | $ | (18,315,520 | ) | | | (429,537 | ) | | $ | (10,979,586 | ) |
| | | | | | | | | | | | | | | | |
|
| Growth Opportunities HLS Fund | |
| | | For the Six-Month Period
Ended June 30, 2018 | | | For the Year Ended
December 31, 2017 | |
| | | Shares | | | Amount | | | Shares | | | Amount | |
Class IA | | | | | | | | | | | | | | | | |
Shares Sold | | | 319,012 | | | $ | 13,143,307 | | | | 1,055,813 | | | $ | 35,715,356 | |
Shares Issued for Reinvested Dividends | | | — | | | | — | | | | 456,670 | | | | 16,106,761 | |
Shares Redeemed | | | (2,340,865 | ) | | | (96,651,671 | ) | | | (5,385,187 | ) | | | (187,447,545 | ) |
| | | | | | | | | | | | | | | | |
Net Increase (Decrease) | | | (2,021,853 | ) | | | (83,508,364 | ) | | | (3,872,704 | ) | | | (135,625,428 | ) |
| | | | | | | | | | | | | | | | |
Class IB | | | | | | | | | | | | | | | | |
Shares Sold | | | 106,662 | | | $ | 4,260,732 | | | | 226,887 | | | $ | 7,648,732 | |
Shares Issued for Reinvested Dividends | | | — | | | | — | | | | 55,466 | | | | 1,881,415 | |
Shares Redeemed | | | (348,901 | ) | | | (13,767,106 | ) | | | (837,366 | ) | | | (27,997,475 | ) |
| | | | | | | | | | | | | | | | |
Net Increase (Decrease) | | | (242,239 | ) | | | (9,506,374 | ) | | | (555,013 | ) | | | (18,467,328 | ) |
| | | | | | | | | | | | | | | | |
Class IC | | | | | | | | | | | | | | | | |
Shares Sold | | | 44,358 | | | $ | 1,803,599 | | | | 104,552 | | | $ | 3,540,640 | |
Shares Issued for Reinvested Dividends | | | — | | | | — | | | | 11,639 | | | | 403,653 | |
Shares Redeemed | | | (50,643 | ) | | | (2,048,527 | ) | | | (81,843 | ) | | | (2,819,857 | ) |
| | | | | | | | | | | | | | | | |
Net Increase (Decrease) | | | (6,285 | ) | | | (244,928 | ) | | | 34,348 | | | | 1,124,436 | |
| | | | | | | | | | | | | | | | |
Total Net Increase (Decrease) | | | (2,270,377 | ) | | $ | (93,259,666 | ) | | | (4,393,369 | ) | | $ | (152,968,320 | ) |
| | | | | | | | | | | | | | | | |
Notes to Financial Statements – (continued)
June 30, 2018 (Unaudited)
| | | | | | | | | | | | | | | | |
| Healthcare HLS Fund | |
| | | For the Six-Month Period
Ended June 30, 2018 | | | For the Year Ended
December 31, 2017 | |
| | | Shares | | | Amount | | | Shares | | | Amount | |
Class IA | | | | | | | | | | | | | | | | |
Shares Sold | | | 561,680 | | | $ | 13,237,928 | | | | 1,841,982 | | | $ | 44,835,798 | |
Shares Issued for Reinvested Dividends | | | — | | | | — | | | | 1,933,544 | | | | 42,557,293 | |
Shares Redeemed | | | (1,465,716 | ) | | | (34,131,774 | ) | | | (2,322,554 | ) | | | (54,827,732 | ) |
| | | | | | | | | | | | | | | | |
Net Increase (Decrease) | | | (904,036 | ) | | | (20,893,846 | ) | | | 1,452,972 | | | | 32,565,359 | |
| | | | | | | | | | | | | | | | |
Class IB | | | | | | | | | | | | | | | | |
Shares Sold | | | 42,980 | | | $ | 958,869 | | | | 129,384 | | | $ | 2,994,650 | |
Shares Issued for Reinvested Dividends | | | — | | | | — | | | | 343,098 | | | | 7,184,474 | |
Shares Redeemed | | | (257,235 | ) | | | (5,744,394 | ) | | | (517,395 | ) | | | (11,565,478 | ) |
| | | | | | | | | | | | | | | | |
Net Increase (Decrease) | | | (214,255 | ) | | | (4,785,525 | ) | | | (44,913 | ) | | | (1,386,354 | ) |
| | | | | | | | | | | | | | | | |
Total Net Increase (Decrease) | | | (1,118,291 | ) | | $ | (25,679,371 | ) | | | 1,408,059 | | | $ | 31,179,005 | |
| | | | | | | | | | | | | | | | |
| | | | |
| High Yield HLS Fund | | | | | | | | | | | | |
| | | For the Six-Month Period
Ended June 30, 2018 | | | For the Year Ended
December 31, 2017 | |
| | | Shares | | | Amount | | | Shares | | | Amount | |
Class IA | | | | | | | | | | | | | | | | |
Shares Sold | | | 638,412 | | | $ | 5,239,687 | | | | 1,551,820 | | | $ | 12,802,783 | |
Shares Issued for Reinvested Dividends | | | — | | | | — | | | | 1,763,487 | | | | 14,107,895 | |
Shares Redeemed | | | (2,826,921 | ) | | | (23,093,971 | ) | | | (5,352,490 | ) | | | (44,291,170 | ) |
| | | | | | | | | | | | | | | | |
Net Increase (Decrease) | | | (2,188,509 | ) | | | (17,854,284 | ) | | | (2,037,183 | ) | | | (17,380,492 | ) |
| | | | | | | | | | | | | | | | |
Class IB | | | | | | | | | | | | | | | | |
Shares Sold | | | 214,332 | | | $ | 1,723,911 | | | | 398,161 | | | $ | 3,249,143 | |
Shares Issued for Reinvested Dividends | | | — | | | | — | | | | 551,458 | | | | 4,345,488 | |
Shares Redeemed | | | (852,945 | ) | | | (6,848,227 | ) | | | (1,811,097 | ) | | | (14,711,242 | ) |
| | | | | | | | | | | | | | | | |
Net Increase (Decrease) | | | (638,613 | ) | | | (5,124,316 | ) | | | (861,478 | ) | | | (7,116,611 | ) |
| | | | | | | | | | | | | | | | |
Total Net Increase (Decrease) | | | (2,827,122 | ) | | $ | (22,978,600 | ) | | | (2,898,661 | ) | | $ | (24,497,103 | ) |
| | | | | | | | | | | | | | | | |
|
| International Opportunities HLS Fund | |
| | | For the Six-Month Period
Ended June 30, 2018 | | | For the Year Ended
December 31, 2017 | |
| | | Shares | | | Amount | | | Shares | | | Amount | |
Class IA | | | | | | | | | | | | | | | | |
Shares Sold | | | 4,715,929 | | | $ | 83,167,911 | | | | 14,013,729 | | | $ | 228,923,920 | |
Shares Issued for Reinvested Dividends | | | — | | | | — | | | | 1,165,749 | | | | 19,083,304 | |
Shares Redeemed | | | (8,360,119 | ) | | | (147,509,618 | ) | | | (10,831,010 | ) | | | (174,609,123 | ) |
| | | | | | | | | | | | | | | | |
Net Increase (Decrease) | | | (3,644,190 | ) | | | (64,341,707 | ) | | | 4,348,468 | | | | 73,398,101 | |
| | | | | | | | | | | | | | | | |
Class IB | | | | | | | | | | | | | | | | |
Shares Sold | | | 275,535 | | | $ | 4,905,184 | | | | 595,017 | | | $ | 9,615,544 | |
Shares Issued for Reinvested Dividends | | | — | | | | — | | | | 109,962 | | | | 1,824,269 | |
Shares Redeemed | | | (774,292 | ) | | | (13,901,190 | ) | | | (1,810,973 | ) | | | (29,172,721 | ) |
| | | | | | | | | | | | | | | | |
Net Increase (Decrease) | | | (498,757 | ) | | | (8,996,006 | ) | | | (1,105,994 | ) | | | (17,732,908 | ) |
| | | | | | | | | | | | | | | | |
Total Net Increase (Decrease) | | | (4,142,947 | ) | | $ | (73,337,713 | ) | | | 3,242,474 | | | $ | 55,665,193 | |
| | | | | | | | | | | | | | | | |
Notes to Financial Statements – (continued)
June 30, 2018 (Unaudited)
| | | | | | | | | | | | | | | | |
| MidCap HLS Fund | |
| | | For the Six-Month Period
Ended June 30, 2018 | | | For the Year Ended
December 31, 2017 | |
| | | Shares | | | Amount | | | Shares | | | Amount | |
Class IA | | | | | | | | | | | | | | | | |
Shares Sold | | | 3,950,121 | | | $ | 165,126,777 | | | | 9,676,572 | | | $ | 363,623,668 | |
Shares Issued for Reinvested Dividends | | | — | | | | — | | | | 2,534,154 | | | | 94,658,888 | |
Shares Redeemed | | | (5,754,378 | ) | | | (241,944,351 | ) | | | (9,315,330 | ) | | | (349,644,474 | ) |
| | | | | | | | | | | | | | | | |
Net Increase (Decrease) | | | (1,804,257 | ) | | | (76,817,574 | ) | | | 2,895,396 | | | | 108,638,082 | |
| | | | | | | | | | | | | | | | |
Class IB | | | | | | | | | | | | | | | | |
Shares Sold | | | 37,829 | | | $ | 1,559,928 | | | | 203,031 | | | $ | 7,530,954 | |
Shares Issued for Reinvested Dividends | | | — | | | | — | | | | 139,137 | | | | 5,084,893 | |
Shares Redeemed | | | (155,671 | ) | | | (6,344,958 | ) | | | (1,660,894 | ) | | | (64,348,851 | ) |
| | | | | | | | | | | | | | | | |
Net Increase (Decrease) | | | (117,842 | ) | | | (4,785,030 | ) | | | (1,318,726 | ) | | | (51,733,004 | ) |
| | | | | | | | | | | | | | | | |
Total Net Increase (Decrease) | | | (1,922,099 | ) | | $ | (81,602,604 | ) | | | 1,576,670 | | | $ | 56,905,078 | |
| | | | | | | | | | | | | | | | |
|
| MidCap Value HLS Fund | |
| | | For the Six-Month Period
Ended June 30, 2018 | | | For the Year Ended
December 31, 2017 | |
| | | Shares | | | Amount | | | Shares | | | Amount | |
Class IA | | | | | | | | | | | | | | | | |
Shares Sold | | | 67,125 | | | $ | 847,408 | | | | 474,578 | | | $ | 5,861,095 | |
Shares Issued for Reinvested Dividends | | | — | | | | — | | | | 1,786,186 | | | | 20,308,940 | |
Shares Redeemed | | | (1,617,049 | ) | | | (20,476,312 | ) | | | (3,597,010 | ) | | | (44,123,512 | ) |
| | | | | | | | | | | | | | | | |
Net Increase (Decrease) | | | (1,549,924 | ) | | | (19,628,904 | ) | | | (1,336,246 | ) | | | (17,953,477 | ) |
| | | | | | | | | | | | | | | | |
Class IB | | | | | | | | | | | | | | | | |
Shares Sold | | | 22,882 | | | $ | 287,764 | | | | 91,141 | | | $ | 1,113,838 | |
Shares Issued for Reinvested Dividends | | | — | | | | — | | | | 534,256 | | | | 6,031,748 | |
Shares Redeemed | | | (499,876 | ) | | | (6,253,039 | ) | | | (1,189,202 | ) | | | (14,470,579 | ) |
| | | | | | | | | | | | | | | | |
Net Increase (Decrease) | | | (476,994 | ) | | | (5,965,275 | ) | | | (563,805 | ) | | | (7,324,993 | ) |
| | | | | | | | | | | | | | | | |
Total Net Increase (Decrease) | | | (2,026,918 | ) | | $ | (25,594,179 | ) | | | (1,900,051 | ) | | $ | (25,278,470 | ) |
| | | | | | | | | | | | | | | | |
| | | | |
| Small Cap Growth HLS Fund | | | | | | | | | | | | |
| | | For the Six-Month Period
Ended June 30, 2018 | | | For the Year Ended
December 31, 2017 | |
| | | Shares | | | Amount | | | Shares | | | Amount | |
Class IA | | | | | | | | | | | | | | | | |
Shares Sold | | | 2,045,522 | | | $ | 68,500,481 | | | | 5,723,808 | | | $ | 165,058,843 | |
Shares Issued for Reinvested Dividends | | | — | | | | — | | | | 13,629 | | | | 391,968 | |
Shares Redeemed | | | (2,852,673 | ) | | | (95,567,053 | ) | | | (12,168,321 | ) | | | (365,607,978 | ) |
| | | | | | | | | | | | | | | | |
Net Increase (Decrease) | | | (807,151 | ) | | | (27,066,572 | ) | | | (6,430,884 | ) | | | (200,157,167 | ) |
| | | | | | | | | | | | | | | | |
Class IB | | | | | | | | | | | | | | | | |
Shares Sold | | | 753,426 | | | $ | 24,743,547 | | | | 5,928,739 | | | $ | 176,762,856 | |
Shares Redeemed | | | (1,747,655 | ) | | | (57,664,923 | ) | | | (2,636,397 | ) | | | (76,228,471 | ) |
| | | | | | | | | | | | | | | | |
Net Increase (Decrease) | | | (994,229 | ) | | | (32,921,376 | ) | | | 3,292,342 | | | | 100,534,385 | |
| | | | | | | | | | | | | | | | |
Total Net Increase (Decrease) | | | (1,801,380 | ) | | $ | (59,987,948 | ) | | | (3,138,542 | ) | | $ | (99,622,782 | ) |
| | | | | | | | | | | | | | | | |
Notes to Financial Statements – (continued)
June 30, 2018 (Unaudited)
| | | | | | | | | | | | | | | | |
| Small Company HLS Fund | | | | | | | | | | | | |
| | | For the Six-Month Period
Ended June 30, 2018 | | | For the Year Ended
December 31, 2017 | |
| | | Shares | | | Amount | | | Shares | | | Amount | |
Class IA | | | | | | | | | | | | | | | | |
Shares Sold | | | 1,051,436 | | | $ | 23,311,529 | | | | 1,793,489 | | | $ | 32,075,623 | |
Shares Redeemed | | | (2,682,674 | ) | | | (58,567,737 | ) | | | (26,402,292 | ) | | | (469,703,430 | ) |
| | | | | | | | | | | | | | | | |
Net Increase (Decrease) | | | (1,631,238 | ) | | | (35,256,208 | ) | | | (24,608,803 | ) | | | (437,627,807 | ) |
| | | | | | | | | | | | | | | | |
Class IB | | | | | | | | | | | | | | | | |
Shares Sold | | | 150,410 | | | $ | 3,055,944 | | | | 223,321 | | | $ | 3,768,830 | |
Shares Redeemed | | | (397,510 | ) | | | (7,939,465 | ) | | | (2,064,656 | ) | | | (34,359,403 | ) |
| | | | | | | | | | | | | | | | |
Net Increase (Decrease) | | | (247,100 | ) | | | (4,883,521 | ) | | | (1,841,335 | ) | | | (30,590,573 | ) |
| | | | | | | | | | | | | | | | |
Total Net Increase (Decrease) | | | (1,878,338 | ) | | $ | (40,139,729 | ) | | | (26,450,138 | ) | | $ | (468,218,380 | ) |
| | | | | | | | | | | | | | | | |
|
| Small/Mid Cap Equity HLS Fund | |
| | | For the Six-Month Period
Ended June 30, 2018 | | | For the Year Ended
December 31, 2017 | |
| | | Shares | | | Amount | | | Shares | | | Amount | |
Class IA | | | | | | | | | | | | | | | | |
Shares Sold | | | 251,473 | | | $ | 2,255,505 | | | | 546,142 | | | $ | 4,524,831 | |
Shares Issued for Reinvested Dividends | | | — | | | | — | | | | 415,135 | | | | 3,287,870 | |
Shares Redeemed | | | (998,283 | ) | | | (8,860,876 | ) | | | (2,330,941 | ) | | | (19,299,802 | ) |
| | | | | | | | | | | | | | | | |
Net Increase (Decrease) | | | (746,810 | ) | | | (6,605,371 | ) | | | (1,369,664 | ) | | | (11,487,101 | ) |
| | | | | | | | | | | | | | | | |
Class IB | | | | | | | | | | | | | | | | |
Shares Sold | | | 51,294 | | | $ | 455,552 | | | | 206,491 | | | $ | 1,703,656 | |
Shares Issued for Reinvested Dividends | | | — | | | | — | | | | 69,948 | | | | 550,492 | |
Shares Redeemed | | | (199,446 | ) | | | (1,762,772 | ) | | | (724,359 | ) | | | (5,954,090 | ) |
| | | | | | | | | | | | | | | | |
Net Increase (Decrease) | | | (148,152 | ) | | | (1,307,220 | ) | | | (447,920 | ) | | | (3,699,942 | ) |
| | | | | | | | | | | | | | | | |
Total Net Increase (Decrease) | | | (894,962 | ) | | $ | (7,912,591 | ) | | | (1,817,584 | ) | | $ | (15,187,043 | ) |
| | | | | | | | | | | | | | | | |
|
| Stock HLS Fund | |
| | | For the Six-Month Period
Ended June 30, 2018 | | | For the Year Ended
December 31, 2017 | |
| | | Shares | | | Amount | | | Shares | | | Amount | |
Class IA | | | | | | | | | | | | | | | | |
Shares Sold | | | 47,769 | | | $ | 3,863,891 | | | | 82,347 | | | $ | 6,102,812 | |
Shares Issued for Reinvested Dividends | | | — | | | | — | | | | 299,255 | | | | 23,707,000 | |
Shares Redeemed | | | (1,156,629 | ) | | | (93,141,506 | ) | | | (2,491,889 | ) | | | (184,342,341 | ) |
| | | | | | | | | | | | | | | | |
Net Increase (Decrease) | | | (1,108,860 | ) | | | (89,277,615 | ) | | | (2,110,287 | ) | | | (154,532,529 | ) |
| | | | | | | | | | | | | | | | |
Class IB | | | | | | | | | | | | | | | | |
Shares Sold | | | 7,956 | | | $ | 656,654 | | | | 24,541 | | | $ | 1,800,010 | |
Shares Issued for Reinvested Dividends | | | — | | | | — | | | | 26,673 | | | | 2,111,519 | |
Shares Redeemed | | | (172,492 | ) | | | (13,883,236 | ) | | | (326,619 | ) | | | (24,082,015 | ) |
| | | | | | | | | | | | | | | | |
Net Increase (Decrease) | | | (164,536 | ) | | | (13,226,582 | ) | | | (275,405 | ) | | | (20,170,486 | ) |
| | | | | | | | | | | | | | | | |
Total Net Increase (Decrease) | | | (1,273,396 | ) | | $ | (102,504,197 | ) | | | (2,385,692 | ) | | $ | (174,703,015 | ) |
| | | | | | | | | | | | | | | | |
Notes to Financial Statements – (continued)
June 30, 2018 (Unaudited)
| | | | | | | | | | | | | | | | |
| Total Return Bond HLS Fund | |
| | | For the Six-Month Period
Ended June 30, 2018 | | | For the Year Ended
December 31, 2017 | |
| | | Shares | | | Amount | | | Shares | | | Amount | |
Class IA | | | | | | | | | | | | | | | | |
Shares Sold | | | 4,178,162 | | | $ | 46,776,581 | | | | 10,804,579 | | | $ | 121,912,379 | |
Shares Issued for Reinvested Dividends | | | — | | | | — | | | | 5,703,212 | | | | 64,104,099 | |
Shares Redeemed | | | (15,470,047 | ) | | | (172,304,979 | ) | | | (28,263,945 | ) | | | (319,063,315 | ) |
| | | | | | | | | | | | | | | | |
Net Increase (Decrease) | | | (11,291,885 | ) | | | (125,528,398 | ) | | | (11,756,154 | ) | | | (133,046,837 | ) |
| | | | | | | | | | | | | | | | |
Class IB | | | | | | | | | | | | | | | | |
Shares Sold | | | 403,940 | | | $ | 4,490,077 | | | | 1,007,204 | | | $ | 11,336,689 | |
Shares Issued for Reinvested Dividends | | | — | | | | — | | | | 611,268 | | | | 6,840,084 | |
Shares Redeemed | | | (1,732,917 | ) | | | (19,189,678 | ) | | | (3,290,538 | ) | | | (36,973,156 | ) |
| | | | | | | | | | | | | | | | |
Net Increase (Decrease) | | | (1,328,977 | ) | | | (14,699,601 | ) | | | (1,672,066 | ) | | | (18,796,383 | ) |
| | | | | | | | | | | | | | | | |
Total Net Increase (Decrease) | | | (12,620,862 | ) | | | $ (140,227,999 | ) | | | (13,428,220 | ) | | | $ (151,843,220 | ) |
| | | | | | | | | | | | | | | | |
|
| Ultrashort Bond HLS Fund | |
| | | For the Six-Month Period
Ended June 30, 2018 | | | For the Year Ended
December 31, 2017 | |
| | | Shares | | | Amount | | | Shares | | | Amount | |
Class IA | | | | | | | | | | | | | | | | |
Shares Sold | | | 2,374,711 | | | $ | 23,943,569 | | | | 3,269,464 | | | $ | 32,898,341 | |
Shares Issued for Reinvested Dividends | | | — | | | | — | | | | 385,163 | | | | 3,863,181 | |
Shares Redeemed | | | (4,626,704 | ) | | | (46,628,728 | ) | | | (10,954,529 | ) | | | (110,225,740 | ) |
| | | | | | | | | | | | | | | | |
Net Increase (Decrease) | | | (2,251,993 | ) | | | (22,685,159 | ) | | | (7,299,902 | ) | | | (73,464,218 | ) |
| | | | | | | | | | | | | | | | |
Class IB | | | | | | | | | | | | | | | | |
Shares Sold | | | 559,439 | | | $ | 5,628,909 | | | | 766,654 | | | $ | 7,701,575 | |
Shares Issued for Reinvested Dividends | | | — | | | | — | | | | 35,217 | | | | 353,222 | |
Shares Redeemed | | | (868,400 | ) | | | (8,738,188 | ) | | | (2,138,208 | ) | | | (21,476,321 | ) |
| | | | | | | | | | | | | | | | |
Net Increase (Decrease) | | | (308,961 | ) | | | (3,109,279 | ) | | | (1,336,337 | ) | | | (13,421,524 | ) |
| | | | | | | | | | | | | | | | |
Total Net Increase (Decrease) | | | (2,560,954 | ) | | $ | (25,794,438 | ) | | | (8,636,239 | ) | | $ | (86,885,742 | ) |
| | | | | | | | | | | | | | | | |
|
| U.S. Government Securities HLS Fund | |
| | | For the Six-Month Period
Ended June 30, 2018 | | | For the Year Ended
December 31, 2017 | |
| | | Shares | | | Amount | | | Shares | | | Amount | |
Class IA | | | | | | | | | | | | | | | | |
Shares Sold | | | 791,123 | | | $ | 8,042,839 | | | | 2,103,061 | | | $ | 21,772,509 | |
Shares Issued for Reinvested Dividends | | | — | | | | — | | | | 729,790 | | | | 7,516,833 | |
Shares Redeemed | | | (3,140,136 | ) | | | (31,794,041 | ) | | | (6,323,266 | ) | | | (65,421,205 | ) |
| | | | | | | | | | | | | | | | |
Net Increase (Decrease) | | | (2,349,013 | ) | | | (23,751,202 | ) | | | (3,490,415 | ) | | | (36,131,863 | ) |
| | | | | | | | | | | | | | | | |
Class IB | | | | | | | | | | | | | | | | |
Shares Sold | | | 193,347 | | | $ | 1,957,256 | | | | 351,226 | | | $ | 3,626,856 | |
Shares Issued for Reinvested Dividends | | | — | | | | — | | | | 135,593 | | | | 1,395,250 | |
Shares Redeemed | | | (690,265 | ) | | | (6,971,384 | ) | | | (1,335,009 | ) | | | (13,785,552 | ) |
| | | | | | | | | | | | | | | | |
Net Increase (Decrease) | | | (496,918 | ) | | | (5,014,128 | ) | | | (848,190 | ) | | | (8,763,446 | ) |
| | | | | | | | | | | | | | | | |
Total Net Increase (Decrease) | | | (2,845,931 | ) | | $ | (28,765,330 | ) | | | (4,338,605 | ) | | $ | (44,895,309 | ) |
| | | | | | | | | | | | | | | | |
Notes to Financial Statements – (continued)
June 30, 2018 (Unaudited)
| | | | | | | | | | | | | | | | |
| Value HLS Fund | |
| | | For the Six-Month Period
Ended June 30, 2018 | | | For the Year Ended
December 31, 2017 | |
| | | Shares | | | Amount | | | Shares | | | Amount | |
Class IA | | | | | | | | | | | | | | | | |
Shares Sold | | | 359,580 | | | $ | 5,753,564 | | | | 695,794 | | | $ | 10,990,889 | |
Shares Issued for Reinvested Dividends | | | — | | | | — | | | | 2,611,798 | | | | 39,184,876 | |
Shares Redeemed | | | (2,306,822 | ) | | | (37,130,513 | ) | | | (4,444,508 | ) | | | (70,230,330 | ) |
| | | | | | | | | | | | | | | | |
Net Increase (Decrease) | | | (1,947,242 | ) | | | (31,376,949 | ) | | | (1,136,916 | ) | | | (20,054,565 | ) |
| | | | | | | | | | | | | | | | |
Class IB | | | | | | | | | | | | | | | | |
Shares Sold | | | 39,718 | | | $ | 638,372 | | | | 75,796 | | | $ | 1,195,727 | |
Shares Issued for Reinvested Dividends | | | — | | | | — | | | | 435,092 | | | | 6,498,111 | |
Shares Redeemed | | | (383,648 | ) | | | (6,141,237 | ) | | | (886,742 | ) | | | (13,949,988 | ) |
| | | | | | | | | | | | | | | | |
Net Increase (Decrease) | | | (343,930 | ) | | | (5,502,865 | ) | | | (375,854 | ) | | | (6,256,150 | ) |
| | | | | | | | | | | | | | | | |
Total Net Increase (Decrease) | | | (2,291,172 | ) | | $ | (36,879,814 | ) | | | (1,512,770 | ) | | $ | (26,310,715 | ) |
| | | | | | | | | | | | | | | | |
Each Fund participates in a committed line of credit pursuant to a credit agreement. Each Fund may borrow under the line of credit for temporary or emergency purposes. The Funds (together with certain other Hartford Funds) may borrow up to $400 million in the aggregate, subject to asset coverage and other limitations specified in the credit agreement. The interest rate on borrowings varies depending on the nature of the loan. The facility also charges a commitment fee, which is allocated to each of the funds participating in the line of credit based on average net assets of the funds. During the six-month period ended June 30, 2018, none of the Funds had borrowings under this facility.
| 12. | Pending Legal Proceedings: |
On February 25, 2011, Jennifer L. Kasilag, Louis Mellinger, Judith M. Menendez, Jacqueline M. Robinson, and Linda A. Russell filed a derivative lawsuit against Hartford Investment Financial Services, LLC (“HIFSCO”) (now known as Hartford Funds Distributors, LLC) on behalf of six Hartford retail mutual funds in the United States District Court for the District of New Jersey, alleging that HIFSCO received excessive advisory and distribution fees in violation of its statutory fiduciary duty under Section 36(b) of the 1940 Act when serving as investment manager and principal underwriter, respectively, to the Hartford retail mutual funds. Although this action was purportedly filed on behalf of certain of the Hartford Funds, none of the Hartford Funds is itself a defendant to the suit. HIFSCO moved to dismiss and, in September 2011, the motion was granted in part and denied in part, with leave to amend the complaint. In November 2011, plaintiffs filed an amended complaint on behalf of certain Hartford retail mutual funds, The Hartford Global Health Fund (now known as The Hartford Healthcare Fund), The Hartford Conservative Allocation Fund, The Hartford Growth Opportunities Fund, The Hartford Inflation Plus Fund, The Hartford Advisers Fund (now known as The Hartford Balanced Fund), and The Hartford Capital Appreciation Fund. Plaintiffs seek to rescind the investment management agreements and distribution plans between HIFSCO and these funds and to recover the total fees charged thereunder or, in the alternative, to recover any improper compensation HIFSCO received, in addition to lost earnings.
HIFSCO filed a partial motion to dismiss the amended complaint and, in December 2012, the court dismissed without prejudice the claims regarding distribution fees and denied the motion with respect to the advisory fees claims. In March 2014, the plaintiffs filed a new complaint that, among other things, added as new plaintiffs The Hartford Floating Rate Fund and The Hartford Small Company Fund and named as a defendant Hartford Funds Management Company, LLC (“HFMC”), which assumed the role as investment manager to the funds as of January 2013. In June 2015, HFMC and HIFSCO moved for summary judgment, and plaintiffs cross-moved for partial summary judgment with respect to The Hartford Capital Appreciation Fund. In March 2016, the court, in large part, denied summary judgment for all parties. The court granted judgment for HFMC and HIFSCO with respect to all claims made by The Hartford Small Company Fund and certain claims made by The Hartford Floating Rate Fund. The court further ruled that the appropriate measure of damages on the surviving claims is the difference, if any, between the actual advisory fees paid through trial and those that could have been paid under the applicable legal standard. A bench trial on the issue of liability was held in November 2016. On February 28, 2017, the court granted judgment for HIFSCO and HFMC as to all claims. On March 23, 2017, plaintiffs appealed to the United States Court of Appeals for the Third Circuit.
Notes to Financial Statements – (continued)
June 30, 2018 (Unaudited)
No accrual for litigation relating to this matter has been recorded in the financial statements of the Funds because the Funds are not party to the suit.
On October 21, 2013 for the Ultrashort Bond HLS Fund, a reverse stock split was declared for the Class IA and Class IB shares at a ten to one ratio. The effect of the reverse stock split was to divide the number of outstanding shares by the reverse split factor, with a corresponding increase in the net asset value per share. The split was executed at the closing rounded NAV as of the prior business day. This transaction did not change the net assets of the Fund and the total value of a shareholder’s investment in the Fund did not change as a result of the reverse stock split. Data presented in the Financial Highlights has been adjusted retroactively to account for the reverse stock split.
Under each Company’s organizational documents, the Company shall indemnify its officers and directors to the full extent required or permitted under Maryland General Corporation Law and federal securities laws. In addition, each Company, on behalf of its respective Funds, may enter into contracts that contain a variety of indemnifications. Each Company’s maximum exposure under these arrangements is unknown. However, as of the date of these financial statements, each Company has not had prior claims or losses pursuant to these contracts and expects the risk of loss to be remote.
In connection with the preparation of the financial statements of the Funds as of and for the six-month period ended June 30, 2018, events and transactions subsequent to June 30, 2018, through the date the financial statements were issued have been evaluated by the Funds’ management for possible adjustment and/or disclosure. The following subsequent events requiring financial statement adjustment or disclosure have been identified.
Karen H. Grimes, CFA announced her plan to retire and withdraw from the partnership of Wellington Management Group LLP, the ultimate holding company of Wellington Management Company LLP, as of December 31, 2018. Accordingly, she will no longer serve as a portfolio manager to the Balanced HLS Fund or the Value HLS Fund as of December 31, 2018. It is anticipated that Ms. Grimes’ portfolio manager responsibilities will transition to each Fund’s other portfolio managers by December 31, 2018.
Effective November 1, 2018, the name, principal investment strategy, portfolio manager and benchmark of the Hartford Small/Mid Cap Equity HLS Fund will change. As part of these changes, (i) the Fund will change its name to the Hartford MidCap Growth HLS Fund; (ii) the Fund’s non-fundamental policy to invest under normal circumstances at least 80% of its assets in common stocks of small-capitalization and mid-capitalization companies will change to remove the reference to small-capitalization companies; (iii) Tim Manning will replace David J. Elliott, CFA as the Fund’s sole portfolio manager; and (iv) the Fund’s benchmark will change to the Russell Midcap Growth Index from the Russell 2500 Index.
Kent M. Stahl, CFA announced his plan to retire and withdraw from the partnership of Wellington Management Group LLP, the ultimate holding company of Wellington Management Company LLP, as of December 31, 2018. Accordingly, he will no longer serve as a portfolio manager to the Capital Appreciation HLS Fund as of December 31, 2018. Gregg R. Thomas, CFA will remain a portfolio manager on the Capital Appreciation HLS Fund. Mr. Thomas will continue to select and oversee the Capital Appreciation HLS Fund’s portfolio management team and determine how the Capital Appreciation HLS Fund assets are allocated among the team’s members.
HFMC agreed to extend the current contractual management fee waiver of 0.03% for the Balanced HLS Fund. In addition, effective January 1, 2019, HFMC agreed to waive 0.04% of the MidCap Value HLS Fund’s contractual management fee. Each of these contractual management fee waivers will remain in effect until April 30, 2020 unless the Board of Directors of Hartford Series Fund, Inc. approves its earlier termination.
HOW TO OBTAIN A COPY OF EACH FUND’S PROXY VOTING POLICIES AND VOTING RECORDS (UNAUDITED)
A description of the policies and procedures that each Fund uses to determine how to vote proxies relating to portfolio securities and information about how each Fund voted proxies relating to portfolio securities during the most recent twelve-month period ended June 30, are available (1) without charge, upon request, by calling 888-843-7824 and (2) on the SEC’s website at http://www.sec.gov.
QUARTERLY PORTFOLIO HOLDINGS INFORMATION (UNAUDITED)
Each Fund files a complete schedule of portfolio holdings with the SEC for the first and third quarters of each fiscal year on Form N-Q. Each Fund’s Forms N-Q are available (1) without charge, upon request, by calling 888-843-7824 and (2) on the SEC’s website at http://www.sec.gov. The Form N-Q may be reviewed and copied at the SEC’s Public Reference Room in Washington, DC. Information on the operation of the Public Reference Room may be obtained by calling 1-800-SEC-0330.
THIS PRIVACY POLICY IS NOT PART OF THIS REPORT
CUSTOMER PRIVACY NOTICE
The Hartford Financial Services Group, Inc. and Affiliates*
(herein called “we, our, and us”)
This Privacy Policy applies to our United States Operations
We value your trust. We are committed to the responsible:
a) management;
b) use; and
c) protection;
of Personal Information.
This notice describes how we collect, disclose, and protect Personal Information.
We collect Personal Information to:
a) service your Transactions with us; and
b) support our business functions.
We may obtain Personal Information from:
a) You;
b) your Transactions with us; and
c) third parties such as a consumer-reporting agency.
Based on the type of product or service You apply for or get from us, Personal Information such as:
a) your name;
b) your address;
c) your income;
d) your payment; or
e) your credit history;
may be gathered from sources such as applications, Transactions, and consumer reports.
To serve You and service our business, we may share certain Personal Information. We will share Personal Information, only as allowed by law, with affiliates such as:
a) our insurance companies;
b) our employee agents;
c) our brokerage firms; and
d) our administrators.
As allowed by law, we may share Personal Financial Information with our affiliates to:
a) market our products; or
b) market our services;
to You without providing You with an option to prevent these disclosures.
We may also share Personal Information, only as allowed by law, with unaffiliated third parties including:
a) independent agents;
b) brokerage firms;
c) insurance companies;
d) administrators; and
e) service providers;
who help us serve You and service our business.
When allowed by law, we may share certain Personal Financial Information with other unaffiliated third parties who assist us by performing services or functions such as:
a) taking surveys;
b) marketing our products or services; or
c) offering financial products or services under a joint agreement between us and one or more financial institutions.
We, and third parties we partner with, may track some of the pages You visit through the use of:
a) cookies;
b) pixel tagging; or
c) other technologies;
and currently do not process or comply with any web browser’s “do not track” signal or other similar mechanism that indicates a request to disable online tracking of individual users who visit our websites or use our services.
For more information, our Online Privacy Policy, which governs information we collect on our website and our affiliate websites, is available at https://www.thehartford.com/online-privacy-policy.
We will not sell or share your Personal Financial Information with anyone for purposes unrelated to our business functions without offering You the opportunity to:
a) “opt-out;” or
b) “opt-in;”
as required by law.
We only disclose Personal Health Information with:
a) your authorization; or
b) as otherwise allowed or required by law.
Our employees have access to Personal Information in the course of doing their jobs, such as:
a) underwriting policies;
b) paying claims;
c) developing new products; or
d) advising customers of our products and services.
We use manual and electronic security procedures to maintain:
a) the confidentiality; and
b) the integrity of;
Personal Information that we have. We use these procedures to guard against unauthorized access.
Some techniques we use to protect Personal Information include:
a) secured files;
b) user authentication;
c) encryption;
d) firewall technology; and
e) the use of detection software.
We are responsible for and must:
a) identify information to be protected;
b) provide an adequate level of protection for that data;
c) grant access to protected data only to those people who must use it in the performance of their job-related duties.
Employees who violate our privacy policies and procedures may be subject to discipline, which may include termination of their employment with us.
We will continue to follow our Privacy Policy regarding Personal Information even when a business relationship no longer exists between us.
As used in this Privacy Notice:
Application means your request for our product or service.
Personal Financial Information means financial information such as:
a) credit history;
b) income;
c) financial benefits; or
d) policy or claim information.
Personal Financial Information may include Social Security Numbers, Driver’s license numbers, or other government-issued identification numbers, or credit, debit card, or bank account numbers.
Personal Health Information means health information such as:
a) your medical records; or
b) information about your illness, disability or injury.
Personal Information means information that identifies You personally and is not otherwise available to the public. It includes: a) Personal Financial Information; and
b) Personal Health Information.
Transaction means your business dealings with us, such as:
a) your Application;
b) your request for us to pay a claim; and
c) your request for us to take an action on your account.
You means an individual who has given us Personal Information in conjunction with:
a) asking about;
b) applying for; or
c) obtaining;
a financial product or service from us if the product or service is used mainly for personal, family, or household purposes.
If you have any questions or comments about this privacy notice, please feel free to contact us at The Hartford – Law Department, Privacy Law, One Hartford Plaza, Hartford, CT 06155, or at CorporatePrivacyOffice@thehartford.com.
This Customer Privacy Notice is being provided on behalf of The Hartford Financial Services Group, Inc. and its affiliates (including the following as of March 2018), to the extent required by the Gramm-Leach-Bliley Act and implementing regulations.
1stAGChoice, Inc.; Access CoverageCorp, Inc.; Access CoverageCorp Technologies, Inc.; American Maturity Life Insurance Company; Business Management Group, Inc.; Cervus Claim Solutions, LLC; First State Insurance Company; Fountain Investors I LLC; Fountain Investors II LLC; Fountain Investors III LLC; Fountain Investors IV LLC; FP R, LLC; FTC Resolution Company LLC; Hart Re Group L.L.C.; Hartford Accident and Indemnity Company; Hartford Administrative Services Company; Hartford Casualty General Agency, Inc.; Hartford Casualty Insurance Company; Hartford Financial Services, LLC; Hartford Fire General Agency, Inc.; Hartford Fire Insurance Company; Hartford Funds Distributors, LLC; Hartford Funds Management Company, LLC; Hartford Funds Management Group, Inc.; Hartford Group Benefits Holding Company; Hartford Holdings, Inc.; Hartford Insurance Company of Illinois; Hartford Insurance Company of the Midwest; Hartford Insurance Company of the Southeast; Hartford Insurance, Ltd.; Hartford Integrated Technologies, Inc.; Hartford International Life Reassurance Corporation; Hartford Investment Management Company; Hartford Life and Accident Insurance Company; Hartford Life and Annuity Insurance Company; Hartford Life Insurance Company; Hartford Life, Inc.; Hartford Life International Holding Company; Hartford Life, Ltd.; Hartford Lloyd’s Corporation; Hartford Lloyd’s Insurance Company; Hartford Management, Ltd.; Hartford of Texas General Agency, Inc.; Hartford Residual Market, L.C.C.; Hartford Securities Distribution Company, Inc.; Hartford Specialty Insurance Services of Texas, LLC; Hartford Strategic Investments, LLC; Hartford Underwriters General Agency, Inc.; Hartford Underwriters Insurance Company; Hartford-Comprehensive Employee Benefit Service Company; Heritage Holdings, Inc.; Heritage Reinsurance Company, Ltd.; HIMCO Distribution Services Company; HLA LLC; HL Investment Advisors, LLC; Horizon Management Group, LLC; HRA Brokerage Services, Inc.; Lanidex R, LLC; Lattice Strategies LLC; Maxum Casualty Insurance Company; Maxum Indemnity Company; Maxum Specialty Services Corporation; MPC Resolution Company LLC; New England Insurance Company; New England Reinsurance Corporation; New Ocean Insurance Co., Ltd.; Northern Homelands Company; Nutmeg Insurance Agency, Inc.; Nutmeg Insurance Company; Pacific Insurance Company, Limited; Property and Casualty Insurance Company of Hartford; Sentinel Insurance Company, Ltd.; The Hartford International Asset Management Company Limited; Trumbull Flood Management, L.L.C.; Trumbull Insurance Company; Twin City Fire Insurance Company.
Revised March 2018
Series of Hartford Series Fund, Inc. and Hartford HLS Series Fund II, Inc. (each a “Fund” and collectively, the “Funds”) are not subsidiaries of The Hartford Financial Services Group, Inc. (“The Hartford”) but are underwritten, distributed by and advised by subsidiaries of The Hartford. Investments in the Funds are not guaranteed by The Hartford or any other entity.
This report is submitted for the general information of the shareholders of the Funds referenced in this report. It is not authorized for distribution to persons who are not shareholders of one or more Funds referenced in this report unless preceded or accompanied by a current prospectus for the relevant Fund. Nothing herein contained is to be considered
an offer of sale or a solicitation of an offer to buy shares of any Fund listed in this report. Such offering is only made by prospectus, which includes details as to the offering price and other material information.
Investors should carefully consider the investment objectives, risks, charges and expenses of a Fund. This and other important information is contained in a Fund’s prospectus and summary prospectus, which can be obtained by visiting hartfordfunds.com. Please read it carefully before investing.
The Funds are distributed by Hartford Funds Distributors, LLC (HFD), Member FINRA. Hartford Funds Management Company, LLC (HFMC) is the Funds’ investment manager. The Funds are sub-advised by Wellington Management Company LLP. HFD and HFMC are not affiliated with Wellington Management Company LLP.
HLSSAR18 8-18 207433 Printed in U.S.A.

Item 2. Code of Ethics.
Not applicable to this semi-annual filing.
Item 3. Audit Committee Financial Expert.
Not applicable to this semi-annual filing.
Item 4. Principal Accountant Fees and Services.
Not applicable to this semi-annual filing.
Item 5. Audit Committee of Listed Registrants.
Not applicable.
Item 6. Investments.
| | (a) | The Schedule of Investments in securities of unaffiliated issuers as of the close of the reporting period is included as part of the semi-annual report filed under Item 1 of this form. |
Item 7. Disclosure of Proxy Voting Policies and Procedures for Closed-End Management Investment Companies.
Not applicable.
Item 8. Portfolio Managers of Closed-End Management Investment Companies.
Not applicable.
Item 9. Purchases of Equity Securities by Closed-End Management Investment Company and Affiliated Purchasers.
Not applicable.
Item 10. Submission of Matters to a Vote of Security Holders.
There have been no material changes to the procedures by which shareholders may recommend nominees to the registrant’s board of directors since the registrant last provided disclosure in response to this requirement.
Item 11. Controls and Procedures.
| | (a) | The registrant’s principal executive and principal financial officers, or persons performing similar functions, have concluded that the registrant’s disclosure controls and procedures (as defined in Rule 30a-3(c) under the Investment Company Act of 1940, as |
| | amended (the “1940 Act”) (17 CFR 270.30a-3(c))) are generally effective to provide reasonable assurance, as of a date within 90 days of the filing date of the report that includes the disclosure required by this paragraph, based on their evaluation of these controls and procedures required by Rule 30a-3(b) under the 1940 Act (17 CFR 270.30a-3(b)) and Rules 13a-15(b) or 15d-15(b) under the Securities Exchange Act of 1934, as amended (17 CFR 240.13a-15(b) or 240.15d-15(b)). |
| | (b) | There were no changes in the registrant’s internal control over financial reporting (as defined in Rule 30a-3(d) under the 1940 Act (17 CFR 270.30a-3(d)) that occurred during the registrant’s second fiscal quarter of the period covered by this report that have materially affected, or is reasonably likely to materially affect, the registrant’s internal control over financial reporting. |
Item 12. Disclosure of Securities Lending Activities for Closed-End Management Investment Companies.
Not applicable.
Item 13. Exhibits.
| | (a)(2) | Separate certifications for each principal executive officer and principal financial officer of the registrant as required by Rule 30a-2(a) under the 1940 Act (17 CFR 270.30a-2(a)) and Section 302 of the Sarbanes-Oxley Act of 2002 are attached hereto. |
| | (b) | Certifications pursuant to Rule 30a-2(b) under the 1940 Act and Section 906 of the Sarbanes-Oxley Act of 2002 are attached hereto. |
SIGNATURES
Pursuant to the requirements of the Securities Exchange Act of 1934 and the Investment Company Act of 1940, the registrant has duly caused this report to be signed on its behalf by the undersigned, thereunto duly authorized.
| | | | |
| | HARTFORD SERIES FUND, INC. | | |
| | |
| Date: August 23, 2018 | | By: /s/ James E. Davey | | |
| | James E. Davey | | |
| | President and Chief Executive Officer | | |
Pursuant to the requirements of the Securities Exchange Act of 1934 and the Investment Company Act of 1940, this report has been signed below by the following persons on behalf of the registrant and in the capacities and on the dates indicated.
| | | | |
| Date: August 23, 2018 | | By: /s/ James E. Davey | | |
| | James E. Davey | | |
| | President and Chief Executive Officer | | |
| | |
| Date: August 23, 2018 | | By: /s/ Amy N. Furlong | | |
| | Amy N. Furlong | | |
| | Treasurer | | |
| | (Principal Financial Officer and Principal Accounting Officer) | | |