UNITED STATES
SECURITIES AND EXCHANGE COMMISSION
Washington, D.C. 20549
FORM 10-K
| x | ANNUAL REPORT PURSUANT TO SECTION 13 OR 15(d) OF THE SECURITIES EXCHANGE ACT OF 1934 |
For the Fiscal Year Ended December 31, 2011
OR
| ¨ | TRANSITION REPORT PURSUANT TO SECTION 13 OR 15(d) OF THE SECURITIES EXCHANGE ACT OF 1934 |
For the transition period from to .
Commission file number 1-14045
LASALLE HOTEL PROPERTIES
(Exact name of registrant as specified in its charter)
| | |
| Maryland | | 36-4219376 |
(State or other jurisdiction of incorporation or organization) | | (IRS Employer Identification No.) |
3 Bethesda Metro Center, Suite 1200 Bethesda, Maryland | | 20814 |
| (Address of principal executive offices) | | (Zip Code) |
(301) 941-1500
(Registrant’s telephone number, including area code)
Securities registered pursuant to Section 12(b) of the Act:
| | |
Title of each class | | Name of each exchange on which registered |
Common Shares of Beneficial Interest ($0.01 par value) | | New York Stock Exchange |
7 1/2% Series D Cumulative Redeemable Preferred Shares ($0.01 par value) | | New York Stock Exchange |
8% Series E Cumulative Redeemable Preferred Shares ($0.01 par value) | | New York Stock Exchange |
7 1/4% Series G Cumulative Redeemable Preferred Shares ($0.01 par value) | | New York Stock Exchange |
7 1/2% Series H Cumulative Redeemable Preferred Shares ($0.01 par value) | | New York Stock Exchange |
Securities registered pursuant to Section 12(g) of the Act: None
Indicate by check mark if the registrant is a well-known seasoned issuer, as defined in Rule 405 of the Securities Act. Yes x No ¨
Indicate by check mark if the registrant is not required to file reports pursuant to Section 13 or Section 15(d) of the Exchange Act. Yes ¨ No x
Indicate by check mark whether the registrant (1) has filed all reports required to be filed by Section 13 or 15(d) of the Securities Exchange Act of 1934 during the preceding 12 months (or for such shorter period that the registrant was required to file such reports), and (2) has been subject to such filing requirements for the past 90 days. Yes x No ¨
Indicate by check mark whether the registrant has submitted electronically and posted on its corporate Web site, if any, every Interactive Data File required to be submitted and posted pursuant to Rule 405 of Regulation S-T (§232.405 of this chapter) during the preceding 12 months (or for such shorter period that the registrant was required to submit and post such files). Yes x No ¨
Indicate by check mark if disclosure of delinquent filers pursuant to Item 405 of Regulation S-K is not contained herein, and will not be contained, to the best of the registrant’s knowledge, in definitive proxy or information statements incorporated by reference in Part III of this Form 10-K or any amendment to this Form 10-K. x
Indicate by check mark whether the registrant is a large accelerated filer, an accelerated filer, a non-accelerated filer or a smaller reporting company. See the definitions of “large accelerated filer,” “accelerated filer” and “smaller reporting company” in Rule 12b-2 of the Exchange Act. Check one:
| | | | | | |
| Large accelerated filer x | | Accelerated filer ¨ | | Non-accelerated filer ¨ | | Smaller reporting company ¨ |
| | | | (Do not check if a smaller reporting company) | | |
Indicate by check mark whether the registrant is a shell company (as defined in Rule 12b-2 of the Exchange Act). Yes ¨ No x
The aggregate market value of the 85,061,919 common shares of beneficial interest held by non-affiliates of the registrant was approximately $2.2 billion based on the closing price on the New York Stock Exchange for such common shares of beneficial interest as of June 30, 2011.
Number of the registrant’s common shares of beneficial interest outstanding as of February 15, 2012: 85,631,189.
DOCUMENTS INCORPORATED BY REFERENCE
Portions of the registrant’s Proxy Statement for its 2012 Annual Meeting of Shareholders to be held on or about April 20, 2012 are incorporated by reference in Part II and Part III of this report as noted therein.
LASALLE HOTEL PROPERTIES
INDEX
Forward-Looking Statements
This report, together with other statements and information publicly disseminated by LaSalle Hotel Properties (the “Company”), contains certain forward-looking statements within the meaning of Section 27A of the Securities Act of 1933, as amended (the “Securities Act”), and Section 21E of the Securities Exchange Act of 1934, as amended (the “Exchange Act”). The Company intends such forward-looking statements to be covered by the safe harbor provisions for forward-looking statements contained in the Private Securities Litigation Reform Act of 1995 and includes this statement for purposes of complying with these safe harbor provisions. Forward-looking statements, which are based on certain assumptions and describe the Company’s future plans, strategies and expectations, are generally identifiable by use of the words “believe,” “expect,” “intend,” “anticipate,” “estimate,” “project,” “may,” “plan,” “seek,” “should,” “will” or similar expressions. Forward-looking statements in this report include, among others, statements about the Company’s business strategy, including its acquisition and development strategies, industry trends, estimated revenues and expenses, ability to realize deferred tax assets and expected liquidity needs and sources (including capital expenditures and the ability to obtain financing or raise capital). You should not rely on forward-looking statements since they involve known and unknown risks, uncertainties and other factors that are, in some cases, beyond the Company’s control and which could materially affect actual results, performances or achievements. Factors that may cause actual results to differ materially from current expectations include, but are not limited to:
| | • | | risks associated with the hotel industry, including competition, increases in wages, energy costs and other operating costs, potential unionization, actual or threatened terrorist attacks, any type of flu or disease-related pandemic and downturns in general and local economic conditions; |
| | • | | the availability and terms of financing and capital and the general volatility of securities markets; |
| | • | | the Company’s dependence on third-party managers of its hotels, including its inability to implement strategic business decisions directly; |
| | • | | risks associated with the real estate industry, including environmental contamination and costs of complying with the Americans with Disabilities Act of 1990, as amended (the “ADA”), and similar laws; |
| | • | | interest rate increases; |
| | • | | the possible failure of the Company to qualify as a real estate investment trust (“REIT”) and the risk of changes in laws affecting REITs; |
| | • | | the possibility of uninsured losses; |
| | • | | risks associated with redevelopment and repositioning projects, including delays and cost overruns; and |
| | • | | the risk factors discussed under the heading “Risk Factors” in this Annual Report on Form 10-K. |
Accordingly, there is no assurance that the Company’s expectations will be realized. Except as otherwise required by the federal securities laws, the Company disclaims any obligations or undertaking to publicly release any updates or revisions to any forward-looking statement contained herein (or elsewhere) to reflect any change in the Company’s expectations with regard thereto or any change in events, conditions or circumstances on which any such statement is based.
The “Company”, “we” or “us” means LaSalle Hotel Properties and one or more of its subsidiaries (including LaSalle Hotel Operating Partnership, L.P. (the “Operating Partnership”) and LaSalle Hotel Lessee, Inc. (“LHL”)), or, as the context may require, LaSalle Hotel Properties only, the Operating Partnership only or LHL only.
1
PART I
General
The Company, a Maryland REIT organized on January 15, 1998, primarily buys, owns, redevelops and leases upscale and luxury full-service hotels located in convention, resort and major urban business markets. The Company is a self-administered and self-managed REIT as defined in the Internal Revenue Code of 1986, as amended (the “Code”). As a REIT, the Company is generally not subject to federal corporate income tax on that portion of its net income that is currently distributed to shareholders. The income of LHL, the Company’s wholly owned taxable-REIT subsidiary, is subject to taxation at normal corporate rates.
As of December 31, 2011, the Company owned interests in 37 hotels with over 9,800 guest rooms located in nine states and the District of Columbia. Each hotel is leased to LHL or a wholly owned subsidiary of LHL under a participating lease that provides for rental payments equal to the greater of (i) base rent or (ii) participating rent based on hotel revenues. The LHL leases expire between December 2012 and December 2015. Lease revenue from LHL and its wholly owned subsidiaries is eliminated in consolidation. A third-party non-affiliated hotel operator manages each hotel, which is also subject to a hotel management agreement, the terms of which are discussed in more detail under “—Hotel Managers and Hotel Management Agreements”.
Substantially all of the Company’s assets are held by, and all of its operations are conducted through, the Operating Partnership. The Company is the sole general partner of the Operating Partnership. The Company owned, through a combination of direct and indirect interests, 99.6% of the common units of the Operating Partnership at December 31, 2011. The remaining 0.4% is held by limited partners who held 296,300 common units of limited partnership interest at December 31, 2011. On December 29, 2011, the Company issued the 296,300 units to two entities comprising the seller of Park Central Hotel as partial consideration for the acquisition. The common units of limited partnership interest are subject to a required hold period that ends on December 28, 2013, after which they are convertible into a like number of common shares of beneficial interest, par value $0.01 per share, of the Company.
The Company’s principal offices are located at 3 Bethesda Metro Center, Suite 1200, Bethesda, Maryland 20814. The Company’s website iswww.lasallehotels.com. The Company makes available on its website free of charge its filings with the Securities and Exchange Commission (“SEC”), including its Annual Report on Form 10-K, Quarterly Reports on Form 10-Q, Current Reports on Form 8-K and amendments to those reports.
Strategies and Objectives
The Company’s primary objectives are to provide income to its shareholders through increases in distributable cash flow and to increase long-term total returns to shareholders through appreciation in the value of its common shares of beneficial interest. To achieve these objectives, the Company seeks to:
| | • | | enhance the return from, and the value of, the hotels in which it owns interests and any additional hotels the Company may acquire or develop; and |
| | • | | invest in or acquire additional hotel properties on favorable terms. |
The Company seeks to achieve revenue growth principally through:
| | • | | renovations, repositionings and/or expansions at selected hotels; |
| | • | | acquisitions of full-service hotels located in convention, resort and major urban markets in the U.S. especially upscale and luxury full-service hotels in such markets where the Company perceives strong demand growth or significant barriers to entry; |
| | • | | selective development of hotel properties, particularly upscale and luxury full-service hotels in high barrier-to-entry and high demand markets where development economics are favorable; and |
| | • | | revenue enhancing programs at the hotels. |
2
The Company intends to acquire additional hotels in urban, convention and resort markets, consistent with the growth strategies outlined above and which may:
| | • | | possess unique competitive advantages in the form of location, physical facilities or other attributes; |
| | • | | be available at significant discounts to replacement cost, including when such discounts result from reduced competition for hotels with long-term management and/or franchise agreements; |
| | • | | benefit from brand or franchise conversion or removal, new management, renovations or redevelopment or other active and aggressive asset management strategies; or |
| | • | | have expansion opportunities. |
The Company continues to focus on eight primary urban markets; however, it will acquire assets in other markets if the investment is consistent with the Company’s strategies and return criteria. The primary urban markets are:
| | |
| • Boston | | • San Diego |
| • Chicago | | • San Francisco |
| • Los Angeles | | • Seattle |
| • New York | | • Washington, DC |
Hotel Managers and Hotel Management Agreements
The Company seeks to grow through strategic relationships with premier, internationally recognized hotel operating companies, including Westin Hotels and Resorts, Hilton Hotels Corporation, Outrigger Lodging Services, Noble House Hotels & Resorts, Hyatt Hotels Corporation, Benchmark Hospitality, White Lodging Services Corporation, Thompson Hotels, Sandcastle Resorts & Hotels, Davidson Hotel Company, Denihan Hospitality Group, Kimpton Hotel & Restaurant Group, L.L.C., Accor, Destination Hotels & Resorts, HEI Hotels & Resorts, JRK Hotel Group, Inc., Viceroy Hotel Group and Highgate Holdings. The Company believes that having multiple operators creates a network that will generate acquisition opportunities. In addition, the Company believes its acquisition capabilities are enhanced by its considerable experience, resources and relationships in the hotel industry specifically and the real estate industry generally.
As of December 31, 2011, all of our 37 hotels are leased by LHL, and are managed and operated by third parties pursuant to management agreements entered into between LHL and the respective hotel management companies.
Our management agreements for the 37 hotels leased to LHL have the terms described below.
| | • | | Base Management Fees. Our management agreements generally provide for the payment of base management fees between 1.0% and 4.0% of the applicable hotel’s revenues or a fixed amount, as determined in the agreements. |
| | • | | Incentive Management and Other Fees. Some of our management agreements provide for the payment of incentive management fees between 10.0% and 20.0% of gross operating profit or as a percentage of, or in excess of, certain thresholds of net operating income or cash flow of the applicable hotel, if certain criteria are met. Certain of the management agreements also provide for the payment by us of sales and marketing, accounting and other fees. |
| | • | | Terms. The terms of our management agreements range from one year to 22 years not including renewals, and one year to 52 years including renewals. Only one management agreement has a 52-year term including renewals. The next longest management agreement term including renewals is 37 years. |
| | • | | Ability to Terminate. We have 37 management agreements of which 31 are terminable at will and one is terminable upon sale. The remaining five management agreements are terminable only with cause. Termination fees range from zero to up to ten times annual base management and incentive |
3
| | management fees. Only one management agreement has termination fees at ten times, with the next highest at two times annual base management and incentive management fees. |
| | • | | Operational Services. Each manager has exclusive authority to supervise, direct and control the day-to-day operation and management of the respective hotel including establishing all room rates, processing reservations, procuring inventories, supplies and services, and preparing public relations, publicity and marketing plans for the hotel. |
| | • | | Executive Supervision and Management Services. Each manager supervises all managerial and other employees, reviews the operation and maintenance, prepares reports, budgets and projections, and provides other administrative and accounting support services to the respective hotel. |
| | • | | Chain Services. Our management agreements with major brands require the managers to furnish chain services that are generally made available to other hotels managed by such managers. Such services may, for example, include: (1) the development and operation of computer systems and reservation services; (2) management and administrative services; (3) marketing and sales services; (4) human resources training services and (5) such additional services as may from time to time be more efficiently performed on a national, regional or group level. |
| | • | | Working Capital. Our management agreements typically require us to maintain working capital for a hotel and to fund the cost of supplies such as linen and other similar items. We are also responsible for providing funds to meet the cash needs for the hotel operations if at any time the funds available from the hotel operations are insufficient to meet the financial requirements of the hotel. |
| | • | | Furniture, Fixtures and Equipment Replacements. We are required to provide to the managers all the necessary furniture, fixtures and equipment for the operation of the hotels (including funding any required furniture, fixture and equipment replacements). Our management agreements generally provide that once each year the managers will prepare a list of furniture, fixtures and equipment to be acquired and certain routine repairs to be performed in the next year and an estimate of funds that are necessary therefore, subject to our review and approval. For purposes of funding the furniture, fixtures and equipment replacements, a specified percentage of the gross revenues of each hotel is either deposited by the manager in an escrow account (typically 4.0% to 5.0%) or held by the owner. |
| | • | | Building Alterations, Improvements and Renewals. Our management agreements generally require the managers to prepare an annual estimate of the expenditures necessary for major repairs, alterations, improvements, renewals and replacements to the structural, mechanical, electrical, heating, ventilating, air conditioning, plumbing and vertical transportation elements of the hotels. In addition to the foregoing, the management agreements generally provide that the managers may propose such changes, alterations and improvements to the hotels as required by reason of laws or regulations or, in each manager’s reasonable judgment, to keep each respective hotel in a safe, competitive and efficient operating condition. |
| | • | | Sale of a Hotel. Six of our management agreements limit our ability to sell, lease or otherwise transfer a hotel, unless the transferee assumes the related management agreement and meets specified other conditions and/or unless the transferee is not a competitor of the manager. |
| | • | | Service Marks. During the term of our management agreements, the service mark, symbols and logos currently used by the managers may be used in the operation of the hotels. Any right to use the service marks, logo and symbols and related trademarks at a hotel will terminate with respect to that hotel upon termination of the management agreement with respect to such hotel. |
Recent Developments
On December 29, 2011, the Company acquired a 100% interest in the Park Central Hotel, a 934-room upscale, full-service hotel located in New York, NY, for $396.2 million. The sources of the funding for the acquisition were cash on hand consisting primarily of the remaining net proceeds from the Company’s previously
4
completed sale of common shares of beneficial interest on April 29, 2011, borrowings under the Company’s senior unsecured credit facility and the issuance of 296,300 common units of limited partnership interest (0.4% of the Operating Partnership).
From February 1, 2012 through February 15, 2012, the Company sold 1,714,939 common shares of beneficial interest, par value $0.01 per share, under its equity distribution agreement (the “2011 Agreement”) with Raymond James & Associates, Inc. (the “Manager”). After deducting the Manager’s discounts and commissions, the Company raised net proceeds of $46.6 million, which were used to pay down amounts outstanding under the Company’s senior unsecured credit facility and for general corporate purposes.
Hotel Renovations
The Company believes that its regular program of capital improvements at the hotels, including replacement and refurbishment of furniture, fixtures and equipment helps maintain and enhance its competitiveness and maximizes revenue growth.
Joint Ventures
On December 29, 2010, the Company, through Modern Magic Hotel LLC, a joint venture in which the Company holds a 95.0% controlling interest, sold its interest in the IBM Building located at 330 N. Wabash Avenue in downtown Chicago, IL for $58.8 million, resulting in an impairment loss of $8.4 million, which includes a $2.7 million termination fee paid to the development manager. On November 1, 2011, the joint venture was dissolved after final distributions were made to the partners.
Tax Status
The Company has elected to be taxed as a REIT under Sections 856 through 860 of the Code. As a result, the Company generally is not subject to corporate income tax on that portion of its net income that is currently distributed to shareholders. A REIT is subject to a number of highly technical and complex organizational and operational requirements, including requirements with respect to the nature of its gross income and assets and a requirement that it currently distribute at least 90% of its taxable income. The Company may, however, be subject to certain state and local taxes on its income and property.
Effective January 1, 2001, the Company elected to operate its wholly-owned subsidiary, LHL, as provided for under the REIT Modernization Act as a taxable-REIT subsidiary. Accordingly, LHL is required to pay corporate income taxes at the applicable rates.
Seasonality
The Company’s hotels’ operations historically have been seasonal. Taken together, the hotels maintain higher occupancy rates during the second and third quarters of each year. These seasonality patterns can be expected to cause fluctuations in the quarterly hotel operating revenues of LHL and the Company’s quarterly lease revenues from LHL.
Competition
The hotel industry is highly competitive. Each of the hotels is located in a developed area that includes other hotel properties. The number of competitive hotel properties in a particular area could have a material adverse effect on occupancy, average daily rate (“ADR”) and room revenue per available room (“RevPAR”) at the Company’s current hotels or at hotels acquired in the future. The Company may be competing for investment opportunities with entities that have substantially greater financial resources than the Company. These entities may generally be able to accept more risk than the Company can prudently manage, including risks with respect to the amount of leverage utilized, creditworthiness of a hotel operator or the geographic proximity of its investments. Competition may generally reduce the number of suitable investment opportunities offered to the Company and increase the bargaining power of property owners seeking to sell.
5
Environmental Matters
In connection with the ownership of hotels, the Company is subject to various federal, state and local laws, ordinances and regulations relating to environmental protection. Under these laws, a current or previous owner or operator of real estate may be liable for the costs of removal or remediation of certain hazardous or toxic substances on, under or in such property. Such laws often impose liability without regard to whether the owner or operator knew of, or was responsible for, the presence of hazardous or toxic substances. In addition, the presence of contamination from hazardous or toxic substances, or the failure to remediate such contaminated property properly, may adversely affect the owner’s ability to borrow using such property as collateral. Furthermore, a person who arranges for the disposal or treatment of a hazardous or toxic substance at a property owned by another, or who transports such substance to or from such property, may be liable for the costs of removal or remediation of such substance released into the environment at the disposal or treatment facility. The costs of remediation or removal of such substances may be substantial, and the presence of such substances may adversely affect the owner’s ability to sell such real estate or to borrow using such real estate as collateral. In connection with the ownership of hotels, the Company may be potentially liable for such costs.
The Company believes that its hotels are in compliance, in all material respects, with all federal, state and local environmental ordinances and regulations regarding hazardous or toxic substances and other environmental matters, the violation of which could have a material adverse effect on the Company. The Company has not received verbal or written notice from any governmental authority of any material noncompliance, liability or claim relating to hazardous or toxic substances or other environmental matters in connection with any of its present properties.
Employees
The Company had 31 employees as of February 15, 2012. All persons employed in the day-to-day operations of the hotels are employees of the management companies engaged by the lessees to operate such hotels.
Additional Information
All reports filed with the SEC may also be read and copied at the SEC’s public reference room at 100 F Street, NE, Washington, DC 20549. Further information regarding the operation of the public reference room may be obtained by calling 1-800-SEC-0330. In addition, all of our filed reports can be obtained at the SEC’s website atwww.sec.gov or through the Company’s website atwww.lasallehotels.com.
The following risk factors and other information included in this Annual Report on Form 10-K should be carefully considered. The risks and uncertainties described below are not the only ones the Company faces. Additional risks and uncertainties not presently known to the Company or that it may currently deem immaterial also may impair its business operations. If any of the following risks occur, the Company’s business, financial condition, operating results and cash flows could be materially adversely affected.
In the past, events beyond our control, including an economic slowdown or downturn and terrorism, harmed the operating performance of the hotel industry generally and the performance of our hotels. If these or similar events occur or continue to occur, our operating and financial results may be harmed by declines in occupancy, average daily room rates and/or other operating revenues.
The performance of the lodging industry has traditionally been closely linked with the performance of the general economy and, specifically, growth in the U.S. gross domestic product (“GDP”). All of our hotels are classified as luxury, upper upscale or upscale. In an economic downturn, these types of hotels may be more susceptible to a decrease in revenue, as compared to hotels in other categories that have lower room rates. This
6
characteristic may result from the fact that upper upscale hotels generally target business and high-end leisure travelers. In periods of economic difficulties, business and leisure travelers may seek to reduce travel costs by limiting travel or seeking to reduce costs on their trips. In addition, the terrorist attacks of September 11, 2001 had a dramatic adverse effect on business and leisure travel, and on the occupancy and ADR of our hotels. Future terrorist activities could have a harmful effect on both the industry and us. Likewise, the volatility in the credit and equity markets and the economic recession will continue to have an adverse effect on our business. Even after an economic recovery begins, a significant period of time may elapse before RevPAR, operating margins and other key lodging fundamentals improve.
The return on our hotels depends upon the ability of the hotel operators to operate and manage the hotels.
To maintain our status as a REIT, we are not permitted to operate any of our hotels. As a result, we are unable to directly implement strategic business decisions with respect to the daily operation and marketing of our hotels, such as decisions with respect to the setting of room rates, repositioning of a hotel, food and beverage pricing and certain similar matters. Although LHL consults with the hotel operators with respect to strategic business plans, the hotel operators are under no obligation to implement any of our recommendations with respect to such matters. Thus, even if we believe our hotels are being operated inefficiently or in a manner that does not result in satisfactory occupancy rates, revenue per available room, average daily rates or operating profits, we may not have sufficient rights under our hotel operating agreements to enable us to force the hotel operator to change its method of operation. We generally can only seek redress if a hotel operator violates the terms of the applicable operating agreement, and then only to the extent of the remedies provided for under the terms of the agreement. Some of the operating agreements have lengthy terms and may not be terminable by us before the agreement’s expiration. In the event that we are able to and do replace any of our hotel operators, we may experience significant disruptions at the affected hotels, which may adversely affect our ability to make distributions to our shareholders.
We currently own only luxury, upper upscale and upscale hotels. These segments of the lodging market are highly competitive and generally subject to greater volatility than most other market segments, which could negatively affect our profitability.
The luxury, upper upscale and upscale segments of the hotel business are highly competitive. Our hotels compete on the basis of location, room rates, quality, service levels, reputation and reservations systems, among many factors. There are many competitors in the luxury, upper upscale and upscale segments, and many of these competitors may have substantially greater marketing and financial resources than we have. This competition could reduce occupancy levels and room revenue at our hotels, which would harm our operations. Over-building in the hotel industry may increase the number of rooms available and may decrease occupancy and room rates. In addition, in periods of weak demand, as may occur during a general economic recession, profitability is negatively affected by the relatively high fixed costs of operating luxury, upper upscale and upscale hotels.
Our performance and our ability to make distributions on our shares are subject to risks associated with the hotel industry.
Competition for guests, increases in operating costs, dependence on travel and economic conditions could adversely affect our cash flow. Our hotels are subject to all operating risks common to the hotel industry. These risks include:
| | • | | adverse effects of weak national, regional and local economic conditions; |
| | • | | tightening credit standards; |
| | • | | competition for guests and meetings from other hotels including competition and pricing pressure from internet wholesalers and distributors; |
7
| | • | | increases in operating costs, including wages, benefits, insurance, property taxes and energy, due to inflation and other factors, which may not be offset in the future by increased room rates; |
| | • | | labor strikes, disruptions or lockouts that may impact operating performance; |
| | • | | dependence on demand from business and leisure travelers, which may fluctuate and be seasonal; |
| | • | | increases in energy costs, airline fares and other expenses related to travel, which may negatively affect traveling; and |
| | • | | terrorism, terrorism alerts and warnings, military actions, pandemics or other medical events which may cause decreases in business and leisure travel. |
These factors could adversely affect the ability of the lessees to generate revenues and to make rental payments to us.
Unexpected capital expenditures could adversely affect our cash flow. Hotels require ongoing renovations and other capital improvements, including periodic replacement or refurbishment of furniture, fixtures and equipment. Under the terms of our leases, we are obligated to pay the cost of certain capital expenditures at the hotels, including new brand standards, and to pay for periodic replacement or refurbishment of furniture, fixtures and equipment. If capital expenditures exceed expectations, there can be no assurance that sufficient sources of financing will be available to fund such expenditures.
In addition, we have acquired hotels that have undergone significant renovation and may acquire additional hotels in the future that require significant renovation. Renovations of hotels involve numerous risks, including the possibility of environmental problems, construction cost overruns and delays, the effect on current demand, uncertainties as to market demand or deterioration in market demand after commencement of renovation and the emergence of unanticipated competition from other hotels.
Our lenders may have suffered losses related to the weakening economy and may not be able to fund our borrowings.
Our lenders, including the lenders participating in our $750.0 million senior unsecured credit facility, may have suffered losses related to their lending and other financial relationships, especially because of the general weakening of the national economy and increased financial instability of many borrowers. As a result, lenders may become insolvent or tighten their lending standards, which could make it more difficult for us to borrow under our credit facility or to obtain other financing on favorable terms or at all. Our financial condition and results of operations would be adversely affected if we were unable to draw funds under our credit facility because of a lender default or to obtain other cost-effective financing.
Our obligation to comply with financial covenants in our unsecured credit facilities and mortgages on some of our hotel properties could impact our operations, may require us to liquidate our properties and could adversely affect our ability to make distributions to our shareholders.
Our unsecured credit facilities. We have a senior unsecured credit facility with a syndicate of banks that provides for a maximum borrowing of up to $750.0 million, with the maximum borrowing potentially increased to $1.0 billion through an accordion feature. The senior unsecured credit facility matures on January 30, 2016, subject to a one-year extension that we may exercise at our option, pursuant to certain terms and conditions, including the payment of an extension fee. The senior unsecured credit facility contains certain financial covenants relating to net worth requirements, debt ratios and fixed charge coverage and other limitations that restrict our ability to make distributions or other payments to our shareholders upon events of default. The senior unsecured credit facility also contains a cross-default provision that allows the lenders under the credit facility to stop future extensions of credit and/or accelerate the maturity of any outstanding principal balances under the credit facility if we are in default under another debt obligation, including our non-recourse secured mortgage indebtedness.
8
LHL has an unsecured revolving credit facility with U.S. Bank National Association that provides for a maximum borrowing of up to $25.0 million. The unsecured revolving credit facility matures on January 30, 2016, subject to a one-year extension that LHL may exercise at its option, pursuant to certain terms and conditions, including the payment of an extension fee. The unsecured revolving credit facility contains certain financial covenants relating to net worth requirements, debt ratios and fixed charge coverage.
If we violate the financial covenants in our credit facilities, we could be required to repay all or a portion of our indebtedness with respect to such credit facility before maturity at a time when we might be unable to arrange financing for such repayment on attractive terms, or at all. Moreover, if we are unable to refinance our debt on acceptable terms, including at maturity of our credit facilities, we may be forced to dispose of hotel properties on disadvantageous terms, potentially resulting in losses that reduce cash flow from operating activities. Failure to comply with our financial covenants contained in our credit facilities, or our non-recourse secured mortgages described below, could result from, among other things, changes in our results of operations, the incurrence of additional debt or changes in general economic conditions.
Our non-recourse secured mortgages. In addition to our senior unsecured credit facility and the LHL unsecured revolving credit facility, we have from time to time entered into non-recourse mortgages secured by specific hotel properties. Under the terms of these debt obligations, a lender’s only remedy in the event of default is against the real property securing the mortgage, except where a borrower has, among other customary exceptions, engaged in an action constituting fraud or an intentional misrepresentation. In those cases, a lender may seek a remedy for a breach directly against the borrower, including its other assets. The Indianapolis Marriott Downtown, Hilton San Diego Gaslamp Quarter, Westin Copley Place, Hotel Deca, Westin Michigan Avenue, Hotel Solamar and Hotel Roger Williams are each mortgaged to secure payment of indebtedness aggregating $643.7 million (excluding loan premiums) as of December 31, 2011. The Harborside Hyatt Conference Center & Hotel is mortgaged to secure payment of principal and interest on bonds with an aggregate par value of $42.5 million. These mortgages contain debt service coverage tests related to the mortgaged property. If our debt service coverage ratio fails, for that specific property, to exceed a threshold level specified in a mortgage, cash flows from that hotel will automatically be directed to the lender to (i) satisfy required payments, (ii) fund certain reserves required by the mortgage and (iii) fund additional cash reserves for future required payments, including final payment. Cash flows will be directed to the lender until such time as we again become compliant with the specified debt service coverage ratio or the mortgage is paid off.
If we are unable to meet mortgage payment obligations, including the payment obligation upon maturity of the mortgage borrowing, the mortgage securing the specific property could be foreclosed upon by, or the property could be otherwise transferred to, the mortgagee with a consequent loss of income and asset value to us. We may also elect to sell the property, if we are able to sell the property, for a loss in advance of a foreclosure or other transfer. An event of default under our non-recourse secured mortgage may also constitute an event of default under our senior unsecured credit facility.
As of December 31, 2011, the Company is in compliance with all debt covenants, current on all loan payments and not otherwise in default under the credit facilities or mortgages.
9
Our liquidity may be reduced and our cost of debt financing may be increased because we may be unable to, or elect not to, remarket debt securities related to our Harborside Hyatt Conference Center & Hotel for which we may be liable.
We are the obligor with respect to a $37.1 million tax-exempt special project revenue bond and a $5.4 million taxable special project revenue bond, both issued by the Massachusetts Port Authority (collectively, the “Massport Bonds”). The Massport Bonds, which mature on March 1, 2018, bear interest based on weekly floating rates and have no principal reductions prior to their scheduled maturities. The Massport Bonds may be redeemed at any time, at our option, without penalty. The Royal Bank of Scotland provides the supporting letters of credit on the Massport Bonds. The letters of credit expire on February 14, 2014, pursuant to amendments to the agreements in 2011. The Royal Bank of Scotland letters of credit also have three one-year extensions that we may exercise at our option, subject to certain terms and conditions. If the Royal Bank of Scotland fails to renew its letters of credit at expiration and an acceptable replacement provider cannot be found, we may be required to pay off the bonds. If we are unable to, or elect not to, issue or remarket the Massport Bonds, we would expect to rely primarily on our available cash and revolving credit facility to pay off the Massport Bonds. At certain times, we may hold some of the Massport Bonds that have not been successfully remarketed. Our borrowing costs under our revolving credit facility may be higher than tax-exempt bond financing costs. Borrowings under the revolving credit facility to pay off the Massport Bonds would also reduce our liquidity to meet other obligations.
Our performance is subject to real estate industry conditions, the terms of our leases and management agreements.
Because real estate investments are illiquid, we may not be able to sell hotels when desired. Real estate investments generally cannot be sold quickly. We may not be able to vary our portfolio promptly in response to economic or other conditions. In addition, provisions of the Code limit a REIT’s ability to sell properties in some situations when it may be economically advantageous to do so.
Liability for environmental matters could adversely affect our financial condition. As an owner of real property, we are subject to various federal, state and local laws and regulations relating to the protection of the environment that may require a current or previous owner of real estate to investigate and clean-up hazardous or toxic substances at a property. These laws often impose such liability without regard to whether the owner knew of or caused the presence of the contaminants, and liability is not limited under the enactments and could exceed the value of the property and/or the aggregate assets of the owner. Persons who arrange for the disposal or treatment facility, whether or not such facility is owned or operated by the person may be liable for the costs of removal or remediation of such substance released into the environment at the disposal or treatment facility. Even if more than one person were responsible for the contamination, each person covered by the environmental laws may be held responsible for the entire amount of clean-up costs incurred.
Environmental laws also govern the presence, maintenance and removal of asbestos-containing materials. These laws impose liability for release of asbestos-containing materials into the air and third parties may seek recovery from owners or operators of real properties for personal injury associated with asbestos-containing materials. In connection with ownership (direct or indirect) of our hotels, we may be considered an owner or operator of properties with asbestos-containing materials. Having arranged for the disposal or treatment of contaminants, we may be potentially liable for removal, remediation and other costs, including governmental fines and injuries to persons and property.
The costs of compliance with the ADA and other government regulations could adversely affect our cash flow. Under the ADA, all public accommodations are required to meet certain federal requirements related to access and use by disabled persons. A determination that we are not in compliance with the ADA could result in imposition of fines or an award of damages to private litigants. If we are required to make substantial modifications to our hotels, whether to comply with ADA or other government regulation such as building codes or fire safety regulations, our financial condition, results of operations and ability to make shareholder distributions could be adversely affected.
10
Certain leases and management agreements may constrain us from acting in the best interest of shareholders or require us to make certain payments. The Harborside Hyatt Conference Center & Hotel, San Diego Paradise Point Resort and Spa, The Hilton San Diego Resort and Spa, Hotel Roger Williams and Viceroy Santa Monica are each subject to a ground or land and building lease with a third-party lessor which requires us to obtain the consent of the relevant third party lessor in order to sell any of these hotels or to assign our leasehold interest in any of the ground or land and building leases. Accordingly, if we determine that the sale of any of these hotels or the assignment of our leasehold interest in any of these ground or land and building leases is in the best interest of our shareholders, we may be prevented from completing such a transaction if we are unable to obtain the required consent from the relevant lessor. The Indianapolis Marriott Downtown, Westin Copley Place and Hotel Solamar are each subject to a ground or air rights lease and do not require approval from the relevant third-party lessor.
In some instances, we may be required to obtain the consent of the hotel operator or franchisor prior to selling the hotel. Typically, such consent is only required in connection with certain proposed sales, such as if the proposed purchaser is engaged in the operation of a competing hotel or does not meet certain minimum financial requirements. The operators of Harborside Hyatt Conference Center & Hotel and Alexis Hotel require approval of certain sales.
Some of our hotels are subject to rights of first offer which may adversely affect our ability to sell those properties on favorable terms or at all.
We are subject to a franchisor’s or operator’s right of first offer with respect to the Hilton Alexandria Old Town, Hilton San Diego Gaslamp Quarter, The Hilton San Diego Resort and Spa, Embassy Suites Philadelphia—Center City and Park Central Hotel. These third-party rights may adversely affect our ability to timely dispose of these properties on favorable terms, or at all.
Increases in interest rates may increase our interest expense.
As of December 31, 2011, $307.5 million of aggregate indebtedness (32.3% of total indebtedness) was subject to variable interest rates. An increase in interest rates could increase our interest expense and reduce our cash flow and may affect our ability to make distributions to shareholders and to service our indebtedness.
Failure to qualify as a REIT would be costly.
We have operated (and intend to so operate in the future) so as to qualify as a REIT under the Code beginning with our taxable year ended December 31, 1998. Although management believes that we are organized and operated in a manner to so qualify, no assurance can be given that we will qualify or remain qualified as a REIT.
If we fail to qualify as a REIT in any taxable year, we will be subject to federal income tax (including any applicable alternative minimum tax) on our taxable income at regular corporate rates. Moreover, unless entitled to relief under certain statutory provisions, we also will be disqualified from treatment as a REIT for the four taxable years following the year during which qualification was lost. This treatment would cause us to incur additional tax liabilities, significantly impair our ability to service indebtedness and reduce the amount of cash available to make new investments or to make distributions on our common shares of beneficial interest and preferred shares.
Current laws include provisions that could provide relief in the event we violate certain provisions of the Code that otherwise would result in our failure to qualify as a REIT. We cannot assure that these relief provisions would apply if we failed to comply with the REIT qualification laws. Even if the relief provisions do apply, we would be subject to a penalty tax of at least $50,000 for each disqualifying event in most cases.
11
Property ownership through partnerships and joint ventures could limit our control of those investments.
Partnership or joint venture investments may involve risks not otherwise present for investments made solely by us, including among others, the possibility that our co-investors might become bankrupt, might at any time have goals or interests that are different from ours because of disparate tax consequences or otherwise, and may take action contrary to our instructions, requests, policies or objectives, including our policy with respect to maintaining our qualification as a REIT. Other risks of joint venture investments include an impasse on decisions, such as a sale, because neither our co-investors nor we would have full control over the partnership or joint venture. There is no limitation under our organizational documents as to the amount of funds that may be invested in partnerships or joint ventures.
We may not have enough insurance.
We carry comprehensive liability, fire, flood, earthquake, extended coverage and business interruption policies that insure us against losses with policy specifications and insurance limits that we believe are reasonable. There are certain types of losses, such as losses from environmental problems or terrorism, that management may not be able to insure against or may decide not to insure against since the cost of insuring is not economical. We may suffer losses that exceed our insurance coverage. Further, market conditions, changes in building codes and ordinances or other factors such as environmental laws may make it too expensive to repair or replace a property that has been damaged or destroyed, even if covered by insurance.
Our organizational documents and agreements with our executives and applicable Maryland law contain provisions that may delay, defer or prevent change of control transactions and may prevent shareholders from realizing a premium for their shares.
Our trustees serve staggered three-year terms, the trustees may only be removed for cause and remaining trustees may fill board vacancies. Our Board of Trustees is divided into three classes of trustees, each serving staggered three-year terms. In addition, a trustee may only be removed for cause by the affirmative vote of the holders of a majority of our outstanding common shares. Our declaration of trust and bylaws also provide that a majority of the remaining trustees may fill any vacancy on the Board of Trustees and further effectively provide that only the Board of Trustees may increase or decrease the number of persons serving on the Board of Trustees. These provisions preclude shareholders from removing incumbent trustees, except for cause after a majority affirmative vote, and filling the vacancies created by such removal with their own nominees.
Our Board of Trustees may approve the issuance of shares with terms that may discourage a third party from acquiring the Company. The Board of Trustees has the power under the declaration of trust to classify any of our unissued preferred shares, and to reclassify any of our previously classified but unissued preferred shares of any series from time to time, in one or more series of preferred shares, without shareholder approval. The issuance of preferred shares could adversely affect the voting power, dividend and other rights of holders of common shares and the value of the common shares.
Our declaration of trust prohibits ownership of more than 9.8% of the common shares or 9.8% of any series of preferred shares. To qualify as a REIT under the Code, no more than 50% of the value of our outstanding shares may be owned, directly or under applicable attribution rules, by five or fewer individuals (as defined to include certain entities) during the last half of each taxable year. Our declaration of trust generally prohibits direct or indirect ownership by any person of (i) more than 9.8% of the number or value (whichever is more restrictive) of the outstanding common shares or (ii) more than 9.8% of the number or value (whichever is more restrictive) of the outstanding shares of any class or series of preferred shares. Generally, shares owned by affiliated owners will be aggregated for purposes of the ownership limitation. Any transfer of shares that would violate the ownership limitation will result in the shares that would otherwise be held in violation of the ownership limit being designated as “shares-in-trust” and transferred automatically to a charitable trust effective on the day before the purported transfer or other event giving rise to such excess ownership. The intended transferee will acquire no rights in such shares.
12
The Maryland Business Combination Statute applies to us. A Maryland “business combination” statute contains provisions that, subject to limitations, prohibit certain business combinations between us and an “interested stockholder” (defined generally as any person who beneficially owns 10% or more of the voting power of our shares or an affiliate thereof) for five years after the most recent date on which the shareholder becomes an interested stockholder, and thereafter impose special shareholder voting requirements on these combinations.
The Board of Trustees may choose to subject us to the Maryland Control Share Act. A Maryland law known as the “Maryland Control Share Act” provides that “control shares” of a company (defined as shares which, when aggregated with other shares controlled by the acquiring shareholder, entitle the shareholder to exercise one of three increasing ranges of voting power in electing trustees) acquired in a “control share acquisition” (defined as the direct or indirect acquisition of ownership or control of “control shares”) have no voting rights except to the extent approved by the company’s shareholders by the affirmative vote of at least two-thirds of all the votes entitled to be cast on the matter, excluding all interested shares. Our bylaws currently provide that we are not subject to these provisions. However, the Board of Trustees, without shareholder approval, may repeal this bylaw and cause us to become subject to the Maryland Control Share Act.
Other provisions of our organization documents may delay or prevent a change of control of the Company. Among other provisions, our organizational documents provide that the number of trustees constituting the full Board of Trustees may be fixed only by the trustees and that a special meeting of shareholders may not be called by holders of common shares holding less than a majority of the outstanding common shares entitled to vote at such meeting.
Our executive officers have agreements that provide them with benefits in the event of a change in control of the Company. We entered into agreements with our executive officers that provide them with severance benefits if their employment ends under certain circumstances within one year following a “change in control” of the Company (as defined in the agreements) or if the executive officer resigns for “good reason” (as defined in the agreements). These benefits could increase the cost to a potential acquirer of the Company and thereby prevent or deter a change in control of the Company that might involve a premium price for the common shares or otherwise be in our shareholders’ best interests.
We depend on the efforts and expertise of our key executive officers and would be adversely affected by the loss of their services.
We depend on the efforts and expertise of our President and Chief Executive Officer, as well as our other executive officers, to execute our business strategy. The loss of their services, and our inability to find suitable replacements, would have an adverse effect on our business.
A large number of shares available for future sale could adversely affect the market price of our common shares and may be dilutive to current shareholders.
The sales of a substantial number of our common shares, or the perception that such sales could occur, could adversely affect prevailing market prices for our common shares. As of December 31, 2011, there were 200,000,000 common shares authorized under our declaration of trust, as amended, of which 83,786,932 were outstanding. Our Board of Trustees may authorize the issuance of additional authorized but unissued common shares or other authorized but unissued securities at any time, including pursuant to our 2009 Equity Incentive Plan. We also have filed a registration statement with the SEC allowing us to offer, from time to time, an indefinite amount of equity securities (including common or preferred shares) on an as-needed basis and subject to our ability to affect offerings on satisfactory terms based on prevailing conditions. In addition, in February 2011, our Board of Trustees authorized us to issue common shares having an aggregate offering price of up to $250.0 million in a continuous equity issuance program. Our ability to execute our business strategy depends on our access to an appropriate blend of debt financing, including unsecured lines of credit and other forms of
13
secured and unsecured debt, and equity financing, including issuances of common and preferred equity. No prediction can be made about the effect that future distributions or sales of our common shares will have on the market price of our common shares.
Holders of our outstanding preferred shares have dividend, liquidation and other rights that are senior to the rights of the holders of our common shares.
Our Board of Trustees has the authority to designate and issue preferred shares with liquidation, dividend and other rights that are senior to those of our common shares. As of December 31, 2011, 3,170,000 shares of our 7 1/2% Series D Cumulative Redeemable Preferred Shares (the “Series D Preferred Shares”), 3,500,000 shares of our 8% Series E Cumulative Redeemable Preferred Shares (the “Series E Preferred Shares”), 6,348,888 shares of our 7 1/4% Series G Cumulative Redeemable Preferred Shares (the “Series G Preferred Shares”) and 2,750,000 shares of our 7 1/2% Series H Cumulative Redeemable Preferred Shares (the “Series H Preferred Shares”) were issued and outstanding. The aggregate liquidation preference with respect to the outstanding preferred shares is approximately $394.2 million, and annual dividends on our outstanding preferred shares are approximately $29.6 million. Holders of our Series D Preferred Shares, our Series E Preferred Shares, our Series G Preferred Shares and our Series H Preferred Shares are entitled to cumulative dividends before any dividends may be declared or set aside on our common shares. Upon our voluntary or involuntary liquidation, dissolution or winding up, before any payment is made to holders of our common shares, holders of these preferred shares are entitled to receive a liquidation preference of $25.00 per share plus any accrued and unpaid distributions. This will reduce the remaining amount of our assets, if any, available to distribute to holders of our common shares. In addition, holders of these preferred shares have the right to elect two additional trustees to our Board of Trustees whenever dividends on the preferred shares are in arrears in an aggregate amount equivalent to six or more quarterly dividends, whether or not consecutive. Because our decision to issue securities will depend on market conditions and other factors beyond our control, we cannot predict or estimate the amount, timing or nature of our future preferred offerings. Thus, our shareholders bear the risk of our future securities issuances reducing the market price of our common shares and diluting their interest.
| Item 1B. | Unresolved Staff Comments |
None.
14
Hotel Properties
As of December 31, 2011, the Company owned interests in the following 37 hotel properties:
| | | | | | |
Hotel Properties | | Number of
Guest Rooms | | | Location |
1. Le Montrose Suite Hotel | | | 133 | | | WestHollywood, CA |
2. San Diego Paradise Point Resort and Spa(1) | | | 462 | | | San Diego, CA |
3. Harborside Hyatt Conference Center & Hotel(1)(2) | | | 270 | | | Boston,MA |
4. Hotel Viking | | | 209 | | | Newport,RI |
5. Topaz Hotel | | | 99 | | | Washington,D.C. |
6. Hotel Rouge | | | 137 | | | Washington,D.C. |
7. Hotel Madera | | | 82 | | | Washington,D.C. |
8. Hotel Helix | | | 178 | | | Washington,D.C. |
9. The Liaison Capitol Hill | | | 343 | | | Washington,D.C. |
10. Lansdowne Resort | | | 296 | | | Lansdowne,VA |
11. Hotel George | | | 139 | | | Washington,D.C. |
12. Indianapolis Marriott Downtown(1)(2) | | | 622 | | | Indianapolis,IN |
13. Hilton Alexandria Old Town | | | 246 | | | Alexandria,VA |
14. Chaminade Resort and Conference Center | | | 156 | | | SantaCruz, CA |
15. Hilton San Diego Gaslamp Quarter(2) | | | 283 | | | San Diego, CA |
16. The Grafton on Sunset | | | 108 | | | WestHollywood, CA |
17. Onyx Hotel | | | 112 | | | Boston,MA |
18. Westin Copley Place(2)(3) | | | 803 | | | Boston,MA |
19. Hotel Deca(2) | | | 158 | | | Seattle,WA |
20. The Hilton San Diego Resort and Spa(1) | | | 357 | | | San Diego, CA |
21. Donovan House | | | 193 | | | Washington,D.C. |
22. Le Parc Suite Hotel | | | 154 | | | WestHollywood, CA |
23. Hotel Sax Chicago | | | 353 | | | Chicago,IL |
24. Westin Michigan Avenue(2) | | | 752 | | | Chicago,IL |
25. Alexis Hotel | | | 121 | | | Seattle,WA |
26. Hotel Solamar(1)(2) | | | 235 | | | San Diego, CA |
27. Gild Hall | | | 126 | | | New York, NY |
28. Hotel Amarano Burbank | | | 99 | | | Burbank,CA |
29. Sofitel Washington, DC Lafayette Square | | | 237 | | | Washington,D.C. |
30. Hotel Monaco San Francisco | | | 201 | | | San Francisco, CA |
31. Westin Philadelphia | | | 294 | | | Philadelphia,PA |
32. Embassy Suites Philadelphia – Center City | | | 288 | | | Philadelphia,PA |
33. Hotel Roger Williams(1)(2) | | | 193 | | | New York, NY |
34. Chamberlain West Hollywood | | | 113 | | | WestHollywood, CA |
35. Viceroy Santa Monica(1) | | | 162 | | | SantaMonica, CA |
36. Villa Florence | | | 182 | | | San Francisco, CA |
37. Park Central Hotel | | | 934 | | | New York, NY |
| | | | | | |
Total number of guest rooms | | | 9,830 | | | |
| | | | | | |
| (1) | Property subject to a long-term ground or land and building lease. |
| (2) | Property subject to a mortgage/debt. |
| (3) | Property subject to a long-term air rights lease. |
Each of our hotels is full service, with six classified as “luxury”, 25 classified as “upper upscale” and six classified as “upscale”, as defined by Smith Travel Research (“STR”), a provider of hotel industry data.
15
The nature of the operations of the hotels exposes the hotels and the Company to the risk of claims and litigation in the normal course of their business. The Company is not presently subject to any material litigation nor, to the Company’s knowledge, is any litigation threatened against the Company, other than routine actions for negligence or other claims and administrative proceedings arising in the ordinary course of business, some of which are expected to be covered by liability insurance and all of which collectively are not expected to have a material adverse effect on the liquidity, results of operations, business or financial condition of the Company.
| Item 4. | Mine Safety Disclosures |
Not applicable.
PART II
| Item 5. | Market for Registrant’s Common Equity, Related Shareholder Matters and Issuer Purchases of Equity Securities |
Information about the Company’s equity compensation plans is incorporated by reference to the material in the Company’s Proxy Statement for the 2012 Annual Meeting of Shareholders (the “Proxy Statement”).
Market Information
The common shares of the Company began trading on the New York Stock Exchange (“NYSE”) on April 24, 1998 under the symbol “LHO.” The following table sets forth, for the periods indicated, the high and low sale prices per common share and the cash distributions declared per share:
| | | | | | | | | | | | | | | | | | | | | | | | |
| | | Calendar Year 2011 | | | Calendar Year 2010 | |
| | | High | | | Low | | | Distribution | | | High | | | Low | | | Distribution | |
First Quarter | | $ | 29.58 | | | $ | 25.05 | | | $ | 0.11 | | | $ | 23.75 | | | $ | 18.91 | | | $ | 0.01 | |
Second Quarter | | $ | 28.69 | | | $ | 23.98 | | | $ | 0.11 | | | $ | 28.22 | | | $ | 20.10 | | | $ | 0.01 | |
Third Quarter | | $ | 27.47 | | | $ | 15.17 | | | $ | 0.11 | | | $ | 24.65 | | | $ | 19.12 | | | $ | 0.11 | |
Fourth Quarter | | $ | 25.25 | | | $ | 17.22 | | | $ | 0.11 | | | $ | 26.92 | | | $ | 21.39 | | | $ | 0.11 | |
The closing price for the Company’s common shares, as reported by the NYSE on December 31, 2011, was $24.21 per share.
16
SHARE PERFORMANCE GRAPH
The following graph provides a comparison of the cumulative total return on the common shares from December 31, 2006 to the NYSE closing price per share on December 31, 2011 with the cumulative total return on the Standard & Poor’s 500 Composite Stock Price Index (the “S&P 500”) and the FTSE National Association of Real Estate Investment Trusts Equity REITs Index (“FTSE NAREIT Equity Index”). In 2007, the National Association of Real Estate Investment Trusts replaced the Total Return Index previously used by the Company in its Share Performance Graph with the FTSE NAREIT Equity Index. Total return values were calculated assuming a $100 investment on December 31, 2006 with reinvestment of all dividends in (i) the common shares, (ii) the S&P 500 and (iii) the FTSE NAREIT Equity Index.
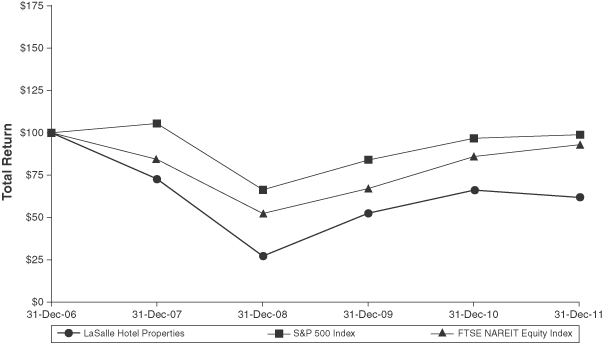
The actual returns on the graph above are as follows:
| | | | | | | | | | | | | | | | | | | | | | | | |
Name | | Initial
Investment at
December 31,
2006 | | | Value of
Initial
Investment at
December 31,
2007 | | | Value of
Initial
Investment at
December 31,
2008 | | | Value of
Initial
Investment at
December 31,
2009 | | | Value of
Initial
Investment at
December 31,
2010 | | | Value of
Initial
Investment at
December 31,
2011 | |
LaSalle Hotel Properties | | $ | 100.00 | | | $ | 72.92 | | | $ | 27.38 | | | $ | 52.78 | | | $ | 66.28 | | | $ | 61.92 | |
S&P 500 Index | | $ | 100.00 | | | $ | 105.49 | | | $ | 66.46 | | | $ | 84.05 | | | $ | 96.71 | | | $ | 98.76 | |
FTSE NAREIT Equity Index | | $ | 100.00 | | | $ | 84.31 | | | $ | 52.50 | | | $ | 67.20 | | | $ | 85.98 | | | $ | 93.10 | |
Shareholder Information
As of February 15, 2012, there were 103 record holders of the Company’s common shares of beneficial interest, including shares held in “street name” by nominees who are record holders, and approximately 15,600 beneficial holders.
17
Distribution Information
For 2011, the Company paid $0.44 per common share in distributions, of which $0.33 was recognized as 2011 distributions for tax purposes. Additionally, distributions of $0.0881 per common share for 2010 were recognized as 2011 distributions for tax purposes, bringing total 2011 distributions for tax purposes to $0.4182 per common share (rounded). Of the $0.4182, 27.33% represented ordinary income and 72.67% represented return of capital. Distributions for 2011 were paid quarterly to the Company’s common shareholders at a level of $0.11 per common share. Finally, distributions were paid to common unitholders at $0.11 per common unit for the fourth quarter of 2011.
For 2010, the Company paid $0.24 per common share in distributions, of which $0.1519 was recognized as 2010 distributions for tax purposes. Of the $0.1519, 100% represented ordinary income. These distributions were paid quarterly to the Company’s common shareholders at a level of $0.01 per common share for the first and second quarters of 2010 and $0.11 per common share for the third and fourth quarters of 2010.
The declaration of distributions by the Company is in the sole discretion of the Company’s Board of Trustees, and depends on the actual cash flow of the Company, its financial condition, capital expenditure requirements for the Company’s hotels, the annual distribution requirements under the REIT provisions of the Code and such other factors as the Board of Trustees deems relevant.
Operating Partnership Units and Recent Sales of Unregistered Securities
The Operating Partnership issued 3,181,723 common units of limited partnership interest to third parties on April 24, 1998 (inception), in conjunction with the Company’s initial public offering. The following is a summary of common unit activity since inception:
| | | | |
Common units issued at initial public offering | | | 3,181,723 | |
Common units issued: | | | | |
2000-2006 | | | 86,667 | |
2011 | | | 296,300 | |
Common units redeemed: | | | | |
1999-2008 | | | (3,198,390 | ) |
2009 | | | (70,000 | ) |
| | | | |
Common units outstanding at December 31, 2011 | | | 296,300 | |
| | | | |
Holders of common units of limited partnership interest receive distributions per unit in the same manner as distributions on a per common share basis to the common shareholders of beneficial interest.
Common shares issued upon redemption of common units of limited partnership interest were issued in reliance on an exemption from registration under Section 4(2) of the Securities Act. The Company relied on the exemption based on representations given by the limited partners that redeemed the units.
On December 29, 2011, in connection with the Company’s acquisition of Park Central Hotel and as part of the consideration for the hotel acquisition, the Operating Partnership issued 296,300 common units of limited partnership interest. The issuance of the common units was effected in reliance upon an exemption from registration provided by Section 4(2) under the Securities Act. The Company relied on the exemption based on representations given by the holders of the common units.
On November 17, 2006, in connection with the Company’s acquisition of Gild Hall and as part of the consideration for the hotel acquisition, the Operating Partnership issued 70,000 common units of limited
18
partnership interest and 1,098,348 Series F Preferred Units (liquidation preference $25.00 per unit) of limited partnership interest. During 2008, all 1,098,348 of the Series F Preferred Units were redeemed for 568,786 common shares of beneficial interest and a cash payment of $14.5 million. During 2009, all 70,000 common units and the Series F Preferred Units were redeemed for 69,500 common shares of beneficial interest and an insignificant amount of cash. The issuance of the common units and the Series F Preferred Units and the subsequent issuance of common shares upon the redemption of the common units were each effected in reliance upon an exemption from registration provided by Section 4(2) under the Securities Act. The Company relied on the exemption based on representations given by the holder of the common units and the Series F Preferred Units.
In August 2005, the Company acquired the Westin Copley Place in Boston, Massachusetts. As part of the consideration to acquire the hotel, the Operating Partnership issued 2,348,888 7 1/4% Series C Cumulative Redeemable Preferred Units (liquidation preference $25.00 per unit) of the Operating Partnership (the “Series C Preferred Units”). The Series C Preferred Units were redeemable for 7 1/4% Series C Cumulative Redeemable Preferred Shares of Beneficial Interest (liquidation preference $25.00 per share), $0.01 par value per share, of the Company (the “Series C Preferred Shares”) on a one-for-one basis. On February 1, 2009, each of the Series C Preferred Units was redeemed and the Company issued 2,348,888 Series C Preferred Shares. Prior to the exchange described below, the Series C Preferred Shares were held by SCG Hotel DLP, L.P. (“SCG”). On April 16, 2009, SCG exchanged its Series C Preferred Shares for an equal number of Series G Preferred Shares (liquidation preference $25.00 per share), $0.01 par value per share, of the Company in a private transaction. Each of the issuance of the Series C Preferred Shares and the exchange of the Series C Preferred Shares for Series G Preferred Shares was exempt from registration pursuant to Section 4(2) of the Securities Act. On April 17, 2009, the Company filed a registration statement with the SEC to register the resale of the Series G Preferred Shares. On May 13, 2009, in connection with the exchange, SCG paid the Company a fee of $1.0 million, which the Company recognized as income.
Issuer Purchases of Equity Securities
| | | | | | | | | | | | | | | | |
| | | Total Number
of Shares
Purchased(1) | | | Average
Price Paid
per Share | | | Total Number
of Shares
Purchased as
Part of
Publicly
Announced
Plans or
Programs | | | Approximate
Dollar Value
of Shares that
May Yet Be
Purchased
Under the
Plans or
Programs(2) | |
October 1, 2011 — October 31, 2011 | | | 337,718 | | | $ | 17.77 | | | | 337,718 | | | $ | 75,498,000 | |
November 1, 2011 — November 30, 2011 | | | — | | | | — | | | | — | | | $ | 75,498,000 | |
December 1, 2011 — December 31, 2011 | | | — | | | | — | | | | — | | | $ | 75,498,000 | |
| | | | | | | | | | | | | | | | |
Total | | | 337,718 | | | $ | 17.77 | | | | 337,718 | | | $ | 75,498,000 | |
| | | | | | | | | | | | | | | | |
| (1) | During the fourth quarter of 2011, the Company repurchased 337,718 common shares of beneficial interest under the Repurchase Program (as defined below). |
| (2) | On August 29, 2011, the Company announced its Board of Trustees had authorized a share repurchase program (the “Repurchase Program”) to acquire up to $100.0 million of the Company’s common shares of beneficial interest. The timing of the purchases and the exact number of shares to be purchased depend upon market conditions. The authorization did not include specific price targets or an expiration date. Since the time the Company ceased repurchasing activity on October 11, 2011 (the date of the Company’s last repurchase of common shares), the Company has had availability under the Repurchase Program to acquire up to $75.5 million of common shares of beneficial interest. However, the Company is not currently authorized by its Board of Trustees to repurchase or offer to repurchase any common shares. If authorized by its Board of Trustees, the Company may resume using the Repurchase Program on a future date. |
19
| Item 6. | Selected Financial Data |
The following tables set forth selected historical operating and financial data for the Company. The selected historical operating and financial data for the Company for the years ended December 31, 2011, 2010, 2009, 2008 and 2007 have been derived from the historical financial statements of the Company. The following selected financial information should be read in conjunction with “Management’s Discussion and Analysis of Financial Condition and Results of Operations” and all of the financial statements and notes thereto included elsewhere in this Annual Report on Form 10-K.
LASALLE HOTEL PROPERTIES
Selected Historical Operating and Financial Data
(Unaudited, in thousands, except share data)
| | | | | | | | | | | | | | | | | | | | |
| | | For the year ended December 31, | |
| | | 2011 | | | 2010 | | | 2009 | | | 2008 | | | 2007 | |
Operating Data: | | | | | | | | | | | | | | | | | | | | |
Revenues: | | | | | | | | | | | | | | | | | | | | |
Hotel operating revenues | | $ | 714,005 | | | $ | 594,642 | | | $ | 535,944 | | | $ | 587,449 | | | $ | 545,941 | |
Participating lease revenue | | | 0 | | | | 0 | | | | 0 | | | | 12,799 | | | | 27,193 | |
Other income | | | 5,002 | | | | 5,715 | | | | 6,702 | | | | 7,504 | | | | 5,421 | |
| | | | | | | | | | | | | | | | | | | | |
Total revenues | | | 719,007 | | | | 600,357 | | | | 542,646 | | | | 607,752 | | | | 578,555 | |
Expenses: | | | | | | | | | | | | | | | | | | | | |
Hotel operating expenses | | | 452,838 | | | | 380,459 | | | | 338,539 | | | | 366,518 | | | | 338,758 | |
Depreciation and amortization | | | 111,282 | | | | 105,587 | | | | 102,856 | | | | 99,365 | | | �� | 85,234 | |
Real estate taxes, personal property taxes and insurance | | | 35,425 | | | | 30,897 | | | | 29,460 | | | | 31,664 | | | | 29,478 | |
Ground rent | | | 7,720 | | | | 5,825 | | | | 5,706 | | | | 7,091 | | | | 6,838 | |
General and administrative | | | 17,120 | | | | 18,802 | | | | 15,033 | | | | 17,361 | | | | 13,425 | |
Lease termination expense | | | 0 | | | | 0 | | | | 0 | | | | 4,296 | | | | 0 | |
Acquisition transaction costs | | | 2,571 | | | | 3,003 | | | | 0 | | | | 0 | | | | 0 | |
Impairment of development property | | | 0 | | | | 8,427 | | | | 0 | | | | 0 | | | | 0 | |
Other expenses | | | 2,527 | | | | 3,287 | | | | 3,016 | | | | 3,504 | | | | 2,966 | |
| | | | | | | | | | | | | | | | | | | | |
Total operating expenses | | | 629,483 | | | | 556,287 | | | | 494,610 | | | | 529,799 | | | | 476,699 | |
Operating income | | | 89,524 | | | | 44,070 | | | | 48,036 | | | | 77,953 | | | | 101,856 | |
Interest income | | | 48 | | | | 126 | | | | 63 | | | | 159 | | | | 1,386 | |
Interest expense | | | (39,704 | ) | | | (36,500 | ) | | | (37,951 | ) | | | (48,207 | ) | | | (46,279 | ) |
| | | | | | | | | | | | | | | | | | | | |
Income before income tax (expense) benefit, equity in earnings of joint venture and discontinued operations | | | 49,868 | | | | 7,696 | | | | 10,148 | | | | 29,905 | | | | 56,963 | |
Income tax (expense) benefit | | | (7,048 | ) | | | (5,075 | ) | | | (4,590 | ) | | | 1,017 | | | | (1,719 | ) |
Equity in earnings of joint venture | | | 0 | | | | 0 | | | | 0 | | | | 0 | | | | 27 | |
| | | | | | | | | | | | | | | | | | | | |
Income from continuing operations | | | 42,820 | | | | 2,621 | | | | 5,558 | | | | 30,922 | | | | 55,271 | |
Net income (loss) from discontinued operations | | | 796 | | | | (851 | ) | | | 2,412 | | | | 7,444 | | | | 40,853 | |
| | | | | | | | | | | | | | | | | | | | |
Net income | | | 43,616 | | | | 1,770 | | | | 7,970 | | | | 38,366 | | | | 96,124 | |
| | | | | | | | | | | | | | | | | | | | |
Noncontrolling interests: | | | | | | | | | | | | | | | | | | | | |
Redeemable noncontrolling interest in loss of consolidated entity | | | 2 | | | | 191 | | | | 30 | | | | 39 | | | | 0 | |
Noncontrolling interest of common units in Operating Partnership | | | (1 | ) | | | 0 | | | | (15 | ) | | | (100 | ) | | | (249 | ) |
Noncontrolling interest of preferred units in Operating Partnership | | | 0 | | | | 0 | | | | (367 | ) | | | (5,178 | ) | | | (6,120 | ) |
| | | | | | | | | | | | | | | | | | | | |
Net income (loss) attributable to noncontrolling interests | | | 1 | | | | 191 | | | | (352 | ) | | | (5,239 | ) | | | (6,369 | ) |
| | | | | | | | | | | | | | | | | | | | |
Net income attributable to the Company | | | 43,617 | | | | 1,961 | | | | 7,618 | | | | 33,127 | | | | 89,755 | |
Distributions to preferred shareholders | | | (29,952 | ) | | | (26,754 | ) | | | (26,388 | ) | | | (22,497 | ) | | | (24,344 | ) |
Issuance costs of redeemed preferred shares | | | (731 | ) | | | 0 | | | | 0 | | | | 0 | | | | (3,868 | ) |
| | | | | | | | | | | | | | | | | | | | |
Net income (loss) attributable to common shareholders | | $ | 12,934 | | | $ | (24,793 | ) | | $ | (18,770 | ) | | $ | 10,630 | | | $ | 61,543 | |
| | | | | | | | | | | | | | | | | | | | |
20
LASALLE HOTEL PROPERTIES
Selected Historical Operating and Financial Data
(Unaudited, in thousands, except share data)
| | | | | | | | | | | | | | | | | | | | |
| | | For the year ended December 31, | |
| | | 2011 | | | 2010 | | | 2009 | | | 2008 | | | 2007 | |
Earnings per Common Share: | | | | | | | | | | | | | | | | | | | | |
Net income (loss) attributable to common shareholders before discontinued operations and excluding amounts attributable to unvested restricted shares: | | | | | | | | | | | | | | | | | | | | |
Basic | | $ | 0.15 | | | $ | (0.35 | ) | | $ | (0.39 | ) | | $ | 0.06 | | | $ | 0.51 | |
| | | | | | | | | | | | | | | | | | | | |
Diluted | | $ | 0.15 | | | $ | (0.35 | ) | | $ | (0.39 | ) | | $ | 0.06 | | | $ | 0.50 | |
| | | | | | | | | | | | | | | | | | | | |
Net income (loss) attributable to common shareholders excluding amounts attributable to unvested restricted shares: | | | | | | | | | | | | | | | | | | | | |
Basic | | $ | 0.16 | | | $ | (0.36 | ) | | $ | (0.34 | ) | | $ | 0.25 | | | $ | 1.53 | |
| | | | | | | | | | | | | | | | | | | | |
Diluted | | $ | 0.16 | | | $ | (0.36 | ) | | $ | (0.34 | ) | | $ | 0.25 | | | $ | 1.52 | |
| | | | | | | | | | | | | | | | | | | | |
Weighted average number of common shares outstanding: | | | | | | | | | | | | | | | | | | | | |
Basic | | | 81,155,228 | | | | 69,549,441 | | | | 54,477,414 | | | | 40,158,745 | | | | 39,852,182 | |
Diluted | | | 81,326,304 | | | | 69,549,441 | | | | 54,477,414 | | | | 40,257,970 | | | | 40,045,509 | |
| | | | | |
Balance Sheet Data: | | | | | | | | | | | | | | | | | | | | |
Investment in hotel properties, net | | $ | 2,712,174 | | | $ | 2,229,362 | | | $ | 1,882,502 | | | $ | 1,967,255 | | | $ | 1,885,423 | |
Total assets | | | 2,833,275 | | | | 2,355,045 | | | | 2,023,563 | | | | 2,131,470 | | | | 2,111,320 | |
Borrowings under credit facilities | | | 265,000 | | | | 120,193 | | | | 6,259 | | | | 234,505 | | | | 70,416 | |
Bonds payable | | | 42,500 | | | | 42,500 | | | | 42,500 | | | | 42,500 | | | | 42,500 | |
Mortgage loans, including unamortized loan premiums | | | 643,897 | | | | 646,207 | | | | 595,389 | | | | 685,686 | | | | 762,904 | |
Redeemable noncontrolling interest in consolidated entity | | | 0 | | | | 49 | | | | 2,739 | | | | 2,769 | | | | 0 | |
Noncontrolling interests in consolidated entity | | | 17 | | | | 33 | | | | 48 | | | | 64 | | | | 0 | |
Noncontrolling interests of common units in Operating Partnership. | | | 5,613 | | | | 0 | | | | 0 | | | | 668 | | | | 747 | |
Noncontrolling interest of preferred units in Operating Partnership | | | 0 | | | | 0 | | | | 0 | | | | 59,739 | | | | 87,652 | |
Preferred shares, liquidation preference | | | 394,222 | | | | 352,972 | | | | 352,972 | | | | 294,250 | | | | 294,250 | |
Total shareholders’ equity | | | 1,765,613 | | | | 1,443,467 | | | | 1,296,187 | | | | 993,672 | | | | 1,038,136 | |
| | | | | |
Other Data: | | | | | | | | | | | | | | | | | | | | |
Funds from operations(1) | | $ | 123,251 | | | $ | 92,484 | | | $ | 90,825 | | | $ | 117,129 | | | $ | 123,442 | |
Earnings before interest, taxes, depreciation and amortization(1) | | | 200,952 | | | | 152,374 | | | | 160,079 | | | | 192,011 | | | | 237,808 | |
Cash provided by operating activities | | | 165,495 | | | | 131,572 | | | | 112,058 | | | | 159,347 | | | | 168,228 | |
Cash used in investing activities | | | (569,936 | ) | | | (371,517 | ) | | | (31,634 | ) | | | (137,076 | ) | | | (60,709 | ) |
Cash provided by (used in) financing activities | | | 411,666 | | | | 244,504 | | | | (90,039 | ) | | | (30,265 | ) | | | (144,495 | ) |
Cash dividends declared per common share | | $ | 0.44 | | | $ | 0.24 | | | $ | 0.04 | | | $ | 1.80 | | | $ | 1.95 | |
| | (1) | See “Non-GAAP Financial Measures” below in Item 7. Management’s Discussion and Analysis of Financial Condition and Results of Operations for a detailed description and reconciliation of funds from operations and earnings before interest, taxes, depreciation and amortization to net income applicable to common shareholders. |
21
| Item 7. | Management’s Discussion and Analysis of Financial Condition and Results of Operations |
Overview
There were a number of positive economic indicators in the United States economy in 2011, including strong corporate profits, moderate improvements in consumer spending and a declining unemployment rate. GDP improved in each quarter of 2011 with progressively stronger growth throughout the year. The lodging industry benefited from these economic indicators. As such, 2011 U.S. lodging industry RevPAR increased 8.2%, due to an increase in demand of 5.0%, which was slightly offset by a 0.6% increase in supply. U.S. lodging industry average rate improved 3.7%, marking the first year of the lodging industry recovery with rate improvement. As a result, RevPAR at the Company’s hotels increased. During 2011, the Company’s funds from operations (“FFO”) per diluted share and earnings before interest, taxes, depreciation and amortization (“EBITDA”) increased as compared to 2010 due mainly to improvements in the performance of its portfolio.
For 2011, the Company had net income applicable to common shareholders of $12.9 million, or $0.16 per diluted share. FFO was $123.3 million, or $1.52 per diluted share/unit (based on 81,328,739 weighted average shares and units outstanding during the year ended December 31, 2011) and EBITDA was $201.0 million. RevPAR in 2011 was $147.69. The Company considers RevPAR and EBITDA to be key measures of the performance of the individual hotels. RevPAR for the total portfolio increased 6.2% for 2011. The RevPAR increase is attributable to a 5.1% increase in ADR to $193.27 and 1.1% growth in occupancy to 76.4%. During 2011, the Company continued to implement measures that result in efficient hotel operations.
Hotel operations depend on the state of the overall economy which can significantly impact hotel operational performance and thus, impact the Company’s financial position. Should any of the hotels experience a significant decline in operational performance, it may affect the Company’s ability to make distributions to its shareholders, service debt or meet other financial obligations.
The Company measures hotel performance by evaluating financial metrics such as RevPAR, FFO and EBITDA. The Company evaluates the hotels in its portfolio and potential acquisitions using these metrics discussed above to determine each portfolio hotel’s contribution or acquisition hotel’s potential contribution toward reaching the Company’s goals of providing income to its shareholders through increases in distributable cash flow and increasing long-term total returns to shareholders through appreciation in the value of its common shares. The Company invests in capital improvements throughout the portfolio to continue to increase the competitiveness of its hotels and improve their financial performance. The Company actively seeks to acquire hotel properties, but continues to face significant competition for acquisitions that meet its investment criteria.
Please refer to “Non-GAAP Financial Measures” below for a detailed discussion of the Company’s use of FFO and EBITDA and a reconciliation of FFO and EBITDA to net income, a U.S. generally accepted accounting principles (“GAAP”) measurement.
Critical Accounting Policies
The consolidated financial statements include the accounts of the Company, the Operating Partnership, LHL and their subsidiaries in which they have a controlling interest, including joint ventures. All significant intercompany balances and transactions have been eliminated.
The preparation of the consolidated financial statements in conformity with GAAP requires management to make estimates and assumptions that affect the reported amounts of certain assets and liabilities and the amounts
22
of contingent assets and liabilities at the balance sheet date and the reported amounts of revenues and expenses during the reporting periods. In preparing these financial statements, management has used the information available including the Company’s past history, industry standards and the current economic environment, among other factors, in forming its estimates and judgments of certain amounts included in the consolidated financial statements.
It is possible that the ultimate outcome as anticipated by management in formulating its estimates inherent in these financial statements might not materialize. However, application of the critical accounting policies below involves the exercise of judgment and use of assumptions as to future uncertainties and, as a result, actual results could differ from those estimates. In addition, other companies may determine these estimates differently, which may impact comparability of the Company’s results of operations to those of companies in similar businesses.
Valuation of Deferred Tax Assets
As of December 31, 2011, the Company had deferred tax assets of $5.3 million primarily due to past years’ federal and state tax net operating losses of LHL. Management believes that it is more likely than not that the results of future operations will generate sufficient taxable income to realize the deferred tax asset related to federal loss carryforwards prior to the expiration of the loss carryforwards and has determined that no valuation allowance is required. The Company analyzes state loss carryforwards on a state by state basis and records a valuation allowance when management deems it more likely than not that future results will not generate sufficient taxable income in the respective state to realize the deferred tax asset prior to the expiration of the loss carryforwards.
Revenue Recognition
The Company recognizes hotel operating revenues on an accrual basis consistent with hotel operations. For retail operations, revenue is recognized on a straight line basis over the lives of the retail leases. Revenue from retail operations is included in other income in the consolidated statements of operations. Base and participating rent are each recognized based on quarterly thresholds pursuant to each participating lease.
Investment in Hotel Properties
Upon acquisition, the Company allocates the purchase price to asset classes based on the fair value of the acquired real estate, furniture, fixtures and equipment, assumed debt and any intangible assets or liabilities. The Company’s investments in hotel properties are carried at cost and depreciated using the straight-line method over an estimated useful life of 30 to 40 years for buildings, 15 years for building improvements, the shorter of the useful life of the improvement or the term of the related tenant lease for tenant improvements, 7 years for land improvements, 20 years for golf course land improvements, 20 years for swimming pool assets and 3 to 5 years for furniture, fixtures and equipment. For investments subject to ground or land and building leases, assets are recorded at the estimated fair value of the right to use the leased property at acquisition and depreciated over the shorter of the useful lives of the assets or the term of the respective lease. Renovations and/or replacements that improve or extend the life of the asset are capitalized and depreciated over their estimated useful lives.
The Company is required to make subjective assessments as to the useful lives and classification of its properties for purposes of determining the amount of depreciation expense to reflect each year with respect to those properties. These assessments have a direct impact on the Company’s net income. Should the Company change the expected useful life or classification of particular assets, it would result in a change in depreciation expense and annual net income.
23
The Company reviews each hotel for impairment at the end of each reporting period or as events and circumstances dictate throughout the year. A property is considered impaired when the sum of estimated future undiscounted cash flows over the estimated remaining holding period is less than the carrying amount of a property.
At the end of each reporting period, the Company assesses whether any quantitative or qualitative triggering events have occurred in relation to a property. Examples of situations considered to be triggering events include:
| | • | | a substantial decline in operating cash flows during the period, including declines related to decreased occupancy, ADR or RevPAR; |
| | • | | a current or projected loss from operations; |
| | • | | a significant cost accumulation above the original acquisition/development estimate; |
| | • | | a change in plan to sell the property prior to the end of its useful life or holding period; |
| | • | | a significant decrease in market price not in line with general market trends; and |
| | • | | any other quantitative or qualitative events deemed significant by our management or our Board of Trustees. |
If the presence of one or more triggering events as described above is identified at the end of a reporting period or throughout the year with respect to a hotel, the Company performs a recoverability test. In doing so, an estimate of undiscounted future cash flows over the estimated remaining holding period is compared to the carrying amount of the hotel.
If the results of a recoverability analysis indicate that the carrying amount of a hotel exceeds the estimated future undiscounted cash flows, impairment is indicated. Upon presentation to, discussion with, and approval from the Board of Trustees, an impairment charge is recorded equal to the excess of the carrying value of the hotel over the fair value. When performing a recoverability test or estimating the fair value of a property, the Company makes certain assumptions including, but not limited to, consideration of:
| | • | | projected operating cash flows – considering factors such as booking pace, growth rates, occupancy, room rates, property-specific operating costs and future capital expenditures; |
| | • | | projected cash flows from the eventual disposition of the hotel based upon our estimation of a property-specific capitalization rate; |
| | • | | property-specific discount rates; and |
| | • | | comparable selling prices. |
In accordance with GAAP guidance, the Company considers a hotel as held for sale when a contract for sale is entered into, a substantial non-refundable deposit has been received from the purchaser and sale is expected to occur within one year.
Share-Based Compensation
From time to time, the Company awards nonvested shares under the 2009 Equity Incentive Plan (“2009 Plan”) as compensation to officers, employees and non-employee trustees. The shares vest over three to nine years. The Company recognizes compensation expense for nonvested shares on a straight-line basis over the vesting period based upon the fair market value of the shares on the date of issuance, adjusted for forfeitures.
24
Comparison of the Year Ended December 31, 2011 to the Year Ended December 31, 2010
The U.S. lodging industry operated in an improving environment during 2011 as the U.S. economy continued to recover. On a year-over-year basis, overall industry demand increased 5.0%, while supply grew 0.6%. This resulted in an occupancy increase of 5.0%, while ADR improved 3.7%. Corporate demand continued to recover during the year, which was reflected in both the transient and group segments. Leisure demand also improved and both segments reflected increased pricing power due to the higher demand levels. As such, lodging industry RevPAR grew by 8.2%. The urban segment, as reported by STR, also posted a RevPAR increase of 8.2%, in line with the overall industry. Hotel occupancy, ADR, operating revenues and operating expenses for the Company’s portfolio were positively impacted by the overall industry performance.
Hotel Operating Revenues
Hotel operating revenues including room, food and beverage and other operating department revenues increased $119.4 million from $594.6 million in 2010 to $714.0 million in 2011. This increase is due primarily to the hotel operating revenues generated from the 2011 and 2010 hotel acquisitions, which consist of the 2011 acquisitions of the Viceroy Santa Monica, Villa Florence and Park Central Hotel, and the 2010 acquisitions, which consist of Sofitel Washington, DC Lafayette Square, Westin Philadelphia, Embassy Suites Philadelphia – Center City, Hotel Monaco San Francisco, Hotel Roger Williams and Chamberlain West Hollywood (collectively, the “2011/2010 Acquisition Properties”). The 2011/2010 Acquisition Properties, which are not comparable year-over-year, contributed $91.8 million to the increase in hotel operating revenues. Additionally, the effects of the economic recovery that began in mid-2010, which resulted in a 6.2% increase in RevPAR across the portfolio, attributable to a 5.1% increase in ADR and a 1.1% increase in occupancy, contributed to the increase in hotel operating revenues.
The following hotels experienced significant increases in total room, food and beverage and other operating department revenues primarily as a result of the effects of the economic turnaround that began in mid-2010:
| | • | | $7.1 million increase from San Diego Paradise Point Resort and Spa; |
| | • | | $4.2 million increase from Westin Copley Place; |
| | • | | $3.8 million increase from Westin Michigan Avenue; |
| | • | | $2.5 million increase from The Liaison Capitol Hill; |
| | • | | $2.1 million increase from The Hilton San Diego Resort and Spa; and |
| | • | | $1.9 million increase from Hotel Solamar. |
These increases are partially offset by a decrease of $2.6 million from Indianapolis Marriott Downtown due primarily to new hotel room supply.
Hotel operating revenues increased a net $8.6 million across 21 additional hotels in the portfolio primarily as a result of the effects of the economic turnaround experienced throughout the portfolio.
Other Income
Other income decreased $0.7 million from $5.7 million in 2010 to $5.0 million in 2011. This decrease is primarily due to lower gains from insurance proceeds recognized in the 2011 period.
Hotel Operating Expenses
Hotel operating expenses increased $72.3 million from $380.5 million in 2010 to $452.8 million in 2011. This overall increase is primarily due to $54.7 million from the results of the 2011/2010 Acquisition Properties,
25
which are not comparable year-over-year. To a lesser extent, the increase is a result of the effects of increased operating costs associated with higher occupancies across the portfolio attributable to the economic recovery.
The following hotels experienced significant increases in total room, food and beverage, other direct and other indirect expenses primarily as a result of increased occupancies at the hotels:
| | • | | $3.4 million increase from San Diego Paradise Point Resort and Spa; |
| | • | | $2.1 million increase from Westin Copley Place; |
| | • | | $1.7 million increase from Westin Michigan Avenue; |
| | • | | $1.5 million increase from The Hilton San Diego Resort and Spa; and |
| | • | | $1.0 million increase from The Liaison Capitol Hill. |
These increases are partially offset by a decrease of $1.0 million from Indianapolis Marriott Downtown due to decreased occupancy resulting primarily from new hotel room supply.
Hotel operating expenses increased a net $8.9 million across 22 additional hotels in the portfolio due primarily to the effects of the increased operating costs associated with higher occupancies throughout the portfolio.
Depreciation and Amortization
Depreciation and amortization expense increased $5.7 million from $105.6 million in 2010 to $111.3 million in 2011. The increase is primarily due to $12.5 million from the 2011/2010 Acquisition Properties, which are not comparable year-over-year, partially offset by a net decrease of $6.8 million across the remaining hotels in the portfolio due to a portion of the furniture, fixtures and equipment becoming fully depreciated.
Real Estate Taxes, Personal Property Taxes and Insurance
Real estate taxes, personal property taxes and insurance expenses increased $4.5 million from $30.9 million in 2010 to $35.4 million in 2011. This increase is primarily due to $4.6 million from the 2011/2010 Acquisition Properties, which are not comparable year-over-year, partially offset by a net decrease in real estate taxes and personal property taxes of $0.1 million across the remaining hotels in the portfolio resulting primarily from decreased assessed property values or tax rates at certain properties, particularly in Washington, DC and San Diego, and real estate taxes capitalized as part of renovations, partially offset by higher real estate tax expense incurred in Chicago. Insurance expense remained flat across the periods for the remaining hotels in the portfolio.
Ground Rent
Ground rent increased by approximately $1.9 million from $5.8 million in 2010 to $7.7 million in 2011. Certain hotels are subject to ground rent under operating leases which call for either fixed or variable payments based on the hotel’s performance. Viceroy Santa Monica, which is not comparable year-over-year, contributed $1.2 million to the 2011 increase. The other hotels subject to ground leases contributed a net $0.7 million to the increase due to improved operating results.
General and Administrative
General and administrative expense decreased $1.7 million from $18.8 million in 2010 to $17.1 million in 2011. Charges associated with the departure of the Company’s former Chief Financial Officer totaled $2.6
26
million in 2010 and $0.6 million in 2011, a decrease of $2.0 million in 2011. The remaining increase of $0.3 million is primarily due to higher professional fees, slightly offset by lower costs incurred related to pursuing potential acquisitions.
Acquisition Transaction Costs
Acquisition transaction costs of $2.6 million in 2011 and $3.0 million in 2010 relate to the purchase of the 2011/2010 Acquisition Properties.
Impairment of Development Property
During the fourth quarter of 2010, the Company entered into a contract to sell its interest in the development property located at 330 N. Wabash Avenue in downtown Chicago upon receiving a nonrefundable deposit. Upon receipt of the deposit, the property was determined to be held for sale and the Company recorded an $8.4 million impairment charge, which includes a $2.7 million termination fee paid to the development manager. The sale of the property closed on December 29, 2010.
Other Expenses
Other expenses decreased $0.8 million from $3.3 million in 2010 to $2.5 million in 2011 primarily due to decreased retail lease expenses and losses from property damage, which were largely covered by insurance proceeds.
Interest Income
Interest income decreased from approximately $0.1 million 2010 to an immaterial amount in 2011.
Interest Expense
Interest expense increased $3.2 million from $36.5 million in 2010 to $39.7 million in 2011 due to an increase in the Company’s weighted average debt outstanding and an increase in the weighted average interest rate, partly offset by an increase in capitalized interest. The Company’s weighted average debt outstanding related to continuing operations increased from $702.0 million in 2010 to $716.7 million in 2011 due primarily to the following borrowings:
| | • | | additional borrowings to purchase the 2011/2010 Acquisition Properties; |
| | • | | assumption of the mortgage loan on the Hotel Roger Williams in October 2010; and |
| | • | | additional borrowings to finance other capital improvements during 2010 and 2011. |
The above borrowings are partially offset by paydowns with proceeds from the following:
| | • | | the March 2010 common share offering; |
| | • | | the sale of the Seaview Resort in September 2010; |
| | • | | the sale of the Westin City Center Dallas in September 2010; |
| | • | | the sale of the interest in the 330 N. Wabash Avenue property held through the Modern Magic Hotel, LLC joint venture in December 2010; |
| | • | | the sale of the Sheraton Bloomington Hotel Minneapolis South in January 2011; |
| | • | | the January and February 2011 issuances of the Series H Preferred Shares, net of the March 2011 redemption of the 8 3/8% Series B Cumulative Redeemable Preferred Shares (the “Series B Preferred Shares”); |
| | • | | the April 2011 common share offering, net of the August through October 2011 repurchase of common shares under the Repurchase Program; |
27
| | • | | the issuance of common shares under the Company’s equity distribution agreements during 2010 and 2011; and |
The Company’s weighted average interest rate, including the impact of capitalized interest, increased from 4.9% in 2010 to 5.2% in 2011. Capitalized interest increased from $0.2 million in 2010 to $0.5 million in 2011 primarily due to increased renovation activity during the 2011 period.
Income Tax Expense
Income tax expense from continuing operations and discontinued operations increased $3.7 million from $3.4 million in 2010 to $7.1 million in 2011. This increased income tax expense is primarily the result of the increase in LHL’s net income before income tax expense of $4.2 million from $10.6 million in 2010 to $14.8 million in 2011 due to improved hotel performance and an increase in state and local income taxes on the Operating Partnership and affiliated entities, which are subject to minimum state and local income taxes in applicable jurisdictions. For the year ended December 31, 2011, LHL’s income tax expense was calculated using an estimated combined federal and state annual effective tax rate of 41.3%.
Discontinued Operations
Net income (loss) from discontinued operations increased $1.7 million from a net loss of $0.9 million in 2010 to net income of $0.8 million in 2011. Net income (loss) from discontinued operations reflects the operating results of the Seaview Resort and Westin City Center Dallas, which were sold in September 2010, and the Sheraton Bloomington Hotel Minneapolis South, which was sold in January 2011. The 2010 period includes gain on sale of Westin City Center Dallas of $29.2 million, partially offered by losses on impairment of $24.5 million and $3.2 million for Seaview Resort and Sheraton Bloomington Hotel Minneapolis South, respectively, and the 2011 period includes gain on finalization of the Seaview Resort roof project of $0.8 million.
Redeemable Noncontrolling Interest
Redeemable noncontrolling interest in loss of consolidated entity represents the outside equity interest in the Modern Magic Hotel, LLC joint venture, which is included in the consolidated financial statements of the Company since the Company held a controlling interest prior to dissolution on November 1, 2011.
Noncontrolling Interests of Common Units
Noncontrolling interests of common units in Operating Partnership represents the allocation of income or loss of the Operating Partnership to the common units held by third parties based on their weighted average percentage ownership throughout the period. At December 31, 2011, third party limited partners held 0.4% of the common units of the Operating Partnership.
Distributions to Preferred Shareholders
Distributions to preferred shareholders increased $3.2 million from $26.8 million in 2010 to $30.0 million in 2011 due to distributions on the Series H Preferred Shares, which were issued on January 19 and February 4, 2011, partially offset by decreased distributions on the Series B Preferred Shares, which were redeemed on March 14, 2011.
Issuance Costs of Redeemed Preferred Shares
Issuance costs of redeemed preferred shares of $0.7 million in 2011 represent the offering costs related to the Series B Preferred shares, which were redeemed on March 14, 2011. The excess of fair value over carrying value (i.e. offering costs) is included in the determination of net income attributable to common shareholders.
28
Comparison of the Year Ended December 31, 2010 to the Year Ended December 31, 2009
The U.S. lodging industry operated in an improving environment during 2010 as the U.S. economy began to recover. On a year-over-year basis, overall industry demand increased 7.7%, while supply grew 2.0%. This resulted in an occupancy increase of 5.7%, while ADR decreased 0.1%. Corporate demand began to recover during the year, which was reflected in both the transient and group segments. Leisure demand also began to improve and was less dependent on the deep discounting that was required in the prior year. As such, lodging industry RevPAR grew by 5.5%. The urban segment, as reported by STR, posted a RevPAR increase of 8.8%, outperforming the overall industry as was the case in previous years of recovery. The upper upscale segment, as reported by STR, performed slightly better than the overall lodging industry, with a RevPAR improvement of 5.7%. Hotel occupancy, ADR, operating revenues and operating expenses for the Company’s portfolio were positively impacted by the overall industry performance. However, this impact was somewhat offset by the Company’s concentration of hotels in Washington, DC, which benefitted from the 2009 inauguration, creating a difficult comparison for 2010. Additionally, the Company’s RevPAR was impacted by the performance of its resorts, which haven’t recovered as quickly as its urban or convention segments.
Hotel Operating Revenues
Hotel operating revenues including room, food and beverage and other operating department revenues increased $58.7 million from $535.9 million in 2009 to $594.6 million in 2010. This increase is due primarily to the hotel operating revenues generated from the 2010 hotel acquisitions which consist of Sofitel Washington, DC Lafayette Square, Westin Philadelphia, Embassy Suites Philadelphia – Center City, Hotel Monaco San Francisco, Hotel Roger Williams and Chamberlain West Hollywood (the “2010 Acquisition Properties”). The 2010 Acquisition Properties, which are not comparable year-over-year, contributed $46.1 million to the increase in hotel operating revenues. Additionally the effects of the beginning of an economic recovery in mid 2010 which resulted in a 2.5% increase in RevPAR, attributable to a 1.2% increase in ADR across the portfolio and a 1.2% increase in occupancy across the portfolio contributed to the increase in hotel operating revenue, partially offset by the lingering effects of the economic downturn in the first quarter of 2010.
The following hotels experienced significant increases in total room, food and beverage and other operating department revenues primarily as a result of the effects of the beginning of the economic turnaround in mid 2010:
| | • | | $2.3 million increase from Donovan House; |
| | • | | $1.6 million increase from Westin Copley Place; and |
| | • | | $1.6 million increase from The Liaison Capitol Hill. |
These increases are partially offset by the following significant decreases from the effects of the recent economic downturn primarily in the first quarter of 2010:
| | • | | $2.2 million decrease from Lansdowne Resort; and |
| | • | | $2.0 million decrease from The Hilton San Diego Resort and Spa. |
Hotel operating revenues increased a net $11.3 million across 24 additional hotels in the portfolio primarily as a result of the beginning of an economic turnaround, particularly in the Washington, DC, Boston, West Hollywood, Chicago and New York markets.
Other Income
Other income decreased $1.0 million from $6.7 million in 2009 to $5.7 million in 2010. This decrease is primarily due to $1.0 million recognized in 2009 from the fee received related to the exchange of the Series C Preferred Shares for Series G Preferred Shares. Other decreases, primarily in retail lease income, were offset by gains from insurance proceeds recognized in the 2010 period.
29
Hotel Operating Expenses
Hotel operating expenses increased $42.0 million from $338.5 million in 2009 to $380.5 million in 2010. This overall increase is due primarily to the hotel operating expenses incurred by the 2010 Acquisition Properties, which are not comparable year-over-year, and which contributed $29.0 million to the increase in hotel operating expenses. To a lesser extent the increase is a result of the increased operating revenues and occupancies across the portfolio attributable to the economic recovery.
The following hotels experienced significant increases in total room, food and beverage, other direct and other indirect expenses primarily as a result of increased occupancies at the hotels:
| | • | | $2.4 million increase from Westin Copley Place; |
| | • | | $2.2 million increase from San Diego Paradise Point Resort and Spa; |
| | • | | $1.8 million increase from Donovan House; and |
| | • | | $1.3 million increase from The Liaison Capitol Hill. |
Hotel operating expenses increased a net $5.3 million across 25 additional hotels in the portfolio due primarily to the effects of increased operating costs associated with higher occupancy.
Depreciation and Amortization
Depreciation and amortization expense increased $2.7 million from $102.9 million in 2009 to $105.6 million in 2010. The increase is primarily due to depreciation on building and furniture, fixtures and equipment for the 2010 Acquisition Properties, partially offset by a portion of the furniture, fixtures and equipment across the hotel portfolio becoming fully depreciated.
Real Estate Taxes, Personal Property Taxes and Insurance
Real estate taxes, personal property taxes, and insurance expenses increased $1.4 million from $29.5 million in 2009 to $30.9 million in 2010. The 2010 Acquisition Properties contributed $2.2 million to this increase. The remainder of the increase is primarily due to the following:
| | • | | $1.0 million increase in real estate taxes in the 2010 period at Indianapolis Marriott Downtown due to decreases in assessed property values for 2009 and prior years reflected in the 2009 period; and |
| | • | | $0.4 million increase in real estate taxes in the 2010 period at Hotel Sax due to decreases in assessed property values for 2009 and prior years reflected in the 2009 period. |
The above increases are partially offset by decreases, particularly at four properties located in Washington, DC, Chicago and New York totaling $2.2 million which are due to decreases in the assessed property values for 2010, reflected in the 2010 period. Insurance expense remained flat across the periods.
Ground Rent
Ground rent increased by $0.1 million from $5.7 million in 2009 to $5.8 million in 2010. Certain hotels are subject to ground rent under operating leases which call for either fixed or variable payments based on the hotel’s performance. The performance of these hotels was comparable year-over-year.
General and Administrative
General and administrative expense increased $3.8 million from $15.0 million in 2009 to $18.8 million in 2010 primarily as a result of a $2.6 million charge associated with the departure of the Company’s former Chief Financial Officer and to a lesser extent, the reversal of non-cash equity compensation related to restricted stock forfeitures in the 2009 period.
30
Acquisition Transaction Costs
Acquisition transaction costs of $3.0 million in 2010 relate to the purchase of the 2010 Acquisition Properties. GAAP guidance requires that acquisition-related costs be expensed when incurred rather than capitalized.
Impairment of Development Property
During the fourth quarter of 2010, the Company entered into a contract to sell its interest in the development property located at 330 N. Wabash Avenue in downtown Chicago upon receiving a nonrefundable deposit. Upon receipt of the deposit, the property was determined to be held for sale and the Company recorded an $8.4 million impairment charge, which includes a $2.7 million termination fee paid to the development manager. The sale of the property closed on December 29, 2010.
Other Expenses
Other expenses increased $0.3 million from $3.0 million in 2009 to $3.3 million in 2010 primarily due to an increase in expenses related to the repositioning of certain hotels.
Interest Income
Interest income increased slightly from 2009 to 2010 with an immaterial amount earned in both periods.
Interest Expense
Interest expense decreased $1.5 million from $38.0 million in 2009 to $36.5 million in 2010 due to a decrease in the Company’s weighted average debt outstanding, partly offset by an increase in the weighted average interest rate and a decrease in capitalized interest. The Company’s weighted average debt outstanding decreased from $790.3 million in 2009 to $702.0 million in 2010, due primarily to paydowns on outstanding debt with proceeds from:
| | • | | the April 2009, June 2009 and March 2010 common share offerings; |
| | • | | the issuance of common shares under the Company’s equity distribution agreements during August 2010; |
| | • | | the sale of the Seaview Resort in September 2010; |
| | • | | the sale of the Westin City Center Dallas in September 2010; |
| | • | | the sale of the interest in the 330 N. Wabash Avenue property held through the Modern Magic Hotel, LLC joint venture in December 2010; and |
The above paydowns are offset by the following, which caused total debt outstanding to be higher at December 31, 2010 than at December 31, 2009:
| | • | | additional borrowings to purchase the 2010 Acquisition Properties; |
| | • | | assumption of the mortgage loan on the Hotel Roger Williams in October 2010; and |
| | • | | additional borrowings to finance other capital improvements during 2009 and 2010. |
The Company’s weighted average interest rate, including the impact of capitalized interest, increased from 4.5% in 2009 to 4.9% in 2010. Capitalized interest decreased from $0.7 million in 2009 to $0.2 million in 2010, primarily due to the temporary suspension of the redevelopment of the property formerly owned through the Modern Magic Hotel, LLC joint venture, partly offset by the start of the renovation project at Westin Copley Place during the 2010 period.
31
Income Tax Expense
Income tax expense from continuing operations and discontinued operations decreased $0.9 million from $4.3 million in 2009 to $3.4 million in 2010. LHL’s net income before income tax expense increased $2.0 million from $8.6 million in 2009 to $10.6 million in 2010, primarily due to new participating leases requiring lower rent payments effective January 1, 2010, partially offset by the $9.5 million cure payment revenue recognized at Seaview Resort in the 2009 period. Income tax expense decreased as a result of the revaluation of past years’ tax net operating loss carryforwards during the 2010 period upon finalization of LHL’s 2009 federal and state income tax returns, partially offset by the increased LHL taxable income. For the year ended December 31, 2010, LHL’s income tax expense was calculated using an estimated combined federal and state annual effective tax rate of 33.3%.
Discontinued Operations
Net income (loss) from discontinued operations decreased $3.3 million from net income of $2.4 million in 2009 to net loss of $0.9 million in 2010. Net income (loss) from discontinued operations reflects the operating results of the Seaview Resort and Westin City Center Dallas, which were sold in September 2010, and the Sheraton Bloomington Hotel Minneapolis South, which was sold in January 2011 and classified as held for sale upon receiving a nonrefundable deposit on December 6, 2010. The 2010 period includes gain on sale of Westin City Center Dallas of $29.2 million, partially offset by losses on impairment of $24.5 million and $3.2 million for Seaview Resort and Sheraton Bloomington Hotel Minneapolis South, respectively, and the 2009 period includes $9.5 million of cure payment revenue recognized at Seaview Resort.
Redeemable Noncontrolling Interest
Redeemable noncontrolling interest in consolidated entity represents the outside equity interest in the Modern Magic Hotel, LLC joint venture, which is included in the consolidated financial statements of the Company since the Company holds a controlling interest.
Noncontrolling Interests
Noncontrolling interests of common units in the Operating Partnership represents the allocation of income or loss of the Operating Partnership to the common units held by a third party. Income or loss is allocated to common units noncontrolling interest based on the weighted average percentage ownership throughout the period. At December 31, 2010, no third party limited partner held any common units of the Operating Partnership.
Noncontrolling interests of preferred units in the Operating Partnership represents the allocation of income of the Operating Partnership to the preferred units held by third parties. The decrease in noncontrolling interest of preferred units in the Operating Partnership from $0.4 million in 2009 to zero in 2010 is a result of the redemption of the 2,348,888 Series C Preferred Units on February 1, 2009, resulting in no third party limited partner holding any preferred units of the Operating Partnership.
Distributions to Preferred Shareholders
Distributions to preferred shareholders increased $0.4 million from $26.4 million in 2009 to $26.8 million in 2010. This increase was due to the redemption of the Series C Preferred Units and issuance of Series C Preferred Shares on February 1, 2009, which were subsequently exchanged for Series G Preferred Shares on April 16, 2009.
32
Non-GAAP Financial Measures
FFO and EBITDA
The Company considers the non-GAAP measures of FFO and EBITDA to be key supplemental measures of the Company’s performance and should be considered along with, but not as alternatives to, net income or loss as a measure of the Company’s operating performance. Historical cost accounting for real estate assets implicitly assumes that the value of real estate assets diminishes predictably over time. Since real estate values instead have historically risen or fallen with market conditions, most real estate industry investors consider FFO and EBITDA to be helpful in evaluating a real estate company’s operations.
The White Paper on FFO approved by the National Association of Real Estate Investment Trusts (“NAREIT”) in April 2002 defines FFO as net income or loss (computed in accordance with GAAP), excluding gains or losses from sales of properties and items classified by GAAP as extraordinary, plus real estate-related depreciation and amortization (excluding amortization of deferred finance costs) and after comparable adjustments for the Company’s portion of these items related to unconsolidated entities and joint ventures. In October 2011 and November 2011, NAREIT issued guidance reaffirming its view that impairment write-downs of depreciable real estate should be excluded from the computation of FFO. Accordingly, the Company recast FFO for the year ended December 31, 2010 to exclude loss on impairment of properties, providing a consistent presentation of FFO measures. The Company computes FFO consistent with standards established by NAREIT, which may not be comparable to FFO reported by other REITs that do not define the term in accordance with the current NAREIT definition or that interpret the current NAREIT definition differently than the Company.
With respect to FFO, the Company believes that excluding the effect of extraordinary items, real estate-related depreciation and amortization, and the portion of these items related to unconsolidated entities, all of which are based on historical cost accounting and which may be of limited significance in evaluating current performance, can facilitate comparisons of operating performance between periods and between REITs, even though FFO does not represent an amount that accrues directly to common shareholders. However, FFO may not be helpful when comparing the Company to non-REITs.
With respect to EBITDA, the Company believes that excluding the effect of non-operating expenses and non-cash charges, and the portion of these items related to unconsolidated entities, all of which are also based on historical cost accounting and may be of limited significance in evaluating current performance, can help eliminate the accounting effects of depreciation and amortization, and financing decisions and facilitate comparisons of core operating profitability between periods and between REITs, even though EBITDA also does not represent an amount that accrues directly to common shareholders.
FFO and EBITDA do not represent cash generated from operating activities determined by GAAP and should not be considered as alternatives to net income, cash flows from operations or any other operating performance measure prescribed by GAAP. FFO and EBITDA are not measures of the Company’s liquidity, nor are FFO and EBITDA indicative of funds available to fund the Company’s cash needs, including its ability to make cash distributions. These measurements do not reflect cash expenditures for long-term assets and other items that have been and will be incurred. FFO and EBITDA may include funds that may not be available for management’s discretionary use due to functional requirements to conserve funds for capital expenditures, property acquisitions and other commitments and uncertainties. To compensate for this, management considers the impact of these excluded items to the extent they are material to operating decisions or the evaluation of the Company’s operating performance.
33
The following is a reconciliation between net income (loss) attributable to common shareholders and FFO for the years ended December 31, 2011, 2010, 2009, 2008 and 2007 (in thousands, except share and unit data):
| | | | | | | | | | | | | | | | | | | | |
| | | For the year ended December 31, | |
| | | 2011 | | | 2010 | | | 2009 | | | 2008 | | | 2007 | |
Net income (loss) attributable to common shareholders | | $ | 12,934 | | | $ | (24,793 | ) | | $ | (18,770 | ) | | $ | 10,630 | | | $ | 61,543 | |
Depreciation(1) | | | 110,760 | | | | 110,138 | | | | 109,174 | | | | 105,746 | | | | 91,560 | |
Amortization of deferred lease costs | | | 318 | | | | 363 | | | | 436 | | | | 692 | | | | 491 | |
Noncontrolling interests: | | | | | | | | | | | | | | | | | | | | |
Redeemable noncontrolling interest in consolidated entity | | | (2 | ) | | | (191 | ) | | | (30 | ) | | | (39 | ) | | | 0 | |
Noncontrolling interests of common units in Operating Partnership | | | 1 | | | | 0 | | | | 15 | | | | 100 | | | | 249 | |
Gain on sale of properties | | | (760 | ) | | | (29,162 | ) | | | 0 | | | | 0 | | | | (30,401 | ) |
Loss on impairment of properties | | | 0 | | | | 36,129 | | | | 0 | | | | 0 | | | | 0 | |
| | | | | | | | | | | | | | | | | | | | |
FFO | | $ | 123,251 | | | $ | 92,484 | | | $ | 90,825 | | | $ | 117,129 | | | $ | 123,442 | |
| | | | | | | | | | | | | | | | | | | | |
Weighted average number of common shares and units outstanding: | | | | | | | | | | | | | | | | | | | | |
Basic | | | 81,157,663 | | | | 69,549,441 | | | | 54,534,939 | | | | 40,256,228 | | | | 39,955,712 | |
Diluted | | | 81,328,739 | | | | 69,722,700 | | | | 54,611,974 | | | | 40,355,453 | | | | 40,149,039 | |
| (1) | Includes amounts from discontinued operations. |
The following is a reconciliation between net income (loss) attributable to common shareholders and EBITDA for the years ended December 31, 2011, 2010, 2009, 2008 and 2007 (in thousands):
| | | | | | | | | | | | | | | | | | | | |
| | | For the year ended December 31, | |
| | | 2011 | | | 2010 | | | 2009 | | | 2008 | | | 2007 | |
Net income (loss) attributable to common shareholders | | $ | 12,934 | | | $ | (24,793 | ) | | $ | (18,770 | ) | | $ | 10,630 | | | $ | 61,543 | |
Interest expense(1) | | | 39,704 | | | | 36,504 | | | | 37,956 | | | | 48,213 | | | | 46,289 | |
Income tax expense (benefit)(1) | | | 7,081 | | | | 3,424 | | | | 4,257 | | | | (1,316 | ) | | | 3,006 | |
Depreciation and amortization(1) | | | 111,282 | | | | 110,676 | | | | 109,896 | | | | 106,748 | | | | 92,389 | |
Noncontrolling interests: | | | | | | | | | | | | | | | | | | | | |
Redeemable noncontrolling interest in consolidated entity | | | (2 | ) | | | (191 | ) | | | (30 | ) | | | (39 | ) | | | 0 | |
Noncontrolling interests of common units in Operating Partnership | | | 1 | | | | 0 | | | | 15 | | | | 100 | | | | 249 | |
Noncontrolling interests of preferred units in Operating Partnership | | | 0 | | | | 0 | | | | 367 | | | | 5,178 | | | | 6,120 | |
Distributions to preferred shareholders | | | 29,952 | | | | 26,754 | | | | 26,388 | | | | 22,497 | | | | 28,212 | |
| | | | | | | | | | | | | | | | | | | | |
EBITDA(2) | | $ | 200,952 | | | $ | 152,374 | | | $ | 160,079 | | | $ | 192,011 | | | $ | 237,808 | |
| | | | | | | | | | | | | | | | | | | | |
| (1) | Includes amounts from discontinued operations. |
| (2) | EBITDA includes the gain on finalization of the Seaview Resort roof project of $0.8 million in 2011. EBITDA includes the gain on sale of Westin City Center Dallas of $29.2 million and the loss on impairment of Seaview Resort, Sheraton Bloomington Hotel Minneapolis South and 330 N. Wabash Avenue property of $24.5 million, $3.2 million and $8.4 million, respectively, in 2010. EBITDA includes the gain on sale of the LaGuardia Airport Marriott of $30.4 million in 2007. |
34
The Hotels
The following table sets forth historical comparative information with respect to occupancy, ADR and RevPAR for the total hotel portfolio for the years ended December 31, 2011 and 2010, respectively.
| | | | | | | | | | | | |
| | | Year ended December 31, | |
| | | 2011 | | | 2010 | | | Variance | |
Total Portfolio | | | | | | | | | | | | |
Occupancy | | | 76.4 | % | | | 75.6 | % | | | 1.1 | % |
ADR | | $ | 193.27 | | | $ | 183.98 | | | | 5.1 | % |
RevPAR | | $ | 147.69 | | | $ | 139.11 | | | | 6.2 | % |
The above hotel statistics include adjustments made for presentation of comparable information.
Off-Balance Sheet Arrangements
Reserve Funds
Certain of the Company’s agreements with its hotel managers, franchisors and lenders have provisions for the Company to provide funds, generally 4.0% to 5.0% of hotel revenues, sufficient to cover the cost of (a) certain non-routine repairs and maintenance to the hotels and (b) replacements and renewals to the hotels’ furniture, fixtures and equipment. Certain agreements require that the Company reserve cash. As of December 31, 2011, the Company held $17.0 million of restricted cash reserves, $11.6 million of which was available for future capital expenditures. The Company has sufficient cash on hand and availability on its credit facilities to cover required capital expenditures under agreements that do not necessitate that the Company separately reserve cash.
The Company has no other off-balance sheet arrangements.
Liquidity and Capital Resources
The Company’s principal source of cash to meet its cash requirements, including distributions to shareholders, is the operating cash flow from the Company’s hotels. Additional sources of cash are the Company’s senior unsecured credit facility, LHL’s credit facility, secured financing on one or all of the Company’s 29 unencumbered properties as of December 31, 2011, the sale of one or more properties, equity issuances available under the Company’s shelf registration statement and the issuance of up to $210.8 million of common shares from time to time under the 2011 Agreement (see “Equity Issuances and Redemptions” below), of which $47.2 million was utilized during the period from February 1, 2012 through February 15, 2012.
LHL is a wholly-owned subsidiary of the Operating Partnership. Payments to the Operating Partnership are required pursuant to the terms of the lease agreements between LHL and the Operating Partnership relating to the properties owned by the Operating Partnership and leased by LHL. LHL’s ability to make rent payments to the Operating Partnership and the Company’s liquidity, including its ability to make distributions to shareholders, are dependent on the lessees’ ability to generate sufficient cash flow from the operation of the hotels.
In addition, cash flow from hotel operations is subject to all operating risks common to the hotel industry. These risks include:
| | • | | adverse effects of weak national, regional and local economic conditions; |
| | • | | tightening credit standards; |
| | • | | competition for guests and meetings from other hotels, including competition and pricing pressures from internet wholesalers and distributors; |
35
| | • | | increases in operating costs, including wages, benefits, insurance, property taxes and energy, due to inflation and other factors, which may not be offset in the future by increases in room rates; |
| | • | | labor strikes, disruptions or lockouts that may impact operating performance; |
| | • | | dependence on demand from business and leisure travelers, which may fluctuate and be seasonal; |
| | • | | increases in energy costs, airline fares and other expenses related to travel, which may negatively affect traveling; and |
| | • | | terrorism, terrorism alerts and warnings, military actions, pandemics or other medical events which may cause decreases in business and leisure travel. |
These factors could adversely affect the ability of the hotel operators to generate revenues which could adversely affect LHL’s ability to make rental payments to the Company pursuant to the participating leases and ultimately impact the Company’s liquidity.
The Company’s senior unsecured credit facility and LHL’s credit facility contain certain financial covenants relating to net worth requirements, debt ratios and fixed charge coverage and other limitations that restrict our ability to make distributions or other payments to our shareholders upon events of default. There are currently no other contractual or other arrangements limiting payment of distributions by the Operating Partnership.
Failure to comply with our financial covenants contained in our credit facilities and non-recourse secured mortgages could result from, among other things, changes in our results of operations, the incurrence of additional debt or changes in general economic conditions. If we violate the financial covenants contained in either credit facility, we may attempt to negotiate a waiver of the violation or amend the terms of the credit facility with the lenders thereunder; however, we can make no assurance that we would be successful in any such negotiations or that, if successful in obtaining a waiver or amendment, such amendment or waiver would be on terms attractive to us. If a default under any of the above debt instruments were to occur, we would possibly have to refinance the debt through additional debt financing, private or public offerings of debt securities, or additional equity financings. If we are unable to refinance our debt on acceptable terms, including upon maturity of the debt, we may be forced to dispose of hotel properties on disadvantageous terms, potentially resulting in losses that reduce cash flow from operating activities. If, at the time of any refinancing, prevailing interest rates or other factors result in higher interest rates upon refinancing, increases in interest expense would lower our cash flow, and, consequently, cash available for distribution to our shareholders.
As of December 31, 2011, the Company is in compliance with all debt covenants, current on all loan payments and not otherwise in default under the credit facilities or mortgages.
36
Properties Leased to LHL
Effective January 1, 2001, LHL became a wholly owned subsidiary of the Company as provided for under the taxable-REIT subsidiary provisions of the Code. As of December 31, 2011, LHL leased all 37 hotels owned by the Company as follows:
| | |
| 1. Harborside Hyatt Conference Center & Hotel | | 20. Le Parc Suite Hotel |
| 2. Hotel Viking | | 21. Westin Michigan Avenue |
| 3. Topaz Hotel | | 22. Hotel Sax Chicago |
| 4. Hotel Rouge | | 23. Alexis Hotel |
| 5. Hotel Madera | | 24. Hotel Solamar |
| 6. Hotel Helix | | 25. Gild Hall |
| 7. The Liaison Capitol Hill | | 26. Hotel Amarano Burbank |
| 8. Lansdowne Resort | | 27. San Diego Paradise Point Resort and Spa |
| 9. Hotel George | | 28. Le Montrose Suite Hotel |
| 10. Indianapolis Marriott Downtown | | 29. Sofitel Washington, DC Lafayette Square |
| 11. Hilton Alexandria Old Town | | 30. Hotel Monaco San Francisco |
| 12. Chaminade Resort and Conference Center | | 31. Westin Philadelphia |
| 13. Hilton San Diego Gaslamp Quarter | | 32. Embassy Suites Philadelphia - Center City |
| 14. The Grafton on Sunset | | 33. Hotel Roger Williams |
| 15. Onyx Hotel | | 34. Chamberlain West Hollywood |
| 16. Westin Copley Place | | 35. Viceroy Santa Monica |
| 17. Hotel Deca | | 36. Villa Florence |
| 18. The Hilton San Diego Resort and Spa | | 37. Park Central Hotel |
| 19. Donovan House | | |
Contractual Obligations
The following is a summary of the Company’s obligations and commitments as of December 31, 2011 (in thousands):
| | | | | | | | | | | | | | | | | | | | |
| | | Total
Amounts
Committed | | | Amount of Commitment Expiration Per Period | |
Obligations and Commitments | | | Less than
1 year | | | 1 to 3
years | | | 4 to 5
years | | | Over 5
years | |
Mortgage loans(1) | | $ | 775,806 | | | $ | 99,989 | | | $ | 140,420 | | | $ | 535,397 | | | $ | 0 | |
Borrowings under credit facilities(2) | | | 290,227 | | | | 6,197 | | | | 12,359 | | | | 271,671 | | | | 0 | |
Rents(3) | | | 266,152 | | | | 5,998 | | | | 12,033 | | | | 12,112 | | | | 236,009 | |
Massport Bonds(1) | | | 43,024 | | | | 85 | | | | 170 | | | | 170 | | | | 42,599 | |
Purchase commitments(4) | | | | | | | | | | | | | | | | | | | | |
Purchase orders and letters of commitment | | | 27,327 | | | | 27,327 | | | | 0 | | | | 0 | | | | 0 | |
| | | | | | | | | | | | | | | | | | | | |
Total obligations and commitments | | $ | 1,402,536 | | | $ | 139,596 | | | $ | 164,982 | | | $ | 819,350 | | | $ | 278,608 | |
| | | | | | | | | | | | | | | | | | | | |
| (1) | Amounts include principal and interest. |
| (2) | Amounts include principal and interest. Interest expense is calculated based on the variable rate as of December 31, 2011. It is assumed that the outstanding debt as of December 31, 2011 will be repaid upon maturity with interest-only payments until then. |
| (3) | Amounts calculated based on the annual minimum future lease payments that extend through the term of the lease. Rents may be subject to adjustments based on future interest rates and hotel performance. |
| (4) | As of December 31, 2011, purchase orders and letters of commitment totaling approximately $27.3 million had been issued for renovations at the properties. The Company has committed to these projects and anticipates making similar arrangements in the future with the existing properties or any future properties that it may acquire. |
37
Credit Facilities
On December 14, 2011, the Company entered into a new $750.0 million senior unsecured credit facility with a syndicate of banks that replaced the Company’s $450.0 million facility that was scheduled to mature on April 13, 2012. The new facility matures on January 30, 2016, subject to a one-year extension that the Company may exercise at its option, pursuant to certain terms and conditions, including payment of an extension fee. The new credit facility includes an accordion feature which, subject to certain conditions, entitles the Company to request additional lender commitments, allowing for total commitments up to $1.0 billion. The senior unsecured credit facility contains certain financial covenants relating to net worth requirements, debt ratios and fixed charge coverage and other limitations that restrict the Company’s ability to make distributions or other payments to its shareholders upon events of default. Borrowings under the credit facility bear interest at floating rates equal to, at the Company’s option, either (i) LIBOR plus an applicable margin, or (ii) an “Adjusted Base Rate” plus an applicable margin. Additionally, the Company is required to pay a variable unused commitment fee of 0.30% or 0.40% of the unused portion of the credit facility, depending on the average unused portion of the senior unsecured credit facility during each quarterly period.
LHL has a $25.0 million unsecured revolving credit facility to be used for working capital and general lessee corporate purposes. On December 14, 2011, LHL refinanced its credit facility that was scheduled to mature on April 13, 2012, extending the maturity date to January 30, 2016, subject to a one-year extension that LHL may exercise at its option, pursuant to certain terms and conditions, including payment of an extension fee. Borrowings under the LHL revolving credit facility bear interest at floating rates equal to, at LHL’s option, either (i) LIBOR plus an applicable margin, or (ii) an “Adjusted Base Rate” plus an applicable margin. Additionally, LHL is required to pay a variable unused commitment fee of 0.30% or 0.40% of the unused portion of the credit facility, depending on the average unused portion of the LHL unsecured revolving credit facility during each quarterly period.
Debt Summary
Debt as of December 31, 2011 and 2010 consisted of the following (in thousands):
| | | | | | | | | | | | | | | | |
Debt | | Interest
Rate | | | Maturity Date | | | Balance Outstanding as of | |
| | | | December 31,
2011 | | | December 31,
2010 | |
Credit facilities | | | | | | | | | | | | | | | | |
Senior unsecured credit facility | | | Floating | (a) | | | January 2016 | | | $ | 265,000 | | | $ | 112,000 | |
LHL unsecured credit facility | | | Floating | (b) | | | January 2016 | | | | 0 | | | | 8,193 | |
| | | | | | | | | | | | | | | | |
Total borrowings under credit facilities | | | | | | | | | | | 265,000 | | | | 120,193 | |
| | | | | | | | | | | | | | | | |
Massport Bonds | | | | | | | | | | | | | | | | |
Harborside Hyatt Conference
Center & Hotel (taxable) | | | Floating | (c) | | | March 2018 | | | | 5,400 | | | | 5,400 | |
Harborside Hyatt Conference
Center & Hotel (tax exempt) | | | Floating | (c) | | | March 2018 | | | | 37,100 | | | | 37,100 | |
| | | | | | | | | | | | | | | | |
Total bonds payable | | | | | | | | | | | 42,500 | | | | 42,500 | |
| | | | | | | | | | | | | | | | |
Mortgage loans | | | | | | | | | | | | | | | | |
Hilton San Diego Gaslamp Quarter | | | 5.35 | % | | | July 2012 | (d) | | | 59,600 | | | | 59,600 | |
Hotel Solamar | | | 5.49 | % | | | December 2013 | | | | 60,900 | | | | 60,900 | |
Hotel Deca | | | 6.28 | % | | | August 2014 | | | | 9,392 | | | | 9,658 | |
Westin Copley Place | | | 5.28 | % | | | September 2015 | | | | 210,000 | | | | 210,000 | |
Westin Michigan Avenue | | | 5.75 | % | | | April 2016 | | | | 138,902 | | | | 140,000 | |
Indianapolis Marriott Downtown | | | 5.99 | % | | | July 2016 | | | | 101,319 | | | | 101,780 | |
Hotel Roger Williams | | | 6.31 | % | | | August 2016 | | | | 63,589 | | | | 64,000 | |
| | | | | | | | | | | | | | | | |
Mortgage loans at stated value | | | | | | | | | | | 643,702 | | | | 645,938 | |
Unamortized loan premium(e) | | | | | | | | | | | 195 | | | | 269 | |
| | | | | | | | | | | | | | | | |
Total mortgage loans | | | | | | | | | | | 643,897 | | | | 646,207 | |
| | | | | | | | | | | | | | | | |
Total debt | | | | | | | | | | $ | 951,397 | | | $ | 808,900 | |
| | | | | | | | | | | | | | | | |
38
| (a) | Borrowings bear interest at floating rates equal to, at the Company’s option, either (i) LIBOR plus an applicable margin, or (ii) an Adjusted Base Rate plus an applicable margin. As of December 31, 2011, the rate, including the applicable margin, for the Company’s outstanding LIBOR borrowing of $265,000 was 2.30%. As of December 31, 2010, the rate, including the applicable margin, for the Company’s outstanding LIBOR borrowing of $112,000 was 1.07%. On December 14, 2011, the Company entered into a new unsecured credit facility, which matures on January 30, 2016 and has a one-year extension option. |
| (b) | Borrowings bear interest at floating rates equal to, at LHL’s option, either (i) LIBOR plus an applicable margin, or (ii) an Adjusted Base Rate plus an applicable margin. There were no borrowings outstanding at December 31, 2011. As of December 31, 2010, the rate, including the applicable margin, for LHL’s outstanding LIBOR borrowings of $8,193 was 1.06%. On December 14, 2011, LHL refinanced its credit facility, which matures on January 30, 2016 and has a one-year extension option. |
| (c) | The Massport Bonds are secured by letters of credit issued by the Royal Bank of Scotland that expire in February 2014 pursuant to an amendment to the agreement governing the letters of credit. The Royal Bank of Scotland letters of credit also have three one- year extension options and are secured by the Harborside Hyatt Conference Center & Hotel. The bonds bear interest based on weekly floating rates. The interest rates as of December 31, 2011 were 0.75% and 0.12% for the $5,400 and $37,100 bonds, respectively. The interest rates as of December 31, 2010 were 0.28% and 0.38% for the $5,400 and $37,100 bonds, respectively. The Company also incurs an annual letter of credit fee, which was increased from 1.10% to 2.00% effective February 15, 2011. Effective February 14, 2012, the letter of credit fee will be based on an applicable margin as defined in our new senior unsecured credit agreement. |
| (d) | The Company intends to either repay the mortgage loan through borrowings on its credit facilities upon maturity or refinance the loan through a property mortgage. |
| (e) | Mortgage debt includes an unamortized loan premium on the mortgage loan on Hotel Deca of $195 and $269 as of December 31, 2011 and 2010, respectively. |
The mortgages contain debt service coverage ratio thresholds related to the mortgaged properties. If our debt service coverage ratio for a specific property fails to exceed a threshold level specified in the mortgage, cash flows from that hotel will automatically be directed to the lender to (i) satisfy required payments, (ii) fund certain reserves required by the mortgage and (iii) fund additional cash reserves for future required payments, including final payment. Cash flows will be directed to the lender until such time as we again become compliant with the specified debt service coverage ratio or the mortgage is paid off.
A summary of the Company’s interest expense and weighted average interest rates for borrowings for the years ended December 31, 2011, 2010 and 2009 is as follows (in thousands):
| | | | | | | | | | | | |
| | | For the year ended December 31, | |
| | | 2011 | | | 2010 | | | 2009 | |
Interest Expense: | | | | | | | | | | | | |
Interest incurred | | $ | 39,196 | | | $ | 35,797 | | | $ | 37,664 | |
Amortization of deferred financing costs | | | 967 | | | | 907 | | | | 995 | |
Capitalized interest | | | (459 | ) | | | (200 | ) | | | (703 | ) |
| | | | | | | | | | | | |
Interest expense | | | 39,704 | | | | 36,504 | | | | 37,956 | |
Interest expense from discontinued operations | | | 0 | | | | (4 | ) | | | (5 | ) |
| | | | | | | | | | | | |
Interest expense from continuing operations | | $ | 39,704 | | | $ | 36,500 | | | $ | 37,951 | |
| | | | | | | | | | | | |
Weighted Average Interest Rates for Borrowings: | | | | | | | | | | | | |
Senior unsecured credit facility | | | 1.2 | % | | | 1.0 | % | | | 1.3 | % |
| | | | | | | | | | | | |
LHL unsecured credit facility | | | 1.1 | % | | | 0.9 | % | | | 1.2 | % |
| | | | | | | | | | | | |
Massport bonds | | | 0.2 | % | | | 0.3 | % | | | 0.5 | % |
| | | | | | | | | | | | |
39
The Company estimates the fair value of its fixed rate debt and the credit spreads over variable market rates on its variable rate debt by discounting the future cash flows of each instrument at estimated market rates or credit spreads consistent with the maturity of the debt obligation with similar credit policies. Rates and credit spreads take into consideration general market conditions and maturity.
The carrying value and estimated fair value of the Company’s debt as of December 31, 2011 and 2010 were as follows (in thousands):
| | | | | | | | |
| | | As of December 31, | |
| | | 2011 | | | 2010 | |
Carrying value | | $ | 951,397 | | | $ | 808,900 | |
| | | | | | | | |
Estimated fair value | | $ | 954,299 | | | $ | 807,742 | |
| | | | | | | | |
The carrying amounts of the Company’s other financial instruments approximate fair value because of the relatively short maturities of these instruments.
As of December 31, 2011, the Company is in compliance with all debt covenants, current on all loan payments and not otherwise in default under the credit facilities, bonds or mortgages.
Equity Issuances and Redemptions
In August 2005, the Company acquired the Westin Copley Place in Boston, Massachusetts. As part of the consideration to acquire the hotel, the Operating Partnership issued 2,348,888 Series C Preferred Units. The Series C Preferred Units were redeemable for Series C Preferred Shares on a one-for-one basis. On February 1, 2009, each of the Series C Preferred Units was redeemed and the Company issued 2,348,888 Series C Preferred Shares. Prior to the exchange described below, the Series C Preferred Shares were held by SCG. On April 16, 2009, SCG exchanged its Series C Preferred Shares for an equal number of Series G Preferred Shares in a private transaction. Each of the issuance of the Series C Preferred Shares and the exchange of the Series C Preferred Shares for Series G Preferred Shares was exempt from registration pursuant to Section 4(2) of the Securities Act. On April 17, 2009 the Company filed a registration statement with the SEC to register the resale of the Series G Preferred Shares. On May 13, 2009, in connection with the exchange, SCG paid the Company a fee of $1.0 million, which the Company recognized as income.
On April 29, 2009, the Company completed an underwritten public offering of 12,362,500 common shares of beneficial interest, par value $0.01 per share, including 1,612,500 common shares pursuant to an overallotment option exercise. After deducting the underwriters’ discounts and commissions and other offering costs, the Company raised net proceeds of approximately $119.3 million. The net proceeds were used to reduce amounts outstanding under the Company’s senior unsecured credit facility and under the LHL unsecured credit facility, and for general corporate purposes.
On June 15, 2009, the Company completed an underwritten public offering of 10,000,000 common shares of beneficial interest, par value $0.01 per share. After deducting the underwriters’ discounts and commissions and other offering costs, the Company raised net proceeds of approximately $141.1 million. The net proceeds were used to reduce amounts outstanding under the Company’s senior unsecured credit facility and under the LHL unsecured credit facility, and for general corporate purposes.
During 2009, 69,500 units of limited partnership interest were redeemed for common shares on a one-for-one basis and 500 units of limited partnership interest were redeemed for an insignificant amount of cash.
40
On March 2, 2010, the Company completed an underwritten public offering of 6,152,500 common shares of beneficial interest, par value $0.01 per share, including 802,500 common shares pursuant to an overallotment option exercise by the underwriters. After deducting the underwriters’ discounts and commissions and other offering costs, the Company raised net proceeds of approximately $109.2 million. The net proceeds were used to pay down amounts outstanding under the Company’s senior unsecured credit facility and under the LHL unsecured credit facility, and for general corporate purposes.
On April 21, 2010, the Company entered into separate equity distribution agreements (the “2010 Agreements”) with each of Merrill Lynch, Pierce, Fenner & Smith Incorporated, Raymond James & Associates, Inc. and Wells Fargo Securities, LLC (collectively, the “Managers”). Under the terms of the 2010 Agreements, the Company could issue and sell from time to time through or to the Managers, as sales agents and/or principals, the Company’s common shares of beneficial interest having an aggregate offering price of up to $150.0 million.
During August 2010, the Company sold 3,270,936 common shares of beneficial interest, par value $0.01 per share, under the 2010 Agreements, of which 36,044 were issued from treasury. After deducting the underwriters’ discounts and commissions of $1.5 million and other offering costs, the Company raised net proceeds of approximately $74.9 million. The net proceeds were used to fund in part the September 1, 2010 acquisitions of the Hotel Monaco San Francisco, the Westin Philadelphia and the Embassy Suites Philadelphia – Center City.
On January 19, 2011, the Company issued 2,600,000 7 1/2% Series H Cumulative Redeemable Preferred Shares ($0.01 par value) (“Series H Preferred Shares”) at a price of $25.00 per share and received net proceeds, after costs, of $62.7 million. On February 4, 2011, the underwriters exercised their rights to cover overallotments and purchased 150,000 additional Series H Preferred Shares, resulting in additional net proceeds to the Company of $3.6 million. The net proceeds were used to reduce amounts outstanding under the Company’s senior unsecured credit facility and under the LHL unsecured credit facility, and for general corporate purposes.
From January 21, 2011 through February 16, 2011, the Company sold 2,619,811 common shares of beneficial interest, par value $0.01 per share, under the 2010 Agreements. After deducting the underwriters’ discounts and commissions of $1.2 million, the Company raised net proceeds of $72.3 million. The net proceeds were used to pay down amounts outstanding under the Company’s senior unsecured credit facility and under the LHL unsecured credit facility, and for general corporate purposes. As of December 31, 2011, the Company had fully utilized the $150.0 million of aggregate offering price authorized under the 2010 Agreements.
On February 11, 2011, the Company provided notice to the holders of its 8 3/8% Series B Cumulative Redeemable Preferred Shares (“Series B Preferred Shares”) of the redemption of those shares. On March 14, 2011, the Company redeemed all 1,100,000 outstanding Series B Preferred Shares for $27.5 million ($25.00 per share) plus accrued distributions through March 14, 2011 of $0.5 million. The redemption value of the Series B Preferred Shares exceeded the carrying value of the Series B Preferred Shares by $0.7 million which is included in the determination of net income attributable to common shareholders for the year ended December 31, 2011. The $0.7 million represents the offering costs related to the Series B Preferred Shares.
On March 4, 2011, the Company entered into an equity distribution agreement (the “2011 Agreement”) with Raymond James & Associates, Inc. (the “Manager”). Under the terms of the 2011 Agreement, the Company may issue from time to time through or to the Manager, as sales agent or principal, the Company’s common shares of beneficial interest having an aggregate offering price of up to $250.0 million. From March 24, 2011 through April 11, 2011, the Company sold 1,436,881 common shares of beneficial interest, par value $0.01 per share, under the 2011 Agreement, of which 9,406 were issued from treasury. On July 7, 2011, the Company sold 8,016 common shares of beneficial interest, par value $0.01 per share, under the 2011 Agreement. After deducting the Manager’s discounts and commissions of $0.5 million and other offering costs, the Company raised cumulative
41
net proceeds of $38.5 million. The proceeds were used to pay down amounts outstanding under the Company’s senior unsecured credit facility and under the LHL unsecured credit facility, and for general corporate purposes. As of December 31, 2011, the Company had availability under the 2011 Agreement to issue and sell common shares of beneficial interest having an aggregate offering price of up to $210.8 million.
On April 29, 2011, the Company completed an underwritten public offering of 7,896,612 common shares of beneficial interest, par value $0.01 per share, including 896,612 common shares pursuant to an overallotment option exercise by the underwriters. After deducting the underwriters’ discounts and commissions and other offering costs, the Company raised net proceeds of $216.7 million. The net proceeds were used to pay down amounts outstanding under the Company’s senior unsecured credit facility and under the LHL unsecured credit facility, to repurchase common shares of beneficial interest under the Repurchase Program (as defined below), to fund the acquisition of Villa Florence on October 5, 2011, to fund a portion of the acquisition of the Park Central Hotel on December 29, 2011 and for general corporate purposes.
On August 29, 2011, the Company’s Board of Trustees authorized a share repurchase program (the “Repurchase Program”) to acquire up to $100.0 million of the Company’s common shares of beneficial interest, with repurchased shares recorded at cost in treasury. From August 29, 2011 through October 11, 2011, the Company repurchased 1,389,574 common shares of beneficial interest under the Repurchase Program. Including commissions of an immaterial amount, the Company paid a total of $24.5 million. Since the time the Company ceased repurchasing activity on October 11, 2011 (the date of the Company’s last repurchase of common shares), the Company has had availability under the Repurchase Program to acquire up to $75.5 million of common shares of beneficial interest. However, the Company is not currently authorized by its Board of Trustees to repurchase or offer to repurchase any common shares. If authorized by its Board of Trustees, the Company may resume using the Repurchase Program on a future date.
On December 29, 2011, the Company issued 296,300 common units of limited partnership interest to two entities comprising the seller of Park Central Hotel as partial consideration for the acquisition. The units are subject to a required hold period that ends on December 28, 2013, after which they are convertible into a like number of common shares of beneficial interest, par value $0.01 per share, of the Company.
From February 1, 2012 through February 15, 2012, the Company sold 1,714,939 common shares of beneficial interest, par value $0.01 per share, under the 2011 Agreement, of which 1,260,256 were issued from treasury. After deducting the Manager’s discounts and commissions of $0.6 million, the Company raised net proceeds of $46.6 million. The net proceeds were used to pay down amounts outstanding under the Company’s senior unsecured credit facility and for general corporate purposes. After considering these additional shares sold, the Company has availability under the 2011 Agreement to issue and sell common shares of beneficial interest having an aggregate offering price of up to $163.7 million.
Sources and Uses of Cash
As of December 31, 2011, the Company had $20.2 million of cash and cash equivalents and $17.0 million of restricted cash reserves, $11.6 million of which was available for future capital expenditures. Additionally, the Company had $484.3 million available under the senior unsecured credit facility, with $0.7 million reserved for outstanding letters of credit, and $25.0 million available under the LHL credit facility.
Net cash provided by operating activities was $165.5 million for the year ended December 31, 2011 primarily due to the operations of the hotels, which were offset by payments for real estate taxes, personal property taxes, insurance and ground rent.
Net cash used in investing activities was $569.9 million for the year ended December 31, 2011 primarily due to the purchase of Viceroy Santa Monica, Villa Florence and Park Central Hotel, outflows for improvements and additions at the hotels and the net funding of restricted cash reserves, partially offset by proceeds from the sale of Sheraton Bloomington Hotel Minneapolis South.
42
Net cash provided by financing activities was $411.7 million for the year ended December 31, 2011 primarily due to net proceeds from the common share offerings, net proceeds from the preferred share offering and net borrowings under the credit facilities, partially offset by payment for the redemption of preferred shares, payment for the repurchase of common shares of beneficial interest under the Repurchase Program, payment of distributions to common shareholders and payment of distributions to preferred shareholders.
The Company has considered its short-term (one year or less) liquidity needs and the adequacy of its estimated cash flow from operations and other expected liquidity sources to meet these needs. The Company believes that its principal short-term liquidity needs are to fund normal recurring expenses, debt service requirements, property acquisitions, repurchase of common shares of beneficial interest under the Repurchase Program, distributions on the preferred shares and the minimum distribution required to maintain the Company’s REIT qualification under the Code. The Company anticipates that these needs will be met with available cash on hand, cash flows provided by operating activities, borrowings under the senior unsecured credit facility or LHL’s credit facility, secured financing on any of the Company’s 29 unencumbered properties, potential property sales, equity issuances available under the Company’s shelf registration statement and the issuance of up to $210.8 million of common shares from time to time under the 2011 Agreement, of which $47.2 million was utilized during the period from February 1, 2012 through February 15, 2012. The Company also considers capital improvements and property acquisitions as short-term needs that will be funded either with cash flows provided by operating activities, utilizing availability under the senior unsecured credit facility or LHL’s credit facility, secured financing on any of the Company’s 29 unencumbered properties, potential property sales or the issuance of additional equity securities.
The Company expects to meet long-term (greater than one year) liquidity requirements such as property acquisitions, scheduled debt maturities, major renovations, expansions and other nonrecurring capital improvements utilizing availability under the senior unsecured credit facility or LHL’s credit facility, secured financing on any of the Company’s 29 unencumbered properties, potential property sales, estimated cash flows from operations, equity issuances available under the Company’s shelf registration statement and the issuance of up to $210.8 million of common shares from time to time under the 2011 Agreement, of which $47.2 million was utilized during the period from February 1, 2012 through February 15, 2012. The Company expects to acquire or develop additional hotel properties only as suitable opportunities arise, and the Company will not undertake acquisition or development of properties unless stringent acquisition or development criteria have been achieved.
Reserve Funds
The Company is obligated to maintain reserve funds for capital expenditures at the hotels (including the periodic replacement or refurbishment of furniture, fixtures and equipment) as determined pursuant to the operating agreements. Please refer to “Off-Balance Sheet Arrangements” for a discussion of the Reserve Funds.
Inflation
The Company relies entirely on the performance of the hotels and their ability to increase revenues to keep pace with inflation. The hotel operators can change room rates quickly, but competitive pressures may limit the hotel operators’ abilities to raise rates faster than inflation or even at the same rate.
The Company’s expenses (primarily real estate taxes, property and casualty insurance, administrative expenses and LHL hotel operating expenses) are subject to inflation. These expenses are expected to grow with the general rate of inflation, except for energy costs, liability insurance, property tax rates, employee benefits and some wages, which are expected to increase at rates higher than inflation, and except for instances in which the properties are subject to periodic real estate tax reassessments.
43
Derivative/Financial Instruments
In the normal course of business, the Company is exposed to the effects of interest rate changes. As of December 31, 2011, approximately 32.3% of the Company’s borrowings were subject to variable rates. The Company limits the risks associated with interest rate changes by following established risk management policies and procedures which may include the use of derivatives. For interest rate exposures, derivatives are used primarily to align rate movements between interest rates associated with the Company’s hotel operating revenues and other financial assets with interest rates on related debt, and manage the cost of borrowing obligations. The Company may utilize derivative financial instruments to manage, or hedge, interest rate risk. The Company requires that hedging derivative instruments be effective in reducing the interest rate risk exposure that they are designated to hedge. This effectiveness is essential in order to qualify for hedge accounting. Instruments that meet these hedging criteria are formally designated as hedges at the inception of the derivative contract. When the terms of an underlying transaction are modified, or when the underlying hedged item ceases to exist, all changes in the fair value of the instrument are marked-to-market with changes in value included in net income or loss each period until the instrument matures. The Company did not utilize any derivative financial instruments during the years 2009 through 2011 and there were no derivatives outstanding as of December 31, 2011 and 2010.
| Item 7A. | Quantitative and Qualitative Disclosures about Market Risk |
Interest Rate Sensitivity
The table below provides information about financial instruments that are sensitive to changes in interest rates, including mortgage obligations, bonds and lines of credit. For debt obligations, the table presents scheduled maturities and related weighted average interest rates by expected maturity dates (in thousands).
| | | | | | | | | | | | | | | | | | | | | | | | | | | | |
| | | 2012 | | | 2013 | | | 2014 | | | 2015 | | | 2016 | | | Thereafter | | | Total | |
Fixed rate debt | | $ | 64,600 | | | $ | 64,687 | | | $ | 13,324 | | | $ | 214,797 | | | $ | 286,294 | | | $ | 0 | | | $ | 643,702 | |
Weighted average interest | | | 5.4 | % | | | 5.5 | % | | | 6.2 | % | | | 5.3 | % | | | 5.9 | % | | | 0.0 | % | | | 5.6 | % |
Variable rate debt | | $ | 0 | | | $ | 0 | | | $ | 0 | | | $ | 0 | | | $ | 265,000 | | | $ | 42,500 | | | $ | 307,500 | |
Weighted average interest | | | 0.0 | % | | | 0.0 | % | | | 0.0 | % | | | 0.0 | % | | | 2.3 | % | | | 0.2 | % | | | 2.0 | % |
| | | | | | | | | | | | | | | | | | | | | | | | | | | | |
Total | | $ | 64,600 | | | $ | 64,687 | | | $ | 13,324 | | | $ | 214,797 | | | $ | 551,294 | | | $ | 42,500 | | | $ | 951,202 | |
| | | | | | | | | | | | | | | | | | | | | | | | | | | | |
The table above presents the principal amount of debt maturing each year, including annual amortization of principal, through December 31, 2016 and thereafter and weighted average interest rates for the debt maturing in each specified period. This table reflects indebtedness outstanding as of December 31, 2011 and does not reflect indebtedness, if any, incurred after that date. The Company’s ultimate exposure to interest rate fluctuations depends on the amount of indebtedness that bears interest at variable rates, the time at which the interest rate is adjusted, the amount of adjustment, the ability to prepay or refinance variable rate indebtedness and hedging strategies used to reduce the impact of any increases in rates. As of December 31, 2011, the estimated fair value of the Company’s fixed rate mortgage debt was $645.6 million.
The Company is exposed to market risk from changes in interest rates. The Company seeks to limit the impact of interest rate changes on earnings and cash flows and to lower the overall borrowing costs by closely monitoring the Company’s variable rate debt and converting such debt to fixed rates when we deem such conversion advantageous. As of December 31, 2011, $307.5 million of the Company’s aggregate indebtedness (32.3% of total indebtedness) was subject to variable interest rates.
If market rates of interest on the Company’s variable rate long-term debt fluctuate by 0.25%, interest expense would increase or decrease, depending on rate movement, future earnings and cash flows by $0.8 million annually. This assumes that the amount outstanding under the Company’s variable rate debt remains at $307.5 million, the balance as of December 31, 2011.
44
| Item 8. | Consolidated Financial Statements and Supplementary Data |
See Index to Financial Statements on page F-1.
| Item 9. | Changes in and Disagreements with Accountants on Accounting and Financial Disclosure |
None.
| Item 9A. | Controls and Procedures |
Evaluation of Disclosure Controls and Procedures—The Company has established disclosure controls and procedures to ensure that material information relating to the Company, including its consolidated subsidiaries, is made known to the officers who certify the Company’s financial reports and to the members of senior management and the Board of Trustees.
Based on management’s evaluation as of December 31, 2011, the principal executive officer and principal financial officer of the Company have concluded that the Company’s disclosure controls and procedures (as defined in Rules 13a-15(e) or 15d-15(e) under the Exchange Act) are effective to ensure that the information required to be disclosed by the Company in the reports that it files or submits under the Exchange Act is recorded, processed, summarized and reported within the time periods specified in the rules and forms.
Management’s Report on Internal Control Over Financial Reporting—The Company’s management is responsible for establishing and maintaining adequate internal control over financial reporting, as such term is defined in 13a-15(f) and 15d-15(f) of the Exchange Act. Under the supervision and with the participation of our management, including our principal executive officer, we conducted an evaluation of the effectiveness of our internal control over financial reporting based on the framework in Internal Control—Integrated Framework issued by the Committee of Sponsoring Organizations of the Treadway Commission. Based on our evaluation under the framework in Internal Control—Integrated Framework, our management concluded that our internal control over financial reporting was effective as of December 31, 2011.
Independent Registered Public Accounting Firm’s Report on Internal Control Over Financial Reporting—KPMG LLP, an independent registered public accounting firm, has audited the Company’s consolidated financial statements included in this Annual Report on Form 10-K and, as part of its audit, has issued its report, included herein on page F-3, on the effectiveness of our internal control over financial reporting.
Changes in Internal Controls—There was no change to the Company’s internal control over financial reporting during the fourth quarter ended December 31, 2011 that has materially affected, or is reasonably likely to materially affect, the Company’s internal control over financial reporting.
| Item 9B. | Other Information |
None.
45
PART III
| Item 10. | Trustees, Executive Officers and Corporate Governance |
The information required by this item is incorporated by reference to the material in the Proxy Statement.
| Item 11. | Executive Compensation |
The information required by this item is incorporated by reference to the material in the Proxy Statement.
| Item 12. | Security Ownership of Certain Beneficial Owners and Management and Related Shareholder Matters |
The information required by this item is incorporated by reference to the material in the Proxy Statement.
| Item 13. | Certain Relationships and Related Transactions, and Trustee Independence |
The information required by this item is incorporated by reference to the material in the Proxy Statement.
| Item 14. | Principal Accountant Fees and Services |
The information required by this item is incorporated by reference to the material in the Proxy Statement.
PART IV
| Item 15. | Exhibits and Financial Statement Schedules |
Included herein at pages F-1 through F-45.
| 2. | Financial Statement Schedules |
The following financial statement schedule is included herein at pages F-46 through F-47.
Schedule III – Real Estate and Accumulated Depreciation
All other schedules for which provision is made in Regulation S-X are either not required to be included herein under the related instructions or are inapplicable or the related information is included in the footnotes to the applicable financial statement and, therefore, have been omitted.
46
The following exhibits are filed as part of this Annual Report on Form 10-K:
| | |
Exhibit Number | | Description of Exhibit |
| |
| 3.1 | | Articles of Amendment and Restatement of Declaration of Trust of the Registrant(25) |
| |
| 3.2 | | Third Amended and Restated Bylaws of the Registrant(1) |
| |
| 4.1 | | Form of Common Share of Beneficial Interest(2) |
| |
| 10.1 | | Amended and Restated Agreement of Limited Partnership of LaSalle Hotel Operating Partnership, L.P., dated as of April 29, 1998(3) |
| |
| 10.2 | | First Amendment to the Amended and Restated Agreement of Limited Partnership of LaSalle Hotel Operating Partnership, L.P., dated as of March 6, 2002(4) |
| |
| 10.3 | | Second Amendment to the Amended and Restated Agreement of Limited Partnership of LaSalle Hotel Operating Partnership, L.P., dated as of September 30, 2003(5) |
| |
| 10.4 | | Form of Third Amendment to the Amended and Restated Agreement of Limited Partnership of LaSalle Hotel Operating Partnership, L.P.(6) |
| |
| 10.5 | | Fourth Amendment to the Amended and Restated Agreement of Limited Partnership of LaSalle Hotel Operating Partnership, L.P., dated as of August 22, 2005(7) |
| |
| 10.6 | | Fifth Amendment to the Amended and Restated Agreement of Limited Partnership of LaSalle Hotel Operating Partnership, L.P., dated as of February 8, 2006(8) |
| |
| 10.7 | | Form of Sixth Amendment to the Amended and Restated Agreement of Limited Partnership of LaSalle Hotel Operation Partnership, L.P.(9) |
| |
| 10.8 | | Seventh Amendment to the Amended and Restated Agreement of Limited Partnership of LaSalle Hotel Operating Partnership, L.P., dated as of November 17, 2006(10) |
| |
| 10.9 | | Eighth Amendment to Amended and Restated Agreement of Limited Partnership of LaSalle Hotel Operating Partnership, L.P., dated as of April 15, 2009(11) |
| |
| 10.10 | | Ninth Amendment to Amended and Restated Agreement of Limited Partnership of LaSalle Hotel Operating Partnership, L.P., dated as of January 24, 2011(12) |
| |
| 10.11 | | Form of Management Agreement(2) |
| |
| 10.12 | | Form of Lease with Affiliated Lessees(2) |
| |
| 10.13 | | Form of First Amendment to Lease with Affiliated Lessee(13) |
| |
| 10.14 | | Form of Second Amendment to Lease with Affiliate Lessee(13) |
| |
| 10.15 | | Promissory Note Secured by Leasehold Mortgage in the original principal amount of $210,000,000 made by LHO Backstreets, L.L.C. and dated as of August 30, 2005(14) |
| |
| 10.16 | | Leasehold Mortgage and Absolute Assignment of Rents and Leases and Security Agreement (and Fixture Filing) by LHO Backstreets, LLC, as Mortgagor, and Mortgage Electronic Registration Systems, Inc., as Mortgagee and dated as of August 30, 2005(14) |
| |
| 10.17 | | Loan and Trust Agreement, dated as of December 15, 1990, as amended and restated as of June 27, 1991, among the Massachusetts Port Authority, Logan Harborside Associates II Limited Partnership, and Shawmut Bank, N.A., as trustee(3) |
| |
| 10.18 | | Credit Enhancement Agreement, dated as of June 27, 1991, among the Massachusetts Port Authority, Logan Harborside Associates II Limited Partnership and Shawmut Bank, N.A.(3) |
47
| | |
Exhibit Number | | Description of Exhibit |
| |
| 10.19 | | LaSalle Hotel Properties 1998 Share Option and Incentive Plan, as amended through April 21, 2005(15)* |
| |
| 10.20 | | LaSalle Hotel Properties 2009 Equity Incentive Plan(16)* |
| |
| 10.21 | | Trustee Fee Deferral Program(17)* |
| |
| 10.22 | | Form of Time-Based Restricted Share Award Agreement(18)* |
| |
| 10.23 | | Form of Performance-Based Restricted Share Award Agreement(18)* |
| |
| 10.24 | | Amended and Restated Severance Agreement between Hans S. Weger and LaSalle Hotel Properties effective October 19, 2009(17)* |
| |
| 10.25 | | Amended and Restated Severance Agreement between Michael D. Barnello and LaSalle Hotel Properties effective October 19, 2009(17)* |
| |
| 10.26 | | Severance Agreement between Alfred L. Young and LaSalle Hotel Properties effective November 3, 2009(17)* |
| |
| 10.27 | | Severance Agreement between Bruce A. Riggins and LaSalle Hotel Properties effective January 24, 2011(25)* |
| |
| 10.28 | | Offer Letter to Michael D. Barnello(19)* |
| |
| 10.29 | | Offer Letter to Alfred L. Young(20)* |
| |
| 10.30 | | Offer Letter to Bruce A. Riggins(21)* |
| |
| 10.31 | | Form of Indemnification Agreement(22)* |
| |
| 10.32 | | Amended and Restated Senior Unsecured Credit Agreement entered into on June 9, 2005 among Bank of Montreal, Bank of America, N.A., the other lenders named therein and LaSalle Hotel Operating Partnership, L.P.(23) |
| |
| 10.33 | | Second Amendment to Amended and Restated Senior Unsecured Credit Agreement(24) |
| |
| 10.34 | | Total Commitments Increase Agreement dated as of January 14, 2008 among LaSalle Hotel Operating Partnership, L.P. and Branch Banking & Trust Company, BMO Capital Markets Financing, Inc., Bank of Montreal, Chicago Branch, The Royal Bank of Scotland PLC, Wachovia Bank, NA, Raymond James Bank, FSB, U.S. Bank National Association and National City Bank and Bank of Montreal, Chicago Branch, as Administrative Agent(25) |
| |
| 10.35 | | Guaranty and Contribution Agreement made as of June 9, 2005 by LaSalle Hotel Properties and certain of its subsidiaries(23) |
| |
| 10.36 | | Environmental Indemnification Agreement made as of June 9, 2005 by LaSalle Hotel Operating Partnership, L.P., LaSalle Hotel Properties and certain of their subsidiaries(23) |
| |
| 10.37 | | Purchase and Sale Agreement, dated June 3, 2011, by and among LaSalle Hotel Operating Partnership, L.P., Park Central Hotel (DE) LLC, PCH TIC Owner LLC and PCH Operating Lessee Owner Corp.(26) |
| |
| 10.38 | | Senior Unsecured Credit Agreement, dated December 14, 2011, among LaSalle Hotel Operating Partnership, L.P., LaSalle Hotel Properties, and Citibank, N.A., as Administrative Agent, The Royal Bank of Scotland plc and Bank of Montreal, as Co-Syndication Agents, and the other lenders named therein(27) |
| |
| 12.1 | | Computation of the Registrant’s Ratios of Earnings to Combined Fixed Charges and Preferred Share Dividends |
48
| | |
Exhibit Number | | Description of Exhibit |
| |
| 21.1 | | List of Subsidiaries |
| |
| 23.1 | | Consent of KPMG LLP |
| |
| 24.1 | | Power of Attorney (included in Part IV of this Annual report on Form 10-K) |
| |
| 31.1 | | Certification of Chief Executive Officer pursuant to Section 302 of the Sarbanes-Oxley Act of 2002 |
| |
| 31.2 | | Certification of Chief Financial Officer pursuant to Section 302 of the Sarbanes-Oxley Act of 2002 |
| |
| 32.1 | | Certification of Chief Executive Officer and Chief Financial Officer pursuant to 18 U.S.C. 1350, as created by Section 906 of the Sarbanes-Oxley Act of 2002 |
| |
| 101 | | The following financial statements from LaSalle Hotel Properties’ Annual Report on Form 10-K for the year ended December 31, 2011, filed on February 22, 2012, formatted in XBRL: (i) Consolidated Balance Sheets, (ii) Consolidated Statements of Operations, (iii) Consolidated Statements of Equity, (iv) Consolidated Statements of Cash Flows and (v) Notes to Consolidated Financial Statements |
| * | Represents management contract or compensatory plan or agreement. |
| (1) | Previously filed as an exhibit to the Registrant’s Current Report on Form 8-K filed with the SEC on February 2, 2010 and incorporated herein by reference. |
| (2) | Previously filed as an exhibit to Amendment No. 1 to the Registrant’s Registration Statement on Form S-11 (No. 333-45647) filed with the SEC on April 2, 1998 and incorporated herein by reference. |
| (3) | Previously filed as an exhibit to the Registrant’s Quarterly Report on Form 10-Q (No. 001-14045) filed with the SEC on August 14, 1998 and incorporated herein by reference. |
| (4) | Previously filed as an exhibit to the Registrant’s Current Report on Form 8-K filed with the SEC on March 12, 2002 and incorporated herein by reference. |
| (5) | Previously filed as an exhibit to Registrant’s Annual report on Form 10-K filed with the SEC on February 23, 2006 and incorporated herein by reference. |
| (6) | Previously filed as an exhibit to Registrant’s Current Report on Form 8-K filed with the SEC on August 16, 2005 and incorporated herein by reference. |
| (7) | Previously filed as an exhibit to Registrant’s Current Report on Form 8-K filed with the SEC on August 24, 2005 and incorporated herein by reference. |
| (8) | Previously filed as an exhibit to Registrant’s Current Report on Form 8-K filed with the SEC on February 9, 2006 and incorporated herein by reference. |
| (9) | Previously filed as an exhibit to Registrant’s Current Report on Form 8-K filed with the SEC on September 28, 2006 and incorporated herein by reference. |
| (10) | Previously filed as an exhibit to Registrant’s Current Report on Form 8-K filed with the SEC on November 17, 2006 and incorporated herein by reference. |
| (11) | Previously filed as an exhibit to the Registrant’s Current Report on Form 8-K filed with the SEC on April 17, 2009 and incorporated herein by reference. |
| (12) | Previously filed as an exhibit to Registrant’s Current Report on Form 8-K filed with the SEC on January 24, 2011 and incorporated herein by reference. |
| (13) | Previously filed as an exhibit to the Registrant’s Quarterly Report on Form 10-Q (No. 001-14045) filed with the SEC on May 12, 1999 and incorporated herein by reference. |
| (14) | Previously filed as an exhibit to Registrant’s Current Report on Form 8-K filed with the SEC on September 7, 2005 and incorporated herein by reference. |
| (15) | Previously filed as an exhibit to the Registrant’s Registration Statement on Form S-8 (No. 333-125058) filed with the SEC on May 19, 2005 and incorporated herein by reference. |
| (16) | Previously filed as an exhibit to the Registrant’s Registration Statement on Form S-8 (No. 333-158873) filed with the SEC on April 28, 2009 and incorporated herein by reference. |
| (17) | Previously filed as an exhibit to the Registrant’s Annual Report on Form 10-K filed with the SEC on February 25, 2010 and incorporated herein by reference. |
49
| (18) | Previously filed as an exhibit to the Registrant’s Quarterly Report on Form 10-Q filed with the SEC on April 18, 2007 and incorporated herein by reference. |
| (19) | Previously filed as an exhibit to the Registrant’s Current Report on Form 8-K filed with the SEC on June 2, 2008 and incorporated herein by reference. |
| (20) | Previously filed as an exhibit to the Registrant’s Current Report on Form 8-K filed with the SEC on October 6, 2010 and incorporated herein by reference. |
| (21) | Previously filed as an exhibit to Registrant’s Current Report on Form 8-K filed with the SEC on January 5, 2011 and incorporated herein by reference. |
| (22) | Previously filed as an exhibit to the Registrant’s Current report on Form 8-K filed with the SEC on November 12, 2008 and incorporated herein by reference. |
| (23) | Previously filed as an exhibit to Registrant’s Current Report on Form 8-K filed with the SEC on June 14, 2005 and incorporated herein by reference. |
| (24) | Previously filed as an exhibit to the Registrant’s Current Report on Form 8-K filed with the SEC on April 13, 2007 and incorporated herein by reference. |
| (25) | Previously filed as an exhibit to the Registrant’s Annual Report on Form 10-K filed with the SEC on February 23, 2011 and incorporated herein by reference. |
| (26) | Previously filed as an exhibit to the Registrant’s Quarterly Report on Form 10-Q filed with the SEC on July 20, 2011 and incorporated herein by reference. |
| (27) | Previously filed as an exhibit to the Registrant’s Annual Report on Form 8-K filed with the SEC on December 15, 2011 and incorporated herein by reference. |
50
SIGNATURES
Pursuant to the requirements of Section 13 or 15(d) of the Securities Exchange Act of 1934, the registrant has duly caused this report to be signed on its behalf by the undersigned, thereunto duly authorized.
| | | | | | |
| | | | LASALLE HOTEL PROPERTIES |
| | | |
| Dated: February 22, 2012 | | | | BY: | | /S/ BRUCE A. RIGGINS |
| | | | | | Bruce A. Riggins Executive Vice President and Chief Financial Officer
(Principal Financial Officer and Principal Accounting Officer) |
KNOW ALL MEN BY THESE PRESENTS, that we, the undersigned officers and trustees of LaSalle Hotel Properties, hereby severally constitute Michael D. Barnello, Bruce A. Riggins and Alfred L. Young, and each of them singly, our true and lawful attorneys with full power to them, and each of them singly, to sign for us and in our names in the capacities indicated below, the Form 10-K filed herewith and any and all amendments to said Form 10-K, and generally to do all such things in our names and in our capacities as officers and trustees to enable LaSalle Hotel Properties to comply with the provisions of the Securities Exchange Act of 1934, as amended, and all requirements of the Securities and Exchange Commission, hereby ratifying and confirming our signatures as they may be signed by our said attorneys, or any of them, to said Form 10-K and any and all amendments thereto.
Pursuant to the requirements of the Securities Exchange Act of 1934, this report has been signed below by the following persons on behalf of the registrant and in the capacities and on the dates indicated.
| | | | |
Date | | Signature | | |
| | |
| February 22, 2012 | | /s/ MICHAEL D. BARNELLO Michael D. Barnello | | Trustee, President and Chief Executive Officer (Principal Executive Officer) |
| | |
| February 22, 2012 | | /s/ JEFFREY T. FOLAND Jeffrey T. Foland | | Trustee |
| | |
| February 22, 2012 | | /s/ DARRYL HARTLEY-LEONARD Darryl Hartley-Leonard | | Trustee |
| | |
| February 22, 2012 | | /s/ WILLIAM S. MCCALMONT William S. McCalmont | | Trustee |
| | |
| February 22, 2012 | | /s/ DONALD S. PERKINS Donald S. Perkins | | Trustee |
| | |
| February 22, 2012 | | /s/ STUART L. SCOTT Stuart L. Scott | | Chairman of the Board of Trustees |
| | |
| February 22, 2012 | | /s/ DONALD A. WASHBURN Donald A. Washburn | | Trustee |
| | |
| February 22, 2012 | | /s/ BRUCE A. RIGGINS Bruce A. Riggins | | Executive Vice President and Chief Financial Officer (Principal Financial Officer and Principal Accounting Officer) |
| | |
| February 22, 2012 | | /s/ ALFRED L. YOUNG Alfred L. Young | | Executive Vice President and Chief Operating Officer |
51
LASALLE HOTEL PROPERTIES
Index to Financial Statements
F-1
Report of Independent Registered Public Accounting Firm
The Shareholders and Board of Trustees
LaSalle Hotel Properties:
We have audited the accompanying consolidated balance sheets of LaSalle Hotel Properties (the Company) as of December 31, 2011 and 2010, and the related consolidated statements of operations, equity, and cash flows for each of the years in the three-year period ended December 31, 2011. In connection with our audits of the consolidated financial statements, we also have audited financial statement schedule III. These consolidated financial statements and financial statement schedule are the responsibility of the Company’s management. Our responsibility is to express an opinion on these consolidated financial statements and financial statement schedule based on our audits.
We conducted our audits in accordance with the standards of the Public Company Accounting Oversight Board (United States). Those standards require that we plan and perform the audit to obtain reasonable assurance about whether the financial statements are free of material misstatement. An audit includes examining, on a test basis, evidence supporting the amounts and disclosures in the financial statements. An audit also includes assessing the accounting principles used and significant estimates made by management, as well as evaluating the overall financial statement presentation. We believe that our audits provide a reasonable basis for our opinion.
In our opinion, the consolidated financial statements referred to above present fairly, in all material respects, the financial position of LaSalle Hotel Properties as of December 31, 2011 and 2010, and the results of their operations and their cash flows for each of the years in the three-year period ended December 31, 2011, in conformity with U.S. generally accepted accounting principles. Also in our opinion, the related financial statement schedule, when considered in relation to the basic consolidated financial statements taken as a whole, presents fairly, in all material respects, the information set forth therein.
We also have audited, in accordance with the standards of the Public Company Accounting Oversight Board (United States), LaSalle Hotel Properties’ internal control over financial reporting as of December 31, 2011, based on criteria established inInternal Control—Integrated Framework issued by the Committee of Sponsoring Organizations of the Treadway Commission, and our report dated February 22, 2012, expressed an unqualified opinion on the effectiveness of the Company’s internal control over financial reporting.
/s/ KPMG LLP
Chicago, Illinois
February 22, 2012
F-2
Report of Independent Registered Public Accounting Firm
The Shareholders and Board of Trustees
LaSalle Hotel Properties:
We have audited LaSalle Hotel Properties’ (the Company) internal control over financial reporting as of December 31, 2011, based on criteria established inInternal Control—Integrated Framework issued by the Committee of Sponsoring Organizations of the Treadway Commission (COSO). LaSalle Hotel Properties’ management is responsible for maintaining effective internal control over financial reporting and for its assessment of the effectiveness of internal control over financial reporting, included in the accompanying Management’s Report on Internal Control over Financial Reporting. Our responsibility is to express an opinion on the Company’s internal control over financial reporting based on our audit.
We conducted our audit in accordance with the standards of the Public Company Accounting Oversight Board (United States). Those standards require that we plan and perform the audit to obtain reasonable assurance about whether effective internal control over financial reporting was maintained in all material respects. Our audit included obtaining an understanding of internal control over financial reporting, assessing the risk that a material weakness exists, and testing and evaluating the design and operating effectiveness of internal control based on the assessed risk. Our audit also included performing such other procedures as we considered necessary in the circumstances. We believe that our audit provides a reasonable basis for our opinion.
A company’s internal control over financial reporting is a process designed to provide reasonable assurance regarding the reliability of financial reporting and the preparation of financial statements for external purposes in accordance with generally accepted accounting principles. A company’s internal control over financial reporting includes those policies and procedures that (1) pertain to the maintenance of records that, in reasonable detail, accurately and fairly reflect the transactions and dispositions of the assets of the company; (2) provide reasonable assurance that transactions are recorded as necessary to permit preparation of financial statements in accordance with generally accepted accounting principles, and that receipts and expenditures of the company are being made only in accordance with authorizations of management and directors of the company; and (3) provide reasonable assurance regarding prevention or timely detection of unauthorized acquisition, use, or disposition of the company’s assets that could have a material effect on the financial statements.
Because of its inherent limitations, internal control over financial reporting may not prevent or detect misstatements. Also, projections of any evaluation of effectiveness to future periods are subject to the risk that controls may become inadequate because of changes in conditions, or that the degree of compliance with the policies or procedures may deteriorate.
In our opinion, LaSalle Hotel Properties maintained, in all material respects, effective internal control over financial reporting as of December 31, 2011, based on criteria established inInternal Control—IntegratedFramework issued by the Committee of Sponsoring Organizations of the Treadway Commission.
We also have audited, in accordance with the standards of the Public Company Accounting Oversight Board (United States), the consolidated balance sheets of LaSalle Hotel Properties as of December 31, 2011 and 2010, and the related consolidated statements of operations, equity, and cash flows for each of the years in the three-year period ended December 31, 2011, and our report dated February 22, 2012, expressed an unqualified opinion on those consolidated financial statements.
/s/ KPMG LLP
Chicago, Illinois
February 22, 2012
F-3
LASALLE HOTEL PROPERTIES
Consolidated Balance Sheets
(in thousands, except share data)
| | | | | | | | |
| | | December 31,
2011 | | | December 31,
2010 | |
Assets: | | | | | | | | |
Investment in hotel properties, net (Note 3) | | $ | 2,712,174 | | | $ | 2,229,362 | |
Property under development (Note 3) | | | 21,346 | | | | 15,601 | |
Assets held for sale (Note 3) | | | 0 | | | | 20,000 | |
Cash and cash equivalents | | | 20,225 | | | | 13,000 | |
Restricted cash reserves (Notes 2 and 5) | | | 16,969 | | | | 19,267 | |
Hotel receivables (net of allowance for doubtful accounts of $321 and $1,118, respectively) | | | 23,760 | | | | 20,074 | |
Deferred financing costs, net | | | 6,235 | | | | 1,583 | |
Deferred tax assets (Note 9) | | | 5,250 | | | | 10,654 | |
Prepaid expenses and other assets | | | 27,316 | | | | 25,504 | |
| | | | | | | | |
Total assets | | $ | 2,833,275 | | | $ | 2,355,045 | |
| | | | | | | | |
Liabilities: | | | | | | | | |
Borrowings under credit facilities (Note 4) | | $ | 265,000 | | | $ | 120,193 | |
Bonds payable (Note 4) | | | 42,500 | | | | 42,500 | |
Mortgage loans (including unamortized premium of $195 and $269, respectively) (Note 4) | | | 643,897 | | | | 646,207 | |
Accounts payable and accrued expenses | | | 78,407 | | | | 73,817 | |
Liabilities of assets held for sale (Note 3) | | | 0 | | | | 2,380 | |
Advance deposits | | | 12,085 | | | | 8,601 | |
Accrued interest | | | 3,492 | | | | 3,073 | |
Distributions payable | | | 16,651 | | | | 14,725 | |
| | | | | | | | |
Total liabilities | | | 1,062,032 | | | | 911,496 | |
| | | | | | | | |
Redeemable noncontrolling interest in consolidated entity (Note 3) | | | 0 | | | | 49 | |
| | | | | | | | |
Commitments and contingencies (Note 5) | | | | | | | | |
Equity: | | | | | | | | |
Shareholders’ Equity: | | | | | | | | |
Preferred shares, $0.01 par value (liquidation preference of $394,222 and $352,972, respectively), 40,000,000 shares authorized; 15,768,888 and 14,118,888 shares issued and outstanding, respectively (Note 6) | | | 158 | | | | 141 | |
Common shares of beneficial interest, $0.01 par value, 200,000,000 shares authorized; 85,176,506 shares issued and 83,786,932 shares outstanding, and 73,061,144 shares issued and 73,059,600 shares outstanding, respectively (Note 6) | | | 851 | | | | 731 | |
Treasury shares, at cost (Note 6) | | | (24,543 | ) | | | (28 | ) |
Additional paid-in capital, net of offering costs of $66,146 and $60,938, respectively | | | 2,029,145 | | | | 1,659,258 | |
Distributions in excess of retained earnings | | | (239,998 | ) | | | (216,635 | ) |
| | | | | | | | |
Total shareholders’ equity | | | 1,765,613 | | | | 1,443,467 | |
| | | | | | | | |
Noncontrolling Interests: | | | | | | | | |
Noncontrolling interests in consolidated entity | | | 17 | | | | 33 | |
Noncontrolling interests of common units in Operating Partnership (Notes 2 and 6) | | | 5,613 | | | | 0 | |
| | | | | | | | |
Total noncontrolling interests | | | 5,630 | | | | 33 | |
| | | | | | | | |
Total equity | | | 1,771,243 | | | | 1,443,500 | |
| | | | | | | | |
Total liabilities and equity | | $ | 2,833,275 | | | $ | 2,355,045 | |
| | | | | | | | |
The accompanying notes are an integral part of these consolidated financial statements.
F-4
LASALLE HOTEL PROPERTIES
Consolidated Statements of Operations
(in thousands, except share data)
| | | | | | | | | | | | |
| | | For the year ended
December 31, | |
| | | 2011 | | | 2010 | | | 2009 | |
Revenues: | | | | | | | | | | | | |
Hotel operating revenues: | | | | | | | | | | | | |
Room | | $ | 471,023 | | | $ | 388,108 | | | $ | 346,604 | |
Food and beverage | | | 193,332 | | | | 162,831 | | | | 147,252 | |
Other operating department | | | 49,650 | | | | 43,703 | | | | 42,088 | |
| | | | | | | | | | | | |
Total hotel operating revenues | | | 714,005 | | | | 594,642 | | | | 535,944 | |
Other income | | | 5,002 | | | | 5,715 | | | | 6,702 | |
| | | | | | | | | | | | |
Total revenues | | | 719,007 | | | | 600,357 | | | | 542,646 | |
| | | | | | | | | | | | |
Expenses: | | | | | | | | | | | | |
Hotel operating expenses: | | | | | | | | | | | | |
Room | | | 115,839 | | | | 95,271 | | | | 84,008 | |
Food and beverage | | | 133,838 | | | | 112,757 | | | | 99,551 | |
Other direct | | | 20,390 | | | | 18,753 | | | | 17,620 | |
Other indirect (Note 8) | | | 182,771 | | | | 153,678 | | | | 137,360 | |
| | | | | | | | | | | | |
Total hotel operating expenses | | | 452,838 | | | | 380,459 | | | | 338,539 | |
Depreciation and amortization | | | 111,282 | | | | 105,587 | | | | 102,856 | |
Real estate taxes, personal property taxes and insurance | | | 35,425 | | | | 30,897 | | | | 29,460 | |
Ground rent (Note 5) | | | 7,720 | | | | 5,825 | | | | 5,706 | |
General and administrative | | | 17,120 | | | | 18,802 | | | | 15,033 | |
Acquisition transaction costs (Note 3) | | | 2,571 | | | | 3,003 | | | | 0 | |
Impairment of development property (Note 3) | | | 0 | | | | 8,427 | | | | 0 | |
Other expenses | | | 2,527 | | | | 3,287 | | | | 3,016 | |
| | | | | | | | | | | | |
Total operating expenses | | | 629,483 | | | | 556,287 | | | | 494,610 | |
| | | | | | | | | | | | |
Operating income | | | 89,524 | | | | 44,070 | | | | 48,036 | |
Interest income | | | 48 | | | | 126 | | | | 63 | |
Interest expense | | | (39,704 | ) | | | (36,500 | ) | | | (37,951 | ) |
| | | | | | | | | | | | |
Income before income tax expense and discontinued operations | | | 49,868 | | | | 7,696 | | | | 10,148 | |
Income tax expense (Note 9) | | | (7,048 | ) | | | (5,075 | ) | | | (4,590 | ) |
| | | | | | | | | | | | |
Income from continuing operations | | | 42,820 | | | | 2,621 | | | | 5,558 | |
| | | | | | | | | | | | |
Discontinued operations (Note 3): | | | | | | | | | | | | |
Income (loss) from operations of properties disposed of, including gain on sale and loss on impairment | | | 829 | | | | (2,502 | ) | | | 2,079 | |
Income tax (expense) benefit (Note 9) | | | (33 | ) | | | 1,651 | | | | 333 | |
| | | | | | | | | | | | |
Net income (loss) from discontinued operations | | | 796 | | | | (851 | ) | | | 2,412 | |
| | | | | | | | | | | | |
Net income | | | 43,616 | | | | 1,770 | | | | 7,970 | |
| | | | | | | | | | | | |
Noncontrolling interests: | | | | | | | | | | | | |
Redeemable noncontrolling interest in loss of consolidated entity (Note 3) | | | 2 | | | | 191 | | | | 30 | |
Noncontrolling interests of common units in Operating Partnership (Notes 2 and 6) | | | (1 | ) | | | 0 | | | | (15 | ) |
Noncontrolling interests of preferred units in Operating Partnership (Notes 2 and 6) | | | 0 | | | | 0 | | | | (367 | ) |
| | | | | | | | | | | | |
Net loss (income) attributable to noncontrolling interests | | | 1 | | | | 191 | | | | (352 | ) |
| | | | | | | | | | | | |
Net income attributable to the Company | | | 43,617 | | | | 1,961 | | | | 7,618 | |
Distributions to preferred shareholders | | | (29,952 | ) | | | (26,754 | ) | | | (26,388 | ) |
Issuance costs of redeemed preferred shares (Note 6) | | | (731 | ) | | | 0 | | | | 0 | |
| | | | | | | | | | | | |
Net income (loss) attributable to common shareholders | | $ | 12,934 | | | $ | (24,793 | ) | | $ | (18,770 | ) |
| | | | | | | | | | | | |
F-5
LASALLE HOTEL PROPERTIES
Consolidated Statements of Operations—Continued
(in thousands, except share data)
| | | | | | | | | | | | |
| | | For the year ended
December 31, | |
| | | 2011 | | | 2010 | | | 2009 | |
Earnings per Common Share—Basic: | | | | | | | | | | | | |
Net income (loss) attributable to common shareholders before discontinued operations and excluding amounts attributable to unvested restricted shares | | $ | 0.15 | | | $ | (0.35 | ) | | $ | (0.39 | ) |
Discontinued operations | | | 0.01 | | | | (0.01 | ) | | | 0.05 | |
| | | | | | | | | | | | |
Net income (loss) attributable to common shareholders excluding amounts attributable to unvested restricted shares | | $ | 0.16 | | | $ | (0.36 | ) | | $ | (0.34 | ) |
| | | | | | | | | | | | |
Earnings per Common Share—Diluted: | | | | | | | | | | | | |
Net income (loss) attributable to common shareholders before discontinued operations and excluding amounts attributable to unvested restricted shares | | $ | 0.15 | | | $ | (0.35 | ) | | $ | (0.39 | ) |
Discontinued operations | | | 0.01 | | | | (0.01 | ) | | | 0.05 | |
| | | | | | | | | | | | |
Net income (loss) attributable to common shareholders excluding amounts attributable to unvested restricted shares | | $ | 0.16 | | | $ | (0.36 | ) | | $ | (0.34 | ) |
| | | | | | | | | | | | |
Weighted average number of common shares outstanding: | | | | | | | | | | | | |
Basic | | | 81,155,228 | | | | 69,549,441 | | | | 54,477,414 | |
Diluted | | | 81,326,304 | | | | 69,549,441 | | | | 54,477,414 | |
The accompanying notes are an integral part of these consolidated financial statements.
F-6
LASALLE HOTEL PROPERTIES
Consolidated Statements of Equity
(in thousands, except per share/unit data)
| | | | | | | | | | | | | | | | | | | | | | | | | | | | | | | | | | | | | | | | | | | | |
| | | Preferred
Shares | | | Common
Shares of
Beneficial
Interest | | | Treasury
Shares | | | Additional
Paid-In
Capital | | | Distributions
in Excess of
Retained
Earnings | | | Total
Shareholders’
Equity | | | Noncontrolling
Interests in
Consolidated
Entity | | | Noncontrolling
Interests of
Common
Units in
Operating
Partnership | | | Noncontrolling
Interests of
Preferred
Units in
Operating
Partnership | | | Total
Noncontrolling
Interests | | | Total
Equity | |
Balance, December 31, 2008 | | $ | 118 | | | $ | 411 | | | $ | 0 | | | $ | 1,146,581 | | | $ | (153,438 | ) | | $ | 993,672 | | | $ | 64 | | | $ | 668 | | | $ | 59,739 | | | $ | 60,471 | | | $ | 1,054,143 | |
Issuance of shares, net of offering costs | | | 0 | | | | 224 | | | | 58 | | | | 260,247 | | | | 0 | | | | 260,529 | | | | 0 | | | | 0 | | | | 0 | | | | 0 | | | | 260,529 | |
Repurchase of common shares into treasury | | | 0 | | | | 0 | | | | (365 | ) | | | 0 | | | | 0 | | | | (365 | ) | | | 0 | | | | 0 | | | | 0 | | | | 0 | | | | (365 | ) |
Options exercised | | | 0 | | | | 0 | | | | 0 | | | | 342 | | | | 0 | | | | 342 | | | | 0 | | | | 0 | | | | 0 | | | | 0 | | | | 342 | |
Unit conversions | | | 23 | | | | 0 | | | | 0 | | | | 59,134 | | | | 0 | | | | 59,157 | | | | 0 | | | | (446 | ) | | | (58,675 | ) | | | (59,121 | ) | | | 36 | |
Deferred compensation, net | | | 0 | | | | 1 | | | | 307 | | | | 3,191 | | | | 207 | | | | 3,706 | | | | 0 | | | | 0 | | | | 0 | | | | 0 | | | | 3,706 | |
Adjustments to noncontrolling interests | | | 0 | | | | 0 | | | | 0 | | | | 235 | | | | 0 | | | | 235 | | | | 0 | | | | (235 | ) | | | 0 | | | | (235 | ) | | | 0 | |
Redeemable noncontrolling interest | | | 0 | | | | 0 | | | | 0 | | | | 0 | | | | 30 | | | | 30 | | | | 0 | | | | 0 | | | | 0 | | | | 0 | | | | 30 | |
Distributions on common shares/units ($0.04 per share/unit) | | | 0 | | | | 0 | | | | 0 | | | | 0 | | | | (2,320 | ) | | | (2,320 | ) | | | 0 | | | | (2 | ) | | | 0 | | | | (2 | ) | | | (2,322 | ) |
Distributions on preferred shares/units | | | 0 | | | | 0 | | | | 0 | | | | 0 | | | | (26,387 | ) | | | (26,387 | ) | | | (16 | ) | | | 0 | | | | (1,431 | ) | | | (1,447 | ) | | | (27,834 | ) |
Net income | | | 0 | | | | 0 | | | | 0 | | | | 0 | | | | 7,588 | | | | 7,588 | | | | 0 | | | | 15 | | | | 367 | | | | 382 | | | | 7,970 | |
| | | | | | | | | | | | | | | | | | | | | | | | | | | | | | | | | | | | | | | | | | | | |
Balance, December 31, 2009 | | $ | 141 | | | $ | 636 | | | $ | 0 | | | $ | 1,469,730 | | | $ | (174,320 | ) | | $ | 1,296,187 | | | $ | 48 | | | $ | 0 | | | $ | 0 | | | $ | 48 | | | $ | 1,296,235 | |
Issuance of shares, net of offering costs | | | 0 | | | | 95 | | | | 830 | | | | 183,191 | | | | 0 | | | | 184,116 | | | | 0 | | | | 0 | | | | 0 | | | | 0 | | | | 184,116 | |
Repurchase of common shares into treasury | | | 0 | | | | 0 | | | | (566 | ) | | | 0 | | | | 0 | | | | (566 | ) | | | 0 | | | | 0 | | | | 0 | | | | 0 | | | | (566 | ) |
Options exercised | | | 0 | | | | 0 | | | | 0 | | | | 171 | | | | 0 | | | | 171 | | | | 0 | | | | 0 | | | | 0 | | | | 0 | | | | 171 | |
Deferred compensation, net | | | 0 | | | | 0 | | | | (292 | ) | | | 6,166 | | | | 17 | | | | 5,891 | | | | 0 | | | | 0 | | | | 0 | | | | 0 | | | | 5,891 | |
Redeemable noncontrolling interest | | | 0 | | | | 0 | | | | 0 | | | | 0 | | | | 191 | | | | 191 | | | | 0 | | | | 0 | | | | 0 | | | | 0 | | | | 191 | |
Distributions on issued long-term performance-based share awards | | | 0 | | | | 0 | | | | 0 | | | | 0 | | | | (46 | ) | | | (46 | ) | | | 0 | | | | 0 | | | | 0 | | | | 0 | | | | (46 | ) |
Distributions on common shares ($0.24 per share) | | | 0 | | | | 0 | | | | 0 | | | | 0 | | | | (17,493 | ) | | | (17,493 | ) | | | 0 | | | | 0 | | | | 0 | | | | 0 | | | | (17,493 | ) |
Distributions on preferred shares | | | 0 | | | | 0 | | | | 0 | | | | 0 | | | | (26,754 | ) | | | (26,754 | ) | | | (15 | ) | | | 0 | | | | 0 | | | | (15 | ) | | | (26,769 | ) |
Net income | | | 0 | | | | 0 | | | | 0 | | | | 0 | | | | 1,770 | | | | 1,770 | | | | 0 | | | | 0 | | | | 0 | | | | 0 | | | | 1,770 | |
| | | | | | | | | | | | | | | | | | | | | | | | | | | | | | | | | | | | | | | | | | | | |
Balance, December 31, 2010 | | $ | 141 | | | $ | 731 | | | $ | (28 | ) | | $ | 1,659,258 | | | $ | (216,635 | ) | | $ | 1,443,467 | | | $ | 33 | | | $ | 0 | | | $ | 0 | | | $ | 33 | | | $ | 1,443,500 | |
F-7
LASALLE HOTEL PROPERTIES
Consolidated Statements of Equity—Continued
(in thousands, except per share/unit data)
| | | | | | | | | | | | | | | | | | | | | | | | | | | | | | | | | | | | | | | | | | | | |
| | | Preferred
Shares | | | Common
Shares of
Beneficial
Interest | | | Treasury
Shares | | | Additional
Paid-In
Capital | | | Distributions
in Excess of
Retained
Earnings | | | Total
Shareholders’
Equity | | | Noncontrolling
Interests in
Consolidated
Entity | | | Noncontrolling
Interests of
Common
Units in
Operating
Partnership | | | Noncontrolling
Interests of
Preferred
Units in
Operating
Partnership | | | Total
Noncontrolling
Interests | | | Total
Equity | |
Issuance of shares, net of offering costs | | | 28 | | | | 120 | | | | 258 | | | | 393,601 | | | | 0 | | | | 394,007 | | | | 0 | | | | 0 | | | | 0 | | | | 0 | | | | 394,007 | |
Redemption of preferred shares | | | (11 | ) | | | 0 | | | | 0 | | | | (26,758 | ) | | | (731 | ) | | | (27,500 | ) | | | 0 | | | | 0 | | | | 0 | | | | 0 | | | | (27,500 | ) |
Repurchase of common shares into treasury | | | 0 | | | | 0 | | | | (27,601 | ) | | | 0 | | | | 0 | | | | (27,601 | ) | | | 0 | | | | 0 | | | | 0 | | | | 0 | | | | (27,601 | ) |
Options exercised | | | 0 | | | | 0 | | | | 0 | | | | 83 | | | | 0 | | | | 83 | | | | 0 | | | | 0 | | | | 0 | | | | 0 | | | | 83 | |
Issuance of units | | | 0 | | | | 0 | | | | 0 | | | | 0 | | | | 0 | | | | 0 | | | | 0 | | | | 7,245 | | | | 0 | | | | 7,245 | | | | 7,245 | |
Deferred compensation, net | | | 0 | | | | 0 | | | | 2,828 | | | | 1,360 | | | | 0 | | | | 4,188 | | | | 0 | | | | 0 | | | | 0 | | | | 0 | | | | 4,188 | |
Adjustments to noncontrolling interests | | | 0 | | | | 0 | | | | 0 | | | | 1,601 | | | | 0 | | | | 1,601 | | | | 0 | | | | (1,601 | ) | | | 0 | | | | (1,601 | ) | | | 0 | |
Redeemable noncontrolling interest | | | 0 | | | | 0 | | | | 0 | | | | 0 | | | | 2 | | | | 2 | | | | 0 | | | | 0 | | | | 0 | | | | 0 | | | | 2 | |
Distributions on issued long-term performance-based share awards | | | 0 | | | | 0 | | | | 0 | | | | 0 | | | | (69 | ) | | | (69 | ) | | | 0 | | | | 0 | | | | 0 | | | | 0 | | | | (69 | ) |
Distributions on common shares/units ($0.44 per share/unit) | | | 0 | | | | 0 | | | | 0 | | | | 0 | | | | (36,228 | ) | | | (36,228 | ) | | | 0 | | | | (32 | ) | | | 0 | | | | (32 | ) | | | (36,260 | ) |
Distributions on preferred shares | | | 0 | | | | 0 | | | | 0 | | | | 0 | | | | (29,952 | ) | | | (29,952 | ) | | | (16 | ) | | | 0 | | | | 0 | | | | (16 | ) | | | (29,968 | ) |
Net income | | | 0 | | | | 0 | | | | 0 | | | | 0 | | | | 43,615 | | | | 43,615 | | | | 0 | | | | 1 | | | | 0 | | | | 1 | | | | 43,616 | |
| | | | | | | | | | | | | | | | | | | | | | | | | | | | | | | | | | | | | | | | | | | | |
Balance, December 31, 2011 | | $ | 158 | | | $ | 851 | | | $ | (24,543 | ) | | $ | 2,029,145 | | | $ | (239,998 | ) | | $ | 1,765,613 | | | $ | 17 | | | $ | 5,613 | | | $ | 0 | | | $ | 5,630 | | | $ | 1,771,243 | |
| | | | | | | | | | | | | | | | | | | | | | | | | | | | | | | | | | | | | | | | | | | | |
The accompanying notes are an integral part of these consolidated financial statements.
F-8
LASALLE HOTEL PROPERTIES
Consolidated Statements of Cash Flows
(in thousands)
| | | | | | | | | | | | |
| | | For the year ended December 31, | |
| | | 2011 | | | 2010 | | | 2009 | |
Cash flows from operating activities: | | | | | | | | | | | | |
Net income | | $ | 43,616 | | | $ | 1,770 | | | $ | 7,970 | |
Adjustments to reconcile net income to net cash provided by operating activities: | | | | | | | | | | | | |
Depreciation and amortization | | | 111,282 | | | | 110,676 | | | | 109,896 | |
Amortization of deferred financing costs and mortgage premium | | | 893 | | | | 834 | | | | 925 | |
Gain on sale of properties | | | (760 | ) | | | (29,162 | ) | | | 0 | |
Loss on impairment of properties | | | 0 | | | | 36,129 | | | | 0 | |
Deferred compensation | | | 4,188 | | | | 5,891 | | | | 3,705 | |
Allowance for doubtful accounts | | | (797 | ) | | | 237 | | | | (459 | ) |
Other | | | 0 | | | | (700 | ) | | | 137 | |
Changes in assets and liabilities: | | | | | | | | | | | | |
Restricted cash reserves | | | 3,284 | | | | (1,061 | ) | | | 126 | |
Rent receivable | | | 0 | | | | 0 | | | | 85 | |
Hotel receivables | | | (2,660 | ) | | | (81 | ) | | | 3,572 | |
Deferred tax assets | | | 5,404 | | | | 2,994 | | | | 3,836 | |
Prepaid expenses and other assets | | | 1,070 | | | | (3,528 | ) | | | 6,877 | |
Accounts payable and accrued expenses | | | (2,936 | ) | | | 8,802 | | | | (22,157 | ) |
Advance deposits | | | 2,492 | | | | (1,264 | ) | | | (2,069 | ) |
Accrued interest | | | 419 | | | | 35 | | | | (386 | ) |
| | | | | | | | | | | | |
Net cash provided by operating activities | | | 165,495 | | | | 131,572 | | | | 112,058 | |
| | | | | | | | | | | | |
Cash flows from investing activities: | | | | | | | | | | | | |
Improvements and additions to properties | | | (54,820 | ) | | | (33,932 | ) | | | (29,588 | ) |
Acquisition of properties | | | (533,767 | ) | | | (455,980 | ) | | | 0 | |
Purchase of office furniture and equipment | | | (90 | ) | | | (127 | ) | | | (23 | ) |
Restricted cash reserves | | | (986 | ) | | | (3,726 | ) | | | (2,023 | ) |
Proceeds from sale of properties | | | 19,727 | | | | 120,855 | | | | 0 | |
Property insurance proceeds | | | 0 | | | | 1,393 | | | | 0 | |
| | | | | | | | | | | | |
Net cash used in investing activities | | | (569,936 | ) | | | (371,517 | ) | | | (31,634 | ) |
| | | | | | | | | | | | |
Cash flows from financing activities: | | | | | | | | | | | | |
Borrowings under credit facilities | | | 429,191 | | | | 478,807 | | | | 284,039 | |
Repayments under credit facilities | | | (284,384 | ) | | | (364,873 | ) | | | (512,285 | ) |
Repayments of mortgage loans | | | (2,236 | ) | | | (13,109 | ) | | | (90,227 | ) |
Payment of deferred financing costs | | | (5,358 | ) | | | (549 | ) | | | 0 | |
Distributions to redeemable noncontrolling interest | | | (47 | ) | | | (2,499 | ) | | | 0 | |
Purchase of treasury shares | | | (27,601 | ) | | | (566 | ) | | | (365 | ) |
Proceeds from exercise of stock options | | | 83 | | | | 171 | | | | 342 | |
Proceeds from issuance of preferred shares | | | 68,750 | | | | 0 | | | | 0 | |
Payment of preferred offering costs | | | (2,380 | ) | | | 0 | | | | 0 | |
Proceeds from issuance of common shares | | | 331,030 | | | | 190,322 | | | | 272,361 | |
Payment of common offering costs | | | (3,559 | ) | | | (6,316 | ) | | | (11,943 | ) |
Distributions on issued long-term performance-based share awards | | | (69 | ) | | | (46 | ) | | | 0 | |
Redemption of preferred shares | | | (27,500 | ) | | | 0 | | | | (11 | ) |
Distributions on preferred shares/units | | | (29,255 | ) | | | (26,769 | ) | | | (26,770 | ) |
Distributions on common shares/units | | | (34,999 | ) | | | (10,069 | ) | | | (5,180 | ) |
| | | | | | | | | | | | |
Net cash provided by (used in) financing activities | | | 411,666 | | | | 244,504 | | | | (90,039 | ) |
| | | | | | | | | | | | |
Net change in cash and cash equivalents | | | 7,225 | | | | 4,559 | | | | (9,615 | ) |
Cash and cash equivalents, beginning of year | | | 13,000 | | | | 8,441 | | | | 18,056 | |
| | | | | | | | | | | | |
Cash and cash equivalents, end of year | | $ | 20,225 | | | $ | 13,000 | | | $ | 8,441 | |
| | | | | | | | | | | | |
The accompanying notes are an integral part of these consolidated financial statements.
F-9
LASALLE HOTEL PROPERTIES
Notes to Consolidated Financial Statements
(in thousands, except share/unit data)
LaSalle Hotel Properties (the “Company”), a Maryland real estate investment trust (“REIT”) organized on January 15, 1998, primarily buys, owns, redevelops and leases upscale and luxury full-service hotels located in convention, resort and major urban business markets. The Company is a self-administered and self-managed REIT as defined in the Internal Revenue Code of 1986, as amended (the “Code”). As a REIT, the Company is generally not subject to federal corporate income tax on that portion of its net income that is currently distributed to shareholders. The income of LaSalle Hotel Lessee, Inc. (“LHL”), the Company’s wholly owned taxable-REIT subsidiary, is subject to taxation at normal corporate rates.
As of December 31, 2011, the Company owned interests in 37 hotels with over 9,800 guest rooms located in nine states and the District of Columbia. Each hotel is leased to LHL (see Note 8) or a wholly owned subsidiary of LHL under a participating lease that provides for rental payments equal to the greater of (i) a base rent or (ii) a participating rent based on hotel revenues. The LHL leases expire between December 2012 and December 2015. Lease revenue from LHL and its wholly owned subsidiaries is eliminated in consolidation. A third-party or non-affiliated hotel operator manages each hotel, which is also subject to a hotel management agreement.
Substantially all of the Company’s assets are held by, and all of its operations are conducted through, LaSalle Hotel Operating Partnership, LP (the “Operating Partnership”). The Company is the sole general partner of the Operating Partnership. The Company owned, through a combination of direct and indirect interests, 99.6% of the common units of the Operating Partnership at December 31, 2011. The remaining 0.4% is held by limited partners who held 296,300 common units of limited partnership interest at December 31, 2011. See Note 6 for additional disclosures on common and preferred operating partnership units.
| 2. | Summary of Significant Accounting Policies |
Basis of Presentation
The consolidated financial statements include the accounts of the Company, the Operating Partnership, LHL and their subsidiaries in which they have a controlling interest, including joint ventures. All significant intercompany balances and transactions have been eliminated.
Use of Estimates
The preparation of the consolidated financial statements in conformity with U.S. generally accepted accounting principles (“GAAP”) requires management to make estimates and assumptions that affect the reported amounts of certain assets and liabilities and the amounts of contingent assets and liabilities at the balance sheet date and the reported amounts of revenues and expenses during the reporting periods. Actual results could differ from those estimates.
Risks and Uncertainties
The state of the overall economy can significantly impact hotel operational performance and thus, impact the Company’s financial position. Should any of the hotels experience a significant decline in operational performance, it may affect the Company’s ability to make distributions to its shareholders, service debt or meet other financial obligations.
F-10
Fair Value Measurements
In evaluating fair value, GAAP outlines a valuation framework and creates a fair value hierarchy that distinguishes between market assumptions based on market data (observable inputs) and a reporting entity’s own assumptions about market data (unobservable inputs). The hierarchy ranks the quality and reliability of inputs used to determine fair value, which are then classified and disclosed in one of the three categories. The three levels are as follows:
Level 1—Inputs are quoted prices (unadjusted) in active markets for identical assets or liabilities.
Level 2—Inputs include quoted prices in active markets for similar assets and liabilities, quoted prices for identical or similar assets or liabilities in markets that are not active, and model-derived valuations whose inputs are observable.
Level 3—Model-derived valuations with unobservable inputs.
As required by the guidance, the Company classifies assets and liabilities based on the lowest level of input that is significant to the fair value measurement.
Investment in Hotel Properties
Upon acquisition, the Company allocates the purchase price to asset classes based on the fair value of the acquired real estate, furniture, fixtures and equipment, assumed debt and any intangible assets or liabilities. The Company’s investments in hotel properties are carried at cost and depreciated using the straight-line method over an estimated useful life of 30 to 40 years for buildings, 15 years for building improvements, the shorter of the useful life of the improvement or the term of the related tenant lease for tenant improvements, 7 years for land improvements, 20 years for golf course land improvements, 20 years for swimming pool assets and 3 to 5 years for furniture, fixtures and equipment. For investments subject to ground or land and building leases, assets are recorded at the estimated fair value of the right to use the leased property at acquisition and depreciated over the shorter of the useful lives of the assets or the term of the respective lease. Renovations and/or replacements that improve or extend the life of the asset are capitalized and depreciated over their estimated useful lives.
The Company is required to make subjective assessments as to the useful lives and classification of its properties for purposes of determining the amount of depreciation expense to reflect each year with respect to those properties. These assessments have a direct impact on the Company’s net income. Should the Company change the expected useful life or classification of particular assets, it would result in a change in depreciation expense and annual net income.
The Company reviews each hotel for impairment at the end of each reporting period or as events and circumstances dictate throughout the year. A property is considered impaired when the sum of estimated future undiscounted cash flows over the estimated remaining holding period is less than the carrying amount of a property.
At the end of each reporting period, the Company assesses whether any quantitative or qualitative triggering events have occurred in relation to a property. Examples of situations considered to be triggering events include:
| | • | | a substantial decline in operating cash flows during the period, including declines related to decreased occupancy, ADR or RevPAR; |
| | • | | a current or projected loss from operations; |
| | • | | a significant cost accumulation above the original acquisition/development estimate; |
F-11
| | • | | a change in plan to sell the property prior to the end of its useful life or holding period; |
| | • | | a significant decrease in market price not in line with general market trends; and |
| | • | | any other quantitative or qualitative events deemed significant by our management or our Board of Trustees. |
If the presence of one or more triggering events as described above is identified at the end of a reporting period or throughout the year with respect to a hotel, the Company performs a recoverability test. In doing so, an estimate of undiscounted future cash flows over the estimated remaining holding period is compared to the carrying amount of the hotel.
If the results of a recoverability analysis indicate that the carrying amount of a hotel exceeds the estimated future undiscounted cash flows, impairment is indicated. Upon presentation to, discussion with, and approval from the Board of Trustees, an impairment charge is recorded equal to the excess of the carrying value of the hotel over the fair value. When performing a recoverability test or estimating the fair value of a property, the Company makes certain assumptions including, but not limited to, consideration of:
| | • | | projected operating cash flows – considering factors such as booking pace, growth rates, occupancy, room rates, property-specific operating costs and future capital expenditures; |
| | • | | projected cash flows from the eventual disposition of the hotel or development property based upon our estimation of a property-specific capitalization rate; |
| | • | | property-specific discount rate; and |
| | • | | comparable selling prices. |
In accordance with GAAP guidance, the Company considers a hotel as held for sale when a contract for sale is entered into, a substantial nonrefundable deposit has been received from the purchaser and sale is expected to occur within one year.
The Company accounts for profit recognition in accordance with GAAP guidance. Upon sale of a hotel, the Company determines its profit from the sale under the full accrual method provided the following applicable criteria are met: a sale is consummated; the buyer’s initial and continuing investments are adequate to demonstrate a commitment to pay for the property; the Company’s receivable, if applicable, is not subject to future subordination; the Company has transferred to the buyer the usual risks and rewards of ownership; and the Company does not have a substantial continuing involvement with the property. If all of these conditions are met, the Company will recognize the profit on the sale.
Interest, real estate taxes and insurance costs incurred during the renovation or development period are capitalized and depreciated over the lives of the renovated or developed assets. Capitalized interest for the years ended December 31, 2011, 2010 and 2009 was $459, $200 and $703, respectively.
Intangible Assets
The Company does not amortize intangible assets with indefinite useful lives. Non-amortizable intangible assets are reviewed annually for impairment and more frequently if events or circumstances indicate that the assets may be impaired. If a non-amortizable intangible asset is subsequently determined to have a finite useful life, the intangible asset will be written down to the lower of its fair value or carrying amount and then amortized prospectively, based on the remaining useful life of the intangible asset. As of December 31, 2011 and 2010, the Company did not have any value attributed to such intangible assets in the accompanying consolidated balance sheets.
F-12
Derivative/Financial Instruments
In the normal course of business, the Company is exposed to the effects of interest rate changes. As of December 31, 2011, approximately 32.3% of the Company’s borrowings were subject to variable rates. The Company limits the risks associated with interest rate changes by following established risk management policies and procedures which may include the use of derivatives. For interest rate exposures, derivatives are used primarily to align rate movements between interest rates associated with the Company’s hotel operating revenues and other financial assets with interest rates on related debt, and manage the cost of borrowing obligations. The Company may use derivative financial instruments to manage, or hedge, interest rate risk. The Company requires that hedging derivative instruments be effective in reducing the interest rate risk exposure that they are designated to hedge. This effectiveness is essential in order to qualify for hedge accounting. Instruments that meet these hedging criteria are formally designated as hedges at the inception of the derivative contract. When the terms of an underlying transaction are modified, or when the underlying hedged item ceases to exist, all changes in the fair value of the instrument are marked-to-market with changes in value included in net income or loss each period until the instrument matures. The Company did not use any derivative financial instruments during the years 2009 through 2011 and there were no derivatives outstanding as of December 31, 2011 and 2010.
Cash and Cash Equivalents
All highly liquid investments with a maturity of three months or less when purchased are considered to be cash equivalents.
Restricted Cash Reserves
At December 31, 2011, the Company held $16,969 in restricted cash reserves. Included in such amounts are (i) $11,585 of reserve funds relating to the hotels with leases or operating agreements requiring the Company to maintain restricted cash to fund future capital expenditures, (ii) $4,250 deposited in mortgage escrow accounts pursuant to mortgage obligations to pre-fund a portion of certain operating expenses and debt payments and (iii) $1,134 held by insurance companies on the Company’s behalf to be refunded or applied to future liabilities.
Deferred Financing Costs
Financing costs related to long-term debt are recorded at cost and are amortized as interest expense over the life of the related debt instrument. Accumulated amortization at December 31, 2011 and 2010 was $1,185 and $3,535, respectively.
Revenue Recognition
The Company recognizes hotel operating revenue on an accrual basis consistent with hotel operations. For retail operations, revenue is recognized on a straight line basis over the lives of the retail leases. Revenue from retail operations is included in other income in the accompanying consolidated statements of operations. Base and participating rent are each recognized based on quarterly thresholds pursuant to each participating lease.
F-13
Participating Leases
The participating leases have non-cancelable terms of three to five years (from commencement), subject to earlier termination upon the occurrence of certain contingencies, as defined. Each participating lease requires LHL or wholly owned subsidiary to pay the Operating Partnership or subsidiary the greater of (i) base rent in a fixed amount or (ii) participating rent based on certain percentages of room revenue, food and beverage revenue, telephone revenue and other revenue at the applicable hotel. Participating rent applicable to room and other hotel revenues varies by lease and is calculated by multiplying fixed percentages by the total amounts of such revenues over specified quarterly threshold amounts. Both the base rent and the participating rent thresholds used in computing percentage rents applicable to room and other hotel revenues, including food and beverage revenues, are subject to annual adjustments based on increases in the United States Consumer Price Index published by the Bureau of Labor Statistics of the United States of America Department of Labor, U.S. City Average, Urban Wage Earners and Clerical Workers. Lease revenue from LHL and its wholly owned subsidiaries is eliminated in consolidation.
Share-Based Compensation
From time to time, the Company awards nonvested shares under the 2009 Equity Incentive Plan (“2009 Plan”) as compensation to officers, employees and non-employee trustees (see Note 7). The shares issued to officers and employees vest over three to nine years. The Company recognizes compensation expense for nonvested shares on a straight-line basis over the vesting period based upon the fair market value of the shares on the date of issuance, adjusted for forfeitures.
Noncontrolling Interests
Per GAAP guidance, noncontrolling interest is the portion of equity (net assets) in a subsidiary not attributable, directly or indirectly, to a parent. The ownership interests in the subsidiary that are held by owners other than the parent are noncontrolling interests. Under this guidance, such noncontrolling interests are reported on the consolidated balance sheets within equity, separately from the Company’s equity. On the consolidated statements of operations, revenues, expenses and net income or loss from less-than-wholly-owned subsidiaries are reported at the consolidated amounts, including both the amounts attributable to the Company and noncontrolling interests. Consolidated statements of equity include beginning balances, activity for the period and ending balances for shareholders’ equity, noncontrolling interests and total equity.
However, per GAAP requirements, the Company’s securities that are redeemable for cash or other assets at the option of the holder, not solely within the control of the issuer, must be classified outside of permanent equity. The Company makes this determination based on terms in applicable agreements, specifically in relation to redemption provisions. Additionally, with respect to noncontrolling interests for which the Company has a choice to settle the contract by delivery of its own shares, the Company considered existing GAAP guidance to evaluate whether the Company controls the actions or events necessary to issue the maximum number of shares that could be required to be delivered under share settlement of the contract.
As of December 31, 2011, the consolidated results of the Company include the following ownership interests held by owners other than the Company: (i) the outside preferred ownership interests in a subsidiary and (ii) the common units in the Operating Partnership held by third parties.
F-14
Income Taxes
The Company has elected to be taxed as a REIT under Sections 856 through 860 of the Code commencing with its taxable year ended December 31, 1998. To qualify as a REIT, the Company must meet a number of organizational and operational requirements, including a requirement that it currently distribute at least 90% of its adjusted taxable income to its shareholders. It is the Company’s current intention to adhere to these requirements and maintain the Company’s qualification for taxation as a REIT. As a REIT, the Company generally is not subject to federal corporate income tax on that portion of its net income that is currently distributed to shareholders. If the Company fails to qualify for taxation as a REIT in any taxable year, it will be subject to federal income taxes at regular corporate rates (including any applicable alternative minimum tax) and may not be able to qualify as a REIT for four subsequent taxable years. Even if the Company qualifies for taxation as a REIT, the Company may be subject to certain state and local taxes on its income and property, and to federal income and excise taxes on its undistributed taxable income. In addition, taxable income from non-REIT activities managed through taxable REIT subsidiaries is subject to federal, state and local income taxes. As a wholly owned taxable-REIT subsidiary of the Company, LHL is required to pay income taxes at applicable federal, state and local rates.
Deferred tax assets and liabilities are recognized for the estimated future tax consequences attributable to differences between the financial statement carrying amounts of existing assets and liabilities and their respective tax bases. Deferred tax assets and liabilities are measured using enacted tax rates in effect for the year in which those temporary differences are expected to be recovered or settled. The effect on deferred tax assets and liabilities from a change in tax rates is recognized in earnings in the period when the new rate is enacted. However, deferred tax assets are recognized only to the extent that it is more likely than not that they will be realized based on consideration of available evidence, including future reversals of existing taxable temporary differences, future projected taxable income and tax planning strategies. The Company’s deferred tax assets balance consists primarily of net operating loss carryforwards (see Note 9).
Earnings per Common Share
Basic earnings per common share is based on the weighted average number of common shares of beneficial interest outstanding during the year excluding the weighted average number of unvested restricted shares (“participating securities” as defined in Note 10). The basic earnings per share calculation includes the effect of such participating securities. Diluted earnings per common share is based on the basic weighted average number of common shares of beneficial interest outstanding plus the effect of in-the-money stock options and compensation-related shares. Any anti-dilutive shares are excluded from the diluted earnings per share calculation.
Comprehensive Income
The purpose of reporting comprehensive income is to report a measure of all changes in equity of an entity that result from recognized transactions and other economic events of the period other than transactions with owners in their capacity as owners. Comprehensive income consists of all components of income, including other comprehensive income, which is excluded from net income. For the years ended December 31, 2011, 2010 and 2009, comprehensive income was $43,617, $1,961 and $7,618, respectively. As of December 31, 2011 and 2010, the Company’s accumulated other comprehensive income was zero.
F-15
| 3. | Investment in Properties |
Investment in hotel properties as of December 31, 2011 and 2010 consists of the following:
| | | | | | | | |
| | | December 31,
2011 | | | December 31,
2010 | |
Land | | $ | 438,938 | | | $ | 291,161 | |
Buildings and improvements | | | 2,586,788 | | | | 2,204,219 | |
Furniture, fixtures and equipment | | | 394,884 | | | | 331,658 | |
| | | | | | | | |
Investment in hotel properties, gross | | | 3,420,610 | | | | 2,827,038 | |
Accumulated depreciation | | | (708,436 | ) | | | (597,676 | ) |
| | | | | | | | |
Investment in hotel properties, net | | $ | 2,712,174 | | | $ | 2,229,362 | |
| | | | | | | | |
The December 31, 2011 balance of investment in hotel properties excludes $21,346 classified as property under development primarily at the Hotel Amarano Burbank, The Liaison Capitol Hill, Hotel Roger Williams, Westin Michigan Avenue and Le Montrose Suite Hotel. The December 31, 2010 balance of investment in hotel properties excludes $15,601 classified as property under development primarily at the Westin Copley Place, Hotel Viking and Hotel Amarano Burbank and $20,000 classified as assets held for sale consisting of the Sheraton Bloomington Hotel Minneapolis South property (see “Discontinued Operations” below).
The hotels owned as of December 31, 2011 are located in California (13), the District of Columbia (eight), Indiana, Illinois (two), Massachusetts (three), New York (three), Pennsylvania (two), Rhode Island, Virginia (two) and Washington state (two).
Investment in Joint Ventures
Effective December 22, 2010, the Company, through Modern Magic Hotel, LLC, a joint venture in which the Company held a 95.0% controlling interest, accepted an offer to sell its interest in the IBM Building located at 330 N. Wabash Avenue in downtown Chicago, IL, received a nonrefundable deposit and determined the property to be held for sale as of that date. This was deemed a triggering event for impairment since it represented a change in management’s plan with respect to the property, resulting in a change in the property’s estimated holding period. Accordingly, in 2010, the Company performed an impairment analysis and recorded an impairment loss of $8,427, which included a $2,700 termination fee paid to the development manager. The fair value was determined using the negotiated sales price per the terms of the sales contract, which is classified within level 2 of the fair value hierarchy (see Note 2), less estimated costs to sell. The loss to the Company, net of $154 allocated to the noncontrolling interest, was $8,273. On December 29, 2010, the Company sold its interest in the property for $58,800. The 5.0% interest of the outside partner was included in redeemable noncontrolling interest in the accompanying consolidated balance sheets as of December 31, 2010. On November 1, 2011, the joint venture was dissolved after final distributions to the partners were made.
On February 2, 2010, the Company’s joint venture arrangement with LaSalle Investment Management (“LIM”), entered into on April 17, 2008, was mutually dissolved. The joint venture arrangement with LIM, a leading global real estate investment manager, was to seek domestic hotel investments in high barrier-to-entry urban and resort markets in the U.S. During its existence, there were no acquisitions through the joint venture.
F-16
Acquisitions
During 2010, the Company acquired 100% interests in six full-service hotels, each of which is leased to LHL. The Company recorded the acquisitions at fair value using model-derived valuations, with the purchase price allocated to investment in hotel properties and hotel working capital assets and liabilities. In connection with the acquisitions, the Company incurred acquisition transaction costs that were expensed as incurred in accordance with GAAP. The following is a summary of the acquisitions:
| | | | | | | | | | | | | | | | | | |
| | | | | | | | | | | | | | | Acquisition
Transaction Costs | |
Hotel Name | | Acquisition Date | | Number of
Rooms | | | Location | | Purchase
Price | | | Manager | | For the year ended
December 31, 2010 | |
Sofitel Washington, DC | | | | | | | | | | | | | | | | | | |
Lafayette Square | | March 1, 2010 | | | 237 | | | Washington, DC | | $ | 95,000 | | | Sofitel (Accor SA) | | $ | 1,471 | |
Hotel Monaco San | | | | | | | | | | | | | | Kimpton Hotel & | | | | |
Francisco | | September 1, 2010 | | | 201 | | | San Francisco, CA | | | 68,500 | | | Restaurant Group, L.L.C. | | | 262 | |
Westin Philadelphia | | September 1, 2010 | | | 294 | | | Philadelphia, PA | | | 145,000 | | | HEI Hotels & Resorts | | | 252 | |
Embassy Suites Philadelphia – Center City | | September 1, 2010 | | | 288 | | | Philadelphia, PA | | | 79,000 | | | HEI Hotels & Resorts | | | 234 | |
Hotel Roger Williams | | October 6, 2010 | | | 193 | | | New York, NY | | | 93,750 | | | JRK Hotel Group, Inc. | | | 527 | |
Chamberlain West | | | | | | | | | | | | | | Outrigger Lodging | | | | |
Hollywood | | December 6, 2010 | | | 113 | | | West Hollywood, CA | | | 38,500 | | | Services | | | 257 | |
| | | | | | | | | | | | | | | | | | |
Total | | | | | | | | | | $ | 519,750 | | | | | $ | 3,003 | |
| | | | | | | | | | | | | | | | | | |
Hotel Roger Williams is subject to a land and building lease, which was determined to be a capital lease (see Note 5). Accordingly, at acquisition, the Company recorded a capital asset related to its leasehold interest of $95,079, based upon the estimated fair value of the right to use the leased property for the remaining term. The capital asset, net of accumulated depreciation of $3,470 and $694, is included within investment in hotel properties, net, in the accompanying consolidated balance sheets as of December 31, 2011 and 2010, respectively. Additionally, the Company recorded furniture, fixtures and equipment and inventory of $3,563 as part of the acquisition.
The source of the funding for the March 1, 2010 acquisition was the Company’s senior unsecured credit facility, which was subsequently paid down with proceeds from the March 2, 2010 public offering of common shares of beneficial interest (see Note 6). The sources of the funding for the September 1, 2010 acquisitions were the Company’s senior unsecured credit facility and available cash, including cash from operations, proceeds from the sale of the Seaview Resort and proceeds from prior issuances of common shares of beneficial interest under the Company’s equity distribution agreements (see Note 6). The sources of the funding for the October 6, 2010 acquisition were the Company’s assumption of a $64,000 loan secured by the hotel (see Note 4) and borrowings under the Company’s senior unsecured credit facility. The source of the funding for the December 6, 2010 acquisition was borrowings under the Company’s senior unsecured credit facility. Total revenues and net income from the acquired hotels of $46,166 and $5,172, respectively, are included in the accompanying consolidated statements of operations for the year ended December 31, 2010.
During 2011, the Company acquired 100% interests in three full-service hotels, each of which is leased to LHL. The Company recorded the acquisitions at fair value using model-derived valuations, with the purchase price allocated to investment in hotel properties and hotel working capital assets and liabilities. In connection with the acquisitions, the Company incurred acquisition transaction costs that were expensed as incurred in accordance with GAAP. The following is a summary of the acquisitions:
| | | | | | | | | | | | | | | | | | |
| | | | | | | | | | | | | | | Acquisition
Transaction Costs | |
Hotel Name | | Acquisition Date | | Number of
Rooms | | | Location | | Purchase
Price | | | Manager | | For the year ended
December 31, 2011 | |
Viceroy Santa Monica | | March 16, 2011 | | | 162 | | | Santa Monica, CA | | $ | 80,072 | | | Viceroy Hotel Group | | $ | 182 | |
Villa Florence | | October 5, 2011 | | | 182 | | | San Francisco, CA | | | 67,054 | | | JRK Hotel Group, Inc. | | | 133 | |
Park Central Hotel | | December 29, 2011 | | | 934 | | | New York, NY | | | 396,235 | | | Highgate Holdings | | | 2,256 | |
| | | | | | | | | | | | | | | | | | |
Total | | | | | | | | | | $ | 543,361 | | | | | $ | 2,571 | |
| | | | | | | | | | | | | | | | | | |
F-17
The source of the funding for the March 16, 2011 acquisition, which is subject to a ground lease expiring on September 25, 2065 determined to be an operating lease (see Note 5), was the Company’s senior unsecured credit facility. The source of the funding for the October 5, 2011 acquisition was cash on hand consisting primarily of the remaining net proceeds from the Company’s previously completed sale of common shares of beneficial interest on April 29, 2011 (see Note 6). The sources of the funding for the December 29, 2011 acquisition were cash on hand consisting primarily of the remaining net proceeds from the Company’s previously completed sale of common shares of beneficial interest on April 29, 2011 (see Note 6), borrowings under the Company’s senior unsecured credit facility and the issuance of common units of limited partnership interest (see Note 6). The Company has not yet finalized its allocations of the purchase price of Park Central Hotel as the Company is awaiting certain valuation-related information. A final determination of required purchase price adjustments will be made during 2012. Total revenues and net income from the hotels acquired during 2011 of $23,943 and $1,289, respectively, are included in the accompanying consolidated statements of operations for the year ended December 31, 2011.
Condensed Pro Forma Financial Information (Unaudited)
The results of operations of acquired properties are included in the consolidated statements of operations beginning on their respective acquisition dates. The following unaudited condensed pro forma financial information is presented as if the above described 2010 and 2011 acquisitions had been consummated as of January 1, 2009 and 2010, respectively, the beginning of the reporting period prior to acquisition. In addition, for purposes of the unaudited condensed pro forma financial information only, the March 2, 2010 issuance of 6,152,500 common shares of beneficial interest, the August 2010 issuance of 3,270,936 common shares of beneficial interest, the January 21, 2011 through February 16, 2011 issuance of 2,619,811 common shares of beneficial interest, the March 24, 2011 through April 11, 2011 issuance of 1,436,881 common shares of beneficial interest, the April 29, 2011 issuance of 7,896,612 common shares of beneficial interest and the July 7, 2011 issuance of 8,016 common shares of beneficial interest (see Note 6) are presented as if the issuances had occurred as of January 1, 2010. No adjustments have been made to the unaudited condensed pro forma financial information presented below for the 2011 preferred share issuance and redemption or the 2011 common share repurchases (see Note 6) since they have no relation to the acquisitions. The unaudited condensed pro forma financial information is for comparative purposes only and not necessarily indicative of what actual results of operations of the Company would have been had the 2010 and 2011 acquisitions been consummated on January 1, 2009 and 2010, respectively, nor does it purport to represent the results of operations for future periods. The unaudited condensed pro forma financial information has not been adjusted for property sales.
The unaudited condensed pro forma financial information for the years ended December 31, 2011 and 2010 is as follows:
| | | | | | | | |
| | | Year Ended December 31, | |
| | | 2011 | | | 2010 | |
| | | (unaudited) | | | (unaudited) | |
Total revenues | | $ | 812,095 | | | | 764,477 | |
Net income | | $ | 47,720 | | | | 6,316 | |
Net income (loss) attributable to common shareholders | | $ | 17,038 | | | | (20,247 | ) |
| | |
Earnings per common share – basic | | $ | 0.20 | | | | (0.24 | ) |
Earnings per common share – diluted | | $ | 0.20 | | | | (0.24 | ) |
| | |
Weighted average number of common shares outstanding: | | | | | | | | |
Basic | | | 84,363,466 | | | | 84,528,609 | |
Diluted | | | 84,534,542 | | | | 84,528,609 | |
Discontinued Operations
Effective August 20, 2010, the Company accepted an offer to sell the Seaview Resort, received a nonrefundable deposit and determined the property to be held for sale as of that date. This was deemed a
F-18
triggering event for impairment since it represented a change in management’s plan with respect to the property, resulting in a change in the property’s estimated holding period. Accordingly, in 2010, the Company performed an impairment analysis and recorded an impairment loss of $24,479 after determining fair value using the negotiated sales price per the terms of the sales contract, which is classified within Level 2 of the fair value hierarchy (see Note 2), less estimated costs to sell. On September 1, 2010, the Company sold the Seaview Resort for $20,000. The Company retained responsibility for the repair of the roof at the property. The estimated cost of the project was between $4,000 and $6,000, with the Company’s exposure limited by contract to $5,000. Accordingly, on September 1, 2010, the Company recorded a liability for related costs of $5,000, of which the unpaid balance of $4,643 was included in accounts payable and accrued expenses, and a receivable from the insurance company representing the Company’s estimate of the net recoverable amount of $4,050, which was included in prepaid expenses and other assets, in the accompanying consolidated balance sheets as of December 31, 2010. On March 24, 2011, the Company received insurance proceeds of $4,500, of which $4,050 was applied to the receivable from the insurance company and $450 was recorded as a liability to cover estimated related costs consisting primarily of amounts payable to the insurance adjuster. On September 2, 2011, the Company entered into a settlement agreement with the purchaser of the Seaview Resort which released the Company of any future responsibility for the repair of the roof. Accordingly, the Company paid $450 to the purchaser as a condition of the agreement on September 20, 2011, at which point the Company recognized a gain of $760 representing the unpaid liability balance after settlement.
Effective August 9, 2010, the Company accepted an offer to sell the Westin City Center Dallas, received a nonrefundable deposit and determined the property to be held for sale as of that date. On September 30, 2010, the Company sold the Westin City Center Dallas for $50,000, resulting in a gain of $29,162.
Effective December 6, 2010, the Company accepted an offer to sell the Sheraton Bloomington Hotel Minneapolis South, received a nonrefundable deposit and determined the property to be held for sale as of that date. This was deemed a triggering event for impairment since it represented a change in management’s plan with respect to the property, resulting in a change in the property’s estimated holding period. Accordingly, in 2010, the Company performed an impairment analysis and recorded an impairment loss of $3,223 after determining fair value using the negotiated sales price per the terms of the sales contract, which is classified within Level 2 of the fair value hierarchy (see Note 2), less estimated costs to sell. On January 12, 2011, the Company sold the Sheraton Bloomington Hotel Minneapolis South for $20,000. Since the property was under contract for sale during the fourth quarter of 2010, it was considered held for sale as of December 31, 2010.
The operating results of each of the three properties from the Company’s respective period of ownership are included in discontinued operations for all periods presented, as applicable. The following is a summary of the results of the properties classified in discontinued operations:
| | | | | | | | | | | | |
| | | For the year ended December 31, | |
| | | 2011 | | | 2010 | | | 2009 | |
Operating revenues | | $ | 495 | | | $ | 47,422 | | | $ | 64,353 | |
Operating expenses | | | 426 | | | | 51,384 | | | | 62,274 | |
| | | | | | | | | | | | |
Income (loss) from operations before gain (loss) | | | 69 | | | | (3,962 | ) | | | 2,079 | |
Gain on sale | | | 760 | | | | 29,162 | | | | 0 | |
Loss on impairment | | | 0 | | | | (27,702 | ) | | | 0 | |
| | | | | | | | | | | | |
Income (loss) from operations | | | 829 | | | | (2,502 | ) | | | 2,079 | |
Income tax (expense) benefit | | | (33 | ) | | | 1,651 | | | | 333 | |
| | | | | | | | | | | | |
Net income (loss) from discontinued operations | | $ | 796 | | | $ | (851 | ) | | $ | 2,412 | |
| | | | | | | | | | | | |
F-19
Credit Facilities
On December 14, 2011, the Company entered into a new $750,000 senior unsecured credit facility with a syndicate of banks that replaced the Company’s $450,000 facility that was scheduled to mature on April 13, 2012. The new facility matures on January 30, 2016, subject to a one-year extension that the Company may exercise at its option, pursuant to certain terms and conditions, including payment of an extension fee. The new credit facility includes an accordion feature which, subject to certain conditions, entitles the Company to request additional lender commitments, allowing for total commitments up to $1,000,000. The senior unsecured credit facility contains certain financial covenants relating to net worth requirements, debt ratios and fixed charge coverage and other limitations that restrict the Company’s ability to make distributions or other payments to its shareholders upon events of default. Borrowings under the credit facility bear interest at floating rates equal to, at the Company’s option, either (i) LIBOR plus an applicable margin, or (ii) an “Adjusted Base Rate” plus an applicable margin. Additionally, the Company is required to pay a variable unused commitment fee of 0.30% or 0.40% of the unused portion of the credit facility, depending on the average unused portion of the senior unsecured credit facility during each quarterly period.
LHL has a $25,000 unsecured revolving credit facility to be used for working capital and general lessee corporate purposes. On December 14, 2011, LHL refinanced its credit facility that was scheduled to mature on April 13, 2012, extending the maturity date to January 30, 2016, subject to a one-year extension that LHL may exercise at its option, pursuant to certain terms and conditions, including payment of an extension fee. Borrowings under the LHL revolving credit facility bear interest at floating rates equal to, at LHL’s option, either (i) LIBOR plus an applicable margin, or (ii) an “Adjusted Base Rate” plus an applicable margin. Additionally, LHL is required to pay a variable unused commitment fee of 0.30% or 0.40% of the unused portion of the credit facility, depending on the average unused portion of the LHL unsecured revolving credit facility during each quarterly period.
Bonds Payable
The Company is the obligor with respect to a $37,100 tax-exempt special project revenue bond and a $5,400 taxable special project revenue bond, both issued by the Massachusetts Port Authority (collectively, the “Massport Bonds”). The Massport Bonds, which mature on March 1, 2018, bear interest based on weekly floating rates and have no principal reductions prior to their scheduled maturities. The Massport Bonds may be redeemed at any time, at the Company’s option, without penalty. The Massport Bonds are secured by letters of credit issued by the Royal Bank of Scotland that expire on February 14, 2014, pursuant to amendments to the agreements during 2011. The Royal Bank of Scotland letters of credit also have three one-year extensions that the Company may exercise at its option, subject to certain terms and conditions. The annual letter of credit fee, which is included in interest expense, is currently set at 2.00% and, effective February 14, 2012, will be based on an applicable margin as defined in our new senior unsecured credit agreement. The Royal Bank of Scotland letters of credit are secured by the Harborside Hyatt Conference Center & Hotel. If the Royal Bank of Scotland fails to renew its letters of credit at expiration and an acceptable replacement provider cannot be found, the Company may be required to pay off the bonds.
Mortgage Loans
The Company’s mortgage loans are secured by the respective property. The mortgages are non-recourse to the Company except for fraud or misapplication of funds.
On February 1, 2010, the Company repaid without fee or penalty the Le Montrose Suite Hotel mortgage loan in the amount of $12,836 plus accrued interest with cash and additional borrowings on its senior unsecured credit facility. The loan was due to mature in July 2010.
F-20
On October 6, 2010, in connection with the acquisition of the Hotel Roger Williams, the Company assumed a loan secured by the leasehold interest in the hotel with a principal balance of $64,000, fixed annual interest rate of 6.31% and maturity date in August 2016. The loan was determined to be at market terms through comparison to market debt obligations with similar credit policies.
Debt Summary
Debt as of December 31, 2011 and 2010 consisted of the following:
| | | | | | | | | | | | | | | | |
| | | | | | | | | Balance Outstanding as of | |
Debt | | Interest
Rate | | | Maturity Date | | | December 31,
2011 | | | December 31,
2010 | |
Credit facilities | | | | | | | | | | | | | | | | |
Senior unsecured credit facility | | | Floating | (a) | | | January 2016 | | | $ | 265,000 | | | $ | 112,000 | |
LHL unsecured credit facility | | | Floating | (b) | | | January 2016 | | | | 0 | | | | 8,193 | |
| | | | | | | | | | | | | | | | |
Total borrowings under credit facilities | | | | | | | | | | | 265,000 | | | | 120,193 | |
| | | | | | | | | | | | | | | | |
Massport Bonds | | | | | | | | | | | | | | | | |
Harborside Hyatt Conference
Center & Hotel (taxable) | | | Floating | (c) | | | March 2018 | | | | 5,400 | | | | 5,400 | |
Harborside Hyatt Conference
Center & Hotel (tax exempt) | | | Floating | (c) | | | March 2018 | | | | 37,100 | | | | 37,100 | |
| | | | | | | | | | | | | | | | |
Total bonds payable | | | | | | | | | | | 42,500 | | | | 42,500 | |
| | | | | | | | | | | | | | | | |
Mortgage loans | | | | | | | | | | | | | | | | |
Hilton San Diego Gaslamp Quarter | | | 5.35 | % | | | July 2012 | (d) | | | 59,600 | | | | 59,600 | |
Hotel Solamar | | | 5.49 | % | | | December 2013 | | | | 60,900 | | | | 60,900 | |
Hotel Deca | | | 6.28 | % | | | August 2014 | | | | 9,392 | | | | 9,658 | |
Westin Copley Place | | | 5.28 | % | | | September 2015 | | | | 210,000 | | | | 210,000 | |
Westin Michigan Avenue | | | 5.75 | % | | | April 2016 | | | | 138,902 | | | | 140,000 | |
Indianapolis Marriott Downtown | | | 5.99 | % | | | July 2016 | | | | 101,319 | | | | 101,780 | |
Hotel Roger Williams . | | | 6.31 | % | | | August 2016 | | | | 63,589 | | | | 64,000 | |
| | | | | | | | | | | | | | | | |
Mortgage loans at stated value | | | | | | | | | | | 643,702 | | | | 645,938 | |
Unamortized loan premium(e) | | | | | | | | | | | 195 | | | | 269 | |
| | | | | | | | | | | | | | | | |
Total mortgage loans | | | | | | | | | | | 643,897 | | | | 646,207 | |
| | | | | | | | | | | | | | | | |
Total debt | | | | | | | | | | $ | 951,397 | | | $ | 808,900 | |
| | | | | | | | | | | | | | | | |
| (a) | Borrowings bear interest at floating rates equal to, at the Company’s option, either (i) LIBOR plus an applicable margin, or (ii) an Adjusted Base Rate plus an applicable margin. As of December 31, 2011, the rate, including the applicable margin, for the Company’s outstanding LIBOR borrowing of $265,000 was 2.30%. As of December 31, 2010, the rate, including the applicable margin, for the Company’s outstanding LIBOR borrowing of $112,000 was 1.07%. On December 14, 2011, the Company entered into a new unsecured credit facility, which matures on January 30, 2016 and has a one-year extension option. |
| (b) | Borrowings bear interest at floating rates equal to, at LHL’s option, either (i) LIBOR plus an applicable margin, or (ii) an Adjusted Base Rate plus an applicable margin. There were no borrowings outstanding at December 31, 2011. As of December 31, 2010, the rate, including the applicable margin, for LHL’s outstanding LIBOR borrowings of $8,193 was 1.06%. On December 14, 2011, LHL |
refinanced its credit facility, which matures on January 30, 2016 and has a one-year extension option.
| (c) | The Massport Bonds are secured by letters of credit issued by the Royal Bank of Scotland that expire in February 2014 pursuant to an amendment to the agreement governing the letters of credit. The Royal Bank of Scotland letters of credit also have three one-year extension options and are secured by the Harborside Hyatt Conference Center & Hotel. The bonds bear interest based on weekly floating rates. The interest rates as of December 31, 2011 were 0.75% and 0.12% for the $5,400 and $37,100 bonds, respectively. The |
F-21
| | interest rates as of December 31, 2010 were 0.28% and 0.38% for the $5,400 and $37,100 bonds, respectively. The Company also incurs an annual letter of credit fee, which was increased from 1.10% to 2.00% effective February 15, 2011. Effective February 14, 2012, the letter of credit fee will be based on an applicable margin as defined in our new senior unsecured credit agreement. |
| (d) | The Company intends to either repay the mortgage loan through borrowings on its credit facilities upon maturity or refinance the loan through a property mortgage. |
| (e) | Mortgage debt includes an unamortized loan premium on the mortgage loan on Hotel Deca of $195 and $269 as of December 31, 2011 and 2010, respectively. |
Future scheduled debt principal payments as of December 31, 2011 are as follows:
| | | | |
2012 | | $ | 64,600 | |
2013 | | | 64,687 | |
2014 | | | 13,324 | |
2015 | | | 214,797 | |
2016 | | | 551,294 | |
Thereafter | | | 42,500 | |
| | | | |
Total debt principal payments | | | 951,202 | |
Premium on mortgage loan | | | 195 | |
| | | | |
Total debt | | $ | 951,397 | |
| | | | |
A summary of the Company’s interest expense and weighted average interest rates for borrowings for the years ended December 31, 2011, 2010 and 2009 is as follows:
| | | | | | | | | | | | |
| | | For the year ended December 31, | |
| | | 2011 | | | 2010 | | | 2009 | |
Interest Expense: | | | | | | | | | | | | |
Interest incurred | | $ | 39,196 | | | $ | 35,797 | | | $ | 37,664 | |
Amortization of deferred financing costs | | | 967 | | | | 907 | | | | 995 | |
Capitalized interest | | | (459 | ) | | | (200 | ) | | | (703 | ) |
| | | | | | | | | | | | |
Interest expense | | | 39,704 | | | | 36,504 | | | | 37,956 | |
Interest expense from discontinued operations | | | 0 | | | | (4 | ) | | | (5 | ) |
| | | | | | | | | | | | |
Interest expense from continuing operations | | $ | 39,704 | | | $ | 36,500 | | | $ | 37,951 | |
| | | | | | | | | | | | |
Weighted Average Interest Rates for Borrowings: | | | | | | | | | | | | |
Senior unsecured credit facility | | | 1.2 | % | | | 1.0 | % | | | 1.3 | % |
| | | | | | | | | | | | |
LHL unsecured credit facility | | | 1.1 | % | | | 0.9 | % | | | 1.2 | % |
| | | | | | | | | | | | |
Massport bonds | | | 0.2 | % | | | 0.3 | % | | | 0.5 | % |
| | | | | | | | | | | | |
The Company estimates the fair value of its fixed rate debt and the credit spreads over variable market rates on its variable rate debt by discounting the future cash flows of each instrument at estimated market rates or credit spreads consistent with the maturity of the debt obligation with similar credit policies. Rates and credit spreads take into consideration general market conditions and maturity.
The carrying value and estimated fair value of the Company’s debt as of December 31, 2011 and 2010 were as follows:
| | | | | | | | |
| | | 2011 | | | 2010 | |
Carrying value | | $ | 951,397 | | | $ | 808,900 | |
| | | | | | | | |
Estimated fair value | | $ | 954,299 | | | $ | 807,742 | |
| | | | | | | | |
F-22
The carrying amounts of the Company’s other financial instruments approximate fair value because of the relatively short maturities of these instruments.
Financial Covenants
Failure to comply with our financial covenants contained in our credit facilities and non-recourse secured mortgages could result from, among other things, changes in our results of operations, the incurrence of additional debt or changes in general economic conditions.
If the Company violates the financial covenants contained in either credit facility described above, the Company may attempt to negotiate a waiver of the violation or amend the terms of the credit facility with the lender thereunder; however, the Company can make no assurance that it would be successful in any such negotiations or that, if successful in obtaining a waiver or amendment, such amendment or waiver would be on terms attractive to the Company. If a default under the credit facilities were to occur, the Company would possibly have to refinance the debt through additional debt financing, private or public offerings of debt securities, or additional equity financings. If the Company is unable to refinance its debt on acceptable terms, including at maturity of the credit facilities, it may be forced to dispose of hotel properties on disadvantageous terms, potentially resulting in losses that reduce cash flow from operating activities. If, at the time of any refinancing, prevailing interest rates or other factors result in higher interest rates upon refinancing, increases in interest expense would lower the Company’s cash flow, and, consequently, cash available for distribution to its shareholders.
The Company’s non-recourse secured mortgages contain debt service coverage ratio thresholds. If the Company’s debt service coverage ratio fails to exceed a threshold level specified in a mortgage, cash flows from that hotel will automatically be directed to the lender to (i) satisfy required payments, (ii) fund certain reserves required by the mortgage and (iii) fund additional reserves for future required payments, including final payment. Cash flows will be directed to the lender until such time as the Company again becomes compliant with the specified debt service coverage ratio or the mortgage is paid off. This may limit the overall liquidity for the Company as cash from the hotel securing such mortgage would not be available for the Company to use. If the Company is unable to meet mortgage payment obligations, including the payment obligation upon maturity of the mortgage borrowing, the mortgage securing the specific property could be foreclosed upon by, or the property could be otherwise transferred to, the mortgagee with a consequent loss of income and asset value to the Company.
As of December 31, 2011, the Company is in compliance with all debt covenants, current on all loan payments and not otherwise in default under the credit facilities, bonds or mortgages.
| 5. | Commitments and Contingencies |
Ground, Land and Building, and Air Rights Leases
Six of the Company’s hotels, San Diego Paradise Point Resort and Spa, Harborside Hyatt Conference Center & Hotel, Indianapolis Marriott Downtown, The Hilton San Diego Resort and Spa, Hotel Solamar and Viceroy Santa Monica are subject to ground leases under non-cancelable operating leases expiring from March 2026 to December 2102. The ground lease at Harborside Hyatt Conference Center & Hotel expires in 2026, but the Company has options to extend for over 50 years to 2077. None of the remaining leases expire prior to 2045. The Westin Copley Place is subject to a long term air rights lease which expires on December 14, 2077 and requires no payments through maturity. The ground lease related to the Indianapolis Marriott Downtown requires future ground rent payments of one dollar per year. The ground lease at Viceroy Santa Monica is subject to minimum annual rent increases, resulting in noncash straight-line rent expense of $347 for the year ended December 31, 2011, which is included in total ground rent expense below.
F-23
Hotel Roger Williams, acquired on October 6, 2010 (see Note 3), is subject to a lease of land and building which expires on December 31, 2044. The Company evaluated the terms of the lease agreement and determined the lease to be a capital lease pursuant to applicable GAAP guidance. At acquisition, the fair value of the remaining rent payments of $4,892 was recorded as a capital lease obligation. This obligation, net of amortization, is included in accounts payable and accrued expenses in the accompanying consolidated balance sheets.
Total ground rent expense for the years ended December 31, 2011, 2010 and 2009 was $7,730, $5,951 and $5,828, respectively, of which $10, $126 and $122, respectively, is related to part of the parking lot at Sheraton Bloomington Hotel Minneapolis South, which is included in discontinued operations for all periods presented. Certain rent payments are based on the hotel’s performance. Actual payments of rent may exceed the minimum required rent due to meeting specified thresholds.
Future minimum rent payments (without reflecting future applicable Consumer Price Index increases) are as follows:
| | | | |
2012 | | $ | 5,998 | |
2013 | | | 6,010 | |
2014 | | | 6,023 | |
2015 | | | 6,035 | |
2016 | | | 6,077 | |
Thereafter | | | 236,009 | |
| | | | |
| | $ | 266,152 | |
| | | | |
Reserve Funds
Certain of the Company’s agreements with its hotel managers, franchisors and lenders have provisions for the Company to provide funds, generally 4.0% to 5.0% of hotel revenues, sufficient to cover the cost of (a) certain non-routine repairs and maintenance to the hotels and (b) replacements and renewals to the hotels’ furniture, fixtures and equipment. Certain agreements require that the Company reserve cash. As of December 31, 2011, $11,585 was available in restricted cash reserves for future capital expenditures. The Company has sufficient cash on hand and availability on its credit facilities to cover required capital expenditures under agreements that do not necessitate that the Company separately reserve cash.
Restricted Cash Reserves
At December 31, 2011, the Company held $16,969 in restricted cash reserves. Included in such amounts are (i) $11,585 of reserve funds relating to the hotels with leases or operating agreements requiring the Company to maintain restricted cash to fund future capital expenditures, (ii) $4,250 deposited in mortgage escrow accounts pursuant to mortgage obligations to pre-fund a portion of certain operating expenses and debt payments and (iii) $1,134 held by insurance companies on the Company’s behalf to be refunded or applied to future liabilities.
Litigation
The nature of the operations of the hotels exposes the hotels and the Company to the risk of claims and litigation in the normal course of their business. The Company is not presently subject to any material litigation nor, to the Company’s knowledge, is any litigation threatened against the Company, other than routine actions for negligence or other claims and administrative proceedings arising in the ordinary course of business, some of which are expected to be covered by liability insurance and all of which collectively are not expected to have a material adverse effect on the liquidity, results of operations, business or financial condition of the Company.
F-24
Common Shares of Beneficial Interest
On April 19, 2007, the common shareholders approved an amendment to the Company’s Amended and Restated Declaration of Trust increasing the number of authorized common shares of beneficial interest from 100,000,000 to 200,000,000. Accordingly, at December 31, 2011 and 2010, there were 200,000,000 authorized common shares.
On January 1, 2010, the Company issued 8,097 common shares of beneficial interest from treasury and authorized an additional 28,155 deferred shares to the independent members of its Board of Trustees for their earned 2009 compensation pursuant to award arrangements existing on or before January 1, 2009. These common shares of beneficial interest were issued under the 2009 Plan.
On January 1, 2010, the Company issued 11,688 restricted common shares of beneficial interest to the Company’s executives related to 18,596 long-term performance-based share awards, which were granted on December 20, 2006. The remaining 6,908 shares were forfeited based on performance on January 1, 2010 (see Note 7). One-third of the restricted shares, or 3,896 shares, vested immediately and the remaining two-thirds of the restricted shares, or 7,792 shares, will vest over two years, starting January 1, 2011. These common shares of beneficial interest were issued under the 1998 Share Option and Incentive Plan (“1998 Plan”), which was in place prior to the 2009 Plan.
On January 27, 2010, the Company granted 49,122 restricted common shares of beneficial interest to the Company’s executives and employees, of which 7,212 were issued from treasury. The restricted shares granted vest over three years, starting January 1, 2011. These common shares of beneficial interest were issued under the 2009 Plan.
On March 2, 2010, the Company completed an underwritten public offering of 6,152,500 common shares of beneficial interest, par value $0.01 per share, including 802,500 common shares pursuant to an overallotment option exercise by the underwriters. After deducting the underwriters’ discounts and commissions and other offering costs, the Company raised net proceeds of approximately $109,150. The net proceeds were used to pay down amounts outstanding under the Company’s senior unsecured credit facility and under the LHL unsecured credit facility, and for general corporate purposes.
On April 19, 2010, the Company granted 1,153 restricted common shares of beneficial interest to the Company’s employees, all of which were issued out of treasury. The restricted shares granted vest over three years, starting January 1, 2011. These common shares of beneficial interest were issued under the 2009 Plan.
On April 21, 2010, the Company entered into separate equity distribution agreements (the “2010 Agreements”) with each of Merrill Lynch, Pierce, Fenner & Smith Incorporated, Raymond James & Associates, Inc. and Wells Fargo Securities, LLC (collectively, the “Managers”). Under the terms of the 2010 Agreements, the Company could issue and sell from time to time through or to the Managers, as sales agents and/or principals, the Company’s common shares of beneficial interest having an aggregate offering price of up to $150,000.
During August 2010, the Company sold 3,270,936 common shares of beneficial interest, par value $0.01 per share, under the 2010 Agreements, of which 36,044 were issued from treasury. After deducting the underwriters’ discounts and commissions of $1,531 and other offering costs, the Company raised net proceeds of approximately $74,856. The net proceeds were used to fund in part the September 1, 2010 acquisitions of the Hotel Monaco San Francisco, the Westin Philadelphia and the Embassy Suites Philadelphia – Center City (see Note 3).
F-25
On January 1, 2011, the Company issued 7,274 common shares of beneficial interest and authorized an additional 12,077 deferred shares to the independent members of its Board of Trustees for their earned 2010 compensation pursuant to award arrangements existing on or before January 1, 2010. These common shares of beneficial interest were issued under the 2009 Plan.
On January 1, 2011, the Company issued 16,844 restricted common shares of beneficial interest to the Company’s executives related to 26,796 long-term performance-based share awards, which were granted on December 17, 2007. The remaining 9,952 shares were forfeited based on performance on January 1, 2011 (see Note 7). One-third of the issued restricted shares, or 5,616 shares, vested immediately and 5,614 shares vested on January 20, 2011 related to the previously announced termination of the Company’s former Chief Financial Officer. The remaining 5,614 shares are scheduled to vest over two years, starting January 1, 2012. These common shares of beneficial interest were issued under the 1998 Plan.
On January 20, 2011, the Company issued 52,110 common shares of beneficial interest to its former Chief Financial Officer related to long-term performance-based share awards, as a result of the previously announced termination of employment. Pursuant to the terms of the original award agreements, a portion of his unvested long-term performance-based share awards vested upon termination (see Note 7). Of the common shares of beneficial interest issued, 10,403 shares were issued under the 1998 Plan and 41,707 shares were issued under the 2009 Plan.
From January 24, 2011 through January 27, 2011, the Company granted 74,562 restricted common shares of beneficial interest to the Company’s executives and employees, all of which were issued from treasury. The restricted shares granted vest over three years, starting January 1, 2012. These common shares of beneficial interest were issued under the 2009 Plan.
From January 21, 2011 through February 16, 2011, the Company sold 2,619,811 common shares of beneficial interest, par value $0.01 per share, under the 2010 Agreements. After deducting the underwriters’ discounts and commissions of $1,220, the Company raised net proceeds of $72,280. The net proceeds were used to pay down amounts outstanding under the Company’s senior unsecured credit facility and under the LHL unsecured credit facility, and for general corporate purposes. As of December 31, 2011, the Company had fully utilized the $150,000 of aggregate offering price authorized under the 2010 Agreements.
On February 28, 2011, a member of the Board of Trustees exercised 5,000 options to purchase common shares of beneficial interest. These common shares were issued under the 1998 Plan.
On March 4, 2011, the Company entered into an equity distribution agreement (the “2011 Agreement”) with Raymond James & Associates, Inc. (the “Manager”). Under the terms of the 2011 Agreement, the Company may issue from time to time through or to the Manager, as sales agent or principal, the Company’s common shares of beneficial interest having an aggregate offering price of up to $250,000. From March 24, 2011 through April 11, 2011, the Company sold 1,436,881 common shares of beneficial interest, par value $0.01 per share, under the 2011 Agreement, of which 9,406 were issued from treasury. On July 7, 2011, the Company sold 8,016 common shares of beneficial interest, par value $0.01 per share, under the 2011 Agreement. After deducting the Manager’s discounts and commissions of $490 and other offering costs, the Company raised cumulative net proceeds of $38,532. The proceeds were used to pay down amounts outstanding under the Company’s senior unsecured credit facility and under the LHL unsecured credit facility, and for general corporate purposes. As of December 31, 2011, the Company had availability under the 2011 Agreement to issue and sell common shares of beneficial interest having an aggregate offering price of up to $210,810.
On April 29, 2011, the Company completed an underwritten public offering of 7,896,612 common shares of beneficial interest, par value $0.01 per share, including 896,612 common shares pursuant to an overallotment option exercise by the underwriters. After deducting the underwriters’ discounts and commissions and other
F-26
offering costs, the Company raised net proceeds of $216,659. The net proceeds were used to pay down amounts outstanding under the Company’s senior unsecured credit facility and under the LHL unsecured credit facility, to repurchase common shares of beneficial interest under the Repurchase Program authorized on August 29, 2011 (see below), to fund the acquisition of Villa Florence on October 5, 2011 (see Note 3), to fund a portion of the acquisition of the Park Central Hotel on December 29, 2011 (see Note 3) and for general corporate purposes.
On July 1, 2011, the Company issued 21,190 restricted common shares of beneficial interest to an executive officer related to 25,000 long-term performance-based share awards, which were granted on May 31, 2008. The remaining 3,810 shares were forfeited based on performance on July 1, 2011 (see Note 7). All of the issued restricted shares vested immediately on July 1, 2011. These common shares of beneficial interest were issued under the 1998 Plan.
On July 19, 2011, the Company granted 92,088 restricted common shares of beneficial interest to the Company’s employees, of which 31,058 were issued from treasury. Of the restricted shares granted, 46,046 vest on June 30, 2014 and 46,042 vest on January 1, 2017. These common shares of beneficial interest were issued under the 2009 Plan.
Common Dividends
The Company paid the following dividends on common shares during the year ended December 31, 2011:
| | | | | | | | | | |
Dividend per
Share | | For the Quarter Ended | | Record Date | | | Payable Date | |
$ 0.11 | | 31-Dec-2010 | | | 31-Dec-2010 | | | | 14-Jan-2011 | |
$ 0.11 | | 31-Mar-2011 | | | 31-Mar-2011 | | | | 15-Apr-2011 | |
$ 0.11 | | 30-Jun-2011 | | | 30-Jun-2011 | | | | 15-Jul-2011 | |
$ 0.11 | | 30-Sep-2011 | | | 30-Sep-2011 | | | | 14-Oct-2011 | |
Treasury Shares
Treasury shares are accounted for under the cost method. During the year ended December 31, 2011, the Company received 113,482 common shares of beneficial interest related to executives and employees surrendering shares to pay taxes at the time restricted shares vested and forfeiture of restricted shares due to employee resignations.
On August 29, 2011, the Company’s Board of Trustees authorized a share repurchase program (the “Repurchase Program”) to acquire up to $100,000 of the Company’s common shares of beneficial interest, with repurchased shares recorded at cost in treasury. From August 29, 2011 through October 11, 2011, the Company repurchased 1,389,574 common shares of beneficial interest under the Repurchase Program. Including commissions of $41, the Company paid a total of $24,543. Since the time the Company ceased repurchasing activity on October 11, 2011 (the date of the Company’s last repurchase of common shares), the Company has had availability under the Repurchase Program to acquire up to $75,498 of common shares of beneficial interest. However, the Company is not currently authorized by its Board of Trustees to repurchase or offer to repurchase any common shares. If authorized by its Board of Trustees, the Company may resume using the Repurchase Program on a future date.
During the year ended December 31, 2011, the Company re-issued 74,562 treasury shares related to the grant of restricted common shares of beneficial interest in January 2011, 9,406 treasury shares related to the sale of common shares of beneficial interest under the 2011 Agreement in March 2011 and 31,058 treasury shares related to the grant of restricted common shares of beneficial interest in July 2011.
F-27
At December 31, 2011, there were 1,389,574 common shares of beneficial interest in treasury.
Preferred Shares
On April 19, 2007, the common shareholders approved an amendment to the Company’s Amended and Restated Declaration of Trust increasing the number of authorized preferred shares of beneficial interest from 20,000,000 to 40,000,000. Accordingly, at December 31, 2011 and 2010, there were 40,000,000 authorized preferred shares.
On February 1, 2009, each of the 2,348,888 7 1/4% Series C Cumulative Redeemable Preferred units (“Series C Preferred Units”) was redeemed and the Company issued 2,348,888 7 1/4% Series C Cumulative Redeemable Preferred Shares (“Series C Preferred Shares”). Prior to the exchange described below, the Series C Preferred Shares were held by SCG Hotel DLP, L.P. (“SCG”). On April 16, 2009, SCG exchanged its Series C Preferred Shares for an equal number of 7 1/4% Series G Cumulative Redeemable Preferred Shares (“Series G Preferred Shares”) in a private transaction exempt from registration pursuant to Section 4(2) of the Securities Act of 1933, as amended. On April 17, 2009, the Company filed a registration statement with the SEC to register the resale of the Series G Preferred Shares. On May 13, 2009, in connection with the exchange, the Company received a fee of $1,000, which the Company recognized in other income in the accompanying consolidated statements of operations.
On January 19, 2011, the Company issued 2,600,000 7 1/2% Series H Cumulative Redeemable Preferred Shares ($0.01 par value) (“Series H Preferred Shares”) at a price of $25.00 per share and received net proceeds, after costs, of $62,738. On February 4, 2011, the underwriters exercised their rights to cover overallotments and purchased 150,000 additional Series H Preferred Shares, resulting in additional net proceeds to the Company of $3,632. The net proceeds were used to reduce amounts outstanding under the Company’s senior unsecured credit facility and under the LHL unsecured credit facility, and for general corporate purposes.
On February 11, 2011, the Company provided notice to the holders of its 8 3/8% Series B Cumulative Redeemable Preferred Shares (“Series B Preferred Shares”) of the redemption of those shares. On March 14, 2011, the Company redeemed all 1,100,000 outstanding Series B Preferred Shares for $27,500 ($25.00 per share) plus accrued distributions through March 14, 2011 of $473. The redemption value of the Series B Preferred Shares exceeded the carrying value of the Series B Preferred Shares by $731 which is included in the determination of net income attributable to common shareholders for the year ended December 31, 2011. The $731 represents the offering costs related to the Series B Preferred Shares.
The 7 1/2% Series D Cumulative Redeemable Preferred Shares (“Series D Preferred Shares”), 8% Series E Cumulative Redeemable Preferred Shares (“Series E Preferred Shares”), Series G Preferred Shares and Series H Preferred Shares (collectively, the “Preferred Shares”) rank senior to the common shares of beneficial interest and on parity with each other with respect to payment of distributions; the Company will not pay any distributions, or set aside any funds for the payment of distributions, on its common shares of beneficial interest unless it has also paid (or set aside for payment) the full cumulative distributions on the Preferred Shares for the current and all past dividend periods. The outstanding Preferred Shares do not have any maturity date, and are not subject to mandatory redemption. The difference between the carrying value and the redemption amount of the Preferred Shares are the offering costs. In addition, the Company is not required to set aside funds to redeem the Preferred Shares. The Company currently has the option to redeem the Series D Preferred Shares, Series E Preferred Shares and Series G Preferred Shares. The Company may not optionally redeem the Series H Preferred Shares prior to January 24, 2016, except in limited circumstances relating to the Company’s continuing qualification as a REIT or as discussed below. After that date, the Company may, at its option, redeem the Preferred Shares, in whole or from time to time in part, by payment of $25.00 per share, plus any accumulated, accrued and unpaid distributions to and including the date of redemption. In addition, upon the occurrence of a change of control, as defined, the result of which the Company’s common shares of beneficial interest and the common securities of the acquiring or surviving entity are not listed on the New York Stock Exchange, the
F-28
NYSE Amex Equities or the NASDAQ Stock Market, or any successor exchanges, the Company may, at its option, redeem the Series H Preferred Shares in whole or in part within 120 days after the change of control occurred, by paying $25.00 per share, plus any accrued and unpaid distributions to and including the date of redemption. If the Company does not exercise its right to redeem the Series H Preferred Shares upon a change of control, the holders of Series H Preferred Shares have the right to convert some or all of their shares into a number of the Company’s common shares of beneficial interest based on a defined formula subject to a cap of 4,680,500 common shares.
The following Preferred Shares were outstanding as of December 31, 2011:
| | | | |
Security Type | | Number of
Shares | |
7 1/2% Series D Preferred Shares | | | 3,170,000 | |
8% Series E Preferred Shares | | | 3,500,000 | |
7 1/4% Series G Preferred Shares | | | 6,348,888 | |
7 1/2% Series H Preferred Shares | | | 2,750,000 | |
Preferred Dividends
The Company paid the following dividends on preferred shares during the year ended December 31, 2011:
| | | | | | | | | | |
Security Type | | Dividend per
Share(1) | | | For the Quarter
Ended | | Record Date | | Payable Date |
8 3/8% Series B | | $ | 0.52 | | | 31-Dec-2010 | | 1-Jan-2011 | | 14-Jan-2011 |
7 1/2% Series D | | $ | 0.47 | | | 31-Dec-2010 | | 1-Jan-2011 | | 14-Jan-2011 |
8% Series E | | $ | 0.50 | | | 31-Dec-2010 | | 1-Jan-2011 | | 14-Jan-2011 |
7 1/4% Series G | | $ | 0.45 | | | 31-Dec-2010 | | 1-Jan-2011 | | 14-Jan-2011 |
8 3/8% Series B | | $ | 0.43 | | | 31-Mar-2011 | | 14-Mar-2011 | | 14-Mar-2011 |
7 1/2% Series D | | $ | 0.47 | | | 31-Mar-2011 | | 1-Apr-2011 | | 15-Apr-2011 |
8% Series E | | $ | 0.50 | | | 31-Mar-2011 | | 1-Apr-2011 | | 15-Apr-2011 |
7 1/4% Series G | | $ | 0.45 | | | 31-Mar-2011 | | 1-Apr-2011 | | 15-Apr-2011 |
7 1/2% Series H | | $ | 0.42 | | | 31-Mar-2011 | | 1-Apr-2011 | | 15-Apr-2011 |
7 1/2% Series D | | $ | 0.47 | | | 30-Jun-2011 | | 1-Jul-2011 | | 15-Jul-2011 |
8% Series E | | $ | 0.50 | | | 30-Jun-2011 | | 1-Jul-2011 | | 15-Jul-2011 |
7 1/4% Series G | | $ | 0.45 | | | 30-Jun-2011 | | 1-Jul-2011 | | 15-Jul-2011 |
7 1/2% Series H | | $ | 0.47 | | | 30-Jun-2011 | | 1-Jul-2011 | | 15-Jul-2011 |
7 1/2% Series D | | $ | 0.47 | | | 30-Sep-2011 | | 1-Oct-2011 | | 14-Oct-2011 |
8% Series E | | $ | 0.50 | | | 30-Sep-2011 | | 1-Oct-2011 | | 14-Oct-2011 |
7 1/4% Series G | | $ | 0.45 | | | 30-Sep-2011 | | 1-Oct-2011 | | 14-Oct-2011 |
7 1/2% Series H | | $ | 0.47 | | | 30-Sep-2011 | | 1-Oct-2011 | | 14-Oct-2011 |
| (1) | Amounts are rounded to the nearest whole cent for presentation purposes. |
Noncontrolling Interest of Common Units in Operating Partnership
On December 29, 2011, the Company issued 296,300 common units of limited partnership interest to two entities comprising the seller of Park Central Hotel as partial consideration for the acquisition (see Note 3). The units are subject to a required hold period that ends on December 28, 2013, after which they are convertible into a like number of common shares of beneficial interest of the Company.
As of December 31, 2011, the Operating Partnership had 296,300 common units of limited partnership interest outstanding, representing a 0.4% partnership interest held by the limited partners. As of December 31, 2011, approximately $7,173 of cash or the equivalent value in common shares, at our option, would be paid to the limited
F-29
partners of the Operating Partnership if the partnership were terminated. The approximate value of $7,173 is equivalent to the units outstanding valued at the Company’s December 31, 2011 closing common share price of $24.21, which we assume would be equal to the value provided to the limited partners upon liquidation of the Operating Partnership.
The following schedule presents the effects of changes in the Company’s ownership interest in the Operating Partnership on the Company’s equity:
| | | | | | | | | | | | |
| | | For the year ended December 31, | |
| | | 2011 | | | 2010 | | | 2009 | |
Net income (loss) attributable to common shareholders | | $ | 12,934 | | | $ | (24,793 | ) | | $ | (18,770 | ) |
Increase in additional paid-in capital from adjustments to noncontrolling interests of common units in Operating Partnership | | | 1,601 | | | | 0 | | | | 235 | |
| | | | | | | | | | | | |
Change in the Company’s ownership interest from net income (loss) and adjustments to noncontrolling interests | | $ | 14,535 | | | $ | (24,793 | ) | | $ | (18,535 | ) |
| | | | | | | | | | | | |
Noncontrolling Interests of Preferred Units in Operating Partnership
As previously disclosed, each of the 2,348,888 Series C Preferred Units was redeemed on February 1, 2009.
There were no preferred units held by third parties outstanding as of December 31, 2011.
At the 2009 Annual Meeting of Shareholders held on April 23, 2009, the common shareholders approved the 2009 Plan, under which the Company may issue equity-based awards to officers, employees, non-employee trustees and any other persons providing services to or for the Company and its subsidiaries. The 2009 Plan provides for a maximum of 1,800,000 common shares of beneficial interest to be issued in the form of share options, share appreciation rights, restricted share awards, performance shares, phantom shares and other equity-based awards. In addition, the maximum number of common shares subject to awards of any combination that may be granted under the 2009 Plan during any fiscal year to any one individual is limited to 500,000 shares. The 2009 Plan terminates on January 28, 2019. The 2009 Plan authorized, among other things: (i) the grant of share options that qualify as incentive options under the Code, (ii) the grant of share options that do not so qualify, (iii) the grant of common shares in lieu of cash for trustees’ fees, (iv) grants of common shares in lieu of cash compensation, and (v) the making of loans to acquire common shares in lieu of compensation (to the extent permitted by law and applicable provisions of the Sarbanes Oxley Act of 2002). The exercise price of share options is determined by the Compensation Committee of the Board of Trustees, but may not be less than 100% of the fair market value of the common shares on the date of grant. Restricted share awards and options under the 2009 Plan vest over a period determined by the Compensation Committee of the Board of Trustees, generally a three to five year period, with certain awards vesting over periods of up to nine years. The duration of each option is also determined by the Compensation Committee, subject to applicable laws and regulation. There were no unvested stock options outstanding as of December 31, 2011. At December 31, 2011, there were 1,431,012 common shares available for future grant under the 2009 Plan.
Service Condition Nonvested Share Awards
From time to time, the Company awards nonvested shares under the 2009 Plan to members of the Board of Trustees, executives and employees. The nonvested shares vest over three to nine years based on continued
F-30
employment. The Company measures compensation costs for the nonvested shares based upon the fair market value of its common stock at the date of grant. Compensation costs are recognized on a straight-line basis over the vesting period and are included in general and administrative expense in the accompanying consolidated statements of operations.
A summary of the Company’s service condition nonvested shares as of December 31, 2011 is as follows:
| | | | | | | | |
| | | Number of
Shares | | | Weighted -
Average Grant
Date Fair Value | |
Nonvested at January 1, 2011 | | | 480,919 | | | $ | 24.29 | |
Granted | | | 166,650 | | | | 26.58 | |
Vested(1) | | | (261,757 | ) | | | 25.40 | |
Forfeited | | | (1,058 | ) | | | 22.52 | |
| | | | | | | | |
Nonvested at December 31, 2011(2) | | | 384,754 | | | $ | 25.07 | |
| | | | | | | | |
| (1) | Amount includes accelerated vesting of former Chief Financial Officer’s shares. |
| (2) | Amount excludes 7,562 long-term performance-based shares which were earned but nonvested due to a service condition as of December 31, 2011. |
As of December 31, 2011 and 2010, there were $7,087 and $5,444, respectively, of total unrecognized compensation costs related to nonvested share awards. As of December 31, 2011 and 2010, these costs were expected to be recognized over a weighted–average period of 3.3 years and 3.7 years, respectively. The total fair value of shares vested (calculated as number of shares multiplied by vesting date share price) during the years ended December 31, 2011 and 2010 was $7,089 and $1,578, respectively. On September 13, 2009, 105,696 shares were forfeited with respect to an executive resignation. As a result, non-cash equity compensation related to those shares was reversed in September 2009. On September 27, 2010, the Company announced the termination of its former Chief Financial Officer no later than February 28, 2011. Pursuant to the terms of the original award agreements, all of his unvested service condition share awards would vest upon termination. Accordingly, the Company accelerated the recognition of previously unrecognized compensation costs on unvested awards over the estimated remaining service period. On January 20, 2011, upon termination of the former Chief Financial Officer, all of his unvested service condition share awards vested with all remaining previously unrecognized compensation costs recognized. The compensation costs (net of forfeitures) that have been included in general and administrative expenses in the accompanying consolidated statements of operations were $2,763, $4,154 and $2,926 for the years ended December 31, 2011, 2010 and 2009, respectively.
Long-Term Performance-Based Share Awards
On December 20, 2006, the Company’s Board of Trustees granted 31,490 performance-based awards of nonvested shares to executives. On September 13, 2009, 12,894 shares were forfeited with respect to an executive resignation. The actual share amounts of the awards earned were determined on January 1, 2010, based on the performance period of January 1, 2007 through December 31, 2009, in accordance with the terms of the agreements. On January 1, 2010, the executives earned 62.9% of the target number of shares, or 11,688 shares. The shares representing the difference between 62.9% and 100% of the target, or 6,908 shares, were forfeited on January 1, 2010. Of the shares earned, 3,896 shares vested immediately on January 1, 2010, 3,896 shares vested on January 1, 2011, 1,948 shares vested on January 20, 2011 upon termination of the former Chief Financial Officer and 1,948 shares will vest on January 1, 2012 based on continued employment. The executives received cash payments on the earned shares equal to the value of all dividends paid on common shares from December 31, 2006 until the determination date, January 1, 2010. As of January 1, 2010, the executives are entitled to receive dividends as declared and paid on the earned shares and to vote the shares, including those shares subject to further vesting.
F-31
On December 17, 2007, the Company’s Board of Trustees granted 45,376 performance-based awards of nonvested shares to executives, of which 18,580 shares were forfeited on September 13, 2009 with respect to an executive resignation. The actual amounts of the awards earned were determined on January 1, 2011, based on the performance period of January 1, 2008 through December 31, 2010, in accordance with the terms of the agreements. On January 1, 2011, the executives earned 62.9% of the target number of shares, or 16,844 shares. The shares representing the difference between 62.9% and 100% of the target, or 9,952 shares, were forfeited on January 1, 2011. Of the shares earned, 5,616 shares vested immediately on January 1, 2011, 5,614 shares vested on January 20, 2011 upon termination of the former Chief Financial Officer and the remaining 5,614 shares will vest in equal amounts on January 1, 2012 and January 1, 2013 based on continued employment. The executives received cash payments of $38 on the earned shares equal to the value of all dividends paid on common shares from December 31, 2007 until the determination date, January 1, 2011. As of January 1, 2011, the executives are entitled to receive dividends as declared and paid on the earned shares and to vote the shares, including those shares subject to further vesting.
On May 31, 2008, the Company’s Board of Trustees entered into three Performance-Based Share Agreements (the “Share Agreements”), awarding 125,000 performance-based awards, in 25,000, 50,000 and 50,000 increments, of nonvested shares to an executive. The actual amounts of the awards earned for each of the Share Agreements is based on the specified 3-year performance periods ending on July 1, 2011, 2014 and 2017, respectively. The actual amounts of the awards will range from 0% to 200% of the target amounts, depending on the performance analysis stipulated in the agreement, and none of the performance shares are outstanding until issued in accordance with the award agreement based on performance.
On July 1, 2011, the executive earned 84.8% of the 25,000 target number of shares, or 21,190 shares. The shares representing the difference between 84.8% and 100% of the target, or 3,810 shares, were forfeited on July 1, 2011. All of the shares earned vested immediately on July 1, 2011. The executive received a cash payment of $31 on the earned shares equal to the value of all dividends paid on common shares from June 30, 2008 until the determination date, July 1, 2011. As of July 1, 2011, the executive is entitled to receive dividends as declared and paid on the earned shares and to vote the shares. With respect to 50,000 shares, fair value was estimated on July 1, 2011, the beginning of the performance period, and, with respect to the additional 50,000 shares, fair value will be estimated on July 1, 2014, the beginning of the performance period.
On June 25, 2008, the Company’s Board of Trustees granted 87,500 performance-based awards of nonvested shares to executives to be valued and earned in three separate increments. On September 13, 2009, 25,000 shares were forfeited with respect to an executive resignation. On January 20, 2011, the former Chief Financial Officer, upon his termination, earned a net 83.2% of his 12,500 target number of shares, or 10,403 shares, based on the performance period of July 1, 2008 through January 20, 2011. The shares representing the difference between 83.2% and 100% of the target, or 2,097 shares, were forfeited on January 20, 2011. All of the shares earned vested immediately on January 20, 2011. The remaining 50,000 awards were forfeited upon the former Chief Financial Officer’s termination, which was prior to the beginning of the remaining awards’ performance periods.
On April 28, 2009, the Company’s Board of Trustees granted 70,344 performance-based awards of nonvested shares to executives. On January 20, 2011, the former Chief Financial Officer, upon his termination, earned a net 107.6% of his 32,118 target number of shares, or 34,570 shares, based on the performance period of January 1, 2009 through January 20, 2011. All of the shares earned vested immediately on January 20, 2011. No additional shares were earned or vested related to the former Chief Financial Officer subsequent to this date. The actual amounts of the remaining 38,226 awards held by an executive will be determined on January 1, 2012, based on the performance period of January 1, 2009 through December 31, 2011, in accordance with the terms of the agreements. The actual amounts of the awards will range from 0% to 200% of the target amounts, depending on the performance analysis stipulated in the agreements, and none of the performance shares are outstanding until issued in accordance with award agreements based on performance. After the actual amounts of the awards are determined (or earned) on January 1, 2012, the earned shares will be issued and outstanding with a portion subject to further vesting based on continued employment. The executive will receive a cash payment equal to
F-32
the value of all dividends paid on common shares from December 31, 2008 until the determination date, January 1, 2012, on only the earned shares, including those subject to further vesting. Such amount will be paid to the awardee on or about January 1, 2012. Thereafter, the executive will be entitled to receive dividends as declared and paid on the earned shares and to vote the shares, including those shares subject to further vesting.
On November 3, 2009 and January 27, 2010, the Company’s Board of Trustees granted 10,228 and 48,648 performance-based awards of nonvested shares to executives, respectively. On January 20, 2011, the former Chief Financial Officer, upon his termination, earned a net 35.4% of his 20,171 target number of shares, or 7,137 shares, based on the performance period of January 1, 2010 through January 20, 2011. The shares representing the difference between 35.4% and 100% of the target, or 13,034 shares, were forfeited on January 20, 2011. All of the shares earned vested immediately on January 20, 2011. The actual amounts of the remaining 38,705 awards will be determined on January 1, 2013, based on the performance period of January 1, 2010 through December 31, 2012, in accordance with the terms of the agreements. The actual amounts of the awards will range from 0% to 200% of the target amounts, depending on the performance analysis stipulated in the agreements, and none of the performance shares are outstanding until issued in accordance with award agreements based on performance. After the actual amounts of the awards are determined (or earned) on January 1, 2013, the earned shares will be issued and outstanding with a portion subject to further vesting based on continued employment. The executives will receive cash payments equal to the value of all dividends paid on common shares from December 31, 2009 until the determination date, January 1, 2013, on only the earned shares, including those shares subject to further vesting. Such amounts will be paid to the awardees on or about January 1, 2013. Thereafter, the executives will be entitled to receive dividends as declared and paid on the earned shares and to vote the shares, including those shares subject to further vesting.
On January 24 and January 26, 2011, the Company’s Board of Trustees granted 8,925 and 35,920 performance-based awards of nonvested shares to executives, respectively. The actual amounts of the awards will be determined on January 1, 2014, based on the performance period of January 1, 2011 through December 31, 2013, in accordance with the terms of the agreements. The actual amounts of the awards will range from 0% to 200% of the target amounts, depending on the performance analysis stipulated in the agreements, and none of the performance shares are outstanding until issued in accordance with award agreements based on performance. After the actual amounts of the awards are determined (or earned) on January 1, 2014, the earned shares will be issued and outstanding with a portion subject to further vesting based on continued employment. The executives will receive cash payments equal to the value of all dividends paid on common shares from December 31, 2010 until the determination date, January 1, 2014, on only the earned shares, including those shares subject to further vesting. Such amounts will be paid to the awardees on or about January 1, 2014. Thereafter, the executives will be entitled to receive dividends as declared and paid on the earned shares and to vote the shares, including those shares subject to further vesting.
The fair values of the above described awards were determined by the Company utilizing valuation reports which used the Monte Carlo valuation method provided by a third-party consultant. The measurement of performance stipulated in the award agreements consists of the comparison of the Company’s “total return” (the increase in the market price of a company’s common shares plus dividends declared thereon and assuming such dividends are reinvested as calculated by the FTSE NAREIT Equity Index) to the total return of the companies in the FTSE NAREIT Equity Index, the total return of six companies in a designated peer group of the Company and a Board-established total return goal.
Assumptions used in the valuations consisted of the following:
Capital Market Assumptions
| | • | | Factors associated with the underlying performance of the Company’s stock price and shareholder returns over the term of the performance awards including total stock return volatility and risk-free interest. |
F-33
| | • | | Factors associated with the relative performance of the Company’s stock price and shareholder returns when compared to those companies which compose the index including beta as a means to breakdown total volatility into market-related and company specific volatilities. |
| | • | | The valuation has been performed in a risk-neutral framework. |
The assumptions used were as follows for each performance measure:
| | | | | | | | | | | | | | | | | | | | | | | | |
| | | Volatility | | | Interest
Rates | | | Dividend
Yield | | | Stock
Beta | | | Fair Value of
Components
of Award | | | Weighting
of Total
Awards | |
May 31, 2008 Awards (performance period starting July 1, 2011) | | | | | | | | | |
Target amounts | | | 83.30 | % | | | 0.85 | % | | | N/A | | | | N/A | | | $ | 37.64 | | | | 20.00 | % |
NAREIT index | | | 83.30 | % | | | 0.85 | % | | | N/A | | | | 1.318 | | | $ | 36.27 | | | | 40.00 | % |
Peer companies | | | 83.30 | % | | | 0.85 | % | | | N/A | | | | 0.892 | | | $ | 38.79 | | | | 40.00 | % |
January 24 and 26, 2011 Awards | | | | | | | | | | | | | | | | | | | | | | | | |
Target amounts | | | 84.30 | % | | | 1.05 | % | | | N/A | | | | N/A | | | $ | 40.43 | | | | 33.40 | % |
NAREIT index | | | 84.30 | % | | | 1.05 | % | | | N/A | | | | 1.300 | | | $ | 38.85 | | | | 33.30 | % |
Peer companies | | | 84.30 | % | | | 1.05 | % | | | N/A | | | | 0.898 | | | $ | 41.24 | | | | 33.30 | % |
January 27, 2010 Awards | | | | | | | | | | | | | | | | | | | | | | | | |
Target amounts | | | 83.30 | % | | | 1.40 | % | | | N/A | | | | N/A | | | $ | 30.02 | | | | 33.40 | % |
NAREIT index | | | 83.30 | % | | | 1.40 | % | | | N/A | | | | 1.281 | | | $ | 28.96 | | | | 33.30 | % |
Peer companies | | | 83.30 | % | | | 1.40 | % | | | N/A | | | | 0.908 | | | $ | 29.28 | | | | 33.30 | % |
November 3, 2009 Awards | | | | | | | | | | | | | | | | | | | | | | | | |
Target amounts | | | 83.10 | % | | | 1.70 | % | | | N/A | | | | N/A | | | $ | 30.50 | | | | 20.00 | % |
NAREIT index | | | 83.10 | % | | | 1.70 | % | | | N/A | | | | 1.280 | | | $ | 28.72 | | | | 40.00 | % |
Peer companies | | | 83.10 | % | | | 1.70 | % | | | N/A | | | | 0.909 | | | $ | 30.61 | | | | 40.00 | % |
April 28, 2009 Awards | | | | | | | | | | | | | | | | | | | | | | | | |
Target amounts | | | 76.20 | % | | | 1.39 | % | | | N/A | | | | N/A | | | $ | 15.44 | | | | 20.00 | % |
NAREIT index | | | 76.20 | % | | | 1.39 | % | | | N/A | | | | 1.238 | | | $ | 16.45 | | | | 40.00 | % |
Peer companies | | | 76.20 | % | | | 1.39 | % | | | N/A | | | | 0.907 | | | $ | 16.25 | | | | 40.00 | % |
May 31, 2008 Awards (performance period starting July 1, 2008) and June 25, 2008 Awards | | | | | |
Target amounts | | | 30.80 | % | | | 2.90 | % | | | N/A | | | | N/A | | | $ | 24.81 | | | | 20.00 | % |
NAREIT index | | | 30.80 | % | | | 2.90 | % | | | N/A | | | | 1.152 | | | $ | 27.61 | | | | 40.00 | % |
Peer companies | | | 30.80 | % | | | 2.90 | % | | | N/A | | | | 1.022 | | | $ | 28.00 | | | | 40.00 | % |
December 17, 2007 Awards | | | | | | | | | | | | | | | | | | | | | | | | |
Target amounts | | | 25.80 | % | | | 3.07 | % | | | N/A | | | | N/A | | | $ | 28.69 | | | | 20.00 | % |
NAREIT index | | | 25.80 | % | | | 3.07 | % | | | N/A | | | | 1.123 | | | $ | 35.22 | | | | 40.00 | % |
Peer companies | | | 25.80 | % | | | 3.07 | % | | | N/A | | | | 1.004 | | | $ | 35.39 | | | | 40.00 | % |
December 20, 2006 Awards | | | | | | | | | | | | | | | | | | | | | | | | |
Target amounts | | | 24.40 | % | | | 4.74 | % | | | N/A | | | | N/A | | | $ | 43.29 | | | | 20.00 | % |
NAREIT index | | | 24.40 | % | | | 4.74 | % | | | 1.32 | % | | | 0.947 | | | $ | 51.47 | | | | 40.00 | % |
Peer companies | | | 24.40 | % | | | 4.74 | % | | | 1.32 | % | | | 0.967 | | | $ | 50.82 | | | | 40.00 | % |
A summary of the Company’s long-term performance-based share awards as of December 31, 2011 is as follows:
| | | | | | | | |
| | | Number
of Shares | | | Weighted-
Average Grant
Date Fair Value | |
Nonvested at January 1, 2011 | | | 201,308 | | | $ | 28.44 | |
Granted(1) | | | 94,845 | | | | 38.79 | |
Vested(2)(3) | | | (87,922 | ) | | | 25.70 | |
Forfeited(2)(3) | | | (28,893 | ) | | | 30.54 | |
| | | | | | | | |
Nonvested at December 31, 2011(4) | | | 179,338 | | | $ | 31.94 | |
| | | | | | | | |
F-34
| (1) | Amount includes 50,000 shares from a May 2008 award agreement, for which fair value was estimated at the beginning of the performance measurement period on July 1, 2011. |
| (2) | Amounts relate to December 2006, December 2007 and May 2008 award agreements, for which shares were determined on January 1, 2010, January 1, 2011 and July 1, 2011, respectively. |
| (3) | Amounts include 59,672 shares vested, including 2,452 shares earned, and 15,131 shares forfeited, respectively, upon departure of the former Chief Financial Officer. |
| (4) | Amount excludes 50,000 shares that have been committed for future performance share grants. Fair value will be estimated at the beginning of the performance measurement period on July 1, 2014. |
As of December 31, 2011 and 2010, there were $4,047 and $2,392, respectively, of total unrecognized compensation costs related to long-term performance-based share awards. As of December 31, 2011 and 2010, these costs were expected to be recognized over a weighted-average period of 2.8 and 2.7 years, respectively. As of December 31, 2011 and 2010, there were 94,270 and 3,896 long-term performance-based share awards vested, respectively. Additionally, there were 7,562 and 7,792 long-term performance-based awards earned but non-vested due to a service condition as of December 31, 2011 and 2010, respectively. On September 13, 2009, 56,474 shares were forfeited with respect to an executive resignation. As a result, non-cash equity compensation related to those shares was reversed in September 2009. On September 27, 2010, the Company announced the termination of its former Chief Financial Officer no later than February 28, 2011. Pursuant to the terms of the original award agreements, a portion of his unvested long-term performance-based share awards would vest upon termination. Accordingly, the Company accelerated the recognition of previously unrecognized compensation costs on unvested awards over the estimated remaining service period. On January 20, 2011, upon termination of the former Chief Financial Officer, a portion of his unvested long-term performance-based share awards vested and a portion was forfeited and additional shares were earned for awards valued at over 100% of the target, with all remaining previously unrecognized compensation costs recognized. The compensation costs (net of forfeitures) related to long-term performance-based share awards that have been included in general and administrative expense in the accompanying consolidated statements of operations were $1,426, $1,737 and $364 for the years ended December 31, 2011, 2010 and 2009, respectively.
Board of Trustees’ Compensation
The Company issues common shares of beneficial interest to the independent members of the Board of Trustees for at least half of their compensation in lieu of cash. The Trustees may elect to receive the remaining half in cash or additional common shares. All or a portion of the shares issued may be deferred. The Company issued an aggregate of 17,856, 19,351 and 36,252 shares, including 8,928, 12,077 and 28,155 deferred shares related to the Trustees’ compensation for the years 2011, 2010 and 2009, respectively.
F-35
Stock Options
A summary of the Company’s stock option activity for the years ended December 31, 2011, 2010 and 2009 is as follows:
| | | | | | | | | | | | | | | | | | | | | | | | |
| | | 2011 | | | 2010 | | | 2009 | |
| | | Shares | | | Weighted
average
exercise
price | | | Shares | | | Weighted
average
exercise
price | | | Shares | | | Weighted
average
exercise
price | |
Options outstanding at beginning of year | | | 10,000 | | | $ | 15.70 | | | | 21,000 | | | $ | 15.63 | | | | 62,000 | | | $ | 11.03 | |
Options granted | | | 0 | | | | 0.00 | | | | 0 | | | | 0.00 | | | | 0 | | | | 0.00 | |
Options exercised | | | (5,000 | ) | | | 16.51 | | | | (11,000 | ) | | | 14.14 | | | | (40,000 | ) | | | 8.55 | |
Options forfeited | | | 0 | | | | 0.00 | | | | 0 | | | | 0.00 | | | | (1,000 | ) | | | 13.88 | |
| | | | | | | | | | | | | | | | | | | | | | | | |
Options outstanding at end of year | | | 5,000 | | | $ | 14.88 | | | | 10,000 | | | $ | 15.70 | | | | 21,000 | | | $ | 15.63 | |
| | | | | | | | | | | | | | | | | | | | | | | | |
Weighted average remaining life | | | 0.4 | years | | | | | | | 0.8 | years | | | | | | | 1.7 | years | | | | |
Range of exercise prices on outstanding options | | | $14.88 to $14.88 | | | | $14.88 to $16.51 | | | | $14.14 to $16.51 | |
Options exercisable at end of year | | | 5,000 | | | $ | 14.88 | | | | 10,000 | | | $ | 15.70 | | | | 21,000 | | | $ | 15.63 | |
Available for future grant at year end | | | 1,431,012 | | | | | | | | 1,535,812 | | | | | | | | 1,550,060 | | | | | |
Weighted average per share fair value of options granted during the year | | | N/A | | | | | | | | N/A | | | | | | | | N/A | | | | | |
A significant portion of the Company’s revenue is derived from operating revenues generated by the hotels leased by LHL.
Other indirect hotel operating expenses, including amounts related to discontinued operations, consist of the following expenses incurred by the hotels leased by LHL:
| | | | | | | | | | | | |
| | | For the year ended December 31, | |
| | | 2011 | | | 2010 | | | 2009 | |
General and administrative | | $ | 56,788 | | | $ | 52,998 | | | $ | 48,192 | |
Sales and marketing | | | 44,228 | | | | 42,190 | | | | 38,603 | |
Repairs and maintenance | | | 26,260 | | | | 25,781 | | | | 23,353 | |
Utilities and insurance | | | 22,956 | | | | 23,347 | | | | 23,453 | |
Management and incentive fees | | | 24,937 | | | | 22,998 | | | | 21,623 | |
Franchise fees | | | 6,088 | | | | 4,771 | | | | 4,171 | |
Other expenses | | | 1,802 | | | | 1,552 | | | | 1,676 | |
| | | | | | | | | | | | |
Total other indirect expenses | | | 183,059 | | | | 173,637 | | | | 161,071 | |
Other indirect expenses from discontinued operations | | | (288 | ) | | | (19,959 | ) | | | (23,711 | ) |
| | | | | | | | | | | | |
Other indirect expenses from continuing operations | | $ | 182,771 | | | $ | 153,678 | | | $ | 137,360 | |
| | | | | | | | | | | | |
F-36
As of December 31, 2011, LHL leased all 37 hotels owned by the Company as follows:
| | |
| 1. Harborside Hyatt Conference Center & Hotel | | 20. Le Parc Suite Hotel |
| 2. Hotel Viking | | 21. Westin Michigan Avenue |
| 3. Topaz Hotel | | 22. Hotel Sax Chicago |
| 4. Hotel Rouge | | 23. Alexis Hotel |
| 5. Hotel Madera | | 24. Hotel Solamar |
| 6. Hotel Helix | | 25. Gild Hall |
| 7. The Liaison Capitol Hill | | 26. Hotel Amarano Burbank |
| 8. Lansdowne Resort | | 27. San Diego Paradise Point Resort and Spa |
| 9. Hotel George | | 28. Le Montrose Suite Hotel |
| 10. Indianapolis Marriott Downtown | | 29. Sofitel Washington, DC Lafayette Square |
| 11. Hilton Alexandria Old Town | | 30. Hotel Monaco San Francisco |
| 12. Chaminade Resort and Conference Center | | 31. Westin Philadelphia |
| 13. Hilton San Diego Gaslamp Quarter | | 32. Embassy Suites Philadelphia - Center City |
| 14. The Grafton on Sunset | | 33. Hotel Roger Williams |
| 15. Onyx Hotel | | 34. Chamberlain West Hollywood |
| 16. Westin Copley Place | | 35. Viceroy Santa Monica |
| 17. Hotel Deca | | 36. Villa Florence |
| 18. The Hilton San Diego Resort and Spa | | 37. Park Central Hotel |
| 19. Donovan House | | |
In May 2009, the Company recognized $9,494 as pre-tax income as a result of the termination of the management agreement with Marriott International at Seaview Resort, which is included in discontinued operations in the accompanying consolidated statements of operations since the hotel was sold on September 1, 2010 (see Note 3).
The Company has elected to be taxed as a REIT under Sections 856 through 860 of the Code commencing with its taxable year ended December 31, 1998. To qualify as a REIT, the Company must meet a number of organizational and operational requirements, including a requirement that it currently distribute at least 90% of its adjusted taxable income to its shareholders. It is the Company’s current intention to adhere to these requirements and maintain the Company’s qualification for taxation as a REIT. As a REIT, the Company generally is not subject to federal corporate income tax on that portion of its net income that is currently distributed to shareholders. If the Company fails to qualify for taxation as a REIT in any taxable year, it will be subject to federal income taxes at regular corporate rates (including any applicable alternative minimum tax) and may not be able to qualify as a REIT for four subsequent taxable years. Even if the Company qualifies for taxation as a REIT, the Company may be subject to certain state and local taxes on its income and property, and to federal income and excise taxes on its undistributed taxable income. In addition, taxable income from non-REIT activities managed through taxable-REIT subsidiaries is subject to federal, state and local income taxes. As a wholly owned taxable-REIT subsidiary of the Company, LHL is required to pay income taxes at the applicable federal, state and local rates.
For federal income tax purposes, the cash distributions paid to the Company’s common shareholders of beneficial interest and preferred shareholders may be characterized as ordinary income, return of capital (generally non-taxable) or capital gains. Tax law permits certain characterization of distributions which could result in differences between cash basis and tax basis distribution amounts.
F-37
The following characterizes distributions paid per common share of beneficial interest and preferred share on a tax basis for the years ended December 31, 2011, 2010 and 2009:
| | | | | | | | | | | | | | | | | | | | | | | | |
| | | 2011 | | | 2010 | | | 2009 | |
| | | $ | | | % | | | $ | | | % | | | $ | | | % | |
Common shares of beneficial interest | | | | | | | | | | | | | | | | | | | | | | | | |
Ordinary income | | $ | 0.1143 | | | | 27.33 | % | | $ | 0.1519 | | | | 100.00 | % | | $ | 0.1250 | | | | 100.00 | % |
Return of capital | | | 0.3039 | | | | 72.67 | % | | | 0.0000 | | | | 0.00 | % | | | 0.0000 | | | | 0.00 | % |
Capital gain | | | 0.0000 | | | | 0.00 | % | | | 0.0000 | | | | 0.00 | % | | | 0.0000 | | | | 0.00 | % |
Unrecaptured Section 1250 gain | | | 0.0000 | | | | 0.00 | % | | | 0.0000 | | | | 0.00 | % | | | 0.0000 | | | | 0.00 | % |
| | | | | | | | | | | | | | | | | | | | | | | | |
| | $ | 0.4182 | | | | 100.00 | % | | $ | 0.1519 | | | | 100.00 | % | | $ | 0.1250 | | | | 100.00 | % |
| | | | | | | | | | | | | | | | | | | | | | | | |
Preferred shares (Series B) | | | | | | | | | | | | | | | | | | | | | | | | |
Ordinary income | | $ | 0.9538 | | | | 100.00 | % | | $ | 2.0938 | | | | 100.00 | % | | $ | 2.0938 | | | | 100.00 | % |
Capital gain | | | 0.0000 | | | | 0.00 | % | | | 0.0000 | | | | 0.00 | % | | | 0.0000 | | | | 0.00 | % |
Unrecaptured Section 1250 gain | | | 0.0000 | | | | 0.00 | % | | | 0.0000 | | | | 0.00 | % | | | 0.0000 | | | | 0.00 | % |
| | | | | | | | | | | | | | | | | | | | | | | | |
| | $ | 0.9538 | | | | 100.00 | % | | $ | 2.0938 | | | | 100.00 | % | | $ | 2.0938 | | | | 100.00 | % |
| | | | | | | | | | | | | | | | | | | | | | | | |
Preferred shares (Series C) | | | | | | | | | | | | | | | | | | | | | | | | |
Ordinary income | | $ | 0.0000 | | | | N/A | | | $ | 0.0000 | | | | N/A | | | $ | 0.2970 | | | | 100.00 | % |
Capital gain | | | 0.0000 | | | | N/A | | | | 0.0000 | | | | N/A | | | | 0.0000 | | | | 0.00 | % |
Unrecaptured Section 1250 gain | | | 0.0000 | | | | N/A | | | | 0.0000 | | | | N/A | | | | 0.0000 | | | | 0.00 | % |
| | | | | | | | | | | | | | | | | | | | | | | | |
| | $ | 0.0000 | | | | 0.00 | % | | $ | 0.0000 | | | | 0.00 | % | | $ | 0.2970 | | | | 100.00 | % |
| | | | | | | | | | | | | | | | | | | | | | | | |
Preferred shares (Series D) | | | | | | | | | | | | | | | | | | | | | | | | |
Ordinary income | | $ | 1.8750 | | | | 100.00 | % | | $ | 1.8750 | | | | 100.00 | % | | $ | 1.8750 | | | | 100.00 | % |
Capital gain | | | 0.0000 | | | | 0.00 | % | | | 0.0000 | | | | 0.00 | % | | | 0.0000 | | | | 0.00 | % |
Unrecaptured Section 1250 gain | | | 0.0000 | | | | 0.00 | % | | | 0.0000 | | | | 0.00 | % | | | 0.0000 | | | | 0.00 | % |
| | | | | | | | | | | | | | | | | | | | | | | | |
| | $ | 1.8750 | | | | 100.00 | % | | $ | 1.8750 | | | | 100.00 | % | | $ | 1.8750 | | | | 100.00 | % |
| | | | | | | | | | | | | | | | | | | | | | | | |
Preferred shares (Series E) | | | | | | | | | | | | | | | | | | | | | | | | |
Ordinary income | | $ | 2.0000 | | | | 100.00 | % | | $ | 2.0000 | | | | 100.00 | % | | $ | 2.0000 | | | | 100.00 | % |
Capital gain | | | 0.0000 | | | | 0.00 | % | | | 0.0000 | | | | 0.00 | % | | | 0.0000 | | | | 0.00 | % |
Unrecaptured Section 1250 gain | | | 0.0000 | | | | 0.00 | % | | | 0.0000 | | | | 0.00 | % | | | 0.0000 | | | | 0.00 | % |
| | | | | | | | | | | | | | | | | | | | | | | | |
| | $ | 2.0000 | | | | 100.00 | % | | $ | 2.0000 | | | | 100.00 | % | | $ | 2.0000 | | | | 100.00 | % |
| | | | | | | | | | | | | | | | | | | | | | | | |
Preferred shares (Series G) | | | | | | | | | | | | | | | | | | | | | | | | |
Ordinary income | | $ | 1.8125 | | | | 100.00 | % | | $ | 1.8125 | | | | 100.00 | % | | $ | 1.8125 | | | | 100.00 | % |
Capital gain | | | 0.0000 | | | | 0.00 | % | | | 0.0000 | | | | 0.00 | % | | | 0.0000 | | | | 0.00 | % |
Unrecaptured Section 1250 gain | | | 0.0000 | | | | 0.00 | % | | | 0.0000 | | | | 0.00 | % | | | 0.0000 | | | | 0.00 | % |
| | | | | | | | | | | | | | | | | | | | | | | | |
| | $ | 1.8125 | | | | 100.00 | % | | $ | 1.8125 | | | | 100.00 | % | | $ | 1.8125 | | | | 100.00 | % |
| | | | | | | | | | | | | | | | | | | | | | | | |
Preferred shares (Series H) | | | | | | | | | | | | | | | | | | | | | | | | |
Ordinary income | | $ | 1.3594 | | | | 100.00 | % | | $ | 0.0000 | | | | N/A | | | $ | 0.0000 | | | | N/A | |
Capital gain | | | 0.0000 | | | | 0.00 | % | | | 0.0000 | | | | N/A | | | | 0.0000 | | | | N/A | |
Unrecaptured Section 1250 gain | | | 0.0000 | | | | 0.00 | % | | | 0.0000 | | | | N/A | | | | 0.0000 | | | | N/A | |
| | | | | | | | | | | | | | | | | | | | | | | | |
| | $ | 1.3594 | | | | 100.00 | % | | $ | 0.0000 | | | | 0.00 | % | | $ | 0.0000 | | | | 0.00 | % |
| | | | | | | | | | | | | | | | | | | | | | | | |
F-38
Income tax expense (benefit) was comprised of the following for the years ended December 31, 2011, 2010 and 2009:
| | | | | | | | | | | | |
| | | For the year ended December 31, | |
| | | 2011 | | | 2010 | | | 2009 | |
LHL’s income tax expense | | $ | 6,128 | | | $ | 3,315 | | | $ | 4,103 | |
Operating Partnership’s income tax expense | | | 953 | | | | 109 | | | | 154 | |
| | | | | | | | | | | | |
Total income tax expense | | | 7,081 | | | | 3,424 | | | | 4,257 | |
Income tax (expense) benefit from discontinued operations | | | (33 | ) | | | 1,651 | | | | 333 | |
| | | | | | | | | | | | |
Income tax expense from continuing operations | | $ | 7,048 | | | $ | 5,075 | | | $ | 4,590 | |
| | | | | | | | | | | | |
The components of LHL’s income tax expense (benefit) and income (loss) before income tax expense (benefit) from continuing operations and discontinued operations for the years ended December 31, 2011, 2010 and 2009 were as follows:
| | | | | | | | | | | | |
| | | For the year ended December 31, | |
| | | 2011 | | | 2010 | | | 2009 | |
LHL’s income tax expense (benefit): | | | | | | | | | | | | |
Federal | | | | | | | | | | | | |
Current | | $ | 269 | | | $ | 196 | | | $ | 152 | |
Deferred | | | 4,913 | | | | 3,224 | | | | 2,902 | |
State & local | | | | | | | | | | | | |
Current | | | 455 | | | | 125 | | | | 115 | |
Deferred | | | 491 | | | | (230 | ) | | | 934 | |
| | | | | | | | | | | | |
Total | | $ | 6,128 | | | $ | 3,315 | | | $ | 4,103 | |
| | | | | | | | | | | | |
LHL’s income (loss) before income tax expense (benefit): | | | | | | | | | | | | |
From continuing operations | | $ | 15,162 | | | $ | 14,848 | | | $ | 9,820 | |
From discontinued operations | | | (328 | ) | | | (4,262 | ) | | | (1,186 | ) |
| | | | | | | | | | | | |
Total | | $ | 14,834 | | | $ | 10,586 | | | $ | 8,634 | |
| | | | | | | | | | | | |
LHL’s provision for income taxes differs from the amount of income tax determined by applying the applicable U.S. statutory federal income tax rate to LHL’s pretax income for the years ended December 31, 2011, 2010 and 2009 as a result of the following differences:
| | | | | | | | | | | | |
| | | For the year ended December 31, | |
| | | 2011 | | | 2010 | | | 2009 | |
“Expected” federal tax expense at statutory rate | | $ | 5,043 | | | $ | 3,599 | | | $ | 2,936 | |
State income tax expense, net of federal income tax effect | | | 1,005 | | | | 693 | | | | 550 | |
Other, net | | | 80 | | | | (977 | ) | | | 617 | |
| | | | | | | | | | | | |
Income tax expense | | $ | 6,128 | | | $ | 3,315 | | | $ | 4,103 | |
| | | | | | | | | | | | |
LHL’s deferred tax assets (liabilities) as of December 31, 2011 and 2010 were as follows:
| | | | | | | | |
| | | December 31, | |
| | | 2011 | | | 2010 | |
LHL net operating losses | | $ | 4,186 | | | $ | 9,376 | |
Bad debts | | | 271 | | | | 424 | |
Golf memberships | | | (83 | ) | | | 143 | |
Tax credit carryforwards | | | 853 | | | | 600 | |
Other, net | | | 23 | | | | 111 | |
| | | | | | | | |
Total deferred tax assets | | $ | 5,250 | | | $ | 10,654 | |
| | | | | | | | |
F-39
The Company has estimated LHL’s income tax expense using an estimated combined federal and state annual effective tax rate of 41.3%. As of December 31, 2011, the Company had deferred tax assets of $5,250 primarily due to past years’ tax net operating losses. These loss carryforwards will generally expire in 2024 through 2028 if not utilized by then. Management believes that it is more likely than not that the results of future operations will generate sufficient taxable income to realize the deferred tax asset related to federal loss carryforwards prior to the expiration of the loss carryforwards and has determined that no valuation allowance is necessary. The Company analyzes state loss carryforwards on a state by state basis and records a valuation allowance when management deems it more likely than not that future results will not generate sufficient taxable income in the respective state to realize the deferred tax asset prior to the expiration of the loss carryforwards. From time to time, the Company may be subject to federal, state or local tax audits in the normal course of business.
Regarding accounting for uncertainty in income taxes, GAAP guidance prescribes a recognition threshold and measurement attribute for the financial statement recognition and measurement of a tax position taken in a tax return. The Company must determine whether it is “more-likely-than-not” that a tax position will be sustained upon examination, including resolution of any related appeals or litigation processes, based on the technical merits of the position. Once it is determined that a position meets the more-likely-than-not recognition threshold, the previously unrecognized benefit associated with the position is recognized in the financial statements. This pronouncement applies to all positions related to income taxes. A reconciliation of the beginning and ending amount of unrecognized tax benefits is as follows:
| | | | | | | | | | | | |
| | | Year ended December 31, | |
| | | 2011 | | | 2010 | | | 2009 | |
Balance at beginning of year | | $ | 652 | | | $ | 892 | | | $ | 799 | |
Additions (reductions) for tax positions of prior years | | | 56 | | | | (240 | ) | | | 93 | |
| | | | | | | | | | | | |
Balance at end of year | | $ | 708 | | | $ | 652 | | | $ | 892 | |
| | | | | | | | | | | | |
All of such amount, if recognized, would impact our reconciliation between the income tax expense calculated at the statutory federal income tax rate of 34% and the actual income tax expense recorded each year.
It is reasonably possible that the total amount of unrecognized tax benefits will decrease up to $708 within 12 months of the reporting date due to settlement opportunities with the applicable taxing authorities. As of December 31, 2011, the tax years that remain subject to examination by major tax jurisdictions generally include 2007 through 2011.
The Company recognizes penalties and interest related to unrecognized tax benefits in income tax expense. During the years ended December 31, 2011, 2010 and 2009, the Company recognized $84, $69 and $57, respectively, in penalties and interest. The Company had $210 and $126 for the payment of penalties and interest accrued at December 31, 2011 and 2010, respectively.
| 10. | Earnings per Common Share |
The limited partners’ outstanding limited partnership units in the Operating Partnership (which may be converted to common shares of beneficial interest) have been excluded from the diluted earnings per share calculation as there would be no effect on the amounts since the limited partners’ share of income would also be added back to net income. Any anti-dilutive shares have been excluded from the diluted earnings per share calculation. Unvested share-based payment awards that contain nonforfeitable rights to dividends or dividend equivalents (whether paid or unpaid) are participating securities and shall be included in the computation of earnings per share pursuant to the two-class method. Accordingly, distributed and undistributed earnings attributable to unvested restricted shares (participating securities) have been excluded, as applicable, from net income or loss attributable to common shareholders utilized in the basic and diluted earnings per share calculations. Net income or loss figures are presented net of noncontrolling interests in the earnings per share calculations.
F-40
For the years ended December 31, 2010 and 2009, diluted weighted average common shares do not include the impact of outstanding stock options and unvested compensation-related shares because the effect of these items on diluted earnings per share would be anti-dilutive. For the years ended December 31, 2010 and 2009, there were 173,258 and 77,035 anti-dilutive stock options and compensation-related shares outstanding, respectively.
The computation of basic and diluted earnings per common share is as follows:
| | | | | | | | | | | | |
| | | For the year ended December 31, | |
| | | 2011 | | | 2010 | | | 2009 | |
Numerator: | | | | | | | | | | | | |
Net income (loss) attributable to common shareholders before discontinued operations | | $ | 12,138 | | | $ | (23,942 | ) | | $ | (21,182 | ) |
Discontinued operations | | | 796 | | | | (851 | ) | | | 2,412 | |
| | | | | | | | | | | | |
Net income (loss) attributable to common shareholders | | | 12,934 | | | | (24,793 | ) | | | (18,770 | ) |
Dividends paid on unvested restricted shares | | | (169 | ) | | | (118 | ) | | | (20 | ) |
Undistributed earnings attributable to unvested restricted shares | | | 0 | | | | 0 | | | | 0 | |
| | | | | | | | | | | | |
Net income (loss) attributable to common shareholders excluding amounts attributable to unvested restricted shares | | $ | 12,765 | | | $ | (24,911 | ) | | $ | (18,790 | ) |
| | | | | | | | | | | | |
Denominator: | | | | | | | | | | | | |
Weighted average number of common shares—basic | | | 81,155,228 | | | | 69,549,441 | | | | 54,477,414 | |
Effect of dilutive securities: | | | | | | | | | | | | |
Stock options and compensation-related shares | | | 171,076 | | | | 0 | | | | 0 | |
| | | | | | | | | | | | |
Weighted average number of common shares—diluted | | | 81,326,304 | | | | 69,549,441 | | | | 54,477,414 | |
| | | | | | | | | | | | |
Earnings per Common Share—Basic: | | | | | | | | | | | | |
Net income (loss) attributable to common shareholders before discontinued operations and excluding amounts attributable to unvested restricted shares | | $ | 0.15 | | | $ | (0.35 | ) | | $ | (0.39 | ) |
Discontinued operations | | | 0.01 | | | | (0.01 | ) | | | 0.05 | |
| | | | | | | | | | | | |
Net income (loss) attributable to common shareholders excluding amounts attributable to unvested restricted shares | | $ | 0.16 | | | $ | (0.36 | ) | | $ | (0.34 | ) |
| | | | | | | | | | | | |
Earnings per Common Share—Diluted: | | | | | | | | | | | | |
Net income (loss) attributable to common shareholders before discontinued operations and excluding amounts attributable to unvested restricted shares | | $ | 0.15 | | | $ | (0.35 | ) | | $ | (0.39 | ) |
Discontinued operations | | | 0.01 | | | | (0.01 | ) | | | 0.05 | |
| | | | | | | | | | | | |
Net income (loss) attributable to common shareholders excluding amounts attributable to unvested restricted shares | | $ | 0.16 | | | $ | (0.36 | ) | | $ | (0.34 | ) |
| | | | | | | | | | | | |
F-41
| 11. | Supplemental Information to Statements of Cash Flows |
| | | | | | | | | | | | |
| | | For the year ended December 31, | |
| | | 2011 | | | 2010 | | | 2009 | |
Interest paid, net of capitalized interest | | $ | 38,318 | | | $ | 35,562 | | | $ | 37,347 | |
| | | | | | | | | | | | |
Interest capitalized | | | 459 | | | | 200 | | | | 703 | |
| | | | | | | | | | | | |
Income taxes paid, net | | | 1,073 | | | | 482 | | | | 473 | |
| | | | | | | | | | | | |
Distributions payable on common shares | | | 9,249 | | | | 8,036 | | | | 636 | |
| | | | | | | | | | | | |
Distributions payable on preferred shares | | | 7,402 | | | | 6,689 | | | | 6,689 | |
| | | | | | | | | | | | |
Redemption of common/preferred units for common/preferred shares | | | 0 | | | | 0 | | | | 59,121 | |
| | | | | | | | | | | | |
Write-off of fully amortized deferred financing costs | | | 3,317 | | | | 341 | | | | 1,293 | |
| | | | | | | | | | | | |
Accrued capital expenditures | | | 2,806 | | | | 256 | | | | 46 | |
| | | | | | | | | | | | |
Issuance (forfeiture) of restricted shares to employees and executives, net | | | 7,486 | | | | 2,742 | | | | (1,505 | ) |
| | | | | | | | | | | | |
Issuance of common shares for board of trustees compensation | | | 166 | | | | 110 | | | | 110 | |
| | | | | | | | | | | | |
Repurchase of common shares into treasury | | | 27,601 | | | | 566 | | | | 365 | |
| | | | | | | | | | | | |
In conjunction with the sale of properties, the Company disposed of the following assets and liabilities: | | | | | | | | | | | | |
Investment in properties, net of closing costs | | $ | 19,628 | | | $ | 122,202 | | | $ | 0 | |
Other assets | | | 378 | | | | 692 | | | | 0 | |
Liabilities | | | (279 | ) | | | (2,039 | ) | | | 0 | |
| | | | | | | | | | | | |
Sale of properties | | $ | 19,727 | | | $ | 120,855 | | | $ | 0 | |
| | | | | | | | | | | | |
In conjunction with the acquisition of properties, the Company assumed assets and liabilities and issued units as follows: | | | | | | | | | | | | |
Investment in properties (after credits at closing) | | $ | (541,947 | ) | | $ | (518,528 | ) | | $ | 0 | |
Issuance of common units | | | 7,245 | | | | 0 | | | | 0 | |
Other assets | | | (3,920 | ) | | | (6,235 | ) | | | 0 | |
Liabilities | | | 4,855 | | | | 68,783 | | | | 0 | |
| | | | | | | | | | | | |
Acquisition of properties | | $ | (533,767 | ) | | $ | (455,980 | ) | | $ | 0 | |
| | | | | | | | | | | | |
On January 1, 2012, the Company issued from treasury 69,899 restricted shares of beneficial interest to an executive who earned 182.9% of his 38,226 target number of shares from the performance-based awards of nonvested shares granted on April 28, 2009. One-third of the shares earned, or 23,300 shares, vested immediately on January 1, 2012, and the remaining two-thirds of the shares earned, or 46,599 shares, will vest in equal amounts on January 1, 2013 and January 1, 2014 based on continued employment. The executive received a cash payment of $56 on the earned shares equal to the value of all dividends paid on common shares from December 31, 2008 until the determination date, January 1, 2012. As of January 1, 2012, the executive is entitled to receive dividends as declared and paid on the earned shares and to vote the shares. These common shares of beneficial interest were issued under the 2009 Plan.
On January 1, 2012, the Company issued from treasury 8,928 common shares of beneficial interest and authorized an additional 8,928 deferred shares to the independent members of its Board of Trustees for their 2011 compensation. These common shares of beneficial interest were issued under the 2009 Plan.
F-42
On January 1, 2012, the Company received 30,493 common shares of beneficial interest related to executives and employees surrendering shares to pay taxes at the time restricted shares vested.
On January 19, 2012, the Company issued from treasury 10,535 common shares of beneficial interest related to the resignation of Kelly Kuhn from its Board of Trustees for accumulated deferred shares issued as compensation for years 2007 through 2011. These common shares of beneficial interest were issued under the 2009 Plan.
On January 26, 2012, the Board of Trustees approved long-term equity incentive awards to Michael D. Barnello, the Company’s President and Chief Executive Officer, Bruce A. Riggins, the Company’s Executive Vice President and Chief Financial Officer, and Alfred L. Young, the Company’s Executive Vice President and Chief Operating Officer. The approved awards include 24,021 time-based restricted shares issued from treasury to Mr. Barnello, 9,239 time-based restricted shares issued from treasury to Mr. Riggins, 12,934 time-based restricted shares issued from treasury to Mr. Young, and performance-based awards to Mr. Barnello in a target amount of 44,346 shares, to Mr. Riggins in a target amount of 15,152 shares and to Mr. Young in a target amount of 20,325 shares.
From February 1, 2012 through February 15, 2012, the Company sold 1,714,939 common shares of beneficial interest, par value $0.01 per share, under the 2011 Agreement (see Note 6), of which 1,260,256 were issued from treasury. After deducting the Manager’s discounts and commissions of $589, the Company raised net proceeds of $46,566. The net proceeds were used to pay down amounts outstanding under the Company’s senior unsecured credit facility and for general corporate purposes. After considering these additional shares sold, the Company has availability under the 2011 Agreement to issue and sell common shares of beneficial interest having an aggregate offering price of up to $163,655.
The Company paid the following common and preferred share dividends subsequent to December 31, 2011:
| | | | | | | | | | | | | | | | |
Security Type | | Dividend per
Share(1) | | | For the
Quarter Ended | | | Record Date | | | Payable Date | |
Common | | $ | 0.11 | | | | 31-Dec-2011 | | | | 31-Dec-2011 | | | | 13-Jan-2012 | |
7 1/2% Series D Preferred | | $ | 0.47 | | | | 31-Dec-2011 | | | | 1-Jan-2012 | | | | 13-Jan-2012 | |
8% Series E Preferred | | $ | 0.50 | | | | 31-Dec-2011 | | | | 1-Jan-2012 | | | | 13-Jan-2012 | |
7 1/4% Series G Preferred | | $ | 0.45 | | | | 31-Dec-2011 | | | | 1-Jan-2012 | | | | 13-Jan-2012 | |
7 1/2% Series H Preferred | | $ | 0.47 | | | | 31-Dec-2011 | | | | 1-Jan-2012 | | | | 13-Jan-2012 | |
| | (1) | Amounts are rounded to the nearest whole cent for presentation purposes. |
F-43
13. Quarterly Operating Results (Unaudited)
The Company’s unaudited consolidated quarterly operating data for the years ended December 31, 2011 and 2010 (in thousands, except per share data) follows. In the opinion of management, all adjustments (consisting of normal recurring accruals) necessary for a fair presentation of quarterly results have been reflected in the data. It is also management’s opinion, however, that quarterly operating data for hotel enterprises are not indicative of results to be achieved in succeeding quarters or years.
| | | | | | | | | | | | | | | | |
| | | Year Ended December 31, 2011 | |
| | | First | | | Second | | | Third | | | Fourth | |
| | | Quarter | | | Quarter | | | Quarter | | | Quarter | |
Total revenues from continuing operations | | $ | 138,359 | | | $ | 202,555 | | | $ | 199,136 | | | $ | 179,005 | |
Total expenses from continuing operations | | | 148,950 | | | | 178,444 | | | | 177,331 | | | | 171,510 | |
| | | | | | | | | | | | | | | | |
Net (loss) income from continuing operations | | | (10,591 | ) | | | 24,111 | | | | 21,805 | | | | 7,495 | |
Net (loss) income from discontinued operations | | | (213 | ) | | | 26 | | | | 516 | | | | 467 | |
| | | | | | | | | | | | | | | | |
Net (loss) income | | | (10,804 | ) | | | 24,137 | | | | 22,321 | | | | 7,962 | |
Net loss (income) attributable to noncontrolling interests | | | 2 | | | | 0 | | | | 0 | | | | (1 | ) |
Distributions to preferred shareholders | | | (7,746 | ) | | | (7,402 | ) | | | (7,402 | ) | | | (7,402 | ) |
Issuance costs of redeemed preferred shares | | | (731 | ) | | | 0 | | | | 0 | | | | 0 | |
| | | | | | | | | | | | | | | | |
Net (loss) income attributable to common shareholders | | $ | (19,279 | ) | | $ | 16,735 | | | $ | 14,919 | | | $ | 559 | |
| | | | | | | | | | | | | | | | |
Earnings per Common Share—Basic: | | | | | | | | | | | | | | | | |
Net (loss) income attributable to common shareholders before discontinued operations and excluding amounts attributable to unvested restricted shares | | $ | (0.26 | ) | | $ | 0.20 | | | $ | 0.17 | | | $ | 0.00 | |
Discontinued operations | | | 0.00 | | | | 0.00 | | | | 0.01 | | | | 0.01 | |
| | | | | | | | | | | | | | | | |
Net (loss) income attributable to common shareholders excluding amounts attributable to unvested restricted shares | | $ | (0.26 | ) | | $ | 0.20 | | | $ | 0.18 | | | $ | 0.01 | |
| | | | | | | | | | | | | | | | |
Earnings per Common Share—Diluted: | | | | | | | | | | | | | | | | |
Net (loss) income attributable to common shareholders before discontinued operations and excluding amounts attributable to unvested restricted shares | | $ | (0.26 | ) | | $ | 0.20 | | | $ | 0.17 | | | $ | 0.00 | |
Discontinued operations | | | 0.00 | | | | 0.00 | | | | 0.01 | | | | 0.01 | |
| | | | | | | | | | | | | | | | |
Net (loss) income attributable to common shareholders excluding amounts attributable to unvested restricted shares | | $ | (0.26 | ) | | $ | 0.20 | | | $ | 0.18 | | | $ | 0.01 | |
| | | | | | | | | | | | | | | | |
Weighted average number of common shares outstanding: | | | | | | | | | | | | | | | | |
Basic | | | 74,202,756 | | | | 82,220,410 | | | | 84,640,196 | | | | 83,417,987 | |
Diluted | | | 74,202,756 | | | | 82,372,022 | | | | 84,752,112 | | | | 83,530,710 | |
F-44
| | | | | | | | | | | | | | | | |
| | | Year Ended December 31, 2010 | |
| | | First
Quarter | | | Second
Quarter | | | Third
Quarter | | | Fourth
Quarter | |
Total revenues from continuing operations | | $ | 108,197 | | | $ | 165,725 | | | $ | 164,767 | | | $ | 161,794 | |
Total expenses from continuing operations | | | 126,128 | | | | 151,365 | | | | 152,752 | | | | 167,617 | |
| | | | | | | | | | | | | | | | |
Net (loss) income from continuing operations | | | (17,931 | ) | | | 14,360 | | | | 12,015 | | | | (5,823 | ) |
Net (loss) income from discontinued operations | | | (1,246 | ) | | | 328 | | | | 4,754 | | | | (4,687 | ) |
| | | | | | | | | | | | | | | | |
Net (loss) income | | | (19,177 | ) | | | 14,688 | | | | 16,769 | | | | (10,510 | ) |
Net loss (income) attributable to noncontrolling interests | | | 28 | | | | (9 | ) | | | 17 | | | | 155 | |
Distributions to preferred shareholders | | | (6,689 | ) | | | (6,688 | ) | | | (6,689 | ) | | | (6,688 | ) |
| | | | | | | | | | | | | | | | |
Net (loss) income attributable to common shareholders | | $ | (25,838 | ) | | $ | 7,991 | | | $ | 10,097 | | | $ | (17,043 | ) |
| | | | | | | | | | | | | | | | |
Earnings per Common Share—Basic: | | | | | | | | | | | | | | | | |
Net (loss) income attributable to common shareholders before discontinued operations and excluding amounts attributable to unvested restricted shares | | $ | (0.38 | ) | | $ | 0.11 | | | $ | 0.07 | | | $ | (0.17 | ) |
Discontinued operations | | | (0.02 | ) | | | 0.00 | | | | 0.07 | | | | (0.07 | ) |
| | | | | | | | | | | | | | | | |
Net (loss) income attributable to common shareholders excluding amounts attributable to unvested restricted shares | | $ | (0.40 | ) | | $ | 0.11 | | | $ | 0.14 | | | $ | (0.24 | ) |
| | | | | | | | | | | | | | | | |
| | | | | | | | | | | | | | | | |
Earnings per Common Share—Diluted: | | | | | | | | | | | | | | | | |
Net (loss) income attributable to common shareholders before discontinued operations and excluding amounts attributable to unvested restricted shares | | $ | (0.38 | ) | | $ | 0.11 | | | $ | 0.07 | | | $ | (0.17 | ) |
Discontinued operations | | | (0.02 | ) | | | 0.00 | | | | 0.07 | | | | (0.07 | ) |
| | | | | | | | | | | | | | | | |
Net (loss) income attributable to common shareholders excluding amounts attributable to unvested restricted shares | | $ | (0.40 | ) | | $ | 0.11 | | | $ | 0.14 | | | $ | (0.24 | ) |
| | | | | | | | | | | | | | | | |
| | | | | | | | | | | | | | | | |
Weighted average number of common shares outstanding: | | | | | | | | | | | | | | | | |
Basic | | | 64,981,780 | | | | 69,296,793 | | | | 71,246,259 | | | | 72,570,889 | |
Diluted | | | 64,981,780 | | | | 69,398,026 | | | | 71,345,731 | | | | 72,570,889 | |
F-45
LASALLE HOTEL PROPERTIES
Schedule III—Real Estate and Accumulated Depreciation
As of December 31, 2011
(in thousands)
| | | | | | | | | | | | | | | | | | | | | | | | | | | | | | | | | | | | | | | | | | | | | | | | | | | | | | | | | | | | | | |
| | | | | Initial Cost | | | Cost Capitalized Subsequent
to Acquisition(1) | | | Gross Amounts at Which
Carried at Close of Period | | | | | | | | | | | | Life on
Which
Depreciation
in Statement
of Operations
is Computed | |
| | | | | Encum-
brances | | | Land | | | Building
and
Improve-
ments | | | Furniture,
Fixtures
and
Equipment | | | Land | | | Building
and
Improve-
ments | | | Furniture,
Fixtures
and
Equipment | | | Land | | | Building
and
Improve-
ments | | | Furniture,
Fixtures
and
Equipment | | | Accumu-
lated
Depre-
ciation | | | Net Book
Value | | | Date of
Original
Construc-
tion | | | Date of
Acqui-
sition | | |
1. | | Le Montrose Suite Hotel | | $ | 0 | | | $ | 5,004 | | | $ | 19,752 | | | $ | 2,951 | | | $ | 0 | | | $ | 5,056 | | | $ | 6,889 | | | $ | 5,004 | | | $ | 24,808 | | | $ | 9,840 | | | $ | 19,417 | | | $ | 20,235 | | | | 1976 | | | | 04/29/98 | | | | 3-40 years | |
2. | | San Diego Paradise Point Resort and Spa | | | 0 | | | | 0 | | | | 69,639 | | | | 3,665 | | | | 109 | | | | 32,691 | | | | 24,126 | | | | 109 | | | | 102,330 | | | | 27,791 | | | | 64,643 | | | | 65,587 | | | | 1962 | | | | 06/01/98 | | | | 3-40 years | |
3. | | Harborside Hyatt Conference Center & Hotel | | | 42,500 | | | | 0 | | | | 66,159 | | | | 5,246 | | | | 8 | | | | 4,547 | | | | 5,907 | | | | 8 | | | | 70,706 | | | | 11,153 | | | | 40,849 | | | | 41,018 | | | | 1993 | | | | 06/24/98 | | | | 3-40 years | |
4. | | Hotel Viking | | | 0 | | | | 2,421 | | | | 24,375 | | | | 353 | | | | 76 | | | | 16,779 | | | | 12,324 | | | | 2,497 | | | | 41,154 | | | | 12,677 | | | | 25,088 | | | | 31,240 | | | | 1850 | | | | 06/02/99 | | | | 3-40 years | |
5. | | Topaz Hotel | | | 0 | | | | 2,137 | | | | 8,549 | | | | 0 | | | | 12 | | | | 4,006 | | | | 5,889 | | | | 2,149 | | | | 12,555 | | | | 5,889 | | | | 8,243 | | | | 12,350 | | | | 1963 | | | | 03/08/01 | | | | 3-40 years | |
6. | | Hotel Madera | | | 0 | | | | 1,682 | | | | 6,726 | | | | 0 | | | | 15 | | | | 5,071 | | | | 3,705 | | | | 1,697 | | | | 11,797 | | | | 3,705 | | | | 7,176 | | | | 10,023 | | | | 1963 | | | | 03/08/01 | | | | 3-40 years | |
7. | | Hotel Rouge | | | 0 | | | | 2,162 | | | | 8,647 | | | | 0 | | | | 17 | | | | 5,017 | | | | 7,453 | | | | 2,179 | | | | 13,664 | | | | 7,453 | | | | 9,264 | | | | 14,032 | | | | 1963 | | | | 03/08/01 | | | | 3-40 years | |
8. | | Hotel Helix | | | 0 | | | | 2,636 | | | | 10,546 | | | | 0 | | | | 14 | | | | 8,845 | | | | 7,421 | | | | 2,650 | | | | 19,391 | | | | 7,421 | | | | 12,616 | | | | 16,846 | | | | 1962 | | | | 03/08/01 | | | | 3-40 years | |
9. | | The Liaison Capitol Hill | | | 0 | | | | 8,353 | | | | 33,412 | | | | 2,742 | | | | 19 | | | | 13,931 | | | | 15,135 | | | | 8,372 | | | | 47,343 | | | | 17,877 | | | | 28,529 | | | | 45,063 | | | | 1968 | | | | 06/01/01 | | | | 3-40 years | |
10. | | Lansdowne Resort | | | 0 | | | | 27,421 | | | | 74,835 | | | | 3,114 | | | | 33,131 | | | | 26,918 | | | | 18,542 | | | | 60,552 | | | | 101,753 | | | | 21,656 | | | | 51,539 | | | | 132,422 | | | | 1991 | | | | 06/17/03 | | | | 3-40 years | |
11. | | Hotel George | | | 0 | | | | 1,743 | | | | 22,221 | | | | 531 | | | | 0 | | | | 207 | | | | 2,871 | | | | 1,743 | | | | 22,428 | | | | 3,402 | | | | 9,041 | | | | 18,532 | | | | 1928 | | | | 09/18/03 | | | | 3-40 years | |
12. | | Indianapolis Marriott Downtown | | | 101,319 | | | | 0 | | | | 96,173 | | | | 9,879 | | | | 0 | | | | 1,839 | | | | 10,286 | | | | 0 | | | | 98,012 | | | | 20,165 | | | | 43,512 | | | | 74,665 | | | | 2001 | | | | 02/10/04 | | | | 3-40 years | |
13. | | Hilton Alexandria Old Town | | | 0 | | | | 11,079 | | | | 45,539 | | | | 2,597 | | | | 0 | | | | 1,782 | | | | 5,269 | | | | 11,079 | | | | 47,321 | | | | 7,866 | | | | 19,477 | | | | 46,789 | | | | 2000 | | | | 05/28/04 | | | | 3-40 years | |
14. | | Chaminade Resort and Conference Center | | | 0 | | | | 5,240 | | | | 13,111 | | | | 299 | | | | 24 | | | | 8,819 | | | | 7,832 | | | | 5,264 | | | | 21,930 | | | | 8,131 | | | | 12,281 | | | | 23,044 | | | | 1985 | | | | 11/18/04 | | | | 3-40 years | |
15. | | Hilton San Diego Gaslamp Quarter | | | 59,600 | | | | 5,008 | | | | 77,892 | | | | 2,250 | | | | 0 | | | | 828 | | | | 3,472 | | | | 5,008 | | | | 78,720 | | | | 5,722 | | | | 19,051 | | | | 70,399 | | | | 2000 | | | | 01/06/05 | | | | 3-40 years | |
16. | | The Grafton on Sunset | | | 0 | | | | 1,882 | | | | 23,226 | | | | 431 | | | | 11 | | | | 1,024 | | | | 1,798 | | | | 1,893 | | | | 24,250 | | | | 2,229 | | | | 6,088 | | | | 22,284 | | | | 1954 | | | | 01/10/05 | | | | 3-40 years | |
17. | | Onyx Hotel | | | 0 | | | | 6,963 | | | | 21,262 | | | | 445 | | | | 0 | | | | 138 | | | | 618 | | | | 6,963 | | | | 21,400 | | | | 1,063 | | | | 4,336 | | | | 25,090 | | | | 2004 | | | | 05/18/05 | | | | 3-40 years | |
18. | | Westin Copley Place | | | 210,000 | | | | 0 | | | | 295,809 | | | | 28,223 | | | | 0 | | | | 12,829 | | | | 31,604 | | | | 0 | | | | 308,638 | | | | 59,827 | | | | 89,730 | | | | 278,735 | | | | 1983 | | | | 08/31/05 | | | | 3-40 years | |
19. | | Hotel Deca(2) | | | 9,392 | | | | 4,938 | | | | 21,720 | | | | 577 | | | | 0 | | | | 433 | | | | 3,159 | | | | 4,938 | | | | 22,153 | | | | 3,736 | | | | 6,533 | | | | 24,294 | | | | 1931 | | | | 12/08/05 | | | | 3-40 years | |
20. | | The Hilton San Diego Resort and Spa | | | 0 | | | | 0 | | | | 85,572 | | | | 4,800 | | | | 116 | | | | 15,367 | | | | 13,222 | | | | 116 | | | | 100,939 | | | | 18,022 | | | | 33,036 | | | | 86,041 | | | | 1962 | | | | 12/15/05 | | | | 3-40 years | |
21. | | Donovan House | | | 0 | | | | 11,384 | | | | 34,573 | | | | 0 | | | | 0 | | | | 36,453 | | | | 10,112 | | | | 11,384 | | | | 71,026 | | | | 10,112 | | | | 19,711 | | | | 72,811 | | | | 1972 | | | | 12/16/05 | | | | 3-40 years | |
22. | | Le Parc Suite Hotel | | | 0 | | | | 13,971 | | | | 31,742 | | | | 2,741 | | | | 3 | | | | 1,086 | | | | 4,261 | | | | 13,974 | | | | 32,828 | | | | 7,002 | | | | 9,529 | | | | 44,275 | | | | 1970 | | | | 01/27/06 | | | | 3-40 years | |
23. | | Westin Michigan Avenue | | | 138,902 | | | | 38,158 | | | | 154,181 | | | | 24,112 | | | | 17 | | | | 9,679 | | | | 12,178 | | | | 38,175 | | | | 163,860 | | | | 36,290 | | | | 58,403 | | | | 179,922 | | | | 1963/1972 | | | | 03/01/06 | | | | 3-40 years | |
24. | | Hotel Sax Chicago | | | 0 | | | | 9,403 | | | | 104,148 | | | | 889 | | | | 155 | | | | 21,994 | | | | 15,055 | | | | 9,558 | | | | 126,142 | | | | 15,944 | | | | 34,103 | | | | 117,541 | | | | 1998 | | | | 03/01/06 | | | | 3-40 years | |
25. | | Alexis Hotel | | | 0 | | | | 6,581 | | | | 31,062 | | | | 578 | | | | 13 | | | | 8,076 | | | | 6,384 | | | | 6,594 | | | | 39,138 | | | | 6,962 | | | | 11,993 | | | | 40,701 | | | | 1901/1982 | | | | 06/15/06 | | | | 3-40 years | |
26. | | Hotel Solamar | | | 60,900 | | | | 0 | | | | 79,111 | | | | 7,890 | | | | 0 | | | | 189 | | | | 1,217 | | | | 0 | | | | 79,300 | | | | 9,107 | | | | 19,288 | | | | 69,119 | | | | 2005 | | | | 08/01/06 | | | | 3-40 years | |
27. | | Gild Hall. | | | 0 | | | | 6,732 | | | | 45,016 | | | | 984 | | | | 2 | | | | 2,994 | | | | 9,395 | | | | 6,734 | | | | 48,010 | | | | 10,379 | | | | 14,697 | | | | 50,426 | | | | 1999 | | | | 11/17/06 | | | | 3-40 years | |
28. | | Amarano Burbank | | | 0 | | | | 5,982 | | | | 29,292 | | | | 1,253 | | | | (1,090 | ) | | | 65 | | | | 1,628 | | | | 4,892 | | | | 29,357 | | | | 2,881 | | | | 6,451 | | | | 30,679 | | | | 2002 | | | | 12/19/06 | | | | 3-40 years | |
29. | | Sofitel Washington, DC Lafayette Square | | | 0 | | | | 11,082 | | | | 80,342 | | | | 2,619 | | | | 0 | | | | 73 | | | | 1,666 | | | | 11,082 | | | | 80,415 | | | | 4,285 | | | | 4,921 | | | | 90,861 | | | | 2002 | | | | 03/01/10 | | | | 3-40 years | |
30. | | Hotel Monaco San Francisco | | | 0 | | | | 11,435 | | | | 53,186 | | | | 3,736 | | | | 0 | | | | 0 | | | | 100 | | | | 11,435 | | | | 53,186 | | | | 3,836 | | | | 2,777 | | | | 65,680 | | | | 1910/1995 | | | | 09/01/10 | | | | 3-40 years | |
31. | | Westin Philadelphia. | | | 0 | | | | 35,100 | | | | 106,100 | | | | 3,776 | | | | 0 | | | | 0 | | | | 390 | | | | 35,100 | | | | 106,100 | | | | 4,166 | | | | 4,597 | | | | 140,769 | | | | 1990 | | | | 09/01/10 | | | | 3-40 years | |
32. | | Embassy Suites Philadelphia-Center City | | | 0 | | | | 13,600 | | | | 62,900 | | | | 2,504 | | | | 0 | | | | 1,947 | | | | 1,449 | | | | 13,600 | | | | 64,847 | | | | 3,953 | | | | 2,856 | | | | 79,544 | | | | 1963/1993 | | | | 09/01/10 | | | | 3-40 years | |
33. | | Hotel Roger Williams | | | 63,589 | | | | 0 | | | | 95,079 | | | | 3,509 | | | | 0 | | | | (184 | ) | | | 111 | | | | 0 | | | | 94,895 | | | | 3,620 | | | | 4,340 | | | | 94,175 | | | | 1930/1998 | | | | 10/06/10 | | | | 3-34 years | |
34. | | Chamberlain West Hollywood | | | 0 | | | | 6,470 | | | | 29,085 | | | | 2,895 | | | | 0 | | | | 32 | | | | 457 | | | | 6,470 | | | | 29,117 | | | | 3,352 | | | | 1,456 | | | | 37,483 | | | | 1970/2005 | | | | 12/06/10 | | | | 3-40 years | |
35. | | Viceroy Santa Monica | | | 0 | | | | 0 | | | | 75,270 | | | | 4,747 | | | | 0 | | | | 0 | | | | 332 | | | | 0 | | | | 75,270 | | | | 5,079 | | | | 2,378 | | | | 77,971 | | | | 1967/2002 | | | | 03/16/11 | | | | 3-40 years | |
36. | | Villa Florence | | | 0 | | | | 12,413 | | | | 50,997 | | | | 3,202 | | | | 0 | | | | 0 | | | | 85 | | | | 12,413 | | | | 50,997 | | | | 3,287 | | | | 487 | | | | 66,210 | | | | 1908 | | | | 10/05/11 | | | | 3-40 years | |
37. | | Park Central Hotel | | | 0 | | | | 135,306 | | | | 251,008 | | | | 9,004 | | | | 0 | | | | 0 | | | | 0 | | | | 135,306 | | | | 251,008 | | | | 9,004 | | | | 0 | | | | 395,318 | | | | 1928 | | | | 12/29/11 | | | | 3-40 years | |
| | | | | | | | | | | | | | | | | | | | | | | | | | | | | | | | | | | | | | | | | | | | | | | | | | | | | | | | | | | | | | |
| | Total | | $ | 686,202 | | | $ | 406,286 | | | $ | 2,338,257 | | | $ | 142,542 | | | $ | 32,652 | | | $ | 248,531 | | | $ | 252,342 | | | $ | 438,938 | | | $ | 2,586,788 | | | $ | 394,884 | | | $ | 708,436 | | | $ | 2,712,174 | | | | | | | | | | | | | |
| | | | | | | | | | | | | | | | | | | | | | | | | | | | | | | | | | | | | | | | | | | | | | | | | | | | | | | | | | | | | | |
| (1) | Costs of disposals, impairments and reclassifications to property under development are reflected as reductions to cost capitalized subsequent to acquisition. Reclassifications from property under development are reflected as increases to cost capitalized subsequent to acquisition. |
| (2) | Encumbrance on the Hotel Deca is presented at face value which excludes loan premium of $195 at December 31, 2011. |
F-46
LASALLE HOTEL PROPERTIES
Schedule III—Real Estate and Accumulated Depreciation—Continued
As of December 31, 2011
Reconciliation of Real Estate and Accumulated Depreciation:
| | | | |
Reconciliation of Real Estate: | | | | |
Balance at December 31, 2008 | | $ | 2,434,289 | |
Improvements and additions to hotel properties | | | 18,617 | |
Reclassification from property under development | | | 5,941 | |
Disposal of assets | | | (332 | ) |
| | | | |
Balance at December 31, 2009 | | $ | 2,458,515 | |
Acquisition of hotel properties | | | 523,420 | |
Improvements and additions to hotel properties | | | 20,015 | |
Reclassification from property under development | | | 1,694 | |
Reclassification to property under development | | | (1,557 | ) |
Disposal of hotels | | | (121,296 | ) |
Impairment of assets held for sale | | | (32,687 | ) |
Disposal of assets | | | (1,066 | ) |
| | | | |
Balance at December 31, 2010 | | $ | 2,847,038 | |
Acquisition of hotel properties | | | 541,947 | |
Improvements and additions to hotel properties | | | 38,343 | |
Reclassification from property under development | | | 13,282 | |
Disposal of hotel | | | (20,000 | ) |
| | | | |
Balance at December 31, 2011 | | $ | 3,420,610 | |
| | | | |
| |
Reconciliation of Accumulated Depreciation: | | | | |
Balance at December 31, 2008 | | $ | 467,034 | |
Depreciation | | | 109,174 | |
Disposal of assets | | | (195 | ) |
| | | | |
Balance at December 31, 2009 | | $ | 576,013 | |
Depreciation | | | 110,138 | |
Disposal of hotels | | | (58,212 | ) |
Impairment of assets held for sale | | | (29,836 | ) |
Disposal of assets | | | (427 | ) |
| | | | |
Balance at December 31, 2010 | | $ | 597,676 | |
Depreciation | | | 110,760 | |
| | | | |
Balance at December 31, 2011 | | $ | 708,436 | |
| | | | |
F-47