
Exhibit 99.1 Pebblebrook Hotel Trust and LaSalle Hotel Properties Updated Merger Rationale and Benefits 1 June 28, 2018

Additional Information This communication does not constitute an offer to buy or solicitation of an offer to sell any securities. This communication relates to a proposal which Pebblebrook Hotel Trust (“Pebblebrook”) has made for a business combination transaction with LaSalle Hotel Properties (“LaSalle”). In furtherance of this proposal and subject to future developments, Pebblebrook (and, if a negotiated transaction is agreed, LaSalle) may file one or more registration statements, proxy statements, tender or exchange offer statements, prospectuses or other documents with the United States Securities and Exchange Commission (the “SEC”). This communication is not a substitute for any proxy statement, registration statement, tender or exchange offer statement, prospectus or other document Pebblebrook or LaSalle may file with the SEC in connection with the proposed transaction. INVESTORS AND SECURITY HOLDERS OF PEBBLEBROOK AND LASALLE ARE URGED TO READ ANY SUCH PROXY STATEMENT, REGISTRATION STATEMENT, TENDER OR EXCHANGE OFFER STATEMENT, PROSPECTUS AND OTHER DOCUMENTS FILED WITH THE SEC CAREFULLY AND IN THEIR ENTIRETY IF AND WHEN THEY BECOME AVAILABLE AS THEY WILL CONTAIN IMPORTANT INFORMATION ABOUT THE PROPOSED TRANSACTION. Any definitive proxy statement or prospectus (if and when available) will be delivered to shareholders of LaSalle or Pebblebrook, as applicable. Investors and security holders will be able to obtain free copies of these documents (if and when available) and other documents filed with the SEC by Pebblebrook through the website maintained by the SEC at http://www.sec.gov. Pebblebrook or LaSalle and their respective trustees and executive officers and other members of management and employees may be deemed to be participants in the solicitation of proxies in respect of the proposed transaction. You can find information about Pebblebrook’s executive officers and trustees in Pebblebrook’s definitive proxy statement filed with the SEC on April 27, 2018. You can find information about LaSalle’s executive officers and trustees in LaSalle’s definitive proxy statement filed with the SEC on March 22, 2018. Additional information regarding the interests of such potential participants will be included in one or more registration statements, proxy statements, tender or exchange offer statements or other documents filed with the SEC if and when they become available. You may obtain free copies of these documents using the sources indicated above. This document shall not constitute an offer to sell or the solicitation of an offer to buy any securities, nor shall there be any sale of securities in any jurisdiction in which such offer, solicitation or sale would be unlawful prior to registration or qualification under the securities laws of any such jurisdiction. No offering of securities shall be made except by means of a prospectus meeting the requirements of Section 10 of the Securities Act of 1933, as amended. Forward-Looking Statements This communication may include “forward-looking statements” within the meaning of the Private Securities Litigation Reform Act of 1995. These forward-looking statements include, but are not limited to, statements regarding Pebblebrook’s offer to acquire LaSalle, its financing of the proposed transaction, its expected future performance (including expected results of operations and financial guidance), and the combined company’s future financial condition, operating results, strategy and plans. Forward-looking statements may be identified by the use of the words “anticipates,” “expects,” “intends,” “plans,” “should,” “could,” “would,” “may,” “will,” “believes,” “estimates,” “potential,” “target,” “opportunity,” “tentative,” “positioning,” “designed,” “create,” “predict,” “project,” “seek,” “ongoing,” “upside,” “increases” or “continue” and variations or similar expressions. These statements are based upon the current expectations and beliefs of management and are subject to numerous assumptions, risks and uncertainties that change over time and could cause actual results to differ materially from those described in the forward-looking statements. These assumptions, risks and uncertainties include, but are not limited to, assumptions, risks and uncertainties discussed in Pebblebrook’s most recent annual or quarterly report filed with the SEC and assumptions, risks and uncertainties relating to the proposed transaction, as detailed from time to time in Pebblebrook’s and LaSalle’s filings with the SEC, which factors are incorporated herein by reference. Important factors that could cause actual results to differ materially from the forward- looking statements made in this communication are set forth in other reports or documents that Pebblebrook may file from time to time with the SEC, and include, but are not limited to: (i) the ultimate outcome of any possible transaction between Pebblebrook and LaSalle, including the possibilities that LaSalle will reject a transaction with Pebblebrook, (ii) the ultimate outcome and results of integrating the operations of Pebblebrook and LaSalle if a transaction is consummated, (iii) the ability to obtain regulatory approvals and meet other closing conditions to any possible transaction, including the necessary shareholder approvals, and (iv) the risks and uncertainties detailed by LaSalle with respect to its business as described in its reports and documents filed with the SEC. All forward-looking statements attributable to Pebblebrook or any person acting on Pebblebrook’s behalf are expressly qualified in their entirety by this cautionary statement. Readers are cautioned not to place undue reliance on any of these forward-looking statements. These forward-looking statements speak only as of the date hereof. Pebblebrook undertakes no obligation to update any of these forward-looking statements to reflect events or circumstances after the date of this communication or to reflect actual outcomes. 2

Superior Proposal for LaSalle Shareholders Remains Outstanding Pebblebrook’s proposal is materially superior to LaSalle’s current “takeunder” agreement with Blackstone. Pebblebrook’s proposal of cash and shares allows LaSalle shareholders to participate in improving economic and hotel industry fundamentals and Pebblebrook’s well-positioned portfolio, and receive a materially higher current price and substantially higher dividend . $36.47 implied offer price based on a 0.92 fixed exchange ratio and PEB’s 5-day Price VWAP of $39.28(1) . 9% above Blackstone’s existing “takeunder” proposal . Each LaSalle shareholder will elect consideration for each share of either . $37.80 cash (fixed and will not fluctuate)(2); or . 0.92 PEB share (a fixed exchange ratio) . Shares receiving cash consideration capped at 20% of total LHO shares outstanding Consideration . If greater than 20% of shares elect cash, those shares electing cash will be subject to pro rata cutbacks and the remainder will receive 0.92 PEB share per LHO share . Structure provides significant optionality with participation in upside and downside protection . Expected closing of approximately 90-120 days following execution of merger agreement . Certainty of closing and no financing contingency . Merger agreement with essentially the same terms and materially higher Execution consideration than current agreement with Blackstone . Severance payments and equity award vesting related to change in control will be waived for all of Pebblebrook’s senior officers . Pebblebrook expects to maintain its current dividend of $1.52 per share, which is a 55% increase for LaSalle shareholders(3) Note: $36.47 offer price is based on the blended consideration of 20% cash and 80% stock 3 (1) As of June 26, 2018 (2) Cash consideration fixed and will not fluctuate. $37.80 is based on a 0.92 exchange ratio and PEB’s 5-day VWAP as of June 8, 2018 (3) Based on a fixed exchange ratio of 0.92 and LaSalle’s current quarterly dividend per share of $0.225, or $0.90 annualized

Focused on Completing the Merger of Pebblebrook and LaSalle Pebblebrook is committed to completing the most logical strategic combination in the hotel REIT sector Similar strategy, hotels, markets and operators Operating and information synergies to unlock additional value Pebblebrook now owns 9.8% of LaSalle (about $363 million in LaSalle shares) – Pebblebrook is the largest active investor in LaSalle Committed to doing what is necessary to ensure LaSalle shareholders get their full value as opposed to Blackstone’s “takeunder” which represents a discount to both LaSalle’s current share price and Pebblebrook’s offer price Pebblebrook is prepared to sign a definitive agreement immediately and would expect to close in approximately 90 -120 days 4

Pebblebrook Offers Materially Higher Consideration 9% higher consideration today, with the option for cash or continued ownership in a premier lodging REIT and ability to participate in the future performance of the combined company $36.47 Blackstone is acquiring LaSalle at a discount to both 9% higher LaSalle’s current consideration share price and Pebblebrook’s offer for LaSalle price $33.50 shareholders than Blackstone’s proposal Current Blackstone Pebblebrook “Takeunder” Proposal(1) Agreement We are not aware of any listed equity REIT M&A transaction since 2006 in which a target has agreed to a cash proposal at a discount of greater than 1% compared to a competing share or share and cash proposal(2) Note: $36.47 offer price is based on the blended consideration of 20% cash and 80% stock 5 (1) Based on a fixed exchange ratio of 0.92 and Pebblebrook price of $39.28, which is PEB’s 5-day VWAP as of June 26, 2018 (2) The only listed equity REIT M&A transaction since 2006 in which a lower cash proposal was accepted compared to a competing share or share and cash proposal was Blackstone’s acquisition of Equity Office Properties in 2007; Blackstone’s proposal represented a less than 1% discount to the competing stock/cash proposal
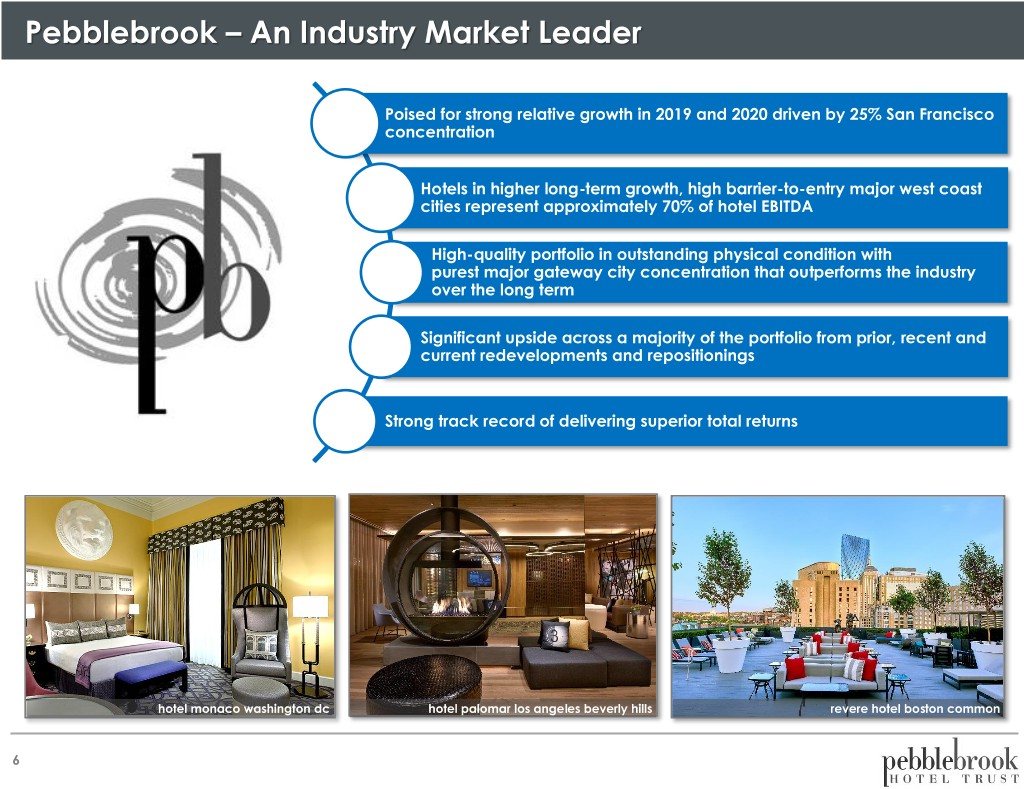
Pebblebrook – An Industry Market Leader Poised for strong relative growth in 2019 and 2020 driven by 25% San Francisco concentration Hotels in higher long-term growth, high barrier-to-entry major west coast cities represent approximately 70% of hotel EBITDA High-quality portfolio in outstanding physical condition with purest major gateway city concentration that outperforms the industry over the long term Significant upside across a majority of the portfolio from prior, recent and current redevelopments and repositionings Strong track record of delivering superior total returns hotel monaco washington dc hotel palomar los angeles beverly hills revere hotel boston common 6
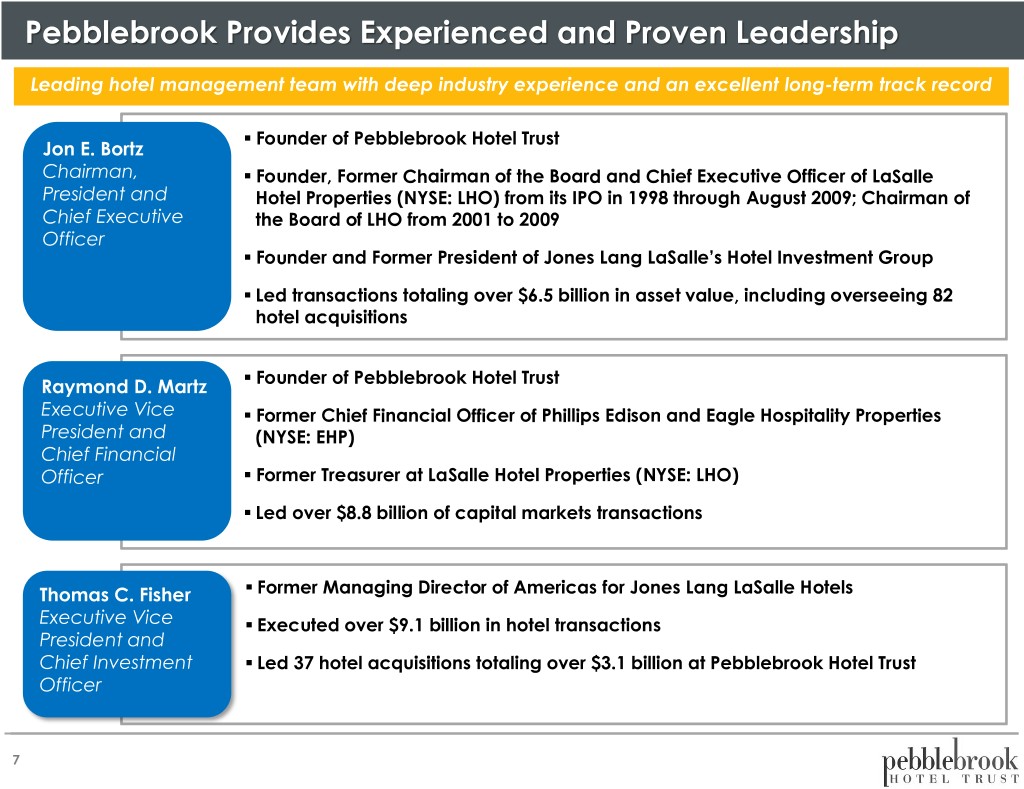
Pebblebrook Provides Experienced and Proven Leadership Leading hotel management team with deep industry experience and an excellent long-term track record . Founder of Pebblebrook Hotel Trust Jon E. Bortz Chairman, . Founder, Former Chairman of the Board and Chief Executive Officer of LaSalle President and Hotel Properties (NYSE: LHO) from its IPO in 1998 through August 2009; Chairman of Chief Executive the Board of LHO from 2001 to 2009 Officer . Founder and Former President of Jones Lang LaSalle’s Hotel Investment Group . Led transactions totaling over $6.5 billion in asset value, including overseeing 82 hotel acquisitions . Raymond D. Martz Founder of Pebblebrook Hotel Trust Executive Vice . Former Chief Financial Officer of Phillips Edison and Eagle Hospitality Properties President and (NYSE: EHP) Chief Financial . Officer Former Treasurer at LaSalle Hotel Properties (NYSE: LHO) . Led over $8.8 billion of capital markets transactions . Thomas C. Fisher Former Managing Director of Americas for Jones Lang LaSalle Hotels Executive Vice . Executed over $9.1 billion in hotel transactions President and Chief Investment . Led 37 hotel acquisitions totaling over $3.1 billion at Pebblebrook Hotel Trust Officer 7

Pebblebrook Management Delivers Strong Total Shareholder Returns Companies led by Jon Bortz have historically traded at premium multiples and outperformed the peer group and industry averages LaSalle Performance Under Jon Bortz Absolute Performance: From IPO to Jon LHO Relative Bortz Departure(1) Outperformance LaSalle Hotel Properties 96.5% - Russel 2000 42.0% 54.5% S&P 500 13.5% 83.0% SNL U.S. REIT Hotel (40.5%) 137.0% (2) Lodging Peers (45.4%) 141.9% Pebblebrook Performance Under Jon Bortz (3) LTM Trailing 5 Years Since PEB IPO Performance PEB vs Performance PEB vs Performance PEB vs Pebblebrook Hotel Properties 24.8% - 55.8% - 111.8% - Chesapeake Lodging Trust 21.1% 3.7% 49.3% 6.6% 96.2% 15.6% Host Hotels & Resorts 6.2% 18.6% 29.9% 25.9% 125.2% (13.4%) (4) Lodging Peers 4.2% 20.5% 39.0% 16.8% 95.6% 16.3% Sunstone Hotel Investors 3.5% 21.3% 52.6% 3.2% 125.3% (13.4%) SNL U.S. REIT Hotel 2.1% 22.7% 38.2% 17.6% 138.9% (27.1%) DiamondRock Hospitality (2.6%) 27.3% 35.4% 20.4% 66.0% 45.9% LaSalle Hotel Properties (7.0%) 31.8% 28.1% 27.8% 65.2% 46.6% Source: SNL (3) Total return from PEB’s IPO on 12/8/2009 – 3/27/2018 (unaffected close) 8 Note: Trailing 5 Year and LTM performance is as of 3/27/2018 (unaffected close); Total return includes reinvested dividends (4) Lodging Peers include HST, SHO, DRH, CHSP, and LHO (1) Total return from LHO’s IPO on 4/23/1998 until Jon’s last day as CEO on 9/13/2009 (2) Lodging Peers include: HST and FCH

Pebblebrook Consistently Trades at a Premium Multiple PEB has generally traded at a premium to its lodging REIT peers, providing a consistent cost of capital advantage Historical NTM EBITDA Multiple Summary (1) (1) (2) 5-Year Avg. 3-Year Avg. 1-Year Avg. 6-Month Avg. 3-Month Avg. 2018 YTD Avg. 2018E Multiple 2019E Multiple Total Return PEB 14.7x 14.0x 15.1x 15.5x 15.3x 15.3x 14.7x 14.2x 55.8% SHO 12.5x 12.0x 12.9x 13.0x 13.0x 13.0x 12.2x 11.9x 52.6% CHSP 13.3x 12.9x 13.3x 13.7x 13.4x 13.4x 13.3x 12.7x 49.3% DRH 12.4x 11.5x 11.9x 11.9x 11.8x 11.8x 11.6x 11.5x 35.4% HST 12.4x 11.6x 12.0x 12.3x 12.3x 12.3x 12.0x 11.8x 29.9% LHO 12.9x 12.1x 12.5x 12.7x 12.9x 12.9x 12.9x 12.5x 28.1% Lodging REIT Peers 12.7x 12.0x 12.5x 12.7x 12.6x 12.6x 12.3x 12.0x 39.0% PEB Spread to Lodging REIT Peers 2.0x 2.0x 2.6x 2.7x 2.7x 2.7x 2.5x 2.2x 16.8% 19.0x 18.0x 17.0x 16.0x PEB 5-Year Avg.: 14.7x 15.0x 14.0x PEB 5-Year Avg. Spread to Peers: 2.0x 13.0x 12.0x 11.0x Lodging REIT Peer 5-Year Avg.: 12.7x 10.0x 9.0x 3/26/2013 9/26/2013 3/26/2014 9/26/2014 3/26/2015 9/26/2015 3/26/2016 9/26/2016 3/26/2017 9/26/2017 3/26/2018 PEB LHO HST DRH CHSP SHO Lodging REIT Avg PEB Average Source: Company filings, FactSet, and SNL. Market data as of March 27, 2018. Note: Lodging REIT Peers include CHSP, DRH, HST and SHO 9 (1) Based on consensus estimates of 2018 or 2019 (as applicable) EBITDA as of March 27, 2018 (2) Trailing 5-year return as of March 27, 2018; includes reinvested dividends
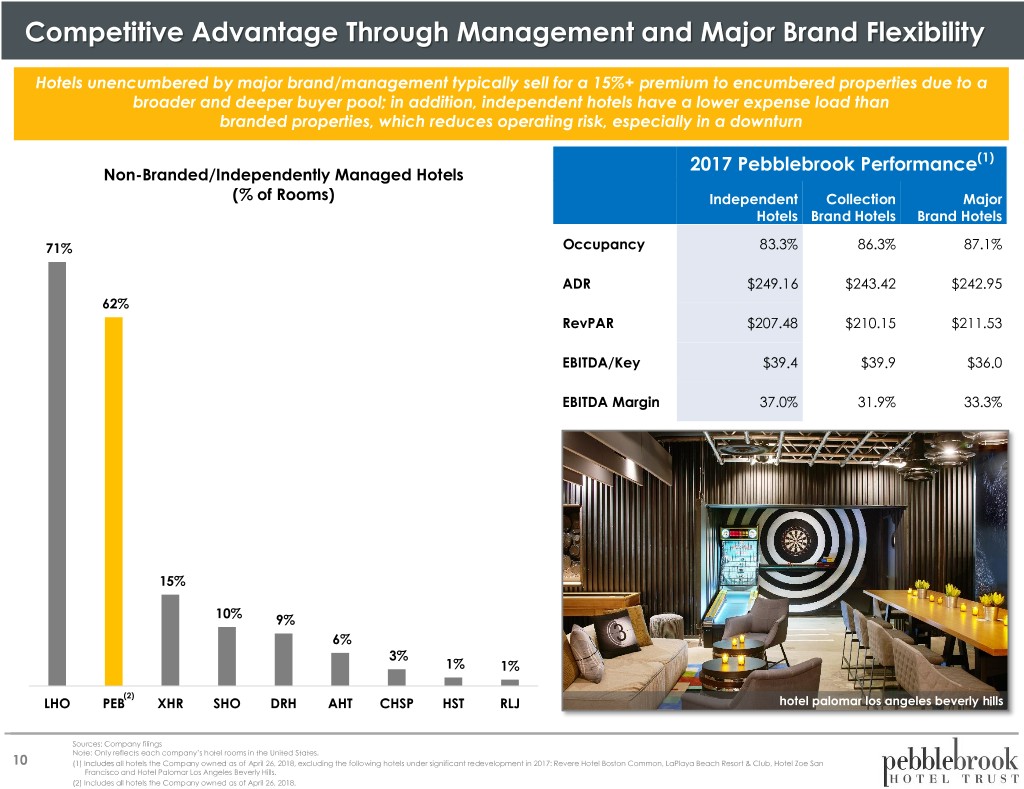
Competitive Advantage Through Management and Major Brand Flexibility Hotels unencumbered by major brand/management typically sell for a 15%+ premium to encumbered properties due to a broader and deeper buyer pool; in addition, independent hotels have a lower expense load than branded properties, which reduces operating risk, especially in a downturn 2017 Pebblebrook Performance(1) Non-Branded/Independently Managed Hotels (% of Rooms) Independent Collection Major Hotels Brand Hotels Brand Hotels 71% Occupancy 83.3% 86.3% 87.1% ADR $249.16 $243.42 $242.95 62% RevPAR $207.48 $210.15 $211.53 EBITDA/Key $39.4 $39.9 $36.0 EBITDA Margin 37.0% 31.9% 33.3% 15% 10% 9% 6% 3% 1% 1% (2) LHO PEB XHR SHO DRH AHT CHSP HST RLJ hotel palomar los angeles beverly hills Sources: Company filings Note: Only reflects each company’s hotel rooms in the United States. 10 (1) Includes all hotels the Company owned as of April 26, 2018, excluding the following hotels under significant redevelopment in 2017: Revere Hotel Boston Common, LaPlaya Beach Resort & Club, Hotel Zoe San Francisco and Hotel Palomar Los Angeles Beverly Hills. (2) Includes all hotels the Company owned as of April 26, 2018.
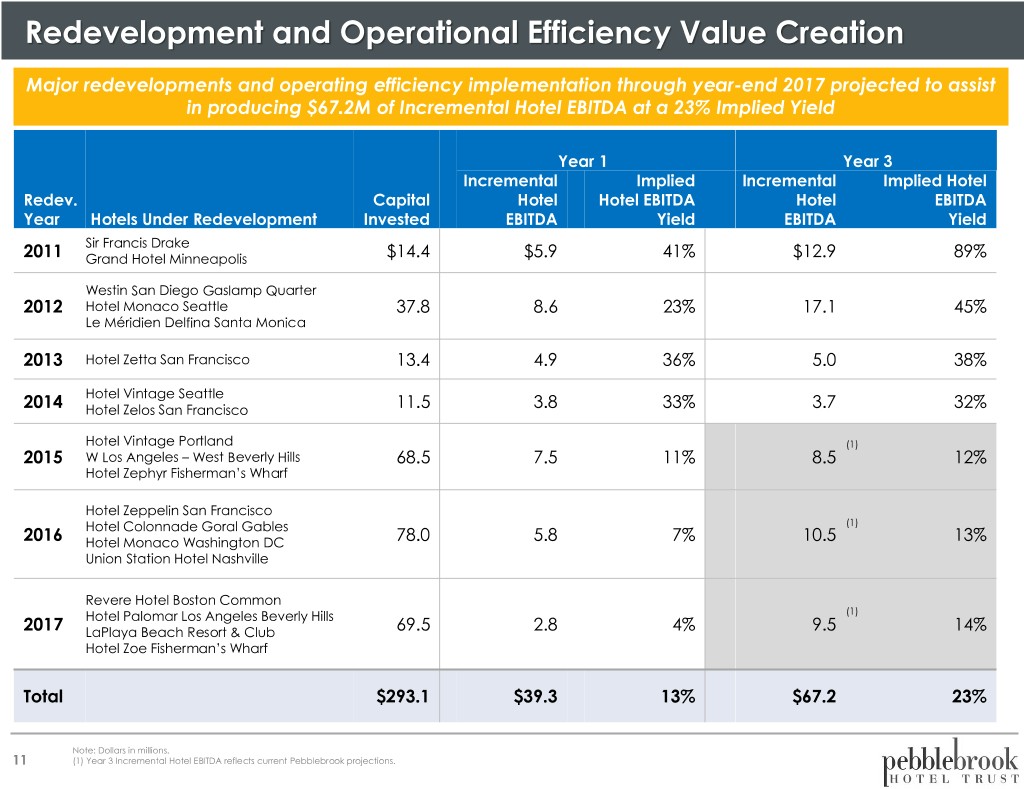
Redevelopment and Operational Efficiency Value Creation Major redevelopments and operating efficiency implementation through year-end 2017 projected to assist in producing $67.2M of Incremental Hotel EBITDA at a 23% Implied Yield Year 1 Year 3 Incremental Implied Incremental Implied Hotel Redev. Capital Hotel Hotel EBITDA Hotel EBITDA Year Hotels Under Redevelopment Invested EBITDA Yield EBITDA Yield Sir Francis Drake 2011 Grand Hotel Minneapolis $14.4 $5.9 41% $12.9 89% Westin San Diego Gaslamp Quarter 2012 Hotel Monaco Seattle 37.8 8.6 23% 17.1 45% Le Méridien Delfina Santa Monica 2013 Hotel Zetta San Francisco 13.4 4.9 36% 5.0 38% Hotel Vintage Seattle 2014 Hotel Zelos San Francisco 11.5 3.8 33% 3.7 32% Hotel Vintage Portland (1) 2015 W Los Angeles – West Beverly Hills 68.5 7.5 11% 8.5 12% Hotel Zephyr Fisherman’s Wharf Hotel Zeppelin San Francisco Hotel Colonnade Goral Gables (1) 2016 Hotel Monaco Washington DC 78.0 5.8 7% 10.5 13% Union Station Hotel Nashville Revere Hotel Boston Common Hotel Palomar Los Angeles Beverly Hills (1) 2017 LaPlaya Beach Resort & Club 69.5 2.8 4% 9.5 14% Hotel Zoe Fisherman’s Wharf Total $293.1 $39.3 13% $67.2 23% Note: Dollars in millions. 11 (1) Year 3 Incremental Hotel EBITDA reflects current Pebblebrook projections.
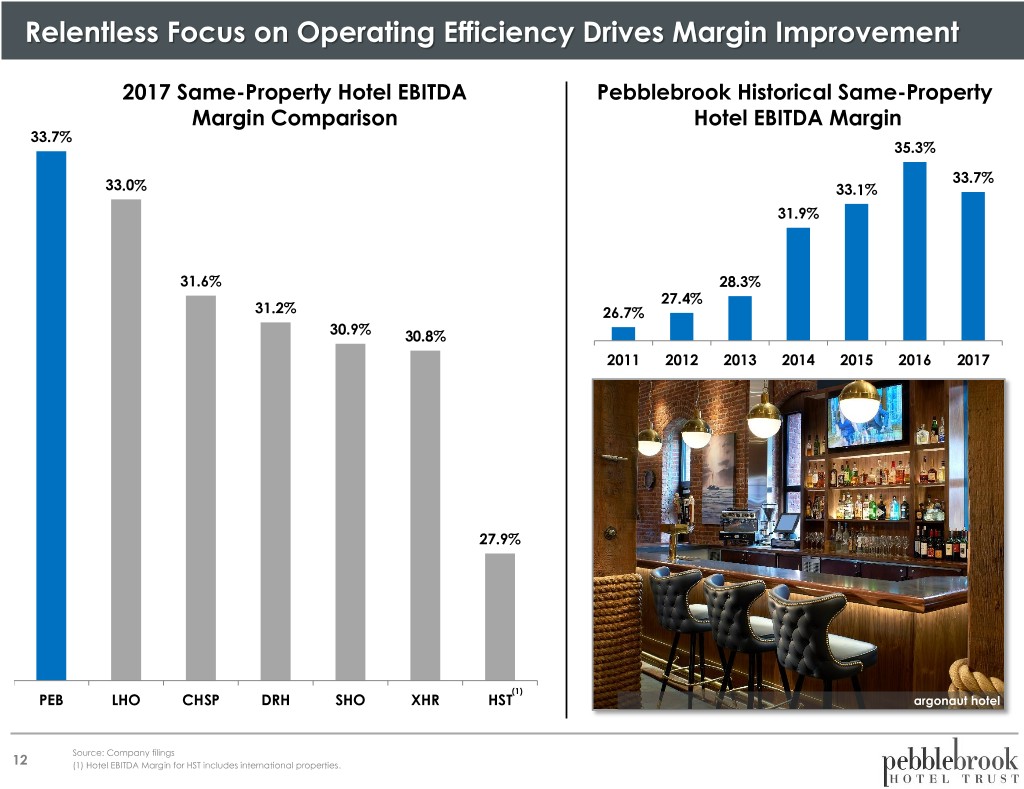
Relentless Focus on Operating Efficiency Drives Margin Improvement 2017 Same-Property Hotel EBITDA Pebblebrook Historical Same-Property Margin Comparison Hotel EBITDA Margin 33.7% 35.3% 33.7% 33.0% 33.1% 31.9% 31.6% 28.3% 27.4% 31.2% 26.7% 30.9% 30.8% 2011 2012 2013 2014 2015 2016 2017 27.9% (1) PEB LHO CHSP DRH SHO XHR HST argonaut hotel Source: Company filings 12 (1) Hotel EBITDA Margin for HST includes international properties.

Pebblebrook Has Maintained Impressive RevPAR Growth Asset and market purchase decisions, capital allocation and property redevelopment have led to Pebblebrook’s superior operating performance Historical RevPAR Growth Company 2011 2012 2013 2014 2015 2016 2017 PEB 10.3% 8.1% 6.4% 9.2% 3.3% 2.7% (2.2%) CHSP 9.1% 8.8% 5.1% 5.9% 5.7% 2.3% (2.4%) AHT 6.5% 5.2% 2.6% 9.9% 6.5% 3.2% 3.9% SHO 7.2% 5.6% 4.5% 6.8% 5.6% 1.3% 3.6% HST 6.1% 6.4% 5.8% 5.7% 3.8% 2.7% 1.3% DRH 6.3% 5.3% 1.4% 11.6% 4.7% (0.2%) 2.5% LHO 6.2% 4.6% 2.8% 8.8% 1.4% 2.5% (1.8%) hotel monaco washington dc 13 Source: Company filings
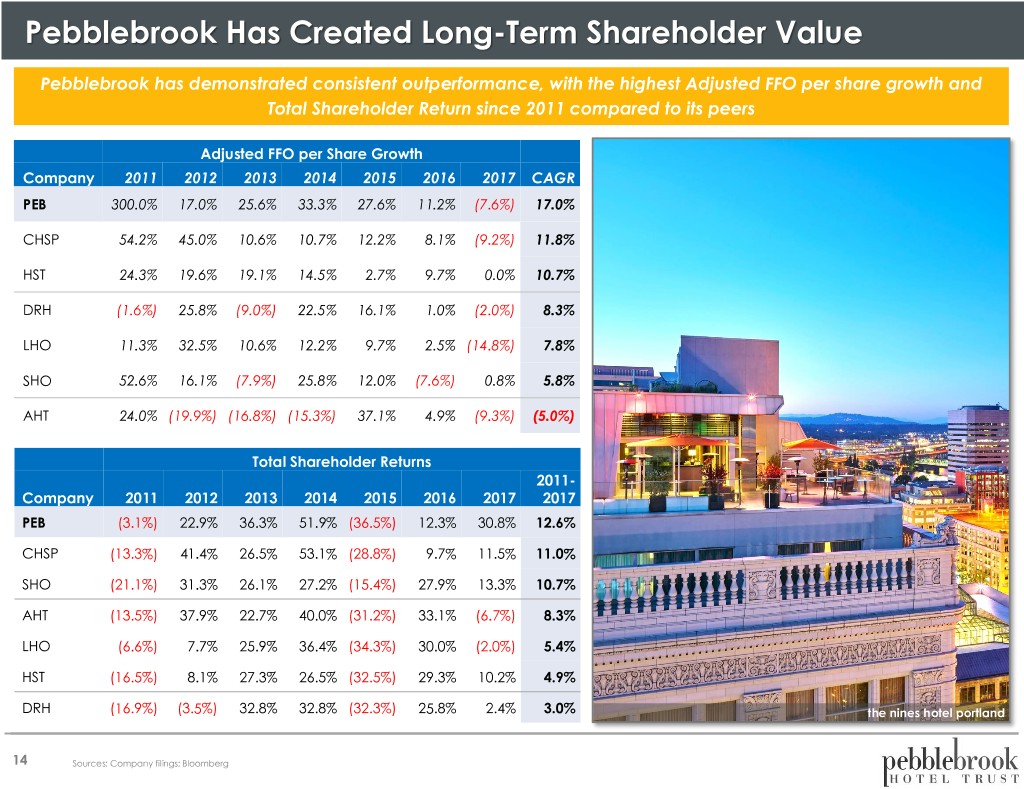
Pebblebrook Has Created Long-Term Shareholder Value Pebblebrook has demonstrated consistent outperformance, with the highest Adjusted FFO per share growth and Total Shareholder Return since 2011 compared to its peers Adjusted FFO per Share Growth Company 2011 2012 2013 2014 2015 2016 2017 CAGR PEB 300.0% 17.0% 25.6% 33.3% 27.6% 11.2% (7.6%) 17.0% CHSP 54.2% 45.0% 10.6% 10.7% 12.2% 8.1% (9.2%) 11.8% HST 24.3% 19.6% 19.1% 14.5% 2.7% 9.7% 0.0% 10.7% DRH (1.6%) 25.8% (9.0%) 22.5% 16.1% 1.0% (2.0%) 8.3% LHO 11.3% 32.5% 10.6% 12.2% 9.7% 2.5% (14.8%) 7.8% SHO 52.6% 16.1% (7.9%) 25.8% 12.0% (7.6%) 0.8% 5.8% AHT 24.0% (19.9%) (16.8%) (15.3%) 37.1% 4.9% (9.3%) (5.0%) Total Shareholder Returns 2011- Company 2011 2012 2013 2014 2015 2016 2017 2017 PEB (3.1%) 22.9% 36.3% 51.9% (36.5%) 12.3% 30.8% 12.6% CHSP (13.3%) 41.4% 26.5% 53.1% (28.8%) 9.7% 11.5% 11.0% SHO (21.1%) 31.3% 26.1% 27.2% (15.4%) 27.9% 13.3% 10.7% AHT (13.5%) 37.9% 22.7% 40.0% (31.2%) 33.1% (6.7%) 8.3% LHO (6.6%) 7.7% 25.9% 36.4% (34.3%) 30.0% (2.0%) 5.4% HST (16.5%) 8.1% 27.3% 26.5% (32.5%) 29.3% 10.2% 4.9% DRH (16.9%) (3.5%) 32.8% 32.8% (32.3%) 25.8% 2.4% 3.0% the nines hotel portland 14 Sources: Company filings; Bloomberg
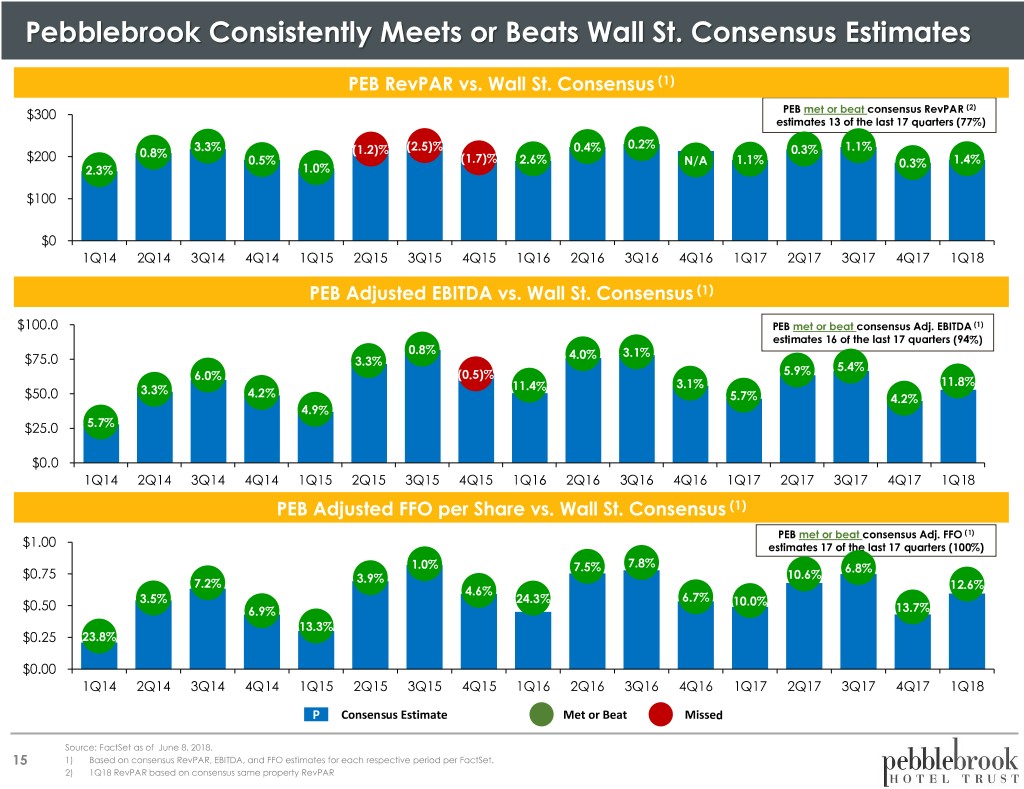
Pebblebrook Consistently Meets or Beats Wall St. Consensus Estimates PEB RevPAR vs. Wall St. Consensus (1) (2) $300 PEB met or beat consensus RevPAR estimates 13 of the last 17 quarters (77%) 3.3% (2.5)% 0.2% 1.1% 0.8% (1.2)% 0.4% 0.3% $200 0.5% (1.7)% 2.6% N/A 1.1% 0.3% 1.4% 2.3% 1.0% $100 $0 1Q14 2Q14 3Q14 4Q14 1Q15 2Q15 3Q15 4Q15 1Q16 2Q16 3Q16 4Q16 1Q17 2Q17 3Q17 4Q17 1Q18 PEB Adjusted EBITDA vs. Wall St. Consensus (1) $100.0 PEB met or beat consensus Adj. EBITDA (1) estimates 16 of the last 17 quarters (94%) 0.8% $75.0 4.0% 3.1% 3.3% 5.4% 6.0% (0.5)% 5.9% 3.1% 11.8% 3.3% 11.4% $50.0 4.2% 5.7% 4.2% 4.9% $25.0 5.7% $0.0 1Q14 2Q14 3Q14 4Q14 1Q15 2Q15 3Q15 4Q15 1Q16 2Q16 3Q16 4Q16 1Q17 2Q17 3Q17 4Q17 1Q18 PEB Adjusted FFO per Share vs. Wall St. Consensus (1) PEB met or beat consensus Adj. FFO (1) $1.00 estimates 17 of the last 17 quarters (100%) 1.0% 7.5% 7.8% 6.8% $0.75 3.9% 10.6% 7.2% 12.6% 4.6% 3.5% 24.3% 6.7% 10.0% $0.50 6.9% 13.7% 13.3% $0.25 23.8% $0.00 1Q14 2Q14 3Q14 4Q14 1Q15 2Q15 3Q15 4Q15 1Q16 2Q16 3Q16 4Q16 1Q17 2Q17 3Q17 4Q17 1Q18 P Consensus Estimate Met or Beat Missed Source: FactSet as of June 8, 2018. 15 1) Based on consensus RevPAR, EBITDA, and FFO estimates for each respective period per FactSet. 2) 1Q18 RevPAR based on consensus same property RevPAR

Strategic Merger Combination 16 hotel vintage portland

Higher Offer Today with Upside Potential and Downside Protection Our proposal offers superior value today to LaSalle shareholders and provides them with upside participation and downside protection Superior Value Today Total consideration of $36.47 per share(1), a 9% premium to Blackstone’s “takeunder” proposal Upside Participation Ability for implied value of consideration to increase with PEB price appreciation Downside Protection Fixed cash consideration of $37.80 for a maximum of 20% of LHO shares Blackstone’s existing proposal PEB’s implied share consideration (2) PEB’s implied cash consideration (3) Current proposal based on PEB 5-day VWAP of $39.28 19.0% $45.00 16.0% Premium 13.3% Premium Premium 8.9% $39.85 $40.00 4.6% $38.85 2.4% Premium $37.94 0.0% Premium Premium $36.47 Premium $35.02 $33.50 $34.30 $35.00 $33.50 $7.56 Blackstone $7.56 $30.00 “Takeunder” $7.56 $7.56 $38.85 $39.85 Proposal $37.94 $25.00 $28.91 $27.46 $25.94 $26.74 Merger Consideration Per Share Per Consideration Merger $20.00 $33.50 $35.24 $36.33 $37.32 $39.28 $41.24 $42.23 $43.32 (10.3%) (7.5%) (5.0%) 0.0% 5.0% 7.5% 10.3% PEB price must decrease to $35.24 (10.3%) to be as low as Blackstone’s consideration PEB’s Share Price and Percent Increase / (Decrease) (1) Note: Table displays average consideration per share, assuming a position of 5 or more shares. $36.47 offer price is based on the blended consideration of 20% cash and 80% stock 17 (1) Based on a fixed exchange ratio of 0.92 and Pebblebrook price of $39.28, which is PEB’s 5-day VWAP as of June 26, 2018 (2) Assumes all LHO shares elect 0.92 PEB shares if PEB stock increases above $41.09 (3) Assumes all LHO shares vote for cash if PEB stock falls below $41.09 and pro rated to 20% maximum cash cap

Today There Is No Legitimate Rationale For the Blackstone Takeunder 100% of LaSalle shares traded after the Blackstone deal announcement have traded above the $33.50 deal price and the share price has increased over that time as well – LaSalle’s shareholders clearly believe a higher deal price for LaSalle is warranted LaSalle Share Price Pebblebrook Offer Price(2): $37.00 $36.47 $36.00 LaSalle VWAP from 5/23/18 – $35.00 current(1): $34.80 The Blackstone $34.00 Agreement is a “takeunder” $33.00 Nearly 50% of Blackstone deal announced at LHO shares $32.00 $33.50 traded since 5/23/18 have traded over $31.00 $35.00 30 LaSalle Daily Trading Volume (millions) 25 20 15 10 5 - Sources: SNL and Bloomberg 18 (1) As of June 26, 2018 (2) Based on a fixed exchange ratio of 0.92 and Pebblebrook price of $39.28, which is PEB’s 5-day VWAP as of June 26, 2018
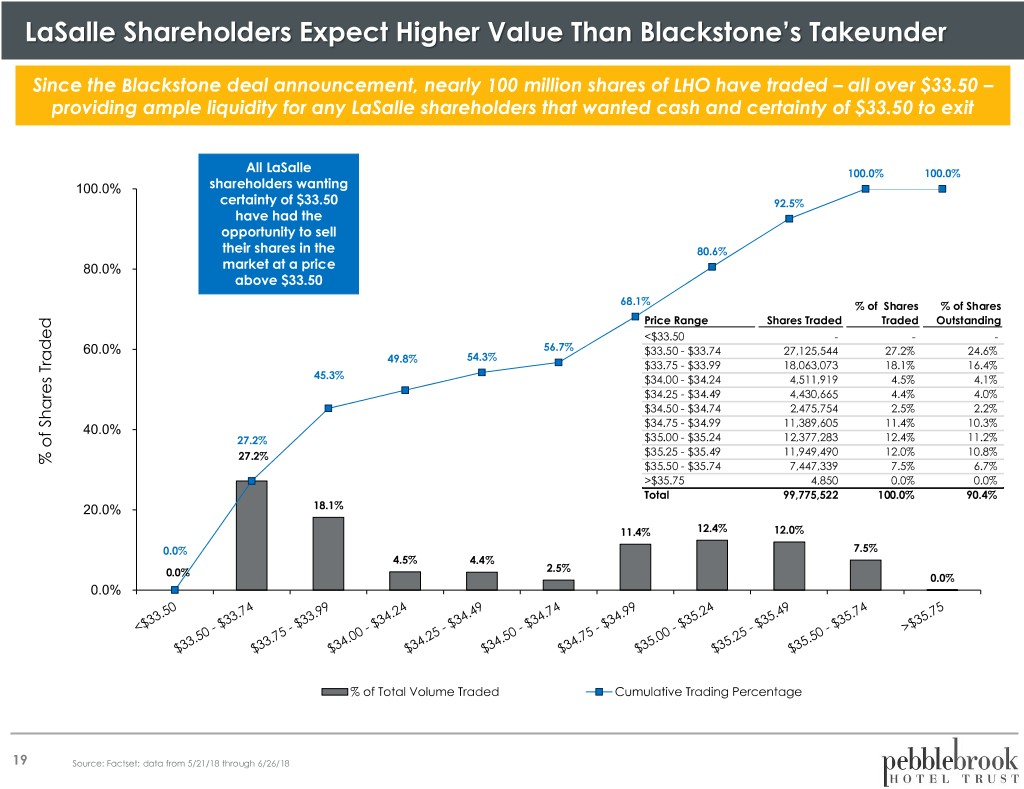
LaSalle Shareholders Expect Higher Value Than Blackstone’s Takeunder Since the Blackstone deal announcement, nearly 100 million shares of LHO have traded – all over $33.50 – providing ample liquidity for any LaSalle shareholders that wanted cash and certainty of $33.50 to exit All LaSalle 100.0% 100.0% 100.0% shareholders wanting certainty of $33.50 92.5% have had the opportunity to sell their shares in the 80.6% 80.0% market at a price above $33.50 68.1% % of Shares % of Shares Price Range Shares Traded Traded Outstanding <$33.50 - - - 60.0% 56.7% $33.50 - $33.74 27,125,544 27.2% 24.6% 49.8% 54.3% $33.75 - $33.99 18,063,073 18.1% 16.4% 45.3% $34.00 - $34.24 4,511,919 4.5% 4.1% $34.25 - $34.49 4,430,665 4.4% 4.0% $34.50 - $34.74 2,475,754 2.5% 2.2% 40.0% $34.75 - $34.99 11,389,605 11.4% 10.3% 27.2% $35.00 - $35.24 12,377,283 12.4% 11.2% 27.2% $35.25 - $35.49 11,949,490 12.0% 10.8% % of Shares Traded Shares of % $35.50 - $35.74 7,447,339 7.5% 6.7% >$35.75 4,850 0.0% 0.0% Total 99,775,522 100.0% 90.4% 20.0% 18.1% 11.4% 12.4% 12.0% 0.0% 7.5% 4.5% 4.4% 0.0% 2.5% 0.0% 0.0% % of Total Volume Traded Cumulative Trading Percentage 19 Source: Factset; data from 5/21/18 through 6/26/18
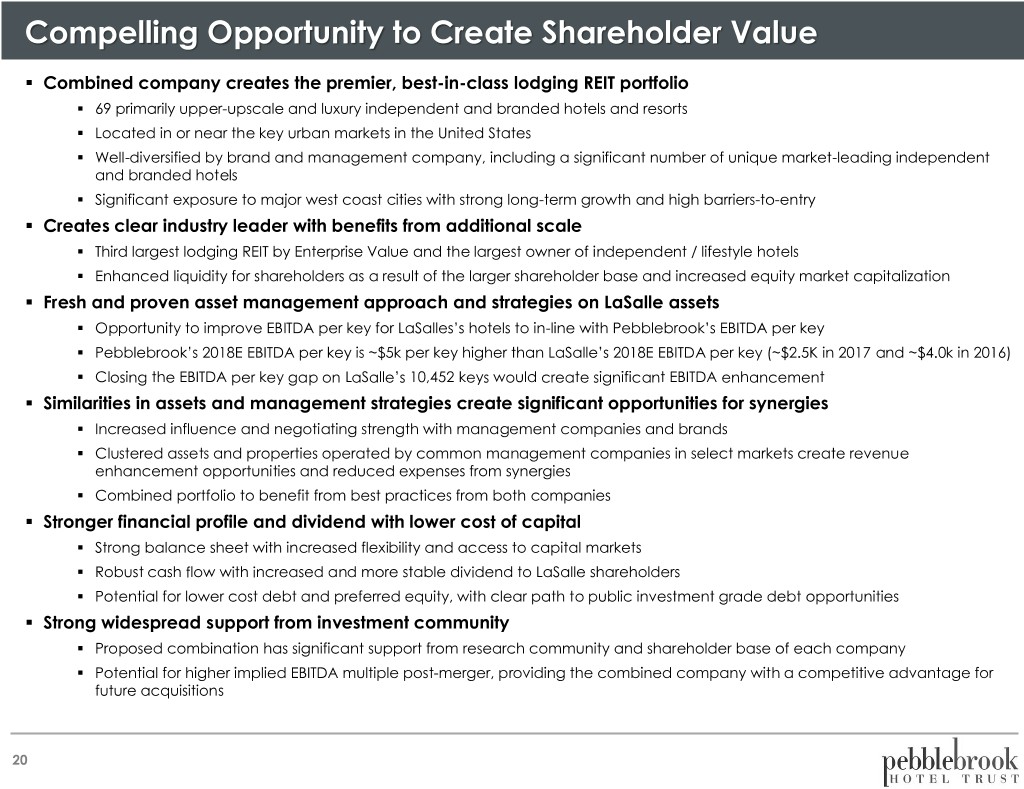
Compelling Opportunity to Create Shareholder Value . Combined company creates the premier, best-in-class lodging REIT portfolio . 69 primarily upper-upscale and luxury independent and branded hotels and resorts . Located in or near the key urban markets in the United States . Well-diversified by brand and management company, including a significant number of unique market-leading independent and branded hotels . Significant exposure to major west coast cities with strong long-term growth and high barriers-to-entry . Creates clear industry leader with benefits from additional scale . Third largest lodging REIT by Enterprise Value and the largest owner of independent / lifestyle hotels . Enhanced liquidity for shareholders as a result of the larger shareholder base and increased equity market capitalization . Fresh and proven asset management approach and strategies on LaSalle assets . Opportunity to improve EBITDA per key for LaSalles’s hotels to in-line with Pebblebrook’s EBITDA per key . Pebblebrook’s 2018E EBITDA per key is ~$5k per key higher than LaSalle’s 2018E EBITDA per key (~$2.5K in 2017 and ~$4.0k in 2016) . Closing the EBITDA per key gap on LaSalle’s 10,452 keys would create significant EBITDA enhancement . Similarities in assets and management strategies create significant opportunities for synergies . Increased influence and negotiating strength with management companies and brands . Clustered assets and properties operated by common management companies in select markets create revenue enhancement opportunities and reduced expenses from synergies . Combined portfolio to benefit from best practices from both companies . Stronger financial profile and dividend with lower cost of capital . Strong balance sheet with increased flexibility and access to capital markets . Robust cash flow with increased and more stable dividend to LaSalle shareholders . Potential for lower cost debt and preferred equity, with clear path to public investment grade debt opportunities . Strong widespread support from investment community . Proposed combination has significant support from research community and shareholder base of each company . Potential for higher implied EBITDA multiple post-merger, providing the combined company with a competitive advantage for future acquisitions 20

Creating An Industry Leader A combination of PEB and LHO will create the largest owner of independent hotels, the third-largest company in the lodging REIT sector as measured by enterprise value and the second-largest by equity market cap Enterprise Value $19,623 $9,110 $8,510 $6,419 $5,555 $5,761 $4,753 $4,469 $4,063 $3,689 $3,757 $3,282 $2,689 $2,397 $1,969 $1,460 $1,167 $269 $439 HT PK RLJ HST PEB INN AHT RHP XHR AHP LHO DRH SHO Pro APLE CLDT CHSP SOHO CDOR Forma 21 Dollars in millions Source: FacSet as of 6/26/2018

Powerful Strategic Fit Combined company will have greater presence in higher-growth markets in the U.S. and will improve the geographic diversification of LaSalle’s portfolio while reducing relative exposure to lower growth markets West Coast East Coast 2017A Hotel EBITDA (1) 2017A Hotel EBITDA (1) $323mm $252mm (53% of Total 2017A (41% of Total 2017A Hotel EBITDA) Hotel EBITDA) ($ in 000’s) $60,000 of EBITDA $30,000 of EBITDA $10,000 of EBITDA PEB LHO Top Markets (By % of 2017A Hotel EBITDA (1)) 20% 14% 13% 12% 11% 6% 5% 4% 4% 2% 2% 2% 2% 1% 1% 1% 22 (1) Pro forma based on Company filings
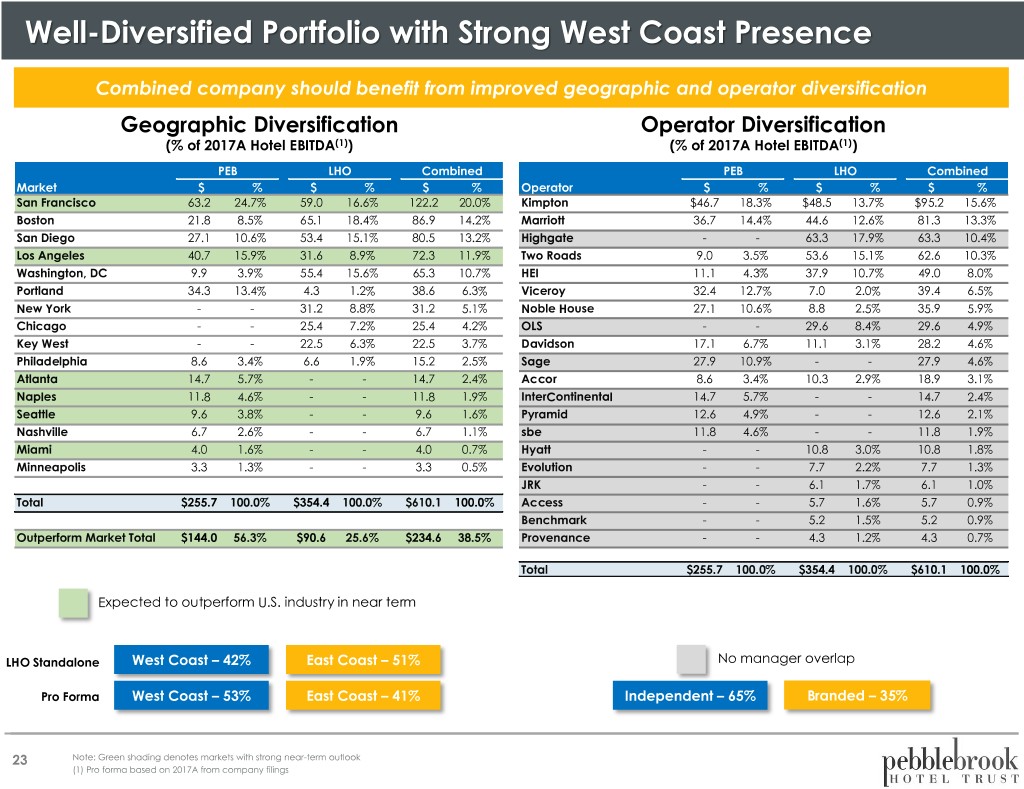
Well-Diversified Portfolio with Strong West Coast Presence Combined company should benefit from improved geographic and operator diversification Geographic Diversification Operator Diversification (% of 2017A Hotel EBITDA(1)) (% of 2017A Hotel EBITDA(1)) PEB LHO Combined PEB LHO Combined Market $ % $ % $ % Operator $ % $ % $ % San Francisco 63.2 24.7% 59.0 16.6% 122.2 20.0% Kimpton $46.7 18.3% $48.5 13.7% $95.2 15.6% Boston 21.8 8.5% 65.1 18.4% 86.9 14.2% Marriott 36.7 14.4% 44.6 12.6% 81.3 13.3% San Diego 27.1 10.6% 53.4 15.1% 80.5 13.2% Highgate - - 63.3 17.9% 63.3 10.4% Los Angeles 40.7 15.9% 31.6 8.9% 72.3 11.9% Two Roads 9.0 3.5% 53.6 15.1% 62.6 10.3% Washington, DC 9.9 3.9% 55.4 15.6% 65.3 10.7% HEI 11.1 4.3% 37.9 10.7% 49.0 8.0% Portland 34.3 13.4% 4.3 1.2% 38.6 6.3% Viceroy 32.4 12.7% 7.0 2.0% 39.4 6.5% New York - - 31.2 8.8% 31.2 5.1% Noble House 27.1 10.6% 8.8 2.5% 35.9 5.9% Chicago - - 25.4 7.2% 25.4 4.2% OLS - - 29.6 8.4% 29.6 4.9% Key West - - 22.5 6.3% 22.5 3.7% Davidson 17.1 6.7% 11.1 3.1% 28.2 4.6% Philadelphia 8.6 3.4% 6.6 1.9% 15.2 2.5% Sage 27.9 10.9% - - 27.9 4.6% Atlanta 14.7 5.7% - - 14.7 2.4% Accor 8.6 3.4% 10.3 2.9% 18.9 3.1% Naples 11.8 4.6% - - 11.8 1.9% InterContinental 14.7 5.7% - - 14.7 2.4% Seattle 9.6 3.8% - - 9.6 1.6% Pyramid 12.6 4.9% - - 12.6 2.1% Nashville 6.7 2.6% - - 6.7 1.1% sbe 11.8 4.6% - - 11.8 1.9% Miami 4.0 1.6% - - 4.0 0.7% Hyatt - - 10.8 3.0% 10.8 1.8% Minneapolis 3.3 1.3% - - 3.3 0.5% Evolution - - 7.7 2.2% 7.7 1.3% JRK - - 6.1 1.7% 6.1 1.0% Total $255.7 100.0% $354.4 100.0% $610.1 100.0% Access - - 5.7 1.6% 5.7 0.9% Benchmark - - 5.2 1.5% 5.2 0.9% Outperform Market Total $144.0 56.3% $90.6 25.6% $234.6 38.5% Provenance - - 4.3 1.2% 4.3 0.7% Total $255.7 100.0% $354.4 100.0% $610.1 100.0% Expected to outperform U.S. industry in near term LHO Standalone West Coast – 42% East Coast – 51% No manager overlap Pro Forma West Coast – 53% East Coast – 41% Independent – 65% Branded – 35% 23 Note: Green shading denotes markets with strong near-term outlook (1) Pro forma based on 2017A from company filings
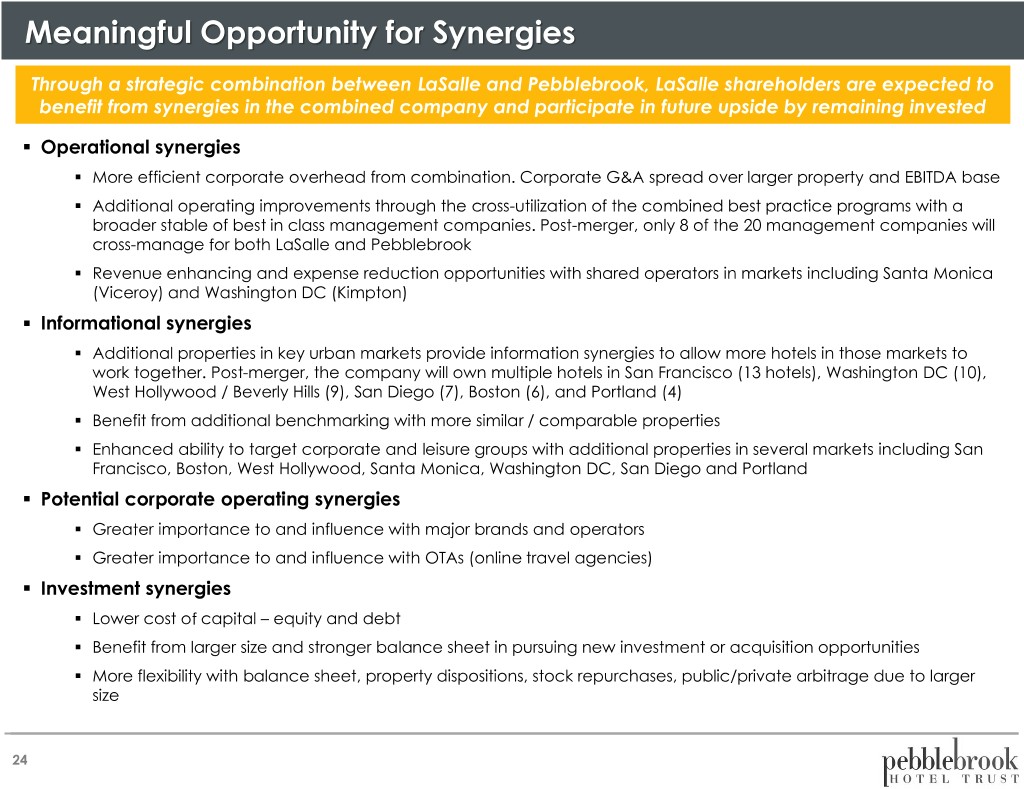
Meaningful Opportunity for Synergies Through a strategic combination between LaSalle and Pebblebrook, LaSalle shareholders are expected to benefit from synergies in the combined company and participate in future upside by remaining invested . Operational synergies . More efficient corporate overhead from combination. Corporate G&A spread over larger property and EBITDA base . Additional operating improvements through the cross-utilization of the combined best practice programs with a broader stable of best in class management companies. Post-merger, only 8 of the 20 management companies will cross-manage for both LaSalle and Pebblebrook . Revenue enhancing and expense reduction opportunities with shared operators in markets including Santa Monica (Viceroy) and Washington DC (Kimpton) . Informational synergies . Additional properties in key urban markets provide information synergies to allow more hotels in those markets to work together. Post-merger, the company will own multiple hotels in San Francisco (13 hotels), Washington DC (10), West Hollywood / Beverly Hills (9), San Diego (7), Boston (6), and Portland (4) . Benefit from additional benchmarking with more similar / comparable properties . Enhanced ability to target corporate and leisure groups with additional properties in several markets including San Francisco, Boston, West Hollywood, Santa Monica, Washington DC, San Diego and Portland . Potential corporate operating synergies . Greater importance to and influence with major brands and operators . Greater importance to and influence with OTAs (online travel agencies) . Investment synergies . Lower cost of capital – equity and debt . Benefit from larger size and stronger balance sheet in pursuing new investment or acquisition opportunities . More flexibility with balance sheet, property dispositions, stock repurchases, public/private arbitrage due to larger size 24

Significant Opportunity to Improve Hotel EBITDA Pebblebrook has significantly outperformed LaSalle on Hotel EBITDA Margin growth and Hotel EBITDA per key over the past 5 years Same-Property Hotel EBITDA Margin (1) Agg. Margin Improv. PEB LHO PEB Outperformance 2012A - 2017A 630 bps 90 bps 540 bps 2012A - 2018E 591 bps (110) bps 701 bps YoY Same-Property Improvement (2) (146) (220) 263 bps 113 bps 88 bps 19 bps 262 bps 101 bps 148 bps 118 bps 65 bps 37 bps (64) bps (50) bps bps bps 35.3% 33.2% 33.1% 33.5% 33.9% 33.7% 33.0% 33.4% 32.1% 32.2% 31.9% 31.0% 27.4% 28.3% 2012A 2013A 2014A 2015A 2016A 2017A 2018E Same-Property Hotel EBITDA per Key (1) CAGR PEB LHO PEB Outperformance Opportunity to improve LaSalle’s EBITDA 2012A - 2017A 7.3% 5.3% 197 bps per key based on PEB’s proven asset 2012A - 2018E 5.9% 3.2% 271 bps management approach and strategy YoY Same-Property (2) Improvement (4.7)% (4.0)% (0.9)% (7.8)% 16.7% 7.0% 8.4% 3.0% 16.3% 10.4% 7.6% 5.6% 4.2% 3.1% ~$5k per key x 10,452 rooms = $52.3mm of incremental EBITDA $39k $36k $36k $35k $35k $34k $33k $32k $33k $31k $26k $26k $28k $27k 2012A 2013A 2014A 2015A 2016A 2017A 2018E Source: Public filings Note: 2018E represents the midpoint of PEB guidance as of April 26, 2018 and midpoint of LHO Guidance as of May 10, 2018. (1) For PEB, based on properties defined in the Same-Property Inclusion Reference Table in each earnings release. For LHO, Hotel EBITDA margin based on the disclosed figure on the first page of each earnings release and Hotel EBITDA per Key 25 based on the FFO and EBITDA reconciliation in each earnings release and number of keys at the end of the period. LHO 2017A figures exclude Key West and 2018E Hotel EBITDA based on a midpoint of guidance of 31.0% Hotel EBITDA margin and $1,053.5mm Hotel Revenue as of May 10, 2018. (2) Margin improvement figures based on reported year over year Hotel EBITDA margin improvement. Hotel EBITDA per Key growth based on year-over-year growth of the comparable asset pool as reported each year.

Improving Industry Fundamentals Result in Strong Lodging REIT Performance Pebblebrook and its lodging REIT peers have traded up significantly throughout the last year as lodging fundamentals have performed above expectations and management teams have become more optimistic about the operating environment in 2018 and 2019 30.0% 1Q Earnings CHSP: 27.5% Releases XHR: 23.8% PEB: 18.9% 20.0% PK: 11.8% LHO: 11.6% 10.0% HST: 10.6% SNL U.S. REIT: 7.5% - DRH: 5.2% SHO: 0.9% (10.0%) (20.0%) (30.0%) 26 Source: SNL as of 6/26/18 Note: Price performance is the trailing 12 months as of 6/26/18

Opportunity to Participate in Improving Industry Performance Pebblebrook and its lodging REIT peers benefit from a strong economy and the lodging sector is poised to continue outperforming . The lodging industry has experienced improving fundamentals and a more stable travel environment . As a result, lodging REIT peers have recently increased their outlooks for 2018 and are more optimistic about the future . Smith Travel Research and PwC have also increased 2018 outlooks, forecasting stronger growth in occupancy, ADR and RevPAR . From a strategic combination of LaSalle with Pebblebrook, LaSalle shareholders will receive considerable value today and future upside through an investment in a larger, more diversified company that is well- positioned to capitalize on the strong market environment and company-specific opportunities 2018 FY Outlook at 4Q17 2018 FY Outlook at 1Q18 Increase RevPAR FFO RevPAR FFO RevPAR FFO PEB 0.50% $2.54 0.75% $2.63 0.25% $0.09 CHSP 4.00% 2.38 4.00% 2.38 - - SHO 1.00% 1.10 1.25% 1.12 0.25% 0.01 HST 1.50% 1.65 2.00% 1.70 0.50% 0.05 DRH 1.00% 0.99 2.00% 1.03 1.00% 0.05 LHO (2.00%) 2.06 (0.75%) 2.18 1.25% 0.12 2018 FY RevPAR Outlook at 4Q17 after 1Q18 Increase STR 2.7% 2.9% 0.2% PwC 2.5% 3.0% 0.5% 27 Source: Company filings, based on midpoint where applicable, Raymond James Research, Smith Travel Research, PwC

LaSalle Management Is Recently Bullish on the Lodging Cycle LaSalle management is very optimistic about industry fundamentals following 1Q18 results – the combined company should benefit from strong industry tailwinds, making PEB share ownership more attractive than cash LaSalle Q1 2018 Earnings Call May 10, 2018 “There are a number of promising market and performance “We're pleased with our results this quarter, which meaningfully drivers positively impacting our business.” exceeded our own expectations.” “Our positivity is bolstered by the best quarter New York market “Looking specifically in San Francisco, the ramp-up has has had in 5 years, the start of the ramp-up in demand in San already started, and Q2 is looking great. For our assets in San Francisco, and the strong overall performance in our urban Francisco, we've a few brand-new properties that just markets in March and April.” debuted, and by early January 2019, 5 of our 6 assets in the market will be fully renovated. While 2018 pace is certainly “We have a uniquely positioned portfolio with significant strong for our San Francisco hotels at plus 20, we're even more upside in prime, high-barrier-to-entry urban and resort bullish about 2019 with the pace up 50%.” markets.” “We're already seeing San Francisco pivot, and we believe its “As we move forward in the second quarter and the full year, performance will improve in the second and third quarters. “ the picture is much brighter. Before diving into more detail, I want to express that we appreciate that we need to do a “…the citywide bookings are super strong in San Francisco. It better job ensuring shareholders and analysts understand the should play out to be the strongest major market in the value that we see in our portfolio in the market. Our updated country next year. So we feel very bullish about San Francisco, outlook and the color provided today attempt to do just that which we -- that hasn't really wavered, really, in years.” and help the financial community better understand how we're seeing the market and our properties. And I'm encouraged by the strength we're seeing throughout the portfolio.” 28 Source: Q1 2018 Earnings call.

Pebblebrook Management is Also Bullish on the Lodging Cycle Pebblebrook believes its portfolio is well-positioned to capitalize on strong industry trends, and expects the combined company to continue Pebblebrook’s outperformance for shareholders PEB Q1 2018 Earnings Call April 27, 2018 “2018 has started out very well for the industry and for “Given the continuing strength of the economy, the passage Pebblebrook. We've finally begun to see healthy signs of of the new federal tax bill and significant projected increases improvements in business travel. Last quarter, we talked about for corporate profits in 2018, it shouldn't come as a surprise that some early signs of business travel improving. And since our corporate travel is improving.” call in mid-February, we've seen those early indications broaden out through most of our markets and to a majority of “Many of our properties and markets performed better in Q1 our properties.” than we expected. Better-performing markets included West L.A., San Francisco and San Diego on the West Coast, and “When we look at the industry data, we see corroborating Philadelphia, Buckhead, South Florida and Boston on the East evidence of improving business travel trends.” Coast. And Boston was better even with the 3 Nor'easters that hit 3 weeks in a row in March. Even more encouraging in our “With the better-than-expected first quarter behind us, we're portfolio was that there really were no markets that performed increasingly optimistic about the potential for the continued worse than we expected.” improvement in travel, including business travel, and the benefits that will accrue to our performance should that come to pass. We're positioned well for the rest of the year and for 2019.” 29 Source: Q1 2018 Earnings call.
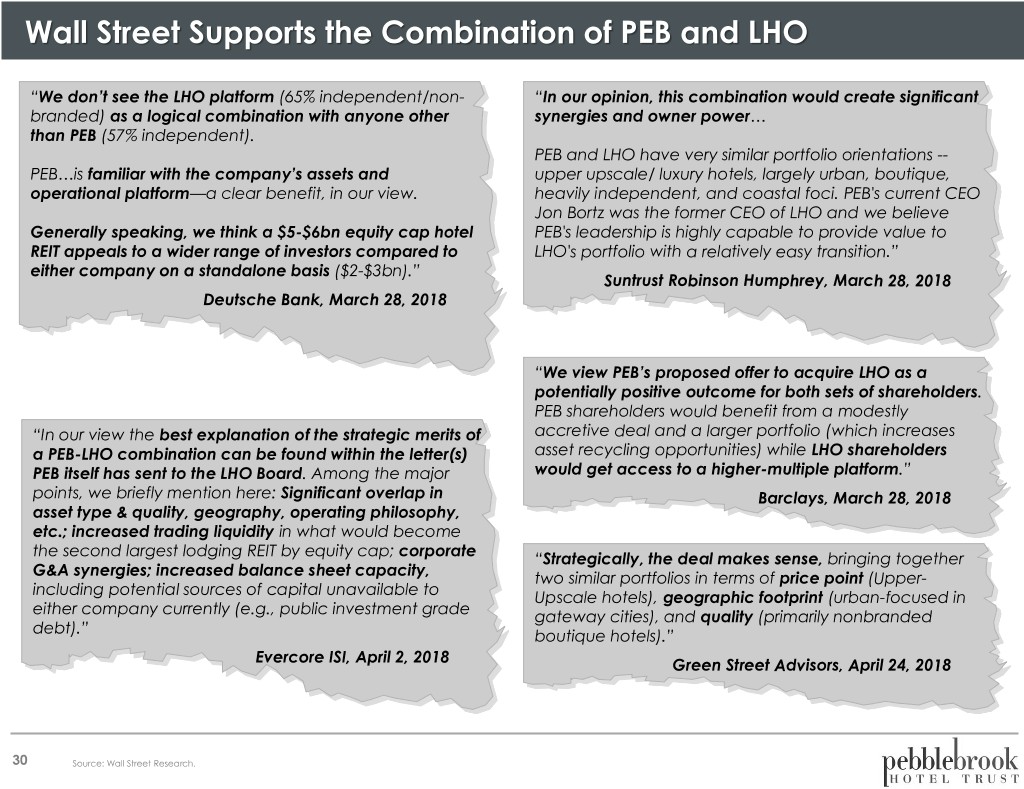
Wall Street Supports the Combination of PEB and LHO “We don’t see the LHO platform (65% independent/non- “In our opinion, this combination would create significant branded) as a logical combination with anyone other synergies and owner power… than PEB (57% independent). PEB and LHO have very similar portfolio orientations -- PEB…is familiar with the company’s assets and upper upscale/ luxury hotels, largely urban, boutique, operational platform—a clear benefit, in our view. heavily independent, and coastal foci. PEB's current CEO Jon Bortz was the former CEO of LHO and we believe Generally speaking, we think a $5-$6bn equity cap hotel PEB's leadership is highly capable to provide value to REIT appeals to a wider range of investors compared to LHO's portfolio with a relatively easy transition.” either company on a standalone basis ($2-$3bn).” Suntrust Robinson Humphrey, March 28, 2018 Deutsche Bank, March 28, 2018 “We view PEB’s proposed offer to acquire LHO as a potentially positive outcome for both sets of shareholders. PEB shareholders would benefit from a modestly “In our view the best explanation of the strategic merits of accretive deal and a larger portfolio (which increases a PEB-LHO combination can be found within the letter(s) asset recycling opportunities) while LHO shareholders PEB itself has sent to the LHO Board. Among the major would get access to a higher-multiple platform.” points, we briefly mention here: Significant overlap in Barclays, March 28, 2018 asset type & quality, geography, operating philosophy, etc.; increased trading liquidity in what would become the second largest lodging REIT by equity cap; corporate “Strategically, the deal makes sense, bringing together G&A synergies; increased balance sheet capacity, two similar portfolios in terms of price point (Upper- including potential sources of capital unavailable to Upscale hotels), geographic footprint (urban-focused in either company currently (e.g., public investment grade gateway cities), and quality (primarily nonbranded debt).” boutique hotels).” Evercore ISI, April 2, 2018 Green Street Advisors, April 24, 2018 30 Source: Wall Street Research.
Merger Opportunity Conclusions Combined company creates the premier, best-in-class lodging REIT Creates clear industry leader with synergistic benefits from additional scale across a portfolio of similar assets Pebblebrook’s creative asset management approach and strategies provide significant opportunities for EBITDA growth Stronger financial profile and dividend with lower cost of capital Widespread support from investment community 31

NYSE: PEB 32