UNITED STATES
SECURITIES AND EXCHANGE COMMISSION
Washington, D.C. 20549
FORMN-CSR
CERTIFIED SHAREHOLDER REPORT OF REGISTERED
MANAGEMENT INVESTMENT COMPANIES
| | |
| Investment Company Act file number | | 811-01424 |
|
AIM Equity Funds (Invesco Equity Funds) |
(Exact name of registrant as specified in charter) |
|
11 Greenway Plaza, Suite 1000 Houston, Texas 77046 |
(Address of principal executive offices) (Zip code) |
|
Sheri Morris 11 Greenway Plaza, Suite 1000 Houston, Texas 77046 |
(Name and address of agent for service) |
| | |
Registrant’s telephone number, including area code: | | (713)626-1919 |
| | |
Date of fiscal year end: | | 10/31 |
| |
Date of reporting period: | | 10/31/19 |
| Item 1. | Reports to Stockholders. |
| | | | |
| | |

| | Annual Report to Shareholders | | October 31, 2019 |
| | |
| | Invesco Charter Fund Nasdaq: A: CHTRX∎ C: CHTCX∎ R: CHRRX∎ S: CHRSX∎ Y: CHTYX∎ R5: CHTVX∎ R6: CHFTX |

Letters to Shareholders
| | |

Andrew Schlossberg | | Dear Shareholders: This annual report includes information about your Fund, including performance data and a complete list of its investments as of the close of the reporting period. Inside is a discussion of how your Fund was managed and the factors that affected its performance during the reporting period. Despite marked market volatility along the way, most global equity markets produced solid gains for the reporting period. As the reporting period unfolded in the final months of 2018, global equities were reeling from a sharp sell-off. The catalyst for the sell-off was a combination of ongoing trade concerns between the US and China, fears of a global economic slowdown and lower oil prices from a supply glut. Gains posted earlier in 2018 for global equities were erased, while US Treasury bonds, along with government and municipal bonds, rallied as investors fled to “safe haven” assets. |
At the start of 2019, global equity markets rebounded strongly buoyed by more policy from central banks and optimism about a potential US-China trade deal. In May, US-China trade concerns and slowing global growth led to a global equity sell-off and rally in US Treasuries. Despite the May sell-off, domestic equity markets rallied in June in anticipation of a US Federal Reserve (the Fed) interest rate cut and closed the second quarter with modest gains. Continued US-China trade worries and signs of slowing global economic growth left global equity markets largely flat for the third quarter. As the reporting period came to a close in October 2019, a raft of upbeat positive corporate earnings results and a US interest rate cut buoyed domestic equity results with some domestic indices recording record highs.
The Fed, in fact, both raised and lowered the federal funds rate during the reporting period. Given signs of a strong economy, the Fed raised rates in December 2018. In 2019, however, the Fed altered its outlook on further rate hikes leaving rates unchanged for the first half of the year. In July, the Fed lowered interest rates for the first time in 11 years. It again lowered rates in September and once again in October. As the year continues to unfold, we’ll see how the interplay of interest rates, economic data, geopolitics and a host of other factors affect US and overseas equity and fixed income markets.
Investor uncertainty and market volatility, such as we witnessed during the reporting period, are unfortunate facts of life when it comes to investing. That’s why Invesco encourages investors to work with a professional financial adviser who can stress the importance of starting to save and invest early and the importance of adhering to a disciplined investment plan. A financial adviser who knows your unique financial situation, investment goals and risk tolerance can be an invaluable partner as you seek to achieve your financial goals. He or she can offer a long-term perspective when markets are volatile and time-tested advice and guidance when your financial situation or investment goals change.
Visit our website for more information on your investments
Our website, invesco.com/us, offers a wide range of market insights and investment perspectives. On the website, you’ll find detailed information about our funds, including performance, holdings and portfolio manager commentaries. You can access information about your account by completing a simple, secure online registration. To do so, select “Log In” on the right side of the homepage, and then select “Register for Individual Account Access.”
In addition to the resources accessible on our website and through our mobile app, you can obtain timely updates to help you stay informed about the markets and the economy by connecting with Invesco on Twitter, LinkedIn or Facebook. You can access our blog at blog.invesco.us.com. Our goal is to provide you the information you want, when and where you want it.
Finally, I’m pleased to share with you Invesco’s commitment to both the Principles for Responsible Investment and to considering environmental, social and governance issues in our robust investment process. I invite you to learn more at invesco.com/esg.
Have questions?
For questions about your account, contact an Invesco client services representative at 800 959 4246.
All of us at Invesco look forward to serving your investment management needs. Thank you for investing with us.
Sincerely,

Andrew Schlossberg
Head of the Americas,
Senior Managing Director, Invesco Ltd.
| | |

Bruce Crockett | | Dear Shareholders: Among the many important lessons I’ve learned in more than 40 years in a variety of business endeavors is the value of a trusted advocate. As independent chair of the Invesco Funds Board, I can assure you that the members of the Board are strong advocates for the interests of investors in Invesco’s mutual funds. We work hard to represent your interests through oversight of the quality of the investment management services your funds receive and other matters important to your investment, including but not limited to: ∎ Ensuring that Invesco offers a diverse lineup of mutual funds that your financial adviser can use to strive to meet your financial needs as your investment goals change over time. ∎ Monitoring how the portfolio management teams of the Invesco funds are performing in light of changing economic and market conditions. |
| ∎ | | Assessing each portfolio management team’s investment performance within the context of the investment strategy described in the fund’s prospectus. |
| ∎ | | Monitoring for potential conflicts of interests that may impact the nature of the services that your funds receive. |
We believe one of the most important services we provide our fund shareholders is the annual review of the funds’ advisory and sub-advisory contracts with Invesco Advisers and its affiliates. This review is required by the Investment Company Act of 1940 and focuses on the nature and quality of the services Invesco provides as the adviser to the Invesco funds and the reasonableness of the fees that it charges for those services. Each year, we spend months carefully reviewing information received from Invesco and a variety of independent sources, such as performance and fee data prepared by Lipper, Inc. (a subsidiary of Broadridge Financial Solutions, Inc.), an independent, third-party firm widely recognized as a leader in its field. We also meet with our independent legal counsel and other independent advisers to review and help us assess the information that we have received. Our goal is to assure that you receive quality investment management services for a reasonable fee.
I trust the measures outlined above provide assurance that you have a worthy advocate when it comes to choosing the Invesco Funds.
On behalf of the Board, we look forward to continuing to represent your interests and serving your needs.
Sincerely,

Bruce L. Crockett
Independent Chair
Invesco Funds Board of Trustees
Management’s Discussion of Fund Performance
| | | | |
Performance summary For the fiscal year ended October 31, 2019, Class A shares of Invesco Charter Fund (the Fund), at net asset value (NAV), underperformed the Russell 1000 Index, the Fund’s style-specific benchmark. Your Fund’s long-term performance appears later in this report. | |
Fund vs. Indexes Total returns, October 31, 2018 to October 31, 2019, at net asset value (NAV). Performance shown does not include applicable contingent deferred sales charges (CDSC) or front-end sales charges, which would have reduced performance. | |
| Class A Shares* | | | 12.96% | |
| Class C Shares* | | | 12.14 | |
| Class R Shares* | | | 12.68 | |
| Class S Shares* | | | 13.09 | |
| Class Y Shares* | | | 13.24 | |
| Class R5 Shares* | | | 13.34 | |
| Class R6 Shares* | | | 13.38 | |
| S&P 500 Index▼(Broad Market Index) | | | 14.33 | |
| Russell 1000 Index▼(Style-Specific Index) | | | 14.15 | |
| Lipper Large-Cap Core Funds Index¾(Peer Group Index) | | | 12.62 | |
| Source(s):▼RIMES Technologies Corp.;¾Lipper Inc. | | | | |
* Performance includes litigation proceeds. Had these proceeds not been received, total returns would have been lower. | |
Market conditions and your Fund
The US economy continued to exhibit decent economic growth, low unemployment and modest inflation during the fiscal year. This was driven partly by tax cuts, technological innovation and falling regulatory hurdles. That said, the effect of the strain from US-China trade tensions has been a headwind to growth, but not nearly enough to offset the momentum in the economy.
Opinions in the market have become highly polarized in our view. On one hand, relative safe-haven equity investments, like consumer staples stocks and utilities, were bid up to lofty valuations. On the other hand, speculation remained at an elevated level during the fiscal year. The mania around cryptocurrency and now cannabis stocks are symptoms of this sentiment. More recently, the initial
public offering market has been very active. We believe an equally big risk to stock prices is the stock market’s preference for so-called “disruptors” and the potential for stocks with this perceived characteristic to become crowded trades and have valuations that are untethered to financial reality. We are looking both to avoid the disrupted companies, while also gaining exposure to disruptors that are trading at reasonable valuations.
Please note there was a portfolio management change effective June 21, 2019 and the portfolio was transitioned to reflect the investment philosophy and process of the new management team during the final four months of the fiscal year.
During the fiscal year, stock selection within the financials, information technology (IT) and utilities sectors were the largest contributors to the Fund’s perfor-
mance versus the Russell 1000 Index. This was offset by weaker stock selection within the communication services and industrials sectors. The Fund’s underweight exposures to the real estate and IT sectors and slight overweight exposure to the energy sector also detracted from the Fund’s performance versus the style-specific index.
The largest individual contributors to the Fund’s performance relative to the style-specific benchmark during the fiscal year includedEPAM Systems,Master-card, andWEC Energy. EPAM Systems is a digital provider of software engineering solutions and technology consulting. The company has benefited from the move to digital, which has driven strong growth rates and increasing margins. However, we exited this position after the portfolio management change.
Mastercard’s fundamentals remained strong during the fiscal year with mid-teens revenue growth, margin expansion and capital return mainly through stock buybacks. Mastercard’s wide moat from its lead in global merchant acceptance, technology innovation and wide variety of payments services business has well-positioned the company to compete and partner with emerging mobile-based payment models, such as digital wallets.
WEC Energy is an electric and natural gas utility in Wisconsin. WEC benefited from general outperformance by the utilities sector, which was a result of investors’ preference for more defensive-oriented stocks and so-called bond proxies that tend to outperform in a low interest rate environment. The company has also generated consistent earnings growth and an attractive return on equity.
The largest individual detractors from the Fund’s performance relative to the style-specific index during the fiscal year
| | | | |
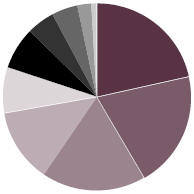
| Portfolio Composition | |
| By sector | | | % of total net assets | |
| |
| Financials | | | 18.68% | |
| Information Technology | | | 17.50 | |
| Health Care | | | 14.85 | |
| Consumer Discretionary | | | 12.87 | |
| Industrials | | | 8.60 | |
| Communication Services | | | 7.70 | |
| Consumer Staples | | | 7.36 | |
| Energy | | | 6.32 | |
| Utilities | | | 2.28 | |
| Real Estate | | | 2.06 | |
| Money Market Funds Plus Other Assets Less Liabilities | | | 1.78 | |
| | | | |
| Top 10 Equity Holdings* | |
| | | % of total net assets | |
| |
1. Microsoft Corp. | | | 7.65% | |
2. JPMorgan Chase & Co. | | | 4.85 | |
3. Procter & Gamble Co. (The) | | | 3.90 | |
4. Facebook, Inc., Class A | | | 3.70 | |
5. Amazon.com, Inc. | | | 3.67 | |
6. UnitedHealth Group, Inc. | | | 3.66 | |
7. Berkshire Hathaway, Inc., Class B | | | 3.24 | |
8. Merck & Co., Inc. | | | 3.19 | |
9. Lockheed Martin Corp. | | | 2.98 | |
10. Capital One Financial Corp. | | | 2.61 | |
| | | | |
| Total Net Assets | | | $3.2 billion | |
| |
| Total Number of Holdings* | | | 56 | |
The Fund’s holdings are subject to change, and there is no assurance that the Fund will continue to hold any particular security.
| * | Excluding money market fund holdings, if any. |
Data presented here are as of October 31, 2019.
includedActivision,FacebookandConcho. Activision saw many transitions throughout calendar year 2019, following a challenging 2018. The company experienced a leadership change at its Blizzard unit, lost its chief financial officer to Netflix (not a Fund holding), exited an underperforming game title and reallocated internal resources to focus on delivering continuous content releases. We exited this position before the close of the fiscal year.
Facebook’s stock experienced strong gains for the style-specific index for the fiscal year but was not owned in the Fund prior to the portfolio management change in late June. We established a position in July 2019, after most of the stock’s gains for the fiscal year had already been achieved.
Concho is an oil and gas exploration and production company focused on the Permian Basin in Texas. The stock was negatively impacted by general weakness across the energy sector, which was the only sector within the Russell 1000 Index with negative returns during the fiscal year. Additionally, investors reacted negatively to the prices the company paid for land in the Permian given the drop in oil prices. We sold our position in this company after the portfolio management change.
As of the close of the fiscal year, we transitioned the Fund to reflect our discipline around valuation and focus on companies with competitive advantages and skilled management teams that are out-executing peers. The evidence of this that we look for in our companies include high returns on invested capital, consistently strong pricing power and/or rising market shares. During times of economic volatility such companies frequently widen their lead over weaker competitors. We seek to invest in companies characterized by these qualities at compelling valuations and believe this disciplined approach is essential to generating superior long-term performance, especially in down markets.
We thank you for your continued investment in Invesco Charter Fund.
Portfolio Managers:
Manind Govil - Lead
Paul Larson
Benjamin Ram
The views and opinions expressed in management’s discussion of Fund performance are those of Invesco Advisers, Inc. These views and opinions are subject to change at any time based on factors such as market and economic conditions. These
views and opinions may not be relied upon as investment advice or recommendations, or as an offer for a particular security. The information is not a complete analysis of every aspect of any market, country, industry, security or the Fund. Statements of fact are from sources considered reliable, but Invesco Advisers, Inc. makes no representation or warranty as to their completeness or accuracy. Although historical performance is no guarantee of future results, these insights may help you understand our investment management philosophy.
See important Fund and, if applicable, index disclosures later in this report.
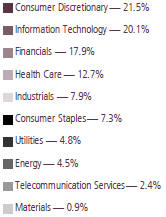
Your Fund’s Long-Term Performance
Results of a $10,000 Investment – Oldest Share Class(es)
Fund and index data from 10/31/09
| | |
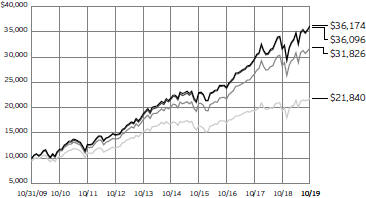 | | Russell 1000 Index1 S&P 500 Index1 Lipper Large-Cap Core Funds Index2 Invesco Charter Fund–Class A Shares |
| 1 | Source: RIMES Technologies Corp. |
Past performance cannot guarantee comparable future results.
The data shown in the chart include reinvested distributions, applicable sales charges and Fund expenses including
management fees. Index results include reinvested dividends, but they do not reflect sales charges. Performance of the peer group, if applicable, reflects fund expenses and management fees; perfor-
mance of a market index does not. Performance shown in the chart does not reflect deduction of taxes a shareholder would pay on Fund distributions or sale of Fund shares.
| | | | |
| Average Annual Total Returns | |
As of 10/31/19, including maximum applicable sales charges | |
| |
| |
| Class A Shares | | | | |
| Inception (11/26/68) | | | 10.32 | % |
| 10 Years | | | 8.12 | |
| 5 Years | | | 4.16 | |
| 1 Year | | | 6.75 | |
| |
| Class C Shares | | | | |
| Inception (8/4/97) | | | 5.19 | % |
| 10 Years | | | 7.92 | |
| 5 Years | | | 4.56 | |
| 1 Year | | | 11.14 | |
| |
| Class R Shares | | | | |
| Inception (6/3/02) | | | 6.56 | % |
| 10 Years | | | 8.46 | |
| 5 Years | | | 5.09 | |
| 1 Year | | | 12.68 | |
| |
| Class S Shares | | | | |
| Inception (9/25/09) | | | 8.69 | % |
| 10 Years | | | 8.84 | |
| 5 Years | | | 5.45 | |
| 1 Year | | | 13.09 | |
| |
| Class Y Shares | | | | |
| Inception (10/3/08) | | | 8.41 | % |
| 10 Years | | | 9.01 | |
| 5 Years | | | 5.61 | |
| 1 Year | | | 13.24 | |
| |
| Class R5 Shares | | | | |
| Inception (7/30/91) | | | 8.14 | % |
| 10 Years | | | 9.11 | |
| 5 Years | | | 5.68 | |
| 1 Year | | | 13.34 | |
| |
| Class R6 Shares | | | | |
| 10 Years | | | 9.05 | % |
| 5 Years | | | 5.76 | |
1 Year | | | 13.38 | |
Performance includes litigation proceeds. Had these proceeds not been received, total returns would have been lower. | |
Class R6 shares incepted on September 24, 2012. Performance shown prior to that date is that of Class A shares and includes the 12b-1 fees applicable to Class A shares.
The performance data quoted represent past performance and cannot guarantee comparable future results; current performance may be lower or higher. Please visit invesco.com/ performance for the most recent month-end performance. Performance figures reflect reinvested distributions, changes in net asset value and the effect of the maximum sales charge unless otherwise stated. Performance figures do not reflect deduction of taxes a shareholder would pay on Fund
| | | | |
| Average Annual Total Returns | |
As of 9/30/19, the most recent calendar quarter end, including maximum applicable sales charges | |
| |
| Class A Shares | | | | |
| Inception (11/26/68) | | | 10.30 | % |
| 10 Years | | | 7.77 | |
| 5 Years | | | 3.81 | |
| 1 Year | | | –2.99 | |
| |
| Class C Shares | | | | |
| Inception (8/4/97) | | | 5.14 | % |
| 10 Years | | | 7.58 | |
| 5 Years | | | 4.22 | |
| 1 Year | | | 1.01 | |
| |
| Class R Shares | | | | |
| Inception (6/3/02) | | | 6.49 | % |
| 10 Years | | | 8.11 | |
| 5 Years | | | 4.73 | |
| 1 Year | | | 2.33 | |
| |
| Class S Shares | | | | |
| Inception (9/25/09) | | | 8.59 | % |
| 10 Years | | | 8.49 | |
| 5 Years | | | 5.11 | |
| 1 Year | | | 2.75 | |
| |
| Class Y Shares | | | | |
| Inception (10/3/08) | | | 8.32 | % |
| 10 Years | | | 8.66 | |
| 5 Years | | | 5.27 | |
| 1 Year | | | 2.93 | |
| |
| Class R5 Shares | | | | |
| Inception (7/30/91) | | | 8.10 | % |
| 10 Years | | | 8.77 | |
| 5 Years | | | 5.34 | |
| 1 Year | | | 2.94 | |
| |
| Class R6 Shares | | | | |
| 10 Years | | | 8.70 | % |
| 5 Years | | | 5.43 | |
| 1 Year | | | 3.07 | |
Performance includes litigation proceeds. Had these proceeds not been received, total returns would have been lower. | |
distributions or sale of Fund shares. Investment return and principal value will fluctuate so that you may have a gain or loss when you sell shares.
The net annual Fund operating expense ratio set forth in the most recent Fund prospectus as of the date of this report for Class A, Class C, Class R, Class S, Class Y, Class R5 and Class R6 shares was 1.08%, 1.83%, 1.33%, 0.98%, 0.83%, 0.77% and 0.70%, respectively.1 The total annual Fund operating expense ratio set forth in the most recent Fund prospectus as of the date of this report for Class A, Class C, Class R, Class S, Class Y, Class R5 and Class R6 shares was 1.09%, 1.84%, 1.34%, 0.99%, 0.84%,
0.78% and 0.71%, respectively. The expense ratios presented above may vary from the expense ratios presented in other sections of this report that are based on expenses incurred during the period covered by this report.
Class A share performance reflects the maximum 5.50% sales charge, and Class C share performance reflects the applicable contingent deferred sales charge (CDSC) for the period involved. The CDSC on Class C shares is 1% for the first year after purchase. Class R, Class S, Class Y, Class R5 and Class R6 shares do not have a front-end sales charge or a CDSC; therefore, performance is at net asset value.
The performance of the Fund’s share classes will differ primarily due to different sales charge structures and class expenses.
Fund performance reflects any applicable fee waivers and/or expense reimbursements. Had the adviser not waived fees and/or reimbursed expenses currently or in the past, returns would have been lower. See current prospectus for more information.
| 1 | Total annual Fund operating expenses after any contractual fee waivers and/or expense reimbursements by the adviser in effect through at least June 30, 2021. See current prospectus for more information. |
Invesco Charter Fund’s investment objective is long-term growth of capital.
| ∎ | | Unless otherwise stated, information presented in this report is as of October 31, 2019, and is based on total net assets. |
| ∎ | | Unless otherwise noted, all data provided by Invesco. |
| ∎ | | To access your Fund’s reports/prospectus, visit invesco.com/fundreports. |
About share classes
| ∎ | | Class R sharesare generally available only to employee benefit plans. Please see the prospectus for more information. |
| ∎ | | Class S sharesandClass Y sharesare available only to certain investors. Please see the prospectus for more information. |
| ∎ | | Class R5 sharesandClass R6 sharesare available for use by retirement plans that meet certain standards and for institutional investors. Class R6 shares are also available through intermediaries that have established an agreement with Invesco Distributors, Inc. to make such shares available for use in retail omnibus accounts. Please see the prospectus for more information. |
Principal risks of investing in the Fund
| ∎ | | Cash/cash equivalents risk. In rising markets, holding cash or cash equivalents will negatively affect the Fund’s performance relative to its benchmark. |
| ∎ | | Debt securities risk. The prices of debt securities held by the Fund will be affected by changes in interest rates, the creditworthiness of the issuer and other factors. An increase in prevailing interest rates typically causes the value of existing debt securities to fall and often has a greater impact on longer-duration debt securities and higher quality debt securities. Falling interest rates will cause the Fund to reinvest the proceeds of debt securities that have been repaid by the issuer at lower interest rates. Falling interest rates may also reduce the Fund’s distributable income because interest payments on floating rate debt instruments held by the Fund will decline. The Fund could lose money on investments in debt securities if the issuer or borrower fails to meet its obligations to make interest payments and/or to repay principal in a timely manner. Changes in an issuer’s finan- |
| | | cial strength, the market’s perception of such strength or in the credit rating of the issuer or the security may affect the value of debt securities. The Adviser’s credit analysis may fail to anticipate such changes, which could result in buying a debt security at an inopportune time or failing to sell a debt security in advance of a price decline or other credit event. |
| ∎ | | Derivatives risk. The value of a derivative instrument depends largely on (and is derived from) the value of an underlying security, currency, commodity, interest rate, index or other asset (each referred to as an underlying asset). In addition to risks relating to the underlying assets, the use of derivatives may include other, possibly greater, risks, including counter-party, leverage and liquidity risks. Counterparty risk is the risk that the counterparty to the derivative contract will default on its obligation to pay the Fund the amount owed or otherwise perform under the derivative contract. Derivatives create leverage risk because they do not require payment up front equal to the economic exposure created by holding a position in the derivative. As a result, an adverse change in the value of the underlying asset could result in the Fund sustaining a loss that is substantially greater than the amount invested in the derivative or the anticipated value of the underlying asset, which may make the Fund’s returns more volatile and increase the risk of loss. Derivative instruments may also be less liquid than more traditional investments and the Fund may be unable to sell or close out its derivative positions at a desirable time or price. This risk may be more acute under adverse market conditions, during which the Fund may be most in need of liquidating its derivative positions. Derivatives may also be harder to value, less tax efficient and subject to changing government regulation that could impact the Fund’s ability to use certain derivatives or their cost. |
| | Derivatives strategies may not always be successful. For example, derivatives used for hedging or to gain or limit exposure to a particular market segment may not provide the expected benefits, particularly during adverse market conditions. |
| ∎ | | Foreign securities risk. The Fund’s foreign investments may be adversely affected by political and social instability, changes in economic or taxation policies, difficulty in enforcing obligations, decreased liquidity or increased volatility. Foreign investments also involve the risk of the possible seizure, nationalization or expropriation of the issuer or foreign deposits (in which the Fund could lose its entire investments in a certain market) and the possible adoption of foreign governmental restrictions such as exchange controls. Unless the Fund has hedged its foreign securities risk, foreign securities risk also involves the risk of negative foreign currency rate fluctuations, which may cause the value of securities denominated in such foreign currency (or other instruments through which the Fund has exposure to foreign currencies) to decline in value. Currency exchange rates may fluctuate significantly over short periods of time. Currency hedging strategies, if used, are not always successful. |
| ∎ | | Management risk. The Fund is actively managed and depends heavily on the Adviser’s judgment about markets, interest rates or the attractiveness, relative values, liquidity, or potential appreciation of particular investments made for the Fund’s portfolio. The Fund could experience losses if these judgments prove to be incorrect. Additionally, legislative, regulatory, or tax developments may adversely affect management of the Fund and, therefore, the ability of the Fund to achieve its investment objective. |
| ∎ | | Market risk. The market values of the Fund’s investments, and therefore the value of the Fund’s shares, will go up |
| | |
This report must be accompanied or preceded by a currently effective Fund prospectus, which contains more complete information, including sales charges and expenses. Investors should read it carefully before investing. | | |
| | |
| NOT FDIC INSURED | MAY LOSE VALUE | NO BANK GUARANTEE | | |
| | and down, sometimes rapidly or unpredictably. Market risk may affect a single issuer, industry or section of the economy, or it may affect the market as a whole. Individual stock prices tend to go up and down more dramatically than those of certain other types of investments, such as bonds. During a general downturn in the financial markets, multiple asset classes may decline in value. When markets perform well, there can be no assurance that specific investments held by the Fund will rise in value. |
| ∎ | | Small- and mid-capitalization companies risks. Small- and mid-capitalization companies tend to be more vulnerable to changing market conditions, may have little or no operating history or track record of success, and may have more limited product lines and markets, less experienced management and fewer financial resources than larger companies. These companies’ securities may be more volatile and less liquid than those of more established companies, and their returns may vary, sometimes significantly, from the overall securities market. |
About indexes used in this report
| ∎ | | TheS&P 500® Indexis an unmanaged index considered representative of the US stock market. |
| ∎ | | TheRussell 1000® Indexis an unmanaged index considered representative of large-cap stocks. The Russell 1000 Index is a trademark/service mark of the Frank Russell Co. Russell® is a trademark of the Frank Russell Co. |
| ∎ | | TheLipper Large-Cap Core Funds Indexis an unmanaged index considered representative of large-cap core funds tracked by Lipper. |
| ∎ | | The Fund is not managed to track the performance of any particular index, including the index(es) described here, and consequently, the performance of the Fund may deviate significantly from the performance of the index(es). |
| ∎ | | A direct investment cannot be made in an index. Unless otherwise indicated, index results include reinvested dividends, and they do not reflect sales charges. Performance of the peer group, if applicable, reflects fund expenses; performance of a market index does not. |
Other information
| ∎ | | The returns shown in management’s discussion of Fund performance are based on net asset values (NAVs) calculated for shareholder transactions. Generally accepted accounting principles require adjustments to be made to the net assets of the Fund at period end for financial reporting purposes, and as such, the NAVs for shareholder transactions and the returns based on those NAVs may differ from the NAVs and returns reported in the Financial Highlights. |
| ∎ | | Industry classifications used in this report are generally according to the Global Industry Classification Standard, which was developed by and is the exclusive property and a service mark of MSCI Inc. and Standard & Poor’s. |
Schedule of Investments(a)
October 31, 2019
| | | | | | | | |
| | | Shares | | | Value | |
Common Stocks & Other Equity Interests–98.22% | |
Aerospace & Defense–4.11% | |
Lockheed Martin Corp. | | | 253,794 | | | $ | 95,599,124 | |
| |
United Technologies Corp. | | | 252,764 | | | | 36,291,855 | |
| |
| | | | | | | 131,890,979 | |
| |
|
Automotive Retail–0.94% | |
O’Reilly Automotive, Inc.(b) | | | 69,509 | | | | 30,271,865 | |
| |
|
Brewers–0.85% | |
Anheuser-Busch InBev S.A./N.V. (Belgium) | | | 335,546 | | | | 27,101,786 | |
| |
|
Communications Equipment–2.40% | |
Motorola Solutions, Inc. | | | 463,511 | | | | 77,091,150 | |
| |
|
Computer & Electronics Retail–1.17% | |
Best Buy Co., Inc. | | | 522,335 | | | | 37,519,323 | |
| |
|
Consumer Finance–4.02% | |
American Express Co. | | | 386,183 | | | | 45,291,542 | |
| |
Capital One Financial Corp. | | | 895,193 | | | | 83,476,747 | |
| |
| | | | | | | 128,768,289 | |
| |
|
Data Processing & Outsourced Services–1.33% | |
Mastercard, Inc., Class A | | | 154,373 | | | | 42,731,990 | |
| |
|
Distillers & Vintners–0.93% | |
Constellation Brands, Inc., Class A | | | 156,206 | | | | 29,730,688 | |
| |
|
Diversified Banks–5.04% | |
Danske Bank A/S (Denmark) | | | 429,785 | | | | 6,135,122 | |
| |
JPMorgan Chase & Co. | | | 1,243,470 | | | | 155,334,272 | |
| |
| | | | | | | 161,469,394 | |
| |
|
Financial Exchanges & Data–1.92% | |
Moody’s Corp. | | | 279,291 | | | | 61,636,731 | |
| |
|
Gas Utilities–0.48% | |
UGI Corp. | | | 320,012 | | | | 15,254,972 | |
| |
|
Health Care Equipment–3.26% | |
Boston Scientific Corp.(b) | | | 425,859 | | | | 17,758,320 | |
| |
Medtronic PLC | | | 267,892 | | | | 29,173,439 | |
| |
Zimmer Biomet Holdings, Inc. | | | 416,964 | | | | 57,636,934 | |
| |
| | | | | | | 104,568,693 | |
| |
|
Health Care Facilities–0.90% | |
HCA Healthcare, Inc. | | | 215,905 | | | | 28,831,954 | |
| |
|
Home Improvement Retail–2.38% | |
Home Depot, Inc. (The) | | | 325,790 | | | | 76,423,818 | |
| |
|
Homebuilding–0.74% | |
D.R. Horton, Inc. | | | 450,507 | | | | 23,593,052 | |
| |
| | | | | | | | |
| | | Shares | | | Value | |
Household Products–3.90% | |
Procter & Gamble Co. (The) | | | 1,004,679 | | | $ | 125,092,582 | |
| |
|
Industrial Conglomerates–2.08% | |
Honeywell International, Inc. | | | 386,213 | | | | 66,710,571 | |
| |
|
Industrial Machinery–0.64% | |
Stanley Black & Decker, Inc. | | | 134,561 | | | | 20,363,116 | |
| |
|
Industrial REITs–2.06% | |
Prologis, Inc. | | | 753,106 | | | | 66,092,583 | |
| |
|
Insurance Brokers–1.28% | |
Marsh & McLennan Cos., Inc. | | | 395,005 | | | | 40,930,418 | |
| |
|
Integrated Oil & Gas–3.78% | |
Chevron Corp. | | | 368,285 | | | | 42,772,620 | |
| |
Suncor Energy, Inc. (Canada) | | | 2,642,514 | | | | 78,456,241 | |
| |
| | | | | | | 121,228,861 | |
| |
|
Integrated Telecommunication Services–2.01% | |
Verizon Communications, Inc. | | | 1,064,244 | | | | 64,354,835 | |
| |
|
Interactive Media & Services–5.69% | |
Alphabet, Inc., Class A(b) | | | 50,694 | | | | 63,813,607 | |
| |
Facebook, Inc., Class A(b) | | | 618,313 | | | | 118,499,687 | |
| |
| | | | | | | 182,313,294 | |
| |
|
Internet & Direct Marketing Retail–6.03% | |
Amazon.com, Inc.(b) | | | 66,197 | | | | 117,609,562 | |
| |
Booking Holdings, Inc.(b) | | | 36,979 | | | | 75,761,466 | |
| |
| | | | | | | 193,371,028 | |
| |
|
IT Consulting & Other Services–0.99% | |
Amdocs Ltd. | | | 487,994 | | | | 31,817,209 | |
| |
|
Life Sciences Tools & Services–1.57% | |
Thermo Fisher Scientific, Inc. | | | 166,676 | | | | 50,332,818 | |
| |
|
Managed Health Care–3.66% | |
UnitedHealth Group, Inc. | | | 464,292 | | | | 117,326,588 | |
| |
|
Multi–Sector Holdings–3.24% | |
Berkshire Hathaway, Inc., Class B(b) | | | 488,782 | | | | 103,905,278 | |
| |
|
Multi–Utilities–1.81% | |
WEC Energy Group, Inc. | | | 613,746 | | | | 57,937,622 | |
| |
|
Oil & Gas Equipment & Services–1.09% | |
Schlumberger Ltd. | | | 1,066,460 | | | | 34,862,577 | |
| |
|
Oil & Gas Storage & Transportation–1.45% | |
Magellan Midstream Partners, L.P. | | | 747,279 | | | | 46,570,427 | |
| |
|
Other Diversified Financial Services–1.95% | |
AXA Equitable Holdings, Inc. | | | 2,894,880 | | | | 62,529,408 | |
| |
See accompanying Notes to Financial Statements which are an integral part of the financial statements.
| | | | | | | | |
| | | Shares | | | Value | |
Pharmaceuticals–5.46% | |
AstraZeneca PLC, ADR (United Kingdom) | | | 1,155,409 | | | $ | 56,649,703 | |
| |
Elanco Animal Health, Inc.(b) | | | 600,023 | | | | 16,212,621 | |
| |
Merck & Co., Inc. | | | 1,180,216 | | | | 102,277,519 | |
| |
| | | | | | | 175,139,843 | |
| |
|
Property & Casualty Insurance–1.12% | |
Fidelity National Financial, Inc. | | | 353,501 | | | | 16,204,486 | |
| |
Progressive Corp. (The) | | | 283,514 | | | | 19,760,926 | |
| |
| | | | | | | 35,965,412 | |
| |
| | |
Railroads–1.66% | | | | | | | | |
Union Pacific Corp. | | | 320,929 | | | | 53,100,912 | |
| |
|
Regional Banks–0.12% | |
SVB Financial Group(b) | | | 16,742 | | | | 3,708,018 | |
| |
| | |
Restaurants–0.89% | | | | | | | | |
Starbucks Corp. | | | 338,752 | | | | 28,644,869 | |
| |
|
Semiconductor Equipment–1.98% | |
Applied Materials, Inc. | | | 1,169,401 | | | | 63,451,698 | |
| |
|
Semiconductors–2.39% | |
QUALCOMM, Inc. | | | 391,061 | | | | 31,456,947 | |
| |
Texas Instruments, Inc. | | | 383,809 | | | | 45,285,624 | |
| |
| | | | | | | 76,742,571 | |
| |
|
Soft Drinks–1.68% | |
PepsiCo, Inc. | | | 392,800 | | | | 53,880,376 | |
| |
| | | | | | | | |
| | | Shares | | | Value | |
Specialty Stores–0.71% | | | | | | | | |
Ulta Beauty, Inc.(b) | | | 97,862 | | | $ | 22,816,525 | |
| |
|
Systems Software–8.39% | |
Microsoft Corp. | | | 1,710,007 | | | | 245,163,703 | |
| |
ServiceNow, Inc.(b) | | | 96,788 | | | | 23,931,801 | |
| |
| | | | | | | 269,095,504 | |
| |
|
Trading Companies & Distributors–0.12% | |
Fastenal Co. | | | 102,885 | | | | 3,697,687 | |
| |
Total Common Stocks & Other Equity Interests
(Cost $2,668,760,600) | | | | 3,148,867,314 | |
| |
| | |
Money Market Funds–1.81% | | | | | | | | |
Invesco Government & Agency Portfolio, Institutional Class, 1.71%(c) | | | 20,327,443 | | | | 20,327,443 | |
| |
Invesco Liquid Assets Portfolio, Institutional Class, 1.90%(c) | | | 14,515,265 | | | | 14,521,072 | |
| |
Invesco Treasury Portfolio, Institutional Class, 1.66%(c) | | | 23,231,364 | | | | 23,231,364 | |
| |
Total Money Market Funds
(Cost $58,079,434) | | | | 58,079,879 | |
| |
TOTAL INVESTMENTS IN SECURITIES–100.03%
(Cost $2,726,840,034) | | | | 3,206,947,193 | |
| |
OTHER ASSETS LESS LIABILITIES–(0.03)% | | | | (1,049,651 | ) |
| |
NET ASSETS–100.00% | | | $ | 3,205,897,542 | |
| |
Investment Abbreviations:
ADR – American Depositary Receipt
REIT – Real Estate Investment Trust
Notes to Schedule of Investments:
| (a) | Industry and/or sector classifications used in this report are generally according to the Global Industry Classification Standard, which was developed by and is the exclusive property and a service mark of MSCI Inc. and Standard & Poor’s. |
| (b) | Non-income producing security. |
| (c) | The money market fund and the Fund are affiliated by having the same investment adviser. The rate shown is the 7-day SEC standardized yield as of October 31, 2019. |
See accompanying Notes to Financial Statements which are an integral part of the financial statements.
Statement of Assets and Liabilities
October 31, 2019
| | | | |
Assets: | | | | |
| |
Investments in securities, at value
(Cost $2,668,760,600) | | $ | 3,148,867,314 | |
| |
Investments in affiliated money market funds, at value
(Cost $58,079,434) | | | 58,079,879 | |
| |
Foreign currencies, at value (Cost $177,826) | | | 180,990 | |
| |
| Receivable for: | | | | |
Dividends | | | 2,771,570 | |
| |
Fund shares sold | | | 140,887 | |
| |
Investment for trustee deferred compensation and retirement plans | | | 1,697,106 | |
| |
| Other assets | | | 61,452 | |
| |
Total assets | | | 3,211,799,198 | |
| |
| |
Liabilities: | | | | |
| |
| Payable for: | | | | |
Fund shares reacquired | | | 2,017,617 | |
| |
Accrued fees to affiliates | | | 1,819,723 | |
| |
Accrued trustees’ and officers’ fees and benefits | | | 4,416 | |
| |
Accrued other operating expenses | | | 220,346 | |
| |
Trustee deferred compensation and retirement plans | | | 1,839,554 | |
| |
Total liabilities | | | 5,901,656 | |
| |
| Net assets applicable to shares outstanding | | $ | 3,205,897,542 | |
| |
| |
Net assets consist of: | | | | |
| Shares of beneficial interest | | $ | 2,210,920,440 | |
| |
| Distributable earnings | | | 994,977,102 | |
| |
| | $ | 3,205,897,542 | |
| |
| |
Net Assets: | | | | |
| Class A | | $ | 3,007,391,024 | |
| |
| Class C | | $ | 40,492,845 | |
| |
| Class R | | $ | 19,772,063 | |
| |
| Class S | | $ | 16,905,758 | |
| |
| Class Y | | $ | 93,142,670 | |
| |
| Class R5 | | $ | 9,162,746 | |
| |
| Class R6 | | $ | 19,030,436 | |
| |
| | | | |
Shares outstanding, no par value, with an unlimited number of shares authorized: | |
Class A | | | 169,061,416 | |
| |
Class C | | | 2,458,019 | |
| |
Class R | | | 1,122,393 | |
| |
Class S | | | 949,866 | |
| |
Class Y | | | 5,209,935 | |
| |
Class R5 | | | 489,678 | |
| |
Class R6 | | | 1,017,442 | |
| |
Class A: | | | | |
Net asset value per share | | $ | 17.79 | |
| |
Maximum offering price per share
(Net asset value of $17.79 ÷ 94.50%) | | $ | 18.83 | |
| |
Class C: | | | | |
Net asset value and offering price per share | | $ | 16.47 | |
| |
Class R: | | | | |
Net asset value and offering price per share | | $ | 17.62 | |
| |
Class S: | | | | |
Net asset value and offering price per share | | $ | 17.80 | |
| |
Class Y: | | | | |
Net asset value and offering price per share | | $ | 17.88 | |
| |
Class R5: | | | | |
Net asset value and offering price per share | | $ | 18.71 | |
| |
Class R6: | | | | |
Net asset value and offering price per share | | $ | 18.70 | |
| |
See accompanying Notes to Financial Statements which are an integral part of the financial statements.
Statement of Operations
For the year ended October 31, 2019
| | | | |
| Investment income: | | | | |
| Dividends (net of foreign withholding taxes of $908,146) | | $ | 57,136,853 | |
| |
| Dividends from affiliated money market funds | | | 895,075 | |
| |
Total investment income | | | 58,031,928 | |
| |
| |
| Expenses: | | | | |
| Advisory fees | | | 19,886,882 | |
| |
| Administrative services fees | | | 473,695 | |
| |
| Distribution fees: | | | | |
Class A | | | 7,436,267 | |
| |
Class C | | | 652,589 | |
| |
Class R | | | 104,055 | |
| |
Class S | | | 25,603 | |
| |
| Transfer agent fees – A, C, R, S and Y | | | 5,425,584 | |
| |
| Transfer agent fees – R5 | | | 9,905 | |
| |
| Transfer agent fees – R6 | | | 7,040 | |
| |
| Trustees’ and officers’ fees and benefits | | | 60,388 | |
| |
| Registration and filing fees | | | 130,217 | |
| |
| Reports to shareholders | | | 256,637 | |
| |
| Professional services fees | | | 61,987 | |
| |
| Other | | | 16,833 | |
| |
Total expenses | | | 34,547,682 | |
| |
| Less: Fees waived and/or expense offset arrangement(s) | | | (110,018 | ) |
| |
Net expenses | | | 34,437,664 | |
| |
| Net investment income | | | 23,594,264 | |
| |
| |
| Realized and unrealized gain (loss) from: | | | | |
| Net realized gain (loss) from: | | | | |
Investment securities (includes net gains from securities sold to affiliates of $55,181,506) | | | 496,547,333 | |
| |
Foreign currencies | | | (117,995 | ) |
| |
| | | 496,429,338 | |
| |
| Change in net unrealized appreciation (depreciation) of: | | | | |
Investment securities | | | (133,612,549 | ) |
| |
Foreign currencies | | | 26,114 | |
| |
| | | (133,586,435 | ) |
| |
| Net realized and unrealized gain | | | 362,842,903 | |
| |
| Net increase in net assets resulting from operations | | $ | 386,437,167 | |
| |
See accompanying Notes to Financial Statements which are an integral part of the financial statements.
Statement of Changes in Net Assets
For the years ended October 31, 2019 and 2018
| | | | | | | | |
| | | 2019 | | | 2018 | |
| |
| Operations: | | | | | | | | |
| | |
Net investment income | | $ | 23,594,264 | | | $ | 11,829,540 | |
| |
Net realized gain | | | 496,429,338 | | | | 312,460,544 | |
| |
Change in net unrealized appreciation (depreciation) | | | (133,586,435 | ) | | | (305,827,517 | ) |
| |
Net increase in net assets resulting from operations | | | 386,437,167 | | | | 18,462,567 | |
| |
| | |
| Distributions to shareholders from distributable earnings: | | | | | | | | |
| | |
Class A | | | (284,822,261 | ) | | | (220,440,781 | ) |
| |
Class B | | | – | | | | (751,285 | ) |
| |
Class C | | | (13,185,191 | ) | | | (10,627,614 | ) |
| |
Class R | | | (2,153,234 | ) | | | (1,810,151 | ) |
| |
Class S | | | (1,689,390 | ) | | | (1,275,165 | ) |
| |
Class Y | | | (10,112,841 | ) | | | (8,540,377 | ) |
| |
Class R5 | | | (1,140,865 | ) | | | (1,952,783 | ) |
| |
Class R6 | | | (1,963,684 | ) | | | (1,266,614 | ) |
| |
Total distributions from distributable earnings | | | (315,067,466 | ) | | | (246,664,770 | ) |
| |
| | |
| Share transactions-net: | | | | | | | | |
| | |
Class A | | | (21,102,703 | ) | | | (206,489,185 | ) |
| |
Class B | | | – | | | | (12,744,633 | ) |
| |
Class C | | | (85,274,153 | ) | | | (22,815,713 | ) |
| |
Class R | | | (3,782,587 | ) | | | (5,255,412 | ) |
| |
Class S | | | (838,015 | ) | | | (523,015 | ) |
| |
Class Y | | | (9,786,525 | ) | | | (20,054,996 | ) |
| |
Class R5 | | | (2,789,887 | ) | | | (16,618,011 | ) |
| |
Class R6 | | | (1,856,211 | ) | | | 3,396,818 | |
| |
Net increase (decrease) in net assets resulting from share transactions | | | (125,430,081 | ) | | | (281,104,147 | ) |
| |
Net increase (decrease) in net assets | | | (54,060,380 | ) | | | (509,306,350 | ) |
| |
| | |
| Net assets: | | | | | | | | |
| | |
Beginning of year | | | 3,259,957,922 | | | | 3,769,264,272 | |
| |
End of year | | $ | 3,205,897,542 | | | $ | 3,259,957,922 | |
| |
See accompanying Notes to Financial Statements which are an integral part of the financial statements.
Financial Highlights
The following schedule presents financial highlights for a share of the Fund outstanding throughout the periods indicated.
| | | | | | | | | | | | | | | | | | | | | | | | | | | | | | | | | | | | | | | | | | | | | | | | | | | | | | | | | | | | | | | | | | | | | | |
| | | Net asset value, beginning of period | | Net investment income (loss)(a) | | Net gains (losses) on securities (both realized and unrealized) | | Total from investment operations | | Dividends from net investment income | | Distributions from net realized gains | | Total distributions | | Net asset value, end of period | | Total return (b) | | Net assets,
end of period (000’s omitted) | | Ratio of expenses to average net assets with fee waivers and/or expenses absorbed | | Ratio of expenses to average net assets without fee waivers and/or
expenses
absorbed | | Ratio of net investment income (loss) to average net assets | | Portfolio turnover (c) |
| Class A | | | | | | | | | | | | | | | | | | | | | | | | | | | | | | | | | | | | | | | | | | | | | | | | | | | | | | | | | | | | | | | | | | | | | | |
Year ended 10/31/19 | | | $ | 17.52 | | | | $ | 0.13 | | | | $ | 1.86 | (d) | | | $ | 1.99 | | | | $ | (0.07 | ) | | | $ | (1.65 | ) | | | $ | (1.72 | ) | | | $ | 17.79 | | | | | 12.96 | %(d) | | | $ | 3,007,391 | | | | | 1.07 | %(e) | | | | 1.07 | %(e) | | | | 0.74 | %(e) | | | | 82 | % |
Year ended 10/31/18 | | | | 18.75 | | | | | 0.06 | | | | | (0.04 | ) | | | | 0.02 | | | | | (0.10 | ) | | | | (1.15 | ) | | | | (1.25 | ) | | | | 17.52 | | | | | (0.04 | ) | | | | 2,951,279 | | | | | 1.07 | | | | | 1.08 | | | | | 0.35 | | | | | 46 | |
Year ended 10/31/17 | | | | 18.31 | | | | | 0.09 | | | | | 2.29 | | | | | 2.38 | | | | | (0.17 | ) | | | | (1.77 | ) | | | | (1.94 | ) | | | | 18.75 | | | | | 13.83 | | | | | 3,363,073 | | | | | 1.10 | | | | | 1.11 | | | | | 0.50 | | | | | 30 | |
Year ended 10/31/16 | | | | 20.30 | | | | | 0.16 | | | | | 0.34 | | | | | 0.50 | | | | | (0.21 | ) | | | | (2.28 | ) | | | | (2.49 | ) | | | | 18.31 | | | | | 3.54 | | | | | 3,467,887 | | | | | 1.11 | | | | | 1.12 | | | | | 0.88 | | | | | 28 | |
Year ended 10/31/15 | | | | 23.28 | | | | | 0.19 | | | | | (0.74 | ) | | | | (0.55 | ) | | | | (0.13 | ) | | | | (2.30 | ) | | | | (2.43 | ) | | | | 20.30 | | | | | (2.53 | ) | | | | 3,869,488 | | | | | 1.07 | | | | | 1.08 | | | | | 0.89 | | | | | 47 | |
Class C | | | | | | | | | | | | | | | | | | | | | | | | | | | | | | | | | | | | | | | | | | | | | | | | | | | | | | | | | | | | | | | | | | | | | | |
Year ended 10/31/19 | | | | 16.39 | | | | | (0.00 | ) | | | | 1.73 | (d) | | | | 1.73 | | | | | – | | | | | (1.65 | ) | | | | (1.65 | ) | | | | 16.47 | | | | | 12.14 | (d) | | | | 40,493 | | | | | 1.82 | (e) | | | | 1.82 | (e) | | | | (0.01 | )(e) | | | | 82 | |
Year ended 10/31/18 | | | | 17.65 | | | | | (0.07 | ) | | | | (0.04 | ) | | | | (0.11 | ) | | | | – | | | | | (1.15 | ) | | | | (1.15 | ) | | | | 16.39 | | | | | (0.80 | ) | | | | 133,804 | | | | | 1.82 | | | | | 1.83 | | | | | (0.40 | ) | | | | 46 | |
Year ended 10/31/17 | | | | 17.32 | | | | | (0.04 | ) | | | | 2.16 | | | | | 2.12 | | | | | (0.02 | ) | | | | (1.77 | ) | | | | (1.79 | ) | | | | 17.65 | | | | | 12.98 | | | | | 167,073 | | | | | 1.85 | | | | | 1.86 | | | | | (0.25 | ) | | | | 30 | |
Year ended 10/31/16 | | | | 19.30 | | | | | 0.02 | | | | | 0.32 | | | | | 0.34 | | | | | (0.04 | ) | | | | (2.28 | ) | | | | (2.32 | ) | | | | 17.32 | | | | | 2.73 | | | | | 200,499 | | | | | 1.86 | | | | | 1.87 | | | | | 0.13 | | | | | 28 | |
Year ended 10/31/15 | | | | 22.27 | | | | | 0.03 | | | | | (0.70 | ) | | | | (0.67 | ) | | | | – | | | | | (2.30 | ) | | | | (2.30 | ) | | | | 19.30 | | | | | (3.22 | ) | | | | 239,765 | | | | | 1.82 | | | | | 1.83 | | | | | 0.14 | | | | | 47 | |
Class R | | | | | | | | | | | | | | | | | | | | | | | | | | | | | | | | | | | | | | | | | | | | | | | | | | | | | | | | | | | | | | | | | | | | | | |
Year ended 10/31/19 | | | | 17.34 | | | | | 0.08 | | | | | 1.85 | (d) | | | | 1.93 | | | | | – | | | | | (1.65 | ) | | | | (1.65 | ) | | | | 17.62 | | | | | 12.68 | (d) | | | | 19,772 | | | | | 1.32 | (e) | | | | 1.32 | (e) | | | | 0.49 | (e) | | | | 82 | |
Year ended 10/31/18 | | | | 18.55 | | | | | 0.02 | | | | | (0.04 | ) | | | | (0.02 | ) | | | | (0.04 | ) | | | | (1.15 | ) | | | | (1.19 | ) | | | | 17.34 | | | | | (0.24 | ) | | | | 23,251 | | | | | 1.32 | | | | | 1.33 | | | | | 0.10 | | | | | 46 | |
Year ended 10/31/17 | | | | 18.13 | | | | | 0.05 | | | | | 2.26 | | | | | 2.31 | | | | | (0.12 | ) | | | | (1.77 | ) | | | | (1.89 | ) | | | | 18.55 | | | | | 13.53 | | | | | 30,187 | | | | | 1.35 | | | | | 1.36 | | | | | 0.25 | | | | | 30 | |
Year ended 10/31/16 | | | | 20.12 | | | | | 0.11 | | | | | 0.34 | | | | | 0.45 | | | | | (0.16 | ) | | | | (2.28 | ) | | | | (2.44 | ) | | | | 18.13 | | | | | 3.24 | | | | | 35,654 | | | | | 1.36 | | | | | 1.37 | | | | | 0.63 | | | | | 28 | |
Year ended 10/31/15 | | | | 23.07 | | | | | 0.13 | | | | | (0.72 | ) | | | | (0.59 | ) | | | | (0.06 | ) | | | | (2.30 | ) | | | | (2.36 | ) | | | | 20.12 | | | | | (2.72 | ) | | | | 44,079 | | | | | 1.32 | | | | | 1.33 | | | | | 0.64 | | | | | 47 | |
Class S | | | | | | | | | | | | | | | | | | | | | | | | | | | | | | | | | | | | | | | | | | | | | | | | | | | | | | | | | | | | | | | | | | | | | | |
Year ended 10/31/19 | | | | 17.53 | | | | | 0.14 | | | | | 1.87 | (d) | | | | 2.01 | | | | | (0.09 | ) | | | | (1.65 | ) | | | | (1.74 | ) | | | | 17.80 | | | | | 13.09 | (d) | | | | 16,906 | | | | | 0.97 | (e) | | | | 0.97 | (e) | | | | 0.84 | (e) | | | | 82 | |
Year ended 10/31/18 | | | | 18.76 | | | | | 0.08 | | | | | (0.04 | ) | | | | 0.04 | | | | | (0.12 | ) | | | | (1.15 | ) | | | | (1.27 | ) | | | | 17.53 | | | | | 0.07 | | | | | 17,317 | | | | | 0.97 | | | | | 0.98 | | | | | 0.45 | | | | | 46 | |
Year ended 10/31/17 | | | | 18.32 | | | | | 0.11 | | | | | 2.28 | | | | | 2.39 | | | | | (0.18 | ) | | | | (1.77 | ) | | | | (1.95 | ) | | | | 18.76 | | | | | 13.94 | | | | | 19,028 | | | | | 1.00 | | | | | 1.01 | | | | | 0.60 | | | | | 30 | |
Year ended 10/31/16 | | | | 20.32 | | | | | 0.18 | | | | | 0.34 | | | | | 0.52 | | | | | (0.24 | ) | | | | (2.28 | ) | | | | (2.52 | ) | | | | 18.32 | | | | | 3.63 | | | | | 18,364 | | | | | 1.01 | | | | | 1.02 | | | | | 0.98 | | | | | 28 | |
Year ended 10/31/15 | | | | 23.30 | | | | | 0.21 | | | | | (0.74 | ) | | | | (0.53 | ) | | | | (0.15 | ) | | | | (2.30 | ) | | | | (2.45 | ) | | | | 20.32 | | | | | (2.42 | ) | | | | 19,329 | | | | | 0.97 | | | | | 0.98 | | | | | 0.99 | | | | | 47 | |
Class Y | | | | | | | | | | | | | | | | | | | | | | | | | | | | | | | | | | | | | | | | | | | | | | | | | | | | | | | | | | | | | | | | | | |
Year ended 10/31/19 | | | | 17.61 | | | | | 0.17 | | | | | 1.87 | (d) | | | | 2.04 | | | | | (0.12 | ) | | | | (1.65 | ) | | | | (1.77 | ) | | | | 17.88 | | | | | 13.24 | (d) | | | | 93,143 | | | | | 0.82 | (e) | | | | 0.82 | (e) | | | | 0.99 | (e) | | | | 82 | |
Year ended 10/31/18 | | | | 18.84 | | | | | 0.11 | | | | | (0.04 | ) | | | | 0.07 | | | | | (0.15 | ) | | | | (1.15 | ) | | | | (1.30 | ) | | | | 17.61 | | | | | 0.23 | | | | | 101,885 | | | | | 0.82 | | | | | 0.83 | | | | | 0.60 | | | | | 46 | |
Year ended 10/31/17 | | | | 18.39 | | | | | 0.14 | | | | | 2.29 | | | | | 2.43 | | | | | (0.21 | ) | | | | (1.77 | ) | | | | (1.98 | ) | | | | 18.84 | | | | | 14.13 | | | | | 129,285 | | | | | 0.85 | | | | | 0.86 | | | | | 0.75 | | | | | 30 | |
Year ended 10/31/16 | | | | 20.40 | | | | | 0.20 | | | | | 0.34 | | | | | 0.54 | | | | | (0.27 | ) | | | | (2.28 | ) | | | | (2.55 | ) | | | | 18.39 | | | | | 3.76 | | | | | 102,182 | | | | | 0.86 | | | | | 0.87 | | | | | 1.13 | | | | | 28 | |
Year ended 10/31/15 | | | | 23.38 | | | | | 0.25 | | | | | (0.75 | ) | | | | (0.50 | ) | | | | (0.18 | ) | | | | (2.30 | ) | | | | (2.48 | ) | | | | 20.40 | | | | | (2.24 | ) | | | | 183,005 | | | | | 0.82 | | | | | 0.83 | | | | | 1.14 | | | | | 47 | |
Class R5 | | | | | | | | | | | | | | | | | | | | | | | | | | | | | | | | | | | | | | | | | | | | | | | | | | | | | | | | | | | | | | | | | | |
Year ended 10/31/19 | | | | 18.34 | | | | | 0.19 | | | | | 1.96 | (d) | | | | 2.15 | | | | | (0.13 | ) | | | | (1.65 | ) | | | | (1.78 | ) | | | | 18.71 | | | | | 13.34 | (d) | | | | 9,163 | | | | | 0.75 | (e) | | | | 0.75 | (e) | | | | 1.06 | (e) | | | | 82 | |
Year ended 10/31/18 | | | | 19.58 | | | | | 0.13 | | | | | (0.06 | ) | | | | 0.07 | | | | | (0.16 | ) | | | | (1.15 | ) | | | | (1.31 | ) | | | | 18.34 | | | | | 0.25 | | | | | 12,018 | | | | | 0.76 | | | | | 0.77 | | | | | 0.66 | | | | | 46 | |
Year ended 10/31/17 | | | | 19.05 | | | | | 0.16 | | | | | 2.38 | | | | | 2.54 | | | | | (0.24 | ) | | | | (1.77 | ) | | | | (2.01 | ) | | | | 19.58 | | | | | 14.19 | | | | | 29,835 | | | | | 0.77 | | | | | 0.78 | | | | | 0.83 | | | | | 30 | |
Year ended 10/31/16 | | | | 21.03 | | | | | 0.23 | | | | | 0.36 | | | | | 0.59 | | | | | (0.29 | ) | | | | (2.28 | ) | | | | (2.57 | ) | | | | 19.05 | | | | | 3.92 | | | | | 38,682 | | | | | 0.75 | | | | | 0.76 | | | | | 1.24 | | | | | 28 | |
Year ended 10/31/15 | | | | 24.04 | | | | | 0.27 | | | | | (0.78 | ) | | | | (0.51 | ) | | | | (0.20 | ) | | | | (2.30 | ) | | | | (2.50 | ) | | | | 21.03 | | | | | (2.22 | ) | | | | 110,943 | | | | | 0.73 | | | | | 0.74 | | | | | 1.23 | | | | | 47 | |
Class R6 | | | | | | | | | | | | | | | | | | | | | | | | | | | | | | | | | | | | | | | | | | | | | | | | | | | | | | | | | | | | | | | | | | |
Year ended 10/31/19 | | | | 18.34 | | | | | 0.20 | | | | | 1.95 | (d) | | | | 2.15 | | | | | (0.14 | ) | | | | (1.65 | ) | | | | (1.79 | ) | | | | 18.70 | | | | | 13.38 | (d) | | | | 19,030 | | | | | 0.69 | (e) | | | | 0.69 | (e) | | | | 1.12 | (e) | | | | 82 | |
Year ended 10/31/18 | | | | 19.58 | | | | | 0.14 | | | | | (0.05 | ) | | | | 0.09 | | | | | (0.18 | ) | | | | (1.15 | ) | | | | (1.33 | ) | | | | 18.34 | | | | | 0.34 | | | | | 20,404 | | | | | 0.69 | | | | | 0.70 | | | | | 0.73 | | | | | 46 | |
Year ended 10/31/17 | | | | 19.05 | | | | | 0.17 | | | | | 2.38 | | | | | 2.55 | | | | | (0.25 | ) | | | | (1.77 | ) | | | | (2.02 | ) | | | | 19.58 | | | | | 14.27 | | | | | 18,290 | | | | | 0.69 | | | | | 0.70 | | | | | 0.91 | | | | | 30 | |
Year ended 10/31/16 | | | | 21.04 | | | | | 0.24 | | | | | 0.36 | | | | | 0.60 | | | | | (0.31 | ) | | | | (2.28 | ) | | | | (2.59 | ) | | | | 19.05 | | | | | 3.99 | | | | | 2,948 | | | | | 0.68 | | | | | 0.69 | | | | | 1.31 | | | | | 28 | |
Year ended 10/31/15 | | | | 24.05 | | | | | 0.29 | | | | | (0.77 | ) | | | | (0.48 | ) | | | | (0.23 | ) | | | | (2.30 | ) | | | | (2.53 | ) | | | | 21.04 | | | | | (2.12 | ) | | | | 125,997 | | | | | 0.64 | | | | | 0.65 | | | | | 1.32 | | | | | 47 | |
| (a) | Calculated using average shares outstanding. |
| (b) | Includes adjustments in accordance with accounting principles generally accepted in the United States of America and as such, the net asset value for financial reporting purposes and the returns based upon those net asset values may differ from the net asset value and returns for shareholder transactions. Does not include sales charges and is not annualized for periods less than one year, if applicable. |
| (c) | Portfolio turnover is calculated at the fund level and is not annualized for periods less than one year, if applicable. |
| (d) | Includes litigation proceeds received during the year. Had these litigation proceeds not been received, Net gains (losses) on securities (both realized and unrealized) per share would have been $1.81, $1.68, $1.80, $1.82, $1.82, $1.91 and $1.90 for Class A, Class C, Class R, Class S, Class Y, Class R5, and Class R6 shares, respectively. Total returns would have been lower. |
| (e) | Ratios are based on average daily net assets (000’s omitted) of $2,974,507, $65,259, $20,811, $17,069, $93,973, $9,917 and $19,584 for Class A, Class C, Class R, Class S, Class Y, Class R5 and Class R6 shares, respectively. |
See accompanying Notes to Financial Statements which are an integral part of the financial statements.
Notes to Financial Statements
October 31, 2019
NOTE 1–Significant Accounting Policies
Invesco Charter Fund (the “Fund”) is a series portfolio of AIM Equity Funds (Invesco Equity Funds) (the “Trust”). The Trust is a Delaware statutory trust registered under the Investment Company Act of 1940, as amended (the “1940 Act”), as an open-end series management investment company authorized to issue an unlimited number of shares of beneficial interest. Information presented in these financial statements pertains only to the Fund. Matters affecting the Fund or each class will be voted on exclusively by the shareholders of the Fund or each class.
The Fund’s investment objective is long-term growth of capital.
The Fund currently consists of seven different classes of shares: Class A, Class C, Class R, Class S, Class Y, Class R5 and Class R6. Class Y shares are available only to certain investors. Class A shares are sold with a front-end sales charge unless certain waiver criteria are met. Under certain circumstances, load waived shares may be subject to contingent deferred sales charges (“CDSC”). Class C shares are sold with a CDSC. Class R, Class S, Class Y, Class R5 and Class R6 shares are sold at net asset value. Class C shares held for ten years after purchase are eligible for automatic conversion into Class A shares of the same Fund (the “Conversion Feature”). The automatic conversion pursuant to the Conversion Feature will generally occur at the end of the month following the tenth anniversary after a purchase of Class C shares.
The Fund is an investment company and accordingly follows the investment company accounting and reporting guidance in accordance with Financial Accounting Standards Board Accounting Standards Codification Topic 946,Financial Services - Investment Companies.
The following is a summary of the significant accounting policies followed by the Fund in the preparation of its financial statements.
| A. | Security Valuations– Securities, including restricted securities, are valued according to the following policy. |
A security listed or traded on an exchange (except convertible securities) is valued at its last sales price or official closing price as of the close of the customary trading session on the exchange where the security is principally traded, or lacking any sales or official closing price on a particular day, the security may be valued at the closing bid price on that day. Securities traded in the over-the-counter market are valued based on prices furnished by independent pricing services or market makers. When such securities are valued by an independent pricing service they may be considered fair valued. Futures contracts are valued at the final settlement price set by an exchange on which they are principally traded. Listed options are valued at the mean between the last bid and asked prices from the exchange on which they are principally traded. Options not listed on an exchange are valued by an independent source at the mean between the last bid and asked prices. For purposes of determining net asset value (“NAV”) per share, futures and option contracts generally are valued 15 minutes after the close of the customary trading session of the New York Stock Exchange (“NYSE”).
Investments in open-end and closed-end registered investment companies that do not trade on an exchange are valued at the end-of-day net asset value per share. Investments in open-end and closed-end registered investment companies that trade on an exchange are valued at the last sales price or official closing price as of the close of the customary trading session on the exchange where the security is principally traded.
Debt obligations (including convertible securities) and unlisted equities are fair valued using an evaluated quote provided by an independent pricing service. Evaluated quotes provided by the pricing service may be determined without exclusive reliance on quoted prices, and may reflect appropriate factors such as institution-size trading in similar groups of securities, developments related to specific securities, dividend rate (for unlisted equities), yield (for debt obligations), quality, type of issue, coupon rate (for debt obligations), maturity (for debt obligations), individual trading characteristics and other market data. Pricing services generally value debt obligations assuming orderly transactions of institutional round lot size, but a fund may hold or transact in the same securities in smaller, odd lot sizes. Odd lots often trade at lower prices than institutional round lots. Debt obligations are subject to interest rate and credit risks. In addition, all debt obligations involve some risk of default with respect to interest and/or principal payments.
Foreign securities’ (including foreign exchange contracts) prices are converted into U.S. dollar amounts using the applicable exchange rates as of the close of the NYSE. If market quotations are available and reliable for foreign exchange-traded equity securities, the securities will be valued at the market quotations. Because trading hours for certain foreign securities end before the close of the NYSE, closing market quotations may become unreliable. If between the time trading ends on a particular security and the close of the customary trading session on the NYSE, events occur that the investment adviser determines are significant and make the closing price unreliable, the Fund may fair value the security. If the event is likely to have affected the closing price of the security, the security will be valued at fair value in good faith using procedures approved by the Board of Trustees. Adjustments to closing prices to reflect fair value may also be based on a screening process of an independent pricing service to indicate the degree of certainty, based on historical data, that the closing price in the principal market where a foreign security trades is not the current value as of the close of the NYSE. Foreign securities’ prices meeting the approved degree of certainty that the price is not reflective of current value will be priced at the indication of fair value from the independent pricing service. Multiple factors may be considered by the independent pricing service in determining adjustments to reflect fair value and may include information relating to sector indices, American Depositary Receipts and domestic and foreign index futures. Foreign securities may have additional risks including exchange rate changes, potential for sharply devalued currencies and high inflation, political and economic upheaval, the relative lack of issuer information, relatively low market liquidity and the potential lack of strict financial and accounting controls and standards.
Securities for which market prices are not provided by any of the above methods may be valued based upon quotes furnished by independent sources. The last bid price may be used to value equity securities. The mean between the last bid and asked prices is used to value debt obligations, including corporate loans.
Securities for which market quotations are not readily available or became unreliable are valued at fair value as determined in good faith by or under the supervision of the Trust’s officers following procedures approved by the Board of Trustees. Issuer specific events, market trends, bid/asked quotes of brokers and information providers and other market data may be reviewed in the course of making a good faith determination of a security’s fair value.
The Fund may invest in securities that are subject to interest rate risk, meaning the risk that the prices will generally fall as interest rates rise and, conversely, the prices will generally rise as interest rates fall. Specific securities differ in their sensitivity to changes in interest rates depending on their individual characteristics. Changes in interest rates may result in increased market volatility, which may affect the value and/or liquidity of certain Fund investments.
Valuations change in response to many factors including the historical and prospective earnings of the issuer, the value of the issuer’s assets, general economic conditions, interest rates, investor perceptions and market liquidity. Because of the inherent uncertainties of valuation, the values reflected in the financial statements may materially differ from the value received upon actual sale of those investments.
| B. | Securities Transactions and Investment Income – Securities transactions are accounted for on a trade date basis. Realized gains or losses on sales are computed on the basis of specific identification of the securities sold. Interest income (net of withholding tax, if any) is recorded on the accrual basis from settlement date. Dividend income (net of withholding tax, if any) is recorded on the ex-dividend date. |
The Fund may periodically participate in litigation related to Fund investments. As such, the Fund may receive proceeds from litigation settlements. Any proceeds received are included in the Statement of Operations as realized gain (loss) for investments no longer held and as unrealized gain (loss) for investments still held.
Brokerage commissions and mark ups are considered transaction costs and are recorded as an increase to the cost basis of securities purchased and/or a reduction of proceeds on a sale of securities. Such transaction costs are included in the determination of net realized and unrealized gain (loss) from investment securities reported in the Statement of Operations and the Statement of Changes in Net Assets and the net realized and unrealized gains (losses) on securities per share in the Financial Highlights. Transaction costs are included in the calculation of the Fund’s net asset value and, accordingly, they reduce the Fund’s total returns. These transaction costs are not considered operating expenses and are not reflected in net investment income reported in the Statement of Operations and the Statement of Changes in Net Assets, or the net investment income per share and the ratios of expenses and net investment income reported in the Financial Highlights, nor are they limited by any expense limitation arrangements between the Fund and the investment adviser.
The Fund allocates income and realized and unrealized capital gains and losses to a class based on the relative net assets of each class.
| C. | Country Determination– For the purposes of making investment selection decisions and presentation in the Schedule of Investments, the investment adviser may determine the country in which an issuer is located and/or credit risk exposure based on various factors. These factors include the laws of the country under which the issuer is organized, where the issuer maintains a principal office, the country in which the issuer derives 50% or more of its total revenues and the country that has the primary market for the issuer’s securities, as well as other criteria. Among the other criteria that may be evaluated for making this determination are the country in which the issuer maintains 50% or more of its assets, the type of security, financial guarantees and enhancements, the nature of the collateral and the sponsor organization. Country of issuer and/or credit risk exposure has been determined to be the United States of America, unless otherwise noted. |
| D. | Distributions– Distributions from net investment income and net realized capital gain, if any, are generally declared and paid annually and recorded on the ex-dividend date. The Fund may elect to treat a portion of the proceeds from redemptions as distributions for federal income tax purposes. |
| E. | Federal Income Taxes –The Fund intends to comply with the requirements of Subchapter M of the Internal Revenue Code of 1986, as amended (the “Internal Revenue Code”), necessary to qualify as a regulated investment company and to distribute substantially all of the Fund’s taxable earnings to shareholders. As such, the Fund will not be subject to federal income taxes on otherwise taxable income (including net realized capital gain) that is distributed to shareholders. Therefore, no provision for federal income taxes is recorded in the financial statements. |
The Fund recognizes the tax benefits of uncertain tax positions only when the position is more likely than not to be sustained. Management has analyzed the Fund’s uncertain tax positions and concluded that no liability for unrecognized tax benefits should be recorded related to uncertain tax positions. Management is not aware of any tax positions for which it is reasonably possible that the total amounts of unrecognized tax benefits will change materially in the next 12 months.
The Fund files tax returns in the U.S. Federal jurisdiction and certain other jurisdictions. Generally, the Fund is subject to examinations by such taxing authorities for up to three years after the filing of the return for the tax period.
| F. | Expenses – Fees provided for under the Rule 12b-1 plan of a particular class of the Fund are charged to the operations of such class. Transfer agency fees and expenses and other shareholder recordkeeping fees and expenses attributable to Class R5 and Class R6 are allocated to each share class based on relative net assets. Sub-accounting fees attributable to Class R5 are charged to the operations of the class. Transfer agency fees and expenses and other shareholder recordkeeping fees and expenses relating to all other classes are allocated among those classes based on relative net assets. All other expenses are allocated among the classes based on relative net assets. |
| G. | Accounting Estimates – The preparation of financial statements in conformity with accounting principles generally accepted in the United States of America (“GAAP”) requires management to make estimates and assumptions that affect the reported amounts of assets and liabilities at the date of the financial statements and the reported amounts of revenues and expenses during the reporting period including estimates and assumptions related to taxation. Actual results could differ from those estimates by a significant amount. In addition, the Fund monitors for material events or transactions that may occur or become known after the period-end date and before the date the financial statements are released to print. |
| H. | Indemnifications– Under the Trust’s organizational documents, each Trustee, officer, employee or other agent of the Trust is indemnified against certain liabilities that may arise out of the performance of their duties to the Fund. Additionally, in the normal course of business, the Fund enters into contracts, including the Fund’s servicing agreements, that contain a variety of indemnification clauses. The Fund’s maximum exposure under these arrangements is unknown as this would involve future claims that may be made against the Fund that have not yet occurred. The risk of material loss as a result of such indemnification claims is considered remote. |
| I. | Foreign Currency Translations– Foreign currency is valued at the close of the NYSE based on quotations posted by banks and major currency dealers. Portfolio securities and other assets and liabilities denominated in foreign currencies are translated into U.S. dollar amounts at the date of valuation. Purchases and sales of portfolio securities (net of foreign taxes withheld on disposition) and income items denominated in foreign currencies are translated into U.S. dollar amounts on the respective dates of such transactions. The Fund does not separately account for the portion of the results of operations resulting from changes in foreign exchange rates on investments and the fluctuations arising from changes in market prices of securities held. The combined results of changes in foreign exchange rates and the fluctuation of market prices on investments (net of estimated foreign tax withholding) are included with the net realized and unrealized gain or loss from investments in the Statement of Operations. Reported net realized foreign currency gains or losses arise from (1) sales of foreign currencies, (2) currency gains or losses realized between the trade and settlement dates on securities transactions, and (3) the difference between the amounts of dividends, interest, and foreign withholding taxes recorded on the Fund’s books and the U.S. dollar equivalent of the amounts actually received or paid. Net |
| | unrealized foreign currency gains and losses arise from changes in the fair values of assets and liabilities, other than investments in securities at fiscal period end, resulting from changes in exchange rates. |
The Fund may invest in foreign securities, which may be subject to foreign taxes on income, gains on investments or currency repatriation, a portion of which may be recoverable. Foreign taxes, if any, are recorded based on the tax regulations and rates that exist in the foreign markets in which the Fund invests and are shown in the Statement of Operations.
| J. | Forward Foreign Currency Contracts– The Fund may engage in foreign currency transactions either on a spot (i.e. for prompt delivery and settlement) basis, or through forward foreign currency contracts, to manage or minimize currency or exchange rate risk. |
The Fund may also enter into forward foreign currency contracts for the purchase or sale of a security denominated in a foreign currency in order to “lock in” the U.S. dollar price of that security, or the Fund may also enter into forward foreign currency contracts that do not provide for physical settlement of the two currencies, but instead are settled by a single cash payment calculated as the difference between the agreed upon exchange rate and the spot rate at settlement based upon an agreed upon notional amount (non-deliverable forwards). The Fund will set aside liquid assets in an amount equal to the daily mark-to-market obligation for forward foreign currency contracts.
A forward foreign currency contract is an obligation between two parties (“Counterparties”) to purchase or sell a specific currency for an agreed-upon price at a future date. The use of forward foreign currency contracts does not eliminate fluctuations in the price of the underlying securities the Fund owns or intends to acquire but establishes a rate of exchange in advance. Fluctuations in the value of these contracts are measured by the difference in the contract date and reporting date exchange rates and are recorded as unrealized appreciation (depreciation) until the contracts are closed. When the contracts are closed, realized gains (losses) are recorded. Realized and unrealized gains (losses) on the contracts are included in the Statement of Operations. The primary risks associated with forward foreign currency contracts include failure of the Counterparty to meet the terms of the contract and the value of the foreign currency changing unfavorably. These risks may be in excess of the amounts reflected in the Statement of Assets and Liabilities.
NOTE 2–Advisory Fees and Other Fees Paid to Affiliates
The Trust has entered into a master investment advisory agreement with Invesco Advisers, Inc. (the “Adviser” or “Invesco”). Under the terms of the investment advisory agreement, the Fund accrues daily and pays monthly an advisory fee to the Adviser based on the annual rate of the Fund’s average daily net assets as follows:
| | |
| Average Daily Net Assets | | Rate |
| First $250 million | | 0.695% |
| Next $4.05 billion | | 0.615% |
| Next $3.9 billion | | 0.570% |
| Next $1.8 billion | | 0.545% |
Over $10 billion | | 0.520% |
For the year ended October 31, 2019, the effective advisory fee rate incurred by the Fund was 0.62%.
Under the terms of a master sub-advisory agreement between the Adviser and each of Invesco Asset Management Deutschland GmbH, Invesco Asset Management Limited, Invesco Asset Management (Japan) Limited, Invesco Hong Kong Limited, Invesco Senior Secured Management, Inc. and Invesco Canada Ltd. (collectively, the “Affiliated Sub-Advisers”) the Adviser, not the Fund, will pay 40% of the fees paid to the Adviser to any such Affiliated Sub-Adviser(s) that provide(s) discretionary investment management services to the Fund based on the percentage of assets allocated to such Affiliated Sub-Adviser(s).
The Adviser has contractually agreed, through at least June 30, 2020, to waive advisory fees and/or reimburse expenses of all shares to the extent necessary to limit total annual fund operating expenses after fee waiver and/or expense reimbursement (excluding certain items discussed below) of Class A, Class C, Class R, Class S, Class Y, Class R5 and Class R6 shares to 2.00%, 2.75%, 2.25%, 1.90%, 1.75%, 1.75% and 1.75%, respectively, of average daily net assets (the “expense limits”). In determining the Adviser’s obligation to waive advisory fees and/or reimburse expenses, the following expenses are not taken into account, and could cause the total annual fund operating expenses after fee waiver and/or expense reimbursement to exceed the numbers reflected above: (1) interest; (2) taxes; (3) dividend expense on short sales; (4) extraordinary or non-routine items, including litigation expenses; and (5) expenses that the Fund has incurred but did not actually pay because of an expense offset arrangement. Unless Invesco continues the fee waiver agreement, it will terminate on June 30, 2020. During its term, the fee waiver agreement cannot be terminated or amended to increase the expense limits or reduce the advisory fee waiver without approval of the Board of Trustees. The Adviser did not waive fees and/or reimburse expenses during the period under these expense limits.
The Adviser has contractually agreed, through at least June 30, 2021, to waive the advisory fee payable by the Fund in an amount equal to 100% of the net advisory fees the Adviser receives from the affiliated money market funds on investments by the Fund of uninvested cash in such affiliated money market funds.
For the year ended October 31, 2019, the Adviser waived advisory fees of $46,910.
The Trust has entered into a master administrative services agreement with Invesco pursuant to which the Fund has agreed to pay Invesco for certain administrative costs incurred in providing accounting services to the Fund. For the year ended October 31, 2019, expenses incurred under the agreement are shown in the Statement of Operations asAdministrative services fees. Invesco has entered into a sub-administration agreement whereby State Street Bank and Trust Company (“SSB”) serves as fund accountant and provides certain administrative services to the Fund. Pursuant to a custody agreement with the Trust on behalf of the Fund, SSB also serves as the Fund’s custodian.
The Trust has entered into a transfer agency and service agreement with Invesco Investment Services, Inc. (“IIS”) pursuant to which the Fund has agreed to pay IIS a fee for providing transfer agency and shareholder services to the Fund and reimburse IIS for certain expenses incurred by IIS in the course of providing such services. IIS may make payments to intermediaries that provide omnibus account services, sub-accounting services and/or networking services. All fees payable by IIS to intermediaries that provide omnibus account services or sub-accounting services are charged back to the Fund, subject to certain limitations approved by the Trust’s Board of Trustees. For the year ended October 31, 2019, expenses incurred under the agreement are shown in the Statement of Operations asTransfer agent fees.
The Trust has entered into master distribution agreements with Invesco Distributors, Inc. (“IDI”) to serve as the distributor for the Class A, Class C, Class R, Class S, Class Y, Class R5 and Class R6 shares of the Fund. The Trust has adopted plans pursuant to Rule 12b-1 under the 1940 Act with respect to the Fund’s Class A, Class C, Class R and Class S shares (collectively, the “Plans”). The Fund, pursuant to the Plans, pays IDI compensation at the annual rate of 0.25% of the Fund’s average daily net assets of Class A shares, 1.00% of the average daily net assets of Class C shares, 0.50% of the average daily net assets of Class R shares and 0.15% of the average daily net assets of Class S shares. The fees are accrued daily and paid monthly. Of the Plan payments, up to 0.25% of the average daily net assets of Class A, Class C and Class R shares and 0.15% of the average daily net assets of Class S shares may be paid to furnish continuing personal shareholder services to customers who purchase and own shares of such classes. Any amounts not paid as a service fee under the Plans would constitute an asset-based sales charge. Rules of the Financial Industry Regulatory Authority (“FINRA”) impose a cap on the total sales charges, including asset-based sales charges, that may be paid by any class of shares of the Fund. For the year ended October 31, 2019, expenses incurred under the Plans are shown in the Statement of Operations as Distribution fees.
Front-end sales commissions and CDSC (collectively, the “sales charges”) are not recorded as expenses of the Fund. Front-end sales commissions are deducted from proceeds from the sales of Fund shares prior to investment in Class A shares of the Fund. CDSC are deducted from redemption proceeds prior to remittance to the shareholder. During the year ended October 31, 2019, IDI advised the Fund that IDI retained $108,270 in front-end sales commissions from the sale of Class A shares and $833 and $1,872 from Class A and Class C shares, respectively, for CDSC imposed upon redemptions by shareholders.
For the year ended October 31, 2019, the Fund incurred $3,607 in brokerage commissions with Invesco Capital Markets, Inc., an affiliate of the Adviser and IDI, for portfolio transactions executed on behalf of the Fund.
Certain officers and trustees of the Trust are officers and directors of the Adviser, IIS and/or IDI.
NOTE 3–Additional Valuation Information
GAAP defines fair value as the price that would be received to sell an asset or paid to transfer a liability in an orderly transaction between market participants at the measurement date, under current market conditions. GAAP establishes a hierarchy that prioritizes the inputs to valuation methods, giving the highest priority to readily available unadjusted quoted prices in an active market for identical assets (Level 1) and the lowest priority to significant unobservable inputs (Level 3), generally when market prices are not readily available or are unreliable. Based on the valuation inputs, the securities or other investments are tiered into one of three levels. Changes in valuation methods may result in transfers in or out of an investment’s assigned level:
| | | | |
| Level 1 | | – | | Prices are determined using quoted prices in an active market for identical assets. |
| Level 2 | | – | | Prices are determined using other significant observable inputs. Observable inputs are inputs that other market participants may use in pricing a security. These may include quoted prices for similar securities, interest rates, prepayment speeds, credit risk, yield curves, loss severities, default rates, discount rates, volatilities and others. |
| Level 3 | | – | | Prices are determined using significant unobservable inputs. In situations where quoted prices or observable inputs are unavailable (for example, when there is little or no market activity for an investment at the end of the period), unobservable inputs may be used. Unobservable inputs reflect the Fund’s own assumptions about the factors market participants would use in determining fair value of the securities or instruments and would be based on the best available information. |
The following is a summary of the tiered valuation input levels, as of October 31, 2019. The level assigned to the securities valuations may not be an indication of the risk or liquidity associated with investing in those securities. Because of the inherent uncertainties of valuation, the values reflected in the financial statements may materially differ from the value received upon actual sale of those investments.
| | | | | | | | | | | | | | | | |
| | | Level 1 | | | Level 2 | | | Level 3 | | | Total | |
Investments in Securities | | | | | | | | | | | | | | | | |
| Common Stocks & Other Equity Interests | | $ | 3,115,630,406 | | | $ | 33,236,908 | | | | $– | | | $ | 3,148,867,314 | |
| Money Market Funds | | | 58,079,879 | | | | – | | | | – | | | | 58,079,879 | |
Total Investments | | $ | 3,173,710,285 | | | $ | 33,236,908 | | | | $– | | | $ | 3,206,947,193 | |
NOTE 4–Security Transactions with Affiliated Funds
The Fund is permitted to purchase or sell securities from or to certain other Invesco Funds under specified conditions outlined in procedures adopted by the Board of Trustees of the Trust. The procedures have been designed to ensure that any purchase or sale of securities by the Fund from or to another fund or portfolio that is or could be considered an affiliate by virtue of having a common investment adviser (or affiliated investment advisers), common Trustees and/or common officers complies with Rule 17a-7 of the 1940 Act. Further, as defined under the procedures, each transaction is effected at the current market price. Pursuant to these procedures, for the year ended October 31, 2019, the Fund engaged in securities purchases of $531,719,708 and securities sales of $131,369,711, which resulted in net realized gains of $55,181,506.
NOTE 5–Expense Offset Arrangement(s)
The expense offset arrangement is comprised of transfer agency credits which result from balances in demand deposit accounts used by the transfer agent for clearing shareholder transactions. For the year ended October 31, 2019, the Fund received credits from this arrangement, which resulted in the reduction of the Fund’s total expenses of $63,108.
NOTE 6–Trustees’ and Officers’ Fees and Benefits
Trustees’ and Officers’ Fees and Benefits include amounts accrued by the Fund to pay remuneration to certain Trustees and Officers of the Fund. Trustees have the option to defer compensation payable by the Fund, andTrustees’ and Officers’ Fees and Benefits also include amounts accrued by the Fund to fund such deferred compensation amounts. Those Trustees who defer compensation have the option to select various Invesco Funds in which their deferral accounts shall be deemed to be invested. Finally, certain current Trustees were eligible to participate in a retirement plan that provided
for benefits to be paid upon retirement to Trustees over a period of time based on the number of years of service. The Fund may have certain former Trustees who also participate in a retirement plan and receive benefits under such plan.Trustees’ and Officers’ Fees and Benefits include amounts accrued by the Fund to fund such retirement benefits. Obligations under the deferred compensation and retirement plans represent unsecured claims against the general assets of the Fund.
NOTE 7–Cash Balances
The Fund is permitted to temporarily carry a negative or overdrawn balance in its account with SSB, the custodian bank. Such balances, if any at period-end, are shown in the Statement of Assets and Liabilities under the payable captionAmount due custodian. To compensate the custodian bank for such overdrafts, the overdrawn Fund may either (1) leave funds as a compensating balance in the account so the custodian bank can be compensated by earning the additional interest; or (2) compensate by paying the custodian bank at a rate agreed upon by the custodian bank and Invesco, not to exceed the contractually agreed upon rate.
NOTE 8–Distributions to Shareholders and Tax Components of Net Assets
Tax Character of Distributions to Shareholders Paid During the Fiscal Years Ended October 31, 2019 and 2018
| | | | | | | | |
| | | 2019 | | | 2018 | |
| Ordinary income | | $ | 12,054,389 | | | $ | 18,753,597 | |
| |
Long-term capital gain | | | 303,013,077 | | | | 227,911,173 | |
| |
Total distributions | | $ | 315,067,466 | | | $ | 246,664,770 | |
| |
Tax Components of Net Assets at Period-End:
| | | | |
| | | 2019 | |
| Undistributed ordinary income | | $ | 30,307,542 | |
| |
| Undistributed long-term capital gain | | | 490,477,219 | |
| |
| Net unrealized appreciation – investments | | | 475,792,165 | |
| |
| Net unrealized appreciation (depreciation) - foreign currencies | | | (25,354 | ) |
| |
| Temporary book/tax differences | | | (1,574,470 | ) |
| |
Shares of beneficial interest | | | 2,210,920,440 | |
| |
Total net assets | | $ | 3,205,897,542 | |
| |
The difference between book-basis and tax-basis unrealized appreciation (depreciation) is due to differences in the timing of recognition of gains and losses on investments for tax and book purposes. The Fund’s net unrealized appreciation difference is attributable primarily to wash sales.
The temporary book/tax differences are a result of timing differences between book and tax recognition of income and/or expenses. The Fund’s temporary book/tax differences are the result of the trustee deferral of compensation and retirement plan benefits.
Capital loss carryforward is calculated and reported as of a specific date. Results of transactions and other activity after that date may affect the amount of capital loss carryforward actually available for the Fund to utilize. Capital losses generated in years beginning after December 22, 2010 can be carried forward for an unlimited period, whereas previous losses expire in eight tax years. Capital losses with an expiration period may not be used to offset capital gains until all net capital losses without an expiration date have been utilized. Capital loss carryforwards with no expiration date will retain their character as either short-term or long-term capital losses instead of as short-term capital losses as under prior law. The ability to utilize capital loss carryforwards in the future may be limited under the Internal Revenue Code and related regulations based on the results of future transactions.
The Fund does not have a capital loss carryforward as of October 31, 2019.
NOTE 9–Investment Transactions
The aggregate amount of investment securities (other than short-term securities, U.S. Treasury obligations and money market funds, if any) purchased and sold by the Fund during the year ended October 31, 2019 was $2,588,699,230 and $3,000,573,585, respectively. Cost of investments, including any derivatives, on a tax basis includes the adjustments for financial reporting purposes as of the most recently completed federal income tax reporting period-end.
| | | | |
| Unrealized Appreciation (Depreciation) of Investments on a Tax Basis | |
| |
| Aggregate unrealized appreciation of investments | | | $526,397,335 | |
| |
Aggregate unrealized (depreciation) of investments | | | (50,605,170 | ) |
| |
Net unrealized appreciation of investments | | | $475,792,165 | |
| |
Cost of investments for tax purposes is $2,731,155,028.
NOTE 10–Reclassification of Permanent Differences
Primarily as a result of differing book/tax treatment of foreign currency transactions, on October 31, 2019, undistributed net investment income was decreased by $117,996 and undistributed net realized gain was increased by $117,996. This reclassification had no effect on the net assets or the distributable earnings of the Fund.
NOTE 11–Share Information
| | | | | | | | | | | | | | | | |
| | | Summary of Share Activity | |
| |
| | | Years ended October 31, | |
| | | 2019(a) | | | 2018 | |
| | | Shares | | | Amount | | | Shares | | | Amount | |
| |
Sold: | | | | | | | | | | | | | | | | |
Class A | | | 2,723,373 | | | $ | 45,605,051 | | | | 3,170,069 | | | $ | 58,228,262 | |
| |
Class B(b) | | | - | | | | - | | | | 1,210 | | | | 21,625 | |
| |
Class C | | | 285,023 | | | | 4,416,381 | | | | 330,129 | | | | 5,708,817 | |
| |
Class R | | | 221,684 | | | | 3,675,629 | | | | 212,312 | | | | 3,840,617 | |
| |
Class S | | | 29,310 | | | | 492,536 | | | | 26,948 | | | | 496,453 | |
| |
Class Y | | | 1,118,460 | | | | 19,115,839 | | | | 1,744,023 | | | | 32,297,466 | |
| |
Class R5 | | | 51,308 | | | | 902,015 | | | | 47,307 | | | | 818,104 | |
| |
Class R6 | | | 153,493 | | | | 2,697,321 | | | | 615,081 | | | | 11,837,302 | |
| |
| | | | |
Issued as reinvestment of dividends: | | | | | | | | | | | | | | | | |
Class A | | | 17,496,395 | | | | 266,994,964 | | | | 11,640,076 | | | | 208,473,736 | |
| |
Class B(b) | | | - | | | | - | | | | 42,636 | | | | 715,869 | |
| |
Class C | | | 883,643 | | | | 12,574,245 | | | | 604,288 | | | | 10,194,340 | |
| |
Class R | | | 142,128 | | | | 2,153,233 | | | | 101,923 | | | | 1,810,151 | |
| |
Class S | | | 110,679 | | | | 1,688,958 | | | | 71,238 | | | | 1,275,165 | |
| |
Class Y | | | 506,566 | | | | 7,755,521 | | | | 344,635 | | | | 6,189,638 | |
| |
Class R5 | | | 70,967 | | | | 1,136,186 | | | | 104,095 | | | | 1,946,586 | |
| |
Class R6 | | | 106,721 | | | | 1,707,537 | | | | 66,133 | | | | 1,235,374 | |
| |
| | | | |
Conversion of Class B shares to Class A shares:(c) | | | | | | | | | | | | | | | | |
Class A | | | - | | | | - | | | | 628,757 | | | | 12,059,566 | |
| |
Class B | | | - | | | | - | | | | (614,926 | ) | | | (12,059,566 | ) |
| |
| | | | |
Automatic conversion of Class C shares to Class A shares: | | | | | | | | | | | | | | | | |
Class A | | | 5,413,624 | | | | 86,019,834 | | | | - | | | | - | |
| |
Class C | | | (5,816,137 | ) | | | (86,019,834 | ) | | | - | | | | - | |
| |
| | | | |
Reacquired: | | | | | | | | | | | | | | | | |
Class A | | | (25,043,141 | ) | | | (419,722,552 | ) | | | (26,359,490 | ) | | | (485,250,749 | ) |
| |
Class B(b) | | | - | | | | - | | | | (139,742 | ) | | | (1,422,561 | ) |
| |
Class C | | | (1,056,902 | ) | | | (16,244,945 | ) | | | (2,237,465 | ) | | | (38,718,870 | ) |
| |
Class R | | | (582,661 | ) | | | (9,611,449 | ) | | | (599,985 | ) | | | (10,906,180 | ) |
| |
Class S | | | (177,985 | ) | | | (3,019,509 | ) | | | (124,574 | ) | | | (2,294,633 | ) |
| |
Class Y | | | (2,201,732 | ) | | | (36,657,885 | ) | | | (3,164,160 | ) | | | (58,542,100 | ) |
| |
Class R5 | | | (287,719 | ) | | | (4,828,088 | ) | | | (1,020,288 | ) | | | (19,382,701 | ) |
| |
Class R6 | | | (355,291 | ) | | | (6,261,069 | ) | | | (502,945 | ) | | | (9,675,858 | ) |
| |
Net increase (decrease) in share activity | | | (6,208,194 | ) | | $ | (125,430,081 | ) | | | (15,012,715 | ) | | $ | (281,104,147 | ) |
| |
| (a) | There are entities that are record owners of more than 5% of the outstanding shares of the Fund and in the aggregate own 38% of the outstanding shares of the Fund. IDI has an agreement with these entities to sell Fund shares. The Fund, Invesco and/or Invesco affiliates may make payments to these entities, which are considered to be related to the Fund, for providing services to the Fund, Invesco and/or Invesco affiliates including but not limited to services such as securities brokerage, distribution, third party record keeping and account servicing. The Fund has no knowledge as to whether all or any portion of the shares owned of record by these entities are also owned beneficially. |
| (b) | Class B shares activity for the period November 1, 2017 through January 26, 2018 (date of conversion). |
| (c) | Effective as of the close of business January 26, 2018, all outstanding Class B shares were converted to Class A shares. |
Report of Independent Registered Public Accounting Firm
To the Board of Trustees of AIM Equity Funds (Invesco Equity Funds) and Shareholders of Invesco Charter Fund
Opinion on the Financial Statements
We have audited the accompanying statement of assets and liabilities, including the schedule of investments, of Invesco Charter Fund (one of the funds constituting AIM Equity Funds (Invesco Equity Funds), referred to hereafter as the “Fund”) as of October 31, 2019, the related statement of operations for the year ended October 31, 2019, the statement of changes in net assets for each of the two years in the period ended October 31, 2019, including the related notes, and the financial highlights for each of the five years in the period ended October 31, 2019 (collectively referred to as the “financial statements”). In our opinion, the financial statements present fairly, in all material respects, the financial position of the Fund as of October 31, 2019, the results of its operations for the year then ended, the changes in its net assets for each of the two years in the period ended October 31, 2019 and the financial highlights for each of the five years in the period ended October 31, 2019 in conformity with accounting principles generally accepted in the United States of America.
Basis for Opinion
These financial statements are the responsibility of the Fund’s management. Our responsibility is to express an opinion on the Fund’s financial statements based on our audits. We are a public accounting firm registered with the Public Company Accounting Oversight Board (United States) (PCAOB) and are required to be independent with respect to the Fund in accordance with the U.S. federal securities laws and the applicable rules and regulations of the Securities and Exchange Commission and the PCAOB.
We conducted our audits of these financial statements in accordance with the standards of the PCAOB. Those standards require that we plan and perform the audit to obtain reasonable assurance about whether the financial statements are free of material misstatement, whether due to error or fraud.
Our audits included performing procedures to assess the risks of material misstatement of the financial statements, whether due to error or fraud, and performing procedures that respond to those risks. Such procedures included examining, on a test basis, evidence regarding the amounts and disclosures in the financial statements. Our audits also included evaluating the accounting principles used and significant estimates made by management, as well as evaluating the overall presentation of the financial statements. Our procedures included confirmation of securities owned as of October 31, 2019 by correspondence with the custodian, transfer agent and brokers; when replies were not received from brokers, we performed other auditing procedures. We believe that our audits provide a reasonable basis for our opinion.
/s/ PricewaterhouseCoopers LLP
Houston, Texas
December 27, 2019
We have served as the auditor of one or more of the investment companies in the Invesco group of investment companies since at least 1995. We have not been able to determine the specific year we began serving as auditor.
Calculating your ongoing Fund expenses
Example
As a shareholder of the Fund, you incur two types of costs: (1) transaction costs, which may include sales charges (loads) on purchase payments or contingent deferred sales charges on redemptions, if any; and (2) ongoing costs, including management fees, distribution and/or service (12b-1) fees, and other Fund expenses. This example is intended to help you understand your ongoing costs (in dollars) of investing in the Fund and to compare these costs with ongoing costs of investing in other mutual funds. The example is based on an investment of $1,000 invested at the beginning of the period and held for the entire period May 1, 2019 through October 31, 2019.
Actual expenses
The table below provides information about actual account values and actual expenses. You may use the information in this table, together with the amount you invested, to estimate the expenses that you paid over the period. Simply divide your account value by $1,000 (for example, an $8,600 account value divided by $1,000 = 8.6), then multiply the result by the number in the table under the heading entitled “Actual Expenses Paid During Period” to estimate the expenses you paid on your account during this period.
Hypothetical example for comparison purposes
The table below also provides information about hypothetical account values and hypothetical expenses based on the Fund’s actual expense ratio and an assumed rate of return of 5% per year before expenses, which is not the Fund’s actual return.
The hypothetical account values and expenses may not be used to estimate the actual ending account balance or expenses you paid for the period. You may use this information to compare the ongoing costs of investing in the Fund and other funds. To do so, compare this 5% hypothetical example with the 5% hypothetical examples that appear in the shareholder reports of the other funds.
Please note that the expenses shown in the table are meant to highlight your ongoing costs only and do not reflect any transaction costs, such as sales charges (loads) on purchase payments or contingent deferred sales charges on redemptions, if any. Therefore, the hypothetical information is useful in comparing ongoing costs only, and will not help you determine the relative total costs of owning different funds. In addition, if these transaction costs were included, your costs would have been higher.
| | | | | | | | | | | | |
| | | | | | | HYPOTHETICAL | | |
| | | | | ACTUAL | | (5% annual return before expenses) | | |
| | | Beginning | | Ending | | Expenses | | Ending | | Expenses | | Annualized |
| | | Account Value | | Account Value | | Paid During | | Account Value | | Paid During | | Expense |
| | | (05/01/19) | | (10/31/19)1 | | Period2 | | (10/31/19) | | Period2 | | Ratio |
Class A | | $1,000.00 | | $1,018.90 | | $5.50 | | $1,019.76 | | $5.50 | | 1.08% |
Class C | | 1,000.00 | | 1,014.80 | | 9.29 | | 1,015.98 | | 9.30 | | 1.83 |
Class R | | 1,000.00 | | 1,017.90 | | 6.76 | | 1,018.50 | | 6.77 | | 1.33 |
Class S | | 1,000.00 | | 1,019.50 | | 4.99 | | 1,020.27 | | 4.99 | | 0.98 |
Class Y | | 1,000.00 | | 1,020.60 | | 4.23 | | 1,021.02 | | 4.23 | | 0.83 |
Class R5 | | 1,000.00 | | 1,020.20 | | 3.92 | | 1,021.32 | | 3.92 | | 0.77 |
Class R6 | | 1,000.00 | | 1,020.70 | | 3.57 | | 1,021.68 | | 3.57 | | 0.70 |
| 1 | The actual ending account value is based on the actual total return of the Fund for the period May 1, 2019 through October 31, 2019, after actual expenses and will differ from the hypothetical ending account value which is based on the Fund’s expense ratio and a hypothetical annual return of 5% before expenses. |
| 2 | Expenses are equal to the Fund’s annualized expense ratio as indicated above multiplied by the average account value over the period, multiplied by 184/365 to reflect the most recent fiscal half year. |
Approval of Investment Advisory and Sub-Advisory Contracts
At meetings held on June 10, 2019, the Board of Trustees (the Board or the Trustees) of AIM Equity Funds (Invesco Equity Funds) as a whole, and the independent Trustees, who comprise over 75% of the Board, voting separately, approved the continuance of the Invesco Charter Fund’s (the Fund) Master Investment Advisory Agreement with Invesco Advisers, Inc. (Invesco Advisers and the investment advisory agreement) and the Master Intergroup Sub-Advisory Contract for Mutual Funds with Invesco Asset Management Deutschland GmbH, Invesco Asset Management Limited, Invesco Asset Management (Japan) Limited, Invesco Hong Kong Limited, Invesco Senior Secured Management, Inc. and Invesco Canada Ltd (collectively, the Affiliated Sub-Advisers and the sub-advisory contracts) for another year, effective July 1, 2019. After evaluating the factors discussed below, among others, the Board approved the renewal of the Fund’s investment advisory agreement and the sub-advisory contracts and determined that the compensation payable by the Fund to Invesco Advisers and by Invesco Advisers to the Affiliated Sub-Advisers is fair and reasonable.
The Board’s Evaluation Process
The Board’s Investments Committee has established three Sub-Committees, which meet throughout the year to review the performance of funds advised by Invesco Advisers (the Invesco Funds). As part of a regularly scheduled basis of in-person Board meetings, the Sub-Committees meet with portfolio managers for their assigned Invesco Funds and other members of management to review detailed information about investment performance and portfolio attributes of these funds. The Board took into account evaluations and reports that it received from the Investments Committee and Sub-Committees, as well as the information provided to such committees and the Board throughout the year, in considering whether to approve each Invesco Fund’s investment advisory agreement and sub-advisory contracts.
As part of the contract renewal process, the Board reviews and considers information provided in response to detailed requests for information submitted to management by the independent Trustees with assistance from legal counsel to the independent Trustees. The Board receives comparative investment performance and fee data regarding the Invesco Funds prepared by Invesco Advisers and Broadridge Financial Solutions, Inc. (Broadridge), an independent mutual fund data provider. The Board also receives an independent written evaluation from the Senior Officer, an officer of the Invesco Funds who reports directly to the independent Trustees. The Senior Officer’s evaluation is prepared as part of his
responsibility to manage the process by which the Invesco Funds’ proposed management fees are negotiated during the annual contract renewal process to ensure they are negotiated in a manner that is at arms’ length and reasonable. In addition to meetings with Invesco Advisers and fund counsel throughout the year, the independent Trustees also discuss the continuance of the investment advisory agreement and sub-advisory contracts in separate sessions with the Senior Officer and with independent legal counsel.
The discussion below is a summary of the Senior Officer’s independent written evaluation with respect to the Fund’s investment advisory agreement, as well as a discussion of the material factors and related conclusions that formed the basis for the Board’s approval of the Fund’s investment advisory agreement and sub-advisory contracts. The Trustees’ review and conclusions are based on the comprehensive consideration of all information presented to them during the course of the year and in prior years and are not the result of any single determinative factor. Moreover, one Trustee may have weighed a particular piece of information or factor differently than another Trustee. This information is current as of June 10, 2019.
Factors and Conclusions and Summary of Independent Written Fee Evaluation
| A. | Nature, Extent and Quality of Services Provided by Invesco Advisers and the Affiliated Sub-Advisers |
The Board reviewed the nature, extent and quality of the advisory services provided to the Fund by Invesco Advisers under the Fund’s investment advisory agreement, and the credentials and experience of the officers and employees of Invesco Advisers who provide these services, including the Fund’s portfolio manager(s). The Board’s review included consideration of Invesco Advisers’ investment process oversight and structure, credit analysis and investment risk management. The Board also considered non-advisory services that Invesco Advisers and its affiliates provide to the Invesco Funds such as various back office support functions, third party oversight, internal audit, valuation, portfolio trading and legal and compliance. The Board also received and reviewed information about Invesco Advisers’ role as administrator of the Invesco Funds’ liquidity risk management program. The Board also reviewed and considered the benefits to shareholders of investing in a fund that is part of the Invesco family of funds under the umbrella of Invesco Ltd., Invesco Advisers’ parent company, and noted Invesco Ltd.’s depth and experience in conducting an investment management business, as well as its
commitment of financial and other resources to such business. The Board reviewed and considered information about the resources that Invesco Advisers intends to continue to commit to managing the Invesco family of funds following Invesco Ltd.’s acquisition of OppenheimerFunds, Inc. and its subsidiaries. The Board concluded that the nature, extent and quality of the services provided to the Fund by Invesco Advisers are appropriate and satisfactory.
The Board reviewed the services that may be provided by the Affiliated Sub-Advisers under the sub-advisory contracts and the credentials and experience of the officers and employees of the Affiliated Sub-Advisers who provide these services. The Board noted the Affiliated Sub-Advisers’ expertise with respect to certain asset classes and that the Affiliated Sub-Advisers have offices and personnel that are located in financial centers around the world. As a result, the Board noted that the Affiliated Sub-Advisers can provide research and investment analysis on the markets and economies of various countries in which the Fund may invest, make recommendations regarding securities and assist with security trades. The Board concluded that the sub-advisory contracts may benefit the Fund and its shareholders by permitting Invesco Advisers to use the resources and talents of the Affiliated Sub-Advisers in managing the Fund. The Board concluded that the nature, extent and quality of the services that may be provided by the Affiliated Sub-Advisers are appropriate and satisfactory.
| B. | Fund Investment Performance |
The Board considered Fund investment performance as a relevant factor in considering whether to approve the investment advisory agreement. The Board did not view Fund investment performance as a relevant factor in considering whether to approve the sub-advisory contracts for the Fund, as no Affiliated Sub-Adviser currently manages assets of the Fund.
The Board compared the Fund’s investment performance over multiple time periods ending December 31, 2018 to the performance of funds in the Broadridge performance universe and against the Lipper Large Cap Core Funds Index. The Board noted that performance of Class A shares of the Fund was in the fifth quintile for the one, three and five year periods (the first quintile being the best performing funds and the fifth quintile being the worst performing funds). The Board noted that performance of Class A shares of the Fund was below the performance of the Index for the one, three and five year periods. The Board noted that the Fund’s high quality bias and
underweight and overweight exposures to certain securities and sectors detracted from Fund performance. The Trustees also reviewed more recent Fund performance and this review did not change their conclusions.
| C. | Advisory and Sub-Advisory Fees and Fund Expenses |
The Board compared the Fund’s contractual management fee rate to the contractual management fee rates of funds in the Fund’s Broadridge expense group. The Board noted that the contractual management fee rate for Class A shares of the Fund was reasonably comparable to the median contractual management fee rate of funds in its expense group. The Board noted that the term “contractual management fee” for funds in the expense group may include both advisory and certain non-portfolio management administrative services fees, but that Broadridge does not provide information on a fund by fund basis as to what is included. The Board also reviewed the methodology used by Broadridge in providing expense group information, which includes using each fund’s contractual management fee schedule (including any applicable breakpoints) as reported in the most recent prospectus or statement of additional information for each fund in the expense group. The Board also considered comparative information regarding the Fund’s total expense ratio and its various components. The Board noted that the Fund’s actual management fees and total expense ratio were in the fourth and fifth quintile, respectively, of its expense group and discussed with management reasons for such relative actual management fees and total expenses.
The Board noted that Invesco Advisers has contractually agreed to waive fees and/or limit expenses of the Fund for the term disclosed in the Fund’s registration statement in an amount necessary to limit total annual operating expenses to a specified percentage of average daily net assets for each class of the Fund.
The Board also considered the fees charged by Invesco Advisers and the Affiliated Sub-Advisers to other similarly managed client accounts. The Board noted that Invesco Advisers or the Affiliated Sub-Advisers may charge lower fees to large institutional clients. Invesco Advisers reviewed with the Board differences in the scope of services it provides to the Invesco Funds relative to certain other types of client accounts, including management of cash flows as a result of redemptions and purchases, necessary infrastructure such as officers, office space, technology, legal and distribution, oversight of service providers, costs and business risks associated with launching new funds and sponsoring and maintaining the product line, preparation of annual registration statement updates and financial information and compliance with federal and state laws and regulations.
The Board also considered the services that may be provided by the Affiliated Sub-Advisers pursuant to the sub-advisory contracts, as well as the fees payable by Invesco Advisers to the Affiliated Sub-Advisers pursuant to the sub-advisory contracts.
| D. | Economies of Scale and Breakpoints |
The Board considered the extent to which there may be economies of scale in the provision of advisory services to the Fund. The Board considered Invesco’s reinvestment in its business, including investments in business infrastructure and cybersecurity. The Board also considered that the Fund benefits from economies of scale through contractual breakpoints in the Fund’s advisory fee schedule, which generally operate to reduce the Fund’s expense ratio as it grows in size. The Board noted that the Fund shares directly in economies of scale through lower fees charged by third party service providers based on the combined size of the Invesco Funds. The Board noted that the Fund may also benefit from economies of scale through initial fee setting, fee waivers and expense reimbursements.
| E. | Profitability and Financial Resources |
The Board reviewed information from Invesco Advisers concerning the costs of the advisory and other services that Invesco Advisers and its affiliates provide to the Fund and the Invesco Funds and the profitability of Invesco Advisers and its affiliates in providing these services. The Board considered the methodology used for calculating profitability and noted the periodic review of such methodology by an independent consultant. The Board noted that Invesco Advisers continues to operate at a net profit from services Invesco Advisers and its affiliates provide to the Invesco Funds and the Fund. The Board did not deem the level of profits realized by Invesco Advisers and its affiliates from providing services to the Fund to be excessive given the nature, extent and quality of the services provided. The Board received information from Invesco Advisers demonstrating that Invesco Advisers and the Affiliated Sub-Advisers are financially sound and have the resources necessary to perform their obligations under the investment advisory agreement and sub-advisory contracts.
| F. | Collateral Benefits to Invesco Advisers and its Affiliates |
The Board considered various other benefits received by Invesco Advisers and its affiliates from the relationship with the Fund, including the fees received for providing administrative, transfer agency and distribution services to the Fund. The Board considered comparative information regarding fees charged for these services, including information provided by Broadridge and other independent sources. The Board considered the performance of Invesco Advisers and its affiliates in providing these services and the organizational structure employed to provide these services. The Board also considered that these services are provided
to the Fund pursuant to written contracts that are reviewed and approved on an annual basis by the Board; and that the services are required for the operation of the Fund.
The Board considered the benefits realized by Invesco Advisers and the Affiliated Sub-Advisers as a result of portfolio brokerage transactions executed through “soft dollar” arrangements. The Board noted that soft dollar arrangements may result in the Fund bearing costs to purchase research that may be used by Invesco Advisers or the Affiliated Sub-Advisers with other clients and may reduce Invesco Advisers’ or the Affiliated Sub-Advisers’ expenses. The Board also considered that it receives periodic reports from Invesco representing that these arrangements are consistent with regulatory requirements. The Board did not deem the soft dollar arrangements to be inappropriate.
The Board considered that the Fund’s uninvested cash and cash collateral from any securities lending arrangements may be invested in money market funds advised by Invesco Advisers pursuant to procedures approved by the Board. The Board considered information regarding the returns of the affiliated money market funds relative to comparable overnight investments, as well as the costs to the Fund of such investments. The Board noted that Invesco Advisers receives advisory fees from these affiliated money market funds attributable to such investments, although Invesco Advisers has contractually agreed to waive through varying periods the advisory fees payable by the Invesco Funds with respect to certain investments in the affiliated money market funds. The waiver is in an amount equal to 100% of the net advisory fee Invesco Advisers receives from the affiliated money market funds with respect to the Fund’s investment in the affiliated money market funds of uninvested cash, but not cash collateral. The Board concluded that the amount of advisory fees received by Invesco Advisers from the Fund’s investment of cash collateral from any securities lending arrangements in the affiliated money market funds is fair and reasonable.
The Board also considered that an affiliated broker may receive commissions for executing certain trades for the Fund. Invesco Advisers and the Affiliated Sub-Advisers may use the affiliated broker to, among other things, control order routing and minimize information leakage, and the Board was advised that such trades are executed in compliance with rules under the federal securities laws and consistent with best execution obligations.
Tax Information
Form 1099-DIV, Form 1042-S and other year–end tax information provide shareholders with actual calendar year amounts that should be included in their tax returns. Shareholders should consult their tax advisers.
The following distribution information is being provided as required by the Internal Revenue Code or to meet a specific state’s requirement.
The Fund designates the following amounts or, if subsequently determined to be different, the maximum amount allowable for its fiscal year ended October 31, 2019:
| | | | | | |
| | Federal and State Income Tax | | | | |
| | Long-Term Capital Gain Distributions | | $ | 303,013,077 | |
| | Qualified Dividend Income* | | | 100 | % |
| | Corporate Dividends Received Deduction* | | | 100 | % |
| | U.S. Treasury Obligations* | | | 0 | % |
| | * | The above percentages are based on ordinary income dividends paid to shareholders during the Fund’s fiscal year. |
Trustees and Officers
The address of each trustee and officer is AIM Equity Funds (Invesco Equity Funds) (the “Trust”), 11 Greenway Plaza, Suite 1000, Houston, Texas 77046-1173. The trustees serve for the life of the Trust, subject to their earlier death, incapacitation, resignation, retirement or removal as more specifically provided in the Trust’s organizational documents. Each officer serves for a one year term or until their successors are elected and qualified. Column two below includes length of time served with predecessor entities, if any.
| | | | | | | | |
Name, Year of Birth and Position(s) Held with the Trust | | Trustee and/or Officer Since | | Principal Occupation(s) During Past 5 Years | | Number of Funds in Fund Complex Overseen by Trustee | | Other Directorship(s) Held by Trustee During Past 5 Years |
Interested Persons | | | | | | | | |
| | | | | |
Martin L. Flanagan1– 1960 Trustee and Vice Chair | | 2007 | | Executive Director, Chief Executive Officer and President, Invesco Ltd. (ultimate parent of Invesco and a global investment management firm); Trustee and Vice Chair, The Invesco Funds; Vice Chair, Investment Company Institute; and Member of Executive Board, SMU Cox School of Business Formerly: Advisor to the Board, Invesco Advisers, Inc. (formerly known as Invesco Institutional (N.A.), Inc.); Chairman and Chief Executive Officer, Invesco Advisers, Inc. (registered investment adviser); Director, Chairman, Chief Executive Officer and President, Invesco Holding Company (US), Inc. (formerly IVZ Inc.) (holding company), Invesco Group Services, Inc. (service provider) and Invesco North American Holdings, Inc. (holding company); Director, Chief Executive Officer and President, Invesco Holding Company Limited (parent of Invesco and a global investment management firm); Director, Invesco Ltd.; Chairman, Investment Company Institute and President, Co-Chief Executive Officer, Co-President, Chief Operating Officer and Chief Financial Officer, Franklin Resources, Inc. (global investment management organization) | | 229 | | None |
| | | | | |
Philip A. Taylor2– 1954 Trustee | | 2006 | | Vice Chair, Invesco Ltd.; Trustee, The Invesco Funds Formerly: Director, Invesco Canada Ltd. (formerly known as Invesco Trimark Ltd./Invesco Trimark Ltèe) (registered investment adviser and registered transfer agent); Head of the Americas and Senior Managing Director, Invesco Ltd.; Director, Invesco Advisers, Inc. (formerly known as Invesco Institutional (N.A.), Inc.) (registered investment adviser); Director and Chairman, Invesco Investment Services, Inc. (formerly known as Invesco AIM Investment Services, Inc.) (registered transfer agent); Chief Executive Officer, Invesco Corporate Class Inc. (corporate mutual fund company); Chairman and Chief Executive Officer, Invesco Canada Ltd. (formerly known as Invesco Trimark Ltd./Invesco Trimark Ltèe) (registered investment adviser and registered transfer agent); Senior Vice President, The Invesco Funds; Director, Invesco Investment Advisers LLC (formerly known as Van Kampen Asset Management); Director, Chairman, Chief Executive Officer and President, Invesco Management Group, Inc. (formerly known as Invesco AIM Management Group, Inc.) (financial services holding company); Co-Chairman, Co-President and Co-Chief Executive Officer, Invesco Advisers, Inc. (formerly known as Invesco Institutional (N.A.), Inc.) (registered investment adviser); Director, Chief Executive Officer and President, Van Kampen Exchange Corp; President and Principal Executive Officer, The Invesco Funds (other than AIM Treasurer’s Series Trust (Invesco Treasurer’s Series Trust), Short-Term Investments Trust and Invesco Management Trust); Executive Vice President, The Invesco Funds (AIM Treasurer’s Series Trust (Invesco Treasurer’s Series Trust), Short-Term Investments Trust and Invesco Management Trust only); Director and President, INVESCO Funds Group, Inc. (registered investment adviser and registered transfer agent); Director and Chairman, IVZ Distributors, Inc. (formerly known as INVESCO Distributors, Inc.) (registered broker dealer); Director, President and Chairman, Invesco Inc. (holding company), Invesco Canada Holdings Inc. (holding company), Trimark Investments Ltd./Placements Trimark Ltèe and Invesco Financial Services Ltd/Services Financiers Invesco Ltèe; Chief Executive Officer, Invesco Canada Fund Inc. (corporate mutual fund company); Director and Chairman, Van Kampen Investor Services Inc.; Director, Chief Executive Officer and President, 1371 Preferred Inc. (holding company) and Van Kampen Investments Inc.; Director and President, AIM GP Canada Inc. (general partner for limited partnerships) and Van Kampen Advisors, Inc.; Director and Chief Executive Officer, Invesco Trimark Dealer Inc. (registered broker dealer); Director, Invesco Distributors, Inc. (formerly known as Invesco AIM Distributors, Inc.) (registered broker dealer); Manager, Invesco Capital Management LLC; Director, Chief Executive Officer and President, Invesco Advisers, Inc.; Director, Chairman, Chief Executive Officer and President, Invesco AIM Capital Management, Inc.; President, Invesco Trimark Dealer Inc. and Invesco Trimark Ltd./Invesco Trimark Ltèe; Director and President, AIM Trimark Corporate Class Inc. and AIM Trimark Canada Fund Inc.; Senior Managing Director, Invesco Holding Company Limited; Director and Chairman, Fund Management Company (former registered broker dealer); President and Principal Executive Officer, The Invesco Funds (AIM Treasurer’s Series Trust (Invesco Treasurer’s Series Trust), and Short-Term Investments Trust only); President, AIM Trimark Global Fund Inc. and AIM Trimark Canada Fund Inc. | | 229 | | None |
| 1 | Mr. Flanagan is considered an interested person (within the meaning of Section 2(a)(19) of the 1940 Act) of the Trust because he is an officer of the Adviser to the Trust, and an officer and a director of Invesco Ltd., ultimate parent of the Adviser. |
| 2 | Mr. Taylor is considered an interested person (within the meaning of Section 2(a)(19) of the 1940 Act) of the Trust because he is an officer and a director of the Adviser. |
Trustees and Officers–(continued)
| | | | | | | | |
Name, Year of Birth and Position(s) Held with the Trust | | Trustee and/or Officer Since | | Principal Occupation(s) During Past 5 Years | | Number of Funds in Fund Complex Overseen by Trustee | | Other Directorship(s) Held by Trustee During Past 5 Years |
Independent Trustees | | | | | | | | |
| | | | | |
| Bruce L. Crockett – 1944 Trustee and Chair | | 1993 | | Chairman, Crockett Technologies Associates (technology consulting company) Formerly: Director, Captaris (unified messaging provider); Director, President and Chief Executive Officer, COMSAT Corporation; Chairman, Board of Governors of INTELSAT (international communications company); ACE Limited (insurance company); Independent Directors Council and Investment Company Institute: Member of the Audit Committee, Investment Company Institute; Member of the Executive Committee and Chair of the Governance Committee, Independent Directors Council | | 229 | | Director and Chairman of the Audit Committee, ALPS (Attorneys Liability Protection Society) (insurance company); Director and Member of the Audit Committee and Compensation Committee, Ferroglobe PLC (metallurgical company) |
| | | | | |
| David C. Arch – 1945 Trustee | | 2010 | | Chairman of Blistex Inc. (consumer health care products manufacturer); Member, World Presidents’ Organization | | 229 | | Board member of the Illinois Manufacturers’ Association |
| | | | | |
| Beth Ann Brown – 1968 Trustee | | 2019 | | Independent Consultant Formerly: Head of Intermediary Distribution, Managing Director, Strategic Relations, Managing Director, Head of National Accounts, Senior Vice President, National Account Manager and Senior Vice President, Key Account Manager, Columbia Management Investment Advisers LLC; Vice President, Key Account Manager, Liberty Funds Distributor, Inc.; and Trustee of certain Oppenheimer Funds | | 229 | | Director, Board of Directors of Caron Engineering Inc.; President and Director, Acton Shapleigh Youth Conservation Corps (non - profit); and Vice President and Director of Grahamtastic Connection (non- profit) |
| | | | | |
| Jack M. Fields – 1952 Trustee | | 1997 | | Chief Executive Officer, Twenty First Century Group, Inc. (government affairs company); and Chairman, Discovery Learning Alliance (non-profit) Formerly: Owner and Chief Executive Officer, Dos Angeles Ranch L.P. (cattle, hunting, corporate entertainment); Director, Insperity, Inc. (formerly known as Administaff) (human resources provider); Chief Executive Officer, Texana Timber LP (sustainable forestry company); Director of Cross Timbers Quail Research Ranch (non-profit); and member of the U.S. House of Representatives | | 229 | | None |
| | | | | |
| Cynthia Hostetler – 1962 Trustee | | 2017 | | Non-Executive Director and Trustee of a number of public and private business corporations Formerly: Director, Aberdeen Investment Funds (4 portfolios); Head of Investment Funds and Private Equity, Overseas Private Investment Corporation; President, First Manhattan Bancorporation, Inc.; Attorney, Simpson Thacher & Bartlett LLP | | 229 | | Vulcan Materials Company (construction materials company); Trilinc Global Impact Fund; Genesee & Wyoming, Inc. (railroads); Artio Global Investment LLC (mutual fund complex); Edgen Group, Inc. (specialized energy and infrastructure products distributor); Investment Company Institute (professional organization); Independent Directors Council (professional organization) |
Trustees and Officers–(continued)
| | | | | | | | |
Name, Year of Birth and Position(s) Held with the Trust | | Trustee and/or Officer Since | | Principal Occupation(s) During Past 5 Years | | Number of Funds in Fund Complex Overseen by Trustee | | Other Directorship(s) Held by Trustee During Past 5 Years |
Independent Trustees-(continued) | | | | |
| | | | | |
Eli Jones – 1961 Trustee | | 2016 | | Professor and Dean, Mays Business School - Texas A&M University Formerly: Professor and Dean, Walton College of Business, University of Arkansas and E.J. Ourso College of Business, Louisiana State University; Director, Arvest Bank | | 229 | | Insperity, Inc. (formerly known as Administaff) (human resources provider) |
| | | | | |
Elizabeth Krentzman – 1959 Trustee | | 2019 | | Formerly: Principal and Chief Regulatory Advisor for Asset Management Services and U.S. Mutual Fund Leader of Deloitte & Touche LLP; General Counsel of the Investment Company Institute (trade association); National Director of the Investment Management Regulatory Consulting Practice, Principal, Director and Senior Manager of Deloitte & Touche LLP; Assistant Director of the Division of Investment Management - Office of Disclosure and Investment Adviser Regulation of the U.S. Securities and Exchange Commission and various positions with the Division of Investment Management - Office of Regulatory Policy of the U.S. Securities and Exchange Commission; Associate at Ropes & Gray LLP; Advisory Board Member of the Securities and Exchange Commission Historical Society; and Trustee of certain Oppenheimer Funds | | 229 | | Trustee of the University of Florida National Board Foundation and Audit Committee Member; Member of the Cartica Funds Board of Directors (private investment funds); Member of the University of Florida Law Center Association, Inc. Board of Trustees and Audit Committee Member |
| | | | | |
Anthony J. LaCava, Jr. – 1956 Trustee | | 2019 | | Formerly: Director and Member of the Audit Committee, Blue Hills Bank (publicly traded financial institution) and Managing Partner, KPMG LLP | | 229 | | Blue Hills Bank; Chairman, Bentley University; Member, Business School Advisory Council; and Nominating Committee KPMG LLP |
| | | | | |
Prema Mathai-Davis – 1950 Trustee | | 1998 | | Retired Co-Owner & Partner of Quantalytics Research, LLC, (a FinTech Investment Research Platform for the Self-Directed Investor) | | 229 | | None |
| | | | | |
Joel W. Motley – 1952 Trustee | | 2019 | | Director of Office of Finance, Federal Home Loan Bank; Member of the Vestry of Trinity Wall Street; Managing Director of Carmona Motley Inc. (privately held financial advisor); Member of the Finance and Budget Committee of the Council on Foreign Relations, Member of the Investment Committee and Board of Human Rights Watch and Member of the Investment Committee and Board of Historic Hudson Valley (non-profit cultural organization) Formerly: Managing Director of Public Capital Advisors, LLC (privately held financial advisor); Managing Director of Carmona Motley Hoffman, Inc. (privately held financial advisor); Trustee of certain Oppenheimer Funds; and Director of Columbia Equity Financial Corp. (privately held financial advisor) | | 229 | | Director of Greenwall Foundation (bioethics research foundation); Member of Board and Investment Committee of The Greenwall Foundation; Director of Southern Africa Legal Services Foundation; Board Member and Investment Committee Member of Pulizer Center for Crisis Reporting (non-profit journalism) |
| | | | | |
Teresa M. Ressel – 1962 Trustee | | 2017 | | Non-executive director and trustee of a number of public and private business corporations Formerly: Chief Financial Officer, Olayan America, The Olayan Group (international investor/commercial/industrial); Chief Executive Officer, UBS Securities LLC; Group Chief Operating Officer, Americas, UBS AG; Assistant Secretary for Management & Budget and CFO, US Department of the Treasury | | 229 | | Atlantic Power Corporation (power generation company); ON Semiconductor Corp. (semiconductor supplier) |
Trustees and Officers–(continued)
| | | | | | | | |
Name, Year of Birth and Position(s) Held with the Trust | | Trustee and/or Officer Since | | Principal Occupation(s) During Past 5 Years | | Number of Funds in Fund Complex Overseen by Trustee | | Other Directorship(s) Held by Trustee During Past 5 Years |
Independent Trustees–(continued) | | | | |
| | | | | |
Ann Barnett Stern – 1957 Trustee | | 2017 | | President and Chief Executive Officer, Houston Endowment Inc. (private philanthropic institution) Formerly: Executive Vice President and General Counsel, Texas Children’s Hospital; Attorney, Beck, Redden and Secrest, LLP; Business Law Instructor, University of St. Thomas; Attorney, Andrews & Kurth LLP | | 229 | | Federal Reserve Bank of Dallas |
| | | | | |
Raymond Stickel, Jr. – 1944 Trustee | | 2005 | | Retired Formerly: Director, Mainstay VP Series Funds, Inc. (25 portfolios); Partner, Deloitte & Touche | | 229 | | None |
| | | | | |
Robert C. Troccoli – 1949 Trustee | | 2016 | | Retired Formerly: Adjunct Professor, University of Denver - Daniels College of Business; Senior Partner, KPMG LLP | | 229 | | None |
| | | | | |
Daniel S. Vandivort – 1954 Trustee | | 2019 | | Treasurer, Chairman of the Audit and Finance Committee, and Trustee, Board of Trustees, Huntington Disease Foundation of America; and President, Flyway Advisory Services LLC (consulting and property management) Formerly: Trustee and Governance Chair, of certain Oppenheimer Funds | | 229 | | Chairman and Lead Independent Director, Chairman of the Audit Committee, and Director, Board of Directors, Value Line Funds |
| | | | | |
James D. Vaughn – 1945 Trustee | | 2019 | | Retired Formerly: Managing Partner, Deloitte & Touche LLP; Trustee and Chairman of the Audit Committee, Schroder Funds; Board Member, Mile High United Way, Boys and Girls Clubs, Boy Scouts, Colorado Business Committee for the Arts, Economic Club of Colorado and Metro Denver Network (economic development corporation); and Trustee of certain Oppenheimer Funds | | 229 | | Board member and Chairman of Audit Committee of AMG National Trust Bank; Trustee and Investment Committee member, University of South Dakota Foundation; Board member, Audit Committee Member and past Board Chair, Junior Achievement (non-profit) |
| | | | | |
Christopher L. WIlson – 1957 Trustee, Vice Chair and Chair Designate | | 2017 | | Reitred Formerly: Director, TD Asset Management USA Inc. (mutual fund complex) (22 portfolios); Managing Partner, CT2, LLC (investing and consulting firm); President/Chief Executive Officer, Columbia Funds, Bank of America Corporation; President/Chief Executive Officer, CDC IXIS Asset Management Services, Inc.; Principal & Director of Operations, Scudder Funds, Scudder, Stevens & Clark, Inc.; Assistant Vice President, Fidelity Investments | | 229 | | ISO New England, Inc. (non-profit organization managing regional electricity market) |
Trustees and Officers–(continued)
| | | | | | | | |
Name, Year of Birth and Position(s) Held with the Trust | | Trustee
and/or Officer Since | | Principal Occupation(s) During Past 5 Years | | Number of Funds in Fund Complex Overseen by Trustee | | Other Directorship(s) Held by Trustee During Past 5 Years |
Other Officers | | | | | | | | |
| | | | | |
| Sheri Morris – 1964 President, Principal Executive Officer and Treasurer | | 1999 | | Head of Global Fund Services, Invesco Ltd.; President, Principal Executive Officer and Treasurer, The Invesco Funds; Vice President, Invesco Advisers, Inc. (formerly known as Invesco Institutional (N.A.), Inc.) (registered investment adviser); and Vice President, Invesco Exchange-Traded Fund Trust, Invesco Exchange-Traded Fund Trust II, Invesco India Exchange-Traded Fund Trust, Invesco Actively Managed Exchange-Traded Fund Trust, Invesco Actively Managed Exchange-Traded Commodity Fund Trust and Invesco Exchange-Traded Self-Indexed Fund Trust; and Vice President, OppenheimerFunds, Inc. Formerly: Vice President and Principal Financial Officer, The Invesco Funds; Vice President, Invesco AIM Advisers, Inc., Invesco AIM Capital Management, Inc. and Invesco AIM Private Asset Management, Inc.; Assistant Vice President and Assistant Treasurer, The Invesco Funds and Assistant Vice President, Invesco Advisers, Inc., Invesco AIM Capital Management, Inc. and Invesco AIM Private Asset Management, Inc.; and Treasurer, Invesco Exchange-Traded Fund Trust, Invesco Exchange-Traded Fund Trust II, Invesco India Exchange-Traded Fund Trust and Invesco Actively Managed Exchange-Traded Fund Trust | | N/A | | N/A |
| | | | | |
| Russell C. Burk – 1958 Senior Vice President and Senior Officer | | 2005 | | Senior Vice President and Senior Officer, The Invesco Funds | | N/A | | N/A |
| | | | | |
| Jeffrey H. Kupor – 1968 Senior Vice President, Chief Legal Officer and Secretary | | 2018 | | Head of Legal of the Americas, Invesco Ltd.; Senior Vice President and Secretary, Invesco Advisers, Inc. (formerly known as Invesco Institutional (N.A.), Inc.) (registered investment adviser); Senior Vice President and Secretary, Invesco Distributors, Inc. (formerly known as Invesco AIM Distributors, Inc.); Vice President and Secretary, Invesco Investment Services, Inc. (formerly known as Invesco AIM Investment Services, Inc.) Senior Vice President, Chief Legal Officer and Secretary, The Invesco Funds; Secretary and General Counsel, Invesco Investment Advisers LLC (formerly known as Van Kampen Asset Management); Secretary and General Counsel, Invesco Capital Markets, Inc. (formerly known as Van Kampen Funds Inc.) and Chief Legal Officer, Invesco Exchange-Traded Fund Trust, Invesco Exchange-Traded Fund Trust II, Invesco India Exchange-Traded Fund Trust, Invesco Actively Managed Exchange-Traded Fund Trust, Invesco Actively Managed Exchange-Traded Commodity Fund Trust and Invesco Exchange-Traded Self-Indexed Fund Trust; Secretary, Invesco Indexing LLC; Secretary, W.L. Ross & Co., LLC Formerly: Secretary and Vice President, Jemstep, Inc.; Head of Legal, Worldwide Institutional, Invesco Ltd.; Secretary and General Counsel, INVESCO Private Capital Investments, Inc.; Senior Vice President, Secretary and General Counsel, Invesco Management Group, Inc. (formerly known as Invesco AIM Management Group, Inc.); Assistant Secretary, INVESCO Asset Management (Bermuda) Ltd.; Secretary and General Counsel, Invesco Private Capital, Inc.; Assistant Secretary and General Counsel, INVESCO Realty, Inc.; Secretary and General Counsel, Invesco Senior Secured Management, Inc.; and Secretary, Sovereign G./P. Holdings Inc. | | N/A | | N/A |
| | | | | |
Andrew R. Schlossberg – 1974 Senior Vice President | | 2019 | | Head of the Americas and Senior Managing Director, Invesco Ltd.; Director and Senior Vice President, Invesco Advisers, Inc. (formerly known as Invesco Institutional (N.A.), Inc.) (registered investment adviser); Director and Chairman, Invesco Investment Services, Inc. (formerly known as Invesco AIM Investment Services, Inc.) (registered transfer agent); Senior Vice President, The Invesco Funds; Director, Invesco Investment Advisers LLC (formerly known as Van Kampen Asset Management); Director, President and Chairman, Invesco Insurance Agency, Inc. Formerly: Director, Invesco UK Limited; Director and Chief Executive, Invesco Asset Management Limited and Invesco Fund Managers Limited; Assistant Vice President, The Invesco Funds; Senior Vice President, Invesco Advisers, Inc. (formerly known as Invesco Institutional (N.A.), Inc.) (registered investment adviser); Director and Chief Executive, Invesco Administration Services Limited and Invesco Global Investment Funds Limited; Director, Invesco Distributors, Inc.; Head of EMEA, Invesco Ltd.; President, Invesco Actively Managed Exchange-Traded Commodity Fund Trust, Invesco Actively Managed Exchange-Traded Fund Trust, Invesco Exchange-Traded Fund Trust, Invesco Exchange-Traded Fund Trust II and Invesco India Exchange-Traded Fund Trust; Managing Director and Principal Executive Officer, Invesco Capital Management LLC | | N/A | | N/A |
Trustees and Officers–(continued)
| | | | | | | | |
Name, Year of Birth and Position(s) Held with the Trust | | Trustee and/or Officer Since | | Principal Occupation(s) During Past 5 Years | | Number of Funds in Fund Complex Overseen by Trustee | | Other Directorship(s) Held by Trustee During Past 5 Years |
Other Officers–(continued) | | | | | | |
| | | | | |
John M. Zerr – 1962 Senior Vice President | | 2006 | | Chief Operating Officer of the Americas; Senior Vice President, Invesco Advisers, Inc. (formerly known as Invesco Institutional (N.A.), Inc.) (registered investment adviser); Senior Vice President, Invesco Distributors, Inc. (formerly known as Invesco AIM Distributors, Inc.); Director and Vice President, Invesco Investment Services, Inc. (formerly known as Invesco AIM Investment Services, Inc.) Senior Vice President, The Invesco Funds; Managing Director, Invesco Capital Management LLC; Director, Invesco Investment Advisers LLC (formerly known as Van Kampen Asset Management); Senior Vice President, Invesco Capital Markets, Inc. (formerly known as Van Kampen Funds Inc.); Manager, Invesco Indexing LLC; Manager, Invesco Specialized Products, LLC; Director and Senior Vice President, Invesco Insurance Agency, Inc.; Member, Invesco Canada Funds Advisory Board; Director, President and Chief Executive Officer, Invesco Corporate Class Inc. (corporate mutual fund company); and Director, Chairman, President and Chief Executive Officer, Invesco Canada Ltd. (formerly known as Invesco Trimark Ltd./Invesco Trimark Ltèe) (registered investment adviser and registered transfer agent) Formerly: Director and Senior Vice President, Invesco Management Group, Inc. (formerly known as Invesco AIM Management Group, Inc.); Secretary and General Counsel, Invesco Management Group, Inc. (formerly known as Invesco AIM Management Group, Inc.); Secretary, Invesco Investment Services, Inc. (formerly known as Invesco AIM Investment Services, Inc.); Chief Legal Officer and Secretary, The Invesco Funds; Secretary and General Counsel, Invesco Investment Advisers LLC (formerly known as Van Kampen Asset Management); Secretary and General Counsel, Invesco Capital Markets, Inc. (formerly known as Van Kampen Funds Inc.); Chief Legal Officer, Invesco Exchange-Traded Fund Trust, Invesco Exchange-Traded Fund Trust II, Invesco India Exchange-Traded Fund Trust, Invesco Actively Managed Exchange-Traded Fund Trust, Invesco Actively Managed Exchange-Traded Commodity Fund Trust and Invesco Exchange-Traded Self-Indexed Fund Trust; Secretary, Invesco Indexing LLC; Director, Secretary, General Counsel and Senior Vice President, Van Kampen Exchange Corp.; Director, Vice President and Secretary, IVZ Distributors, Inc. (formerly known as INVESCO Distributors, Inc.); Director and Vice President, INVESCO Funds Group, Inc.; Director and Vice President, Van Kampen Advisors Inc.; Director, Vice President, Secretary and General Counsel, Van Kampen Investor Services Inc.; Director and Secretary, Invesco Distributors, Inc. (formerly known as Invesco AIM Distributors, Inc.); Director, Senior Vice President, General Counsel and Secretary, Invesco AIM Advisers, Inc. and Van Kampen Investments Inc.; Director, Vice President and Secretary, Fund Management Company; Director, Senior Vice President, Secretary, General Counsel and Vice President, Invesco AIM Capital Management, Inc.; Chief Operating Officer and General Counsel, Liberty Ridge Capital, Inc. (an investment adviser) | | N/A | | N/A |
| | | | | |
Gregory G. McGreevey – 1962 Senior Vice President | | 2012 | | Senior Managing Director, Invesco Ltd.; Director, Chairman, President, and Chief Executive Officer, Invesco Advisers, Inc. (formerly known as Invesco Institutional (N.A.), Inc.) (registered investment adviser); Director, Invesco Mortgage Capital, Inc. and Invesco Senior Secured Management, Inc.; and Senior Vice President, The Invesco Funds; and President, SNW Asset Management Corporation Formerly: Senior Vice President, Invesco Management Group, Inc. and Invesco Advisers, Inc.; Assistant Vice President, The Invesco Funds | | N/A | | N/A |
| | | | | |
Kelli Gallegos – 1970 Vice President, Principal Financial Officer and Assistant Treasurer | | 2008 | | Principal Financial and Accounting Officer - Investments Pool, Invesco Specialized Products, LLC; Vice President, Principal Financial Officer and Assistant Treasurer, The Invesco Funds; Principal Financial and Accounting Officer - Pooled Investments, Invesco Capital Management LLC; Vice President and Treasurer, Invesco Exchange-Traded Fund Trust, Invesco Exchange-Traded Fund Trust II, Invesco India Exchange-Traded Fund Trust, Invesco Actively Managed Exchange-Traded Fund Trust, Invesco Actively Managed Exchange-Traded Commodity Fund Trust and Invesco Exchange-Traded Self-Indexed Fund Trust Formerly: Assistant Treasurer, Invesco Specialized Products, LLC; Assistant Treasurer, Invesco Exchange-Traded Fund Trust, Invesco Exchange-Traded Fund Trust II, Invesco India Exchange-Traded Fund Trust, Invesco Actively Managed Exchange-Traded Fund Trust, Invesco Actively Managed Exchange-Traded Commodity Fund Trust and Invesco Exchange-Traded Self-Indexed Fund Trust; Assistant Treasurer, Invesco Capital Management LLC; Assistant Vice President, The Invesco Funds | | N/A | | N/A |
Trustees and Officers–(continued)
| | | | | | | | |
Name, Year of Birth and Position(s) Held with the Trust | | Trustee and/or Officer Since | | Principal Occupation(s) During Past 5 Years | | Number of Funds in Fund Complex Overseen by Trustee | | Other Directorship(s) Held by Trustee During Past 5 Years |
Other Officers-(continued) | | | | | | |
| | | | | |
Crissie M. Wisdom – 1969 Anti-Money Laundering Compliance Officer | | 2013 | | Anti-Money Laundering Compliance Officer, Invesco Advisers, Inc. (formerly known as Invesco Institutional (N.A.), Inc.) (registered investment adviser), Invesco Capital Markets, Inc. (formerly known as Van Kampen Funds Inc.), Invesco Distributors, Inc., Invesco Investment Services, Inc., The Invesco Funds, and Invesco Exchange-Traded Fund Trust, Invesco Exchange-Traded Fund Trust II, Invesco India Exchange-Traded Fund Trust, Invesco Actively Managed Exchange-Traded Fund Trust, Invesco Actively Managed Exchange-Traded Commodity Fund Trust and Invesco Exchange-Traded Self-Indexed Fund Trust; Anti-Money Laundering Compliance Officer and Bank Secrecy Act Officer, INVESCO National Trust Company and Invesco Trust Company; and Fraud Prevention Manager and Controls and Risk Analysis Manager for Invesco Investment Services, Inc. Formerly: Anti-Money Laundering Compliance Officer, Van Kampen Exchange Corp. and Invesco Management Group, Inc. | | N/A | | N/A |
| | | | | |
Robert R. Leveille – 1969 Chief Compliance Officer | | 2016 | | Chief Compliance Officer, Invesco Advisers, Inc. (registered investment adviser); and Chief Compliance Officer, The Invesco Funds Formerly: Chief Compliance Officer, Putnam Investments and the Putnam Funds | | N/A | | N/A |
The Statement of Additional Information of the Trust includes additional information about the Fund’s Trustees and is available upon request, without charge, by calling 1.800.959.4246. Please refer to the Fund’s Statement of Additional Information for information on the Fund’s sub-advisers.
| | | | | | |
| Office of the Fund | | Investment Adviser | | Distributor | | Auditors |
11 Greenway Plaza, Suite 1000 Houston, TX 77046-1173 | | Invesco Advisers, Inc. 1555 Peachtree Street, N.E. Atlanta, GA 30309 | | Invesco Distributors, Inc. 11 Greenway Plaza, Suite 1000 Houston, TX 77046-1173 | | PricewaterhouseCoopers
LLP1000 Louisiana Street,
Suite 5800 Houston, TX 77002-5678 |
| | | |
| Counsel to the Fund | | Counsel to the Independent Trustees | | Transfer Agent | | Custodian |
Stradley Ronon Stevens & Young, LLP 2005 Market Street, Suite 2600 Philadelphia, PA 19103-7018 | | Goodwin Procter LLP 901 New York Avenue, N.W. Washington, D.C. 20001 | | Invesco Investment Services, Inc. 11 Greenway Plaza, Suite 1000 Houston, TX 77046-1173 | | State Street Bank and
Trust Company225 Franklin Street Boston, MA 02110-2801 |
(This page intentionally left blank)
(This page intentionally left blank)

Go paperless with eDelivery
Visit invesco.com/edelivery to enjoy the convenience and security of anytime electronic access to your investment documents.
With eDelivery, you can elect to have any or all of the following materials delivered straight to your inbox to download, save and print from your own computer:
| ∎ | | Fund reports and prospectuses |
Invesco mailing information
Send general correspondence to Invesco Investment Services, Inc., P.O. Box 219078, Kansas City, MO 64121-9078.
Important notice regarding delivery of security holder documents
To reduce Fund expenses, only one copy of most shareholder documents may be mailed to shareholders with multiple accounts at the same address (Householding). Mailing of your shareholder documents may be householded indefinitely unless you instruct us otherwise. If you do not want the mailing of these documents to be combined with those for other members of your household, please contact Invesco Investment Services, Inc. at 800 959 4246 or contact your financial institution. We will begin sending you individual copies for each account within 30 days after receiving your request.
Fund holdings and proxy voting information
The Fund provides a complete list of its holdings four times in each fiscal year, at the quarter-ends. For the second and fourth quarters, the list appears in the Fund’s semiannual and annual reports to shareholders. For the first and third quarters, the Fund files the lists with the Securities and Exchange Commission (SEC) as an exhibit to its reports on Form N-PORT. The most recent list of portfolio holdings is available at invesco.com/completeqtrholdings. Shareholders can also look up the Fund’s Form N-PORT filings on the SEC website, sec.gov. The SEC file numbers for the Fund are shown below.
A description of the policies and procedures that the Fund uses to determine how to vote proxies relating to portfolio securities is available without charge, upon request, from our Client Services department at 800 959 4246, or at invesco.com/ proxyguidelines. The information is also available on the SEC website, sec.gov.
| | |
Information regarding how the Fund voted proxies related to its portfolio securities during the most recent 12-month period ended June 30 is available at invesco.com/proxysearch. This information is also available on the SEC website, sec.gov. Invesco Advisers, Inc. is an investment adviser; it provides investment advisory services to individual and institutional clients and does not sell securities. Invesco Distributors, Inc. is the US distributor for Invesco Ltd.’s retail mutual funds, exchange-traded funds and institutional money market funds. Both are wholly owned, indirect subsidiaries of Invesco Ltd. | |  |
| | | | |
| SEC file numbers: 811-01424 and 002-25469 | | Invesco Distributors, Inc. | | CHT-AR-1 |
| | | | | | |
| | | |
 | | Annual Report to Shareholders | | | October 31, 2019 | |
| | | |
| | Invesco Diversified Dividend Fund | |
| | Nasdaq: | |
| | A: LCEAX∎ C: LCEVX∎ R: DDFRX∎ Y: LCEYX∎ Investor: LCEIX∎ R5: DDFIX∎ R6: LCEFX | |

Letters to Shareholders
| | |

Andrew Schlossberg | | Dear Shareholders: This annual report includes information about your Fund, including performance data and a
complete list of its investments as of the close of the reporting period. Inside is a discussion of
how your Fund was managed and the factors that affected its performance during the reporting
period. Despite marked market volatility along the way, most global equity markets produced solid
gains for the reporting period. As the reporting period unfolded in the final months of 2018,
global equities were reeling from a sharpsell-off. The catalyst for thesell-off was a
combination of ongoing trade concerns between the US and China, fears of a global economic
slowdown and lower oil prices from a supply glut. Gains posted earlier in 2018 for global
equities were erased, while US Treasury bonds, along with government and municipal bonds,
rallied as investors fled to “safe haven” assets. |
At the start of 2019, global equity markets rebounded strongly buoyed by more policy from central banks and optimism about a potentialUS-China trade deal. In May,US-China trade concerns and slowing global growth led to a global equitysell-off and rally in US Treasuries. Despite the May sell-off, domestic equity markets rallied in June in anticipation of a US Federal Reserve (the Fed) interest rate cut and closed the second quarter with modest gains. ContinuedUS-China trade worries and signs of slowing global economic growth left global equity markets largely flat for the third quarter. As the reporting period came to a close in October 2019, a raft of upbeat positive corporate earnings results and a US interest rate cut buoyed domestic equity results with some domestic indices recording record highs.
The Fed, in fact, both raised and lowered the federal funds rate during the reporting period. Given signs of a strong economy, the Fed raised rates in December 2018. In 2019, however, the Fed altered its outlook on further rate hikes leaving rates unchanged for the first half of the year. In July, the Fed lowered interest rates for the first time in 11 years. It again lowered rates in September and once again in October. As the year continues to unfold, we’ll see how the interplay of interest rates, economic data, geopolitics and a host of other factors affect US and overseas equity and fixed income markets.
Investor uncertainty and market volatility, such as we witnessed during the reporting period, are unfortunate facts of life when it comes to investing. That’s why Invesco encourages investors to work with a professional financial adviser who can stress the importance of starting to save and invest early and the importance of adhering to a disciplined investment plan. A financial adviser who knows your unique financial situation, investment goals and risk tolerance can be an invaluable partner as you seek to achieve your financial goals. He or she can offer a long-term perspective when markets are volatile and time-tested advice and guidance when your financial situation or investment goals change.
Visit our website for more information on your investments
Our website, invesco.com/us, offers a wide range of market insights and investment perspectives. On the website, you’ll find detailed information about our funds, including performance, holdings and portfolio manager commentaries. You can access information about your account by completing a simple, secure online registration. To do so, select “Log In” on the right side of the homepage, and then select “Register for Individual Account Access.”
In addition to the resources accessible on our website and through our mobile app, you can obtain timely updates to help you stay informed about the markets and the economy by connecting with Invesco on Twitter, LinkedIn or Facebook. You can access our blog at blog.invesco.us.com. Our goal is to provide you the information you want, when and where you want it.
Finally, I’m pleased to share with you Invesco’s commitment to both the Principles for Responsible Investment and to considering environmental, social and governance issues in our robust investment process. I invite you to learn more at invesco.com/esg.
Have questions?
For questions about your account, contact an Invesco client services representative at 800 959 4246.
All of us at Invesco look forward to serving your investment management needs. Thank you for investing with us.
Sincerely,

Andrew Schlossberg
Head of the Americas,
Senior Managing Director, Invesco Ltd.
| | |
| 2 | | Invesco Diversified Dividend Fund |
| | |

Bruce Crockett | | Dear Shareholders: |
| | Among the many important lessons I’ve learned in more than 40 years in a variety of business endeavors is the value of a trusted advocate. |
| | As independent chair of the Invesco Funds Board, I can assure you that the members of the Board are strong advocates for the interests of investors in Invesco’s mutual funds. We work hard to represent your interests through oversight of the quality of the investment management services your funds receive and other matters important to your investment, including but not limited to: |
| | ∎ Ensuring that Invesco offers a diverse lineup of mutual funds that your financial adviser can use to strive to meet your financial needs as your investment goals change over time. |
| | ∎ Monitoring how the portfolio management teams of the Invesco funds are performing in light of changing economic and market conditions. |
| ∎ | | Assessing each portfolio management team’s investment performance within the context of the investment strategy described in the fund’s prospectus. |
| ∎ | | Monitoring for potential conflicts of interests that may impact the nature of the services that your funds receive. |
We believe one of the most important services we provide our fund shareholders is the annual review of the funds’ advisory andsub-advisory contracts with Invesco Advisers and its affiliates. This review is required by the Investment Company Act of 1940 and focuses on the nature and quality of the services Invesco provides as the adviser to the Invesco funds and the reasonableness of the fees that it charges for those services. Each year, we spend months carefully reviewing information received from Invesco and a variety of independent sources, such as performance and fee data prepared by Lipper, Inc. (a subsidiary of Broadridge Financial Solutions, Inc.), an independent, third-party firm widely recognized as a leader in its field. We also meet with our independent legal counsel and other independent advisers to review and help us assess the information that we have received. Our goal is to assure that you receive quality investment management services for a reasonable fee.
I trust the measures outlined above provide assurance that you have a worthy advocate when it comes to choosing the Invesco Funds.
On behalf of the Board, we look forward to continuing to represent your interests and serving your needs.
Sincerely,

Bruce L. Crockett
Independent Chair
Invesco Funds Board of Trustees
| | |
| 3 | | Invesco Diversified Dividend Fund |
Management’s Discussion of Fund Performance
| | | | |
Performance summary For the fiscal year ended October 31, 2019, Class A shares of Invesco Diversified Dividend Fund (the Fund), at net asset value (NAV), outperformed the Russell 1000 Value Index, the Fund’s style-specific benchmark. Your Fund’s long-term performance appears later in this report. | |
Fund vs. Indexes Total returns, October 31, 2018 to October 31, 2019, at net asset value (NAV). Performance shown does not include applicable contingent deferred sales charges (CDSC) or front-end sales charges, which would have reduced performance. | |
| Class A Shares | | | 12.94% | |
| Class C Shares | | | 12.08 | |
| Class R Shares | | | 12.69 | |
| Class Y Shares | | | 13.27 | |
| Investor Class Shares | | | 13.00 | |
| Class R5 Shares | | | 13.29 | |
| Class R6 Shares | | | 13.44 | |
| S&P 500 Index▼(Broad Market Index) | | | 14.33 | |
| Russell 1000 Value Index▼ (Style-Specific Index) | | | 11.21 | |
| Lipper Large-Cap Value Funds Index∎ (Peer Group Index) | | | 10.39 | |
| Source(s):▼RIMES Technologies Corp.; ∎Lipper Inc. | | | | |
| |
Market conditions and your Fund
The fiscal year began with increased market volatility in the final months of 2018, as US equity markets suffered a sharp sell-off due to ongoing US-China trade disputes, fears of a global economic slowdown and lower oil prices. The US Federal Reserve (the Fed) raised interest rates in December 2018.
Equity markets rebounded in the first quarter of 2019, as optimism about a potential US-China trade deal increased and the Fed signaled there would be no further interest rate hikes in 2019, a surprising shift in monetary policy. The Fed’s more accommodative stance provided a supportive environment for equities and fixed income, despite mixed US economic data and slower overseas growth. Against this backdrop, the S&P 500 Index posted its best first quarter returns since 1998.
Although the S&P 500 Index posted modest gains for the second quarter of 2019, the US stock market experienced increased volatility. After four consecutive months of rising stock markets, the market sold off in May 2019, along with bond yields and oil prices, as investors weighed the impact of the lingering US-China trade war, as well as potential tariffs on Mexico. In addition, economic data continued to show a slowing domestic and global economy.
These investor concerns carried over into the third quarter of 2019. The US-China trade conflict worried investors and stifled business investment, even as the Fed cut interest rates by 0.25% twice in the quarter. This uncertainty increased both market volatility and risk aversion, and investors crowded into asset classes perceived as safe havens, such as US Treasuries and gold. The US Treasury yield curve inverted several
times, increasing fears of a possible US recession. However, the Fed’s accommodative tone provided some support for risk assets.
In October 2019, optimism that phase one of a US-China trade deal would be completed, a delay in the Brexit agreement until January 2020 and better-than-expected third-quarter corporate earnings results, helped send risk assets higher. During its October meeting, the Fed cut interest rates by another 0.25% based on business investment and exports remaining weak. Despite increased market volatility, most US-based equity indexes produced modest to strong returns for the fiscal year.
Within the S&P 500 Index, information technology (IT) was the best-performing sector for the fiscal year, while energy was the worst-performing sector and the only one to post a loss. It is important to view the market’s performance within the context of a full market cycle. This cycle, which began in June 2009, is one of the longest expansions on record with one of the largest bull markets, despite a historically low recovery in revenue versus previous cycle troughs.1 In this environment, we remain focused on our assessment of each investment’s risk-reward profile.
During the fiscal year, the Fund’s management discipline remained unchanged. Our total return approach continued to emphasize long-term capital appreciation, current income and capital preservation. We believe the Fund may serve as an equity foundation within a well-diversified asset allocation strategy, complementing more aggressive and cyclical investments. We look for dividend-paying companies with strong profitability, solid balance sheets and capital allocation policies that support sustained or increasing dividends and share repurchases. We perform extensive
| | | | |
| Portfolio Composition | |
| By sector % of total net assets | |
| |
| Consumer Staples | | | 23.37% | |
| Utilities | | | 18.31 | |
| Financials | | | 14.16 | |
| Industrials | | | 9.14 | |
| Health Care | | | 7.58 | |
| Energy | | | 5.45 | |
| Consumer Discretionary | | | 4.81 | |
| Communication Services | | | 4.69 | |
| Materials | | | 4.00 | |
| Other Sectors, Each Less than 2% of Net Assets | | | 3.09 | |
| Money Market Funds Plus Other Assets Less Liabilities | | | 5.40 | |
| | | | |
| Top 10 Equity Holdings* | |
| % of total net assets | |
| |
1. Entergy Corp. | | | 3.46% | |
2. Hartford Financial Services Group, Inc. (The) | | | 3.19 | |
3. Procter & Gamble Co. (The) | | | 3.05 | |
4. General Mills, Inc. | | | 3.01 | |
5. Coca-Cola Co. (The) | | | 2.81 | |
6. AT&T, Inc. | | | 2.72 | |
7. Dominion Energy, Inc. | | | 2.49 | |
8. PPL Corp. | | | 2.45 | |
9. Exelon Corp. | | | 2.24 | |
10. Kimberly-Clark Corp. | | | 2.09 | |
| | | | |
| Total Net Assets | | | $19.2 billion | |
| |
| Total Number of Holdings* | | | 70 | |
The Fund’s holdings are subject to change, and there is no assurance that the Fund will continue to hold any particular security.
*Excluding money market fund holdings, if any.
Data presented here are as of October 31, 2019.
| | |
| 4 | | Invesco Diversified Dividend Fund |
fundamental research, incorporating both financial statement analysis and an assessment of the potential reward relative to the downside risk, to determine a fair valuation over ourtwo-to three-year investment horizon for each stock. We believe this process may provide a valuable combination of dividend income, price appreciation and capital preservation. We also maintain a rigorous sell discipline and consider selling or reducing shares in stocks that no longer meet our investment criteria.
Within the Fund’s style-specific benchmark, real estate, utilities and IT were the best-performing sectors, while energy was the worst-performing sector during the fiscal year. The Fund’s overweight exposure to the utilities and consumer staples sectors contributed the most to the Fund’s performance relative to the style-specific index. The Fund’s underweight exposure to energy also helped relative performance, as did stock selection in the health care sector. Underweight positions in the IT and real estate sectors detracted the most from the Fund’s relative performance during the fiscal year. Stock selection in the industrials sector also hurt the Fund’s performance relative to the style-specific benchmark.
During the fiscal year, holdings in the utilities and consumer staples sectors were the largest contributors to the Fund’s performance. Utility companyEntergywas the largest contributor to Fund performance. The company has focused on exiting its merchant power business and transitioning to a fully regulated utility in order to deliver more consistent earnings. In addition, success in securing regulatory improvements in several state jurisdictions drove outperformance. Household and personal products companyProcter & Gamblealso made a significant contribution to Fund performance. The company experienced improving organic sales growth and better price realization during the fiscal year. In addition, management worked to improve shareholder returns by driving more focus at the business unit level, strengthening and accelerating productivity, investing in innovation and streamlining execution.
The Fund’s holdings in the energy sector were the largest detractors from performance during the fiscal year.Conoco-Phillipsstock declined during the fiscal year, as did energy stocks in general. The company has consistently generated cash flows above expectations from higher unit profitability and faster debt
reduction. In line with our thesis, management continues to increase the return of capital to shareholders. Conoco-Phillips recently announced a 38% dividend increase and an annual share buyback of $3 billion. Packaged food companyKraft Heinzwas also a large detractor from the Fund’s performance during the fiscal year. The company faced increasing costs that have lowered profitability and revenue growth has disappointed. The stock was also impacted by previous management actions that included a decrease in the dividend and an impairment of company assets. We believe new management initiatives to improve operations and invest in brands should improve Kraft Heinz profitability and organic sales.
The Fund used currency forward contracts for the purpose of hedging currency exposure of some of thenon-US-based companies held in the portfolio and not for speculative purposes or leverage. The use of currency forward contracts had a very small positive impact on the Fund’s performance during the fiscal year.
The Fund has successfully navigated multiple market cycles during its16-plus year history with a consistent long-term mandate to emphasize capital appreciation, current income and capital preservation over a full market cycle.
It has been our privilege to oversee Invesco Diversified Dividend Fund, and we thank you for your continued investment.
| 1 | Sources: National Bureau of Economic Research, Ned Davis Research and FactSet Research Systems Inc. |
Portfolio Managers:
Robert Botard
Kristina Bradshaw
Chris McMeans
Meggan Walsh - Lead
The views and opinions expressed in management’s discussion of Fund performance are those of Invesco Advisers, Inc. These views and opinions are subject to change at any time based on factors such as market and economic conditions. These views and opinions may not be relied upon as investment advice or recommendations, or as an offer for a particular security. The information is not a complete analysis of every aspect of any market, country, industry, security or the Fund. Statements of fact are from sources considered reliable, but Invesco Advisers, Inc. makes no representation or warranty as to their completeness or accuracy. Although historical performance is no guarantee of future results, these insights may help you understand our investment management philosophy.
See important Fund and, if applicable, index disclosures later in this report.
| | |
| 5 | | Invesco Diversified Dividend Fund |
Your Fund’s Long-Term Performance
Results of a $10,000 Investment – Oldest Share Class(es)
Fund and index data from 10/31/09
| | |
 | | S&P 500 Index1 Russell 1000 Value Index1 LipperLarge-Cap Value Funds Index2 Invesco Diversified Dividend Fund–Class A Shares Invesco Diversified Dividend Fund–Class C Shares |
| 1 | Source: RIMES Technologies Corp. |
Past performance cannot guarantee comparable future results.
The data shown in the chart include reinvested distributions, applicable sales charges and Fund expenses including
management fees. Index results include reinvested dividends, but they do not reflect sales charges. Performance of the peer group, if applicable, reflects fund expenses and management fees; performance
of a market index does not. Performance shown in the chart does not reflect deduction of taxes a shareholder would pay on Fund distributions or sale of Fund shares.
| | |
| 6 | | Invesco Diversified Dividend Fund |
| | | | |
Average Annual Total Returns | |
As of 10/31/19, including maximum applicable sales charges | |
| |
Class A Shares | | | | |
Inception (12/31/01) | | | 7.38 | % |
10 Years | | | 10.57 | |
5 Years | | | 6.22 | |
1 Year | | | 6.72 | |
| |
Class C Shares | | | | |
Inception (12/31/01) | | | 7.30 | % |
10 Years | | | 10.36 | |
5 Years | | | 6.63 | |
1 Year | | | 11.08 | |
| |
Class R Shares | | | | |
Inception (10/25/05) | | | 7.88 | % |
10 Years | | | 10.94 | |
5 Years | | | 7.17 | |
1 Year | | | 12.69 | |
| |
Class Y Shares | | | | |
Inception (10/3/08) | | | 9.94 | % |
10 Years | | | 11.48 | |
5 Years | | | 7.71 | |
1 Year | | | 13.27 | |
| |
Investor Class Shares | | | | |
Inception (7/15/05) | | | 7.79 | % |
10 Years | | | 11.24 | |
5 Years | | | 7.49 | |
1 Year | | | 13.00 | |
| |
Class R5 Shares | | | | |
Inception (10/25/05) | | | 8.48 | % |
10 Years | | | 11.54 | |
5 Years | | | 7.76 | |
1 Year | | | 13.29 | |
| |
Class R6 Shares | | | | |
10 Years | | | 11.50 | % |
5 Years | | | 7.87 | |
1 Year | | | 13.44 | |
Class R6 shares incepted on September 24, 2012. Performance shown prior to that date is that of Class A shares and includes the12b-1 fees applicable to Class A shares.
The performance data quoted represent past performance and cannot guarantee comparable future results; current performance may be lower or higher. Please visit invesco.com/ performance for the most recentmonth-end performance. Performance figures reflect reinvested distributions, changes in net asset value and the effect of the maximum sales charge unless otherwise stated. Performance figures do not reflect deduction of taxes a shareholder would pay on Fund distributions or sale of Fund shares. Investment return and principal value
| | | | |
Average Annual Total Returns | |
As of 9/30/19, the most recent calendar quarter end, including maximum applicable sales charges | |
| |
Class A Shares | | | | |
Inception (12/31/01) | | | 7.39 | % |
10 Years | | | 10.28 | |
5 Years | | | 6.62 | |
1 Year | | | 2.25 | |
| |
Class C Shares | | | | |
Inception (12/31/01) | | | 7.31 | % |
10 Years | | | 10.08 | |
5 Years | | | 7.03 | |
1 Year | | | 6.40 | |
| |
Class R Shares | | | | |
Inception (10/25/05) | | | 7.91 | % |
10 Years | | | 10.65 | |
5 Years | | | 7.56 | |
1 Year | | | 7.90 | |
| |
Class Y Shares | | | | |
Inception (10/3/08) | | | 9.98 | % |
10 Years | | | 11.18 | |
5 Years | | | 8.10 | |
1 Year | | | 8.45 | |
| |
Investor Class Shares | | | | |
Inception (7/15/05) | | | 7.81 | % |
10 Years | | | 10.96 | |
5 Years | | | 7.88 | |
1 Year | | | 8.24 | |
| |
Class R5 Shares | | | | |
Inception (10/25/05) | | | 8.51 | % |
10 Years | | | 11.27 | |
5 Years | | | 8.16 | |
1 Year | | | 8.51 | |
| |
Class R6 Shares | | | | |
10 Years | | | 11.21 | % |
5 Years | | | 8.25 | |
1 Year | | | 8.61 | |
will fluctuate so that you may have a gain or loss when you sell shares.
The net annual Fund operating expense ratio set forth in the most recent Fund prospectus as of the date of this report for Class A, Class C, Class R, Class Y, Investor Class, Class R5 and Class R6 shares was 0.81%, 1.56%, 1.06%, 0.56%, 0.76%, 0.52% and 0.42%, respectively.1 The total annual Fund operating expense ratio set forth in the most recent Fund prospectus as of the date of this report for Class A, Class C, Class R, Class Y, Investor Class, Class R5 and Class R6 shares was 0.82%, 1.57%, 1.07%, 0.57%, 0.77%, 0.53% and 0.43%, respectively. The expense ratios presented above may vary from the expense ratios presented in other sections of this report that are based
on expenses incurred during the period covered by this report.
Class A share performance reflects the maximum 5.50% sales charge, and Class C share performance reflects the applicable contingent deferred sales charge (CDSC) for the period involved. The CDSC on Class C shares is 1% for the first year after purchase. Class R, Class Y, Investor Class, Class R5 and Class R6 shares do not have afront-end sales charge or a CDSC; therefore, performance is at net asset value.
The performance of the Fund’s share classes will differ primarily due to different sales charge structures and class expenses.
Fund performance reflects any applicable fee waivers and/or expense reimbursements. Had the adviser not waived fees and/or reimbursed expenses currently or in the past, returns would have been lower. See current prospectus for more information.
| 1 | Total annual Fund operating expenses after any contractual fee waivers and/or expense reimbursements by the adviser in effect through at least June 30, 2021. See current prospectus for more information. |
| | |
| 7 | | Invesco Diversified Dividend Fund |
Invesco Diversified Dividend Fund’s investment objective is long-term growth of capital and, secondarily, current income.
| ∎ | | Unless otherwise stated, information presented in this report is as of October 31, 2019, and is based on total net assets. |
| ∎ | | Unless otherwise noted, all data provided by Invesco. |
| ∎ | | To access your Fund’s reports/prospectus, visit invesco.com/fundreports. |
About share classes
| ∎ | | Class R sharesare generally available only to employer sponsored retirement and benefit plans. Please see the prospectus for more information. |
| ∎ | | Class Y sharesandInvestor Class shares are available only to certain investors. Please see the prospectus for more information. |
| ∎ | | Class R5 sharesandClass R6 sharesare available for use by retirement plans that meet certain standards and for institutional investors. Class R6 shares are also available through intermediaries that have established an agreement with Invesco Distributors, Inc. to make such shares available for use in retail omnibus accounts. Please see the prospectus for more information. |
Principal risks of investing in the Fund
| ∎ | | Foreign securities risk.The Fund’s foreign investments may be adversely affected by political and social instability, changes in economic or taxation policies, difficulty in enforcing obligations, decreased liquidity or increased volatility. Foreign investments also involve the risk of the possible seizure, nationalization or expropriation of the issuer or foreign deposits (in which the Fund could lose its entire investments in a certain market) and the possible adoption of foreign governmental restrictions such as exchange controls. Unless the Fund has |
hedged its foreign securities risk, foreign securities risk also involves the risk of negative foreign currency rate fluctuations, which may cause the value of securities denominated in such foreign currency (or other instruments through which the Fund has exposure to foreign currencies) to decline in value. Currency exchange rates may fluctuate significantly over short periods of time. Currency hedging strategies, if used, are not always successful.
| ∎ | | Management risk.The Fund is actively managed and depends heavily on the Adviser’s judgment about markets, interest rates or the attractiveness, relative values, liquidity, or potential appreciation of particular investments made for the Fund’s portfolio. The Fund could experience losses if these judgments prove to be incorrect. Additionally, legislative, regulatory, or tax developments may adversely affect management of the Fund and, therefore, the ability of the Fund to achieve its investment objective. |
| ∎ | | Market risk.The market values of the Fund’s investments, and therefore the value of the Fund’s shares, will go up and down, sometimes rapidly or unpredictably. Market risk may affect a single issuer, industry or section of the economy, or it may affect the market as a whole. Individual stock prices tend to go up and down more dramatically than those of certain other types of investments, such as bonds. During a general downturn in the financial markets, multiple asset classes may decline in value. When markets perform well, there can be no assurance that specific investments held by the Fund will rise in value. |
| ∎ | | Value investing style risk.A value investing style subjects the Fund to the risk that the valuations never improve or that the returns on value equity securities are less than returns on other styles of investing or the overall stock market. |
About indexes used in this report
| ∎ | | TheS&P 500® Indexis an unmanaged index considered representative of the US stock market. |
| ∎ | | TheRussell 1000® Value Indexis an unmanaged index considered representative oflarge-cap value stocks. The Russell 1000 Value Index is a trademark/service mark of the Frank Russell Co. Russell® is a trademark of the Frank Russell Co. |
| ∎ | | TheLipperLarge-Cap Value Funds Indexis an unmanaged index considered representative oflarge-cap value funds tracked by Lipper. |
| ∎ | | The Fund is not managed to track the performance of any particular index, including the index(es) described here, and consequently, the performance of the Fund may deviate significantly from the performance of the index(es). |
| ∎ | | A direct investment cannot be made in an index. Unless otherwise indicated, index results include reinvested dividends, and they do not reflect sales charges. Performance of the peer group, if applicable, reflects fund expenses; performance of a market index does not. |
Other information
| ∎ | | The returns shown in management’s discussion of Fund performance are based on net asset values (NAVs) calculated for shareholder transactions. Generally accepted accounting principles require adjustments to be made to the net assets of the Fund at period end for financial reporting purposes, and as such, the NAVs for shareholder transactions and the returns based on those NAVs may differ from the NAVs and returns reported in the Financial Highlights. |
| ∎ | | Industry classifications used in this report are generally according to the Global Industry Classification Standard, which was developed by and is the exclusive property and a service mark of MSCI Inc. and Standard & Poor’s. |
|
This report must be accompanied or preceded by a currently effective Fund prospectus, which contains more complete information, including sales charges and expenses. Investors should read it carefully before investing. |
| |
NOT FDIC INSURED | MAY LOSE VALUE | NO BANK GUARANTEE
| | |
| 8 | | Invesco Diversified Dividend Fund |
Schedule of Investments(a)
October 31, 2019
| | | | | | | | |
| | | Shares | | | Value | |
Common Stocks & Other Equity Interests–94.60% | |
| |
| Aerospace & Defense–1.72% | | | | | |
General Dynamics Corp. | | | 1,233,211 | | | $ | 218,031,705 | |
| |
Raytheon Co. | | | 525,727 | | | | 111,564,526 | |
| |
| | | | | | | 329,596,231 | |
| |
|
| Air Freight & Logistics–1.01% | |
United Parcel Service, Inc., Class B | | | 1,683,577 | | | | 193,897,563 | |
| |
|
| Apparel Retail–1.28% | |
TJX Cos., Inc. (The) | | | 4,253,020 | | | | 245,186,603 | |
| |
|
| Apparel, Accessories & Luxury Goods–0.43% | |
Columbia Sportswear Co. | | | 903,433 | | | | 81,715,515 | |
| |
|
| Asset Management & Custody Banks–0.57% | |
Federated Investors, Inc., Class B | | | 3,410,369 | | | | 108,927,186 | |
| |
|
| Brewers–2.98% | |
Anheuser-Busch InBev S.A./N.V. (Belgium) | | | 2,679,183 | | | | 216,395,497 | |
| |
Heineken N.V. (Netherlands) | | | 3,487,825 | | | | 355,902,966 | |
| |
| | | | | | | 572,298,463 | |
| |
|
| Construction Machinery & Heavy Trucks–0.98% | |
Cummins, Inc. | | | 1,087,608 | | | | 187,590,628 | |
| |
|
| Consumer Finance–1.31% | |
American Express Co. | | | 2,134,851 | | | | 250,375,325 | |
| |
|
| Data Processing & Outsourced Services–1.19% | |
Automatic Data Processing, Inc. | | | 1,411,544 | | | | 228,994,783 | |
| |
|
| Diversified Chemicals–0.73% | |
BASF S.E. (Germany) | | | 1,849,550 | | | | 140,774,290 | |
| |
|
| Electric Utilities–12.28% | |
American Electric Power Co., Inc. | | | 3,189,872 | | | | 301,092,018 | |
| |
Duke Energy Corp. | | | 2,578,860 | | | | 243,083,344 | |
| |
Entergy Corp. | | | 5,469,861 | | | | 664,478,714 | |
| |
Exelon Corp. | | | 9,427,795 | | | | 428,870,395 | |
| |
PPL Corp. | | | 14,013,235 | | | | 469,303,240 | |
| |
SSE PLC (United Kingdom) | | | 14,945,278 | | | | 248,540,361 | |
| |
| | | | | | | 2,355,368,072 | |
| |
|
| Electrical Components & Equipment–1.74% | |
ABB Ltd. (Switzerland) | | | 11,063,018 | | | | 232,188,839 | |
| |
Emerson Electric Co. | | | 1,454,735 | | | | 102,049,660 | |
| |
| | | | | | | 334,238,499 | |
| |
|
| Fertilizers & Agricultural Chemicals–0.53% | |
Nutrien Ltd. (Canada) | | | 2,140,297 | | | | 102,391,704 | |
| |
|
| Food Distributors–1.28% | |
Sysco Corp. | | | 3,063,356 | | | | 244,670,244 | |
| |
| | | | | | | | |
| | | Shares | | | Value | |
| General Merchandise Stores–1.37% | |
Target Corp. | | | 2,451,432 | | | $ | 262,082,595 | |
| |
|
| Health Care Equipment–0.24% | |
Stryker Corp. | | | 216,631 | | | | 46,850,786 | |
| |
|
| Household Products–5.14% | |
Kimberly–Clark Corp. | | | 3,014,728 | | | | 400,597,057 | |
| |
Procter & Gamble Co. (The) | | | 4,692,992 | | | | 584,324,434 | |
| |
| | | | | | | 984,921,491 | |
| |
|
| Industrial Conglomerates–1.16% | |
Siemens AG (Germany) | | | 1,926,479 | | | | 222,216,370 | |
| |
|
| Industrial Machinery–2.53% | |
Flowserve Corp.(b) | | | 7,621,382 | | | | 372,228,297 | |
| |
Pentair PLC | | | 2,711,271 | | | | 112,436,408 | |
| |
| | | | | | | 484,664,705 | |
| |
|
| Integrated Oil & Gas–3.46% | |
Royal Dutch Shell PLC, Class B (United Kingdom) | | | 2,044,789 | | | | 58,890,086 | |
| |
Suncor Energy, Inc. (Canada) | | | 7,957,996 | | | | 236,607,033 | |
| |
TOTAL S.A. (France) | | | 6,976,440 | | | | 367,720,160 | |
| |
| | | | | | | 663,217,279 | |
| |
|
| Integrated Telecommunication Services–4.69% | |
AT&T, Inc. | | | 13,540,190 | | | | 521,161,913 | |
| |
BT Group PLC (United Kingdom) | | | 65,954,939 | | | | 174,946,776 | |
| |
Deutsche Telekom AG (Germany) | | | 11,581,478 | | | | 203,676,673 | |
| |
| | | | | | | 899,785,362 | |
| |
|
| IT Consulting & Other Services–0.36% | |
International Business Machines Corp. | | | 514,078 | | | | 68,747,651 | |
| |
|
| Motorcycle Manufacturers–1.35% | |
Harley-Davidson, Inc. | | | 6,637,496 | | | | 258,264,969 | |
| |
|
| Multi-line Insurance–3.19% | |
Hartford Financial Services Group, Inc. (The) | | | 10,714,332 | | | | 611,574,071 | |
| |
|
| Multi-Utilities–6.02% | |
Consolidated Edison, Inc. | | | 3,243,449 | | | | 299,110,867 | |
| |
Dominion Energy, Inc. | | | 5,781,430 | | | | 477,257,046 | |
| |
Sempra Energy | | | 2,622,652 | | | | 378,999,441 | |
| |
| | | | | | | 1,155,367,354 | |
| |
|
| Oil & Gas Equipment & Services–0.72% | |
Baker Hughes Co. | | | 6,448,831 | | | | 138,004,983 | |
| |
|
| Oil & Gas Exploration & Production–1.27% | |
ConocoPhillips | | | 4,415,990 | | | | 243,762,648 | |
| |
|
| Packaged Foods & Meats–9.72% | |
Campbell Soup Co. | | | 8,475,754 | | | | 392,512,168 | |
| |
See accompanying Notes to Financial Statements which are an integral part of the financial statements.
| | |
| 9 | | Invesco Diversified Dividend Fund |
| | | | | | | | |
| | | Shares | | | Value | |
| Packaged Foods & Meats–(continued) | |
Danone S.A. (France) | | | 1,586,830 | | | $ | 131,782,214 | |
| |
General Mills, Inc. | | | 11,366,532 | | | | 578,101,817 | |
| |
Kraft Heinz Co. (The) | | | 4,085,616 | | | | 132,087,965 | |
| |
Mondelez International, Inc., Class A | | | 7,063,745 | | | | 370,493,425 | |
| |
Nestle S.A. (Switzerland) | | | 2,435,982 | | | | 260,106,780 | |
| |
| | | | | | | 1,865,084,369 | |
| |
| | |
| Paper Packaging–2.32% | | | | | | | | |
Avery Dennison Corp. | | | 840,657 | | | | 107,486,404 | |
| |
International Paper Co. | | | 4,604,920 | | | | 201,142,906 | |
| |
Sonoco Products Co. | | | 2,355,955 | | | | 135,938,603 | |
| |
| | | | | | | 444,567,913 | |
| |
| | |
| Personal Products–1.45% | | | | | | | | |
L’Oreal S.A. (France) | | | 949,302 | | | | 277,286,598 | |
| |
| | |
| Pharmaceuticals–7.34% | | | | | | | | |
Bayer AG (Germany) | | | 3,744,723 | | | | 290,532,640 | |
| |
Bristol-Myers Squibb Co. | | | 5,078,366 | | | | 291,345,857 | |
| |
Eli Lilly and Co. | | | 2,521,480 | | | | 287,322,646 | |
| |
Johnson & Johnson | | | 1,573,927 | | | | 207,821,321 | |
| |
Merck & Co., Inc. | | | 3,817,985 | | | | 330,866,580 | |
| |
| | | | | | | 1,407,889,044 | |
| |
| |
| Property & Casualty Insurance–1.65% | | | | | |
Travelers Cos., Inc. (The) | | | 2,418,346 | | | | 316,948,427 | |
| |
| | |
| Regional Banks–7.44% | | | | | | | | |
Comerica, Inc. | | | 1,620,843 | | | | 106,035,549 | |
| |
Cullen/Frost Bankers, Inc. | | | 1,423,255 | | | | 128,206,810 | |
| |
Fifth Third Bancorp | | | 6,343,016 | | | | 184,454,905 | |
| |
KeyCorp | | | 2,796,501 | | | | 50,253,123 | |
| |
M&T Bank Corp. | | | 2,457,698 | | | | 384,703,468 | |
| |
| | | | | | | | |
| | | Shares | | | Value | |
| Regional Banks–(continued) | |
PNC Financial Services Group, Inc. (The) | | | 1,698,895 | | | $ | 249,227,897 | |
| |
Zions Bancorp. N.A. | | | 6,696,044 | | | | 324,557,253 | |
| |
| | | | | | | 1,427,439,005 | |
| |
| | |
| Restaurants–0.39% | | | | | | | | |
Darden Restaurants, Inc. | | | 666,495 | | | | 74,827,394 | |
| |
| | |
| Soft Drinks–2.81% | | | | | | | | |
Coca-Cola Co. (The) | | | 9,898,261 | | | | 538,762,346 | |
| |
| |
| Specialized REITs–1.54% | | | | | |
Weyerhaeuser Co. | | | 10,087,950 | | | | 294,669,020 | |
| |
| |
| Specialty Chemicals–0.41% | | | | | |
DuPont de Nemours, Inc. | | | 1,208,098 | | | | 79,625,739 | |
| |
Total Common Stocks & Other Equity Interests
(Cost $13,517,661,984) | | | | 18,142,585,225 | |
| |
| |
Money Market Funds–5.29% | | | | | |
Invesco Government & Agency Portfolio, Institutional Class, 1.71%(c) | | | 354,815,044 | | | | 354,815,044 | |
| |
Invesco Liquid Assets Portfolio, Institutional Class, 1.90%(c) | | | 253,435,771 | | | | 253,537,145 | |
| |
Invesco Treasury Portfolio, Institutional Class, 1.66%(c) | | | 405,502,907 | | | | 405,502,907 | |
| |
Total Money Market Funds (Cost $1,013,789,171) | | | | | | | 1,013,855,096 | |
| |
TOTAL INVESTMENTS IN SECURITIES-99.89%
(Cost $14,531,451,155) | | | | 19,156,440,321 | |
| |
OTHER ASSETS LESS LIABILITIES–0.11% | | | | 21,875,239 | |
| |
NET ASSETS-100.00% | | | | | | $ | 19,178,315,560 | |
| |
Investment Abbreviations:
REIT – Real Estate Investment Trust
Notes to Schedule of Investments:
| (a) | Industry and/or sector classifications used in this report are generally according to the Global Industry Classification Standard, which was developed by and is the exclusive property and a service mark of MSCI Inc. and Standard & Poor’s. |
| (b) | Affiliated company during the period. The Investment Company Act of 1940 defines an “affiliated person” as an issuance in which a fund holds 5% or more of the outstanding voting securities. The Fund has not owned enough of the outstanding voting securities of the issuer to have control (as defined in the Investment Company Act of 1940) of that issuer. The value of this security as of October 31, 2019 represented 1.94% of the Fund’s Net Assets. |
| | | | | | | | | | | | | | | | | | | | | | | | | | | | |
| | | Value 10/31/18 | | | Purchases at Cost | | | Proceeds from Sales | | | Change in
Unrealized
Appreciation | | | Realized
Gain | | | Value 10/31/19 | | | Dividend
Income | |
| |
Flowserve Corp. | | $ | 365,743,226 | | | $ | 9,518,345 | | | $ | (29,384,607 | ) | | $ | 25,806,908 | | | $ | 544,425 | | | $ | 372,228,297 | | | $ | 6,021,335 | |
| |
| (c) | The money market fund and the Fund are affiliated by having the same investment adviser. The rate shown is the7-day SEC standardized yield as of October 31, 2019. |
| | | | | | | | | | | | | | |
| Open Forward Foreign Currency Contracts | |
| |
Settlement Date | | Counterparty | | Contract to | | | Unrealized
Appreciation
(Depreciation) | |
| | Deliver | | | Receive | |
| |
| Currency Risk | | | | | | | | | | | | | | |
| |
12/16/2019 | | Goldman Sachs International | | | EUR 396,043,614 | | | | USD 441,905,465 | | | | $(1,080,005 | ) |
| |
See accompanying Notes to Financial Statements which are an integral part of the financial statements.
| | |
| 10 | | Invesco Diversified Dividend Fund |
| | | | | | | | | | | | | | |
| Open Forward Foreign Currency Contracts–(continued) | |
| |
Settlement
Date | | Counterparty | | Contract to | | | Unrealized Appreciation (Depreciation) | |
| | Deliver | | | Receive | |
| |
| 12/16/2019 | | JPMorgan Chase Bank, N.A. | | | EUR 396,736,710 | | | | USD 442,601,051 | | | | $(1,159,664 | ) |
| |
Subtotal-Depreciation | | | | | | | | | | | (2,239,669 | ) |
| |
Total Forward Foreign Currency Contracts | | | | | | | | | | | $(2,239,669 | ) |
| |
Abbreviations:
EUR - Euro
USD - U.S. Dollar
See accompanying Notes to Financial Statements which are an integral part of the financial statements.
| | |
| 11 | | Invesco Diversified Dividend Fund |
Statement of Assets and Liabilities
October 31, 2019
| | | | |
Assets: | | | | |
Investments in securities, at value
(Cost $13,189,956,914) | | $ | 17,770,356,928 | |
| |
Investments in affiliates, at value
(Cost $1,341,494,241) | | | 1,386,083,393 | |
| |
Foreign currencies, at value
(Cost $826,858) | | | 828,845 | |
| |
Receivable for: | | | | |
Dividends | | | 34,529,536 | |
| |
Investments sold | | | 20,297,273 | |
| |
Fund shares sold | | | 16,658,647 | |
| |
Investment for trustee deferred compensation and retirement plans | | | 806,038 | |
| |
Other assets | | | 83,725 | |
| |
Total assets | | | 19,229,644,385 | |
| |
| |
| Liabilities: | | | | |
Other investments: | | | | |
Unrealized depreciation on forward foreign currency contracts outstanding | | | 2,239,669 | |
| |
Payable for: | | | | |
Investments purchased | | | 11,544,662 | |
| |
Fund shares reacquired | | | 28,734,884 | |
| |
Accrued fees to affiliates | | | 7,137,834 | |
| |
Accrued trustees’ and officers’ fees and benefits | | | 20,320 | |
| |
Accrued other operating expenses | | | 666,163 | |
| |
Trustee deferred compensation and retirement plans | | | 985,293 | |
| |
Total liabilities | | | 51,328,825 | |
| |
Net assets applicable to shares outstanding | | $ | 19,178,315,560 | |
| |
| |
| Net assets consist of: | | | | |
Shares of beneficial interest | | $ | 13,964,676,024 | |
| |
Distributable earnings | | | 5,213,639,536 | |
| |
| | $ | 19,178,315,560 | |
| |
| |
| Net Assets: | | | | |
Class A | | $ | 4,995,726,031 | |
| |
Class C | | $ | 449,837,626 | |
| |
Class R | | $ | 255,482,474 | |
| |
Class Y | | $ | 2,547,134,094 | |
| |
Investor Class | | $ | 1,817,250,998 | |
| |
Class R5 | | $ | 3,915,167,532 | |
| |
Class R6 | | $ | 5,197,716,805 | |
| |
| | | | |
Shares outstanding, no par value, with an unlimited number of shares authorized: | |
Class A | | | 243,671,605 | |
| |
Class C | | | 22,243,849 | |
| |
Class R | | | 12,420,758 | |
| |
Class Y | | | 124,092,858 | |
| |
Investor Class | | | 88,671,546 | |
| |
Class R5 | | | 190,939,425 | |
| |
Class R6 | | | 253,450,037 | |
| |
Class A: | | | | |
Net asset value per share | | $ | 20.50 | |
| |
Maximum offering price per share
(Net asset value of $20.50 ÷ 94.50%) | | $ | 21.69 | |
| |
Class C: | | | | |
Net asset value and offering price per share | | $ | 20.22 | |
| |
Class R: | | | | |
Net asset value and offering price per share | | $ | 20.57 | |
| |
Class Y: | | | | |
Net asset value and offering price per share | | $ | 20.53 | |
| |
Investor Class: | | | | |
Net asset value and offering price per share | | $ | 20.49 | |
| |
Class R5: | | | | |
Net asset value and offering price per share | | $ | 20.50 | |
| |
Class R6: | | | | |
Net asset value and offering price per share | | $ | 20.51 | |
| |
See accompanying Notes to Financial Statements which are an integral part of the financial statements.
| | |
| 12 | | Invesco Diversified Dividend Fund |
Statement of Operations
For the year ended October 31, 2019
| | | | |
| Investment income: | | | | |
Dividends (net of foreign withholding taxes of $13,472,736) | | $ | 597,677,925 | |
| |
Dividends from affiliates | | | 28,181,712 | |
| |
Total investment income | | | 625,859,637 | |
| |
| |
| Expenses: | | | | |
Advisory fees | | | 74,291,784 | |
| |
Administrative services fees | | | 2,430,271 | |
| |
Custodian fees | | | 441,232 | |
| |
Distribution fees: | | | | |
Class A | | | 12,316,050 | |
| |
Class C | | | 5,019,971 | |
| |
Class R | | | 1,365,555 | |
| |
Investor Class | | | 3,184,397 | |
| |
Transfer agent fees – A, C, R, Y and Investor | | | 15,907,108 | |
| |
Transfer agent fees – R5 | | | 3,719,422 | |
| |
Transfer agent fees – R6 | | | 226,732 | |
| |
Trustees’ and officers’ fees and benefits | | | 265,667 | |
| |
Registration and filing fees | | | 291,585 | |
| |
Reports to shareholders | | | 1,140,659 | |
| |
Professional services fees | | | 201,309 | |
| |
Other | | | 167,958 | |
| |
Total expenses | | | 120,969,700 | |
| |
Less: Fees waived and/or expense offset arrangement(s) | | | (1,188,007 | ) |
| |
Net expenses | | | 119,781,693 | |
| |
Net investment income | | | 506,077,944 | |
| |
| |
| Realized and unrealized gain (loss) from: | | | | |
| |
Net realized gain from: | | | | |
Investment securities | | | 474,586,399 | |
| |
Foreign currencies | | | 4,993,645 | |
| |
Forward foreign currency contracts | | | 59,596,564 | |
| |
| | | 539,176,608 | |
| |
Change in net unrealized appreciation (depreciation) of: | | | | |
Investment securities | | | 1,338,631,447 | |
| |
Foreign currencies | | | 147,670 | |
| |
Forward foreign currency contracts | | | (22,671,407 | ) |
| |
| | | 1,316,107,710 | |
| |
Net realized and unrealized gain | | | 1,855,284,318 | |
| |
Net increase in net assets resulting from operations | | $ | 2,361,362,262 | |
| |
See accompanying Notes to Financial Statements which are an integral part of the financial statements.
| | |
| 13 | | Invesco Diversified Dividend Fund |
Statement of Changes in Net Assets
For the years ended October 31, 2019 and 2018
| | | | | | | | |
| | | 2019 | | | 2018 | |
| | |
| Operations: | | | | | | | | |
| | |
Net investment income | | $ | 506,077,944 | | | $ | 536,482,893 | |
| |
Net realized gain | | | 539,176,608 | | | | 917,909,631 | |
| |
Change in net unrealized appreciation (depreciation) | | | 1,316,107,710 | | | | (1,429,295,776 | ) |
| |
Net increase in net assets resulting from operations | | | 2,361,362,262 | | | | 25,096,748 | |
| |
| | |
| Distributions to shareholders from distributable earnings: | | | | | | | | |
| | |
Class A | | | (351,815,831 | ) | | | (164,774,412 | ) |
| |
Class B | | | – | | | | (101,750 | ) |
| |
Class C | | | (38,365,245 | ) | | | (16,786,350 | ) |
| |
Class R | | | (20,032,184 | ) | | | (9,233,576 | ) |
| |
Class Y | | | (200,165,580 | ) | | | (118,691,198 | ) |
| |
Investor Class | | | (129,867,806 | ) | | | (58,326,262 | ) |
| |
Class R5 | | | (271,593,863 | ) | | | (124,983,876 | ) |
| |
Class R6 | | | (425,139,139 | ) | | | (213,238,919 | ) |
| |
Total distributions from distributable earnings | | | (1,436,979,648 | ) | | | (706,136,343 | ) |
| |
| | |
| Share transactions–net: | | | | | | | | |
| | |
Class A | | | (232,824,873 | ) | | | (884,267,650 | ) |
| |
Class B | | | – | | | | (9,425,590 | ) |
| |
Class C | | | (197,879,552 | ) | | | (183,579,211 | ) |
| |
Class R | | | (62,747,471 | ) | | | (42,483,297 | ) |
| |
Class Y | | | (413,898,527 | ) | | | (1,327,883,943 | ) |
| |
Investor Class | | | (87,969,174 | ) | | | (240,151,819 | ) |
| |
Class R5 | | | (7,437,105 | ) | | | (29,888,681 | ) |
| |
Class R6 | | | (944,856,073 | ) | | | (218,978,810 | ) |
| |
Net increase (decrease) in net assets resulting from share transactions | | | (1,947,612,775 | ) | | | (2,936,659,001 | ) |
| |
Net increase (decrease) in net assets | | | (1,023,230,161 | ) | | | (3,617,698,596 | ) |
| |
| | |
| Net assets: | | | | | | | | |
| | |
Beginning of year | | | 20,201,545,721 | | | | 23,819,244,317 | |
| |
End of year | | $ | 19,178,315,560 | | | $ | 20,201,545,721 | |
| |
See accompanying Notes to Financial Statements which are an integral part of the financial statements.
| | |
| 14 | | Invesco Diversified Dividend Fund |
Financial Highlights
The following schedule presents financial highlights for a share of the Fund outstanding throughout the periods indicated.
| | | | | | | | | | | | | | | | | | | | | | | | | | | | | | | | | | | | | | | | | | | | | | | | | | | | | | | | |
| | | Net asset
value,
beginning
of period | | | Net
investment income(a) | | | Net gains
(losses) on securities
(both
realized and
unrealized) | | | Total from
investment
operations | | | Dividends from net investment income | | | Distributions
from net
realized
gains | | | Total
distributions | | | Net asset
value, end
of period | | | Total
return (b) | | | Net assets,
end of period
(000’s omitted) | | | Ratio of
expenses
to average net assets
with fee waivers
and/or
expenses
absorbed | | Ratio of
expenses
to average net
assets without fee waivers
and/or expenses
absorbed | | Ratio of net
investment
income to average
net assets | | Portfolio
turnover (c) |
| Class A | | | | | | | | | | | | | | | | | | | | | | | | | | | | | | | | | | | | | | | | | | | | | | | | | | | | | | | | |
| Year ended 10/31/19 | | | $19.55 | | | | $0.47 | | | | $1.89 | | | | $2.36 | | | | $(0.51 | ) | | | $(0.90 | ) | | | $(1.41 | ) | | | $20.50 | | | | 12.94 | % | | | $4,995,726 | | | | | 0.81%(d) | | | | 0.82%(d) | | | | 2.45%(d) | | | 5 | % |
| Year ended 10/31/18 | | | 20.18 | | | | 0.44 | | | | (0.49 | ) | | | (0.05 | ) | | | (0.43 | ) | | | (0.15 | ) | | | (0.58 | ) | | | 19.55 | | | | (0.28 | ) | | | 4,979,893 | | | | | 0.79 | | | | 0.80 | | | | 2.17 | | | 10 | |
| Year ended 10/31/17 | | | 18.83 | | | | 0.37 | | | | 1.79 | | | | 2.16 | | | | (0.34 | ) | | | (0.47 | ) | | | (0.81 | ) | | | 20.18 | | | | 11.65 | | | | 6,029,664 | | | | | 0.80 | | | | 0.82 | | | | 1.85 | | | 8 | |
| Year ended 10/31/16 | | | 18.78 | | | | 0.33 | | | | 0.76 | | | | 1.09 | | | | (0.31 | ) | | | (0.73 | ) | | | (1.04 | ) | | | 18.83 | | | | 6.27 | | | | 5,985,548 | | | | | 0.80 | | | | 0.82 | | | | 1.79 | | | 11 | |
| Year ended 10/31/15 | | | 18.17 | | | | 0.30 | | | | 0.95 | | | | 1.25 | | | | (0.28 | ) | | | (0.36 | ) | | | (0.64 | ) | | | 18.78 | | | | 7.09 | | | | 4,715,635 | | | | | 0.82 | | | | 0.83 | | | | 1.63 | | | 11 | |
| Class C | | | | | | | | | | | | | | | | | | | | | | | | | | | | | | | | | | | | | | | | | | | | | | | | | | | | | | | | |
| Year ended 10/31/19 | | | 19.30 | | | | 0.32 | | | | 1.86 | | | | 2.18 | | | | (0.36 | ) | | | (0.90 | ) | | | (1.26 | ) | | | 20.22 | | | | 12.08 | | | | 449,838 | | | | | 1.56(d) | | | | 1.57(d) | | | | 1.70(d) | | | 5 | |
| Year ended 10/31/18 | | | 19.92 | | | | 0.28 | | | | (0.47 | ) | | | (0.19 | ) | | | (0.28 | ) | | | (0.15 | ) | | | (0.43 | ) | | | 19.30 | | | | (1.01 | ) | | | 634,394 | | | | | 1.54 | | | | 1.55 | | | | 1.42 | | | 10 | |
| Year ended 10/31/17 | | | 18.59 | | | | 0.21 | | | | 1.77 | | | | 1.98 | | | | (0.18 | ) | | | (0.47 | ) | | | (0.65 | ) | | | 19.92 | | | | 10.84 | | | | 840,125 | | | | | 1.55 | | | | 1.57 | | | | 1.10 | | | 8 | |
| Year ended 10/31/16 | | | 18.56 | | | | 0.19 | | | | 0.74 | | | | 0.93 | | | | (0.17 | ) | | | (0.73 | ) | | | (0.90 | ) | | | 18.59 | | | | 5.41 | | | | 778,829 | | | | | 1.55 | | | | 1.57 | | | | 1.04 | | | 11 | |
| Year ended 10/31/15 | | | 17.95 | | | | 0.16 | | | | 0.95 | | | | 1.11 | | | | (0.14 | ) | | | (0.36 | ) | | | (0.50 | ) | | | 18.56 | | | | 6.36 | | | | 440,482 | | | | | 1.57 | | | | 1.58 | | | | 0.88 | | | 11 | |
| Class R | | | | | | | | | | | | | | | | | | | | | | | | | | | | | | | | | | | | | | | | | | | | | | | | | | | | | | | | |
| Year ended 10/31/19 | | | 19.61 | | | | 0.43 | | | | 1.89 | | | | 2.32 | | | | (0.46 | ) | | | (0.90 | ) | | | (1.36 | ) | | | 20.57 | | | | 12.69 | | | | 255,482 | | | | | 1.06(d) | | | | 1.07(d) | | | | 2.20(d) | | | 5 | |
| Year ended 10/31/18 | | | 20.24 | | | | 0.39 | | | | (0.49 | ) | | | (0.10 | ) | | | (0.38 | ) | | | (0.15 | ) | | | (0.53 | ) | | | 19.61 | | | | (0.52 | ) | | | 306,070 | | | | | 1.04 | | | | 1.05 | | | | 1.92 | | | 10 | |
| Year ended 10/31/17 | | | 18.88 | | | | 0.32 | | | | 1.80 | | | | 2.12 | | | | (0.29 | ) | | | (0.47 | ) | | | (0.76 | ) | | | 20.24 | | | | 11.40 | | | | 358,418 | | | | | 1.05 | | | | 1.07 | | | | 1.60 | | | 8 | |
| Year ended 10/31/16 | | | 18.84 | | | | 0.28 | | | | 0.75 | | | | 1.03 | | | | (0.26 | ) | | | (0.73 | ) | | | (0.99 | ) | | | 18.88 | | | | 5.93 | | | | 237,638 | | | | | 1.05 | | | | 1.07 | | | | 1.54 | | | 11 | |
| Year ended 10/31/15 | | | 18.22 | | | | 0.26 | | | | 0.96 | | | | 1.22 | | | | (0.24 | ) | | | (0.36 | ) | | | (0.60 | ) | | | 18.84 | | | | 6.87 | | | | 204,956 | | | | | 1.07 | | | | 1.08 | | | | 1.38 | | | 11 | |
| Class Y | | | | | | | | | | | | | | | | | | | | | | | | | | | | | | | | | | | | | | | | | | | | | | | | | | | | | | | | |
| Year ended 10/31/19 | | | 19.57 | | | | 0.52 | | | | 1.90 | | | | 2.42 | | | | (0.56 | ) | | | (0.90 | ) | | | (1.46 | ) | | | 20.53 | | | | 13.27 | | | | 2,547,134 | | | | | 0.56(d) | | | | 0.57(d) | | | | 2.70(d) | | | 5 | |
| Year ended 10/31/18 | | | 20.20 | | | | 0.49 | | | | (0.49 | ) | | | 0.00 | | | | (0.48 | ) | | | (0.15 | ) | | | (0.63 | ) | | | 19.57 | | | | (0.03 | ) | | | 2,844,688 | | | | | 0.54 | | | | 0.55 | | | | 2.42 | | | 10 | |
| Year ended 10/31/17 | | | 18.85 | | | | 0.42 | | | | 1.79 | | | | 2.21 | | | | (0.39 | ) | | | (0.47 | ) | | | (0.86 | ) | | | 20.20 | | | | 11.93 | | | | 4,278,325 | | | | | 0.55 | | | | 0.57 | | | | 2.10 | | | 8 | |
| Year ended 10/31/16 | | | 18.80 | | | | 0.38 | | | | 0.75 | | | | 1.13 | | | | (0.35 | ) | | | (0.73 | ) | | | (1.08 | ) | | | 18.85 | | | | 6.53 | | | | 3,670,662 | | | | | 0.55 | | | | 0.57 | | | | 2.04 | | | 11 | |
| Year ended 10/31/15 | | | 18.19 | | | | 0.35 | | | | 0.95 | | | | 1.30 | | | | (0.33 | ) | | | (0.36 | ) | | | (0.69 | ) | | | 18.80 | | | | 7.36 | | | | 1,183,312 | | | | | 0.57 | | | | 0.58 | | | | 1.88 | | | 11 | |
| Investor Class | | | | | | | | | | | | | | | | | | | | | | | | | | | | | | | | | | | | | | | | | | | | | | | | | | | | | | | | |
| Year ended 10/31/19 | | | 19.54 | | | | 0.49 | | | | 1.88 | | | | 2.37 | | | | (0.52 | ) | | | (0.90 | ) | | | (1.42 | ) | | | 20.49 | | | | 13.00 | (e) | | | 1,817,251 | | | | | 0.74(d)(e) | | | | 0.75(d)(e) | | | | 2.52(d)(e) | | | 5 | |
| Year ended 10/31/18 | | | 20.16 | | | | 0.45 | | | | (0.48 | ) | | | (0.03 | ) | | | (0.44 | ) | | | (0.15 | ) | | | (0.59 | ) | | | 19.54 | | | | (0.19 | )(e) | | | 1,815,421 | | | | | 0.74(e) | | | | 0.75(e) | | | | 2.22(e) | | | 10 | |
| Year ended 10/31/17 | | | 18.81 | | | | 0.37 | | | | 1.79 | | | | 2.16 | | | | (0.34 | ) | | | (0.47 | ) | | | (0.81 | ) | | | 20.16 | | | | 11.69 | (e) | | | 2,113,750 | | | | | 0.75(e) | | | | 0.77(e) | | | | 1.90(e) | | | 8 | |
| Year ended 10/31/16 | | | 18.77 | | | | 0.33 | | | | 0.76 | | | | 1.09 | | | | (0.32 | ) | | | (0.73 | ) | | | (1.05 | ) | | | 18.81 | | | | 6.29 | (e) | | | 2,114,404 | | | | | 0.76(e) | | | | 0.78(e) | | | | 1.83(e) | | | 11 | |
| Year ended 10/31/15 | | | 18.16 | | | | 0.31 | | | | 0.96 | | | | 1.27 | | | | (0.30 | ) | | | (0.36 | ) | | | (0.66 | ) | | | 18.77 | | | | 7.16 | (e) | | | 2,002,938 | | | | | 0.80(e) | | | | 0.81(e) | | | | 1.65(e) | | | 11 | |
| Class R5 | | | | | | | | | | | | | | | | | | | | | | | | | | | | | | | | | | | | | | | | | | | | | | | | | | | | | | | | |
| Year ended 10/31/19 | | | 19.55 | | | | 0.54 | | | | 1.88 | | | | 2.42 | | | | (0.57 | ) | | | (0.90 | ) | | | (1.47 | ) | | | 20.50 | | | | 13.29 | | | | 3,915,168 | | | | | 0.50(d) | | | | 0.51(d) | | | | 2.76(d) | | | 5 | |
| Year ended 10/31/18 | | | 20.18 | | | | 0.50 | | | | (0.49 | ) | | | 0.01 | | | | (0.49 | ) | | | (0.15 | ) | | | (0.64 | ) | | | 19.55 | | | | 0.02 | | | | 3,715,586 | | | | | 0.50 | | | | 0.51 | | | | 2.46 | | | 10 | |
| Year ended 10/31/17 | | | 18.83 | | | | 0.43 | | | | 1.79 | | | | 2.22 | | | | (0.40 | ) | | | (0.47 | ) | | | (0.87 | ) | | | 20.18 | | | | 11.99 | | | | 3,845,848 | | | | | 0.49 | | | | 0.51 | | | | 2.16 | | | 8 | |
| Year ended 10/31/16 | | | 18.78 | | | | 0.39 | | | | 0.76 | | | | 1.15 | | | | (0.37 | ) | | | (0.73 | ) | | | (1.10 | ) | | | 18.83 | | | | 6.59 | | | | 3,410,571 | | | | | 0.50 | | | | 0.52 | | | | 2.09 | | | 11 | |
| Year ended 10/31/15 | | | 18.17 | | | | 0.36 | | | | 0.95 | | | | 1.31 | | | | (0.34 | ) | | | (0.36 | ) | | | (0.70 | ) | | | 18.78 | | | | 7.41 | | | | 2,385,096 | | | | | 0.53 | | | | 0.54 | | | | 1.92 | | | 11 | |
| Class R6 | | | | | | | | | | | | | | | | | | | | | | | | | | | | | | | | | | | | | | | | | | | | | | | | | | | | | | | | |
| Year ended 10/31/19 | | | 19.55 | | | | 0.55 | | | | 1.90 | | | | 2.45 | | | | (0.59 | ) | | | (0.90 | ) | | | (1.49 | ) | | | 20.51 | | | | 13.44 | | | | 5,197,717 | | | | | 0.41(d) | | | | 0.42(d) | | | | 2.85(d) | | | 5 | |
| Year ended 10/31/18 | | | 20.19 | | | | 0.51 | | | | (0.49 | ) | | | 0.02 | | | | (0.51 | ) | | | (0.15 | ) | | | (0.66 | ) | | | 19.55 | | | | 0.07 | | | | 5,905,494 | | | | | 0.40 | | | | 0.41 | | | | 2.56 | | | 10 | |
| Year ended 10/31/17 | | | 18.83 | | | | 0.45 | | | | 1.79 | | | | 2.24 | | | | (0.41 | ) | | | (0.47 | ) | | | (0.88 | ) | | | 20.19 | | | | 12.15 | | | | 6,344,022 | | | | | 0.39 | | | | 0.41 | | | | 2.26 | | | 8 | |
| Year ended 10/31/16 | | | 18.79 | | | | 0.41 | | | | 0.74 | | | | 1.15 | | | | (0.38 | ) | | | (0.73 | ) | | | (1.11 | ) | | | 18.83 | | | | 6.63 | | | | 2,620,298 | | | | | 0.40 | | | | 0.42 | | | | 2.19 | | | 11 | |
| Year ended 10/31/15 | | | 18.17 | | | | 0.37 | | | | 0.97 | | | | 1.34 | | | | (0.36 | ) | | | (0.36 | ) | | | (0.72 | ) | | | 18.79 | | | | 7.57 | | | | 849,176 | | | | | 0.43 | | | | 0.44 | | | | 2.02 | | | 11 | |
| (a) | Calculated using average shares outstanding. |
| (b) | Includes adjustments in accordance with accounting principles generally accepted in the United States of America and as such, the net asset value for financial reporting purposes and the returns based upon those net asset values may differ from the net asset value and returns for shareholder transactions. Does not include sales charges and is not annualized for periods less than one year, if applicable. |
| (c) | Portfolio turnover is calculated at the fund level and is not annualized for periods less than one year, if applicable. |
| (d) | Ratios are based on average daily net assets (000’s omitted) of $4,926,420, $501,997, $273,111, $2,589,857, $1,790,568, $3,789,662 and $5,347,466 for Class A, Class C, Class R, Class Y, Investor Class, Class R5 and Class R6 shares, respectively. |
| (e) | The total return, ratio of expenses to average net assets and ratio of net investment income to average net assets reflect actual12b-1 fees of 0.18%, 0.20%, 0.20%, 0.21% and 0.23% for the years ended October 31, 2019, 2018, 2017, 2016 and 2015, respectively. |
See accompanying Notes to Financial Statements which are an integral part of the financial statements.
| | |
| 15 | | Invesco Diversified Dividend Fund |
Notes to Financial Statements
October 31, 2019
NOTE 1–Significant Accounting Policies
Invesco Diversified Dividend Fund (the “Fund”) is a series portfolio of AIM Equity Funds (Invesco Equity Funds) (the “Trust”). The Trust is a Delaware statutory trust registered under the Investment Company Act of 1940, as amended (the “1940 Act”), as anopen-end series management investment company authorized to issue an unlimited number of shares of beneficial interest. Information presented in these financial statements pertains only to the Fund. Matters affecting the Fund or each class will be voted on exclusively by the shareholders of the Fund or each class.
The Fund’s investment objective is long-term growth of capital and, secondarily, current income.
The Fund currently consists of seven different classes of shares: Class A, Class C, Class R, Class Y, Investor Class, Class R5 and Class R6. Class Y and Investor Class shares are available only to certain investors. Class A shares are sold with afront-end sales charge unless certain waiver criteria are met. Under certain circumstances, load waived shares may be subject to contingent deferred sales charges (“CDSC”). Class C shares are sold with a CDSC. Class R, Class Y, Investor Class, Class R5 and Class R6 shares are sold at net asset value. Class C shares held for ten years after purchase are eligible for automatic conversion into Class A shares of the same Fund (the “Conversion Feature”). The automatic conversion pursuant to the Conversion Feature will generally occur at the end of the month following the tenth anniversary after a purchase of Class C shares.
The Fund is an investment company and accordingly follows the investment company accounting and reporting guidance in accordance with Financial Accounting Standards Board Accounting Standards Codification Topic 946,Financial Services – Investment Companies.
The following is a summary of the significant accounting policies followed by the Fund in the preparation of its financial statements.
| A. | Security Valuations- Securities, including restricted securities, are valued according to the following policy. |
A security listed or traded on an exchange (except convertible securities) is valued at its last sales price or official closing price as of the close of the customary trading session on the exchange where the security is principally traded, or lacking any sales or official closing price on a particular day, the security may be valued at the closing bid price on that day. Securities traded in theover-the-counter market are valued based on prices furnished by independent pricing services or market makers. When such securities are valued by an independent pricing service they may be considered fair valued. Futures contracts are valued at the final settlement price set by an exchange on which they are principally traded. Listed options are valued at the mean between the last bid and asked prices from the exchange on which they are principally traded. Options not listed on an exchange are valued by an independent source at the mean between the last bid and asked prices. For purposes of determining net asset value (“NAV”) per share, futures and option contracts generally are valued 15 minutes after the close of the customary trading session of the New York Stock Exchange (“NYSE”).
Investments inopen-end andclosed-end registered investment companies that do not trade on an exchange are valued at theend-of-day net asset value per share. Investments inopen-end andclosed-end registered investment companies that trade on an exchange are valued at the last sales price or official closing price as of the close of the customary trading session on the exchange where the security is principally traded.
Debt obligations (including convertible securities) and unlisted equities are fair valued using an evaluated quote provided by an independent pricing service. Evaluated quotes provided by the pricing service may be determined without exclusive reliance on quoted prices, and may reflect appropriate factors such asinstitution-size trading in similar groups of securities, developments related to specific securities, dividend rate (for unlisted equities), yield (for debt obligations), quality, type of issue, coupon rate (for debt obligations), maturity (for debt obligations), individual trading characteristics and other market data. Pricing services generally value debt obligations assuming orderly transactions of institutional round lot size, but a fund may hold or transact in the same securities in smaller, odd lot sizes. Odd lots often trade at lower prices than institutional round lots. Debt obligations are subject to interest rate and credit risks. In addition, all debt obligations involve some risk of default with respect to interest and/or principal payments.
Foreign securities’ (including foreign exchange contracts) prices are converted into U.S. dollar amounts using the applicable exchange rates as of the close of the NYSE. If market quotations are available and reliable for foreign exchange-traded equity securities, the securities will be valued at the market quotations. Because trading hours for certain foreign securities end before the close of the NYSE, closing market quotations may become unreliable. If between the time trading ends on a particular security and the close of the customary trading session on the NYSE, events occur that the investment adviser determines are significant and make the closing price unreliable, the Fund may fair value the security. If the event is likely to have affected the closing price of the security, the security will be valued at fair value in good faith using procedures approved by the Board of Trustees. Adjustments to closing prices to reflect fair value may also be based on a screening process of an independent pricing service to indicate the degree of certainty, based on historical data, that the closing price in the principal market where a foreign security trades is not the current value as of the close of the NYSE. Foreign securities’ prices meeting the approved degree of certainty that the price is not reflective of current value will be priced at the indication of fair value from the independent pricing service. Multiple factors may be considered by the independent pricing service in determining adjustments to reflect fair value and may include information relating to sector indices, American Depositary Receipts and domestic and foreign index futures. Foreign securities may have additional risks including exchange rate changes, potential for sharply devalued currencies and high inflation, political and economic upheaval, the relative lack of issuer information, relatively low market liquidity and the potential lack of strict financial and accounting controls and standards.
Securities for which market prices are not provided by any of the above methods may be valued based upon quotes furnished by independent sources. The last bid price may be used to value equity securities. The mean between the last bid and asked prices is used to value debt obligations, including corporate loans.
Securities for which market quotations are not readily available or became unreliable are valued at fair value as determined in good faith by or under the supervision of the Trust’s officers following procedures approved by the Board of Trustees. Issuer specific events, market trends, bid/asked quotes of brokers and information providers and other market data may be reviewed in the course of making a good faith determination of a security’s fair value.
The Fund may invest in securities that are subject to interest rate risk, meaning the risk that the prices will generally fall as interest rates rise and, conversely, the prices will generally rise as interest rates fall. Specific securities differ in their sensitivity to changes in interest rates depending on their individual characteristics. Changes in interest rates may result in increased market volatility, which may affect the value and/or liquidity of certain Fund investments.
| | |
| 16 | | Invesco Diversified Dividend Fund |
Valuations change in response to many factors including the historical and prospective earnings of the issuer, the value of the issuer’s assets, general economic conditions, interest rates, investor perceptions and market liquidity. Because of the inherent uncertainties of valuation, the values reflected in the financial statements may materially differ from the value received upon actual sale of those investments.
| B. | Securities Transactions and Investment Income– Securities transactions are accounted for on a trade date basis. Realized gains or losses on sales are computed on the basis of specific identification of the securities sold. Interest income (net of withholding tax, if any) is recorded on the accrual basis from settlement date. Dividend income (net of withholding tax, if any) is recorded on theex-dividend date. |
The Fund may periodically participate in litigation related to Fund investments. As such, the Fund may receive proceeds from litigation settlements. Any proceeds received are included in the Statement of Operations as realized gain (loss) for investments no longer held and as unrealized gain (loss) for investments still held.
Brokerage commissions and mark ups are considered transaction costs and are recorded as an increase to the cost basis of securities purchased and/or a reduction of proceeds on a sale of securities. Such transaction costs are included in the determination of net realized and unrealized gain (loss) from investment securities reported in the Statement of Operations and the Statement of Changes in Net Assets and the net realized and unrealized gains (losses) on securities per share in the Financial Highlights. Transaction costs are included in the calculation of the Fund’s net asset value and, accordingly, they reduce the Fund’s total returns. These transaction costs are not considered operating expenses and are not reflected in net investment income reported in the Statement of Operations and the Statement of Changes in Net Assets, or the net investment income per share and the ratios of expenses and net investment income reported in the Financial Highlights, nor are they limited by any expense limitation arrangements between the Fund and the investment adviser.
The Fund allocates income and realized and unrealized capital gains and losses to a class based on the relative net assets of each class.
| C. | Country Determination– For the purposes of making investment selection decisions and presentation in the Schedule of Investments, the investment adviser may determine the country in which an issuer is located and/or credit risk exposure based on various factors. These factors include the laws of the country under which the issuer is organized, where the issuer maintains a principal office, the country in which the issuer derives 50% or more of its total revenues and the country that has the primary market for the issuer’s securities, as well as other criteria. Among the other criteria that may be evaluated for making this determination are the country in which the issuer maintains 50% or more of its assets, the type of security, financial guarantees and enhancements, the nature of the collateral and the sponsor organization. Country of issuer and/or credit risk exposure has been determined to be the United States of America, unless otherwise noted. |
| D. | Distributions– Distributions from net investment income, if any, are declared and paid quarterly and are recorded on theex-dividend date. Distributions from net realized capital gain, if any, are generally declared and paid annually and recorded on theex-dividend date. The Fund may elect to treat a portion of the proceeds from redemptions as distributions for federal income tax purposes. |
| E. | Federal Income Taxes –The Fund intends to comply with the requirements of Subchapter M of the Internal Revenue Code of 1986, as amended (the “Internal Revenue Code”), necessary to qualify as a regulated investment company and to distribute substantially all of the Fund’s taxable earnings to shareholders. As such, the Fund will not be subject to federal income taxes on otherwise taxable income (including net realized capital gain) that is distributed to shareholders. Therefore, no provision for federal income taxes is recorded in the financial statements. |
The Fund recognizes the tax benefits of uncertain tax positions only when the position is more likely than not to be sustained. Management has analyzed the Fund’s uncertain tax positions and concluded that no liability for unrecognized tax benefits should be recorded related to uncertain tax positions. Management is not aware of any tax positions for which it is reasonably possible that the total amounts of unrecognized tax benefits will change materially in the next 12 months.
The Fund files tax returns in the U.S. Federal jurisdiction and certain other jurisdictions. Generally, the Fund is subject to examinations by such taxing authorities for up to three years after the filing of the return for the tax period.
| F. | Expenses –Fees provided for under the Rule12b-1 plan of a particular class of the Fund are charged to the operations of such class. Transfer agency fees and expenses and other shareholder recordkeeping fees and expenses attributable to Class R5 and Class R6 are allocated to each share class based on relative net assets.Sub-accounting fees attributable to Class R5 are charged to the operations of the class. Transfer agency fees and expenses and other shareholder recordkeeping fees and expenses relating to all other classes are allocated among those classes based on relative net assets. All other expenses are allocated among the classes based on relative net assets. |
| G. | Accounting Estimates –The preparation of financial statements in conformity with accounting principles generally accepted in the United States of America (“GAAP”) requires management to make estimates and assumptions that affect the reported amounts of assets and liabilities at the date of the financial statements and the reported amounts of revenues and expenses during the reporting period including estimates and assumptions related to taxation. Actual results could differ from those estimates by a significant amount. In addition, the Fund monitors for material events or transactions that may occur or become known after theperiod-end date and before the date the financial statements are released to print. |
| H. | Indemnifications– Under the Trust’s organizational documents, each Trustee, officer, employee or other agent of the Trust is indemnified against certain liabilities that may arise out of the performance of their duties to the Fund. Additionally, in the normal course of business, the Fund enters into contracts, including the Fund’s servicing agreements, that contain a variety of indemnification clauses. The Fund’s maximum exposure under these arrangements is unknown as this would involve future claims that may be made against the Fund that have not yet occurred. The risk of material loss as a result of such indemnification claims is considered remote. |
| I. | Foreign Currency Translations– Foreign currency is valued at the close of the NYSE based on quotations posted by banks and major currency dealers. Portfolio securities and other assets and liabilities denominated in foreign currencies are translated into U.S. dollar amounts at the date of valuation. Purchases and sales of portfolio securities (net of foreign taxes withheld on disposition) and income items denominated in foreign currencies are translated into U.S. dollar amounts on the respective dates of such transactions. The Fund does not separately account for the portion of the results of operations resulting from changes in foreign exchange rates on investments and the fluctuations arising from changes in market prices of securities held. The combined results of changes in foreign exchange rates and the fluctuation of market prices on investments (net of estimated foreign tax withholding) are included with the net realized and unrealized gain or loss from investments in the Statement of Operations. Reported net realized foreign currency gains or losses arise from (1) sales of foreign currencies, (2) currency gains or losses realized between the trade and settlement dates on securities transactions, and (3) the difference between the amounts of dividends, interest, and foreign withholding taxes recorded on the Fund’s books and the U.S. dollar equivalent of the amounts actually received or paid. Net |
| | |
| 17 | | Invesco Diversified Dividend Fund |
| | unrealized foreign currency gains and losses arise from changes in the fair values of assets and liabilities, other than investments in securities at fiscal period end, resulting from changes in exchange rates. |
The Fund may invest in foreign securities, which may be subject to foreign taxes on income, gains on investments or currency repatriation, a portion of which may be recoverable. Foreign taxes, if any, are recorded based on the tax regulations and rates that exist in the foreign markets in which the Fund invests and are shown in the Statement of Operations.
| J. | Forward Foreign Currency Contracts– The Fund may engage in foreign currency transactions either on a spot (i.e. for prompt delivery and settlement) basis, or through forward foreign currency contracts, to manage or minimize currency or exchange rate risk. |
The Fund may also enter into forward foreign currency contracts for the purchase or sale of a security denominated in a foreign currency in order to “lock in” the U.S. dollar price of that security, or the Fund may also enter into forward foreign currency contracts that do not provide for physical settlement of the two currencies, but instead are settled by a single cash payment calculated as the difference between the agreed upon exchange rate and the spot rate at settlement based upon an agreed upon notional amount(non-deliverable forwards). The Fund will set aside liquid assets in an amount equal to the dailymark-to-market obligation for forward foreign currency contracts.
A forward foreign currency contract is an obligation between two parties (“Counterparties”) to purchase or sell a specific currency for an agreed-upon price at a future date. The use of forward foreign currency contracts does not eliminate fluctuations in the price of the underlying securities the Fund owns or intends to acquire but establishes a rate of exchange in advance. Fluctuations in the value of these contracts are measured by the difference in the contract date and reporting date exchange rates and are recorded as unrealized appreciation (depreciation) until the contracts are closed. When the contracts are closed, realized gains (losses) are recorded. Realized and unrealized gains (losses) on the contracts are included in the Statement of Operations. The primary risks associated with forward foreign currency contracts include failure of the Counterparty to meet the terms of the contract and the value of the foreign currency changing unfavorably. These risks may be in excess of the amounts reflected in the Statement of Assets and Liabilities.
NOTE 2–Advisory Fees and Other Fees Paid to Affiliates
The Trust has entered into a master investment advisory agreement with Invesco Advisers, Inc. (the “Adviser” or “Invesco”). Under the terms of the investment advisory agreement, the Fund accrues daily and pays monthly an advisory fee to the Adviser based on the annual rate of the Fund’s average daily net assets as follows:
| | | | |
| Average Daily Net Assets | | Rate | |
| |
| First $ 350 million | | | 0.600% | |
| |
Next $350 million | | | 0.550% | |
| |
Next $1.3 billion | | | 0.500% | |
| |
Next $2 billion | | | 0.450% | |
| |
Next $2 billion | | | 0.400% | |
| |
Next $2 billion | | | 0.375% | |
| |
Over $8 billion | | | 0.350% | |
| |
For the year ended October 31, 2019, the effective advisory fee rate incurred by the Fund was 0.39%.
Under the terms of a mastersub-advisory agreement between the Adviser and each of Invesco Asset Management Deutschland GmbH, Invesco Asset Management Limited, Invesco Asset Management (Japan) Limited, Invesco Hong Kong Limited, Invesco Senior Secured Management, Inc. and Invesco Canada Ltd. (collectively, the “AffiliatedSub-Advisers”) the Adviser, not the Fund, will pay 40% of the fees paid to the Adviser to any such AffiliatedSub-Adviser(s) that provide(s) discretionary investment management services to the Fund based on the percentage of assets allocated to such AffiliatedSub-Adviser(s).
The Adviser has contractually agreed, through at least June 30, 2020, to waive advisory fees and/or reimburse expenses of all shares to the extent necessary to limit total annual fund operating expenses after fee waiver and/or expense reimbursement (excluding certain items discussed below) of Class A, Class C, Class R, Class Y, Investor Class, Class R5 and Class R6 shares to 2.00%, 2.75%, 2.25%, 1.75%, 2.00%, 1.75% and 1.75%, respectively, of average daily net assets (the “expense limits”). In determining the Adviser’s obligation to waive advisory fees and/or reimburse expenses, the following expenses are not taken into account, and could cause the total annual fund operating expenses after fee waiver and/or expense reimbursement to exceed the numbers reflected above: (1) interest; (2) taxes; (3) dividend expense on short sales; (4) extraordinary ornon-routine items, including litigation expenses; and (5) expenses that the Fund has incurred but did not actually pay because of an expense offset arrangement. Unless Invesco continues the fee waiver agreement, it will terminate on June 30, 2020. During its term, the fee waiver agreement cannot be terminated or amended to increase the expense limits or reduce the advisory fee waiver without approval of the Board of Trustees. The Adviser did not waive fees and/or reimburse expenses during the period under these expense limits.
The Adviser has contractually agreed, through at least June 30, 2021, to waive the advisory fee payable by the Fund in an amount equal to 100% of the net advisory fees the Adviser receives from the affiliated money market funds on investments by the Fund of uninvested cash in such affiliated money market funds.
For the year ended October 31, 2019, the Adviser waived advisory fees of $1,140,044.
The Trust has entered into a master administrative services agreement with Invesco pursuant to which the Fund has agreed to pay Invesco for certain administrative costs incurred in providing accounting services to the Fund. For the year ended October 31, 2019, expenses incurred under the agreement are shown in the Statement of Operations asAdministrative services fees. Invesco has entered into asub-administration agreement whereby State Street Bank and Trust Company (“SSB”) serves as fund accountant and provides certain administrative services to the Fund. Pursuant to a custody agreement with the Trust on behalf of the Fund, SSB also serves as the Fund’s custodian.
The Trust has entered into a transfer agency and service agreement with Invesco Investment Services, Inc. (“IIS”) pursuant to which the Fund has agreed to pay IIS a fee for providing transfer agency and shareholder services to the Fund and reimburse IIS for certain expenses incurred by IIS in the course of providing such services. IIS may make payments to intermediaries that provide omnibus account services,sub-accounting services and/or networking services. All fees payable by IIS to intermediaries that provide omnibus account services orsub-accounting services are charged back to
| | |
| 18 | | Invesco Diversified Dividend Fund |
the Fund, subject to certain limitations approved by the Trust’s Board of Trustees. For the year ended October 31, 2019, expenses incurred under the agreement are shown in the Statement of Operations asTransfer agent fees.
The Trust has entered into master distribution agreements with Invesco Distributors, Inc. (“IDI”) to serve as the distributor for the Class A, Class C, Class R, Class Y, Investor Class, Class R5 and Class R6 shares of the Fund. The Trust has adopted plans pursuant to Rule12b-1 under the 1940 Act with respect to the Fund’s Class A, Class C, Class R and Investor Class shares (collectively, the “Plans”). The Fund, pursuant to the Plans, pays IDI compensation at the annual rate of 0.25% of the Fund’s average daily net assets of Class A shares, 1.00% of the average daily net assets of Class C shares and 0.50% of the average daily net assets of Class R shares. The Fund, pursuant to the Investor Class Plan, reimburses IDI for its allocated share of expenses incurred pursuant to the Investor Class Plan for the period, up to a maximum annual rate of 0.25% of the average daily net assets of Investor Class shares. The fees are accrued daily and paid monthly. Of the Plan payments, up to 0.25% of the average daily net assets of each class of shares may be paid to furnish continuing personal shareholder services to customers who purchase and own shares of such classes. Any amounts not paid as a service fee under the Plans would constitute an asset-based sales charge. Rules of the Financial Industry Regulatory Authority (“FINRA”) impose a cap on the total sales charges, including asset-based sales charges, that may be paid by any class of shares of the Fund. For the year ended October 31, 2019, expenses incurred under the Plans are shown in the Statement of Operations asDistribution fees.
Front-end sales commissions and CDSC (collectively, the “sales charges”) are not recorded as expenses of the Fund.Front-end sales commissions are deducted from proceeds from the sales of Fund shares prior to investment in Class A shares of the Fund. CDSC are deducted from redemption proceeds prior to remittance to the shareholder. During the year ended October 31, 2019, IDI advised the Fund that IDI retained $598,103 infront-end sales commissions from the sale of Class A shares and $23,183 and $26,212 from Class A and Class C shares, respectively, for CDSC imposed upon redemptions by shareholders.
For the year ended October 31, 2019, the Fund incurred $37,559 in brokerage commissions with Invesco Capital Markets, Inc., an affiliate of the Adviser and IDI, for portfolio transactions executed on behalf of the Fund.
Certain officers and trustees of the Trust are officers and directors of the Adviser, IIS and/or IDI.
NOTE 3–Additional Valuation Information
GAAP defines fair value as the price that would be received to sell an asset or paid to transfer a liability in an orderly transaction between market participants at the measurement date, under current market conditions. GAAP establishes a hierarchy that prioritizes the inputs to valuation methods, giving the highest priority to readily available unadjusted quoted prices in an active market for identical assets (Level 1) and the lowest priority to significant unobservable inputs (Level 3), generally when market prices are not readily available or are unreliable. Based on the valuation inputs, the securities or other investments are tiered into one of three levels. Changes in valuation methods may result in transfers in or out of an investment’s assigned level:
| | |
| Level 1 - | | Prices are determined using quoted prices in an active market for identical assets. |
| Level 2 - | | Prices are determined using other significant observable inputs. Observable inputs are inputs that other market participants may use in pricing a security. These may include quoted prices for similar securities, interest rates, prepayment speeds, credit risk, yield curves, loss severities, default rates, discount rates, volatilities and others. |
| Level 3 - | | Prices are determined using significant unobservable inputs. In situations where quoted prices or observable inputs are unavailable (for example, when there is little or no market activity for an investment at the end of the period), unobservable inputs may be used. Unobservable inputs reflect the Fund’s own assumptions about the factors market participants would use in determining fair value of the securities or instruments and would be based on the best available information. |
The following is a summary of the tiered valuation input levels, as of October 31, 2019. The level assigned to the securities valuations may not be an indication of the risk or liquidity associated with investing in those securities. Because of the inherent uncertainties of valuation, the values reflected in the financial statements may materially differ from the value received upon actual sale of those investments.
| | | | | | | | | | | | | | | | |
| | | Level 1 | | | Level 2 | | | Level 3 | | Total | |
| |
| Investments in Securities | | | | | | | | | | | | | | | | |
| |
Common Stocks & Other Equity Interests | | | $14,961,624,975 | | | | $3,180,960,250 | | | | $– | | | | $18,142,585,225 | |
| |
Money Market Funds | | | 1,013,855,096 | | | | – | | | | – | | | | 1,013,855,096 | |
| |
| Total Investments in Securities | | | 15,975,480,071 | | | | 3,180,960,250 | | | | – | | | | 19,156,440,321 | |
| |
| | | | |
| Other Investments - Liabilities* | | | | | | | | | | | | | | | | |
| |
Forward Foreign Currency Contracts | | | – | | | | (2,239,669 | ) | | | – | | | | (2,239,669 | ) |
| |
Total Investments | | | $15,975,480,071 | | | | $3,178,720,581 | | | | $– | | | | $19,154,200,652 | |
| |
| * | Unrealized appreciation (depreciation). |
NOTE 4–Derivative Investments
The Fund may enter into an International Swaps and Derivatives Association Master Agreement (“ISDA Master Agreement”) under which a fund may trade OTC derivatives. An OTC transaction entered into under an ISDA Master Agreement typically involves a collateral posting arrangement, payment netting provisions andclose-out netting provisions. These netting provisions allow for reduction of credit risk through netting of contractual obligations. The enforceability of the netting provisions of the ISDA Master Agreement depends on the governing law of the ISDA Master Agreement, among other factors.
For financial reporting purposes, the Fund does not offset OTC derivative assets or liabilities that are subject to ISDA Master Agreements in the Statement of Assets and Liabilities.
| | |
| 19 | | Invesco Diversified Dividend Fund |
Value of Derivative Investments atPeriod-End
The table below summarizes the value of the Fund’s derivative investments, detailed by primary risk exposure, held as of October 31, 2019:
| | | | |
| | | Value | |
| Derivative Liabilities | | Currency Risk | |
| |
| Unrealized depreciation on forward foreign currency contracts outstanding | | $ | (2,239,669 | ) |
| |
Derivatives not subject to master netting agreements | | | - | |
| |
Total Derivative Liabilities subject to master netting agreements | | $ | (2,239,669 | ) |
| |
Offsetting Assets and Liabilities
The table below reflects the Fund’s exposure to Counterparties subject to either an ISDA Master Agreement or other agreement for OTC derivative transactions as of October 31, 2019.
| | | | | | | | | | | | | | | | | | |
| | | Financial
Derivative
Assets | | Financial
Derivative
Liabilities | | | | Collateral
(Received)/Pledged | | | |
| Counterparty | | Forward Foreign Currency Contracts | | Forward Foreign Currency Contracts | | Net Value of
Derivatives | | Non-Cash | | Cash | | Net Amount | |
| |
| Goldman Sachs International | | $- | | | $(1,080,005 | ) | | $ | (1,080,005 | ) | | $- | | $- | | $ | (1,080,005 | ) |
| |
| JPMorgan Chase Bank, N.A. | | - | | | (1,159,664 | ) | | | (1,159,664 | ) | | - | | - | | | (1,159,664 | ) |
| |
Total | | $- | | | $(2,239,669 | ) | | $ | (2,239,669 | ) | | $- | | $- | | $ | (2,239,669 | ) |
| |
Effect of Derivative Investments for the year ended October 31, 2019
The table below summarizes the gains (losses) on derivative investments, detailed by primary risk exposure, recognized in earnings during the period:
| | | | |
| | | Location of Gain (Loss) on
Statement of Operations |
| | | Currency Risk |
| Realized Gain: | | | | |
Forward foreign currency contracts | | | $ 59,596,564 | |
Change in Net Unrealized Appreciation (Depreciation): | | | | |
Forward foreign currency contracts | | | (22,671,407) | |
| Total | | | $ 36,925,157 | |
The table below summarizes the average notional value of derivatives held during the period.
| | | | |
| | | Forward Foreign Currency Contracts | |
| Average notional value | | | $904,787,436 | |
NOTE 5–Expense Offset Arrangement(s)
The expense offset arrangement is comprised of transfer agency credits which result from balances in demand deposit accounts used by the transfer agent for clearing shareholder transactions. For the year ended October 31, 2019, the Fund received credits from this arrangement, which resulted in the reduction of the Fund’s total expenses of $47,963.
NOTE 6–Trustees’ and Officers’ Fees and Benefits
Trustees’ and Officers’ Fees and Benefits include amounts accrued by the Fund to pay remuneration to certain Trustees and Officers of the Fund. Trustees have the option to defer compensation payable by the Fund, and Trustees’ and Officers’Fees and Benefits also include amounts accrued by the Fund to fund such deferred compensation amounts. Those Trustees who defer compensation have the option to select various Invesco Funds in which their deferral accounts shall be deemed to be invested. Finally, certain current Trustees were eligible to participate in a retirement plan that provided for benefits to be paid upon retirement to Trustees over a period of time based on the number of years of service. The Fund may have certain former Trustees who also participate in a retirement plan and receive benefits under such plan.Trustees’ and Officers’ Fees and Benefits include amounts accrued by the Fund to fund such retirement benefits. Obligations under the deferred compensation and retirement plans represent unsecured claims against the general assets of the Fund.
NOTE 7–Cash Balances
The Fund is permitted to temporarily carry a negative or overdrawn balance in its account with SSB, the custodian bank. Such balances, if any atperiod-end, are shown in the Statement of Assets and Liabilities under the payable captionAmount due custodian. To compensate the custodian bank for such overdrafts, the overdrawn Fund may either (1) leave funds as a compensating balance in the account so the custodian bank can be
| | |
| 20 | | Invesco Diversified Dividend Fund |
compensated by earning the additional interest; or (2) compensate by paying the custodian bank at a rate agreed upon by the custodian bank and Invesco, not to exceed the contractually agreed upon rate.
NOTE 8–Distributions to Shareholders and Tax Components of Net Assets
Tax Character of Distributions to Shareholders Paid During the Fiscal Years Ended October 31, 2019 and 2018
| | | | | | | | |
| | | 2019 | | | 2018 | |
| Ordinary income | | $ | 536,231,450 | | | $ | 535,039,424 | |
| Long-term capital gain | | | 900,748,198 | | | | 171,096,919 | |
| Total distributions | | $ | 1,436,979,648 | | | $ | 706,136,343 | |
Tax Components of Net Assets atPeriod-End:
| | | | |
| | | 2019 | |
| |
| Undistributed ordinary income | | $ | 95,976,882 | |
| |
| Undistributed long-term capital gain | | | 501,737,937 | |
| |
| Net unrealized appreciation – investments | | | 4,616,817,373 | |
| |
| Net unrealized appreciation (depreciation) – foreign currencies | | | (42,530 | ) |
| |
| Temporary book/tax differences | | | (850,126 | ) |
| |
| Shares of beneficial interest | | | 13,964,676,024 | |
| |
| Total net assets | | $ | 19,178,315,560 | |
| |
The difference between book-basis andtax-basis unrealized appreciation (depreciation) is due to differences in the timing of recognition of gains and losses on investments for tax and book purposes. The Fund’s net unrealized appreciation difference is attributable primarily to wash sales and forward foreign currency contracts.
The temporary book/tax differences are a result of timing differences between book and tax recognition of income and/or expenses. The Fund’s temporary book/tax differences are the result of the trustee deferral of compensation and retirement plan benefits.
Capital loss carryforward is calculated and reported as of a specific date. Results of transactions and other activity after that date may affect the amount of capital loss carryforward actually available for the Fund to utilize. Capital losses generated in years beginning after December 22, 2010 can be carried forward for an unlimited period, whereas previous losses expire in eight tax years. Capital losses with an expiration period may not be used to offset capital gains until all net capital losses without an expiration date have been utilized. Capital loss carryforwards with no expiration date will retain their character as either short-term or long-term capital losses instead of as short-term capital losses as under prior law.
The ability to utilize capital loss carryforwards in the future may be limited under the Internal Revenue Code and related regulations based on the results of future transactions.
The Fund does not have a capital loss carryforward as of October 31, 2019.
On December 28, 2018, a total of 4,427,853 Class R6 shares of the Fund valued at $76,911,804 were redeemed by significant shareholders and settled through aredemption-in-kind transaction, of which $4,821,258 consisted of cash, which resulted in a realized gain (loss) of $(7,680,540) to the Fund for book purposes. From a federal income tax perspective, the realized gains (losses) are not recognized.
NOTE 9–Investment Transactions
The aggregate amount of investment securities (other than short-term securities, U.S. Treasury obligations and money market funds, if any) purchased and sold by the Fund during the year ended October 31, 2019 was $908,968,610 and $3,508,348,303, respectively. Cost of investments, including any derivatives, on a tax basis includes the adjustments for financial reporting purposes as of the most recently completed federal income tax reportingperiod-end.
| | | | |
| Unrealized Appreciation (Depreciation) of Investments on a Tax Basis | |
| |
Aggregate unrealized appreciation of investments | | $ | 5,105,382,676 | |
| |
Aggregate unrealized (depreciation) of investments | | | (488,565,303 | ) |
| |
Net unrealized appreciation of investments | | $ | 4,616,817,373 | |
| |
| |
Cost of investments for tax purposes is $14,537,383,279. | | | | |
NOTE 10–Reclassification of Permanent Differences
Primarily as a result of differing book/tax treatment of foreign currency transactions and real estate investments distributions, on October 31, 2019, undistributed net investment income was decreased by $8,244,768 and undistributed net realized gain was increased by $8,244,768. This reclassification had no effect on the net assets or the distributable earnings of the Fund.
| | |
| 21 | | Invesco Diversified Dividend Fund |
NOTE 11–Share Information
| | | | | | | | | | | | | | | | |
| | | | | | Summary of Share Activity | | | | |
| |
| | | Years ended October 31, | |
| | | 2019(a) | | | 2018 | |
| | | Shares | | | Amount | | | Shares | | | Amount | |
| |
| Sold: | | | | | | | | | | | | | | | | |
Class A | | | 24,412,210 | | | $ | 471,277,278 | | | | 28,924,893 | | | $ | 580,423,086 | |
| |
Class B(b) | | | - | | | | - | | | | 6,148 | | | | 124,354 | |
| |
Class C | | | 2,727,373 | | | | 51,664,464 | | | | 3,686,590 | | | | 73,250,992 | |
| |
Class R | | | 1,907,144 | | | | 37,104,995 | | | | 3,552,739 | | | | 71,570,802 | |
| |
Class Y | | | 37,070,082 | | | | 715,412,888 | | | | 46,011,505 | | | | 929,419,492 | |
| |
Investor Class | | | 1,818,691 | | | | 35,336,910 | | | | 2,089,174 | | | | 41,892,838 | |
| |
Class R5 | | | 37,625,648 | | | | 708,074,585 | | | | 48,399,623 | | | | 956,945,773 | |
| |
Class R6 | | | 37,737,549 | | | | 731,949,356 | | | | 92,419,916 | | | | 1,862,795,671 | |
| |
| | | | |
| Issued as reinvestment of dividends: | | | | | | | | | | | | | | | | |
Class A | | | 17,742,073 | | | | 328,402,028 | | | | 7,738,483 | | | | 155,261,455 | |
| |
Class B(b) | | | - | | | | - | | | | 4,758 | | | | 95,535 | |
| |
Class C | | | 1,908,252 | | | | 34,544,670 | | | | 765,384 | | | | 15,214,465 | |
| |
Class R | | | 1,081,709 | | | | 20,020,083 | | | | 458,168 | | | | 9,229,628 | |
| |
Class Y | | | 8,761,820 | | | | 162,216,487 | | | | 4,846,794 | | | | 97,341,228 | |
| |
Investor Class | | | 6,497,701 | | | | 120,231,365 | | | | 2,694,174 | | | | 54,011,105 | |
| |
Class R5 | | | 14,369,271 | | | | 266,851,133 | | | | 6,097,457 | | | | 122,210,853 | |
| |
Class R6 | | | 22,753,159 | | | | 421,270,905 | | | | 10,519,733 | | | | 210,727,661 | |
| |
| | | | |
| Conversion of Class B shares to Class A shares:(c) | | | | | | | | | | | | | | | | |
Class A | | | - | | | | - | | | | 335,663 | | | | 7,082,493 | |
| |
Class B | | | - | | | | - | | | | (340,970 | ) | | | (7,082,493 | ) |
| |
| | | | |
| Automatic conversion of Class C shares to Class A shares: | | | | | | | | | | | | | | | | |
Class A | | | 7,037,711 | | | | 130,466,106 | | | | - | | | | - | |
| |
Class C | | | (7,131,106 | ) | | | (130,466,106 | ) | | | - | | | | - | |
| |
| | | | |
| Reacquired: | | | | | | | | | | | | | | | | |
Class A | | | (60,283,484 | ) | | | (1,162,970,285 | ) | | | (81,056,684 | ) | | | (1,627,034,684 | ) |
| |
Class B(b) | | | - | | | | - | | | | (125,801 | ) | | | (2,562,986 | ) |
| |
Class C | | | (8,137,934 | ) | | | (153,622,580 | ) | | | (13,749,672 | ) | | | (272,044,668 | ) |
| |
Class R | | | (6,176,732 | ) | | | (119,872,549 | ) | | | (6,109,297 | ) | | | (123,283,727 | ) |
| |
Class Y | | | (67,108,430 | ) | | | (1,291,527,902 | ) | | | (117,286,030 | ) | | | (2,354,644,663 | ) |
| |
Investor Class | | | (12,572,298 | ) | | | (243,537,449 | ) | | | (16,686,410 | ) | | | (336,055,762 | ) |
| |
Class R5 | | | (51,119,158 | ) | | | (982,362,823 | ) | | | (54,991,310 | ) | | | (1,109,045,307 | ) |
| |
Class R6 | | | (109,076,580 | ) | | | (2,098,076,334 | ) | | | (115,191,624 | ) | | | (2,292,502,142 | ) |
| |
Net increase (decrease) in share activity | | | (98,155,329 | ) | | $ | (1,947,612,775 | ) | | | (146,986,596 | ) | | $ | (2,936,659,001 | ) |
| |
| (a) | There are entities that are record owners of more than 5% of the outstanding shares of the Fund and in the aggregate own 46% of the outstanding shares of the Fund. IDI has an agreement with these entities to sell Fund shares. The Fund, Invesco and/or Invesco affiliates may make payments to these entities, which are considered to be related to the Fund, for providing services to the Fund, Invesco and/or Invesco affiliates including but not limited to services such as securities brokerage, distribution, third party record keeping and account servicing. The Fund has no knowledge as to whether all or any portion of the shares owned of record by these entities are also owned beneficially. |
| (b) | Class B shares activity for the period November 1, 2017 through January 26, 2018 (date of conversion). |
| (c) | Effective as of the close of business January 26, 2018, all outstanding Class B shares were converted to Class A shares. |
| | |
| 22 | | Invesco Diversified Dividend Fund |
Report of Independent Registered Public Accounting Firm
To the Board of Trustees of AIM Equity Funds (Invesco Equity Funds) and Shareholders of Invesco Diversified Dividend Fund
Opinion on the Financial Statements
We have audited the accompanying statement of assets and liabilities, including the schedule of investments, of Invesco Diversified Dividend Fund (one of the funds constituting AIM Equity Funds (Invesco Equity Funds), referred to hereafter as the “Fund”) as of October 31, 2019, the related statement of operations for the year ended October 31, 2019, the statement of changes in net assets for each of the two years in the period ended October 31, 2019, including the related notes, and the financial highlights for each of the five years in the period ended October 31, 2019 (collectively referred to as the “financial statements”). In our opinion, the financial statements present fairly, in all material respects, the financial position of the Fund as of October 31, 2019, the results of its operations for the year then ended, the changes in its net assets for each of the two years in the period ended October 31, 2019 and the financial highlights for each of the five years in the period ended October 31, 2019 in conformity with accounting principles generally accepted in the United States of America.
Basis for Opinion
These financial statements are the responsibility of the Fund’s management. Our responsibility is to express an opinion on the Fund’s financial statements based on our audits. We are a public accounting firm registered with the Public Company Accounting Oversight Board (United States) (PCAOB) and are required to be independent with respect to the Fund in accordance with the U.S. federal securities laws and the applicable rules and regulations of the Securities and Exchange Commission and the PCAOB.
We conducted our audits of these financial statements in accordance with the standards of the PCAOB. Those standards require that we plan and perform the audit to obtain reasonable assurance about whether the financial statements are free of material misstatement, whether due to error or fraud.
Our audits included performing procedures to assess the risks of material misstatement of the financial statements, whether due to error or fraud, and performing procedures that respond to those risks. Such procedures included examining, on a test basis, evidence regarding the amounts and disclosures in the financial statements. Our audits also included evaluating the accounting principles used and significant estimates made by management, as well as evaluating the overall presentation of the financial statements. Our procedures included confirmation of securities owned as of October 31, 2019 by correspondence with the custodian, transfer agent and brokers; when replies were not received from brokers, we performed other auditing procedures. We believe that our audits provide a reasonable basis for our opinion.
/s/ PricewaterhouseCoopers LLP
Houston, Texas
December 23, 2019
We have served as the auditor of one or more of the investment companies in the Invesco group of investment companies since at least 1995. We have not been able to determine the specific year we began serving as auditor.
| | |
| 23 | | Invesco Diversified Dividend Fund |
Calculating your ongoing Fund expenses
Example
As a shareholder of the Fund, you incur two types of costs: (1) transaction costs, which may include sales charges (loads) on purchase payments or contingent deferred sales charges on redemptions, if any; and (2) ongoing costs, including management fees, distribution and/or service(12b-1) fees, and other Fund expenses. This example is intended to help you understand your ongoing costs (in dollars) of investing in the Fund and to compare these costs with ongoing costs of investing in other mutual funds. The example is based on an investment of $1,000 invested at the beginning of the period and held for the entire period May 1, 2019 through October 31, 2019.
Actual expenses
The table below provides information about actual account values and actual expenses. You may use the information in this table, together with the amount you invested, to estimate the expenses that you paid over the period. Simply divide your account value by $1,000 (for example, an $8,600 account value divided by $1,000 = 8.6), then multiply the result by the number in the table under the heading entitled “Actual Expenses Paid During Period” to estimate the expenses you paid on your account during this period.
Hypothetical example for comparison purposes
The table below also provides information about hypothetical account values and hypothetical expenses based on the Fund’s actual expense ratio and an assumed rate of return of 5% per year before expenses, which is not the Fund’s actual return.
The hypothetical account values and expenses may not be used to estimate the actual ending account balance or expenses you paid for the period. You may use this information to compare the ongoing costs of investing in the Fund and other funds. To do so, compare this 5% hypothetical example with the 5% hypothetical examples that appear in the shareholder reports of the other funds.
Please note that the expenses shown in the table are meant to highlight your ongoing costs only and do not reflect any transaction costs, such as sales charges (loads) on purchase payments or contingent deferred sales charges on redemptions, if any. Therefore, the hypothetical information is useful in comparing ongoing costs only, and will not help you determine the relative total costs of owning different funds. In addition, if these transaction costs were included, your costs would have been higher.
| | | | | | | | | | | | | | | | | | | | | | | | | | | | | | |
| | | | | ACTUAL | | HYPOTHETICAL (5% annual return before expenses) | | Annualized Expense Ratio |
| | Beginning Account Value (05/01/19) | | Ending Account Value (10/31/19)1 | | Expenses Paid During Period2 | | Ending Account Value (10/31/19) | | Expenses Paid During Period2 |
| Class A | | | $ | 1,000.00 | | | | $ | 1,049.50 | | | | $ | 4.18 | | | | $ | 1,021.12 | | | | $ | 4.13 | | | 0.81% | |
| Class C | | | | 1,000.00 | | | | | 1,045.70 | | | | | 8.04 | | | | | 1,017.34 | | | | | 7.93 | | | 1.56 | |
| Class R | | | | 1,000.00 | | | | | 1,048.60 | | | | | 5.47 | | | | | 1,019.86 | | | | | 5.40 | | | 1.06 | |
| Class Y | | | | 1,000.00 | | | | | 1,051.20 | | | | | 2.90 | | | | | 1,022.38 | | | | | 2.85 | | | 0.56 | |
| Investor Class | | | | 1,000.00 | | | | | 1,049.80 | | | | | 3.82 | | | | | 1,021.48 | | | | | 3.77 | | | 0.74 | |
| Class R5 | | | | 1,000.00 | | | | | 1,051.00 | | | | | 2.64 | | | | | 1,022.63 | | | | | 2.60 | | | 0.51 | |
| Class R6 | | | | 1,000.00 | | | | | 1,052.00 | | | | | 2.17 | | | | | 1,023.09 | | | | | 2.14 | | | 0.42 | |
| 1 | The actual ending account value is based on the actual total return of the Fund for the period May 1, 2019 through October 31, 2019, after actual expenses and will differ from the hypothetical ending account value which is based on the Fund’s expense ratio and a hypothetical annual return of 5% before expenses. |
| 2 | Expenses are equal to the Fund’s annualized expense ratio as indicated above multiplied by the average account value over the period, multiplied by 184/365 to reflect the most recent fiscal half year. |
| | |
| 24 | | Invesco Diversified Dividend Fund |
Approval of Investment Advisory andSub-Advisory Contracts
At meetings held on June 10, 2019, the Board of Trustees (the Board or the Trustees) of AIM Equity Funds (Invesco Equity Funds) as a whole, and the independent Trustees, who comprise over 75% of the Board, voting separately, approved the continuance of the Invesco Diversified Dividend Fund’s (the Fund) Master Investment Advisory Agreement with Invesco Advisers, Inc. (Invesco Advisers and the investment advisory agreement) and the Master IntergroupSub-Advisory Contract for Mutual Funds with Invesco Asset Management Deutschland GmbH, Invesco Asset Management Limited, Invesco Asset Management (Japan) Limited, Invesco Hong Kong Limited, Invesco Senior Secured Management, Inc. and Invesco Canada Ltd. (collectively, the AffiliatedSub-Advisers and thesub-advisory contracts) for another year, effective July 1, 2019. After evaluating the factors discussed below, among others, the Board approved the renewal of the Fund’s investment advisory agreement and thesub-advisory contracts and determined that the compensation payable by the Fund to Invesco Advisers and by Invesco Advisers to the AffiliatedSub-Advisers is fair and reasonable.
The Board’s Evaluation Process
The Board’s Investments Committee has established threeSub-Committees, which meet throughout the year to review the performance of funds advised by Invesco Advisers (the Invesco Funds). As part of a regularly scheduled basis ofin-person Board meetings, theSub-Committees meet with portfolio managers for their assigned Invesco Funds and other members of management to review detailed information about investment performance and portfolio attributes of these funds. The Board took into account evaluations and reports that it received from the Investments Committee andSub-Committees, as well as the information provided to such committees and the Board throughout the year, in considering whether to approve each Invesco Fund’s investment advisory agreement andsub-advisory contracts.
As part of the contract renewal process, the Board reviews and considers information provided in response to detailed requests for information submitted to management by the independent Trustees with assistance from legal counsel to the independent Trustees. The Board receives comparative investment performance and fee data regarding the Invesco Funds prepared by Invesco Advisers and Broadridge Financial Solutions, Inc. (Broadridge), an independent mutual fund data provider. The Board also receives an independent written evaluation from the Senior Officer, an officer of the Invesco Funds who reports directly to the independent Trustees. The Senior Officer’s evaluation is prepared as part of his
responsibility to manage the process by which the Invesco Funds’ proposed management fees are negotiated during the annual contract renewal process to ensure they are negotiated in a manner that is at arms’ length and reasonable. In addition to meetings with Invesco Advisers and fund counsel throughout the year, the independent Trustees also discuss the continuance of the investment advisory agreement andsub-advisory contracts in separate sessions with the Senior Officer and with independent legal counsel.
The discussion below is a summary of the Senior Officer’s independent written evaluation with respect to the Fund’s investment advisory agreement, as well as a discussion of the material factors and related conclusions that formed the basis for the Board’s approval of the Fund’s investment advisory agreement andsub-advisory contracts. The Trustees’ review and conclusions are based on the comprehensive consideration of all information presented to them during the course of the year and in prior years and are not the result of any single determinative factor. Moreover, one Trustee may have weighed a particular piece of information or factor differently than another Trustee. This information is current as of June 10, 2019.
Factors and Conclusions and Summary of Independent Written Fee Evaluation
| A. | Nature, Extent and Quality of Services Provided by Invesco Advisers and the AffiliatedSub-Advisers |
The Board reviewed the nature, extent and quality of the advisory services provided to the Fund by Invesco Advisers under the Fund’s investment advisory agreement, and the credentials and experience of the officers and employees of Invesco Advisers who provide these services, including the Fund’s portfolio manager(s). The Board’s review included consideration of Invesco Advisers’ investment process oversight and structure, credit analysis and investment risk management. The Board also considerednon-advisory services that Invesco Advisers and its affiliates provide to the Invesco Funds such as various back office support functions, third party oversight, internal audit, valuation, portfolio trading and legal and compliance. The Board also received and reviewed information about Invesco Advisers’ role as administrator of the Invesco Funds’ liquidity risk management program. The Board also reviewed and considered the benefits to shareholders of investing in a fund that is part of the Invesco family of funds under the umbrella of Invesco Ltd., Invesco Advisers’ parent company, and noted Invesco Ltd.’s depth and experience in conducting an investment management business, as well as its
commitment of financial and other resources to such business. The Board reviewed and considered information about the resources that Invesco Advisers intends to continue to commit to managing the Invesco family of funds following Invesco Ltd.’s acquisition of OppenheimerFunds, Inc. and its subsidiaries. The Board concluded that the nature, extent and quality of the services provided to the Fund by Invesco Advisers are appropriate and satisfactory.
The Board reviewed the services that may be provided by the AffiliatedSub-Advisers under thesub-advisory contracts and the credentials and experience of the officers and employees of the AffiliatedSub-Advisers who provide these services. The Board noted the AffiliatedSub-Advisers’ expertise with respect to certain asset classes and that the AffiliatedSub-Advisers have offices and personnel that are located in financial centers around the world. As a result, the Board noted that the AffiliatedSub-Advisers can provide research and investment analysis on the markets and economies of various countries in which the Fund may invest, make recommendations regarding securities and assist with security trades. The Board concluded that thesub-advisory contracts may benefit the Fund and its shareholders by permitting Invesco Advisers to use the resources and talents of the AffiliatedSub-Advisers in managing the Fund. The Board concluded that the nature, extent and quality of the services that may be provided by the AffiliatedSub-Advisers are appropriate and satisfactory.
| B. | Fund Investment Performance |
The Board considered Fund investment performance as a relevant factor in considering whether to approve the investment advisory agreement. The Board did not view Fund investment performance as a relevant factor in considering whether to approve thesub-advisory contracts for the Fund, as no AffiliatedSub-Adviser currently manages assets of the Fund.
The Board compared the Fund’s investment performance over multiple time periods ending December 31, 2018 to the performance of funds in the Broadridge performance universe and against the LipperLarge-Cap Value Funds Index. The Board noted that performance of Class A shares of the Fund was in the second quintile of its performance universe for the one year period, the fifth quintile for the three year period and the third quintile for the five year period (the first quintile being the best performing funds and the fifth quintile being the worst performing funds). The Board noted that performance of Class A shares of the Fund was reasonably comparable to the performance of
| | |
| 25 | | Invesco Diversified Dividend Fund |
the Index for the one year period and below the performance of the Index for the three and five year periods. The Board noted that the Fund’s overweight exposure to certain defensive sectors and underweight exposure to certain cyclically-oriented sectors negatively impacted performance. The Trustees also reviewed more recent Fund performance and this review did not change their conclusions.
| C. | Advisory andSub-Advisory Fees and Fund Expenses |
The Board compared the Fund’s contractual management fee rate to the contractual management fee rates of funds in the Fund’s Broadridge expense group. The Board noted that the contractual management fee rate for Class A shares of the Fund was below the median contractual management fee rate of funds in its expense group. The Board noted that the term “contractual management fee” for funds in the expense group may include both advisory and certainnon-portfolio management administrative services fees, but that Broadridge does not provide information on a fund by fund basis as to what is included. The Board also reviewed the methodology used by Broadridge in providing expense group information, which includes using each fund’s contractual management fee schedule (including any applicable breakpoints) as reported in the most recent prospectus or statement of additional information for each fund in the expense group. The Board also considered comparative information regarding the Fund’s total expense ratio and its various components.
The Board noted that Invesco Advisers has contractually agreed to waive fees and/or limit expenses of the Fund for the term disclosed in the Fund’s registration statement in an amount necessary to limit total annual operating expenses to a specified percentage of average daily net assets for each class of the Fund.
The Board also considered the fees charged by Invesco Advisers and the AffiliatedSub-Advisers to other similarly managed client accounts. The Board noted that Invesco Advisers or the AffiliatedSub-Advisers may charge lower fees to large institutional clients. Invesco Advisers reviewed with the Board differences in the scope of services it provides to the Invesco Funds relative to certain other types of client accounts, including management of cash flows as a result of redemptions and purchases, necessary infrastructure such as officers, office space, technology, legal and distribution, oversight of service providers, costs and business risks associated with launching new funds and sponsoring and maintaining the product line, preparation of annual registration statement updates and financial information and compliance with federal and state laws and regulations.
The Board also compared the Fund’s effective advisory fee rate (the advisory fee rate after
advisory fee waivers and before other expense limitations/waivers) to the effective advisory fee rates of other similarly managed third-party mutual funds advised orsub-advised by Invesco Advisers and its affiliates, based on asset balances as of December 31, 2018.
The Board also considered the services that may be provided by the AffiliatedSub-Advisers pursuant to thesub-advisory contracts, as well as the fees payable by Invesco Advisers to the AffiliatedSub-Advisers pursuant to thesub-advisory contracts.
| D. | Economies of Scale and Breakpoints |
The Board considered the extent to which there may be economies of scale in the provision of advisory services to the Fund. The Board considered Invesco’s reinvestment in its business, including investments in business infrastructure and cybersecurity. The Board also considered that the Fund benefits from economies of scale through contractual breakpoints in the Fund’s advisory fee schedule, which generally operate to reduce the Fund’s expense ratio as it grows in size. The Board noted that the Fund shares directly in economies of scale through lower fees charged by third party service providers based on the combined size of the Invesco Funds. The Board noted that the Fund may also benefit from economies of scale through initial fee setting, fee waivers and expense reimbursements.
| E. | Profitability and Financial Resources |
The Board reviewed information from Invesco Advisers concerning the costs of the advisory and other services that Invesco Advisers and its affiliates provide to the Fund and the Invesco Funds and the profitability of Invesco Advisers and its affiliates in providing these services. The Board considered the methodology used for calculating profitability and noted the periodic review of such methodology by an independent consultant. The Board noted that Invesco Advisers continues to operate at a net profit from services Invesco Advisers and its affiliates provide to the Invesco Funds and the Fund. The Board did not deem the level of profits realized by Invesco Advisers and its affiliates from providing services to the Fund to be excessive given the nature, extent and quality of the services provided. The Board received information from Invesco Advisers demonstrating that Invesco Advisers and the AffiliatedSub-Advisers are financially sound and have the resources necessary to perform their obligations under the investment advisory agreement andsub-advisory contracts.
| F. | Collateral Benefits to Invesco Advisers and its Affiliates |
The Board considered various other benefits received by Invesco Advisers and its affiliates from the relationship with the Fund, including the fees received for providing administrative, transfer agency and distribution services to the Fund. The Board considered comparative information regarding fees charged for these services, including information provided by
Broadridge and other independent sources. The Board considered the performance of Invesco Advisers and its affiliates in providing these services and the organizational structure employed to provide these services. The Board also considered that these services are provided to the Fund pursuant to written contracts that are reviewed and approved on an annual basis by the Board; and that the services are required for the operation of the Fund.
The Board considered the benefits realized by Invesco Advisers and the AffiliatedSub-Advisers as a result of portfolio brokerage transactions executed through “soft dollar” arrangements. The Board noted that soft dollar arrangements may result in the Fund bearing costs to purchase research that may be used by Invesco Advisers or the AffiliatedSub-Advisers with other clients and may reduce Invesco Advisers’ or the AffiliatedSub-Advisers’ expenses. The Board also considered that it receives periodic reports from Invesco representing that these arrangements are consistent with regulatory requirements. The Board did not deem the soft dollar arrangements to be inappropriate.
The Board considered that the Fund’s uninvested cash and cash collateral from any securities lending arrangements may be invested in money market funds advised by Invesco Advisers pursuant to procedures approved by the Board. The Board considered information regarding the returns of the affiliated money market funds relative to comparable overnight investments, as well as the costs to the Fund of such investments. The Board noted that Invesco Advisers receives advisory fees from these affiliated money market funds attributable to such investments, although Invesco Advisers has contractually agreed to waive through varying periods the advisory fees payable by the Invesco Funds with respect to certain investments in the affiliated money market funds. The waiver is in an amount equal to 100% of the net advisory fee Invesco Advisers receives from the affiliated money market funds with respect to the Fund’s investment in the affiliated money market funds of uninvested cash, but not cash collateral. The Board concluded that the amount of advisory fees received by Invesco Advisers from the Fund’s investment of cash collateral from any securities lending arrangements in the affiliated money market funds is fair and reasonable.
The Board also considered that an affiliated broker may receive commissions for executing certain trades for the Fund. Invesco Advisers and the AffiliatedSub-Advisers may use the affiliated broker to, among other things, control order routing and minimize information leakage, and the Board was advised that such trades are executed in compliance with rules under the federal securities laws and consistent with best execution obligations.
| | |
| 26 | | Invesco Diversified Dividend Fund |
Tax Information
Form1099-DIV, Form1042-S and other year-end tax information provide shareholders with actual calendar year amounts that should be included in their tax returns. Shareholders should consult their tax advisers.
The following distribution information is being provided as required by the Internal Revenue Code or to meet a specific state’s requirement.
The Fund designates the following amounts or, if subsequently determined to be different, the maximum amount allowable for its fiscal year ended October 31, 2019:
| | | | | | |
| | Federal and State Income Tax | | | | |
| | Long-Term Capital Gain Distributions | | $ | 900,748,198 | |
| | Qualified Dividend Income* | | | 100.00 | % |
| | Corporate Dividends Received Deduction* | | | 88.95 | % |
| | U.S. Treasury Obligations* | | | 0.00 | % |
| | * | The above percentages are based on ordinary income dividends paid to shareholders during the Fund’s fiscal year. |
| | |
| 27 | | Invesco Diversified Dividend Fund |
Trustees and Officers
The address of each trustee and officer is AIM Equity Funds (Invesco Equity Funds) (the “Trust”), 11 Greenway Plaza, Suite 1000, Houston, Texas 77046-1173. The trustees serve for the life of the Trust, subject to their earlier death, incapacitation, resignation, retirement or removal as more specifically provided in the Trust’s organizational documents. Each officer serves for a one year term or until their successors are elected and qualified. Column two below includes length of time served with predecessor entities, if any.
| | | | | | | | |
Name, Year of Birth and
Position(s) Held with the Trust | | Trustee
and/or Officer Since | | Principal Occupation(s) During Past 5 Years | | Number of
Funds in
Fund Complex
Overseen by
Trustee | | Other Directorship(s)
Held by Trustee
During Past 5 Years |
| Interested Persons | | | | | | | | |
| Martin L. Flanagan1– 1960 Trustee and Vice Chair | | 2007 | | Executive Director, Chief Executive Officer and President, Invesco Ltd. (ultimate parent of Invesco and a global investment management firm); Trustee and Vice Chair, The Invesco Funds; Vice Chair, Investment Company Institute; and Member of Executive Board, SMU Cox School of Business | | 229 | | None |
| | | | | Formerly: Advisor to the Board, Invesco Advisers, Inc. (formerly known as Invesco Institutional (N.A.), Inc.); Chairman and Chief Executive Officer, Invesco Advisers, Inc. (registered investment adviser); Director, Chairman, Chief Executive Officer and President, Invesco Holding Company (US), Inc. (formerly IVZ Inc.) (holding company), Invesco Group Services, Inc. (service provider) and Invesco North American Holdings, Inc. (holding company); Director, Chief Executive Officer and President, Invesco Holding Company Limited (parent of Invesco and a global investment management firm); Director, Invesco Ltd.; Chairman, Investment Company Institute and President,Co-Chief Executive Officer,Co-President, Chief Operating Officer and Chief Financial Officer, Franklin Resources, Inc. (global investment management organization) | | | | |
| Philip A. Taylor2– 1954 Trustee | | 2006 | | Vice Chair, Invesco Ltd.; Trustee, The Invesco Funds Formerly: Director, Invesco Canada Ltd. (formerly known as Invesco Trimark Ltd./Invesco Trimark Ltèe) (registered investment adviser and registered transfer agent); Head of the Americas and Senior Managing Director, Invesco Ltd.; Director, Invesco Advisers, Inc. (formerly known as Invesco Institutional (N.A.), Inc.) (registered investment adviser); Director and Chairman, Invesco Investment Services, Inc. (formerly known as Invesco AIM Investment Services, Inc.) (registered transfer agent); Chief Executive Officer, Invesco Corporate Class Inc. (corporate mutual fund company); Chairman and Chief Executive Officer, Invesco Canada Ltd. (formerly known as Invesco Trimark Ltd./Invesco Trimark Ltèe) (registered investment adviser and registered transfer agent); Senior Vice President, The Invesco Funds; Director, Invesco Investment Advisers LLC (formerly known as Van Kampen Asset Management); Director, Chairman, Chief Executive Officer and President, Invesco Management Group, Inc. (formerly known as Invesco AIM Management Group, Inc.) (financial services holding company);Co-Chairman,Co-President andCo-Chief Executive Officer, Invesco Advisers, Inc. (formerly known as Invesco Institutional (N.A.), Inc.) (registered investment adviser); Director, Chief Executive Officer and President, Van Kampen Exchange Corp; President and Principal Executive Officer, The Invesco Funds (other than AIM Treasurer’s Series Trust (Invesco Treasurer’s Series Trust), Short-Term Investments Trust and Invesco Management Trust); Executive Vice President, The Invesco Funds (AIM Treasurer’s Series Trust (Invesco Treasurer’s Series Trust), Short-Term Investments Trust and Invesco Management Trust only); Director and President, INVESCO Funds Group, Inc. (registered investment adviser and registered transfer agent); Director and Chairman, IVZ Distributors, Inc. (formerly known as INVESCO Distributors, Inc.) (registered broker dealer); Director, President and Chairman, Invesco Inc. (holding company), Invesco Canada Holdings Inc. (holding company), Trimark Investments Ltd./Placements Trimark Ltèe and Invesco Financial Services Ltd/Services Financiers Invesco Ltèe; Chief Executive Officer, Invesco Canada Fund Inc. (corporate mutual fund company); Director and Chairman, Van Kampen Investor Services Inc.; Director, Chief Executive Officer and President, 1371 Preferred Inc. (holding company) and Van Kampen Investments Inc.; Director and President, AIM GP Canada Inc. (general partner for limited partnerships) and Van Kampen Advisors, Inc.; Director and Chief Executive Officer, Invesco Trimark Dealer Inc. (registered broker dealer); Director, Invesco Distributors, Inc. (formerly known as Invesco AIM Distributors, Inc.) (registered broker dealer); Manager, Invesco Capital Management LLC; Director, Chief Executive Officer and President, Invesco Advisers, Inc.; Director, Chairman, Chief Executive Officer and President, Invesco AIM Capital Management, Inc.; President, Invesco Trimark Dealer Inc. and Invesco Trimark Ltd./Invesco Trimark Ltèe; Director and President, AIM Trimark Corporate Class Inc. and AIM Trimark Canada Fund Inc.; Senior Managing Director, Invesco Holding Company Limited; Director and Chairman, Fund Management Company (former registered broker dealer); President and Principal Executive Officer, The Invesco Funds (AIM Treasurer’s Series Trust (Invesco Treasurer’s Series Trust), and Short-Term Investments Trust only); President, AIM Trimark Global Fund Inc. and AIM Trimark Canada Fund Inc. | | 229 | | None |
| 1 | Mr. Flanagan is considered an interested person (within the meaning of Section 2(a)(19) of the 1940 Act) of the Trust because he is an officer of the Adviser to the Trust, and an officer and a director of Invesco Ltd., ultimate parent of the Adviser. |
| 2 | Mr. Taylor is considered an interested person (within the meaning of Section 2(a)(19) of the 1940 Act) of the Trust because he is an officer and a director of the Adviser. |
| | |
| T-1 | | Invesco Diversified Dividend Fund |
Trustees and Officers–(continued)
| | | | | | | | |
Name, Year of Birth and Position(s) Held with the Trust | | Trustee
and/or Officer Since | | Principal Occupation(s) During Past 5 Years | | Number of
Funds in Fund Complex
Overseen by
Trustee | | Other Directorship(s)
Held by Trustee
During Past 5 Years |
| Independent Trustees | | | | | | | | |
| Bruce L. Crockett – 1944 Trustee and Chair | | 1993 | | Chairman, Crockett Technologies Associates (technology consulting company) Formerly: Director, Captaris (unified messaging provider); Director, President and Chief Executive Officer, COMSAT Corporation; Chairman, Board of Governors of INTELSAT (international communications company); ACE Limited (insurance company); Independent Directors Council and Investment Company Institute: Member of the Audit Committee, Investment Company Institute; Member of the Executive Committee and Chair of the Governance Committee, Independent Directors Council | | 229 | | Director and Chairman of the Audit Committee, ALPS (Attorneys Liability Protection Society) (insurance company); Director and Member of the Audit Committee and Compensation Committee, Ferroglobe PLC (metallurgical company) |
David C. Arch – 1945 Trustee | | 2010 | | Chairman of Blistex Inc. (consumer health care products manufacturer); Member, World Presidents’ Organization | | 229 | | Board member of the Illinois Manufacturers’ Association |
Beth Ann Brown – 1968 Trustee | | 2019 | | Independent Consultant Formerly: Head of Intermediary Distribution, Managing Director, Strategic Relations, Managing Director, Head of National Accounts, Senior Vice President, National Account Manager and Senior Vice President, Key Account Manager, Columbia Management Investment Advisers LLC; Vice President, Key Account Manager, Liberty Funds Distributor, Inc.; and Trustee of certain Oppenheimer Funds | | 229 | | Director, Board of Directors of Caron Engineering Inc.; President and Director, Acton Shapleigh Youth Conservation Corps (non - profit); and Vice President and Director of Grahamtastic Connection (non-profit) |
Jack M. Fields – 1952 Trustee | | 1997 | | Chief Executive Officer, Twenty First Century Group, Inc. (government affairs company); and Chairman, Discovery Learning Alliance(non-profit) Formerly: Owner and Chief Executive Officer, Dos Angeles Ranch L.P. (cattle, hunting, corporate entertainment); Director, Insperity, Inc. (formerly known as Administaff) (human resources provider); Chief Executive Officer, Texana Timber LP (sustainable forestry company); Director of Cross Timbers Quail Research Ranch(non-profit); and member of the U.S. House of Representatives | | 229 | | None |
| Cynthia Hostetler – 1962 Trustee | | 2017 | | Non-Executive Director and Trustee of a number of public and private business corporations Formerly: Director, Aberdeen Investment Funds (4 portfolios); Head of Investment Funds and Private Equity, Overseas Private Investment Corporation; President, First Manhattan Bancorporation, Inc.; Attorney, Simpson Thacher & Bartlett LLP | | 229 | | Vulcan Materials Company (construction materials company); Trilinc Global Impact Fund; Genesee & Wyoming, Inc. (railroads); Artio Global Investment LLC (mutual fund complex); Edgen Group, Inc. (specialized energy and infrastructure products distributor); Investment Company Institute (professional organization); Independent Directors Council (professional organization) |
| | |
| T-2 | | Invesco Diversified Dividend Fund |
Trustees and Officers–(continued)
| | | | | | | | |
Name, Year of Birth and
Position(s) Held with the Trust | | Trustee
and/or Officer Since | | Principal Occupation(s) During Past 5 Years | | Number of
Funds in Fund Complex
Overseen by
Trustee | | Other Directorship(s)
Held by Trustee
During Past 5 Years |
| Independent Trustees–(continued) | | | | |
Eli Jones – 1961 Trustee | | 2016 | | Professor and Dean, Mays Business School - Texas A&M University Formerly: Professor and Dean, Walton College of Business, University of Arkansas and E.J. Ourso College of Business, Louisiana State University; Director, Arvest Bank | | 229 | | Insperity, Inc. (formerly known as Administaff) (human resources provider) |
| Elizabeth Krentzman – 1959 Trustee | | 2019 | | Formerly: Principal and Chief Regulatory Advisor for Asset Management Services and U.S. Mutual Fund Leader of Deloitte & Touche LLP; General Counsel of the Investment Company Institute (trade association); National Director of the Investment Management Regulatory Consulting Practice, Principal, Director and Senior Manager of Deloitte & Touche LLP; Assistant Director of the Division of Investment Management - Office of Disclosure and Investment Adviser Regulation of the U.S. Securities and Exchange Commission and various positions with the Division of Investment Management - Office of Regulatory Policy of the U.S. Securities and Exchange Commission; Associate at Ropes & Gray LLP; Advisory Board Member of the Securities and Exchange Commission Historical Society; and Trustee of certain Oppenheimer Funds | | 229 | | Trustee of the University of Florida National Board Foundation and Audit Committee Member; Member of the Cartica Funds Board of Directors (private investment funds); Member of the University of Florida Law Center Association, Inc. Board of Trustees and Audit Committee Member |
| Anthony J. LaCava, Jr. – 1956 Trustee | | 2019 | | Formerly: Director and Member of the Audit Committee, Blue Hills Bank (publicly traded financial institution) and Managing Partner, KPMG LLP | | 229 | | Blue Hills Bank; Chairman, Bentley University; Member, Business School Advisory Council; and Nominating Committee KPMG LLP |
| Prema Mathai-Davis – 1950 Trustee | | 1998 | | Retired Co-Owner & Partner of Quantalytics Research, LLC, (a FinTech Investment Research Platform for the Self-Directed Investor) | | 229 | | None |
| Joel W. Motley – 1952 Trustee | | 2019 | | Director of Office of Finance, Federal Home Loan Bank; Member of the Vestry of Trinity Wall Street; Managing Director of Carmona Motley Inc. (privately held financial advisor); Member of the Finance and Budget Committee of the Council on Foreign Relations, Member of the Investment Committee and Board of Human Rights Watch and Member of the Investment Committee and Board of Historic Hudson Valley(non-profit cultural organization) Formerly: Managing Director of Public Capital Advisors, LLC (privately held financial advisor); Managing Director of Carmona Motley Hoffman, Inc. (privately held financial advisor); Trustee of certain Oppenheimer Funds; and Director of Columbia Equity Financial Corp. (privately held financial advisor) | | 229 | | Director of Greenwall Foundation (bioethics research foundation); Member of Board and Investment Committee of The Greenwall Foundation; Director of Southern Africa Legal Services Foundation; Board Member and Investment Committee Member of Pulizer Center for Crisis Reporting(non-profit journalism) |
| Teresa M. Ressel – 1962 Trustee | | 2017 | | Non-executive director and trustee of a number of public and private business corporations Formerly: Chief Financial Officer, Olayan America, The Olayan Group (international investor/commercial/industrial); Chief Executive Officer, UBS Securities LLC; Group Chief Operating Officer, Americas, UBS AG; Assistant Secretary for Management & Budget and CFO, US Department of the Treasury | | 229 | | Atlantic Power Corporation (power generation company); ON Semiconductor Corp. (semiconductor supplier) |
| | |
| T-3 | | Invesco Diversified Dividend Fund |
Trustees and Officers–(continued)
| | | | | | | | |
Name, Year of Birth and
Position(s) Held with the Trust | | Trustee and/or Officer Since | | Principal Occupation(s) During Past 5 Years | | Number of
Funds in Fund Complex
Overseen by
Trustee | | Other Directorship(s) Held by Trustee During Past 5 Years |
| Independent Trustees–(continued) | | | | |
| Ann Barnett Stern – 1957 Trustee | | 2017 | | President and Chief Executive Officer, Houston Endowment Inc. (private philanthropic institution) Formerly: Executive Vice President and General Counsel, Texas Children’s Hospital; Attorney, Beck, Redden and Secrest, LLP; Business Law Instructor, University of St. Thomas; Attorney, Andrews & Kurth LLP | | 229 | | Federal Reserve Bank of Dallas |
| Raymond Stickel, Jr. – 1944 Trustee | | 2005 | | Retired Formerly: Director, Mainstay VP Series Funds, Inc. (25 portfolios); Partner, Deloitte & Touche | | 229 | | None |
| Robert C. Troccoli – 1949 Trustee | | 2016 | | Retired Formerly: Adjunct Professor, University of Denver – Daniels College of Business; Senior Partner, KPMG LLP | | 229 | | None |
| Daniel S. Vandivort –1954 Trustee | | 2019 | | Treasurer, Chairman of the Audit and Finance Committee, and Trustee, Board of Trustees, Huntington Disease Foundation of America; and President, Flyway Advisory Services LLC (consulting and property management) Formerly: Trustee and Governance Chair, of certain Oppenheimer Funds | | 229 | | Chairman and Lead Independent Director, Chairman of the Audit Committee, and Director, Board of Directors, Value Line Funds |
| James D. Vaughn – 1945 Trustee | | 2019 | | Retired Formerly: Managing Partner, Deloitte & Touche LLP; Trustee and Chairman of the Audit Committee, Schroder Funds; Board Member, Mile High United Way, Boys and Girls Clubs, Boy Scouts, Colorado Business Committee for the Arts, Economic Club of Colorado and Metro Denver Network (economic development corporation); and Trustee of certain Oppenheimer Funds | | 229 | | Board member and Chairman of Audit Committee of AMG National Trust Bank; Trustee and Investment Committee member, University of South Dakota Foundation; Board member, Audit Committee Member and past Board Chair, Junior Achievement(non-profit) |
Christopher L. WIlson - 1957 Trustee, Vice Chair and Chair Designate | | 2017 | | Reitred Formerly: Director, TD Asset Management USA Inc. (mutual fund complex) (22 portfolios); Managing Partner, CT2, LLC (investing and consulting firm); President/Chief Executive Officer, Columbia Funds, Bank of America Corporation; President/Chief Executive Officer, CDC IXIS Asset Management Services, Inc.; Principal & Director of Operations, Scudder Funds, Scudder, Stevens & Clark, Inc.; Assistant Vice President, Fidelity Investments | | 229 | | ISO New England, Inc.(non-profit organization managing regional electricity market) |
| | |
| T-4 | | Invesco Diversified Dividend Fund |
Trustees and Officers–(continued)
| | | | | | | | |
Name, Year of Birth and Position(s) Held with the Trust | | Trustee
and/or Officer Since | | Principal Occupation(s) During Past 5 Years | | Number of
Funds in
Fund Complex
Overseen by
Trustee | | Other Directorship(s)
Held by Trustee During Past 5 Years |
| Other Officers | | | | | | | | |
| | | | | |
Sheri Morris – 1964 President, Principal Executive Officer and Treasurer | | 1999 | | Head of Global Fund Services, Invesco Ltd.; President, Principal Executive Officer and Treasurer, The Invesco Funds; Vice President, Invesco Advisers, Inc. (formerly known as Invesco Institutional (N.A.), Inc.) (registered investment adviser); and Vice President, Invesco Exchange-Traded Fund Trust, Invesco Exchange-Traded Fund Trust II, Invesco India Exchange-Traded Fund Trust, Invesco Actively Managed Exchange-Traded Fund Trust, Invesco Actively Managed Exchange-Traded Commodity Fund Trust and Invesco Exchange-Traded Self-Indexed Fund Trust; and Vice President, OppenheimerFunds, Inc. Formerly: Vice President and Principal Financial Officer, The Invesco Funds; Vice President, Invesco AIM Advisers, Inc., Invesco AIM Capital Management, Inc. and Invesco AIM Private Asset Management, Inc.; Assistant Vice President and Assistant Treasurer, The Invesco Funds and Assistant Vice President, Invesco Advisers, Inc., Invesco AIM Capital Management, Inc. and Invesco AIM Private Asset Management, Inc.; and Treasurer, Invesco Exchange-Traded FundTrust, Invesco Exchange-Traded Fund Trust II, Invesco India Exchange-Traded Fund Trust and Invesco Actively Managed Exchange-Traded Fund Trust | | N/A | | N/A |
| | | | | |
Russell C. Burk – 1958 Senior Vice President and Senior Officer | | 2005 | | Senior Vice President and Senior Officer, The Invesco Funds | | N/A | | N/A |
| | | | | |
Jeffrey H. Kupor – 1968 Senior Vice President, Chief Legal Officer and Secretary | | 2018 | | Head of Legal of the Americas, Invesco Ltd.; Senior Vice President and Secretary, Invesco Advisers, Inc. (formerly known as Invesco Institutional (N.A.), Inc.) (registered investment adviser); Senior Vice President and Secretary, Invesco Distributors, Inc. (formerly known as Invesco AIM Distributors, Inc.); Vice President and Secretary, Invesco Investment Services, Inc. (formerly known as Invesco AIM Investment Services, Inc.) Senior Vice President, Chief Legal Officer and Secretary, The Invesco Funds; Secretary and General Counsel, Invesco Investment Advisers LLC (formerly known as Van Kampen Asset Management); Secretary and General Counsel, Invesco Capital Markets, Inc. (formerly known as Van Kampen Funds Inc.) and Chief Legal Officer, Invesco Exchange-Traded Fund Trust, Invesco Exchange-Traded Fund Trust II, Invesco India Exchange-Traded Fund Trust, Invesco Actively Managed Exchange-Traded Fund Trust, Invesco Actively Managed Exchange-Traded Commodity Fund Trust and Invesco Exchange-Traded Self-Indexed Fund Trust; Secretary, Invesco Indexing LLC; Secretary, W.L. Ross & Co., LLC Formerly: Secretary and Vice President, Jemstep, Inc.; Head of Legal, Worldwide Institutional, Invesco Ltd.; Secretary and General Counsel, INVESCO Private Capital Investments, Inc.; Senior Vice President, Secretary and General Counsel, Invesco Management Group, Inc. (formerly known as Invesco AIM Management Group, Inc.); Assistant Secretary, INVESCO Asset Management (Bermuda) Ltd.; Secretary and General Counsel, Invesco Private Capital, Inc.; Assistant Secretary and General Counsel, INVESCO Realty, Inc.; Secretary and General Counsel, Invesco Senior Secured Management, Inc.; and Secretary, Sovereign G./P. Holdings Inc. | | N/A | | N/A |
| | | | | |
Andrew R. Schlossberg – 1974 Senior Vice President | | 2019 | | Head of the Americas and Senior Managing Director, Invesco Ltd.; Director and Senior Vice President, Invesco Advisers, Inc. (formerly known as Invesco Institutional (N.A.), Inc.) (registered investment adviser); Director and Chairman, Invesco Investment Services, Inc. (formerly known as Invesco AIM Investment Services, Inc.) (registered transfer agent); Senior Vice President, The Invesco Funds; Director, Invesco Investment Advisers LLC (formerly known as Van Kampen Asset Management); Director, President and Chairman, Invesco Insurance Agency, Inc. Formerly: Director, Invesco UK Limited; Director and Chief Executive, Invesco Asset Management Limited and Invesco Fund Managers Limited; Assistant Vice President, The Invesco Funds; Senior Vice President, Invesco Advisers, Inc. (formerly known as Invesco Institutional (N.A.), Inc.) (registered investment adviser); Director and Chief Executive, Invesco Administration Services Limited and Invesco Global Investment Funds Limited; Director, Invesco Distributors, Inc.; Head of EMEA, Invesco Ltd.; President, Invesco Actively Managed Exchange-Traded Commodity Fund Trust, Invesco Actively Managed Exchange-Traded Fund Trust, Invesco Exchange-Traded Fund Trust, Invesco Exchange-Traded Fund Trust II and Invesco India Exchange-Traded Fund Trust; Managing Director and Principal Executive Officer, Invesco Capital Management LLC | | N/A | | N/A |
| | |
| T-5 | | Invesco Diversified Dividend Fund |
Trustees and Officers–(continued)
| | | | | | | | |
Name, Year of Birth and Position(s) Held with the Trust | | Trustee
and/or Officer Since | | Principal Occupation(s) During Past 5 Years | | Number of
Funds in
Fund Complex
Overseen by
Trustee | | Other Directorship(s)
Held by Trustee During Past 5 Years |
| Other Officers–(continued) |
| | | | | |
John M. Zerr – 1962 Senior Vice President | | 2006 | | Chief Operating Officer of the Americas; Senior Vice President, Invesco Advisers, Inc. (formerly known as Invesco Institutional (N.A.), Inc.) (registered investment adviser); Senior Vice President, Invesco Distributors, Inc. (formerly known as Invesco AIM Distributors, Inc.); Director and Vice President, Invesco Investment Services, Inc. (formerly known as Invesco AIM Investment Services, Inc.) Senior Vice President, The Invesco Funds; Managing Director, Invesco Capital Management LLC; Director, Invesco Investment Advisers LLC (formerly known as Van Kampen Asset Management); Senior Vice President, Invesco Capital Markets, Inc. (formerly known as Van Kampen Funds Inc.); Manager, Invesco Indexing LLC; Manager, Invesco Specialized Products, LLC; Director and Senior Vice President, Invesco Insurance Agency, Inc.; Member, Invesco Canada Funds Advisory Board; Director, President and Chief Executive Officer, Invesco Corporate Class Inc. (corporate mutual fund company); and Director, Chairman, President and Chief Executive Officer, Invesco Canada Ltd. (formerly known as Invesco Trimark Ltd./Invesco Trimark Ltèe) (registered investment adviser and registered transfer agent) Formerly: Director and Senior Vice President, Invesco Management Group, Inc. (formerly known as Invesco AIM Management Group, Inc.); Secretary and General Counsel, Invesco Management Group, Inc. (formerly known as Invesco AIM Management Group, Inc.); Secretary, Invesco Investment Services, Inc. (formerly known as Invesco AIM Investment Services, Inc.); Chief Legal Officer and Secretary, The Invesco Funds; Secretary and General Counsel, Invesco Investment Advisers LLC (formerly known as Van Kampen Asset Management); Secretary and General Counsel, Invesco Capital Markets, Inc. (formerly known as Van Kampen Funds Inc.); Chief Legal Officer, Invesco Exchange-Traded Fund Trust, Invesco Exchange-Traded Fund Trust II, Invesco India Exchange-Traded Fund Trust, Invesco Actively Managed Exchange-Traded Fund Trust, Invesco Actively Managed Exchange-Traded Commodity Fund Trust and Invesco Exchange-Traded Self-Indexed Fund Trust; Secretary, Invesco Indexing LLC; Director, Secretary, General Counsel and Senior Vice President, Van Kampen Exchange Corp.; Director, Vice President and Secretary, IVZ Distributors, Inc. (formerly known as INVESCO Distributors, Inc.); Director and Vice President, INVESCO Funds Group, Inc.; Director and Vice President, Van Kampen Advisors Inc.; Director, Vice President, Secretary and General Counsel, Van Kampen Investor Services Inc.;Director and Secretary, Invesco Distributors, Inc. (formerly known as Invesco AIM Distributors, Inc.); Director, Senior Vice President, General Counsel and Secretary, Invesco AIM Advisers, Inc. and Van Kampen Investments Inc.; Director, Vice President and Secretary, Fund Management Company; Director, Senior Vice President, Secretary, General Counsel and Vice President, Invesco AIM Capital Management, Inc.; Chief Operating Officer and General Counsel, Liberty Ridge Capital, Inc. (an investment adviser) | | N/A | | N/A |
| | | | | |
Gregory G. McGreevey – 1962 Senior Vice President | | 2012 | | Senior Managing Director, Invesco Ltd.; Director, Chairman, President, and Chief Executive Officer, Invesco Advisers, Inc. (formerly known as Invesco Institutional (N.A.), Inc.) (registered investment adviser); Director, Invesco Mortgage Capital, Inc. and Invesco Senior Secured Management, Inc.; and Senior Vice President, The Invesco Funds; and President, SNW Asset Management Corporation Formerly: Senior Vice President, Invesco Management Group, Inc. and Invesco Advisers, Inc.; Assistant Vice President, The Invesco Funds | | N/A | | N/A |
| | | | | |
Kelli Gallegos – 1970 Vice President, Principal Financial Officer and Assistant Treasurer | | 2008 | | Principal Financial and Accounting Officer – Investments Pool, Invesco Specialized Products, LLC; Vice President, Principal Financial Officer and Assistant Treasurer, The Invesco Funds; Principal Financial and Accounting Officer – Pooled Investments, Invesco Capital Management LLC; Vice President and Treasurer, Invesco Exchange-Traded Fund Trust, Invesco Exchange-Traded Fund Trust II, Invesco India Exchange-Traded Fund Trust, Invesco Actively Managed Exchange-Traded Fund Trust, Invesco Actively Managed Exchange-Traded Commodity Fund Trust and Invesco Exchange-Traded Self-Indexed Fund Trust Formerly: Assistant Treasurer, Invesco Specialized Products, LLC; Assistant Treasurer, Invesco Exchange-Traded Fund Trust, Invesco Exchange-Traded Fund Trust II, Invesco India Exchange-Traded Fund Trust, Invesco Actively Managed Exchange-Traded Fund Trust, Invesco Actively Managed Exchange-Traded Commodity Fund Trust and Invesco Exchange-Traded Self-Indexed Fund Trust; Assistant Treasurer, Invesco Capital Management LLC; Assistant Vice President, The Invesco Funds | | N/A | | N/A |
| | |
| T-6 | | Invesco Diversified Dividend Fund |
Trustees and Officers–(continued)
| | | | | | | | |
Name, Year of Birth and Position(s) Held with the Trust | | Trustee
and/or Officer Since | | Principal Occupation(s) During Past 5 Years | | Number of
Funds in
Fund Complex
Overseen by
Trustee | | Other Directorship(s)
Held by Trustee During Past 5 Years |
| Other Officers–(continued) |
| | | | | |
Crissie M. Wisdom – 1969 Anti-Money Laundering Compliance Officer | | 2013 | | Anti-Money Laundering Compliance Officer, Invesco Advisers, Inc. (formerly known as Invesco Institutional (N.A.), Inc.) (registered investment adviser), Invesco Capital Markets, Inc. (formerly known as Van Kampen Funds Inc.), Invesco Distributors, Inc., Invesco Investment Services, Inc., The Invesco Funds, and Invesco Exchange-Traded Fund Trust, Invesco Exchange-Traded Fund Trust II, Invesco India Exchange-Traded Fund Trust, Invesco Actively Managed Exchange-Traded Fund Trust, Invesco Actively Managed Exchange-Traded Commodity Fund Trust and Invesco Exchange-Traded Self-Indexed Fund Trust; Anti-Money Laundering Compliance Officer and Bank Secrecy Act Officer, INVESCO National Trust Company and Invesco Trust Company; and Fraud Prevention Manager and Controls and Risk Analysis Manager for Invesco Investment Services, Inc. Formerly: Anti-Money Laundering Compliance Officer, Van Kampen Exchange Corp. and Invesco Management Group, Inc. | | N/A | | N/A |
| | | | | |
Robert R. Leveille – 1969 Chief Compliance Officer | | 2016 | | Chief Compliance Officer, Invesco Advisers, Inc. (registered investment adviser); and Chief Compliance Officer, The Invesco Funds Formerly: Chief Compliance Officer, Putnam Investments and the Putnam Funds | | N/A | | N/A |
The Statement of Additional Information of the Trust includes additional information about the Fund’s Trustees and is available upon request, without charge, by calling 1.800.959.4246. Please refer to the Fund’s Statement of Additional Information for information on the Fund’ssub-advisers.
| | | | | | |
| Office of the Fund | | Investment Adviser | | Distributor | | Auditors |
11 Greenway Plaza, Suite 1000 Houston, TX 77046-1173 | | Invesco Advisers, Inc. 1555 Peachtree Street, N.E. Atlanta, GA 30309 | | Invesco Distributors, Inc. 11 Greenway Plaza, Suite 1000 Houston, TX 77046-1173 | | PricewaterhouseCoopers LLP 1000 Louisiana Street, Suite 5800 Houston, TX 77002-5678 |
| | | |
| Counsel to the Fund | | Counsel to the Independent Trustees | | Transfer Agent | | Custodian |
Stradley Ronon Stevens & Young, LLP 2005 Market Street, Suite 2600 Philadelphia, PA 19103-7018 | | Goodwin Procter LLP 901 New York Avenue, N.W. Washington, D.C. 20001 | | Invesco Investment Services, Inc. 11 Greenway Plaza, Suite 1000 Houston, TX 77046-1173 | | State Street Bank and Trust Company 225 Franklin Street Boston, MA 02110-2801 |
| | |
| T-7 | | Invesco Diversified Dividend Fund |
(This page intentionally left blank)

Go paperless with eDelivery
Visit invesco.com/edelivery to enjoy the convenience and security of anytime electronic access to your investment documents.
With eDelivery, you can elect to have any or all of the following materials delivered straight to your inbox to download, save and print from your own computer:
| ∎ | | Fund reports and prospectuses |
Invesco mailing information
Send general correspondence to Invesco Investment Services, Inc., P.O. Box 219078, Kansas City, MO 64121-9078.
Important notice regarding delivery of security holder documents
To reduce Fund expenses, only one copy of most shareholder documents may be mailed to shareholders with multiple accounts at the same address (Householding). Mailing of your shareholder documents may be householded indefinitely unless you instruct us otherwise. If you do not want the mailing of these documents to be combined with those for other members of your household, please contact Invesco Investment Services, Inc. at 800 959 4246 or contact your financial institution. We will begin sending you individual copies for each account within 30 days after receiving your request.
Fund holdings and proxy voting information
The Fund provides a complete list of its holdings four times in each fiscal year, at the quarter-ends. For the second and fourth quarters, the list appears in the Fund’s semiannual and annual reports to shareholders. For the first and third quarters, the Fund files the lists with the Securities and Exchange Commission (SEC) as an exhibit to its reports on FormN-PORT. The most recent list of portfolio holdings is available at invesco.com/completeqtrholdings. Shareholders can also look up the Fund’s FormN-PORT filings on the SEC website, sec.gov. The SEC file numbers for the Fund are shown below.
A description of the policies and procedures that the Fund uses to determine how to vote proxies relating to portfolio securities is available without charge, upon request, from our Client Services department at 800 959 4246, or at invesco.com/ proxyguidelines. The information is also available on the SEC website, sec.gov.
Information regarding how the Fund voted proxies related to its portfolio securities during the most recent 12-month period ended June 30 is available at invesco.com/proxysearch. This information is also available on the SEC website, sec.gov.
| | |
Invesco Advisers, Inc. is an investment adviser; it provides investment advisory services to individual and institutional clients and does not sell securities. Invesco Distributors, Inc. is the US distributor for Invesco Ltd.’s retail mutual funds, exchange-traded funds and institutional money market funds. Both are wholly owned, indirect subsidiaries of Invesco Ltd. | | |
|
| | | | | | |
| SEC file numbers:811-01424 and002-25469 | | Invesco Distributors, Inc. | | DDI-AR-1 | | |
| | | | |
| | |

| | Annual Report to Shareholders | | October 31, 2019 |
| | |
| | Invesco Summit Fund | | |
| | Nasdaq: |
| | A: ASMMX∎ C: CSMMX∎ P: SMMIX∎ S: SMMSX∎ Y: ASMYX∎ R5: SMITX∎ R6: SMISX |

Letters to Shareholders
| | |

Andrew Schlossberg | | Dear Shareholders: This annual report includes information about your Fund, including performance data and a complete list of its investments as of the close of the reporting period. Inside is a discussion of how your Fund was managed and the factors that affected its performance during the reporting period. Despite marked market volatility along the way, most global equity markets produced solid gains for the reporting period. As the reporting period unfolded in the final months of 2018, global equities were reeling from a sharpsell-off. The catalyst for thesell-off was a combination of ongoing trade concerns between the US and China, fears of a global economic slowdown and lower oil prices from a supply glut. Gains posted earlier in 2018 for global equities were erased, while US Treasury bonds, along with government and municipal bonds, rallied as investors fled to “safe haven” assets. |
At the start of 2019, global equity markets rebounded strongly buoyed by more policy from central banks and optimism about a potentialUS-China trade deal. In May,US-China trade concerns and slowing global growth led to a global equitysell-off and rally in US Treasuries. Despite the Maysell-off, domestic equity markets rallied in June in anticipation of a US Federal Reserve (the Fed) interest rate cut and closed the second quarter with modest gains. ContinuedUS-China trade worries and signs of slowing global economic growth left global equity markets largely flat for the third quarter. As the reporting period came to a close in October 2019, a raft of upbeat positive corporate earnings results and a US interest rate cut buoyed domestic equity results with some domestic indices recording record highs.
The Fed, in fact, both raised and lowered the federal funds rate during the reporting period. Given signs of a strong economy, the Fed raised rates in December 2018. In 2019, however, the Fed altered its outlook on further rate hikes leaving rates unchanged for the first half of the year. In July, the Fed lowered interest rates for the first time in 11 years. It again lowered rates in September and once again in October. As the year continues to unfold, we’ll see how the interplay of interest rates, economic data, geopolitics and a host of other factors affect US and overseas equity and fixed income markets.
Investor uncertainty and market volatility, such as we witnessed during the reporting period, are unfortunate facts of life when it comes to investing. That’s why Invesco encourages investors to work with a professional financial adviser who can stress the importance of starting to save and invest early and the importance of adhering to a disciplined investment plan. A financial adviser who knows your unique financial situation, investment goals and risk tolerance can be an invaluable partner as you seek to achieve your financial goals. He or she can offer a long-term perspective when markets are volatile and time-tested advice and guidance when your financial situation or investment goals change.
Visit our website for more information on your investments
Our website, invesco.com/us, offers a wide range of market insights and investment perspectives. On the website, you’ll find detailed information about our funds, including performance, holdings and portfolio manager commentaries. You can access information about your account by completing a simple, secure online registration. To do so, select “Log In” on the right side of the homepage, and then select “Register for Individual Account Access.”
In addition to the resources accessible on our website and through our mobile app, you can obtain timely updates to help you stay informed about the markets and the economy by connecting with Invesco on Twitter, LinkedIn or Facebook. You can access our blog at blog.invesco.us.com. Our goal is to provide you the information you want, when and where you want it.
Finally, I’m pleased to share with you Invesco’s commitment to both the Principles for Responsible Investment and to considering environmental, social and governance issues in our robust investment process. I invite you to learn more at invesco.com/esg.
Have questions?
For questions about your account, contact an Invesco client services representative at 800 959 4246.
All of us at Invesco look forward to serving your investment management needs. Thank you for investing with us.
Sincerely,

Andrew Schlossberg
Head of the Americas,
Senior Managing Director, Invesco Ltd.
| | |

Bruce Crockett | | Dear Shareholders: |
| | Among the many important lessons I’ve learned in more than 40 years in a variety of business endeavors is the value of a trusted advocate. |
| | As independent chair of the Invesco Funds Board, I can assure you that the members of the Board are strong advocates for the interests of investors in Invesco’s mutual funds. We work hard to represent your interests through oversight of the quality of the investment management services your funds receive and other matters important to your investment, including but not limited to: |
| | ∎ Ensuring that Invesco offers a diverse lineup of mutual funds that your financial adviser can use to strive to meet your financial needs as your investment goals change over time. |
| | ∎ Monitoring how the portfolio management teams of the Invesco funds are performing in light of changing economic and market conditions. |
| ∎ | | Assessing each portfolio management team’s investment performance within the context of the investment strategy described in the fund’s prospectus. |
| ∎ | | Monitoring for potential conflicts of interests that may impact the nature of the services that your funds receive. |
We believe one of the most important services we provide our fund shareholders is the annual review of the funds’ advisory andsub-advisory contracts with Invesco Advisers and its affiliates. This review is required by the Investment Company Act of 1940 and focuses on the nature and quality of the services Invesco provides as the adviser to the Invesco funds and the reasonableness of the fees that it charges for those services. Each year, we spend months carefully reviewing information received from Invesco and a variety of independent sources, such as performance and fee data prepared by Lipper, Inc. (a subsidiary of Broadridge Financial Solutions, Inc.), an independent, third-party firm widely recognized as a leader in its field. We also meet with our independent legal counsel and other independent advisers to review and help us assess the information that we have received. Our goal is to assure that you receive quality investment management services for a reasonable fee.
I trust the measures outlined above provide assurance that you have a worthy advocate when it comes to choosing the Invesco Funds.
On behalf of the Board, we look forward to continuing to represent your interests and serving your needs.
Sincerely,

Bruce L. Crockett
Independent Chair
Invesco Funds Board of Trustees
Management’s Discussion of Fund Performance
| | | | |
| Performance summary | | | | |
| For the fiscal year ended October 31, 2019, Class A shares of Invesco Summit Fund (the Fund), at net asset value (NAV), outperformed the Russell 1000 Growth Index, the Fund’s style-specific benchmark. | |
Your Fund’s long-term performance appears later in this report. | |
| Fund vs. Indexes | | | | |
Total returns, October 31, 2018 to October 31, 2019, at net asset value (NAV). Performance shown does not include applicable contingent deferred sales charges (CDSC) orfront-end sales charges, which would have reduced performance. | | | | |
| Class A Shares | | | 17.36 | % |
| Class C Shares | | | 16.43 | |
| Class P Shares | | | 17.55 | |
| Class S Shares | | | 17.44 | |
| Class Y Shares | | | 17.65 | |
| Class R5 Shares | | | 17.63 | |
| Class R6 Shares | | | 17.73 | |
| S&P 500 Index▼(Broad Market Index) | | | 14.33 | |
| Russell 1000 Growth Index▼(Style-Specific Index) | | | 17.10 | |
| LipperMulti-Cap Growth Funds Index¾(Peer Group Index) | | | 15.43 | |
| Source(s):▼RIMES Technologies Corp.;¾Lipper Inc. | | | | |
Market conditions and your Fund
The fiscal year began with noticeable market volatility in the final few months of 2018, which continued throughyear-end, as US equity markets suffered a sharpsell-off due to ongoing trade concerns between the US and China, fears of a global economic slowdown and lower oil prices from a supply glut. Oil prices plummeted from near $64 per barrel in early November 2018 to around $45 per barrel in late December 2018.1 There was a flight to safety, as investors fled to more defensive areas of the markets, such as health care, utilities and US Treasuries. The US Federal Reserve (the Fed) raised interest rates once during the fiscal year in December 2018.2
Following a sharpsell-off during the fourth quarter of 2018, equity markets rebounded in the first quarter of 2019, fueled by optimism about a potentialUS-China trade deal and the Fed’s indication that there would be no interest rate hikes
in 2019, a surprising shift in monetary policy. The Fed’s more accommodative stance provided a supportive environment for equities and fixed income, even as US economic data were mixed and overseas growth appeared to be slowing. Against this backdrop, the S&P 500 Index posted its best first quarter returns since 1998.
Although the S&P 500 Index posted modest gains for the second quarter of 2019, the US stock market experienced increased volatility. After four consecutive months of rising stock markets, the market sold off in May 2019, along with bond yields and oil prices, as investors weighed the impact of the lingering trade war between the US and China, as well as potential tariffs imposed on Mexico. In addition, economic data showed a slowing domestic and global economy.
Key issues that concerned investors in the second quarter of 2019 carried over into the third quarter. TheUS-China
trade conflict worried investors and stifled business investment, even as the Fed cut interest rates by 0.25% in July and again in September 2019.2 This environment, combined with evidence of slowing global economic growth, fueled market volatility in August 2019. The US Treasury yield curve inverted several times, increasing fears of a possible US recession. As a result, August saw increased risk aversion, with investors crowding into asset classes perceived as safe havens, such as US Treasuries and gold. However, the Fed’s accommodative tone provided some support for risk assets.
In October 2019, optimism that phase one of aUS-China trade deal would be completed, a delay in the Brexit agreement until January 2020 and better-than-expected third-quarter corporate earnings results, helped send risk assets higher. During its October meeting, the Fed cut interest rates again by 0.25% based on business investment and exports remaining weak.2 Despite increased market volatility, mostUS-based equity indexes produced modest to strong returns for the fiscal year.
In this market environment, the Fund produced a positive return at NAV and outperformed the Russell 1000 Growth Index, its style-specific benchmark, for the fiscal year. Overall, stock selection contributed to the Fund’s relative returns while market allocation detracted from the Fund’s relative performance. Stock selection in the industrials and information technology (IT) sectors was a key contributor to the Fund’s relative performance. Stock selection in the consumer staples and financials sectors was also beneficial. In contrast, stock selection in and overweight allocations to the energy and consumer discretionary sectors, as well as stock selection in the materials sector detracted from the Fund’s relative performance.
| | |
| Portfolio Composition | | |
| By sector | | % of total net assets |
| Information Technology | | 27.97% |
| Consumer Discretionary | | 19.90 |
| Communication Services | | 19.76 |
| Health Care | | 11.98 |
| Industrials | | 9.77 |
| Financials | | 4.48 |
| Consumer Staples | | 4.01 |
| Other Sectors, Each Less than 2% of Net Assets | | 2.12 |
| Money Market Funds Plus Other Assets Less Liabilities | | 0.01 |
| | | | |
| Top 10 Equity Holdings* | | | | |
| | | % of total net assets | |
1. Amazon.com, Inc. | | | 8.54% | |
2. Alphabet, Inc., Class C | | | 5.87 | |
3. Facebook, Inc., Class A | | | 4.62 | |
4. Mastercard, Inc., Class A | | | 4.23 | |
5. Microsoft Corp. | | | 3.60 | |
6. Apple, Inc. | | | 2.44 | |
7. salesforce.com, inc. | | | 2.43 | |
8. Alibaba Group Holding Ltd., ADR | | | 2.39 | |
9. Lowe’s Cos., Inc. | | | 2.31 | |
10. Visa, Inc., Class A | | | 2.02 | |
| | |
| Total Net Assets | | $2.4 billion |
| Total Number of Holdings* | | 104 |
The Fund’s holdings are subject to change, and there is no assurance that the Fund will continue to hold any particular security.
*Excluding money market fund holdings, if any.
Data presented here are as of October 31, 2019.
The leading individual contributors to Fund performance during the fiscal year includedVisa,FacebookandAmazon.com. Visa contributed to both absolute and relative performance as the company implemented price increases across almost all of its products and reported very positive earnings results despite slowing cross-border volumes. Network economics and competition remained healthy during the fiscal year, and Visa has performed well despite the company’s slight delay in participating in the emerging alternative payments space. Following Visa’s strong performance, we trimmed the Fund’s exposure during the fiscal year.
Social networking company, Facebook, was an overall strong contributor to the Fund’s absolute and relative returns, despite slow-moving performance toward the end of the fiscal year as a result of increased anti-trust scrutiny andslow-to-materialize support for its newly announced Libra cryptocurrency. Although we believed that the Libra cryptocurrency is an interesting long-term option for Facebook, we did not expect it to provide a financial contribution to the company anytime soon. Instead, we believed increasing monetization for areas of Facebook, such as “Stories,” “Watch” and “Messenger,” as well as improving margins from slowing regulatory and privacy costs would be more impactful to the company in the near-term.
During the fiscal year, an overweight allocation to Amazon.com benefited the Fund’s performance on a relative and absolute basis. The company switched fromtwo-day toone-day guaranteed shipping for its Prime subscription service and ramped up its salesforce headcount for Amazon Web Services, its cloud computing service. We viewed these changes as actions that will deepen Amazon.com’s position as the leading eCommerce provider and could drive better-than-expected revenue growth in the future. From a valuation standpoint, we viewed Amazon.com as extremely attractive with upside potential frome-commerce penetration of consumables, food and goods, as well as automobiles.
Individual detractors from the Fund’s performance for the fiscal year includedActivision Blizzard,Take-Two Interactive SoftwareandUnitedHealth Group. Within communication services, an overweight position in video game developers Activision Blizzard andTake-Two Interactive Software detracted from the Fund’s performance on a relative and absolute
basis. While our long-term view on Activision Blizzard has not changed, the company announced slower-than-expected growth for its Destiny franchise due to a delayed launch schedule for its Destiny 2 title, as well as a delay in its Blizzard studio’s launch schedule in the fourth quarter of 2018. Together, these issues were expected to slow the company’s growth over the near-term. We viewed these issues as transitory and continued to hold the stock. Activision Blizzard saw improvement in August 2019 due to strong earnings from its Call of Duty and Hearthstone titles. The stock also gained momentum from key catalysts, such as the launch of Call of Duty for mobile devices in October 2019 and Blizzcon, the company’s annual gaming convention, in November 2019.
Take-Two Interactive Software reported strong results from sales of its Red Dead Redemption 2 title, but gave guidance that suggested slow momentum for the online version. Despite this delay in revenue, we believedTake-Two was well positioned with a strong portfolio of game franchises like Red Dead and Grand Theft Auto, as well as multiple key sports franchises, such as NBA2K and WWE. In general, we are constructive on the video game software industry due to several themes: a strong console cycle; the shift from physical to digital distribution; an increase in mobile phone processing power, which leads to a larger addressable audience for established franchises and game libraries; an increase in viewership for eSports; and the potential for new markets through new peripherals using virtual reality (VR) and augmented reality (AR) interactive experiences.
During the fiscal year, UnitedHealth Group, along with the entire managed health care industry, lagged due to the increased political rhetoric surrounding the “Medicare for All” platform. Also weighing on the stock was a proposal from the Trump administration to eliminate rebates from government drug plans as part of an effort to lower prescription drug prices, which was later dropped. We believed the discussion of opposing viewpoints would continue at least through the primary election season and, as a result, reduced the Fund’s position in UnitedHealth Group. We continue to have high confidence in the company in the long term. UnitedHealth Group features a vertically integrated business model that is driven by its Optum division, which brings artificial intelligence, technology and a growing provider network
to drive lower costs of care and better outcomes to its customers and patients.
At the close of the fiscal year, the Fund had overweight exposures to the communication services, consumer discretionary and financials sectors relative to the Fund’s style-specific index. Within consumer discretionary, we focused on companies with technology-driven share shift capabilities, demographics and changing behaviors. The Fund’s position within the financials sector remained a small portion overall and was focused primarily on alternative asset managers that we believed had potential for sales growth and profit expansion. Relative to the Fund’s style-specific index, the Fund had underweight exposures to the IT, health care and real estate sectors. The Fund remained underweight in the IT sector given late economic cycle dynamics of excess inventory, slowing growth rates and peak profits. Within health care, our positioning continued to emphasize industries that provide equipment, tools and services for large pharmaceutical and biotechnology companies.
Recent central bank actions supported continued growth by keeping the cost of debt low. The labor market remains healthy with job and wage gains, which we believe is beneficial to consumers. However, these are clearly the late innings of the economic cycle and, therefore, we expect only modest growth from here, as well as continued volatility spurred by trade and election headlines. True growth is likely to be scarce and we believe the market will favor companies that can produce growth and compound earnings in spite of the economic cycle. We believe change is the fuel for growth. Thus, we are seeking to identify “share-takers,” which are companies that can gain market share from technology-enabled advantages in their business models despite disruptive shifts in consumer behavior.
Thank you for your investment in Invesco Summit Fund and for sharing our long-term investment horizon.
1 Source: Bloomberg
2 Source: US Federal Reserve
Portfolio managers:
Ido Cohen
Erik Voss - Lead
The views and opinions expressed in management’s discussion of Fund performance are those of Invesco Advisers, Inc. These views and opinions are
subject to change at any time based on factors such as market and economic conditions. These views and opinions may not be relied upon as investment advice or recommendations, or as an offer for a particular security. The information is not a complete analysis of every aspect of any market, country, industry, security or the Fund. Statements of fact are from sources considered reliable, but Invesco Advisers, Inc. makes no representation or warranty as to their completeness or accuracy. Although historical performance is no guarantee of future results, these insights may help you understand our investment management philosophy.
See important Fund and, if applicable, index disclosures later in this report.
Your Fund’s Long-Term Performance
Results of a $10,000 Investment – Oldest Share Class(es)
Fund and index data from 10/31/09
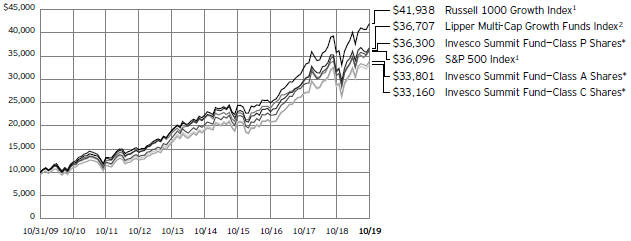
| 1 | Source: RIMES Technologies Corp. |
| * | The Fund’s oldest share class (Class P) does not have a sales charge; therefore, the second-oldest share classes with a sales charge (Class A and Class C) are also included in the chart. |
Past performance cannot guarantee comparable future results.
The data shown in the chart include reinvested distributions, applicable sales charges and Fund expenses including
management fees. Index results include reinvested dividends, but they do not reflect sales charges. Performance of the peer group, if applicable, reflects fund expenses and management fees; performance
of a market index does not. Performance shown in the chart does not reflect deduction of taxes a shareholder would pay on Fund distributions or sale of Fund shares.
| | | | |
| Average Annual Total Returns | | | | |
| As of 10/31/19, including maximum applicable sales charges | |
| |
| Class A Shares | | | | |
| Inception (10/31/05) | | | 8.51% | |
| 10 Years | | | 12.95 | |
5 Years | | | 10.96 | |
1 Year | | | 10.89 | |
| |
| Class C Shares | | | | |
| Inception (10/31/05) | | | 8.36% | |
| 10 Years | | | 12.74 | |
5 Years | | | 11.37 | |
1 Year | | | 15.43 | |
| |
| Class P Shares | | | | |
| Inception (11/1/82) | | | 9.71% | |
| 10 Years | | | 13.76 | |
5 Years | | | 12.39 | |
1 Year | | | 17.55 | |
| |
| Class S Shares | | | | |
| Inception (9/25/09) | | | 13.46% | |
| 10 Years | | | 13.71 | |
5 Years | | | 12.32 | |
1 Year | | | 17.44 | |
| |
| Class Y Shares | | | | |
| Inception (10/3/08) | | | 11.83% | |
| 10 Years | | | 13.88 | |
5 Years | | | 12.51 | |
1 Year | | | 17.65 | |
| |
| Class R5 Shares | | | | |
| Inception (10/3/08) | | | 11.93% | |
| 10 Years | | | 13.97 | |
5 Years | | | 12.55 | |
1 Year | | | 17.63 | |
| |
| Class R6 Shares | | | | |
| 10 Years | | | 13.68% | |
5 Years | | | 12.39 | |
1 Year | | | 17.73 | |
Class R6 shares incepted on April 4, 2017. Performance shown prior to that date is that of Class A shares and includes the12b-1 fees applicable to Class A shares.
The performance data quoted represent past performance and cannot guarantee comparable future results; current performance may be lower or higher. Please visit invesco.com/ performance for the most recentmonth-end performance. Performance figures reflect reinvested distributions, changes in net asset value and the effect of the maximum sales charge unless otherwise stated. Performance figures do not reflect deduction of taxes a shareholder would pay on Fund distributions or sale of Fund shares. Investment return and principal value
| | | | |
| Average Annual Total Returns | | | | |
| As of 9/30/19, the most recent calendar quarter end, including maximum applicable sales charges | |
| |
| Class A Shares | | | | |
| Inception (10/31/05) | | | 8.35% | |
| 10 Years | | | 12.43 | |
5 Years | | | 10.93 | |
1 Year | | | –4.63 | |
| |
| Class C Shares | | | | |
| Inception (10/31/05) | | | 8.20% | |
| 10 Years | | | 12.23 | |
5 Years | | | 11.35 | |
1 Year | | | –0.72 | |
| |
| Class P Shares | | | | |
| Inception (11/1/82) | | | 9.65% | |
| 10 Years | | | 13.24 | |
5 Years | | | 12.35 | |
1 Year | | | 1.06 | |
| |
| Class S Shares | | | | |
| Inception (9/25/09) | | | 13.26% | |
| 10 Years | | | 13.19 | |
5 Years | | | 12.30 | |
1 Year | | | 0.98 | |
| |
| Class Y Shares | | | | |
| Inception (10/3/08) | | | 11.64% | |
| 10 Years | | | 13.36 | |
5 Years | | | 12.46 | |
1 Year | | | 1.16 | |
| |
| Class R5 Shares | | | | |
| Inception (10/3/08) | | | 11.74% | |
| 10 Years | | | 13.45 | |
5 Years | | | 12.52 | |
1 Year | | | 1.15 | |
| |
| Class R6 Shares | | | | |
| 10 Years | | | 13.15% | |
5 Years | | | 12.35 | |
1 Year | | | 1.24 | |
will fluctuate so that you may have a gain or loss when you sell shares.
The total annual Fund operating expense ratio set forth in the most recent Fund prospectus as of the date of this report for Class A, Class C, Class P, Class S, Class Y, Class R5 and Class R6 shares was 1.02%, 1.77%, 0.87%, 0.92%, 0.77%, 0.72% and 0.72%, respectively. The expense ratios presented above may vary from the expense ratios presented in other sections of this report that are based on expenses incurred during the period covered by this report.
Class A share performance reflects the maximum 5.50% sales charge, and Class C share performance reflects the applicable contingent deferred sales charge (CDSC) for the period involved. The CDSC on Class C shares is 1% for
the first year after purchase. Class P, Class S, Class Y, Class R5 and Class R6 shares do not have afront-end sales charge or contingent deferred sales charge (CDSC); therefore, returns shown are at net asset value.
The performance numbers shown do not reflect the creation and sales charges and other fees assessed by the AIM Summit Investors Plans, which were dissolved effective December 8, 2006.
The performance of the Fund’s share classes will differ primarily due to different sales charge structures and class expenses.
Fund performance reflects any applicable fee waivers and/or expense reimbursements. Had the adviser not waived fees and/or reimbursed expenses currently or in the past, returns would have been lower. See current prospectus for more information.
Invesco Summit Fund’s investment objective is long-term growth of capital.
| ∎ | | Unless otherwise stated, information presented in this report is as of October 31, 2019, and is based on total net assets. |
| ∎ | | Unless otherwise noted, all data provided by Invesco. |
| ∎ | | To access your Fund’s reports/prospectus, visit invesco.com/fundreports. |
About share classes
| ∎ | | Class P shares,Class S sharesandClass Y sharesare available only to certain investors. Please see the prospectus for more information. |
| ∎ | | Class R5 sharesandClass R6 sharesare available for use by retirement plans that meet certain standards and for institutional investors. Class R6 shares are also available through intermediaries that have established an agreement with Invesco Distributors, Inc. to make such shares available for use in retail omnibus accounts. Please see the prospectus for more information. |
Principal risks of investing in the Fund
| ∎ | | Foreign securities risk.The Fund’s foreign investments may be adversely affected by political and social instability, changes in economic or taxation policies, difficulty in enforcing obligations, decreased liquidity or increased volatility. Foreign investments also involve the risk of the possible seizure, nationalization or expropriation of the issuer or foreign deposits (in which the Fund could lose its entire investments in a certain market) and the possible adoption of foreign governmental restrictions such as exchange controls. Unless the Fund has hedged its foreign securities risk, |
foreign securities risk also involves the risk of negative foreign currency rate fluctuations, which may cause the value of securities denominated in such foreign currency (or other instruments through which the Fund has exposure to foreign currencies) to decline in value. Currency exchange rates may fluctuate significantly over short periods of time. Currency hedging strategies, if used, are not always successful.
| ∎ | | Growth investing risk.Growth stocks tend to be more expensive relative to the issuing company’s earnings or assets compared with other types of stock. As a result, they tend to be |
| | | more sensitive to changes in, or investors’ expectations of, the issuing company’s earnings and can be more volatile. |
| ∎ | | Management risk.The Fund is actively managed and depends heavily on the Adviser’s judgment about markets, interest rates or the attractiveness, relative values, liquidity, or potential appreciation of particular investments made for the Fund’s portfolio. The Fund could experience losses if these judgments prove to be incorrect. Additionally, legislative, regulatory, or tax developments may adversely affect management of the Fund and, therefore, the ability of the Fund to achieve its investment objective. |
| ∎ | | Market risk.The market values of the Fund’s investments, and therefore the value of the Fund’s shares, will go up and down, sometimes rapidly or unpredictably. Market risk may affect a single issuer, industry or section of the economy, or it may affect the market as a whole. Individual stock prices tend to go up and down more dramatically than those of certain other types of investments, such as bonds. During a general downturn in the financial markets, multiple asset classes may decline in value. When markets perform well, there can be no assurance that specific investments held by the Fund will rise in value. |
| ∎ | | Sector focus risk.The Fund may from time to time invest a significant amount of its assets (i.e. over 25%) in one market sector or group of related industries. In this event, the Fund’s performance will depend to a greater extent on the overall condition of the sector or group of industries and there is increased risk that the Fund will lose significant value if conditions adversely affect that sector or group of industries. |
| ∎ | | Small- andmid-capitalization companies risks.Small- andmid-capitalization companies tend to be more vulnerable to changing market conditions, may have little or no operating history or track record of success, |
| | | and may have more limited product lines and markets, less experienced management and fewer financial resources than larger companies. These companies’ securities may be more volatile and less liquid than those of more established companies, and their returns may vary, sometimes significantly, from the overall securities market. |
About indexes used in this report
| ∎ | | TheS&P 500®Indexis an unmanaged index considered representative of the US stock market. |
| ∎ | | TheRussell 1000®Growth Indexis an unmanaged index considered representative oflarge-cap growth stocks. The Russell 1000 Growth Index is a trademark/service mark of the Frank Russell Co. Russell®is a trademark of the Frank Russell Co. |
| ∎ | | TheLipperMulti-Cap Growth Funds Indexis an unmanaged index considered representative ofmulti-cap growth funds tracked by Lipper. |
| ∎ | | The Fund is not managed to track the performance of any particular index, including the index(es) described here, and consequently, the performance of the Fund may deviate significantly from the performance of the index(es). |
| ∎ | | A direct investment cannot be made in an index. Unless otherwise indicated, index results include reinvested dividends, and they do not reflect sales charges. Performance of the peer group, if applicable, reflects fund expenses; performance of a market index does not. |
Other information
| ∎ | | The returns shown in management’s discussion of Fund performance are based on net asset values (NAVs) calculated for shareholder transactions. Generally accepted accounting principles require adjustments to be made to the net assets of the Fund at period end for financial reporting purposes, |
| | |
This report must be accompanied or preceded by a currently effective Fund prospectus, which contains more complete information, including sales charges and expenses. Investors should read it carefully before investing. | | |
| | | |
| NOT FDIC INSURED | MAY LOSE VALUE | NO BANK GUARANTEE | | |
| | and as such, the NAVs for shareholder transactions and the returns based on those NAVs may differ from the NAVs and returns reported in the Financial Highlights. |
| ∎ | | Industry classifications used in this report are generally according to the Global Industry Classification Standard, which was developed by and is the exclusive property and a service mark of MSCI Inc. and Standard & Poor’s. |
Schedule of Investments(a)
October 31, 2019
| | | | | | |
| | | Shares | | | Value |
Common Stocks & Other Equity Interests–99.99% |
|
| Aerospace & Defense–3.58% |
Airbus S.E. (France) | | | 225,700 | | | $ 32,344,614 |
Boeing Co. (The) | | | 22,500 | | | 7,647,975 |
L3Harris Technologies, Inc. | | | 35,000 | | | 7,220,850 |
Lockheed Martin Corp. | | | 40,700 | | | 15,330,876 |
Teledyne Technologies, Inc.(b) | | | 72,900 | | | 24,027,840 |
| | | | 86,572,155 |
|
| Agricultural & Farm Machinery–0.40% |
| Deere & Co. | | | 55,000 | | | 9,577,700 |
|
| Application Software–4.92% |
Adobe, Inc.(b) | | | 52,000 | | | 14,452,360 |
RealPage, Inc.(b) | | | 321,300 | | | 19,454,715 |
salesforce.com, inc.(b) | | | 376,200 | | | 58,871,538 |
Splunk, Inc.(b) | | | 75,000 | | | 8,997,000 |
Trade Desk, Inc. (The), Class A(b) | | | 86,500 | | | 17,369,200 |
| | | | 119,144,813 |
|
| Asset Management & Custody Banks–2.63% |
Apollo Global Management, Inc. | | | 511,500 | | | 21,053,340 |
Ares Management Corp., Class A | | | 881,010 | | | 26,051,466 |
Carlyle Group L.P. (The)(c) | | | 468,000 | | | 12,767,040 |
Legg Mason, Inc. | | | 100,944 | | | 3,761,173 |
| | | | 63,633,019 |
|
| Biotechnology–0.61% |
Alnylam Pharmaceuticals, Inc.(b) | | | 66,000 | | | 5,724,840 |
BeiGene Ltd., ADR (China)(b) | | | 20,000 | | | 2,766,800 |
Bluebird Bio, Inc.(b) | | | 20,000 | | | 1,620,000 |
Moderna, Inc.(b) | | | 170,000 | | | 2,847,500 |
Sage Therapeutics, Inc.(b) | | | 14,000 | | | 1,899,100 |
| | | | 14,858,240 |
|
| Cable & Satellite–1.46% |
Altice USA, Inc., Class A(b) | | | 611,000 | | | 18,910,450 |
Charter Communications, Inc., Class A(b) | | | 25,000 | | | 11,696,500 |
DISH Network Corp., Class A(b) | | | 135,000 | | | 4,641,300 |
| | | | 35,248,250 |
|
| Commodity Chemicals–0.30% |
| Westlake Chemical Corp. | | | 115,010 | | | 7,267,482 |
|
| Consumer Electronics–1.46% |
| Sony Corp. (Japan) | | | 581,100 | | | 35,408,170 |
|
| Data Processing & Outsourced Services–9.01% |
Fidelity National Information Services, Inc. | | | 258,300 | | | 34,033,608 |
Mastercard, Inc., Class A | | | 369,900 | | | 102,392,019 |
PayPal Holdings, Inc.(b) | | | 314,100 | | | 32,697,810 |
| | | | | | |
| | | Shares | | | Value |
|
| Data Processing & Outsourced Services–(continued) |
Visa, Inc., Class A | | | 274,100 | | | $ 49,025,526 |
| | | | 218,148,963 |
|
| Diversified Support Services–1.13% |
| Cintas Corp. | | | 101,400 | | | 27,243,138 |
|
| Environmental & Facilities Services–2.31% |
Casella Waste Systems, Inc.,
Class A(b) | | | 316,400 | | | 13,791,876 |
Clean Harbors, Inc.(b) | | | 233,000 | | | 19,213,180 |
Waste Connections, Inc. | | | 79,865 | | | 7,379,526 |
Waste Management, Inc. | | | 138,000 | | | 15,484,980 |
| | | | 55,869,562 |
|
| Financial Exchanges & Data–0.75% |
Intercontinental Exchange, Inc. | | | 134,000 | | | 12,638,880 |
London Stock Exchange Group PLC (United Kingdom) | | | 61,100 | | | 5,510,251 |
| | | | 18,149,131 |
|
| Health Care Equipment–4.66% |
Baxter International, Inc. | | | 241,200 | | | 18,500,040 |
Boston Scientific Corp.(b) | | | 699,004 | | | 29,148,467 |
Intuitive Surgical, Inc.(b) | | | 40,000 | | | 22,118,000 |
Teleflex, Inc. | | | 88,800 | | | 30,850,008 |
Zimmer Biomet Holdings, Inc. | | | 87,164 | | | 12,048,680 |
| | | | 112,665,195 |
|
| Health Care Services–0.69% |
| LHC Group, Inc.(b) | | | 150,300 | | | 16,678,791 |
|
| Home Improvement Retail–3.53% |
Home Depot, Inc. (The) | | | 126,200 | | | 29,603,996 |
Lowe’s Cos., Inc. | | | 500,490 | | | 55,859,689 |
| | | | 85,463,685 |
|
| Hotels, Resorts & Cruise Lines–1.97% |
Norwegian Cruise Line Holdings Ltd.(b) | | | 725,000 | | | 36,801,000 |
Royal Caribbean Cruises Ltd. | | | 100,000 | | | 10,883,000 |
| | | | 47,684,000 |
|
| Industrial Conglomerates–0.41% |
| Roper Technologies, Inc. | | | 29,520 | | | 9,947,059 |
|
| Industrial Gases–0.17% |
| Linde PLC (United Kingdom) | | | 21,252 | | | 4,215,334 |
|
| Industrial Machinery–0.34% |
| Stanley Black & Decker, Inc. | | | 53,800 | | | 8,141,554 |
|
| Interactive Home Entertainment–6.68% |
Activision Blizzard, Inc. | | | 811,400 | | | 45,462,742 |
Electronic Arts, Inc.(b) | | | 298,800 | | | 28,804,320 |
Nintendo Co., Ltd. (Japan) | | | 114,500 | | | 40,839,754 |
Sea Ltd., ADR (Taiwan)(b) | | | 594,000 | | | 17,677,440 |
| | |
| See accompanying Notes to Financial Statements which are an integral part of the financial statements. |
| |
| 11 | | Invesco Summit Fund |
| | | | | | |
| | | Shares | | | Value |
| Interactive Home Entertainment–(continued) |
Take-Two Interactive Software, Inc.(b) | | | 239,000 | | | $ 28,763,650 |
| | | | 161,547,906 |
|
| Interactive Media & Services–10.52% |
Alphabet, Inc., Class A(b) | | | 650 | | | 818,220 |
Alphabet, Inc., Class C(b) | | | 112,800 | | | 142,140,408 |
Facebook, Inc., Class A(b) | | | 582,918 | | | 111,716,235 |
| | | | 254,674,863 |
|
| Internet & Direct Marketing Retail–12.33% |
Alibaba Group Holding Ltd., ADR (China)(b) | | | 327,355 | | | 57,833,808 |
Amazon.com, Inc.(b) | | | 116,280 | | | 206,590,025 |
Booking Holdings, Inc.(b) | | | 14,760 | | | 30,239,845 |
JD.com, Inc., ADR (China)(b) | | | 117,000 | | | 3,644,550 |
| | | | 298,308,228 |
|
| Investment Banking & Brokerage–0.65% |
Goldman Sachs Group, Inc. (The) | | | 33,000 | | | 7,041,540 |
LPL Financial Holdings, Inc. | | | 107,000 | | | 8,649,880 |
| | | | 15,691,420 |
|
| Life Sciences Tools & Services–3.37% |
10X Genomics, Inc., Class A(b) | | | 120,600 | | | 6,994,800 |
Avantor, Inc.(b) | | | 715,000 | | | 10,160,150 |
Illumina, Inc.(b) | | | 138,600 | | | 40,959,072 |
Thermo Fisher Scientific, Inc. | | | 77,400 | | | 23,373,252 |
| | | | 81,487,274 |
|
| Managed Health Care–1.65% |
Humana, Inc. | | | 50,900 | | | 14,974,780 |
UnitedHealth Group, Inc. | | | 98,859 | | | 24,981,669 |
| | | | 39,956,449 |
|
| Movies & Entertainment–1.10% |
IMAX Corp.(b) | | | 332,000 | | | 7,088,200 |
Netflix, Inc.(b) | | | 37,260 | | | 10,708,897 |
Vivendi S.A. (France) | | | 320,000 | | | 8,922,588 |
| | | | 26,719,685 |
|
| Oil & Gas Exploration & Production–0.31% |
| Viper Energy Partners L.P. | | | 312,200 | | | 7,514,654 |
|
| Oil & Gas Refining & Marketing–0.71% |
Marathon Petroleum Corp. | | | 117,000 | | | 7,482,150 |
PBF Energy, Inc., Class A | | | 300,500 | | | 9,700,140 |
| | | | 17,182,290 |
|
| Packaged Foods & Meats–4.01% |
Conagra Brands, Inc. | | | 359,100 | | | 9,713,655 |
Lamb Weston Holdings, Inc. | | | 150,200 | | | 11,721,608 |
Mondelez International, Inc., Class A | | | 221,100 | | | 11,596,695 |
Mowi ASA (Norway) | | | 518,400 | | | 12,658,857 |
Nomad Foods Ltd. (United Kingdom)(b) | | | 405,000 | | | 7,901,550 |
Tyson Foods, Inc., Class A | | | 525,000 | | | 43,464,750 |
| | | | 97,057,115 |
| | | | | | |
| | | Shares | | | Value |
|
| Pharmaceuticals–1.00% |
Novo Nordisk A/S, Class B (Denmark) | | | 88,235 | | | $ 4,858,062 |
Zoetis, Inc. | | | 152,100 | | | 19,456,632 |
| | | | 24,314,694 |
|
| Railroads–1.12% |
Kansas City Southern | | | 126,000 | | | 17,738,280 |
Union Pacific Corp. | | | 56,000 | | | 9,265,760 |
| | | | 27,004,040 |
|
| Regional Banks–0.25% |
| SVB Financial Group(b) | | | 27,000 | | | 5,979,960 |
|
| Reinsurance–0.20% |
| Reinsurance Group of America, Inc. | | | 30,500 | | | 4,955,335 |
|
| Restaurants–0.27% |
Restaurant Brands International, Inc. (Canada)(c) | | | 97,958 | | | 6,410,372 |
|
| Semiconductor Equipment–2.31% |
Applied Materials, Inc. | | | 529,092 | | | 28,708,532 |
ASML Holding N.V., New York Shares (Netherlands) | | | 104,030 | | | 27,252,739 |
| | | | 55,961,271 |
|
| Semiconductors–3.67% |
NVIDIA Corp. | | | 51,300 | | | 10,312,326 |
QUALCOMM, Inc. | | | 248,000 | | | 19,949,120 |
Semtech Corp.(b) | | | 492,000 | | | 24,826,320 |
Silicon Motion Technology Corp., ADR (Taiwan) | | | 804,000 | | | 33,808,200 |
| | | | 88,895,966 |
|
| Specialized Consumer Services–0.34% |
| Service Corp. International | | | 180,000 | | | 8,186,400 |
|
| Specialized REITs–0.19% |
Crown Castle International Corp. | | | 16,500 | | | 2,290,035 |
SBA Communications Corp., Class A | | | 9,800 | | | 2,358,370 |
| | | | 4,648,405 |
|
| Specialty Chemicals–0.44% |
| Sherwin-Williams Co. (The) | | | 18,560 | | | 10,622,259 |
|
| Systems Software–5.61% |
Microsoft Corp. | | | 606,808 | | | 86,998,063 |
Palo Alto Networks, Inc.(b) | | | 133,500 | | | 30,356,565 |
ServiceNow, Inc.(b) | | | 74,100 | | | 18,321,966 |
| | | | 135,676,594 |
|
| Technology Hardware, Storage & Peripherals–2.44% |
| Apple, Inc. | | | 237,619 | | | 59,110,102 |
| | |
| Trucking–0.49% | | | | | | |
Lyft, Inc., Class A(b) | | | 164,000 | | | 6,796,160 |
| | |
| See accompanying Notes to Financial Statements which are an integral part of the financial statements. |
| |
| 12 | | Invesco Summit Fund |
| | | | | | |
| | | Shares | | | Value |
| Trucking–(continued) |
Uber Technologies, Inc.(b)(c) | | | 163,000 | | | $ 5,134,500 |
| | | | 11,930,660 |
Total Common Stocks & Other Equity Interests
(Cost $1,361,355,934) | | | 2,419,752,183 |
|
Money Market Funds–0.00% |
Invesco Government & Agency Portfolio, Institutional Class, 1.71%(d) | | | 40 | | | 40 |
Invesco Treasury Portfolio, Institutional Class, 1.66%(d) | | | 45 | | | 45 |
Total Money Market Funds (Cost $85) | | | 85 |
TOTAL INVESTMENTS IN SECURITIES
(excluding investments purchased with cash collateral from securities onloan)-99.99%
(Cost $1,361,356,019) | | | 2,419,752,268 |
| | | | | | | | |
| | | Shares | | | Value | |
Investments Purchased with Cash Collateral from Securities on Loan | |
|
| Money Market Funds–0.32% | |
Invesco Government & Agency Portfolio, Institutional Class, 1.71%(d)(e) | | | 5,084,830 | | | $ | 5,084,830 | |
| |
Invesco Liquid Assets Portfolio, Institutional Class, 1.90%(d)(e) | | | 2,718,191 | | | | 2,719,278 | |
| |
Total Investments Purchased with Cash Collateral from Securities on Loan (Cost $7,803,934) | | | | 7,804,108 | |
| |
TOTAL INVESTMENTS IN SECURITIES–100.31%
(Cost $1,369,159,953) | | | | 2,427,556,376 | |
| |
OTHER ASSETS LESS LIABILITIES–(0.31)% | | | | (7,443,150 | ) |
| |
NET ASSETS–100.00% | | | $ | 2,420,113,226 | |
| |
Investment Abbreviations:
ADR – American Depositary Receipt
REIT – Real Estate Investment Trust
Notes to Schedule of Investments:
| (a) | Industry and/or sector classifications used in this report are generally according to the Global Industry Classification Standard, which was developed by and is the exclusive property and a service mark of MSCI Inc. and Standard & Poor’s. |
| (b) | Non-income producing security. |
| (c) | All or a portion of this security was out on loan at October 31, 2019. |
| (d) | The money market fund and the Fund are affiliated by having the same investment adviser. The rate shown is the7-day SEC standardized yield as of October 31, 2019. |
| (e) | The security has been segregated to satisfy the commitment to return the cash collateral received in securities lending transactions upon the borrower’s return of the securities loaned. See Note 1I. |
| | |
| See accompanying Notes to Financial Statements which are an integral part of the financial statements. |
| |
| 13 | | Invesco Summit Fund |
Statement of Assets and Liabilities
October 31, 2019
| | | | |
| Assets: | | | | |
Investments in securities, at value
(Cost $1,361,355,934)* | | $ | 2,419,752,183 | |
Investments in affiliated money market funds, at value
(Cost $7,804,019) | | | 7,804,193 | |
Foreign currencies, at value
(Cost $2,608) | | | 2,627 | |
| Receivable for: | | | | |
Investments sold | | | 1,037,365 | |
Dividends | | | 938,035 | |
Fund shares sold | | | 400,877 | |
Investment for trustee deferred compensation and retirement plans | | | 409,618 | |
Other assets | | | 59,133 | |
Total assets | | | 2,430,404,031 | |
| |
| Liabilities: | | | | |
| Payable for: | | | | |
Fund shares reacquired | | | 720,134 | |
Amount due custodian | | | 575,334 | |
Collateral upon return of securities loaned | | | 7,803,934 | |
Accrued fees to affiliates | | | 629,677 | |
Accrued trustees’ and officers’ fees and benefits | | | 3,022 | |
Accrued other operating expenses | | | 112,546 | |
Trustee deferred compensation and retirement plans | | | 446,158 | |
Total liabilities | | | 10,290,805 | |
| Net assets applicable to shares outstanding | | $ | 2,420,113,226 | |
| |
| Net assets consist of: | | | | |
Shares of beneficial interest | | $ | 1,162,020,516 | |
| Distributable earnings | | | 1,258,092,710 | |
| | | $ | 2,420,113,226 | |
| | | | |
| Net Assets: | | | | |
| Class A | | $ | 169,882,825 | |
| |
| Class C | | $ | 15,470,306 | |
| |
| Class P | | $ | 2,204,984,427 | |
| |
| Class S | | $ | 3,710,607 | |
| |
| Class Y | | $ | 13,413,747 | |
| |
| Class R5 | | $ | 95,682 | |
| |
| Class R6 | | $ | 12,555,632 | |
| |
| | | | |
Shares outstanding, no par value, with an unlimited number of shares authorized: | |
| Class A | | | 7,804,539 | |
| |
| Class C | | | 801,985 | |
| |
| Class P | | | 99,514,994 | |
| |
| Class S | | | 169,034 | |
| |
| Class Y | | | 606,505 | |
| |
| Class R5 | | | 4,306 | |
| |
| Class R6 | | | 564,627 | |
| |
| Class A: | | | | |
Net asset value per share | | $ | 21.77 | |
| |
Maximum offering price per share (Net asset value of $21.77 ÷ 94.50%) | | $ | 23.04 | |
| |
| Class C: | | | | |
Net asset value and offering price per share | | $ | 19.29 | |
| |
| Class P: | | | | |
Net asset value and offering price per share | | $ | 22.16 | |
| |
| Class S: | | | | |
Net asset value and offering price per share | | $ | 21.95 | |
| |
| Class Y: | | | | |
Net asset value and offering price per share | | $ | 22.12 | |
| |
| Class R5: | | | | |
Net asset value and offering price per share | | $ | 22.22 | |
| |
| Class R6: | | | | |
Net asset value and offering price per share | | $ | 22.24 | |
| |
| * | At October 31, 2019, securities with an aggregate value of $7,630,007 were on loan to brokers. |
| | |
| See accompanying Notes to Financial Statements which are an integral part of the financial statements. |
| |
| 14 | | Invesco Summit Fund |
Statement of Operations
For the year ended October 31, 2019
| | | | |
| Investment income: | | | | |
| Dividends (net of foreign withholding taxes of $498,374) | | $ | 18,354,808 | |
| |
| Dividends from affiliated money market funds (includes securities lending income of $540,599) | | | 671,097 | |
| |
Total investment income | | | 19,025,905 | |
| |
| |
| Expenses: | | | | |
| Advisory fees | | | 14,467,533 | |
| |
| Administrative services fees | | | 348,499 | |
| |
| Custodian fees | | | 67,037 | |
| |
| Distribution fees: | | | | |
Class A | | | 340,998 | |
| |
Class C | | | 153,722 | |
| |
Class P | | | 2,099,897 | |
| |
Class S | | | 5,362 | |
| |
| Transfer agent fees – A, C, P, S and Y | | | 2,165,219 | |
| |
| Transfer agent fees – R5 | | | 83 | |
| |
| Transfer agent fees – R6 | | | 4,780 | |
| |
| Trustees’ and officers’ fees and benefits | | | 47,749 | |
| |
| Registration and filing fees | | | 109,193 | |
| |
| Reports to shareholders | | | 63,909 | |
| |
| Professional services fees | | | 62,680 | |
| |
| Other | | | 24,607 | |
| |
Total expenses | | | 19,961,268 | |
| |
| Less: Fees waived and/or expense offset arrangement(s) | | | (44,497 | ) |
| |
Net expenses | | | 19,916,771 | |
| |
| Net investment income (loss) | | | (890,866 | ) |
| |
| |
| Realized and unrealized gain (loss) from: | | | | |
| Net realized gain (loss) from: | | | | |
Investment securities (includes net gains from securities sold to affiliates of $34,091,959) | | | 205,407,308 | |
| |
Foreign currencies | | | (13,201 | ) |
| |
| | | 205,394,107 | |
| |
| Change in net unrealized appreciation of: | | | | |
Investment securities | | | 165,019,766 | |
| |
Foreign currencies | | | 74 | |
| |
| | | 165,019,840 | |
| |
| Net realized and unrealized gain | | | 370,413,947 | |
| |
| Net increase in net assets resulting from operations | | $ | 369,523,081 | |
| |
| | |
| See accompanying Notes to Financial Statements which are an integral part of the financial statements. |
| |
| 15 | | Invesco Summit Fund |
Statement of Changes in Net Assets
For the years ended October 31, 2019 and 2018
| | | | | | | | |
| | | 2019 | | | 2018 | |
| |
| Operations: | | | | | | | | |
Net investment income (loss) | | $ | (890,866 | ) | | $ | (2,380,420 | ) |
| |
Net realized gain | | | 205,394,107 | | | | 221,027,996 | |
| |
Change in net unrealized appreciation (depreciation) | | | 165,019,840 | | | | (62,831,310 | ) |
| |
Net increase in net assets resulting from operations | | | 369,523,081 | | | | 155,816,266 | |
| |
| | |
| Distributions to shareholders from distributable earnings: | | | | | | | | |
Class A | | | (11,802,245 | ) | | | (2,989,383 | ) |
| |
Class B | | | – | | | | (13,801 | ) |
| |
Class C | | | (1,924,446 | ) | | | (469,794 | ) |
| |
Class P | | | (200,986,497 | ) | | | (74,612,584 | ) |
| |
Class S | | | (342,325 | ) | | | (128,917 | ) |
| |
Class Y | | | (1,432,310 | ) | | | (636,582 | ) |
| |
Class R5 | | | (7,405 | ) | | | (769 | ) |
| |
Class R6 | | | (1,111,514 | ) | | | (439 | ) |
| |
Total distributions from distributable earnings | | | (217,606,742 | ) | | | (78,852,269 | ) |
| |
| | |
| Share transactions–net: | | | | | | | | |
Class A | | | 45,113,185 | | | | 35,805,441 | |
| |
Class B | | | – | | | | (369,921 | ) |
| |
Class C | | | (1,676,851 | ) | | | 7,522,064 | |
| |
Class P | | | 41,247,361 | | | | (95,477,221 | ) |
| |
Class S | | | 86,338 | | | | (247,728 | ) |
| |
Class Y | | | (2,237,075 | ) | | | 261,843 | |
| |
Class R5 | | | 16,489 | | | | 55,373 | |
| |
Class R6 | | | 721,839 | | | | 11,366,414 | |
| |
Net increase (decrease) in net assets resulting from share transactions | | | 83,271,286 | | | | (41,083,735 | ) |
| |
Net increase in net assets | | | 235,187,625 | | | | 35,880,262 | |
| |
| | |
| Net assets: | | | | | | | | |
Beginning of year | | | 2,184,925,601 | | | | 2,149,045,339 | |
| |
End of year | | $ | 2,420,113,226 | | | $ | 2,184,925,601 | |
| |
| | |
| See accompanying Notes to Financial Statements which are an integral part of the financial statements. |
| |
| 16 | | Invesco Summit Fund |
Financial Highlights
The following schedule presents financial highlights for a share of the Fund outstanding throughout the periods indicated.
| | | | | | | | | | | | | | | | | | | | | | | | | | | | | | | | | | | | | | | | | | | | | | | | | | | | | | | | | | | | | | | | | | | | | | |
| | | Net asset
value,
beginning
of period | | Net
investment
income
(loss)(a) | | Net gains
(losses) on securities
(both
realized and
unrealized) | | Total from investment operations | | Dividends from net investment income | | Distributions from net realized gains | | Total distributions | | Net asset value, end of period | | Total return (b) | | Net assets, end of period (000’s omitted) | | Ratio of expenses to average net assets with fee waivers and/or expenses absorbed | | Ratio of expenses to average net assets without fee waivers and/or expenses absorbed | | Ratio of net investment income (loss) to average net assets | | Portfolio turnover (c) |
| Class A | | | | | | | | | | | | | | | | | | | | | | | | | | | | | | | | | | | | | | | | | | | | | | | | | | | | | | | | | | | | | | | | | | | | | | |
| Year ended 10/31/19 | | | $ | 20.75 | | | | $ | (0.04 | ) | | | $ | 3.17 | | | | $ | 3.13 | | | | $ | – | | | | $ | (2.11 | ) | | | $ | (2.11 | ) | | | $ | 21.77 | | | | | 17.36 | % | | | $ | 169,883 | | | | | 1.01 | %(d) | | | | 1.01 | %(d) | | | | (0.18 | )%(d) | | | | 29 | % |
| Year ended 10/31/18 | | | | 20.14 | | | | | (0.05 | ) | | | | 1.41 | | | | | 1.36 | | | | | – | | | | | (0.75 | ) | | | | (0.75 | ) | | | | 20.75 | | | | | 6.95 | | | | | 114,570 | | | | | 1.02 | | | | | 1.02 | | | | | (0.24 | ) | | | | 35 | |
| Year ended 10/31/17 | | | | 16.56 | | | | | (0.02 | ) | | | | 4.60 | | | | | 4.58 | | | | | – | | | | | (1.00 | ) | | | | (1.00 | ) | | | | 20.14 | | | | | 29.20 | | | | | 77,519 | | | | | 1.04 | | | | | 1.04 | | | | | (0.13 | ) | | | | 31 | |
| Year ended 10/31/16 | | | | 17.59 | | | | | (0.01 | ) | | | | 0.11 | | | | | 0.10 | | | | | – | | | | | (1.13 | ) | | | | (1.13 | ) | | | | 16.56 | | | | | 0.81 | | | | | 50,217 | | | | | 1.05 | | | | | 1.05 | | | | | (0.05 | ) | | | | 47 | |
| Year ended 10/31/15 | | | | 18.62 | | | | | (0.03 | ) | | | | 1.44 | | | | | 1.41 | | | | | – | | | | | (2.44 | ) | | | | (2.44 | ) | | | | 17.59 | | | | | 8.86 | | | | | 50,349 | | | | | 1.04 | | | | | 1.04 | | | | | (0.16 | ) | | | | 49 | |
| Class C | | | | | | | | | | | | | | | | | | | | | | | | | | | | | | | | | | | | | | | | | | | | | | | | | | | | | | | | | | | | | | | | | | | | | | |
| Year ended 10/31/19 | | | | 18.77 | | | | | (0.17 | ) | | | | 2.80 | | | | | 2.63 | | | | | – | | | | | (2.11 | ) | | | | (2.11 | ) | | | | 19.29 | | | | | 16.43 | | | | | 15,470 | | | | | 1.76 | (d) | | | | 1.76 | (d) | | | | (0.93 | )(d) | | | | 29 | |
| Year ended 10/31/18 | | | | 18.41 | | | | | (0.19 | ) | | | | 1.30 | | | | | 1.11 | | | | | – | | | | | (0.75 | ) | | | | (0.75 | ) | | | | 18.77 | | | | | 6.22 | | | | | 16,792 | | | | | 1.77 | | | | | 1.77 | | | | | (0.99 | ) | | | | 35 | |
| Year ended 10/31/17 | | | | 15.34 | | | | | (0.15 | ) | | | | 4.22 | | | | | 4.07 | | | | | – | | | | | (1.00 | ) | | | | (1.00 | ) | | | | 18.41 | | | | | 28.15 | | | | | 9,325 | | | | | 1.79 | | | | | 1.79 | | | | | (0.88 | ) | | | | 31 | |
| Year ended 10/31/16 | | | | 16.49 | | | | | (0.12 | ) | | | | 0.10 | | | | | (0.02 | ) | | | | – | | | | | (1.13 | ) | | | | (1.13 | ) | | | | 15.34 | | | | | 0.09 | | | | | 5,008 | | | | | 1.80 | | | | | 1.80 | | | | | (0.80 | ) | | | | 47 | |
| Year ended 10/31/15 | | | | 17.73 | | | | | (0.15 | ) | | | | 1.35 | | | | | 1.20 | | | | | – | | | | | (2.44 | ) | | | | (2.44 | ) | | | | 16.49 | | | | | 8.02 | | | | | 4,855 | | | | | 1.79 | | | | | 1.79 | | | | | (0.91 | ) | | | | 49 | |
| Class P | | | | | | | | | | | | | | | | | | | | | | | | | | | | | | | | | | | | | | | | | | | | | | | | | | | | | | | | | | | | | | | | | | | | | | |
| Year ended 10/31/19 | | | | 21.05 | | | | | (0.01 | ) | | | | 3.23 | | | | | 3.22 | | | | | – | | | | | (2.11 | ) | | | | (2.11 | ) | | | | 22.16 | | | | | 17.55 | | | | | 2,204,984 | | | | | 0.86 | (d) | | | | 0.86 | (d) | | | | (0.03 | )(d) | | | | 29 | |
| Year ended 10/31/18 | | | | 20.39 | | | | | (0.02 | ) | | | | 1.43 | | | | | 1.41 | | | | | (0.00 | ) | | | | (0.75 | ) | | | | (0.75 | ) | | | | 21.05 | | | | | 7.13 | | | | | 2,024,211 | | | | | 0.87 | | | | | 0.87 | | | | | (0.09 | ) | | | | 35 | |
| Year ended 10/31/17 | | | | 16.75 | | | | | 0.00 | | | | | 4.65 | | | | | 4.65 | | | | | (0.01 | ) | | | | (1.00 | ) | | | | (1.01 | ) | | | | 20.39 | | | | | 29.32 | | | | | 2,044,421 | | | | | 0.89 | | | | | 0.89 | | | | | 0.02 | | | | | 31 | |
| Year ended 10/31/16 | | | | 17.75 | | | | | 0.02 | | | | | 0.11 | | | | | 0.13 | | | | | – | | | | | (1.13 | ) | | | | (1.13 | ) | | | | 16.75 | | | | | 0.98 | | | | | 1,708,869 | | | | | 0.90 | | | | | 0.90 | | | | | 0.10 | | | | | 47 | |
| Year ended 10/31/15 | | | | 18.74 | | | | | (0.00 | ) | | | | 1.45 | | | | | 1.45 | | | | | – | | | | | (2.44 | ) | | | | (2.44 | ) | | | | 17.75 | | | | | 9.03 | | | | | 1,821,733 | | | | | 0.89 | | | | | 0.89 | | | | | (0.01 | ) | | | | 49 | |
| Class S | | | | | | | | | | | | | | | | | | | | | | | | | | | | | | | | | | | | | | | | | | | | | | | | | | | | | | | | | | | | | | | | | | | | | | |
| Year ended 10/31/19 | | | | 20.89 | | | | | (0.02 | ) | | | | 3.19 | | | | | 3.17 | | | | | – | | | | | (2.11 | ) | | | | (2.11 | ) | | | | 21.95 | | | | | 17.44 | | | | | 3,711 | | | | | 0.91 | (d) | | | | 0.91 | (d) | | | | (0.08 | )(d) | | | | 29 | |
| Year ended 10/31/18 | | | | 20.24 | | | | | (0.03 | ) | | | | 1.43 | | | | | 1.40 | | | | | – | | | | | (0.75 | ) | | | | (0.75 | ) | | | | 20.89 | | | | | 7.12 | | | | | 3,405 | | | | | 0.92 | | | | | 0.92 | | | | | (0.14 | ) | | | | 35 | |
| Year ended 10/31/17 | | | | 16.63 | | | | | (0.01 | ) | | | | 4.62 | | | | | 4.61 | | | | | (0.00 | ) | | | | (1.00 | ) | | | | (1.00 | ) | | | | 20.24 | | | | | 29.29 | | | | | 3,521 | | | | | 0.94 | | | | | 0.94 | | | | | (0.03 | ) | | | | 31 | |
| Year ended 10/31/16 | | | | 17.64 | | | | | 0.01 | | | | | 0.11 | | | | | 0.12 | | | | | – | | | | | (1.13 | ) | | | | (1.13 | ) | | | | 16.63 | | | | | 0.92 | | | | | 3,164 | | | | | 0.95 | | | | | 0.95 | | | | | 0.05 | | | | | 47 | |
| Year ended 10/31/15 | | | | 18.66 | | | | | (0.01 | ) | | | | 1.43 | | | | | 1.42 | | | | | – | | | | | (2.44 | ) | | | | (2.44 | ) | | | | 17.64 | | | | | 8.90 | | | | | 3,546 | | | | | 0.94 | | | | | 0.94 | | | | | (0.06 | ) | | | | 49 | |
| Class Y | | | | | | | | | | | | | | | | | | | | | | | | | | | | | | | | | | | | | | | | | | | | | | | | | | | | | | | | | | | | | | | | | | | | | | |
| Year ended 10/31/19 | | | | 21.00 | | | | | 0.02 | | | | | 3.21 | | | | | 3.23 | | | | | – | | | | | (2.11 | ) | | | | (2.11 | ) | | | | 22.12 | | | | | 17.65 | | | | | 13,414 | | | | | 0.76 | (d) | | | | 0.76 | (d) | | | | 0.07 | (d) | | | | 29 | |
| Year ended 10/31/18 | | | | 20.34 | | | | | 0.00 | | | | | 1.43 | | | | | 1.43 | | | | | (0.02 | ) | | | | (0.75 | ) | | | | (0.77 | ) | | | | 21.00 | | | | | 7.25 | | | | | 14,818 | | | | | 0.77 | | | | | 0.77 | | | | | 0.01 | | | | | 35 | |
| Year ended 10/31/17 | | | | 16.71 | | | | | 0.02 | | | | | 4.64 | | | | | 4.66 | | | | | (0.03 | ) | | | | (1.00 | ) | | | | (1.03 | ) | | | | 20.34 | | | | | 29.46 | | | | | 13,881 | | | | | 0.79 | | | | | 0.79 | | | | | 0.12 | | | | | 31 | |
| Year ended 10/31/16 | | | | 17.69 | | | | | 0.03 | | | | | 0.12 | | | | | 0.15 | | | | | – | | | | | (1.13 | ) | | | | (1.13 | ) | | | | 16.71 | | | | | 1.10 | | | | | 3,576 | | | | | 0.80 | | | | | 0.80 | | | | | 0.20 | | | | | 47 | |
| Year ended 10/31/15 | | | | 18.67 | | | | | 0.02 | | | | | 1.44 | | | | | 1.46 | | | | | – | | | | | (2.44 | ) | | | | (2.44 | ) | | | | 17.69 | | | | | 9.13 | | | | | 2,170 | | | | | 0.79 | | | | | 0.79 | | | | | 0.09 | | | | | 49 | |
| Class R5 | | | | | | | | | | | | | | | | | | | | | | | | | | | | | | | | | | | | | | | | | | | | | | | | | | | | | | | | | | | | | | | | | | | | | | |
| Year ended 10/31/19 | | | | 21.09 | | | | | 0.01 | | | | | 3.23 | | | | | 3.24 | | | | | – | | | | | (2.11 | ) | | | | (2.11 | ) | | | | 22.22 | | | | | 17.63 | | | | | 96 | | | | | 0.77 | (d) | | | | 0.77 | (d) | | | | 0.06 | (d) | | | | 29 | |
| Year ended 10/31/18 | | | | 20.42 | | | | | 0.01 | | | | | 1.43 | | | | | 1.44 | | | | | (0.02 | ) | | | | (0.75 | ) | | | | (0.77 | ) | | | | 21.09 | | | | | 7.30 | | | | | 73 | | | | | 0.72 | | | | | 0.72 | | | | | 0.06 | | | | | 35 | |
| Year ended 10/31/17 | | | | 16.77 | | | | | 0.03 | | | | | 4.66 | | | | | 4.69 | | | | | (0.04 | ) | | | | (1.00 | ) | | | | (1.04 | ) | | | | 20.42 | | | | | 29.56 | | | | | 20 | | | | | 0.76 | | | | | 0.76 | | | | | 0.15 | | | | | 31 | |
| Year ended 10/31/16 | | | | 17.75 | | | | | 0.04 | | | | | 0.11 | | | | | 0.15 | | | | | – | | | | | (1.13 | ) | | | | (1.13 | ) | | | | 16.77 | | | | | 1.10 | | | | | 17 | | | | | 0.74 | | | | | 0.74 | | | | | 0.26 | | | | | 47 | |
| Year ended 10/31/15 | | | | 18.71 | | | | | 0.04 | | | | | 1.44 | | | | | 1.48 | | | | | – | | | | | (2.44 | ) | | | | (2.44 | ) | | | | 17.75 | | | | | 9.24 | | | | | 18 | | | | | 0.68 | | | | | 0.68 | | | | | 0.20 | | | | | 49 | |
| Class R6 | | | | | | | | | | | | | | | | | | | | | | | | | | | | | | | | | | | | | | | | | | | | | | | | | | | | | | | | | | | | | | | | | | | | | | |
| Year ended 10/31/19 | | | | 21.09 | | | | | 0.03 | | | | | 3.23 | | | | | 3.26 | | | | | – | | | | | (2.11 | ) | | | | (2.11 | ) | | | | 22.24 | | | | | 17.73 | | | | | 12,556 | | | | | 0.71 | (d) | | | | 0.71 | (d) | | | | 0.12 | (d) | | | | 29 | |
| Year ended 10/31/18 | | | | 20.42 | | | | | 0.01 | | | | | 1.43 | | | | | 1.44 | | | | | (0.02 | ) | | | | (0.75 | ) | | | | (0.77 | ) | | | | 21.09 | | | | | 7.29 | | | | | 11,057 | | | | | 0.72 | | | | | 0.72 | | | | | 0.06 | | | | | 35 | |
| Year ended 10/31/17(e) | | | | 17.61 | | | | | 0.01 | | | | | 2.80 | | | | | 2.81 | | | | | – | | | | | – | | | | | – | | | | | 20.42 | | | | | 15.96 | | | | | 12 | | | | | 0.77 | (f) | | | | 0.77 | (f) | | | | 0.14 | (f) | | | | 31 | |
| (a) | Calculated using average shares outstanding. |
| (b) | Includes adjustments in accordance with accounting principles generally accepted in the United States of America and as such, the net asset value for financial reporting purposes and the returns based upon those net asset values may differ from the net asset value and returns for shareholder transactions. Does not include sales charges and is not annualized for periods less than one year, if applicable. |
| (c) | Portfolio turnover is calculated at the fund level and is not annualized for periods less than one year, if applicable. |
| (d) | Ratios are based on average daily net assets (000’s omitted) of $136,399, $15,372, $2,099,897, $3,574, $13,760, $83 and $11,719 for Class A, Class C, Class P, Class S, Class Y, Class R5 and Class R6 shares, respectively. |
| (e) | Commencement date of April 4, 2017. |
| | |
| See accompanying Notes to Financial Statements which are an integral part of the financial statements. |
| |
| 17 | | Invesco Summit Fund |
Notes to Financial Statements
October 31, 2019
NOTE 1–Significant Accounting Policies
Invesco Summit Fund (the “Fund”) is a series portfolio of AIM Equity Funds (Invesco Equity Funds) (the “Trust”). The Trust is a Delaware statutory trust registered under the Investment Company Act of 1940, as amended (the “1940 Act”), as anopen-end series management investment company authorized to issue an unlimited number of shares of beneficial interest. Information presented in these financial statements pertains only to the Fund. Matters affecting the Fund or each class will be voted on exclusively by the shareholders of the Fund or each class.
The Fund’s investment objective is long-term growth of capital.
The Fund currently consists of seven different classes of shares: Class A, Class C, Class P, Class S, Class Y, Class R5 and Class R6. Class P shares are not sold to members of the general public. Only shareholders who had accounts in the AIM Summit Investors Plans I and AIM Summit Investors Plans II at the close of business on December 8, 2006, may continue to purchase Class P shares as described in the Fund’s prospectus. Class Y shares are available only to certain investors. Class A shares are sold with afront-end sales charge unless certain waiver criteria are met. Under certain circumstances, load waiver shares may be subject to contingent deferred sales charges (“CDSC”). Class C shares are sold with a CDSC. Class P, Class S, Class Y, Class R5 and Class R6 shares are sold at net asset value. Class C shares held for ten years after purchase are eligible for automatic conversion into Class A shares of the same Fund (the “Conversion Feature”). The automatic conversion pursuant to the Conversion Feature will generally occur at the end of the month following the tenth anniversary after a purchase of Class C shares (the Conversion Date).
The Fund is an investment company and accordingly follows the investment company accounting and reporting guidance in accordance with Financial Accounting Standards Board Accounting Standards Codification Topic 946,Financial Services – Investment Companies.
The following is a summary of the significant accounting policies followed by the Fund in the preparation of its financial statements.
| A. | Security Valuations– Securities, including restricted securities, are valued according to the following policy. |
A security listed or traded on an exchange (except convertible securities) is valued at its last sales price or official closing price as of the close of the customary trading session on the exchange where the security is principally traded, or lacking any sales or official closing price on a particular day, the security may be valued at the closing bid price on that day. Securities traded in theover-the-counter market are valued based on prices furnished by independent pricing services or market makers. When such securities are valued by an independent pricing service they may be considered fair valued. Futures contracts are valued at the final settlement price set by an exchange on which they are principally traded. Listed options are valued at the mean between the last bid and asked prices from the exchange on which they are principally traded. Options not listed on an exchange are valued by an independent source at the mean between the last bid and asked prices. For purposes of determining net asset value (“NAV”) per share, futures and option contracts generally are valued 15 minutes after the close of the customary trading session of the New York Stock Exchange (“NYSE”).
Investments inopen-end andclosed-end registered investment companies that do not trade on an exchange are valued at theend-of-day net asset value per share. Investments inopen-end andclosed-end registered investment companies that trade on an exchange are valued at the last sales price or official closing price as of the close of the customary trading session on the exchange where the security is principally traded.
Debt obligations (including convertible securities) and unlisted equities are fair valued using an evaluated quote provided by an independent pricing service. Evaluated quotes provided by the pricing service may be determined without exclusive reliance on quoted prices, and may reflect appropriate factors such asinstitution-size trading in similar groups of securities, developments related to specific securities, dividend rate (for unlisted equities), yield (for debt obligations), quality, type of issue, coupon rate (for debt obligations), maturity (for debt obligations), individual trading characteristics and other market data. Pricing services generally value debt obligations assuming orderly transactions of institutional round lot size, but a fund may hold or transact in the same securities in smaller, odd lot sizes. Odd lots often trade at lower prices than institutional round lots. Debt obligations are subject to interest rate and credit risks. In addition, all debt obligations involve some risk of default with respect to interest and/or principal payments.
Foreign securities’ (including foreign exchange contracts) prices are converted into U.S. dollar amounts using the applicable exchange rates as of the close of the NYSE. If market quotations are available and reliable for foreign exchange-traded equity securities, the securities will be valued at the market quotations. Because trading hours for certain foreign securities end before the close of the NYSE, closing market quotations may become unreliable. If between the time trading ends on a particular security and the close of the customary trading session on the NYSE, events occur that the investment adviser determines are significant and make the closing price unreliable, the Fund may fair value the security. If the event is likely to have affected the closing price of the security, the security will be valued at fair value in good faith using procedures approved by the Board of Trustees. Adjustments to closing prices to reflect fair value may also be based on a screening process of an independent pricing service to indicate the degree of certainty, based on historical data, that the closing price in the principal market where a foreign security trades is not the current value as of the close of the NYSE. Foreign securities’ prices meeting the approved degree of certainty that the price is not reflective of current value will be priced at the indication of fair value from the independent pricing service. Multiple factors may be considered by the independent pricing service in determining adjustments to reflect fair value and may include information relating to sector indices, American Depositary Receipts and domestic and foreign index futures. Foreign securities may have additional risks including exchange rate changes, potential for sharply devalued currencies and high inflation, political and economic upheaval, the relative lack of issuer information, relatively low market liquidity and the potential lack of strict financial and accounting controls and standards.
Securities for which market prices are not provided by any of the above methods may be valued based upon quotes furnished by independent sources. The last bid price may be used to value equity securities. The mean between the last bid and asked prices is used to value debt obligations, including corporate loans.
Securities for which market quotations are not readily available or became unreliable are valued at fair value as determined in good faith by or under the supervision of the Trust’s officers following procedures approved by the Board of Trustees. Issuer specific events, market trends, bid/asked quotes of brokers and information providers and other market data may be reviewed in the course of making a good faith determination of a security’s fair value.
The Fund may invest in securities that are subject to interest rate risk, meaning the risk that the prices will generally fall as interest rates rise and, conversely, the prices will generally rise as interest rates fall. Specific securities differ in their sensitivity to changes in interest rates
depending on their individual characteristics. Changes in interest rates may result in increased market volatility, which may affect the value and/or liquidity of certain Fund investments.
Valuations change in response to many factors including the historical and prospective earnings of the issuer, the value of the issuer’s assets, general economic conditions, interest rates, investor perceptions and market liquidity. Because of the inherent uncertainties of valuation, the values reflected in the financial statements may materially differ from the value received upon actual sale of those investments.
| B. | Securities Transactions and Investment Income– Securities transactions are accounted for on a trade date basis. Realized gains or losses on sales are computed on the basis of specific identification of the securities sold. Interest income (net of withholding tax, if any) is recorded on the accrual basis from settlement date. Dividend income (net of withholding tax, if any) is recorded on theex-dividend date. |
The Fund may periodically participate in litigation related to Fund investments. As such, the Fund may receive proceeds from litigation settlements. Any proceeds received are included in the Statement of Operations as realized gain (loss) for investments no longer held and as unrealized gain (loss) for investments still held.
Brokerage commissions and mark ups are considered transaction costs and are recorded as an increase to the cost basis of securities purchased and/or a reduction of proceeds on a sale of securities. Such transaction costs are included in the determination of net realized and unrealized gain (loss) from investment securities reported in the Statement of Operations and the Statement of Changes in Net Assets and the net realized and unrealized gains (losses) on securities per share in the Financial Highlights. Transaction costs are included in the calculation of the Fund’s net asset value and, accordingly, they reduce the Fund’s total returns. These transaction costs are not considered operating expenses and are not reflected in net investment income reported in the Statement of Operations and the Statement of Changes in Net Assets, or the net investment income per share and the ratios of expenses and net investment income reported in the Financial Highlights, nor are they limited by any expense limitation arrangements between the Fund and the investment adviser.
The Fund allocates income and realized and unrealized capital gains and losses to a class based on the relative net assets of each class.
| C. | Country Determination– For the purposes of making investment selection decisions and presentation in the Schedule of Investments, the investment adviser may determine the country in which an issuer is located and/or credit risk exposure based on various factors. These factors include the laws of the country under which the issuer is organized, where the issuer maintains a principal office, the country in which the issuer derives 50% or more of its total revenues and the country that has the primary market for the issuer’s securities, as well as other criteria. Among the other criteria that may be evaluated for making this determination are the country in which the issuer maintains 50% or more of its assets, the type of security, financial guarantees and enhancements, the nature of the collateral and the sponsor organization. Country of issuer and/or credit risk exposure has been determined to be the United States of America, unless otherwise noted. |
| D. | Distributions– Distributions from net investment income and net realized capital gain, if any, are generally declared and paid annually and recorded on theex-dividend date. The Fund may elect to treat a portion of the proceeds from redemptions as distributions for federal income tax purposes. |
| E. | Federal Income Taxes –The Fund intends to comply with the requirements of Subchapter M of the Internal Revenue Code of 1986, as amended (the “Internal Revenue Code”), necessary to qualify as a regulated investment company and to distribute substantially all of the Fund’s taxable earnings to shareholders. As such, the Fund will not be subject to federal income taxes on otherwise taxable income (including net realized capital gain) that is distributed to shareholders. Therefore, no provision for federal income taxes is recorded in the financial statements. |
The Fund recognizes the tax benefits of uncertain tax positions only when the position is more likely than not to be sustained. Management has analyzed the Fund’s uncertain tax positions and concluded that no liability for unrecognized tax benefits should be recorded related to uncertain tax positions. Management is not aware of any tax positions for which it is reasonably possible that the total amounts of unrecognized tax benefits will change materially in the next 12 months.
The Fund files tax returns in the U.S. Federal jurisdiction and certain other jurisdictions. Generally, the Fund is subject to examinations by such taxing authorities for up to three years after the filing of the return for the tax period.
| F. | Expenses –Fees provided for under the Rule12b-1 plan of a particular class of the Fund are charged to the operations of such class. Transfer agency fees and expenses and other shareholder recordkeeping fees and expenses attributable to Class R5 and Class R6 are allocated to each share class based on relative net assets.Sub-accounting fees attributable to Class R5 are charged to the operations of the class. Transfer agency fees and expenses and other shareholder recordkeeping fees and expenses relating to all other classes are allocated among those classes based on relative net assets. All other expenses are allocated among the classes based on relative net assets. |
| G. | Accounting Estimates –The preparation of financial statements in conformity with accounting principles generally accepted in the United States of America (“GAAP”) requires management to make estimates and assumptions that affect the reported amounts of assets and liabilities at the date of the financial statements and the reported amounts of revenues and expenses during the reporting period including estimates and assumptions related to taxation. Actual results could differ from those estimates by a significant amount. In addition, the Fund monitors for material events or transactions that may occur or become known after theperiod-end date and before the date the financial statements are released to print. |
| H. | Indemnifications– Under the Trust’s organizational documents, each Trustee, officer, employee or other agent of the Trust is indemnified against certain liabilities that may arise out of the performance of their duties to the Fund. Additionally, in the normal course of business, the Fund enters into contracts, including the Fund’s servicing agreements, that contain a variety of indemnification clauses. The Fund’s maximum exposure under these arrangements is unknown as this would involve future claims that may be made against the Fund that have not yet occurred. The risk of material loss as a result of such indemnification claims is considered remote. |
| I. | Securities Lending– The Fund may lend portfolio securities having a market value up toone-third of the Fund’s total assets. Such loans are secured by collateral equal to no less than the market value of the loaned securities determined daily by the securities lending provider. Such collateral will be cash or debt securities issued or guaranteed by the U.S. Government or any of its sponsored agencies. Cash collateral received in connection with these loans is invested in short-term money market instruments or affiliated money market funds and is shown as such on the Schedule of Investments. The Fund bears the risk of loss with respect to the investment of collateral. It is the Fund’s policy to obtain additional collateral from or return excess collateral to the borrower by the end of the next business day, following the valuation date of the securities loaned. Therefore, the value of the collateral held may be temporarily less than the value of the securities on loan. When loaning securities, the Fund retains certain benefits of owning the securities, including the economic equivalent of dividends or interest generated by the security. Lending securities entails a risk of loss to the Fund if, and to the extent that, the market value of the securities loaned were to increase and the |
| | borrower did not increase the collateral accordingly, and the borrower failed to return the securities. The securities loaned are subject to termination at the option of the borrower or the Fund. Upon termination, the borrower will return to the Fund the securities loaned and the Fund will return the collateral. Upon the failure of the borrower to return the securities, collateral may be liquidated and the securities may be purchased on the open market to replace the loaned securities. The Fund could experience delays and costs in gaining access to the collateral and the securities may lose value during the delay which could result in potential losses to the Fund. Some of these losses may be indemnified by the lending agent. The Fund bears the risk of any deficiency in the amount of the collateral available for return to the borrower due to any loss on the collateral invested. Dividends received on cash collateral investments for securities lending transactions, which are net of compensation to counterparties, are included inDividends from affiliated money market funds on the Statement of Operations. The aggregate value of securities out on loan, if any, is shown as a footnote on the Statement of Assets and Liabilities. |
| J. | Foreign Currency Translations– Foreign currency is valued at the close of the NYSE based on quotations posted by banks and major currency dealers. Portfolio securities and other assets and liabilities denominated in foreign currencies are translated into U.S. dollar amounts at the date of valuation. Purchases and sales of portfolio securities (net of foreign taxes withheld on disposition) and income items denominated in foreign currencies are translated into U.S. dollar amounts on the respective dates of such transactions. The Fund does not separately account for the portion of the results of operations resulting from changes in foreign exchange rates on investments and the fluctuations arising from changes in market prices of securities held. The combined results of changes in foreign exchange rates and the fluctuation of market prices on investments (net of estimated foreign tax withholding) are included with the net realized and unrealized gain or loss from investments in the Statement of Operations. Reported net realized foreign currency gains or losses arise from (1) sales of foreign currencies, (2) currency gains or losses realized between the trade and settlement dates on securities transactions, and (3) the difference between the amounts of dividends, interest, and foreign withholding taxes recorded on the Fund’s books and the U.S. dollar equivalent of the amounts actually received or paid. Net unrealized foreign currency gains and losses arise from changes in the fair values of assets and liabilities, other than investments in securities at fiscal period end, resulting from changes in exchange rates. |
The Fund may invest in foreign securities, which may be subject to foreign taxes on income, gains on investments or currency repatriation, a portion of which may be recoverable. Foreign taxes, if any, are recorded based on the tax regulations and rates that exist in the foreign markets in which the Fund invests and are shown in the Statement of Operations.
| K. | Forward Foreign Currency Contracts– The Fund may engage in foreign currency transactions either on a spot (i.e. for prompt delivery and settlement) basis, or through forward foreign currency contracts, to manage or minimize currency or exchange rate risk. |
The Fund may also enter into forward foreign currency contracts for the purchase or sale of a security denominated in a foreign currency in order to “lock in” the U.S. dollar price of that security, or the Fund may also enter into forward foreign currency contracts that do not provide for physical settlement of the two currencies, but instead are settled by a single cash payment calculated as the difference between the agreed upon exchange rate and the spot rate at settlement based upon an agreed upon notional amount(non-deliverable forwards). The Fund will set aside liquid assets in an amount equal to the dailymark-to-market obligation for forward foreign currency contracts.
A forward foreign currency contract is an obligation between two parties (“Counterparties”) to purchase or sell a specific currency for an agreed-upon price at a future date. The use of forward foreign currency contracts does not eliminate fluctuations in the price of the underlying securities the Fund owns or intends to acquire but establishes a rate of exchange in advance. Fluctuations in the value of these contracts are measured by the difference in the contract date and reporting date exchange rates and are recorded as unrealized appreciation (depreciation) until the contracts are closed. When the contracts are closed, realized gains (losses) are recorded. Realized and unrealized gains (losses) on the contracts are included in the Statement of Operations. The primary risks associated with forward foreign currency contracts include failure of the Counterparty to meet the terms of the contract and the value of the foreign currency changing unfavorably. These risks may be in excess of the amounts reflected in the Statement of Assets and Liabilities.
NOTE 2–Advisory Fees and Other Fees Paid to Affiliates
The Trust has entered into a master investment advisory agreement with Invesco Advisers, Inc. (the “Adviser” or “Invesco”). Under the terms of the investment advisory agreement, the Fund accrues daily and pays monthly an advisory fee to the Adviser based on the annual rate of the Fund’s average daily net assets as follows:
| | |
| Average Daily Net Assets | | Rate |
First $10 million | | 1.000% |
Next $140 million | | 0.750% |
| Over $150 million | | 0.625% |
For the year ended October 31, 2019, the effective advisory fee rate incurred by the Fund was 0.63%.
Under the terms of a mastersub-advisory agreement between the Adviser and each of Invesco Asset Management Deutschland GmbH, Invesco Asset Management Limited, Invesco Asset Management (Japan) Limited, Invesco Hong Kong Limited, Invesco Senior Secured Management, Inc. and Invesco Canada Ltd. (collectively, the “AffiliatedSub-Advisers”) the Adviser, not the Fund, will pay 40% of the fees paid to the Adviser to any such AffiliatedSub-Adviser(s) that provide(s) discretionary investment management services to the Fund based on the percentage of assets allocated to such AffiliatedSub-Adviser(s).
The Adviser has contractually agreed, through at least June 30, 2020, to waive advisory fees and/or reimburse expenses of all shares to the extent necessary to limit total annual fund operating expenses after fee waiver and/or expense reimbursement (excluding certain items discussed below) of Class A, Class C, Class P, Class S, Class Y, Class R5 and Class R6 shares to 2.00%, 2.75%, 1.85%, 1.90%, 1.75%, 1.75% and 1.75%, respectively, of average daily net assets (the “expense limits”). In determining the Adviser’s obligation to waive advisory fees and/or reimburse expenses, the following expenses are not taken into account, and could cause the total annual fund operating expenses after fee waiver and/or expense reimbursement to exceed the numbers reflected above: (1) interest; (2) taxes; (3) dividend expense on short sales; (4) extraordinary ornon-routine items, including litigation expenses; and (5) expenses that the Fund has incurred but did not actually pay because of an expense offset arrangement. Unless Invesco continues the fee waiver agreement, it will terminate on June 30, 2020. During its term, the fee waiver agreement
cannot be terminated or amended to increase the expense limits or reduce the advisory fee waiver without approval of the Board of Trustees. The Adviser did not waive fees and/or reimburse expenses during the period under these expense limits.
The Adviser has contractually agreed, through at least June 30, 2021, to waive the advisory fee payable by the Fund in an amount equal to 100% of the net advisory fees the Adviser receives from the affiliated money market funds on investments by the Fund of uninvested cash (excluding investments of cash collateral from securities lending) in such affiliated money market funds.
For the year ended October 31, 2019, the Adviser waived advisory fees of $7,185.
The Trust has entered into a master administrative services agreement with Invesco pursuant to which the Fund has agreed to pay Invesco for certain administrative costs incurred in providing accounting services to the Fund. For the year ended October 31, 2019, expenses incurred under the agreement are shown in the Statement of Operations asAdministrative services fees. Invesco has entered into asub-administration agreement whereby State Street Bank and Trust Company (“SSB”) serves as fund accountant and provides certain administrative services to the Fund. Pursuant to a custody agreement with the Trust on behalf of the Fund, SSB also serves as the Fund’s custodian.
The Trust has entered into a transfer agency and service agreement with Invesco Investment Services, Inc. (“IIS”) pursuant to which the Fund has agreed to pay IIS a fee for providing transfer agency and shareholder services to the Fund and reimburse IIS for certain expenses incurred by IIS in the course of providing such services. IIS may make payments to intermediaries that provide omnibus account services,sub-accounting services and/or networking services. All fees payable by IIS to intermediaries that provide omnibus account services orsub-accounting services are charged back to the Fund, subject to certain limitations approved by the Trust’s Board of Trustees. For the year ended October 31, 2019, expenses incurred under the agreement are shown in the Statement of Operations asTransfer agent fees.
The Fund has entered into master distribution agreements with Invesco Distributors, Inc. (“IDI”) to serve as the distributor for the Class A, Class C, Class P, Class S, Class Y, Class R5 and Class R6 shares. The Fund has adopted plans pursuant to Rule12b-1 under the 1940 Act with respect to the Fund’s Class A, Class C shares, Class P shares and Class S shares (collectively, the “Plans”). The Fund, pursuant to the Plans, pays IDI compensation at the annual rate of 0.25% of the Fund’s average daily net assets of Class A shares, 1.00% of the average daily net assets of Class C shares, 0.10% of the average daily net assets of Class P shares and 0.15% of the average daily net assets of Class S shares. The fees are accrued daily and paid monthly. Of the Plan payments, up to 0.25% of the average daily net assets of Class A and Class C shares, 0.10% of the average daily net assets of Class P shares and 0.15% of the average daily net assets of Class S shares may be paid to furnish continuing personal shareholder services to customers who purchase and own shares of such classes. Any amounts not paid as a service fee under the Plans would constitute an asset-based sales charge. Rules of the Financial Industry Regulatory Authority (“FINRA”) impose a cap on the total sales charges, including asset-based sales charges, that may be paid by any class of shares of the Fund. For the year ended October 31, 2019, expenses incurred under the Plans are shown in the Statement of Operations as Distribution fees.
Front-end sales commissions and CDSC (collectively, the “sales charges”) are not recorded as expenses of the Fund.Front-end sales commissions are deducted from proceeds from the sales of Fund shares prior to investment in Class A shares of the Fund. CDSC are deducted from redemption proceeds prior to remittance to the shareholder. During the year ended October 31, 2019, IDI advised the Fund that IDI retained $109,604 infront-end sales commissions from the sale of Class A shares and $951 and $1,691 from Class A and Class C shares, respectively, for CDSC imposed upon redemptions by shareholders.
For the year ended October 31, 2019, the Fund incurred $15,398 in brokerage commissions with Invesco Capital Markets, Inc., an affiliate of the Adviser and IDI, for portfolio transactions executed on behalf of the Fund.
Certain officers and trustees of the Trust are officers and directors of the Adviser, IIS and/or IDI.
NOTE 3–Additional Valuation Information
GAAP defines fair value as the price that would be received to sell an asset or paid to transfer a liability in an orderly transaction between market participants at the measurement date, under current market conditions. GAAP establishes a hierarchy that prioritizes the inputs to valuation methods, giving the highest priority to readily available unadjusted quoted prices in an active market for identical assets (Level 1) and the lowest priority to significant unobservable inputs (Level 3), generally when market prices are not readily available or are unreliable. Based on the valuation inputs, the securities or other investments are tiered into one of three levels. Changes in valuation methods may result in transfers in or out of an investment’s assigned level:
| | | | |
| Level 1 | | – | | Prices are determined using quoted prices in an active market for identical assets. |
| Level 2 | | – | | Prices are determined using other significant observable inputs. Observable inputs are inputs that other market participants may use in pricing a security. These may include quoted prices for similar securities, interest rates, prepayment speeds, credit risk, yield curves, loss severities, default rates, discount rates, volatilities and others. |
| Level 3 | | – | | Prices are determined using significant unobservable inputs. In situations where quoted prices or observable inputs are unavailable (for example, when there is little or no market activity for an investment at the end of the period), unobservable inputs may be used. Unobservable inputs reflect the Fund’s own assumptions about the factors market participants would use in determining fair value of the securities or instruments and would be based on the best available information. |
The following is a summary of the tiered valuation input levels, as of October 31, 2019. The level assigned to the securities valuations may not be an indication of the risk or liquidity associated with investing in those securities. Because of the inherent uncertainties of valuation, the values reflected in the financial statements may materially differ from the value received upon actual sale of those investments.
| | | | | | | | | | | | | | |
| | | Level 1 | | | Level 2 | | | Level 3 | | | Total |
| Investments in Securities | | | | | | | | | | | | | | |
Common Stocks & Other Equity Interests | | | $2,279,209,887 | | | $ | 140,542,296 | | | | $- | | | $2,419,752,183 |
Money Market Funds | | | 7,804,193 | | | | - | | | | - | | | 7,804,193 |
Total Investments | | | $2,287,014,080 | | | | $140,542,296 | | | | $- | | | $2,427,556,376 |
NOTE 4–Security Transactions with Affiliated Funds
The Fund is permitted to purchase or sell securities from or to certain other Invesco Funds under specified conditions outlined in procedures adopted by the Board of Trustees of the Trust. The procedures have been designed to ensure that any purchase or sale of securities by the Fund from or to another fund or portfolio that is or could be considered an affiliate by virtue of having a common investment adviser (or affiliated investment advisers), common Trustees and/or common officers complies with Rule17a-7 of the 1940 Act. Further, as defined under the procedures, each transaction is effected at the current market price. Pursuant to these procedures, for the year ended October 31, 2019, the Fund engaged in securities purchases of $83,357,967 and securities sales of $68,778,649, which resulted in net realized gains of $34,091,959.
NOTE 5–Expense Offset Arrangement(s)
The expense offset arrangement is comprised of transfer agency credits which result from balances in demand deposit accounts used by the transfer agent for clearing shareholder transactions. For the year ended October 31, 2019, the Fund received credits from this arrangement, which resulted in the reduction of the Fund’s total expenses of $37,312.
NOTE 6–Trustees’ and Officers’ Fees and Benefits
Trustees’ and Officers’ Fees and Benefits include amounts accrued by the Fund to pay remuneration to certain Trustees and Officers of the Fund. Trustees have the option to defer compensation payable by the Fund, andTrustees’ and Officers’ Fees and Benefits also include amounts accrued by the Fund to fund such deferred compensation amounts. Those Trustees who defer compensation have the option to select various Invesco Funds in which their deferral accounts shall be deemed to be invested. Finally, certain current Trustees were eligible to participate in a retirement plan that provided for benefits to be paid upon retirement to Trustees over a period of time based on the number of years of service. The Fund may have certain former Trustees who also participate in a retirement plan and receive benefits under such plan.Trustees’ and Officers’ Fees and Benefits include amounts accrued by the Fund to fund such retirement benefits. Obligations under the deferred compensation and retirement plans represent unsecured claims against the general assets of the Fund.
NOTE 7–Cash Balances
The Fund is permitted to temporarily carry a negative or overdrawn balance in its account with SSB, the custodian bank. Such balances, if any atperiod-end, are shown in the Statement of Assets and Liabilities under the payable caption Amount due custodian. To compensate the custodian bank for such overdrafts, the overdrawn Fund may either (1) leave funds as a compensating balance in the account so the custodian bank can be compensated by earning the additional interest; or (2) compensate by paying the custodian bank at a rate agreed upon by the custodian bank and Invesco, not to exceed the contractually agreed upon rate.
NOTE 8–Distributions to Shareholders and Tax Components of Net Assets
Tax Character of Distributions to Shareholders Paid During the Fiscal Years Ended October 31, 2019 and 2018
| | | | | | | | |
| | | 2019 | | | 2018 | |
| |
| Ordinary income | | $ | 86,978 | | | $ | 5,946,634 | |
| |
| Long-term capital gain | | | 217,519,764 | | | | 72,905,635 | |
| |
| Total distributions | | $ | 217,606,742 | | | $ | 78,852,269 | |
| |
Tax Components of Net Assets atPeriod-End:
| | | | |
| | | 2019 | |
| |
| Undistributed long-term capital gain | | $ | 203,247,000 | |
| |
| Net unrealized appreciation – investments | | | 1,055,905,981 | |
| |
| Net unrealized appreciation (depreciation) – foreign currencies | | | (735 | ) |
| |
| Temporary book/tax differences | | | (379,849 | ) |
| |
| Late-Year ordinary loss deferral | | | (679,687 | ) |
| |
| Shares of beneficial interest | | | 1,162,020,516 | |
| |
| Total net assets | | $ | 2,420,113,226 | |
| |
The difference between book-basis andtax-basis unrealized appreciation (depreciation) is due to differences in the timing of recognition of gains and losses on investments for tax and book purposes. The Fund’s net unrealized appreciation difference is attributable primarily to wash sales.
The temporary book/tax differences are a result of timing differences between book and tax recognition of income and/or expenses. The Fund’s temporary book/tax differences are the result of the trustee deferral of compensation and retirement plan benefits.
Capital loss carryforward is calculated and reported as of a specific date. Results of transactions and other activity after that date may affect the amount of capital loss carryforward actually available for the Fund to utilize. Capital losses generated in years beginning after December 22, 2010 can be carried forward for an unlimited period, whereas previous losses expire in eight tax years. Capital losses with an expiration period may not be used to offset capital gains until all net capital losses without an expiration date have been utilized. Capital loss carryforwards with no expiration date will retain their character as either short-term or long-term capital losses instead of as short-term capital losses as under prior law. The ability to utilize capital loss carryforwards in the future may be limited under the Internal Revenue Code and related regulations based on the results of future transactions.
The Fund does not have a capital loss carryforward as of October 31, 2019.
NOTE 9–Investment Transactions
The aggregate amount of investment securities (other than short-term securities, U.S. Treasury obligations and money market funds, if any) purchased and sold by the Fund during the year ended October 31, 2019 was $667,100,794 and $795,880,688, respectively. Cost of investments, including any derivatives, on a tax basis includes the adjustments for financial reporting purposes as of the most recently completed federal income tax reportingperiod-end.
| | | | |
Unrealized Appreciation (Depreciation) of Investments on a Tax Basis | |
| |
| Aggregate unrealized appreciation of investments | | | $1,074,567,868 | |
| |
| Aggregate unrealized (depreciation) of investments | | | (18,661,887 | ) |
| |
| Net unrealized appreciation of investments | | | $1,055,905,981 | |
| |
Cost of investments for tax purposes is $1,371,650,395.
NOTE 10–Reclassification of Permanent Differences
Primarily as a result of differing book/tax treatment of net operating losses, partnership transactions and REIT distributions, on October 31, 2019, undistributed net investment income (loss) was increased by $317,190 and undistributed net realized gain was decreased by $317,190. This reclassification had no effect on the net assets or the distributable earnings of the Fund.
NOTE 11–Share Information
| | | | | | | | | | | | | | | | | | |
| | | | | | Summary of Share Activity | | | | |
| |
| | | | | | Years ended October 31, | | | | |
| | | | |
| | | 2019 | | | | | 2018 | |
| | | | | | | | | | |
| | | Shares | | | Amount | | | | | Shares | | | Amount | |
| |
|
| Sold: | |
Class A | | | 3,148,737 | | | $ | 63,824,110 | | | | | | 2,747,684 | | | $ | 58,734,837 | |
| |
Class B(a) | | | - | | | | - | | | | | | 796 | | | | 14,719 | |
| |
Class C | | | 316,732 | | | | 5,619,115 | | | | | | 645,661 | | | | 12,462,679 | |
| |
Class P | | | 1,279,251 | | | | 26,015,956 | | | | | | 1,343,366 | | | | 28,723,804 | |
| |
Class S | | | 5,172 | | | | 106,063 | | | | | | 3,893 | | | | 83,837 | |
| |
Class Y | | | 274,954 | | | | 5,491,428 | | | | | | 600,267 | | | | 12,700,327 | |
| |
Class R5 | | | 673 | | | | 13,508 | | | | | | 2,500 | | | | 55,861 | |
| |
Class R6 | | | 134,890 | | | | 2,776,548 | | | | | | 611,749 | | | | 13,282,861 | |
| |
|
| Issued as reinvestment of dividends: | |
Class A | | | 641,737 | | | | 11,397,250 | | | | | | 147,603 | | | | 2,894,554 | |
| |
Class B(a) | | | - | | | | - | | | | | | 758 | | | | 13,577 | |
| |
Class C | | | 111,801 | | | | 1,772,053 | | | | | | 25,759 | | | | 460,049 | |
| |
Class P | | | 10,930,519 | | | | 197,405,168 | | | | | | 3,694,772 | | | | 73,415,062 | |
| |
Class S | | | 19,124 | | | | 342,325 | | | | | | 6,502 | | | | 128,288 | |
| |
Class Y | | | 69,581 | | | | 1,253,149 | | | | | | 30,410 | | | | 602,431 | |
| |
Class R5 | | | 294 | | | | 5,313 | | | | | | - | | | | - | |
| |
Class R6 | | | 60,394 | | | | 1,093,129 | | | | | | - | | | | - | |
| |
|
| Conversion of Class B shares to Class A shares:(b) | |
Class A | | | - | | | | - | | | | | | 16,457 | | | | 354,658 | |
| |
Class B | | | - | | | | - | | | | | | (18,081 | ) | | | (354,658 | ) |
| |
|
| Automatic conversion of Class C shares to Class A shares: | |
Class A | | | 135,282 | | | | 2,539,403 | | | | | | - | | | | - | |
| |
Class C | | | (151,835 | ) | | | (2,539,403 | ) | | | | | - | | | | - | |
| |
| | | | | | | | | | | | | | | | | | |
| | | Summary of Share Activity | |
| |
| | | | | | Years ended October 31, | | | | |
| | | | |
| | | 2019 | | | | | 2018 | |
| | | | | | | | | | |
| | | Shares | | | Amount | | | | | Shares | | | Amount | |
| |
| | | | | |
| Reacquired: | | | | | | | | | | | | | | | | | | |
Class A | | | (1,643,166 | ) | | $ | (32,647,578 | ) | | | | | (1,239,718 | ) | | $ | (26,178,608 | ) |
| |
Class B(a) | | | - | | | | - | | | | | | (2,262 | ) | | | (43,559 | ) |
| |
Class C | | | (369,501 | ) | | | (6,528,616 | ) | | | | | (283,018 | ) | | | (5,400,664 | ) |
| |
Class P | | | (8,846,916 | ) | | | (182,173,763 | ) | | | | | (9,145,348 | ) | | | (197,616,087 | ) |
| |
Class S | | | (18,293 | ) | | | (362,050 | ) | | | | | (21,290 | ) | | | (459,853 | ) |
| |
Class Y | | | (443,704 | ) | | | (8,981,652 | ) | | | | | (607,343 | ) | | | (13,040,915 | ) |
| |
Class R5 | | | (131 | ) | | | (2,332 | ) | | | | | (23 | ) | | | (488 | ) |
| |
Class R6 | | | (154,905 | ) | | | (3,147,838 | ) | | | | | (88,069 | ) | | | (1,916,447 | ) |
| |
| Net increase (decrease) in share activity | | | 5,500,690 | | | $ | 83,271,286 | | | | | | (1,526,975 | ) | | $ | (41,083,735 | ) |
| |
| (a) | Class B shares activity for the period November 1, 2017 through January 26, 2018 (date of conversion). |
| (b) | Effective as of the close of business January 26, 2018, all outstanding Class B shares were converted to Class A shares. |
Report of Independent Registered Public Accounting Firm
To the Board of Trustees of AIM Equity Funds (Invesco Equity Funds) and Shareholders of Invesco Summit Fund
Opinion on the Financial Statements
We have audited the accompanying statement of assets and liabilities, including the schedule of investments, of Invesco Summit Fund (one of the funds constituting AIM Equity Funds (Invesco Equity Funds), referred to hereafter as the “Fund”) as of October 31, 2019, the related statement of operations for the year ended October 31, 2019, the statement of changes in net assets for each of the two years in the period ended October 31, 2019, including the related notes, and the financial highlights for each of the periods indicated therein (collectively referred to as the “financial statements”). In our opinion, the financial statements present fairly, in all material respects, the financial position of the Fund as of October 31, 2019, the results of its operations for the year then ended, the changes in its net assets for each of the two years in the period ended October 31, 2019 and the financial highlights for each of the periods indicated therein in conformity with accounting principles generally accepted in the United States of America.
Basis for Opinion
These financial statements are the responsibility of the Fund’s management. Our responsibility is to express an opinion on the Fund’s financial statements based on our audits. We are a public accounting firm registered with the Public Company Accounting Oversight Board (United States) (PCAOB) and are required to be independent with respect to the Fund in accordance with the U.S. federal securities laws and the applicable rules and regulations of the Securities and Exchange Commission and the PCAOB.
We conducted our audits of these financial statements in accordance with the standards of the PCAOB. Those standards require that we plan and perform the audit to obtain reasonable assurance about whether the financial statements are free of material misstatement, whether due to error or fraud.
Our audits included performing procedures to assess the risks of material misstatement of the financial statements, whether due to error or fraud, and performing procedures that respond to those risks. Such procedures included examining, on a test basis, evidence regarding the amounts and disclosures in the financial statements. Our audits also included evaluating the accounting principles used and significant estimates made by management, as well as evaluating the overall presentation of the financial statements. Our procedures included confirmation of securities owned as of October 31, 2019 by correspondence with the custodian, transfer agent and brokers; when replies were not received from brokers, we performed other auditing procedures. We believe that our audits provide a reasonable basis for our opinion.
/s/ PricewaterhouseCoopers LLP
Houston, Texas
December 23, 2019
We have served as the auditor of one or more of the investment companies in the Invesco group of investment companies since at least 1995. We have not been able to determine the specific year we began serving as auditor.
Calculating your ongoing Fund expenses
Example
As a shareholder of the Fund, you incur two types of costs: (1) transaction costs, which may include sales charges (loads) on purchase payments or contingent deferred sales charges on redemptions, if any; and (2) ongoing costs, including management fees, distribution and/or service(12b-1) fees, and other Fund expenses. This example is intended to help you understand your ongoing costs (in dollars) of investing in the Fund and to compare these costs with ongoing costs of investing in other mutual funds. The example is based on an investment of $1,000 invested at the beginning of the period and held for the entire period May 1, 2019 through October 31, 2019.
Actual expenses
The table below provides information about actual account values and actual expenses. You may use the information in this table, together with the amount you invested, to estimate the expenses that you paid over the period. Simply divide your account value by $1,000 (for example, an $8,600 account value divided by $1,000 = 8.6), then multiply the result by the number in the table under the heading entitled “Actual Expenses Paid During Period” to estimate the expenses you paid on your account during this period.
Hypothetical example for comparison purposes
The table below also provides information about hypothetical account values and hypothetical expenses based on the Fund’s actual expense ratio and an assumed rate of return of 5% per year before expenses, which is not the Fund’s actual return.
The hypothetical account values and expenses may not be used to estimate the actual ending account balance or expenses you paid for the period. You may use this information to compare the ongoing costs of investing in the Fund and other funds. To do so, compare this 5% hypothetical example with the 5% hypothetical examples that appear in the shareholder reports of the other funds.
Please note that the expenses shown in the table are meant to highlight your ongoing costs only and do not reflect any transaction costs, such as sales charges (loads) on purchase payments or contingent deferred sales charges on redemptions, if any. Therefore, the hypothetical information is useful in comparing ongoing costs only, and will not help you determine the relative total costs of owning different funds. In addition, if these transaction costs were included, your costs would have been higher.
| | | | | | | | | | | | | | | | | | | | | | | | | | | | | | |
| | | | | | | | | HYPOTHETICAL | | |
| | | | | | | | | (5% annual return before | | |
| | | | | ACTUAL | | expenses) | | |
| | | Beginning | | Ending | | Expenses | | Ending | | Expenses | | Annualized |
| | | Account Value | | Account Value | | Paid During | | Account Value | | Paid During | | Expense |
| | | (05/01/19) | | (10/31/19)1 | | Period2 | | (10/31/19) | | Period2 | | Ratio |
| Class A | | | | $1,000.00 | | | | | $1,039.60 | | | | | $5.14 | | | | | $1,020.16 | | | | | $5.09 | | | | | 1.00 | % |
| Class C | | | | 1,000.00 | | | | | 1,035.40 | | | | | 8.98 | | | | | 1,016.38 | | | | | 8.89 | | | | | 1.75 | |
| Class P | | | | 1,000.00 | | | | | 1,040.40 | | | | | 4.37 | | | | | 1,020.92 | | | | | 4.33 | | | | | 0.85 | |
| Class S | | | | 1,000.00 | | | | | 1,039.80 | | | | | 4.63 | | | | | 1,020.67 | | | | | 4.58 | | | | | 0.90 | |
| Class Y | | | | 1,000.00 | | | | | 1,040.90 | | | | | 3.86 | | | | | 1,021.42 | | | | | 3.82 | | | | | 0.75 | |
| Class R5 | | | | 1,000.00 | | | | | 1,040.70 | | | | | 3.91 | | | | | 1,021.37 | | | | | 3.87 | | | | | 0.76 | |
| Class R6 | | | | 1,000.00 | | | | | 1,041.20 | | | | | 3.65 | | | | | 1,021.63 | | | | | 3.62 | | | | | 0.71 | |
| 1 | The actual ending account value is based on the actual total return of the Fund for the period May 1, 2019 through October 31, 2019, after actual expenses and will differ from the hypothetical ending account value which is based on the Fund’s expense ratio and a hypothetical annual return of 5% before expenses. |
| 2 | Expenses are equal to the Fund’s annualized expense ratio as indicated above multiplied by the average account value over the period, multiplied by 184/365 to reflect the most recent fiscal half year. |
Approval of Investment Advisory andSub-Advisory Contracts
At meetings held on June 10, 2019, the Board of Trustees (the Board or the Trustees) of AIM Equity Funds (Invesco Equity Funds) as a whole, and the independent Trustees, who comprise over 75% of the Board, voting separately, approved the continuance of the Invesco Summit Fund’s (the Fund) Master Investment Advisory Agreement with Invesco Advisers, Inc. (Invesco Advisers and the investment advisory agreement) and the Master IntergroupSub-Advisory Contract for Mutual Funds with Invesco Asset Management Deutschland GmbH, Invesco Asset Management Limited, Invesco Asset Management (Japan) Limited, Invesco Hong Kong Limited, Invesco Senior Secured Management, Inc. and Invesco Canada Ltd. (collectively, the AffiliatedSub-Advisers and thesub-advisory contracts) for another year, effective July 1, 2019. After evaluating the factors discussed below, among others, the Board approved the renewal of the Fund’s investment advisory agreement and thesub-advisory contracts and determined that the compensation payable by the Fund to Invesco Advisers and by Invesco Advisers to the AffiliatedSub-Advisers is fair and reasonable.
The Board’s Evaluation Process
The Board’s Investments Committee has established threeSub-Committees, which meet throughout the year to review the performance of funds advised by Invesco Advisers (the Invesco Funds). As part of a regularly scheduled basis ofin-person Board meetings, theSub-Committees meet with portfolio managers for their assigned Invesco Funds and other members of management to review detailed information about investment performance and portfolio attributes of these funds. The Board took into account evaluations and reports that it received from the Investments Committee andSub-Committees, as well as the information provided to such committees and the Board throughout the year, in considering whether to approve each Invesco Fund’s investment advisory agreement andsub-advisory contracts.
As part of the contract renewal process, the Board reviews and considers information provided in response to detailed requests for information submitted to management by the independent Trustees with assistance from legal counsel to the independent Trustees. The Board receives comparative investment performance and fee data regarding the Invesco Funds prepared by Invesco Advisers and Broadridge Financial Solutions, Inc. (Broadridge), an independent mutual fund data provider. The Board also receives an independent written evaluation from the Senior Officer, an officer of the Invesco Funds who reports directly to the independent Trustees. The Senior Officer’s evaluation is prepared as part of his
responsibility to manage the process by which the Invesco Funds’ proposed management fees are negotiated during the annual contract renewal process to ensure they are negotiated in a manner that is at arms’ length and reasonable. In addition to meetings with Invesco Advisers and fund counsel throughout the year, the independent Trustees also discuss the continuance of the investment advisory agreement andsub-advisory contracts in separate sessions with the Senior Officer and with independent legal counsel.
The discussion below is a summary of the Senior Officer’s independent written evaluation with respect to the Fund’s investment advisory agreement, as well as a discussion of the material factors and related conclusions that formed the basis for the Board’s approval of the Fund’s investment advisory agreement andsub-advisory contracts. The Trustees’ review and conclusions are based on the comprehensive consideration of all information presented to them during the course of the year and in prior years and are not the result of any single determinative factor. Moreover, one Trustee may have weighed a particular piece of information or factor differently than another Trustee. This information is current as of June 10, 2019.
Factors and Conclusions and Summary of Independent Written Fee Evaluation
| A. | Nature, Extent and Quality of Services Provided by Invesco Advisers and the AffiliatedSub-Advisers |
The Board reviewed the nature, extent and quality of the advisory services provided to the Fund by Invesco Advisers under the Fund’s investment advisory agreement, and the credentials and experience of the officers and employees of Invesco Advisers who provide these services, including the Fund’s portfolio manager(s). The Board’s review included consideration of Invesco Advisers’ investment process oversight and structure, credit analysis and investment risk management. The Board also considerednon-advisory services that Invesco Advisers and its affiliates provide to the Invesco Funds such as various back office support functions, third party oversight, internal audit, valuation, portfolio trading and legal and compliance. The Board also received and reviewed information about Invesco Advisers’ role as administrator of the Invesco Funds’ liquidity risk management program. The Board also reviewed and considered the benefits to shareholders of investing in a fund that is part of the Invesco family of funds under the umbrella of Invesco Ltd., Invesco Advisers’ parent company, and noted Invesco Ltd.’s depth and experience in conducting an investment management business, as well as its
commitment of financial and other resources to such business. The Board reviewed and considered information about the resources that Invesco Advisers intends to continue to commit to managing the Invesco family of funds following Invesco Ltd.’s acquisition of OppenheimerFunds, Inc. and its subsidiaries. The Board concluded that the nature, extent and quality of the services provided to the Fund by Invesco Advisers are appropriate and satisfactory.
The Board reviewed the services that may be provided by the AffiliatedSub-Advisers under thesub-advisory contracts and the credentials and experience of the officers and employees of the AffiliatedSub-Advisers who provide these services. The Board noted the AffiliatedSub-Advisers’ expertise with respect to certain asset classes and that the AffiliatedSub-Advisers have offices and personnel that are located in financial centers around the world. As a result, the Board noted that the AffiliatedSub-Advisers can provide research and investment analysis on the markets and economies of various countries in which the Fund may invest, make recommendations regarding securities and assist with security trades. The Board concluded that thesub-advisory contracts may benefit the Fund and its shareholders by permitting Invesco Advisers to use the resources and talents of the AffiliatedSub-Advisers in managing the Fund. The Board concluded that the nature, extent and quality of the services that may be provided by the AffiliatedSub-Advisers are appropriate and satisfactory.
| B. | Fund Investment Performance |
The Board considered Fund investment performance as a relevant factor in considering whether to approve the investment advisory agreement. The Board did not view Fund investment performance as a relevant factor in considering whether to approve thesub-advisory contracts for the Fund, as no AffiliatedSub-Adviser currently manages assets of the Fund.
The Board compared the Fund’s investment performance over multiple time periods ending December 31, 2018 to the performance of funds in the Broadridge performance universe and against the LipperMulti-Cap Growth Funds Index. The Board noted that performance of Class A shares of the Fund was in the third quintile of its performance universe for the one, three and five year periods (the first quintile being the best performing funds and the fifth quintile being the worst performing funds). The Board noted that performance of Class A shares of the Fund was above the performance of the Index for the one year period, and reasonably comparable to the performance of the Index for
the three and five year periods. The Trustees also reviewed more recent Fund performance and this review did not change their conclusions.
| C. | Advisory andSub-Advisory Fees and Fund Expenses |
The Board compared the Fund’s contractual management fee rate to the contractual management fee rates of funds in the Fund’s Broadridge expense group. The Board noted that the contractual management fee rate for Class A shares of the Fund was below the median contractual management fee rate of funds in its expense group. The Board noted that the term “contractual management fee” for funds in the expense group may include both advisory and certainnon-portfolio management administrative services fees, but that Broadridge does not provide information on a fund by fund basis as to what is included. The Board also reviewed the methodology used by Broadridge in providing expense group information, which includes using each fund’s contractual management fee schedule (including any applicable breakpoints) as reported in the most recent prospectus or statement of additional information for each fund in the expense group. The Board also considered comparative information regarding the Fund’s total expense ratio and its various components.
The Board noted that Invesco Advisers has contractually agreed to waive fees and/or limit expenses of the Fund for the term disclosed in the Fund’s registration statement in an amount necessary to limit total annual operating expenses to a specified percentage of average daily net assets for each class of the Fund.
The Board noted that Invesco Advisers and the AffiliatedSub-Advisers do not manage other similarly managed mutual funds or client accounts.
The Board also considered the services that may be provided by the AffiliatedSub-Advisers pursuant to thesub-advisory contracts, as well as the fees payable by Invesco Advisers to the AffiliatedSub-Advisers pursuant to thesub-advisory contracts.
| D. | Economies of Scale and Breakpoints |
The Board considered the extent to which there may be economies of scale in the provision of advisory services to the Fund. The Board considered Invesco’s reinvestment in its business, including investments in business infrastructure and cybersecurity. The Board also considered that the Fund benefits from economies of scale through contractual breakpoints in the Fund’s advisory fee schedule, which generally operate to reduce the Fund’s expense ratio as it grows in size. The Board noted that the Fund shares directly in economies of scale through lower fees charged by third party service providers based on the combined size of the Invesco Funds. The Board noted that the Fund may also benefit from
economies of scale through initial fee setting, fee waivers and expense reimbursements.
| E. | Profitability and Financial Resources |
The Board reviewed information from Invesco Advisers concerning the costs of the advisory and other services that Invesco Advisers and its affiliates provide to the Fund and the Invesco Funds and the profitability of Invesco Advisers and its affiliates in providing these services. The Board considered the methodology used for calculating profitability and noted the periodic review of such methodology by an independent consultant. The Board noted that Invesco Advisers continues to operate at a net profit from services Invesco Advisers and its affiliates provide to the Invesco Funds and the Fund. The Board did not deem the level of profits realized by Invesco Advisers and its affiliates from providing services to the Fund to be excessive given the nature, extent and quality of the services provided. The Board received information from Invesco Advisers demonstrating that Invesco Advisers and the AffiliatedSub-Advisers are financially sound and have the resources necessary to perform their obligations under the investment advisory agreement andsub-advisory contracts.
| F. | Collateral Benefits to Invesco Advisers and its Affiliates |
The Board considered various other benefits received by Invesco Advisers and its affiliates from the relationship with the Fund, including the fees received for providing administrative, transfer agency and distribution services to the Fund. The Board considered comparative information regarding fees charged for these services, including information provided by Broadridge and other independent sources. The Board considered the performance of Invesco Advisers and its affiliates in providing these services and the organizational structure employed to provide these services. The Board also considered that these services are provided to the Fund pursuant to written contracts that are reviewed and approved on an annual basis by the Board; and that the services are required for the operation of the Fund.
The Board considered the benefits realized by Invesco Advisers and the AffiliatedSub-Advisers as a result of portfolio brokerage transactions executed through “soft dollar” arrangements. The Board noted that soft dollar arrangements may result in the Fund bearing costs to purchase research that may be used by Invesco Advisers or the AffiliatedSub-Advisers with other clients and may reduce Invesco Advisers’ or the AffiliatedSub-Advisers’ expenses. The Board also considered that it receives periodic reports from Invesco representing that these arrangements are consistent with regulatory requirements. The Board did not deem the soft dollar arrangements to be inappropriate.
The Board considered that the Fund’s uninvested cash and cash collateral from any securities lending arrangements may be invested in money market funds advised by
Invesco Advisers pursuant to procedures approved by the Board. The Board considered information regarding the returns of the affiliated money market funds relative to comparable overnight investments, as well as the costs to the Fund of such investments. The Board noted that Invesco Advisers receives advisory fees from these affiliated money market funds attributable to such investments, although Invesco Advisers has contractually agreed to waive through varying periods the advisory fees payable by the Invesco Funds with respect to certain investments in the affiliated money market funds. The waiver is in an amount equal to 100% of the net advisory fee Invesco Advisers receives from the affiliated money market funds with respect to the Fund’s investment in the affiliated money market funds of uninvested cash, but not cash collateral. The Board concluded that the amount of advisory fees received by Invesco Advisers from the Fund’s investment of cash collateral from any securities lending arrangements in the affiliated money market funds is fair and reasonable.
The Board also considered that an affiliated broker may receive commissions for executing certain trades for the Fund. Invesco Advisers and the AffiliatedSub-Advisers may use the affiliated broker to, among other things, control order routing and minimize information leakage, and the Board was advised that such trades are executed in compliance with rules under the federal securities laws and consistent with best execution obligations.
Tax Information
Form1099-DIV, Form1042-S and other year-end tax information provide shareholders with actual calendar year amounts that should be included in their tax returns. Shareholders should consult their tax advisers.
The following distribution information is being provided as required by the Internal Revenue Code or to meet a specific state’s requirement.
The Fund designates the following amounts or, if subsequently determined to be different, the maximum amount allowable for its fiscal year ended October 31, 2019:
| | | | | | |
Federal and State Income Tax | | | | | | |
| Long-Term Capital Gain Distributions | | $ | 217,519,764 | | | |
| Qualified Dividend Income* | | | 100 | % | | |
| Corporate Dividends Received Deduction* | | | 100 | % | | |
| U.S. Treasury Obligations* | | | 0 | % | | |
|
* The above percentages are based on ordinary income dividends paid to shareholders during the Fund’s fiscal year. |
Trustees and Officers
The address of each trustee and officer is AIM Equity Funds (Invesco Equity Funds) (the “Trust”), 11 Greenway Plaza, Suite 1000, Houston, Texas 77046-1173. The trustees serve for the life of the Trust, subject to their earlier death, incapacitation, resignation, retirement or removal as more specifically provided in the Trust’s organizational documents. Each officer serves for a one year term or until their successors are elected and qualified. Column two below includes length of time served with predecessor entities, if any.
| | | | | | | | |
Name, Year of Birth and Position(s) Held with the Trust | | Trustee and/or Officer Since | | Principal Occupation(s) During Past 5 Years | | Number of
Funds in
Fund Complex
Overseen by
Trustee | | Other Directorship(s)
Held by Trustee
During Past 5 Years |
| Interested Persons | | | | | | | | |
| Martin L. Flanagan1– 1960 Trustee and Vice Chair | | 2007 | | Executive Director, Chief Executive Officer and President, Invesco Ltd. (ultimate parent of Invesco and a global investment management firm); Trustee and Vice Chair, The Invesco Funds; Vice Chair, Investment Company Institute; and Member of Executive Board, SMU Cox School of Business Formerly: Advisor to the Board, Invesco Advisers, Inc. (formerly known as Invesco Institutional (N.A.), Inc.); Chairman and Chief Executive Officer, Invesco Advisers, Inc. (registered investment adviser); Director, Chairman, Chief Executive Officer and President, Invesco Holding Company (US), Inc. (formerly IVZ Inc.) (holding company), Invesco Group Services, Inc. (service provider) and Invesco North American Holdings, Inc. (holding company); Director, Chief Executive Officer and President, Invesco Holding Company Limited (parent of Invesco and a global investment management firm); Director, Invesco Ltd.; Chairman, Investment Company Institute and President,Co-Chief Executive Officer,Co-President, Chief Operating Officer and Chief Financial Officer, Franklin Resources, Inc. (global investment management organization) | | 229 | | None |
| Philip A. Taylor2– 1954 Trustee | | 2006 | | Vice Chair, Invesco Ltd.; Trustee, The Invesco Funds Formerly: Director, Invesco Canada Ltd. (formerly known as Invesco Trimark Ltd./Invesco Trimark Ltèe) (registered investment adviser and registered transfer agent); Head of the Americas and Senior Managing Director, Invesco Ltd.; Director, Invesco Advisers, Inc. (formerly known as Invesco Institutional (N.A.), Inc.) (registered investment adviser); Director and Chairman, Invesco Investment Services, Inc. (formerly known as Invesco AIM Investment Services, Inc.) (registered transfer agent); Chief Executive Officer, Invesco Corporate Class Inc. (corporate mutual fund company); Chairman and Chief Executive Officer, Invesco Canada Ltd. (formerly known as Invesco Trimark Ltd./Invesco Trimark Ltèe) (registered investment adviser and registered transfer agent); Senior Vice President, The Invesco Funds; Director, Invesco Investment Advisers LLC (formerly known as Van Kampen Asset Management); Director, Chairman, Chief Executive Officer and President, Invesco Management Group, Inc. (formerly known as Invesco AIM Management Group, Inc.) (financial services holding company);Co-Chairman,Co-President andCo-Chief Executive Officer, Invesco Advisers, Inc. (formerly known as Invesco Institutional (N.A.), Inc.) (registered investment adviser); Director, Chief Executive Officer and President, Van Kampen Exchange Corp; President and Principal Executive Officer, The Invesco Funds (other than AIM Treasurer’s Series Trust (Invesco Treasurer’s Series Trust), Short-Term Investments Trust and Invesco Management Trust); Executive Vice President, The Invesco Funds (AIM Treasurer’s Series Trust (Invesco Treasurer’s Series Trust), Short-Term Investments Trust and Invesco Management Trust only); Director and President, INVESCO Funds Group, Inc. (registered investment adviser and registered transfer agent); Director and Chairman, IVZ Distributors, Inc. (formerly known as INVESCO Distributors, Inc.) (registered broker dealer); Director, President and Chairman, Invesco Inc. (holding company), Invesco Canada Holdings Inc. (holding company), Trimark Investments Ltd./Placements Trimark Ltèe and Invesco Financial Services Ltd/Services Financiers Invesco Ltèe; Chief Executive Officer, Invesco Canada Fund Inc. (corporate mutual fund company); Director and Chairman, Van Kampen Investor Services Inc.; Director, Chief Executive Officer and President, 1371 Preferred Inc. (holding company) and Van Kampen Investments Inc.; Director and President, AIM GP Canada Inc. (general partner for limited partnerships) and Van Kampen Advisors, Inc.; Director and Chief Executive Officer, Invesco Trimark Dealer Inc. (registered broker dealer); Director, Invesco Distributors, Inc. (formerly known as Invesco AIM Distributors, Inc.) (registered broker dealer); Manager, Invesco Capital Management LLC; Director, Chief Executive Officer and President, Invesco Advisers, Inc.; Director, Chairman, Chief Executive Officer and President, Invesco AIM Capital Management, Inc.; President, Invesco Trimark Dealer Inc. and Invesco Trimark Ltd./Invesco Trimark Ltèe; Director and President, AIM Trimark Corporate Class Inc. and AIM Trimark Canada Fund Inc.; Senior Managing Director, Invesco Holding Company Limited; Director and Chairman, Fund Management Company (former registered broker dealer); President and Principal Executive Officer, The Invesco Funds (AIM Treasurer’s Series Trust (Invesco Treasurer’s Series Trust), and Short-Term Investments Trust only); President, AIM Trimark Global Fund Inc. and AIM Trimark Canada Fund Inc. | | 229 | | None |
| 1 | Mr. Flanagan is considered an interested person (within the meaning of Section 2(a)(19) of the 1940 Act) of the Trust because he is an officer of the Adviser to the Trust, and an officer and a director of Invesco Ltd., ultimate parent of the Adviser. |
| 2 | Mr. Taylor is considered an interested person (within the meaning of Section 2(a)(19) of the 1940 Act) of the Trust because he is an officer and a director of the Adviser. |
Trustees and Officers–(continued)
| | | | | | | | |
Name, Year of Birth and Position(s) Held with the Trust | | Trustee and/or
Officer Since | | Principal Occupation(s) During Past 5 Years | | Number of
Funds in Fund Complex
Overseen by Trustee | | Other Directorship(s) Held by Trustee During Past 5 Years |
| Independent Trustees | | | | | | | | |
| Bruce L. Crockett – 1944 Trustee and Chair | | 1993 | | Chairman, Crockett Technologies Associates (technology consulting company) Formerly: Director, Captaris (unified messaging provider); Director, President and Chief Executive Officer, COMSAT Corporation; Chairman, Board of Governors of INTELSAT (international communications company); ACE Limited (insurance company); Independent Directors Council and Investment Company Institute: Member of the Audit Committee, Investment Company Institute; Member of the Executive Committee and Chair of the Governance Committee, Independent Directors Council | | 229 | | Director and Chairman of the Audit Committee, ALPS (Attorneys Liability Protection Society) (insurance company); Director and Member of the Audit Committee and Compensation Committee, Ferroglobe PLC (metallurgical company) |
David C. Arch – 1945 Trustee | | 2010 | | Chairman of Blistex Inc. (consumer health care products manufacturer); Member, World Presidents’ Organization | | 229 | | Board member of the Illinois Manufacturers’ Association |
Beth Ann Brown – 1968 Trustee | | 2019 | | Independent Consultant Formerly: Head of Intermediary Distribution, Managing Director, Strategic Relations, Managing Director, Head of National Accounts, Senior Vice President, National Account Manager and Senior Vice President, Key Account Manager, Columbia Management Investment Advisers LLC; Vice President, Key Account Manager, Liberty Funds Distributor, Inc.; and Trustee of certain Oppenheimer Funds | | 229 | | Director, Board of Directors of Caron Engineering Inc.; President and Director, Acton Shapleigh Youth Conservation Corps (non - profit); and Vice President and Director of Grahamtastic Connection (non-profit) |
Jack M. Fields – 1952 Trustee | | 1997 | | Chief Executive Officer, Twenty First Century Group, Inc. (government affairs company); and Chairman, Discovery Learning Alliance(non-profit) Formerly: Owner and Chief Executive Officer, Dos Angeles Ranch L.P. (cattle, hunting, corporate entertainment); Director, Insperity, Inc. (formerly known as Administaff) (human resources provider); Chief Executive Officer, Texana Timber LP (sustainable forestry company); Director of Cross Timbers Quail Research Ranch(non-profit); and member of the U.S. House of Representatives | | 229 | | None |
Cynthia Hostetler –1962 Trustee | | 2017 | | Non-Executive Director and Trustee of a number of public and private business corporations Formerly: Director, Aberdeen Investment Funds (4 portfolios); Head of Investment Funds and Private Equity, Overseas Private Investment Corporation; President, First Manhattan Bancorporation, Inc.; Attorney, Simpson Thacher & Bartlett LLP | | 229 | | Vulcan Materials Company (construction materials company); Trilinc Global Impact Fund; Genesee & Wyoming, Inc. (railroads); Artio Global Investment LLC (mutual fund complex); Edgen Group, Inc. (specialized energy and infrastructure products distributor); Investment Company Institute (professional organization); Independent Directors Council (professional organization) |
Trustees and Officers–(continued)
| | | | | | | | |
Name, Year of Birth and Position(s) Held with the Trust | | Trustee and/or
Officer Since | | Principal Occupation(s) During Past 5 Years | | Number of
Funds in Fund Complex Overseen by Trustee | | Other Directorship(s) Held by Trustee During Past 5 Years |
| Independent Trustees—(continued) | | | | | | |
Eli Jones – 1961 Trustee | | 2016 | | Professor and Dean, Mays Business School - Texas A&M University Formerly: Professor and Dean, Walton College of Business, University of Arkansas and E.J. Ourso College of Business, Louisiana State University; Director, Arvest Bank | | 229 | | Insperity, Inc. (formerly known as Administaff) (human resources provider) |
Elizabeth Krentzman – 1959 Trustee | | 2019 | | Formerly: Principal and Chief Regulatory Advisor for Asset Management Services and U.S. Mutual Fund Leader of Deloitte & Touche LLP; General Counsel of the Investment Company Institute (trade association); National Director of the Investment Management Regulatory Consulting Practice, Principal, Director and Senior Manager of Deloitte & Touche LLP; Assistant Director of the Division of Investment Management - Office of Disclosure and Investment Adviser Regulation of the U.S. Securities and Exchange Commission and various positions with the Division of Investment Management – Office of Regulatory Policy of the U.S. Securities and Exchange Commission; Associate at Ropes & Gray LLP; Advisory Board Member of the Securities and Exchange Commission Historical Society; and Trustee of certain Oppenheimer Funds | | 229 | | Trustee of the University of Florida National Board Foundation and Audit Committee Member; Member of the Cartica Funds Board of Directors (private investment funds); Member of the University of Florida Law Center Association, Inc. Board of Trustees and Audit Committee Member |
Anthony J. LaCava, Jr. – 1956 Trustee | | 2019 | | Formerly: Director and Member of the Audit Committee, Blue Hills Bank (publicly traded financial institution) and Managing Partner, KPMG LLP | | 229 | | Blue Hills Bank; Chairman, Bentley University; Member, Business School Advisory Council; and Nominating Committee KPMG LLP |
Prema Mathai-Davis – 1950 Trustee | | 1998 | | Retired Co-Owner & Partner of Quantalytics Research, LLC, (a FinTech Investment Research Platform for the Self-Directed Investor) | | 229 | | None |
Joel W. Motley – 1952 Trustee | | 2019 | | Director of Office of Finance, Federal Home Loan Bank; Member of the Vestry of Trinity Wall Street; Managing Director of Carmona Motley Inc. (privately held financial advisor); Member of the Finance and Budget Committee of the Council on Foreign Relations, Member of the Investment Committee and Board of Human Rights Watch and Member of the Investment Committee and Board of Historic Hudson Valley(non-profit cultural organization) Formerly: Managing Director of Public Capital Advisors, LLC (privately held financial advisor); Managing Director of Carmona Motley Hoffman, Inc. (privately held financial advisor); Trustee of certain Oppenheimer Funds; and Director of Columbia Equity Financial Corp. (privately held financial advisor) | | 229 | | Director of Greenwall Foundation (bioethics research foundation); Member of Board and Investment Committee of The Greenwall Foundation; Director of Southern Africa Legal Services Foundation; Board Member and Investment Committee Member of Pulizer Center for Crisis Reporting(non-profit journalism) |
| Teresa M. Ressel – 1962 Trustee | | 2017 | | Non-executive director and trustee of a number of public and private business corporations Formerly: Chief Financial Officer, Olayan America, The Olayan Group (international investor/commercial/industrial); Chief Executive Officer, UBS Securities LLC; Group Chief Operating Officer, Americas, UBS AG; Assistant Secretary for Management & Budget and CFO, US Department of the Treasury | | 229 | | Atlantic Power Corporation (power generation company); ON Semiconductor Corp. (semiconductor supplier) |
Trustees and Officers–(continued)
| | | | | | | | |
Name, Year of Birth and Position(s) Held with the Trust | | Trustee and/or
Officer Since | | Principal Occupation(s) During Past 5 Years | | Number of
Funds in Fund Complex Overseen by Trustee | | Other Directorship(s) Held by Trustee During Past 5 Years |
| Independent Trustees–(continued) | | | | | | |
Ann Barnett Stern – 1957 Trustee | | 2017 | | President and Chief Executive Officer, Houston Endowment Inc. (private philanthropic institution) Formerly: Executive Vice President and General Counsel, Texas Children’s Hospital; Attorney, Beck, Redden and Secrest, LLP; Business Law Instructor, University of St. Thomas; Attorney, Andrews & Kurth LLP | | 229 | | Federal Reserve Bank of Dallas |
Raymond Stickel, Jr. – 1944 Trustee | | 2005 | | Retired Formerly: Director, Mainstay VP Series Funds, Inc. (25 portfolios); Partner, Deloitte & Touche | | 229 | | None |
Robert C. Troccoli – 1949 Trustee | | 2016 | | Retired Formerly: Adjunct Professor, University of Denver – Daniels College of Business; Senior Partner, KPMG LLP | | 229 | | None |
Daniel S. Vandivort –1954 Trustee | | 2019 | | Treasurer, Chairman of the Audit and Finance Committee, and Trustee, Board of Trustees, Huntington Disease Foundation of America; and President, Flyway Advisory Services LLC (consulting and property management) Formerly: Trustee and Governance Chair, of certain Oppenheimer Funds | | 229 | | Chairman and Lead Independent Director, Chairman of the Audit Committee, and Director, Board of Directors, Value Line Funds |
James D. Vaughn – 1945 Trustee | | 2019 | | Retired Formerly: Managing Partner, Deloitte & Touche LLP; Trustee and Chairman of the Audit Committee, Schroder Funds; Board Member, Mile High United Way, Boys and Girls Clubs, Boy Scouts, Colorado Business Committee for the Arts, Economic Club of Colorado and Metro Denver Network (economic development corporation); and Trustee of certain Oppenheimer Funds | | 229 | | Board member and Chairman of Audit Committeeof AMG National Trust Bank; Trustee and Investment Committee member, University of South Dakota Foundation; Board member, Audit Committee Member and past Board Chair, Junior Achievement(non-profit) |
| Christopher L. WIlson - 1957 Trustee, Vice Chair and Chair Designate | | 2017 | | Reitred Formerly: Director, TD Asset Management USA Inc. (mutual fund complex) (22 portfolios); Managing Partner, CT2, LLC (investing and consulting firm); President/Chief Executive Officer, Columbia Funds, Bank of America Corporation; President/Chief Executive Officer, CDC IXIS Asset Management Services, Inc.; Principal & Director of Operations, Scudder Funds, Scudder, Stevens & Clark, Inc.; Assistant Vice President, Fidelity Investments | | 229 | | ISO New England, Inc.(non-profit organization managing regional electricity market) |
Trustees and Officers–(continued)
| | | | | | | | |
Name, Year of Birth and Position(s) Held with the Trust | | Trustee and/or
Officer Since | | Principal Occupation(s) During Past 5 Years | | Number of
Funds in Fund Complex Overseen by Trustee | | Other Directorship(s) Held by Trustee During Past 5 Years |
| Other Officers | | | | | | | | |
Sheri Morris – 1964 President, Principal Executive Officer and Treasurer | | 1999 | | Head of Global Fund Services, Invesco Ltd.; President, Principal Executive Officer and Treasurer, The Invesco Funds; Vice President, Invesco Advisers, Inc. (formerly known as Invesco Institutional (N.A.), Inc.) (registered investment adviser); and Vice President, Invesco Exchange-Traded Fund Trust, Invesco Exchange-Traded Fund Trust II, Invesco India Exchange-Traded Fund Trust, Invesco Actively Managed Exchange-Traded Fund Trust, Invesco Actively Managed Exchange-Traded Commodity Fund Trust and Invesco Exchange-Traded Self-Indexed Fund Trust; and Vice President, OppenheimerFunds, Inc. Formerly: Vice President and Principal Financial Officer, The Invesco Funds; Vice President, Invesco AIM Advisers, Inc., Invesco AIM Capital Management, Inc. and Invesco AIM Private Asset Management, Inc.; Assistant Vice President and Assistant Treasurer, The Invesco Funds and Assistant Vice President, Invesco Advisers, Inc., Invesco AIM Capital Management, Inc. and Invesco AIM Private Asset Management, Inc.; and Treasurer, Invesco Exchange-Traded FundTrust, Invesco Exchange-Traded Fund Trust II, Invesco India Exchange-Traded Fund Trust and Invesco Actively Managed Exchange-Traded Fund Trust | | N/A | | N/A |
Russell C. Burk – 1958 Senior Vice President and Senior Officer | | 2005 | | Senior Vice President and Senior Officer, The Invesco Funds | | N/A | | N/A |
Jeffrey H. Kupor – 1968 Senior Vice President, Chief Legal Officer and Secretary | | 2018 | | Head of Legal of the Americas, Invesco Ltd.; Senior Vice President and Secretary, Invesco Advisers, Inc. (formerly known as Invesco Institutional (N.A.), Inc.) (registered investment adviser); Senior Vice President and Secretary, Invesco Distributors, Inc. (formerly known as Invesco AIM Distributors, Inc.); Vice President and Secretary, Invesco Investment Services, Inc. (formerly known as Invesco AIM Investment Services, Inc.) Senior Vice President, Chief Legal Officer and Secretary, The Invesco Funds; Secretary and General Counsel, Invesco Investment Advisers LLC (formerly known as Van Kampen Asset Management); Secretary and General Counsel, Invesco Capital Markets, Inc. (formerly known as Van Kampen Funds Inc.) and Chief Legal Officer, Invesco Exchange-Traded Fund Trust, Invesco Exchange-Traded Fund Trust II, Invesco India Exchange-Traded Fund Trust, Invesco Actively Managed Exchange-Traded Fund Trust, Invesco Actively Managed Exchange-Traded Commodity Fund Trust and Invesco Exchange-Traded Self-Indexed Fund Trust; Secretary, Invesco Indexing LLC; Secretary, W.L. Ross & Co., LLC Formerly: Secretary and Vice President, Jemstep, Inc.; Head of Legal, Worldwide Institutional, Invesco Ltd.; Secretary and General Counsel, INVESCO Private Capital Investments, Inc.; Senior Vice President, Secretary and General Counsel, Invesco Management Group, Inc. (formerly known as Invesco AIM Management Group, Inc.); Assistant Secretary, INVESCO Asset Management (Bermuda) Ltd.; Secretary and General Counsel, Invesco Private Capital, Inc.; Assistant Secretary and General Counsel, INVESCO Realty, Inc.; Secretary and General Counsel, Invesco Senior Secured Management, Inc.; and Secretary, Sovereign G./P. Holdings Inc. | | N/A | | N/A |
Andrew R. Schlossberg – 1974 Senior Vice President | | 2019 | | Head of the Americas and Senior Managing Director, Invesco Ltd.; Director and Senior Vice President, Invesco Advisers, Inc. (formerly known as Invesco Institutional (N.A.), Inc.) (registered investment adviser); Director and Chairman, Invesco Investment Services, Inc. (formerly known as Invesco AIM Investment Services, Inc.) (registered transfer agent); Senior Vice President, The Invesco Funds; Director, Invesco Investment Advisers LLC (formerly known as Van Kampen Asset Management); Director, President and Chairman, Invesco Insurance Agency, Inc. Formerly: Director, Invesco UK Limited; Director and Chief Executive, Invesco Asset Management Limited and Invesco Fund Managers Limited; Assistant Vice President, The Invesco Funds; Senior Vice President, Invesco Advisers, Inc. (formerly known as Invesco Institutional (N.A.), Inc.) (registered investment adviser); Director and Chief Executive, Invesco Administration Services Limited and Invesco Global Investment Funds Limited; Director, Invesco Distributors, Inc.; Head of EMEA, Invesco Ltd.; President, Invesco Actively Managed Exchange-Traded Commodity Fund Trust, Invesco Actively Managed Exchange-Traded Fund Trust, Invesco Exchange-Traded Fund Trust, Invesco Exchange-Traded Fund Trust II and Invesco India Exchange-Traded Fund Trust; Managing Director and Principal Executive Officer, Invesco Capital Management LLC | | N/A | | N/A |
Trustees and Officers–(continued)
| | | | | | | | |
Name, Year of Birth and Position(s) Held with the Trust | | Trustee and/or
Officer Since | | Principal Occupation(s) During Past 5 Years | | Number of
Funds in Fund Complex
Overseen by Trustee | | Other Directorship(s)
Held by Trustee During Past 5 Years |
| Other Officers–(continued) | | | | | | | | |
John M. Zerr – 1962 Senior Vice President | | 2006 | | Chief Operating Officer of the Americas; Senior Vice President, Invesco Advisers, Inc. (formerly known as Invesco Institutional (N.A.), Inc.) (registered investment adviser); Senior Vice President, Invesco Distributors, Inc. (formerly known as Invesco AIM Distributors, Inc.); Director and Vice President, Invesco Investment Services, Inc. (formerly known as Invesco AIM Investment Services, Inc.) Senior Vice President, The Invesco Funds; Managing Director, Invesco Capital Management LLC; Director, Invesco Investment Advisers LLC (formerly known as Van Kampen Asset Management); Senior Vice President, Invesco Capital Markets, Inc. (formerly known as Van Kampen Funds Inc.); Manager, Invesco Indexing LLC; Manager, Invesco Specialized Products, LLC; Director and Senior Vice President, Invesco Insurance Agency, Inc.; Member, Invesco Canada Funds Advisory Board; Director, President and Chief Executive Officer, Invesco Corporate Class Inc. (corporate mutual fund company); and Director, Chairman, President and Chief Executive Officer, Invesco Canada Ltd. (formerly known as Invesco Trimark Ltd./Invesco Trimark Ltèe) (registered investment adviser and registered transfer agent) | | N/A | | N/A |
| | | | | |
| | | | | Formerly: Director and Senior Vice President, Invesco Management Group, Inc. (formerly known as Invesco AIM Management Group, Inc.); Secretary and General Counsel, Invesco Management Group, Inc. (formerly known as Invesco AIM Management Group, Inc.); Secretary, Invesco Investment Services, Inc. (formerly known as Invesco AIM Investment Services, Inc.); Chief Legal Officer and Secretary, The Invesco Funds; Secretary and General Counsel, Invesco Investment Advisers LLC (formerly known as Van Kampen Asset Management); Secretary and General Counsel, Invesco Capital Markets, Inc. (formerly known as Van Kampen Funds Inc.); Chief Legal Officer, Invesco Exchange-Traded Fund Trust, Invesco Exchange-Traded Fund Trust II, Invesco India Exchange-Traded Fund Trust, Invesco Actively Managed Exchange-Traded Fund Trust, Invesco Actively Managed Exchange-Traded Commodity Fund Trust and Invesco Exchange-Traded Self-Indexed Fund Trust; Secretary, Invesco Indexing LLC; Director, Secretary, General Counsel and Senior Vice President, Van Kampen Exchange Corp.; Director, Vice President and Secretary, IVZ Distributors, Inc. (formerly known as INVESCO Distributors, Inc.); Director and Vice President, INVESCO Funds Group, Inc.; Director and Vice President, Van Kampen Advisors Inc.; Director, Vice President, Secretary and General Counsel, Van Kampen Investor Services Inc.;Director and Secretary, Invesco Distributors, Inc. (formerly known as Invesco AIM Distributors, Inc.); Director, Senior Vice President, General Counsel and Secretary, Invesco AIM Advisers, Inc. and Van Kampen Investments Inc.; Director, Vice President and Secretary, Fund Management Company; Director, Senior Vice President, Secretary, General Counsel and Vice President, Invesco AIM Capital Management, Inc.; Chief Operating Officer and General Counsel, Liberty Ridge Capital, Inc. (an investment adviser) | | | | |
| Gregory G. McGreevey–1962 Senior Vice President | | 2012 | | Senior Managing Director, Invesco Ltd.; Director, Chairman, President, and Chief Executive Officer, Invesco Advisers, Inc. (formerly known as Invesco Institutional (N.A.), Inc.) (registered investment adviser); Director, Invesco Mortgage Capital, Inc. and Invesco Senior Secured Management, Inc.; and Senior Vice President, The Invesco Funds; and President, SNW Asset Management Corporation Formerly: Senior Vice President, Invesco Management Group, Inc. and Invesco Advisers, Inc.; Assistant Vice President, The Invesco Funds | | N/A | | N/A |
| Kelli Gallegos – 1970 Vice President, Principal Financial Officer and Assistant Treasurer | | 2008 | | Principal Financial and Accounting Officer – Investments Pool, Invesco Specialized Products, LLC; Vice President, Principal Financial Officer and Assistant Treasurer, The Invesco Funds; Principal Financial and Accounting Officer – Pooled Investments, Invesco Capital Management LLC; Vice President and Treasurer, Invesco Exchange-Traded Fund Trust, Invesco Exchange-Traded Fund Trust II, Invesco India Exchange-Traded Fund Trust, Invesco Actively Managed Exchange-Traded Fund Trust, Invesco Actively Managed Exchange-Traded Commodity Fund Trust and Invesco Exchange-Traded Self-Indexed Fund Trust Formerly: Assistant Treasurer, Invesco Specialized Products, LLC; Assistant Treasurer, Invesco Exchange-Traded Fund Trust, Invesco Exchange-Traded Fund Trust II, Invesco India Exchange-Traded Fund Trust, Invesco Actively Managed Exchange-Traded Fund Trust, Invesco Actively Managed Exchange-Traded Commodity Fund Trust and Invesco Exchange-Traded Self-Indexed Fund Trust; Assistant Treasurer, Invesco Capital Management LLC; Assistant Vice President, The Invesco Funds | | N/A | | N/A |
Trustees and Officers–(continued)
| | | | | | | | |
Name, Year of Birth and Position(s) Held with the Trust | | Trustee and/or
Officer Since | | Principal Occupation(s) During Past 5 Years | | Number of
Funds in Fund Complex
Overseen by Trustee | | Other Directorship(s) Held by Trustee During Past 5 Years |
| Other Officers–(continued) | | | | | | | | |
| Crissie M. Wisdom – 1969 Anti-Money Laundering Compliance Officer | | 2013 | | Anti-Money Laundering Compliance Officer, Invesco Advisers, Inc. (formerly known as Invesco Institutional (N.A.), Inc.) (registered investment adviser), Invesco Capital Markets, Inc. (formerly known as Van Kampen Funds Inc.), Invesco Distributors, Inc., Invesco Investment Services, Inc., The Invesco Funds, and Invesco Exchange-Traded Fund Trust, Invesco Exchange-Traded Fund Trust II, Invesco India Exchange-Traded Fund Trust, Invesco Actively Managed Exchange-Traded Fund Trust, Invesco Actively Managed Exchange-Traded Commodity Fund Trust and Invesco Exchange-Traded Self-Indexed Fund Trust; Anti-Money Laundering Compliance Officer and Bank Secrecy Act Officer, INVESCO National Trust Company and Invesco Trust Company; and Fraud Prevention Manager and Controls and Risk Analysis Manager for Invesco Investment Services, Inc. Formerly: Anti-Money Laundering Compliance Officer, Van Kampen Exchange Corp. and Invesco Management Group, Inc. | | N/A | | N/A |
| Robert R. Leveille – 1969 Chief Compliance Officer | | 2016 | | Chief Compliance Officer, Invesco Advisers, Inc. (registered investment adviser); and Chief Compliance Officer, The Invesco Funds Formerly: Chief Compliance Officer, Putnam Investments and the Putnam Funds | | N/A | | N/A |
The Statement of Additional Information of the Trust includes additional information about the Fund’s Trustees and is available upon request, without charge, by calling 1.800.959.4246. Please refer to the Fund’s Statement of Additional Information for information on the Fund’ssub-advisers.
| | | | | | |
| Office of the Fund | | Investment Adviser | | Distributor | | Auditors |
11 Greenway Plaza, Suite 1000 Houston, TX 77046-1173 | | Invesco Advisers, Inc. 1555 Peachtree Street, N.E. Atlanta, GA 30309 | | Invesco Distributors, Inc. 11 Greenway Plaza, Suite 1000 Houston, TX 77046-1173 | | PricewaterhouseCoopers LLP 1000 Louisiana Street, Suite 5800 Houston, TX 77002-5678 |
| | | |
| Counsel to the Fund | | Counsel to the Independent Trustees | | Transfer Agent | | Custodian |
Stradley Ronon Stevens & Young, LLP 2005 Market Street, Suite 2600 Philadelphia, PA 19103-7018 | | Goodwin Procter LLP 901 New York Avenue, N.W. Washington, D.C. 20001 | | Invesco Investment Services, Inc. 11 Greenway Plaza, Suite 1000 Houston, TX 77046-1173 | | State Street Bank and Trust Company 225 Franklin Street Boston, MA 02110-2801 |
(This page intentionally left blank)
(This page intentionally left blank)
(This page intentionally left blank)

Go paperless with eDelivery
Visit invesco.com/edelivery to enjoy the convenience and security of anytime electronic access to your investment documents.
With eDelivery, you can elect to have any or all of the following materials delivered straight to your inbox to download, save and print from your own computer:
| ∎ | | Fund reports and prospectuses |
Invesco mailing information
Send general correspondence to Invesco Investment Services, Inc., P.O. Box 219078, Kansas City, MO 64121-9078.
Important notice regarding delivery of security holder documents
To reduce Fund expenses, only one copy of most shareholder documents may be mailed to shareholders with multiple accounts at the same address (Householding). Mailing of your shareholder documents may be householded indefinitely unless you instruct us otherwise. If you do not want the mailing of these documents to be combined with those for other members of your household, please contact Invesco Investment Services, Inc. at 800 959 4246 or contact your financial institution. We will begin sending you individual copies for each account within 30 days after receiving your request.
Fund holdings and proxy voting information
The Fund provides a complete list of its holdings four times in each fiscal year, at the quarter-ends. For the second and fourth quarters, the list appears in the Fund’s semiannual and annual reports to shareholders. For the first and third quarters, the Fund files the lists with the Securities and Exchange Commission (SEC) as an exhibit to its reports on FormN-PORT. The most recent list of portfolio holdings is available at invesco.com/completeqtrholdings. Shareholders can also look up the Fund’s FormN-PORT filings on the SEC website, sec.gov. The SEC file numbers for the Fund are shown below.
A description of the policies and procedures that the Fund uses to determine how to vote proxies relating to portfolio securities is available without charge, upon request, from our Client Services department at 800 959 4246, or at invesco.com/ proxyguidelines. The information is also available on the SEC website, sec.gov.
| | |
Information regarding how the Fund voted proxies related to its portfolio securities during the most recent 12-month period ended June 30 is available at invesco.com/proxysearch. This information is also available on the SEC website, sec.gov. | |  |
Invesco Advisers, Inc. is an investment adviser; it provides investment advisory services to individual and institutional clients and does not sell securities. Invesco Distributors, Inc. is the US distributor for Invesco Ltd.’s retail mutual funds, exchange-traded funds and institutional money market funds. Both are wholly owned, indirect subsidiaries of Invesco Ltd. |
| | | | | | |
| SEC file numbers: 811-01424 and 002-25469 | | Invesco Distributors, Inc. | | SUM-AR-1 | | |

Invesco
Oppenheimer
Rising Dividends
Fund*
Beginning on January 1, 2021, as permitted by regulations adopted by the Securities and Exchange Commission, paper copies of the Fund’s shareholder reports will no longer be sent by mail, unless you specifically request paper copies of the reports from the Fund or from your financial intermediary, such as a broker-dealer or bank. Instead, the reports will be made available on the Fund’s website, and you will be notified by mail each time a report is posted and provided with a website link to access the report.
If you already elected to receive shareholder reports electronically, you will not be affected by this change and you need not take any action. You may elect to receive shareholder reports and other communications from the Fund electronically by contacting your financial intermediary (such as a broker-dealer or bank) or, if you are a direct investor, by enrolling at invesco.com/edelivery.
You may elect to receive all future reports in paper free of charge. If you invest through a financial intermediary, you can contact your financial intermediary to request that you continue to receive paper copies of your shareholder reports. If you invest directly with the Fund, you can call 800 959 4246 to let the Fund know you wish to continue receiving paper copies of your shareholder reports. Your election to receive reports in paper will apply to all funds held with your financial intermediary or all funds held with the fund complex if you invest directly with the Fund.
*Prior to the close of business on May 24, 2019, the Fund’s name was Oppenheimer Rising Dividends Fund. See Important Update on the following page for more information.
Important Update
On October 18, 2018, Massachusetts Mutual Life Insurance Company, an indirect corporate parent of OppenheimerFunds, Inc. and its subsidiaries OFI Global Asset Management, Inc., OFI SteelPath, Inc. and OFI Advisors, LLC, announced that it had entered into an agreement whereby Invesco Ltd., a global investment management company would acquire OppenheimerFunds and its subsidiaries (together, “OppenheimerFunds”). After the close of business on May 24, 2019 Invesco Ltd. completed the acquisition of OppenheimerFunds. This Fund was included in that acquisition and as of that date, became part of the Invesco family of funds. Please visit invesco.com for more information or call Invesco’s Client Services team at800-959-4246.
Table of Contents
Class A Shares
AVERAGE ANNUAL TOTAL RETURNS AT 10/31/19
| | | | | | | | | | | | | | | | | | | | |
| | | Class A Shares of the Fund | | | | |
| | | Without Sales Charge | | With Sales Charge | | S&P 500 Index | | Russell 1000 Index |
| 1-Year | | | | 12.30 | % | | | | 6.14 | % | | | | 14.33 | % | | | | 14.15 | % |
| 5-Year | | | | 7.45 | | | | | 6.24 | | | | | 10.78 | | | | | 10.55 | |
| 10-Year | | | | 10.62 | | | | | 9.99 | | | | | 13.70 | | | | | 13.72 | |
Performance quoted is past performance and cannot guarantee comparable future results; current performance may be lower or higher. Visit invesco.com for the most recentmonth-end performance. Performance figures reflect reinvested distributions and changes in net asset value (NAV). Investment return and principal value will vary so that you may have a gain or a loss when you sell shares. Fund returns include changes in share price, reinvested distributions and a 5.50% maximum applicable sales charge except where “without sales charge” is indicated. Returns for periods of less than one year are cumulative and not annualized. As the result of a reorganization after the close of business on May 24, 2019, the returns of the Fund for periods on or prior to May 24, 2019 reflect performance of the Oppenheimer predecessor fund. Share class returns will differ from those of the predecessor fund because they have different expenses. Returns do not consider capital gains or income taxes on an individual’s investment. See Fund
3 INVESCO OPPENHEIMER RISING DIVIDENDS FUND
prospectus and summary prospectus for more information on share classes, sales charges and new fee agreements, if any. Fund literature is available at invesco.com.
4 INVESCO OPPENHEIMER RISING DIVIDENDS FUND
Fund Performance Discussion
The Fund produced a net return of 12.30% during the reporting period, marginally lagging the Russell 1000 Index’s (the “Index”) return of 14.15%. The Fund’s under-performance can be attributed to stock selection within the Communication Services and Consumer Staples sections. This was offset by strong selection In Information Technology, Financials and Real Estate sectors.
MARKET OVERVIEW
The reporting period encompassed a volatile environment for equities in general. The last quarter of 2018, in particular, saw a significantsell-off in equities, as investors stampeded for the door, volatility spiked significantly as macro risks (tariff wars, China slowdown, FED Interest rate moves, Government shutdown, slowing International markets) over took decent domestic economic fundamentals. We enjoyed a sharp rally to begin 2019, and optimism continued throughout most of 2019 as markets surged higher despite several sentiment driven
pullbacks. Volatility has made a comeback due to a combination of the U.S. Administration’s trade wars, a rise in geopolitical tensions, and interest rates/yield curve uncertainty.
FUND OVERVIEW
Top performing stocks for the Fund this reporting period includedMicrosoft, American Tower Corp. andApplied Materials.
Microsoft reported strong second quarter 2019 results delivering constant currency
COMPARISON OF CHANGE IN VALUE OF $10,000 HYPOTHETICAL INVESTMENTS IN:
5 INVESCO OPPENHEIMER RISING DIVIDENDS FUND
revenue growth of 16%. Results were strong across business segments with particular strength in commercial cloud which posted constant currency revenue growth of 43% and comprised just over 30% of revenue. The company continued to drive leverage in the model with operating margins up 290 basis points year over year.
American Tower Corp. reported strong trends in domestic leasing, and announced a settlement with Tata, a partner in their India venture that has faced a high degree of churn. The outperformance in the US and certainty in India caused an improvement in American Tower’s multiple.
Applied Materials engages in the provision of materials engineering solutions used to produce new chip and advanced display. Investors are forecasting growth in both semis and display markets in 2020. Applied Materials could achieve healthy long-term profit growth with its dominant market share in semiconductor- production equipment.
Detractors from the Fund’s performance this reporting period includedAltria Group,Marathon Petroleum Corp. andPfizer. We exited our positions in both Altria Group and Marathon Petroleum Corp.
Altria Group, Inc. is a holding company, which engages in the manufacture and sale of cigarettes in the United States. It operates through the following segments: Smokeable Products, Smokeless Products, and Wine. Investors became disenchanted with
their investment in Juul, as the regulatory environment has cracked down on vaping which may hamper the industries growth.
Marathon Petroleum Corp. operates as a crude oil refining company. The company refines, supplies, markets and transports petroleum products. Strong 3Q 2019 refining performance is being offset by emissions violations in several states. In addition, retirements of both the CEO and Vice-Chairman leave a leadership gap during a period of activist activity.
Pfizer along with all of pharma has underperformed (after having strong performance in 2018) the sector in 1Q/19 as we’ve seen a rotation into medical device and life science tools companies that don’t have exposure to drug pricing reform concerns. Also, Pfizer has little in the way of meaningful data readouts (catalysts) while one of their larger drugs will go off patent next year (Lyrica). Also in July, Pfizer announced the spin-merger of Upjohn (PFE’s established products business and Mylan) through a Reverse Morris Trust. The outlook for RemainCo is lower sales at a lower contribution margin resulting in a rebasing of earnings and valuation, which sent the stock lower.
STRATEGY & OUTLOOK
Our long-term investment process remains the same. We seek dynamic companies with above-average, sustainable revenue and earnings growth that we believe are
6 INVESCO OPPENHEIMER RISING DIVIDENDS FUND
positioned to outperform. This includes leading firms in structurally attractive industries with committed management teams that have proven records of performance.
In the short-term, we expect the U.S. economy to continue to show economic growth, albeit at slower rates than experienced in 2018, driven by favorable consumer confidence, falling regulatory hurdles, and technological innovation.
However, there are several warning signs on the horizon including global synchronized growth becoming less synchronized, weakening transport volumes, elevated levels of inventories as companies hedge their risk of tariffs, and the flattening/inversion of the yield curve implying a slowing economy.
While a recession late this year or early next would not surprise us, it is not our base case assumption at this time.
We continue to maintain our discipline around valuation and focus on companies showing competitive advantages and skilled management teams that areout-executing peers.
Manind Govil, Portfolio Manager
Raman Vardharaj, Portfolio Manager
7 INVESCO OPPENHEIMER RISING DIVIDENDS FUND
Top Holdings and Allocations
TOP TEN COMMON STOCK HOLDINGS
| | | | |
| Microsoft Corp. | | | 5.5 | % |
| Apple, Inc. | | | 5.0 | |
| JPMorgan Chase & Co. | | | 3.2 | |
| Home Depot, Inc. (The) | | | 2.4 | |
| Visa, Inc., Cl. A | | | 2.3 | |
| UnitedHealth Group, Inc. | | | 2.3 | |
| Chevron Corp. | | | 2.2 | |
| Mastercard, Inc., Cl. A | | | 2.1 | |
| Procter & Gamble Co. (The) | | | 2.1 | |
| Marsh & McLennan Cos., Inc. | | | 2.0 | |
Holdings and allocations are subject to change and are not buy/sell recommendations. Percentages are as of October 31, 2019, and are based on net assets.
TOP TEN COMMON STOCK INDUSTRIES
| | | | |
| Real Estate Investment Trusts (REITs) | | | 7.4 | % |
| IT Services | | | 7.0 | |
| Software | | | 6.2 | |
| Oil, Gas & Consumable Fuels | | | 5.8 | |
| Capital Markets | | | 5.6 | |
| Commercial Banks | | | 5.2 | |
| Technology Hardware, Storage & Peripherals | | | 5.0 | |
| Specialty Retail | | | 4.3 | |
| Aerospace & Defense | | | 4.3 | |
| Pharmaceuticals | | | 3.7 | |
Holdings and allocations are subject to change and are not buy/sell recommendations. Percentages are as of October 31, 2019, and are based on net assets.
SECTOR ALLOCATION
Holdings and allocations are subject to change and are not buy/sell recommendations. Percentages are as of October 31, 2019, and are based on the total market value of common stocks.
For more current Fund holdings, please visit invesco.com.
8 INVESCO OPPENHEIMER RISING DIVIDENDS FUND
Share Class Performance
AVERAGE ANNUAL TOTAL RETURNS WITHOUT SALES CHARGE AS OF 10/31/19
| | | | | | | | | | | | | | | | | | |
| | | Inception | | | | | | | | | | | | |
| | | Date | | | | | 1-Year | | | 5-Year | | | 10-Year | |
| Class A (OARDX) | | | 4/30/80 | | | | | | 12.30 | % | | | 7.45 | % | | | 10.62 | % |
| Class C (OCRDX) | | | 9/1/93 | | | | | | 11.44 | | | | 6.65 | | | | 9.79 | |
| Class R (ONRDX) | | | 3/1/01 | | | | | | 12.00 | | | | 7.18 | | | | 10.29 | |
| Class Y (OYRDX) | | | 12/16/96 | | | | | | 12.52 | | | | 7.71 | | | | 10.88 | |
| Class R5 (RSDQX)1 | | | 5/24/19 | | | | | | 12.52 | | | | 7.49 | | | | 10.64 | |
| Class R6 (OIRDX) | | | 2/28/12 | | | | | | 12.72 | | | | 7.90 | | | | 9.99 | 2 |
AVERAGE ANNUAL TOTAL RETURNS WITH SALES CHARGE AS OF 10/31/19
| | | | | | | | | | | | | | | | | | |
| | | Inception | | | | | | | | | | | | |
| | | Date | | | | | 1-Year | | | 5-Year | | | 10-Year | |
| Class A (OARDX) | | | 4/30/80 | | | | | | 6.14 | % | | | 6.24 | % | | | 9.99 | % |
| Class C (OCRDX) | | | 9/1/93 | | | | | | 10.44 | | | | 6.65 | | | | 9.79 | |
| Class R (ONRDX) | | | 3/1/01 | | | | | | 12.00 | | | | 7.18 | | | | 10.29 | |
| Class Y (OYRDX) | | | 12/16/96 | | | | | | 12.52 | | | | 7.71 | | | | 10.88 | |
| Class R5 (RSDQX)1 | | | 5/24/19 | | | | | | 12.52 | | | | 7.49 | | | | 10.64 | |
| Class R6 (OIRDX) | | | 2/28/12 | | | | | | 12.72 | | | | 7.90 | | | | 9.99 | 2 |
1. Class R5 shares’ performance shown prior to the inception date is that of the predecessor fund’s Class A shares at net asset value (NAV) and includes the12b-1 fees applicable to Class A shares. Class A shares’ performance reflects any applicable fee waivers and/or expense reimbursements.
2. Shows performance since inception.
Performance quoted is past performance and cannot guarantee comparable future results; current performance may be lower or higher. Visit invesco.com for the most recentmonth-end performance. Performance figures reflect reinvested distributions and changes in net asset value (NAV). Investment return and principal value will vary so that you may have a gain or a loss when you sell shares. Performance shown at NAV does not include the applicablefront-end sales charge, which would have reduced the performance. The current maximum initial sales charge for Class A shares is 5.50%, and the contingent deferred sales charge for Class C shares is 1% for the1-year period. Class R, Class Y, Class R5 and Class R6 shares have no sales charge; therefore, performance is at NAV. Effective after the close of business on May 24, 2019, Class A, Class C, Class R, Class Y, and Class I shares of the predecessor fund were reorganized into Class A, Class C, Class R, Class Y, and Class R6 shares, respectively, of the Fund. Class R5 shares’ performance shown prior to the inception date is that of the predecessor fund’s Class A shares at NAV and includes the12b-1 fees applicable to Class A shares. Class A shares’ performance reflects any applicable fee waivers and/or expense reimbursements. Returns shown for Class A, Class C, Class R, Class Y, Class R5, and Class R6 shares are blended returns of the predecessor fund and the Fund. Share class returns will differ from those of the predecessor fund because of different expenses. See Fund prospectuses and summary prospectuses for more information on share classes, sales charges and new fee agreements, if any. Fund literature is available at invesco.com.
9 INVESCO OPPENHEIMER RISING DIVIDENDS FUND
The Fund’s performance is compared to the performance of the S&P 500 Index and the Russell 1000 Index. The S&P 500 Index is a capitalization-weighted index of 500 stocks intended to be a representative sample of leading companies in leading industries within the U.S. economy. The Russell 1000 Index measures the performance of thelarge-cap segment of the U.S. equity universe. It is a subset of the Russell 3000 Index and includes approximately 1,000 of the largest securities based on a combination of their market cap and current index membership. The Russell 1000 represents approximately 92% of the Russell 3000 Index. The indices areunmanaged and cannot be purchased directly by investors. While index comparisons may be useful to provide a benchmark for the Fund’s performance, it must be noted that the Fund’s investments are not limited to the investments comprising the indices. Index performance includes reinvestment of income, but does not reflect transaction costs, fees, expenses or taxes. Index performance is shown for illustrative purposes only as a benchmark for the Fund’s performance, and does not predict or depict performance of the Fund. The Fund’s performance reflects the effects of the Fund’s business and operating expenses.
The views and opinions expressed in management’s discussion of Fund performance are those of Invesco Advisers, Inc. These views and opinions are subject to change at any time based on factors such as market and economic conditions. These views and opinions may not be relied upon as investment advice or recommendations, or as an offer for a particular security. The information is not a complete analysis of every aspect of any market, country, industry, security or the Fund. Statements of fact are from sources considered reliable, but Invesco Advisers, Inc. makes no representation or warranty as to their completeness or accuracy. Although historical performance is no guarantee of future results, these insights may help you understand our investment management philosophy.
Before investing, investors should carefully read the prospectus and/or summary prospectus and carefully consider the investment objectives, risks, charges and expenses. For this and more complete information about the fund(s), investors should ask their advisors for a prospectus/summary prospectus or visit invesco.com/fundprospectus.
Shares of Invesco funds are not deposits or obligations of any bank, are not guaranteed by any bank, are not insured by the FDIC or any other agency, and involve investment risks, including the possible loss of the principal amount invested.
10 INVESCO OPPENHEIMER RISING DIVIDENDS FUND
Fund Expenses
Fund Expenses. As a shareholder of the Fund, you incur two types of costs: (1) transaction costs, which may include sales charges (loads) on purchase payments and/or contingent deferred sales charges on redemptions; and (2) ongoing costs, including management fees; distribution and service fees; and other Fund expenses. These examples are intended to help you understand your ongoing costs (in dollars) of investing in the Fund and to compare these costs with the ongoing costs of investing in other mutual funds.
The examples are based on an investment of $1,000.00 invested at the beginning of the period and held for the entire6-month period ended October 31, 2019.
Actual Expenses. The first section of the table provides information about actual account values and actual expenses. You may use the information in this section for the class of shares you hold, together with the amount you invested, to estimate the expense that you paid over the period. Simply divide your account value by $1,000.00 (for example, an $8,600.00 account value divided by $1,000.00 = 8.60), then multiply the result by the number in the first section under the heading entitled “Expenses Paid During 6 Months Ended October 31, 2019” to estimate the expenses you paid on your account during this period.
Hypothetical Example for Comparison Purposes.The second section of the table provides information about hypothetical account values and hypothetical expenses based on the Fund’s actual expense ratio for each class of shares, and an assumed rate of return of 5% per year for each class before expenses, which is not the Fund’s actual return. The hypothetical account values and expenses may not be used to estimate the actual ending account balance or expenses you paid for the period. You may use this information to compare the ongoing costs of investing in the Fund and other funds. To do so, compare this 5% hypothetical example for the class of shares you hold with the 5% hypothetical examples that appear in the shareholder reports of the other funds.
Please note that the expenses shown in the table are meant to highlight your ongoing costs only and do not reflect any transactional costs, such asfront-end or contingent deferred sales charges (loads). Therefore, the “hypothetical” section of the table is useful in comparing ongoing costs only, and will not help you determine the relative total costs of owning different funds. In addition, if these transactional costs were included, your costs would have been higher.
11 INVESCO OPPENHEIMER RISING DIVIDENDS FUND
| | | | | | | | | | | | | | | |
| Actual | | Beginning
Account
Value
May 1, 2019 | | Ending Account Value
October 31, 2019 | | Expenses
Paid During
6 Months Ended
October 31, 20191,2 |
| Class A | | | $ | 1,000.00 | | | | $ | 1,042.00 | | | | $ | 5.37 | |
| Class C | | | | 1,000.00 | | | | | 1,038.50 | | | | | 9.29 | |
| Class R | | | | 1,000.00 | | | | | 1,041.10 | | | | | 6.66 | |
| Class Y | | | | 1,000.00 | | | | | 1,043.10 | | | | | 4.08 | |
| Class R5 | | | | 1,000.00 | | | | | 1,044.00 | | | | | 3.10 | |
| Class R6 | | | | 1,000.00 | | | | | 1,044.00 | | | | | 3.30 | |
| | | |
Hypothetical (5% return before expenses) | | | | | | | | | | | | | | | |
| Class A | | | | 1,000.00 | | | | | 1,019.96 | | | | | 5.31 | |
| Class C | | | | 1,000.00 | | | | | 1,016.13 | | | | | 9.19 | |
| Class R | | | | 1,000.00 | | | | | 1,018.70 | | | | | 6.58 | |
| Class Y | | | | 1,000.00 | | | | | 1,021.22 | | | | | 4.03 | |
| Class R5 | | | | 1,000.00 | | | | | 1,021.73 | | | | | 3.52 | |
| Class R6 | | | | 1,000.00 | | | | | 1,021.98 | | | | | 3.27 | |
1. Actual expenses paid for Class A, C, R, Y, and R6are equal to the Fund’s annualized expense ratio for that class, multiplied by the average account value over the period, multiplied by 184/365(to reflect theone-half year period). Actual expenses paid for Class R5 are equal to the Fund’s annualized expense ratio for that class, multiplied by the average account value over the period, multiplied by 160/365to reflect the period from after the close of business on May 24, 2019 (inception of offering) to October 31, 2019.
2.Hypothetical expenses paid for all classes are equal to the Fund’s annualized expense ratio for that class, multiplied by the average account value over the period, multiplied by 184/365(to reflect theone-half year period).
Those annualized expense ratios, excluding indirect expenses from affiliated funds, based on the6-month period ended October 31, 2019 for Classes A, C, R, Y and R6and for the period from after the close of business on May 24, 2019 (inception of offering) to October 31, 2019 for Class R5 are as follows:
| | | | |
| Class | | Expense Ratios |
| Class A | | | 1.04 | % |
| Class C | | | 1.80 | |
| Class R | | | 1.29 | |
| Class Y | | | 0.79 | |
| Class R5 | | | 0.69 | |
| Class R6 | | | 0.64 | |
The expense ratios reflect voluntary and/or contractual waivers and/or reimbursements of expenses by the Fund’s Manager. Some of these undertakings may be modified or terminated at any time, as indicated in the Fund’s prospectus. The “Financial Highlights” tables in the
12 INVESCO OPPENHEIMER RISING DIVIDENDS FUND
Fund’s financial statements, included in this report, also show the gross expense ratios, without such waivers or reimbursements and reduction to custodian expenses, if applicable.
13 INVESCO OPPENHEIMER RISING DIVIDENDS FUND
SCHEDULE OF INVESTMENTSOctober 31, 2019
| | | | | | | | |
| | | Shares | | | Value |
| Common Stocks—99.0% | | | | | |
| Consumer Discretionary—11.9% | | | | | |
| Auto Components—0.9% | | | | | |
| Lear Corp. | | | 201,557 | | | $ | 23,737,368 | |
| Hotels, Restaurants & Leisure—2.7% | | | | | |
| McDonald’s Corp. | | | 247,777 | | | | 48,737,736 | |
| Royal Caribbean Cruises Ltd. | | | 260,764 | | | | 28,378,946 | |
| | | | | | | | |
| | | | | | | 77,116,682 | |
| Media—2.8% | | | | | | | | |
| Comcast Corp., Cl. A | | | 767,069 | | | | 34,380,033 | |
| Fox Corp., Cl. B | | | 821,624 | | | | 25,667,534 | |
| Sirius XM Holdings, Inc. | | | 2,879,052 | | | | 19,347,229 | |
| | | | | | | | |
| | | | | | | 79,394,796 | |
| Specialty Retail—4.3% | | | | | |
| Home Depot, Inc. (The) | | | 292,042 | | | | 68,507,212 | |
| Ross Stores, Inc. | | | 242,130 | | | | 26,554,397 | |
| TJX Cos., Inc. (The) | | | 473,666 | | | | 27,306,845 | |
| | | | | | | | |
| | | | | | | 122,368,454 | |
| Textiles, Apparel & Luxury Goods—1.2% | |
| Kering SA | | | 57,730 | | | | 32,878,815 | |
| Consumer Staples—5.2% | | | | | |
| Beverages—3.1% | | | | | | | | |
| Coca-Cola Co. (The) | | | 662,318 | | | | 36,049,969 | |
| Diageo plc | | | 545,357 | | | | 22,326,841 | |
| Pernod Ricard SA | | | 159,187 | | | | 29,392,452 | |
| | | | | | | | |
| | | | | | | 87,769,262 | |
| Household Products—2.1% | | | | | |
| Procter & Gamble Co. (The) | | | 479,786 | | | | 59,738,155 | |
| Energy—5.8% | | | | | | | | |
| Oil, Gas & Consumable Fuels—5.8% | | | | | |
| Chevron Corp. | | | 539,692 | | | | 62,679,829 | |
| ConocoPhillips | | | 455,140 | | | | 25,123,728 | |
| Suncor Energy, Inc. | | | 903,486 | | | | 26,824,499 | |
| TC Energy Corp. | | | 361,315 | | | | 18,184,984 | |
| Valero Energy Corp. | | | 325,107 | | | | 31,528,877 | |
| | | | | | | | |
| | | | | | | 164,341,917 | |
| Financials—22.8% | | | | | | | | |
| Capital Markets—5.6% | | | | | |
| CME Group, Inc., Cl. A | | | 188,750 | | | | 38,835,313 | |
| Intercontinental Exchange, Inc. | | | 403,364 | | | | 38,045,292 | |
| | | | | | | | |
| | | Shares | | | Value |
| Capital Markets (Continued) | | | | | |
| Northern Trust Corp. | | | 315,611 | | | $ | 31,460,104 | |
| S&P Global, Inc. | | | 187,713 | | | | 48,428,077 | |
| | | | | | | | |
| | | | | | | 156,768,786 | |
| Commercial Banks—5.2% | | | | | |
| East West Bancorp, Inc. | | | 411,902 | | | | 17,678,834 | |
| Huntington Bancshares, Inc. | | | 2,738,078 | | | | 38,689,042 | |
| JPMorgan Chase & Co. | | | 730,505 | | | | 91,254,685 | |
| | | | | | | | |
| | | | | | | 147,622,561 | |
| Consumer Finance—1.0% | | | | | |
| Capital One Financial Corp. | | | 301,917 | | | | 28,153,760 | |
| Insurance—3.6% | | | | | | | | |
| Fidelity National Financial, Inc. | | | 640,459 | | | | 29,358,640 | |
| Marsh & McLennan Cos., Inc. | | | 537,676 | | | | 55,713,987 | |
| Progressive Corp. (The) | | | 249,958 | | | | 17,422,073 | |
| | | | | | | | |
| | | | | | | 102,494,700 | |
| Real Estate Investment Trusts (REITs)—7.4% | |
| American Tower Corp. | | | 253,557 | | | | 55,295,710 | |
| EPR Properties | | | 466,181 | | | | 36,264,220 | |
| Lamar Advertising Co., Cl. A | | | 521,558 | | | | 41,729,856 | |
| Prologis, Inc. | | | 574,275 | | | | 50,398,374 | |
| SL Green Realty Corp. | | | 280,183 | | | | 23,423,299 | |
| | | | | | | | |
| | | | | | | 207,111,459 | |
| Health Care—12.5% | | | | | | | | |
| Health Care Equipment & Supplies—3.0% | |
| Medtronic plc | | | 253,678 | | | | 27,625,534 | |
| STERIS plc | | | 100,270 | | | | 14,195,224 | |
| Stryker Corp. | | | 193,539 | | | | 41,856,680 | |
| | | | | | | | |
| | | | | | | 83,677,438 | |
| Health Care Providers & Services—3.3% | |
| Humana, Inc. | | | 97,713 | | | | 28,747,165 | |
| UnitedHealth Group, Inc. | | | 253,849 | | | | 64,147,642 | |
| | | | | | | | |
| | | | | | | 92,894,807 | |
| Life Sciences Tools & Services—2.5% | | | | | |
| Lonza Group AG1 | | | 79,996 | | | | 28,800,363 | |
14 INVESCO OPPENHEIMER RISING DIVIDENDS FUND
| | | | | | | | |
| | | Shares | | | Value |
| Life Sciences Tools & Services (Continued) | |
| Thermo Fisher Scientific, Inc. | | | 142,979 | | | $ | 43,176,798 | |
| | | | | | | | |
| | | | | | | 71,977,161 | |
| Pharmaceuticals—3.7% | | | | | |
| Merck & Co., Inc. | | | 417,697 | | | | 36,197,622 | |
| Pfizer, Inc. | | | 605,300 | | | | 23,225,361 | |
| Zoetis, Inc., Cl. A | | | 349,012 | | | | 44,645,615 | |
| | | | | | | | |
| | | | | | | 104,068,598 | |
| Industrials—9.9% | | | | | | | | |
| Aerospace & Defense—4.3% | | | | | |
| Airbus SE | | | 196,680 | | | | 28,185,825 | |
| Boeing Co. (The) | | | 130,776 | | | | 44,452,070 | |
| Lockheed Martin Corp. | | | 126,412 | | | | 47,616,872 | |
| | | | | | | | |
| | | | | | | 120,254,767 | |
| Commercial Services & Supplies—1.6% | |
| Cintas Corp. | | | 86,835 | | | | 23,329,960 | |
| Republic Services, Inc., Cl. A | | | 258,928 | | | | 22,658,789 | |
| | | | | | | | |
| | | | | | | 45,988,749 | |
| Industrial Conglomerates—1.3% | | | | | |
| Honeywell International, Inc. | | | 210,084 | | | | 36,287,809 | |
| Machinery—1.2% | | | | | | | | |
| Illinois Tool Works, Inc. | | | 208,679 | | | | 35,179,106 | |
| Road & Rail—1.5% | | | | | | | | |
| Union Pacific Corp. | | | 247,279 | | | | 40,914,783 | |
| Information Technology—24.9% | | | | | |
| Communications Equipment—3.0% | | | | | |
| Cisco Systems, Inc. | | | 1,024,761 | | | | 48,686,395 | |
| Motorola Solutions, Inc. | | | 216,152 | | | | 35,950,401 | |
| | | | | | | | |
| | | | | | | 84,636,796 | |
| IT Services—7.0% | | | | | | | | |
| Accenture plc, Cl. A | | | 248,047 | | | | 45,992,875 | |
| Fidelity National Information Services, Inc. | | | 194,616 | | | | 25,642,604 | |
| Mastercard, Inc., Cl. A | | | 217,984 | | | | 60,340,151 | |
| Visa, Inc., Cl. A | | | 365,342 | | | | 65,345,070 | |
| | | | | | | | |
| | | | | | | 197,320,700 | |
| | | | | | | | |
| | | Shares | | | Value |
| Semiconductors & Semiconductor Equipment—3.7% | |
| Applied Materials, Inc. | | | 614,636 | | | $ | 33,350,149 | |
| ASML Holding NV | | | 100,110 | | | | 26,225,817 | |
| Texas Instruments, Inc. | | | 365,040 | | | | 43,071,070 | |
| | | | | | | | |
| | | | | | | 102,647,036 | |
| Software—6.2% | | | | | | | | |
| Intuit, Inc. | | | 74,968 | | | | 19,304,260 | |
| Microsoft Corp. | | | 1,089,758 | | | | 156,238,604 | |
| | | | | | | | |
| | | | | | | 175,542,864 | |
| Technology Hardware, Storage & Peripherals—5.0% | |
| Apple, Inc. | | | 568,855 | | | | 141,508,370 | |
| Materials—1.3% | | | | | | | | |
| Chemicals—1.3% | | | | | | | | |
| Air Products & Chemicals, Inc. | | | 171,814 | | | | 36,641,054 | |
| Utilities—4.7% | | | | | | | | |
| Electric Utilities—3.0% | | | | | |
| Duke Energy Corp. | | | 514,695 | | | | 48,515,151 | |
| Evergy, Inc. | | | 584,105 | | | | 37,330,150 | |
| | | | | | | | |
| | | | | | | 85,845,301 | |
| Gas Utilities—0.6% | | | | | | | | |
| Atmos Energy Corp. | | | 144,326 | | | | 16,233,788 | |
| Independent Power and Renewable Electricity Producers—1.1% | |
| NRG Energy, Inc. | | | 743,931 | | | | 29,846,512 | |
| | | | | | | | |
Total Common Stocks (Cost $2,057,175,186) | | | | | | | 2,790,962,354 | |
| Investment Company—1.1% | | | | | |
Invesco Government & Agency Portfolio, Institutional Class, 1.71%2(Cost $30,479,100) | | | 30,479,100 | | | | 30,479,100 | |
| Total Investments, at Value (Cost $2,087,654,286) | | | 100.1% | | | | 2,821,441,454 | |
| Net Other Assets (Liabilities) | | | (0.1 | ) | | | (2,652,063 | ) |
| | | | |
| Net Assets | | | 100.0% | | | $ | 2,818,789,391 | |
| | | | |
15 INVESCO OPPENHEIMER RISING DIVIDENDS FUND
SCHEDULE OF INVESTMENTSContinued
Footnotes to Statement of Investments
1.Non-income producing security.
2. The money market fund and the Fund are affiliated by having the same investment adviser. The rate shown is the7-day SEC standardized yield as of October 31, 2019.
See accompanying Notes to Financial Statements.
16 INVESCO OPPENHEIMER RISING DIVIDENDS FUND
STATEMENT OF ASSETS AND LIABILITIESOctober 31, 2019
| | | | |
Assets | | | | |
| Investments, at value—see accompanying schedule of investments: | | | | |
| Unaffiliated companies (cost $2,057,175,186) | | $ | 2,790,962,354 | |
| Affiliated companies (cost $30,479,100) | | | 30,479,100 | |
| | | | 2,821,441,454 | |
| Cash | | | 2,995,437 | |
| Receivables and other assets: | | | | |
| Investments sold | | | 10,706,389 | |
| Dividends | | | 1,979,110 | |
| Shares of beneficial interest sold | | | 695,482 | |
| Other | | | 198,871 | |
| Total assets | | | 2,838,016,743 | |
Liabilities | | | | |
| Amount due to custodian-foreign | | | 71,241 | |
| Payables and other liabilities: | | | | |
| Investments purchased | | | 14,122,338 | |
| Shares of beneficial interest redeemed | | | 2,724,051 | |
| Transfer and shareholder servicing agent fees | | | 950,211 | |
| Distribution and service plan fees | | | 744,742 | |
| Trustees’ compensation | | | 305,316 | |
| Shareholder communications | | | 211,270 | |
| Advisory fees | | | 46,222 | |
| Administration fees | | | 474 | |
| Other | | | 51,487 | |
| | | | |
| Total liabilities | | | 19,227,352 | |
| Net Assets | | $ | 2,818,789,391 | |
| | | | |
| | | | |
Composition of Net Assets | | | | |
| Shares of beneficial interest | | $ | 1,991,021,648 | |
| Total distributable earnings | | | 827,767,743 | |
| | | | |
| Net Assets | | $ | 2,818,789,391 | |
| | | | |
17 INVESCO OPPENHEIMER RISING DIVIDENDS FUND
STATEMENT OF ASSETS AND LIABILITIESContinued
| | | | |
Net Asset Value Per Share | | | | |
| Class A Shares: | | | | |
| |
| Net asset value and redemption price per share (based on net assets of $2,055,642,851 and 101,704,990 shares of beneficial interest outstanding) | | $ | 20.21 | |
| |
Maximum offering price per share (net asset value plus sales charge of 5.50% of offering price) | | $ | 21.39 | |
| |
| Class C Shares: | | | | |
| |
Net asset value, redemption price (excludes applicable contingent deferred sales charge) and offering price per share (based on net assets of $317,474,679 and 18,935,229 shares of beneficial interest outstanding) | | $ | 16.77 | |
| |
| Class R Shares: | | | | |
| |
Net asset value, redemption price and offering price per share (based on net assets of $104,286,878 and 5,199,100 shares of beneficial interest outstanding) | | $ | 20.06 | |
| |
| Class Y Shares: | | | | |
| |
Net asset value, redemption price and offering price per share (based on net assets of $311,750,176 and 14,829,304 shares of beneficial interest outstanding) | | $ | 21.02 | |
| |
| Class R5 Shares: | | | | |
| |
Net asset value, redemption price and offering price per share (based on net assets of $10,834 and 536 shares of beneficial interest outstanding) | | $ | 20.21 | |
| |
| Class R6 Shares: | | | | |
| |
| Net asset value, redemption price and offering price per share (based on net assets of $29,623,973 and 1,412,583 shares of beneficial interest outstanding) | | $ | 20.97 | |
See accompanying Notes to Financial Statements.
18 INVESCO OPPENHEIMER RISING DIVIDENDS FUND
STATEMENT
OF OPERATIONSFor the Year Ended October 31, 2019
| | | | |
Investment Income | | | | |
| Dividends: | | | | |
| Unaffiliated companies (net of foreign withholding taxes of $459,778) | | $ | 60,539,747 | |
| Affiliated companies | | | 794,501 | |
| Interest | | | 70,614 | |
| | | | |
Total investment income | | | 61,404,862 | |
Expenses | | | | |
| Advisory fees | | | 16,781,933 | |
| Administration fees | | | 171,992 | |
| Distribution and service plan fees: | | | | |
| Class A | | | 4,811,421 | |
| Class C | | | 4,053,670 | |
| Class R | | | 516,244 | |
| Transfer and shareholder servicing agent fees: | | | | |
| Class A | | | 3,543,316 | |
| Class C | | | 743,524 | |
| Class R | | | 188,326 | |
| Class Y | | | 575,020 | |
| Class R5 | | | 3 | |
| Class R6 | | | 5,748 | |
| Shareholder communications: | | | | |
| Class A | | | 164,226 | |
| Class C | | | 29,165 | |
| Class R | | | 8,517 | |
| Class Y | | | 24,911 | |
| Class R5 | | | 1 | |
| Class R6 | | | 2,216 | |
| Borrowing fees | | | 48,146 | |
| Trustees’ compensation | | | 47,520 | |
| Custodian fees and expenses | | | 22,595 | |
| Other | | | 219,854 | |
| | | | |
| Total expenses | | | 31,958,348 | |
| Less waivers and reimbursement of expenses | | | (34,819 | ) |
| | | | |
| Net expenses | | | 31,923,529 | |
| Net Investment Income | | | 29,481,333 | |
19 INVESCO OPPENHEIMER RISING DIVIDENDS FUND
STATEMENT
OF OPERATIONSContinued
| | | | |
Realized and Unrealized Gain | | | | |
| Net realized gain (loss) on: | | | | |
| Investment transactions in unaffiliated companies (includes net gain (loss) from securities sold to affiliates of $607,116) | | $ | 91,006,770 | |
| Foreign currency transactions | | | 49,237 | |
| | | | |
| Net realized gain | | | 91,056,007 | |
| Net change in unrealized appreciation/(depreciation) on: | | | | |
| Investment transactions in unaffiliated companies | | | 198,976,081 | |
| Translation of assets and liabilities denominated in foreign currencies | | | 6,987 | |
| | | | |
Net change in unrealized appreciation/(depreciation) | | | 198,983,068 | |
| Net Increase in Net Assets Resulting from Operations | | $ | 319,520,408 | |
| | | | |
See accompanying Notes to Financial Statements.
20 INVESCO OPPENHEIMER RISING DIVIDENDS FUND
STATEMENT OF CHANGES IN NET ASSETS
| | | | | | | | |
| | | Year Ended
October 31, 2019 | | Year Ended
October 31, 2018 | |
Operations | | | | | | | | |
| Net investment income | | $ | 29,481,333 | | | $ | 31,985,047 | |
| Net realized gain | | | 91,056,007 | | | | 218,656,742 | |
| Net change in unrealized appreciation/(depreciation) | | | 198,983,068 | | | | (105,616,948 | ) |
| | | | |
Net increase in net assets resulting from operations | | | 319,520,408 | | | | 145,024,841 | |
Dividends and/or Distributions to Shareholders | | | | | | | | |
| Distributions to shareholders from distributable earnings: | | | | | | | | |
| Class A | | | (148,441,686 | ) | | | (188,267,465 | ) |
| Class B1 | | | — | | | | (1,468,312 | ) |
| Class C | | | (38,808,896 | ) | | | (51,054,553 | ) |
| Class R | | | (7,628,712 | ) | | | (9,646,752 | ) |
| Class Y | | | (25,506,364 | ) | | | (39,206,844 | ) |
| Class R5 | | | (67 | ) | | | — | |
| Class R6 | | | (1,868,881 | ) | | | (1,999,969 | ) |
| | | | |
Total distributions from distributable earnings | | | (222,254,606 | ) | | | (291,643,895 | ) |
Beneficial Interest Transactions | | | | | | | | |
| Net increase (decrease) in net assets resulting from beneficial interest transactions: | | | | | | | | |
| Class A | | | (1,247,458 | ) | | | (58,970,092 | ) |
| Class B1 | | | — | | | | (20,227,225 | ) |
| Class C | | | (157,408,225 | ) | | | (32,733,790 | ) |
| Class R | | | (4,569,374 | ) | | | (1,486,900 | ) |
| Class Y | | | (43,978,936 | ) | | | (101,215,362 | ) |
| Class R5 | | | 10,000 | | | | — | |
| Class R6 | | | 4,152,973 | | | | 3,710,006 | |
| | | | |
Total beneficial interest transactions | | | (203,041,020 | ) | | | (210,923,363 | ) |
Net Assets | | | | | | | | |
| Total increase (decrease) | | | (105,775,218 | ) | | | (357,542,417 | ) |
| Beginning of period | | | 2,924,564,609 | | | | 3,282,107,026 | |
| | | | |
| End of period | | $ | 2,818,789,391 | | | $ | 2,924,564,609 | |
| | | | |
1. Effective June 1, 2018, all Class B shares converted to Class A shares.
See accompanying Notes to Financial Statements.
21 INVESCO OPPENHEIMER RISING DIVIDENDS FUND
FINANCIAL HIGHLIGHTS
| | | | | | | | | | | | | | | | | | | | |
| Class A | | Year Ended
October 31,
2019 | | | Year Ended
October 31,
2018 | | | Year Ended
October 31,
2017 | | | Year Ended
October 31,
2016 | | | Year Ended
October 30,
20151 | |
Per Share Operating Data | | | | | | | | | | | | | | | | | | | | |
| Net asset value, beginning of period | | | $19.48 | | | | $20.45 | | | | $18.26 | | | | $19.88 | | | | $20.99 | |
| Income (loss) from investment operations: | | | | | | | | | | | | | | | | | | | | |
| Net investment income2 | | | 0.22 | | | | 0.22 | | | | 0.27 | | | | 0.24 | | | | 0.17 | |
| Net realized and unrealized gain (loss) | | | 1.98 | | | | 0.63 | | | | 3.11 | | | | (0.48) | | | | 0.62 | |
| Total from investment operations | | | 2.20 | | | | 0.85 | | | | 3.38 | | | | (0.24) | | | | 0.79 | |
| Dividends and/or distributions to shareholders: | | | | | | | | | | | | | | | | | | | | |
| Dividends from net investment income | | | (0.18) | | | | (0.23) | | | | (0.29) | | | | (0.25) | | | | (0.17) | |
| Distributions from net realized gain | | | (1.29) | | | | (1.59) | | | | (0.90) | | | | (1.13) | | | | (1.73) | |
| Total dividends and/or distributions to shareholders | | | (1.47) | | | | (1.82) | | | | (1.19) | | | | (1.38) | | | | (1.90) | |
| Net asset value, end of period | | | $20.21 | | | | $19.48 | | | | $20.45 | | | | $18.26 | | | | $19.88 | |
| | | | | | | | | | | | | | | | | | | | |
| | | | | | | | | | | | | | | | | | | | |
Total Return, at Net Asset Value3 | | | 12.30% | | | | 4.39% | | | | 19.42% | | | | (1.37)% | | | | 3.72% | |
| | | | | | | | | | | | | | | | | | | | |
Ratios/Supplemental Data | | | | | | | | | | | | | | | | | | | | |
| Net assets, end of period (in thousands) | | | $2,055,643 | | | | $1,980,262 | | | | $2,131,479 | | | | $2,201,657 | | | | $2,615,039 | |
| Average net assets (in thousands) | | | $1,961,321 | | | | $2,110,412 | | | | $2,175,064 | | | | $2,406,601 | | | | $2,727,301 | |
| Ratios to average net assets:4 | | | | | | | | | | | | | | | | | | | | |
| Net investment income | | | 1.13% | | | | 1.11% | | | | 1.43% | | | | 1.29% | | | | 0.85% | |
| Expenses excluding specific expenses listed below | | | 1.05% | | | | 1.06% | | | | 1.07% | | | | 1.07% | | | | 1.05% | |
| Interest and fees from borrowings | | | 0.00%5 | | | | 0.00%5 | | | | 0.00%5 | | | | 0.00%5 | | | | 0.00%5 | |
| Total expenses6 | | | 1.05% | | | | 1.06% | | | | 1.07% | | | | 1.07% | | | | 1.05% | |
| Expenses after payments, waivers and/or reimbursements and reduction to custodian expenses | | | 1.05%7 | | | | 1.06%7 | | | | 1.06% | | | | 1.07%7 | | | | 1.05%7 | |
| Portfolio turnover rate8 | | | 29% | | | | 58% | | | | 78% | | | | 96% | | | | 60% | |
1. Represents the last business day of the Fund’s reporting period.
2. Per share amounts calculated based on the average shares outstanding during the period.
3. Includes adjustments in accordance with accounting principles generally accepted in the United States of America and as such, the net asset value for financial reporting purposes and the returns based upon those net asset values may differ from the net asset value and returns for shareholder transactions. Does not include sales charges and is not annualized for periods less than one year, if applicable.
4. Annualized for periods less than one full year.
5. Less than 0.005%.
6. Total expenses including indirect expenses from affiliated fund fees and expenses were as follows:
| | | | |
| Year Ended October 31, 2019 | | | 1.05 | % |
| Year Ended October 31, 2018 | | | 1.06 | % |
| Year Ended October 31, 2017 | | | 1.07 | % |
| Year Ended October 31, 2016 | | | 1.07 | % |
| Year Ended October 30, 2015 | | | 1.05 | % |
7. Waiver was less than 0.005%.
8. Portfolio turnover is calculated at the fund level and is not annualized for periods less than one year, if applicable.
See accompanying Notes to Financial Statements.
22 INVESCO OPPENHEIMER RISING DIVIDENDS FUND
| | | | | | | | | | | | | | | | | | | | |
| Class C | | Year Ended
October 31,
2019 | | | Year Ended
October 31,
2018 | | | Year Ended
October 31,
2017 | | | Year Ended
October 31,
2016 | | | Year Ended
October 30,
20151 | |
Per Share Operating Data | | | | | | | | | | | | | | | | | | | | |
| Net asset value, beginning of period | | | $16.44 | | | | $17.54 | | | | $15.83 | | | | $17.43 | | | | $18.63 | |
| Income (loss) from investment operations: | | | | | | | | | | | | | | | | | | | | |
| Net investment income2 | | | 0.06 | | | | 0.06 | | | | 0.11 | | | | 0.09 | | | | 0.02 | |
| Net realized and unrealized gain (loss) | | | 1.64 | | | | 0.54 | | | | 2.68 | | | | (0.42) | | | | 0.55 | |
| Total from investment operations | | | 1.70 | | | | 0.60 | | | | 2.79 | | | | (0.33) | | | | 0.57 | |
| Dividends and/or distributions to shareholders: | | | | | | | | | | | | | | | | | | | | |
| Dividends from net investment income | | | (0.08) | | | | (0.11) | | | | (0.18) | | | | (0.14) | | | | (0.04) | |
| Distributions from net realized gain | | | (1.29) | | | | (1.59) | | | | (0.90) | | | | (1.13) | | | | (1.73) | |
| Total dividends and/or distributions to shareholders | | | (1.37) | | | | (1.70) | | | | (1.08) | | | | (1.27) | | | | (1.77) | |
| Net asset value, end of period | | | $16.77 | | | | $16.44 | | | | $17.54 | | | | $15.83 | | | | $17.43 | |
| | | | | | | | | | | | | | | | | | | | |
| | | | | | | | | | | | | | | | | | | | |
Total Return, at Net Asset Value3 | | | 11.44% | | | | 3.65% | | | | 18.54% | | | | (2.13)% | | | | 2.97% | |
| | | | | | | | | | | | | | | | | | | | |
Ratios/Supplemental Data | | | | | | | | | | | | | | | | | | | | |
| Net assets, end of period (in thousands) | | | $317,475 | | | | $470,544 | | | | $534,216 | | | | $586,282 | | | | $716,184 | |
| Average net assets (in thousands) | | | $405,793 | | | | $512,837 | | | | $561,839 | | | | $653,546 | | | | $750,751 | |
| Ratios to average net assets:4 | | | | | | | | | | | | | | | | | | | | |
| Net investment income | | | 0.38% | | | | 0.36% | | | | 0.68% | | | | 0.54% | | | | 0.10% | |
| Expenses excluding specific expenses listed below | | | 1.80% | | | | 1.81% | | | | 1.83% | | | | 1.82% | | | | 1.80% | |
| Interest and fees from borrowings | | | 0.00%5 | | | | 0.00%5 | | | | 0.00%5 | | | | 0.00%5 | | | | 0.00%5 | |
| Total expenses6 | | | 1.80% | | | | 1.81% | | | | 1.83% | | | | 1.82% | | | | 1.80% | |
| Expenses after payments, waivers and/or reimbursements and reduction to custodian expenses | | | 1.80%7 | | | | 1.81%7 | | | | 1.82% | | | | 1.82%7 | | | | 1.80%7 | |
| Portfolio turnover rate8 | | | 29% | | | | 58% | | | | 78% | | | | 96% | | | | 60% | |
1. Represents the last business day of the Fund’s reporting period.
2. Per share amounts calculated based on the average shares outstanding during the period.
3. Includes adjustments in accordance with accounting principles generally accepted in the United States of America and as such, the net asset value for financial reporting purposes and the returns based upon those net asset values may differ from the net asset value and returns for shareholder transactions. Does not include sales charges and is not annualized for periods less than one year, if applicable.
4. Annualized for periods less than one full year.
5. Less than 0.005%.
6. Total expenses including indirect expenses from affiliated fund fees and expenses were as follows:
| | | | |
| Year Ended October 31, 2019 | | | 1.80 | % |
| Year Ended October 31, 2018 | | | 1.81 | % |
| Year Ended October 31, 2017 | | | 1.83 | % |
| Year Ended October 31, 2016 | | | 1.82 | % |
| Year Ended October 30, 2015 | | | 1.80 | % |
7. Waiver was less than 0.005%.
8. Portfolio turnover is calculated at the fund level and is not annualized for periods less than one year, if applicable.
See accompanying Notes to Financial Statements.
23 INVESCO OPPENHEIMER RISING DIVIDENDS FUND
FINANCIAL HIGHLIGHTSContinued
| | | | | | | | | | | | | | | | | | | | |
| Class R | | Year Ended
October 31,
2019 | | | Year Ended
October 31,
2018 | | | Year Ended
October 31,
2017 | | | Year Ended
October 31,
2016 | | | Year Ended
October 30,
20151 | |
Per Share Operating Data | | | | | | | | | | | | | | | | | | | | |
| Net asset value, beginning of period | | | $19.35 | | | | $20.32 | | | | $18.15 | | | | $19.77 | | | | $20.88 | |
| Income (loss) from investment operations: | | | | | | | | | | | | | | | | | | | | |
| Net investment income2 | | | 0.17 | | | | 0.17 | | | | 0.23 | | | | 0.19 | | | | 0.12 | |
| Net realized and unrealized gain (loss) | | | 1.97 | | | | 0.63 | | | | 3.08 | | | | (0.48) | | | | 0.61 | |
| Total from investment operations | | | 2.14 | | | | 0.80 | | | | 3.31 | | | | (0.29) | | | | 0.73 | |
| Dividends and/or distributions to shareholders: | | | | | | | | | | | | | | | | | | | | |
| Dividends from net investment income | | | (0.14) | | | | (0.18) | | | | (0.24) | | | | (0.20) | | | | (0.11) | |
| Distributions from net realized gain | | | (1.29) | | | | (1.59) | | | | (0.90) | | | | (1.13) | | | | (1.73) | |
| Total dividends and/or distributions to shareholders | | | (1.43) | | | | (1.77) | | | | (1.14) | | | | (1.33) | | | | (1.84) | |
| Net asset value, end of period | | | $20.06 | | | | $19.35 | | | | $20.32 | | | | $18.15 | | | | $19.77 | |
| | | | | | | | | | | | | | | | | | | | |
| | | | | | | | | | | | | | | | | | | | |
Total Return, at Net Asset Value3 | | | 12.00% | | | | 4.16% | | | | 19.12% | | | | (1.63)% | | | | 3.47% | |
| | | | | | | | | | | | | | | | | | | | |
Ratios/Supplemental Data | | | | | | | | | | | | | | | | | | | | |
| Net assets, end of period (in thousands) | | | $104,287 | | | | $104,523 | | | | $111,030 | | | | $118,374 | | | | $142,003 | |
| Average net assets (in thousands) | | | $104,073 | | | | $110,250 | | | | $117,073 | | | | $128,499 | | | | $150,181 | |
| Ratios to average net assets:4 | | | | | | | | | | | | | | | | | | | | |
| Net investment income | | | 0.88% | | | | 0.86% | | | | 1.20% | | | | 1.04% | | | | 0.60% | |
| Expenses excluding specific expenses listed below | | | 1.30% | | | | 1.31% | | | | 1.33% | | | | 1.32% | | | | 1.30% | |
| Interest and fees from borrowings | | | 0.00%5 | | | | 0.00%5 | | | | 0.00%5 | | | | 0.00%5 | | | | 0.00%5 | |
| Total expenses6 | | | 1.30% | | | | 1.31% | | | | 1.33% | | | | 1.32% | | | | 1.30% | |
| Expenses after payments, waivers and/or reimbursements and reduction to custodian expenses | | | 1.30%7 | | | | 1.31%7 | | | | 1.31% | | | | 1.32%7 | | | | 1.30%7 | |
| Portfolio turnover rate8 | | | 29% | | | | 58% | | | | 78% | | | | 96% | | | | 60% | |
1. Represents the last business day of the Fund’s reporting period.
2. Per share amounts calculated based on the average shares outstanding during the period.
3. Includes adjustments in accordance with accounting principles generally accepted in the United States of America and as such, the net asset value for financial reporting purposes and the returns based upon those net asset values may differ from the net asset value and returns for shareholder transactions. Does not include sales charges and is not annualized for periods less than one year, if applicable.
4. Annualized for periods less than one full year.
5. Less than 0.005%.
6. Total expenses including indirect expenses from affiliated fund fees and expenses were as follows:
| | | | |
| Year Ended October 31, 2019 | | | 1.30 | % |
| Year Ended October 31, 2018 | | | 1.31 | % |
| Year Ended October 31, 2017 | | | 1.33 | % |
| Year Ended October 31, 2016 | | | 1.32 | % |
| Year Ended October 30, 2015 | | | 1.30 | % |
7. Waiver was less than 0.005%.
8. Portfolio turnover is calculated at the fund level and is not annualized for periods less than one year, if applicable.
See accompanying Notes to Financial Statements.
24 INVESCO OPPENHEIMER RISING DIVIDENDS FUND
| | | | | | | | | | | | | | | | | | | | |
| Class Y | | Year Ended
October 31,
2019 | | | Year Ended
October 31,
2018 | | | Year Ended
October 31,
2017 | | | Year Ended
October 31,
2016 | | | Year Ended
October 30,
20151 | |
Per Share Operating Data | | | | | | | | | | | | | | | | | | | | |
| Net asset value, beginning of period | | | $20.21 | | | | $21.14 | | | | $18.84 | | | | $20.45 | | | | $21.53 | |
| Income (loss) from investment operations: | | | | | | | | | | | | | | | | | | | | |
| Net investment income2 | | | 0.27 | | | | 0.28 | | | | 0.34 | | | | 0.32 | | | | 0.23 | |
| Net realized and unrealized gain (loss) | | | 2.06 | | | | 0.66 | | | | 3.20 | | | | (0.52) | | | | 0.63 | |
| Total from investment operations | | | 2.33 | | | | 0.94 | | | | 3.54 | | | | (0.20) | | | | 0.86 | |
| Dividends and/or distributions to shareholders: | | | | | | | | | | | | | | | | | | | | |
| Dividends from net investment income | | | (0.23) | | | | (0.28) | | | | (0.34) | | | | (0.28) | | | | (0.21) | |
| Distributions from net realized gain | | | (1.29) | | | | (1.59) | | | | (0.90) | | | | (1.13) | | | | (1.73) | |
| Total dividends and/or distributions to shareholders | | | (1.52) | | | | (1.87) | | | | (1.24) | | | | (1.41) | | | | (1.94) | |
| Net asset value, end of period | | | $21.02 | | | | $20.21 | | | | $21.14 | | | | $18.84 | | | | $20.45 | |
| | | | | | | | | | | | | | | | | | | | |
| | | | | | | | | | | | | | | | | | | | |
Total Return, at Net Asset Value3 | | | 12.52% | | | | 4.68% | | | | 19.69% | | | | (1.11)% | | | | 4.01% | |
| | | | | | | | | | | | | | | | | | | | |
Ratios/Supplemental Data | | | | | | | | | | | | | | | | | | | | |
| Net assets, end of period (in thousands) | | | $311,750 | | | | $345,108 | | | | $462,807 | | | | $485,497 | | | | $1,644,707 | |
| Average net assets (in thousands) | | | $316,747 | | | | $390,440 | | | | $489,430 | | | | $1,140,392 | | | | $1,807,893 | |
| Ratios to average net assets:4 | | | | | | | | | | | | | | | | | | | | |
| Net investment income | | | 1.38% | | | | 1.36% | | | | 1.69% | | | | 1.67% | | | | 1.12% | |
| Expenses excluding specific expenses listed below | | | 0.80% | | | | 0.81% | | | | 0.83% | | | | 0.82% | | | | 0.81% | |
| Interest and fees from borrowings | | | 0.00%5 | | | | 0.00%5 | | | | 0.00%5 | | | | 0.00%5 | | | | 0.00%5 | |
| Total expenses6 | | | 0.80% | | | | 0.81% | | | | 0.83% | | | | 0.82% | | | | 0.81% | |
| Expenses after payments, waivers and/or reimbursements and reduction to custodian expenses | | | 0.80%7 | | | | 0.81%7 | | | | 0.82% | | | | 0.82%7 | | | | 0.81%7 | |
| Portfolio turnover rate8 | | | 29% | | | | 58% | | | | 78% | | | | 96% | | | | 60% | |
1. Represents the last business day of the Fund’s reporting period.
2. Per share amounts calculated based on the average shares outstanding during the period.
3. Includes adjustments in accordance with accounting principles generally accepted in the United States of America and as such, the net asset value for financial reporting purposes and the returns based upon those net asset values may differ from the net asset value and returns for shareholder transactions. Does not include sales charges and is not annualized for periods less than one year, if applicable.
4. Annualized for periods less than one full year.
5. Less than 0.005%.
6. Total expenses including indirect expenses from affiliated fund fees and expenses were as follows:
| | | | |
| Year Ended October 31, 2019 | | | 0.80 | % |
| Year Ended October 31, 2018 | | | 0.81 | % |
| Year Ended October 31, 2017 | | | 0.83 | % |
| Year Ended October 31, 2016 | | | 0.82 | % |
| Year Ended October 31, 2015 | | | 0.81 | % |
7. Waiver was less than 0.005%.
8. Portfolio turnover is calculated at the fund level and is not annualized for periods less than one year, if applicable.
See accompanying Notes to Financial Statements.
25 INVESCO OPPENHEIMER RISING DIVIDENDS FUND
FINANCIAL HIGHLIGHTSContinued
| | | | |
| Class R5 | | Period
Ended
October 31,
20191 | |
Per Share Operating Data | | | | |
| Net asset value, beginning of period | | | $18.65 | |
| Income (loss) from investment operations: | | | | |
| Net investment income2 | | | 0.13 | |
| Net realized and unrealized gain | | | 1.55 | |
| Total from investment operations | | | 1.68 | |
| Dividends and/or distributions to shareholders: | | | | |
| Dividends from net investment income | | | (0.12) | |
| Distributions from net realized gain | | | 0.00 | |
| Total dividends and/or distributions to shareholders | | | (0.12) | |
| Net asset value, end of period | | | $20.21 | |
| | | | |
| | | | |
Total Return, at Net Asset Value3 | | | 9.05% | |
| | | | |
Ratios/Supplemental Data | | | | |
| Net assets, end of period (in thousands) | | | $11 | |
| Average net assets (in thousands) | | | $11 | |
| Ratios to average net assets:4 | | | | |
| Net investment income | | | 1.49% | |
| Expenses excluding specific expenses listed below | | | 0.70% | |
| Interest and fees from borrowings | | | 0.00%5 | |
| Total expenses6 | | | 0.70% | |
| Expenses after payments, waivers and/or reimbursements and reduction to custodian expenses | | | 0.69% | |
| Portfolio turnover rate7 | | | 29% | |
1. For the period from after the close of business on May 24, 2019 (inception of offering) to October 31, 2019.
2. Per share amounts calculated based on the average shares outstanding during the period.
3. Includes adjustments in accordance with accounting principles generally accepted in the United States of America and as such, the net asset value for financial reporting purposes and the returns based upon those net asset values may differ from the net asset value and returns for shareholder transactions. Does not include sales charges and is not annualized for periods less than one year, if applicable.
4. Annualized for periods less than one full year.
5. Waiver was less than 0.005%.
6. Total expenses including indirect expenses from affiliated fund fees and expenses were as follows:
| | | | |
| Period Ended October 31, 2019 | | | 0.70 | % |
7. Portfolio turnover is calculated at the fund level and is not annualized for periods less than one year, if applicable.
See accompanying Notes to Financial Statements.
26 INVESCO OPPENHEIMER RISING DIVIDENDS FUND
| | | | | | | | | | | | | | | | | | | | |
| Class R6 | | Year Ended
October 31,
2019 | | | Year Ended
October 31,
2018 | | | Year Ended
October 31,
2017 | | | Year Ended
October 31,
2016 | | | Year Ended
October 30,
20151 | |
Per Share Operating Data | | | | | | | | | | | | | | | | | | | | |
| Net asset value, beginning of period | | | $20.16 | | | | $21.10 | | | | $18.81 | | | | $20.43 | | | | $21.52 | |
| Income (loss) from investment operations: | | | | | | | | | | | | | | | | | | | | |
| Net investment income2 | | | 0.30 | | | | 0.31 | | | | 0.35 | | | | 0.37 | | | | 0.26 | |
| Net realized and unrealized gain (loss) | | | 2.06 | | | | 0.65 | | | | 3.21 | | | | (0.53) | | | | 0.64 | |
| Total from investment operations | | | 2.36 | | | | 0.96 | | | | 3.56 | | | | (0.16) | | | | 0.90 | |
| Dividends and/or distributions to shareholders: | | | | | | | | | | | | | | | | | | | | |
| Dividends from net investment income | | | (0.26) | | | | (0.31) | | | | (0.37) | | | | (0.33) | | | | (0.26) | |
| Distributions from net realized gain | | | (1.29) | | | | (1.59) | | | | (0.90) | | | | (1.13) | | | | (1.73) | |
| Total dividends and/or distributions to shareholders | | | (1.55) | | | | (1.90) | | | | (1.27) | | | | (1.46) | | | | (1.99) | |
| Net asset value, end of period | | | $20.97 | | | | $20.16 | | | | $21.10 | | | | $18.81 | | | | $20.43 | |
| | | | | | | | | | | | | | | | | | | | |
| | | | | | | | | | | | | | | | | | | | |
Total Return, at Net Asset Value3 | | | 12.72% | | | | 4.82% | | | | 19.89% | | | | (0.92)% | | | | 4.19% | |
| | | | | | | | | | | | | | | | | | | | |
Ratios/Supplemental Data | | | | | | | | | | | | | | | | | | | | |
| Net assets, end of period (in thousands) | | | $29,624 | | | | $24,128 | | | | $21,409 | | | | $8,978 | | | | $45,049 | |
| Average net assets (in thousands) | | | $25,995 | | | | $23,333 | | | | $9,823 | | | | $24,379 | | | | $47,979 | |
| Ratios to average net assets:4 | | | | | | | | | | | | | | | | | | | | |
| Net investment income | | | 1.54% | | | | 1.52% | | | | 1.78% | | | | 1.95% | | | | 1.28% | |
| Expenses excluding specific expenses listed below | | | 0.64% | | | | 0.65% | | | | 0.64% | | | | 0.63% | | | | 0.62% | |
| Interest and fees from borrowings | | | 0.00%5 | | | | 0.00%5 | | | | 0.00%5 | | | | 0.00%5 | | | | 0.00%5 | |
| Total expenses6 | | | 0.64% | | | | 0.65% | | | | 0.64% | | | | 0.63% | | | | 0.62% | |
| Expenses after payments, waivers and/or reimbursements and reduction to custodian expenses | | | 0.64%7 | | | | 0.65%7 | | | | 0.64%7 | | | | 0.63%7 | | | | 0.62%7 | |
| Portfolio turnover rate8 | | | 29% | | | | 58% | | | | 78% | | | | 96% | | | | 60% | |
1. Represents the last business day of the Fund’s reporting period.
2. Per share amounts calculated based on the average shares outstanding during the period.
3. Includes adjustments in accordance with accounting principles generally accepted in the United States of America and as such, the net asset value for financial reporting purposes and the returns based upon those net asset values may differ from the net asset value and returns for shareholder transactions. Does not include sales charges and is not annualized for periods less than one year, if applicable.
4. Annualized for periods less than one full year.
5. Less than 0.005%.
6. Total expenses including indirect expenses from affiliated fund fees and expenses were as follows:
| | | | |
| Year Ended October 31, 2019 | | | 0.64 | % |
| Year Ended October 31, 2018 | | | 0.65 | % |
| Year Ended October 31, 2017 | | | 0.64 | % |
| Year Ended October 31, 2016 | | | 0.63 | % |
| Year Ended October 30, 2015 | | | 0.62 | % |
7. Waiver was less than 0.005%.
8. Portfolio turnover is calculated at the fund level and is not annualized for periods less than one year, if applicable.
See accompanying Notes to Financial Statements.
27 INVESCO OPPENHEIMER RISING DIVIDENDS FUND
NOTES TO FINANCIAL STATEMENTSOctober 31, 2019
Note 1 - Significant Accounting Policies
Invesco Oppenheimer Rising Dividends Fund (the “Fund”) is a series portfolio of AIM Equity Funds (Invesco Equity Funds) (the “Trust”). The Trust is a Delaware statutory trust registered under the Investment Company Act of 1940, as amended (the “1940 Act”), as anopen-end series management investment company authorized to issue an unlimited number of shares of beneficial interest. Information presented in these financial statements pertains only to the Fund. Matters affecting the Fund or each class will be voted on exclusively by the shareholders of such Fund or each class.
Prior to the close of business on May 24, 2019, the Fund operated as Oppenheimer Rising Dividends Fund (the “Acquired Fund” or “Predecessor Fund”). The Acquired Fund was reorganized after the close of business on May 24, 2019 (the “Reorganization Date”) through the transfer of all of its assets and liabilities to the Fund (the “Reorganization”).
Upon closing of the Reorganization, holders of the Acquired Fund’s Class A, Class C, Class R, and Class Y shares received the corresponding class of shares of the Fund and holders of the Acquired Fund’s Class I shares received Class R6 shares of the Fund. Information for the Acquired Fund’s Class I shares prior to the Reorganization is included with Class R6 shares throughout this report. Class R5 shares commenced operations on the Reorganization Date.
The Fund’s investment objective is to seek total return.
The Fund currently consists of six different classes of shares: Class A, Class C, Class R, Class Y, Class R5 and Class R6. Class Y shares are available only to certain investors. Class A shares are sold with afront-end sales charge unless certain waiver criteria are met and under certain circumstances load waived shares may be subject to contingent deferred sales charges (“CDSC”). Class C shares are sold with a CDSC. Class R, Class Y, Class R5 and Class R6 shares are sold at net asset value. Class C shares held for ten years after purchase are eligible for automatic conversion into Class A shares of the same Fund (the “Conversion Feature”). The automatic conversion pursuant to the Conversion Feature will generally occur at the end of the month following the tenth anniversary after a purchase of Class C shares.
The Fund is an investment company and accordingly follows the investment company accounting and reporting guidance in accordance with Financial Accounting Standards Board Accounting Standards Codification Topic 946, Financial Services – Investment Companies.
The following is a summary of the significant accounting policies followed by the Fund in the preparation of its financial statements.
A. Security Valuations – Securities, including restricted securities, are valued according to the following policy.
A security listed or traded on an exchange (except convertible securities) is valued at its last sales price or official closing price as of the close of the customary trading session on the exchange where the security is principally traded, or lacking any sales or official closing price on a particular day, the security may be valued at the closing bid price on that day. Securities traded in theover-the-counter market are valued based on prices furnished by independent pricing services or market makers. When such securities are valued by an independent pricing service they may be considered fair valued. Futures contracts are valued at the final settlement price set by an exchange on which they are principally traded. Listed
28 INVESCO OPPENHEIMER RISING DIVIDENDS FUND
options are valued at the mean between the last bid and asked prices from the exchange on which they are principally traded. Options not listed on an exchange are valued by an independent source at the mean between the last bid and asked prices. For purposes of determining net asset value (“NAV”) per share, futures and option contracts generally are valued 15 minutes after the close of the customary trading session of the New York Stock Exchange (“NYSE”).
Investments inopen-end andclosed-end registered investment companies that do not trade on an exchange are valued at theend-of-day net asset value per share. Investments inopen-end andclosed-end registered investment companies that trade on an exchange are valued at the last sales price or official closing price as of the close of the customary trading session on the exchange where the security is principally traded.
Debt obligations (including convertible securities) and unlisted equities are fair valued using an evaluated quote provided by an independent pricing service. Evaluated quotes provided by the pricing service may be determined without exclusive reliance on quoted prices, and may reflect appropriate factors such asinstitution-size trading in similar groups of securities, developments related to specific securities, dividend rate (for unlisted equities), yield (for debt obligations), quality, type of issue, coupon rate (for debt obligations), maturity (for debt obligations), individual trading characteristics and other market data. Pricing services generally value debt obligations assuming orderly transactions of institutional round lot size, but a fund may hold or transact in the same securities in smaller, odd lot sizes. Odd lots often trade at lower prices than institutional round lots. Debt obligations are subject to interest rate and credit risks. In addition, all debt obligations involve some risk of default with respect to interest and/or principal payments.
Foreign securities’ (including foreign exchange contracts) prices are converted into U.S. dollar amounts using the applicable exchange rates as of the close of the NYSE. If market quotations are available and reliable for foreign exchange-traded equity securities, the securities will be valued at the market quotations. Because trading hours for certain foreign securities end before the close of the NYSE, closing market quotations may become unreliable. If between the time trading ends on a particular security and the close of the customary trading session on the NYSE, events occur that the investment adviser determines are significant and make the closing price unreliable, the Fund may fair value the security. If the event is likely to have affected the closing price of the security, the security will be valued at fair value in good faith using procedures approved by the Board of Trustees. Adjustments to closing prices to reflect fair value may also be based on a screening process of an independent pricing service to indicate the degree of certainty, based on historical data, that the closing price in the principal market where a foreign security trades is not the current value as of the close of the NYSE. Foreign securities’ prices meeting the approved degree of certainty that the price is not reflective of current value will be priced at the indication of fair value from the independent pricing service. Multiple factors may be considered by the independent pricing service in determining adjustments to reflect fair value and may include information relating to sector indices, American Depositary Receipts and domestic and foreign index futures. Foreign securities may have additional risks including exchange rate changes, potential for sharply devalued currencies
29 INVESCO OPPENHEIMER RISING DIVIDENDS FUND
NOTES TO FINANCIAL STATEMENTSContinued
and high inflation, political and economic upheaval, the relative lack of issuer information, relatively low market liquidity and the potential lack of strict financial and accounting controls and standards.
Securities for which market prices are not provided by any of the above methods may be valued based upon quotes furnished by independent sources. The last bid price may be used to value equity securities. The mean between the last bid and asked prices is used to value debt obligations, including corporate loans.
Securities for which market quotations are not readily available or became unreliable are valued at fair value as determined in good faith by or under the supervision of the Trust’s officers following procedures approved by the Board of Trustees. Issuer specific events, market trends, bid/asked quotes of brokers and information providers and other market data may be reviewed in the course of making a good faith determination of a security’s fair value.
The Fund may invest in securities that are subject to interest rate risk, meaning the risk that the prices will generally fall as interest rates rise and, conversely, the prices will generally rise as interest rates fall. Specific securities differ in their sensitivity to changes in interest rates depending on their individual characteristics. Changes in interest rates may result in increased market volatility, which may affect the value and/or liquidity of certain Fund investments.
Valuations change in response to many factors including the historical and prospective earnings of the issuer, the value of the issuer’s assets, general economic conditions, interest rates, investor perceptions and market liquidity. Because of the inherent uncertainties of valuation, the values reflected in the financial statements may materially differ from the value received upon actual sale of those investments.
| B. | Securities Transactions and Investment Income - Securities transactions are accounted for on a trade date basis. Realized gains or losses on sales are computed on the basis of specific identification of the securities sold. Interest income (net of withholding tax, if any) is recorded on the accrual basis from settlement date. Dividend income (net of withholding tax, if any) is recorded on theex-dividend date. |
The Fund may periodically participate in litigation related to Fund investments. As such, the Fund may receive proceeds from litigation settlements. Any proceeds received are included in the Statement of Operations as realized gain (loss) for investments no longer held and as unrealized gain (loss) for investments still held.
Brokerage commissions and mark ups are considered transaction costs and are recorded as an increase to the cost basis of securities purchased and/or a reduction of proceeds on a sale of securities. Such transaction costs are included in the determination of net realized and unrealized gain (loss) from investment transactions reported in the Statement of Operations and the Statement of Changes in Net Assets and the net realized and unrealized gains (losses) on securities per share in the Financial Highlights. Transaction costs are included in the calculation of the Fund’s net asset value and, accordingly, they reduce the Fund’s total returns. These transaction costs are not considered operating expenses and are not reflected in net investment income reported in the Statement of Operations and the Statement of Changes in Net Assets, or the net investment income per share and the
30 INVESCO OPPENHEIMER RISING DIVIDENDS FUND
ratios of expenses and net investment income reported in the Financial Highlights, nor are they limited by any expense limitation arrangements between the Fund and the investment adviser.
The Fund allocates income and realized and unrealized capital gains and losses to a class based on the relative net assets of each class.
The Fund recharacterizes distributions received from REIT investments based on information provided by the REIT into the following categories: ordinary income, long-term and short-term capital gains, and return of capital. If information is not available on a timely basis from the REIT, the recharacterization will be based on available information which may include the previous year’s allocation. If new or additional information becomes available from the REIT at a later date, a recharacterization will be made in the following year. The Fund records as dividend income the amount recharacterized as ordinary income and as realized gain the amount recharacterized as capital gain in the Statement of Operations, and the amount recharacterized as return of capital as a reduction of the cost of the related investment. These recharacterizations are reflected in the accompanying financial statements.
| C. | Country Determination - For the purposes of making investment selection decisions and presentation in the Schedule of Investments, the investment adviser may determine the country in which an issuer is located and/or credit risk exposure based on various factors. These factors include the laws of the country under which the issuer is organized, where the issuer maintains a principal office, the country in which the issuer derives 50% or more of its total revenues and the country that has the primary market for the issuer’s securities, as well as other criteria. Among the other criteria that may be evaluated for making this determination are the country in which the issuer maintains 50% or more of its assets, the type of security, financial guarantees and enhancements, the nature of the collateral and the sponsor organization. |
| D. | Distributions - Dividends and distributions to shareholders, which are determined in accordance with income tax regulations and may differ from accounting principles generally accepted in the United States of America (“GAAP”), are recorded on theex-dividend date. Income and capital gain distributions, if any, are declared and paid annually or at other times as determined necessary by the Adviser. |
| E. | Return of Capital - Distributions received from the Fund’s investments in MLPs generally are comprised of income and return of capital. The Fund records investment income and return of capital based on estimates made at the time such distributions are received. The return of capital portion of the distribution is a reduction to investment income that results in an equivalent reduction in the cost basis of the associated investments and increases net realized gains (losses) and change in unrealized appreciation (depreciation). Such estimates are based on historical information available from each MLP and other industry sources. These estimates will subsequently be revised and may materially differ primarily based on information received from the MLPs after their tax reporting periods are concluded. |
| F. | Federal Income Taxes - The Fund intends to comply with provisions of the Internal Revenue Code applicable to regulated investment companies and to distribute substantially all of its investment company taxable income, including any net realized gain on |
31 INVESCO OPPENHEIMER RISING DIVIDENDS FUND
NOTES TO FINANCIAL STATEMENTSContinued
investments not offset by capital loss carryforwards, if any, to shareholders. Therefore, no federal income or excise tax provision is required. The Fund files income tax returns in U.S. federal and applicable state jurisdictions. The statute of limitations on the Fund’s tax return filings generally remains open for the three preceding fiscal reporting period ends. The Fund has analyzed its tax positions for the fiscal year ended October 31, 2019, including open tax years, and does not believe there are any uncertain tax positions requiring recognition in the Fund’s financial statements.
The tax components of capital shown in the following table represent distribution requirements the Fund must satisfy under the income tax regulations, losses the Fund may be able to offset against income and gains realized in future years and unrealized appreciation or depreciation of securities and other investments for federal income tax purposes.
| | | | | | | | | | | | |
Undistributed Net Investment Income | | Undistributed
Long-Term
Gain | | | Accumulated
Loss
Carryforward1,2 | | | Net Unrealized
Appreciation
Based on cost of
Securities and
Other Investments
for Federal Income
Tax Purposes | |
| $3,768,570 | | | $91,613,691 | | | | $— | | | | $732,687,960 | |
1. During the reporting period, the Fund did not utilize any capital loss carryforward.
2. During the previous reporting period, the Fund did not utilize any capital loss carryforward.
Net investment income (loss) and net realized gain (loss) may differ for financial statement and tax purposes. The character of dividends and distributions made during the fiscal year from net investment income or net realized gains are determined in accordance with federal income tax requirements, which may differ from the character of net investment income or net realized gains presented in those financial statements in accordance with U.S. GAAP. Also, due to timing of dividends and distributions, the fiscal year in which amounts are distributed may differ from the fiscal year in which the income or net realized gain was recorded by the Fund.
Accordingly, the following amounts have been reclassified for the reporting period. Net assets of the Fund were unaffected by the reclassifications.
| | | | |
Reduction toPaid-in Capital | | Increase
to Accumulated Net
Earnings | |
| $1,803 | | | $1,803 | |
The tax character of distributions paid during the reporting periods:
32 INVESCO OPPENHEIMER RISING DIVIDENDS FUND
| | | | | | | | |
| | | Year Ended
October 31, 2019 | | | Year Ended
October 31, 2018 | |
| Distributions paid from: | | | | | | | | |
| Ordinary income | | $ | 25,693,082 | | | $ | 119,813,534 | |
| Long-term capital gain | | | 196,561,524 | | | | 171,830,361 | |
| | | | |
| Total | | $ | 222,254,606 | | | $ | 291,643,895 | |
| | | | |
The aggregate cost of securities and other investments and the composition of unrealized appreciation and depreciation of securities and other investments for federal income tax purposes at period end are noted in the following table. The primary difference between book and tax appreciation or depreciation of securities and other investments, if applicable, is attributable to the tax deferral of losses or tax realization of financial statement unrealized gain or loss.
| | | | |
| Federal tax cost of securities | | $ | 2,088,753,494 | |
| | | | |
| Gross unrealized appreciation | | $ | 794,697,476 | |
| Gross unrealized depreciation | | | (62,009,516 | ) |
| | | | |
| Net unrealized appreciation | | $ | 732,687,960 | |
| | | | |
| G. | Expenses - Fees provided for under the Rule12b-1 plan of a particular class of the Fund are charged to the operations of such class. Transfer agency fees and expenses and other shareholder recordkeeping fees and expenses attributable to Class R5 and Class R6 are allocated to each share class based on relative net assets.Sub-accounting fees attributable to Class R5 are charged to the operations of the class. Transfer agency fees and expenses and other shareholder recordkeeping fees and expenses relating to all other classes are allocated among those classes based on relative net assets. All other expenses are allocated among the classes based on relative net assets. |
| H. | Accounting Estimates - The financial statements are prepared on a basis in conformity with GAAP, which requires management to make estimates and assumptions that affect the reported amounts of assets and liabilities at the date of the financial statements and the reported amounts of revenues and expenses during the reporting period including estimates and assumptions related to taxation. Actual results could differ from those estimates by a significant amount. In addition, the Fund monitors for material events or transactions that may occur or become known after theperiod-end date and before the date the financial statements are released to print. |
| I. | Indemnifications - Under the Trust’s organizational documents, each Trustee, officer, employee or other agent of the Trust is indemnified against certain liabilities that may arise out of the performance of their duties to the Fund. Additionally, in the normal course of business, the Fund enters into contracts, including the Fund’s servicing agreements, that contain a variety of indemnification clauses. The Fund’s maximum exposure under these arrangements is unknown as this would involve future claims that may be made against the Fund that have not yet occurred. The risk of material loss as a result of such indemnification claims is considered remote. |
| J. | Foreign Currency Translations - Foreign currency is valued at the close of the NYSE based on quotations posted by banks and major currency dealers. Portfolio securities |
33 INVESCO OPPENHEIMER RISING DIVIDENDS FUND
NOTES TO FINANCIAL STATEMENTSContinued
and other assets and liabilities denominated in foreign currencies are translated into U.S. dollar amounts at the date of valuation. Purchases and sales of portfolio securities (net of foreign taxes withheld on disposition) and income items denominated in foreign currencies are translated into U.S. dollar amounts on the respective dates of such transactions. The Fund does not separately account for the portion of the results of operations resulting from changes in foreign exchange rates on investments and the fluctuations arising from changes in market prices of securities held. The combined results of changes in foreign exchange rates and the fluctuation of market prices on investments (net of estimated foreign tax withholding) are included with the net realized and unrealized gain or loss from investments in the Statement of Operations. Reported net realized foreign currency gains or losses arise from (1) sales of foreign currencies, (2) currency gains or losses realized between the trade and settlement dates on securities transactions, and (3) the difference between the amounts of dividends, interest, and foreign withholding taxes recorded on the Fund’s books and the U.S. dollar equivalent of the amounts actually received or paid. Net unrealized foreign currency gains and losses arise from changes in the fair values of assets and liabilities, other than investments in securities at fiscal period end, resulting from changes in exchange rates. The Fund may invest in foreign securities, which may be subject to foreign taxes on income, gains on investments or currency repatriation, a portion of which may be recoverable. Foreign taxes, if any, are recorded based on the tax regulations and rates that exist in the foreign markets in which the Fund invests and are shown in the Statement of Operations.
| K. | Forward Foreign Currency Contracts - The Fund may engage in foreign currency transactions either on a spot (i.e. for prompt delivery and settlement) basis, or through forward foreign currency contracts, to manage or minimize currency or exchange rate risk. |
The Fund may also enter into forward foreign currency contracts for the purchase or sale of a security denominated in a foreign currency in order to “lock in” the U.S. dollar price of that security, or the Fund may also enter into forward foreign currency contracts that do not provide for physical settlement of the two currencies, but instead are settled by a single cash payment calculated as the difference between the agreed upon exchange rate and the spot rate at settlement based upon an agreed upon notional amount(non-deliverable forwards). The Fund will set aside liquid assets in an amount equal to the dailymark-to-market obligation for forward foreign currency contracts.
A forward foreign currency contract is an obligation between two parties (“Counterparties”) to purchase or sell a specific currency for an agreed-upon price at a future date. The use of forward foreign currency contracts does not eliminate fluctuations in the price of the underlying securities the Fund owns or intends to acquire but establishes a rate of exchange in advance. Fluctuations in the value of these contracts are measured by the difference in the contract date and reporting date exchange rates and are recorded as unrealized appreciation (depreciation) until the contracts are closed. When the contracts are closed, realized gains (losses) are recorded. Realized and unrealized gains (losses) on the contracts are included in the Statement of Operations. The primary risks associated with forward foreign currency contracts include failure of the Counterparty to meet the terms of the contract and the value of the foreign currency changing unfavorably. These risks may be
34 INVESCO OPPENHEIMER RISING DIVIDENDS FUND
in excess of the amounts reflected in the Statement of Assets and Liabilities.
Note 2 - Advisory Fees and Other Fees Paid to Affiliates
The Trust has entered into a master investment advisory agreement with Invesco Advisers, Inc. (the “Adviser” or “Invesco”). Under the terms of the investment advisory agreement, the Fund accrues daily and pays monthly an advisory fee to the Adviser based on the annual rate of the Fund’s average daily net assets as follows:
| | | | |
| Fee Schedule* | | |
| Up to $800 million | | | 0.65 | % |
| Next $700 million | | | 0.60 | |
| Next $1.0 billion | | | 0.58 | |
| Next $2.5 billion | | | 0.56 | |
| Next $5 billion | | | 0.54 | |
| Over $10 billion | | | 0.52 | |
*The advisory fee paid by the Fund shall be reduced by any amounts paid by the Fund under the administrative services agreement with the Adviser.
For the year ended October 31, 2019, the effective advisory fee incurred by the Fund was 0.60% annualized.
From the beginning of the fiscal period until the date of the Reorganization, the Acquired Fund paid $9,497,759 in advisory fees to OFI Global Asset Management, Inc. based on the annual rates above of the Acquired Fund’s average daily net assets.
Under the terms of a mastersub-advisory agreement between the Adviser and each of Invesco Asset Management Deutschland GmbH, Invesco Asset Management Limited, Invesco Asset Management (Japan) Limited, Invesco Hong Kong Limited, Invesco Senior Secured Management, Inc. and Invesco Canada Ltd. and separatesub-advisory agreements with Invesco Capital Management LLC, and Invesco Asset Management (India) Private Limited (collectively, the “AffiliatedSub-Advisers”) the Adviser, not the Fund, will pay 40% of the fees paid to the Adviser to any such AffiliatedSub-Adviser(s) that provide(s) discretionary investment management services to the Fund based on the percentage of assets allocated to such AffiliatedSub-Adviser(s). Invesco has also entered into aSub-Advisory Agreement with OppenheimerFunds, Inc. to provide discretionary management services to the Funds.
Effective on the Reorganization Date, the Adviser has contractually agreed, through at least May 31, 2021, to waive advisory fees and/or reimburse expenses of all shares to the extent necessary to limit the total annual fund operating expenses after fee waiver and/or expense reimbursement (excluding certain items discussed below) of Class A, Class C, Class R, Class Y, Class R5 and Class R6 shares to 1.08%, 1.83%, 1.33%, 0.83%, 0.69% and 0.64%, respectively, of the Fund’s average daily net assets (the “expense limits”). In determining the Adviser’s obligation to waive advisory fees and/or reimburse expenses, the following expenses are not taken into account, and could cause total annual fund operating expenses after fee waivers and/or expense reimbursement to exceed the numbers reflected above: (1) interest; (2) taxes; (3) dividend expenses on short sales; (4) extraordinary ornon-routine items, including litigation expenses; and (5) expenses that the Fund has incurred but did not actually
35 INVESCO OPPENHEIMER RISING DIVIDENDS FUND
NOTES TO FINANCIAL STATEMENTSContinued
pay because of an expense offset arrangement. Unless Invesco continues the fee waiver agreement, it will terminate May 31, 2021. During its term, the fee waiver agreement cannot be terminated or amended to increase the expense limits or reduce the advisory fee waiver without approval of the Board of Trustees.
Further, the Adviser has contractually agreed, through at least June 30, 2021, to waive the advisory fee payable by the Fund in an amount equal to 100% of the net advisory fees the Adviser receives from the affiliated money market funds on investments by the Fund of uninvested cash in such affiliated money market funds.
For the year ended October 31, 2019, the Adviser waived advisory fees of $34,444 and reimbursed fund expenses of $375 for Class R6
The Trust has entered into a master administrative services agreement with Invesco pursuant to which the Fund has agreed to pay Invesco for certain administrative costs incurred in providing accounting services to the Fund. For the year ended October 31, 2019, expenses incurred under the agreement are shown in the Statement of Operations as Administration fees. Additionally, Invesco has entered into service agreements Citibank serves as custodian to the Fund. Prior to the Reorganization, the Acquired Fund paid administrative fees to OFI Global Asset Management, Inc.
The Trust has entered into a transfer agency and service agreement with Invesco Investment Services, Inc. (“IIS”) pursuant to which the Fund has agreed to pay IIS a fee for providing transfer agency and shareholder services to the Fund and reimburse IIS for certain expenses incurred by IIS in the course of providing such services. IIS may make payments to intermediaries that provide omnibus account services,sub-accounting services and/or networking services. All fees payable by IIS to intermediaries that provide omnibus account services orsub-accounting services are charged back to the Fund, subject to certain limitations approved by the Trust’s Board of Trustees. Prior to the Reorganization, the Acquired Fund paid transfer agent fees to OFI Global Asset Management, Inc. and Shareholder Services, Inc. For the year ended October 31, 2019, expenses incurred under these agreements are shown in the Statement of Operations as Transfer and shareholder servicing agent fees.
The Trust has entered into master distribution agreements with Invesco Distributors, Inc. (“IDI”) to serve as the distributor for the Class A, Class C, Class R, Class Y, Class R5 and Class R6 shares of the Fund. The Trust has adopted plans pursuant to Rule12b-1 under the 1940 Act with respect to the Fund’s Class A, Class C and Class R shares (collectively the “Plan”). The Fund, pursuant to the Class A Plan, reimburses IDI in an amount up to an annual rate of 0.25% of the average daily net assets of Class A shares. The Fund pursuant to the Class C and Class R Plan, pays IDI compensation at the annual rate of 1.00% of the average daily net assets of Class C shares and 0.50% of the average daily net assets of Class R shares. The fees are accrued daily and paid monthly. Of the Plan payments, up to 0.25% of the average daily net assets of each class of shares may be paid to furnish continuing personal shareholder services to customers who purchase and own shares of such classes. Any amounts not paid as a service fee under the Plan would constitute an asset-based sales charge. Rules of the Financial Industry Regulatory Authority (“FINRA”) impose a cap on the total sales charges, including asset-based sales charges, that may be paid by any class of shares of the Fund plans. Prior to the Reorganization, the Acquired Fund paid distribution fees to OppenheimerFunds
36 INVESCO OPPENHEIMER RISING DIVIDENDS FUND
Distributor, Inc. For the yearended October 31, 2019, expenses incurred under the plans are shown in the Statement of Operations as Distribution and service plan fees.
Front-end sales commissions and CDSC (collectively, the “sales charges”) are not recorded as expenses of the Fund.Front-end sales commissions are deducted from proceeds from the sales of Fund shares prior to investment in Class A shares of the Fund. CDSC are deducted from redemption proceeds prior to remittance to the shareholder. During the year ended October 31, 2019, IDI advised the Fund that IDI retained $106,840 infront-end sales commissions from the sale of Class A shares and $260 and $10,336 from Class A and Class C shares, respectively, for CDSC imposed on redemptions by shareholders. From the beginning of the fiscal year to the date of the Reorganization, OppenheimerFunds Distributor, Inc. retained $254,011 in front–end sales commissions from the sale of Class A shares and $2,100 and $9,501 from Class A and Class C shares, respectively, for CDSC imposed on redemption by shareholders.
Certain officers and trustees of the Trust are officers and directors of the Adviser, IIS and/or IDI.
Note 3 - Additional Valuation Information
GAAP defines fair value as the price that would be received to sell an asset or paid to transfer a liability in an orderly transaction between market participants at the measurement date, under current market conditions. GAAP establishes a hierarchy that prioritizes the inputs to valuation methods, giving the highest priority to readily available unadjusted quoted prices in an active market for identical assets (Level 1) and the lowest priority to significant unobservable inputs (Level 3), generally when market prices are not readily available or are unreliable. Based on the valuation inputs, the securities or other investments are tiered into one of three levels. Changes in valuation methods may result in transfers in or out of an investment’s assigned level:
Level 1 — Prices are determined using quoted prices in an active market for identical assets.
Level 2 — Prices are determined using other significant observable inputs. Observable inputs are inputs that other market participants may use in pricing a security. These may include quoted prices for similar securities, interest rates, prepayment speeds, credit risk, yield curves, loss severities, default rates, discount rates, volatilities and others.
Level 3 — Prices are determined using significant unobservable inputs. In situations where quoted prices or observable inputs are unavailable (for example, when there is little or no market activity for an investment at the end of the period), unobservable inputs may be used. Unobservable inputs reflect the Fund’s own assumptions about the factors market participants would use in determining fair value of the securities or instruments and would be based on the best available information.
The following is a summary of the tiered valuation input levels, as of October 31, 2019. The level assigned to the securities valuations may not be an indication of the risk or liquidity associated with investing in those securities. Because of the inherent uncertainties of
37 INVESCO OPPENHEIMER RISING DIVIDENDS FUND
NOTES TO FINANCIAL STATEMENTSContinued
valuation, the values reflected in the financial statements may materially differ from the value received upon actual sale of those investments.
| | | | | | | | | | | | | | | | |
| | | Level 1—
Unadjusted
Quoted Prices | | | Level 2—
Other Significant
Observable Inputs | | | Level 3—
Significant Unobservable Inputs | | | Value | |
| Assets Table | | | | | | | | | | | | | | | | |
| Investments, at Value: | | | | | | | | | | | | | | | | |
| Common Stocks | | | | | | | | | | | | | | | | |
Consumer Discretionary | | | $ 302,617,300 | | | | $ 32,878,815 | | | | $ — | | | | $ 335,496,115 | |
Consumer Staples | | | 95,788,124 | | | | 51,719,293 | | | | — | | | | 147,507,417 | |
Energy | | | 164,341,917 | | | | — | | | | — | | | | 164,341,917 | |
Financials | | | 642,151,266 | | | | — | | | | — | | | | 642,151,266 | |
Health Care | | | 323,817,641 | | | | 28,800,363 | | | | — | | | | 352,618,004 | |
Industrials | | | 250,439,389 | | | | 28,185,825 | | | | — | | | | 278,625,214 | |
Information Technology | | | 701,655,766 | | | | — | | | | — | | | | 701,655,766 | |
Materials | | | 36,641,054 | | | | — | | | | — | | | | 36,641,054 | |
Utilities | | | 131,925,601 | | | | — | | | | — | | | | 131,925,601 | |
| Investment Company | | | 30,479,100 | | | | — | | | | — | | | | 30,479,100 | |
| | | | |
| Total Assets | | | $ 2,679,857,158 | | | | $ 141,584,296 | | | | $ — | | | | $ 2,821,441,454 | |
| | | | |
Forward currency exchange contracts and futures contracts, if any, are reported at their unrealized appreciation/depreciation at measurement date, which represents the change in the contract’s value from trade date. All additional assets and liabilities included in the above table are reported at their market value at measurement date.
Note 4 - Security Transactions with Affiliated Funds
The Fund is permitted to purchase or sell securities from or to certain other Invesco Funds under specified conditions outlined in procedures adopted by the Board of Trustees of the Trust. The procedures have been designed to ensure that any purchase or sale of securities by the Fund from or to another fund or portfolio that is or could be considered an affiliate by virtue of having a common investment adviser (or affiliated investment advisers), common Trustees and/or common officers complies with Rule17a-7 of the 1940 Act. Further, as defined under the procedures, each transaction is effected at the current market price. Pursuant to these procedures for the period November 1, 2018 to May 24, 2019, the Predecessor Fund engaged in transactions with affiliates as listed: Securities purchases of $2,777,846 and securities sales of $1,977,325, which resulted in net realized gains of $607,116. For the period May 25, 2019 to October 31, 2019, the Fund did not engage in transactions with affiliates.
Note 5 - Trustee and Officer Fees and Benefits
The Fund has adopted an unfunded retirement plan (the “Plan”) for the Fund’s Independent Trustees. Benefits are based on years of service and fees paid to each Trustee during their period of service. The Plan was frozen with respect to adding new participants effective
38 INVESCO OPPENHEIMER RISING DIVIDENDS FUND
December 31, 2006 (the “Freeze Date”) and existing Plan Participants as of the Freeze Date will continue to receive accrued benefits under the Plan. Active Independent Trustees as of the Freeze Date have each elected a distribution method with respect to their benefits under the Plan.
During the reporting period, the Fund’s projected benefit obligations, payments to retired Trustees and accumulated liability were as follows:
| | | | |
| Projected Benefit Obligations Increased | | $ | 7,543 | |
| Payments Made to Retired Trustees | | | 15,126 | |
| Accumulated Liability as of October 31, 2019 | | | 123,566 | |
Certain trustees have executed a Deferred Compensation Agreement pursuant to which they have the option to elect to defer receipt of all or a portion of the annual compensation they are entitled to receive from the Fund. For purposes of determining the amount owed to the Trustee under the plan, deferred amounts are treated as though equal dollar amounts had been invested in shares of the Fund or in other Invesco and/or Invesco Oppenheimer funds selected by the Trustee. The Fund purchases shares of the funds selected for deferral by the Trustee in amounts equal to his or her deemed investment, resulting in a Fund asset equal to the deferred compensation liability. Such assets are included as a component of “Other” within the asset section of the Statement of Assets and Liabilities. Deferral of Trustees’ fees under the plan will not affect the net assets of the Fund and will not materially affect the Fund’s assets, liabilities or net investment income per share. Amounts will be deferred until distributed in accordance with the compensation deferral plan.
Note 6 - Cash Balances
The Fund is permitted to temporarily carry a negative or overdrawn balance in its account with Citibank, N.A., the custodian bank. Such balances, if any atperiod-end, are shown in the Statement of Assets and Liabilities under the payable caption Amount due to custodian. To compensate the custodian bank for such overdrafts, the overdrawn Fund may either (1) leave funds as a compensating balance in the account so the custodian bank can be compensated by earning the additional interest; or (2) compensate by paying the custodian bank at a rate agreed upon by the custodian bank and Invesco, not to exceed the contractually agreed upon rate.
Note 7 - Investment Transactions
The aggregate amount of investment securities (other than short-term securities, U.S. Treasury obligations and money market funds, if any) purchased and sold by the Fund during the year ended October 31, 2019 was $805,382,627 and $1,193,866,732, respectively.
39 INVESCO OPPENHEIMER RISING DIVIDENDS FUND
NOTES TO FINANCIAL STATEMENTSContinued
Note 8 - Share Information
Transactions in shares of beneficial interest were as follows:
| | | | | | | | | | | | | | | | |
| | | Year Ended October 31, 20191 | | | Year Ended October 31, 2018 | |
| | | Shares | | | Amount | | | Shares | | | Amount | |
| Class A | | | | | | | | | | | | | | | | |
| Sold | | | 7,014,508 | | | $ | 132,091,757 | | | | 7,507,226 | | | $ | 148,946,863 | |
| Automatic Conversion Class C to Class A Shares | | | 5,644,612 | | | | 110,073,631 | | | | — | | | | — | |
| Dividends and/or distributions reinvested | | | 7,999,039 | | | | 143,666,720 | | | | 9,442,091 | | | | 181,037,367 | |
| Redeemed | | | (20,583,859 | ) | | | (387,079,566 | ) | | | (19,535,186 | ) | | | (388,954,322) | |
| | | | |
| Net increase (decrease) | | | 74,300 | | | $ | (1,247,458 | ) | | | (2,585,869 | ) | | $ | (58,970,092) | |
| | | | |
| | |
| Class B | | | | | | | | | | | | | | | | |
| Sold | | | — | | | $ | — | | | | 4,967 | | | $ | 82,883 | |
| Dividends and/or distributions reinvested | | | — | | | | — | | | | 85,633 | | | | 1,400,955 | |
| Redeemed2 | | | — | | | | — | | | | (1,285,022 | ) | | | (21,711,063) | |
| | | | |
| Net increase (decrease) | | | — | | | $ | — | | | | (1,194,422 | ) | | $ | (20,227,225) | |
| | | | |
| | |
| Class C | | | | | | | | | | | | | | | | |
| Sold | | | 2,293,225 | | | $ | 35,601,789 | | | | 2,342,739 | | | $ | 39,246,967 | |
| Dividends and/or distributions reinvested | | | 2,406,930 | | | | 35,846,047 | | | | 2,891,269 | | | | 46,838,910 | |
| Automatic conversion Class C to Class A Shares | | | (6,794,033 | ) | | | (110,073,631 | ) | | | — | | | | — | |
| Redeemed | | | (7,601,350 | ) | | | (118,782,430 | ) | | | (7,060,617 | ) | | | (118,819,667) | |
| | | | |
| Net increase (decrease) | | | (9,695,228 | ) | | $ | (157,408,225 | ) | | | (1,826,609 | ) | | $ | (32,733,790) | |
| | | | |
| | |
| Class R | | | | | | | | | | | | | | | | |
| Sold | | | 776,127 | | | $ | 14,464,779 | | | | 861,315 | | | $ | 16,976,552 | |
| Dividends and/or distributions reinvested | | | 411,631 | | | | 7,326,229 | | | | 481,199 | | | | 9,161,260 | |
| Redeemed | | | (1,390,570 | ) | | | (26,360,382 | ) | | | (1,404,051 | ) | | | (27,624,712) | |
| | | | |
| Net increase (decrease) | | | (202,812 | ) | | $ | (4,569,374 | ) | | | (61,537 | ) | | $ | (1,486,900) | |
| | | | |
| | |
| Class Y | | | | | | | | | | | | | | | | |
| Sold | | | 2,407,809 | | | $ | 46,801,289 | | | | 3,121,653 | | | $ | 64,383,684 | |
| Dividends and/or distributions reinvested | | | 974,384 | | | | 18,209,546 | | | | 1,472,851 | | | | 29,251,590 | |
| Redeemed | | | (5,633,179 | ) | | | (108,989,771 | ) | | | (9,407,638 | ) | | | (194,850,636) | |
| | | | |
| Net increase (decrease) | | | (2,250,986 | ) | | $ | (43,978,936 | ) | | | (4,813,134 | ) | | $ | (101,215,362) | |
| | | | |
| | |
| Class R53 | | | | | | | | | | | | | | | | |
| Sold | | | 536 | | | $ | 10,000 | | | | — | | | $ | — | |
| Dividends and/or distributions reinvested | | | — | | | | — | | | | — | | | | — | |
| Redeemed | | | — | | | | — | | | | — | | | | — | |
| | | | |
| Net increase (decrease) | | | 536 | | | $ | 10,000 | | | | — | | | $ | — | |
| | | | |
40 INVESCO OPPENHEIMER RISING DIVIDENDS FUND
| | | | | | | | | | | | | | | | |
| | | Year Ended October 31, 20191 | | | Year Ended October 31, 2018 | |
| | | Shares | | | Amount | | | Shares | | | Amount | |
| Class R6 | | | | | | | | | | | | | | | | |
| Sold | | | 538,105 | | | $ | 10,525,025 | | | | 553,595 | | | $ | 11,454,861 | |
| Dividends and/or distributions reinvested | | | 92,845 | | | | 1,735,240 | | | | 100,369 | | | | 1,992,020 | |
| Redeemed | | | (415,201 | ) | | | (8,107,292 | ) | | | (471,908 | ) | | | (9,736,875) | |
| | | | |
| Net increase (decrease) | | | 215,749 | | | $ | 4,152,973 | | | | 182,056 | | | $ | 3,710,006 | |
| | | | |
1. There are entities that are record owners of more than 5% of the outstanding shares of the Fund and own 20% of the outstanding shares of the Fund. IDI has an agreement with these entities to sell Fund shares. The Fund, Invesco and/or Invesco affiliates may make payments to these entities, which are considered to be related to the Fund, for providing services to the Fund, Invesco and/or Invesco affiliates, including but not limited to services such as securities brokerage, distribution, third party record keeping and account servicing. The Fund has no knowledge as to whether all or any portion of the shares owned of record by these entities are also owned beneficially.
2. All outstanding Class B shares converted to Class A shares on June 1, 2018.
3. Commencement date after the close of business on May 24, 2019.
Note 9 – Borrowings
Joint Credit Facility.A number of mutual funds managed by the Adviser participate in a $1.95 billion revolving credit facility (the “Facility”) intended to provide short-term financing, if necessary, subject to certain restrictions in connection with atypical redemption activity. Expenses and fees related to the Facility are paid by the participating funds and are disclosed separately or as other expenses on the Statement of Operations. The Fund did not utilize the Facility during the reporting period. The Facility terminated May 24, 2019.
41 INVESCO OPPENHEIMER RISING DIVIDENDS FUND
REPORT OF INDEPENDENT REGISTERED PUBLIC ACCOUNTING FIRM
To the Board of Trustees of AIM Equity Funds (Invesco Equity Funds) and Shareholders of Invesco Oppenheimer Rising Dividends Fund
Opinion on the Financial Statements
We have audited the accompanying statement of assets and liabilities, including the schedule of investments, of Invesco Oppenheimer Rising Dividends Fund (one of the funds constituting AIM Equity Funds (Invesco Equity Funds), referred to hereafter as the “Fund”) as of October 31, 2019, the related statements of operations and of changes in net assets for the year ended October 31, 2019, including the related notes, and the financial highlights for each of the periods ended October 31, 2019 (collectively referred to as the “financial statements”). In our opinion, the financial statements present fairly, in all material respects, the financial position of the Fund as of October 31, 2019, the results of its operations and changes in its net assets for the year ended October 31, 2019 and the financial highlights for each of the periods ended October 31, 2019 in conformity with accounting principles generally accepted in the United States of America.
The financial statements of Invesco Oppenheimer Rising Dividends Fund (formerly known as Oppenheimer Rising Dividends Fund) as of and for the year ended October 31, 2018 and the financial highlights for each of the periods ended on or prior to October 31, 2018 (not presented herein, other than the statement of changes in net assets and the financial highlights) were audited by other auditors whose report dated December 21, 2018 expressed an unqualified opinion on those financial statements and financial highlights.
Basis for Opinion
These financial statements are the responsibility of the Fund’s management. Our responsibility is to express an opinion on the Fund’s financial statements based on our audit. We are a public accounting firm registered with the Public Company Accounting Oversight Board (United States) (PCAOB) and are required to be independent with respect to the Fund in accordance with the U.S. federal securities laws and the applicable rules and regulations of the Securities and Exchange Commission and the PCAOB.
We conducted our audit of these financial statements in accordance with the standards of the PCAOB. Those standards require that we plan and perform the audit to obtain reasonable assurance about whether the financial statements are free of material misstatement, whether due to error or fraud.
Our audit included performing procedures to assess the risks of material misstatement of the financial statements, whether due to error or fraud, and performing procedures that respond to those risks. Such procedures included examining, on a test basis, evidence regarding the amounts and disclosures in the financial statements. Our audit also included evaluating the accounting principles used and significant estimates made by management, as well as evaluating the overall presentation of the financial statements. Our procedures included confirmation of securities owned as of October 31, 2019 by correspondence with the custodian, transfer agent and brokers; when replies were not received from brokers, we performed other auditing procedures. We believe that our audit provides a reasonable basis for our opinion.
/s/PricewaterhouseCoopers LLP
Houston, Texas
December 23, 2019
42 INVESCO OPPENHEIMER RISING DIVIDENDS FUND
We have served as the auditor of one or more of the investment companies in the Invesco group of investment companies since at least 1995. We have not been able to determine the specific year we began serving as auditor.
43 INVESCO OPPENHEIMER RISING DIVIDENDS FUND
INDEPENDENT REGISTERED PUBLIC ACCOUNTING FIRM
The Audit Committee of the Board of Trustees appointed, and the Board of Trustees ratified and approved, PricewaterhouseCoopers LLP (“PwC”) as the independent registered public accounting firm of the Fund for the fiscal periods ending after May 24, 2019. Prior to the close of business on May 24, 2019, the Predecessor Fund was a separate series of an unaffiliated investment company and its financial statements were audited by a different independent registered public accounting firm (the “Prior Auditor”).
Effective after the close of business on May 24, 2019, the Prior Auditor resigned as the independent registered public accounting firm of the Fund. The Prior Auditor’s report on the financial statements of the Predecessor Fund for the past two fiscal years did not contain an adverse or disclaimer of opinion, and was not qualified or modified as to uncertainty, audit scope or accounting principles. During the Predecessor Fund’s two most recent fiscal years and through the close of business on May 24, 2019, there were no (1) disagreements with the Prior Auditor on any matter of accounting principles or practices, financial statement disclosure, or auditing scope or procedure, which disagreements, if not resolved to the Prior Auditor’s satisfaction, would have caused it to make reference to that matter in connection with its report; or (2) “reportable events,” as that term is defined in Item 304(a)(1)(v) of RegulationS-K under the Securities Exchange Act of 1934.
44 INVESCO OPPENHEIMER RISING DIVIDENDS FUND
FEDERAL INCOME TAX INFORMATION
In early 2019, if applicable, shareholders of record received information regarding all dividends and distributions paid to them by the Fund during calendar year 2018.
Capital gain distributions of $1.28753 per share were paid to Class A, Class C, Class R, Class Y and Class R6 shareholders, respectively, on December 6, 2018. Whether received in stock or in cash, the capital gain distribution should be treated by shareholders as a gain from the sale of the capital assets held for more than one year (long-term capital gains).
Dividends, if any, paid by the Fund during the reporting period which are not designated as capital gain distributions should be multiplied by the maximum amount allowable but not less than 100% to arrive at the amount eligible for the corporate dividend-received deduction.
A portion, if any, of the dividends paid by the Fund during the reporting period which are not designated as capital gain distributions are eligible for lower individual income tax rates to the extent that the Fund has received qualified dividend income as stipulated by recent tax legislation. The maximum amount allowable but not less than $54,619,643 of the Fund’s fiscal year taxable income may be eligible for the lower individual income tax rates. In early 2019, shareholders of record received information regarding the percentage of distributions that are eligible for lower individual income tax rates.
Recent tax legislation allows a regulated investment company to designate distributions not designated as capital gain distributions, as either interest related dividends or short-term capital gain dividends, both of which are exempt from the U.S. withholding tax applicable to non U.S. taxpayers. For the reporting period, the maximum amount allowable but not less than $381,393 of the ordinary distributions to be paid by the Fund qualifies as an interest related dividend.
The foregoing information is presented to assist shareholders in reporting distributions received from the Fund to the Internal Revenue Service. Because of the complexity of the federal regulations which may affect your individual tax return and the many variations in state and local tax regulations, we recommend that you consult your tax advisor for specific guidance.
45 INVESCO OPPENHEIMER RISING DIVIDENDS FUND
APPROVAL OF INVESTMENT ADVISORY ANDSUB-ADVISORY CONTRACTS
At meetings held on December 14, 2018, the Board of Trustees (the Board or the Trustees) of AIM Equity Funds (Invesco Equity Funds) (the Trust) as a whole, and the independent Trustees, who comprise over 75% of the Board, voting separately, approved (i) an amendment to the Trust’s Master Investment Advisory Agreement with Invesco Advisers, Inc. (Invesco Advisers and the investment advisory agreement) to add Invesco Oppenheimer Rising Dividends Fund (the Fund), (ii) an amendment to the Master IntergroupSub-Advisory Contract for Mutual Funds with Invesco Asset Management Deutschland GmbH, Invesco Asset Management Limited, Invesco Asset Management (Japan) Limited, Invesco Hong Kong Limited, Invesco Senior Secured Management, Inc. and Invesco Canada Ltd. to add the Fund, (iii) an amendment to the separatesub-advisory contract with Invesco Capital Management LLC to add the Fund, (iv) an amendment to the separatesub-advisory contract with Invesco Asset Management (India) Private Limited to add the Fund, and (v) an initialsub-advisory contract with OppenheimerFunds, Inc. (collectively, the AffiliatedSub-Advisers and thesub-advisory contracts). Additionally, on March 26, 2019, the Boardre-approved an initialsub-advisory contract with OppenheimerFunds, Inc. following its change of control as a result of the acquisition of OppenheimerFunds, Inc. and its subsidiaries, including the Oppenheimer mutual funds (each, an Oppenheimer Fund), by Invesco Ltd. (the OFI Transaction). After evaluating the factors discussed below, among others, the Board approved the Fund’s investment advisory agreement and thesub-advisory contracts and determined that the compensation payable by the Fund to Invesco Advisers and by Invesco Advisers to the AffiliatedSub-Advisers is fair and reasonable.
The Board’s Evaluation Process
The Board noted that it had previously approved establishing the Fund at the Board meeting held on October 23, 2018 and that the Fund was formed to acquire the assets and liabilities of an Oppenheimer Fund (the Acquired Fund) with the same investment objective and substantially similar principal investment strategies and risks. At the time of approval, the Fund had no assets and no performance history and the portfolio managers were not employed by Invesco Advisers or any of the AffiliatedSub-Advisers except OppenheimerFunds, Inc., which was not affiliated with Invesco at that time.
In approving the investment advisory agreement andsub-advisory contracts, the Board followed a process similar to the process that it follows in annually reviewing and approving investment advisory agreements andsub-advisory contracts for the series portfolios of funds advised by Invesco Advisers and considered the information provided in the most recent annual review process for those funds as well as the information provided with respect to the Fund. As part of the approval process, the Board reviewed and considered information provided in response to detailed requests for information submitted to management by the independent Trustees with assistance from legal counsel to the independent Trustees. The Board reviewed comparative investment performance and fee data prepared by Invesco Advisers and an independent mutual fund data provider. The Board was assisted in its
46 INVESCO OPPENHEIMER RISING DIVIDENDS FUND
review by the Senior Officer, an officer of the Invesco Funds who reports directly to the independent Trustees, and by independent legal counsel.
The discussion below serves as a summary of the material factors and related conclusions that formed the basis for the Board’s approval of the Fund’s investment advisory agreement andsub-advisory contracts. The Trustees’ review and conclusions are based on the comprehensive consideration of all information presented to them and are not the result of any single determinative factor. Moreover, one Trustee may have weighed a particular piece of information or factor differently than another Trustee. This information is current as of December 14, 2018 and March 26, 2019 for thesub-advisory contract with OppenheimerFunds, Inc.
Factors and Conclusions and Summary of Independent Written Fee Evaluation
A. Nature, Extent and Quality of Services Provided by Invesco Advisers and the AffiliatedSub-Advisers
The Board reviewed the nature, extent and quality of the advisory services to be provided to the Fund by Invesco Advisers under the Fund’s investment advisory agreement, and the credentials and experience of the officers and employees of Invesco Advisers who will provide these services. The Board’s review included consideration of the investment process oversight and structure, credit analysis and investment risk management to be employed in providing advisory services to the Fund. The Board also considerednon-advisory services that Invesco Advisers and its affiliates provide to the Invesco Funds and will provide to the Fund, such as various back office support functions, third party oversight, internal audit, valuation, portfolio trading and legal and compliance. The Board also received and reviewed information about Invesco Advisers’ role as administrator of the Invesco Funds’ liquidity risk management program. The Board also reviewed and considered the benefits to shareholders of investing in a fund that is part of the Invesco family of funds under the umbrella of Invesco Ltd., Invesco Advisers’ parent company, and noted Invesco Ltd.’s depth and experience in conducting an investment management business, as well as its commitment of financial and other resources to such business. The Board reviewed and considered information about the resources that Invesco Advisers intends to continue to commit to managing the Invesco family of funds, including the Fund, following the OFI Transaction. The Board concluded that the nature, extent and quality of the services to be provided to the Fund by Invesco Advisers are appropriate and satisfactory.
The Board reviewed the services that may be provided by the AffiliatedSub-Advisers under thesub-advisory contracts and the credentials and experience of the officers and employees of the AffiliatedSub-Advisers who provide these services. The Board noted the AffiliatedSub-Advisers’ expertise with respect to certain asset classes and that the AffiliatedSub-Advisers have offices and personnel that are located in financial centers around the world. As a result, the Board noted that the AffiliatedSub-Advisers can provide research and
47 INVESCO OPPENHEIMER RISING DIVIDENDS FUND
APPROVAL OF INVESTMENT ADVISORY ANDSUB-ADVISORY CONTRACTSContinued
investment analysis on the markets and economies of various countries in which the Fund may invest, make recommendations regarding securities and assist with security trades. The Board concluded that thesub-advisory contracts may benefit the Fund and its shareholders by permitting Invesco Advisers to use the resources and talents of the AffiliatedSub-Advisers in managing the Fund. The Board concluded that the nature, extent and quality of the services that may be provided by the AffiliatedSub-Advisers are appropriate and satisfactory.
B. Fund Investment Performance
The Board noted that the Fund would continue the historical performance information of the Acquired Fund following the consummation of the OFI Transaction. The Board considered the performance of the Acquired Fund and the fact that, at the closing of the OFI Transaction, management anticipates that the Fund will be managed pursuant to substantially similar investment strategies and by substantially the same portfolio management team as managed the Acquired Fund. The Board did not view Fund performance as a relevant factor in considering whether to approve thesub-advisory contracts for the Fund, as no AffiliatedSub-Adviser currently manages assets of the Fund.
The Board compared the Fund’s investment performance over multiple time periods ending December 31, 2017 to the performance of funds in the Morningstar performance universe and against the Fund’s benchmark index. The Trustees also reviewed more recent Fund performance and this review did not change their conclusions.
C. Advisory andSub-Advisory Fees and Fund Expenses
The Board compared the Fund’s contractual management fee rate to the contractual management fee rates of funds in the Fund’s Morningstar expense group. The Board also considered comparative information regarding the Fund’s total expense ratio and its various components.
The Board noted that Invesco Advisers has contractually agreed to waive fees and/or limit expenses of the Fund for at least two years from the closing date of the OFI Transaction in an amount necessary to limit total annual operating expenses to a specified percentage of average daily net assets for each class of the Fund.
The Board also considered the fees charged by Invesco Advisers and the AffiliatedSub-Advisers to other similarly managed client accounts. The Board noted that Invesco Advisers or the AffiliatedSub-Advisers may charge lower fees to large institutional clients. Invesco Advisers reviewed with the Board differences in the scope of services it provides to the Invesco Funds relative to certain other types of client accounts, including management of cash flows as a result of redemptions and purchases, necessary infrastructure such as officers, office space, technology, legal and distribution, oversight of service providers, costs and business risks associated with launching new funds and sponsoring and maintaining the
48 INVESCO OPPENHEIMER RISING DIVIDENDS FUND
product line, preparation of annual registration statement updates and financial information and compliance with federal and state laws and regulations.
The Board also considered the services that may be provided by the AffiliatedSub-Advisers pursuant to thesub-advisory contracts, as well as the fees payable by Invesco Advisers to the AffiliatedSub-Advisers pursuant to thesub-advisory contracts.
D. Economies of Scale and Breakpoints
The Board considered the extent to which there may be economies of scale in the provision of advisory services to the Fund. The Board considered Invesco’s reinvestment in its business, including investments in business infrastructure and cybersecurity. The Board also considered that the Fund may benefit from economies of scale through contractual breakpoints in the Fund’s advisory fee schedule, which generally operate to reduce the Fund’s expense ratio as it grows in size. The Board noted that the Fund will share directly in economies of scale through lower fees charged by third party service providers based on the combined size of the Invesco Funds. The Board noted that the Fund may also benefit from economies of scale through initial fee setting, fee waivers and expense reimbursements.
E. Profitability and Financial Resources
The Board reviewed information from the 2018 contract renewal process provided by Invesco Advisers concerning the costs of the advisory and other services that Invesco Advisers and its affiliates provide to the Invesco Funds and the profitability of Invesco Advisers and its affiliates in providing these services. The Board considered the methodology used for calculating profitability and noted the periodic review of such methodology by an independent consultant. The Board noted that Invesco Advisers will continue to operate at a net profit from services Invesco Advisers and its affiliates provide to the Invesco Funds. The Board did not deem the level of profits realized by Invesco Advisers and its affiliates from providing services to the Invesco Funds, and the profits estimated to be realized by the Fund, to be excessive given the nature, extent and quality of the services provided. The Board received information from Invesco Advisers demonstrating that Invesco Advisers and the AffiliatedSub-Advisers are financially sound and have the resources necessary to perform their obligations under the investment advisory agreement andsub-advisory contracts.
F. Collateral Benefits to Invesco Advisers and its Affiliates
The Board considered various other benefits to be received by Invesco Advisers and its affiliates from the relationship with the Fund, including the fees to be received for providing administrative, transfer agency and distribution services to the Fund. The Board considered the performance of Invesco Advisers and its affiliates in providing these services to other Invesco Funds and the organizational structure employed to provide these services. The Board also considered that these services will be provided to the Fund pursuant to written
49 INVESCO OPPENHEIMER RISING DIVIDENDS FUND
APPROVAL OF INVESTMENT ADVISORY ANDSUB-ADVISORY CONTRACTSContinued
contracts that are reviewed and approved on an annual basis by the Board; and that the services are required for the operation of the Fund.
The Board considered the benefits realized by Invesco Advisers and the AffiliatedSub-Advisers as a result of portfolio brokerage transactions executed through “soft dollar” arrangements. The Board noted that soft dollar arrangements may result in the Fund bearing costs to purchase research that may be used by Invesco Advisers or the AffiliatedSub-Advisers with other clients and may reduce Invesco Advisers’ or the AffiliatedSub-Advisers’ expenses. The Board also considered that it will receive periodic reports from Invesco representing that these arrangements are consistent with regulatory requirements. The Board did not deem the soft dollar arrangements to be inappropriate.
The Board considered that the Fund’s uninvested cash and cash collateral from any securities lending arrangements may be invested in money market funds advised by Invesco Advisers pursuant to procedures approved by the Board. The Board considered that Invesco Advisers will receive advisory fees from these affiliated money market funds attributable to such investments, although Invesco Advisers has contractually agreed to waive through varying periods the advisory fees payable by the Invesco Funds with respect to certain investments in the affiliated money market funds. The waiver is in an amount equal to 100% of the net advisory fee Invesco Advisers will receive from the affiliated money market funds with respect to the Fund’s investment in the affiliated money market funds of uninvested cash, but not cash collateral. The Board concluded that the amount of advisory fees to be received by Invesco Advisers from the Fund’s investment of cash collateral from any securities lending arrangements in the affiliated money market funds is fair and reasonable.
The Board also considered that an affiliated broker may receive commissions for executing certain trades for the Fund. Invesco Advisers and the AffiliatedSub-Advisers may use the affiliated broker to, among other things, control order routing and minimize information leakage, and the Board was advised that such trades will be executed in compliance with rules under the federal securities laws and consistent with best execution obligations.
50 INVESCO OPPENHEIMER RISING DIVIDENDS FUND
PORTFOLIO PROXY VOTING POLICIES AND GUIDELINES;
UPDATES TO SCHEDULE OF INVESTMENTS
Go paperless with eDelivery
Visit invesco.com/edelivery to enjoy the convenience and security of anytime electronic access to your investment documents.
With eDelivery, you can elect to have any or all of the following materials delivered straight to your inbox to download, save and print from your own computer:
· Fund reports and prospectuses
· Quarterly statements
· Daily confirmations
· Tax forms
Invesco mailing information
Send general correspondence to Invesco Investment Services, Inc., P.O. Box 219078, Kansas City, MO 64121-9078.
Important notice regarding delivery of security holder documents
To reduce Fund expenses, only one copy of most shareholder documents may be mailed to shareholders with multiple accounts at the same address (Householding). Mailing of your shareholder documents may be householded indefinitely unless you instruct us otherwise. If you do not want the mailing of these documents to be combined with those for other members of your household, please contact Invesco Investment Services, Inc. at 800 959 4246 or contact your financial institution. We will begin sending you individual copies for each account within 30 days after receiving your request.
Fund holdings and proxy voting information
The Fund provides a complete list of its holdings four times in each fiscal year, at the quarter ends. For the second and fourth quarters, the lists appear in the Fund’s semiannual and annual reports to shareholders. For the first and third quarters, the Fund files the lists with the Securities and Exchange Commission (SEC) as an exhibit to its reports on FormN-PORT. The most recent list of portfolio holdings is available at invesco.com/completeqtrholdings. Shareholders can also look up the Fund’s FormsN-PORT on the SEC website at sec.gov.
A description of the policies and procedures that the Fund uses to determine how to vote proxies relating to portfolio securities is available without charge, upon request, from our Client Services department at 800 959 4246 or at invesco.com/proxyguidelines. The information is also available on the SEC website, sec.gov.
Information regarding how the Fund voted proxies related to its portfolio securities during the most recent12-month period ended June 30 is available at invesco.com/proxysearch. The information is also available on the SEC website, sec.gov.
Invesco Advisers, Inc. is an investment adviser; it provides investment advisory services to individual and institutional clients and does not sell securities. Invesco Distributors, Inc. is the US distributor for Invesco Ltd.’s retail mutual funds, exchange-traded funds and institutional money market funds. Both are wholly owned, indirect subsidiaries of Invesco Ltd.
51 INVESCO OPPENHEIMER RISING DIVIDENDS FUND
SHAREHOLDER PROXY
A Special Meeting (“Meeting”) of Shareholders of Invesco Oppenheimer Rising Dividends Fund was held on April 12, 2019. The Meeting was held for the following purpose:
(1) Approval of an Agreement and Plan of Reorganization that provides for the reorganization of Oppenheimer Rising Dividends Fund into Invesco Oppenheimer Rising Dividends Fund.
The results of the voting on the above matter was as follows:
| | | | | | | | | | | | | | | | |
| Matter | | Votes For | | | Votes
Against | | | Votes
Abstain | | | Broker
Non-Votes | |
| (1) Approval of an Agreement and Plan of Reorganization | | | 70,677,694 | | | | 4,530,893 | | | | 7,057,489 | | | | 0 | |
52 INVESCO OPPENHEIMER RISING DIVIDENDS FUND
TRUSTEES AND OFFICERS
The address of each trustee and officer is AIM Equity Funds (Invesco Equity Funds) (the “Trust”), 11 Greenway Plaza, Suite 1000, Houston, Texas 77046-1173. The trustees serve for the life of the Trust, subject to their earlier death, incapacitation, resignation, retirement or removal as more specifically provided in the Trust’s organizational documents. Each officer serves for a one year term or until their successors are elected and qualified. Column two below includes length of time served with predecessor entities, if any.
| | | | | | | | | | |
Name, Year of Birth and
Position(s) Held with the Trust | | Trustee and/or Officer Since | | Principal Occupation(s) During Past 5 Years | | | | Number of Funds
in Fund Complex
Overseen by Trustee | | Other Directorship(s)
Held by Trustee During
Past 5 Years |
INTERESTED PERSONS | | | | | | | | | | |
Martin L. Flanagan1 — 1960
Trustee and Vice Chair | | 2007 | | Executive Director, Chief Executive Officer and President, Invesco Ltd. (ultimate parent of Invesco and a global investment management firm); Trustee and Vice Chair, The Invesco Funds; Vice Chair, Investment Company Institute; and Member of Executive Board, SMU Cox School of Business Formerly: Advisor to the Board, Invesco Advisers, Inc. (formerly known as Invesco Institutional (N.A.), Inc.); Chairman and Chief Executive Officer, Invesco Advisers, Inc. (registered investment adviser); Director, Chairman, Chief Executive Officer and President, Invesco Holding Company (US), Inc. (formerly IVZ Inc.) (holding company), Invesco Group Services, Inc. (service provider) and Invesco North American Holdings, Inc. (holding company); Director, Chief Executive Officer and President, Invesco Holding Company Limited (parent of Invesco and a global investment management firm); Director, Invesco Ltd.; Chairman, Investment Company Institute and President,Co-Chief Executive Officer,Co-President, Chief Operating Officer and Chief Financial Officer, Franklin Resources, Inc. (global investment management organization) | | | | 229 | | None |
Philip A. Taylor2— 1954 Trustee | | 2006 | | Vice Chair, Invesco Ltd.; Trustee, The Invesco Funds Formerly: Director, Invesco Canada Ltd. (formerly known as Invesco Trimark Ltd./ Invesco Trimark Ltèe) (registered investment adviser and registered transfer agent); Head of the Americas and Senior Managing Director, Invesco Ltd.; Director, Invesco Advisers, Inc. (formerly known as Invesco Institutional (N.A.), Inc.) (registered investment adviser); | | | | 229 | | None |
1 Mr. Flanagan is considered an interested person (within the meaning of Section 2(a)(19) of the 1940 Act) of the Trust because he is an officer of the Adviser to the Trust, and an officer and a director of Invesco Ltd., ultimate parent of the Adviser. |
| |
2 Mr. Taylor is considered an interested person (within the meaning of Section 2(a)(19) of the 1940 Act) of the Trust because he is an officer of Invesco Ltd., ultimate parent of the Adviser. |
53 INVESCO OPPENHEIMER RISING DIVIDENDS FUND
TRUSTEES AND OFFICERSContinued
| | | | | | | | | | |
Name, Year of Birth and
Position(s) Held with the Trust | | Trustee and/or Officer Since | | Principal Occupation(s) During Past 5 Years | | | | Number of Funds
in Fund Complex
Overseen by Trustee | | Other Directorship(s)
Held by Trustee During
Past 5 Years |
INTERESTED PERSONS (CONTINUED) | | | | | | | | | | |
| Philip A. Taylor (Continued) | | | | Director and Chairman, Invesco Investment Services, Inc. (formerly known as Invesco AIM Investment Services, Inc.) (registered transfer agent); Chief Executive Officer, Invesco Corporate Class Inc. (corporate mutual fund company); Chairman and Chief Executive Officer, Invesco Canada Ltd. (formerly known as Invesco Trimark Ltd./Invesco Trimark Ltèe) (registered investment adviser and registered transfer agent); Senior Vice President, The Invesco Funds; Director, Invesco Investment Advisers LLC (formerly known as Van Kampen Asset Management); Director, Chairman, Chief Executive Officer and President, Invesco Management Group, Inc. (formerly known as Invesco AIM Management Group, Inc.) (financial services holding company);Co-Chairman,Co-President andCo-Chief Executive Officer, Invesco Advisers, Inc. (formerly known as Invesco Institutional (N.A.), Inc.) (registered investment adviser); Director, Chief Executive Officer and President, Van Kampen Exchange Corp; President and Principal Executive Officer, The Invesco Funds (other than AIM Treasurer’s Series Trust (Invesco Treasurer’s Series Trust), Short-Term Investments Trust and Invesco Management Trust); Executive Vice President, The Invesco Funds (AIM Treasurer’s Series Trust (Invesco Treasurer’s Series Trust), Short-Term Investments Trust and Invesco Management Trust only); Director and President, INVESCO Funds Group, Inc. (registered investment adviser and registered transfer agent); Director and Chairman, IVZ Distributors, Inc. (formerly known as INVESCO Distributors, Inc.) (registered broker dealer); Director, President and Chairman, Invesco Inc. (holding company), Invesco Canada Holdings Inc. (holding company), Trimark Investments Ltd./ Placements Trimark Ltèe and Invesco Financial Services Ltd/Services Financiers Invesco Ltèe; Chief Executive Officer, Invesco Canada Fund Inc. (corporate mutual fund company); Director and Chairman, Van Kampen Investor Services Inc.; Director, Chief Executive Officer and President, 1371 Preferred Inc. (holding | | | | | | |
54 INVESCO OPPENHEIMER RISING DIVIDENDS FUND
| | | | | | | | | | |
Name, Year of Birth and
Position(s) Held with the Trust | | Trustee and/or Officer Since | | Principal Occupation(s) During Past 5 Years | | | | Number of Funds
in Fund Complex
Overseen by Trustee | | Other Directorship(s)
Held by Trustee During
Past 5 Years |
INTERESTED PERSONS (CONTINUED) | | | | | | | | | | |
| Philip A. Taylor (Continued) | | | | company) and Van Kampen Investments Inc.; Director and President, AIM GP Canada Inc. (general partner for limited partnerships) and Van Kampen Advisors, Inc.; Director and Chief Executive Officer, Invesco Trimark Dealer Inc. (registered broker dealer); Director, Invesco Distributors, Inc. (formerly known as Invesco AIM Distributors, Inc.) (registered broker dealer); Manager, Invesco Capital Management LLC; Director, Chief Executive Officer and President, Invesco Advisers, Inc.; Director, Chairman, Chief Executive Officer and President, Invesco AIM Capital Management, Inc.; President, Invesco Trimark Dealer Inc. and Invesco Trimark Ltd./Invesco Trimark Ltèe; Director and President, AIM Trimark Corporate Class Inc. and AIM Trimark Canada Fund Inc.; Senior Managing Director, Invesco Holding Company Limited; Director and Chairman, Fund Management Company (former registered broker dealer); President and Principal Executive Officer, The Invesco Funds (AIM Treasurer’s Series Trust (Invesco Treasurer’s Series Trust), and Short-Term Investments Trust only); President, AIM Trimark Global Fund Inc. and AIM Trimark Canada Fund Inc. | | | | | | |
55 INVESCO OPPENHEIMER RISING DIVIDENDS FUND
TRUSTEES AND OFFICERSContinued
| | | | | | | | | | |
Name, Year of Birth and
Position(s) Held with the Trust | | Trustee and/or Officer Since | | Principal Occupation(s) During Past 5 Years | | | | Number of Funds
in Fund Complex
Overseen by Trustee | | Other Directorship(s)
Held by Trustee During
Past 5 Years |
INDEPENDENT TRUSTEES | | | | | | | | | | |
Bruce L. Crockett – 1944 Trustee and Chair | | 2003 | | Chairman, Crockett Technologies Associates (technology consulting company) Formerly: Director, Captaris (unified messaging provider); Director, President and Chief Executive Officer, COMSAT Corporation; Chairman, Board of Governors of INTELSAT (international communications company); ACE Limited (insurance company); Independent Directors Council and Investment Company Institute: Member of the Audit Committee, Investment Company Institute; Member of the Executive Committee and Chair of the Governance Committee, Independent Directors Council | | | | 229 | | Director and Chairman of the Audit Committee, ALPS (Attorneys Liability Protection Society) (insurance company); Director and Member of the Audit Committee and Compensation Committee, Ferroglobe PLC (metallurgical company) |
David C. Arch – 1945 Trustee | | 2010 | | Chairman of Blistex Inc. (consumer health care products manufacturer); Member, World Presidents’ Organization | | | | 229 | | Board member of the Illinois Manufacturers’ Association |
Beth Ann Brown – 1968 Trustee | | 2019 | | Independent Consultant Formerly: Head of Intermediary Distribution, Managing Director, Strategic Relations, Managing Director, Head of National Accounts, Senior Vice President, National Account Manager and Senior Vice President, Key Account Manager, Columbia Management Investment Advisers LLC; Vice President, Key Account Manager, Liberty Funds Distributor, Inc.; and Trustee of certain Oppenheimer Funds | | | | 229 | | Director, Board of Directors of Caron Engineering Inc.; Advisor, Board of Advisors of Caron Engineering Inc.; President and Director, of Acton Shapleigh Youth Conservation Corps (non-profit); and Vice President and Director of Grahamtastic Connection (non-profit) |
Jack M. Fields – 1952 Trustee | | 2003 | | Chief Executive Officer, Twenty First Century Group, Inc. (government affairs company); and Chairman, Discovery Learning Alliance(non-profit) Formerly: Owner and Chief Executive Officer, Dos Angeles Ranch L.P. (cattle, hunting, corporate entertainment); Director, Insperity, Inc. (formerly known as Administaff) (human resources provider); Chief Executive Officer, Texana Timber LP (sustainable forestry company); Director of Cross Timbers Quail Research Ranch(non-profit); and member of the U.S. House of Representatives | | | | 229 | | None |
56 INVESCO OPPENHEIMER RISING DIVIDENDS FUND
| | | | | | | | | | |
Name, Year of Birth and
Position(s) Held with the Trust | | Trustee and/or Officer Since | | Principal Occupation(s) During Past 5 Years | | | | Number of Funds
in Fund Complex
Overseen by Trustee | | Other Directorship(s)
Held by Trustee During
Past 5 Years |
INDEPENDENT TRUSTEES (CONTINUED) | | | | | | | | | | |
Cynthia Hostetler —1962 Trustee | | 2017 | | Non-Executive Director and Trustee of a number of public and private business corporations Formerly: Director, Aberdeen Investment Funds (4 portfolios); Head of Investment Funds and Private Equity, Overseas Private Investment Corporation; President, First Manhattan Bancorporation, Inc.; Attorney, Simpson Thacher & Bartlett LLP | | | | 229 | | Vulcan Materials Company (construction materials company); Trilinc Global Impact Fund; Genesee & Wyoming, Inc. (railroads); Artio Global Investment LLC (mutual fund complex); Edgen Group, Inc. (specialized energy and infrastructure products distributor); Investment Company Institute (professional organization); Independent Directors Council (professional organization) |
Eli Jones – 1961 Trustee | | 2016 | | Professor and Dean, Mays Business School - Texas A&M University Formerly: Professor and Dean, Walton College of Business, University of Arkansas and E.J. Ourso College of Business, Louisiana State University; Director, Arvest Bank | | | | 229 | | Insperity, Inc. (formerly known as Administaff) (human resources provider) |
Elizabeth Krentzman – 1959 Trustee | | 2019 | | Formerly: Principal and Chief Regulatory Advisor for Asset Management Services and U.S. Mutual Fund Leader of Deloitte & Touche LLP; General Counsel of the Investment Company Institute (trade association); National Director of the Investment Management Regulatory Consulting Practice, Principal, Director and Senior Manager of Deloitte & Touche LLP; Assistant Director of the Division of Investment Management - Office of Disclosure and Investment Adviser Regulation of the U.S. Securities and Exchange Commission and various positions with the Division of Investment Management – Office of Regulatory Policy of the U.S. Securities and Exchange Commission; Associate at Ropes & Gray LLP.; Advisory Board Member of the Securities and Exchange Commission Historical Society; and Trustee of certain Oppenheimer Funds | | | | 229 | | Trustee of the University of Florida National Board Foundation and Audit Committee Member; Member of the Cartica Funds Board of Directors (private investment funds); Member of the University of Florida Law Center Association, Inc. Board of Trustees and Audit Committee Member |
57 INVESCO OPPENHEIMER RISING DIVIDENDS FUND
TRUSTEES AND OFFICERSContinued
| | | | | | | | | | |
Name, Year of Birth and
Position(s) Held with the Trust | | Trustee and/or Officer Since | | Principal Occupation(s) During Past 5 Years | | | | Number of Funds
in Fund Complex
Overseen by Trustee | | Other Directorship(s)
Held by Trustee During
Past 5 Years |
INDEPENDENT TRUSTEES (CONTINUED) | | | | | | | | | | |
Anthony J. LaCava, Jr. – 1956 Trustee | | 2019 | | Formerly: Director and Member of the Audit Committee, Blue Hills Bank (publicly traded financial institution) and Managing Partner, KPMG LLP | | | | 229 | | Blue Hills Bank; Chairman of Bentley University; Member, Business School Advisory Council; and Nominating Committee, KPMG LLP |
Prema Mathai-Davis – 1950 Trustee | | 2003 | | Retired Co-Owner & Partner of Quantalytics Research, LLC, (a FinTech Investment Research Platform for the Self-Directed Investor) | | | | 229 | | None |
Joel W. Motley – 1952 Trustee | | 2019 | | Director of Office of Finance, Federal Home Loan Bank; Member of the Vestry of Trinity Wall Street; Managing Director of Carmona Motley Hoffman, Inc. (privately held financial advisor); Member of the Finance and Budget Committee of the Council on Foreign Relations, Member of the Investment Committee and Board of Human Rights Watch and Member of the Investment Committee and Board of Historic Hudson Valley (non-profit cultural organization). Formerly: Managing Director of Public Capital Advisors, LLC (privately held financial advisor); Managing Director of Carmona Motley Hoffman, Inc. (privately held financial advisor); Trustee of certain Oppenheimer Funds; and Director of Columbia Equity Financial Corp. (privately held financial advisor) | | | | 229 | | Director of Greenwall Foundation (bioethics research foundation); Member of Board and Investment Committee of The Greenwall Foundation; Director of Southern Africa Legal Services Foundation; Board Member and Investment Committee Member of Pulitzer Center for Crisis Reporting(non-profit journalism) |
Teresa M. Ressel — 1962 Trustee | | 2017 | | Non-executive director and trustee of a number of public and private business corporations Formerly: Chief Financial Officer, Olayan America, The Olayan Group (international investor/commercial/industrial); Chief Executive Officer, UBS Securities LLC; Group Chief Operating Officer, Americas, UBS AG; Assistant Secretary for Management & Budget and CFO, US Department of the Treasury | | | | 229 | | Atlantic Power Corporation (power generation company); ON Semiconductor Corp. (semiconductor supplier) |
Ann Barnett Stern – 1957 Trustee | | 2017 | | President and Chief Executive Officer, Houston Endowment Inc. (private philanthropic institution) Formerly: Executive Vice President and General Counsel, Texas Children’s Hospital; | | | | 229 | | Federal Reserve Bank of Dallas |
58 INVESCO OPPENHEIMER RISING DIVIDENDS FUND
| | | | | | | | | | |
Name, Year of Birth and
Position(s) Held with the Trust | | Trustee and/or Officer Since | | Principal Occupation(s) During Past 5 Years | | | | Number of Funds
in Fund Complex
Overseen by Trustee | | Other Directorship(s)
Held by Trustee During
Past 5 Years |
INDEPENDENT TRUSTEES (CONTINUED) | | | | | | | | | | |
| Ann Barnett Stern (Continued) | | | | Attorney, Beck, Redden and Secrest, LLP; Business Law Instructor, University of St. Thomas; Attorney, Andrews & Kurth LLP | | | | | | |
Raymond Stickel, Jr. – 1944 Trustee | | 2005 | | Retired Formerly: Director, Mainstay VP Series Funds, Inc. (25 portfolios); Partner, Deloitte & Touche | | | | 229 | | None |
Robert C. Troccoli – 1949 Trustee | | 2016 | | Retired Formerly: Adjunct Professor, University of Denver – Daniels College of Business, Senior Partner, KPMG LLP | | | | 229 | | None |
Daniel S. Vandivort –1954 Trustee | | 2019 | | Treasurer, Chairman of the Audit and Finance Committee, and Trustee, Board of Trustees, Huntington Disease Foundation of America; and President, Flyway Advisory Services LLC (consulting and property management). Formerly: Trustee and Governance Chair, of certain Oppenheimer Funds | | | | 229 | | Chairman and Lead Independent Director, Chairman of the Audit Committee, and Director, Board of Directors, Value Line Funds |
James D. Vaughn – 1945 Trustee | | 2019 | | Retired Formerly: Managing Partner, Deloitte & Touche LLP; Trustee and Chairman of the Audit Committee, Schroder Funds; Board Member, Mile High United Way, Boys and Girls Clubs, Boy Scouts, Colorado Business Committee for the Arts, Economic Club of Colorado and Metro Denver Network (economic development corporation); and Trustee of certain Oppenheimer Funds | | | | 229 | | Board member and Chairman of Audit Committee of AMG National Trust Bank; Trustee and Investment Committee member, University of South Dakota Foundation; Board member, Audit Committee Member and past Board Chair, Junior Achievement(non-profit) |
Christopher L. Wilson – 1957 Trustee, Vice Chair and Chair Designate | | 2017 | | Retired Formerly: Director, TD Asset Management USA Inc. (mutual fund complex) (22 portfolios); Managing Partner, CT2, LLC (investing and consulting firm); President/Chief Executive Officer, Columbia Funds, Bank of America Corporation; President/Chief Executive Officer, CDC IXIS Asset Management Services, Inc.; Principal & Director of Operations, Scudder Funds, Scudder, Stevens & Clark, Inc.; Assistant Vice President, Fidelity Investments | | | | 229 | | ISO New England, Inc.(non-profit organization managing regional electricity market) |
59 INVESCO OPPENHEIMER RISING DIVIDENDS FUND
TRUSTEES AND OFFICERSContinued
| | | | | | | | | | |
Name, Year of Birth and
Position(s) Held with the Trust | | Trustee and/or Officer Since | | Principal Occupation(s) During Past 5 Years | | | | Number of Funds
in Fund Complex
Overseen by Trustee | | Other Directorship(s)
Held by Trustee During
Past 5 Years |
OTHER OFFICERS | | | | | | | | | | |
Sheri Morris — 1964 President, Principal Executive Officer and Treasurer | | 2003 | | Head of Global Fund Services, Invesco Ltd.; President, Principal Executive Officer and Treasurer, The Invesco Funds; Vice President, Invesco Advisers, Inc. (formerly known as Invesco Institutional (N.A.), Inc.) (registered investment adviser); and Vice President, Invesco Exchange-Traded Fund Trust, Invesco Exchange-Traded Fund Trust II, Invesco India Exchange-Traded Fund Trust, Invesco Actively Managed Exchange-Traded Fund Trust, Invesco Actively Managed Exchange-Traded Commodity Fund Trust and Invesco Exchange-Traded Self-Indexed Fund Trust, and Vice President, OppenheimerFunds, Inc. Formerly: Vice President and Principal Financial Officer, The Invesco Funds; Vice President, Invesco AIM Advisers, Inc., Invesco AIM Capital Management, Inc. and Invesco AIM Private Asset Management, Inc.; Assistant Vice President and Assistant Treasurer, The Invesco Funds and Assistant Vice President, Invesco Advisers, Inc., Invesco AIM Capital Management, Inc. and Invesco AIM Private Asset Management, Inc.; and Treasurer, Invesco Exchange-Traded Fund Trust, Invesco Exchange-Traded Fund Trust II, Invesco India Exchange-Traded Fund Trust and Invesco Actively Managed Exchange-Traded Fund Trust | | | | N/A | | N/A |
Russell C. Burk — 1958 Senior Vice President and Senior Officer | | 2005 | | Senior Vice President and Senior Officer, The Invesco Funds | | | | N/A | | N/A |
Jeffrey H. Kupor – 1968 Senior Vice President, Chief Legal Officer and Secretary | | 2018 | | Head of Legal of the Americas, Invesco Ltd.; Senior Vice President and Secretary, Invesco Advisers, Inc. (formerly known as Invesco Institutional (N.A.), Inc.) (registered investment adviser); Senior Vice President and Secretary, Invesco Distributors, Inc. (formerly known as Invesco AIM Distributors, Inc.); Vice President and Secretary, Invesco Investment Services, Inc. (formerly known as Invesco AIM Investment Services, Inc.) Senior Vice President, Chief Legal Officer and Secretary, The Invesco Funds; Secretary and General Counsel, Invesco Investment Advisers LLC (formerly known as Van Kampen Asset Management); Secretary and General Counsel, Invesco Capital Markets, Inc. (formerly known as Van Kampen Funds Inc.) and Chief Legal | | | | N/A | | N/A |
60 INVESCO OPPENHEIMER RISING DIVIDENDS FUND
| | | | | | | | | | |
Name, Year of Birth and
Position(s) Held with the Trust | | Trustee and/or Officer Since | | Principal Occupation(s) During Past 5 Years | | | | Number of Funds
in Fund Complex
Overseen by Trustee | | Other Directorship(s)
Held by Trustee During
Past 5 Years |
OTHER OFFICERS (CONTINUED) | | | | | | | | | | |
| Jeffrey H. Kupor (Continued) | | | | Officer, Invesco Exchange-Traded Fund Trust, Invesco Exchange-Traded Fund Trust II, Invesco India Exchange-Traded Fund Trust, Invesco Actively Managed Exchange-Traded Fund Trust, Invesco Actively Managed Exchange-Traded Commodity Fund Trust and Invesco Exchange-Traded Self-Indexed Fund Trust; Secretary, Invesco Indexing LLC; Secretary, W.L. Ross & Co., LLC Formerly: Secretary and Vice President, Jemstep, Inc.; Head of Legal, Worldwide Institutional, Invesco Ltd.; Secretary and General Counsel, INVESCO Private Capital Investments, Inc.; Senior Vice President, Secretary and General Counsel, Invesco Management Group, Inc. (formerly known as Invesco AIM Management Group, Inc.); Assistant Secretary, INVESCO Asset Management (Bermuda) Ltd.; Secretary and General Counsel, Invesco Private Capital, Inc.; Assistant Secretary and General Counsel, INVESCO Realty, Inc.; Secretary and General Counsel, Invesco Senior Secured Management, Inc.; and Secretary, Sovereign G./P. Holdings Inc. | | | | | | |
Andrew R. Schlossberg – 1974 Senior Vice President | | 2019 | | Head of the Americas and Senior Managing Director, Invesco Ltd.; Director and Senior Vice President, Invesco Advisers, Inc. (formerly known as Invesco Institutional (N.A.), Inc.) (registered investment adviser); Director and Chairman, Invesco Investment Services, Inc. (formerly known as Invesco AIM Investment Services, Inc.) (registered transfer agent); Senior Vice President, The Invesco Funds; Director, Invesco Investment Advisers LLC (formerly known as Van Kampen Asset Management); Director, President and Chairman, Invesco Insurance Agency, Inc. Formerly: Director, Invesco UK Limited; Director and Chief Executive, Invesco Asset Management Limited and Invesco Fund Managers Limited; Assistant Vice President, The Invesco Funds; Senior Vice President, Invesco Advisers, Inc. (formerly known as Invesco Institutional (N.A.), Inc.) (registered investment adviser); Director and Chief Executive, Invesco Administration Services | | | | N/A | | N/A |
61 INVESCO OPPENHEIMER RISING DIVIDENDS FUND
TRUSTEES AND OFFICERSContinued
| | | | | | | | | | |
Name, Year of Birth and
Position(s) Held with the Trust | | Trustee and/or Officer Since | | Principal Occupation(s) During Past 5 Years | | | | Number of Funds
in Fund Complex
Overseen by Trustee | | Other Directorship(s)
Held by Trustee During
Past 5 Years |
OTHER OFFICERS (CONTINUED) | | | | | | | | | | |
| Andrew R. Schlossberg (Continued) | | | | Limited and Invesco Global Investment Funds Limited; Director, Invesco Distributors, Inc.; Head of EMEA, Invesco Ltd.; President, Invesco Actively Managed Exchange-Traded Commodity Fund Trust, Invesco Actively Managed Exchange-Traded Fund Trust, Invesco Exchange-Traded Fund Trust, Invesco Exchange-Traded Fund Trust II and Invesco India Exchange-Traded Fund Trust; Managing Director and Principal Executive Officer, Invesco Capital Management LLC | | | | | | |
John M. Zerr — 1962 Senior Vice President | | 2006 | | Chief Operating Officer of the Americas; Senior Vice President, Invesco Advisers, Inc. (formerly known as Invesco Institutional (N.A.), Inc.) (registered investment adviser); Senior Vice President, Invesco Distributors, Inc. (formerly known as Invesco AIM Distributors, Inc.); Director and Vice President, Invesco Investment Services, Inc. (formerly known as Invesco AIM Investment Services, Inc.) Senior Vice President, The Invesco Funds; Managing Director, Invesco Capital Management LLC; Director, Invesco Investment Advisers LLC (formerly known as Van Kampen Asset Management); Senior Vice President, Invesco Capital Markets, Inc. (formerly known as Van Kampen Funds Inc.); Manager, Invesco Indexing LLC; Manager, Invesco Specialized Products, LLC; Director and Senior Vice President, Invesco Insurance Agency, Inc.; Member, Invesco Canada Funds Advisory Board; Director, President and Chief Executive Officer, Invesco Corporate Class Inc. (corporate mutual fund company); and Director, Chairman, President and Chief Executive Officer, Invesco Canada Ltd. (formerly known as Invesco Trimark Ltd./Invesco Trimark Ltèe) (registered investment adviser and registered transfer agent) Formerly: Director and Senior Vice President, Invesco Management Group, Inc. (formerly known as Invesco AIM Management Group, Inc.); Secretary and General Counsel, Invesco Management Group, Inc. (formerly known as Invesco AIM Management Group, Inc.); Secretary, Invesco Investment Services, Inc. (formerly known as Invesco AIM Investment Services, Inc.); Chief Legal Officer and | | | | N/A | | N/A |
62 INVESCO OPPENHEIMER RISING DIVIDENDS FUND
| | | | | | | | | | |
Name, Year of Birth and
Position(s) Held with the Trust | | Trustee and/or Officer Since | | Principal Occupation(s) During Past 5 Years | | | | Number of Funds
in Fund Complex
Overseen by Trustee | | Other Directorship(s)
Held by Trustee During
Past 5 Years |
OTHER OFFICERS (CONTINUED) | | | | | | | | | | |
| John M. Zerr (Continued) | | | | Secretary, The Invesco Funds; Secretary and General Counsel, Invesco Investment Advisers LLC (formerly known as Van Kampen Asset Management); Secretary and General Counsel, Invesco Capital Markets, Inc. (formerly known as Van Kampen Funds Inc.); Chief Legal Officer, Invesco Exchange-Traded Fund Trust, Invesco Exchange-Traded Fund Trust II, Invesco India Exchange-Traded Fund Trust, Invesco Actively Managed Exchange-Traded Fund Trust, Invesco Actively Managed Exchange- Traded Commodity Fund Trust and Invesco Exchange-Traded Self-Indexed Fund Trust; Secretary, Invesco Indexing LLC; Director, Secretary, General Counsel and Senior Vice President, Van Kampen Exchange Corp.; Director, Vice President and Secretary, IVZ Distributors, Inc. (formerly known as INVESCO Distributors, Inc.); Director and Vice President, INVESCO Funds Group, Inc.; Director and Vice President, Van Kampen Advisors Inc.; Director, Vice President, Secretary and General Counsel, Van Kampen Investor Services Inc.; Director and Secretary, Invesco Distributors, Inc. (formerly known as Invesco AIM Distributors, Inc.); Director, Senior Vice President, General Counsel and Secretary, Invesco AIM Advisers, Inc. and Van Kampen Investments Inc.; Director, Vice President and Secretary, Fund Management Company; Director, Senior Vice President, Secretary, General Counsel and Vice President, Invesco AIM Capital Management, Inc.; Chief Operating Officer and General Counsel, Liberty Ridge Capital, Inc. (an investment adviser) | | | | | | |
Gregory G. McGreevey - 1962 Senior Vice President | | 2012 | | Senior Managing Director, Invesco Ltd.; Director, Chairman, President, and Chief Executive Officer, Invesco Advisers, Inc. (formerly known as Invesco Institutional (N.A.), Inc.) (registered investment adviser); Director, Invesco Mortgage Capital, Inc. and Invesco Senior Secured Management, Inc.; and Senior Vice President, The Invesco Funds; and President, SNW Asset Management Corporation Formerly: Senior Vice President, Invesco | | | | N/A | | N/A |
63 INVESCO OPPENHEIMER RISING DIVIDENDS FUND
TRUSTEES AND OFFICERSContinued
| | | | | | | | | | |
Name, Year of Birth and
Position(s) Held with the Trust | | Trustee and/or Officer Since | | Principal Occupation(s) During Past 5 Years | | | | Number of Funds
in Fund Complex
Overseen by Trustee | | Other Directorship(s)
Held by Trustee During
Past 5 Years |
OTHER OFFICERS (CONTINUED) | | | | | | | | | | |
| Gregory G. McGreevey (Continued) | | | | Management Group, Inc. and Invesco Advisers, Inc.; Assistant Vice President, The Invesco Funds | | | | | | |
Kelli Gallegos – 1970 Vice President, Principal Financial Officer and Assistant Treasurer | | 2008 | | Principal Financial and Accounting Officer – Investments Pool, Invesco Specialized Products, LLC; Vice President, Principal Financial Officer and Assistant Treasurer, The Invesco Funds; Principal Financial and Accounting Officer – Pooled Investments, Invesco Capital Management LLC; Vice President and Treasurer, InvescoExchange-Traded Fund Trust, Invesco Exchange-Traded Fund Trust II, Invesco India Exchange-Traded Fund Trust, Invesco Actively Managed Exchange-Traded Fund Trust, Invesco Actively Managed Exchange-Traded Commodity Fund Trust and Invesco Exchange-Traded Self- Indexed Fund Trust Formerly: Assistant Treasurer, Invesco Specialized Products, LLC; Assistant Treasurer, Invesco Exchange-Traded Fund Trust, Invesco Exchange-Traded Fund Trust II, Invesco IndiaExchange-Traded Fund Trust, Invesco Actively Managed Exchange-Traded Fund Trust, Invesco Actively Managed Exchange-Traded Commodity Fund Trust and Invesco Exchange-Traded Self-Indexed Fund Trust; Assistant Treasurer, Invesco Capital Management LLC; Assistant Vice President, The Invesco Funds | | | | N/A | | N/A |
Crissie M. Wisdom – 1969 Anti-Money Laundering Compliance Officer | | 2013 | | Anti-Money Laundering Compliance Officer, Invesco Advisers, Inc. (formerly known as Invesco Institutional (N.A.), Inc.) (registered investment adviser), Invesco Capital Markets, Inc. (formerly known as Van Kampen Funds Inc.), Invesco Distributors, Inc., Invesco Investment Services, Inc., The Invesco Funds, and Invesco Exchange-Traded Fund Trust, Invesco Exchange-Traded Fund Trust II, Invesco India Exchange-Traded Fund Trust, Invesco Actively Managed Exchange-Traded Fund Trust, Invesco Actively Managed Exchange-Traded Commodity Fund Trust and Invesco Exchange-Traded Self-Indexed Fund Trust; Anti-Money Laundering Compliance Officer and Bank Secrecy Act Officer, INVESCO National Trust Company and Invesco Trust Company; and Fraud Prevention Manager and | | | | N/A | | N/A |
64 INVESCO OPPENHEIMER RISING DIVIDENDS FUND
| | | | | | | | | | |
Name, Year of Birth and
Position(s) Held with the Trust | | Trustee and/or Officer Since | | Principal Occupation(s) During Past 5 Years | | | | Number of Funds
in Fund Complex
Overseen by Trustee | | Other Directorship(s)
Held by Trustee During
Past 5 Years |
OTHER OFFICERS (CONTINUED) | | | | | | | | | | |
| Crissie M. Wisdom (Continued) | | | | Controls and Risk Analysis Manager for Invesco Investment Services, Inc. Formerly: Anti-Money Laundering Compliance Officer, Van Kampen Exchange Corp. and Invesco Management Group, Inc. | | | | | | |
Robert R. Leveille – 1969 Chief Compliance Officer | | 2016 | | Chief Compliance Officer, Invesco Advisers, Inc. (registered investment adviser); and Chief Compliance Officer, The Invesco Funds Formerly: Chief Compliance Officer, Putnam Investments and the Putnam Funds | | | | N/A | | N/A |
The Statement of Additional Information of the Trust includes additional information about the Fund’s Trustees and is available upon request, without charge, by calling 1.800.959.4246. Please refer to the Fund’s Statement of Additional Information for information on the Fund’ssub-advisers.
| | | | | | |
Office of the Fund 11 Greenway Plaza, Suite 1000 Houston, TX 77046-1173 Counsel to the Fund Stradley Ronon Stevens & Young, LLP 2005 Market Street, Suite 2600 Philadelphia, PA 19103-7018 | | Investment Adviser Invesco Advisers, Inc. 1555 Peachtree Street, N.E. Atlanta, GA 30309 Counsel to the Independent Trustees Goodwin Procter LLP 901 New York Avenue, N.W. Washington, D.C. 20001 | | Distributor Invesco Distributors, Inc. 11 Greenway Plaza, Suite 1000 Houston, TX 77046-1173 Transfer Agent Invesco Investment Services, Inc. 11 Greenway Plaza, Suite 1000 Houston, TX 77046-1173 | | AuditorsPricewaterhouseCoopers LLP 1000 Louisiana Street, Suite 5800 Houston, TX 77002-5021 Custodian Citibank, N.A. 111 Wall Street New York, NY 10005 |
65 INVESCO OPPENHEIMER RISING DIVIDENDS FUND
Invesco recognizes the importance of protecting your personal and financial information when you visit our website located atwww.invesco.com (the “Website”). The following information is designed to help you understand the information collection practices at this Website. We will not sell, share or rent your personally identifiable information to others in contravention of this Privacy Policy. When we refer to ourselves as “we” or “Invesco” in this Privacy Policy, we mean our entire company including our affiliates, such as subsidiaries.
By visiting this Website, you are accepting the practices described in this Privacy Policy. If you do not agree to this policy, you may not use this Website. This Privacy Policy is subject to change without notice, from time to time in our sole discretion. You acknowledge that by accessing the Website after we have posted changes to this Privacy Policy, you are agreeing to this Privacy Policy as modified. Please review the Terms of Use1 to learn of other terms and conditions applicable to your use of the Website.
Please note that this Privacy Policy is not an exclusive statement of our privacy principles across all products and services. Other privacy principles or policies may apply depending on the products or services you obtain from Invesco, or the jurisdiction in which you transact with Invesco.
This Privacy Policy was last updated on May 6, 2018.
Information We Collect and Use
We collect personal information you choose to submit to the Website in order to process transactions requested by you and meet our contractual obligations. For example, you can choose to provide your name, contact information, social security number, or tax identification number in connection with accessing your account, or you can choose to provide your personal information when you fill out a secure account question form. Any information collected about you from the Website can, from time to time, be associated with other identifying information we have about you.
In addition, we may gather information about you automatically through your use of the Website, e.g. your IP address, how you navigate the Website, the organization from which you are accessing the Website, and the websites that you access before and after you visit the Website.
When you access the Website, we may also collect information such as unique device identifiers, your screen resolution and other device settings, information about your location, and analytical information about how you use the device from which you are viewing the Website. Where applicable, we may ask your permission before collecting certain information, such as precise geolocation information.
From time to time, we use or augment the personal information we have about you with information obtained from third parties. For example, we use third party information to confirm contact or financial information or to better understand your interests by associating demographic information from third parties with the information you have provided.
How We Use Personal Information
We use your personal information to respond to your inquiries and provide the products and services you request. We also use your information from time to time to deliver the content and services we believe
1NTD
66 INVESCO OPPENHEIMER RISING DIVIDENDS FUND
you will find the most relevant and to provide customer service and support.
We also use the information you provide to further develop and improve our products and services. We aggregate and/orde-identify data about visitors to the Website for various business purposes including product and service development and improvement activities.
How We Share Personal Information
We collaborate with other companies and individuals to perform services for us and on our behalf and we collaborate with our affiliates, other companies and individuals with respect to particular products or services (“Providers”). Examples of Providers include data analysis firms, customer service and support providers, email and SMS vendors, andweb-hosting and development companies. Some Providers collect information for us or on our behalf on our Website. These Providers can be provided with access to personal information needed to perform their functions.
We reserve the right to disclose your personal information as required by law, when we believe disclosure is necessary to comply with a regulatory requirement, judicial proceeding, court order or legal process served on us, to protect the safety, rights or property of our customers, the public or Invesco or to enforce the Terms of Use.
If we sell or transfer a business unit (such as a subsidiary) or an asset (such as a website) to another company, we will share your personal information with such company. You will receive notice of such an event and the new entity will inform you of any changes to the practices in this Privacy Policy. If the new entity wishes to make additional use of your information, you have the right to decline such use at that time.
We occasionally disclose aggregate orde-identified data that is not personally identifiable with third parties.
Cookies and Other Tools
Invesco and its Providers collect information about you by using cookies, tracking pixels and other technologies. We use this information to better understand, customize and improve user experience with our websites, services and offerings as well as to manage our advertising. For example, we use web analytics services that use these technologies to gather information to help us understand how visitors engage with and navigate our Website, e.g., how and when pages in a site are visited and by how many visitors. We are also able to offer our visitors a more customized, relevant experience on our sites using these technologies by delivering content and functionality based on your preferences and interests.
Depending on their purpose, some cookies will only operate for the length of a single browsing session, while others have a longer life span to ensure that they fulfill their longer-term purposes. Your web browser can be set to allow you to control whether you will accept cookies or reject cookies, to notify you each time a cookie is sent to your browser, or to delete cookies that have already been set. If your browser is set to reject cookies, certain aspects of the Website that are cookie-enabled will not recognize you when you return to the website, and some Website functionality may be lost. The “Help” section of your browser may tell you how to prevent your browser from accepting cookies. To find out more about cookies, visitwww.aboutcookies.org.
67 INVESCO OPPENHEIMER RISING DIVIDENDS FUND
| | |
| | INVESCO’S PRIVACY NOTICEContinued |
Security
No data transmission over the internet can be 100% secure, so Invesco cannot ensure or warrant the security of any information you submit to us on this Website. However, Invesco seeks to protect your personal information from unauthorized access or use when you transact business on our Website using technical, administrative and procedural measures. Invesco makes no representation as to the reasonableness, efficacy, or appropriateness of the measures we use to safeguard such information.
Users are responsible for maintaining the secrecy of their own passwords. If you have reason to believe that your interaction with us is no longer secure (for example, if you feel that the security of any account you might have with us has been compromised), please immediately notify us by contacting us as specified below.
Transfer of Data to Other Countries
Any information you provide to Invesco through use of the Website may be stored and processed, transferred between and accessed from the United States, Canada and other countries which do not guarantee the same level of protection of personal information as the one in which you reside. However, Invesco will handle your personal information in accordance with this Privacy Policy regardless of where your personal information is stored/accessed.
Children’s Privacy
We are committed to protecting the privacy of children. We do not knowingly collect personal information from children under the age of 18. If you are under the age of 18, do not provide us with any personal information.
Contact Us
Please contact us if you have any questions or concerns about your personal information or require assistance in managing your choices.
Invesco Ltd.
1555 Peachtree St. NE
Atlanta, GA 30309
By phone:
(404)439-3236
By fax:
(404)962-8288
By email:
Anne.Gerry@invesco.com
Please update your account information by logging in or contact us by email or telephone as specified above to update your account information whenever such information ceases to be complete or accurate.
You may also contact us to:
68 INVESCO OPPENHEIMER RISING DIVIDENDS FUND
● Request that we amend, rectify, delete or update the personal data we hold about you;
● Where possible (e.g. in relation to marketing) amend or update your choices around processing;
● Request a copy of personal data held by us.
Disclaimer
Where the Website contains links to third-party websites/content/services that are not owned or controlled by Invesco, Invesco is not responsible for how these properties operate or treat your personal information so we recommend that you read the privacy policies and terms associated with these third party properties carefully.
69 INVESCO OPPENHEIMER RISING DIVIDENDS FUND
THIS PAGE INTENTIONALLY LEFT BLANK.
THIS PAGE INTENTIONALLY LEFT BLANK.
| | |
Explore High-Conviction Investing with Invesco 
Go paperless with eDelivery Visit invesco.com/edelivery to enjoy the convenience and security of anytime electronic access to your investment documents. With eDelivery, you can elect to have any or all of the following materials delivered straight to your inbox to download, save and print from your own computer: ∎ Fund reports and prospectuses ∎ Quarterly statements ∎ Daily confirmations ∎ Tax forms Invesco mailing information Send general correspondence to Invesco Investment Services, Inc., P.O. Box 219078, Kansas City, MO 64121-9078. | | |
| | | | | | | | |
| | |  | |
| | |
Invesco Distributors, Inc. | | | O-RISD-AR-1 | | | | 12272019 | |
| | |

| | Shareholder Report for the Three Months Ended 10/31/2019 |
| | |
| | |
| | Invesco Oppenheimer |
| | Main Street All Cap Fund* |
| | Beginning on January 1, 2021, as permitted by regulations adopted by the Securities and Exchange Commission, paper copies of the Fund’s shareholder reports will no longer be sent by mail, unless you specifically request paper copies of the reports from the Fund or from your financial intermediary, such as a broker-dealer or bank. Instead, the reports will be made available on the Fund’s website, and you will be notified by mail each time a report is posted and provided with a website link to access the report. |
| | If you already elected to receive shareholder reports electronically, you will not be affected by this change and you need not take any action. You may elect to receive shareholder reports and other communications from the Fund electronically by contacting your financial intermediary (such as a broker-dealer or bank) or, if you are a direct investor, by enrolling at invesco.com/edelivery. |
| | You may elect to receive all future reports in paper free of charge. If you invest through a financial intermediary, you can contact your financial intermediary to request that you continue to receive paper copies of your shareholder reports. If you invest directly with the Fund, you can call 800 959 4246 to let the Fund know you wish to continue receiving paper copies of your shareholder reports. Your election to receive reports in paper will apply to all funds held with your financial intermediary or all funds held with the fund complex if you invest directly with the Fund. |
| |
| | *Prior to the close of business on May 24, 2019, the Fund’s name was Oppenheimer Main Street All Cap Fund. See Important Update on the following page for more information. |
Important Update
On October 18, 2018, Massachusetts Mutual Life Insurance Company, an indirect corporate parent of OppenheimerFunds, Inc. and its subsidiaries OFI Global Asset Management, Inc., OFI SteelPath, Inc. and OFI Advisors, LLC, announced that it had entered into an agreement whereby Invesco Ltd., a global investment management company would acquire OppenheimerFunds and its subsidiaries (together, “OppenheimerFunds”). After the close of business on May 24, 2019 Invesco Ltd. completed the acquisition of OppenheimerFunds. This Fund was included in that acquisition and as of that date, became part of the Invesco family of funds. Please visit invesco.com for more information or call Invesco’s Client Services team at800-959-4246.
Table of Contents
Class A Shares
AVERAGE ANNUAL TOTAL RETURNS AT10/31/19
| | | | | | | | | | | | |
| | | Class A Shares of the Fund | | |
| | | |
| | | Without Sales Charge | | With Sales Charge | | Russell 3000 Index |
| 1-Year | | | 13.27 | % | | | 7.06 | % | | | 13.49 | % |
| 5-Year | | | 7.21 | | | | 6.00 | | | | 10.31 | |
| 10-Year | | | 10.74 | | | | 10.12 | | | | 13.62 | |
Performance quoted is past performance and cannot guarantee comparable future results; current performance may be lower or higher. Visit invesco.com for the most recentmonth-end performance. Performance figures reflect reinvested distributions and changes in net asset value (NAV). Investment return and principal value will vary so that you may have a gain or a loss when you sell shares. Fund returns include changes in share price, reinvested distributions and a 5.50% maximum applicable sales charge except where “without sales charge” is indicated. Returns for periods of less than one year are cumulative and not annualized. As the result of a reorganization after the close of business on May 24, 2019, the returns of the Fund for periods on or prior to May 24, 2019 reflect performance of the Oppenheimer predecessor fund. Share class returns will differ from those of the predecessor fund because they have different expenses. Returns do not consider capital gains or income taxes on an individual’s investment. See Fund prospectus and summary prospectus for more information on share classes, sales charges and new fee agreements, if any. Fund literature is available at invesco.com.
3 INVESCO OPPENHEIMER MAIN STREET ALL CAP FUND
Fund Performance Discussion
The Fund slightly underperformed the Russell 3000 Index during the three-month period ended October 31, 2019. The Fund’s underperformance was mainly driven by stock selection within the financials and communication services sectors. This was partially offset by stronger selection within the Information Technology and Consumer Discretionary sectors.
MARKET OVERVIEW
The U.S. economy continues to exhibit decent economic growth, low unemployment and modest inflation. This is driven partly by tax cuts, technological innovation and falling regulatory hurdles. That said, the effects of the strain in the trading relationship with China have been a headwind to growth, but not nearly enough to offset the momentum in the economy.
Opinions in the market have become highly polarized. On one hand, relative safe-haven equity investments like consumer staples
stocks and utilities have been bid up to lofty valuations. On the other hand, speculation remains at an elevated level. Previous mania around cryptocurrency and now cannabis stocks are symptoms of this. More recently, the IPO market has been very active. We believe an equally big risk to stock prices is the stock market’s preference for so called “disruptors” and the potential for stocks with this perceived characteristic to become crowded trades and have valuations untethered to financial reality. We are looking both to avoid the companies getting disrupted
COMPARISON OF CHANGE IN VALUE OF $10,000 HYPOTHETICAL INVESTMENTS IN:
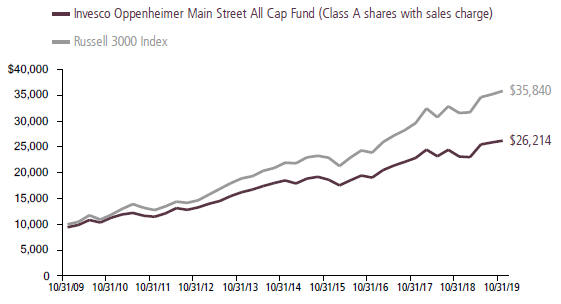
4 INVESCO OPPENHEIMER MAIN STREET ALL CAP FUND
while also gaining exposure to disruptors that are trading at reasonable valuations.
FUND REVIEW
The top individual contributors to the Fund’s relative performance during thetwo-month reporting period included JPMorgan Chase, NVIDIA, and Duke Energy.
JPMorgan benefitted from general strength in the banksub-sector. Additionally, the company continues to display strong execution relative to their peers. NVIDIA saw a stabilization in its gaming and data center businesses after it experienced two challenging quarters. The company maintains a leadership position in both markets and secular growth drivers remain intact for both. Duke Energy, an electric utility, benefitted from general strength in the utilities sector which significantly outperformed the broad market during the reporting period.
The key individual detractors from performance during the reporting period included ServiceNow, Prudential, and Progressive. The Fund’s relative results were also negatively impacted by having an underweight exposure to Apple, one of the largest and best performing names within the index during the period.
ServiceNow was negatively impacted by a broad-based selloff in thesoftware-as-a-service (Saas) group. Additionally, the company announced CEO change. Prudential and Progressive were both negatively
impacted by general weakness across the life insurance and property and casualty insurance subsectors.
STRATEGY & OUTLOOK
We continue to maintain our discipline around valuation and focus on companies that demonstrate competitive advantages and skilled management teams that areout-executing peers. The evidence of this we look for in our companies include high returns on invested capital, consistently strong pricing power, and/or rising market shares. During times of economic volatility such companies frequently widen their lead over weaker competitors. We seek to invest in companies characterized by these qualities at compelling valuations and believe this disciplined approach is essential to generating superior long-term performance, especially in down markets.
Magnus Krantz, Portfolio Manager
Joy Budzinski, Portfolio Manager
Jeff Everett, Portfolio Manager
5 INVESCO OPPENHEIMER MAIN STREET ALL CAP FUND
Top Holdings and Allocations
TOP TEN COMMON STOCK HOLDINGS
| | | | |
| Microsoft Corp. | | | 5.4 | % |
| JPMorgan Chase & Co. | | | 4.8 | |
| Facebook, Inc., Cl. A | | | 3.3 | |
| Amazon.com, Inc. | | | 3.1 | |
| Alphabet, Inc., Cl. A | | | 3.0 | |
| Walmart, Inc. | | | 2.5 | |
| Verizon Communications, Inc. | | | 2.4 | |
| Duke Energy Corp. | | | 2.3 | |
| Apple, Inc. | | | 2.2 | |
| Mastercard, Inc., Cl. A | | | 2.1 | |
Holdings and allocations are subject to change and are not buy/sell recommendations. Percentages are as of October 31, 2019, and are based on net assets.
TOP TEN COMMON STOCK INDUSTRIES
| | | | |
| Commercial Banks | | | 8.0 | % |
| Interactive Media & Services | | | 7.1 | |
| Software | | | 5.9 | |
| Semiconductors & Semiconductor Equipment | | | 5.5 | |
| Specialty Retail | | | 5.4 | |
| Pharmaceuticals | | | 4.7 | |
| Health Care Equipment & Supplies | | | 4.7 | |
| Real Estate Investment Trusts (REITs) | | | 4.1 | |
| Oil, Gas & Consumable Fuels | | | 3.9 | |
| Insurance | | | 3.9 | |
Holdings and allocations are subject to change and are not buy/sell recommendations. Percentages are as of October 31, 2019, and are based on net assets.
SECTOR ALLOCATION
Holdings and allocations are subject to change and are not buy/sell recommendations. Percentages are as of October 31, 2019, and are based on total market value of investments.
For more current Fund holdings, please visit invesco.com.
6 INVESCO OPPENHEIMER MAIN STREET ALL CAP FUND
Share Class Performance
AVERAGE ANNUAL TOTAL RETURNS WITHOUT SALES CHARGE AS OF 10/31/19
| | | | | | | | | | | | | | | | |
| | | Inception
Date | | | 1-Year | | | 5-Year | | | 10-Year |
| Class A (OMSOX) | | | 9/25/00 | | | | 13.27 | % | | | 7.21 | % | | | 10.74 | % |
| Class C (OMSCX) | | | 9/25/00 | | | | 12.37 | | | | 6.40 | | | | 9.91 | |
| Class R (OMSNX) | | | 3/1/01 | | | | 12.90 | | | | 6.94 | | | | 10.44 | |
| Class Y (OMSYX) | | | 9/25/00 | | | | 13.48 | | | | 7.47 | | | | 11.05 | |
| Class R5* (MSAZX) | | | 5/24/19 | | | | 13.45 | | | | 7.24 | | | | 10.76 | |
| Class R6* (IOAPX) | | | 5/24/19 | | | | 13.45 | | | | 7.24 | | | | 10.76 | |
AVERAGE ANNUAL TOTAL RETURNS WITH SALES CHARGE AS OF 10/31/19
| | | | | | | | | | | | | | | | |
| | | Inception
Date | | | 1-Year | | | 5-Year | | | 10-Year |
| Class A (OMSOX) | | | 9/25/00 | | | | 7.06 | % | | | 6.00 | % | | | 10.12 | % |
| Class C (OMSCX) | | | 9/25/00 | | | | 11.37 | | | | 6.40 | | | | 9.91 | |
| Class R (OMSNX) | | | 3/1/01 | | | | 12.90 | | | | 6.94 | | | | 10.44 | |
| Class Y (OMSYX) | | | 9/25/00 | | | | 13.48 | | | | 7.47 | | | | 11.05 | |
| Class R5* (MSAZX) | | | 5/24/19 | | | | 13.45 | | | | 7.24 | | | | 10.76 | |
| Class R6* (IOAPX) | | | 5/24/19 | | | | 13.45 | | | | 7.24 | | | | 10.76 | |
* Class R5 and R6 shares’ performance shown prior to the inception date is that of the predecessor fund’s Class A shares at net asset value (NAV) and includes the12b-1 fees applicable to Class A shares. Class A shares’ performance reflects any applicable fee waivers and/or expense reimbursements.
Performance quoted is past performance and cannot guarantee comparable future results; current performance may be lower or higher. Visit invesco.com for the most recentmonth-end performance. Performance figures reflect reinvested distributions and changes in net asset value (NAV). Investment return and principal value will vary so that you may have a gain or a loss when you sell shares. Performance shown at NAV does not include the applicablefront-end sales charge, which would have reduced the performance. The current maximum initial sales charge for Class A shares is 5.50%, and the contingent deferred sales charge for Class C shares is 1% for the1-year period. Class R, Class Y, Class R5 and Class R6 shares have no sales charge; therefore, performance is at NAV. Effective after the close of business on May 24, 2019, Class A, Class C, Class R, Class Y, and Class I shares of the predecessor fund were reorganized into Class A, Class C, Class R, Class Y, and Class R6 shares, respectively, of the Fund. Class R5 shares’ performance shown prior to the inception date is that of the predecessor fund’s Class A shares at NAV and includes the12b-1 fees applicable to Class A shares. Class A shares’ performance reflects any applicable fee waivers and/or expense reimbursements. Returns shown for Class A, Class C, Class R, Class Y, Class R5, and Class R6 shares are blended returns of the predecessor fund and the Fund. Share class returns will differ from those of the predecessor fund because of different expenses. See Fund prospectuses and summary prospectuses for more information on share classes, sales charges and new fee agreements, if any. Fund literature is available at invesco.com.
The Fund’s performance is compared to the performance of the Russell 3000 Index. The Russell 3000 Index measures the performance of the largest 3,000 U.S. companies,
7 INVESCO OPPENHEIMER MAIN STREET ALL CAP FUND
representing approximately 98% of the investable U.S. equity market. The Index is unmanaged and cannot be purchased directly by investors. While index comparisons may be useful to provide a benchmark for the Fund’s performance, it must be noted that the Fund’s investments are not limited to the investments comprising the Index. Index performance includes reinvestment of income, but does not reflect transaction costs, fees, expenses or taxes. Index performance is shown for illustrative purposes only as a benchmark for the Fund’s performance, and does not predict or depict performance of the Fund. The Fund’s performance reflects the effects of the Fund’s business and operating expenses.
The views and opinions expressed in management’s discussion of Fund performance are those of Invesco Advisers, Inc. These views and opinions are subject to change at any time based on factors such as market and economic conditions. These views and opinions may not be relied upon as investment advice or recommendations, or as an offer for a particular security. The information is not a complete analysis of every aspect of any market, country, industry, security or the Fund. Statements of fact are from sources considered reliable, but Invesco Advisers, Inc. makes no representation or warranty as to their completeness or accuracy. Although historical performance is no guarantee of future results, these insights may help you understand our investment management philosophy.
Before investing, investors should carefully read the prospectus and/or summary prospectus and carefully consider the investment objectives, risks, charges and expenses. For this and more complete information about the fund(s), investors should ask their advisors for a prospectus/summary prospectus or visit invesco. com/fundprospectus.
Shares of Invesco funds are not deposits or obligations of any bank, are not guaranteed by any bank, are not insured by the FDIC or any other agency, and involve investment risks, including the possible loss of the principal amount invested.
8 INVESCO OPPENHEIMER MAIN STREET ALL CAP FUND
Fund Expenses
Fund Expenses. As a shareholder of the Fund, you incur two types of costs: (1) transaction costs, which may include sales charges (loads) on purchase payments and/or contingent deferred sales charges on redemptions; and (2) ongoing costs, including management fees; distribution and service fees; and other Fund expenses. These examples are intended to help you understand your ongoing costs (in dollars) of investing in the Fund and to compare these costs with the ongoing costs of investing in other mutual funds.
The examples are based on an investment of $1,000.00 invested at the beginning of the period and held for the entire6-month period ended October 31, 2019.
Actual Expenses. The first section of the table provides information about actual account values and actual expenses. You may use the information in this section for the class of shares you hold, together with the amount you invested, to estimate the expense that you paid over the period. Simply divide your account value by $1,000.00 (for example, an $8,600.00 account value divided by $1,000.00 = 8.60), then multiply the result by the number in the first section under the heading entitled “Expenses Paid During 6 Months Ended October 31, 2019” to estimate the expenses you paid on your account during this period.
Hypothetical Example for Comparison Purposes.The second section of the table provides information about hypothetical account values and hypothetical expenses based on the Fund’s actual expense ratio for each class of shares, and an assumed rate of return of 5% per year for each class before expenses, which is not the Fund’s actual return. The hypothetical account values and expenses may not be used to estimate the actual ending account balance or expenses you paid for the period. You may use this information to compare the ongoing costs of investing in the Fund and other funds. To do so, compare this 5% hypothetical example for the class of shares you hold with the 5% hypothetical examples that appear in the shareholder reports of the other funds.
Please note that the expenses shown in the table are meant to highlight your ongoing costs only and do not reflect any transactional costs, such asfront-end or contingent deferred sales charges (loads). Therefore, the “hypothetical” section of the table is useful in comparing ongoing costs only, and will not help you determine the relative total costs of owning different funds. In addition, if these transactional costs were included, your costs would have been higher.
9 INVESCO OPPENHEIMER MAIN STREET ALL CAP FUND
| | | | | | | | | | | | |
| Actual | | Beginning Account Value May 1, 2019 | | Ending Account Value October 31, 2019 | | Expenses Paid During 6 Months Ended October 31, 20191,2 |
| Class A | | $ | 1,000.00 | | | $ | 1,028.90 | | | $ | 5.85 | |
| Class C | | | 1,000.00 | | | | 1,024.60 | | | | 9.74 | |
| Class R | | | 1,000.00 | | | | 1,026.90 | | | | 7.18 | |
| Class Y | | | 1,000.00 | | | | 1,029.80 | | | | 4.67 | |
| Class R5 | | | 1,000.00 | | | | 1,030.50 | | | | 3.75 | |
| Class R6 | | | 1,000.00 | | | | 1,030.50 | | | | 3.74 | |
| | | |
| Hypothetical | | | | | | |
| (5% return before expenses) | | | | | | |
| Class A | | | 1,000.00 | | | | 1,019.46 | | | | 5.82 | |
| Class C | | | 1,000.00 | | | | 1,015.63 | | | | 9.70 | |
| Class R | | | 1,000.00 | | | | 1,018.15 | | | | 7.15 | |
| Class Y | | | 1,000.00 | | | | 1,020.62 | | | | 4.65 | |
| Class R5 | | | 1,000.00 | | | | 1,020.97 | | | | 4.29 | |
| Class R6 | | | 1,000.00 | | | | 1,021.53 | | | | 3.73 | |
1. Actual expenses paid for Class A, C, R, and Y are equal to the Fund’s annualized expense ratio for that class, multiplied by the average account value over the period, multiplied by 184/365 (to reflect theone-half year period). Actual expenses paid for Class R5 and R6 are equal to the Fund’s annualized expense ratio for that class, multiplied by the average account value over the period, multiplied by 160/365 to reflect the period from after the close of business on May 24, 2019 (inception of offering) to October 31, 2019.
2.Hypothetical expenses paid for all classes are equal to the Fund’s annualized expense ratio for that class, multiplied by the average account value over the period, multiplied by 184/365 (to reflect theone-half year period).
Those annualized expense ratios, excluding indirect expenses from affiliated funds, based on the6-month period ended October 31, 2019 for Classes A, C, R, and Y and for the period from after the close of business on May 24, 2019 (inception of offering) to October 31, 2019 for Classes R5 and R6 are as follows:
| | | | |
| Class | | Expense Ratios |
| Class A | | | 1.14 | % |
| Class C | | | 1.90 | |
| Class R | | | 1.40 | |
| Class Y | | | 0.91 | |
| Class R5 | | | 0.84 | |
| Class R6 | | | 0.73 | |
The expense ratios reflect voluntary and/or contractual waivers and/or reimbursements of expenses by the Fund’s Manager. Some of these undertakings may be modified or terminated at any time, as indicated in the Fund’s prospectus. The “Financial Highlights” tables in the
10 INVESCO OPPENHEIMER MAIN STREET ALL CAP FUND
Fund’s financial statements, included in this report, also show the gross expense ratios, without such waivers or reimbursements and reduction to custodian expenses, if applicable.
11 INVESCO OPPENHEIMER MAIN STREET ALL CAP FUND
SCHEDULE OF INVESTMENTSOctober 31, 2019
| | | | | | | | |
| | | Shares | | | Value |
| Common Stocks—98.9% | | | | | |
| Consumer Discretionary—21.3% | | | | | |
| Automobiles—0.7% | | | | | | | | |
| General Motors Co. | | | 208,580 | | | $ | 7,750,833 | |
| Entertainment—1.4% | | | | | | | | |
| Zynga, Inc., Cl. A1 | | | 2,540,520 | | | | 15,675,008 | |
| Hotels, Restaurants & Leisure—1.6% | | | | | |
| McDonald’s Corp. | | | 89,480 | | | | 17,600,716 | |
| Household Durables—0.8% | | | | | |
| DR Horton, Inc. | | | 177,160 | | | | 9,277,869 | |
| Interactive Media & Services—7.1% | | | | | |
| Alphabet, Inc., Cl. A1 | | | 26,702 | | | | 33,612,477 | |
| Facebook, Inc., Cl. A1 | | | 196,860 | | | | 37,728,219 | |
| Snap, Inc., Cl. A1 | | | 538,660 | | | | 8,112,220 | |
| | | | | | | 79,452,916 | |
| Internet & Catalog Retail—3.1% | | | | | |
| Amazon.com, Inc.1 | | | 19,582 | | | | 34,790,556 | |
| Specialty Retail—5.4% | | | | | |
| Burlington Stores, Inc.1 | | | 77,550 | | | | 14,902,783 | |
| CarMax, Inc.1 | | | 150,310 | | | | 14,004,383 | |
| Home Depot, Inc. (The) | | | 97,560 | | | | 22,885,625 | |
| O’Reilly Automotive, Inc.1 | | | 22,050 | | | | 9,602,996 | |
| | | | | | | 61,395,787 | |
| Textiles, Apparel & Luxury Goods—1.2% | |
| NIKE, Inc., Cl. B | | | 153,200 | | | | 13,719,060 | |
| Consumer Staples—7.2% | | | | | |
| Beverages—2.9% | | | | | | | | |
| Coca-Cola Co. (The) | | | 424,700 | | | | 23,116,421 | |
| Constellation Brands, Inc., Cl. A | | | 48,940 | | | | 9,314,750 | |
| | | | | | | 32,431,171 | |
| Food & Staples Retailing—2.5% | | | | | |
| Walmart, Inc. | | | 241,320 | | | | 28,297,183 | |
| Household Products—1.8% | | | | | |
| Procter & Gamble Co. (The) | | | 165,068 | | | | 20,552,617 | |
| Energy—4.4% | | | | | | | | |
| Energy Equipment & Services—0.5% | | | | | |
| Schlumberger Ltd. | | | 174,660 | | | | 5,709,635 | |
| | | | | | | | |
| | | Shares | | | Value |
| Oil, Gas & Consumable Fuels—3.9% | | | | | |
| Chevron Corp. | | | 90,740 | | | $ | 10,538,544 | |
| EQT Corp. | | | 313,009 | | | | 3,361,717 | |
| Exxon Mobil Corp. | | | 184,100 | | | | 12,439,637 | |
| Noble Energy, Inc. | | | 437,640 | | | | 8,428,946 | |
| Suncor Energy, Inc. | | | 327,260 | | | | 9,716,349 | |
| | | | | | | 44,485,193 | |
| Financials—17.7% | | | | | | | | |
| Capital Markets—1.7% | | | | | | | | |
| Intercontinental Exchange, Inc. | | | 138,860 | | | | 13,097,275 | |
| Tradeweb Markets, Inc., Cl. A | | | 131,400 | | | | 5,485,950 | |
| | | | | | | 18,583,225 | |
| Commercial Banks—8.0% | | | | | |
| East West Bancorp, Inc. | | | 247,455 | | | | 10,620,769 | |
| IBERIABANK Corp. | | | 117,090 | | | | 8,593,235 | |
| JPMorgan Chase & Co. | | | 435,911 | | | | 54,454,002 | |
| Signature Bank (New York) | | | 48,150 | | | | 5,697,108 | |
| SVB Financial Group1 | | | 47,479 | | | | 10,515,649 | |
| | | | | | | 89,880,763 | |
| Insurance—3.9% | | | | | | | | |
| Arthur J. Gallagher & Co. | | | 95,210 | | | | 8,685,056 | |
| Fidelity National Financial, Inc. | | | 288,380 | | | | 13,219,339 | |
| Progressive Corp. (The) | | | 88,090 | | | | 6,139,873 | |
| Prudential Financial, Inc. | | | 180,170 | | | | 16,420,694 | |
| | | | | | | 44,464,962 | |
| Real Estate Investment Trusts (REITs)—4.1% | |
| EPR Properties | | | 187,310 | | | | 14,570,845 | |
| Prologis, Inc. | | | 262,308 | | | | 23,020,150 | |
| SL Green Realty Corp. | | | 106,900 | | | | 8,936,840 | |
| | | | | | | 46,527,835 | |
| Health Care—12.6% | | | | | | | | |
| Biotechnology—1.1% | | | | | | | | |
| uniQure NV1 | | | 59,060 | | | | 2,955,362 | |
| Vertex Pharmaceuticals, Inc.1 | | | 49,630 | | | | 9,701,673 | |
| | | | | | | 12,657,035 | |
12 INVESCO OPPENHEIMER MAIN STREET ALL CAP FUND
| | | | | | | | |
| | | Shares | | | Value |
| Health Care Equipment & Supplies—4.7% | |
| Becton Dickinson & Co. | | | 57,660 | | | $ | 14,760,960 | |
| Boston Scientific Corp.1 | | | 270,800 | | | | 11,292,360 | |
| Intuitive Surgical, Inc.1 | | | 18,180 | | | | 10,052,631 | |
| Zimmer Biomet Holdings, Inc. | | | 116,550 | | | | 16,110,707 | |
| | | | | | | 52,216,658 | |
| Health Care Providers & Services—2.1% | |
| Anthem, Inc. | | | 66,490 | | | | 17,891,129 | |
| LHC Group, Inc.1 | | | 54,660 | | | | 6,065,620 | |
| | | | | | | 23,956,749 | |
| Pharmaceuticals—4.7% | | | | | | | | |
| AstraZeneca plc, Sponsored ADR | | | 202,110 | | | | 9,909,453 | |
| Johnson & Johnson | | | 161,610 | | | | 21,338,984 | |
| Merck & Co., Inc. | | | 248,710 | | | | 21,553,209 | |
| | | | | | | 52,801,646 | |
| Industrials—7.8% | | | | | | | | |
| Aerospace & Defense—1.4% | | | | | |
| Lockheed Martin Corp. | | | 42,700 | | | | 16,084,236 | |
| Airlines—0.6% | | | | | | | | |
| Spirit Airlines, Inc.1 | | | 175,425 | | | | 6,588,963 | |
| Commercial Services & Supplies—1.0% | | | | | |
| ACCO Brands Corp. | | | 737,363 | | | | 6,746,872 | |
| IAA, Inc.1 | | | 124,820 | | | | 4,761,883 | |
| | | | | | | 11,508,755 | |
| Industrial Conglomerates—1.4% | | | | | |
| Honeywell International, Inc. | | | 93,207 | | | | 16,099,645 | |
| Machinery—0.9% | | | | | | | | |
| Stanley Black & Decker, Inc. | | | 62,670 | | | | 9,483,851 | |
| Professional Services—0.8% | | | | | |
| Korn Ferry | | | 250,840 | | | | 9,203,320 | |
| Road & Rail—0.8% | | | | | | | | |
| Union Pacific Corp. | | | 53,540 | | | | 8,858,728 | |
| Trading Companies & Distributors—0.9% | |
| Fastenal Co. | | | 274,380 | | | | 9,861,217 | |
| Information Technology—19.8% | | | | | |
| Communications Equipment—1.8% | | | | | |
| Motorola Solutions, Inc. | | | 121,340 | | | | 20,181,269 | |
| | | | | | | | |
| | | Shares | | | Value |
| IT Services—3.7% | | | | | | | | |
| Fiserv, Inc.1 | | | 105,589 | | | $ | 11,207,216 | |
| Mastercard, Inc., Cl. A | | | 83,760 | | | | 23,185,606 | |
| Perspecta, Inc. | | | 276,048 | | | | 7,326,314 | |
| | | | | | | 41,719,136 | |
| Semiconductors & Semiconductor Equipment—5.5% | |
| Applied Materials, Inc. | | | 322,260 | | | | 17,485,828 | |
| NVIDIA Corp. | | | 107,760 | | | | 21,661,915 | |
| QUALCOMM, Inc. | | | 144,110 | | | | 11,592,208 | |
| Texas Instruments, Inc. | | | 98,430 | | | | 11,613,756 | |
| | | | | | | 62,353,707 | |
| Software—5.9% | | | | | | | | |
| Microsoft Corp. | | | 423,190 | | | | 60,672,751 | |
| Q2 Holdings, Inc.1 | | | 84,070 | | | | 6,010,164 | |
| | | | | | | 66,682,915 | |
| Technology Hardware, Storage & Peripherals—2.9% | |
| Apple, Inc. | | | 100,910 | | | | 25,102,371 | |
| Western Digital Corp. | | | 146,140 | | | | 7,548,131 | |
| | | | | | | 32,650,502 | |
| Materials—0.9% | | | | | | | | |
| Chemicals—0.9% | | | | | | | | |
| Eastman Chemical Co. | | | 139,520 | | | | 10,609,101 | |
| Telecommunication Services—2.4% | | | | | |
| Diversified Telecommunication Services—2.4% | |
| Verizon Communications, Inc. | | | 442,670 | | | | 26,768,255 | |
| Utilities—4.8% | | | | | | | | |
| Electric Utilities—2.3% | | | | | | | | |
| Duke Energy Corp. | | | 271,370 | | | | 25,579,336 | |
| Gas Utilities—0.8% | | | | | | | | |
| Suburban Propane Partners LP | | | 390,155 | | | | 9,441,751 | |
| Multi-Utilities—1.7% | | | | | | | | |
| Dominion Energy, Inc. | | | 229,160 | | | | 18,917,158 | |
Total Common Stocks
(Cost $918,806,471) | | | | | | | 1,114,819,262 | |
13 INVESCO OPPENHEIMER MAIN STREET ALL CAP FUND
SCHEDULE OF INVESTMENTSContinued
| | | | | | | | |
| | | Shares | | | Value |
| Investment Company—1.2% | | | | | |
Invesco Government & Agency Portfolio, Institutional Class, 1.71%2
(Cost $13,324,912) | | | 13,324,912 | | | $ | 13,324,912 | |
| | | | | | | | |
| | | Shares | | | Value |
Total Investments, at Value
(Cost $932,131,383) | | | 100.1% | | | $ | 1,128,144,174 | |
| Net Other Assets (Liabilities) | | | (0.1) | | | | (1,484,806 | ) |
| | | | |
| Net Assets | | | 100.0% | | | $ | 1,126,659,368 | |
| | | | |
Footnotes to Schedule of Investments
1.Non-income producing security.
2. The money market fund and the Fund are affiliated by having the same investment adviser. The rate shown is the7-day SEC standardized yield as of October 31, 2019.
| | |
| Glossary: | | |
| Definitions | | |
| ADR | | American Depositary Receipt |
See accompanying Notes to Financial Statements.
14 INVESCO OPPENHEIMER MAIN STREET ALL CAP FUND
STATEMENT OF ASSETS AND LIABILITIESOctober 31, 2019
| | | | |
| Assets | | | | |
| Investments, at value—see accompanying schedule of investments: | | | | |
| Unaffiliated companies (cost $918,806,471) | | $ | 1,114,819,262 | |
| Affiliated companies (cost $13,324,912) | | | 13,324,912 | |
| | | | |
| | | 1,128,144,174 | |
| |
| Cash | | | 500,000 | |
| |
| Receivables and other assets: | | | | |
| Dividends | | | 835,351 | |
| Shares of beneficial interest sold | | | 179,697 | |
| Other | | | 306,086 | |
| | | | |
| Total assets | | | 1,129,965,308 | |
| |
| Liabilities | | | | |
| Payables and other liabilities: | | | | |
| Investments purchased | | | 1,217,702 | |
| Shares of beneficial interest redeemed | | | 1,038,239 | |
| Transfer and shareholder servicing agent fees | | | 441,451 | |
| Distribution and service plan fees | | | 260,736 | |
| Trustees’ compensation | | | 137,219 | |
| Shareholder communications | | | 98,638 | |
| Advisory fees | | | 20,485 | |
| Due to advisor | | | 19,654 | |
| Administration fees | | | 442 | |
| Other | | | 71,374 | |
| | | | |
| Total liabilities | | | 3,305,940 | |
| |
| Net Assets | | $ | 1,126,659,368 | |
| | | | |
| | | | |
| |
| Composition of Net Assets | | | | |
| |
| Shares of beneficial interest | | $ | 923,532,060 | |
| |
| |
| Total distributable earnings | | | 203,127,308 | |
| | | | |
| Net Assets | | $ | 1,126,659,368 | |
| | | | |
15 INVESCO OPPENHEIMER MAIN STREET ALL CAP FUND
STATEMENT OF ASSETS AND LIABILITIESContinued
| | | | |
| Net Asset Value Per Share | | | | |
| |
| Class A Shares: | | | | |
| |
| Net asset value and redemption price per share (based on net assets of $957,528,534 and 51,688,581 shares of beneficial interest outstanding) | | $ | 18.53 | |
| Maximum offering price per share (net asset value plus sales charge of 5.50% of offering price) | | $ | 19.61 | |
| |
| Class C Shares: | | | | |
| |
| Net asset value, redemption price (excludes applicable contingent deferred sales charge) and offering price per share (based on net assets of $69,735,993 and 4,185,161 shares of beneficial interest outstanding) | | $ | 16.66 | |
| |
| Class R Shares: | | | | |
| |
| Net asset value, redemption price and offering price per share (based on net assets of $53,064,302 and 2,962,192 shares of beneficial interest outstanding) | | $ | 17.91 | |
| |
| Class Y Shares: | | | | |
| |
| Net asset value, redemption price and offering price per share (based on net assets of $46,308,872 and 2,435,615 shares of beneficial interest outstanding) | | $ | 19.01 | |
| |
| Class R5 Shares: | | | | |
| |
| Net asset value, redemption price and offering price per share (based on net assets of $10,832 and 583.771 shares of beneficial interest outstanding) | | $ | 18.56 | |
| |
| Class R6 Shares: | | | | |
| |
| Net asset value, redemption price and offering price per share (based on net assets of $10,835 and 583.771 shares of beneficial interest outstanding) | | $ | 18.56 | |
See accompanying Notes to Financial Statements.
16 INVESCO OPPENHEIMER MAIN STREET ALL CAP FUND
STATEMENT
OF OPERATIONS
| | | | | | |
| | | Three Months Ended October 31, 2019 | | Year Ended July 31, 2019 |
Investment Income | | | | | | |
| Dividends: | | | | | | |
| Unaffiliated companies (net of foreign withholding taxes of $15,526 and $79,347, respectively) | | $ | 5,212,770 | | | $ 20,716,349 |
| Affiliated companies | | | 91,721 | | | 485,444 |
| Interest | | | 44 | | | 20,363 |
| | | |
| Total investment income | | | 5,304,535 | | | 21,222,156 |
Expenses | | | | | | |
| Advisory fees | | | 1,866,758 | | | 7,666,930 |
| Administration fees | | | 40,315 | | | 13,745 |
| Distribution and service plan fees: | | | | | | |
| Class A | | | 571,869 | | | 2,111,995 |
| Class C | | | 178,954 | | | 1,746,028 |
| Class R | | | 67,360 | | | 272,287 |
| Transfer and shareholder servicing agent fees: | | | | | | |
| Class A | | | 458,683 | | | 1,685,177 |
| Class C | | | 34,180 | | | 340,649 |
| Class R | | | 25,732 | | | 106,909 |
| Class Y | | | 21,234 | | | 82,266 |
| Class R5 | | | 3 | | | 2 |
| Class R6 | | | 1 | | | 1 |
| Shareholder communications: | | | | | | |
| Class A | | | 61,150 | | | 44,615 |
| Class C | | | 4,505 | | | 7,717 |
| Class R | | | 3,406 | | | 2,456 |
| Class Y | | | 2,878 | | | 1,946 |
| Class R6 | | | 1 | | | — |
| Trustees’ compensation | | | 5,922 | | | 33,672 |
| Custodian fees and expenses | | | 1,575 | | | 6,425 |
| Borrowing fees | | | — | | | 26,669 |
| Other | | | 35,884 | | | 100,268 |
| | | |
| Total expenses | | | 3,380,410 | | | 14,249,757 |
| Less waivers and reimbursements of expenses | | | (4,752 | ) | | (22,138) |
| | | |
Net expenses | | | 3,375,658 | | | 14,227,619 |
Net Investment Income | | | 1,928,877 | | | 6,994,537 |
17 INVESCO OPPENHEIMER MAIN STREET ALL CAP FUND
STATEMENT
OF OPERATIONSContinued
| | | | | | |
| | | Three Months Ended October 31, 2019 | | Year Ended July 31, 2019 |
| Realized and Unrealized Gain (Loss) | | | | | | |
| Net realized gain (loss) on: | | | | | | |
| Investment transactions (includes net losses from securities sold to affiliates of $— and $(140,962), respectively) | | $ | 11,849,349 | | | $ 9,359,444 |
| Foreign currency transactions | | | — | | | (18,706) |
| | | |
| Net realized gain | | | 11,849,349 | | | 9,340,738 |
| Net change in unrealized appreciation/(depreciation) on: | | | | | | |
| Investment transactions | | | (300,650 | ) | | 44,103,838 |
| Translation of assets and liabilities denominated in foreign currencies | | | — | | | 5,867 |
| | | |
| Net change in unrealized appreciation/(depreciation) | | | (300,650 | ) | | 44,109,705 |
Net Increase in Net Assets Resulting from Operations | | $ | 13,477,576 | | | $ 60,444,980 |
| | | |
See accompanying Notes to Financial Statements.
18 INVESCO OPPENHEIMER MAIN STREET ALL CAP FUND
STATEMENT OF CHANGES IN NET ASSETS
| | | | | | | | |
| | | | | Three Months Ended October 31, 2019 | | Year Ended July 31, 2019 | | Year Ended July 31, 2018 |
Operations | | | | | | | | |
| Net investment income | | $ | | 1,928,877 | | $ 6,994,537 | | $ 4,544,714 |
| Net realized gain | | | | 11,849,349 | | 9,340,738 | | 81,650,047 |
| Net change in unrealized appreciation/(depreciation) | | | | (300,650) | | 44,109,705 | | 37,166,460 |
| | |
| Net increase in net assets resulting from operations | | | | 13,477,576 | | 60,444,980 | | 123,361,221 |
Dividends and/or Distributions to Shareholders | | | | | | | | |
| Distributions to shareholders from distributable earnings: | | | | | | | | |
| Class A | | | | — | | (64,129,025) | | (117,170,106) |
| Class B | | | | — | | — | | (599,823) |
| Class C | | | | — | | (14,411,614) | | (27,982,587) |
| Class R | | | | — | | (4,069,768) | | (7,544,826) |
| Class Y | | | | — | | (3,096,787) | | (5,612,493) |
| Class R5 | | | | — | | — | | — |
| Class R6 | | | | — | | — | | — |
| | |
| Total distributions from distributable earnings | | | | — | | (85,707,194) | | (158,909,835) |
Beneficial Interest Transactions | | | | | | | | |
| Net increase (decrease) in net assets resulting from beneficial interest transactions: | | | | | | | | |
| Class A | | | | (30,136,411) | | 67,261,954 | | 28,094,931 |
| Class B | | | | — | | — | | (8,237,758) |
| Class C | | | | (4,373,259) | | (119,526,083) | | (9,531,397) |
| Class R | | | | (2,816,900) | | (1,837,777) | | (2,354,763) |
| Class Y | | | | 1,006,663 | | 2,830,296 | | (373,132) |
| Class R5 | | | | — | | 10,000 | | — |
| Class R6 | | | | — | | 10,000 | | — |
| | |
| Total beneficial interest transactions | | | | (36,319,907) | | (51,251,610) | | 7,597,881 |
| Net Assets | | | | | | | | |
| Total decrease | | | | (22,842,331) | | (76,513,824) | | (27,950,733) |
| Beginning of period | | | | 1,149,501,699 | | 1,226,015,523 | | 1,253,966,256 |
| | |
| End of period | | $ | | 1,126,659,368 | | $ 1,149,501,699 | | $ 1,226,015,523 |
| | |
See accompanying Notes to Financial Statements.
19 INVESCO OPPENHEIMER MAIN STREET ALL CAP FUND
FINANCIAL HIGHLIGHTS
| | | | | | | | | | | | | | | | | | | | | | | | |
| Class A | | Three Months Ended
October 31, 2019 | | | Year Ended July 31, 2019 | | | Year Ended July 31, 2018 | | | Year Ended July 31, 2017 | | | Year Ended July 31, 2016 | | | Year Ended July 31, 2015 | |
Per Share Operating Data | | | | | | | | | | | | | | | | | | | | | | | | |
| Net asset value, beginning of period | | | $18.30 | | | | $18.77 | | | | $19.40 | | | | $18.35 | | | | $20.29 | | | | $19.09 | |
| Income (loss) from investment operations: | | | | | | | | | | | | | | | | | | | | | | | | |
| Net investment income1 | | | 0.03 | | | | 0.13 | | | | 0.09 | | | | 0.17 | | | | 0.14 | | | | 0.10 | |
| Net realized and unrealized gain | | | 0.20 | | | | 0.75 | | | | 1.84 | | | | 2.21 | | | | 0.002 | | | | 1.17 | |
| Total from investment operations | | | 0.23 | | | | 0.88 | | | | 1.93 | | | | 2.38 | | | | 0.14 | | | | 1.27 | |
| Dividends and/or distributions to shareholders: | | | | | | | | | | | | | | | | | | | | | | | | |
| Dividends from net investment income | | | 0.00 | | | | (0.07) | | | | (0.18) | | | | (0.20) | | | | (0.10) | | | | (0.07) | |
| Distributions from net realized gain | | | 0.00 | | | | (1.28) | | | | (2.38) | | | | (1.13) | | | | (1.98) | | | | 0.00 | |
| Total dividends and/or distributions to shareholders | | | 0.00 | | | | (1.35) | | | | (2.56) | | | | (1.33) | | | | (2.08) | | | | (0.07) | |
| Net asset value, end of period | | | $18.53 | | | | $18.30 | | | | $18.77 | | | | $19.40 | | | | $18.35 | | | | $20.29 | |
| | | | |
| | | | | | | | | | | | | | | | | | | | | | | | |
| Total Return, at Net Asset Value3 | | | 1.26% | | | | 5.84% | | | | 10.55% | | | | 13.67% | | | | 1.26% | | | | 6.67% | |
| | | | | | | | | | | | | | | | | | | | | | | | |
| Ratios/Supplemental Data | | | | | | | | | | | | | | | | | | | | | | | | |
| Net assets, end of period (in thousands) | | | $957,529 | | | | $976,093 | | | | $923,741 | | | | $919,892 | | | | $927,091 | | | | $1,038,270 | |
| Average net assets (in thousands) | | | $954,192 | | | | $867,734 | | | | $924,084 | | | | $915,013 | | | | $930,473 | | | | $1,083,643 | |
| Ratios to average net assets:4 | | | | | | | | | | | | | | | | | | | | | | | | |
| Net investment income | | | 0.73% | | | | 0.73% | | | | 0.50% | | | | 0.92% | | | | 0.80% | | | | 0.51% | |
| Expenses excluding specific expenses listed below | | | 1.14% | | | | 1.13% | | | | 1.14% | | | | 1.15% | | | | 1.14% | | | | 1.14% | |
| Interest and fees from borrowings | | | 0.00% | | | | 0.00%5 | | | | 0.00%5 | | | | 0.00%5 | | | | 0.00%5 | | | | 0.00%5 | |
| Total expenses6 | | | 1.14% | | | | 1.13% | | | | 1.14% | | | | 1.15% | | | | 1.14% | | | | 1.14% | |
| Expenses after payments, waivers and/or reimbursements and reduction to custodian expenses | | | 1.14%7 | | | | 1.13%7 | | | | 1.13% | | | | 1.14% | | | | 1.14%7 | | | | 1.14%7 | |
| Portfolio turnover rate8 | | | 7% | | | | 48% | | | | 48% | | | | 89% | | | | 67% | | | | 74% | |
20 INVESCO OPPENHEIMER MAIN STREET ALL CAP FUND
1. Per share amounts calculated based on the average shares outstanding during the period.
2. Less than $0.005 per share.
3. Includes adjustments in accordance with accounting principles generally accepted in the United States of America and as such, the net asset value for financial reporting purposes and the returns based upon those net asset values may differ from the net asset value and returns for shareholder transactions. Does not include sales charges and is not annualized for periods less than one year, if applicable.
4. Annualized for periods less than one full year.
5. Less than 0.005%.
6. Total expenses including indirect expenses from affiliated fund fees and expenses were as follows:
| | | | | | |
| Three Months Ended October 31, 2019 | | | 1.14 | % | | |
| Year Ended July 31, 2019 | | | 1.13 | % | | |
| Year Ended July 31, 2018 | | | 1.14 | % | | |
| Year Ended July 31, 2017 | | | 1.15 | % | | |
| Year Ended July 31, 2016 | | | 1.14 | % | | |
| Year Ended July 31, 2015 | | | 1.14 | % | | |
7. Waiver was less than 0.005%.
8. Portfolio turnover is calculated at the fund level and is not annualized for periods less than one year, if applicable.
See accompanying Notes to Financial Statements.
21 INVESCO OPPENHEIMER MAIN STREET ALL CAP FUND
FINANCIAL HIGHLIGHTSContinued
| | | | | | | | | | | | | | | | | | | | | | | | |
| Class C | | Three Months Ended October 31, 2019 | | | Year Ended July 31, 2019 | | | Year Ended July 31, 2018 | | | Year Ended July 31, 2017 | | | Year Ended
July 31, 2016 | | | Year Ended
July 31, 2015 | |
| Per Share Operating Data | | | | | | | | | | | | | | | | | | | | | | | | |
| Net asset value, beginning of period | | | $16.49 | | | | $17.10 | | | | $17.88 | | | | $17.01 | | | | $19.00 | | | | $17.95 | |
| Income (loss) from investment operations: | | | | | | | | | | | | | | | | | | | | | | | | |
| Net investment income (loss)1 | | | 0.002 | | | | (0.00)2 | | | | (0.04) | | | | 0.03 | | | | 0.01 | | | | (0.05) | |
| Net realized and unrealized gain (loss) | | | 0.17 | | | | 0.67 | | | | 1.68 | | | | 2.04 | | | | (0.02) | | | | 1.10 | |
| Total from investment operations | | | 0.17 | | | | 0.67 | | | | 1.64 | | | | 2.07 | | | | (0.01) | | | | 1.05 | |
| Dividends and/or distributions to shareholders: | | | | | | | | | | | | | | | | | | | | | | | | |
| Dividends from net investment income | | | 0.00 | | | | 0.00 | | | | (0.04) | | | | (0.07) | | | | 0.00 | | | | (0.00)2 | |
| Distributions from net realized gain | | | 0.00 | | | | (1.28) | | | | (2.38) | | | | (1.13) | | | | (1.98) | | | | 0.00 | |
| Total dividends and/or distributions to shareholders | | | 0.00 | | | | (1.28) | | | | (2.42) | | | | (1.20) | | | | (1.98) | | | | (0.00)2 | |
| Net asset value, end of period | | | $16.66 | | | | $16.49 | | | | $17.10 | | | | $17.88 | | | | $17.01 | | | | $19.00 | |
| | | | |
| | | | | | | | | | | | | | | | | | | | | | | | |
| Total Return, at Net Asset Value3 | | | 1.03% | | | | 5.18% | | | | 9.67% | | | | 12.84% | | | | 0.48% | | | | 5.86% | |
| | | | | | | | | | | | | | | | | | | | | | | | |
| Ratios/Supplemental Data | | | | | | | | | | | | | | | | | | | | | | | | |
| Net assets, end of period (in thousands) | | | $69,736 | | | | $73,404 | | | | $201,771 | | | | $219,426 | | | | $228,811 | | | | $260,200 | |
| Average net assets (in thousands) | | | $71,061 | | | | $174,644 | | | | $212,553 | | | | $221,928 | | | | $232,194 | | | | $269,678 | |
| Ratios to average net assets:4 | | | | | | | | | | | | | | | | | | | | | | | | |
| Net investment income (loss) | | | (0.03)% | | | | (0.02)% | | | | (0.25)% | | | | 0.17% | | | | 0.05% | | | | (0.25)% | |
| Expenses excluding specific expenses listed below | | | 1.90% | | | | 1.89% | | | | 1.89% | | | | 1.90% | | | | 1.89% | | | | 1.90% | |
| Interest and fees from borrowings | | | 0.00% | | | | 0.00%5 | | | | 0.00%5 | | | | 0.00%5 | | | | 0.00%5 | | | | 0.00%5 | |
| Total expenses6 | | | 1.90% | | | | 1.89% | | | | 1.89% | | | | 1.90% | | | | 1.89% | | | | 1.90% | |
| Expenses after payments, waivers and/or reimbursements and reduction to custodian expenses | | | 1.90%7 | | | | 1.89%7 | | | | 1.88% | | | | 1.89% | | | | 1.89%7 | | | | 1.90%7 | |
| Portfolio turnover rate8 | | | 7% | | | | 48% | | | | 48% | | | | 89% | | | | 67% | | | | 74% | |
22 INVESCO OPPENHEIMER MAIN STREET ALL CAP FUND
1. Per share amounts calculated based on the average shares outstanding during the period.
2. Less than $0.005 per share.
3. Includes adjustments in accordance with accounting principles generally accepted in the United States of America and as such, the net asset value for financial reporting purposes and the returns based upon those net asset values may differ from the net asset value and returns for shareholder transactions. Does not include sales charges and is not annualized for periods less than one year, if applicable.
4. Annualized for periods less than one full year.
5. Less than 0.005%.
6. Total expenses including indirect expenses from affiliated fund fees and expenses were as follows:
| | | | | | |
| Three Months Ended October 31, 2019 | | | 1.90 | % | | |
| Year Ended July 31, 2019 | | | 1.89 | % | | |
| Year Ended July 31, 2018 | | | 1.89 | % | | |
| Year Ended July 31, 2017 | | | 1.90 | % | | |
| Year Ended July 31, 2016 | | | 1.89 | % | | |
| Year Ended July 31, 2015 | | | 1.90 | % | | |
7. Waiver was less than 0.005%.
8.Portfolio turnover is calculated at the fund level and is not annualized for periods less than one year, if applicable.
See accompanying Notes to Financial Statements.
23 INVESCO OPPENHEIMER MAIN STREET ALL CAP FUND
FINANCIAL HIGHLIGHTSContinued
| | | | | | | | | | | | | | | | | | | | | | | | |
| Class R | | Three Months Ended October 31, 2019 | | | Year Ended July 31, 2019 | | | Year Ended
July 31, 2018 | | | Year Ended
July 31, 2017 | | | Year Ended
July 31, 2016 | | | Year Ended
July 31, 2015 | |
| Per Share Operating Data | | | | | | | | | | | | | | | | | | | | | | | | |
| Net asset value, beginning of period | | | $17.70 | | | | $18.20 | | | | $18.88 | | | | $17.89 | | | | $19.83 | | | | $18.65 | |
| Income (loss) from investment operations: | | | | | | | | | | | | | | | | | | | | | | | | |
| Net investment income1 | | | 0.02 | | | | 0.08 | | | | 0.05 | | | | 0.12 | | | | 0.10 | | | | 0.05 | |
| Net realized and unrealized gain (loss) | | | 0.19 | | | | 0.73 | | | | 1.78 | | | | 2.16 | | | | (0.02) | | | | 1.15 | |
| Total from investment operations | | | 0.21 | | | | 0.81 | | | | 1.83 | | | | 2.28 | | | | 0.08 | | | | 1.20 | |
| Dividends and/or distributions to shareholders: | | | | | | | | | | | | | | | | | | | | | | | | |
| Dividends from net investment income | | | 0.00 | | | | (0.03) | | | | (0.13) | | | | (0.16) | | | | (0.04) | | | | (0.02) | |
| Distributions from net realized gain | | | 0.00 | | | | (1.28) | | | | (2.38) | | | | (1.13) | | | | (1.98) | | | | 0.00 | |
| Total dividends and/or distributions to shareholders | | | 0.00 | | | | (1.31) | | | | (2.51) | | | | (1.29) | | | | (2.02) | | | | (0.02) | |
| Net asset value, end of period | | | $17.91 | | | | $17.70 | | | | $18.20 | | | | $18.88 | | | | $17.89 | | | | $19.83 | |
| | | | |
| | | | | | | | | | | | | | | | | | | | | | | | |
| Total Return, at Net Asset Value2 | | | 1.19% | | | | 5.63% | | | | 10.27% | | | | 13.40% | | | | 0.96% | | | | 6.43% | |
| | | | | | | | | | | | | | | | | | | | | | | | |
| Ratios/Supplemental Data | | | | | | | | | | | | | | | | | | | | | | | | |
| Net assets, end of period (in thousands) | | | $53,064 | | | | $55,265 | | | | $58,150 | | | | $62,250 | | | | $61,124 | | | | $74,477 | |
| Average net assets (in thousands) | | | $53,484 | | | | $55,022 | | | | $59,234 | | | | $60,661 | | | | $64,020 | | | | $82,378 | |
| Ratios to average net assets:3 | | | | | | | | | | | | | | | | | | | | | | | | |
| Net investment income | | | 0.47% | | | | 0.48% | | | | 0.25% | | | | 0.67% | | | | 0.55% | | | | 0.26% | |
| Expenses excluding specific expenses listed below | | | 1.40% | | | | 1.38% | | | | 1.39% | | | | 1.40% | | | | 1.39% | | | | 1.39% | |
| Interest and fees from borrowings | | | 0.00% | | | | 0.00%4 | | | | 0.00%4 | | | | 0.00%4 | | | | 0.00%4 | | | | 0.00%4 | |
| Total expenses5 | | | 1.40% | | | | 1.38% | | | | 1.39% | | | | 1.40% | | | | 1.39% | | | | 1.39% | |
| Expenses after payments, waivers and/or reimbursements and reduction to custodian expenses | | | 1.40%6 | | | | 1.38%6 | | | | 1.38% | | | | 1.39% | | | | 1.39%6 | | | | 1.39%6 | |
| Portfolio turnover rate7 | | | 7% | | | | 48% | | | | 48% | | | | 89% | | | | 67% | | | | 74% | |
24 INVESCO OPPENHEIMER MAIN STREET ALL CAP FUND
1. Per share amounts calculated based on the average shares outstanding during the period.
2. Includes adjustments in accordance with accounting principles generally accepted in the United States of America and as such, the net asset value for financial reporting purposes and the returns based upon those net asset values may differ from the net asset value and returns for shareholder transactions. Does not include sales charges and is not annualized for periods less than one year, if applicable.
3. Annualized for periods less than one full year.
4. Less than 0.005%.
5. Total expenses including indirect expenses from affiliated fund fees and expenses were as follows:
| | | | | | |
| Three Months Ended October 31, 2019 | | | 1.40 | % | | |
| Year Ended July 31, 2019 | | | 1.38 | % | | |
| Year Ended July 31, 2018 | | | 1.39 | % | | |
| Year Ended July 31, 2017 | | | 1.40 | % | | |
| Year Ended July 31, 2016 | | | 1.39 | % | | |
| Year Ended July 31, 2015 | | | 1.39 | % | | |
6. Waiver was less than 0.005%.
7. Portfolio turnover is calculated at the fund level and is not annualized for periods less than one year, if applicable.
See accompanying Notes to Financial Statements.
25 INVESCO OPPENHEIMER MAIN STREET ALL CAP FUND
FINANCIAL HIGHLIGHTSContinued
| | | | | | | | | | | | | | | | | | | | | | | | |
| Class Y | | Three Months Ended October 31, 2019 | | | Year Ended July 31, 2019 | | | Year Ended July 31, 2018 | | | Year Ended July 31, 2017 | | | Year Ended July 31, 2016 | | | Year Ended July 31, 2015 | |
| | | | | | | |
| Per Share Operating Data | | | | | | | | | | | | | | | | | | | | | | | | |
| Net asset value, beginning of period | | | $18.77 | | | | $19.22 | | | | $19.81 | | | | $18.70 | | | | $20.65 | | | | $19.43 | |
| Income (loss) from investment operations: | | | | | | | | | | | | | | | | | | | | | | | | |
| Net investment income1 | | | 0.05 | | | | 0.18 | | | | 0.14 | | | | 0.22 | | | | 0.19 | | | | 0.15 | |
| Net realized and unrealized gain (loss) | | | 0.19 | | | | 0.77 | | | | 1.88 | | | | 2.26 | | | | (0.02) | | | | 1.19 | |
| Total from investment operations | | | 0.24 | | | | 0.95 | | | | 2.02 | | | | 2.48 | | | | 0.17 | | | | 1.34 | |
| Dividends and/or distributions to shareholders: | | | | | | | | | | | | | | | | | | | | | | | | |
| Dividends from net investment income | | | 0.00 | | | | (0.12) | | | | (0.23) | | | | (0.24) | | | | (0.14) | | | | (0.12) | |
| Distributions from net realized gain | | | 0.00 | | | | (1.28) | | | | (2.38) | | | | (1.13) | | | | (1.98) | | | | 0.00 | |
| Total dividends and/or distributions to shareholders | | | 0.00 | | | | (1.40) | | | | (2.61) | | | | (1.37) | | | | (2.12) | | | | (0.12) | |
| Net asset value, end of period | | | $19.01 | | | | $18.77 | | | | $19.22 | | | | $19.81 | | | | $18.70 | | | | $20.65 | |
| | | | | | | | | | | | | | | | | | | | | | | | |
| | | | | | | | | | | | | | | | | | | | | | | | |
| Total Return, at Net Asset Value2 | | | 1.28% | | | | 6.11% | | | | 10.84% | | | | 13.96% | | | | 1.43% | | | | 6.95% | |
| | | | | | | | | | | | | | | | | | | | | | | | |
| | | | | | | |
| Ratios/Supplemental Data | | | | | | | | | | | | | | | | | | | | | | | | |
| Net assets, end of period (in thousands) | | | $46,309 | | | | $44,719 | | | | $42,354 | | | | $43,905 | | | | $32,254 | | | | $53,018 | |
| Average net assets (in thousands) | | | $44,205 | | | | $42,369 | | | | $43,351 | | | | $32,465 | | | | $37,452 | | | | $55,960 | |
| Ratios to average net assets:3 | | | | | | | | | | | | | | | | | | | | | | | | |
| Net investment income | | | 0.97% | | | | 0.98% | | | | 0.74% | | | | 1.15% | | | | 1.05% | | | | 0.75% | |
| Expenses excluding specific expenses listed below | | | 0.91% | | | | 0.89% | | | | 0.89% | | | | 0.91% | | | | 0.89% | | | | 0.89% | |
| Interest and fees from borrowings | | | 0.00% | | | | 0.00%4 | | | | 0.00%4 | | | | 0.00%4 | | | | 0.00%4 | | | | 0.00%4 | |
| Total expenses5 | | | 0.91% | | | | 0.89% | | | | 0.89% | | | | 0.91% | | | | 0.89% | | | | 0.89% | |
| Expenses after payments, waivers and/or reimbursements and reduction to custodian expenses | |
| 0.91%6
|
| |
| 0.89%6
|
| | | 0.88% | | | | 0.90% | | |
| 0.89%6
|
| |
| 0.89%6
|
|
| Portfolio turnover rate7 | | | 7% | | | | 48% | | | | 48% | | | | 89% | | | | 67% | | | | 74% | |
26 INVESCO OPPENHEIMER MAIN STREET ALL CAP FUND
1. Per share amounts calculated based on the average shares outstanding during the period.
2. Includes adjustments in accordance with accounting principles generally accepted in the United States of America and as such, the net asset value for financial reporting purposes and the returns based upon those net asset values may differ from the net asset value and returns for shareholder transactions. Does not include sales charges and is not annualized for periods less than one year, if applicable.
3. Annualized for periods less than one full year.
4. Less than 0.005%.
5. Total expenses including indirect expenses from affiliated fund fees and expenses were as follows:
| | | | | | |
| Three Months Ended October 31, 2019 | | | 0.91 | % | | |
| Year Ended July 31, 2019 | | | 0.89 | % | | |
| Year Ended July 31, 2018 | | | 0.89 | % | | |
| Year Ended July 31, 2017 | | | 0.91 | % | | |
| Year Ended July 31, 2016 | | | 0.89 | % | | |
| Year Ended July 31, 2015 | | | 0.89 | % | | |
6. Waiver was less than 0.005%.
7. Portfolio turnover is calculated at the fund level and is not annualized for periods less than one year, if applicable.
See accompanying Notes to Financial Statements.
27 INVESCO OPPENHEIMER MAIN STREET ALL CAP FUND
FINANCIAL HIGHLIGHTSContinued
| | | | | | | | |
| Class R5 | | Three Months Ended October 31, 2019 | | Period Ended July 31, 20191 |
Per Share Operating Data | | | | | | | | |
| Net asset value, beginning of period | | | $18.31 | | | | $17.13 | |
| Income (loss) from investment operations: | | | | | | | | |
| Net investment income2 | | | 0.05 | | | | 0.04 | |
| Net realized and unrealized gain | | | 0.20 | | | | 1.14 | |
| Total from investment operations | | | 0.25 | | | | 1.18 | |
| Dividends and/or distributions to shareholders: | | | | | | | | |
| Dividends from net investment income | | | 0.00 | | | | 0.00 | |
| Distributions from net realized gain | | | 0.00 | | | | 0.00 | |
| Total dividends and/or distributions to shareholders | | | 0.00 | | | | 0.00 | |
| Net asset value, end of period | | | $18.56 | | | | $18.31 | |
| | | | |
| | | | | | | | |
| Total Return, at Net Asset Value3 | | | 1.37% | | | | 6.89% | |
| | | | | | | | |
Ratios/Supplemental Data | | | | | | | | |
| Net assets, end of period (in thousands) | | | $11 | | | | $11 | |
| Average net assets (in thousands) | | | $11 | | | | $10 | |
| Ratios to average net assets:4 | | | | | | | | |
| Net investment income | | | 1.04% | | | | 1.07% | |
| Expenses excluding specific expenses listed below | | | 0.84% | | | | 0.79% | |
| Interest and fees from borrowings | | | 0.00% | | | | 0.00% | |
| Total expenses5 | | | 0.84% | | | | 0.79% | |
| Expenses after payments, waivers and/or reimbursements and reduction to custodian expenses | | | 0.84% | 6 | | | 0.79% | 6 |
| Portfolio turnover rate7 | | | 7% | | | | 48% | |
1. For the period from after the close of business on May 24, 2019 (inception of offering) to July 31, 2019.
2. Per share amounts calculated based on the average shares outstanding during the period.
3. Includes adjustments in accordance with accounting principles generally accepted in the United States of America and as such, the net asset value for financial reporting purposes and the returns based upon those net asset values may differ from the net asset value and returns for shareholder transactions. Does not include sales charges and is not annualized for periods less than one year, if applicable.
4. Annualized for periods less than one full year.
5. Total expenses including indirect expenses from affiliated fund fees and expenses were as follows:
| | | | | | |
| Three Months Ended October 31, 2019 | | | 0.84 | % | | |
| Period Ended July 31, 2019 | | | 0.79 | % | | |
6. Waiver was less than 0.005%.
7. Portfolio turnover is calculated at the fund level and is not annualized for periods less than one year, if applicable.
See accompanying Notes to Financial Statements.
28 INVESCO OPPENHEIMER MAIN STREET ALL CAP FUND
| | | | | | | | |
| Class R6 | | Three Months Ended October 31, 2019 | | Period Ended July 31, 20191 |
Per Share Operating Data | | | | | | | | |
| Net asset value, beginning of period | | | $18.31 | | | | $17.13 | |
| Income (loss) from investment operations: | | | | | | | | |
| Net investment income2 | | | 0.05 | | | | 0.04 | |
| Net realized and unrealized gain | | | 0.20 | | | | 1.14 | |
| Total from investment operations | | | 0.25 | | | | 1.18 | |
| Dividends and/or distributions to shareholders: | | | | | | | | |
| Dividends from net investment income | | | 0.00 | | | | 0.00 | |
| Distributions from net realized gain | | | 0.00 | | | | 0.00 | |
| Total dividends and/or distributions to shareholders | | | 0.00 | | | | 0.00 | |
| Net asset value, end of period | | | $18.56 | | | | $18.31 | |
| | | | |
| | | | | | | | |
| Total Return, at Net Asset Value3 | | | 1.37% | | | | 6.89% | |
| | | | | | | | |
Ratios/Supplemental Data | | | | | | | | |
| Net assets, end of period (in thousands) | | | $11 | | | | $11 | |
| Average net assets (in thousands) | | | $11 | | | | $10 | |
| Ratios to average net assets:4 | | | | | | | | |
| Net investment income | | | 1.15% | | | | 1.12% | |
| Expenses excluding specific expenses listed below | | | 0.73% | | | | 0.74% | |
| Interest and fees from borrowings | | | 0.00% | | | | 0.00% | |
| Total expenses5 | | | 0.73% | | | | 0.74% | |
| Expenses after payments, waivers and/or reimbursements and reduction to custodian expenses | | | 0.73% | 6 | | | 0.74% | 6 |
| Portfolio turnover rate7 | | | 7% | | | | 48% | |
1. For the period from after the close of business on May 24, 2019 (inception of offering) to July 31, 2019.
2. Per share amounts calculated based on the average shares outstanding during the period.
3. Includes adjustments in accordance with accounting principles generally accepted in the United States of America and as such, the net asset value for financial reporting purposes and the returns based upon those net asset values may differ from the net asset value and returns for shareholder transactions. Does not include sales charges and is not annualized for periods less than one year, if applicable.
4. Annualized for periods less than one full year.
5. Total expenses including indirect expenses from affiliated fund fees and expenses were as follows:
| | | | | | |
| Three Months Ended October 31, 2019 | | | 0.73 | % | | |
| Period Ended July 31, 2019 | | | 0.74 | % | | |
6. Waiver was less than 0.005%.
7. Portfolio turnover is calculated at the fund level and is not annualized for periods less than one year, if applicable.
See accompanying Notes to Financial Statements.
29 INVESCO OPPENHEIMER MAIN STREET ALL CAP FUND
NOTES TO FINANCIAL STATEMENTSOctober 31, 2019
Note 1 - Significant Accounting Policies
Invesco Oppenheimer Main Street All Cap Fund (the “Fund”) is a series portfolio of AIM Equity Funds (Invesco Equity Funds) (the “Trust”). The Trust is a Delaware statutory trust registered under the Investment Company Act of 1940, as amended (the “1940 Act”), as anopen-end series management investment company authorized to issue an unlimited number of shares of beneficial interest. Information presented in these financial statements pertains only to the Fund. Matters affecting the Fund or each class will be voted on exclusively by the shareholders of such Fund or each class.
Prior to the close of business on May 24, 2019, the Fund operated as Oppenheimer Main Street All Cap Fund (the “Acquired Fund” or “Predecessor Fund”). The Acquired Fund was reorganized after the close of business on May 24, 2019 (the “Reorganization Date”) through the transfer of all of its assets and liabilities to the Fund (the “Reorganization”).
Upon closing of the Reorganization, holders of the Acquired Fund’s Class A, Class C, Class R, and Class Y shares received the corresponding class of shares of the Fund. Class R5 and Class R6 shares commenced operations on the Reorganization Date.
Effective October 31, 2019, the Fund’s fiscal year end changed from July 31 to October 31.
The Fund’s investment objective is to seek capital appreciation.
The Fund currently consists of six different classes of shares: Class A, Class C, Class R, Class Y, Class R5 and Class R6. Class Y shares are available only to certain investors. Class A shares are sold with afront-end sales charge unless certain waiver criteria are met and under certain circumstances load waived shares may be subject to contingent deferred sales charges (“CDSC”). Class C shares are sold with a CDSC. Class R, Class Y, Class R5 and Class R6 shares are sold at net asset value. Class C shares held for ten years after purchase are eligible for automatic conversion into class A shares of the same Fund (the “Conversion Feature”). The automatic conversion pursuant to the Conversion Feature will generally occur at the end of the month following the tenth anniversary after a purchase of Class C shares.
The Fund is an investment company and accordingly follows the investment company accounting and reporting guidance in accordance with Financial Accounting Standards Board Accounting Standards Codification Topic 946, Financial Services – Investment Companies.
The following is a summary of the significant accounting policies followed by the Fund in the preparation of its financial statements.
A. Security Valuations– Securities, including restricted securities, are valued according to the following policy.
A security listed or traded on an exchange (except convertible securities) is valued at its last sales price or official closing price as of the close of the customary trading session on the exchange where the security is principally traded, or lacking any sales or official closing price on a particular day, the security may be valued at the closing bid price on that day. Securities traded in theover-the-counter market are valued based on prices furnished by independent pricing services or market makers. When such securities are valued by an independent pricing service they may be considered fair valued. Futures contracts are valued at the final settlement price set by an exchange on which they are principally traded. Listed options are valued at the mean between the last bid and asked prices from the exchange
30 INVESCO OPPENHEIMER MAIN STREET ALL CAP FUND
on which they are principally traded. Options not listed on an exchange are valued by an independent source at the mean between the last bid and asked prices. For purposes of determining net asset value (“NAV”) per share, futures and option contracts generally are valued 15 minutes after the close of the customary trading session of the New York Stock Exchange (“NYSE”).
Investments inopen-end andclosed-end registered investment companies that do not trade on an exchange are valued at theend-of-day net asset value per share. Investments inopen-end andclosed-end registered investment companies that trade on an exchange are valued at the last sales price or official closing price as of the close of the customary trading session on the exchange where the security is principally traded.
Debt obligations (including convertible securities) and unlisted equities are fair valued using an evaluated quote provided by an independent pricing service. Evaluated quotes provided by the pricing service may be determined without exclusive reliance on quoted prices, and may reflect appropriate factors such asinstitution-size trading in similar groups of securities, developments related to specific securities, dividend rate (for unlisted equities), yield (for debt obligations), quality, type of issue, coupon rate (for debt obligations), maturity (for debt obligations), individual trading characteristics and other market data. Pricing services generally value debt obligations assuming orderly transactions of institutional round lot size, but a fund may hold or transact in the same securities in smaller, odd lot sizes. Odd lots often trade at lower prices than institutional round lots. Debt obligations are subject to interest rate and credit risks. In addition, all debt obligations involve some risk of default with respect to interest and/or principal payments.
Foreign securities’ (including foreign exchange contracts) prices are converted into U.S. dollar amounts using the applicable exchange rates as of the close of the NYSE. If market quotations are available and reliable for foreign exchange-traded equity securities, the securities will be valued at the market quotations. Because trading hours for certain foreign securities end before the close of the NYSE, closing market quotations may become unreliable. If between the time trading ends on a particular security and the close of the customary trading session on the NYSE, events occur that the investment adviser determines are significant and make the closing price unreliable, the Fund may fair value the security. If the event is likely to have affected the closing price of the security, the security will be valued at fair value in good faith using procedures approved by the Board of Trustees. Adjustments to closing prices to reflect fair value may also be based on a screening process of an independent pricing service to indicate the degree of certainty, based on historical data, that the closing price in the principal market where a foreign security trades is not the current value as of the close of the NYSE. Foreign securities’ prices meeting the approved degree of certainty that the price is not reflective of current value will be priced at the indication of fair value from the independent pricing service. Multiple factors may be considered by the independent pricing service in determining adjustments to reflect fair value and may include information relating to sector indices, American Depositary Receipts and domestic and foreign index futures. Foreign securities may have additional risks including exchange rate changes, potential for sharply devalued currencies and high inflation, political and economic upheaval, the relative lack of issuer information,
31 INVESCO OPPENHEIMER MAIN STREET ALL CAP FUND
NOTES TO FINANCIAL STATEMENTSContinued
relatively low market liquidity and the potential lack of strict financial and accounting controls and standards.
Securities for which market prices are not provided by any of the above methods may be valued based upon quotes furnished by independent sources. The last bid price may be used to value equity securities. The mean between the last bid and asked prices is used to value debt obligations, including corporate loans.
Securities for which market quotations are not readily available or became unreliable are valued at fair value as determined in good faith by or under the supervision of the Trust’s officers following procedures approved by the Board of Trustees. Issuer specific events, market trends, bid/asked quotes of brokers and information providers and other market data may be reviewed in the course of making a good faith determination of a security’s fair value.
The Fund may invest in securities that are subject to interest rate risk, meaning the risk that the prices will generally fall as interest rates rise and, conversely, the prices will generally rise as interest rates fall. Specific securities differ in their sensitivity to changes in interest rates depending on their individual characteristics. Changes in interest rates may result in increased market volatility, which may affect the value and/or liquidity of certain Fund investments.
Valuations change in response to many factors including the historical and prospective earnings of the issuer, the value of the issuer’s assets, general economic conditions, interest rates, investor perceptions and market liquidity. Because of the inherent uncertainties of valuation, the values reflected in the financial statements may materially differ from the value received upon actual sale of those investments.
B.Securities Transactions and Investment Income -Securities transactions are accounted for on a trade date basis. Realized gains or losses on sales are computed on the basis of specific identification of the securities sold. Interest income (net of withholding tax, if any) is recorded on the accrual basis from settlement date. Dividend income (net of withholding tax, if any) is recorded on theex-dividend date.
The Fund may periodically participate in litigation related to Fund investments. As such, the Fund may receive proceeds from litigation settlements. Any proceeds received are included in the Statement of Operations as realized gain (loss) for investments no longer held and as unrealized gain (loss) for investments still held.
Brokerage commissions and mark ups are considered transaction costs and are recorded as an increase to the cost basis of securities purchased and/or a reduction of proceeds on a sale of securities. Such transaction costs are included in the determination of net realized and unrealized gain (loss) from investment transactions reported in the Statement of Operations and the Statement of Changes in Net Assets and the net realized and unrealized gains (losses) on securities per share in the Financial Highlights. Transaction costs are included in the calculation of the Fund’s net asset value and, accordingly, they reduce the Fund’s total returns. These transaction costs are not considered operating expenses and are not reflected in net investment income reported in the Statement of Operations and the Statement of Changes in Net Assets, or the net investment income per share and the ratios of expenses and net investment income reported in the Financial Highlights, nor are
32 INVESCO OPPENHEIMER MAIN STREET ALL CAP FUND
they limited by any expense limitation arrangements between the Fund and the investment adviser.
The Fund allocates income and realized and unrealized capital gains and losses to a class based on the relative net assets of each class.
C.Country Determination- For the purposes of making investment selection decisions and presentation in the Schedule of Investments, the investment adviser may determine the country in which an issuer is located and/or credit risk exposure based on various factors. These factors include the laws of the country under which the issuer is organized, where the issuer maintains a principal office, the country in which the issuer derives 50% or more of its total revenues and the country that has the primary market for the issuer’s securities, as well as other criteria. Among the other criteria that may be evaluated for making this determination are the country in which the issuer maintains 50% or more of its assets, the type of security, financial guarantees and enhancements, the nature of the collateral and the sponsor organization.
D.Distributions -Dividends and distributions to shareholders, which are determined in accordance with income tax regulations and may differ from accounting principles generally accepted in the United States of America (“GAAP”), are recorded on theex-dividend date. Income and capital gain distributions, if any, are declared and paid annually or at other times as determined necessary by the Adviser.
E.Federal Income Taxes -The Fund intends to comply with provisions of the Internal Revenue Code applicable to regulated investment companies and to distribute substantially all of its investment company taxable income, including any net realized gain on investments not offset by capital loss carryforwards, if any, to shareholders. Therefore, no federal income or excise tax provision is required. The Fund files income tax returns in U.S. federal and applicable state jurisdictions. The statute of limitations on the Fund’s tax return filings generally remains open for the three preceding fiscal reporting period ends. The Fund has analyzed its tax positions for the fiscal year ended October 31, 2019, including open tax years, and does not believe there are any uncertain tax positions requiring recognition in the Fund’s financial statements.
The tax components of capital shown in the following table represent distribution requirements the Fund must satisfy under the income tax regulations, losses the Fund may be able to offset against income and gains realized in future years and unrealized appreciation or depreciation of securities and other investments for federal income tax purposes.
| | | | | | | | | | | | |
Undistributed Net Investment Income | | Undistributed Long-Term Gain | | | Accumulated Loss
Carryforward1,2 | | | Net Unrealized Appreciation Based on cost of Securities and Other Investments for Federal Income Tax Purposes | |
| $3,277,003 | | | $3,961,552 | | | | $— | | | | $196,024,257 | |
1. During the reporting period, the Fund did not utilize any capital loss carryforward.
33 INVESCO OPPENHEIMER MAIN STREET ALL CAP FUND
NOTES TO FINANCIAL STATEMENTSContinued
2.During the previous reporting period, the Fund did not utilize any capital loss carryforward.
Net investment income (loss) and net realized gain (loss) may differ for financial statement and tax purposes. The character of dividends and distributions made during the fiscal year from net investment income or net realized gains are determined in accordance with federal income tax requirements, which may differ from the character of net investment income or net realized gains presented in those financial statements in accordance with U.S. GAAP. Also, due to timing of dividends and distributions, the fiscal year in which amounts are distributed may differ from the fiscal year in which the income or net realized gain was recorded by the Fund.
The tax character of distributions paid during the reporting periods:
| | | | | | | | | | | | |
| | | Three Months Ended October 31, 2019 | | | Year Ended
July 31, 2019 | | | Year Ended
July 31, 2018 | |
| Distributions paid from: | | | | | | | | | | | | |
| Ordinary income | | $ | — | | | $ | 8,619,341 | | | $ | 42,177,131 | |
| Long-term capital gain | | | — | | | | 77,087,853 | | | | 116,732,704 | |
| | | | |
| Total | | $ | — | | | $ | 85,707,194 | | | $ | 158,909,835 | |
| | | | |
The aggregate cost of securities and other investments and the composition of unrealized appreciation and depreciation of securities and other investments for federal income tax purposes at period end are noted in the following table. The primary difference between book and tax appreciation or depreciation of securities and other investments, if applicable, is attributable to the tax deferral of losses or tax realization of financial statement unrealized gain or loss.
| | | | |
| Federal tax cost of securities | | $ | 932,119,917 | |
| | | | |
| Gross unrealized appreciation | | $ | 222,235,438 | |
| Gross unrealized depreciation | | | (26,211,181 | ) |
| | | | |
| Net unrealized appreciation | | $ | 196,024,257 | |
| | | | |
F.Expenses -Fees provided for under the Rule12b-1 plan of a particular class of the Fund are charged to the operations of such class. Transfer agency fees and expenses and other shareholder recordkeeping fees and expenses attributable to Class R5 and Class R6 are allocated to each share class based on relative net assets.Sub-accounting fees attributable to Class R5 are charged to the operations of the class. Transfer agency fees and expenses and other shareholder recordkeeping fees and expenses relating to all other classes are allocated among those classes based on relative net assets. All other expenses are allocated among the classes based on relative net assets.
G.Accounting Estimates -The financial statements are prepared on a basis in conformity with GAAP, which requires management to make estimates and assumptions that affect the reported amounts of assets and liabilities at the date of the financial statements and the reported amounts of revenues and expenses during the reporting period including estimates and assumptions related to taxation. Actual results could differ from those estimates by a significant amount. In addition, the Fund monitors for material events or transactions that
34 INVESCO OPPENHEIMER MAIN STREET ALL CAP FUND
may occur or become known after theperiod-end date and before the date the financial statements are released to print.
H.Indemnifications -Under the Trust’s organizational documents, each Trustee, officer, employee or other agent of the Trust is indemnified against certain liabilities that may arise out of the performance of their duties to the Fund. Additionally, in the normal course of business, the Fund enters into contracts, including the Fund’s servicing agreements, that contain a variety of indemnification clauses. The Fund’s maximum exposure under these arrangements is unknown as this would involve future claims that may be made against the Fund that have not yet occurred. The risk of material loss as a result of such indemnification claims is considered remote.
I.Foreign Currency Translations -Foreign currency is valued at the close of the NYSE based on quotations posted by banks and major currency dealers. Portfolio securities and other assets and liabilities denominated in foreign currencies are translated into U.S. dollar amounts at the date of valuation. Purchases and sales of portfolio securities (net of foreign taxes withheld on disposition) and income items denominated in foreign currencies are translated into U.S. dollar amounts on the respective dates of such transactions. The Fund does not separately account for the portion of the results of operations resulting from changes in foreign exchange rates on investments and the fluctuations arising from changes in market prices of securities held. The combined results of changes in foreign exchange rates and the fluctuation of market prices on investments (net of estimated foreign tax withholding) are included with the net realized and unrealized gain or loss from transactions in the Statement of Operations. Reported net realized foreign currency gains or losses arise from (1) sales of foreign currencies, (2) currency gains or losses realized between the trade and settlement dates on securities transactions, and (3) the difference between the amounts of dividends, interest, and foreign withholding taxes recorded on the Fund’s books and the U.S. dollar equivalent of the amounts actually received or paid. Net unrealized foreign currency gains and losses arise from changes in the fair values of assets and liabilities, other than investments in securities at fiscal period end, resulting from changes in exchange rates. The Fund may invest in foreign securities, which may be subject to foreign taxes on income, gains on investments or currency repatriation, a portion of which may be recoverable. Foreign taxes, if any, are recorded based on the tax regulations and rates that exist in the foreign markets in which the Fund invests and are shown in the Statement of Operations.
Note 2 – Advisory Fees and Other Fees Paid to Affiliates
The Trust has entered into a master investment advisory agreement with Invesco Advisers, Inc. (the “Adviser” or “Invesco”). Under the terms of the investment advisory agreement, the Fund accrues daily and pays monthly an advisory fee to the Adviser based on the annual rate of the Fund’s average daily net assets as follows:
35 INVESCO OPPENHEIMER MAIN STREET ALL CAP FUND
NOTES TO FINANCIAL STATEMENTSContinued
| | | | |
| Fee Schedule* | | |
| Up to $200 million | | | 0.75 | % |
| Next $200 million | | | 0.72 | |
| Next $200 million | | | 0.69 | |
| Next $200 million | | | 0.66 | |
| Next $4.2 billion | | | 0.60 | |
| Over $5 billion | | | 0.58 | |
*The advisory fee paid by the Fund shall be reduced by any amounts paid by the Fund under the administrative services agreement with the Adviser.
For theperiod ended October 31, 2019, the effective advisory fee incurred by the Fund were 0.66% annualized.
Under the terms of a mastersub-advisory agreement between the Adviser and each of Invesco Asset Management Deutschland GmbH, Invesco Asset Management Limited, Invesco Asset Management (Japan) Limited, Invesco Hong Kong Limited, Invesco Senior Secured Management, Inc. and Invesco Canada Ltd. and separatesub-advisory agreements with Invesco Capital Management LLC, and Invesco Asset Management (India) Private Limited (collectively, the “AffiliatedSub-Advisers”) the Adviser, not the Fund, will pay 40% of the fees paid to the Adviser to any such AffiliatedSub-Adviser(s) that provide(s) discretionary investment management services to the Fund based on the percentage of assets allocated to such AffiliatedSub-Adviser(s). Invesco has also entered into aSub-Advisory Agreement with OppenheimerFunds, Inc. to provide discretionary management services to the Funds.
Effective on the Reorganization Date, the Adviser has contractually agreed, through at least May 28, 2021, to waive advisory fees and/or reimburse expenses of all shares to the extent necessary to limit the total annual fund operating expenses after fee waiver and/or expense reimbursement (excluding certain items discussed below) ofClass A, Class C, Class R, Class Y, Class R5 and Class R6 shares to 1.16%, 1.90%, 1.41%, 0.91%, 0.86% and 0.81%, respectively, of the Fund’s average daily net assets (the “expense limits”). In determining the Adviser’s obligation to waive advisory fees and/or reimburse expenses, the following expenses are not taken into account, and could cause total annual fund operating expenses after fee waivers and/or expense reimbursement to exceed the numbers reflected above: (1) interest; (2) taxes; (3) dividend expenses on short sales; (4) extraordinary ornon-routine items, including litigation expenses; and (5) expenses that the Fund has incurred but did not actually pay because of an expense offset arrangement. Unless Invesco continues the fee waiver agreement, it will terminate May 28, 2021. During its term, the fee waiver agreement cannot be terminated or amended to increase the expense limits or reduce the advisory fee waiver without approval of the Board of Trustees.
Further, the Adviser has contractually agreed, through at least June 30, 2021, to waive the advisory fee payable by the Fund in an amount equal to 100% of the net advisory fees the Adviser receives from the affiliated money market funds on investments by the Fund of uninvested cash in such affiliated money market funds.
For the periodended October 31, 2019, the Adviser waived advisory fees of $4,752.
The Trust has entered into a master administrative services agreement with Invesco pursuant to which the Fund has agreed to pay Invesco for certain administrative costs
36 INVESCO OPPENHEIMER MAIN STREET ALL CAP FUND
incurred in providing accounting services to the Fund. For the period ended October 31, 2019, expenses incurred under the agreement are shown in the Statement of Operations as Administration fees. Additionally, Invesco has entered into service agreements wherebyBrown Brothers Harriman & Co. serves as custodian to the Fund. Prior to the Reorganization, the Acquired Fund paid administrative fees to OFI Global Asset Management, Inc.
The Trust has entered into a transfer agency and service agreement with Invesco Investment Services, Inc. (“IIS”) pursuant to which the Fund has agreed to pay IIS a fee for providing transfer agency and shareholder services to the Fund and reimburse IIS for certain expenses incurred by IIS in the course of providing such services. IIS may make payments to intermediaries that provide omnibus account services,sub-accounting services and/or networking services. All fees payable by IIS to intermediaries that provide omnibus account services orsub-accounting services are charged back to the Fund, subject to certain limitations approved by the Trust’s Board of Trustees. Prior to the Reorganization, the Acquired Fund paid transfer agent fees to OFI Global Asset Management, Inc. and Shareholder Services, Inc. For the period ended October 31, 2019, expenses incurred under these agreements are shown in the Statement of Operations as Transfer and shareholder servicing agent fees.
The Trust has entered into master distribution agreements with Invesco Distributors, Inc. (“IDI”) to serve as the distributor for theClass A, Class C, Class R, Class Y, Class R5 and Class R6 shares of the Fund. The Trust has adopted plans pursuant to Rule12b-1 under the 1940 Act with respect to the Fund’s Class A, Class C and Class R shares(collectively the “Plan”). The Fund, pursuant to the Class A Plan, reimburses IDI in an amount up to an annual rate of 0.25% of the average daily net assets of Class A shares. The Fund pursuant to the Class C and Class R Plan, pays IDI compensation at the annual rate of 1.00% of the average daily net assets of Class C shares and 0.50% of the average daily net assets of Class R shares. The fees are accrued daily and paid monthly. Of the Plan payments, up to 0.25% of the average daily net assets of each class of shares may be paid to furnish continuing personal shareholder services to customers who purchase and own shares of such classes. Any amounts not paid as a service fee under the Plan would constitute an asset-based sales charge. Rules of the Financial Industry Regulatory Authority (“FINRA”) impose a cap on the total sales charges, including asset-based sales charges, that may be paid by any class of shares of the Fund plans. Prior to the Reorganization, the Acquired Fund paid distribution fees to OppenheimerFunds Distributor, Inc. For the period ended October 31, 2019, expenses incurred under the plans are shown in the Statement of Operations as Distribution and service plan fees.
Front-end sales commissions and CDSC (collectively, the “sales charges”) are not recorded as expenses of the Fund.Front-end sales commissions are deducted from proceeds from the sales of Fund shares prior to investment in Class A shares of the Fund. CDSC are deducted from redemption proceeds prior to remittance to the shareholder. During theperiod ended October 31, 2019, IDI advised the Fund that IDI retained $17,549 infront-end sales commissions from the sale of Class A shares and $1,106 from Class C shares, for CDSC imposed on redemptions by shareholders. From the beginning of the fiscal year to the date of the Reorganization, OppenheimerFunds Distributor, Inc. retained $120,365 in front–end sales commissions from the sale of Class A shares and $1,492 and $4,418 from Class A and Class C shares, respectively, for CDSC imposed on redemption by shareholders.
37 INVESCO OPPENHEIMER MAIN STREET ALL CAP FUND
NOTES TO FINANCIAL STATEMENTSContinued
Certain officers and trustees of the Trust are officers and directors of the Adviser, IIS and/or IDI.
Note 3 – Additional Valuation Information
GAAP defines fair value as the price that would be received to sell an asset or paid to transfer a liability in an orderly transaction between market participants at the measurement date, under current market conditions. GAAP establishes a hierarchy that prioritizes the inputs to valuation methods, giving the highest priority to readily available unadjusted quoted prices in an active market for identical assets (Level 1) and the lowest priority to significant unobservable inputs (Level 3), generally when market prices are not readily available or are unreliable. Based on the valuation inputs, the securities or other investments are tiered into one of three levels. Changes in valuation methods may result in transfers in or out of an investment’s assigned level:
Level 1 — Prices are determined using quoted prices in an active market for identical assets.
Level 2 — Prices are determined using other significant observable inputs. Observable inputs are inputs that other market participants may use in pricing a security. These may include quoted prices for similar securities, interest rates, prepayment speeds, credit risk, yield curves, loss severities, default rates, discount rates, volatilities and others.
Level 3 — Prices are determined using significant unobservable inputs. In situations where quoted prices or observable inputs are unavailable (for example, when there is little or no market activity for an investment at the end of the period), unobservable inputs may be used. Unobservable inputs reflect the Fund’s own assumptions about the factors market participants would use in determining fair value of the securities or instruments and would be based on the best available information.
As of October 31, 2019, all of the securities in this Fund were valued based on Level 1 inputs (see the Schedule of Investments for security categories). The level assigned to the securities valuations may not be an indication of the risk or liquidity associated with investing in those securities. Because of the inherent uncertainties of valuation, the values reflected in the financial statements may materially differ from the value received upon actual sale of those investments.
Note 4 – Trustee and Officer Fees and Benefits
Certain Trustees have executed a Deferred Compensation Agreement pursuant to which they have the option to elect to defer receipt of all or a portion of the annual compensation they are entitled to receive from the Fund. For purposes of determining the amount owed to the Trustees under the plan, deferred amounts are treated as though equal dollar amounts had been invested in shares of the Fund or in other Invesco and/or Invesco Oppenheimer funds selected by the Trustees. The Fund purchases shares of the funds selected for deferral by the
38 INVESCO OPPENHEIMER MAIN STREET ALL CAP FUND
Trustees in amounts equal to his or her deemed investment, resulting in a Fund asset equal to the deferred compensation liability. Such assets are included as a component of “Other” within the asset section of the Statement of Assets and Liabilities. Deferral of Trustees’ fees under the plan will not affect the net assets of the Fund and will not materially affect the Fund’s assets, liabilities or net investment income per share. Amounts will be deferred until distributed in accordance with the compensation deferral plan.
Note 5 – Cash Balances
The Fund is permitted to temporarily carry a negative or overdrawn balance in its account with Brown Brothers Harriman & Co., the custodian bank. Such balances, if any atperiod-end, are shown in the Statement of Assets and Liabilities under the payable caption Amount due to custodian. To compensate the custodian bank for such overdrafts, the overdrawn Fund may either (1) leave funds as a compensating balance in the account so the custodian bank can be compensated by earning the additional interest; or (2) compensate by paying the custodian bank at a rate agreed upon by the custodian bank and Invesco, not to exceed the contractually agreed upon rate.
Note 6 – Investment Transactions
The aggregate amount of investment securities (other than short-term securities, U.S. Treasury obligations and money market funds, if any) purchased and sold by the Fund during theperiod ended October 31, 2019 was $76,456,808 and $99,602,301, respectively.
Note 7 – Share Information
Transactions in shares of beneficial interest were as follows:
| | | | | | | | | | | | | | | | | | | | | | | | |
| | | Three Months Ended October 31, 20191 | | | Year Ended July 31, 20192 | | | Year Ended July 31, 2018 | |
| | | Shares | | | Amount | | | Shares | | | Amount | | | Shares | | | Amount | |
| Class A | | | | | | | | | | | | | | | | | | | | | | | | |
| Sold | | | 582,672 | | | $ | 10,605,829 | | | | 8,420,218 | | | $ | 148,772,926 | | | | 2,615,009 | | | $ | 49,085,668 | |
| Automatic Conversion Class C to Class A Shares | | | 124,373 | | | $ | 2,274,150 | | | | — | | | | — | | | | — | | | | — | |
| Dividends and/or distributions reinvested | | | — | | | | — | | | | 4,010,631 | | | | 63,006,669 | | | | 6,418,432 | | | | 115,018,277 | |
| Redeemed | | | (2,368,765 | ) | | | (43,016,390 | ) | | | (8,303,167 | ) | | | (144,517,641 | ) | | | (7,238,611 | ) | | | (136,009,014 | ) |
| Net increase (decrease) | | | (1,661,720 | ) | | $ | (30,136,411 | ) | | | 4,127,682 | | | $ | 67,261,954 | | | | 1,794,830 | | | $ | 28,094,931 | |
| | | | |
39 INVESCO OPPENHEIMER MAIN STREET ALL CAP FUND
NOTES TO FINANCIAL STATEMENTSContinued
| | | | | | | | | | | | | | | | | | | | | | | | |
| | | Three Months Ended October 31, 20191 | | | Year Ended July 31, 20192 | | | Year Ended July 31, 2018 | |
| | | Shares | | | Amount | | | Shares | | | Amount | | | Shares | | | Amount | |
| Class B | | | | | | | | | | | | | | | | | | | | | | | | |
| Sold | | | — | | | $ | — | | | | — | | | $ | — | | | | 1,508 | | | $ | 25,153 | |
| Dividends and/or distributions reinvested | | | — | | | | — | | | | — | | | | — | | | | 36,806 | | | | 599,564 | |
| Redeemed3 | | | — | | | | — | | | | — | | | | — | | | | (517,070 | ) | | | (8,862,475 | ) |
| Net increase (decrease) | | | — | | | $ | — | | | | — | | | $ | — | | | | (478,756 | ) | | $ | (8,237,758 | ) |
| | | | |
| | | | | | | | | | | | | | | | | | | | | | | | |
| Class C | | | | | | | | | | | | | | | | | | | | | | | | |
| Sold | | | 144,704 | | | $ | 2,357,218 | | | | 713,877 | | | $ | 11,055,699 | | | | 600,054 | | | $ | 10,299,416 | |
| Dividends and/or distributions reinvested | | | — | | | | — | | | | 1,007,860 | | | | 14,331,776 | | | | 1,692,772 | | | | 27,761,456 | |
| Automatic Conversion Class C to Class A Shares | | | (138,191 | ) | | $ | (2,274,150 | ) | | | — | | | | — | | | | — | | | | — | |
| Redeemed | | | (273,180 | ) | | | (4,456,327 | ) | | | (9,072,800 | ) | | | (144,913,558 | ) | | | (2,764,633 | ) | | | (47,592,269 | ) |
| Net increase (decrease) | | | (266,667 | ) | | $ | (4,373,259 | ) | | | (7,351,063 | ) | | $ | (119,526,083 | ) | | | (471,807 | ) | | $ | (9,531,397 | ) |
| | | | |
| | | | | | | | | | | | | | | | | | | | | | | | |
| Class R | | | | | | | | | | | | | | | | | | | | | | | | |
| Sold | | | 89,332 | | | $ | 1,563,360 | | | | 440,682 | | | $ | 7,492,901 | | | | 370,092 | | | $ | 6,760,789 | |
| Dividends and/or distributions reinvested | | | — | | | | — | | | | 262,796 | | | | 4,002,380 | | | | 425,433 | | | | 7,406,798 | |
| Redeemed | | | (248,627 | ) | | | (4,380,260 | ) | | | (776,262 | ) | | | (13,333,058 | ) | | | (898,008 | ) | | | (16,522,350 | ) |
| Net increase (decrease) | | | (159,295 | ) | | $ | (2,816,900 | ) | | | (72,784 | ) | | $ | (1,837,777 | ) | | | (102,483 | ) | | $ | (2,354,763 | ) |
| | | | |
| | | | | | | | | | | | | | | | | | | | | | | | |
| Class Y | | | | | | | | | | | | | | | | | | | | | | | | |
| Sold | | | 225,960 | | | $ | 4,247,428 | | | | 925,980 | | | $ | 16,305,110 | | | | 780,552 | | | $ | 15,067,733 | |
| Dividends and/or distributions reinvested | | | — | | | | — | | | | 191,020 | | | | 3,073,517 | | | | 285,297 | | | | 5,226,638 | |
| Redeemed | | | (173,175 | ) | | | (3,240,765 | ) | | | (938,053 | ) | | | (16,548,331 | ) | | | (1,078,208 | ) | | | (20,667,503 | ) |
| Net increase (decrease) | | | 52,785 | | | $ | 1,006,663 | | | | 178,947 | | | $ | 2,830,296 | | | | (12,359 | ) | | $ | (373,132 | ) |
| | | | |
40 INVESCO OPPENHEIMER MAIN STREET ALL CAP FUND
| | | | | | | | | | | | | | | | | | | | | | | | |
| | | Three Months Ended
October 31, 20191 | | | Year Ended July 31, 20192 | | | Year Ended July 31, 2018 | |
| | | Shares | | | Amount | | | Shares | | | Amount | | | Shares | | | Amount | |
| Class R54 | | | | | | | | | | | | | | | | | | | | | | | | |
| Sold | | | — | | | $ | — | | | | 584 | | | $ | 10,000 | | | | — | | | $ | — | |
| Dividends and/or distributions reinvested | | | — | | | | — | | | | — | | | | — | | | | — | | | | — | |
| Redeemed | | | — | | | | — | | | | — | | | | — | | | | — | | | | — | |
| Net increase (decrease) | | | — | | | $ | — | | | | 584 | | | $ | 10,000 | | | | — | | | $ | — | |
| | | | |
| | | | | | | | | | | | | | | | | | | | | | | | |
| Class R64 | | | | | | | | | | | | | | | | | | | | | | | | |
| Sold | | | — | | | $ | — | | | | 584 | | | $ | 10,000 | | | | — | | | $ | — | |
| Dividends and/or distributions reinvested | | | — | | | | — | | | | — | | | | — | | | | — | | | | — | |
| Redeemed | | | — | | | | — | | | | — | | | | — | | | | — | | | | — | |
| Net increase (decrease) | | | — | | | $ | — | | | | 584 | | | $ | 10,000 | | | | — | | | $ | — | |
| | | | |
1.There are entities that are record owners of more than 5% of the outstanding shares of the Fund and own 11% of the outstanding shares of the Fund. IDI has an agreement with these entities to sell Fund shares. The Fund, Invesco and/or Invesco affiliates may make payments to these entities, which are considered to be related to the Fund, for providing services to the Fund, Invesco and/or Invesco affiliates, including but not limited to services such as
securities brokerage, distribution, third party record keeping and account servicing. The Fund has no knowledge as to whether all or any portion of the shares owned of record by these entities are also owned beneficially.
2.There are entities that are record owners of more than 5% of the outstanding shares of the Fund and own 11% of the outstanding shares of the Fund. IDI has an agreement with these entities to sell Fund shares. The Fund, Invesco and/or Invesco affiliates may make payments to these entities, which are considered to be related to the Fund, for providing services to the Fund, Invesco and/or Invesco affiliates, including but not limited to services such as securities brokerage, distribution, third party record keeping and account servicing. The Fund has no knowledge as to whether all or any portion of the shares owned of record by these entities are also owned beneficially.
3. All outstanding Class B shares converted to Class A shares on June 1, 2018.
4. Commencement date after the close of business on May 24, 2019.
Note 8 – Borrowings
Joint Credit Facility.A number of mutual funds managed by the Adviser participate in a $1.95 billion revolving credit facility (the “Facility”) intended to provide short-term financing, if necessary, subject to certain restrictions in connection with atypical redemption activity. Expenses and fees related to the Facility are paid by the participating funds and are disclosed separately or as other expenses on the Statement of Operations. The Fund did not utilize the Facility during the reporting period.The Facility terminated May 24, 2019.
41 INVESCO OPPENHEIMER MAIN STREET ALL CAP FUND
REPORT OF INDEPENDENT REGISTERED PUBLIC ACCOUNTING FIRM
To the Board of Trustees of AIM Equity Funds (Invesco Equity Funds) and Shareholders of Invesco Oppenheimer Main Street All Cap Fund
Opinion on the Financial Statements
We have audited the accompanying statement of assets and liabilities, including the schedule of investments, of Invesco Oppenheimer Main Street All Cap Fund (one of the funds constituting AIM Equity Funds (Invesco Equity Funds), referred to hereafter as the “Fund”) as of October 31, 2019, the related statements of operations and of changes in net assets for each of the periods indicated in the table below, including the related notes, and the financial highlights for each of the periods indicated in the table below (collectively referred to as the “financial statements”). In our opinion, the financial statements present fairly, in all material respects, the financial position of the Fund as of October 31, 2019, the results of its operations, the changes in its net assets and the financial highlights for each of the periods indicated in the table below in conformity with accounting principles generally accepted in the United States of America.
| | |
| | |
Statement of Operations and Statement of Changes in Net Assets | | Financial Highlights |
| | |
| For the period from August 1, 2019 through October 31, 2019 and the year ended July 31, 2019 | | For the period from August 1, 2019 through October 31, 2019 and the year ended July 31, 2019 for Class A, Class C, Class R and Class Y |
| | |
| | | For the period from August 1, 2019 through October 31, 2019 and the period from May 24, 2019 (inception of offering) through July 31, 2019 for Class R5 and Class R6 |
The financial statements of Invesco Oppenheimer Main Street All Cap Fund (formerly known as Oppenheimer Main Street All Cap Fund) as of and for the year ended July 31, 2018 and the financial highlights for each of the periods ended on or prior to July 31, 2018 (not presented herein, other than the statement of changes in net assets and the financial highlights) were audited by other auditors whose report dated September 26, 2018 expressed an unqualified opinion on those financial statements and financial highlights.
Basis for Opinion
These financial statements are the responsibility of the Fund’s management. Our responsibility is to express an opinion on the Fund’s financial statements based on our audits. We are a public accounting firm registered with the Public Company Accounting Oversight Board (United States) (PCAOB) and are required to be independent with respect to the Fund in accordance with the U.S. federal securities laws and the applicable rules and regulations of the Securities and Exchange Commission and the PCAOB.
We conducted our audits of these financial statements in accordance with the standards of the PCAOB. Those standards require that we plan and perform the audit to obtain reasonable assurance about whether the financial statements are free of material misstatement, whether due to error or fraud.
Our audits included performing procedures to assess the risks of material misstatement of the financial statements, whether due to error or fraud, and performing procedures that respond to those risks. Such procedures included examining, on a test basis, evidence regarding the amounts and disclosures in the financial statements. Our audits also included evaluating the accounting principles used and significant estimates made by management, as well as evaluating the overall presentation of the financial statements. Our procedures included confirmation of securities owned as of October 31, 2019 by correspondence with
42 INVESCO OPPENHEIMER MAIN STREET ALL CAP FUND
the custodian, transfer agent and brokers; when replies were not received from brokers, we performed other auditing procedures. We believe that our audits provide a reasonable basis for our opinion.
/s/PricewaterhouseCoopers LLP
Houston, Texas
December 23, 2019
We have served as the auditor of one or more of the investment companies in the Invesco group of investment companies since at least 1995. We have not been able to determine the specific year we began serving as auditor.
43 INVESCO OPPENHEIMER MAIN STREET ALL CAP FUND
FEDERAL INCOME TAX INFORMATION
In early 2019, if applicable, shareholders of record received information regarding all dividends and distributions paid to them by the Fund during calendar year 2018.
Dividends, if any, paid by the Fund during the reporting period which are not designated as capital gain distributions should be multiplied by the maximum amount allowable but not less than 100% to arrive at the amount eligible for the corporate dividend-received deduction.
A portion, if any, of the dividends paid by the Fund during the reporting period which are not designated as capital gain distributions are eligible for lower individual income tax rates to the extent that the Fund has received qualified dividend income as stipulated by recent tax legislation. The maximum amount allowable but not less than $4,653,323 of the Fund’s fiscal year taxable income may be eligible for the lower individual income tax rates. In early 2019, shareholders of record received information regarding the percentage of distributions that are eligible for lower individual income tax rates.
Recent tax legislation allows a regulated investment company to designate distributions not designated as capital gain distributions, as either interest related dividends or short-term capital gain dividends, both of which are exempt from the U.S. withholding tax applicable to non U.S. taxpayers. For the reporting period, the maximum amount allowable but not less than $33,226 of the ordinary distributions to be paid by the Fund qualifies as an interest related dividend.
The foregoing information is presented to assist shareholders in reporting distributions received from the Fund to the Internal Revenue Service. Because of the complexity of the federal regulations which may affect your individual tax return and the many variations in state and local tax regulations, we recommend that you consult your tax advisor for specific guidance.
44 INVESCO OPPENHEIMER MAIN STREET ALL CAP FUND
PORTFOLIO PROXY VOTING POLICIES AND GUIDELINES;
UPDATES TO SCHEDULE OF INVESTMENTS
Go paperless with eDelivery
Visit invesco.com/edelivery to enjoy the convenience and security of anytime electronic access to your investment documents.
With eDelivery, you can elect to have any or all of the following materials delivered straight to your inbox to download, save and print from your own computer:
| · | | Fund reports and prospectuses |
Invesco mailing information
Send general correspondence to Invesco Investment Services, Inc., P.O. Box 219078, Kansas City, MO 64121-9078.
Important notice regarding delivery of security holder documents
To reduce Fund expenses, only one copy of most shareholder documents may be mailed to shareholders with multiple accounts at the same address (Householding). Mailing of your shareholder documents may be householded indefinitely unless you instruct us otherwise. If you do not want the mailing of these documents to be combined with those for other members of your household, please contact Invesco Investment Services, Inc. at 800 959 4246 or contact your financial institution. We will begin sending you individual copies for each account within 30 days after receiving your request.
Fund holdings and proxy voting information
The Fund provides a complete list of its holdings four times in each fiscal year, at the quarter ends. For the second and fourth quarters, the lists appear in the Fund’s semiannual and annual reports to shareholders. For the first and third quarters, the Fund files the lists with the Securities and Exchange Commission (SEC) as an exhibit to its reports on FormN-PORT. The most recent list of portfolio holdings is available at invesco.com/completeqtrholdings. Shareholders can also look up the Fund’s FormsN-PORT on the SEC website at sec.gov.
A description of the policies and procedures that the Fund uses to determine how to vote proxies relating to portfolio securities is available without charge, upon request, from our Client Services department at 800 959 4246 or at invesco.com/proxyguidelines. The information is also available on the SEC website, sec.gov.
Information regarding how the Fund voted proxies related to its portfolio securities during the most recent12-month period ended June 30 is available at invesco.com/proxysearch. The information is also available on the SEC website, sec.gov.
Invesco Advisers, Inc. is an investment adviser; it provides investment advisory services to individual and institutional clients and does not sell securities. Invesco Distributors, Inc. is the US distributor for Invesco Ltd.’s retail mutual funds, exchange-traded funds and institutional money market funds. Both are wholly owned, indirect subsidiaries of Invesco Ltd.
45 INVESCO OPPENHEIMER MAIN STREET ALL CAP FUND
TRUSTEES AND OFFICERS
The address of each trustee and officer is AIM Equity Funds (Invesco Equity Funds) (the “Trust”), 11 Greenway Plaza, Suite 1000, Houston, Texas 77046-1173. The trustees serve for the life of the Trust, subject to their earlier death, incapacitation, resignation, retirement or removal as more specifically provided in the Trust’s organizational documents. Each officer serves for a one year term or until their successors are elected and qualified. Column two below includes length of time served with predecessor entities, if any.
| | | | | | | | |
| | | | | |
Name, Year of Birth and
Position(s) Held with the Trust | | Trustee and/or Officer Since | | Principal Occupation(s) During Past 5 Years | | Number of Funds in Fund Complex Overseen by Trustee | | Other Directorship(s) Held by Trustee During Past 5 Years |
| | | | | |
INTERESTED PERSONS | | | | | | | | |
| | | | | |
Martin L. Flanagan1— 1960 Trustee and Vice Chair | | 2007 | | Executive Director, Chief Executive Officer and President, Invesco Ltd. (ultimate parent of Invesco and a global investment management firm); Trustee and Vice Chair, The Invesco Funds; Vice Chair, Investment Company Institute; and Member of Executive Board, SMU Cox School of Business | | 229 | | None |
| | | | | |
| | | | | Formerly: Advisor to the Board, Invesco Advisers, Inc. (formerly known as Invesco Institutional (N.A.), Inc.); Chairman and Chief Executive Officer, Invesco Advisers, Inc. (registered investment adviser); Director, Chairman, Chief Executive Officer and President, Invesco Holding Company (US), Inc. (formerly IVZ Inc.) (holding company), Invesco Group Services, Inc. (service provider) and Invesco North American Holdings, Inc. (holding company); Director, Chief Executive Officer and President, Invesco Holding Company Limited (parent of Invesco and a global investment management firm); Director, Invesco Ltd.; Chairman, Investment Company Institute and President,Co-Chief Executive Officer,Co-President, Chief Operating Officer and Chief Financial Officer, Franklin Resources, Inc. (global investment management organization) | | | | |
| | | | | |
Philip A. Taylor2— 1954 Trustee | | 2006 | | Vice Chair, Invesco Ltd.; Trustee, The Invesco Funds Formerly: Director, Invesco Canada Ltd. (formerly known as Invesco Trimark Ltd./ Invesco Trimark Ltèe) (registered investment adviser and registered transfer agent); Head of the Americas and Senior Managing Director, Invesco Ltd.; Director, Invesco Advisers, Inc. (formerly known as Invesco Institutional (N.A.), Inc.) (registered investment adviser); | | 229 | | None |
| |
| 1 Mr. Flanagan is considered an interested person (within the meaning of Section 2(a)(19) of the 1940 Act) of the Trust because he is an officer of the Adviser to the Trust, and an officer and a director of Invesco Ltd., ultimate parent of the Adviser. |
| |
| 2 Mr. Taylor is considered an interested person (within the meaning of Section 2(a)(19) of the 1940 Act) of the Trust because he is an officer of Invesco Ltd., ultimate parent of the Adviser. |
46 INVESCO OPPENHEIMER MAIN STREET ALL CAP FUND
| | | | | | | | |
| | | | | |
Name, Year of Birth and
Position(s) Held with the Trust | | Trustee and/or Officer Since | | Principal Occupation(s) During Past 5 Years | | Number of Funds in Fund Complex Overseen by Trustee | | Other Directorship(s) Held by Trustee During Past 5 Years |
| | | | | |
INTERESTED PERSONS (CONTINUED) | | | | | | | | |
| | | | | |
Philip A. Taylor (Continued) | | | | Director and Chairman, Invesco Investment Services, Inc. (formerly known as Invesco AIM Investment Services, Inc.) (registered transfer agent); Chief Executive Officer, Invesco Corporate Class Inc. (corporate mutual fund company); Chairman and Chief Executive Officer, Invesco Canada Ltd. (formerly known as Invesco Trimark Ltd./Invesco Trimark Ltèe) (registered investment adviser and registered transfer agent); Senior Vice President, The Invesco Funds; Director, Invesco Investment Advisers LLC (formerly known as Van Kampen Asset Management); Director, Chairman, Chief Executive Officer and President, Invesco Management Group, Inc. (formerly known as Invesco AIM Management Group, Inc.) (financial services holding company);Co-Chairman,Co-President andCo-Chief Executive Officer, Invesco Advisers, Inc. (formerly known as Invesco Institutional (N.A.), Inc.) (registered investment adviser); Director, Chief Executive Officer and President, Van Kampen Exchange Corp; President and Principal Executive Officer, The Invesco Funds (other than AIM Treasurer’s Series Trust (Invesco Treasurer’s Series Trust), Short-Term Investments Trust and Invesco Management Trust); Executive Vice President, The Invesco Funds (AIM Treasurer’s Series Trust (Invesco Treasurer’s Series Trust), Short-Term Investments Trust and Invesco Management Trust only); Director and President, INVESCO Funds Group, Inc. (registered investment adviser and registered transfer agent); Director and Chairman, IVZ Distributors, Inc. (formerly known as INVESCO Distributors, Inc.) (registered broker dealer); Director, President and Chairman, Invesco Inc. (holding company), Invesco Canada Holdings Inc. (holding company), Trimark Investments Ltd./ Placements Trimark Ltèe and Invesco Financial Services Ltd/Services Financiers Invesco Ltèe; Chief Executive Officer, Invesco Canada Fund Inc. (corporate mutual fund company); Director and Chairman, Van Kampen Investor Services Inc.; Director, Chief Executive Officer and President, 1371 Preferred Inc. (holding | | | | |
47 INVESCO OPPENHEIMER MAIN STREET ALL CAP FUND
TRUSTEES AND OFFICERSContinued
| | | | | | | | |
| | | | | |
Name, Year of Birth and
Position(s) Held with the Trust | | Trustee and/or Officer Since | | Principal Occupation(s) During Past 5 Years | | Number of Funds in Fund Complex Overseen by Trustee | | Other Directorship(s) Held by Trustee During Past 5 Years |
| | | | | |
INTERESTED PERSONS (CONTINUED) | | | | | | | | |
| | | | | |
Philip A. Taylor (Continued) | | | | company) and Van Kampen Investments Inc.; Director and President, AIM GP Canada Inc. (general partner for limited partnerships) and Van Kampen Advisors, Inc.; Director and Chief Executive Officer, Invesco Trimark Dealer Inc. (registered broker dealer); Director, Invesco Distributors, Inc. (formerly known as Invesco AIM Distributors, Inc.) (registered broker dealer); Manager, Invesco Capital Management LLC; Director, Chief Executive Officer and President, Invesco Advisers, Inc.; Director, Chairman, Chief Executive Officer and President, Invesco AIM Capital Management, Inc.; President, Invesco Trimark Dealer Inc. and Invesco Trimark Ltd./Invesco Trimark Ltèe; Director and President, AIM Trimark Corporate Class Inc. and AIM Trimark Canada Fund Inc.; Senior Managing Director, Invesco Holding Company Limited; Director and Chairman, Fund Management Company (former registered broker dealer); President and Principal Executive Officer, The Invesco Funds (AIM Treasurer’s Series Trust (Invesco Treasurer’s Series Trust), and Short-Term Investments Trust only); President, AIM Trimark Global Fund Inc. and AIM Trimark Canada Fund Inc. | | | | |
48 INVESCO OPPENHEIMER MAIN STREET ALL CAP FUND
| | | | | | | | |
| | | | | |
Name, Year of Birth and
Position(s) Held with the Trust | | Trustee and/or Officer Since | | Principal Occupation(s) During Past 5 Years | | Number of Funds in Fund Complex Overseen by Trustee | | Other Directorship(s) Held by Trustee During Past 5 Years |
| | | | | |
INDEPENDENT TRUSTEES | | | | | | | | |
| | | | | |
Bruce L. Crockett – 1944 Trustee and Chair | | 2003 | | Chairman, Crockett Technologies Associates (technology consulting company) Formerly: Director, Captaris (unified messaging provider); Director, President and Chief Executive Officer, COMSAT Corporation; Chairman, Board of Governors of INTELSAT (international communications company); ACE Limited (insurance company); Independent Directors Council and Investment Company Institute: Member of the Audit Committee, Investment Company Institute; Member of the Executive Committee and Chair of the Governance Committee, Independent Directors Council | | 229 | | Director and Chairman of the Audit Committee, ALPS (Attorneys Liability Protection Society) (insurance company); Director and Member of the Audit Committee and Compensation Committee, Ferroglobe PLC (metallurgical company) |
| | | | | |
David C. Arch – 1945 Trustee | | 2010 | | Chairman of Blistex Inc. (consumer health care products manufacturer); Member, World Presidents’ Organization | | 229 | | Board member of the Illinois Manufacturers’ Association |
| | | | | |
Beth Ann Brown – 1968 Trustee | | 2019 | | Independent Consultant Formerly: Head of Intermediary Distribution, Managing Director, Strategic Relations, Managing Director, Head of National Accounts, Senior Vice President, National Account Manager and Senior Vice President, Key Account Manager, Columbia Management Investment Advisers LLC; Vice President, Key Account Manager, Liberty Funds Distributor, Inc.; and Trustee of certain Oppenheimer Funds | | 229 | | Director, Board of Directors of Caron Engineering Inc.; Advisor, Board of Advisors of Caron Engineering Inc.; President and Director, of Acton Shapleigh Youth Conservation Corps (non -profit); and Vice President and Director of Grahamtastic Connection (non- profit) |
| | | | | |
Jack M. Fields – 1952 Trustee | | 2003 | | Chief Executive Officer, Twenty First Century Group, Inc. (government affairs company); and Chairman, Discovery Learning Alliance(non-profit) Formerly: Owner and Chief Executive Officer, Dos Angeles Ranch L.P. (cattle, hunting, corporate entertainment); Director, Insperity, Inc. (formerly known as Administaff) (human resources provider); Chief Executive Officer, Texana Timber LP (sustainable forestry company); Director of Cross Timbers Quail Research Ranch(non-profit); and member of the U.S. House of Representatives | | 229 | | None |
49 INVESCO OPPENHEIMER MAIN STREET ALL CAP FUND
TRUSTEES AND OFFICERSContinued
| | | | | | | | |
| | | | | |
Name, Year of Birth and
Position(s) Held with the Trust | | Trustee and/or Officer Since | | Principal Occupation(s) During Past 5 Years | | Number of Funds in Fund Complex Overseen by Trustee | | Other Directorship(s) Held by Trustee During Past 5 Years |
| | | | | |
INDEPENDENT TRUSTEES (CONTINUED) | | | | | | | | |
| | | | | |
Cynthia Hostetler —1962 Trustee | | 2017 | | Non-Executive Director and Trustee of a number of public and private business corporations Formerly: Director, Aberdeen Investment Funds (4 portfolios); Head of Investment Funds and Private Equity, Overseas Private Investment Corporation; President, First Manhattan Bancorporation, Inc.; Attorney, Simpson Thacher & Bartlett LLP | | 229 | | Vulcan Materials Company (construction materials company); Trilinc Global Impact Fund; Genesee & Wyoming, Inc. (railroads); Artio Global Investment LLC (mutual fund complex); Edgen Group, Inc. (specialized energy and infrastructure products distributor); Investment Company Institute (professional organization); Independent Directors Council (professional organization) |
| | | | | |
Eli Jones – 1961 Trustee | | 2016 | | Professor and Dean, Mays Business School - Texas A&M University Formerly: Professor and Dean, Walton College of Business, University of Arkansas and E.J. Ourso College of Business, Louisiana State University; Director, Arvest Bank | | 229 | | Insperity, Inc. (formerly known as Administaff) (human resources provider) |
| | | | | |
Elizabeth Krentzman – 1959 Trustee | | 2019 | | Formerly: Principal and Chief Regulatory Advisor for Asset Management Services and U.S. Mutual Fund Leader of Deloitte & Touche LLP; General Counsel of the Investment Company Institute (trade association); National Director of the Investment Management Regulatory Consulting Practice, Principal, Director and Senior Manager of Deloitte & Touche LLP; Assistant Director of the Division of Investment Management - Office of Disclosure and Investment Adviser Regulation of the U.S. Securities and Exchange Commission and various positions with the Division of Investment Management – Office of Regulatory Policy of the U.S. Securities and Exchange Commission; Associate at Ropes & Gray LLP.; Advisory Board Member of the Securities and Exchange Commission Historical Society; and Trustee of certain Oppenheimer Funds | | 229 | | Trustee of the University of Florida National Board Foundation and Audit Committee Member; Member of the Cartica Funds Board of Directors (private investment funds); Member of the University of Florida Law Center Association, Inc. Board of Trustees and Audit Committee Member |
50 INVESCO OPPENHEIMER MAIN STREET ALL CAP FUND
| | | | | | | | |
| | | | | |
Name, Year of Birth and
Position(s) Held with the Trust | | Trustee and/or Officer Since | | Principal Occupation(s) During Past 5 Years | | Number of Funds in Fund Complex Overseen by Trustee | | Other Directorship(s) Held by Trustee During Past 5 Years |
| | | | | |
INDEPENDENT TRUSTEES (CONTINUED) | | | | | | | | |
| | | | | |
Anthony J. LaCava, Jr. – 1956 Trustee | | 2019 | | Formerly: Director and Member of the Audit Committee, Blue Hills Bank (publicly traded financial institution) and Managing Partner, KPMG LLP | | 229 | | Blue Hills Bank; Chairman of Bentley University; Member, Business School Advisory Council; and Nominating Committee, KPMG LLP |
| | | | | |
Prema Mathai-Davis – 1950 Trustee | | 2003 | | Retired Co-Owner & Partner of Quantalytics Research, LLC, (a FinTech Investment Research Platform for the Self-Directed Investor) | | 229 | | None |
| | | | | |
Joel W. Motley – 1952 Trustee | | 2019 | | Director of Office of Finance, Federal Home Loan Bank; Member of the Vestry of Trinity Wall Street; Managing Director of Carmona Motley Hoffman, Inc. (privately held financial advisor); Member of the Finance and Budget Committee of the Council on Foreign Relations, Member of the Investment Committee and Board of Human Rights Watch and Member of the Investment Committee and Board of Historic Hudson Valley (non-profit cultural organization). Formerly: Managing Director of Public Capital Advisors, LLC (privately held financial advisor); Managing Director of Carmona Motley Hoffman, Inc. (privately held financial advisor); Trustee of certain Oppenheimer Funds; and Director of Columbia Equity Financial Corp. (privately held financial advisor) | | 229 | | Director of Greenwall Foundation (bioethics research foundation); Member of Board and Investment Committee of The Greenwall Foundation; Director of Southern Africa Legal Services Foundation; Board Member and Investment Committee Member of Pulitzer Center for Crisis Reporting(non-profit journalism) |
| | | | | |
Teresa M. Ressel — 1962 Trustee | | 2017 | | Non-executive director and trustee of a number of public and private business corporations Formerly: Chief Financial Officer, Olayan America, The Olayan Group (international investor/commercial/industrial); Chief Executive Officer, UBS Securities LLC; Group Chief Operating Officer, Americas, UBS AG; Assistant Secretary for Management & Budget and CFO, US Department of the Treasury | | 229 | | Atlantic Power Corporation (power generation company); ON Semiconductor Corp. (semiconductor supplier) |
| | | | | |
Ann Barnett Stern – 1957 Trustee | | 2017 | | President and Chief Executive Officer, Houston Endowment Inc. (private philanthropic institution) Formerly: Executive Vice President and General Counsel, Texas Children’s Hospital; | | 229 | | Federal Reserve Bank of Dallas |
51 INVESCO OPPENHEIMER MAIN STREET ALL CAP FUND
TRUSTEES AND OFFICERSContinued
| | | | | | | | |
| | | | | |
Name, Year of Birth and
Position(s) Held with the Trust | | Trustee and/or Officer Since | | Principal Occupation(s) During Past 5 Years | | Number of Funds in Fund Complex Overseen by Trustee | | Other Directorship(s) Held by Trustee During Past 5 Years |
| | | | | |
INDEPENDENT TRUSTEES (CONTINUED) | | | | | | | | |
| | | | | |
Ann Barnett Stern (Continued) | | | | Attorney, Beck, Redden and Secrest, LLP; Business Law Instructor, University of St. Thomas; Attorney, Andrews & Kurth LLP | | | | |
| | | | | |
Raymond Stickel, Jr. – 1944 Trustee | | 2005 | | Retired Formerly: Director, Mainstay VP Series Funds, Inc. (25 portfolios); Partner, Deloitte & Touche | | 229 | | None |
| | | | | |
Robert C. Troccoli – 1949 Trustee | | 2016 | | Retired Formerly: Adjunct Professor, University of Denver – Daniels College of Business, Senior Partner, KPMG LLP | | 229 | | None |
| | | | | |
Daniel S. Vandivort –1954 Trustee | | 2019 | | Treasurer, Chairman of the Audit and Finance Committee, and Trustee, Board of Trustees, Huntington Disease Foundation of America; and President, Flyway Advisory Services LLC (consulting and property management). Formerly: Trustee and Governance Chair, of certain Oppenheimer Funds | | 229 | | Chairman and Lead Independent Director, Chairman of the Audit Committee, and Director, Board of Directors, Value Line Funds |
| | | | | |
James D. Vaughn – 1945 Trustee | | 2019 | | Retired Formerly: Managing Partner, Deloitte & Touche LLP; Trustee and Chairman of the Audit Committee, Schroder Funds; Board Member, Mile High United Way, Boys and Girls Clubs, Boy Scouts, Colorado Business Committee for the Arts, Economic Club of Colorado and Metro Denver Network (economic development corporation); and Trustee of certain Oppenheimer Funds | | 229 | | Board member and Chairman of Audit Committee of AMG National Trust Bank; Trustee and Investment Committee member, University of South Dakota Foundation; Board member, Audit Committee Member and past Board Chair, Junior Achievement(non-profit) |
| | | | | |
Christopher L. Wilson – 1957 Trustee, Vice Chair and Chair Designate | | 2017 | | Retired Formerly: Director, TD Asset Management USA Inc. (mutual fund complex) (22 portfolios); Managing Partner, CT2, LLC (investing and consulting firm); President/Chief Executive Officer, Columbia Funds, Bank of America Corporation; President/Chief Executive Officer, CDC IXIS Asset Management Services, Inc.; Principal & Director of Operations, Scudder Funds, Scudder, Stevens & Clark, Inc.; Assistant Vice President, Fidelity Investments | | 229 | | ISO New England, Inc.(non-profit organization managing regional electricity market) |
52 INVESCO OPPENHEIMER MAIN STREET ALL CAP FUND
| | | | | | | | |
| | | | | |
Name, Year of Birth and
Position(s) Held with the Trust | | Trustee and/or Officer Since | | Principal Occupation(s) During Past 5 Years | | Number of Funds in Fund Complex Overseen by Trustee | | Other Directorship(s) Held by Trustee During Past 5 Years |
| | | | | |
OTHER OFFICERS | | | | | | | | |
| | | | | |
Sheri Morris — 1964 President, Principal Executive Officer and Treasurer | | 2003 | | Head of Global Fund Services, Invesco Ltd.; President, Principal Executive Officer and Treasurer, The Invesco Funds; Vice President, Invesco Advisers, Inc. (formerly known as Invesco Institutional (N.A.), Inc.) (registered investment adviser); and Vice President, Invesco Exchange-Traded Fund Trust, Invesco Exchange-Traded Fund Trust II, Invesco India Exchange-Traded Fund Trust, Invesco Actively Managed Exchange-Traded Fund Trust, Invesco Actively Managed Exchange-Traded Commodity Fund Trust and Invesco Exchange-Traded Self-Indexed Fund Trust, and Vice President, OppenheimerFunds, Inc. Formerly: Vice President and Principal Financial Officer, The Invesco Funds; Vice President, Invesco AIM Advisers, Inc., Invesco AIM Capital Management, Inc. and Invesco AIM Private Asset Management, Inc.; Assistant Vice President and Assistant Treasurer, The Invesco Funds and Assistant Vice President, Invesco Advisers, Inc., Invesco AIM Capital Management, Inc. and Invesco AIM Private Asset Management, Inc.; and Treasurer, Invesco Exchange-Traded Fund Trust, Invesco Exchange-Traded Fund Trust II, Invesco India Exchange-Traded Fund Trust and Invesco Actively Managed Exchange-Traded Fund Trust | | N/A | | N/A |
| | | | | |
Russell C. Burk — 1958 Senior Vice President and Senior Officer | | 2005 | | Senior Vice President and Senior Officer, The Invesco Funds | | N/A | | N/A |
| | | | | |
Jeffrey H. Kupor – 1968 Senior Vice President, Chief Legal Officer and Secretary | | 2018 | | Head of Legal of the Americas, Invesco Ltd.; Senior Vice President and Secretary, Invesco Advisers, Inc. (formerly known as Invesco Institutional (N.A.), Inc.) (registered investment adviser); Senior Vice President and Secretary, Invesco Distributors, Inc. (formerly known as Invesco AIM Distributors, Inc.); Vice President and Secretary, Invesco Investment Services, Inc. (formerly known as Invesco AIM Investment Services, Inc.) Senior Vice President, Chief Legal Officer and Secretary, The Invesco Funds; Secretary and General Counsel, Invesco Investment Advisers LLC (formerly known as Van Kampen Asset Management); Secretary and General Counsel, Invesco Capital Markets, Inc. (formerly known as Van Kampen Funds Inc.) and Chief Legal | | N/A | | N/A |
53 INVESCO OPPENHEIMER MAIN STREET ALL CAP FUND
TRUSTEES AND OFFICERSContinued
| | | | | | | | |
| | | | | |
Name, Year of Birth and
Position(s) Held with the Trust | | Trustee and/or Officer Since | | Principal Occupation(s) During Past 5 Years | | Number of Funds in Fund Complex Overseen by Trustee | | Other Directorship(s) Held by Trustee During Past 5 Years |
| | | | | |
OTHER OFFICERS (CONTINUED) | | | | | | | | |
| | | | | |
Jeffrey H. Kupor (Continued) | | | | Officer, Invesco Exchange-Traded Fund Trust, Invesco Exchange-Traded Fund Trust II, Invesco India Exchange-Traded Fund Trust, Invesco Actively Managed Exchange-Traded Fund Trust, Invesco Actively Managed Exchange- Traded Commodity Fund Trust and Invesco Exchange-Traded Self-Indexed Fund Trust; Secretary, Invesco Indexing LLC; Secretary, W.L. Ross & Co., LLC Formerly: Secretary and Vice President, Jemstep, Inc.; Head of Legal, Worldwide Institutional, Invesco Ltd.; Secretary and General Counsel, INVESCO Private Capital Investments, Inc.; Senior Vice President, Secretary and General Counsel, Invesco Management Group, Inc. (formerly known as Invesco AIM Management Group, Inc.); Assistant Secretary, INVESCO Asset Management (Bermuda) Ltd.; Secretary and General Counsel, Invesco Private Capital, Inc.; Assistant Secretary and General Counsel, INVESCO Realty, Inc.; Secretary and General Counsel, Invesco Senior Secured Management, Inc.; and Secretary, Sovereign G./P. Holdings Inc. | | | | |
| | | | | |
Andrew R. Schlossberg – 1974 Senior Vice President | | 2019 | | Head of the Americas and Senior Managing Director, Invesco Ltd.; Director and Senior Vice President, Invesco Advisers, Inc. (formerly known as Invesco Institutional (N.A.), Inc.) (registered investment adviser); Director and Chairman, Invesco Investment Services, Inc. (formerly known as Invesco AIM Investment Services, Inc.) (registered transfer agent); Senior Vice President, The Invesco Funds; Director, Invesco Investment Advisers LLC (formerly known as Van Kampen Asset Management); Director, President and Chairman, Invesco Insurance Agency, Inc. Formerly: Director, Invesco UK Limited; Director and Chief Executive, Invesco Asset Management Limited and Invesco Fund Managers Limited; Assistant Vice President, The Invesco Funds; Senior Vice President, Invesco Advisers, Inc. (formerly known as Invesco Institutional (N.A.), Inc.) (registered investment adviser); Director and Chief Executive, Invesco Administration Services | | N/A | | N/A |
54 INVESCO OPPENHEIMER MAIN STREET ALL CAP FUND
| | | | | | | | |
| | | | | |
Name, Year of Birth and
Position(s) Held with the Trust | | Trustee and/or Officer Since | | Principal Occupation(s) During Past 5 Years | | Number of Funds in Fund Complex Overseen by Trustee | | Other Directorship(s) Held by Trustee During Past 5 Years |
| | | | | |
OTHER OFFICERS (CONTINUED) | | | | | | | | |
| | | | | |
Andrew R. Schlossberg (Continued) | | | | Limited and Invesco Global Investment Funds Limited; Director, Invesco Distributors, Inc.; Head of EMEA, Invesco Ltd.; President, Invesco Actively Managed Exchange-Traded Commodity Fund Trust, Invesco Actively Managed Exchange-Traded Fund Trust, Invesco Exchange-Traded Fund Trust, Invesco Exchange-Traded Fund Trust II and Invesco India Exchange-Traded Fund Trust; Managing Director and Principal Executive Officer, Invesco Capital Management LLC | | | | |
| | | | | |
John M. Zerr — 1962 Senior Vice President | | 2006 | | Chief Operating Officer of the Americas; Senior Vice President, Invesco Advisers, Inc. (formerly known as Invesco Institutional (N.A.), Inc.) (registered investment adviser); Senior Vice President, Invesco Distributors, Inc. (formerly known as Invesco AIM Distributors, Inc.); Director and Vice President, Invesco Investment Services, Inc. (formerly known as Invesco AIM Investment Services, Inc.) Senior Vice President, The Invesco Funds; Managing Director, Invesco Capital Management LLC; Director, Invesco Investment Advisers LLC (formerly known as Van Kampen Asset Management); Senior Vice President, Invesco Capital Markets, Inc. (formerly known as Van Kampen Funds Inc.); Manager, Invesco Indexing LLC; Manager, Invesco Specialized Products, LLC; Director and Senior Vice President, Invesco Insurance Agency, Inc.; Member, Invesco Canada Funds Advisory Board; Director, President and Chief Executive Officer, Invesco Corporate Class Inc. (corporate mutual fund company); and Director, Chairman, President and Chief Executive Officer, Invesco Canada Ltd. (formerly known as Invesco Trimark Ltd./Invesco Trimark Ltèe) (registered investment adviser and registered transfer agent) Formerly: Director and Senior Vice President, Invesco Management Group, Inc. (formerly known as Invesco AIM Management Group, Inc.); Secretary and General Counsel, Invesco Management Group, Inc. (formerly known as Invesco AIM Management Group, Inc.); Secretary, Invesco Investment Services, Inc. (formerly known as Invesco AIM Investment Services, Inc.); Chief Legal Officer and | | N/A | | N/A |
55 INVESCO OPPENHEIMER MAIN STREET ALL CAP FUND
TRUSTEES AND OFFICERSContinued
| | | | | | | | |
| | | | | |
Name, Year of Birth and
Position(s) Held with the Trust | | Trustee and/or Officer Since | | Principal Occupation(s) During Past 5 Years | | Number of Funds in Fund Complex Overseen by Trustee | | Other Directorship(s) Held by Trustee During Past 5 Years |
| | | | | |
OTHER OFFICERS (CONTINUED) | | | | | | | | |
| | | | | |
John M. Zerr (Continued) | | | | Secretary, The Invesco Funds; Secretary and General Counsel, Invesco Investment Advisers LLC (formerly known as Van Kampen Asset Management); Secretary and General Counsel, Invesco Capital Markets, Inc. (formerly known as Van Kampen Funds Inc.); Chief Legal Officer, Invesco Exchange-Traded Fund Trust, Invesco Exchange-Traded Fund Trust II, Invesco India Exchange-Traded Fund Trust, Invesco Actively Managed Exchange-Traded Fund Trust, Invesco Actively Managed Exchange- Traded Commodity Fund Trust and Invesco Exchange-Traded Self-Indexed Fund Trust; Secretary, Invesco Indexing LLC; Director, Secretary, General Counsel and Senior Vice President, Van Kampen Exchange Corp.; Director, Vice President and Secretary, IVZ Distributors, Inc. (formerly known as INVESCO Distributors, Inc.); Director and Vice President, INVESCO Funds Group, Inc.; Director and Vice President, Van Kampen Advisors Inc.; Director, Vice President, Secretary and General Counsel, Van Kampen Investor Services Inc.; Director and Secretary, Invesco Distributors, Inc. (formerly known as Invesco AIM Distributors, Inc.); Director, Senior Vice President, General Counsel and Secretary, Invesco AIM Advisers, Inc. and Van Kampen Investments Inc.; Director, Vice President and Secretary, Fund Management Company; Director, Senior Vice President, Secretary, General Counsel and Vice President, Invesco AIM Capital Management, Inc.; Chief Operating Officer and General Counsel, Liberty Ridge Capital, Inc. (an investment adviser) | | | | |
| | | | | |
Gregory G. McGreevey - 1962 Senior Vice President | | 2012 | | Senior Managing Director, Invesco Ltd.; Director, Chairman, President, and Chief Executive Officer, Invesco Advisers, Inc. (formerly known as Invesco Institutional (N.A.), Inc.) (registered investment adviser); Director, Invesco Mortgage Capital, Inc. and Invesco Senior Secured Management, Inc.; and Senior Vice President, The Invesco Funds; and President, SNW Asset Management Corporation Formerly: Senior Vice President, Invesco | | N/A | | N/A |
56 INVESCO OPPENHEIMER MAIN STREET ALL CAP FUND
| | | | | | | | |
| | | | | |
Name, Year of Birth and
Position(s) Held with the Trust | | Trustee and/or Officer Since | | Principal Occupation(s) During Past 5 Years | | Number of Funds in Fund Complex Overseen by Trustee | | Other Directorship(s) Held by Trustee During Past 5 Years |
| | | | | |
OTHER OFFICERS (CONTINUED) | | | | | | | | |
| | | | | |
Gregory G. McGreevey (Continued) | | | | Management Group, Inc. and Invesco Advisers, Inc.; Assistant Vice President, The Invesco Funds | | | | |
| | | | | |
Kelli Gallegos – 1970 Vice President, Principal Financial Officer and Assistant Treasurer | | 2008 | | Principal Financial and Accounting Officer – Investments Pool, Invesco Specialized Products, LLC; Vice President, Principal Financial Officer and Assistant Treasurer, The Invesco Funds; Principal Financial and Accounting Officer – Pooled Investments, Invesco Capital Management LLC; Vice President and Treasurer, Invesco Exchange- Traded Fund Trust, Invesco Exchange-Traded Fund Trust II, Invesco India Exchange-Traded Fund Trust, Invesco Actively Managed Exchange-Traded Fund Trust, Invesco Actively Managed Exchange-Traded Commodity Fund Trust and Invesco Exchange-Traded Self-Indexed Fund Trust Formerly: Assistant Treasurer, Invesco Specialized Products, LLC; Assistant Treasurer, Invesco Exchange-Traded Fund Trust, Invesco Exchange-Traded Fund Trust II, Invesco India Exchange-Traded Fund Trust, Invesco Actively Managed Exchange-Traded Fund Trust, Invesco Actively Managed Exchange-Traded Commodity Fund Trust and Invesco Exchange-Traded Self-Indexed Fund Trust; Assistant Treasurer, Invesco Capital Management LLC; Assistant Vice President, The Invesco Funds | | N/A | | N/A |
| | | | | |
Crissie M. Wisdom – 1969 Anti-Money Laundering Compliance Officer | | 2013 | | Anti-Money Laundering Compliance Officer, Invesco Advisers, Inc. (formerly known as Invesco Institutional (N.A.), Inc.) (registered investment adviser), Invesco Capital Markets, Inc. (formerly known as Van Kampen Funds Inc.), Invesco Distributors, Inc., Invesco Investment Services, Inc., The Invesco Funds, and Invesco Exchange-Traded Fund Trust, Invesco Exchange-Traded Fund Trust II, Invesco India Exchange-Traded Fund Trust, Invesco Actively Managed Exchange-Traded Fund Trust, Invesco Actively Managed Exchange-Traded Commodity Fund Trust and Invesco Exchange-Traded Self-Indexed Fund Trust; Anti-Money Laundering Compliance Officer and Bank Secrecy Act Officer, INVESCO National Trust Company and Invesco Trust Company; and Fraud Prevention Manager and | | N/A | | N/A |
57 INVESCO OPPENHEIMER MAIN STREET ALL CAP FUND
TRUSTEES AND OFFICERSContinued
| | | | | | | | |
| | | | | |
Name, Year of Birth and
Position(s) Held with the Trust | | Trustee and/or Officer Since | | Principal Occupation(s) During Past 5 Years | | Number of Funds in Fund Complex Overseen by Trustee | | Other Directorship(s) Held by Trustee During Past 5 Years |
| | | | | |
| OTHER OFFICERS (CONTINUED) | | | | | | | | |
| | | | | |
| Crissie M. Wisdom (Continued) | | | | Controls and Risk Analysis Manager for Invesco Investment Services, Inc. Formerly: Anti-Money Laundering Compliance Officer, Van Kampen Exchange Corp. and Invesco Management Group, Inc. | | | | |
| | | | | |
| Robert R. Leveille – 1969 Chief Compliance Officer | | 2016 | | Chief Compliance Officer, Invesco Advisers, Inc. (registered investment adviser); and Chief Compliance Officer, The Invesco Funds Formerly: Chief Compliance Officer, Putnam Investments and the Putnam Funds | | N/A | | N/A |
The Statement of Additional Information of the Trust includes additional information about the Fund’s Trustees and is available upon request, without charge, by calling 1.800.959.4246. Please refer to the Fund’s Statement of Additional Information for information on the Fund’ssub-advisers.
| | | | | | |
| Office of the Fund | | Investment Adviser | | Distributor | | Auditors |
11 Greenway Plaza, Suite 1000 Houston, TX 77046-1173 | | Invesco Advisers, Inc. 1555 Peachtree Street, N.E. Atlanta, GA 30309 | | Invesco Distributors, Inc. 11 Greenway Plaza, Suite 1000 Houston, TX 77046-1173 | | PricewaterhouseCoopers LLP 1000 Louisiana Street, Suite 5800 Houston, TX 77002-5021 |
| Counsel to the Fund | | Counsel to the | | Transfer Agent | | Custodian |
Stradley Ronon Stevens & Young, LLP 2005 Market Street, Suite 2600 Philadelphia, PA 19103-7018 | | Independent Trustees Goodwin Procter LLP 901 New York Avenue, N.W. Washington, D.C. 20001 | | Invesco Investment Services, Inc. 11 Greenway Plaza, Suite 1000 Houston, TX 77046-1173 | | Brown Brothers Harriman & Co. 40 Water Street Boston, MA 02109-3661 |
58 INVESCO OPPENHEIMER MAIN STREET ALL CAP FUND
Invesco recognizes the importance of protecting your personal and financial information when you visit our website located atwww.invesco.com (the “Website”). The following information is designed to help you understand the information collection practices at this Website. We will not sell, share or rent your personally identifiable information to others in contravention of this Privacy Policy. When we refer to ourselves as “we” or “Invesco” in this Privacy Policy, we mean our entire company including our affiliates, such as subsidiaries.
By visiting this Website, you are accepting the practices described in this Privacy Policy. If you do not agree to this policy, you may not use this Website. This Privacy Policy is subject to change without notice, from time to time in our sole discretion. You acknowledge that by accessing the Website after we have posted changes to this Privacy Policy, you are agreeing to this Privacy Policy as modified. Please review the Terms of Use1 to learn of other terms and conditions applicable to your use of the Website.
Please note that this Privacy Policy is not an exclusive statement of our privacy principles across all products and services. Other privacy principles or policies may apply depending on the products or services you obtain from Invesco, or the jurisdiction in which you transact with Invesco.
This Privacy Policy was last updated on May 6, 2018.
Information We Collect and Use
We collect personal information you choose to submit to the Website in order to process transactions requested by you and meet our contractual obligations. For example, you can choose to provide your name, contact information, social security number, or tax identification number in connection with accessing your account, or you can choose to provide your personal information when you fill out a secure account question form. Any information collected about you from the Website can, from time to time, be associated with other identifying information we have about you.
In addition, we may gather information about you automatically through your use of the Website, e.g. your IP address, how you navigate the Website, the organization from which you are accessing the Website, and the websites that you access before and after you visit the Website.
When you access the Website, we may also collect information such as unique device identifiers, your screen resolution and other device settings, information about your location, and analytical information about how you use the device from which you are viewing the Website. Where applicable, we may ask your permission before collecting certain information, such as precise geolocation information.
From time to time, we use or augment the personal information we have about you with information obtained from third parties. For example, we use third party information to confirm contact or financial information or to better understand your interests by associating demographic information from third parties with the information you have provided.
How We Use Personal Information
We use your personal information to respond to your inquiries and provide the products and services you request. We also use your information from time to time to deliver the content and services we believe
1NTD
59 INVESCO OPPENHEIMER MAIN STREET ALL CAP FUND
|
INVESCO’S PRIVACY NOTICEContinued |
you will find the most relevant and to provide customer service and support.
We also use the information you provide to further develop and improve our products and services. We aggregate and/orde-identify data about visitors to the Website for various business purposes including product and service development and improvement activities.
How We Share Personal Information
We collaborate with other companies and individuals to perform services for us and on our behalf and we collaborate with our affiliates, other companies and individuals with respect to particular products or services (“Providers”). Examples of Providers include data analysis firms, customer service and support providers, email and SMS vendors, andweb-hosting and development companies. Some Providers collect information for us or on our behalf on our Website. These Providers can be provided with access to personal information needed to perform their functions.
We reserve the right to disclose your personal information as required by law, when we believe disclosure is necessary to comply with a regulatory requirement, judicial proceeding, court order or legal process served on us, to protect the safety, rights or property of our customers, the public or Invesco or to enforce the Terms of Use.
If we sell or transfer a business unit (such as a subsidiary) or an asset (such as a website) to another company, we will share your personal information with such company. You will receive notice of such an event and the new entity will inform you of any changes to the practices in this Privacy Policy. If the new entity wishes to make additional use of your information, you have the right to decline such use at that time.
We occasionally disclose aggregate orde-identified data that is not personally identifiable with third parties.
Cookies and Other Tools
Invesco and its Providers collect information about you by using cookies, tracking pixels and other technologies. We use this information to better understand, customize and improve user experience with our websites, services and offerings as well as to manage our advertising. For example, we use web analytics services that use these technologies to gather information to help us understand how visitors engage with and navigate our Website, e.g., how and when pages in a site are visited and by how many visitors. We are also able to offer our visitors a more customized, relevant experience on our sites using these technologies by delivering content and functionality based on your preferences and interests.
Depending on their purpose, some cookies will only operate for the length of a single browsing session, while others have a longer life span to ensure that they fulfill their longer-term purposes. Your web browser can be set to allow you to control whether you will accept cookies or reject cookies, to notify you each time a cookie is sent to your browser, or to delete cookies that have already been set. If your browser is set to reject cookies, certain aspects of the Website that are cookie-enabled will not recognize you when you return to the website, and some Website functionality may be lost. The “Help” section of your browser may tell you how to prevent your browser from accepting cookies. To find out more about cookies, visitwww.aboutcookies.org.
60 INVESCO OPPENHEIMER MAIN STREET ALL CAP FUND
Security
No data transmission over the internet can be 100% secure, so Invesco cannot ensure or warrant the security of any information you submit to us on this Website. However, Invesco seeks to protect your personal information from unauthorized access or use when you transact business on our Website using technical, administrative and procedural measures. Invesco makes no representation as to the reasonableness, efficacy, or appropriateness of the measures we use to safeguard such information.
Users are responsible for maintaining the secrecy of their own passwords. If you have reason to believe that your interaction with us is no longer secure (for example, if you feel that the security of any account you might have with us has been compromised), please immediately notify us by contacting us as specified below.
Transfer of Data to Other Countries
Any information you provide to Invesco through use of the Website may be stored and processed, transferred between and accessed from the United States, Canada and other countries which do not guarantee the same level of protection of personal information as the one in which you reside. However, Invesco will handle your personal information in accordance with this Privacy Policy regardless of where your personal information is stored/accessed.
Children’s Privacy
We are committed to protecting the privacy of children. We do not knowingly collect personal information from children under the age of 18. If you are under the age of 18, do not provide us with any personal information.
Contact Us
Please contact us if you have any questions or concerns about your personal information or require assistance in managing your choices.
Invesco Ltd.
1555 Peachtree St. NE
Atlanta, GA 30309
By phone:
(404)439-3236
By fax:
(404)962-8288
By email:
Anne.Gerry@invesco.com
Please update your account information by logging in or contact us by email or telephone as specified above to update your account information whenever such information ceases to be complete or accurate.
You may also contact us to:
61 INVESCO OPPENHEIMER MAIN STREET ALL CAP FUND
| | |
| | INVESCO’S PRIVACY NOTICEContinued |
| | · | | Request that we amend, rectify, delete or update the personal data we hold about you; |
| | · | | Where possible (e.g. in relation to marketing) amend or update your choices around processing; |
| | · | | Request a copy of personal data held by us. |
Disclaimer
Where the Website contains links to third-party websites/content/services that are not owned or controlled by Invesco, Invesco is not responsible for how these properties operate or treat your personal information so we recommend that you read the privacy policies and terms associated with these third party properties carefully.
62 INVESCO OPPENHEIMER MAIN STREET ALL CAP FUND
THIS PAGE INTENTIONALLY LEFT BLANK.
| | | | |
Explore High-Conviction Investing with Invesco 
| | | | |
Go paperless with eDelivery | | | | |
| Visit invesco.com/edelivery to enjoy the convenience and security of anytime electronic access to your investment documents. | | | | |
| |
With eDelivery, you can elect to have any or all of the following materials delivered straight to your inbox to download, save and print from your own computer: | | | | |
∎ Fund reports and prospectuses | | | | |
∎ Quarterly statements | | | | |
∎ Daily confirmations | | | | |
∎ Tax forms | | | | |
Invesco mailing information | | | | |
| Send general correspondence to Invesco Investment Services, Inc., P.O. Box 219078, Kansas City, MO 64121-9078. | | | | |
| |
| | |  | |
| |
| Invesco Distributors, Inc. | | | O-MSA-AR-1 12272019 | |
ITEM 2. CODE OF ETHICS.
There were no amendments to the Code of Ethics (the “Code”) that applies to the Registrant’s Principal Executive Officer (“PEO”) and Principal Financial Officer (“PFO”) during the period covered by the report. The Registrant did not grant any waivers, including implicit waivers, from any provisions of the Code to the PEO or PFO during the period covered by this report.
ITEM 3. AUDIT COMMITTEE FINANCIAL EXPERT.
The Board of Trustees has determined that the Registrant has at least one audit committee financial expert serving on its Audit Committee. The Audit Committee financial experts are David C. Arch, Bruce L. Crockett, Cynthia Hostetler, Elizabeth Krentzman, Anthony J. LaCava, Jr., Teresa M. Ressel, Raymond Stickel, Jr. Robert C. Troccoli and James Vaughn. David C. Arch, Bruce L. Crockett, Cynthia Hostetler, Elizabeth Krentzman, Anthony J. LaCava, Jr., Teresa M. Ressel, Raymond Stickel, Jr. Robert C. Troccoli and James Vaughn are “independent” within the meaning of that term as used in FormN-CSR.
ITEM 4. PRINCIPAL ACCOUNTANT FEES AND SERVICES.
During the reporting period, PricewaterhouseCoopers LLC (“PwC”) advised the Audit Committee of the following matters for consideration under the SEC’s auditor independence rules. PwC advised the Audit Committee that a PwC Director, a PwC Manager and a PwC Senior Associate each held financial interests in investment companies within the Invesco Fund Complex that were inconsistent with the requirements of Rule2-01(c)(1) of RegulationS-X. PwC noted, among other things, that during the time of its audit, the engagement team was not aware of the investments, (or with respect to the PwC Senior Associate was not aware until after the investments were confirmed as SEC exceptions), the individuals were not in the chain of command of the audit or the audit partners of Invesco or the affiliate of the Registrant, the services each individual provided were not relied upon by the audit engagement team with respect to the audit of the Registrant or its affiliates (or with respect to the PwC Senior Associate, the services were performed by an individual who did not have decision-making responsibility for matters that materially affected the audit and were reviewed by team members at least two levels higher than the PwC Senior Associate), and the investments were not material to the net worth of each individual or their respective immediate family members which PwC considered in reaching its conclusion. PwC advised the Audit Committee that it believes its objectivity and impartiality had not been adversely affected by these matters as they related to the audit of the Registrant.
On May 24, 2019, certain investment advisor subsidiaries of Invesco Ltd. assumed management responsibility from Oppenheimer Funds, Inc. (“OFI”) for 83open-end mutual funds and 20 exchange-traded funds (collectively, the “Oppenheimer Funds”). Assumption of management responsibility for the Oppenheimer Funds was accomplished through the reorganization of each Oppenheimer Fund into a new Invesco shell fund (collectively, the “New Invesco Funds”) that did not havepre-existing assets (together, the “Reorganizations”). The Reorganizations were part of the acquisition by Invesco Ltd. (together with its subsidiaries, “Invesco”) of the asset management business of OFI (including the Oppenheimer Funds) from Massachusetts Mutual Life Insurance Company (“MassMutual”), which was also consummated on May 24, 2019 (the “Acquisition”). Subsequent to the Acquisition, MassMutual became a significant shareholder of Invesco, and the Invesco Ltd. board of directors expanded by one director with the addition of a director selected by MassMutual.
Prior to the consummation of the Acquisition and the Reorganizations on May 24, 2019, PwC completed an independence assessment to evaluate the services and relationships with OFI and its affiliates, which became affiliates of Invesco upon the closing of the Acquisition. The assessment identified the following relationship and services that are inconsistent with the auditor independence rules under Rule2-01 of
RegulationS-X (“Rule2-01”) if provided to an affiliate of an audit client. A retired PwC partner who receives a benefit from PwC that is not fully funded, served as a member of Audit Committee of the Boards of Trustees of certain Oppenheimer Funds prior to the Acquisition (the“Pre-Reorganization Relationship”). Additionally, PwC provided certainnon-audit services including, expert legal services to one Oppenheimer Fund, custody of client assets in connection with payroll services, anon-audit service performed pursuant to a success-based fee,non-audit services in which PwC acted as an advocate on behalf of a MassMutual foreign affiliate and certain employee activities undertaken in connection with the provision ofnon-audit services for MassMutual and certain MassMutual foreign affiliates (collectively, the“Pre-Reorganization Services”).
PwC and the Audit Committees of the New Invesco Funds each considered the impact that thePre-Reorganization Relationship and Services have on PwC’s independence with respect to the New Invesco Funds. On the basis of the nature of the relationship and services performed, and in particular the mitigating factors described below, PwC concluded that a reasonable investor, possessing knowledge of all the relevant facts and circumstances regarding thePre-Reorganization Relationship and Services, would conclude that thePre-Reorganization Relationship and Services do not impair PwC’s ability to exhibit the requisite objectivity and impartiality to report on the financial statements of the New Invesco Funds for the years ending May 31, 2019 – April 30, 2020 (“PwC’s Conclusion”).
The Audit Committees of the Boards of Trustees of the New Invesco Funds, based upon PwC’s Conclusion and the concurrence of Invesco, considered the relevant facts and circumstances including the mitigating factors described below and, after careful consideration, concluded that PwC is capable of exercising objective and impartial judgment in connection with its audits of the financial statements of the New Invesco Funds that the respective Boards of Trustees oversee.
Mitigating factors that PwC and the Audit Committees considered in reaching their respective conclusions included, among others, the following factors:
| · | | none of thePre-Reorganization Relationship or Services created a mutuality of interest between PwC and the New Invesco Funds; |
| · | | PwC will not act in a management or employee capacity for the New Invesco Funds or their affiliates during any portion of PwC’s professional engagement period; |
| · | | other than the expert legal services,Pre-Reorganization Services that have been provided to OFI, MassMutual and their affiliates do not have any impact on the financial statements of the New Invesco Funds; |
| · | | as it relates to the expert legal services, while the service provided by PwC related to litigation involving one Oppenheimer Fund, the impact of the litigation on the Oppenheimer Fund’s financial statements was based upon OFI’s decision, and OFI management represented that the PwC service was not considered a significant component of its decision; |
| · | | while certain employees of OFI who were involved in the financial reporting process of the Oppenheimer Funds will be employed by Invesco subsequent to the Reorganizations, existing officers of other Invesco Funds will serve as Principal Executive Officer and Principal Financial Officer or equivalent roles for the New Invesco Funds, and are ultimately responsible for the accuracy of all financial statement assertions for the entirety of the financial reporting periods for the New Invesco Funds; |
| · | | thePre-Reorganization Services giving rise to the lack of independence were provided to, or entered into with, OFI, MassMutual and their affiliates at a time when PwC had no independence restriction with respect to these entities; |
| · | | with the exception of the expert legal service provided to one Oppenheimer Fund, none of thePre-Reorganization Services affected the operations or financial reporting of the New Invesco Funds; |
| · | | thePre-Reorganization Services provided by PwC to OFI, MassMutual and their affiliates were performed by persons who were not, and will not be, part of the audit engagement team for the New Invesco Funds; and |
| · | | the fees associated with thePre-Reorganization Services were not material to MassMutual, Invesco or PwC. |
(a) to (d)
Item 4. Principal Accountant Fees and Services
Fees Billed by PwC Related to the Registrant
PwC billed the Registrant aggregate fees for services rendered to the Registrant for the last two fiscal years as shown in the following table. The Audit Committeepre-approved all audit andnon-audit services provided to the Registrant.
| | | | | | | | | | | | | | |
| | | Fees Billed by PwC for Services
Rendered to the Registrant for
fiscal year end 2019 | | Fees Billed by PwC for Services
Rendered to the Registrant for
fiscal year end 2018 | |
| | | | |
Audit Fees | | | $ 152,469 | | | | | | $ 101,075 | | | | | |
Audit-Related Fees | | | $ 0 | | | | | | $ 0 | | | | | |
Tax Fees(1) | | | $ 103,385 | | | | | | $ 60,193 | | | | | |
All Other Fees | | | $ 0 | | | | | | $ 0 | | | | | |
Total Fees | | | $ 255,854 | | | | | | $ 161268 | | | | | |
| (g) PwC billed the Registrant aggregatenon-audit fees of $103,385 for the fiscal year ended 2019, and $60,193 for the fiscal year ended 2018, fornon-audit services rendered to the Registrant. | | | | | |
| | (1) | Tax Fees for the fiscal year end October 31, 2019 include fees billed for preparation of U.S. Tax Returns and Taxable Income calculations, including excise tax andyear-to-date estimates for variousbook-to-tax differences. Tax Fees for the fiscal year end October 31, 2018 include fees billed for reviewing tax returns and/or services related to tax compliance. |
Fees Billed by PwC Related to Invesco and Invesco Affiliates
PwC billed Invesco Advisers, Inc. (“Invesco”), the Registrant’s investment adviser, and any entity controlling, controlled by or under common control with Invesco that provides ongoing services to the Registrant (“Invesco Affiliates”) aggregate fees forpre-approvednon-audit services rendered to Invesco and Invesco Affiliates for the last two fiscal years as shown in the following table. The Audit Committeepre-approved allnon-audit services provided to Invesco and Invesco Affiliates that were required topre-approved.
| | | | | | | | | | |
| | | Fees Billed for Non-Audit Services Rendered to
Invesco and Invesco Affiliates for fiscal year end
2019 That Were Required to bePre-Approved by the Registrant’s Audit Committee | | Fees Billed for Non-Audit Services
Rendered to Invesco and Invesco
Affiliates for fiscal year end 2018 That
Were Required to bePre-Approved by the Registrant’s Audit Committee |
Audit-Related Fees(1) | | | $ | 690,000 | | | | $ | 662,000 | |
Tax Fees | | | $ | 0 | | | | $ | 0 | |
All Other Fees | | | $ | 0 | | | | $ | 0 | |
| | | | | | | | | | |
Total Fees | | | $ | 690,000 | | | | $ | 662,000 | |
| (1) | Audit-Related Fees for the fiscal years ended 2019 and 2018 include fees billed related to reviewing controls at a service organization. |
|
(e)(2) There were no amounts that werepre-approved by the Audit Committee pursuant to the de minimis exception under Rule2-01 of RegulationS-X. |
(f) Not applicable.
(g) Including the fees for services not required to bepre-approved by the registrant’s audit committee, PwC billed Invesco and Invesco Affiliates aggregatenon-audit fees of $3,984,000 for the fiscal year ended October 31, 2019, and $3,639,000 for the fiscal year ended October 31, 2018, fornon-audit services rendered to Invesco and Invesco Affiliates.
PwC provided audit services to the Investment Company complex of approximately $34 million.
(h) The Audit Committee also has considered whether the provision ofnon-audit services that were rendered to Invesco and Invesco Affiliates that were not required to bepre-approved pursuant to SEC regulations, if any, is compatible with maintaining PwC’s independence.
(e)(1)
PRE-APPROVAL OF AUDIT ANDNON-AUDIT SERVICES
POLICIES AND PROCEDURES
As adopted by the Audit Committees
of the Invesco Funds (the “Funds”)
Last Amended March 29, 2017
| | I. | Statement of Principles |
The Audit Committees (the “Audit Committee”) of the Boards of Trustees of the Funds (the “Board”) have adopted these policies and procedures (the “Procedures”) with respect to thepre-approval of audit andnon-audit services to be provided by the Funds’ independent auditor (the “Auditor”) to the Funds, and to the Funds’ investment adviser(s) and any entity controlling, controlled by, or under common control with the investment adviser(s) that provides ongoing services to the Funds (collectively, “Service Affiliates”).
Under Section 202 of the Sarbanes-Oxley Act of 2002, all audit andnon-audit services provided to the Funds by the Auditor must be preapproved by the Audit Committee. Rule2-01 of RegulationS-X requires that the Audit Committee alsopre-approve a Service Affiliate’s engagement of the Auditor fornon-audit services if the engagement relates directly to the operations and financial reporting of the Funds (a “Service Affiliate’s Covered Engagement”).
These Procedures set forth the procedures and the conditions pursuant to which the Audit Committee maypre-approve audit andnon-audit services for the Funds and a Service Affiliate’s Covered Engagement pursuant to rules and regulations of the Securities and Exchange Commission (“SEC”) and other organizations and regulatory bodies applicable to the Funds (“Applicable Rules”).1 They address both generalpre-approvals without consideration of specificcase-by-case services (“general pre-approvals”) and pre-approvals on acase-by-case basis
1 Applicable Rules include, for example, New York Stock Exchange (“NYSE”) rules applicable to closed-end funds managed by Invesco and listed on NYSE.
(“specific pre-approvals”). Any services requiringpre-approval that are not within the scope of generalpre-approvals hereunder are subject to specificpre-approval. These Procedures also address the delegation by the Audit Committee ofpre-approval authority to the Audit Committee Chair or Vice Chair.
| | II. | Pre-Approval of Fund Audit Services |
The annual Fund audit services engagement, including terms and fees, is subject to specificpre-approval by the Audit Committee. Audit services include the annual financial statement audit and other procedures required to be performed by an independent auditor to be able to form an opinion on the Funds’ financial statements. The Audit Committee will receive, review and consider sufficient information concerning a proposed Fund audit engagement to make a reasonable evaluation of the Auditor’s qualifications and independence. The Audit Committee will oversee the Fund audit services engagement as necessary, including approving any changes in terms, audit scope, conditions and fees.
In addition to approving the Fund audit services engagement at least annually and specifically approving any changes, the Audit Committee may generally or specificallypre-approve engagements for other audit services, which are those services that only an independent auditor reasonably can provide. Other audit services may include services associated with SEC registration statements, periodic reports and other documents filed with the SEC.
| | III. | General and SpecificPre-Approval ofNon-Audit Fund Services |
The Audit Committee will consider, at least annually, the list of GeneralPre-ApprovedNon-Audit Services which list may be terminated or modified at any time by the Audit Committee. To inform the Audit Committee’s review and approval of GeneralPre-ApprovedNon-Audit Services, the Funds’ Treasurer (or his or her designee) and Auditor shall provide such information regarding independence or other matters as the Audit Committee may request.
Any services or fee ranges that are not within the scope of GeneralPre-ApprovedNon-Audit Services have not received generalpre-approval and require specificpre-approval. Each request for specificpre-approval by the Audit Committee for services to be provided by the Auditor to the Funds must be submitted to the Audit Committee by the Funds’ Treasurer (or his or her designee) and must include detailed information about the services to be provided, the fees or fee ranges to be charged, and other relevant information sufficient to allow the Audit Committee to consider whether topre-approve such engagement, including evaluating whether the provision of such services will impair the independence of the Auditor and is otherwise consistent with Applicable Rules.
| | IV. | Non-Audit Service Types |
The Audit Committee may provide either general or specificpre-approval of audit-related, tax or other services, each as described in more detail below.
“Audit-related services” are assurance and related services that are reasonably related to the performance of the audit or review of the Fund’s financial statements or that are traditionally performed by an independent auditor. Audit-related services include, among others, accounting consultations related to accounting, financial reporting or disclosure matters not classified as “Audit services”; assistance with understanding and implementing new accounting and financial reporting guidance from rulemaking authorities; services related to mergers, acquisitions or dispositions; compliance with ratings agency requirements and interfund lending activities; and assistance with internal control reporting requirements.
“Tax services” include, but are not limited to, the review and signing of the Funds’ federal tax returns, the review of required distributions by the Funds and consultations regarding tax matters such as the tax treatment of new investments or the impact of new regulations. The Audit Committee will not approve proposed services of the Auditor which the Audit Committee believes are to be provided in connection with a service or transaction initially recommended by the Auditor, the sole business purpose of which may be tax avoidance and the tax treatment of which may not be supported in the Internal Revenue Code and related regulations. The Audit Committee will consult with the Funds’ Treasurer (or his or her designee) and may consult with outside counsel or advisers as necessary to ensure the consistency of tax services rendered by the Auditor with the foregoing policy. The Auditor shall not represent any Fund or any Service Affiliate before a tax court, district court or federal court of claims.
Each request to provide tax services under either the general or specificpre-approval of the Audit Committee will include a description from the Auditor in writing of (i) the scope of the service, the fee structure for the engagement, and any side letter or other amendment to the engagement letter, or any other agreement (whether oral, written, or otherwise) between the Auditor and the Funds, relating to the service; and (ii) any compensation arrangement or other agreement, such as a referral agreement, a referral fee orfee-sharing arrangement, between the Auditor (or an affiliate of the Auditor) and any person (other than the Funds or Service Affiliates receiving the services) with respect to the promoting, marketing, or recommending of a transaction covered by the service. The Auditor will also discuss with the Audit Committee the potential effects of the services on the independence of the Auditor, and document the substance of its discussion with the Audit Committee.
The Audit Committee maypre-approve other non-audit services so long as the Audit Committee believes that the service will not impair the independence of the Auditor.Appendix I includes a list of services that the Auditor is prohibited from performing by the SEC rules.Appendix I also includes a list of services that would impair the Auditor’s independence unless the Audit Committee reasonably concludes that the results of the services will not be subject to audit procedures during an audit of the Funds’ financial statements.
| | V. | Pre-Approval of Service Affiliate’s Covered Engagements |
Rule2-01 of RegulationS-X requires that the Audit Committeepre-approve a Service Affiliate’s engagement of the Auditor fornon-audit services if the engagement relates directly to the operations and financial reporting of the Funds, defined above as a “Service Affiliate’s Covered Engagement”.
The Audit Committee may provide either general or specificpre-approval of any Service Affiliate’s Covered Engagement, including for audit-related, tax or other services, as described above, if the Audit Committee believes that the provision of the services to a Service Affiliate will not impair the independence of the Auditor with respect to the Funds. Any Service Affiliate’s Covered Engagements that are not within the scope of GeneralPre-ApprovedNon-Audit Services have not received generalpre-approval and require specificpre-approval.
Each request for specificpre-approval by the Audit Committee of a Service Affiliate’s Covered Engagement must be submitted to the Audit Committee by the Funds’ Treasurer (or his or her designee)and must include detailed information about the services to be provided, the fees or fee ranges to be charged, a description of the current status of thepre-approval process involving other audit committees in the Invesco investment company complex (as defined in Rule2-201 of RegulationS-X) with respect to the proposed engagement, and other relevant information sufficient to allow the Audit Committee to consider whether the provision of such services will impair the independence of the Auditor from the Funds. Additionally, the Funds’ Treasurer (or his or her designee) and the Auditor will provide the Audit Committee with a statement that the proposed engagement requirespre-approval by the Audit Committee, the proposed engagement, in their view, will not impair the independence of the Auditor and is consistent with Applicable Rules, and the description of the proposed engagement provided to the Audit Committee is consistent with that presented to or approved by the Invesco audit committee.
Information about all Service Affiliate engagements of the Auditor fornon-audit services, whether or not subject topre-approval by the Audit Committee, shall be provided to the Audit Committee at least quarterly, to allow the Audit Committee to consider whether the provision of such services is compatible with maintaining the Auditor’s independence from the Funds. The Funds’ Treasurer and Auditor shall provide the Audit Committee with sufficiently detailed information about the scope of services provided and the fees for such services, to ensure that the Audit Committee can adequately consider whether the provision of such services is compatible with maintaining the Auditor’s independence from the Funds.
| | VI. | Pre-Approved Fee Levels or Established Amounts |
Pre-approved fee levels or ranges for audit andnon-audit services to be provided by the Auditor to the Funds, and for a Service Affiliate’s Covered Engagement, under generalpre-approval or specificpre-approval will be set periodically by the Audit Committee. Any proposed fees exceeding 110% of the maximumpre-approved fee levels or ranges for such services or engagements will be promptly presented to the Audit Committee and will require specificpre-approval by the Audit Committee before payment of any additional fees is made.
The Audit Committee hereby delegates, subject to the dollar limitations set forth below, specific authority to its Chair, or in his or her absence, Vice Chair, topre-approve audit andnon-audit services proposed to be provided by the Auditor to the Funds and/or a Service Affiliate’s Covered Engagement, between Audit Committee meetings. Such delegation does not preclude the Chair or Vice Chair from declining, on a case by case basis, to exercise his or her delegated authority and instead convening the Audit Committee to consider andpre-approve any proposed services or engagements.
Notwithstanding the foregoing, the Audit Committee mustpre-approve: (a) anynon-audit services to be provided to the Funds for which the fees are estimated to exceed $500,000; (b) any Service Affiliate’s Covered Engagement for which the fees are estimated to exceed $500,000; or (c) any cost increase to any previously approved service or engagement that exceeds the greater of $250,000 or 50% of the previously approved fees up to a maximum increase of $500,000.
| | VIII. | Compliance with Procedures |
Notwithstanding anything herein to the contrary, failure topre-approve any services or engagements that are not required to bepre-approved pursuant to the de minimis exception provided for in Rule2-01(c)(7)(i)(C) of RegulationS-X shall not constitute a violation of these Procedures. The Audit Committee has designated the Funds’ Treasurer to ensure services and engagements arepre-approved in compliance with these Procedures. The Funds’ Treasurer will immediately report to the Chair of the Audit Committee, or the Vice Chair in his or her absence, any breach of these Procedures that comes to the attention of the Funds’ Treasurer or any services or engagements that are not required to bepre-approved pursuant to the de minimis exception provided for in Rule2-01(c)(7)(i)(C) of RegulationS-X.
On at least an annual basis, the Auditor will provide the Audit Committee with a summary of allnon-audit services provided to any entity in the investment company complex (as defined in section2-01(f)(14) of RegulationS-X, including the Funds and Service Affiliates) that were notpre-approved, including the nature of services provided and the associated fees.
| | IX. | Amendments to Procedures |
All material amendments to these Procedures must be approved in advance by the Audit Committee.Non-material amendments to these Procedures may be made by the Legal and Compliance Departments and will be reported to the Audit Committee at the next regularly scheduled meeting of the Audit Committee.
Appendix I
Non-Audit Services That May Impair the Auditor’s Independence
The Auditor is not independent if, at any point during the audit and professional engagement, the Auditor provides the followingnon-audit services:
| | · | | Broker-dealer, investment adviser, or investment banking services; |
| | · | | Expert services unrelated to the audit; |
| | · | | Any service or product provided for a contingent fee or a commission; |
| | · | | Services related to marketing, planning, or opining in favor of the tax treatment of confidential transactions or aggressive tax position transactions, a significant purpose of which is tax avoidance; |
| | · | | Tax services for persons in financial reporting oversight roles at the Fund; and |
| | · | | Any other service that the Public Company Oversight Board determines by regulation is impermissible. |
An Auditor is not independent if, at any point during the audit and professional engagement, the Auditor provides the followingnon-audit services unless it is reasonable to conclude that the results of the services will not be subject to audit procedures during an audit of the Funds’ financial statements:
| | · | | Bookkeeping or other services related to the accounting records or financial statements of the audit client; |
| | · | | Financial information systems design and implementation; |
| | · | | Appraisal or valuation services, fairness opinions, orcontribution-in-kind reports; |
| | · | | Actuarial services; and |
| | · | | Internal audit outsourcing services. |
| ITEM 5. | AUDIT COMMITTEE OF LISTED REGISTRANTS. |
Not applicable.
| ITEM 6. | SCHEDULE OF INVESTMENTS. |
Investments in securities of unaffiliated issuers is included as part of the reports to stockholders filed under Item 1 of this Form.
| ITEM 7. | DISCLOSURE OF PROXY VOTING POLICIES AND PROCEDURES FORCLOSED-END MANAGEMENT INVESTMENT COMPANIES. |
Not applicable.
| ITEM 8. | PORTFOLIO MANAGERS OFCLOSED-END MANAGEMENT COMPANIES. |
Not applicable.
| ITEM 9. | PURCHASES OF EQUITY SECURITIES BYCLOSED-END MANAGEMENT INVESTMENT COMPANY AND AFFILIATED PURCHASERS. |
Not applicable.
| ITEM 10. | SUBMISSION OF MATTERS TO A VOTE OF SECURITY HOLDERS. |
None
| ITEM 11. | CONTROLS AND PROCEDURES. |
| | (a) | As of December 18, 2019, an evaluation was performed under the supervision and with the participation of the officers of the Registrant, including the Principal Executive Officer (“PEO”) and Principal Financial Officer (“PFO”), to assess the effectiveness of the Registrant’s disclosure controls and procedures, as that term is defined in Rule30a-3(c) under the Investment Company Act of 1940 (“Act”), as amended. Based on that evaluation, the Registrant’s officers, including the PEO and PFO, concluded that, as of December 18, 2019, the Registrant’s disclosure controls and procedures were reasonably designed so as to ensure: (1) that information required to be disclosed by the Registrant on FormN-CSR is recorded, processed, summarized and reported within the time periods specified by the rules and forms of the Securities and Exchange Commission; and (2) that material information relating to the Registrant is made known to the PEO and PFO as appropriate to allow timely decisions regarding required disclosure. |
| | (b) | There have been no changes in the Registrant’s internal control over financial reporting (as defined in Rule30a-3(d) under the Act) that occurred during the period covered by this report that have materially affected, or are reasonably likely to materially affect, the Registrant’s internal control over financial reporting. |
| ITEM 12. | DISCLOSURE OF SECURITIES LENDING ACTIVITIES FORCLOSED-END MANAGEMENT INVESTMENT COMPANIES. |
Not applicable.
ITEM 13. EXHIBITS.
| | |
| 13(a) (1) | | Code of Ethics. |
| |
| 13(a) (2) | | Certifications of principal executive officer and principal financial officer as required by Rule30a-2(a) under the Investment Company Act of 1940. |
| |
| 13(a) (3) | | Not applicable. |
| |
| 13(a) (4) | | Registrant’s Independent Public Accountant, attached as Exhibit 99.ACCT |
| |
| 13(b) | | Certifications of principal executive officer and principal financial officer as required by Rule30a-2(b) under the Investment Company Act of 1940. |
SIGNATURES
Pursuant to the requirements of the Securities Exchange Act of 1934 and the Investment Company Act of 1940, the Registrant has duly caused this report to be signed on its behalf by the undersigned, thereunto duly authorized.
Registrant: AIM Equity Funds (Invesco Equity Funds)
| | |
By: | | /s/ Sheri Morris |
| | Sheri Morris |
| | Principal Executive Officer |
| |
Date: | | January 3, 2020 |
Pursuant to the requirements of the Securities and Exchange Act of 1934 and the Investment Company Act of 1940, this report has been signed below by the following persons on behalf of the Registrant and in the capacities and on the dates indicated.
| | |
By: | | /s/ Sheri Morris |
| | Sheri Morris |
| | Principal Executive Officer |
| |
Date: | | January 3, 2020 |
| |
By: | | /s/ Kelli Gallegos |
| | Kelli Gallegos |
| | Principal Financial Officer |
| |
Date: | | January 3, 2020 |