UNITED STATES
SECURITIES AND EXCHANGE COMMISSION
Washington, D.C. 20549
FORM N-CSR
CERTIFIED SHAREHOLDER REPORT OF REGISTERED
MANAGEMENT INVESTMENT COMPANIES
| | |
Investment Company Act file number | | 811-01424 |
AIM Equity Funds (Invesco Equity Funds)
(Exact name of registrant as specified in charter)
11 Greenway Plaza, Suite 1000 Houston, Texas 77046
(Address of principal executive offices) (Zip code)
Glenn Brightman 11 Greenway Plaza, Suite 1000 Houston, Texas 77046
(Name and address of agent for service)
| | | | |
Registrant’s telephone number, including area code: | | (713) 626-1919 | | |
| | | | | | |
Date of fiscal year end: | | 10/31 | | | | |
| | | |
Date of reporting period: | | 10/31/2023 | | | | |
| ITEM 1. | REPORTS TO STOCKHOLDERS. |
(a) The Registrant’s annual report transmitted to shareholders pursuant to Rule 30e-1 under the Investment Company Act of 1940 is as follows:

| | |
| | |
| Annual Report to Shareholders | | October 31, 2023 |
Invesco Charter Fund
Nasdaq:
A: CHTRX ∎ C: CHTCX ∎ R: CHRRX ∎ S: CHRSX ∎ Y: CHTYX ∎ R5: CHTVX ∎ R6: CHFTX
Management’s Discussion of Fund Performance
| | | | |
| | |
Performance summary | | | | |
For the fiscal year ended October 31, 2023, Class A shares of Invesco Charter Fund (the Fund), at net asset value (NAV), underperformed the Russell 1000 Index, the Fund’s style-specific benchmark. | |
Your Fund’s long-term performance appears later in this report. | | | | |
| | |
Fund vs. Indexes | | | | |
Total returns, 10/31/22 to 10/31/23, at net asset value (NAV). Performance shown does not include applicable contingent deferred sales charges (CDSC) or front-end sales charges, which would have reduced performance. | |
Class A Shares | | | 9.44 | % |
Class C Shares | | | 8.65 | |
Class R Shares | | | 9.17 | |
Class S Shares | | | 9.57 | |
Class Y Shares | | | 9.71 | |
Class R5 Shares | | | 9.81 | |
Class R6 Shares | | | 9.83 | |
S&P 500 Indexq (Broad Market Index) | | | 10.14 | |
Russell 1000 Indexq (Style-Specific Index) | | | 9.48 | |
| |
Source(s): qRIMES Technologies Corp. | | | | |
Market conditions and your Fund
Despite various domestic and global head-winds during the fiscal year, the overall US economy proved to be resilient. The US labor market remained tight with unemployment near historic lows while consumers continued to spend, complicating the US Federal Reserve’s (the Fed’s) efforts to tame inflation which had reached multi-decade highs. The Fed tightened monetary policy over the fiscal year, with multiple increases in its target rate during the fiscal year, before taking a long-awaited “pause” in June 2023. Inflation has trended lower over the fiscal year but has stayed above the Fed’s 2% target. The Fed held interest rates steady at its September and October 2023 meetings but signaled that interest rates could stay elevated for an extended length of time if inflation remains stubborn. COVID-19 lockdowns and related supply chain disruptions have moderated, although an uncertain global backdrop threatens to act as a headwind to the US economy. While risks remain, gross domestic product growth in the US has been above expectations and the much-anticipated recession has not yet arrived.
Amid this backdrop, US equity markets delivered a positive return during the fiscal year but were volatile and reactionary to inflation indicators and policy moves by the Fed. Large technology companies were among the leaders in US equities and buoyed the overall market, while smaller cap equities notably lagged. A banking crisis in March 2023 that saw the failure of US regional banks caused significant turmoil but Fed actions to stabilize the banking system sent markets higher and investors appeared to move on by April, supported by better-than-expected corporate earnings. Whether the economy eventually enters a recession remains an open question, but investors remain keenly focused on if tight monetary
conditions will sufficiently lower inflation without imperiling the forward outlook.
During the fiscal year, stock selection in the information technology and communication services were the largest contributors to the Fund’s performance relative to the Russell 1000 Index. This was offset by weaker stock selection in the industrials and financials sectors.
The largest individual contributors to the Fund’s performance relative to the Russell 1000 Index during the fiscal year included Meta Platforms, NVIDIA and Amazon.com. Meta Platforms outperformed as it returned to revenue growth and benefited from steps taken to optimize its cost structure and improve execution. NVIDIA experienced share price gains after management released guidance for full year earnings that was above consensus expectations as the company’s customers look to build out graphics processing units for generative AI (artificial intelligence). Amazon.com performed well driven by stronger-than-expected results and CEO Andy Jassy’s continued focus on streamlining businesses and costs.
The largest individual detractors to the Fund’s performance during the fiscal year included Pfizer, SVB Financial and Mosaic. Pfizer reported revenue below expectations and provided 2023 guidance below consensus due to higher operating costs as the company works to convert its COVID-19 products to a commercial model. SVB Financial was taken over by the Federal Deposit Insurance Corporation following a bank run precipitated by risk management and liquidity concerns among its concentrated depositor base. We did not own stock in SVB Financial at the end of the fiscal year. Mosaic was negatively affected by falling prices for potash and phosphates. Its distribution operations in Brazil suffered from sluggish demand and destocking of high-cost inventory.
We maintain our valuation discipline and our focus on companies with competitive advantages and skilled management teams that we believe are executing better than their peers. These companies historically tend to have higher profit margins and returns on invested capital, rising market shares and consistently strong pricing power. We believe this disciplined approach is essential to generating attractive long-term performance.
We thank you for your continued investment in Invesco Charter Fund.
Portfolio manager(s):
Belinda Cavazos - Lead
Magnus Krantz
Benjamin Ram
The views and opinions expressed in management’s discussion of Fund performance are those of Invesco Advisers, Inc. and its affiliates. These views and opinions are subject to change at any time based on factors such as market and economic conditions. These views and opinions may not be relied upon as investment advice or recommendations, or as an offer for a particular security. The information is not a complete analysis of every aspect of any market, country, industry, security or the Fund. Statements of fact are from sources considered reliable, but Invesco Advisers, Inc. makes no representation or warranty as to their completeness or accuracy. Although historical performance is no guarantee of future results, these insights may help you understand our investment management philosophy.
See important Fund and, if applicable, index disclosures later in this report.
Your Fund’s Long-Term Performance
Results of a $10,000 Investment – Oldest Share Class(es)
Fund and index data from 10/31/13
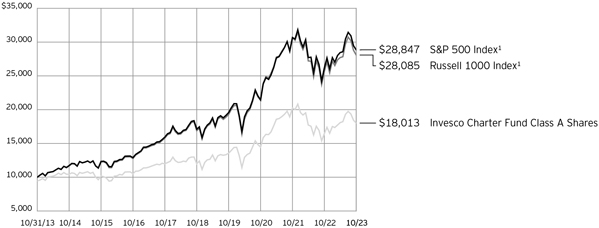
| 1 | Source: RIMES Technologies Corp. |
Past performance cannot guarantee future results.
The data shown in the chart include reinvested distributions, applicable sales charges and Fund expenses including management
fees. Index results include reinvested dividends, but they do not reflect sales charges. Performance of the peer group, if applicable, reflects fund expenses and management fees;
performance of a market index does not. Performance shown in the chart does not reflect deduction of taxes a shareholder would pay on Fund distributions or sale of Fund shares.
| | | | |
| |
Average Annual Total Returns | |
As of 10/31/23, including maximum applicable sales charges | |
Class A Shares | | | | |
Inception (11/26/68) | | | 10.10 | % |
10 Years | | | 6.06 | |
5 Years | | | 7.26 | |
1 Year | | | 3.41 | |
| |
Class C Shares | | | | |
Inception (8/4/97) | | | 5.59 | % |
10 Years | | | 6.02 | |
5 Years | | | 7.67 | |
1 Year | | | 7.65 | |
| |
Class R Shares | | | | |
Inception (6/3/02) | | | 6.66 | % |
10 Years | | | 6.40 | |
5 Years | | | 8.21 | |
1 Year | | | 9.17 | |
| |
Class S Shares | | | | |
Inception (9/25/09) | | | 8.35 | % |
10 Years | | | 6.77 | |
5 Years | | | 8.60 | |
1 Year | | | 9.57 | |
| |
Class Y Shares | | | | |
Inception (10/3/08) | | | 8.21 | % |
10 Years | | | 6.93 | |
5 Years | | | 8.74 | |
1 Year | | | 9.71 | |
| |
Class R5 Shares | | | | |
Inception (7/30/91) | | | 8.08 | % |
10 Years | | | 7.00 | |
5 Years | | | 8.81 | |
1 Year | | | 9.81 | |
| |
Class R6 Shares | | | | |
Inception (9/24/12) | | | 8.49 | % |
10 Years | | | 7.08 | |
5 Years | | | 8.88 | |
1 Year | | | 9.83 | |
Performance includes litigation proceeds. Had these proceeds not been received, total returns would have been lower.
The performance data quoted represent past performance and cannot guarantee future results; current performance may be lower or higher. Please visit invesco.com/performance for the most recent month-end performance. Performance figures reflect reinvested distributions, changes in net asset value and the effect of the maximum sales charge unless otherwise stated. Performance figures do not reflect deduction of taxes a shareholder would pay on Fund distributions or sale of Fund shares. Investment return and principal value will fluctuate so that you may have a gain or loss when you sell shares.
Class A share performance reflects the maximum 5.50% sales charge, and Class C share performance reflects the applicable contingent deferred sales charge (CDSC) for the period involved. The CDSC on Class C shares is 1% for the first year after purchase. Class R, Class S, Class Y, Class R5 and Class R6 shares do not have
a front-end sales charge or a CDSC; therefore, performance is at net asset value.
The performance of the Fund’s share classes will differ primarily due to different sales charge structures and class expenses.
Fund performance reflects any applicable fee waivers and/or expense reimbursements. Had the adviser not waived fees and/or reimbursed expenses currently or in the past, returns would have been lower. See current prospectus for more information.
Supplemental Information
Invesco Charter Fund’s investment objective is long-term growth of capital.
| ∎ | Unless otherwise stated, information presented in this report is as of October 31, 2023, and is based on total net assets. |
| ∎ | Unless otherwise noted, all data is provided by Invesco. |
| ∎ | To access your Fund’s reports/prospectus, visit invesco.com/fundreports. |
About indexes used in this report
| ∎ | The S&P 500® Index is an unmanaged index considered representative of the US stock market. |
| ∎ | The Russell 1000® Index is an unmanaged index considered representative of large-cap stocks. The Russell 1000 Index is a trademark/service mark of the Frank Russell Co. Russell® is a trademark of the Frank Russell Co. |
| ∎ | The Fund is not managed to track the performance of any particular index, including the index(es) described here, and consequently, the performance of the Fund may deviate significantly from the performance of the index(es). |
| ∎ | A direct investment cannot be made in an index. Unless otherwise indicated, index results include reinvested dividends, and they do not reflect sales charges. Performance of the peer group, if applicable, reflects fund expenses; performance of a market index does not. |
|
|
This report must be accompanied or preceded by a currently effective Fund prospectus, which contains more complete information, including sales charges and expenses. Investors should read it carefully before investing. |
|
| NOT FDIC INSURED | MAY LOSE VALUE | NO BANK GUARANTEE |
Fund Information
| | | | | |
| Portfolio Composition | | | | | |
| |
| By sector | | % of total net assets |
| |
Information Technology | | | | 25.83 | % |
| |
Financials | | | | 13.60 | |
| |
Health Care | | | | 13.06 | |
| |
Consumer Discretionary | | | | 10.12 | |
| |
Industrials | | | | 9.04 | |
| |
Communication Services | | | | 8.20 | |
| |
Consumer Staples | | | | 7.74 | |
| |
Energy | | | | 4.51 | |
| |
Materials | | | | 2.57 | |
| |
Real Estate | | | | 2.32 | |
| |
Utilities | | | | 2.22 | |
| |
Money Market Funds Plus Other Assets Less Liabilities | | | | 0.79 | |
| | | | | | | |
Top 10 Equity Holdings* | | | | | |
| | | | | % of total net assets |
| | |
1. | | Microsoft Corp. | | | | 8.68 | % |
| | |
2. | | Apple, Inc. | | | | 4.91 | |
| | |
3. | | Amazon.com, Inc. | | | | 4.87 | |
| | |
4. | | NVIDIA Corp. | | | | 3.77 | |
| | |
5. | | Alphabet, Inc., Class A | | | | 2.86 | |
| | |
6. | | Meta Platforms, Inc., Class A | | | | 2.78 | |
| | |
7. | | JPMorgan Chase & Co. | | | | 2.46 | |
| | |
8. | | UnitedHealth Group, Inc. | | | | 2.38 | |
| | |
9. | | Procter & Gamble Co. (The) | | | | 2.25 | |
| | |
10. | | Chevron Corp. | | | | 2.24 | |
The Fund’s holdings are subject to change, and there is no assurance that the Fund will continue to hold any particular security.
* Excluding money market fund holdings, if any.
Data presented here are as of October 31, 2023.
Schedule of Investments(a)
October 31, 2023
| | | | | | | | |
| | | Shares | | | Value | |
|
| |
Common Stocks & Other Equity Interests–99.21% | |
Aerospace & Defense–3.22% | |
Boeing Co. (The)(b) | | | 254,928 | | | $ | 47,625,649 | |
|
| |
Howmet Aerospace, Inc. | | | 620,415 | | | | 27,360,302 | |
|
| |
Huntington Ingalls Industries, Inc. | | | 68,315 | | | | 15,017,003 | |
|
| |
| | | | | | | 90,002,954 | |
|
| |
|
Agricultural & Farm Machinery–0.74% | |
Deere & Co. | | | 57,004 | | | | 20,826,981 | |
|
| |
|
Air Freight & Logistics–1.53% | |
United Parcel Service, Inc., Class B | | | 304,062 | | | | 42,948,758 | |
|
| |
|
Application Software–3.29% | |
Manhattan Associates, Inc.(b) | | | 157,462 | | | | 30,701,941 | |
|
| |
Synopsys, Inc.(b) | | | 70,555 | | | | 33,121,339 | |
|
| |
Tyler Technologies, Inc.(b)(c) | | | 76,182 | | | | 28,408,268 | |
|
| |
| | | | | | | 92,231,548 | |
|
| |
|
Asset Management & Custody Banks–1.39% | |
BlackRock, Inc. | | | 63,459 | | | | 38,854,677 | |
|
| |
|
Automobile Manufacturers–0.56% | |
Tesla, Inc.(b) | | | 78,383 | | | | 15,742,442 | |
|
| |
|
Automotive Parts & Equipment–1.26% | |
Aptiv PLC(b) | | | 403,446 | | | | 35,180,491 | |
|
| |
|
Biotechnology–1.10% | |
Gilead Sciences, Inc.(c) | | | 391,900 | | | | 30,779,826 | |
|
| |
|
Broadline Retail–4.87% | |
Amazon.com, Inc.(b) | | | 1,024,830 | | | | 136,394,625 | |
|
| |
|
Communications Equipment–1.42% | |
Motorola Solutions, Inc. | | | 142,641 | | | | 39,719,813 | |
|
| |
|
Construction Materials–0.86% | |
Vulcan Materials Co. | | | 122,560 | | | | 24,081,814 | |
|
| |
|
Consumer Finance–1.31% | |
American Express Co. | | | 250,502 | | | | 36,580,807 | |
|
| |
|
Consumer Staples Merchandise Retail–1.50% | |
Walmart, Inc. | | | 257,115 | | | | 42,015,162 | |
|
| |
|
Distillers & Vintners–1.58% | |
Constellation Brands, Inc., Class A | | | 188,917 | | | | 44,234,916 | |
|
| |
|
Distributors–0.84% | |
LKQ Corp. | | | 536,220 | | | | 23,550,782 | |
|
| |
|
Diversified Banks–2.46% | |
JPMorgan Chase & Co. | | | 494,613 | | | | 68,780,884 | |
|
| |
|
Diversified Financial Services–1.07% | |
Equitable Holdings, Inc. | | | 1,128,223 | | | | 29,976,885 | |
|
| |
|
Electrical Components & Equipment–1.59% | |
Emerson Electric Co. | | | 272,014 | | | | 24,201,085 | |
|
| |
Hubbell, Inc. | | | 75,018 | | | | 20,262,362 | |
|
| |
| | | | | | | 44,463,447 | |
|
| |
| | | | | | | | |
| | | Shares | | | Value | |
|
| |
Environmental & Facilities Services–1.03% | |
Republic Services, Inc. | | | 193,162 | | | $ | 28,682,625 | |
|
| |
|
Fertilizers & Agricultural Chemicals–0.99% | |
Mosaic Co. (The) | | | 851,876 | | | | 27,668,932 | |
|
| |
|
Health Care Equipment–2.67% | |
Baxter International, Inc. | | | 511,842 | | | | 16,599,036 | |
|
| |
Boston Scientific Corp.(b) | | | 544,935 | | | | 27,895,222 | |
|
| |
Zimmer Biomet Holdings, Inc. | | | 290,970 | | | | 30,380,178 | |
|
| |
| | | | | | | 74,874,436 | |
|
| |
|
Health Care Facilities–1.04% | |
HCA Healthcare, Inc. | | | 128,701 | | | | 29,104,444 | |
|
| |
|
Home Improvement Retail–1.13% | |
Lowe’s Cos., Inc. | | | 165,714 | | | | 31,580,117 | |
|
| |
|
Hotels, Resorts & Cruise Lines–1.46% | |
Airbnb, Inc., Class A(b) | | | 192,067 | | | | 22,719,605 | |
|
| |
Wyndham Hotels & Resorts, Inc.(c) | | | 248,637 | | | | 18,001,319 | |
|
| |
| | | | | | | 40,720,924 | |
|
| |
|
Household Products–2.25% | |
Procter & Gamble Co. (The) | | | 420,389 | | | | 63,070,962 | |
|
| |
|
Industrial Conglomerates–0.93% | |
Honeywell International, Inc. | | | 142,107 | | | | 26,042,529 | |
|
| |
|
Industrial REITs–1.52% | |
Prologis, Inc. | | | 422,533 | | | | 42,570,200 | |
|
| |
|
Insurance Brokers–1.47% | |
Arthur J. Gallagher & Co.(c) | | | 175,004 | | | | 41,211,692 | |
|
| |
|
Integrated Oil & Gas–2.24% | |
Chevron Corp. | | | 430,131 | | | | 62,682,991 | |
|
| |
|
Integrated Telecommunication Services–1.44% | |
Deutsche Telekom AG (Germany) | | | 640,784 | | | | 13,885,426 | |
|
| |
Verizon Communications, Inc. | | | 754,375 | | | | 26,501,194 | |
|
| |
| | | | | | | 40,386,620 | |
|
| |
|
Interactive Home Entertainment–1.12% | |
Electronic Arts, Inc. | | | 253,355 | | | | 31,362,815 | |
|
| |
|
Interactive Media & Services–5.64% | |
Alphabet, Inc., Class A(b) | | | 644,543 | | | | 79,974,895 | |
|
| |
Meta Platforms, Inc., Class A(b) | | | 258,370 | | | | 77,839,130 | |
|
| |
| | | | | | | 157,814,025 | |
|
| |
|
Investment Banking & Brokerage–1.97% | |
Charles Schwab Corp. (The) | | | 660,366 | | | | 34,365,447 | |
|
| |
Raymond James Financial, Inc.(c) | | | 218,736 | | | | 20,876,164 | |
|
| |
| | | | | | | 55,241,611 | |
|
| |
|
IT Consulting & Other Services–2.35% | |
Accenture PLC, Class A | | | 116,268 | | | | 34,542,060 | |
|
| |
Amdocs Ltd. | | | 389,873 | | | | 31,252,220 | |
|
| |
| | | | | | | 65,794,280 | |
|
| |
See accompanying Notes to Financial Statements which are an integral part of the financial statements.
| | | | | | | | |
| | | Shares | | | Value | |
|
| |
Life Sciences Tools & Services–0.88% | |
Danaher Corp. | | | 127,858 | | | $ | 24,551,293 | |
|
| |
|
Managed Health Care–2.38% | |
UnitedHealth Group, Inc. | | | 124,317 | | | | 66,579,213 | |
|
| |
|
Multi-line Insurance–0.73% | |
American International Group, Inc. | | | 334,094 | | | | 20,483,303 | |
|
| |
|
Multi-Utilities–2.22% | |
Ameren Corp. | | | 394,474 | | | | 29,865,626 | |
|
| |
WEC Energy Group, Inc. | | | 396,481 | | | | 32,269,589 | |
|
| |
| | | | | | | 62,135,215 | |
|
| |
|
Oil & Gas Exploration & Production–2.27% | |
APA Corp. | | | 793,940 | | | | 31,535,297 | |
|
| |
Marathon Oil Corp. | | | 1,176,739 | | | | 32,136,742 | |
|
| |
| | | | | | | 63,672,039 | |
|
| |
|
Pharmaceuticals–4.99% | |
AstraZeneca PLC, ADR (United Kingdom)(c) | | | 446,284 | | | | 28,218,537 | |
|
| |
Eli Lilly and Co. | | | 96,132 | | | | 53,250,399 | |
|
| |
Johnson & Johnson | | | 217,809 | | | | 32,309,787 | |
|
| |
Pfizer, Inc. | | | 849,119 | | | | 25,949,077 | |
|
| |
| | | | | | | 139,727,800 | |
|
| |
|
Property & Casualty Insurance–1.22% | |
Hartford Financial Services Group, Inc. (The) | | | 464,648 | | | | 34,128,396 | |
|
| |
|
Regional Banks–0.98% | |
M&T Bank Corp. | | | 243,407 | | | | 27,444,139 | |
|
| |
|
Retail REITs–0.80% | |
Kimco Realty Corp.(c) | | | 1,249,366 | | | | 22,413,626 | |
|
| |
|
Semiconductor Materials & Equipment–0.89% | |
ASML Holding N.V., New York Shares (Netherlands) | | | 41,786 | | | | 25,021,875 | |
|
| |
|
Semiconductors–4.30% | |
ARM Holdings PLC, ADR(b) | | | 302,096 | | | | 14,890,312 | |
|
| |
NVIDIA Corp. | | | 258,797 | | | | 105,537,416 | |
|
| |
| | | | | | | 120,427,728 | |
|
| |
|
Soft Drinks & Non-alcoholic Beverages–1.46% | |
PepsiCo, Inc. | | | 250,354 | | | | 40,877,801 | |
|
| |
| | | | | | | | |
| | | Shares | | | Value | |
|
| |
Specialty Chemicals–0.72% | |
PPG Industries, Inc. | | | 163,262 | | | $ | 20,043,676 | |
|
| |
|
Systems Software–8.68% | |
Microsoft Corp. | | | 718,764 | | | | 243,021,296 | |
|
| |
|
Technology Hardware, Storage & Peripherals–4.90% | |
Apple, Inc. | | | 804,025 | | | | 137,303,349 | |
|
| |
|
Tobacco–0.95% | |
Philip Morris International, Inc. | | | 299,662 | | | | 26,717,864 | |
|
| |
|
Transaction & Payment Processing Services–1.00% | |
Fiserv, Inc.(b) | | | 245,580 | | | | 27,934,725 | |
|
| |
Total Common Stocks & Other Equity Interests
(Cost $2,281,388,757) | | | | 2,777,659,353 | |
|
| |
|
Money Market Funds–0.49% | |
Invesco Government & Agency Portfolio, Institutional Class, 5.27%(d)(e) | | | 4,795,162 | | | | 4,795,162 | |
|
| |
Invesco Liquid Assets Portfolio, Institutional Class, 5.40%(d)(e) | | | 3,446,483 | | | | 3,447,517 | |
|
| |
Invesco Treasury Portfolio, Institutional Class, 5.27%(d)(e) | | | 5,480,185 | | | | 5,480,185 | |
|
| |
Total Money Market Funds
(Cost $13,721,404) | | | | 13,722,864 | |
|
| |
TOTAL INVESTMENTS IN SECURITIES (excluding investments purchased with cash collateral from securities on loan)-99.70%
(Cost $2,295,110,161) | | | | | | | 2,791,382,217 | |
|
| |
|
Investments Purchased with Cash Collateral from Securities on Loan | |
Money Market Funds–0.38% | |
Invesco Private Government Fund,
5.32%(d)(e)(f) | | | 2,976,168 | | | | 2,976,168 | |
|
| |
Invesco Private Prime Fund,
5.53%(d)(e)(f) | | | 7,658,103 | | | | 7,658,868 | |
|
| |
Total Investments Purchased with Cash Collateral from Securities on Loan
(Cost $10,635,789) | | | | 10,635,036 | |
|
| |
TOTAL INVESTMENTS IN SECURITIES–100.08%
(Cost $2,305,745,950) | | | | 2,802,017,253 | |
|
| |
OTHER ASSETS LESS LIABILITIES–(0.08)% | | | | (2,238,284 | ) |
|
| |
NET ASSETS–100.00% | | | $ | 2,799,778,969 | |
|
| |
|
Investment Abbreviations: |
| ADR – American Depositary Receipt |
| REIT – Real Estate Investment Trust |
See accompanying Notes to Financial Statements which are an integral part of the financial statements.
Notes to Schedule of Investments:
| (a) | Industry and/or sector classifications used in this report are generally according to the Global Industry Classification Standard, which was developed by and is the exclusive property and a service mark of MSCI Inc. and Standard & Poor’s. |
| (b) | Non-income producing security. |
| (c) | All or a portion of this security was out on loan at October 31, 2023. |
| (d) | Affiliated holding. Affiliated holdings are investments in entities which are under common ownership or control of Invesco Ltd. or are investments in entities in which the Fund owns 5% or more of the outstanding voting securities. The table below shows the Fund’s transactions in, and earnings from, its investments in affiliates for the fiscal year ended October 31, 2023. |
| | | | | | | | | | | | | | | | | | | | | | | | | | | | |
| | | Value
October 31, 2022 | | Purchases at Cost | | Proceeds from Sales | | | Change in Unrealized Appreciation (Depreciation) | | Realized Gain (Loss) | | Value
October 31, 2023 | | Dividend Income |
| Investments in Affiliated Money Market Funds: | | | | | | | | | | | | | | | | | | | | | | | | | | | | |
Invesco Government & Agency Portfolio, Institutional Class | | $ | 25,073,021 | | | $ | 181,574,994 | | | $ | (201,852,853) | | | $ | - | | | $ | - | | | $ | 4,795,162 | | | $ | 560,066 | |
Invesco Liquid Assets Portfolio, Institutional Class | | | 17,933,182 | | | | 129,696,424 | | | | (144,180,610) | | | | (920) | | | | (559) | | | | 3,447,517 | | | | 410,671 | |
Invesco Treasury Portfolio, Institutional Class | | | 28,654,881 | | | | 207,514,278 | | | | (230,688,974) | | | | - | | | | - | | | | 5,480,185 | | | | 639,273 | |
| Investments Purchased with Cash Collateral from Securities on Loan: | | | | | | | | | | | | | | | | | | | | | | | | | | | | |
Invesco Private Government Fund | | | 20,095,917 | | | | 262,147,131 | | | | (279,266,880) | | | | - | | | | - | | | | 2,976,168 | | | | 1,049,731* | |
Invesco Private Prime Fund | | | 50,062,457 | | | | 549,793,577 | | | | (592,184,928) | | | | (5,272) | | | | (6,966) | | | | 7,658,868 | | | | 2,802,954* | |
Total | | $ | 141,819,458 | | | $ | 1,330,726,404 | | | $ | (1,448,174,245) | | | $ | (6,192) | | | $ | (7,525) | | | $ | 24,357,900 | | | $ | 5,462,695 | |
| | * | Represents the income earned on the investment of cash collateral, which is included in securities lending income on the Statement of Operations. Does not include rebates and fees paid to lending agent or premiums received from borrowers, if any. |
| (e) | The rate shown is the 7-day SEC standardized yield as of October 31, 2023. |
| (f) | The security has been segregated to satisfy the commitment to return the cash collateral received in securities lending transactions upon the borrower’s return of the securities loaned. See Note 1K. |
See accompanying Notes to Financial Statements which are an integral part of the financial statements.
Statement of Assets and Liabilities
October 31, 2023
| | | | |
Assets: | | | | |
Investments in unaffiliated securities, at value
(Cost $2,281,388,757)* | | $ | 2,777,659,353 | |
|
| |
Investments in affiliated money market funds, at value (Cost $24,357,193) | | | 24,357,900 | |
|
| |
Foreign currencies, at value (Cost $1,551) | | | 1,440 | |
|
| |
Receivable for: | | | | |
Investments sold | | | 10,010,762 | |
|
| |
Fund shares sold | | | 94,981 | |
|
| |
Dividends | | | 1,544,760 | |
|
| |
Investment for trustee deferred compensation and retirement plans | | | 1,087,992 | |
|
| |
Other assets | | | 177,089 | |
|
| |
Total assets | | | 2,814,934,277 | |
|
| |
| |
Liabilities: | | | | |
Payable for: | | | | |
Fund shares reacquired | | | 2,016,565 | |
|
| |
Collateral upon return of securities loaned | | | 10,635,789 | |
|
| |
Accrued fees to affiliates | | | 1,238,842 | |
|
| |
Accrued trustees’ and officers’ fees and benefits | | | 4,850 | |
|
| |
Accrued other operating expenses | | | 101,266 | |
|
| |
Trustee deferred compensation and retirement plans | | | 1,157,996 | |
|
| |
Total liabilities | | | 15,155,308 | |
|
| |
Net assets applicable to shares outstanding | | $ | 2,799,778,969 | |
|
| |
| |
Net assets consist of: | | | | |
Shares of beneficial interest | | $ | 2,131,181,055 | |
|
| |
Distributable earnings | | | 668,597,914 | |
|
| |
| | $ | 2,799,778,969 | |
|
| |
| | | | |
Net Assets: | | | | |
Class A | | $ | 2,653,092,059 | |
|
| |
Class C | | $ | 16,335,700 | |
|
| |
Class R | | $ | 15,124,578 | |
|
| |
Class S | | $ | 14,902,587 | |
|
| |
Class Y | | $ | 80,126,474 | |
|
| |
Class R5 | | $ | 5,609,711 | |
|
| |
Class R6 | | $ | 14,587,860 | |
|
| |
|
Shares outstanding, no par value, with an unlimited number of shares authorized: | |
Class A | | | 165,722,557 | |
|
| |
Class C | | | 1,147,865 | |
|
| |
Class R | | | 957,193 | |
|
| |
Class S | | | 930,465 | |
|
| |
Class Y | | | 4,972,316 | |
|
| |
Class R5 | | | 325,630 | |
|
| |
Class R6 | | | 847,366 | |
|
| |
Class A: | | | | |
Net asset value per share | | $ | 16.01 | |
|
| |
Maximum offering price per share
(Net asset value of $16.01 ÷ 94.50%) | | $ | 16.94 | |
|
| |
Class C: | | | | |
Net asset value and offering price per share | | $ | 14.23 | |
|
| |
Class R: | | | | |
Net asset value and offering price per share | | $ | 15.80 | |
|
| |
Class S: | | | | |
Net asset value and offering price per share | | $ | 16.02 | |
|
| |
Class Y: | | | | |
Net asset value and offering price per share | | $ | 16.11 | |
|
| |
Class R5: | | | | |
Net asset value and offering price per share | | $ | 17.23 | |
|
| |
Class R6: | | | | |
Net asset value and offering price per share | | $ | 17.22 | |
|
| |
| * | At October 31, 2023, securities with an aggregate value of $10,495,505 were on loan to brokers. |
See accompanying Notes to Financial Statements which are an integral part of the financial statements.
Statement of Operations
For the year ended October 31, 2023
| | | | |
Investment income: | | | | |
Dividends (net of foreign withholding taxes of $54,878) | | $ | 39,869,895 | |
|
| |
Dividends from affiliated money market funds (includes net securities lending income of $177,949) | | | 1,787,959 | |
|
| |
Total investment income | | | 41,657,854 | |
|
| |
| |
Expenses: | | | | |
Advisory fees | | | 18,205,040 | |
|
| |
Administrative services fees | | | 415,165 | |
|
| |
Custodian fees | | | 19,670 | |
|
| |
Distribution fees: | | | | |
Class A | | | 6,924,934 | |
|
| |
Class C | | | 179,025 | |
|
| |
Class R | | | 79,412 | |
|
| |
Class S | | | 23,250 | |
|
| |
Transfer agent fees – A, C, R, S and Y | | | 3,586,112 | |
|
| |
Transfer agent fees – R5 | | | 6,168 | |
|
| |
Transfer agent fees – R6 | | | 4,539 | |
|
| |
Trustees’ and officers’ fees and benefits | | | 45,858 | |
|
| |
Registration and filing fees | | | 154,674 | |
|
| |
Reports to shareholders | | | 255,861 | |
|
| |
Professional services fees | | | 107,697 | |
|
| |
Other | | | 45,848 | |
|
| |
Total expenses | | | 30,053,253 | |
|
| |
Less: Fees waived and/or expense offset arrangement(s) | | | (134,006 | ) |
|
| |
Net expenses | | | 29,919,247 | |
|
| |
Net investment income | | | 11,738,607 | |
|
| |
| |
Realized and unrealized gain (loss) from: | | | | |
Net realized gain (loss) from: | | | | |
Unaffiliated investment securities | | | 182,142,958 | |
|
| |
Affiliated investment securities | | | (7,525 | ) |
|
| |
Foreign currencies | | | (76,783 | ) |
|
| |
| | | 182,058,650 | |
|
| |
Change in net unrealized appreciation (depreciation) of: | | | | |
Unaffiliated investment securities | | | 70,131,767 | |
|
| |
Affiliated investment securities | | | (6,192 | ) |
|
| |
Foreign currencies | | | 31,316 | |
|
| |
| | | 70,156,891 | |
|
| |
Net realized and unrealized gain | | | 252,215,541 | |
|
| |
Net increase in net assets resulting from operations | | $ | 263,954,148 | |
|
| |
See accompanying Notes to Financial Statements which are an integral part of the financial statements.
Statement of Changes in Net Assets
For the years ended October 31, 2023 and 2022
| | | | | | | | |
| | | 2023 | | | 2022 | |
|
| |
Operations: | | | | | | | | |
Net investment income | | $ | 11,738,607 | | | $ | 19,211,596 | |
|
| |
Net realized gain | | | 182,058,650 | | | | 86,451,744 | |
|
| |
Change in net unrealized appreciation (depreciation) | | | 70,156,891 | | | | (788,332,003 | ) |
|
| |
Net increase (decrease) in net assets resulting from operations | | | 263,954,148 | | | | (682,668,663 | ) |
|
| |
| | |
Distributions to shareholders from distributable earnings: | | | | | | | | |
Class A | | | (107,764,460 | ) | | | (513,413,240 | ) |
|
| |
Class C | | | (661,290 | ) | | | (4,212,587 | ) |
|
| |
Class R | | | (602,186 | ) | | | (2,936,986 | ) |
|
| |
Class S | | | (620,548 | ) | | | (3,006,415 | ) |
|
| |
Class Y | | | (3,762,877 | ) | | | (16,819,129 | ) |
|
| |
Class R5 | | | (270,422 | ) | | | (1,177,340 | ) |
|
| |
Class R6 | | | (579,930 | ) | | | (3,482,534 | ) |
|
| |
Total distributions from distributable earnings | | | (114,261,713 | ) | | | (545,048,231 | ) |
|
| |
| | |
Share transactions–net: | | | | | | | | |
Class A | | | (160,254,977 | ) | | | 219,433,133 | |
|
| |
Class C | | | (2,846,746 | ) | | | (288,709 | ) |
|
| |
Class R | | | (1,287,839 | ) | | | 1,974,284 | |
|
| |
Class S | | | (766,005 | ) | | | 549,691 | |
|
| |
Class Y | | | (11,835,675 | ) | | | 8,874,658 | |
|
| |
Class R5 | | | (1,342,684 | ) | | | 151,125 | |
|
| |
Class R6 | | | (638,048 | ) | | | 1,083,524 | |
|
| |
Net increase (decrease) in net assets resulting from share transactions | | | (178,971,974 | ) | | | 231,777,706 | |
|
| |
Net increase (decrease) in net assets | | | (29,279,539 | ) | | | (995,939,188 | ) |
|
| |
| | |
Net assets: | | | | | | | | |
Beginning of year | | | 2,829,058,508 | | | | 3,824,997,696 | |
|
| |
End of year | | $ | 2,799,778,969 | | | $ | 2,829,058,508 | |
|
| |
See accompanying Notes to Financial Statements which are an integral part of the financial statements.
Financial Highlights
The following schedule presents financial highlights for a share of the Fund outstanding throughout the periods indicated.
| | | | | | | | | | | | | | | | | | | | | | | | | | | | | | | | | | | | | | | | | | | | | | | | | | | | | | | | |
| | | Net asset
value,
beginning
of period | | Net
investment
income
(loss)(a) | | Net gains
(losses)
on securities
(both
realized and
unrealized) | | Total from
investment
operations | | Dividends
from net
investment
income | | Distributions from net
realized
gains | | Total
distributions | | Net asset
value, end
of period | | Total
return(b) | | Net assets,
end of period
(000’s omitted) | | Ratio of expenses
to average net assets
with fee waivers and/or
expenses
absorbed | | Ratio of
expenses
to average net
assets without
fee waivers
and/or
expenses
absorbed | | Ratio of net
investment
income (loss)
to average
net assets | | Portfolio turnover (c) |
Class A | | | | | | | | | | | | | | | | | | | | | | | | | | | | | | | | | | | | | | | | | | | | | | | | | | | | | | | | |
Year ended 10/31/23 | | | $15.25 | | | | $ 0.06 | | | | $ 1.32 | | | | $ 1.38 | | | | $(0.12 | ) | | | $(0.50 | ) | | | $(0.62 | ) | | | $16.01 | | | | 9.44 | % | | | $2,653,092 | | | | 1.03 | % | | | 1.03 | % | | | 0.39 | % | | | 84 | % |
Year ended 10/31/22 | | | 21.88 | | | | 0.10 | (d) | | | (3.58 | ) | | | (3.48 | ) | | | (0.08 | ) | | | (3.07 | ) | | | (3.15 | ) | | | 15.25 | | | | (18.71 | ) | | | 2,671,536 | | | | 1.02 | | | | 1.02 | | | | 0.58 | (d) | | | 52 | |
Year ended 10/31/21 | | | 15.99 | | | | 0.07 | | | | 6.24 | | | | 6.31 | | | | (0.10 | ) | | | (0.32 | ) | | | (0.42 | ) | | | 21.88 | | | | 40.10 | | | | 3,609,724 | | | | 1.03 | | | | 1.03 | | | | 0.38 | | | | 47 | |
Year ended 10/31/20 | | | 17.79 | | | | 0.11 | | | | 1.02 | | | | 1.13 | | | | (0.13 | ) | | | (2.80 | ) | | | (2.93 | ) | | | 15.99 | | | | 6.71 | | | | 2,816,198 | | | | 1.07 | | | | 1.07 | | | | 0.70 | | | | 45 | |
Year ended 10/31/19 | | | 17.52 | | | | 0.13 | | | | 1.86 | (e) | | | 1.99 | | | | (0.07 | ) | | | (1.65 | ) | | | (1.72 | ) | | | 17.79 | | | | 12.96 | (e) | | | 3,007,391 | | | | 1.07 | | | | 1.07 | | | | 0.74 | | | | 82 | |
Class C | | | | | | | | | | | | | | | | | | | | | | | | | | | | | | | | | | | | | | | | | | | | | | | | | | | | | | | | |
Year ended 10/31/23 | | | 13.60 | | | | (0.05 | ) | | | 1.18 | | | | 1.13 | | | | – | | | | (0.50 | ) | | | (0.50 | ) | | | 14.23 | | | | 8.65 | | | | 16,336 | | | | 1.78 | | | | 1.78 | | | | (0.36 | ) | | | 84 | |
Year ended 10/31/22 | | | 19.91 | | | | (0.03 | )(d) | | | (3.21 | ) | | | (3.24 | ) | | | – | | | | (3.07 | ) | | | (3.07 | ) | | | 13.60 | | | | (19.35 | ) | | | 18,306 | | | | 1.77 | | | | 1.77 | | | | (0.17 | )(d) | | | 52 | |
Year ended 10/31/21 | | | 14.61 | | | | (0.07 | ) | | | 5.69 | | | | 5.62 | | | | – | | | | (0.32 | ) | | | (0.32 | ) | | | 19.91 | | | | 39.00 | | | | 27,725 | | | | 1.78 | | | | 1.78 | | | | (0.37 | ) | | | 47 | |
Year ended 10/31/20 | | | 16.47 | | | | (0.01 | ) | | | 0.95 | | | | 0.94 | | | | – | | | | (2.80 | ) | | | (2.80 | ) | | | 14.61 | | | | 5.96 | | | | 30,607 | | | | 1.82 | | | | 1.82 | | | | (0.05 | ) | | | 45 | |
Year ended 10/31/19 | | | 16.39 | | | | (0.00 | ) | | | 1.73 | (e) | | | 1.73 | | | | – | | | | (1.65 | ) | | | (1.65 | ) | | | 16.47 | | | | 12.14 | (e) | | | 40,493 | | | | 1.82 | | | | 1.82 | | | | (0.01 | ) | | | 82 | |
Class R | | | | | | | | | | | | | | | | | | | | | | | | | | | | | | | | | | | | | | | | | | | | | | | | | | | | | | | | |
Year ended 10/31/23 | | | 15.05 | | | | 0.02 | | | | 1.31 | | | | 1.33 | | | | (0.08 | ) | | | (0.50 | ) | | | (0.58 | ) | | | 15.80 | | | | 9.17 | | | | 15,125 | | | | 1.28 | | | | 1.28 | | | | 0.14 | | | | 84 | |
Year ended 10/31/22 | | | 21.63 | | | | 0.06 | (d) | | | (3.54 | ) | | | (3.48 | ) | | | (0.03 | ) | | | (3.07 | ) | | | (3.10 | ) | | | 15.05 | | | | (18.91 | ) | | | 15,653 | | | | 1.27 | | | | 1.27 | | | | 0.33 | (d) | | | 52 | |
Year ended 10/31/21 | | | 15.82 | | | | 0.02 | | | | 6.16 | | | | 6.18 | | | | (0.05 | ) | | | (0.32 | ) | | | (0.37 | ) | | | 21.63 | | | | 39.66 | | | | 20,442 | | | | 1.28 | | | | 1.28 | | | | 0.13 | | | | 47 | |
Year ended 10/31/20 | | | 17.62 | | | | 0.07 | | | | 1.01 | | | | 1.08 | | | | (0.08 | ) | | | (2.80 | ) | | | (2.88 | ) | | | 15.82 | | | | 6.46 | | | | 16,500 | | | | 1.32 | | | | 1.32 | | | | 0.45 | | | | 45 | |
Year ended 10/31/19 | | | 17.34 | | | | 0.08 | | | | 1.85 | (e) | | | 1.93 | | | | – | | | | (1.65 | ) | | | (1.65 | ) | | | 17.62 | | | | 12.68 | (e) | | | 19,772 | | | | 1.32 | | | | 1.32 | | | | 0.49 | | | | 82 | |
Class S | | | | | | | | | | | | | | | | | | | | | | | | | | | | | | | | | | | | | | | | | | | | | | | | | | | | | | | | |
Year ended 10/31/23 | | | 15.26 | | | | 0.08 | | | | 1.32 | | | | 1.40 | | | | (0.14 | ) | | | (0.50 | ) | | | (0.64 | ) | | | 16.02 | | | | 9.57 | | | | 14,903 | | | | 0.93 | | | | 0.93 | | | | 0.49 | | | | 84 | |
Year ended 10/31/22 | | | 21.89 | | | | 0.12 | (d) | | | (3.58 | ) | | | (3.46 | ) | | | (0.10 | ) | | | (3.07 | ) | | | (3.17 | ) | | | 15.26 | | | | (18.61 | ) | | | 14,877 | | | | 0.92 | | | | 0.92 | | | | 0.68 | (d) | | | 52 | |
Year ended 10/31/21 | | | 16.00 | | | | 0.09 | | | | 6.23 | | | | 6.32 | | | | (0.11 | ) | | | (0.32 | ) | | | (0.43 | ) | | | 21.89 | | | | 40.20 | | | | 21,013 | | | | 0.93 | | | | 0.93 | | | | 0.48 | | | | 47 | |
Year ended 10/31/20 | | | 17.80 | | | | 0.13 | | | | 1.02 | | | | 1.15 | | | | (0.15 | ) | | | (2.80 | ) | | | (2.95 | ) | | | 16.00 | | | | 6.82 | | | | 16,783 | | | | 0.97 | | | | 0.97 | | | | 0.80 | | | | 45 | |
Year ended 10/31/19 | | | 17.53 | | | | 0.14 | | | | 1.87 | (e) | | | 2.01 | | | | (0.09 | ) | | | (1.65 | ) | | | (1.74 | ) | | | 17.80 | | | | 13.09 | (e) | | | 16,906 | | | | 0.97 | | | | 0.97 | | | | 0.84 | | | | 82 | |
Class Y | | | | | | | | | | | | | | | | | | | | | | | | | | | | | | | | | | | | | | | | | | | | | | | | | | | | | | | | |
Year ended 10/31/23 | | | 15.35 | | | | 0.10 | | | | 1.32 | | | | 1.42 | | | | (0.16 | ) | | | (0.50 | ) | | | (0.66 | ) | | | 16.11 | | | | 9.71 | | | | 80,126 | | | | 0.78 | | | | 0.78 | | | | 0.64 | | | | 84 | |
Year ended 10/31/22 | | | 22.01 | | | | 0.14 | (d) | | | (3.60 | ) | | | (3.46 | ) | | | (0.13 | ) | | | (3.07 | ) | | | (3.20 | ) | | | 15.35 | | | | (18.53 | ) | | | 87,804 | | | | 0.77 | | | | 0.77 | | | | 0.83 | (d) | | | 52 | |
Year ended 10/31/21 | | | 16.09 | | | | 0.12 | | | | 6.26 | | | | 6.38 | | | | (0.14 | ) | | | (0.32 | ) | | | (0.46 | ) | | | 22.01 | | | | 40.36 | | | | 116,054 | | | | 0.78 | | | | 0.78 | | | | 0.63 | | | | 47 | |
Year ended 10/31/20 | | | 17.88 | | | | 0.15 | | | | 1.04 | | | | 1.19 | | | | (0.18 | ) | | | (2.80 | ) | | | (2.98 | ) | | | 16.09 | | | | 7.03 | | | | 81,404 | | | | 0.82 | | | | 0.82 | | | | 0.95 | | | | 45 | |
Year ended 10/31/19 | | | 17.61 | | | | 0.17 | | | | 1.87 | (e) | | | 2.04 | | | | (0.12 | ) | | | (1.65 | ) | | | (1.77 | ) | | | 17.88 | | | | 13.24 | (e) | | | 93,143 | | | | 0.82 | | | | 0.82 | | | | 0.99 | | | | 82 | |
Class R5 | | | | | | | | | | | | | | | | | | | | | | | | | | | | | | | | | | | | | | | | | | | | | | | | | | | | | | | | |
Year ended 10/31/23 | | | 16.36 | | | | 0.12 | | | | 1.42 | | | | 1.54 | | | | (0.17 | ) | | | (0.50 | ) | | | (0.67 | ) | | | 17.23 | | | | 9.81 | | | | 5,610 | | | | 0.76 | | | | 0.76 | | | | 0.66 | | | | 84 | |
Year ended 10/31/22 | | | 23.25 | | | | 0.16 | (d) | | | (3.85 | ) | | | (3.69 | ) | | | (0.13 | ) | | | (3.07 | ) | | | (3.20 | ) | | | 16.36 | | | | (18.50 | ) | | | 6,555 | | | | 0.75 | | | | 0.75 | | | | 0.85 | (d) | | | 52 | |
Year ended 10/31/21 | | | 16.98 | | | | 0.14 | | | | 6.60 | | | | 6.74 | | | | (0.15 | ) | | | (0.32 | ) | | | (0.47 | ) | | | 23.25 | | | | 40.37 | | | | 9,109 | | | | 0.75 | | | | 0.75 | | | | 0.66 | | | | 47 | |
Year ended 10/31/20 | | | 18.71 | | | | 0.17 | | | | 1.09 | | | | 1.26 | | | | (0.19 | ) | | | (2.80 | ) | | | (2.99 | ) | | | 16.98 | | | | 7.11 | | | | 7,511 | | | | 0.76 | | | | 0.76 | | | | 1.01 | | | | 45 | |
Year ended 10/31/19 | | | 18.34 | | | | 0.19 | | | | 1.96 | (e) | | | 2.15 | | | | (0.13 | ) | | | (1.65 | ) | | | (1.78 | ) | | | 18.71 | | | | 13.34 | (e) | | | 9,163 | | | | 0.75 | | | | 0.75 | | | | 1.06 | | | | 82 | |
Class R6 | | | | | | | | | | | | | | | | | | | | | | | | | | | | | | | | | | | | | | | | | | | | | | | | | | | | | | | | |
Year ended 10/31/23 | | | 16.36 | | | | 0.13 | | | | 1.41 | | | | 1.54 | | | | (0.18 | ) | | | (0.50 | ) | | | (0.68 | ) | | | 17.22 | | | | 9.83 | | | | 14,588 | | | | 0.69 | | | | 0.69 | | | | 0.73 | | | | 84 | |
Year ended 10/31/22 | | | 23.24 | | | | 0.17 | (d) | | | (3.83 | ) | | | (3.66 | ) | | | (0.15 | ) | | | (3.07 | ) | | | (3.22 | ) | | | 16.36 | | | | (18.41 | ) | | | 14,327 | | | | 0.68 | | | | 0.68 | | | | 0.92 | (d) | | | 52 | |
Year ended 10/31/21 | | | 16.97 | | | | 0.15 | | | | 6.60 | | | | 6.75 | | | | (0.16 | ) | | | (0.32 | ) | | | (0.48 | ) | | | 23.24 | | | | 40.49 | | | | 20,931 | | | | 0.68 | | | | 0.68 | | | | 0.73 | | | | 47 | |
Year ended 10/31/20 | | | 18.70 | | | | 0.18 | | | | 1.09 | | | | 1.27 | | | | (0.20 | ) | | | (2.80 | ) | | | (3.00 | ) | | | 16.97 | | | | 7.19 | | | | 16,553 | | | | 0.69 | | | | 0.69 | | | | 1.08 | | | | 45 | |
Year ended 10/31/19 | | | 18.34 | | | | 0.20 | | | | 1.95 | (e) | | | 2.15 | | | | (0.14 | ) | | | (1.65 | ) | | | (1.79 | ) | | | 18.70 | | | | 13.38 | (e) | | | 19,030 | | | | 0.69 | | | | 0.69 | | | | 1.12 | | | | 82 | |
| (a) | Calculated using average shares outstanding. |
| (b) | Includes adjustments in accordance with accounting principles generally accepted in the United States of America and as such, the net asset value for financial reporting purposes and the returns based upon those net asset values may differ from the net asset value and returns for shareholder transactions. Does not include sales charges and is not annualized for periods less than one year, if applicable. |
| (c) | Portfolio turnover is calculated at the fund level and is not annualized for periods less than one year, if applicable. |
| (d) | Net investment income (loss) per share and the ratio of net investment income (loss) to average net assets includes significant dividends received during the year ended October 31, 2022. Net investment income (loss) per share and the ratio of net investment income (loss) to average net assets excluding the significant dividends are $0.06 and 0.32%, $(0.07) and (0.43)%, $0.02 and 0.07%, $0.08 and 0.42%, $0.10 and 0.57%, $0.12 and 0.59% and $0.13 and 0.66% for Class A, Class C, Class R, Class S, Class Y, Class R5 and Class R6 shares, respectively. |
| (e) | Includes litigation proceeds received during the year ended October 31, 2019. Had these litigation proceeds not been received, Net gains (losses) on securities (both realized and unrealized) per share would have been $1.81, $1.68, $1.80, $1.82, $1.82, $1.91 and $1.90 for Class A, Class C, Class R, Class S, Class Y, Class R5, and Class R6 shares, respectively. Total returns would have been lower. |
See accompanying Notes to Financial Statements which are an integral part of the financial statements.
Notes to Financial Statements
October 31, 2023
NOTE 1–Significant Accounting Policies
Invesco Charter Fund (the “Fund”) is a series portfolio of AIM Equity Funds (Invesco Equity Funds) (the “Trust”). The Trust is a Delaware statutory trust registered under the Investment Company Act of 1940, as amended (the “1940 Act”), as an open-end series management investment company authorized to issue an unlimited number of shares of beneficial interest. Information presented in these financial statements pertains only to the Fund. Matters affecting the Fund or each class will be voted on exclusively by the shareholders of the Fund or each class.
The Fund’s investment objective is long-term growth of capital.
The Fund currently consists of seven different classes of shares: Class A, Class C, Class R, Class S, Class Y, Class R5 and Class R6. Class Y shares are available only to certain investors. Class A shares are sold with a front-end sales charge unless certain waiver criteria are met. Under certain circumstances, load waived shares may be subject to contingent deferred sales charges (“CDSC”). Class C shares are sold with a CDSC. Class R, Class S, Class Y, Class R5 and Class R6 shares are sold at net asset value. Class C shares held for eight years after purchase are eligible for automatic conversion into Class A shares of the same Fund (the “Conversion Feature”). The automatic conversion pursuant to the Conversion Feature will generally occur at the end of the month following the eighth anniversary after a purchase of Class C shares.
The Fund is an investment company and accordingly follows the investment company accounting and reporting guidance in accordance with Financial Accounting Standards Board Accounting Standards Codification Topic 946, Financial Services – Investment Companies.
The following is a summary of the significant accounting policies followed by the Fund in the preparation of its financial statements.
| A. | Security Valuations – Securities, including restricted securities, are valued according to the following policy. |
A security listed or traded on an exchange is generally valued at its trade price or official closing price that day as of the close of the exchange where the security is principally traded, or lacking any trades or official closing price on a particular day, the security may be valued at the closing bid or ask price on that day. Securities traded in the over-the-counter market are valued based on prices furnished by independent pricing services or market makers. When such securities are valued using prices provided by an independent pricing service they may be considered fair valued. Futures contracts are valued at the daily settlement price set by an exchange on which they are principally traded. Where a final settlement price exists, exchange-traded options are valued at the final settlement price from the exchange where the option principally trades. Where a final settlement price does not exist, exchange-traded options are valued at the mean between the last bid and ask price generally from the exchange where the option principally trades.
Securities of investment companies that are not exchange-traded (e.g., open-end mutual funds) are valued using such company’s end-of-business-day net asset value per share.
Deposits, other obligations of U.S. and non-U.S. banks and financial institutions are valued at their daily account value.
Fixed income securities (including convertible debt securities) generally are valued on the basis of prices provided by independent pricing services. Prices provided by the pricing service may be determined without exclusive reliance on quoted prices, and may reflect appropriate factors such as institution-size trading in similar groups of securities, developments related to specific securities, dividend rate (for unlisted equities), yield (for debt obligations), quality, type of issue, coupon rate (for debt obligations), maturity (for debt obligations), individual trading characteristics and other market data. Pricing services generally value debt obligations assuming orderly transactions of institutional round lot size, but a fund may hold or transact in the same securities in smaller, odd lot sizes. Odd lots often trade at lower prices than institutional round lots, and their value may be adjusted accordingly. Debt obligations are subject to interest rate and credit risks. In addition, all debt obligations involve some risk of default with respect to interest and/or principal payments.
Foreign securities’ (including foreign exchange contracts) prices are converted into U.S. dollar amounts using the applicable exchange rates as of the close of the New York Stock Exchange (“NYSE”). If market quotations are available and reliable for foreign exchange-traded equity securities, the securities will be valued at the market quotations. Invesco Advisers, Inc. (the “Adviser” or “Invesco”) may use various pricing services to obtain market quotations as well as fair value prices. Because trading hours for certain foreign securities end before the close of the NYSE, closing market quotations may become not representative of market value in the Adviser’s judgment (“unreliable”). If, between the time trading ends on a particular security and the close of the customary trading session on the NYSE, a significant event occurs that makes the closing price of the security unreliable, the Adviser may fair value the security. If the event is likely to have affected the closing price of the security, the security will be valued at fair value in good faith in accordance with Board- approved policies and related Adviser procedures (“Valuation Procedures”). Adjustments to closing prices to reflect fair value may also be based on a screening process of an independent pricing service to indicate the degree of certainty, based on historical data, that the closing price in the principal market where a foreign security trades is not the current value as of the close of the NYSE. Foreign securities’ prices meeting the degree of certainty that the price is not reflective of current value will be priced at the indication of fair value from the independent pricing service. Multiple factors may be considered by the independent pricing service in determining adjustments to reflect fair value and may include information relating to sector indices, American Depositary Receipts and domestic and foreign index futures. Foreign securities may have additional risks including exchange rate changes, potential for sharply devalued currencies and high inflation, political and economic upheaval, the relative lack of issuer information, relatively low market liquidity and the potential lack of strict financial and accounting controls and standards.
Unlisted securities will be valued using prices provided by independent pricing services or by another method that the Adviser, in its judgment, believes better reflects the security’s fair value in accordance with the Valuation Procedures.
Securities for which market prices are not provided by any of the above methods may be valued based upon quotes furnished by independent sources. The mean between the last bid and ask prices may be used to value debt obligations, including corporate loans.
Securities for which market quotations are not readily available are fair valued by the Adviser in accordance with the Valuation Procedures. If a fair value price provided by a pricing service is unreliable, the Adviser will fair value the security using the Valuation Procedures. Issuer specific events, market trends, bid/ask quotes of brokers and information providers and other market data may be reviewed in the course of making a good faith determination of a security’s fair value.
The Fund may invest in securities that are subject to interest rate risk, meaning the risk that the prices will generally fall as interest rates rise and, conversely, the prices will generally rise as interest rates fall. Specific securities differ in their sensitivity to changes in interest rates depending on their individual characteristics. Changes in interest rates may result in increased market volatility, which may affect the value and/or liquidity of certain Fund investments.
Valuations change in response to many factors including the historical and prospective earnings of the issuer, the value of the issuer’s assets, general market conditions which are not specifically related to the particular issuer, such as real or perceived adverse economic conditions, changes in the general outlook for revenues or corporate earnings, changes in interest or currency rates, regional or global instability, natural or environmental disasters, widespread disease or other public health issues, war, acts of terrorism, significant governmental actions or adverse investor sentiment generally and market liquidity. Because of the inherent uncertainties of valuation, the values reflected in the financial statements may materially differ from the value received upon actual sale of those investments.
The price the Fund could receive upon the sale of any investment may differ from the Adviser’s valuation of the investment, particularly for securities that are valued using a fair valuation technique. When fair valuation techniques are applied, the Adviser uses available information, including both observable and unobservable inputs and assumptions, to determine a methodology that will result in a valuation that the Adviser believes approximates market value. Fund securities that are fair valued may be subject to greater fluctuation in their value from one day to the next than would be the case if market quotations were used.
Because of the inherent uncertainties of valuation, and the degree of subjectivity in such decisions, the Fund could realize a greater or lesser than expected gain or loss upon the sale of the investment.
| B. | Securities Transactions and Investment Income – Securities transactions are accounted for on a trade date basis. Realized gains or losses on sales are computed on the basis of specific identification of the securities sold. Interest income (net of withholding tax, if any) is recorded on an accrual basis from settlement date and includes coupon interest and amortization of premium and accretion of discount on debt securities as applicable. Dividend income (net of withholding tax, if any) is recorded on the ex-dividend date. |
The Fund may periodically participate in litigation related to Fund investments. As such, the Fund may receive proceeds from litigation settlements. Any proceeds received are included in the Statement of Operations as realized gain (loss) for investments no longer held and as unrealized gain (loss) for investments still held.
Brokerage commissions and mark ups are considered transaction costs and are recorded as an increase to the cost basis of securities purchased and/or a reduction of proceeds on a sale of securities. Such transaction costs are included in the determination of net realized and unrealized gain (loss) from investment securities reported in the Statement of Operations and the Statement of Changes in Net Assets and the net realized and unrealized gains (losses) on securities per share in the Financial Highlights. Transaction costs are included in the calculation of the Fund’s net asset value and, accordingly, they reduce the Fund’s total returns. These transaction costs are not considered operating expenses and are not reflected in net investment income reported in the Statement of Operations and the Statement of Changes in Net Assets, or the net investment income per share and the ratios of expenses and net investment income reported in the Financial Highlights, nor are they limited by any expense limitation arrangements between the Fund and the investment adviser.
The Fund allocates income and realized and unrealized capital gains and losses to a class based on the relative net assets of each class.
| C. | Country Determination – For the purposes of making investment selection decisions and presentation in the Schedule of Investments, the investment adviser may determine the country in which an issuer is located and/or credit risk exposure based on various factors. These factors include the laws of the country under which the issuer is organized, where the issuer maintains a principal office, the country in which the issuer derives 50% or more of its total revenues, the country that has the primary market for the issuer’s securities and its “country of risk” as determined by a third party service provider, as well as other criteria. Among the other criteria that may be evaluated for making this determination are the country in which the issuer maintains 50% or more of its assets, the type of security, financial guarantees and enhancements, the nature of the collateral and the sponsor organization. Country of issuer and/or credit risk exposure has been determined to be the United States of America, unless otherwise noted. |
| D. | Distributions – Distributions from net investment income and net realized capital gain, if any, are generally declared and paid annually and recorded on the ex-dividend date. The Fund may elect to treat a portion of the proceeds from redemptions as distributions for federal income tax purposes. |
| E. | Master Limited Partnerships – The Fund invests in Master Limited Partnerships (“MLPs”). MLPs are publicly traded partnerships and limited liability companies taxed as partnerships under the Internal Revenue Code of 1986, as amended (the “Internal Revenue Code”). The Fund invests in MLPs engaged in, among other things, the transportation, storage, processing, refining, marketing, exploration, production and mining of minerals and natural resources. The Fund is a partner in each MLP; accordingly, the Fund is required to take into account the Fund’s allocable share of income, gains, losses, deductions, expenses, and tax credits recognized by each MLP. |
MLP’s may be less liquid and subject to more abrupt or erratic price movements than conventional publicly traded securities.
| F. | Return of Capital – Distributions received from the Fund’s investments in MLPs generally are comprised of income and return of capital. The Fund records investment income and return of capital based on estimates made at the time such distributions are received. The return of capital portion of the distribution is a reduction to investment income that results in an equivalent reduction in the cost basis of the associated investments and increases net realized gains (losses) and change in unrealized appreciation (depreciation). Such estimates are based on historical information available from each MLP and other industry sources. These estimates will subsequently be revised and may materially differ primarily based on information received from the MLPs after their tax reporting periods are concluded. |
| G. | Federal Income Taxes – The Fund intends to comply with the requirements of Subchapter M of the Internal Revenue Code of 1986, as amended (the “Internal Revenue Code”), necessary to qualify as a regulated investment company and to distribute substantially all of the Fund’s taxable earnings to shareholders. As such, the Fund will not be subject to federal income taxes on otherwise taxable income (including net realized capital gain) that is distributed to shareholders. Therefore, no provision for federal income taxes is recorded in the financial statements. |
The Fund recognizes the tax benefits of uncertain tax positions only when the position is more likely than not to be sustained. Management has analyzed the Fund’s uncertain tax positions and concluded that no liability for unrecognized tax benefits should be recorded related to uncertain tax positions. Management is not aware of any tax positions for which it is reasonably possible that the total amounts of unrecognized tax benefits will change materially in the next 12 months.
The Fund files tax returns in the U.S. Federal jurisdiction and certain other jurisdictions. Generally, the Fund is subject to examinations by such taxing authorities for up to three years after the filing of the return for the tax period.
| H. | Expenses – Fees provided for under the Rule 12b-1 plan of a particular class of the Fund are charged to the operations of such class. Transfer agency fees and expenses and other shareholder recordkeeping fees and expenses attributable to Class R5 and Class R6 are allocated based on relative net assets of Class R5 and Class R6. Sub-accounting fees attributable to Class R5 are charged to the operations of the class. Transfer agency fees and expenses and other shareholder recordkeeping fees and expenses relating to all other classes are allocated among those classes based on relative net assets. All other expenses are allocated among the classes based on relative net assets. |
| I. | Accounting Estimates – The preparation of financial statements in conformity with accounting principles generally accepted in the United States of America (“GAAP”) requires management to make estimates and assumptions that affect the reported amounts of assets and liabilities at the date of the financial statements and the reported amounts of revenues and expenses during the reporting period including estimates and assumptions related to taxation. Actual results could differ from those estimates by a significant amount. In addition, the Fund monitors for material events or transactions that may occur or become known after the period-end date and before the date the financial statements are released to print. |
| J. | Indemnifications – Under the Trust’s organizational documents, each Trustee, officer, employee or other agent of the Trust is indemnified against certain liabilities that may arise out of the performance of their duties to the Fund. Additionally, in the normal course of business, the Fund enters into contracts, including the Fund’s servicing agreements, that contain a variety of indemnification clauses. The Fund’s maximum exposure under these arrangements is unknown as this would involve future claims that may be made against the Fund that have not yet occurred. The risk of material loss as a result of such indemnification claims is considered remote. |
| K. | Securities Lending – The Fund may lend portfolio securities having a market value up to one-third of the Fund’s total assets. Such loans are secured by collateral equal to no less than the market value of the loaned securities determined daily by the securities lending provider. Such collateral will be cash or debt securities issued or guaranteed by the U.S. Government or any of its sponsored agencies. Cash collateral received in connection with these loans is invested in short-term money market instruments or affiliated, unregistered investment companies that comply with Rule 2a-7 under the 1940 Act and money market funds (collectively, “affiliated money market funds”) and is shown as such on the Schedule of Investments. The Fund bears the risk of loss with respect to the investment of collateral. It is the Fund’s policy to obtain additional collateral from or return excess collateral to the borrower by the end of the next business day, following the valuation date of the securities loaned. Therefore, the value of the collateral held may be temporarily less than the value of the securities on loan. When loaning securities, the Fund retains certain benefits of owning the securities, including the economic equivalent of dividends or interest generated by the security. |
Lending securities entails a risk of loss to the Fund if, and to the extent that, the market value of the securities loaned were to increase and the borrower did not increase the collateral accordingly, and the borrower failed to return the securities. The securities loaned are subject to termination at the option of the borrower
or the Fund. Upon termination, the borrower will return to the Fund the securities loaned and the Fund will return the collateral. Upon the failure of the borrower to return the securities, collateral may be liquidated and the securities may be purchased on the open market to replace the loaned securities. The Fund could experience delays and costs in gaining access to the collateral and the securities may lose value during the delay which could result in potential losses to the Fund. Some of these losses may be indemnified by the lending agent. The Fund bears the risk of any deficiency in the amount of the collateral available for return to the borrower due to any loss on the collateral invested. Dividends received on cash collateral investments for securities lending transactions, which are net of compensation to counterparties, are included in Dividends from affiliated money market funds on the Statement of Operations. The aggregate value of securities out on loan, if any, is shown as a footnote on the Statement of Assets and Liabilities.
The Adviser serves as an affiliated securities lending agent for the Fund. The Bank of New York Mellon also serves as a securities lending agent. To the extent the Fund utilizes the Adviser as an affiliated securities lending agent, the Fund conducts its securities lending in accordance with, and in reliance upon, no-action letters issued by the SEC staff that provide guidance on how an affiliate may act as a direct agent lender and receive compensation for those services in a manner consistent with the federal securities laws. For the year ended October 31, 2023, the Fund paid the Adviser $11,740 in fees for securities lending agent services. Fees paid to the Adviser for securities lending agent services, if any, are included in Dividends from affiliated money market funds on the Statement of Operations.
| L. | Foreign Currency Translations – Foreign currency is valued at the close of the NYSE based on quotations posted by banks and major currency dealers. Portfolio securities and other assets and liabilities denominated in foreign currencies are translated into U.S. dollar amounts at the date of valuation. Purchases and sales of portfolio securities (net of foreign taxes withheld on disposition) and income items denominated in foreign currencies are translated into U.S. dollar amounts on the respective dates of such transactions. The Fund does not separately account for the portion of the results of operations resulting from changes in foreign exchange rates on investments and the fluctuations arising from changes in market prices of securities held. The combined results of changes in foreign exchange rates and the fluctuation of market prices on investments (net of estimated foreign tax withholding) are included with the net realized and unrealized gain or loss from investments in the Statement of Operations. Reported net realized foreign currency gains or losses arise from (1) sales of foreign currencies, (2) currency gains or losses realized between the trade and settlement dates on securities transactions, and (3) the difference between the amounts of dividends, interest, and foreign withholding taxes recorded on the Fund’s books and the U.S. dollar equivalent of the amounts actually received or paid. Net unrealized foreign currency gains and losses arise from changes in the fair values of assets and liabilities, other than investments in securities at fiscal period end, resulting from changes in exchange rates. |
The Fund may invest in foreign securities, which may be subject to foreign taxes on income, gains on investments or currency repatriation, a portion of which may be recoverable. Foreign taxes, if any, are recorded based on the tax regulations and rates that exist in the foreign markets in which the Fund invests and are shown in the Statement of Operations.
| M. | Forward Foreign Currency Contracts – The Fund may engage in foreign currency transactions either on a spot (i.e. for prompt delivery and settlement) basis, or through forward foreign currency contracts, to manage or minimize currency or exchange rate risk. |
The Fund may also enter into forward foreign currency contracts for the purchase or sale of a security denominated in a foreign currency in order to “lock in” the U.S. dollar price of that security, or the Fund may also enter into forward foreign currency contracts that do not provide for physical exchange of the two currencies on the settlement date, but instead are settled by a single cash payment calculated as the difference between the agreed upon exchange rate and the spot rate at settlement based upon an agreed upon notional amount (non-deliverable forwards).
A forward foreign currency contract is an obligation between two parties (“Counterparties”) to purchase or sell a specific currency for an agreed-upon price at a future date. The use of forward foreign currency contracts for hedging does not eliminate fluctuations in the price of the underlying securities the Fund owns or intends to acquire but establishes a rate of exchange in advance. Fluctuations in the value of these contracts are measured by the difference in the contract date and reporting date exchange rates and are recorded as unrealized appreciation (depreciation) until the contracts are closed. When the contracts are closed, realized gains (losses) are recorded. Realized and unrealized gains (losses) on the contracts are included in the Statement of Operations. The primary risks associated with forward foreign currency contracts include failure of the Counterparty to meet the terms of the contract and the value of the foreign currency changing unfavorably. These risks may be in excess of the amounts reflected in the Statement of Assets and Liabilities.
NOTE 2–Advisory Fees and Other Fees Paid to Affiliates
The Trust has entered into a master investment advisory agreement with the Adviser. Under the terms of the investment advisory agreement, the Fund accrues daily and pays monthly an advisory fee to the Adviser based on the annual rate of the Fund’s average daily net assets as follows:
| | | | | | |
| Average Daily Net Assets | | Rate | |
| |
First $250 million | | | 0.695% | |
| |
Next $4.05 billion | | | 0.615% | |
| |
Next $3.9 billion | | | 0.570% | |
| |
Next $1.8 billion | | | 0.545% | |
| |
Over $10 billion | | | 0.520% | |
| |
For the year ended October 31, 2023, the effective advisory fee rate incurred by the Fund was 0.62%.
Under the terms of a master sub-advisory agreement between the Adviser and each of Invesco Asset Management Deutschland GmbH, Invesco Asset Management Limited, Invesco Asset Management (Japan) Limited, Invesco Hong Kong Limited, Invesco Senior Secured Management, Inc. and Invesco Canada Ltd. (collectively, the “Affiliated Sub-Advisers”) the Adviser, not the Fund, will pay 40% of the fees paid to the Adviser to any such Affiliated Sub-Adviser(s) that provide(s) discretionary investment management services to the Fund based on the percentage of assets allocated to such Affiliated Sub-Adviser(s).
Effective July 1, 2023, the Adviser has agreed, for an indefinite period, to waive advisory fees and/or reimburse expenses of all shares to the extent necessary to limit total annual fund operating expenses after fee waiver and/or expense reimbursement (excluding certain items discussed below) of Class A, Class C, Class R, Class S, Class Y, Class R5 and Class R6 shares to 2.00%, 2.75%, 2.25%, 1.90%, 1.75%, 1.75% and 1.75%, respectively, of the Fund’s average daily net assets (the “boundary limits”). Prior to July 1, 2023, the same boundary limits were in effect with an expiration date of June 30, 2023. In determining the Adviser’s obligation to waive advisory fees and/or reimburse expenses, the following expenses are not taken into account, and could cause the total annual fund operating expenses after fee waiver and/or expense reimbursement to exceed the numbers reflected above: (1) interest; (2) taxes; (3) dividend expense on short sales; (4) extraordinary or non-routine items, including litigation expenses; and (5) expenses that the Fund has incurred but did not actually pay because of an expense offset arrangement. Invesco may amend and/or terminate these boundary limits at any time in its sole discretion and will inform the Board of Trustees of any such changes. The Adviser did not waive fees and/or reimburse expenses during the period under these boundary limits.
Further, the Adviser has contractually agreed, through at least June 30, 2025, to waive the advisory fee payable by the Fund in an amount equal to 100% of the net advisory fees the Adviser receives from the affiliated money market funds on investments by the Fund of uninvested cash (excluding investments of cash collateral from securities lending) in such affiliated money market funds.
For the year ended October 31, 2023, the Adviser waived advisory fees of $38,788.
The Trust has entered into a master administrative services agreement with Invesco pursuant to which the Fund has agreed to pay Invesco for certain administrative costs incurred in providing accounting services to the Fund. For the year ended October 31, 2023, expenses incurred under the agreement are shown in the Statement of Operations as Administrative services fees. Invesco has entered into a sub-administration agreement whereby State Street Bank and Trust Company (“SSB”) serves as fund accountant and provides certain administrative services to the Fund. Pursuant to a custody agreement with the Trust on behalf of the Fund, SSB also serves as the Fund’s custodian.
The Trust has entered into a transfer agency and service agreement with Invesco Investment Services, Inc. (“IIS”) pursuant to which the Fund has agreed to pay IIS a fee for providing transfer agency and shareholder services to the Fund and reimburse IIS for certain expenses incurred by IIS in the course of providing such services. IIS may make payments to intermediaries that provide omnibus account services, sub-accounting services and/or networking services. All fees payable by IIS to intermediaries that provide omnibus account services or sub-accounting services are charged back to the Fund, subject to certain limitations approved by the Trust’s Board of Trustees. For the year ended October 31, 2023, expenses incurred under the agreement are shown in the Statement of Operations as Transfer agent fees.
The Trust has entered into master distribution agreements with Invesco Distributors, Inc. (“IDI”) to serve as the distributor for the Class A, Class C, Class R, Class S, Class Y, Class R5 and Class R6 shares of the Fund. The Trust has adopted plans pursuant to Rule 12b-1 under the 1940 Act with respect to the Fund’s Class A, Class C, Class R and Class S shares (collectively, the “Plans”). The Fund, pursuant to the Plans, pays IDI compensation at the annual rate of 0.25% of the Fund’s average daily net assets of Class A shares, 1.00% of the average daily net assets of Class C shares, 0.50% of the average daily net assets of Class R shares and 0.15% of the average daily net assets of Class S shares. The fees are accrued daily and paid monthly. Of the Plans payments, up to 0.25% of the average daily net assets of Class A, Class C and Class R shares and 0.15% of the average daily net assets of Class S shares may be paid to furnish continuing personal shareholder services to customers who purchase and own shares of such classes. Any amounts not paid as a service fee under the Plans would constitute an asset-based sales charge. Rules of the Financial Industry Regulatory Authority (“FINRA”) impose a cap on the total sales charges, including asset-based sales charges, that may be paid by any class of shares of the Fund. For the year ended October 31, 2023, expenses incurred under the Plans are shown in the Statement of Operations as Distribution fees.
Front-end sales commissions and CDSC (collectively, the “sales charges”) are not recorded as expenses of the Fund. Front-end sales commissions are deducted from proceeds from the sales of Fund shares prior to investment in Class A shares of the Fund. CDSC are deducted from redemption proceeds prior to remittance to the shareholder. During the year ended October 31, 2023, IDI advised the Fund that IDI retained $91,374 in front-end sales commissions from the sale of Class A shares and $1,143 and $461 from Class A and Class C shares, respectively, for CDSC imposed upon redemptions by shareholders.
For the year ended October 31, 2023, the Fund incurred $48,385 in brokerage commissions with Invesco Capital Markets, Inc., an affiliate of the Adviser and IDI, for portfolio transactions executed on behalf of the Fund.
Certain officers and trustees of the Trust are officers and directors of the Adviser, IIS and/or IDI.
NOTE 3–Additional Valuation Information
GAAP defines fair value as the price that would be received to sell an asset or paid to transfer a liability in an orderly transaction between market participants at the measurement date, under current market conditions. GAAP establishes a hierarchy that prioritizes the inputs to valuation methods, giving the highest priority to readily available unadjusted quoted prices in an active market for identical assets (Level 1) and the lowest priority to significant unobservable inputs (Level 3), generally when market prices are not readily available. Based on the valuation inputs, the securities or other investments are tiered into one of three levels. Changes in valuation methods may result in transfers in or out of an investment’s assigned level:
| | |
| Level 1 - | | Prices are determined using quoted prices in an active market for identical assets. |
| Level 2 - | | Prices are determined using other significant observable inputs. Observable inputs are inputs that other market participants may use in pricing a security. These may include quoted prices for similar securities, interest rates, prepayment speeds, credit risk, yield curves, loss severities, default rates, discount rates, volatilities and others. |
| Level 3 - | | Prices are determined using significant unobservable inputs. In situations where quoted prices or observable inputs are unavailable (for example, when there is little or no market activity for an investment at the end of the period), unobservable inputs may be used. Unobservable inputs reflect the Adviser’s assumptions about the factors market participants would use in determining fair value of the securities or instruments and would be based on the best available information. |
The following is a summary of the tiered valuation input levels, as of October 31, 2023. The level assigned to the securities valuations may not be an indication of the risk or liquidity associated with investing in those securities. Because of the inherent uncertainties of valuation, the values reflected in the financial statements may materially differ from the value received upon actual sale of those investments.
| | | | | | | | | | | | | | | | |
| | | Level 1 | | | Level 2 | | | Level 3 | | | Total | |
|
| |
Investments in Securities | | | | | | | | | | | | | | | | |
|
| |
Common Stocks & Other Equity Interests | | $ | 2,763,773,927 | | | $ | 13,885,426 | | | | $– | | | $ | 2,777,659,353 | |
|
| |
Money Market Funds | | | 13,722,864 | | | | 10,635,036 | | | | – | | | | 24,357,900 | |
|
| |
Total Investments | | $ | 2,777,496,791 | | | $ | 24,520,462 | | | | $– | | | $ | 2,802,017,253 | |
|
| |
NOTE 4–Expense Offset Arrangement(s)
The expense offset arrangement is comprised of transfer agency credits which result from balances in demand deposit accounts used by the transfer agent for clearing shareholder transactions. For the year ended October 31, 2023, the Fund received credits from this arrangement, which resulted in the reduction of the Fund’s total expenses of $95,218.
NOTE 5–Trustees’ and Officers’ Fees and Benefits
Trustees’ and Officers’ Fees and Benefits include amounts accrued by the Fund to pay remuneration to certain Trustees and Officers of the Fund. Trustees have the option to defer compensation payable by the Fund, and Trustees’ and Officers’ Fees and Benefits also include amounts accrued by the Fund to fund such deferred compensation amounts. Those Trustees who defer compensation have the option to select various Invesco Funds in which their deferral accounts shall be deemed to be invested. Finally, certain current Trustees were eligible to participate in a retirement plan that provided for benefits to be paid upon retirement to Trustees over a period of time based on the number of years of service. The Fund may have certain former Trustees who also participate in a retirement plan and receive benefits under such plan. Trustees’ and Officers’ Fees and Benefits include amounts accrued by the Fund to fund such retirement benefits. Obligations under the deferred compensation and retirement plans represent unsecured claims against the general assets of the Fund.
NOTE 6–Cash Balances
The Fund is permitted to temporarily carry a negative or overdrawn balance in its account with SSB, the custodian bank. Such balances, if any at period-end, are shown in the Statement of Assets and Liabilities under the payable caption Amount due custodian. To compensate the custodian bank for such overdrafts, the overdrawn Fund
may either (1) leave funds as a compensating balance in the account so the custodian bank can be compensated by earning the additional interest; or (2) compensate by paying the custodian bank at a rate agreed upon by the custodian bank and Invesco, not to exceed the contractually agreed upon rate.
NOTE 7–Distributions to Shareholders and Tax Components of Net Assets
Tax Character of Distributions to Shareholders Paid During the Fiscal Years Ended October 31, 2023 and 2022:
| | | | | | | | | | | | |
| | | 2023 | | | | | | 2022 | |
|
| |
Ordinary income* | | $ | 21,955,418 | | | | | | | $ | 87,532,910 | |
|
| |
Long-term capital gain | | | 92,306,295 | | | | | | | | 457,515,321 | |
|
| |
Total distributions | | $ | 114,261,713 | | | | | | | $ | 545,048,231 | |
|
| |
| * | Includes short-term capital gain distributions, if any. |
Tax Components of Net Assets at Period-End:
| | | | |
| | | 2023 | |
|
| |
Undistributed ordinary income | | $ | 22,358,010 | |
|
| |
Undistributed long-term capital gain | | | 160,080,188 | |
|
| |
Net unrealized appreciation – investments | | | 487,055,089 | |
|
| |
Net unrealized appreciation (depreciation) – foreign currencies | | | (37,132 | ) |
|
| |
Temporary book/tax differences | | | (858,241 | ) |
|
| |
Shares of beneficial interest | | | 2,131,181,055 | |
|
| |
Total net assets | | $ | 2,799,778,969 | |
|
| |
The difference between book-basis and tax-basis unrealized appreciation (depreciation) is due to differences in the timing of recognition of gains and losses on investments for tax and book purposes. The Fund’s net unrealized appreciation (depreciation) difference is attributable primarily to wash sales.
The temporary book/tax differences are a result of timing differences between book and tax recognition of income and/or expenses. The Fund’s temporary book/tax differences are the result of the trustee deferral of compensation and retirement plan benefits.
Capital loss carryforward is calculated and reported as of a specific date. Results of transactions and other activity after that date may affect the amount of capital loss carryforward actually available for the Fund to utilize. The ability to utilize capital loss carryforward in the future may be limited under the Internal Revenue Code and related regulations based on the results of future transactions.
The Fund does not have a capital loss carryforward as of October 31, 2023.
NOTE 8–Investment Transactions
The aggregate amount of investment securities (other than short-term securities, U.S. Government obligations and money market funds, if any) purchased and sold by the Fund during the year ended October 31, 2023 was $2,435,447,245 and $2,690,112,519, respectively. Cost of investments, including any derivatives, on a tax basis includes the adjustments for financial reporting purposes as of the most recently completed federal income tax reporting period-end.
| | | | |
Unrealized Appreciation (Depreciation) of Investments on a Tax Basis | |
Aggregate unrealized appreciation of investments | | | $ 613,060,214 | |
|
| |
Aggregate unrealized (depreciation) of investments | | | (126,005,125 | ) |
|
| |
Net unrealized appreciation of investments | | | $ 487,055,089 | |
|
| |
Cost of investments for tax purposes is $2,314,962,164.
NOTE 9–Reclassification of Permanent Differences
Primarily as a result of differing book/tax treatment of partnerships, on October 31, 2023, undistributed net investment income was increased by $3,730,270, undistributed net realized gain was decreased by $3,725,931 and shares of beneficial interest was decreased by $4,339. This reclassification had no effect on the net assets of the Fund.
NOTE 10–Share Information
| | | | | | | | | | | | | | | | |
| | | Summary of Share Activity | |
|
| |
| | | Year ended | | | Year ended | |
| | | October 31, 2023(a) | | | October 31, 2022 | |
| | | Shares | | | Amount | | | Shares | | | Amount | |
|
| |
Sold: | | | | | | | | | | | | | | | | |
Class A | | | 2,271,675 | | | $ | 36,577,611 | | | | 2,731,948 | | | $ | 47,384,052 | |
|
| |
Class C | | | 131,138 | | | | 1,867,355 | | | | 178,317 | | | | 2,754,149 | |
|
| |
Class R | | | 108,140 | | | | 1,719,707 | | | | 137,101 | | | | 2,394,103 | |
|
| |
Class S | | | 15,068 | | | | 240,188 | | | | 15,469 | | | | 269,618 | |
|
| |
Class Y | | | 893,640 | | | | 14,347,344 | | | | 1,119,532 | | | | 19,144,631 | |
|
| |
Class R5 | | | 31,626 | | | | 534,244 | | | | 40,983 | | | | 770,127 | |
|
| |
Class R6 | | | 222,317 | | | | 3,791,403 | | | | 354,798 | | | | 7,566,199 | |
|
| |
| | | | | | | | | | | | | | | | |
| | | Summary of Share Activity | |
|
| |
| | | Year ended | | | Year ended | |
| | | October 31, 2023(a) | | | October 31, 2022 | |
| | | Shares | | | Amount | | | Shares | | | Amount | |
|
| |
| | | | |
Issued as reinvestment of dividends: | | | | | | | | | | | | | | | | |
Class A | | | 6,826,746 | | | $ | 100,352,865 | | | | 25,285,326 | | | $ | 478,145,790 | |
|
| |
Class C | | | 49,820 | | | | 655,128 | | | | 243,059 | | | | 4,127,134 | |
|
| |
Class R | | | 41,416 | | | | 602,186 | | | | 156,901 | | | | 2,934,049 | |
|
| |
Class S | | | 42,097 | | | | 618,823 | | | | 157,596 | | | | 2,978,567 | |
|
| |
Class Y | | | 194,031 | | | | 2,865,844 | | | | 666,800 | | | | 12,669,201 | |
|
| |
Class R5 | | | 16,780 | | | | 264,794 | | | | 57,483 | | | | 1,164,037 | |
|
| |
Class R6 | | | 34,066 | | | | 536,873 | | | | 154,923 | | | | 3,132,535 | |
|
| |
| | | | |
Automatic conversion of Class C shares to Class A shares: | | | | | | | | | | | | | | | | |
Class A | | | 136,433 | | | | 2,163,013 | | | | 144,900 | | | | 2,483,476 | |
|
| |
Class C | | | (152,940 | ) | | | (2,163,013 | ) | | | (161,690 | ) | | | (2,483,476 | ) |
|
| |
| | | | |
Reacquired: | | | | | | | | | | | | | | | | |
Class A | | | (18,734,188 | ) | | | (299,348,466 | ) | | | (17,936,768 | ) | | | (308,580,185 | ) |
|
| |
Class C | | | (225,995 | ) | | | (3,206,216 | ) | | | (306,435 | ) | | | (4,686,516 | ) |
|
| |
Class R | | | (232,490 | ) | | | (3,609,732 | ) | | | (198,895 | ) | | | (3,353,868 | ) |
|
| |
Class S | | | (101,850 | ) | | | (1,625,016 | ) | | | (157,777 | ) | | | (2,698,494 | ) |
|
| |
Class Y | | | (1,834,966 | ) | | | (29,048,863 | ) | | | (1,339,703 | ) | | | (22,939,174 | ) |
|
| |
Class R5 | | | (123,341 | ) | | | (2,141,722 | ) | | | (89,600 | ) | | | (1,783,039 | ) |
|
| |
Class R6 | | | (284,985 | ) | | | (4,966,324 | ) | | | (534,264 | ) | | | (9,615,210 | ) |
|
| |
Net increase (decrease) in share activity | | | (10,675,762 | ) | | $ | (178,971,974 | ) | | | 10,720,004 | | | $ | 231,777,706 | |
|
| |
| (a) | There are entities that are record owners of more than 5% of the outstanding shares of the Fund and in the aggregate own 30% of the outstanding shares of the Fund. IDI has an agreement with these entities to sell Fund shares. The Fund, Invesco and/or Invesco affiliates may make payments to these entities, which are considered to be related to the Fund, for providing services to the Fund, Invesco and/or Invesco affiliates including but not limited to services such as securities brokerage, distribution, third party record keeping and account servicing. The Fund has no knowledge as to whether all or any portion of the shares owned of record by these entities are also owned beneficially. |
Report of Independent Registered Public Accounting Firm
To the Board of Trustees of AIM Equity Funds (Invesco Equity Funds) and Shareholders of Invesco Charter Fund
Opinion on the Financial Statements
We have audited the accompanying statement of assets and liabilities, including the schedule of investments, of Invesco Charter Fund (one of the funds constituting AIM Equity Funds (Invesco Equity Funds), referred to hereafter as the “Fund”) as of October 31, 2023, the related statement of operations for the year ended October 31, 2023, the statement of changes in net assets for each of the two years in the period ended October 31, 2023, including the related notes, and the financial highlights for each of the five years in the period ended October 31, 2023 (collectively referred to as the “financial statements”). In our opinion, the financial statements present fairly, in all material respects, the financial position of the Fund as of October 31, 2023, the results of its operations for the year then ended, the changes in its net assets for each of the two years in the period ended October 31, 2023 and the financial highlights for each of the five years in the period ended October 31, 2023 in conformity with accounting principles generally accepted in the United States of America.
Basis for Opinion
These financial statements are the responsibility of the Fund’s management. Our responsibility is to express an opinion on the Fund’s financial statements based on our audits. We are a public accounting firm registered with the Public Company Accounting Oversight Board (United States) (PCAOB) and are required to be independent with respect to the Fund in accordance with the U.S. federal securities laws and the applicable rules and regulations of the Securities and Exchange Commission and the PCAOB.
We conducted our audits of these financial statements in accordance with the standards of the PCAOB. Those standards require that we plan and perform the audit to obtain reasonable assurance about whether the financial statements are free of material misstatement, whether due to error or fraud.
Our audits included performing procedures to assess the risks of material misstatement of the financial statements, whether due to error or fraud, and performing procedures that respond to those risks. Such procedures included examining, on a test basis, evidence regarding the amounts and disclosures in the financial statements. Our audits also included evaluating the accounting principles used and significant estimates made by management, as well as evaluating the overall presentation of the financial statements. Our procedures included confirmation of securities owned as of October 31, 2023 by correspondence with the custodian, transfer agent and broker. We believe that our audits provide a reasonable basis for our opinion.
/s/PricewaterhouseCoopers LLP
Houston, Texas
December 21, 2023
We have served as the auditor of one or more of the investment companies in the Invesco group of investment companies since at least 1995. We have not been able to determine the specific year we began serving as auditor.
Calculating your ongoing Fund expenses
Example
As a shareholder of the Fund, you incur two types of costs: (1) transaction costs, which may include sales charges (loads) on purchase payments or contingent deferred sales charges on redemptions, if any; and (2) ongoing costs, including management fees, distribution and/or service (12b-1) fees, and other Fund expenses. This example is intended to help you understand your ongoing costs (in dollars) of investing in the Fund and to compare these costs with ongoing costs of investing in other mutual funds. The example is based on an investment of $1,000 invested at the beginning of the period and held for the entire period May 1, 2023 through October 31, 2023.
Actual expenses
The table below provides information about actual account values and actual expenses. You may use the information in this table, together with the amount you invested, to estimate the expenses that you paid over the period. Simply divide your account value by $1,000 (for example, an $8,600 account value divided by $1,000 = 8.6), then multiply the result by the number in the table under the heading entitled “Actual Expenses Paid During Period” to estimate the expenses you paid on your account during this period.
Hypothetical example for comparison purposes
The table below also provides information about hypothetical account values and hypothetical expenses based on the Fund’s actual expense ratio and an assumed rate of return of 5% per year before expenses, which is not the Fund’s actual return.
The hypothetical account values and expenses may not be used to estimate the actual ending account balance or expenses you paid for the period. You may use this information to compare the ongoing costs of investing in the Fund and other funds. To do so, compare this 5% hypothetical example with the 5% hypothetical examples that appear in the shareholder reports of the other funds.
Please note that the expenses shown in the table are meant to highlight your ongoing costs only and do not reflect any transaction costs, such as sales charges (loads) on purchase payments or contingent deferred sales charges on redemptions, if any. Therefore, the hypothetical information is useful in comparing ongoing costs only, and will not help you determine the relative total costs of owning different funds. In addition, expenses shown in the table do not include the expenses of the underlying funds, which are borne indirectly by the Fund. If transaction costs and indirect expenses were included, your costs would have been higher.
| | | | | | | | | | | | |
| | | | | ACTUAL | | HYPOTHETICAL
(5% annual return before expenses) | | |
| | | Beginning Account Value (05/01/23) | | Ending Account Value (10/31/23)1 | | Expenses Paid During Period2 | | Ending Account Value (10/31/23) | | Expenses Paid During Period2 | | Annualized Expense Ratio |
Class A | | $1,000.00 | | $996.30 | | $5.13 | | $1,020.06 | | $5.19 | | 1.02% |
Class C | | 1,000.00 | | 992.30 | | 8.89 | | 1,016.28 | | 9.00 | | 1.77 |
Class R | | 1,000.00 | | 995.00 | | 6.39 | | 1,018.80 | | 6.46 | | 1.27 |
Class S | | 1,000.00 | | 997.50 | | 4.63 | | 1,020.57 | | 4.69 | | 0.92 |
Class Y | | 1,000.00 | | 997.50 | | 3.88 | | 1,021.32 | | 3.92 | | 0.77 |
Class R5 | | 1,000.00 | | 997.70 | | 3.83 | | 1,021.37 | | 3.87 | | 0.76 |
Class R6 | | 1,000.00 | | 998.30 | | 3.48 | | 1,021.73 | | 3.52 | | 0.69 |
| 1 | The actual ending account value is based on the actual total return of the Fund for the period May 1, 2023 through October 31, 2023, after actual expenses and will differ from the hypothetical ending account value which is based on the Fund’s expense ratio and a hypothetical annual return of 5% before expenses. |
| 2 | Expenses are equal to the Fund’s annualized expense ratio as indicated above multiplied by the average account value over the period, multiplied by 184/365 to reflect the most recent fiscal half year. |
Approval of Investment Advisory and Sub-Advisory Contracts
At meetings held on June 13, 2023, the Board of Trustees (the Board or the Trustees) of AIM Equity Funds (Invesco Equity Funds) as a whole, and the independent Trustees, who comprise over 75% of the Board, voting separately, approved the continuance of the Invesco Charter Fund’s (the Fund) Master Investment Advisory Agreement with Invesco Advisers, Inc. (Invesco Advisers and the investment advisory agreement) and the Master Intergroup Sub-Advisory Contract for Mutual Funds with Invesco Asset Management Deutschland GmbH, Invesco Asset Management Limited, Invesco Asset Management (Japan) Limited, Invesco Hong Kong Limited, Invesco Senior Secured Management, Inc. and Invesco Canada Ltd. (collectively, the Affiliated Sub-Advisers and the sub-advisory contracts) for another year, effective July 1, 2023. After evaluating the factors discussed below, among others, the Board approved the renewal of the Fund’s investment advisory agreement and the sub-advisory contracts and determined that the compensation payable thereunder by the Fund to Invesco Advisers and by Invesco Advisers to the Affiliated Sub-Advisers is fair and reasonable.
The Board’s Evaluation Process
The Board has established an Investments Committee, which in turn has established Sub-Committees, that meet throughout the year to review the performance of funds advised by Invesco Advisers (the Invesco Funds). The Sub-Committees meet regularly with portfolio managers for their assigned Invesco Funds and other members of management to review information about investment performance and portfolio attributes of these funds. The Board has established additional standing and ad hoc committees that meet regularly throughout the year to review matters within their purview, including a working group focused on opportunities to make ongoing and continuous improvements to the annual review process for the Invesco Funds’ investment advisory and sub-advisory contracts. The Board took into account evaluations and reports that it received from its committees and sub-committees, as well as the information provided to the Board and its committees and sub-committees throughout the year, in considering whether to approve each Invesco Fund’s investment advisory agreement and sub-advisory contracts.
As part of the contract renewal process, the Board reviews and considers information provided in response to requests for information submitted to management by the independent Trustees with assistance from legal counsel to the independent Trustees and the Senior Officer, an officer of the Invesco Funds who reports directly to the independent Trustees. The Board receives comparative investment performance and fee and expense data regarding the Invesco Funds prepared by Broadridge Financial Solutions, Inc. (Broadridge), an independent mutual fund data provider, as well as information on the composition of the peer groups provided by Broadridge and its methodology for determining peer groups. The Board also receives an independent written evaluation from the Senior Officer. The Senior Officer’s evaluation is prepared as part of his responsibility to manage the process by which the Invesco Funds’ proposed management fees are negotiated during the annual contract renewal
process to ensure they are negotiated in a manner that is at arms’ length and reasonable in accordance with certain negotiated regulatory requirements. In addition to meetings with Invesco Advisers and fund counsel throughout the year and as part of meetings convened on May 2, 2023 and June 13, 2023, the independent Trustees also discussed the continuance of the investment advisory agreement and sub-advisory contracts in separate sessions with the Senior Officer and with independent legal counsel. Also, as part of the contract renewal process, the independent Trustees reviewed and considered information provided in response to follow-up requests for information submitted by the independent Trustees to management. The independent Trustees met and discussed those follow-up responses with legal counsel to the independent Trustees and the Senior Officer.
The discussion below is a summary of the Senior Officer’s independent written evaluation with respect to the Fund’s investment advisory agreement and sub-advisory contracts, as well as a discussion of the material factors and related conclusions that formed the basis for the Board’s approval of the Fund’s investment advisory agreement and sub-advisory contracts. The Trustees’ review and conclusions are based on the comprehensive consideration of all information presented to them during the course of the year and in prior years and are not the result of any single determinative factor. Moreover, one Trustee may have weighed a particular piece of information or factor differently than another Trustee. The information received and considered by the Board was current as of various dates prior to the Board’s approval on June 13, 2023.
Factors and Conclusions and Summary of Independent Written Fee Evaluation
| A. | Nature, Extent and Quality of Services Provided by Invesco Advisers and the Affiliated Sub-Advisers |
The Board reviewed the nature, extent and quality of the advisory services provided to the Fund by Invesco Advisers under the Fund’s investment advisory agreement, and the credentials and experience of the officers and employees of Invesco Advisers who provide these services, including the Fund’s portfolio manager(s). The Board considered recent senior management changes at Invesco and Invesco Advisers, including the appointment of new Co-Heads of Investments, that had been presented to and discussed with the Board. The Board’s review included consideration of Invesco Advisers’ investment process and oversight, credit analysis and research capabilities. The Board considered information regarding Invesco Advisers’ programs for and resources devoted to risk management, including management of investment, enterprise, operational, liquidity, derivatives, valuation and compliance risks, and technology used to manage such risks. The Board received information regarding Invesco’s methodology for compensating its investment professionals and the incentives and accountability it creates, as well as how it impacts Invesco’s ability to attract and retain talent. The Board received a description of, and reports related to, Invesco Advisers’ global security program and business continuity plans and of its approach to data privacy and cybersecurity, including related testing. The
Board also considered non-advisory services that Invesco Advisers and its affiliates provide to the Invesco Funds, such as various middle office and back office support functions, third party oversight, internal audit, valuation, portfolio trading and legal and compliance. The Board observed that Invesco Advisers’ systems preparedness and ongoing investment enabled Invesco Advisers to manage, operate and oversee the Invesco Funds with minimal impact or disruption through challenging environments. The Board reviewed and considered the benefits to shareholders of investing in a Fund that is part of the family of funds under the umbrella of Invesco Ltd., Invesco Advisers’ parent company, and noted Invesco Ltd.’s depth and experience in running an investment management business, as well as its commitment of financial and other resources to such business. The Board concluded that the nature, extent and quality of the services provided to the Fund by Invesco Advisers are appropriate and satisfactory.
The Board reviewed the services that may be provided to the Fund by the Affiliated Sub-Advisers under the sub-advisory contracts and the credentials and experience of the officers and employees of the Affiliated Sub-Advisers who provide these services. The Board noted the Affiliated Sub-Advisers’ expertise with respect to certain asset classes and that the Affiliated Sub-Advisers have offices and personnel that are located in financial centers around the world. As a result, the Board noted that the Affiliated Sub-Advisers can provide research and investment analysis on the markets and economies of various countries and territories in which the Fund may invest, make recommendations regarding securities and assist with portfolio trading. The Board concluded that the sub-advisory contracts may benefit the Fund and its shareholders by permitting Invesco Advisers to use the resources and talents of the Affiliated Sub-Advisers in managing the Fund. The Board concluded that the nature, extent and quality of the services that may be provided to the Fund by the Affiliated Sub-Advisers are appropriate and satisfactory.
| B. | Fund Investment Performance |
The Board considered Fund investment performance as a relevant factor in considering whether to approve the investment advisory agreement. The Board did not view Fund investment performance as a relevant factor in considering whether to approve the sub-advisory contracts for the Fund, as no Affiliated Sub-Adviser currently manages assets of the Fund.
The Board compared the Fund’s investment performance over multiple time periods ending December 31, 2022 to the performance of funds in the Broadridge performance universe and against the Russell 1000® Index (Index). The Board noted that performance of Class A shares of the Fund was in the fifth quintile of its performance universe for the one, three and five year periods (the first quintile being the best performing funds and the fifth quintile being the worst performing funds). The Board noted that performance of Class A shares of the Fund was below the performance of the Index for the one, three and five year periods. The Board considered that stock selection in certain sectors detracted from the Fund’s relative performance. The Board further considered that the Fund underwent a portfolio management
team change in November 2022, and that performance results prior to such date were those of the prior portfolio management team. The Board recognized that the performance data reflects a snapshot in time as of a particular date and that selecting a different performance period could produce different results. The Board also reviewed more recent Fund performance as well as other performance metrics, which did not change its conclusions.
| C. | Advisory and Sub-Advisory Fees and Fund Expenses |
The Board compared the Fund’s contractual management fee rate to the contractual management fee rates of funds in the Fund’s Broadridge expense group. The Board noted that the contractual management fee rate for Class A shares of the Fund was the same as the median contractual management fee rate of funds in its expense group. The Board noted that the term “contractual management fee” for funds in the expense group may include both advisory and certain non-portfolio management administrative services fees, but that Broadridge is not able to provide information on a fund-by-fund basis as to what is included. The Board also reviewed the methodology used by Broadridge in calculating expense group information, which includes using each fund’s contractual management fee schedule (including any applicable breakpoints) as reported in the most recent prospectus or statement of additional information for each fund in the expense group. The Board also considered comparative information regarding the Fund’s total expense ratio and its various components.
The Board noted that Invesco Advisers has contractually agreed to waive fees and/or limit expenses of the Fund for the term disclosed in the Fund’s registration statement in an amount necessary to limit total annual operating expenses to a specified percentage of average daily net assets for each class of the Fund.
The Board noted that Invesco Advisers and the Affiliated Sub-Advisers do not manage other similarly managed mutual funds or client accounts.
The Board also considered the services that may be provided by the Affiliated Sub-Advisers pursuant to the sub-advisory contracts, as well as the fees payable by Invesco Advisers to the Affiliated Sub-Advisers pursuant to the sub-advisory contracts.
| D. | Economies of Scale and Breakpoints |
The Board considered the extent to which there may be economies of scale in the provision of advisory services to the Fund and the Invesco Funds, and the extent to which such economies of scale are shared with the Fund and the Invesco Funds. The Board acknowledged the difficulty in calculating and measuring economies of scale at the individual fund level; noting that only indicative and estimated measures are available at the individual fund level and that such measures are subject to uncertainty. The Board considered that the Fund benefits from economies of scale through contractual breakpoints in the Fund’s advisory fee schedule, which generally operate to reduce the Fund’s expense ratio as it grows in size. The Board noted that the Fund also shares in economies of scale through Invesco Advisers’ ability to negotiate lower fee arrangements with third party service providers. The Board noted that the Fund may also benefit from economies of scale through initial fee setting, fee waivers and expense reimbursements, as well as Invesco Advisers’ investment in its business, including investments in
business infrastructure, technology and cybersecurity.
| E. | Profitability and Financial Resources |
The Board reviewed information from Invesco Advisers concerning the costs of the advisory and other services that Invesco Advisers and its affiliates provide to the Fund and the Invesco Funds and the profitability of Invesco Advisers and its affiliates in providing these services in the aggregate and on an individual fund-by-fund basis. The Board considered the methodology used for calculating profitability and the periodic review and enhancement of such methodology. The Board noted that Invesco Advisers continues to operate at a net profit from services Invesco Advisers and its affiliates provide to the Invesco Funds in the aggregate and to most Invesco Funds individually. The Board considered that profits to Invesco Advisers can vary significantly depending on the particular Invesco Fund, with some Invesco Funds showing indicative losses to Invesco Advisers and others showing indicative profits at healthy levels, and that Invesco Advisers’ support for and commitment to an Invesco Fund are not, however, solely dependent on the profits realized as to that Fund. The Board did not deem the level of profits realized by Invesco Advisers and its affiliates from providing such services to be excessive, given the nature, extent and quality of the services provided. The Board noted that Invesco Advisers provided information demonstrating that Invesco Advisers is financially sound and has the resources necessary to perform its obligations under the investment advisory agreement, and provided representations indicating that the Affiliated Sub-Advisers are financially sound and have the resources necessary to perform their obligations under the sub-advisory contracts. The Board noted the cyclical and competitive nature of the global asset management industry.
| F. | Collateral Benefits to Invesco Advisers and its Affiliates |
The Board considered various other benefits received by Invesco Advisers and its affiliates from the relationship with the Fund, including the fees received for providing administrative, transfer agency and distribution services to the Fund. The Board received comparative information regarding fees charged for these services, including information provided by Broadridge and other independent sources. The Board reviewed the performance of Invesco Advisers and its affiliates in providing these services and the organizational structure employed to provide these services. The Board noted that these services are provided to the Fund pursuant to written contracts that are reviewed and subject to approval on an annual basis by the Board based on its determination that the services are required for the operation of the Fund.
The Board considered the benefits realized by Invesco Advisers and the Affiliated Sub-Advisers as a result of portfolio brokerage transactions executed through “soft dollar” arrangements. The Board noted that soft dollar arrangements may result in the Fund bearing costs to purchase research that may be used by Invesco Advisers or the Affiliated Sub-Advisers with other clients and may reduce Invesco Advisers’ or the Affiliated Sub-Advisers’ expenses. The Board also considered that it receives from Invesco Advisers periodic reports that include a representation to the effect that these arrangements are consistent with regulatory requirements. The Board did not deem the soft dollar arrangements to be inappropriate.
The Board considered that the Fund’s uninvested cash and cash collateral from any securities lending arrangements may be invested in registered money market funds or, with regard to securities lending cash collateral, unregistered funds that comply with Rule 2a-7 (collectively referred to as “affiliated money market funds”) advised by Invesco Advisers. The Board considered information regarding the returns of the affiliated money market funds relative to comparable overnight investments, as well as the fees paid by the affiliated money market funds to Invesco Advisers and its affiliates. In this regard, the Board noted that Invesco Advisers receives advisory fees from these affiliated money market funds attributable to the Fund’s investments. The Board also noted that Invesco Advisers has contractually agreed to waive through varying periods an amount equal to 100% of the net advisory fee Invesco Advisers receives from the affiliated money market funds with respect to the Fund’s investment in the affiliated money market funds of uninvested cash, but not cash collateral. The Board concluded that the advisory fees payable to Invesco Advisers from the Fund’s investment of cash collateral from any securities lending arrangements in the affiliated money market funds are for services that are not duplicative of services provided by Invesco Advisers to the Fund.
The Board considered that Invesco Advisers may serve as the Fund’s affiliated securities lending agent and evaluated the benefits realized by Invesco Advisers when serving in such role, including the compensation received. The Board considered Invesco Advisers’ securities lending platform and corporate governance structure for securities lending, including Invesco Advisers’ Securities Lending Governance Committee and its related responsibilities. The Board noted that to the extent the Fund utilizes Invesco Advisers as an affiliated securities lending agent, the Fund conducts its securities lending in accordance with, and in reliance upon, no-action letters issued by the SEC staff that provide guidance on how an affiliate may act as a direct agent lender and receive compensation for those services without obtaining exemptive relief. The Board considered information provided by Invesco Advisers related to the performance of Invesco Advisers as securities lending agent, including a summary of the securities lending services provided to the Fund by Invesco Advisers and the compensation paid to Invesco Advisers for such services, as well as any revenues generated for the Fund in connection with such securities lending activity and the allocation of such revenue between the Fund and Invesco Advisers.
The Board also received information about commissions that an affiliated broker may receive for executing certain trades for the Fund. Invesco Advisers and the Affiliated Sub-Advisers advised the Board of the benefits to the Fund of executing trades through the affiliated broker and that such trades were executed in compliance with rules under the federal securities laws and consistent with best execution obligations.
Tax Information
Form 1099-DIV, Form 1042-S and other year–end tax information provide shareholders with actual calendar year amounts that should be included in their tax returns. Shareholders should consult their tax advisers.
The following distribution information is being provided as required by the Internal Revenue Code or to meet a specific state’s requirement.
The Fund designates the following amounts or, if subsequently determined to be different, the maximum amount allowable for its fiscal year ended October 31, 2023:
| | | | | | | | |
Federal and State Income Tax | | | | | | |
Long-Term Capital Gain Distributions | | | $92,306,295 | | | | | |
Qualified Dividend Income* | | | 100.00% | | | | | |
Corporate Dividends Received Deduction* | | | 100.00% | | | | | |
U.S. Treasury Obligations* | | | 0.00% | | | | | |
Qualified Business Income* | | | 0.00% | | | | | |
Business Interest Income* | | | 0.00% | | | | | |
|
| * The above percentages are based on ordinary income dividends paid to shareholders during the Fund’s fiscal year. | |
Trustees and Officers
The address of each trustee and officer is AIM Equity Funds (Invesco Equity Funds) (the “Trust”), 11 Greenway Plaza, Houston, Texas 77046-1173. The trustees serve for the life of the Trust, subject to their earlier death, incapacitation, resignation, retirement or removal as more specifically provided in the Trust’s organizational documents. Each officer serves for a one year term or until their successors are elected and qualified. Column two below includes length of time served with predecessor entities, if any.
| | | | | | | | |
Name, Year of Birth and Position(s) Held with the Trust | | Trustee and/or Officer Since | | Principal Occupation(s) During Past 5 Years | | Number of Funds in Fund Complex Overseen by Trustee | | Other Directorship(s) Held by Trustee During Past 5 Years |
| Interested Trustee | | | | | | | | |
Martin L. Flanagan1 - 1960 Trustee and Vice Chair | | 2007 | | Chairman Emeritus, Invesco Ltd.; Trustee and Vice Chair, The Invesco Funds; and Member of Executive Board, SMU Cox School of Business Formerly: Executive Director, Chief Executive Officer and President, Invesco Ltd. (ultimate parent of Invesco and a global investment management firm); Vice Chair, Investment Company Institute; Advisor to the Board, Invesco Advisers, Inc. (formerly known as Invesco Institutional (N.A.), Inc.); Chairman and Chief Executive Officer, Invesco Advisers, Inc. (registered investment adviser); Director, Chairman, Chief Executive Officer and President, Invesco Holding Company Limited (parent of Invesco and a global investment management firm); Director, Invesco Ltd.; Chairman, Investment Company Institute and President, Co-Chief Executive Officer, Co-President, Chief Operating Officer and Chief Financial Officer, Franklin Resources, Inc. (global investment management organization) | | 169 | | None |
| 1 | Mr. Flanagan is considered an interested person (within the meaning of Section 2(a)(19) of the 1940 Act) of the Trust because he is an officer of the Adviser to the Trust, and an officer and a director of Invesco Ltd., ultimate parent of the Adviser. |
Trustees and Officers–(continued)
| | | | | | | | |
Name, Year of Birth and Position(s) Held with the Trust | | Trustee and/or Officer Since | | Principal Occupation(s) During Past 5 Years | | Number of Funds in Fund Complex Overseen by Trustee | | Other Directorship(s) Held by Trustee During Past 5 Years |
| Independent Trustees | | | | | | | | |
Beth Ann Brown - 1968 Trustee (2019) and Chair (August 2022) | | 2019 | | Independent Consultant Formerly: Head of Intermediary Distribution, Managing Director, Strategic Relations, Managing Director, Head of National Accounts, Senior Vice President, National Account Manager and Senior Vice President, Key Account Manager, Columbia Management Investment Advisers LLC; Vice President, Key Account Manager, Liberty Funds Distributor, Inc.; and Trustee of certain Oppenheimer Funds | | 169 | | Director, Board of Directors of Caron Engineering Inc.; Advisor, Board of Advisors of Caron Engineering Inc.; President and Director, Acton Shapleigh Youth Conservation Corps (non-profit) Formerly: President and Director Director of Grahamtastic Connection (non-profit) |
Cynthia Hostetler - 1962 Trustee | | 2017 | | Non-Executive Director and Trustee of a number of public and private business corporations Formerly: Director, Aberdeen Investment Funds (4 portfolios); Director, Artio Global Investment LLC (mutual fund complex); Director, Edgen Group, Inc. (specialized energy and infrastructure products distributor); Director, Genesee & Wyoming, Inc. (railroads); Head of Investment Funds and Private Equity, Overseas Private Investment Corporation; President, First Manhattan Bancorporation, Inc.; and Attorney, Simpson Thacher & Bartlett LLP | | 169 | | Resideo Technologies, Inc. (smart home technology); Vulcan Materials Company (construction materials company); Trilinc Global Impact Fund; Textainer Group Holdings, (shipping container leasing company); Investment Company Institute (professional organization); and Independent Directors Council (professional organization) |
Eli Jones - 1961 Trustee | | 2016 | | Professor and Dean Emeritus, Mays Business School - Texas A&M University Formerly: Dean of Mays Business School-Texas A&M University; Professor and Dean, Walton College of Business, University of Arkansas and E.J. Ourso College of Business, Louisiana State University; and Director, Arvest Bank | | 169 | | Insperity, Inc. (formerly known as Administaff) (human resources provider); Board Member of the regional board, First Financial Bank Texas; and Board Member, First Financial Bankshares, Inc. Texas |
Elizabeth Krentzman - 1959 Trustee | | 2019 | | Formerly: Principal and Chief Regulatory Advisor for Asset Management Services and U.S. Mutual Fund Leader of Deloitte & Touche LLP; General Counsel of the Investment Company Institute (trade association); National Director of the Investment Management Regulatory Consulting Practice, Principal, Director and Senior Manager of Deloitte & Touche LLP; Assistant Director of the Division of Investment Management - Office of Disclosure and Investment Adviser Regulation of the U.S. Securities and Exchange Commission and various positions with the Division of Investment Management - Office of Regulatory Policy of the U.S. Securities and Exchange Commission; Associate at Ropes & Gray LLP; and Trustee of certain Oppenheimer Funds | | 169 | | Formerly: Member of the Cartica Funds Board of Directors (private investment fund); Trustee of the University of Florida National Board Foundation; and Member of the University of Florida Law Center Association, Inc. Board of Trustees, Audit Committee and Membership Committee |
Anthony J. LaCava, Jr. - 1956 Trustee | | 2019 | | Formerly: Director and Member of the Audit Committee, Blue Hills Bank (publicly traded financial institution) and Managing Partner, KPMG LLP | | 169 | | Blue Hills Bank; Member and Chairman, Bentley University, Business School Advisory Council; and Nominating Committee, KPMG LLP |
Prema Mathai-Davis - 1950 Trustee | | 1998 | | Retired Formerly: Co-Founder & Partner of Quantalytics Research, LLC, (a FinTech Investment Research Platform for the Self-Directed Investor); Trustee of YWCA Retirement Fund; CEO of YWCA of the USA; Board member of the NY Metropolitan Transportation Authority; Commissioner of the NYC Department of Aging; and Board member of Johns Hopkins Bioethics Institute | | 169 | | Member of Board of Positive Planet US (non-profit) and HealthCare Chaplaincy Network (non-profit) |
Trustees and Officers–(continued)
| | | | | | | | |
Name, Year of Birth and Position(s) Held with the Trust | | Trustee and/or Officer Since | | Principal Occupation(s) During Past 5 Years | | Number of Funds in Fund Complex Overseen by Trustee | | Other Directorship(s) Held by Trustee During Past 5 Years |
| Independent Trustees–(continued) | | | | | | |
Joel W. Motley - 1952 Trustee | | 2019 | | Director of Office of Finance, Federal Home Loan Bank System; Managing Director of Carmona Motley Inc. (privately held financial advisor); Member of the Council on Foreign Relations and its Finance and Budget Committee; Chairman Emeritus of Board of Human Rights Watch and Member of its Investment Committee; and Member of Investment Committee Board of Historic Hudson Valley (non-profit cultural organization); Member of the Board, Blue Ocean Acquisition Corp.; and Member of the Vestry and the Investment Committee of Trinity Church Wall Street. Formerly: Managing Director of Public Capital Advisors, LLC (privately held financial advisor); Managing Director of Carmona Motley Hoffman, Inc. (privately held financial advisor); Trustee of certain Oppenheimer Funds; and Director of Columbia Equity Financial Corp. (privately held financial advisor) | | 169 | | Member of Board of Trust for Mutual Understanding (non-profit promoting the arts and environment); Member of Board of Greenwall Foundation (bioethics research foundation) and its Investment Committee; Member of Board of Friends of the LRC (non-profit legal advocacy); and Board Member and Investment Committee Member of Pulitzer Center for Crisis Reporting (non-profit journalism) |
Teresa M. Ressel - 1962 Trustee | | 2017 | | Non-executive director and trustee of a number of public and private business corporations Formerly: Chief Executive Officer, UBS Securities LLC (investment banking); Chief Operating Officer, UBS AG Americas (investment banking); Sr. Management Team Olayan America, The Olayan Group (international investor/commercial/industrial); and Assistant Secretary for Management & Budget and Designated Chief Financial Officer, U.S. Department of Treasury | | 169 | | None |
Robert C. Troccoli - 1949 Trustee | | 2016 | | Retired Formerly: Adjunct Professor, University of Denver - Daniels College of Business; and Managing Partner, KPMG LLP | | 169 | | None |
Daniel S. Vandivort - 1954 Trustee | | 2019 | | President, Flyway Advisory Services LLC (consulting and property management) Formerly: President and Chief Investment Officer, previously Head of Fixed Income, Weiss Peck and Greer/Robeco Investment Management; Trustee and Chair, Weiss Peck and Greer Funds Board; and various capacities at CS First Boston including Head of Fixed Income at First Boston Asset Management. | | 169 | | Formerly: Trustee and Governance Chair, Oppenheimer Funds; Treasurer, Chairman of the Audit and Finance Committee, Huntington Disease Foundation of America |
Trustees and Officers–(continued)
| | | | | | | | |
Name, Year of Birth and Position(s) Held with the Trust | | Trustee and/or Officer Since | | Principal Occupation(s) During Past 5 Years | | Number of Funds in Fund Complex Overseen by Trustee | | Other Directorship(s) Held by Trustee During Past 5 Years |
| Officers | | | | | | | | |
Glenn Brightman - 1972 President and Principal Executive Officer | | 2023 | | Chief Operating Officer, Americas, Invesco Ltd.; President and Principal Executive Officer, The Invesco Funds. Formerly: Global Head of Finance, Invesco Ltd; Executive Vice President and Chief Financial Officer, Nuveen | | N/A | | N/A |
Melanie Ringold - 1975 Senior Vice President, Chief Legal Officer and Secretary | | 2023 | | Head of Legal of the Americas, Invesco Ltd.; Senior Vice President and Secretary, Invesco Advisers, Inc. (formerly known as Invesco Institutional (N.A.), Inc.) (registered investment adviser); Secretary, Invesco Distributors, Inc. (formerly known as Invesco AIM Distributors, Inc.); Secretary, Invesco Investment Services, Inc. (formerly known as Invesco AIM Investment Services, Inc.); Senior Vice President, Chief Legal Officer and Secretary, The Invesco Funds; Secretary, Invesco Investment Advisers LLC, Invesco Capital Markets, Inc.; Chief Legal Officer, Invesco Exchange-Traded Fund Trust, Invesco Exchange-Traded Fund Trust II, Invesco India Exchange-Traded Fund Trust, Invesco Actively Managed Exchange-Traded Fund Trust, Invesco Actively Secretary and Vice President, Harbourview Asset Management Corporation; Secretary and Senior Vice President, OppenheimerFunds, Inc. and Invesco Managed Accounts, LLC; Secretary and Senior Vice President, OFI SteelPath, Inc.; Secretary and Senior Vice President, Oppenheimer Acquisition Corp.; Secretary, SteelPath Funds Remediation LLC; and Secretary and Senior Vice President, Trinity Investment Management Corporation Formerly: Assistant Secretary, Invesco Distributors, Inc., Invesco Advisers, Inc., Invesco Investment Services, Inc., Invesco Capital Markets, Inc., Invesco Capital Management LLC and Invesco Investment Advisers LLC; and Assistant Secretary and Investment Vice President, Invesco Funds | | N/A | | N/A |
Andrew R. Schlossberg - 1974 Senior Vice President | | 2019 | | Chief Executive Officer, President and Executive Director, Invesco Ltd.; Senior Vice President, Invesco Group Services, Inc.; Director and Senior Vice President, Invesco Advisers, Inc. (formerly known as Invesco Institutional (N.A.), Inc.) (registered investment adviser); Director and Chairman, Invesco Investment Services, Inc. (formerly known as Invesco AIM Investment Services, Inc.) (registered transfer agent); Senior Vice President, The Invesco Funds and Trustee, Invesco Foundation, Inc. Formerly: Head of the Americas and Senior Managing Director, Invesco Ltd.; Director, Invesco Investment Advisers LLC (formerly known as Van Kampen Asset Management); Director, President and Chairman, Invesco Insurance Agency, Inc.; Director, Invesco UK Limited; Director and Chief Executive, Invesco Asset Management Limited and Invesco Fund Managers Limited; Assistant Vice President, The Invesco Funds; Senior Vice President, Invesco Advisers, Inc. (formerly known as Invesco Institutional (N.A.), Inc.) (registered investment adviser); Director and Chief Executive, Invesco Administration Services Limited and Invesco Global Investment Funds Limited; Director, Invesco Distributors, Inc.; Head of EMEA, Invesco Ltd.; President, Invesco Actively Managed Exchange-Traded Commodity Fund Trust, Invesco Actively Managed Exchange-Traded Fund Trust, Invesco Exchange-Traded Fund Trust, Invesco Exchange-Traded Fund Trust II and Invesco India Exchange-Traded Fund Trust; and Managing Director and Principal Executive Officer, Invesco Capital Management LLC | | N/A | | N/A |
Trustees and Officers–(continued)
| | | | | | | | |
Name, Year of Birth and Position(s) Held with the Trust | | Trustee and/or Officer Since | | Principal Occupation(s) During Past 5 Years | | Number of Funds in Fund Complex Overseen by Trustee | | Other Directorship(s) Held by Trustee During Past 5 Years |
| Officers–(continued) | | | | | | | | |
John M. Zerr - 1962 Senior Vice President | | 2006 | | Chief Operating Officer of the Americas; Senior Vice President, Invesco Advisers, Inc. (formerly known as Invesco Institutional (N.A.), Inc.) (registered investment adviser); Senior Vice President, Invesco Distributors, Inc. (formerly known as Invesco AIM Distributors, Inc.); Director and Vice President, Invesco Investment Services, Inc. (formerly known as Invesco AIM Investment Services, Inc.) Senior Vice President, The Invesco Funds; Managing Director, Invesco Capital Management LLC; Senior Vice President, Invesco Capital Markets, Inc. (formerly known as Van Kampen Funds Inc.); Manager, Invesco Indexing LLC; Manager, Invesco Specialized Products, LLC; Member, Invesco Canada Funds Advisory Board; Director, President and Chief Executive Officer, Invesco Corporate Class Inc. (corporate mutual fund company); Director, Chairman, President and Chief Executive Officer, Invesco Canada Ltd. (formerly known as Invesco Trimark Ltd./Invesco Trimark Ltèe) (registered investment adviser and registered transfer agent); President, Invesco, Inc.; President, Invesco Global Direct Real Estate Feeder GP Ltd.; President, Invesco IP Holdings (Canada) Ltd; President, Invesco Global Direct Real Estate GP Ltd.; President, Invesco Financial Services Ltd. / Services Financiers Invesco Ltée; and Director and Chairman, Invesco Trust Company Formerly: Director, Invesco Investment Advisers LLC (formerly known as Van Kampen Asset Management); President, Trimark Investments Ltd/Services Financiers Invesco Ltee; Director and Senior Vice President, Invesco Insurance Agency, Inc.; Director and Senior Vice President, Invesco Management Group, Inc. (formerly known as Invesco AIM Management Group, Inc.); Secretary and General Counsel, Invesco Management Group, Inc. (formerly known as Invesco AIM Management Group, Inc.); Secretary, Invesco Investment Services, Inc. (formerly known as Invesco AIM Investment Services, Inc.); Chief Legal Officer and Secretary, The Invesco Funds; Secretary and General Counsel, Invesco Investment Advisers LLC (formerly known as Van Kampen Asset Management); Secretary and General Counsel, Invesco Capital Markets, Inc. (formerly known as Van Kampen Funds Inc.); Chief Legal Officer, Invesco Exchange-Traded Fund Trust, Invesco Exchange-Traded Fund Trust II, Invesco India Exchange-Traded Fund Trust, Invesco Actively Managed Exchange-Traded Fund Trust, Invesco Actively Managed Exchange-Traded Commodity Fund Trust and Invesco Exchange-Traded Self-Indexed Fund Trust; Secretary, Invesco Indexing LLC; Director, Secretary, General Counsel and Senior Vice President, Van Kampen Exchange Corp.; Director, Vice President and Secretary, IVZ Distributors, Inc. (formerly known as INVESCO Distributors, Inc.); Director and Vice President, INVESCO Funds Group, Inc.; Director and Vice President, Van Kampen Advisors Inc.; Director, Vice President, Secretary and General Counsel, Van Kampen Investor Services Inc.; Director and Secretary, Invesco Distributors, Inc. (formerly known as Invesco AIM Distributors, Inc.); Director, Senior Vice President, General Counsel and Secretary, Invesco AIM Advisers, Inc. and Van Kampen Investments Inc.; Director, Vice President and Secretary, Fund Management Company; Director, Senior Vice President, Secretary, General Counsel and Vice President, Invesco AIM Capital Management, Inc.; and Chief Operating Officer and General Counsel, Liberty Ridge Capital, Inc. (an investment adviser) | | N/A | | N/A |
Tony Wong - 1973 Senior Vice President | | 2023 | | Senior Managing Director, Invesco Ltd.; Director, Chairman, Chief Executive Officer and President, Invesco Advisers, Inc.; Director and Chairman, Invesco Private Capital, Inc., INVESCO Private Capital Investments, Inc. and INVESCO Realty, Inc.; Director, Invesco Senior Secured Management, Inc.; President, Invesco Managed Accounts, LLC and SNW Asset Management Corporation; and Senior Vice President, The Invesco Funds Formerly: Assistant Vice President, The Invesco Funds; and Vice President, Invesco Advisers, Inc. | | N/A | | N/A |
Stephanie C. Butcher - 1971 Senior Vice President | | 2023 | | Senior Managing Director, Invesco Ltd.; Senior Vice President, The Invesco Funds; Director and Chief Executive Officer, Invesco Asset Management Limited | | N/A | | N/A |
Adrien Deberghes - 1967 Principal Financial Officer, Treasurer and Senior Vice President | | 2020 | | Head of the Fund Office of the CFO and Fund Administration; Vice President, Invesco Advisers, Inc.; Principal Financial Officer, Treasurer and Senior Vice President, The Invesco Funds; Vice President, Invesco Exchange-Traded Fund Trust, Invesco Exchange-Traded Fund Trust II, Invesco India Exchange-Traded Fund Trust, Invesco Actively Managed Exchange-Traded Fund Trust, Invesco Actively Managed Exchange-Traded Commodity Fund Trust and Invesco Exchange-Traded Self-Indexed Fund Trust Formerly: Vice President, The Invesco Funds; Senior Vice President and Treasurer, Fidelity Investments | | N/A | | N/A |
Crissie M. Wisdom - 1969 Anti-Money Laundering Compliance Officer | | 2013 | | Anti-Money Laundering and OFAC Compliance Officer for Invesco U.S. entities including: Invesco Advisers, Inc. and its affiliates, Invesco Capital Markets, Inc., Invesco Distributors, Inc., Invesco Investment Services, Inc., The Invesco Funds, Invesco Capital Management, LLC, Invesco Trust Company; and Fraud Prevention Manager for Invesco Investment Services, Inc. | | N/A | | N/A |
Trustees and Officers–(continued)
| | | | | | | | |
Name, Year of Birth and Position(s) Held with the Trust | | Trustee and/or Officer Since | | Principal Occupation(s) During Past 5 Years | | Number of Funds in Fund Complex Overseen by Trustee | | Other Directorship(s) Held by Trustee During Past 5 Years |
| Officers–(continued) | | | | | | | | |
Todd F. Kuehl - 1969 Chief Compliance Officer and Senior Vice President | | 2020 | | Chief Compliance Officer, Invesco Advisers, Inc. (registered investment adviser); and Chief Compliance Officer and Senior Vice President, The Invesco Funds Formerly: Managing Director and Chief Compliance Officer, Legg Mason (Mutual Funds); Chief Compliance Officer, Legg Mason Private Portfolio Group (registered investment adviser) | | N/A | | N/A |
James Bordewick, Jr. - 1959 Senior Vice President and Senior Officer | | 2022 | | Senior Vice President and Senior Officer, The Invesco Funds Formerly: Chief Legal Officer, KingsCrowd, Inc. (research and analytical platform for investment in private capital markets); Chief Operating Officer and Head of Legal and Regulatory, Netcapital (private capital investment platform); Managing Director, General Counsel of asset management and Chief Compliance Officer for asset management and private banking, Bank of America Corporation; Chief Legal Officer, Columbia Funds and BofA Funds; Senior Vice President and Associate General Counsel, MFS Investment Management; Chief Legal Officer, MFS Funds; Associate, Ropes & Gray; and Associate, Gaston Snow & Ely Bartlett | | N/A | | N/A |
The Statement of Additional Information of the Trust includes additional information about the Fund’s Trustees and is available upon request, without charge, by calling 1.800.959.4246. Please refer to the Fund’s Statement of Additional Information for information on the Fund’s sub-advisers.
| | | | | | |
| Office of the Fund | | Investment Adviser | | Distributor | | Auditors |
| 11 Greenway Plaza | | Invesco Advisers, Inc. | | Invesco Distributors, Inc. | | PricewaterhouseCoopers LLP |
| Houston, TX 77046-1173 | | 1331 Spring Street, NW, Suite 2500 | | 11 Greenway Plaza | | 1000 Louisiana Street, Suite 5800 |
| | Atlanta, GA 30309 | | Houston, TX 77046-1173 | | Houston, TX 77002-5021 |
| | | |
| Counsel to the Fund | | Counsel to the Independent Trustees | | Transfer Agent | | Custodian |
| Stradley Ronon Stevens & Young, LLP | | Sidley Austin LLP | | Invesco Investment Services, Inc. | | State Street Bank and Trust Company |
| 2005 Market Street, Suite 2600 | | 787 Seventh Avenue | | 11 Greenway Plaza | | 225 Franklin Street |
| Philadelphia, PA 19103-7018 | | New York, NY 10019 | | Houston, TX 77046-1173 | | Boston, MA 02110-2801 |
(This page intentionally left blank)

Go paperless with eDelivery
Visit invesco.com/edelivery to enjoy the convenience and security of anytime electronic access to your investment documents.
With eDelivery, you can elect to have any or all of the following materials delivered straight to your inbox to download, save and print from your own computer:
∎ Fund reports and prospectuses
∎ Quarterly statements
∎ Daily confirmations
∎ Tax forms
Invesco mailing information
Send general correspondence to Invesco Investment Services, Inc., P.O. Box 219078, Kansas City, MO 64121-9078.
Important notice regarding delivery of security holder documents
To reduce Fund expenses, only one copy of most shareholder documents may be mailed to shareholders with multiple accounts at the same address (Householding). Mailing of your shareholder documents may be householded indefinitely unless you instruct us otherwise. If you do not want the mailing of these documents to be combined with those for other members of your household, please contact Invesco Investment Services, Inc. at 800 959 4246 or contact your financial institution. We will begin sending you individual copies for each account within 30 days after receiving your request.
Fund holdings and proxy voting information
The Fund provides a complete list of its portfolio holdings four times each year, at the end of each fiscal quarter. For the second and fourth quarters, the list appears, respectively, in the Fund’s semiannual and annual reports to shareholders. For the first and third quarters, the Fund files the list with the Securities and Exchange Commission (SEC) as an exhibit to its reports on Form N-PORT. The most recent list of portfolio holdings is available at invesco.com/completeqtrholdings. Shareholders can also look up the Fund’s Form N-PORT filings on the SEC website, sec.gov. The SEC file numbers for the Fund are shown below.
A description of the policies and procedures that the Fund uses to determine how to vote proxies relating to portfolio securities is available without charge, upon request, from our Client Services department at 800 959 4246, or at invesco.com/corporate/about-us/esg. The information is also available on the SEC website, sec.gov.
Information regarding how the Fund voted proxies related to its portfolio securities during the most recent 12-month period ended June 30 is available at invesco.com/proxysearch. This information is also available on the SEC website, sec.gov.
Invesco Advisers, Inc. is an investment adviser; it provides investment advisory services to individual and institutional clients and does not sell securities. Invesco Distributors, Inc. is the US distributor for Invesco Ltd.’s retail mutual funds, exchange-traded funds and institutional money market funds. Both are wholly owned, indirect subsidiaries of Invesco Ltd.
| | | | |
| SEC file number(s): 811-01424 and 002-25469 | | Invesco Distributors, Inc. | | CHT-AR-1 |

| | |
| | |
| Annual Report to Shareholders | | October 31, 2023 |
Invesco Diversified Dividend Fund
Nasdaq:
A: LCEAX ∎ C: LCEVX ∎ R: DDFRX ∎ Y: LCEYX ∎ Investor: LCEIX ∎ R5: DDFIX ∎ R6: LCEFX
Management’s Discussion of Fund Performance
| | | | |
| |
Performance summary | |
For the fiscal year ended October 31, 2023, Class A shares of Invesco Diversified Dividend Fund (the Fund), at net asset value (NAV), underperformed the Russell 1000 Value Index, the Fund’s style-specific benchmark. | |
Your Fund’s long-term performance appears later in this report. | |
| |
Fund vs. Indexes | |
Total returns, 10/31/22 to 10/31/23, at net asset value (NAV). Performance shown does not include applicable contingent deferred sales charges (CDSC) or front-end sales charges, which would have reduced performance. | |
Class A Shares | | | -2.18 | % |
Class C Shares | | | -2.89 | |
Class R Shares | | | -2.41 | |
Class Y Shares | | | -1.93 | |
Investor Class Shares | | | -2.03 | |
Class R5 Shares | | | -1.85 | |
Class R6 Shares | | | -1.77 | |
S&P 500 Index▼ (Broad Market Index) | | | 10.14 | |
Russell 1000 Value Index▼ (Style-Specific Index) | | | 0.13 | |
Lipper Large-Cap Value Funds Index∎ (Peer Group Index) | | | 4.11 | |
| |
Source(s): ▼RIMES Technologies Corp.; ∎ Lipper Inc. | | | | |
Market conditions and your Fund
At the start of the fiscal year, US equity markets rebounded, despite mixed data on the economy and corporate earnings. However, the US Federal Reserve’s (the Fed’s) message that rate hikes would continue until data showed inflation meaningfully declining, sent markets lower in December 2022. As energy prices declined, the rate of inflation slowed modestly in the fourth quarter of 2022. Corporate earnings generally met expectations, though companies provided cautious future guidance. With inflation still at multi-decade highs and little evidence of a slowing economy, the Fed raised its target rate by 0.75% in November and by 0.50% in December.1
US equities managed to deliver gains in the first quarter of 2023 despite significant volatility and a banking crisis. A January rally gave way to a February selloff as higher-than-expected inflation, a tight labor market and solid economic growth indicated that the Fed’s monetary policy would remain tight for the foreseeable future, raising the risk of a deeper than expected recession. In March, the failure of two US regional banks, Silicon Valley Bank and Signature Bank, prompted steep losses in the banking sector. The subsequent takeover of Credit Suisse and ongoing fear that bank troubles would spread sent investors to safe-haven assets, sparking a bond rally, particularly among securities at the short end of the yield curve. With instability in the banking sector, the Fed raised the federal funds rate by only 0.25% in February 2023 and again in March.1 The Fed’s actions to stabilize the banking system in March sent markets higher, so equities were surprisingly resilient despite the turmoil.
The US economy and equity markets remained resilient in the second quarter of
2023, as milder inflation data and better-than-expected corporate earnings supported equities, with most major indexes posting gains for the quarter and with some big tech names providing optimistic future guidance. Following the March banking crisis, markets stabilized in April, as corporate earnings season got underway, with many companies surprising consensus earnings and revenue estimates. Facing persistently strong employment data, the Fed raised the federal funds rate by 0.25% at its May meeting,1 but left rates unchanged at its June meeting, giving investors the long-awaited “pause” in rate hikes, which sent equities broadly higher.
Equity markets declined in the third quarter and into October 2023 as a resilient US economy complicated the Fed’s efforts to tame inflation. While inflation has slowed from its peak, the Consumer Price Index (CPI) rose by 0.2% in July, and the 12-month headline inflation rate rose to 3.2% from 3% in June.2 Due to the persistence of inflation, the Fed raised the federal funds rate again in July by 0.25%. The CPI data released in September was higher-than-expected and the overall US labor market remained tight with unemployment near historic lows. At the same time, wages rose and consumers continued to spend, pushing the third quarter year-over-year Gross Domestic Product (GDP) to 4.9%, far above expectations.2 Despite the higher-than-expected GDP for the third quarter of 2023, the Fed held interest rates steady at its September and October meetings, but left open the possibility of another rate hike before the end of the calendar year.1
Despite higher rates and increased market volatility, US stocks for the fiscal year had positive returns of 10.69%, as measured by the S&P 500 Index.3
The Fund underperformed the Russell 1000 Value Index during the fiscal year. Within the Fund’s style-specific benchmark, communication services was the best-performing sector, while health care was the worst-performing sector during the fiscal year. Our focus on high-quality, attractively valued dividend paying companies was a headwind during the fiscal year, as the market was led by more growth-oriented, non-dividend paying stocks that don’t fit our disciplined approach. Stock selection and an underweight in communication services for the fiscal year detracted the most from relative return, as the sector posted strong gains. We didn’t own several of the fiscal year’s best performers in this sector, including Meta Platforms and Alphabet, because they don’t pay a dividend, which was a meaningful detractor from relative return. Stock selection in the financials sector also hurt performance versus the Russell 1000 Value Index. Alternatively, strong stock selection in the information technology (IT) sector was the largest positive contributor to relative performance. Strong stock selection in consumer discretionary and consumer staples also helped performance versus the index.
Holdings within the IT and industrials sectors were among the largest contributors to absolute Fund performance during the fiscal year. Software company Microsoft was the largest individual contributor to overall Fund performance for the fiscal year. Shares of the company benefited from continued strength in their Azure cloud computing business and investor excitement around how artificial intelligence could supplement Microsoft’s already robust technology platform. Aerospace, power and renewable energy company GE was also a top contributor to overall Fund performance for the fiscal year. Positive investor sentiment about the CEO’s turnaround plan drove strong returns for the stock.
Holdings within the financials and health care sectors were among the largest detractors from absolute Fund performance. Financial services company Charles Schwab was the largest individual detractor from Fund performance during the fiscal year. Shares of the company underperformed following the banking crisis that began with the failure of Silicon Valley Bank in the first quarter of 2023. Like many leveraged financial institutions, Schwab was heavily scrutinized for unrealized losses in their securities portfolio following the Fed’s tightening campaign. Unlike Silicon Valley Bank, Schwab has a highly diversified deposit base across 34 million accounts and approximately 80% of deposits are insured. Health care services company CVS Health was also among the largest detractors from overall performance for the fiscal year. Shares fell after Blue Shield of California announced it was dropping CVS Health for its non-specialty pharmacy benefit management services in favor of a coalition
| | |
| 2 | | Invesco Diversified Dividend Fund |
of providers, including Amazon.com. Concerns about deceleration in Medicare Advantage growth rates and potential regulation of Pharmacy Benefits Managers also weighed on the stock.
We believe the Fund has successfully navigated multiple market cycles during its history with a consistent long-term mandate to emphasize capital appreciation, current income and capital preservation over a full market cycle.
It has been our privilege to oversee Invesco Diversified Dividend Fund, and we thank you for your continued investment.
1 Source: US Federal Reserve
2 Source: US Bureau of Labor Statistics
3 Source: Lipper Inc.
Portfolio manager(s):
Caroline Le Feuvre
Craig Leopold
Chris McMeans
Peter Santoro - Lead
The views and opinions expressed in management’s discussion of Fund performance are those of Invesco Advisers, Inc. and its affiliates. These views and opinions are subject to change at any time based on factors such as market and economic conditions. These views and opinions may not be relied upon as investment advice or recommendations, or as an offer for a particular security. The information is not a complete analysis of every aspect of any market, country, industry, security or the Fund. Statements of fact are from sources considered reliable, but Invesco Advisers, Inc. makes no representation or warranty as to their completeness or accuracy. Although historical performance is no guarantee of future results, these insights may help you understand our investment management philosophy.
See important Fund and, if applicable, index disclosures later in this report.
| | |
| 3 | | Invesco Diversified Dividend Fund |
Your Fund’s Long-Term Performance
Results of a $10,000 Investment – Oldest Share Class(es)
Fund and index data from 10/31/13
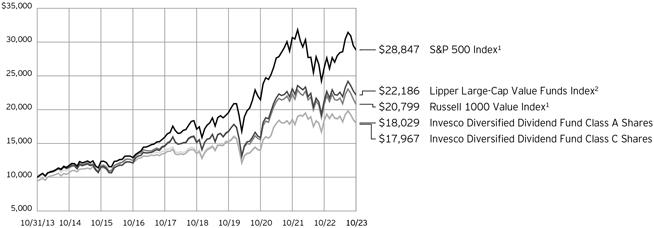
| 1 | Source: RIMES Technologies Corp. |
Past performance cannot guarantee future results.
The data shown in the chart include reinvested distributions, applicable sales charges and Fund expenses including management
fees. Index results include reinvested dividends, but they do not reflect sales charges. Performance of the peer group, if applicable, reflects fund expenses and management fees;
performance of a market index does not. Performance shown in the chart does not reflect deduction of taxes a shareholder would pay on Fund distributions or sale of Fund shares.
| | |
| 4 | | Invesco Diversified Dividend Fund |
| | | | |
| |
Average Annual Total Returns | |
As of 10/31/23, including maximum applicable sales charges | |
| |
Class A Shares | | | | |
Inception (12/31/01) | | | 6.80 | % |
10 Years | | | 6.07 | |
5 Years | | | 4.77 | |
1 Year | | | -7.56 | |
| |
Class C Shares | | | | |
Inception (12/31/01) | | | 6.82 | % |
10 Years | | | 6.03 | |
5 Years | | | 5.17 | |
1 Year | | | -3.76 | |
| |
Class R Shares | | | | |
Inception (10/25/05) | | | 7.01 | % |
10 Years | | | 6.40 | |
5 Years | | | 5.70 | |
1 Year | | | -2.41 | |
| |
Class Y Shares | | | | |
Inception (10/3/08) | | | 8.48 | % |
10 Years | | | 6.94 | |
5 Years | | | 6.23 | |
1 Year | | | -1.93 | |
| |
Investor Class Shares | | | | |
Inception (7/15/05) | | | 7.04 | % |
10 Years | | | 6.75 | |
5 Years | | | 6.06 | |
1 Year | | | -2.03 | |
| |
Class R5 Shares | | | | |
Inception (10/25/05) | | | 7.61 | % |
10 Years | | | 6.99 | |
5 Years | | | 6.29 | |
1 Year | | | -1.85 | |
| |
Class R6 Shares | | | | |
Inception (9/24/12) | | | 8.59 | % |
10 Years | | | 7.09 | |
5 Years | | | 6.38 | |
1 Year | | | -1.77 | |
The performance data quoted represent past performance and cannot guarantee future results; current performance may be lower or higher. Please visit invesco.com/ performance for the most recent month-end performance. Performance figures reflect reinvested distributions, changes in net asset value and the effect of the maximum sales charge unless otherwise stated. Performance figures do not reflect deduction of taxes a shareholder would pay on Fund distributions or sale of Fund shares. Investment return and principal value will fluctuate so that you may have a gain or loss when you sell shares.
Class A share performance reflects the maximum 5.50% sales charge, and Class C share performance reflects the applicable contingent deferred sales charge (CDSC) for the period involved. The CDSC on Class C shares is 1% for the first year after purchase. Class R, Class Y, Investor Class, Class R5 and Class R6 shares do not have a front-end sales charge or a CDSC; therefore, performance is at net asset value.
The performance of the Fund’s share classes will differ primarily due to different sales charge structures and class expenses.
Fund performance reflects any applicable fee waivers and/or expense reimbursements. Had the adviser not waived fees and/or reimbursed expenses currently or in the past, returns would have been lower. See current prospectus for more information.
| | |
| 5 | | Invesco Diversified Dividend Fund |
Supplemental Information
Invesco Diversified Dividend Fund’s investment objective is long-term growth of capital and, secondarily, current income.
| ∎ | Unless otherwise stated, information presented in this report is as of October 31, 2023, and is based on total net assets. |
| ∎ | Unless otherwise noted, all data is provided by Invesco. |
| ∎ | To access your Fund’s reports/prospectus, visit invesco.com/fundreports. |
About indexes used in this report
| ∎ | The S&P 500® Index is an unmanaged index considered representative of the US stock market. |
| ∎ | The Russell 1000® Value Index is an unmanaged index considered representative of large-cap value stocks. The Russell 1000 Value Index is a trademark/service mark of the Frank Russell Co. Russell® is a trademark of the Frank Russell Co. |
| ∎ | The Lipper Large-Cap Value Funds Index is an unmanaged index considered representative of large-cap value funds tracked by Lipper. |
| ∎ | The Fund is not managed to track the performance of any particular index, including the index(es) described here, and consequently, the performance of the Fund may deviate significantly from the performance of the index(es). |
| ∎ | A direct investment cannot be made in an index. Unless otherwise indicated, index results include reinvested dividends, and they do not reflect sales charges. Performance of the peer group, if applicable, reflects fund expenses; performance of a market index does not. |
|
|
This report must be accompanied or preceded by a currently effective Fund prospectus, which contains more complete information, including sales charges and expenses. Investors should read it carefully before investing. |
|
| NOT FDIC INSURED | MAY LOSE VALUE | NO BANK GUARANTEE |
| | |
| 6 | | Invesco Diversified Dividend Fund |
Fund Information
| | | | | |
| Portfolio Composition | | | | | |
| |
| By sector | | % of total net assets |
| |
Financials | | | | 18.15 | % |
| |
Health Care | | | | 15.39 | |
| |
Consumer Staples | | | | 12.52 | |
| |
Industrials | | | | 11.88 | |
| |
Energy | | | | 9.48 | |
| |
Information Technology | | | | 8.79 | |
| |
Utilities | | | | 6.44 | |
| |
Consumer Discretionary | | | | 4.76 | |
| |
Communication Services | | | | 3.91 | |
| |
Materials | | | | 3.69 | |
| |
Real Estate | | | | 2.16 | |
| |
Money Market Funds Plus Other Assets Less Liabilities | | | | 2.83 | |
| | | | | | | |
Top 10 Equity Holdings* | | | | | |
| | | | | % of total net assets |
| | |
1. | | Chevron Corp. | | | | 3.21 | % |
| | |
2. | | Johnson & Johnson | | | | 3.08 | |
| | |
3. | | Walmart, Inc. | | | | 2.98 | |
| | |
4. | | ConocoPhillips | | | | 2.70 | |
| | |
5. | | Microsoft Corp. | | | | 2.44 | |
| | |
6. | | Philip Morris International, Inc. | | | | 2.31 | |
| | |
7. | | Merck & Co., Inc. | | | | 2.23 | |
| | |
8. | | Visa, Inc., Class A | | | | 2.09 | |
| | |
9. | | Becton, Dickinson and Co. | | | | 2.00 | |
| | |
10. | | JPMorgan Chase & Co. | | | | 1.82 | |
The Fund’s holdings are subject to change, and there is no assurance that the Fund will continue to hold any particular security.
* Excluding money market fund holdings, if any.
Data presented here are as of October 31, 2023.
| | |
| 7 | | Invesco Diversified Dividend Fund |
Schedule of Investments(a)
October 31, 2023
| | | | | | | | |
| | | Shares | | | Value | |
|
| |
Common Stocks & Other Equity Interests–97.17% | |
Aerospace & Defense–2.13% | |
Northrop Grumman Corp. | | | 332,062 | | | $ | 156,543,988 | |
|
| |
RTX Corp.(b) | | | 746,774 | | | | 60,779,936 | |
|
| |
| | | | 217,323,924 | |
|
| |
|
Air Freight & Logistics–1.08% | |
United Parcel Service, Inc., Class B(b) | | | 781,069 | | | | 110,325,996 | |
|
| |
|
Apparel Retail–0.86% | |
TJX Cos., Inc. (The) | | | 996,309 | | | | 87,744,934 | |
|
| |
|
Application Software–1.37% | |
Intuit, Inc. | | | 281,945 | | | | 139,548,678 | |
|
| |
|
Asset Management & Custody Banks–1.85% | |
BlackRock, Inc. | | | 148,876 | | | | 91,153,797 | |
|
| |
State Street Corp. | | | 1,503,338 | | | | 97,160,735 | |
|
| |
| | | | 188,314,532 | |
|
| |
|
Building Products–1.12% | |
Trane Technologies PLC | | | 598,189 | | | | 113,841,349 | |
|
| |
|
Cable & Satellite–1.82% | |
Comcast Corp., Class A | | | 4,495,497 | | | | 185,619,071 | |
|
| |
|
Construction Machinery & Heavy Transportation Equipment– 0.80% | |
Caterpillar, Inc. | | | 359,788 | | | | 81,330,077 | |
|
| |
|
Construction Materials–1.19% | |
CRH PLC | | | 2,273,252 | | | | 121,778,110 | |
|
| |
|
Consumer Finance–1.03% | |
American Express Co. | | | 720,221 | | | | 105,173,873 | |
|
| |
|
Consumer Staples Merchandise Retail–3.72% | |
Target Corp. | | | 677,581 | | | | 75,069,199 | |
|
| |
Walmart, Inc.(b) | | | 1,859,668 | | | | 303,888,348 | |
|
| |
| | | | 378,957,547 | |
|
| |
|
Distillers & Vintners–0.99% | |
Constellation Brands, Inc., Class A | | | 433,213 | | | | 101,436,824 | |
|
| |
|
Diversified Banks–4.70% | |
Fifth Third Bancorp | | | 2,442,511 | | | | 57,911,936 | |
|
| |
JPMorgan Chase & Co. | | | 1,337,426 | | | | 185,982,460 | |
|
| |
PNC Financial Services Group, Inc. (The) | | | 1,066,734 | | | | 122,109,041 | |
|
| |
Wells Fargo & Co. | | | 2,849,503 | | | | 113,324,734 | |
|
| |
| | | | 479,328,171 | |
|
| |
|
Electric Utilities–3.25% | |
American Electric Power Co., Inc. | | | 1,311,273 | | | | 99,053,562 | |
|
| |
Entergy Corp. | | | 1,618,172 | | | | 154,681,062 | |
|
| |
PPL Corp. | | | 3,150,975 | | | | 77,419,456 | |
|
| |
| | | | 331,154,080 | |
|
| |
|
Electrical Components & Equipment–1.48% | |
ABB Ltd. (Switzerland)(b) | | | 3,065,798 | | | | 103,080,629 | |
|
| |
| | | | | | | | |
| | | Shares | | | Value | |
|
| |
Electrical Components & Equipment–(continued) | |
Hubbell, Inc. | | | 176,849 | | | $ | 47,766,915 | |
|
| |
| | | | 150,847,544 | |
|
| |
|
Electronic Manufacturing Services–1.30% | |
TE Connectivity Ltd. | | | 1,128,511 | | | | 132,995,021 | |
|
| |
|
Financial Exchanges & Data–3.03% | |
CME Group, Inc., Class A | | | 846,036 | | | | 180,594,845 | |
|
| |
S&P Global, Inc. | | | 366,229 | | | | 127,927,452 | |
|
| |
| | | | 308,522,297 | |
|
| |
|
Food Distributors–0.83% | |
Sysco Corp. | | | 1,277,441 | | | | 84,937,052 | |
|
| |
|
Health Care Equipment–5.41% | |
Becton, Dickinson and Co. | | | 806,962 | | | | 203,983,854 | |
|
| |
Medtronic PLC | | | 1,680,230 | | | | 118,557,029 | |
|
| |
Stryker Corp. | | | 416,196 | | | | 112,464,483 | |
|
| |
Zimmer Biomet Holdings, Inc. | | | 1,115,573 | | | | 116,476,977 | |
|
| |
| | | | 551,482,343 | |
|
| |
|
Health Care Services–1.72% | |
CVS Health Corp. | | | 2,540,952 | | | | 175,351,098 | |
|
| |
|
Home Improvement Retail–1.08% | |
Lowe’s Cos., Inc. | | | 575,516 | | | | 109,676,084 | |
|
| |
|
Household Products–1.44% | |
Colgate-Palmolive Co. | | | 1,959,167 | | | | 147,172,625 | |
|
| |
|
Human Resource & Employment Services–0.90% | |
Automatic Data Processing, Inc. | | | 422,877 | | | | 92,280,219 | |
|
| |
|
Industrial Conglomerates–1.24% | |
General Electric Co. | | | 1,168,201 | | | | 126,901,675 | |
|
| |
|
Industrial Machinery & Supplies & Components–1.68% | |
Parker-Hannifin Corp. | | | 463,080 | | | | 170,834,843 | |
|
| |
|
Industrial REITs–1.39% | |
Prologis, Inc. | | | 1,408,604 | | | | 141,916,853 | |
|
| |
|
Integrated Oil & Gas–3.21% | |
Chevron Corp.(b) | | | 2,247,811 | | | | 327,573,497 | |
|
| |
|
Integrated Telecommunication Services–1.07% | |
Deutsche Telekom AG (Germany) | | | 5,044,511 | | | | 109,311,696 | |
|
| |
|
Interactive Home Entertainment–1.02% | |
Electronic Arts, Inc. | | | 842,727 | | | | 104,321,175 | |
|
| |
|
Investment Banking & Brokerage–1.33% | |
Charles Schwab Corp. (The) | | | 2,599,003 | | | | 135,252,116 | |
|
| |
|
IT Consulting & Other Services–1.24% | |
Accenture PLC, Class A | | | 424,537 | | | | 126,125,697 | |
|
| |
|
Life Sciences Tools & Services–1.42% | |
Thermo Fisher Scientific, Inc. | | | 325,312 | | | | 144,689,018 | |
|
| |
|
Multi-line Insurance–1.06% | |
American International Group,
Inc.(b) | | | 1,771,117 | | | | 108,587,183 | |
|
| |
See accompanying Notes to Financial Statements which are an integral part of the financial statements.
| | |
| 8 | | Invesco Diversified Dividend Fund |
| | | | | | | | |
| | | Shares | | | Value | |
|
| |
Multi-Utilities–3.19% | |
Ameren Corp.(b) | | | 982,669 | | | $ | 74,397,870 | |
|
| |
Public Service Enterprise Group, Inc.(b) | | | 2,752,822 | | | | 169,711,476 | |
|
| |
WEC Energy Group, Inc. | | | 995,574 | | | | 81,029,768 | |
|
| |
| | | | 325,139,114 | |
|
| |
|
Oil & Gas Exploration & Production–5.74% | |
ConocoPhillips(b) | | | 2,313,850 | | | | 274,885,380 | |
|
| |
Marathon Oil Corp.(b) | | | 5,561,434 | | | | 151,882,763 | |
|
| |
Pioneer Natural Resources Co. | | | 664,147 | | | | 158,731,133 | |
|
| |
| | | | 585,499,276 | |
|
| |
|
Oil & Gas Storage & Transportation–0.53% | |
Enbridge, Inc. (Canada) | | | 1,702,089 | | | | 54,545,401 | |
|
| |
|
Packaged Foods & Meats–1.03% | |
Nestle S.A. (Switzerland) | | | 973,813 | | | | 105,058,738 | |
|
| |
|
Personal Care Products–0.84% | |
L’Oreal S.A. (France) | | | 203,298 | | | | 85,273,814 | |
|
| |
|
Pharmaceuticals–6.84% | |
AstraZeneca PLC (United Kingdom) | | | 1,255,498 | | | | 156,931,825 | |
|
| |
Johnson & Johnson | | | 2,114,902 | | | | 313,724,563 | |
|
| |
Merck & Co., Inc. | | | 2,211,167 | | | | 227,086,851 | |
|
| |
| | | | 697,743,239 | |
|
| |
|
Property & Casualty Insurance–2.22% | |
Hartford Financial Services Group, Inc. (The) | | | 1,943,573 | | | | 142,755,437 | |
|
| |
Travelers Cos., Inc. (The) | | | 496,589 | | | | 83,148,862 | |
|
| |
| | | | 225,904,299 | |
|
| |
|
Rail Transportation–1.45% | |
Union Pacific Corp. | | | 711,493 | | | | 147,713,062 | |
|
| |
|
Regional Banks–0.84% | |
M&T Bank Corp.(b) | | | 759,228 | | | | 85,602,957 | |
|
| |
|
Restaurants–2.82% | |
McDonald’s Corp. | | | 692,561 | | | | 181,568,717 | |
|
| |
Starbucks Corp. | | | 1,153,595 | | | | 106,407,603 | |
|
| |
| | | | 287,976,320 | |
|
| |
|
Semiconductor Materials & Equipment–0.96% | |
Lam Research Corp. | | | 166,158 | | | | 97,737,459 | |
|
| |
|
Semiconductors–1.48% | |
Analog Devices, Inc. | | | 608,733 | | | | 95,771,963 | |
|
| |
Broadcom, Inc. | | | 65,252 | | | | 54,901,075 | |
|
| |
| | | | 150,673,038 | |
|
| |
|
Soft Drinks & Non-alcoholic Beverages–1.36% | |
Coca-Cola Co. (The) | | | 2,452,117 | | | | 138,520,089 | |
|
| |
| | | | | | | | |
| | | Shares | | | Value | |
|
| |
Specialty Chemicals–2.50% | |
DuPont de Nemours, Inc.(b) | | | 1,998,721 | | | $ | 145,666,786 | |
|
| |
PPG Industries, Inc. | | | 889,288 | | | | 109,177,888 | |
|
| |
| | | | | | | 254,844,674 | |
|
| |
| | |
Systems Software–2.44% | | | | | | | | |
Microsoft Corp. | | | 734,537 | | | | 248,354,305 | |
|
| |
| | |
Timber REITs–0.77% | | | | | | | | |
Weyerhaeuser Co. | | | 2,744,893 | | | | 78,750,980 | |
|
| |
| | |
Tobacco–2.31% | | | | | | | | |
Philip Morris International, Inc. | | | 2,644,351 | | | | 235,770,335 | |
|
| |
|
Transaction & Payment Processing Services–2.09% | |
Visa, Inc., Class A(b) | | | 906,371 | | | | 213,087,822 | |
|
| |
Total Common Stocks & Other Equity Interests
(Cost $8,328,289,671) | | | | 9,908,850,124 | |
|
| |
|
Money Market Funds–3.20% | |
Invesco Government & Agency Portfolio, Institutional Class, 5.27%(c)(d) | | | 114,276,421 | | | | 114,276,421 | |
|
| |
Invesco Liquid Assets Portfolio, Institutional Class, 5.40%(c)(d) | | | 81,597,268 | | | | 81,621,747 | |
|
| |
Invesco Treasury Portfolio, Institutional Class, 5.27%(c)(d) | | | 130,601,624 | | | | 130,601,624 | |
|
| |
Total Money Market Funds
(Cost $326,485,823) | | | | 326,499,792 | |
|
| |
TOTAL INVESTMENTS IN SECURITIES
(excluding investments purchased with cash collateral from securities on loan)-100.37%
(Cost $8,654,775,494) | | | | 10,235,349,916 | |
|
| |
|
Investments Purchased with Cash Collateral from Securities on Loan | |
Money Market Funds–3.18% | |
Invesco Private Government Fund, 5.32%(c)(d)(e) | | | 90,569,365 | | | | 90,569,365 | |
|
| |
Invesco Private Prime Fund, 5.53%(c)(d)(e) | | | 232,930,288 | | | | 232,953,581 | |
|
| |
Total Investments Purchased with Cash Collateral from Securities on Loan
(Cost $323,515,462) | | | | 323,522,946 | |
|
| |
TOTAL INVESTMENTS IN SECURITIES-103.55%
(Cost $8,978,290,956) | | | | 10,558,872,862 | |
|
| |
OTHER ASSETS LESS LIABILITIES-(3.55)% | | | | (361,505,470 | ) |
|
| |
NET ASSETS–100.00% | | | | | | $ | 10,197,367,392 | |
|
| |
Investment Abbreviations:
REIT – Real Estate Investment Trust
See accompanying Notes to Financial Statements which are an integral part of the financial statements.
| | |
| 9 | | Invesco Diversified Dividend Fund |
Notes to Schedule of Investments:
| (a) | Industry and/or sector classifications used in this report are generally according to the Global Industry Classification Standard, which was developed by and is the exclusive property and a service mark of MSCI Inc. and Standard & Poor’s. |
| (b) | All or a portion of this security was out on loan at October 31, 2023. |
| (c) | Affiliated holding. Affiliated holdings are investments in entities which are under common ownership or control of Invesco Ltd. or are investments in entities in which the Fund owns 5% or more of the outstanding voting securities. The table below shows the Fund’s transactions in, and earnings from, its investments in affiliates for the fiscal year ended October 31, 2023. |
| | | | | | | | | | | | | | | | | | | | | | | | | | | | |
| | | Value
October 31, 2022 | | Purchases at Cost | | Proceeds from Sales | | Change in Unrealized Appreciation (Depreciation) | | Realized Gain (Loss) | | Value
October 31, 2023 | | Dividend Income |
| Investments in Affiliated Money Market Funds: | | | | | | | | | | | | | | | | | | | | | | | | | | | | |
Invesco Government & Agency Portfolio, Institutional Class | | $ | 89,412,768 | | | $ | 995,643,747 | | | $ | (970,780,094 | ) | | $ | - | | | $ | - | | | $ | 114,276,421 | | | $ | 4,643,125 | |
Invesco Liquid Assets Portfolio, Institutional Class | | | 39,822,509 | | | | 711,174,106 | | | | (669,383,838 | ) | | | (6,271 | ) | | | 15,241 | | | | 81,621,747 | | | | 3,265,392 | |
Invesco Treasury Portfolio, Institutional Class | | | 92,817,076 | | | | 1,137,878,569 | | | | (1,100,094,021 | ) | | | - | | | | - | | | | 130,601,624 | | | | 5,248,000 | |
| Investments Purchased with Cash Collateral from Securities on Loan: | | | | | | | | | | | | | | | | | | | | | | | | | | | | |
Invesco Private Government Fund | | | 108,114,666 | | | | 925,824,544 | | | | (943,369,845 | ) | | | - | | | | - | | | | 90,569,365 | | | | 3,488,561* | |
Invesco Private Prime Fund | | | 277,932,348 | | | | 1,887,527,282 | | | | (1,932,491,351 | ) | | | 8,074 | | | | (22,772) | | | | 232,953,581 | | | | 9,520,946* | |
Total | | $ | 608,099,367 | | | $ | 5,658,048,248 | | | $ | (5,616,119,149 | ) | | $ | 1,803 | | | $ | (7,531) | | | $ | 650,022,738 | | | $ | 26,166,024 | |
| | * | Represents the income earned on the investment of cash collateral, which is included in securities lending income on the Statement of Operations. Does not include rebates and fees paid to lending agent or premiums received from borrowers, if any. |
| (d) | The rate shown is the 7-day SEC standardized yield as of October 31, 2023. |
| (e) | The security has been segregated to satisfy the commitment to return the cash collateral received in securities lending transactions upon the borrower’s return of the securities loaned. See Note 1I. |
See accompanying Notes to Financial Statements which are an integral part of the financial statements.
| | |
| 10 | | Invesco Diversified Dividend Fund |
Statement of Assets and Liabilities
October 31, 2023
| | | | |
Assets: | | | | |
Investments in unaffiliated securities, at value
(Cost $8,328,289,671)* | | $ | 9,908,850,124 | |
|
| |
Investments in affiliated money market funds, at value
(Cost $650,001,285) | | | 650,022,738 | |
|
| |
Foreign currencies, at value (Cost $1,251) | | | 1,193 | |
|
| |
Receivable for: | | | | |
Investments sold | | | 21,415,593 | |
|
| |
Fund shares sold | | | 2,987,214 | |
|
| |
Dividends | | | 17,848,675 | |
|
| |
Investment for trustee deferred compensation and retirement plans | | | 547,145 | |
|
| |
Other assets | | | 72,804 | |
|
| |
Total assets | | | 10,601,745,486 | |
|
| |
| |
Liabilities: | | | | |
Payable for: | | | | |
Investments purchased | | | 66,758,144 | |
|
| |
Fund shares reacquired | | | 9,358,504 | |
|
| |
Collateral upon return of securities loaned | | | 323,515,462 | |
|
| |
Accrued fees to affiliates | | | 3,701,600 | |
|
| |
Accrued other operating expenses | | | 354,124 | |
|
| |
Trustee deferred compensation and retirement plans | | | 690,260 | |
|
| |
Total liabilities | | | 404,378,094 | |
|
| |
Net assets applicable to shares outstanding | | $ | 10,197,367,392 | |
|
| |
| |
Net assets consist of: | | | | |
Shares of beneficial interest | | $ | 7,989,369,160 | |
|
| |
Distributable earnings | | | 2,207,998,232 | |
|
| |
| | $ | 10,197,367,392 | |
|
| |
| | | | |
Net Assets: | | | | |
Class A | | $ | 3,478,555,569 | |
|
| |
Class C | | $ | 161,365,144 | |
|
| |
Class R | | $ | 116,297,030 | |
|
| |
Class Y | | $ | 1,153,540,015 | |
|
| |
Investor Class | | $ | 1,385,126,630 | |
|
| |
Class R5 | | $ | 1,688,321,946 | |
|
| |
Class R6 | | $ | 2,214,161,058 | |
|
| |
|
Shares outstanding, no par value, with an unlimited number of shares authorized: | |
| |
Class A | | | 209,026,520 | |
|
| |
Class C | | | 9,862,979 | |
|
| |
Class R | | | 6,954,430 | |
|
| |
Class Y | | | 69,234,340 | |
|
| |
Investor Class | | | 83,260,537 | |
|
| |
Class R5 | | | 101,474,996 | |
|
| |
Class R6 | | | 133,077,998 | |
|
| |
Class A: | | | | |
Net asset value per share | | $ | 16.64 | |
|
| |
Maximum offering price per share
(Net asset value of $16.64 ÷ 94.50%) | | $ | 17.61 | |
|
| |
Class C: | | | | |
Net asset value and offering price per share | | $ | 16.36 | |
|
| |
Class R: | | | | |
Net asset value and offering price per share | | $ | 16.72 | |
|
| |
Class Y: | | | | |
Net asset value and offering price per share | | $ | 16.66 | |
|
| |
Investor Class: | | | | |
Net asset value and offering price per share | | $ | 16.64 | |
|
| |
Class R5: | | | | |
Net asset value and offering price per share | | $ | 16.64 | |
|
| |
Class R6: | | | | |
Net asset value and offering price per share | | $ | 16.64 | |
|
| |
| * | At October 31, 2023, securities with an aggregate value of $321,038,431 were on loan to brokers. |
See accompanying Notes to Financial Statements which are an integral part of the financial statements.
| | |
| 11 | | Invesco Diversified Dividend Fund |
Statement of Operations
For the year ended October 31, 2023
| | | | |
Investment income: | | | | |
Dividends (net of foreign withholding taxes of $1,172,244) | | $ | 272,050,074 | |
|
| |
Dividends from affiliates (includes net securities lending income of $906,935) | | | 14,063,452 | |
|
| |
Total investment income | | | 286,113,526 | |
|
| |
| |
Expenses: | | | | |
Advisory fees | | | 46,847,374 | |
|
| |
Administrative services fees | | | 1,609,045 | |
|
| |
Custodian fees | | | 59,560 | |
|
| |
Distribution fees: | | | | |
Class A | | | 9,586,322 | |
|
| |
Class C | | | 1,970,891 | |
|
| |
Class R | | | 654,916 | |
|
| |
Investor Class | | | 2,322,319 | |
|
| |
Transfer agent fees – A, C, R, Y and Investor | | | 8,943,543 | |
|
| |
Transfer agent fees – R5 | | | 1,934,608 | |
|
| |
Transfer agent fees – R6 | | | 761,989 | |
|
| |
Trustees’ and officers’ fees and benefits | | | 118,300 | |
|
| |
Registration and filing fees | | | 264,418 | |
|
| |
Reports to shareholders | | | 877,494 | |
|
| |
Professional services fees | | | 173,427 | |
|
| |
Other | | | 325,262 | |
|
| |
Total expenses | | | 76,449,468 | |
|
| |
Less: Fees waived and/or expense offset arrangement(s) | | | (371,522 | ) |
|
| |
Net expenses | | | 76,077,946 | |
|
| |
Net investment income | | | 210,035,580 | |
|
| |
| |
Realized and unrealized gain (loss) from: | | | | |
Net realized gain (loss) from: | | | | |
Unaffiliated investment securities | | | 749,802,601 | |
|
| |
Affiliated investment securities | | | (7,531 | ) |
|
| |
Foreign currencies | | | 358,688 | |
|
| |
| | | 750,153,758 | |
|
| |
Change in net unrealized appreciation (depreciation) of: | | | | |
Unaffiliated investment securities | | | (1,135,118,260 | ) |
|
| |
Affiliated investment securities | | | 1,803 | |
|
| |
Foreign currencies | | | 786,841 | |
|
| |
| | | (1,134,329,616 | ) |
|
| |
Net realized and unrealized gain (loss) | | | (384,175,858 | ) |
|
| |
Net increase (decrease) in net assets resulting from operations | | $ | (174,140,278 | ) |
|
| |
See accompanying Notes to Financial Statements which are an integral part of the financial statements.
| | |
| 12 | | Invesco Diversified Dividend Fund |
Statement of Changes in Net Assets
For the years ended October 31, 2023 and 2022
| | | | | | | | |
| | | 2023 | | | 2022 | |
|
| |
Operations: | | | | | | | | |
Net investment income | | $ | 210,035,580 | | | $ | 248,392,048 | |
|
| |
Net realized gain | | | 750,153,758 | | | | 1,333,391,446 | |
|
| |
Change in net unrealized appreciation (depreciation) | | | (1,134,329,616 | ) | | | (1,656,021,601 | ) |
|
| |
Net increase (decrease) in net assets resulting from operations | | | (174,140,278 | ) | | | (74,238,107 | ) |
|
| |
| | |
Distributions to shareholders from distributable earnings: | | | | | | | | |
Class A | | | (434,098,421 | ) | | | (674,862,768 | ) |
|
| |
Class C | | | (22,532,260 | ) | | | (41,366,380 | ) |
|
| |
Class R | | | (14,778,850 | ) | | | (28,971,039 | ) |
|
| |
Class Y | | | (140,687,861 | ) | | | (229,980,426 | ) |
|
| |
Investor Class | | | (174,646,711 | ) | | | (275,395,075 | ) |
|
| |
Class R5 | | | (232,341,754 | ) | | | (453,603,539 | ) |
|
| |
Class R6 | | | (305,604,623 | ) | | | (555,524,110 | ) |
|
| |
Total distributions from distributable earnings | | | (1,324,690,480 | ) | | | (2,259,703,337 | ) |
|
| |
| | |
Share transactions–net: | | | | | | | | |
Class A | | | 57,114,562 | | | | 348,219,065 | |
|
| |
Class C | | | (32,641,012 | ) | | | (10,264,367 | ) |
|
| |
Class R | | | (3,783,739 | ) | | | (26,859,379 | ) |
|
| |
Class Y | | | 40,743,880 | | | | (112,290,773 | ) |
|
| |
Investor Class | | | 19,534,017 | | | | 111,367,979 | |
|
| |
Class R5 | | | (82,929,035 | ) | | | (569,771,344 | ) |
|
| |
Class R6 | | | (153,167,171 | ) | | | (343,382,490 | ) |
|
| |
Net increase (decrease) in net assets resulting from share transactions | | | (155,128,498 | ) | | | (602,981,309 | ) |
|
| |
Net increase (decrease) in net assets | | | (1,653,959,256 | ) | | | (2,936,922,753 | ) |
|
| |
| | |
Net assets: | | | | | | | | |
Beginning of year | | | 11,851,326,648 | | | | 14,788,249,401 | |
|
| |
End of year | | $ | 10,197,367,392 | | | $ | 11,851,326,648 | |
|
| |
See accompanying Notes to Financial Statements which are an integral part of the financial statements.
| | |
| 13 | | Invesco Diversified Dividend Fund |
Financial Highlights
The following schedule presents financial highlights for a share of the Fund outstanding throughout the periods indicated.
| | | | | | | | | | | | | | | | | | | | | | | | | | | | | | | | | | | | | | | | | | | | | | | | | | | | | | | | |
| | | Net asset
value,
beginning
of period | | Net
investment
income(a) | | Net gains
(losses)
on securities
(both
realized and
unrealized) | | Total from
investment
operations | | Dividends
from net
investment
income | | Distributions from net
realized
gains | | Total
distributions | | Net asset
value, end
of period | | Total
return(b) | | Net assets,
end of period
(000’s omitted) | | Ratio of expenses
to average net assets
with fee waivers and/or
expenses
absorbed | | Ratio of
expenses
to average net
assets without
fee waivers
and/or
expenses
absorbed | | Ratio of net
investment
income to average
net assets | | Portfolio turnover (c) |
Class A | | | | | | | | | | | | | | | | | | | | | | | | | | | | | | | | | | | | | | | | | | | | | | | | | | | | | | | | |
Year ended 10/31/23 | | | $19.08 | | | | $0.30 | | | | $(0.62 | ) | | | $(0.32 | ) | | | $(0.34 | ) | | | $(1.78 | ) | | | $(2.12 | ) | | | $16.64 | | | | (2.18 | )% | | | $3,478,556 | | | | 0.82 | % | | | 0.82 | % | | | 1.69 | % | | | 39 | % |
Year ended 10/31/22 | | | 22.89 | | | | 0.35 | | | | (0.56 | ) | | | (0.21 | ) | | | (0.37 | ) | | | (3.23 | ) | | | (3.60 | ) | | | 19.08 | | | | (0.90 | ) | | | 3,923,162 | | | | 0.82 | | | | 0.82 | | | | 1.76 | | | | 39 | |
Year ended 10/31/21 | | | 17.82 | | | | 0.37 | | | | 5.43 | | | | 5.80 | | | | (0.43 | ) | | | (0.30 | ) | | | (0.73 | ) | | | 22.89 | | | | 33.06 | | | | 4,287,951 | | | | 0.81 | | | | 0.81 | | | | 1.73 | | | | 34 | |
Year ended 10/31/20 | | | 20.50 | | | | 0.43 | | | | (2.07 | ) | | | (1.64 | ) | | | (0.46 | ) | | | (0.58 | ) | | | (1.04 | ) | | | 17.82 | | | | (8.28 | ) | | | 3,599,794 | | | | 0.83 | | | | 0.83 | | | | 2.30 | | | | 8 | |
Year ended 10/31/19 | | | 19.55 | | | | 0.47 | | | | 1.89 | | | | 2.36 | | | | (0.51 | ) | | | (0.90 | ) | | | (1.41 | ) | | | 20.50 | | | | 12.94 | | | | 4,995,726 | | | | 0.81 | | | | 0.82 | | | | 2.45 | | | | 5 | |
Class C | | | | | | | | | | | | | | | | | | | | | | | | | | | | | | | | | | | | | | | | | | | | | | | | | | | | | | | | |
Year ended 10/31/23 | | | 18.78 | | | | 0.17 | | | | (0.61 | ) | | | (0.44 | ) | | | (0.20 | ) | | | (1.78 | ) | | | (1.98 | ) | | | 16.36 | | | | (2.89 | ) | | | 161,365 | | | | 1.57 | | | | 1.57 | | | | 0.94 | | | | 39 | |
Year ended 10/31/22 | | | 22.57 | | | | 0.20 | | | | (0.55 | ) | | | (0.35 | ) | | | (0.21 | ) | | | (3.23 | ) | | | (3.44 | ) | | | 18.78 | | | | (1.63 | ) | | | 220,377 | | | | 1.57 | | | | 1.57 | | | | 1.01 | | | | 39 | |
Year ended 10/31/21 | | | 17.58 | | | | 0.21 | | | | 5.34 | | | | 5.55 | | | | (0.26 | ) | | | (0.30 | ) | | | (0.56 | ) | | | 22.57 | | | | 32.02 | | | | 276,023 | | | | 1.56 | | | | 1.56 | | | | 0.98 | | | | 34 | |
Year ended 10/31/20 | | | 20.22 | | | | 0.29 | | | | (2.04 | ) | | | (1.75 | ) | | | (0.31 | ) | | | (0.58 | ) | | | (0.89 | ) | | | 17.58 | | | | (8.96 | ) | | | 300,883 | | | | 1.58 | | | | 1.58 | | | | 1.55 | | | | 8 | |
Year ended 10/31/19 | | | 19.30 | | | | 0.32 | | | | 1.86 | | | | 2.18 | | | | (0.36 | ) | | | (0.90 | ) | | | (1.26 | ) | | | 20.22 | | | | 12.08 | | | | 449,838 | | | | 1.56 | | | | 1.57 | | | | 1.70 | | | | 5 | |
Class R | | | | | | | | | | | | | | | | | | | | | | | | | | | | | | | | | | | | | | | | | | | | | | | | | | | | | | | | |
Year ended 10/31/23 | | | 19.16 | | | | 0.26 | | | | (0.62 | ) | | | (0.36 | ) | | | (0.30 | ) | | | (1.78 | ) | | | (2.08 | ) | | | 16.72 | | | | (2.41 | ) | | | 116,297 | | | | 1.07 | | | | 1.07 | | | | 1.44 | | | | 39 | |
Year ended 10/31/22 | | | 22.97 | | | | 0.30 | | | | (0.56 | ) | | | (0.26 | ) | | | (0.32 | ) | | | (3.23 | ) | | | (3.55 | ) | | | 19.16 | | | | (1.15 | ) | | | 137,274 | | | | 1.07 | | | | 1.07 | | | | 1.51 | | | | 39 | |
Year ended 10/31/21 | | | 17.89 | | | | 0.32 | | | | 5.44 | | | | 5.76 | | | | (0.38 | ) | | | (0.30 | ) | | | (0.68 | ) | | | 22.97 | | | | 32.66 | | | | 193,353 | | | | 1.06 | | | | 1.06 | | | | 1.48 | | | | 34 | |
Year ended 10/31/20 | | | 20.57 | | | | 0.38 | | | | (2.07 | ) | | | (1.69 | ) | | | (0.41 | ) | | | (0.58 | ) | | | (0.99 | ) | | | 17.89 | | | | (8.48 | ) | | | 179,293 | | | | 1.08 | | | | 1.08 | | | | 2.05 | | | | 8 | |
Year ended 10/31/19 | | | 19.61 | | | | 0.43 | | | | 1.89 | | | | 2.32 | | | | (0.46 | ) | | | (0.90 | ) | | | (1.36 | ) | | | 20.57 | | | | 12.69 | | | | 255,482 | | | | 1.06 | | | | 1.07 | | | | 2.20 | | | | 5 | |
Class Y | | | | | | | | | | | | | | | | | | | | | | | | | | | | | | | | | | | | | | | | | | | | | | | | | | | | | | | | |
Year ended 10/31/23 | | | 19.10 | | | | 0.35 | | | | (0.62 | ) | | | (0.27 | ) | | | (0.39 | ) | | | (1.78 | ) | | | (2.17 | ) | | | 16.66 | | | | (1.93 | ) | | | 1,153,540 | | | | 0.57 | | | | 0.57 | | | | 1.94 | | | | 39 | |
Year ended 10/31/22 | | | 22.91 | | | | 0.40 | | | | (0.56 | ) | | | (0.16 | ) | | | (0.42 | ) | | | (3.23 | ) | | | (3.65 | ) | | | 19.10 | | | | (0.64 | ) | | | 1,275,341 | | | | 0.57 | | | | 0.57 | | | | 2.01 | | | | 39 | |
Year ended 10/31/21 | | | 17.84 | | | | 0.43 | | | | 5.42 | | | | 5.85 | | | | (0.48 | ) | | | (0.30 | ) | | | (0.78 | ) | | | 22.91 | | | | 33.35 | | | | 1,620,295 | | | | 0.56 | | �� | | 0.56 | | | | 1.98 | | | | 34 | |
Year ended 10/31/20 | | | 20.53 | | | | 0.48 | | | | (2.08 | ) | | | (1.60 | ) | | | (0.51 | ) | | | (0.58 | ) | | | (1.09 | ) | | | 17.84 | | | | (8.07 | ) | | | 1,589,496 | | | | 0.58 | | | | 0.58 | | | | 2.55 | | | | 8 | |
Year ended 10/31/19 | | | 19.57 | | | | 0.52 | | | | 1.90 | | | | 2.42 | | | | (0.56 | ) | | | (0.90 | ) | | | (1.46 | ) | | | 20.53 | | | | 13.27 | | | | 2,547,134 | | | | 0.56 | | | | 0.57 | | | | 2.70 | | | | 5 | |
Investor Class | | | | | | | | | | | | | | | | | | | | | | | | | | | | | | | | | | | | | | | | | | | | | | | | | | | | | | | | |
Year ended 10/31/23 | | | 19.07 | | | | 0.32 | | | | (0.61 | ) | | | (0.29 | ) | | | (0.36 | ) | | | (1.78 | ) | | | (2.14 | ) | | | 16.64 | | | | (2.03 | )(d) | | | 1,385,127 | | | | 0.72 | (d) | | | 0.72 | (d) | | | 1.79 | (d) | | | 39 | |
Year ended 10/31/22 | | | 22.88 | | | | 0.37 | | | | (0.56 | ) | | | (0.19 | ) | | | (0.39 | ) | | | (3.23 | ) | | | (3.62 | ) | | | 19.07 | | | | (0.81 | )(d) | | | 1,565,529 | | | | 0.73 | (d) | | | 0.73 | (d) | | | 1.85 | (d) | | | 39 | |
Year ended 10/31/21 | | | 17.82 | | | | 0.40 | | | | 5.41 | | | | 5.81 | | | | (0.45 | ) | | | (0.30 | ) | | | (0.75 | ) | | | 22.88 | | | | 33.11 | (d) | | | 1,742,672 | | | | 0.70 | (d) | | | 0.70 | (d) | | | 1.84 | (d) | | | 34 | |
Year ended 10/31/20 | | | 20.49 | | | | 0.44 | | | | (2.06 | ) | | | (1.62 | ) | | | (0.47 | ) | | | (0.58 | ) | | | (1.05 | ) | | | 17.82 | | | | (8.17 | )(d) | | | 1,489,011 | | | | 0.77 | (d) | | | 0.77 | (d) | | | 2.36 | (d) | | | 8 | |
Year ended 10/31/19 | | | 19.54 | | | | 0.49 | | | | 1.88 | | | | 2.37 | | | | (0.52 | ) | | | (0.90 | ) | | | (1.42 | ) | | | 20.49 | | | | 13.00 | (d) | | | 1,817,251 | | | | 0.74 | (d) | | | 0.75 | (d) | | | 2.52 | (d) | | | 5 | |
Class R5 | | | | | | | | | | | | | | | | | | | | | | | | | | | | | | | | | | | | | | | | | | | | | | | | | | | | | | | | |
Year ended 10/31/23 | | | 19.07 | | | | 0.35 | | | | (0.61 | ) | | | (0.26 | ) | | | (0.39 | ) | | | (1.78 | ) | | | (2.17 | ) | | | 16.64 | | | | (1.85 | ) | | | 1,688,322 | | | | 0.54 | | | | 0.54 | | | | 1.97 | | | | 39 | |
Year ended 10/31/22 | | | 22.89 | | | | 0.41 | | | | (0.57 | ) | | | (0.16 | ) | | | (0.43 | ) | | | (3.23 | ) | | | (3.66 | ) | | | 19.07 | | | | (0.66 | ) | | | 2,027,303 | | | | 0.53 | | | | 0.53 | | | | 2.05 | | | | 39 | |
Year ended 10/31/21 | | | 17.82 | | | | 0.43 | | | | 5.43 | | | | 5.86 | | | | (0.49 | ) | | | (0.30 | ) | | | (0.79 | ) | | | 22.89 | | | | 33.45 | | | | 3,062,152 | | | | 0.52 | | | | 0.52 | | | | 2.02 | | | | 34 | |
Year ended 10/31/20 | | | 20.50 | | | | 0.49 | | | | (2.07 | ) | | | (1.58 | ) | | | (0.52 | ) | | | (0.58 | ) | | | (1.10 | ) | | | 17.82 | | | | (7.98 | ) | | | 3,107,721 | | | | 0.52 | | | | 0.52 | | | | 2.61 | | | | 8 | |
Year ended 10/31/19 | | | 19.55 | | | | 0.54 | | | | 1.88 | | | | 2.42 | | | | (0.57 | ) | | | (0.90 | ) | | | (1.47 | ) | | | 20.50 | | | | 13.29 | | | | 3,915,168 | | | | 0.50 | | | | 0.51 | | | | 2.76 | | | | 5 | |
Class R6 | | | | | | | | | | | | | | | | | | | | | | | | | | | | | | | | | | | | | | | | | | | | | | | | | | | | | | | | |
Year ended 10/31/23 | | | 19.07 | | | | 0.36 | | | | (0.61 | ) | | | (0.25 | ) | | | (0.40 | ) | | | (1.78 | ) | | | (2.18 | ) | | | 16.64 | | | | (1.77 | ) | | | 2,214,161 | | | | 0.47 | | | | 0.47 | | | | 2.04 | | | | 39 | |
Year ended 10/31/22 | | | 22.89 | | | | 0.42 | | | | (0.57 | ) | | | (0.15 | ) | | | (0.44 | ) | | | (3.23 | ) | | | (3.67 | ) | | | 19.07 | | | | (0.58 | ) | | | 2,702,340 | | | | 0.46 | | | | 0.46 | | | | 2.12 | | | | 39 | |
Year ended 10/31/21 | | | 17.83 | | | | 0.45 | | | | 5.42 | | | | 5.87 | | | | (0.51 | ) | | | (0.30 | ) | | | (0.81 | ) | | | 22.89 | | | | 33.49 | | | | 3,605,804 | | | | 0.43 | | | | 0.43 | | | | 2.11 | | | | 34 | |
Year ended 10/31/20 | | | 20.51 | | | | 0.50 | | | | (2.07 | ) | | | (1.57 | ) | | | (0.53 | ) | | | (0.58 | ) | | | (1.11 | ) | | | 17.83 | | | | (7.88 | ) | | | 4,024,875 | | | | 0.43 | | | | 0.43 | | | | 2.70 | | | | 8 | |
Year ended 10/31/19 | | | 19.55 | | | | 0.55 | | | | 1.90 | | | | 2.45 | | | | (0.59 | ) | | | (0.90 | ) | | | (1.49 | ) | | | 20.51 | | | | 13.44 | | | | 5,197,717 | | | | 0.41 | | | | 0.42 | | | | 2.85 | | | | 5 | |
| (a) | Calculated using average shares outstanding. |
| (b) | Includes adjustments in accordance with accounting principles generally accepted in the United States of America and as such, the net asset value for financial reporting purposes and the returns based upon those net asset values may differ from the net asset value and returns for shareholder transactions. Does not include sales charges and is not annualized for periods less than one year, if applicable. |
| (c) | Portfolio turnover is calculated at the fund level and is not annualized for periods less than one year, if applicable. |
| (d) | The total return, ratio of expenses to average net assets and ratio of net investment income (loss) to average net assets reflect actual 12b-1 fees of 0.15%, 0.16%, 0.14%, 0.19% and 0.18% for the years ended October 31, 2023, 2022, 2021, 2020 and 2019, respectively. |
See accompanying Notes to Financial Statements which are an integral part of the financial statements.
| | |
| 14 | | Invesco Diversified Dividend Fund |
Notes to Financial Statements
October 31, 2023
NOTE 1–Significant Accounting Policies
Invesco Diversified Dividend Fund (the “Fund”) is a series portfolio of AIM Equity Funds (Invesco Equity Funds) (the “Trust”). The Trust is a Delaware statutory trust registered under the Investment Company Act of 1940, as amended (the “1940 Act”), as an open-end series management investment company authorized to issue an unlimited number of shares of beneficial interest. Information presented in these financial statements pertains only to the Fund. Matters affecting the Fund or each class will be voted on exclusively by the shareholders of the Fund or each class.
The Fund’s investment objective is long-term growth of capital and, secondarily, current income.
The Fund currently consists of seven different classes of shares: Class A, Class C, Class R, Class Y, Investor Class, Class R5 and Class R6. Class Y and Investor Class shares are available only to certain investors. Class A shares are sold with a front-end sales charge unless certain waiver criteria are met. Under certain circumstances, load waived shares may be subject to contingent deferred sales charges (“CDSC”). Class C shares are sold with a CDSC. Class R, Class Y, Investor Class, Class R5 and Class R6 shares are sold at net asset value. Class C shares held for eight years after purchase are eligible for automatic conversion into Class A shares of the same Fund (the “Conversion Feature”). The automatic conversion pursuant to the Conversion Feature will generally occur at the end of the month following the eighth anniversary after a purchase of Class C shares.
The Fund is an investment company and accordingly follows the investment company accounting and reporting guidance in accordance with Financial Accounting Standards Board Accounting Standards Codification Topic 946, Financial Services – Investment Companies.
The following is a summary of the significant accounting policies followed by the Fund in the preparation of its financial statements.
| A. | Security Valuations - Securities, including restricted securities, are valued according to the following policy. |
A security listed or traded on an exchange is generally valued at its trade price or official closing price that day as of the close of the exchange where the security is principally traded, or lacking any trades or official closing price on a particular day, the security may be valued at the closing bid or ask price on that day. Securities traded in the over-the-counter market are valued based on prices furnished by independent pricing services or market makers. When such securities are valued using prices provided by an independent pricing service they may be considered fair valued. Futures contracts are valued at the daily settlement price set by an exchange on which they are principally traded. Where a final settlement price exists, exchange-traded options are valued at the final settlement price from the exchange where the option principally trades. Where a final settlement price does not exist, exchange-traded options are valued at the mean between the last bid and ask price generally from the exchange where the option principally trades.
Securities of investment companies that are not exchange-traded (e.g., open-end mutual funds) are valued using such company’s end-of-business-day net asset value per share.
Deposits, other obligations of U.S. and non-U.S. banks and financial institutions are valued at their daily account value.
Fixed income securities (including convertible debt securities) generally are valued on the basis of prices provided by independent pricing services. Prices provided by the pricing service may be determined without exclusive reliance on quoted prices, and may reflect appropriate factors such as institution-size trading in similar groups of securities, developments related to specific securities, dividend rate (for unlisted equities), yield (for debt obligations), quality, type of issue, coupon rate (for debt obligations), maturity (for debt obligations), individual trading characteristics and other market data. Pricing services generally value debt obligations assuming orderly transactions of institutional round lot size, but a fund may hold or transact in the same securities in smaller, odd lot sizes. Odd lots often trade at lower prices than institutional round lots, and their value may be adjusted accordingly. Debt obligations are subject to interest rate and credit risks. In addition, all debt obligations involve some risk of default with respect to interest and/or principal payments.
Foreign securities’ (including foreign exchange contracts) prices are converted into U.S. dollar amounts using the applicable exchange rates as of the close of the New York Stock Exchange (“NYSE”). If market quotations are available and reliable for foreign exchange-traded equity securities, the securities will be valued at the market quotations. Invesco Advisers, Inc. (the “Adviser” or “Invesco”) may use various pricing services to obtain market quotations as well as fair value prices. Because trading hours for certain foreign securities end before the close of the NYSE, closing market quotations may become not representative of market value in the Adviser’s judgment (“unreliable”). If, between the time trading ends on a particular security and the close of the customary trading session on the NYSE, a significant event occurs that makes the closing price of the security unreliable, the Adviser may fair value the security. If the event is likely to have affected the closing price of the security, the security will be valued at fair value in good faith in accordance with Board- approved policies and related Adviser procedures (“Valuation Procedures”). Adjustments to closing prices to reflect fair value may also be based on a screening process of an independent pricing service to indicate the degree of certainty, based on historical data, that the closing price in the principal market where a foreign security trades is not the current value as of the close of the NYSE. Foreign securities’ prices meeting the degree of certainty that the price is not reflective of current value will be priced at the indication of fair value from the independent pricing service. Multiple factors may be considered by the independent pricing service in determining adjustments to reflect fair value and may include information relating to sector indices, American Depositary Receipts and domestic and foreign index futures. Foreign securities may have additional risks including exchange rate changes, potential for sharply devalued currencies and high inflation, political and economic upheaval, the relative lack of issuer information, relatively low market liquidity and the potential lack of strict financial and accounting controls and standards.
Unlisted securities will be valued using prices provided by independent pricing services or by another method that the Adviser, in its judgment, believes better reflects the security’s fair value in accordance with the Valuation Procedures.
Securities for which market prices are not provided by any of the above methods may be valued based upon quotes furnished by independent sources. The mean between the last bid and ask prices may be used to value debt obligations, including corporate loans.
Securities for which market quotations are not readily available are fair valued by the Adviser in accordance with the Valuation Procedures. If a fair value price provided by a pricing service is unreliable, the Adviser will fair value the security using the Valuation Procedures. Issuer specific events, market trends, bid/ask quotes of brokers and information providers and other market data may be reviewed in the course of making a good faith determination of a security’s fair value.
The Fund may invest in securities that are subject to interest rate risk, meaning the risk that the prices will generally fall as interest rates rise and, conversely, the prices will generally rise as interest rates fall. Specific securities differ in their sensitivity to changes in interest rates depending on their individual characteristics. Changes in interest rates may result in increased market volatility, which may affect the value and/or liquidity of certain Fund investments.
Valuations change in response to many factors including the historical and prospective earnings of the issuer, the value of the issuer’s assets, general market conditions which are not specifically related to the particular issuer, such as real or perceived adverse economic conditions, changes in the general outlook for revenues or corporate earnings, changes in interest or currency rates, regional or global instability, natural or environmental disasters, widespread disease or other public health issues, war, acts of terrorism, significant governmental actions or adverse investor sentiment generally and market liquidity. Because of the inherent uncertainties of valuation, the values reflected in the financial statements may materially differ from the value received upon actual sale of those investments.
The price the Fund could receive upon the sale of any investment may differ from the Adviser’s valuation of the investment, particularly for securities that are valued using a fair valuation technique. When fair valuation techniques are applied, the Adviser uses available information, including both observable and unobservable inputs and assumptions, to determine a methodology that will result in a valuation that the Adviser believes approximates market value. Fund securities that are fair valued may be subject to greater fluctuation in their value from one day to the next than would be the case if market quotations were used.
| | |
| 15 | | Invesco Diversified Dividend Fund |
Because of the inherent uncertainties of valuation, and the degree of subjectivity in such decisions, the Fund could realize a greater or lesser than expected gain or loss upon the sale of the investment.
| B. | Securities Transactions and Investment Income - Securities transactions are accounted for on a trade date basis. Realized gains or losses on sales are computed on the basis of specific identification of the securities sold. Interest income (net of withholding tax, if any) is recorded on an accrual basis from settlement date and includes coupon interest and amortization of premium and accretion of discount on debt securities as applicable. Dividend income (net of withholding tax, if any) is recorded on the ex-dividend date. |
The Fund may periodically participate in litigation related to Fund investments. As such, the Fund may receive proceeds from litigation settlements. Any proceeds received are included in the Statement of Operations as realized gain (loss) for investments no longer held and as unrealized gain (loss) for investments still held.
Brokerage commissions and mark ups are considered transaction costs and are recorded as an increase to the cost basis of securities purchased and/or a reduction of proceeds on a sale of securities. Such transaction costs are included in the determination of net realized and unrealized gain (loss) from investment securities reported in the Statement of Operations and the Statement of Changes in Net Assets and the net realized and unrealized gains (losses) on securities per share in the Financial Highlights. Transaction costs are included in the calculation of the Fund’s net asset value and, accordingly, they reduce the Fund’s total returns. These transaction costs are not considered operating expenses and are not reflected in net investment income reported in the Statement of Operations and the Statement of Changes in Net Assets, or the net investment income per share and the ratios of expenses and net investment income reported in the Financial Highlights, nor are they limited by any expense limitation arrangements between the Fund and the investment adviser.
The Fund allocates income and realized and unrealized capital gains and losses to a class based on the relative net assets of each class.
| C. | Country Determination - For the purposes of making investment selection decisions and presentation in the Schedule of Investments, the investment adviser may determine the country in which an issuer is located and/or credit risk exposure based on various factors. These factors include the laws of the country under which the issuer is organized, where the issuer maintains a principal office, the country in which the issuer derives 50% or more of its total revenues, the country that has the primary market for the issuer’s securities and its “country of risk” as determined by a third party service provider, as well as other criteria. Among the other criteria that may be evaluated for making this determination are the country in which the issuer maintains 50% or more of its assets, the type of security, financial guarantees and enhancements, the nature of the collateral and the sponsor organization. Country of issuer and/or credit risk exposure has been determined to be the United States of America, unless otherwise noted. |
| D. | Distributions - Distributions from net investment income, if any, are declared and paid quarterly and are recorded on the ex-dividend date. Distributions from net realized capital gain, if any, are generally declared and paid annually and recorded on the ex-dividend date. The Fund may elect to treat a portion of the proceeds from redemptions as distributions for federal income tax purposes. |
| E. | Federal Income Taxes - The Fund intends to comply with the requirements of Subchapter M of the Internal Revenue Code of 1986, as amended (the “Internal Revenue Code”), necessary to qualify as a regulated investment company and to distribute substantially all of the Fund’s taxable earnings to shareholders. As such, the Fund will not be subject to federal income taxes on otherwise taxable income (including net realized capital gain) that is distributed to shareholders. Therefore, no provision for federal income taxes is recorded in the financial statements. |
The Fund recognizes the tax benefits of uncertain tax positions only when the position is more likely than not to be sustained. Management has analyzed the Fund’s uncertain tax positions and concluded that no liability for unrecognized tax benefits should be recorded related to uncertain tax positions. Management is not aware of any tax positions for which it is reasonably possible that the total amounts of unrecognized tax benefits will change materially in the next 12 months.
The Fund files tax returns in the U.S. Federal jurisdiction and certain other jurisdictions. Generally, the Fund is subject to examinations by such taxing authorities for up to three years after the filing of the return for the tax period.
| F. | Expenses - Fees provided for under the Rule 12b-1 plan of a particular class of the Fund are charged to the operations of such class. Transfer agency fees and expenses and other shareholder recordkeeping fees and expenses attributable to Class R5 and Class R6 are allocated based on relative net assets of Class R5 and Class R6. Sub-accounting fees attributable to Class R5 are charged to the operations of the class. Transfer agency fees and expenses and other shareholder recordkeeping fees and expenses relating to all other classes are allocated among those classes based on relative net assets. All other expenses are allocated among the classes based on relative net assets. |
| G. | Accounting Estimates - The preparation of financial statements in conformity with accounting principles generally accepted in the United States of America (“GAAP”) requires management to make estimates and assumptions that affect the reported amounts of assets and liabilities at the date of the financial statements and the reported amounts of revenues and expenses during the reporting period including estimates and assumptions related to taxation. Actual results could differ from those estimates by a significant amount. In addition, the Fund monitors for material events or transactions that may occur or become known after the period-end date and before the date the financial statements are released to print. |
| H. | Indemnifications - Under the Trust’s organizational documents, each Trustee, officer, employee or other agent of the Trust is indemnified against certain liabilities that may arise out of the performance of their duties to the Fund. Additionally, in the normal course of business, the Fund enters into contracts, including the Fund’s servicing agreements, that contain a variety of indemnification clauses. The Fund’s maximum exposure under these arrangements is unknown as this would involve future claims that may be made against the Fund that have not yet occurred. The risk of material loss as a result of such indemnification claims is considered remote. |
| I. | Securities Lending - The Fund may lend portfolio securities having a market value up to one-third of the Fund’s total assets. Such loans are secured by collateral equal to no less than the market value of the loaned securities determined daily by the securities lending provider. Such collateral will be cash or debt securities issued or guaranteed by the U.S. Government or any of its sponsored agencies. Cash collateral received in connection with these loans is invested in short-term money market instruments or affiliated, unregistered investment companies that comply with Rule 2a-7 under the 1940 Act and money market funds (collectively, “affiliated money market funds”) and is shown as such on the Schedule of Investments. The Fund bears the risk of loss with respect to the investment of collateral. It is the Fund’s policy to obtain additional collateral from or return excess collateral to the borrower by the end of the next business day, following the valuation date of the securities loaned. Therefore, the value of the collateral held may be temporarily less than the value of the securities on loan. When loaning securities, the Fund retains certain benefits of owning the securities, including the economic equivalent of dividends or interest generated by the security. Lending securities entails a risk of loss to the Fund if, and to the extent that, the market value of the securities loaned were to increase and the borrower did not increase the collateral accordingly, and the borrower failed to return the securities. The securities loaned are subject to termination at the option of the borrower or the Fund. Upon termination, the borrower will return to the Fund the securities loaned and the Fund will return the collateral. Upon the failure of the borrower to return the securities, collateral may be liquidated and the securities may be purchased on the open market to replace the loaned securities. The Fund could experience delays and costs in gaining access to the collateral and the securities may lose value during the delay which could result in potential losses to the Fund. Some of these losses may be indemnified by the lending agent. The Fund bears the risk of any deficiency in the amount of the collateral available for return to the borrower due to any loss on the collateral invested. Dividends received on cash collateral investments for securities lending transactions, which are net of compensation to counterparties, are included in Dividends from affiliated money market funds on the Statement of Operations. The aggregate value of securities out on loan, if any, is shown as a footnote on the Statement of Assets and Liabilities. |
The Adviser serves as an affiliated securities lending agent for the Fund. The Bank of New York Mellon also serves as a securities lending agent. To the extent the Fund utilizes the Adviser as an affiliated securities lending agent, the Fund conducts its securities lending in accordance with, and in reliance upon, no-action letters issued by the SEC staff that provide guidance on how an affiliate may act as a direct agent lender and receive compensation for those services in a manner
| | |
| 16 | | Invesco Diversified Dividend Fund |
consistent with the federal securities laws. For the year ended October 31, 2023, the Fund paid the Adviser $42,173 in fees for securities lending agent services. Fees paid to the Adviser for securities lending agent services, if any, are included in Dividends from affiliated money market funds on the Statement of Operations.
| J. | Foreign Currency Translations - Foreign currency is valued at the close of the NYSE based on quotations posted by banks and major currency dealers. Portfolio securities and other assets and liabilities denominated in foreign currencies are translated into U.S. dollar amounts at the date of valuation. Purchases and sales of portfolio securities (net of foreign taxes withheld on disposition) and income items denominated in foreign currencies are translated into U.S. dollar amounts on the respective dates of such transactions. The Fund does not separately account for the portion of the results of operations resulting from changes in foreign exchange rates on investments and the fluctuations arising from changes in market prices of securities held. The combined results of changes in foreign exchange rates and the fluctuation of market prices on investments (net of estimated foreign tax withholding) are included with the net realized and unrealized gain or loss from investments in the Statement of Operations. Reported net realized foreign currency gains or losses arise from (1) sales of foreign currencies, (2) currency gains or losses realized between the trade and settlement dates on securities transactions, and (3) the difference between the amounts of dividends, interest, and foreign withholding taxes recorded on the Fund’s books and the U.S. dollar equivalent of the amounts actually received or paid. Net unrealized foreign currency gains and losses arise from changes in the fair values of assets and liabilities, other than investments in securities at fiscal period end, resulting from changes in exchange rates. |
The Fund may invest in foreign securities, which may be subject to foreign taxes on income, gains on investments or currency repatriation, a portion of which may be recoverable. Foreign taxes, if any, are recorded based on the tax regulations and rates that exist in the foreign markets in which the Fund invests and are shown in the Statement of Operations.
| K. | Forward Foreign Currency Contracts - The Fund may engage in foreign currency transactions either on a spot (i.e. for prompt delivery and settlement) basis, or through forward foreign currency contracts, to manage or minimize currency or exchange rate risk. |
The Fund may also enter into forward foreign currency contracts for the purchase or sale of a security denominated in a foreign currency in order to “lock in” the U.S. dollar price of that security, or the Fund may also enter into forward foreign currency contracts that do not provide for physical exchange of the two currencies on the settlement date, but instead are settled by a single cash payment calculated as the difference between the agreed upon exchange rate and the spot rate at settlement based upon an agreed upon notional amount (non-deliverable forwards).
A forward foreign currency contract is an obligation between two parties (“Counterparties”) to purchase or sell a specific currency for an agreed-upon price at a future date. The use of forward foreign currency contracts for hedging does not eliminate fluctuations in the price of the underlying securities the Fund owns or intends to acquire but establishes a rate of exchange in advance. Fluctuations in the value of these contracts are measured by the difference in the contract date and reporting date exchange rates and are recorded as unrealized appreciation (depreciation) until the contracts are closed. When the contracts are closed, realized gains (losses) are recorded. Realized and unrealized gains (losses) on the contracts are included in the Statement of Operations. The primary risks associated with forward foreign currency contracts include failure of the Counterparty to meet the terms of the contract and the value of the foreign currency changing unfavorably. These risks may be in excess of the amounts reflected in the Statement of Assets and Liabilities.
NOTE 2–Advisory Fees and Other Fees Paid to Affiliates
The Trust has entered into a master investment advisory agreement with the Adviser. Under the terms of the investment advisory agreement, the Fund accrues daily and pays monthly an advisory fee to the Adviser based on the annual rate of the Fund’s average daily net assets as follows:
| | | | | | |
| Average Daily Net Assets | | Rate | |
| |
First $ 350 million | | | 0.600% | |
| |
Next $350 million | | | 0.550% | |
| |
Next $1.3 billion | | | 0.500% | |
| |
Next $2 billion | | | 0.450% | |
| |
Next $2 billion | | | 0.400% | |
| |
Next $2 billion | | | 0.375% | |
| |
Over $8 billion | | | 0.350% | |
| |
For the year ended October 31, 2023, the effective advisory fee rate incurred by the Fund was 0.41%.
Under the terms of a master sub-advisory agreement between the Adviser and each of Invesco Asset Management Deutschland GmbH, Invesco Asset Management Limited, Invesco Asset Management (Japan) Limited, Invesco Hong Kong Limited, Invesco Senior Secured Management, Inc. and Invesco Canada Ltd. (collectively, the “Affiliated Sub-Advisers”) the Adviser, not the Fund, will pay 40% of the fees paid to the Adviser to any such Affiliated Sub-Adviser(s) that provide(s) discretionary investment management services to the Fund based on the percentage of assets allocated to such Affiliated Sub-Adviser(s).
Effective July 1, 2023, the Adviser has agreed, for an indefinite period, to waive advisory fees and/or reimburse expenses of all shares to the extent necessary to limit total annual fund operating expenses after fee waiver and/or expense reimbursement (excluding certain items discussed below) of Class A, Class C, Class R, Class Y, Investor Class, Class R5 and Class R6 shares to 2.00%, 2.75%, 2.25%, 1.75%, 2.00%, 1.75% and 1.75%, respectively, of the Fund’s average daily net assets (the “boundary limits”). Prior to July 1, 2023, the same boundary limits were in effect with an expiration date of June 30, 2023. In determining the Adviser’s obligation to waive advisory fees and/or reimburse expenses, the following expenses are not taken into account, and could cause the total annual fund operating expenses after fee waiver and/or expense reimbursement to exceed the numbers reflected above: (1) interest; (2) taxes; (3) dividend expense on short sales; (4) extraordinary or non-routine items, including litigation expenses; and (5) expenses that the Fund has incurred but did not actually pay because of an expense offset arrangement. Invesco may amend and/or terminate these boundary limits at any time in its sole discretion and will inform the Board of Trustees of any such changes. The Adviser did not waive fees and/or reimburse expenses during the period under these boundary limits.
Further, the Adviser has contractually agreed, through at least June 30, 2025, to waive the advisory fee payable by the Fund in an amount equal to 100% of the net advisory fees the Adviser receives from the affiliated money market funds on investments by the Fund of uninvested cash (excluding investments of cash collateral from securities lending) in such affiliated money market funds.
For the year ended October 31, 2023, the Adviser waived advisory fees of $292,935.
The Trust has entered into a master administrative services agreement with Invesco pursuant to which the Fund has agreed to pay Invesco for certain administrative costs incurred in providing accounting services to the Fund. For the year ended October 31, 2023, expenses incurred under the agreement are shown in the Statement of Operations as Administrative services fees. Invesco has entered into a sub-administration agreement whereby State Street Bank and Trust Company (“SSB”) serves as fund accountant and provides certain administrative services to the Fund. Pursuant to a custody agreement with the Trust on behalf of the Fund, SSB also serves as the Fund’s custodian.
The Trust has entered into a transfer agency and service agreement with Invesco Investment Services, Inc. (“IIS”) pursuant to which the Fund has agreed to pay IIS a fee for providing transfer agency and shareholder services to the Fund and reimburse IIS for certain expenses incurred by IIS in the course of providing such services. IIS may make payments to intermediaries that provide omnibus account services, sub-accounting services and/or networking services. All fees payable by IIS to
| | |
| 17 | | Invesco Diversified Dividend Fund |
intermediaries that provide omnibus account services or sub-accounting services are charged back to the Fund, subject to certain limitations approved by the Trust’s Board of Trustees. For the year ended October 31, 2023, expenses incurred under the agreement are shown in the Statement of Operations as Transfer agent fees.
The Trust has entered into master distribution agreements with Invesco Distributors, Inc. (“IDI”) to serve as the distributor for the Class A, Class C, Class R, Class Y, Investor Class, Class R5 and Class R6 shares of the Fund. The Trust has adopted plans pursuant to Rule 12b-1 under the 1940 Act with respect to the Fund’s Class A, Class C, Class R and Investor Class shares (collectively, the “Plans”). The Fund, pursuant to the Plans, pays IDI compensation at the annual rate of 0.25% of the Fund’s average daily net assets of Class A shares, 1.00% of the average daily net assets of Class C shares and 0.50% of the average daily net assets of Class R shares. The Fund, pursuant to the Investor Class Plan, reimburses IDI for its allocated share of expenses incurred pursuant to the Investor Class Plan for the period, up to a maximum annual rate of 0.25% of the average daily net assets of Investor Class shares. The fees are accrued daily and paid monthly. Of the Plans payments, up to 0.25% of the average daily net assets of each class of shares may be paid to furnish continuing personal shareholder services to customers who purchase and own shares of such classes. Any amounts not paid as a service fee under the Plans would constitute an asset-based sales charge. Rules of the Financial Industry Regulatory Authority (“FINRA”) impose a cap on the total sales charges, including asset-based sales charges, that may be paid by any class of shares of the Fund. For the year ended October 31, 2023, expenses incurred under the Plans are shown in the Statement of Operations as Distribution fees.
Front-end sales commissions and CDSC (collectively, the “sales charges”) are not recorded as expenses of the Fund. Front-end sales commissions are deducted from proceeds from the sales of Fund shares prior to investment in Class A shares of the Fund. CDSC are deducted from redemption proceeds prior to remittance to the shareholder. During the year ended October 31, 2023, IDI advised the Fund that IDI retained $338,863 in front-end sales commissions from the sale of Class A shares and $17,567 and $7,099 from Class A and Class C shares, respectively, for CDSC imposed upon redemptions by shareholders.
For the year ended October 31, 2023, the Fund incurred $76,346 in brokerage commissions with Invesco Capital Markets, Inc., an affiliate of the Adviser and IDI, for portfolio transactions executed on behalf of the Fund.
Certain officers and trustees of the Trust are officers and directors of the Adviser, IIS and/or IDI.
NOTE 3–Additional Valuation Information
GAAP defines fair value as the price that would be received to sell an asset or paid to transfer a liability in an orderly transaction between market participants at the measurement date, under current market conditions. GAAP establishes a hierarchy that prioritizes the inputs to valuation methods, giving the highest priority to readily available unadjusted quoted prices in an active market for identical assets (Level 1) and the lowest priority to significant unobservable inputs (Level 3), generally when market prices are not readily available. Based on the valuation inputs, the securities or other investments are tiered into one of three levels. Changes in valuation methods may result in transfers in or out of an investment’s assigned level:
| | |
| Level 1 - | | Prices are determined using quoted prices in an active market for identical assets. |
| Level 2 - | | Prices are determined using other significant observable inputs. Observable inputs are inputs that other market participants may use in pricing a security. These may include quoted prices for similar securities, interest rates, prepayment speeds, credit risk, yield curves, loss severities, default rates, discount rates, volatilities and others. |
| Level 3 - | | Prices are determined using significant unobservable inputs. In situations where quoted prices or observable inputs are unavailable (for example, when there is little or no market activity for an investment at the end of the period), unobservable inputs may be used. Unobservable inputs reflect the Adviser’s assumptions about the factors market participants would use in determining fair value of the securities or instruments and would be based on the best available information. |
The following is a summary of the tiered valuation input levels, as of October 31, 2023. The level assigned to the securities valuations may not be an indication of the risk or liquidity associated with investing in those securities. Because of the inherent uncertainties of valuation, the values reflected in the financial statements may materially differ from the value received upon actual sale of those investments.
| | | | | | | | | | | | | | | | |
| | | Level 1 | | | Level 2 | | | Level 3 | | | Total | |
|
| |
Investments in Securities | | | | | | | | | | | | | | | | |
|
| |
Common Stocks & Other Equity Interests | | $ | 9,349,193,422 | | | $ | 559,656,702 | | | | $– | | | $ | 9,908,850,124 | |
|
| |
Money Market Funds | | | 326,499,792 | | | | 323,522,946 | | | | – | | | | 650,022,738 | |
|
| |
Total Investments | | $ | 9,675,693,214 | | | $ | 883,179,648 | | | | $– | | | $ | 10,558,872,862 | |
|
| |
NOTE 4–Expense Offset Arrangement(s)
The expense offset arrangement is comprised of transfer agency credits which result from balances in demand deposit accounts used by the transfer agent for clearing shareholder transactions. For the year ended October 31, 2023, the Fund received credits from this arrangement, which resulted in the reduction of the Fund’s total expenses of $78,587.
NOTE 5–Trustees’ and Officers’ Fees and Benefits
Trustees’ and Officers’ Fees and Benefits include amounts accrued by the Fund to pay remuneration to certain Trustees and Officers of the Fund. Trustees have the option to defer compensation payable by the Fund, and Trustees’ and Officers’ Fees and Benefits also include amounts accrued by the Fund to fund such deferred compensation amounts. Those Trustees who defer compensation have the option to select various Invesco Funds in which their deferral accounts shall be deemed to be invested. Finally, certain current Trustees were eligible to participate in a retirement plan that provided for benefits to be paid upon retirement to Trustees over a period of time based on the number of years of service. The Fund may have certain former Trustees who also participate in a retirement plan and receive benefits under such plan. Trustees’ and Officers’ Fees and Benefits include amounts accrued by the Fund to fund such retirement benefits. Obligations under the deferred compensation and retirement plans represent unsecured claims against the general assets of the Fund.
NOTE 6–Cash Balances
The Fund is permitted to temporarily carry a negative or overdrawn balance in its account with SSB, the custodian bank. Such balances, if any at period-end, are shown in the Statement of Assets and Liabilities under the payable caption Amount due custodian. To compensate the custodian bank for such overdrafts, the overdrawn Fund may either (1) leave funds as a compensating balance in the account so the custodian bank can be compensated by earning the additional interest; or (2) compensate by paying the custodian bank at a rate agreed upon by the custodian bank and Invesco, not to exceed the contractually agreed upon rate.
| | |
| 18 | | Invesco Diversified Dividend Fund |
NOTE 7–Distributions to Shareholders and Tax Components of Net Assets
Tax Character of Distributions to Shareholders Paid During the Fiscal Years Ended October 31, 2023 and 2022:
| | | | | | | | | | | | |
| | | 2023 | | | | | | 2022 | |
|
| |
Ordinary income* | | $ | 231,019,685 | | | | | | | $ | 317,558,079 | |
|
| |
Long-term capital gain | | | 1,093,670,795 | | | | | | | | 1,942,145,258 | |
|
| |
Total distributions | | $ | 1,324,690,480 | | | | | | | $ | 2,259,703,337 | |
|
| |
| * | Includes short-term capital gain distributions, if any. |
Tax Components of Net Assets at Period-End:
| | | | |
| | | 2023 | |
|
| |
Undistributed ordinary income | | $ | 949,303 | |
|
| |
Undistributed long-term capital gain | | | 630,123,339 | |
|
| |
Net unrealized appreciation – investments | | | 1,577,599,328 | |
|
| |
Net unrealized appreciation (depreciation) – foreign currencies | | | (122,914 | ) |
|
| |
Temporary book/tax differences | | | (550,824 | ) |
|
| |
Shares of beneficial interest | | | 7,989,369,160 | |
|
| |
Total net assets | | $ | 10,197,367,392 | |
|
| |
The difference between book-basis and tax-basis unrealized appreciation (depreciation) is due to differences in the timing of recognition of gains and losses on investments for tax and book purposes. The Fund’s net unrealized appreciation (depreciation) difference is attributable primarily to wash sales.
The temporary book/tax differences are a result of timing differences between book and tax recognition of income and/or expenses. The Fund’s temporary book/tax differences are the result of the trustee deferral of compensation and retirement plan benefits.
Capital loss carryforward is calculated and reported as of a specific date. Results of transactions and other activity after that date may affect the amount of capital loss carryforward actually available for the Fund to utilize. The ability to utilize capital loss carryforward in the future may be limited under the Internal Revenue Code and related regulations based on the results of future transactions.
The Fund does not have a capital loss carryforward as of October 31, 2023.
NOTE 8–Investment Transactions
The aggregate amount of investment securities (other than short-term securities, U.S. Government obligations and money market funds, if any) purchased and sold by the Fund during the year ended October 31, 2023 was $4,340,067,888 and $5,645,559,634, respectively. Cost of investments, including any derivatives, on a tax basis includes the adjustments for financial reporting purposes as of the most recently completed federal income tax reporting period-end.
| | | | |
Unrealized Appreciation (Depreciation) of Investments on a Tax Basis | |
Aggregate unrealized appreciation of investments | | | $1,930,622,705 | |
|
| |
Aggregate unrealized (depreciation) of investments | | | (353,023,377 | ) |
|
| |
Net unrealized appreciation of investments | | | $1,577,599,328 | |
|
| |
Cost of investments for tax purposes is $8,981,273,534.
NOTE 9–Reclassification of Permanent Differences
Primarily as a result of differing book/tax treatment of equalization, on October 31, 2023, undistributed net investment income was increased by $9,585,842, undistributed net realized gain was decreased by $115,987,842 and shares of beneficial interest was increased by $106,402,000. This reclassification had no effect on the net assets of the Fund.
NOTE 10–Share Information
| | | | | | | | | | | | | | | | |
| | | Summary of Share Activity | |
|
| |
| | | Year ended | | | Year ended | |
| | | October 31, 2023(a) | | | October 31, 2022 | |
| | | Shares | | | Amount | | | Shares | | | Amount | |
|
| |
Sold: | | | | | | | | | | | | | | | | |
Class A | | | 14,929,944 | | | $ | 265,794,823 | | | | 18,751,577 | | | $ | 369,082,787 | |
|
| |
Class C | | | 952,075 | | | | 16,694,399 | | | | 1,203,766 | | | | 23,334,516 | |
|
| |
Class R | | | 1,302,574 | | | | 23,318,161 | | | | 1,555,928 | | | | 30,996,601 | |
|
| |
Class Y | | | 18,068,726 | | | | 321,751,621 | | | | 16,093,032 | | | | 312,068,013 | |
|
| |
Investor Class | | | 1,013,797 | | | | 18,123,405 | | | | 2,221,885 | | | | 43,366,695 | |
|
| |
Class R5 | | | 10,052,175 | | | | 181,403,834 | | | | 11,348,686 | | | | 225,523,677 | |
|
| |
Class R6 | | | 16,346,232 | | | | 291,487,234 | | | | 22,298,306 | | | | 437,348,946 | |
|
| |
| | |
| 19 | | Invesco Diversified Dividend Fund |
| | | | | | | | | | | | | | | | |
| | | Summary of Share Activity | |
|
| |
| | | Year ended | | | Year ended | |
| | | October 31, 2023(a) | | | October 31, 2022 | |
| | | Shares | | | Amount | | | Shares | | | Amount | |
|
| |
| | | | |
Issued as reinvestment of dividends: | | | | | | | | | | | | | | | | |
Class A | | | 22,485,427 | | | $ | 397,527,110 | | | | 31,995,049 | | | $ | 618,475,492 | |
|
| |
Class C | | | 1,188,932 | | | | 20,725,565 | | | | 1,962,707 | | | | 37,414,143 | |
|
| |
Class R | | | 830,438 | | | | 14,763,837 | | | | 1,490,300 | | | | 28,962,413 | |
|
| |
Class Y | | | 6,245,048 | | | | 110,524,432 | | | | 9,831,220 | | | | 190,171,691 | |
|
| |
Investor Class | | | 8,853,431 | | | | 156,405,158 | | | | 12,786,098 | | | | 247,014,620 | |
|
| |
Class R5 | | | 13,139,583 | | | | 232,072,886 | | | | 23,454,211 | | | | 453,297,676 | |
|
| |
Class R6 | | | 16,907,485 | | | | 298,572,735 | | | | 28,261,580 | | | | 546,061,215 | |
|
| |
| | | | |
Automatic conversion of Class C shares to Class A shares: | | | | | | | | | | | | | | | | |
Class A | | | 1,564,344 | | | | 27,630,606 | | | | 1,582,374 | | | | 31,071,142 | |
|
| |
Class C | | | (1,591,299 | ) | | | (27,630,606 | ) | | | (1,607,511 | ) | | | (31,071,142 | ) |
|
| |
| | | | |
Reacquired: | | | | | | | | | | | | | | | | |
Class A | | | (35,608,699 | ) | | | (633,837,977 | ) | | | (34,039,851 | ) | | | (670,410,356 | ) |
|
| |
Class C | | | (2,421,822 | ) | | | (42,430,370 | ) | | | (2,052,005 | ) | | | (39,941,884 | ) |
|
| |
Class R | | | (2,343,265 | ) | | | (41,865,737 | ) | | | (4,299,947 | ) | | | (86,818,393 | ) |
|
| |
Class Y | | | (21,860,033 | ) | | | (391,532,173 | ) | | | (29,866,402 | ) | | | (614,530,477 | ) |
|
| |
Investor Class | | | (8,699,156 | ) | | | (154,994,546 | ) | | | (9,074,173 | ) | | | (179,013,336 | ) |
|
| |
Class R5 | | | (28,003,716 | ) | | | (496,405,755 | ) | | | (62,321,760 | ) | | | (1,248,592,697 | ) |
|
| |
Class R6 | | | (41,850,316 | ) | | | (743,227,140 | ) | | | (66,433,518 | ) | | | (1,326,792,651 | ) |
|
| |
Net increase (decrease) in share activity | | | (8,498,095 | ) | | $ | (155,128,498 | ) | | | (24,858,448 | ) | | $ | (602,981,309 | ) |
|
| |
| (a) | There are entities that are record owners of more than 5% of the outstanding shares of the Fund and in the aggregate own 48% of the outstanding shares of the Fund. IDI has an agreement with these entities to sell Fund shares. The Fund, Invesco and/or Invesco affiliates may make payments to these entities, which are considered to be related to the Fund, for providing services to the Fund, Invesco and/or Invesco affiliates including but not limited to services such as securities brokerage, distribution, third party record keeping and account servicing. The Fund has no knowledge as to whether all or any portion of the shares owned of record by these entities are also owned beneficially. |
| | |
| 20 | | Invesco Diversified Dividend Fund |
Report of Independent Registered Public Accounting Firm
To the Board of Trustees of AIM Equity Funds (Invesco Equity Funds) and Shareholders of Invesco Diversified Dividend Fund
Opinion on the Financial Statements
We have audited the accompanying statement of assets and liabilities, including the schedule of investments, of Invesco Diversified Dividend Fund (one of the funds constituting AIM Equity Funds (Invesco Equity Funds), referred to hereafter as the “Fund”) as of October 31, 2023, the related statement of operations for the year ended October 31, 2023, the statement of changes in net assets for each of the two years in the period ended October 31, 2023, including the related notes, and the financial highlights for each of the five years in the period ended October 31, 2023 (collectively referred to as the “financial statements”). In our opinion, the financial statements present fairly, in all material respects, the financial position of the Fund as of October 31, 2023, the results of its operations for the year then ended, the changes in its net assets for each of the two years in the period ended October 31, 2023 and the financial highlights for each of the five years in the period ended October 31, 2023 in conformity with accounting principles generally accepted in the United States of America.
Basis for Opinion
These financial statements are the responsibility of the Fund’s management. Our responsibility is to express an opinion on the Fund’s financial statements based on our audits. We are a public accounting firm registered with the Public Company Accounting Oversight Board (United States) (PCAOB) and are required to be independent with respect to the Fund in accordance with the U.S. federal securities laws and the applicable rules and regulations of the Securities and Exchange Commission and the PCAOB.
We conducted our audits of these financial statements in accordance with the standards of the PCAOB. Those standards require that we plan and perform the audit to obtain reasonable assurance about whether the financial statements are free of material misstatement, whether due to error or fraud.
Our audits included performing procedures to assess the risks of material misstatement of the financial statements, whether due to error or fraud, and performing procedures that respond to those risks. Such procedures included examining, on a test basis, evidence regarding the amounts and disclosures in the financial statements. Our audits also included evaluating the accounting principles used and significant estimates made by management, as well as evaluating the overall presentation of the financial statements. Our procedures included confirmation of securities owned as of October 31, 2023 by correspondence with the custodian, transfer agent and brokers. We believe that our audits provide a reasonable basis for our opinion.
/s/PricewaterhouseCoopers LLP
Houston, Texas
December 21, 2023
We have served as the auditor of one or more of the investment companies in the Invesco group of investment companies since at least 1995. We have not been able to determine the specific year we began serving as auditor.
| | |
| 21 | | Invesco Diversified Dividend Fund |
Calculating your ongoing Fund expenses
Example
As a shareholder of the Fund, you incur two types of costs: (1) transaction costs, which may include sales charges (loads) on purchase payments or contingent deferred sales charges on redemptions, if any; and (2) ongoing costs, including management fees, distribution and/or service (12b-1) fees, and other Fund expenses. This example is intended to help you understand your ongoing costs (in dollars) of investing in the Fund and to compare these costs with ongoing costs of investing in other mutual funds. The example is based on an investment of $1,000 invested at the beginning of the period and held for the entire period May 1, 2023 through October 31, 2023.
Actual expenses
The table below provides information about actual account values and actual expenses. You may use the information in this table, together with the amount you invested, to estimate the expenses that you paid over the period. Simply divide your account value by $1,000 (for example, an $8,600 account value divided by $1,000 = 8.6), then multiply the result by the number in the table under the heading entitled “Actual Expenses Paid During Period” to estimate the expenses you paid on your account during this period.
Hypothetical example for comparison purposes
The table below also provides information about hypothetical account values and hypothetical expenses based on the Fund’s actual expense ratio and an assumed rate of return of 5% per year before expenses, which is not the Fund’s actual return.
The hypothetical account values and expenses may not be used to estimate the actual ending account balance or expenses you paid for the period. You may use this information to compare the ongoing costs of investing in the Fund and other funds. To do so, compare this 5% hypothetical example with the 5% hypothetical examples that appear in the shareholder reports of the other funds.
Please note that the expenses shown in the table are meant to highlight your ongoing costs only and do not reflect any transaction costs, such as sales charges (loads) on purchase payments or contingent deferred sales charges on redemptions, if any. Therefore, the hypothetical information is useful in comparing ongoing costs only, and will not help you determine the relative total costs of owning different funds. In addition, if these transaction costs were included, your costs would have been higher.
| | | | | | | | | | | | |
| | | | | ACTUAL | | HYPOTHETICAL
(5% annual return before expenses) | | |
| | | Beginning Account Value (05/01/23) | | Ending Account Value (10/31/23)1 | | Expenses Paid During Period2 | | Ending Account Value (10/31/23) | | Expenses Paid During Period2 | | Annualized Expense Ratio |
Class A | | $1,000.00 | | $946.70 | | $4.02 | | $1,021.07 | | $4.18 | | 0.82% |
Class C | | 1,000.00 | | 943.20 | | 7.69 | | 1,017.29 | | 7.98 | | 1.57 |
Class R | | 1,000.00 | | 945.30 | | 5.25 | | 1,019.81 | | 5.45 | | 1.07 |
Class Y | | 1,000.00 | | 948.00 | | 2.80 | | 1,022.33 | | 2.91 | | 0.57 |
Investor Class | | 1,000.00 | | 947.10 | | 3.53 | | 1,021.58 | | 3.67 | | 0.72 |
Class R5 | | 1,000.00 | | 948.00 | | 2.65 | | 1,022.48 | | 2.75 | | 0.54 |
Class R6 | | 1,000.00 | | 948.40 | | 2.31 | | 1,022.84 | | 2.40 | | 0.47 |
| 1 | The actual ending account value is based on the actual total return of the Fund for the period May 1, 2023 through October 31, 2023, after actual expenses and will differ from the hypothetical ending account value which is based on the Fund’s expense ratio and a hypothetical annual return of 5% before expenses. |
| 2 | Expenses are equal to the Fund’s annualized expense ratio as indicated above multiplied by the average account value over the period, multiplied by 184/365 to reflect the most recent fiscal half year. |
| | |
| 22 | | Invesco Diversified Dividend Fund |
Approval of Investment Advisory and Sub-Advisory Contracts
At meetings held on June 13, 2023, the Board of Trustees (the Board or the Trustees) of AIM Equity Funds (Invesco Equity Funds) as a whole, and the independent Trustees, who comprise over 75% of the Board, voting separately, approved the continuance of the Invesco Diversified Dividend Fund’s (the Fund) Master Investment Advisory Agreement with Invesco Advisers, Inc. (Invesco Advisers and the investment advisory agreement) and the Master Intergroup Sub-Advisory Contract for Mutual Funds with Invesco Asset Management Deutschland GmbH, Invesco Asset Management Limited, Invesco Asset Management (Japan) Limited, Invesco Hong Kong Limited, Invesco Senior Secured Management, Inc. and Invesco Canada Ltd. (collectively, the Affiliated Sub-Advisers and the sub-advisory contracts) for another year, effective July 1, 2023. After evaluating the factors discussed below, among others, the Board approved the renewal of the Fund’s investment advisory agreement and the sub-advisory contracts and determined that the compensation payable thereunder by the Fund to Invesco Advisers and by Invesco Advisers to the Affiliated Sub-Advisers is fair and reasonable.
The Board’s Evaluation Process
The Board has established an Investments Committee, which in turn has established Sub-Committees, that meet throughout the year to review the performance of funds advised by Invesco Advisers (the Invesco Funds). The Sub-Committees meet regularly with portfolio managers for their assigned Invesco Funds and other members of management to review information about investment performance and portfolio attributes of these funds. The Board has established additional standing and ad hoc committees that meet regularly throughout the year to review matters within their purview, including a working group focused on opportunities to make ongoing and continuous improvements to the annual review process for the Invesco Funds’ investment advisory and sub-advisory contracts. The Board took into account evaluations and reports that it received from its committees and sub-committees, as well as the information provided to the Board and its committees and sub-committees throughout the year, in considering whether to approve each Invesco Fund’s investment advisory agreement and sub-advisory contracts.
As part of the contract renewal process, the Board reviews and considers information provided in response to requests for information submitted to management by the independent Trustees with assistance from legal counsel to the independent Trustees and the Senior Officer, an officer of the Invesco Funds who reports directly to the independent Trustees. The Board receives comparative investment performance and fee and expense data regarding the Invesco Funds prepared by Broadridge Financial Solutions, Inc. (Broadridge), an independent mutual fund data provider, as well as information on the composition of the peer groups provided by Broadridge and its methodology for determining peer groups. The Board also receives an independent written evaluation from the Senior Officer. The Senior Officer’s evaluation is prepared as part of his responsibility to manage the process by which the Invesco Funds’ proposed management fees
are negotiated during the annual contract renewal process to ensure they are negotiated in a manner that is at arms’ length and reasonable in accordance with certain negotiated regulatory requirements. In addition to meetings with Invesco Advisers and fund counsel throughout the year and as part of meetings convened on May 2, 2023 and June 13, 2023, the independent Trustees also discussed the continuance of the investment advisory agreement and sub-advisory contracts in separate sessions with the Senior Officer and with independent legal counsel. Also, as part of the contract renewal process, the independent Trustees reviewed and considered information provided in response to follow-up requests for information submitted by the independent Trustees to management. The independent Trustees met and discussed those follow-up responses with legal counsel to the independent Trustees and the Senior Officer.
The discussion below is a summary of the Senior Officer’s independent written evaluation with respect to the Fund’s investment advisory agreement and sub-advisory contracts, as well as a discussion of the material factors and related conclusions that formed the basis for the Board’s approval of the Fund’s investment advisory agreement and sub-advisory contracts. The Trustees’ review and conclusions are based on the comprehensive consideration of all information presented to them during the course of the year and in prior years and are not the result of any single determinative factor. Moreover, one Trustee may have weighed a particular piece of information or factor differently than another Trustee. The information received and considered by the Board was current as of various dates prior to the Board’s approval on June 13, 2023.
Factors and Conclusions and Summary of Independent Written Fee Evaluation
| A. | Nature, Extent and Quality of Services Provided by Invesco Advisers and the Affiliated Sub-Advisers |
The Board reviewed the nature, extent and quality of the advisory services provided to the Fund by Invesco Advisers under the Fund’s investment advisory agreement, and the credentials and experience of the officers and employees of Invesco Advisers who provide these services, including the Fund’s portfolio manager(s). The Board considered recent senior management changes at Invesco and Invesco Advisers, including the appointment of new Co-Heads of Investments, that had been presented to and discussed with the Board. The Board’s review included consideration of Invesco Advisers’ investment process and oversight, credit analysis and research capabilities. The Board considered information regarding Invesco Advisers’ programs for and resources devoted to risk management, including management of investment, enterprise, operational, liquidity, derivatives, valuation and compliance risks, and technology used to manage such risks. The Board received information regarding Invesco’s methodology for compensating its investment professionals and the incentives and accountability it creates, as well as how it impacts Invesco’s ability to attract and retain talent. The Board received a description of, and reports related to, Invesco Advisers’ global security program and business continuity plans and of its approach to data privacy
and cybersecurity, including related testing. The Board also considered non-advisory services that Invesco Advisers and its affiliates provide to the Invesco Funds, such as various middle office and back office support functions, third party oversight, internal audit, valuation, portfolio trading and legal and compliance. The Board observed that Invesco Advisers’ systems preparedness and ongoing investment enabled Invesco Advisers to manage, operate and oversee the Invesco Funds with minimal impact or disruption through challenging environments. The Board reviewed and considered the benefits to shareholders of investing in a Fund that is part of the family of funds under the umbrella of Invesco Ltd., Invesco Advisers’ parent company, and noted Invesco Ltd.’s depth and experience in running an investment management business, as well as its commitment of financial and other resources to such business. The Board concluded that the nature, extent and quality of the services provided to the Fund by Invesco Advisers are appropriate and satisfactory.
The Board reviewed the services that may be provided to the Fund by the Affiliated Sub-Advisers under the sub-advisory contracts and the credentials and experience of the officers and employees of the Affiliated Sub-Advisers who provide these services. The Board noted the Affiliated Sub-Advisers’ expertise with respect to certain asset classes and that the Affiliated Sub-Advisers have offices and personnel that are located in financial centers around the world. As a result, the Board noted that the Affiliated Sub-Advisers can provide research and investment analysis on the markets and economies of various countries and territories in which the Fund may invest, make recommendations regarding securities and assist with portfolio trading. The Board concluded that the sub-advisory contracts may benefit the Fund and its shareholders by permitting Invesco Advisers to use the resources and talents of the Affiliated Sub-Advisers in managing the Fund. The Board concluded that the nature, extent and quality of the services that may be provided to the Fund by the Affiliated Sub-Advisers are appropriate and satisfactory.
| B. | Fund Investment Performance |
The Board considered Fund investment performance as a relevant factor in considering whether to approve the investment advisory agreement. The Board did not view Fund investment performance as a relevant factor in considering whether to approve the sub-advisory contracts for the Fund, as no Affiliated Sub-Adviser currently manages assets of the Fund.
The Board compared the Fund’s investment performance over multiple time periods ending December 31, 2022 to the performance of funds in the Broadridge performance universe and against Russell 1000® Value Index (Index). The Board noted that performance of Class A shares of the Fund was in the first quintile of its performance universe for the one year period, the fifth quintile for the three year period and the fourth quintile for the five year period (the first quintile being the best performing funds and the fifth quintile being the worst performing funds). The Board noted that performance of Class A shares of the Fund was above the performance of the Index for the one year period and below the performance of the Index for the three and five year periods. The
| | |
| 23 | | Invesco Diversified Dividend Fund |
Board acknowledged limitations regarding the Broadridge data, in particular that differences may exist between a Fund’s investment objective, principal investment strategies and/or investment restrictions and those of the funds in its performance universe. The Board considered that the Fund underwent a portfolio management team change and investment process change in March 2021, and that performance results prior to such date were those of the prior portfolio management team. The Board recognized that the performance data reflects a snapshot in time as of a particular date and that selecting a different performance period could produce different results. The Board also reviewed more recent Fund performance as well as other performance metrics, which did not change its conclusions.
| C. | Advisory and Sub-Advisory Fees and Fund Expenses |
The Board compared the Fund’s contractual management fee rate to the contractual management fee rates of funds in the Fund’s Broadridge expense group. The Board noted that the contractual management fee rate for Class A shares of the Fund was below the median contractual management fee rate of funds in its expense group. The Board noted that the term “contractual management fee” for funds in the expense group may include both advisory and certain non-portfolio management administrative services fees, but that Broadridge is not able to provide information on a fund-by-fund basis as to what is included. The Board also reviewed the methodology used by Broadridge in calculating expense group information, which includes using each fund’s contractual management fee schedule (including any applicable breakpoints) as reported in the most recent prospectus or statement of additional information for each fund in the expense group. The Board requested and considered additional information from management regarding the Fund’s actual management fees and the levels of the Fund’s breakpoints in light of current asset levels. The Board also considered comparative information regarding the Fund’s total expense ratio and its various components.
The Board noted that Invesco Advisers has contractually agreed to waive fees and/or limit expenses of the Fund for the term disclosed in the Fund’s registration statement in an amount necessary to limit total annual operating expenses to a specified percentage of average daily net assets for each class of the Fund.
The Board also considered the fees charged by Invesco Advisers and its affiliates to other client accounts that are similarly managed. Invesco Advisers reviewed with the Board differences in the scope of services it provides to the Invesco Funds relative to that provided by Invesco Advisers and its affiliates to certain other types of client accounts, including, among others: management of cash flows as a result of redemptions and purchases; necessary infrastructure such as officers, office space, technology, legal and distribution; oversight of service providers; costs and business risks associated with launching new funds and sponsoring and maintaining the product line; and compliance with federal and state laws and regulations. Invesco Advisers also advised the Board that many of the similarly managed client accounts have all-inclusive fee structures, which are not easily un-bundled.
The Board also compared the Fund’s effective advisory fee rate (defined for this purpose as the
advisory fee rate after advisory fee waivers and before other expense limitations/waivers) to the effective advisory fee rates of other similarly managed third-party mutual funds advised or sub-advised by Invesco Advisers and its affiliates, based on asset balances as of December 31, 2022.
The Board also considered the services that may be provided by the Affiliated Sub-Advisers pursuant to the sub-advisory contracts, as well as the fees payable by Invesco Advisers to the Affiliated Sub-Advisers pursuant to the sub-advisory contracts.
| D. | Economies of Scale and Breakpoints |
The Board considered the extent to which there may be economies of scale in the provision of advisory services to the Fund and the Invesco Funds, and the extent to which such economies of scale are shared with the Fund and the Invesco Funds. The Board acknowledged the difficulty in calculating and measuring economies of scale at the individual fund level; noting that only indicative and estimated measures are available at the individual fund level and that such measures are subject to uncertainty. The Board considered that the Fund benefits from economies of scale through contractual breakpoints in the Fund’s advisory fee schedule, which generally operate to reduce the Fund’s expense ratio as it grows in size. The Board considered information from Invesco Advisers regarding the levels of the Fund’s breakpoints in light of current assets. The Board noted that the Fund also shares in economies of scale through Invesco Advisers’ ability to negotiate lower fee arrangements with third party service providers. The Board noted that the Fund may also benefit from economies of scale through initial fee setting, fee waivers and expense reimbursements, as well as Invesco Advisers’ investment in its business, including investments in business infrastructure, technology and cybersecurity.
| E. | Profitability and Financial Resources |
The Board reviewed information from Invesco Advisers concerning the costs of the advisory and other services that Invesco Advisers and its affiliates provide to the Fund and the Invesco Funds and the profitability of Invesco Advisers and its affiliates in providing these services in the aggregate and on an individual fund-by-fund basis. The Board considered the methodology used for calculating profitability and the periodic review and enhancement of such methodology. The Board noted that Invesco Advisers continues to operate at a net profit from services Invesco Advisers and its affiliates provide to the Invesco Funds in the aggregate and to most Invesco Funds individually. The Board considered that profits to Invesco Advisers can vary significantly depending on the particular Invesco Fund, with some Invesco Funds showing indicative losses to Invesco Advisers and others showing indicative profits at healthy levels, and that Invesco Advisers’ support for and commitment to an Invesco Fund are not, however, solely dependent on the profits realized as to that Fund. The Board did not deem the level of profits realized by Invesco Advisers and its affiliates from providing such services to be excessive, given the nature, extent and quality of the services provided. The Board noted that Invesco Advisers provided information demonstrating that Invesco Advisers is financially sound and has the resources necessary to perform its obligations under the investment advisory agreement, and provided representations indicating that the Affiliated Sub-Advisers are financially sound and have the resources necessary to perform their obligations under the sub-advisory contracts. The
Board noted the cyclical and competitive nature of the global asset management industry.
| F. | Collateral Benefits to Invesco Advisers and its Affiliates |
The Board considered various other benefits received by Invesco Advisers and its affiliates from the relationship with the Fund, including the fees received for providing administrative, transfer agency and distribution services to the Fund. The Board received comparative information regarding fees charged for these services, including information provided by Broadridge and other independent sources. The Board reviewed the performance of Invesco Advisers and its affiliates in providing these services and the organizational structure employed to provide these services. The Board noted that these services are provided to the Fund pursuant to written contracts that are reviewed and subject to approval on an annual basis by the Board based on its determination that the services are required for the operation of the Fund.
The Board considered the benefits realized by Invesco Advisers and the Affiliated Sub-Advisers as a result of portfolio brokerage transactions executed through “soft dollar” arrangements. The Board noted that soft dollar arrangements may result in the Fund bearing costs to purchase research that may be used by Invesco Advisers or the Affiliated Sub-Advisers with other clients and may reduce Invesco Advisers’ or the Affiliated Sub-Advisers’ expenses. The Board also considered that it receives from Invesco Advisers periodic reports that include a representation to the effect that these arrangements are consistent with regulatory requirements. The Board did not deem the soft dollar arrangements to be inappropriate.
The Board considered that the Fund’s uninvested cash and cash collateral from any securities lending arrangements may be invested in registered money market funds or, with regard to securities lending cash collateral, unregistered funds that comply with Rule 2a-7 (collectively referred to as “affiliated money market funds”) advised by Invesco Advisers. The Board considered information regarding the returns of the affiliated money market funds relative to comparable overnight investments, as well as the fees paid by the affiliated money market funds to Invesco Advisers and its affiliates. In this regard, the Board noted that Invesco Advisers receives advisory fees from these affiliated money market funds attributable to the Fund’s investments. The Board also noted that Invesco Advisers has contractually agreed to waive through varying periods an amount equal to 100% of the net advisory fee Invesco Advisers receives from the affiliated money market funds with respect to the Fund’s investment in the affiliated money market funds of uninvested cash, but not cash collateral. The Board concluded that the advisory fees payable to Invesco Advisers from the Fund’s investment of cash collateral from any securities lending arrangements in the affiliated money market funds are for services that are not duplicative of services provided by Invesco Advisers to the Fund.
The Board considered that Invesco Advisers may serve as the Fund’s affiliated securities lending agent and evaluated the benefits realized by Invesco Advisers when serving in such role, including the compensation received. The Board considered Invesco Advisers’ securities lending platform and corporate governance structure for securities lending, including Invesco Advisers’ Securities Lending Governance Committee and its related
| | |
| 24 | | Invesco Diversified Dividend Fund |
responsibilities. The Board noted that to the extent the Fund utilizes Invesco Advisers as an affiliated securities lending agent, the Fund conducts its securities lending in accordance with, and in reliance upon, no-action letters issued by the SEC staff that provide guidance on how an affiliate may act as a direct agent lender and receive compensation for those services without obtaining exemptive relief. The Board considered information provided by Invesco Advisers related to the performance of Invesco Advisers as securities lending agent, including a summary of the securities lending services provided to the Fund by Invesco Advisers and the compensation paid to Invesco Advisers for such services, as well as any revenues generated for the Fund in connection with such securities lending activity and the allocation of such revenue between the Fund and Invesco Advisers.
The Board also received information about commissions that an affiliated broker may receive for executing certain trades for the Fund. Invesco Advisers and the Affiliated Sub-Advisers advised the Board of the benefits to the Fund of executing trades through the affiliated broker and that such trades were executed in compliance with rules under the federal securities laws and consistent with best execution obligations.
| | |
| 25 | | Invesco Diversified Dividend Fund |
Tax Information
Form 1099-DIV, Form 1042-S and other year–end tax information provide shareholders with actual calendar year amounts that should be included in their tax returns. Shareholders should consult their tax advisers.
The following distribution information is being provided as required by the Internal Revenue Code or to meet a specific state’s requirement.
The Fund designates the following amounts or, if subsequently determined to be different, the maximum amount allowable for its fiscal year ended October 31, 2023:
| | | | | | | | |
Federal and State Income Tax | | | | | | |
Long-Term Capital Gain Distributions | | | $1,200,072,795 | | | | | |
Qualified Dividend Income* | | | 100.00 | % | | | | |
Corporate Dividends Received Deduction* | | | 100.00 | % | | | | |
U.S. Treasury Obligations* | | | 0.00 | % | | | | |
Qualified Business Income* | | | 0.00 | % | | | | |
Business Interest Income* | | | 0.00 | % | | | | |
|
| * The above percentages are based on ordinary income dividends paid to shareholders during the Fund’s fiscal year. | |
| | |
| 26 | | Invesco Diversified Dividend Fund |
Trustees and Officers
The address of each trustee and officer is AIM Equity Funds (Invesco Equity Funds) (the “Trust”), 11 Greenway Plaza, Houston, Texas 77046-1173. The trustees serve for the life of the Trust, subject to their earlier death, incapacitation, resignation, retirement or removal as more specifically provided in the Trust’s organizational documents. Each officer serves for a one year term or until their successors are elected and qualified. Column two below includes length of time served with predecessor entities, if any.
| | | | | | | | |
Name, Year of Birth and Position(s) Held with the Trust | | Trustee and/or Officer Since | | Principal Occupation(s) During Past 5 Years | | Number of Funds in Fund Complex Overseen by Trustee | | Other Directorship(s) Held by Trustee During Past 5 Years |
| Interested Trustee | | | | | | | | |
Martin L. Flanagan1 - 1960 Trustee and Vice Chair | | 2007 | | Chairman Emeritus, Invesco Ltd.; Trustee and Vice Chair, The Invesco Funds; and Member of Executive Board, SMU Cox School of Business Formerly: Executive Director, Chief Executive Officer and President, Invesco Ltd. (ultimate parent of Invesco and a global investment management firm); Vice Chair, Investment Company Institute; Advisor to the Board, Invesco Advisers, Inc. (formerly known as Invesco Institutional (N.A.), Inc.); Chairman and Chief Executive Officer, Invesco Advisers, Inc. (registered investment adviser); Director, Chairman, Chief Executive Officer and President, Invesco Holding Company Limited (parent of Invesco and a global investment management firm); Director, Invesco Ltd.; Chairman, Investment Company Institute and President, Co-Chief Executive Officer, Co-President, Chief Operating Officer and Chief Financial Officer, Franklin Resources, Inc. (global investment management organization) | | 169 | | None |
| 1 | Mr. Flanagan is considered an interested person (within the meaning of Section 2(a)(19) of the 1940 Act) of the Trust because he is an officer of the Adviser to the Trust, and an officer and a director of Invesco Ltd., ultimate parent of the Adviser. |
| | |
| T-1 | | Invesco Diversified Dividend Fund |
Trustees and Officers–(continued)
| | | | | | | | |
Name, Year of Birth and Position(s) Held with the Trust | | Trustee and/or Officer Since | | Principal Occupation(s) During Past 5 Years | | Number of Funds in Fund Complex Overseen by Trustee | | Other Directorship(s) Held by Trustee During Past 5 Years |
| Independent Trustees | | | | | | | | |
Beth Ann Brown - 1968 Trustee (2019) and Chair (August 2022) | | 2019 | | Independent Consultant Formerly: Head of Intermediary Distribution, Managing Director, Strategic Relations, Managing Director, Head of National Accounts, Senior Vice President, National Account Manager and Senior Vice President, Key Account Manager, Columbia Management Investment Advisers LLC; Vice President, Key Account Manager, Liberty Funds Distributor, Inc.; and Trustee of certain Oppenheimer Funds | | 169 | | Director, Board of Directors of Caron Engineering Inc.; Advisor, Board of Advisors of Caron Engineering Inc.; President and Director, Acton Shapleigh Youth Conservation Corps (non-profit) Formerly: President and Director Director of Grahamtastic Connection (non-profit) |
Cynthia Hostetler - 1962 Trustee | | 2017 | | Non-Executive Director and Trustee of a number of public and private business corporations Formerly: Director, Aberdeen Investment Funds (4 portfolios); Director, Artio Global Investment LLC (mutual fund complex); Director, Edgen Group, Inc. (specialized energy and infrastructure products distributor); Director, Genesee & Wyoming, Inc. (railroads); Head of Investment Funds and Private Equity, Overseas Private Investment Corporation; President, First Manhattan Bancorporation, Inc.; and Attorney, Simpson Thacher & Bartlett LLP | | 169 | | Resideo Technologies, Inc. (smart home technology); Vulcan Materials Company (construction materials company); Trilinc Global Impact Fund; Textainer Group Holdings, (shipping container leasing company); Investment Company Institute (professional organization); and Independent Directors Council (professional organization) |
Eli Jones - 1961 Trustee | | 2016 | | Professor and Dean Emeritus, Mays Business School - Texas A&M University Formerly: Dean of Mays Business School-Texas A&M University; Professor and Dean, Walton College of Business, University of Arkansas and E.J. Ourso College of Business, Louisiana State University; and Director, Arvest Bank | | 169 | | Insperity, Inc. (formerly known as Administaff) (human resources provider); Board Member of the regional board, First Financial Bank Texas; and Board Member, First Financial Bankshares, Inc. Texas |
Elizabeth Krentzman - 1959 Trustee | | 2019 | | Formerly: Principal and Chief Regulatory Advisor for Asset Management Services and U.S. Mutual Fund Leader of Deloitte & Touche LLP; General Counsel of the Investment Company Institute (trade association); National Director of the Investment Management Regulatory Consulting Practice, Principal, Director and Senior Manager of Deloitte & Touche LLP; Assistant Director of the Division of Investment Management - Office of Disclosure and Investment Adviser Regulation of the U.S. Securities and Exchange Commission and various positions with the Division of Investment Management - Office of Regulatory Policy of the U.S. Securities and Exchange Commission; Associate at Ropes & Gray LLP; and Trustee of certain Oppenheimer Funds | | 169 | | Formerly: Member of the Cartica Funds Board of Directors (private investment fund); Trustee of the University of Florida National Board Foundation; and Member of the University of Florida Law Center Association, Inc. Board of Trustees, Audit Committee and Membership Committee |
Anthony J. LaCava, Jr. - 1956 Trustee | | 2019 | | Formerly: Director and Member of the Audit Committee, Blue Hills Bank (publicly traded financial institution) and Managing Partner, KPMG LLP | | 169 | | Blue Hills Bank; Member and Chairman, Bentley University, Business School Advisory Council; and Nominating Committee, KPMG LLP |
Prema Mathai-Davis - 1950 Trustee | | 1998 | | Retired Formerly: Co-Founder & Partner of Quantalytics Research, LLC, (a FinTech Investment Research Platform for the Self-Directed Investor); Trustee of YWCA Retirement Fund; CEO of YWCA of the USA; Board member of the NY Metropolitan Transportation Authority; Commissioner of the NYC Department of Aging; and Board member of Johns Hopkins Bioethics Institute | | 169 | | Member of Board of Positive Planet US (non-profit) and HealthCare Chaplaincy Network (non-profit) |
| | |
| T-2 | | Invesco Diversified Dividend Fund |
Trustees and Officers–(continued)
| | | | | | | | |
Name, Year of Birth and Position(s) Held with the Trust | | Trustee and/or Officer Since | | Principal Occupation(s) During Past 5 Years | | Number of Funds in Fund Complex Overseen by Trustee | | Other Directorship(s) Held by Trustee During Past 5 Years |
| Independent Trustees–(continued) | | | | | | |
Joel W. Motley - 1952 Trustee | | 2019 | | Director of Office of Finance, Federal Home Loan Bank System; Managing Director of Carmona Motley Inc. (privately held financial advisor); Member of the Council on Foreign Relations and its Finance and Budget Committee; Chairman Emeritus of Board of Human Rights Watch and Member of its Investment Committee; and Member of Investment Committee Board of Historic Hudson Valley (non-profit cultural organization); Member of the Board, Blue Ocean Acquisition Corp.; and Member of the Vestry and the Investment Committee of Trinity Church Wall Street. Formerly: Managing Director of Public Capital Advisors, LLC (privately held financial advisor); Managing Director of Carmona Motley Hoffman, Inc. (privately held financial advisor); Trustee of certain Oppenheimer Funds; and Director of Columbia Equity Financial Corp. (privately held financial advisor) | | 169 | | Member of Board of Trust for Mutual Understanding (non-profit promoting the arts and environment); Member of Board of Greenwall Foundation (bioethics research foundation) and its Investment Committee; Member of Board of Friends of the LRC (non-profit legal advocacy); and Board Member and Investment Committee Member of Pulitzer Center for Crisis Reporting (non-profit journalism) |
Teresa M. Ressel - 1962 Trustee | | 2017 | | Non-executive director and trustee of a number of public and private business corporations Formerly: Chief Executive Officer, UBS Securities LLC (investment banking); Chief Operating Officer, UBS AG Americas (investment banking); Sr. Management Team Olayan America, The Olayan Group (international investor/commercial/industrial); and Assistant Secretary for Management & Budget and Designated Chief Financial Officer, U.S. Department of Treasury | | 169 | | None |
Robert C. Troccoli - 1949 Trustee | | 2016 | | Retired Formerly: Adjunct Professor, University of Denver - Daniels College of Business; and Managing Partner, KPMG LLP | | 169 | | None |
Daniel S. Vandivort - 1954 Trustee | | 2019 | | President, Flyway Advisory Services LLC (consulting and property management) Formerly: President and Chief Investment Officer, previously Head of Fixed Income, Weiss Peck and Greer/Robeco Investment Management; Trustee and Chair, Weiss Peck and Greer Funds Board; and various capacities at CS First Boston including Head of Fixed Income at First Boston Asset Management. | | 169 | | Formerly: Trustee and Governance Chair, Oppenheimer Funds; Treasurer, Chairman of the Audit and Finance Committee, Huntington Disease Foundation of America |
| | |
| T-3 | | Invesco Diversified Dividend Fund |
Trustees and Officers–(continued)
| | | | | | | | |
Name, Year of Birth and Position(s) Held with the Trust | | Trustee and/or Officer Since | | Principal Occupation(s) During Past 5 Years | | Number of Funds in Fund Complex Overseen by Trustee | | Other Directorship(s) Held by Trustee During Past 5 Years |
| Officers | | | | | | | | |
Glenn Brightman - 1972 President and Principal Executive Officer | | 2023 | | Chief Operating Officer, Americas, Invesco Ltd.; President and Principal Executive Officer, The Invesco Funds. Formerly: Global Head of Finance, Invesco Ltd; Executive Vice President and Chief Financial Officer, Nuveen | | N/A | | N/A |
Melanie Ringold - 1975 Senior Vice President, Chief Legal Officer and Secretary | | 2023 | | Head of Legal of the Americas, Invesco Ltd.; Senior Vice President and Secretary, Invesco Advisers, Inc. (formerly known as Invesco Institutional (N.A.), Inc.) (registered investment adviser); Secretary, Invesco Distributors, Inc. (formerly known as Invesco AIM Distributors, Inc.); Secretary, Invesco Investment Services, Inc. (formerly known as Invesco AIM Investment Services, Inc.); Senior Vice President, Chief Legal Officer and Secretary, The Invesco Funds; Secretary, Invesco Investment Advisers LLC, Invesco Capital Markets, Inc.; Chief Legal Officer, Invesco Exchange-Traded Fund Trust, Invesco Exchange-Traded Fund Trust II, Invesco India Exchange-Traded Fund Trust, Invesco Actively Managed Exchange-Traded Fund Trust, Invesco Actively Secretary and Vice President, Harbourview Asset Management Corporation; Secretary and Senior Vice President, OppenheimerFunds, Inc. and Invesco Managed Accounts, LLC; Secretary and Senior Vice President, OFI SteelPath, Inc.; Secretary and Senior Vice President, Oppenheimer Acquisition Corp.; Secretary, SteelPath Funds Remediation LLC; and Secretary and Senior Vice President, Trinity Investment Management Corporation Formerly: Assistant Secretary, Invesco Distributors, Inc., Invesco Advisers, Inc., Invesco Investment Services, Inc., Invesco Capital Markets, Inc., Invesco Capital Management LLC and Invesco Investment Advisers LLC; and Assistant Secretary and Investment Vice President, Invesco Funds | | N/A | | N/A |
Andrew R. Schlossberg - 1974 Senior Vice President | | 2019 | | Chief Executive Officer, President and Executive Director, Invesco Ltd.; Senior Vice President, Invesco Group Services, Inc.; Director and Senior Vice President, Invesco Advisers, Inc. (formerly known as Invesco Institutional (N.A.), Inc.) (registered investment adviser); Director and Chairman, Invesco Investment Services, Inc. (formerly known as Invesco AIM Investment Services, Inc.) (registered transfer agent); Senior Vice President, The Invesco Funds and Trustee, Invesco Foundation, Inc. Formerly: Head of the Americas and Senior Managing Director, Invesco Ltd.; Director, Invesco Investment Advisers LLC (formerly known as Van Kampen Asset Management); Director, President and Chairman, Invesco Insurance Agency, Inc.; Director, Invesco UK Limited; Director and Chief Executive, Invesco Asset Management Limited and Invesco Fund Managers Limited; Assistant Vice President, The Invesco Funds; Senior Vice President, Invesco Advisers, Inc. (formerly known as Invesco Institutional (N.A.), Inc.) (registered investment adviser); Director and Chief Executive, Invesco Administration Services Limited and Invesco Global Investment Funds Limited; Director, Invesco Distributors, Inc.; Head of EMEA, Invesco Ltd.; President, Invesco Actively Managed Exchange-Traded Commodity Fund Trust, Invesco Actively Managed Exchange-Traded Fund Trust, Invesco Exchange-Traded Fund Trust, Invesco Exchange-Traded Fund Trust II and Invesco India Exchange-Traded Fund Trust; and Managing Director and Principal Executive Officer, Invesco Capital Management LLC | | N/A | | N/A |
| | |
| T-4 | | Invesco Diversified Dividend Fund |
Trustees and Officers–(continued)
| | | | | | | | |
Name, Year of Birth and Position(s) Held with the Trust | | Trustee and/or Officer Since | | Principal Occupation(s) During Past 5 Years | | Number of Funds in Fund Complex Overseen by Trustee | | Other Directorship(s) Held by Trustee During Past 5 Years |
| Officers–(continued) | | | | | | | | |
John M. Zerr - 1962 Senior Vice President | | 2006 | | Chief Operating Officer of the Americas; Senior Vice President, Invesco Advisers, Inc. (formerly known as Invesco Institutional (N.A.), Inc.) (registered investment adviser); Senior Vice President, Invesco Distributors, Inc. (formerly known as Invesco AIM Distributors, Inc.); Director and Vice President, Invesco Investment Services, Inc. (formerly known as Invesco AIM Investment Services, Inc.) Senior Vice President, The Invesco Funds; Managing Director, Invesco Capital Management LLC; Senior Vice President, Invesco Capital Markets, Inc. (formerly known as Van Kampen Funds Inc.); Manager, Invesco Indexing LLC; Manager, Invesco Specialized Products, LLC; Member, Invesco Canada Funds Advisory Board; Director, President and Chief Executive Officer, Invesco Corporate Class Inc. (corporate mutual fund company); Director, Chairman, President and Chief Executive Officer, Invesco Canada Ltd. (formerly known as Invesco Trimark Ltd./Invesco Trimark Ltèe) (registered investment adviser and registered transfer agent); President, Invesco, Inc.; President, Invesco Global Direct Real Estate Feeder GP Ltd.; President, Invesco IP Holdings (Canada) Ltd; President, Invesco Global Direct Real Estate GP Ltd.; President, Invesco Financial Services Ltd. / Services Financiers Invesco Ltée; and Director and Chairman, Invesco Trust Company Formerly: Director, Invesco Investment Advisers LLC (formerly known as Van Kampen Asset Management); President, Trimark Investments Ltd/Services Financiers Invesco Ltee; Director and Senior Vice President, Invesco Insurance Agency, Inc.; Director and Senior Vice President, Invesco Management Group, Inc. (formerly known as Invesco AIM Management Group, Inc.); Secretary and General Counsel, Invesco Management Group, Inc. (formerly known as Invesco AIM Management Group, Inc.); Secretary, Invesco Investment Services, Inc. (formerly known as Invesco AIM Investment Services, Inc.); Chief Legal Officer and Secretary, The Invesco Funds; Secretary and General Counsel, Invesco Investment Advisers LLC (formerly known as Van Kampen Asset Management); Secretary and General Counsel, Invesco Capital Markets, Inc. (formerly known as Van Kampen Funds Inc.); Chief Legal Officer, Invesco Exchange-Traded Fund Trust, Invesco Exchange-Traded Fund Trust II, Invesco India Exchange-Traded Fund Trust, Invesco Actively Managed Exchange-Traded Fund Trust, Invesco Actively Managed Exchange-Traded Commodity Fund Trust and Invesco Exchange-Traded Self-Indexed Fund Trust; Secretary, Invesco Indexing LLC; Director, Secretary, General Counsel and Senior Vice President, Van Kampen Exchange Corp.; Director, Vice President and Secretary, IVZ Distributors, Inc. (formerly known as INVESCO Distributors, Inc.); Director and Vice President, INVESCO Funds Group, Inc.; Director and Vice President, Van Kampen Advisors Inc.; Director, Vice President, Secretary and General Counsel, Van Kampen Investor Services Inc.; Director and Secretary, Invesco Distributors, Inc. (formerly known as Invesco AIM Distributors, Inc.); Director, Senior Vice President, General Counsel and Secretary, Invesco AIM Advisers, Inc. and Van Kampen Investments Inc.; Director, Vice President and Secretary, Fund Management Company; Director, Senior Vice President, Secretary, General Counsel and Vice President, Invesco AIM Capital Management, Inc.; and Chief Operating Officer and General Counsel, Liberty Ridge Capital, Inc. (an investment adviser) | | N/A | | N/A |
Tony Wong - 1973 Senior Vice President | | 2023 | | Senior Managing Director, Invesco Ltd.; Director, Chairman, Chief Executive Officer and President, Invesco Advisers, Inc.; Director and Chairman, Invesco Private Capital, Inc., INVESCO Private Capital Investments, Inc. and INVESCO Realty, Inc.; Director, Invesco Senior Secured Management, Inc.; President, Invesco Managed Accounts, LLC and SNW Asset Management Corporation; and Senior Vice President, The Invesco Funds Formerly: Assistant Vice President, The Invesco Funds; and Vice President, Invesco Advisers, Inc. | | N/A | | N/A |
Stephanie C. Butcher - 1971 Senior Vice President | | 2023 | | Senior Managing Director, Invesco Ltd.; Senior Vice President, The Invesco Funds; Director and Chief Executive Officer, Invesco Asset Management Limited | | N/A | | N/A |
Adrien Deberghes - 1967 Principal Financial Officer, Treasurer and Senior Vice President | | 2020 | | Head of the Fund Office of the CFO and Fund Administration; Vice President, Invesco Advisers, Inc.; Principal Financial Officer, Treasurer and Senior Vice President, The Invesco Funds; Vice President, Invesco Exchange-Traded Fund Trust, Invesco Exchange-Traded Fund Trust II, Invesco India Exchange-Traded Fund Trust, Invesco Actively Managed Exchange-Traded Fund Trust, Invesco Actively Managed Exchange-Traded Commodity Fund Trust and Invesco Exchange-Traded Self-Indexed Fund Trust Formerly: Vice President, The Invesco Funds; Senior Vice President and Treasurer, Fidelity Investments | | N/A | | N/A |
Crissie M. Wisdom - 1969 Anti-Money Laundering Compliance Officer | | 2013 | | Anti-Money Laundering and OFAC Compliance Officer for Invesco U.S. entities including: Invesco Advisers, Inc. and its affiliates, Invesco Capital Markets, Inc., Invesco Distributors, Inc., Invesco Investment Services, Inc., The Invesco Funds, Invesco Capital Management, LLC, Invesco Trust Company; and Fraud Prevention Manager for Invesco Investment Services, Inc. | | N/A | | N/A |
| | |
| T-5 | | Invesco Diversified Dividend Fund |
Trustees and Officers–(continued)
| | | | | | | | |
Name, Year of Birth and Position(s) Held with the Trust | | Trustee and/or Officer Since | | Principal Occupation(s) During Past 5 Years | | Number of Funds in Fund Complex Overseen by Trustee | | Other Directorship(s) Held by Trustee During Past 5 Years |
| Officers–(continued) | | | | | | | | |
Todd F. Kuehl - 1969 Chief Compliance Officer and Senior Vice President | | 2020 | | Chief Compliance Officer, Invesco Advisers, Inc. (registered investment adviser); and Chief Compliance Officer and Senior Vice President, The Invesco Funds Formerly: Managing Director and Chief Compliance Officer, Legg Mason (Mutual Funds); Chief Compliance Officer, Legg Mason Private Portfolio Group (registered investment adviser) | | N/A | | N/A |
James Bordewick, Jr. - 1959 Senior Vice President and Senior Officer | | 2022 | | Senior Vice President and Senior Officer, The Invesco Funds Formerly: Chief Legal Officer, KingsCrowd, Inc. (research and analytical platform for investment in private capital markets); Chief Operating Officer and Head of Legal and Regulatory, Netcapital (private capital investment platform); Managing Director, General Counsel of asset management and Chief Compliance Officer for asset management and private banking, Bank of America Corporation; Chief Legal Officer, Columbia Funds and BofA Funds; Senior Vice President and Associate General Counsel, MFS Investment Management; Chief Legal Officer, MFS Funds; Associate, Ropes & Gray; and Associate, Gaston Snow & Ely Bartlett | | N/A | | N/A |
The Statement of Additional Information of the Trust includes additional information about the Fund’s Trustees and is available upon request, without charge, by calling 1.800.959.4246. Please refer to the Fund’s Statement of Additional Information for information on the Fund’s sub-advisers.
| | | | | | |
| Office of the Fund | | Investment Adviser | | Distributor | | Auditors |
| 11 Greenway Plaza | | Invesco Advisers, Inc. | | Invesco Distributors, Inc. | | PricewaterhouseCoopers LLP |
| Houston, TX 77046-1173 | | 1331 Spring Street, NW, Suite 2500 | | 11 Greenway Plaza | | 1000 Louisiana Street, Suite 5800 |
| | Atlanta, GA 30309 | | Houston, TX 77046-1173 | | Houston, TX 77002-5021 |
| | | |
| Counsel to the Fund | | Counsel to the Independent Trustees | | Transfer Agent | | Custodian |
| Stradley Ronon Stevens & Young, LLP | | Sidley Austin LLP | | Invesco Investment Services, Inc. | | State Street Bank and Trust Company |
| 2005 Market Street, Suite 2600 | | 787 Seventh Avenue | | 11 Greenway Plaza | | 225 Franklin Street |
| Philadelphia, PA 19103-7018 | | New York, NY 10019 | | Houston, TX 77046-1173 | | Boston, MA 02110-2801 |
| | |
| T-6 | | Invesco Diversified Dividend Fund |
(This page intentionally left blank)
(This page intentionally left blank)
(This page intentionally left blank)

Go paperless with eDelivery
Visit invesco.com/edelivery to enjoy the convenience and security of anytime electronic access to your investment documents.
With eDelivery, you can elect to have any or all of the following materials delivered straight to your inbox to download, save and print from your own computer:
∎ Fund reports and prospectuses
∎ Quarterly statements
∎ Daily confirmations
∎ Tax forms
Invesco mailing information
Send general correspondence to Invesco Investment Services, Inc., P.O. Box 219078, Kansas City, MO 64121-9078.
Important notice regarding delivery of security holder documents
To reduce Fund expenses, only one copy of most shareholder documents may be mailed to shareholders with multiple accounts at the same address (Householding). Mailing of your shareholder documents may be householded indefinitely unless you instruct us otherwise. If you do not want the mailing of these documents to be combined with those for other members of your household, please contact Invesco Investment Services, Inc. at 800 959 4246 or contact your financial institution. We will begin sending you individual copies for each account within 30 days after receiving your request.
Fund holdings and proxy voting information
The Fund provides a complete list of its portfolio holdings four times each year, at the end of each fiscal quarter. For the second and fourth quarters, the list appears, respectively, in the Fund’s semiannual and annual reports to shareholders. For the first and third quarters, the Fund files the list with the Securities and Exchange Commission (SEC) as an exhibit to its reports on Form N-PORT. The most recent list of portfolio holdings is available at invesco.com/completeqtrholdings. Shareholders can also look up the Fund’s Form N-PORT filings on the SEC website, sec.gov. The SEC file numbers for the Fund are shown below.
A description of the policies and procedures that the Fund uses to determine how to vote proxies relating to portfolio securities is available without charge, upon request, from our Client Services department at 800 959 4246, or at invesco.com/ corporate/about-us/esg. The information is also available on the SEC website, sec.gov.
Information regarding how the Fund voted proxies related to its portfolio securities during the most recent 12-month period ended June 30 is available at invesco.com/proxysearch. This information is also available on the SEC website, sec.gov.
Invesco Advisers, Inc. is an investment adviser; it provides investment advisory services to individual and institutional clients and does not sell securities. Invesco Distributors, Inc. is the US distributor for Invesco Ltd.’s retail mutual funds, exchange-traded funds and institutional money market funds. Both are wholly owned, indirect subsidiaries of Invesco Ltd.
| | | | |
| SEC file number(s): 811-01424 and 002-25469 | | Invesco Distributors, Inc. | | DDI-AR-1 |

| | |
| | |
| Annual Report to Shareholders | | October 31, 2023 |
Invesco Main Street Fund®
Nasdaq:
A: MSIGX ∎ C: MIGCX ∎ R: OMGNX ∎ Y: MIGYX ∎ R5: MSJFX ∎ R6: OMSIX
Management’s Discussion of Fund Performance
| | | | |
| |
Performance summary | |
For the fiscal year ended October 31, 2023, Class A shares of Invesco Main Street Fund® (the Fund), at net asset value (NAV), underperformed the S&P 500 Index. | |
Your Fund’s long-term performance appears later in this report. | |
| |
Fund vs. Indexes | |
Total returns, 10/31/22 to 10/31/23, at net asset value (NAV). Performance shown does not include applicable contingent deferred sales charges (CDSC) or front-end sales charges, which would have reduced performance. | |
Class A Shares | | | 8.95 | % |
Class C Shares | | | 8.11 | |
Class R Shares | | | 8.63 | |
Class Y Shares | | | 9.20 | |
Class R5 Shares | | | 9.28 | |
Class R6 Shares | | | 9.26 | |
S&P 500 Index▼ | | | 10.14 | |
| |
Source(s): ▼RIMES Technologies Corp. | | | | |
Market conditions and your Fund
Despite various domestic and global headwinds during the fiscal year ended October 31, 2023, the overall US economy proved to be resilient. The US labor market remained tight with unemployment near historic lows while consumers continued to spend, complicating the US Federal Reserve’s (the Fed’s) efforts to tame inflation which had reached multi-decade highs. The Fed tightened monetary policy over the fiscal year, with multiple increases in its target rate during the fiscal year, before taking a long-awaited “pause” in June. Inflation has trended lower over the fiscal year but has stayed above the Fed’s 2% target. The Fed held interest rates steady at its September and October 2023 meetings but signaled that interest rates could stay elevated for an extended length of time if inflation remains stubborn. COVID-19 lockdowns and related supply chain disruptions have moderated, although an uncertain global backdrop threatens to act as a headwind to the US economy. While risks remain, gross domestic product growth in the US has been above expectations and the much-anticipated recession has not yet arrived.
Amid this backdrop, US equity markets delivered a positive return during the fiscal year but were volatile and reactionary to inflation indicators and policy moves by the Fed. Large technology companies were among the leaders in US equities and buoyed the overall market, while smaller cap equities notably lagged. A banking crisis in March 2023 that saw the failure of US regional banks caused significant turmoil but Fed actions to stabilize the banking system sent markets higher and investors appeared to move on by April, supported by better-than-expected corporate earnings. Whether the economy eventually enters a recession remains an open question, but investors remain keenly focused on whether tight monetary conditions will sufficiently lower inflation without imperiling the forward outlook.
During the fiscal year, stock selections in the information technology and industrials sectors were the largest detractors to the Fund’s performance relative to the S&P 500 Index. This was offset by stronger stock selections in the health care and communication services sectors.
The largest individual contributors to the Fund’s performance relative to the S&P 500 Index during the fiscal year included Meta Platforms, Advanced Micro Devices (AMD) and Netflix. Meta Platforms outperformed as it returned to revenue growth and benefited from steps taken to optimize its cost structure and improve execution. AMD reported strong results, with guidance indicating a reacceleration of data center demand in the second half of 2023. Netflix has seen improved investor sentiment about its revenue and subscriber growth prospects, supported by measures to reduce account sharing and introducing advertising. AMD was not held at fiscal year-end.
The largest individual detractors to the Fund’s relative performance during the fiscal year included Charles Schwab, Dominion Energy and United Parcel Service (UPS). Charles Schwab was negatively affected by the banking crises and was heavily scrutinized for unrealized losses in its securities portfolio. Dominion Energy was challenged along with broader utilities sector, adding to investor pessimism around Dominion’s strategy and asset sales. UPS was impacted by underwhelming earnings including demand weakness in Asia as well as investor uncertainty around its labor force contract negotiations. An underweight to NVIDIA also detracted from relative returns.
We maintain our valuation discipline and our focus on companies with competitive advantages and skilled management teams that we believe are executing better than their peers. These companies historically tend to have higher profit margins and returns on invested capital, rising market shares and consistently strong pricing power. We believe
this disciplined approach is essential to generating attractive long-term performance.
We thank you for your continued investment in Invesco Main Street Fund®.
Portfolio manager(s):
Manind Govil - Lead
Benjamin Ram
The views and opinions expressed in management’s discussion of Fund performance are those of Invesco Advisers, Inc. and its affiliates. These views and opinions are subject to change at any time based on factors such as market and economic conditions. These views and opinions may not be relied upon as investment advice or recommendations, or as an offer for a particular security. The information is not a complete analysis of every aspect of any market, country, industry, security or the Fund. Statements of fact are from sources considered reliable, but Invesco Advisers, Inc. makes no representation or warranty as to their completeness or accuracy. Although historical performance is no guarantee of future results, these insights may help you understand our investment management philosophy.
See important Fund and, if applicable, index disclosures later in this report.
| | |
| 2 | | Invesco Main Street Fund® |
Your Fund’s Long-Term Performance
Results of a $10,000 Investment – Oldest Share Class(es)
Fund and index data from 10/31/13
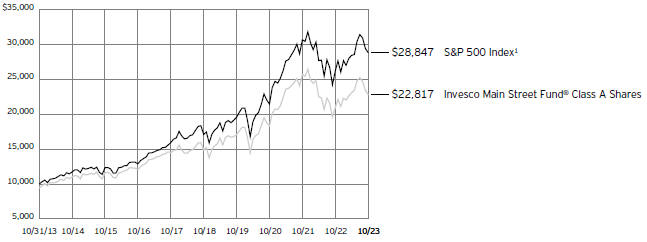
1 Source: RIMES Technologies Corp.
Past performance cannot guarantee future results.
The data shown in the chart include reinvested distributions, applicable sales charges and Fund expenses including management
fees. Index results include reinvested dividends, but they do not reflect sales charges. Performance of the peer group, if applicable, reflects fund expenses and management fees;
performance of a market index does not. Performance shown in the chart does not reflect deduction of taxes a shareholder would pay on Fund distributions or sale of Fund shares.
| | |
| 3 | | Invesco Main Street Fund® |
| | | | |
| |
Average Annual Total Returns | |
As of 10/31/23, including maximum applicable sales charges | |
| |
Class A Shares | | | | |
Inception (2/3/88) | | | 10.56 | % |
10 Years | | | 8.60 | |
5 Years | | | 7.67 | |
1 Year | | | 2.96 | |
| |
Class C Shares | | | | |
Inception (12/1/93) | | | 8.03 | % |
10 Years | | | 8.55 | |
5 Years | | | 8.06 | |
1 Year | | | 7.11 | |
| |
Class R Shares | | | | |
Inception (3/1/01) | | | 6.31 | % |
10 Years | | | 8.93 | |
5 Years | | | 8.60 | |
1 Year | | | 8.63 | |
| |
Class Y Shares | | | | |
Inception (11/1/96) | | | 7.88 | % |
10 Years | | | 9.47 | |
5 Years | | | 9.15 | |
1 Year | | | 9.20 | |
| |
Class R5 Shares | | | | |
10 Years | | | 9.37 | % |
5 Years | | | 9.21 | |
1 Year | | | 9.28 | |
| |
Class R6 Shares | | | | |
Inception (12/29/11) | | | 11.48 | % |
10 Years | | | 9.62 | |
5 Years | | | 9.26 | |
1 Year | | | 9.26 | |
Effective May 24, 2019, Class A, Class C, Class R, Class Y and Class I shares of the Oppenheimer Main Street Fund®, (the predecessor fund), were reorganized into Class A, Class C, Class R, Class Y and Class R6 shares, respectively, of the Invesco Oppenheimer Main Street Fund®. Note: The Fund was subsequently renamed the Invesco Main Street Fund® (the Fund). Returns shown above, for periods ending on or prior to May 24, 2019, for Class A, Class C, Class R, Class Y and Class R6 shares are those for Class A, Class C, Class R, Class Y and Class I shares of the predecessor fund. Share class returns will differ from the predecessor fund because of different expenses.
Class R5 shares incepted on May 24, 2019. Performance shown on and prior to that date is that of the predecessor fund’s Class A shares and includes the 12b-1 fees applicable to Class A shares.
The performance data quoted represent past performance and cannot guarantee future results; current performance may be lower or higher. Please visit invesco.com/performance for the most recent month-end performance. Performance figures reflect reinvested distributions, changes in net asset value and the effect of the maximum sales charge unless otherwise stated. Performance figures do not reflect deduction
of taxes a shareholder would pay on Fund distributions or sale of Fund shares. Investment return and principal value will fluctuate so that you may have a gain or loss when you sell shares.
Class A share performance reflects the maximum 5.50% sales charge, and Class C share performance reflects the applicable contingent deferred sales charge (CDSC) for the period involved. The CDSC on Class C shares is 1% for the first year after purchase. Class R, Class Y, Class R5 and Class R6 shares do not have a front-end sales charge or a CDSC; therefore, performance is at net asset value.
The performance of the Fund’s share classes will differ primarily due to different sales charge structures and class expenses.
Fund performance reflects any applicable fee waivers and/or expense reimbursements. Had the adviser not waived fees and/or reimbursed expenses currently or in the past, returns would have been lower. See current prospectus for more information.
| | |
| 4 | | Invesco Main Street Fund® |
Supplemental Information
Invesco Main Street Fund’s® investment objective is to seek capital appreciation.
| ∎ | Unless otherwise stated, information presented in this report is as of October 31, 2023, and is based on total net assets. |
| ∎ | Unless otherwise noted, all data is provided by Invesco. |
| ∎ | To access your Fund’s reports/prospectus, visit invesco.com/fundreports. |
About indexes used in this report
| ∎ | The S&P 500® Index is an unmanaged index considered representative of the US stock market. |
| ∎ | The Fund is not managed to track the performance of any particular index, including the index(es) described here, and consequently, the performance of the Fund may deviate significantly from the performance of the index(es). |
| ∎ | A direct investment cannot be made in an index. Unless otherwise indicated, index results include reinvested dividends, and they do not reflect sales charges. Performance of the peer group, if applicable, reflects fund expenses; performance of a market index does not. |
|
|
This report must be accompanied or preceded by a currently effective Fund prospectus, which contains more complete information, including sales charges and expenses. Investors should read it carefully before investing. |
|
| NOT FDIC INSURED | MAY LOSE VALUE | NO BANK GUARANTEE |
| | |
| 5 | | Invesco Main Street Fund® |
Fund Information
Portfolio Composition
| | | | | |
| By sector | | % of total net assets |
| |
Information Technology | | | | 25.49 | % |
| |
Financials | | | | 13.43 | |
| |
Health Care | | | | 13.32 | |
| |
Communication Services | | | | 10.05 | |
| |
Industrials | | | | 8.66 | |
| |
Consumer Discretionary | | | | 8.08 | |
| |
Consumer Staples | | | | 8.06 | |
| |
Energy | | | | 4.75 | |
| |
Utilities | | | | 2.02 | |
| |
Other Sectors, Each Less than 2% of Net Assets | | | | 3.78 | |
| |
Money Market Funds Plus Other Assets Less Liabilities | | | | 2.36 | |
Top 10 Equity Holdings*
| | | | | | | |
| | | | | % of total net assets |
| | |
| 1. | | Microsoft Corp. | | | | 8.16 | % |
| | |
| 2. | | Apple, Inc. | | | | 5.75 | |
| | |
| 3. | | Alphabet, Inc., Class A | | | | 3.82 | |
| | |
| 4. | | Amazon.com, Inc. | | | | 3.72 | |
| | |
| 5. | | NVIDIA Corp. | | | | 3.23 | |
| | |
| 6. | | Exxon Mobil Corp. | | | | 3.07 | |
| | |
| 7. | | JPMorgan Chase & Co. | | | | 3.01 | |
| | |
| 8. | | Meta Platforms, Inc., Class A | | | | 2.70 | |
| | |
| 9. | | Constellation Brands, Inc., Class A | | | | 2.48 | |
| | |
| 10. | | UnitedHealth Group, Inc. | | | | 2.31 | |
The Fund’s holdings are subject to change, and there is no assurance that the Fund will continue to hold any particular security.
| * | Excluding money market fund holdings, if any. |
Data presented here are as of October 31, 2023.
| | |
| 6 | | Invesco Main Street Fund® |
Schedule of Investments(a)
October 31, 2023
| | | | | | | | |
| | | Shares | | | Value | |
|
| |
Common Stocks & Other Equity Interests–97.64% | |
Aerospace & Defense–2.08% | | | | | | | | |
Boeing Co. (The)(a) | | | 961,704 | | | $ | 179,665,541 | |
|
| |
|
Air Freight & Logistics–2.01% | |
United Parcel Service, Inc., Class B | | | 1,227,916 | | | | 173,443,135 | |
|
| |
| | |
Application Software–2.27% | | | | | | | | |
Manhattan Associates, Inc.(a) | | | 185,638 | | | | 36,195,697 | |
|
| |
Synopsys, Inc.(a) | | | 199,212 | | | | 93,518,081 | |
|
| |
Tyler Technologies, Inc.(a)(b) | | | 177,195 | | | | 66,076,016 | |
|
| |
| | | | | | | 195,789,794 | |
|
| |
|
Automobile Manufacturers–0.41% | |
Tesla, Inc.(a) | | | 176,836 | | | | 35,515,742 | |
|
| |
|
Automotive Parts & Equipment–0.99% | |
Mobileye Global, Inc., Class A (Israel)(a)(b) | | | 2,404,702 | | | | 85,775,720 | |
|
| |
| | |
Automotive Retail–0.96% | | | | | | | | |
Valvoline, Inc.(b) | | | 2,791,475 | | | | 82,823,063 | |
|
| |
| | |
Biotechnology–1.26% | | | | | | | | |
Gilead Sciences, Inc. | | | 1,379,590 | | | | 108,352,999 | |
|
| |
| | |
Broadline Retail–3.72% | | | | | | | | |
Amazon.com, Inc.(a) | | | 2,411,277 | | | | 320,916,856 | |
|
| |
|
Communications Equipment–0.61% | |
Motorola Solutions, Inc. | | | 187,654 | | | | 52,254,133 | |
|
| |
| | |
Construction Materials–1.00% | | | | | | | | |
Vulcan Materials Co. | | | 437,912 | | | | 86,045,329 | |
|
| |
| | |
Consumer Finance–1.74% | | | | | | | | |
American Express Co. | | | 1,028,835 | | | | 150,240,775 | |
|
| |
|
Consumer Staples Merchandise Retail–1.46% | |
Walmart, Inc.(b) | | | 768,851 | | | | 125,637,942 | |
|
| |
| | |
Distillers & Vintners–2.48% | | | | | | | | |
Constellation Brands, Inc., Class A | | | 914,329 | | | | 214,090,135 | |
|
| |
| | |
Diversified Banks–3.01% | | | | | | | | |
JPMorgan Chase & Co. | | | 1,868,994 | | | | 259,902,306 | |
|
| |
|
Diversified Financial Services–1.61% | |
Equitable Holdings, Inc. | | | 5,233,857 | | | | 139,063,580 | |
|
| |
| | |
Electric Utilities–0.67% | | | | | | | | |
FirstEnergy Corp. | | | 1,622,424 | | | | 57,758,294 | |
|
| |
|
Electrical Components & Equipment–1.89% | |
Emerson Electric Co. | | | 1,097,298 | | | | 97,626,603 | |
|
| |
Hubbell, Inc. | | | 240,795 | | | | 65,038,730 | |
|
| |
| | | | | | | 162,665,333 | |
|
| |
|
Health Care Equipment–3.36% | |
Becton, Dickinson and Co. | | | 250,371 | | | | 63,288,781 | |
|
| |
Boston Scientific Corp.(a) | | | 1,405,720 | | | | 71,958,807 | |
|
| |
Zimmer Biomet Holdings, Inc. | | | 1,479,736 | | | | 154,499,236 | |
|
| |
| | | | | | | 289,746,824 | |
|
| |
| | | | | | | | |
| | | Shares | | | Value | |
|
| |
Health Care Facilities–1.76% | | | | | | | | |
HCA Healthcare, Inc. | | | 414,823 | | | $ | 93,808,073 | |
|
| |
Tenet Healthcare Corp.(a) | | | 1,083,830 | | | | 58,201,671 | |
|
| |
| | | | | | | 152,009,744 | |
|
| |
|
Hotels, Resorts & Cruise Lines–0.49% | |
Airbnb, Inc., Class A(a)(b) | | | 359,303 | | | | 42,501,952 | |
|
| |
|
Industrial Machinery & Supplies & Components–0.64% | |
Otis Worldwide Corp. | | | 711,921 | | | | 54,967,420 | |
|
| |
| | |
Industrial REITs–1.90% | | | | | | | | |
Prologis, Inc. | | | 1,626,263 | | | | 163,845,997 | |
|
| |
| | |
Insurance Brokers–1.03% | | | | | | | | |
Arthur J. Gallagher & Co.(b) | | | 378,581 | | | | 89,152,040 | |
|
| |
| | |
Integrated Oil & Gas–3.06% | | | | | | | | |
Exxon Mobil Corp. | | | 2,496,282 | | | | 264,231,450 | |
|
| |
|
Integrated Telecommunication Services–1.52% | |
Verizon Communications, Inc. | | | 3,730,746 | | | | 131,061,107 | |
|
| |
| |
Interactive Media & Services–6.52% | | | | | |
Alphabet, Inc., Class A(a) | | | 2,656,440 | | | | 329,611,075 | |
|
| |
Meta Platforms, Inc., Class A(a) | | | 773,366 | | | | 232,991,975 | |
|
| |
| | | | | | | 562,603,050 | |
|
| |
|
Investment Banking & Brokerage–1.84% | |
Charles Schwab Corp. (The) | | | 3,050,221 | | | | 158,733,501 | |
|
| |
|
IT Consulting & Other Services–0.99% | |
Amdocs Ltd. | | | 1,064,297 | | | | 85,314,048 | |
|
| |
| | |
Managed Health Care–2.31% | | | | | | | | |
UnitedHealth Group, Inc. | | | 371,776 | | | | 199,108,355 | |
|
| |
|
Movies & Entertainment–1.24% | |
Netflix, Inc.(a) | | | 259,529 | | | | 106,845,494 | |
|
| |
| | |
Multi-line Insurance–1.14% | | | | | | | | |
American International Group, Inc. | | | 1,607,126 | | | | 98,532,895 | |
|
| |
| | |
Multi-Utilities–1.35% | | | | | | | | |
Ameren Corp. | | | 574,315 | | | | 43,481,389 | |
|
| |
Dominion Energy, Inc.(b) | | | 1,805,745 | | | | 72,807,638 | |
|
| |
| | | | | | | 116,289,027 | |
|
| |
|
Oil & Gas Equipment & Services–1.09% | |
Schlumberger N.V. | | | 1,682,799 | | | | 93,664,592 | |
|
| |
|
Oil & Gas Exploration & Production–0.60% | |
Marathon Oil Corp.(b) | | | 1,893,859 | | | | 51,721,289 | |
|
| |
| |
Oil & Gas Storage & Transportation–0.00% | | | | | |
ONEOK, Inc., | | | 2 | | | | 113 | |
|
| |
|
Passenger Ground Transportation–0.85% | |
Uber Technologies, Inc.(a) | | | 1,696,320 | | | | 73,416,730 | |
|
| |
| | |
Personal Care Products–0.49% | | | | | | | | |
Coty, Inc., Class A(a)(b) | | | 4,530,676 | | | | 42,452,434 | |
|
| |
See accompanying Notes to Financial Statements which are an integral part of the financial statements.
| | |
| 7 | | Invesco Main Street Fund® |
| | | | | | | | |
| | | Shares | | | Value | |
|
| |
Pharmaceuticals–4.63% | | | | | | | | |
AstraZeneca PLC, ADR (United Kingdom)(b) | | | 1,452,142 | | | $ | 91,818,939 | |
|
| |
Eli Lilly and Co. | | | 287,458 | | | | 159,231,610 | |
|
| |
Merck & Co., Inc. | | | 1,443,482 | | | | 148,245,601 | |
|
| |
| | | | | | | 399,296,150 | |
|
| |
|
Research & Consulting Services–1.19% | |
Equifax, Inc. | | | 604,673 | | | | 102,534,401 | |
|
| |
| | |
Restaurants–1.51% | | | | | | | | |
Starbucks Corp. | | | 1,408,819 | | | | 129,949,465 | |
|
| |
|
Semiconductor Materials & Equipment–1.30% | |
Applied Materials, Inc. | | | 847,115 | | | | 112,115,670 | |
|
| |
| | |
Semiconductors–4.57% | | | | | | | | |
ARM Holdings PLC, ADR(a) | | | 717,945 | | | | 35,387,509 | |
|
| |
NVIDIA Corp. | | | 683,802 | | | | 278,854,456 | |
|
| |
Taiwan Semiconductor Manufacturing Co. Ltd., ADR (Taiwan) | | | 931,772 | | | | 80,421,241 | |
|
| |
| | | | | | | 394,663,206 | |
|
| |
|
Soft Drinks & Non-alcoholic Beverages–2.12% | |
Coca-Cola Co. (The) | | | 1,077,195 | | | | 60,850,745 | |
|
| |
PepsiCo, Inc. | | | 745,114 | | | | 121,662,214 | |
|
| |
| | | | | | | 182,512,959 | |
|
| |
| | |
Specialty Chemicals–0.88% | | | | | | | | |
DuPont de Nemours, Inc. | | | 1,040,145 | | | | 75,805,768 | |
|
| |
| | |
Systems Software–10.01% | | | | | | | | |
Microsoft Corp. | | | 2,082,139 | | | | 703,992,017 | |
|
| |
ServiceNow, Inc.(a) | | | 274,441 | | | | 159,683,496 | |
|
| |
| | | | | | | 863,675,513 | |
|
| |
|
Technology Hardware, Storage & Peripherals–5.74% | |
Apple, Inc. | | | 2,901,168 | | | | 495,432,459 | |
|
| |
| | | | | | | | |
| | | Shares | | | Value | |
|
| |
Tobacco–1.51% | | | | | | | | |
Philip Morris International, Inc. | | | 1,458,574 | | | $ | 130,046,458 | |
|
| |
|
Transaction & Payment Processing Services–3.06% | |
Fiserv, Inc.(a) | | | 998,941 | | | | 113,629,539 | |
|
| |
Mastercard, Inc., Class A | | | 400,328 | | | | 150,663,443 | |
|
| |
| | | | | | | 264,292,982 | |
|
| |
|
Wireless Telecommunication Services–0.77% | |
T-Mobile US, Inc.(a) | | | 460,234 | | | | 66,209,263 | |
|
| |
Total Common Stocks & Other Equity Interests
(Cost $7,022,095,652) | | | | 8,422,673,033 | |
|
| |
|
Money Market Funds–1.67% | |
Invesco Liquid Assets Portfolio, Institutional Class, 5.40%(c)(d)
(Cost $143,881,298) | | | 143,859,677 | | | | 143,902,835 | |
|
| |
TOTAL INVESTMENTS IN SECURITIES
(excluding investments purchased with cash collateral from securities on
loan)–99.31%
(Cost $7,165,976,950) | | | | | | | 8,566,575,868 | |
|
| |
|
Investments Purchased with Cash Collateral from Securities on Loan | |
Money Market Funds–1.24% | |
Invesco Private Government Fund, 5.32%(c)(d)(e) | | | 29,926,788 | | | | 29,926,788 | |
|
| |
Invesco Private Prime Fund, 5.53%(c)(d)(e) | | | 76,973,870 | | | | 76,981,568 | |
|
| |
Total Investments Purchased with Cash Collateral from Securities on Loan
(Cost $106,908,356) | | | | 106,908,356 | |
|
| |
TOTAL INVESTMENTS IN
SECURITIES–100.55%
(Cost $7,272,885,306) | | | | 8,673,484,224 | |
|
| |
OTHER ASSETS LESS LIABILITIES–(0.55)% | | | | (47,086,359 | ) |
|
| |
NET ASSETS–100.00% | | | $ | 8,626,397,865 | |
|
| |
Investment Abbreviations:
ADR – American Depositary Receipt
REIT – Real Estate Investment Trust
Notes to Schedule of Investments:
| (a) | Non-income producing security. |
| (b) | All or a portion of this security was out on loan at October 31, 2023. |
| (c) | Affiliated holding. Affiliated holdings are investments in entities which are under common ownership or control of Invesco Ltd. or are investments in entities in which the Fund owns 5% or more of the outstanding voting securities. The table below shows the Fund’s transactions in, and earnings from, its investments in affiliates for the fiscal year ended October 31, 2023. |
| | | | | | | | | | | | | | | | | | | | | | | | | | | | |
| | | Value October 31, 2022 | | | Purchases at Cost | | | Proceeds from Sales | | | Change in Unrealized Appreciation (Depreciation) | | | Realized Gain (Loss) | | | Value October 31, 2023 | | | Dividend Income | |
| Investments in Affiliated Money Market Funds: | | | | | | | | | | | | | | | | | | | | | | | | | | | | |
Invesco Government & Agency Portfolio | | $ | 75,624,027 | | | $ | 403,096,924 | | | $ | (478,720,951) | | | $ | - | | | $ | - | | | $ | - | | | $ | 1,177,580 | |
Invesco Liquid Assets Portfolio, Institutional Class | | | 54,378,030 | | | | 1,156,391,647 | | | | (1,066,897,995) | | | | 14,734 | | | | 16,419 | | | | 143,902,835 | | | | 3,468,361 | |
Invesco Treasury Portfolio | | | 86,427,459 | | | | 460,682,199 | | | | (547,109,658) | | | | - | | | | - | | | | - | | | | 1,344,475 | |
See accompanying Notes to Financial Statements which are an integral part of the financial statements.
| | |
| 8 | | Invesco Main Street Fund® |
| | | | | | | | | | | | | | | | | | | | | | | | | | | | |
| | | Value October 31, 2022 | | | Purchases at Cost | | | Proceeds from Sales | | | Change in Unrealized Appreciation (Depreciation) | | | Realized Gain (Loss) | | | Value October 31, 2023 | | | Dividend Income | |
| Investments Purchased with Cash Collateral from Securities on Loan: | | | | | | | | | | | | | | | | | | | | | | | | | | | | |
Invesco Private Government Fund | | $ | 38,220,527 | | | $ | 616,818,305 | | | $ | (625,112,044) | | | | $ - | | | | $ - | | | $ | 29,926,788 | | | $ | 2,515,287* | |
Invesco Private Prime Fund | | | 98,267,279 | | | | 1,292,874,518 | | | | (1,314,152,124) | | | | (5,802) | | | | (2,303) | | | | 76,981,568 | | | | 6,833,576* | |
Total | | $ | 352,917,322 | | | $ | 3,929,863,593 | | | $ | (4,031,992,772) | | | | $ 8,932 | | | | $14,116 | | | $ | 250,811,191 | | | $ | 15,339,279 | |
| | * | Represents the income earned on the investment of cash collateral, which is included in securities lending income on the Statement of Operations. Does not include rebates and fees paid to lending agent or premiums received from borrowers, if any. |
| (d) | The rate shown is the 7-day SEC standardized yield as of October 31, 2023. |
| (e) | The security has been segregated to satisfy the commitment to return the cash collateral received in securities lending transactions upon the borrower’s return of the securities loaned. See Note 1I. |
See accompanying Notes to Financial Statements which are an integral part of the financial statements.
| | |
| 9 | | Invesco Main Street Fund® |
Statement of Assets and Liabilities
October 31, 2023
| | | | |
Assets: | | | | |
| |
Investments in unaffiliated securities, at value (Cost $7,022,095,652)* | | $ | 8,422,673,033 | |
|
| |
Investments in affiliated money market funds, at value
(Cost $250,789,654) | | | 250,811,191 | |
|
| |
Cash | | | 2,999,887 | |
|
| |
Receivable for: | | | | |
Investments sold | | | 93,533,205 | |
|
| |
Fund shares sold | | | 1,211,744 | |
|
| |
Dividends | | | 3,500,232 | |
|
| |
Investment for trustee deferred compensation and retirement plans | | | 554,587 | |
|
| |
Other assets | | | 55,776 | |
|
| |
Total assets | | | 8,775,339,655 | |
|
| |
| |
Liabilities: | | | | |
Payable for: | | | | |
Investments purchased | | | 33,674,917 | |
|
| |
Fund shares reacquired | | | 4,481,551 | |
|
| |
Collateral upon return of securities loaned | | | 106,908,356 | |
|
| |
Accrued fees to affiliates | | | 3,165,503 | |
|
| |
Accrued other operating expenses | | | 156,876 | |
|
| |
Trustee deferred compensation and retirement plans | | | 554,587 | |
|
| |
Total liabilities | | | 148,941,790 | |
|
| |
Net assets applicable to shares outstanding | | $ | 8,626,397,865 | |
|
| |
| |
Net assets consist of: | | | | |
Shares of beneficial interest | | $ | 6,618,197,931 | |
|
| |
Distributable earnings | | | 2,008,199,934 | |
|
| |
| | $ | 8,626,397,865 | |
|
| |
| | | | |
Net Assets: | | | | |
Class A | | $ | 7,375,761,314 | |
|
| |
Class C | | $ | 189,258,983 | |
|
| |
Class R | | $ | 245,222,283 | |
|
| |
Class Y | | $ | 423,216,615 | |
|
| |
Class R5 | | $ | 10,296 | |
|
| |
Class R6 | | $ | 392,928,374 | |
|
| |
|
Shares outstanding, no par value, with an unlimited number of shares authorized: | |
Class A | | | 157,322,508 | |
|
| |
Class C | | | 4,511,080 | |
|
| |
Class R | | | 5,428,664 | |
|
| |
Class Y | | | 9,107,399 | |
|
| |
Class R5 | | | 218 | |
|
| |
Class R6 | | | 8,456,874 | |
|
| |
Class A: | | | | |
Net asset value per share | | $ | 46.88 | |
|
| |
Maximum offering price per share
(Net asset value of $46.88 ÷ 94.50%) | | $ | 49.61 | |
|
| |
Class C: | | | | |
Net asset value and offering price per share | | $ | 41.95 | |
|
| |
Class R: | | | | |
Net asset value and offering price per share | | $ | 45.17 | |
|
| |
Class Y: | | | | |
Net asset value and offering price per share | | $ | 46.47 | |
|
| |
Class R5: | | | | |
Net asset value and offering price per share | | $ | 47.23 | |
|
| |
Class R6: | | | | |
Net asset value and offering price per share | | $ | 46.46 | |
|
| |
| * | At October 31, 2023, securities with an aggregate value of $108,796,008 were on loan to brokers. |
See accompanying Notes to Financial Statements which are an integral part of the financial statements.
| | |
| 10 | | Invesco Main Street Fund® |
Statement of Operations
For the year ended October 31, 2023
| | | | |
Investment income: | | | | |
Dividends (net of foreign withholding taxes of $252,377) | | $ | 124,684,618 | |
|
| |
Dividends from affiliated money market funds (includes net securities lending income of $2,477,696) | | | 8,468,112 | |
|
| |
Total investment income | | | 133,152,730 | |
|
| |
| |
Expenses: | | | | |
Advisory fees | | | 39,998,037 | |
|
| |
Administrative services fees | | | 1,287,087 | |
|
| |
Custodian fees | | | 42,801 | |
|
| |
Distribution fees: | | | | |
Class A | | | 17,610,786 | |
|
| |
Class C | | | 2,085,980 | |
|
| |
Class R | | | 1,251,934 | |
|
| |
Transfer agent fees – A, C, R and Y | | | 8,990,834 | |
|
| |
Transfer agent fees – R5 | | | 4 | |
|
| |
Transfer agent fees – R6 | | | 120,860 | |
|
| |
Trustees’ and officers’ fees and benefits | | | 92,790 | |
|
| |
Registration and filing fees | | | 252,655 | |
|
| |
Reports to shareholders | | | 487,218 | |
|
| |
Professional services fees | | | 122,168 | |
|
| |
Other | | | 127,480 | |
|
| |
Total expenses | | | 72,470,634 | |
|
| |
Less: Fees waived and/or expense offset arrangement(s) | | | (419,395 | ) |
|
| |
Net expenses | | | 72,051,239 | |
|
| |
Net investment income | | | 61,101,491 | |
|
| |
| |
Realized and unrealized gain (loss) from: | | | | |
Net realized gain (loss) from: | | | | |
Unaffiliated investment securities | | | 697,254,656 | |
|
| |
Affiliated investment securities | | | 14,116 | |
|
| |
Foreign currencies | | | (32,376 | ) |
|
| |
| | | 697,236,396 | |
|
| |
Change in net unrealized appreciation of: | | | | |
Unaffiliated investment securities | | | 5,383,437 | |
|
| |
Affiliated investment securities | | | 8,932 | |
|
| |
Foreign currencies | | | 24,728 | |
|
| |
| | | 5,417,097 | |
|
| |
Net realized and unrealized gain | | | 702,653,493 | |
|
| |
Net increase in net assets resulting from operations | | $ | 763,754,984 | |
|
| |
See accompanying Notes to Financial Statements which are an integral part of the financial statements.
| | |
| 11 | | Invesco Main Street Fund® |
Statement of Changes in Net Assets
For the years ended October 31, 2023 and 2022
| | | | | | | | |
| | | 2023 | | | 2022 | |
|
| |
Operations: | | | | | | | | |
Net investment income | | $ | 61,101,491 | | | $ | 73,208,098 | |
|
| |
Net realized gain | | | 697,236,396 | | | | 297,135,019 | |
|
| |
Change in net unrealized appreciation (depreciation) | | | 5,417,097 | | | | (2,425,602,174 | ) |
|
| |
Net increase (decrease) in net assets resulting from operations | | | 763,754,984 | | | | (2,055,259,057 | ) |
|
| |
| | |
Distributions to shareholders from distributable earnings: | | | | | | | | |
Class A | | | (327,399,325 | ) | | | (1,603,979,146 | ) |
|
| |
Class C | | | (8,337,967 | ) | | | (52,532,693 | ) |
|
| |
Class R | | | (10,092,630 | ) | | | (49,150,979 | ) |
|
| |
Class Y | | | (20,377,148 | ) | | | (100,034,120 | ) |
|
| |
Class R5 | | | (479 | ) | | | (2,431 | ) |
|
| |
Class R6 | | | (18,336,707 | ) | | | (90,806,951 | ) |
|
| |
Total distributions from distributable earnings | | | (384,544,256 | ) | | | (1,896,506,320 | ) |
|
| |
| | |
Share transactions-net: | | | | | | | | |
Class A | | | (292,102,340 | ) | | | 886,846,432 | |
|
| |
Class C | | | (25,636,459 | ) | | | 5,923,610 | |
|
| |
Class R | | | 3,493,657 | | | | 44,289,761 | |
|
| |
Class Y | | | (28,027,443 | ) | | | 41,797,114 | |
|
| |
Class R6 | | | (3,951,083 | ) | | | 22,274,427 | |
|
| |
Net increase (decrease) in net assets resulting from share transactions | | | (346,223,668 | ) | | | 1,001,131,344 | |
|
| |
Net increase (decrease) in net assets | | | 32,987,060 | | | | (2,950,634,033 | ) |
|
| |
| | |
Net assets: | | | | | | | | |
Beginning of year | | | 8,593,410,805 | | | | 11,544,044,838 | |
|
| |
End of year | | $ | 8,626,397,865 | | | $ | 8,593,410,805 | |
|
| |
See accompanying Notes to Financial Statements which are an integral part of the financial statements.
| | |
| 12 | | Invesco Main Street Fund® |
Financial Highlights
The following schedule presents financial highlights for a share of the Fund outstanding throughout the periods indicated.
| | | | | | | | | | | | | | | | | | | | | | | | | | | | | | | | | | | | | | | | | | | | | | | | | | | | | | | | |
| | | Net asset value, beginning of period | | Net investment income (loss)(a) | | Net gains (losses) on securities (both realized and unrealized) | | Total from investment operations | | Dividends from net investment income | | Distributions from net realized gains | | Total distributions | | Net asset value, end of period | | Total return(b) | | Net assets, end of period (000’s omitted) | | Ratio of expenses to average net assets with fee waivers and/or expenses absorbed | | Ratio of expenses to average net assets without fee waivers and/or expenses absorbed(c) | | Ratio of net investment income (loss) to average net assets | | Portfolio turnover (d) |
Class A | | | | | | | | | | | | | | | | | | | | | | | | | | | | | | | | | | | | | | | | | | | | | | | | | | | | | | | | |
Year ended 10/31/23 | | | $45.05 | | | | $ 0.32 | | | | $ 3.54 | | | | $ 3.86 | | | | $(0.47 | ) | | | $ (1.56 | ) | | | $ (2.03 | ) | | | $46.88 | | | | 8.95 | %(e) | | | $7,375,761 | | | | 0.80 | %(e) | | | 0.80 | %(e) | | | 0.68 | %(e) | | | 66 | % |
Year ended 10/31/22 | | | 66.18 | | | | 0.38 | | | | (10.59 | ) | | | (10.21 | ) | | | (0.38 | ) | | | (10.54 | ) | | | (10.92 | ) | | | 45.05 | | | | (18.61 | )(e) | | | 7,340,263 | | | | 0.80 | (e) | | | 0.80 | (e) | | | 0.73 | (e) | | | 52 | |
Year ended 10/31/21 | | | 48.70 | | | | 0.35 | | | | 18.82 | | | | 19.17 | | | | (0.44 | ) | | | (1.25 | ) | | | (1.69 | ) | | | 66.18 | | | | 40.26 | (e) | | | 9,808,667 | | | | 0.82 | (e) | | | 0.82 | (e) | | | 0.58 | (e) | | | 47 | |
Year ended 10/31/20 | | | 49.26 | | | | 0.44 | | | | 3.08 | | | | 3.52 | | | | (0.43 | ) | | | (3.65 | ) | | | (4.08 | ) | | | 48.70 | | | | 7.38 | (e) | | | 7,502,604 | | | | 0.83 | (e) | | | 0.83 | (e) | | | 0.93 | (e) | | | 37 | |
Two months ended 10/31/19 | | | 48.16 | | | | 0.07 | | | | 1.03 | | | | 1.10 | | | | – | | | | – | | | | – | | | | 49.26 | | | | 2.28 | | | | 7,681,783 | | | | 0.85 | (f) | | | 0.85 | (f) | | | 0.81 | (f) | | | 7 | |
Year ended 08/31/19 | | | 54.31 | | | | 0.49 | | | | 1.14 | | | | 1.63 | | | | (0.49 | ) | | | (7.29 | ) | | | (7.78 | ) | | | 48.16 | | | | 5.14 | | | | 7,625,507 | | | | 0.88 | | | | 0.88 | | | | 1.03 | | | | 49 | |
Class C | | | | | | | | | | | | | | | | | | | | | | | | | | | | | | | | | | | | | | | | | | | | | | | | | | | | | | | | |
Year ended 10/31/23 | | | 40.46 | | | | (0.04 | ) | | | 3.18 | | | | 3.14 | | | | (0.09 | ) | | | (1.56 | ) | | | (1.65 | ) | | | 41.95 | | | | 8.09 | | | | 189,259 | | | | 1.57 | | | | 1.57 | | | | (0.09 | ) | | | 66 | |
Year ended 10/31/22 | | | 60.54 | | | | (0.02 | ) | | | (9.52 | ) | | | (9.54 | ) | | | – | | | | (10.54 | ) | | | (10.54 | ) | | | 40.46 | | | | (19.20 | ) | | | 206,387 | | | | 1.57 | | | | 1.57 | | | | (0.04 | ) | | | 52 | |
Year ended 10/31/21 | | | 44.96 | | | | (0.10 | ) | | | 17.31 | | | | 17.21 | | | | (0.38 | ) | | | (1.25 | ) | | | (1.63 | ) | | | 60.54 | | | | 39.19 | | | | 307,346 | | | | 1.59 | | | | 1.59 | | | | (0.19 | ) | | | 47 | |
Year ended 10/31/20 | | | 45.99 | | | | 0.07 | | | | 2.86 | | | | 2.93 | | | | (0.31 | ) | | | (3.65 | ) | | | (3.96 | ) | | | 44.96 | | | | 6.55 | | | | 300,125 | | | | 1.60 | | | | 1.60 | | | | 0.16 | | | | 37 | |
Two months ended 10/31/19 | | | 45.03 | | | | 0.00 | | | | 0.96 | | | | 0.96 | | | | – | | | | – | | | | – | | | | 45.99 | | | | 2.13 | | | | 343,918 | | | | 1.62 | (f) | | | 1.62 | (f) | | | 0.04 | (f) | | | 7 | |
Year ended 08/31/19 | | | 51.26 | | | | 0.11 | | | | 1.06 | | | | 1.17 | | | | (0.11 | ) | | | (7.29 | ) | | | (7.40 | ) | | | 45.03 | | | | 4.34 | | | | 350,276 | | | | 1.65 | | | | 1.65 | | | | 0.26 | | | | 49 | |
Class R | | | | | | | | | | | | | | | | | | | | | | | | | | | | | | | | | | | | | | | | | | | | | | | | | | | | | | | | |
Year ended 10/31/23 | | | 43.47 | | | | 0.19 | | | | 3.41 | | | | 3.60 | | | | (0.34 | ) | | | (1.56 | ) | | | (1.90 | ) | | | 45.17 | | | | 8.63 | | | | 245,222 | | | | 1.07 | | | | 1.07 | | | | 0.41 | | | | 66 | |
Year ended 10/31/22 | | | 64.21 | | | | 0.23 | | | | (10.21 | ) | | | (9.98 | ) | | | (0.22 | ) | | | (10.54 | ) | | | (10.76 | ) | | | 43.47 | | | | (18.80 | ) | | | 231,671 | | | | 1.07 | | | | 1.07 | | | | 0.46 | | | | 52 | |
Year ended 10/31/21 | | | 47.40 | | | | 0.18 | | | | 18.30 | | | | 18.48 | | | | (0.42 | ) | | | (1.25 | ) | | | (1.67 | ) | | | 64.21 | | | | 39.88 | | | | 291,450 | | | | 1.09 | | | | 1.09 | | | | 0.31 | | | | 47 | |
Year ended 10/31/20 | | | 48.13 | | | | 0.30 | | | | 3.00 | | | | 3.30 | | | | (0.38 | ) | | | (3.65 | ) | | | (4.03 | ) | | | 47.40 | | | | 7.09 | | | | 219,954 | | | | 1.10 | | | | 1.10 | | | | 0.66 | | | | 37 | |
Two months ended 10/31/19 | | | 47.08 | | | | 0.04 | | | | 1.01 | | | | 1.05 | | | | – | | | | – | | | | – | | | | 48.13 | | | | 2.23 | | | | 221,335 | | | | 1.12 | (f) | | | 1.12 | (f) | | | 0.54 | (f) | | | 7 | |
Year ended 08/31/19 | | | 53.26 | | | | 0.35 | | | | 1.11 | | | | 1.46 | | | | (0.35 | ) | | | (7.29 | ) | | | (7.64 | ) | | | 47.08 | | | | 4.84 | | | | 218,620 | | | | 1.15 | | | | 1.15 | | | | 0.76 | | | | 49 | |
Class Y | | | | | | | | | | | | | | | | | | | | | | | | | | | | | | | | | | | | | | | | | | | | | | | | | | | | | | | | |
Year ended 10/31/23 | | | 44.69 | | | | 0.43 | | | | 3.50 | | | | 3.93 | | | | (0.59 | ) | | | (1.56 | ) | | | (2.15 | ) | | | 46.47 | | | | 9.20 | | | | 423,217 | | | | 0.57 | | | | 0.57 | | | | 0.91 | | | | 66 | |
Year ended 10/31/22 | | | 65.75 | | | | 0.49 | | | | (10.49 | ) | | | (10.00 | ) | | | (0.52 | ) | | | (10.54 | ) | | | (11.06 | ) | | | 44.69 | | | | (18.42 | ) | | | 434,168 | | | | 0.57 | | | | 0.57 | | | | 0.96 | | | | 52 | |
Year ended 10/31/21 | | | 48.31 | | | | 0.48 | | | | 18.67 | | | | 19.15 | | | | (0.46 | ) | | | (1.25 | ) | | | (1.71 | ) | | | 65.75 | | | | 40.57 | | | | 596,575 | | | | 0.59 | | | | 0.59 | | | | 0.81 | | | | 47 | |
Year ended 10/31/20 | | | 48.82 | | | | 0.54 | | | | 3.07 | | | | 3.61 | | | | (0.47 | ) | | | (3.65 | ) | | | (4.12 | ) | | | 48.31 | | | | 7.64 | | | | 443,001 | | | | 0.60 | | | | 0.60 | | | | 1.16 | | | | 37 | |
Two months ended 10/31/19 | | | 47.72 | | | | 0.08 | | | | 1.02 | | | | 1.10 | | | | – | | | | – | | | | – | | | | 48.82 | | | | 2.31 | | | | 611,287 | | | | 0.62 | (f) | | | 0.62 | (f) | | | 1.04 | (f) | | | 7 | |
Year ended 08/31/19 | | | 53.90 | | | | 0.59 | | | | 1.13 | | | | 1.72 | | | | (0.61 | ) | | | (7.29 | ) | | | (7.90 | ) | | | 47.72 | | | | 5.37 | | | | 590,781 | | | | 0.65 | | | | 0.65 | | | | 1.26 | | | | 49 | |
Class R5 | | | | | | | | | | | | | | | | | | | | | | | | | | | | | | | | | | | | | | | | | | | | | | | | | | | | | | | | |
Year ended 10/31/23 | | | 45.40 | | | | 0.47 | | | | 3.55 | | | | 4.02 | | | | (0.63 | ) | | | (1.56 | ) | | | (2.19 | ) | | | 47.23 | | | | 9.28 | | | | 10 | | | | 0.50 | | | | 0.50 | | | | 0.98 | | | | 66 | |
Year ended 10/31/22 | | | 66.63 | | | | 0.54 | | | | (10.64 | ) | | | (10.10 | ) | | | (0.59 | ) | | | (10.54 | ) | | | (11.13 | ) | | | 45.40 | | | | (18.33 | ) | | | 10 | | | | 0.49 | | | | 0.49 | | | | 1.04 | | | | 52 | |
Year ended 10/31/21 | | | 48.89 | | | | 0.55 | | | | 18.91 | | | | 19.46 | | | | (0.47 | ) | | | (1.25 | ) | | | (1.72 | ) | | | 66.63 | | | | 40.73 | | | | 15 | | | | 0.48 | | | | 0.48 | | | | 0.92 | | | | 47 | |
Year ended 10/31/20 | | | 49.33 | | | | 0.61 | | | | 3.08 | | | | 3.69 | | | | (0.48 | ) | | | (3.65 | ) | | | (4.13 | ) | | | 48.89 | | | | 7.75 | | | | 11 | | | | 0.48 | | | | 0.48 | | | | 1.28 | | | | 37 | |
Two months ended 10/31/19 | | | 48.20 | | | | 0.09 | | | | 1.04 | | | | 1.13 | | | | – | | | | – | | | | – | | | | 49.33 | | | | 2.34 | | | | 11 | | | | 0.52 | (f) | | | 0.52 | (f) | | | 1.14 | (f) | | | 7 | |
Period ended 08/31/19(g) | | | 45.79 | | | | 0.18 | | | | 2.23 | | | | 2.41 | | | | – | | | | – | | | | – | | | | 48.20 | | | | 5.26 | | | | 11 | | | | 0.54 | (f) | | | 0.54 | (f) | | | 1.37 | (f) | | | 49 | |
Class R6 | | | | | | | | | | | | | | | | | | | | | | | | | | | | | | | | | | | | | | | | | | | | | | | | | | | | | | | | |
Year ended 10/31/23 | | | 44.70 | | | | 0.46 | | | | 3.49 | | | | 3.95 | | | | (0.63 | ) | | | (1.56 | ) | | | (2.19 | ) | | | 46.46 | | | | 9.26 | | | | 392,928 | | | | 0.50 | | | | 0.50 | | | | 0.98 | | | | 66 | |
Year ended 10/31/22 | | | 65.78 | | | | 0.53 | | | | (10.48 | ) | | | (9.95 | ) | | | (0.59 | ) | | | (10.54 | ) | | | (11.13 | ) | | | 44.70 | | | | (18.35 | ) | | | 380,913 | | | | 0.49 | | | | 0.49 | | | | 1.04 | | | | 52 | |
Year ended 10/31/21 | | | 48.28 | | | | 0.54 | | | | 18.68 | | | | 19.22 | | | | (0.47 | ) | | | (1.25 | ) | | | (1.72 | ) | | | 65.78 | | | | 40.75 | | | | 539,993 | | | | 0.48 | | | | 0.48 | | | | 0.92 | | | | 47 | |
Year ended 10/31/20 | | | 48.77 | | | | 0.60 | | | | 3.05 | | | | 3.65 | | | | (0.49 | ) | | | (3.65 | ) | | | (4.14 | ) | | | 48.28 | | | | 7.75 | | | | 438,565 | | | | 0.48 | | | | 0.48 | | | | 1.28 | | | | 37 | |
Two months ended 10/31/19 | | | 47.66 | | | | 0.09 | | | | 1.02 | | | | 1.11 | | | | – | | | | – | | | | – | | | | 48.77 | | | | 2.33 | | | | 616,482 | | | | 0.48 | (f) | | | 0.48 | (f) | | | 1.18 | (f) | | | 7 | |
Year ended 08/31/19 | | | 53.87 | | | | 0.66 | | | | 1.12 | | | | 1.78 | | | | (0.70 | ) | | | (7.29 | ) | | | (7.99 | ) | | | 47.66 | | | | 5.55 | | | | 621,207 | | | | 0.49 | | | | 0.49 | | | | 1.42 | | | | 49 | |
| (a) | Calculated using average shares outstanding. |
| (b) | Includes adjustments in accordance with accounting principles generally accepted in the United States of America and as such, the net asset value for financial reporting purposes and the returns based upon those net asset values may differ from the net asset value and returns for shareholder transactions. Does not include sales charges and is not annualized for periods less than one year, if applicable. |
| (c) | Does not include estimated acquired fund fees from underlying funds of 0.00% for the two months ended October 31, 2019 and the year ended August 31, 2019, respectively. |
| (d) | Portfolio turnover is calculated at the fund level and is not annualized for periods less than one year, if applicable. |
| (e) | The total return, ratio of expenses to average net assets and ratio of net investment income (loss) to average net assets reflect actual 12b-1 fees of 0.23% for the years ended October 31, 2023, 2022, 2021 and 2020, respectively. |
| (g) | Commencement date after the close of business on May 24, 2019. |
See accompanying Notes to Financial Statements which are an integral part of the financial statements.
| | |
| 13 | | Invesco Main Street Fund® |
Notes to Financial Statements
October 31, 2023
NOTE 1–Significant Accounting Policies
Invesco Main Street Fund® (the “Fund”) is a series portfolio of AIM Equity Funds (Invesco Equity Funds) (the “Trust”). The Trust is a Delaware statutory trust registered under the Investment Company Act of 1940, as amended (the “1940 Act”), as an open-end series management investment company authorized to issue an unlimited number of shares of beneficial interest. Information presented in these financial statements pertains only to the Fund. Matters affecting the Fund or each class will be voted on exclusively by the shareholders of the Fund or each class.
The Fund’s investment objective is to seek capital appreciation.
The Fund currently consists of six different classes of shares: Class A, Class C, Class R, Class Y, Class R5 and Class R6. Class Y shares are available only to certain investors. Class A shares are sold with a front-end sales charge unless certain waiver criteria are met. Under certain circumstances, load waived shares may be subject to contingent deferred sales charges (“CDSC”). Class C shares are sold with a CDSC. Class R, Class Y, Class R5 and Class R6 shares are sold at net asset value. Class C shares held for eight years after purchase are eligible for automatic conversion into Class A shares of the same Fund (the “Conversion Feature”). The automatic conversion pursuant to the Conversion Feature will generally occur at the end of the month following the eighth anniversary after a purchase of Class C shares.
The Fund is an investment company and accordingly follows the investment company accounting and reporting guidance in accordance with Financial Accounting Standards Board Accounting Standards Codification Topic 946, Financial Services – Investment Companies.
The following is a summary of the significant accounting policies followed by the Fund in the preparation of its financial statements.
| A. | Security Valuations – Securities, including restricted securities, are valued according to the following policy. |
A security listed or traded on an exchange is generally valued at its trade price or official closing price that day as of the close of the exchange where the security is principally traded, or lacking any trades or official closing price on a particular day, the security may be valued at the closing bid or ask price on that day. Securities traded in the over-the-counter market are valued based on prices furnished by independent pricing services or market makers. When such securities are valued using prices provided by an independent pricing service they may be considered fair valued. Futures contracts are valued at the daily settlement price set by an exchange on which they are principally traded. Where a final settlement price exists, exchange-traded options are valued at the final settlement price from the exchange where the option principally trades. Where a final settlement price does not exist, exchange-traded options are valued at the mean between the last bid and ask price generally from the exchange where the option principally trades.
Securities of investment companies that are not exchange-traded (e.g., open-end mutual funds) are valued using such company’s end-of-business-day net asset value per share.
Deposits, other obligations of U.S. and non-U.S. banks and financial institutions are valued at their daily account value.
Fixed income securities (including convertible debt securities) generally are valued on the basis of prices provided by independent pricing services. Prices provided by the pricing service may be determined without exclusive reliance on quoted prices, and may reflect appropriate factors such as institution-size trading in similar groups of securities, developments related to specific securities, dividend rate (for unlisted equities), yield (for debt obligations), quality, type of issue, coupon rate (for debt obligations), maturity (for debt obligations), individual trading characteristics and other market data. Pricing services generally value debt obligations assuming orderly transactions of institutional round lot size, but a fund may hold or transact in the same securities in smaller, odd lot sizes. Odd lots often trade at lower prices than institutional round lots, and their value may be adjusted accordingly. Debt obligations are subject to interest rate and credit risks. In addition, all debt obligations involve some risk of default with respect to interest and/or principal payments.
Foreign securities’ (including foreign exchange contracts) prices are converted into U.S. dollar amounts using the applicable exchange rates as of the close of the New York Stock Exchange (“NYSE”). If market quotations are available and reliable for foreign exchange-traded equity securities, the securities will be valued at the market quotations. Invesco Advisers, Inc. (the “Adviser” or “Invesco”) may use various pricing services to obtain market quotations as well as fair value prices. Because trading hours for certain foreign securities end before the close of the NYSE, closing market quotations may become not representative of market value in the Adviser’s judgment (“unreliable”). If, between the time trading ends on a particular security and the close of the customary trading session on the NYSE, a significant event occurs that makes the closing price of the security unreliable, the Adviser may fair value the security. If the event is likely to have affected the closing price of the security, the security will be valued at fair value in good faith in accordance with Board- approved policies and related Adviser procedures (“Valuation Procedures”). Adjustments to closing prices to reflect fair value may also be based on a screening process of an independent pricing service to indicate the degree of certainty, based on historical data, that the closing price in the principal market where a foreign security trades is not the current value as of the close of the NYSE. Foreign securities’ prices meeting the degree of certainty that the price is not reflective of current value will be priced at the indication of fair value from the independent pricing service. Multiple factors may be considered by the independent pricing service in determining adjustments to reflect fair value and may include information relating to sector indices, American Depositary Receipts and domestic and foreign index futures. Foreign securities may have additional risks including exchange rate changes, potential for sharply devalued currencies and high inflation, political and economic upheaval, the relative lack of issuer information, relatively low market liquidity and the potential lack of strict financial and accounting controls and standards.
Unlisted securities will be valued using prices provided by independent pricing services or by another method that the Adviser, in its judgment, believes better reflects the security’s fair value in accordance with the Valuation Procedures.
Securities for which market prices are not provided by any of the above methods may be valued based upon quotes furnished by independent sources. The mean between the last bid and ask prices may be used to value debt obligations, including corporate loans.
Securities for which market quotations are not readily available are fair valued by the Adviser in accordance with the Valuation Procedures. If a fair value price provided by a pricing service is unreliable, the Adviser will fair value the security using the Valuation Procedures. Issuer specific events, market trends, bid/ask quotes of brokers and information providers and other market data may be reviewed in the course of making a good faith determination of a security’s fair value.
The Fund may invest in securities that are subject to interest rate risk, meaning the risk that the prices will generally fall as interest rates rise and, conversely, the prices will generally rise as interest rates fall. Specific securities differ in their sensitivity to changes in interest rates depending on their individual characteristics. Changes in interest rates may result in increased market volatility, which may affect the value and/or liquidity of certain Fund investments.
Valuations change in response to many factors including the historical and prospective earnings of the issuer, the value of the issuer’s assets, general market conditions which are not specifically related to the particular issuer, such as real or perceived adverse economic conditions, changes in the general outlook for revenues or corporate earnings, changes in interest or currency rates, regional or global instability, natural or environmental disasters, widespread disease or other public health issues, war, acts of terrorism, significant governmental actions or adverse investor sentiment generally and market liquidity. Because of the inherent uncertainties of valuation, the values reflected in the financial statements may materially differ from the value received upon actual sale of those investments.
The price the Fund could receive upon the sale of any investment may differ from the Adviser’s valuation of the investment, particularly for securities that are valued using a fair valuation technique. When fair valuation techniques are applied, the Adviser uses available information, including both observable and unobservable inputs and assumptions, to determine a methodology that will result in a valuation that the Adviser believes approximates market value. Fund securities that are fair valued may be subject to greater fluctuation in their value from one day to the next than would be the case if market quotations were used. Because of the inherent uncertainties of valuation, and the degree of subjectivity in such decisions, the Fund could realize a greater or lesser than expected gain or loss upon the sale of the investment.
| | |
| 14 | | Invesco Main Street Fund® |
| B. | Securities Transactions and Investment Income – Securities transactions are accounted for on a trade date basis. Realized gains or losses on sales are computed on the basis of specific identification of the securities sold. Interest income (net of withholding tax, if any) is recorded on an accrual basis from settlement date and includes coupon interest and amortization of premium and accretion of discount on debt securities as applicable. Dividend income (net of withholding tax, if any) is recorded on the ex-dividend date. |
The Fund may periodically participate in litigation related to Fund investments. As such, the Fund may receive proceeds from litigation settlements. Any proceeds received are included in the Statement of Operations as realized gain (loss) for investments no longer held and as unrealized gain (loss) for investments still held.
Brokerage commissions and mark ups are considered transaction costs and are recorded as an increase to the cost basis of securities purchased and/or a reduction of proceeds on a sale of securities. Such transaction costs are included in the determination of net realized and unrealized gain (loss) from investment securities reported in the Statement of Operations and the Statement of Changes in Net Assets and the net realized and unrealized gains (losses) on securities per share in the Financial Highlights. Transaction costs are included in the calculation of the Fund’s net asset value and, accordingly, they reduce the Fund’s total returns. These transaction costs are not considered operating expenses and are not reflected in net investment income reported in the Statement of Operations and the Statement of Changes in Net Assets, or the net investment income per share and the ratios of expenses and net investment income reported in the Financial Highlights, nor are they limited by any expense limitation arrangements between the Fund and the investment adviser.
The Fund allocates income and realized and unrealized capital gains and losses to a class based on the relative net assets of each class.
| C. | Country Determination – For the purposes of making investment selection decisions and presentation in the Schedule of Investments, the investment adviser may determine the country in which an issuer is located and/or credit risk exposure based on various factors. These factors include the laws of the country under which the issuer is organized, where the issuer maintains a principal office, the country in which the issuer derives 50% or more of its total revenues, the country that has the primary market for the issuer’s securities and its “country of risk” as determined by a third party service provider, as well as other criteria. Among the other criteria that may be evaluated for making this determination are the country in which the issuer maintains 50% or more of its assets, the type of security, financial guarantees and enhancements, the nature of the collateral and the sponsor organization. Country of issuer and/or credit risk exposure has been determined to be the United States of America, unless otherwise noted. |
| D. | Distributions – Distributions from net investment income and net realized capital gain, if any, are generally declared and paid annually and recorded on the ex-dividend date. The Fund may elect to treat a portion of the proceeds from redemptions as distributions for federal income tax purposes. |
| E. | Federal Income Taxes – The Fund intends to comply with the requirements of Subchapter M of the Internal Revenue Code of 1986, as amended (the “Internal Revenue Code”), necessary to qualify as a regulated investment company and to distribute substantially all of the Fund’s taxable earnings to shareholders. As such, the Fund will not be subject to federal income taxes on otherwise taxable income (including net realized capital gain) that is distributed to shareholders. Therefore, no provision for federal income taxes is recorded in the financial statements. |
The Fund recognizes the tax benefits of uncertain tax positions only when the position is more likely than not to be sustained. Management has analyzed the Fund’s uncertain tax positions and concluded that no liability for unrecognized tax benefits should be recorded related to uncertain tax positions. Management is not aware of any tax positions for which it is reasonably possible that the total amounts of unrecognized tax benefits will change materially in the next 12 months.
The Fund files tax returns in the U.S. Federal jurisdiction and certain other jurisdictions. Generally, the Fund is subject to examinations by such taxing authorities for up to three years after the filing of the return for the tax period.
| F. | Expenses – Fees provided for under the Rule 12b-1 plan of a particular class of the Fund are charged to the operations of such class. Transfer agency fees and expenses and other shareholder recordkeeping fees and expenses attributable to Class R5 and Class R6 are allocated based on relative net assets of Class R5 and Class R6. Sub-accounting fees attributable to Class R5 are charged to the operations of the class. Transfer agency fees and expenses and other shareholder recordkeeping fees and expenses relating to all other classes are allocated among those classes based on relative net assets. All other expenses are allocated among the classes based on relative net assets. |
| G. | Accounting Estimates – The preparation of financial statements in conformity with accounting principles generally accepted in the United States of America (“GAAP”) requires management to make estimates and assumptions that affect the reported amounts of assets and liabilities at the date of the financial statements and the reported amounts of revenues and expenses during the reporting period including estimates and assumptions related to taxation. Actual results could differ from those estimates by a significant amount. In addition, the Fund monitors for material events or transactions that may occur or become known after the period-end date and before the date the financial statements are released to print. |
| H. | Indemnifications – Under the Trust’s organizational documents, each Trustee, officer, employee or other agent of the Trust is indemnified against certain liabilities that may arise out of the performance of their duties to the Fund. Additionally, in the normal course of business, the Fund enters into contracts, including the Fund’s servicing agreements, that contain a variety of indemnification clauses. The Fund’s maximum exposure under these arrangements is unknown as this would involve future claims that may be made against the Fund that have not yet occurred. The risk of material loss as a result of such indemnification claims is considered remote. |
| I. | Securities Lending – The Fund may lend portfolio securities having a market value up to one-third of the Fund’s total assets. Such loans are secured by collateral equal to no less than the market value of the loaned securities determined daily by the securities lending provider. Such collateral will be cash or debt securities issued or guaranteed by the U.S. Government or any of its sponsored agencies. Cash collateral received in connection with these loans is invested in short-term money market instruments or affiliated, unregistered investment companies that comply with Rule 2a-7 under the 1940 Act and money market funds (collectively, “affiliated money market funds”) and is shown as such on the Schedule of Investments. The Fund bears the risk of loss with respect to the investment of collateral. It is the Fund’s policy to obtain additional collateral from or return excess collateral to the borrower by the end of the next business day, following the valuation date of the securities loaned. Therefore, the value of the collateral held may be temporarily less than the value of the securities on loan. When loaning securities, the Fund retains certain benefits of owning the securities, including the economic equivalent of dividends or interest generated by the security. Lending securities entails a risk of loss to the Fund if, and to the extent that, the market value of the securities loaned were to increase and the borrower did not increase the collateral accordingly, and the borrower failed to return the securities. The securities loaned are subject to termination at the option of the borrower or the Fund. Upon termination, the borrower will return to the Fund the securities loaned and the Fund will return the collateral. Upon the failure of the borrower to return the securities, collateral may be liquidated and the securities may be purchased on the open market to replace the loaned securities. The Fund could experience delays and costs in gaining access to the collateral and the securities may lose value during the delay which could result in potential losses to the Fund. Some of these losses may be indemnified by the lending agent. The Fund bears the risk of any deficiency in the amount of the collateral available for return to the borrower due to any loss on the collateral invested. Dividends received on cash collateral investments for securities lending transactions, which are net of compensation to counterparties, are included in Dividends from affiliated money market funds on the Statement of Operations. The aggregate value of securities out on loan, if any, is shown as a footnote on the Statement of Assets and Liabilities. |
The Adviser serves as an affiliated securities lending agent for the Fund. The Bank of New York Mellon also serves as a securities lending agent. To the extent the Fund utilizes the Adviser as an affiliated securities lending agent, the Fund conducts its securities lending in accordance with, and in reliance upon, no-action letters issued by the SEC staff that provide guidance on how an affiliate may act as a direct agent lender and receive compensation for those services in a manner consistent with the federal securities laws. For the year ended October 31, 2023, the Fund paid the Adviser $153,642 in fees for securities lending agent services. Fees paid to the Adviser for securities lending agent services, if any, are included in Dividends from affiliated money market funds on the Statement of Operations.
| J. | Foreign Currency Translations – Foreign currency is valued at the close of the NYSE based on quotations posted by banks and major currency dealers. |
| | |
| 15 | | Invesco Main Street Fund® |
| | Portfolio securities and other assets and liabilities denominated in foreign currencies are translated into U.S. dollar amounts at the date of valuation. Purchases and sales of portfolio securities (net of foreign taxes withheld on disposition) and income items denominated in foreign currencies are translated into U.S. dollar amounts on the respective dates of such transactions. The Fund does not separately account for the portion of the results of operations resulting from changes in foreign exchange rates on investments and the fluctuations arising from changes in market prices of securities held. The combined results of changes in foreign exchange rates and the fluctuation of market prices on investments (net of estimated foreign tax withholding) are included with the net realized and unrealized gain or loss from investments in the Statement of Operations. Reported net realized foreign currency gains or losses arise from (1) sales of foreign currencies, (2) currency gains or losses realized between the trade and settlement dates on securities transactions, and (3) the difference between the amounts of dividends, interest, and foreign withholding taxes recorded on the Fund’s books and the U.S. dollar equivalent of the amounts actually received or paid. Net unrealized foreign currency gains and losses arise from changes in the fair values of assets and liabilities, other than investments in securities at fiscal period end, resulting from changes in exchange rates. |
The Fund may invest in foreign securities, which may be subject to foreign taxes on income, gains on investments or currency repatriation, a portion of which may be recoverable. Foreign taxes, if any, are recorded based on the tax regulations and rates that exist in the foreign markets in which the Fund invests and are shown in the Statement of Operations.
| K. | Forward Foreign Currency Contracts – The Fund may engage in foreign currency transactions either on a spot (i.e. for prompt delivery and settlement) basis, or through forward foreign currency contracts, to manage or minimize currency or exchange rate risk. |
The Fund may also enter into forward foreign currency contracts for the purchase or sale of a security denominated in a foreign currency in order to “lock in” the U.S. dollar price of that security, or the Fund may also enter into forward foreign currency contracts that do not provide for physical exchange of the two currencies on the settlement date, but instead are settled by a single cash payment calculated as the difference between the agreed upon exchange rate and the spot rate at settlement based upon an agreed upon notional amount (non-deliverable forwards).
A forward foreign currency contract is an obligation between two parties (“Counterparties”) to purchase or sell a specific currency for an agreed-upon price at a future date. The use of forward foreign currency contracts for hedging does not eliminate fluctuations in the price of the underlying securities the Fund owns or intends to acquire but establishes a rate of exchange in advance. Fluctuations in the value of these contracts are measured by the difference in the contract date and reporting date exchange rates and are recorded as unrealized appreciation (depreciation) until the contracts are closed. When the contracts are closed, realized gains (losses) are recorded. Realized and unrealized gains (losses) on the contracts are included in the Statement of Operations. The primary risks associated with forward foreign currency contracts include failure of the Counterparty to meet the terms of the contract and the value of the foreign currency changing unfavorably. These risks may be in excess of the amounts reflected in the Statement of Assets and Liabilities.
NOTE 2–Advisory Fees and Other Fees Paid to Affiliates
The Trust has entered into a master investment advisory agreement with the Adviser. Under the terms of the investment advisory agreement, the Fund accrues daily and pays monthly an advisory fee to the Adviser based on the annual rate of the Fund’s average daily net assets as follows:
| | |
| Average Daily Net Assets | | Rate* |
First $200 million | | 0.650% |
Next $150 million | | 0.600% |
Next $150 million | | 0.550% |
Next $9.5 billion | | 0.450% |
Over $10 billion | | 0.430% |
| * | The advisory fee paid by the Fund shall be reduced by any amounts paid by the Fund under the administrative services agreement with the Adviser. |
For the year ended October 31, 2023, the effective advisory fee rate incurred by the Fund was 0.44%.
Under the terms of a master sub-advisory agreement between the Adviser and each of Invesco Asset Management Deutschland GmbH, Invesco Asset Management Limited, Invesco Asset Management (Japan) Limited, Invesco Hong Kong Limited, Invesco Senior Secured Management, Inc. and Invesco Canada Ltd. and separate sub-advisory agreements with Invesco Capital Management LLC and Invesco Asset Management (India) Private Limited (collectively, the “Affiliated Sub-Advisers”) the Adviser, not the Fund, will pay 40% of the fees paid to the Adviser to any such Affiliated Sub-Adviser(s) that provide(s) discretionary investment management services to the Fund based on the percentage of assets allocated to such Affiliated Sub-Adviser(s). Invesco has also entered into a sub-advisory agreement with OppenheimerFunds, Inc. to provide discretionary management services to the Fund.
Effective July 1, 2023, the Adviser has agreed, for an indefinite period, to waive advisory fees and/or reimburse expenses of all shares to the extent necessary to limit total annual fund operating expenses after fee waiver and/or expense reimbursement (excluding certain items discussed below) of Class A, Class C, Class R, Class Y, Class R5 and Class R6 shares to 2.00%, 2.75%, 2.25%, 1.75%, 1.75% and 1.75%, respectively, of the Fund’s average daily net assets (the “boundary limits”). Prior to July 1, 2023, the same boundary limits were in effect with an expiration date of June 30, 2023. In determining the Adviser’s obligation to waive advisory fees and/or reimburse expenses, the following expenses are not taken into account, and could cause the total annual fund operating expenses after fee waiver and/or expense reimbursement to exceed the numbers reflected above: (1) interest; (2) taxes; (3) dividend expense on short sales; (4) extraordinary or non-routine items, including litigation expenses; and (5) expenses that the Fund has incurred but did not actually pay because of an expense offset arrangement. Invesco may amend and/or terminate these boundary limits at any time in its sole discretion and will inform the Board of Trustees of any such changes. The Adviser did not waive fees and/or reimburse expenses during the period under these boundary limits.
Further, the Adviser has contractually agreed, through at least June 30, 2025, to waive the advisory fee payable by the Fund in an amount equal to 100% of the net advisory fees the Adviser receives from the affiliated money market funds on investments by the Fund of uninvested cash (excluding investments of cash collateral from securities lending) in such affiliated money market funds.
For the year ended October 31, 2023, the Adviser waived advisory fees of $136,023.
The Trust has entered into a master administrative services agreement with Invesco pursuant to which the Fund has agreed to pay Invesco for certain administrative costs incurred in providing accounting services to the Fund. For the year ended October 31, 2023, expenses incurred under the agreement are shown in the Statement of Operations as Administrative services fees. Invesco has entered into a sub-administration agreement whereby State Street Bank and Trust Company (“SSB”) serves as fund accountant and provides certain administrative services to the Fund. Pursuant to a custody agreement with the Trust on behalf of the Fund, SSB also serves as the Fund’s custodian.
The Trust has entered into a transfer agency and service agreement with Invesco Investment Services, Inc. (“IIS”) pursuant to which the Fund has agreed to pay IIS a fee for providing transfer agency and shareholder services to the Fund and reimburse IIS for certain expenses incurred by IIS in the course of providing such services. IIS may make payments to intermediaries that provide omnibus account services, sub-accounting services and/or networking services. All fees payable by IIS to intermediaries that provide omnibus account services or sub-accounting services are charged back to the Fund, subject to certain limitations approved by the Trust’s Board of Trustees. For the year ended October 31, 2023, expenses incurred under the agreement are shown in the Statement of Operations as Transfer agent fees.
| | |
| 16 | | Invesco Main Street Fund® |
The Trust has entered into master distribution agreements with Invesco Distributors, Inc. (“IDI”) to serve as the distributor for the Class A, Class C, Class R, Class Y, Class R5 and Class R6 shares of the Fund. The Trust has adopted plans pursuant to Rule 12b-1 under the 1940 Act with respect to the Fund’s Class A, Class C and Class R shares (collectively, the “Plans”). The Fund, pursuant to the Class A Plan, reimburses IDI for its allocated share of expenses incurred for the period, up to a maximum annual rate of 0.25% of the average daily net assets of Class A shares. The Fund, pursuant to the Class C and Class R Plans, pays IDI compensation at the annual rate of 1.00% of the average daily net assets of Class C shares and 0.50% of the average daily net assets of Class R shares. The fees are accrued daily and paid monthly. Of the Plans payments, up to 0.25% of the average daily net assets of each class of shares may be paid to furnish continuing personal shareholder services to customers who purchase and own shares of such classes. Any amounts not paid as a service fee under the Plans would constitute an asset-based sales charge. Rules of the Financial Industry Regulatory Authority (“FINRA”) impose a cap on the total sales charges, including asset-based sales charges, that may be paid by any class of shares of the Fund. For the year ended October 31, 2023, expenses incurred under the Plans are shown in the Statement of Operations as Distribution fees.
Front-end sales commissions and CDSC (collectively, the “sales charges”) are not recorded as expenses of the Fund. Front-end sales commissions are deducted from proceeds from the sales of Fund shares prior to investment in Class A shares of the Fund. CDSC are deducted from redemption proceeds prior to remittance to the shareholder. During the year ended October 31, 2023, IDI advised the Fund that IDI retained $524,298 in front-end sales commissions from the sale of Class A shares and $7,386 and $3,104 from Class A and Class C shares, respectively, for CDSC imposed upon redemptions by shareholders.
For the year ended October 31, 2023, the Fund incurred $4,993 in brokerage commissions with Invesco Capital Markets, Inc., an affiliate of the Adviser and IDI, for portfolio transactions executed on behalf of the Fund.
Certain officers and trustees of the Trust are officers and directors of the Adviser, IIS and/or IDI.
NOTE 3–Additional Valuation Information
GAAP defines fair value as the price that would be received to sell an asset or paid to transfer a liability in an orderly transaction between market participants at the measurement date, under current market conditions. GAAP establishes a hierarchy that prioritizes the inputs to valuation methods, giving the highest priority to readily available unadjusted quoted prices in an active market for identical assets (Level 1) and the lowest priority to significant unobservable inputs (Level 3), generally when market prices are not readily available. Based on the valuation inputs, the securities or other investments are tiered into one of three levels. Changes in valuation methods may result in transfers in or out of an investment’s assigned level:
| | |
| Level 1 - | | Prices are determined using quoted prices in an active market for identical assets. |
| Level 2 - | | Prices are determined using other significant observable inputs. Observable inputs are inputs that other market participants may use in pricing a security. These may include quoted prices for similar securities, interest rates, prepayment speeds, credit risk, yield curves, loss severities, default rates, discount rates, volatilities and others. |
| Level 3 - | | Prices are determined using significant unobservable inputs. In situations where quoted prices or observable inputs are unavailable (for example, when there is little or no market activity for an investment at the end of the period), unobservable inputs may be used. Unobservable inputs reflect the Adviser’s assumptions about the factors market participants would use in determining fair value of the securities or instruments and would be based on the best available information. |
The following is a summary of the tiered valuation input levels, as of October 31, 2023. The level assigned to the securities valuations may not be an indication of the risk or liquidity associated with investing in those securities. Because of the inherent uncertainties of valuation, the values reflected in the financial statements may materially differ from the value received upon actual sale of those investments.
| | | | | | | | | | | | | | |
| | | Level 1 | | | Level 2 | | | Level 3 | | | Total |
Investments in Securities | | | | | | | | | | | | | | |
Common Stocks & Other Equity Interests | | $ | 8,422,673,033 | | | $ | – | | | | $– | | | $8,422,673,033 |
Money Market Funds | | | 143,902,835 | | | | 106,908,356 | | | | – | | | 250,811,191 |
Total Investments | | $ | 8,566,575,868 | | | $ | 106,908,356 | | | | $– | | | $8,673,484,224 |
NOTE 4–Expense Offset Arrangement(s)
The expense offset arrangement is comprised of transfer agency credits which result from balances in demand deposit accounts used by the transfer agent for clearing shareholder transactions. For the year ended October 31, 2023, the Fund received credits from this arrangement, which resulted in the reduction of the Fund’s total expenses of $283,372.
NOTE 5–Trustees’ and Officers’ Fees and Benefits
Trustees’ and Officers’ Fees and Benefits include amounts accrued by the Fund to pay remuneration to certain Trustees and Officers of the Fund. Trustees have the option to defer compensation payable by the Fund, and Trustees’ and Officers’ Fees and Benefits also include amounts accrued by the Fund to fund such deferred compensation amounts. Those Trustees who defer compensation have the option to select various Invesco Funds in which their deferral accounts shall be deemed to be invested. Finally, certain current Trustees were eligible to participate in a retirement plan that provided for benefits to be paid upon retirement to Trustees over a period of time based on the number of years of service. The Fund may have certain former Trustees who also participate in a retirement plan and receive benefits under such plan. Trustees’ and Officers’ Fees and Benefits include amounts accrued by the Fund to fund such retirement benefits. Obligations under the deferred compensation and retirement plans represent unsecured claims against the general assets of the Fund.
NOTE 6–Cash Balances
The Fund is permitted to temporarily carry a negative or overdrawn balance in its account with SSB, the custodian bank. Such balances, if any at period-end, are shown in the Statement of Assets and Liabilities under the payable caption Amount due custodian. To compensate the custodian bank for such overdrafts, the overdrawn Fund may either (1) leave funds as a compensating balance in the account so the custodian bank can be compensated by earning the additional interest; or (2) compensate by paying the custodian bank at a rate agreed upon by the custodian bank and Invesco, not to exceed the contractually agreed upon rate.
| | |
| 17 | | Invesco Main Street Fund® |
NOTE 7–Distributions to Shareholders and Tax Components of Net Assets
Tax Character of Distributions to Shareholders Paid During the Fiscal Years Ended October 31, 2023 and 2022:
| | | | | | | | | | |
| | | 2023 | | | | | | 2022 |
Ordinary income* | | $ | 88,363,552 | | | | | | | $ 307,285,409 |
Long-term capital gain | | | 296,180,704 | | | | | | | 1,589,220,911 |
Total distributions | | $ | 384,544,256 | | | | | | | $1,896,506,320 |
| * | Includes short-term capital gain distributions, if any. |
Tax Components of Net Assets at Period-End:
| | | | |
| | | 2023 | |
|
| |
Undistributed ordinary income | | $ | 36,665,054 | |
|
| |
Undistributed long-term capital gain | | | 619,364,613 | |
|
| |
Net unrealized appreciation – investments | | | 1,352,701,712 | |
|
| |
Net unrealized appreciation – foreign currencies | | | 11,319 | |
|
| |
Temporary book/tax differences | | | (542,764 | ) |
|
| |
Shares of beneficial interest | | | 6,618,197,931 | |
|
| |
Total net assets | | $ | 8,626,397,865 | |
|
| |
The difference between book-basis and tax-basis unrealized appreciation (depreciation) is due to differences in the timing of recognition of gains and losses on investments for tax and book purposes. The Fund’s net unrealized appreciation (depreciation) difference is attributable primarily to wash sales.
The temporary book/tax differences are a result of timing differences between book and tax recognition of income and/or expenses. The Fund’s temporary book/tax differences are the result of the trustee deferral of compensation and retirement plan benefits.
Capital loss carryforward is calculated and reported as of a specific date. Results of transactions and other activity after that date may affect the amount of capital loss carryforward actually available for the Fund to utilize. The ability to utilize capital loss carryforward in the future may be limited under the Internal Revenue Code and related regulations based on the results of future transactions.
The Fund does not have a capital loss carryforward as of October 31, 2023.
NOTE 8–Investment Transactions
The aggregate amount of investment securities (other than short-term securities, U.S. Government obligations and money market funds, if any) purchased and sold by the Fund during the year ended October 31, 2023 was $5,858,530,589 and $6,580,121,892, respectively. Cost of investments, including any derivatives, on a tax basis includes the adjustments for financial reporting purposes as of the most recently completed federal income tax reporting period-end.
| | | | |
Unrealized Appreciation (Depreciation) of Investments on a Tax Basis | |
Aggregate unrealized appreciation of investments | | | $1,625,421,895 | |
|
| |
Aggregate unrealized (depreciation) of investments | | | (272,720,183 | ) |
|
| |
Net unrealized appreciation of investments | | | $1,352,701,712 | |
|
| |
Cost of investments for tax purposes is $7,320,782,512.
NOTE 9–Reclassification of Permanent Differences
Primarily as a result of differing book/tax treatment of equalization and partnerships, on October 31, 2023, undistributed net investment income was increased by $24,675,719, undistributed net realized gain was decreased by $59,965,625 and shares of beneficial interest was increased by $35,289,906. This reclassification had no effect on the net assets of the Fund.
NOTE 10–Share Information
| | | | | | | | | | | | | | | | |
| | | Summary of Share Activity | |
|
| |
| | |
| | | Year ended | | | Year ended | |
| | | October 31, 2023(a) | | | October 31, 2022 | |
| | | Shares | | | Amount | | | Shares | | | Amount | |
|
| |
Sold: | | | | | | | | | | | | | | | | |
Class A | | | 5,281,896 | | | $ | 250,594,781 | | | | 5,515,097 | | | $ | 286,153,535 | |
|
| |
Class C | | | 524,431 | | | | 22,285,230 | | | | 614,975 | | | | 28,745,155 | |
|
| |
Class R | | | 735,243 | | | | 33,473,101 | | | | 862,632 | | | | 43,379,804 | |
|
| |
Class Y | | | 1,234,389 | | | | 58,520,923 | | | | 1,760,226 | | | | 91,226,530 | |
|
| |
Class R6 | | | 1,241,561 | | | | 58,952,227 | | | | 1,302,410 | | | | 67,501,167 | |
|
| |
| | | | |
Issued as reinvestment of dividends: | | | | | | | | | | | | | | | | |
Class A | | | 7,177,272 | | | | 310,560,468 | | | | 27,281,239 | | | | 1,522,293,487 | |
|
| |
Class C | | | 210,622 | | | | 8,210,062 | | | | 1,018,369 | | | | 51,366,549 | |
|
| |
Class R | | | 240,424 | | | | 10,047,332 | | | | 906,909 | | | | 48,936,816 | |
|
| |
Class Y | | | 421,799 | | | | 18,052,986 | | | | 1,610,238 | | | | 88,949,527 | |
|
| |
Class R6 | | | 417,507 | | | | 17,856,791 | | | | 1,610,402 | | | | 88,910,299 | |
|
| |
| | |
| 18 | | Invesco Main Street Fund® |
| | | | | | | | | | | | | | | | |
| | | Summary of Share Activity | |
|
| |
| | |
| | | Year ended | | | Year ended | |
| | | October 31, 2023(a) | | | October 31, 2022 | |
| | | Shares | | | Amount | | | Shares | | | Amount | |
|
| |
| | | | |
Automatic conversion of Class C shares to Class A shares: | | | | | | | | | | | | | | | | |
Class A | | | 505,166 | | | $ | 23,733,472 | | | | 532,376 | | | $ | 26,984,692 | |
|
| |
Class C | | | (562,639 | ) | | | (23,733,472 | ) | | | (590,071 | ) | | | (26,984,692 | ) |
|
| |
| | | | |
Reacquired: | | | | | | | | | | | | | | | | |
Class A | | | (18,560,384 | ) | | | (876,991,061 | ) | | | (18,631,122 | ) | | | (948,585,282 | ) |
|
| |
Class C | | | (762,942 | ) | | | (32,398,279 | ) | | | (1,018,106 | ) | | | (47,203,402 | ) |
|
| |
Class R | | | (876,873 | ) | | | (40,026,776 | ) | | | (978,431 | ) | | | (48,026,859 | ) |
|
| |
Class Y | | | (2,262,815 | ) | | | (104,601,352 | ) | | | (2,729,973 | ) | | | (138,378,943 | ) |
|
| |
Class R6 | | | (1,723,938 | ) | | | (80,760,101 | ) | | | (2,600,713 | ) | | | (134,137,039 | ) |
|
| |
Net increase (decrease) in share activity | | | (6,759,281 | ) | | $ | (346,223,668 | ) | | | 16,466,457 | | | $ | 1,001,131,344 | |
|
| |
| (a) | There is an entity that is a record owner of more than 5% of the outstanding shares of the Fund and owns 9% of the outstanding shares of the Fund. IDI has an agreement with this entity to sell Fund shares. The Fund, Invesco and/or Invesco affiliates may make payments to this entity, which is considered to be related to the Fund, for providing services to the Fund, Invesco and/or Invesco affiliates including but not limited to services such as, securities brokerage, distribution, third party record keeping and account servicing. The Fund has no knowledge as to whether all or any portion of the shares owned of record by this entity are also owned beneficially. |
| | |
| 19 | | Invesco Main Street Fund® |
Report of Independent Registered Public Accounting Firm
To the Board of Trustees of AIM Equity Funds (Invesco Equity Funds) and Shareholders of Invesco Main Street Fund®
Opinion on the Financial Statements
We have audited the accompanying statement of assets and liabilities, including the schedule of investments, of Invesco Main Street Fund® (one of the funds constituting AIM Equity Funds (Invesco Equity Funds), referred to hereafter as the “Fund”) as of October 31, 2023, the related statement of operations for the year ended October 31, 2023, the statement of changes in net assets for each of the two years in the period ended October 31, 2023, including the related notes, and the financial highlights for each of the periods indicated therein (collectively referred to as the “financial statements”). In our opinion, the financial statements present fairly, in all material respects, the financial position of the Fund as of October 31, 2023, the results of its operations for the year then ended, the changes in its net assets for each of the two years in the period ended October 31, 2023 and the financial highlights for each of the periods indicated therein in conformity with accounting principles generally accepted in the United States of America.
Basis for Opinion
These financial statements are the responsibility of the Fund’s management. Our responsibility is to express an opinion on the Fund’s financial statements based on our audits. We are a public accounting firm registered with the Public Company Accounting Oversight Board (United States) (PCAOB) and are required to be independent with respect to the Fund in accordance with the U.S. federal securities laws and the applicable rules and regulations of the Securities and Exchange Commission and the PCAOB.
We conducted our audits of these financial statements in accordance with the standards of the PCAOB. Those standards require that we plan and perform the audit to obtain reasonable assurance about whether the financial statements are free of material misstatement, whether due to error or fraud.
Our audits included performing procedures to assess the risks of material misstatement of the financial statements, whether due to error or fraud, and performing procedures that respond to those risks. Such procedures included examining, on a test basis, evidence regarding the amounts and disclosures in the financial statements. Our audits also included evaluating the accounting principles used and significant estimates made by management, as well as evaluating the overall presentation of the financial statements. Our procedures included confirmation of securities owned as of October 31, 2023 by correspondence with the custodian, transfer agent and brokers. We believe that our audits provide a reasonable basis for our opinion.
/s/PricewaterhouseCoopers LLP
Houston, Texas
December 21, 2023
We have served as the auditor of one or more of the investment companies in the Invesco group of investment companies since at least 1995. We have not been able to determine the specific year we began serving as auditor.
| | |
| 20 | | Invesco Main Street Fund® |
Calculating your ongoing Fund expenses
Example
As a shareholder of the Fund, you incur two types of costs: (1) transaction costs, which may include sales charges (loads) on purchase payments or contingent deferred sales charges on redemptions, if any; and (2) ongoing costs, including management fees, distribution and/or service (12b-1) fees, and other Fund expenses. This example is intended to help you understand your ongoing costs (in dollars) of investing in the Fund and to compare these costs with ongoing costs of investing in other mutual funds. The example is based on an investment of $1,000 invested at the beginning of the period and held for the entire period May 1, 2023 through October 31, 2023.
Actual expenses
The table below provides information about actual account values and actual expenses. You may use the information in this table, together with the amount you invested, to estimate the expenses that you paid over the period. Simply divide your account value by $1,000 (for example, an $8,600 account value divided by $1,000 = 8.6), then multiply the result by the number in the table under the heading entitled “Actual Expenses Paid During Period” to estimate the expenses you paid on your account during this period.
Hypothetical example for comparison purposes
The table below also provides information about hypothetical account values and hypothetical expenses based on the Fund’s actual expense ratio and an assumed rate of return of 5% per year before expenses, which is not the Fund’s actual return.
The hypothetical account values and expenses may not be used to estimate the actual ending account balance or expenses you paid for the period. You may use this information to compare the ongoing costs of investing in the Fund and other funds. To do so, compare this 5% hypothetical example with the 5% hypothetical examples that appear in the shareholder reports of the other funds.
Please note that the expenses shown in the table are meant to highlight your ongoing costs only and do not reflect any transaction costs, such as sales charges (loads) on purchase payments or contingent deferred sales charges on redemptions, if any. Therefore, the hypothetical information is useful in comparing ongoing costs only, and will not help you determine the relative total costs of owning different funds. In addition, if these transaction costs were included, your costs would have been higher.
| | | | | | | | | | | | |
| | | | | ACTUAL | | HYPOTHETICAL (5% annual return before expenses) | | |
| | | Beginning Account Value (05/01/23) | | Ending Account Value (10/31/23)1 | | Expenses Paid During Period2 | | Ending Account Value (10/31/23) | | Expenses Paid During Period2 | | Annualized Expense Ratio |
Class A | | $1,000.00 | | $988.20 | | $4.01 | | $1,021.17 | | $4.08 | | 0.80% |
Class C | | 1,000.00 | | 984.30 | | 7.85 | | 1,017.29 | | 7.98 | | 1.57 |
Class R | | 1,000.00 | | 986.90 | | 5.36 | | 1,019.81 | | 5.45 | | 1.07 |
Class Y | | 1,000.00 | | 989.30 | | 2.86 | | 1,022.33 | | 2.91 | | 0.57 |
Class R5 | | 1,000.00 | | 989.80 | | 2.51 | | 1,022.68 | | 2.55 | | 0.50 |
Class R6 | | 1,000.00 | | 989.80 | | 2.51 | | 1,022.68 | | 2.55 | | 0.50 |
| 1 | The actual ending account value is based on the actual total return of the Fund for the period May 1, 2023 through October 31, 2023, after actual expenses and will differ from the hypothetical ending account value which is based on the Fund’s expense ratio and a hypothetical annual return of 5% before expenses. |
| 2 | Expenses are equal to the Fund’s annualized expense ratio as indicated above multiplied by the average account value over the period, multiplied by 184/365 to reflect the most recent fiscal half year. |
| | |
| 21 | | Invesco Main Street Fund® |
Approval of Investment Advisory and Sub-Advisory Contracts
At meetings held on June 13, 2023, the Board of Trustees (the Board or the Trustees) of AIM Equity Funds (Invesco Equity Funds) as a whole, and the independent Trustees, who comprise over 75% of the Board, voting separately, approved the continuance of the Invesco Main Street Fund®’s (the Fund) Master Investment Advisory Agreement with Invesco Advisers, Inc. (Invesco Advisers and the investment advisory agreement) and the Master Intergroup Sub-Advisory Contract for Mutual Funds with Invesco Asset Management Deutschland GmbH, Invesco Asset Management Limited, Invesco Asset Management (Japan) Limited, Invesco Hong Kong Limited, Invesco Senior Secured Management, Inc. and Invesco Canada Ltd. and separate sub-advisory contracts with Invesco Capital Management LLC and Invesco Asset Management (India) Private Limited and OppenheimerFunds, Inc. (collectively, the Affiliated Sub-Advisers and the sub-advisory contracts) for another year, effective July 1, 2023. After evaluating the factors discussed below, among others, the Board approved the renewal of the Fund’s investment advisory agreement and the sub-advisory contracts and determined that the compensation payable thereunder by the Fund to Invesco Advisers and by Invesco Advisers to the Affiliated Sub-Advisers is fair and reasonable.
The Board’s Evaluation Process
The Board has established an Investments Committee, which in turn has established Sub-Committees, that meet throughout the year to review the performance of funds advised by Invesco Advisers (the Invesco Funds). The Sub-Committees meet regularly with portfolio managers for their assigned Invesco Funds and other members of management to review information about investment performance and portfolio attributes of these funds. The Board has established additional standing and ad hoc committees that meet regularly throughout the year to review matters within their purview, including a working group focused on opportunities to make ongoing and continuous improvements to the annual review process for the Invesco Funds’ investment advisory and sub-advisory contracts. The Board took into account evaluations and reports that it received from its committees and sub-committees, as well as the information provided to the Board and its committees and sub-committees throughout the year, in considering whether to approve each Invesco Fund’s investment advisory agreement and sub-advisory contracts.
As part of the contract renewal process, the Board reviews and considers information provided in response to requests for information submitted to management by the independent Trustees with assistance from legal counsel to the independent Trustees and the Senior Officer, an officer of the Invesco Funds who reports directly to the independent Trustees. The Board receives comparative investment performance and fee and expense data regarding the Invesco Funds prepared by Broadridge Financial Solutions, Inc. (Broadridge), an independent mutual fund data provider, as well as information on the composition of the peer groups provided by Broadridge and its methodology for determining peer groups. The Board also receives an independent written evaluation from the Senior
Officer. The Senior Officer’s evaluation is prepared as part of his responsibility to manage the process by which the Invesco Funds’ proposed management fees are negotiated during the annual contract renewal process to ensure they are negotiated in a manner that is at arms’ length and reasonable in accordance with certain negotiated regulatory requirements. In addition to meetings with Invesco Advisers and fund counsel throughout the year and as part of meetings convened on May 2, 2023 and June 13, 2023, the independent Trustees also discussed the continuance of the investment advisory agreement and sub-advisory contracts in separate sessions with the Senior Officer and with independent legal counsel. Also, as part of the contract renewal process, the independent Trustees reviewed and considered information provided in response to follow-up requests for information submitted by the independent Trustees to management. The independent Trustees met and discussed those follow-up responses with legal counsel to the independent Trustees and the Senior Officer.
The discussion below is a summary of the Senior Officer’s independent written evaluation with respect to the Fund’s investment advisory agreement and sub-advisory contracts, as well as a discussion of the material factors and related conclusions that formed the basis for the Board’s approval of the Fund’s investment advisory agreement and sub-advisory contracts. The Trustees’ review and conclusions are based on the comprehensive consideration of all information presented to them during the course of the year and in prior years and are not the result of any single determinative factor. Moreover, one Trustee may have weighed a particular piece of information or factor differently than another Trustee. The information received and considered by the Board was current as of various dates prior to the Board’s approval on June 13, 2023.
Factors and Conclusions and Summary of Independent Written Fee Evaluation
| A. | Nature, Extent and Quality of Services Provided by Invesco Advisers and the Affiliated Sub-Advisers |
The Board reviewed the nature, extent and quality of the advisory services provided to the Fund by Invesco Advisers under the Fund’s investment advisory agreement, and the credentials and experience of the officers and employees of Invesco Advisers who provide these services, including the Fund’s portfolio manager(s). The Board considered recent senior management changes at Invesco and Invesco Advisers, including the appointment of new Co-Heads of Investments, that had been presented to and discussed with the Board. The Board’s review included consideration of Invesco Advisers’ investment process and oversight, credit analysis, and research capabilities. The Board considered information regarding Invesco Advisers’ programs for and resources devoted to risk management, including management of investment, enterprise, operational, liquidity, derivatives, valuation and compliance risks, and technology used to manage such risks. The Board received information regarding Invesco’s methodology for compensating its investment professionals and the incentives and accountability it creates, as well as how it impacts Invesco’s ability to attract and retain talent. The Board received a
description of, and reports related to, Invesco Advisers’ global security program and business continuity plans and of its approach to data privacy and cybersecurity, including related testing. The Board also considered non-advisory services that Invesco Advisers and its affiliates provide to the Invesco Funds, such as various middle office and back office support functions, third party oversight, internal audit, valuation, portfolio trading and legal and compliance. The Board observed that Invesco Advisers’ systems preparedness and ongoing investment enabled Invesco Advisers to manage, operate and oversee the Invesco Funds with minimal impact or disruption through challenging environments. The Board reviewed and considered the benefits to shareholders of investing in a Fund that is part of the family of funds under the umbrella of Invesco Ltd., Invesco Advisers’ parent company, and noted Invesco Ltd.’s depth and experience in running an investment management business, as well as its commitment of financial and other resources to such business. The Board concluded that the nature, extent and quality of the services provided to the Fund by Invesco Advisers are appropriate and satisfactory.
The Board reviewed the services that may be provided to the Fund by the Affiliated Sub-Advisers under the sub-advisory contracts and the credentials and experience of the officers and employees of the Affiliated Sub-Advisers who provide these services. The Board noted the Affiliated Sub-Advisers’ expertise with respect to certain asset classes and that the Affiliated Sub-Advisers have offices and personnel that are located in financial centers around the world. As a result, the Board noted that the Affiliated Sub-Advisers can provide research and investment analysis on the markets and economies of various countries and territories in which the Fund may invest, make recommendations regarding securities and assist with portfolio trading. The Board concluded that the sub-advisory contracts may benefit the Fund and its shareholders by permitting Invesco Advisers to use the resources and talents of the Affiliated Sub-Advisers in managing the Fund. The Board concluded that the nature, extent and quality of the services that may be provided to the Fund by the Affiliated Sub-Advisers are appropriate and satisfactory.
| B. | Fund Investment Performance |
The Board considered Fund investment performance as a relevant factor in considering whether to approve the investment advisory agreement. The Board did not view Fund investment performance as a relevant factor in considering whether to approve the sub-advisory contracts for the Fund, as no Affiliated Sub-Adviser currently manages assets of the Fund.
The Board compared the Fund’s investment performance over multiple time periods ending December 31, 2022 to the performance of funds in the Broadridge performance universe and against the S&P 500® Index (Index). The Board noted that performance of Class A shares of the Fund was in the fourth quintile of its performance universe for the one year period and the fifth quintile for the three and five year periods (the first quintile being the best performing funds and the fifth quintile being the worst performing funds). The Board noted that performance of Class A shares of the Fund was below
| | |
| 22 | | Invesco Main Street Fund® |
the performance of the Index for the one, three and five year periods. The Board considered that the Fund was created in connection with Invesco Ltd.’s acquisition of OppenheimerFunds, Inc. and its subsidiaries (the “Transaction”) and that the Fund’s performance prior to the closing of the Transaction on May 24, 2019 is that of its predecessor fund. The Board considered that stock selection in and underweight exposure to certain sectors detracted from the Fund’s relative performance. The Board recognized that the performance data reflects a snapshot in time as of a particular date and that selecting a different performance period could produce different results. The Board also reviewed more recent Fund performance as well as other performance metrics, which did not change its conclusions.
| C. | Advisory and Sub-Advisory Fees and Fund Expenses |
The Board compared the Fund’s contractual management fee rate to the contractual management fee rates of funds in the Fund’s Broadridge expense group. The Board noted that the contractual management fee rate for Class A shares of the Fund was below the median contractual management fee rate of funds in its expense group. The Board noted that the term “contractual management fee” for funds in the expense group may include both advisory and certain non-portfolio management administrative services fees, but that Broadridge is not able to provide information on a fund-by-fund basis as to what is included. The Board also reviewed the methodology used by Broadridge in calculating expense group information, which includes using each fund’s contractual management fee schedule (including any applicable breakpoints) as reported in the most recent prospectus or statement of additional information for each fund in the expense group. The Board also considered comparative information regarding the Fund’s total expense ratio and its various components.
The Board noted that Invesco Advisers has contractually agreed to waive fees and/or limit expenses of the Fund for the term disclosed in the Fund’s registration statement in an amount necessary to limit total annual operating expenses to a specified percentage of average daily net assets for each class of the Fund.
The Board also considered the fees charged by Invesco Advisers and its affiliates to other client accounts that are similarly managed. Invesco Advisers reviewed with the Board differences in the scope of services it provides to the Invesco Funds relative to that provided by Invesco Advisers and its affiliates to certain other types of client accounts, including, among others: management of cash flows as a result of redemptions and purchases; necessary infrastructure such as officers, office space, technology, legal and distribution; oversight of service providers; costs and business risks associated with launching new funds and sponsoring and maintaining the product line; and compliance with federal and state laws and regulations. Invesco Advisers also advised the Board that many of the similarly managed client accounts have all-inclusive fee structures, which are not easily un-bundled.
The Board also compared the Fund’s effective advisory fee rate (defined for this purpose as the advisory fee rate after advisory fee waivers and before other expense limitations/waivers) to the effective advisory fee rates of other similarly managed third-party mutual funds advised or
sub-advised by Invesco Advisers and its affiliates, based on asset balances as of December 31, 2022.
The Board also considered the services that may be provided by the Affiliated Sub-Advisers pursuant to the sub-advisory contracts, as well as the fees payable by Invesco Advisers to the Affiliated Sub-Advisers pursuant to the sub-advisory contracts.
| D. | Economies of Scale and Breakpoints |
The Board considered the extent to which there may be economies of scale in the provision of advisory services to the Fund and the Invesco Funds, and the extent to which such economies of scale are shared with the Fund and the Invesco Funds. The Board acknowledged the difficulty in calculating and measuring economies of scale at the individual fund level; noting that only indicative and estimated measures are available at the individual fund level and that such measures are subject to uncertainty. The Board considered that the Fund benefits from economies of scale through contractual breakpoints in the Fund’s advisory fee schedule, which generally operate to reduce the Fund’s expense ratio as it grows in size. The Board noted that the Fund also shares in economies of scale through Invesco Advisers’ ability to negotiate lower fee arrangements with third party service providers. The Board noted that the Fund may also benefit from economies of scale through initial fee setting, fee waivers and expense reimbursements, as well as Invesco Advisers’ investment in its business, including investments in business infrastructure, technology and cybersecurity.
| E. | Profitability and Financial Resources |
The Board reviewed information from Invesco Advisers concerning the costs of the advisory and other services that Invesco Advisers and its affiliates provide to the Fund and the Invesco Funds and the profitability of Invesco Advisers and its affiliates in providing these services in the aggregate and on an individual fund-by-fund basis. The Board considered the methodology used for calculating profitability and the periodic review and enhancement of such methodology. The Board noted that Invesco Advisers continues to operate at a net profit from services Invesco Advisers and its affiliates provide to the Invesco Funds in the aggregate and to most Invesco Funds individually. The Board considered that profits to Invesco Advisers can vary significantly depending on the particular Invesco Fund, with some Invesco Funds showing indicative losses to Invesco Advisers and others showing indicative profits at healthy levels, and that Invesco Advisers’ support for and commitment to an Invesco Fund are not, however, solely dependent on the profits realized as to that Fund. The Board did not deem the level of profits realized by Invesco Advisers and its affiliates from providing such services to be excessive, given the nature, extent and quality of the services provided. The Board noted that Invesco Advisers provided information demonstrating that Invesco Advisers is financially sound and has the resources necessary to perform its obligations under the investment advisory agreement, and provided representations indicating that the Affiliated Sub-Advisers are financially sound and have the resources necessary to perform their obligations under the sub-advisory contracts. The Board noted the cyclical and competitive nature of the global asset management industry.
| F. | Collateral Benefits to Invesco Advisers and its Affiliates |
The Board considered various other benefits received by Invesco Advisers and its affiliates from the relationship with the Fund, including the fees received for providing administrative, transfer agency and distribution services to the Fund. The Board received comparative information regarding fees charged for these services, including information provided by Broadridge and other independent sources. The Board reviewed the performance of Invesco Advisers and its affiliates in providing these services and the organizational structure employed to provide these services. The Board noted that these services are provided to the Fund pursuant to written contracts that are reviewed and subject to approval on an annual basis by the Board based on its determination that the services are required for the operation of the Fund.
The Board considered the benefits realized by Invesco Advisers and the Affiliated Sub-Advisers as a result of portfolio brokerage transactions executed through “soft dollar” arrangements. The Board noted that soft dollar arrangements may result in the Fund bearing costs to purchase research that may be used by Invesco Advisers or the Affiliated Sub-Advisers with other clients and may reduce Invesco Advisers’ or the Affiliated Sub-Advisers’ expenses. The Board also considered that it receives from Invesco Advisers periodic reports that include a representation to the effect that these arrangements are consistent with regulatory requirements. The Board did not deem the soft dollar arrangements to be inappropriate.
The Board considered that the Fund’s uninvested cash and cash collateral from any securities lending arrangements may be invested in registered money market funds or, with regard to securities lending cash collateral, unregistered funds that comply with Rule 2a-7 (collectively referred to as “affiliated money market funds”) advised by Invesco Advisers. The Board considered information regarding the returns of the affiliated money market funds relative to comparable overnight investments, as well as the fees paid by the affiliated money market funds to Invesco Advisers and its affiliates. In this regard, the Board noted that Invesco Advisers receives advisory fees from these affiliated money market funds attributable to the Fund’s investments. The Board also noted that Invesco Advisers has contractually agreed to waive through varying periods an amount equal to 100% of the net advisory fee Invesco Advisers receives from the affiliated money market funds with respect to the Fund’s investment in the affiliated money market funds of uninvested cash, but not cash collateral. The Board concluded that the advisory fees payable to Invesco Advisers from the Fund’s investment of cash collateral from any securities lending arrangements in the affiliated money market funds are for services that are not duplicative of services provided by Invesco Advisers to the Fund.
The Board considered that Invesco Advisers may serve as the Fund’s affiliated securities lending agent and evaluated the benefits realized by Invesco Advisers when serving in such role, including the compensation received. The Board considered Invesco Advisers’ securities lending platform and corporate governance structure for securities lending, including Invesco Advisers’ Securities Lending Governance Committee and its related responsibilities. The Board noted that to the extent the Fund utilizes Invesco Advisers as an affiliated
| | |
| 23 | | Invesco Main Street Fund® |
securities lending agent, the Fund conducts its securities lending in accordance with, and in reliance upon, no-action letters issued by the SEC staff that provide guidance on how an affiliate may act as a direct agent lender and receive compensation for those services without obtaining exemptive relief. The Board considered information provided by Invesco Advisers related to the performance of Invesco Advisers as securities lending agent, including a summary of the securities lending services provided to the Fund by Invesco Advisers and the compensation paid to Invesco Advisers for such services, as well as any revenues generated for the Fund in connection with such securities lending activity and the allocation of such revenue between the Fund and Invesco Advisers.
The Board also received information about commissions that an affiliated broker may receive for executing certain trades for the Fund. Invesco Advisers and the Affiliated Sub-Advisers advised the Board of the benefits to the Fund of executing trades through the affiliated broker and that such trades were executed in compliance with rules under the federal securities laws and consistent with best execution obligations.
| | |
| 24 | | Invesco Main Street Fund® |
Tax Information
Form 1099-DIV, Form 1042-S and other year–end tax information provide shareholders with actual calendar year amounts that should be included in their tax returns. Shareholders should consult their tax advisers.
The following distribution information is being provided as required by the Internal Revenue Code or to meet a specific state’s requirement.
The Fund designates the following amounts or, if subsequently determined to be different, the maximum amount allowable for its fiscal year ended October 31, 2023:
| | | | | | | | |
Federal and State Income Tax | | | | | | |
Long-Term Capital Gain Distributions | | | $331,483,704 | | | | | |
Qualified Dividend Income* | | | 100.00% | | | | | |
Corporate Dividends Received Deduction* | | | 100.00% | | | | | |
U.S. Treasury Obligations* | | | 0.00% | | | | | |
Qualified Business Income* | | | 0.00% | | | | | |
Business Interest Income* | | | 0.00% | | | | | |
|
| * The above percentages are based on ordinary income dividends paid to shareholders during the Fund’s fiscal year. | |
| | |
Non-Resident Alien Shareholders | | | | | | |
Short-Term Capital Gain Distributions | | | $2,619,231 | | | | | |
| | |
| 25 | | Invesco Main Street Fund® |
Trustees and Officers
The address of each trustee and officer is AIM Equity Funds (Invesco Equity Funds) (the “Trust”), 11 Greenway Plaza, Houston, Texas 77046-1173. The trustees serve for the life of the Trust, subject to their earlier death, incapacitation, resignation, retirement or removal as more specifically provided in the Trust’s organizational documents. Each officer serves for a one year term or until their successors are elected and qualified. Column two below includes length of time served with predecessor entities, if any.
| | | | | | | | |
Name, Year of Birth and Position(s) Held with the Trust | | Trustee and/or Officer Since | | Principal Occupation(s) During Past 5 Years | | Number of Funds in Fund Complex Overseen by Trustee | | Other Directorship(s) Held by Trustee During Past 5 Years |
| Interested Trustee | | | | | | | | |
Martin L. Flanagan1 – 1960 Trustee and Vice Chair | | 2007 | | Chairman Emeritus, Invesco Ltd.; Trustee and Vice Chair, The Invesco Funds; and Member of Executive Board, SMU Cox School of Business Formerly: Executive Director, Chief Executive Officer and President, Invesco Ltd. (ultimate parent of Invesco and a global investment management firm); Vice Chair, Investment Company Institute; Advisor to the Board, Invesco Advisers, Inc. (formerly known as Invesco Institutional (N.A.), Inc.); Chairman and Chief Executive Officer, Invesco Advisers, Inc. (registered investment adviser); Director, Chairman, Chief Executive Officer and President, Invesco Holding Company Limited (parent of Invesco and a global investment management firm); Director, Invesco Ltd.; Chairman, Investment Company Institute and President, Co-Chief Executive Officer, Co-President, Chief Operating Officer and Chief Financial Officer, Franklin Resources, Inc. (global investment management organization) | | 169 | | None |
| 1 | Mr. Flanagan is considered an interested person (within the meaning of Section 2(a)(19) of the 1940 Act) of the Trust because he is an officer of the Adviser to the Trust, and an officer and a director of Invesco Ltd., ultimate parent of the Adviser. |
| | |
| T-1 | | Invesco Main Street Fund® |
Trustees and Officers–(continued)
| | | | | | | | |
Name, Year of Birth and Position(s) Held with the Trust | | Trustee and/or Officer Since | | Principal Occupation(s) During Past 5 Years | | Number of Funds in Fund Complex Overseen by Trustee | | Other Directorship(s) Held by Trustee During Past 5 Years |
| Independent Trustees | | | | | | | | |
Beth Ann Brown – 1968 Trustee (2019) and Chair (August 2022) | | 2019 | | Independent Consultant Formerly: Head of Intermediary Distribution, Managing Director, Strategic Relations, Managing Director, Head of National Accounts, Senior Vice President, National Account Manager and Senior Vice President, Key Account Manager, Columbia Management Investment Advisers LLC; Vice President, Key Account Manager, Liberty Funds Distributor, Inc.; and Trustee of certain Oppenheimer Funds | | 169 | | Director, Board of Directors of Caron Engineering Inc.; Advisor, Board of Advisors of Caron Engineering Inc.; President and Director, Acton Shapleigh Youth Conservation Corps (non-profit) Formerly: President and Director Director of Grahamtastic Connection (non-profit) |
Cynthia Hostetler – 1962 Trustee | | 2017 | | Non-Executive Director and Trustee of a number of public and private business corporations Formerly: Director, Aberdeen Investment Funds (4 portfolios); Director, Artio Global Investment LLC (mutual fund complex); Director, Edgen Group, Inc. (specialized energy and infrastructure products distributor); Director, Genesee & Wyoming, Inc. (railroads); Head of Investment Funds and Private Equity, Overseas Private Investment Corporation; President, First Manhattan Bancorporation, Inc.; and Attorney, Simpson Thacher & Bartlett LLP | | 169 | | Resideo Technologies, Inc. (smart home technology); Vulcan Materials Company (construction materials company); Trilinc Global Impact Fund; Textainer Group Holdings, (shipping container leasing company); Investment Company Institute (professional organization); and Independent Directors Council (professional organization) |
Eli Jones – 1961 Trustee | | 2016 | | Professor and Dean Emeritus, Mays Business School - Texas A&M University Formerly: Dean of Mays Business School-Texas A&M University; Professor and Dean, Walton College of Business, University of Arkansas and E.J. Ourso College of Business, Louisiana State University; and Director, Arvest Bank | | 169 | | Insperity, Inc. (formerly known as Administaff) (human resources provider); Board Member of the regional board, First Financial Bank Texas; and Boad Member, First Financial Bankshares, Inc. Texas |
Elizabeth Krentzman – 1959 Trustee | | 2019 | | Formerly: Principal and Chief Regulatory Advisor for Asset Management Services and U.S. Mutual Fund Leader of Deloitte & Touche LLP; General Counsel of the Investment Company Institute (trade association); National Director of the Investment Management Regulatory Consulting Practice, Principal, Director and Senior Manager of Deloitte & Touche LLP; Assistant Director of the Division of Investment Management - Office of Disclosure and Investment Adviser Regulation of the U.S. Securities and Exchange Commission and various positions with the Division of Investment Management – Office of Regulatory Policy of the U.S. Securities and Exchange Commission; Associate at Ropes & Gray LLP; and Trustee of certain Oppenheimer Funds | | 169 | | Formerly: Member of the Cartica Funds Board of Directors (private investment fund); Trustee of the University of Florida National Board Foundation; and Member of the University of Florida Law Center Association, Inc. Board of Trustees, Audit Committee and Membership Committee |
Anthony J. LaCava, Jr. – 1956 Trustee | | 2019 | | Formerly: Director and Member of the Audit Committee, Blue Hills Bank (publicly traded financial institution) and Managing Partner, KPMG LLP | | 169 | | Blue Hills Bank; Member and Chairman, Bentley University, Business School Advisory Council; and Nominating Committee, KPMG LLP |
Prema Mathai-Davis – 1950 Trustee | | 1998 | | Retired Formerly: Co-Founder & Partner of Quantalytics Research, LLC, (a FinTech Investment Research Platform for the Self-Directed Investor); Trustee of YWCA Retirement Fund; CEO of YWCA of the USA; Board member of the NY Metropolitan Transportation Authority; Commissioner of the NYC Department of Aging; and Board member of Johns Hopkins Bioethics Institute | | 169 | | Member of Board of Positive Planet US (non-profit) and HealthCare Chaplaincy Network (non-profit) |
| | |
| T-2 | | Invesco Main Street Fund® |
Trustees and Officers–(continued)
| | | | | | | | |
Name, Year of Birth and Position(s) Held with the Trust | | Trustee and/or Officer Since | | Principal Occupation(s) During Past 5 Years | | Number of Funds in Fund Complex Overseen by Trustee | | Other Directorship(s) Held by Trustee During Past 5 Years |
| Independent Trustees–(continued) | | | | | | |
Joel W. Motley – 1952 Trustee | | 2019 | | Director of Office of Finance, Federal Home Loan Bank System; Managing Director of Carmona Motley Inc. (privately held financial advisor); Member of the Council on Foreign Relations and its Finance and Budget Committee; Chairman Emeritus of Board of Human Rights Watch and Member of its Investment Committee; and Member of Investment Committee Board of Historic Hudson Valley (non-profit cultural organization); Member of the Board, Blue Ocean Acquisition Corp.; and Member of the Vestry and the Investment Committee of Trinity Church Wall Street. Formerly: Managing Director of Public Capital Advisors, LLC (privately held financial advisor); Managing Director of Carmona Motley Hoffman, Inc. (privately held financial advisor); Trustee of certain Oppenheimer Funds; and Director of Columbia Equity Financial Corp. (privately held financial advisor) | | 169 | | Member of Board of Trust for Mutual Understanding (non-profit promoting the arts and environment); Member of Board of Greenwall Foundation (bioethics research foundation) and its Investment Committee; Member of Board of Friends of the LRC (non-profit legal advocacy); and Board Member and Investment Committee Member of Pulitzer Center for Crisis Reporting (non-profit journalism) |
Teresa M. Ressel – 1962 Trustee | | 2017 | | Non-executive director and trustee of a number of public and private business corporations Formerly: Chief Executive Officer, UBS Securities LLC (investment banking); Chief Operating Officer, UBS AG Americas (investment banking); Sr. Management Team Olayan America, The Olayan Group (international investor/commercial/industrial); and Assistant Secretary for Management & Budget and Designated Chief Financial Officer, U.S. Department of Treasury | | 169 | | None |
Robert C. Troccoli – 1949 Trustee | | 2016 | | Retired Formerly: Adjunct Professor, University of Denver – Daniels College of Business; and Managing Partner, KPMG LLP | | 169 | | None |
Daniel S. Vandivort – 1954 Trustee | | 2019 | | President, Flyway Advisory Services LLC (consulting and property management) Formerly: President and Chief Investment Officer, previously Head of Fixed Income, Weiss Peck and Greer/Robeco Investment Management; Trustee and Chair, Weiss Peck and Greer Funds Board; and various capacities at CS First Boston including Head of Fixed Income at First Boston Asset Management. | | 169 | | Formerly: Trustee and Governance Chair, Oppenheimer Funds; Treasurer, Chairman of the Audit and Finance Committee, Huntington Disease Foundation of America |
| | |
| T-3 | | Invesco Main Street Fund® |
Trustees and Officers–(continued)
| | | | | | | | |
Name, Year of Birth and Position(s) Held with the Trust | | Trustee and/or Officer Since | | Principal Occupation(s) During Past 5 Years | | Number of Funds in Fund Complex Overseen by Trustee | | Other Directorship(s) Held by Trustee During Past 5 Years |
| Officers | | | | | | | | |
Glenn Brightman – 1972 President and Principal Executive Officer | | 2023 | | Chief Operating Officer, Americas, Invesco Ltd.; President and Principal Executive Officer, The Invesco Funds. Formerly: Global Head of Finance, Invesco Ltd; Executive Vice President and Chief Financial Officer, Nuveen | | N/A | | N/A |
Melanie Ringold – 1975 Senior Vice President, Chief Legal Officer and Secretary | | 2023 | | Head of Legal of the Americas, Invesco Ltd.; Senior Vice President and Secretary, Invesco Advisers, Inc. (formerly known as Invesco Institutional (N.A.), Inc.) (registered investment adviser); Secretary, Invesco Distributors, Inc. (formerly known as Invesco AIM Distributors, Inc.); Secretary, Invesco Investment Services, Inc. (formerly known as Invesco AIM Investment Services, Inc.); Senior Vice President, Chief Legal Officer and Secretary, The Invesco Funds; Secretary, Invesco Investment Advisers LLC, Invesco Capital Markets, Inc.; Chief Legal Officer, Invesco Exchange-Traded Fund Trust, Invesco Exchange-Traded Fund Trust II, Invesco India Exchange-Traded Fund Trust, Invesco Actively Managed Exchange-Traded Fund Trust, Invesco Actively Secretary and Vice President, Harbourview Asset Management Corporation; Secretary and Senior Vice President, OppenheimerFunds, Inc. and Invesco Managed Accounts, LLC; Secretary and Senior Vice President, OFI SteelPath, Inc.; Secretary and Senior Vice President, Oppenheimer Acquisition Corp.; Secretary, SteelPath Funds Remediation LLC; and Secretary and Senior Vice President, Trinity Investment Management Corporation Formerly: Assistant Secretary, Invesco Distributors, Inc., Invesco Advisers, Inc., Invesco Investment Services, Inc., Invesco Capital Markets, Inc., Invesco Capital Management LLC and Invesco Investment Advisers LLC; and Assistant Secretary and Investment Vice President, Invesco Funds | | N/A | | N/A |
Andrew R. Schlossberg – 1974 Senior Vice President | | 2019 | | Chief Executive Officer, President and Executive Director, Invesco Ltd.; Senior Vice President, Invesco Group Services, Inc.; Director and Senior Vice President, Invesco Advisers, Inc. (formerly known as Invesco Institutional (N.A.), Inc.) (registered investment adviser); Director and Chairman, Invesco Investment Services, Inc. (formerly known as Invesco AIM Investment Services, Inc.) (registered transfer agent); Senior Vice President, The Invesco Funds and Trustee, Invesco Foundation, Inc. Formerly: Head of the Americas and Senior Managing Director, Invesco Ltd.; Director, Invesco Investment Advisers LLC (formerly known as Van Kampen Asset Management); Director, President and Chairman, Invesco Insurance Agency, Inc.; Director, Invesco UK Limited; Director and Chief Executive, Invesco Asset Management Limited and Invesco Fund Managers Limited; Assistant Vice President, The Invesco Funds; Senior Vice President, Invesco Advisers, Inc. (formerly known as Invesco Institutional (N.A.), Inc.) (registered investment adviser); Director and Chief Executive, Invesco Administration Services Limited and Invesco Global Investment Funds Limited; Director, Invesco Distributors, Inc.; Head of EMEA, Invesco Ltd.; President, Invesco Actively Managed Exchange-Traded Commodity Fund Trust, Invesco Actively Managed Exchange-Traded Fund Trust, Invesco Exchange-Traded Fund Trust, Invesco Exchange-Traded Fund Trust II and Invesco India Exchange-Traded Fund Trust; and Managing Director and Principal Executive Officer, Invesco Capital Management LLC | | N/A | | N/A |
| | |
| T-4 | | Invesco Main Street Fund® |
Trustees and Officers–(continued)
| | | | | | | | |
Name, Year of Birth and Position(s) Held with the Trust | | Trustee and/or Officer Since | | Principal Occupation(s) During Past 5 Years | | Number of Funds in Fund Complex Overseen by Trustee | | Other Directorship(s) Held by Trustee During Past 5 Years |
| Officers–(continued) | | | | | | | | |
John M. Zerr – 1962 Senior Vice President | | 2006 | | Chief Operating Officer of the Americas; Senior Vice President, Invesco Advisers, Inc. (formerly known as Invesco Institutional (N.A.), Inc.) (registered investment adviser); Senior Vice President, Invesco Distributors, Inc. (formerly known as Invesco AIM Distributors, Inc.); Director and Vice President, Invesco Investment Services, Inc. (formerly known as Invesco AIM Investment Services, Inc.) Senior Vice President, The Invesco Funds; Managing Director, Invesco Capital Management LLC; Senior Vice President, Invesco Capital Markets, Inc. (formerly known as Van Kampen Funds Inc.); Manager, Invesco Indexing LLC; Manager, Invesco Specialized Products, LLC; Member, Invesco Canada Funds Advisory Board; Director, President and Chief Executive Officer, Invesco Corporate Class Inc. (corporate mutual fund company); Director, Chairman, President and Chief Executive Officer, Invesco Canada Ltd. (formerly known as Invesco Trimark Ltd./Invesco Trimark Ltèe) (registered investment adviser and registered transfer agent); President, Invesco, Inc.; President, Invesco Global Direct Real Estate Feeder GP Ltd.; President, Invesco IP Holdings (Canada) Ltd; President, Invesco Global Direct Real Estate GP Ltd.; President, Invesco Financial Services Ltd. / Services Financiers Invesco Ltée; and Director and Chairman, Invesco Trust Company Formerly: Director, Invesco Investment Advisers LLC (formerly known as Van Kampen Asset Management); President, Trimark Investments Ltd/Services Financiers Invesco Ltee; Director and Senior Vice President, Invesco Insurance Agency, Inc.; Director and Senior Vice President, Invesco Management Group, Inc. (formerly known as Invesco AIM Management Group, Inc.); Secretary and General Counsel, Invesco Management Group, Inc. (formerly known as Invesco AIM Management Group, Inc.); Secretary, Invesco Investment Services, Inc. (formerly known as Invesco AIM Investment Services, Inc.); Chief Legal Officer and Secretary, The Invesco Funds; Secretary and General Counsel, Invesco Investment Advisers LLC (formerly known as Van Kampen Asset Management); Secretary and General Counsel, Invesco Capital Markets, Inc. (formerly known as Van Kampen Funds Inc.); Chief Legal Officer, Invesco Exchange-Traded Fund Trust, Invesco Exchange-Traded Fund Trust II, Invesco India Exchange-Traded Fund Trust, Invesco Actively Managed Exchange-Traded Fund Trust, Invesco Actively Managed Exchange-Traded Commodity Fund Trust and Invesco Exchange-Traded Self-Indexed Fund Trust; Secretary, Invesco Indexing LLC; Director, Secretary, General Counsel and Senior Vice President, Van Kampen Exchange Corp.; Director, Vice President and Secretary, IVZ Distributors, Inc. (formerly known as INVESCO Distributors, Inc.); Director and Vice President, INVESCO Funds Group, Inc.; Director and Vice President, Van Kampen Advisors Inc.; Director, Vice President, Secretary and General Counsel, Van Kampen Investor Services Inc.; Director and Secretary, Invesco Distributors, Inc. (formerly known as Invesco AIM Distributors, Inc.); Director, Senior Vice President, General Counsel and Secretary, Invesco AIM Advisers, Inc. and Van Kampen Investments Inc.; Director, Vice President and Secretary, Fund Management Company; Director, Senior Vice President, Secretary, General Counsel and Vice President, Invesco AIM Capital Management, Inc.; and Chief Operating Officer and General Counsel, Liberty Ridge Capital, Inc. (an investment adviser) | | N/A | | N/A |
Tony Wong – 1973 Senior Vice President | | 2023 | | Senior Managing Director, Invesco Ltd.; Director, Chairman, Chief Executive Officer and President, Invesco Advisers, Inc.; Director and Chairman, Invesco Private Capital, Inc., INVESCO Private Capital Investments, Inc. and INVESCO Realty, Inc.; Director, Invesco Senior Secured Management, Inc.; President, Invesco Managed Accounts, LLC and SNW Asset Management Corporation; and Senior Vice President, The Invesco Funds Formerly: Assistant Vice President, The Invesco Funds; and Vice President, Invesco Advisers, Inc. | | N/A | | N/A |
Stephanie C. Butcher – 1971 Senior Vice President | | 2023 | | Senior Managing Director, Invesco Ltd.; Senior Vice President, The Invesco Funds; Director and Chief Executive Officer, Invesco Asset Management Limited | | N/A | | N/A |
Adrien Deberghes – 1967 Principal Financial Officer, Treasurer and Senior Vice President | | 2020 | | Head of the Fund Office of the CFO and Fund Administration; Vice President, Invesco Advisers, Inc.; Principal Financial Officer, Treasurer and Senior Vice President, The Invesco Funds; Vice President, Invesco Exchange-Traded Fund Trust, Invesco Exchange-Traded Fund Trust II, Invesco India Exchange-Traded Fund Trust, Invesco Actively Managed Exchange-Traded Fund Trust, Invesco Actively Managed Exchange-Traded Commodity Fund Trust and Invesco Exchange-Traded Self-Indexed Fund Trust Formerly: Vice President, The Invesco Funds; Senior Vice President and Treasurer, Fidelity Investments | | N/A | | N/A |
Crissie M. Wisdom – 1969 Anti-Money Laundering Compliance Officer | | 2013 | | Anti-Money Laundering and OFAC Compliance Officer for Invesco U.S. entities including: Invesco Advisers, Inc. and its affiliates, Invesco Capital Markets, Inc., Invesco Distributors, Inc., Invesco Investment Services, Inc., The Invesco Funds, Invesco Capital Management, LLC, Invesco Trust Company; and Fraud Prevention Manager for Invesco Investment Services, Inc. | | N/A | | N/A |
| | |
| T-5 | | Invesco Main Street Fund® |
Trustees and Officers–(continued)
| | | | | | | | |
Name, Year of Birth and Position(s) Held with the Trust | | Trustee and/or Officer Since | | Principal Occupation(s) During Past 5 Years | | Number of Funds in Fund Complex Overseen by Trustee | | Other Directorship(s) Held by Trustee During Past 5 Years |
| Officers–(continued) | | | | | | | | |
Todd F. Kuehl – 1969 Chief Compliance Officer
and Senior Vice President | | 2020 | | Chief Compliance Officer, Invesco Advisers, Inc. (registered investment adviser); and Chief Compliance Officer and Senior Vice President, The Invesco Funds Formerly: Managing Director and Chief Compliance Officer, Legg Mason (Mutual Funds); Chief Compliance Officer, Legg Mason Private Portfolio Group (registered investment adviser) | | N/A | | N/A |
James Bordewick, Jr. – 1959 Senior Vice President and Senior Officer | | 2022 | | Senior Vice President and Senior Officer, The Invesco Funds Formerly: Chief Legal Officer, KingsCrowd, Inc. (research and analytical platform for investment in private capital markets); Chief Operating Officer and Head of Legal and Regulatory, Netcapital (private capital investment platform); Managing Director, General Counsel of asset management and Chief Compliance Officer for asset management and private banking, Bank of America Corporation; Chief Legal Officer, Columbia Funds and BofA Funds; Senior Vice President and Associate General Counsel, MFS Investment Management; Chief Legal Officer, MFS Funds; Associate, Ropes & Gray; and Associate, Gaston Snow & Ely Bartlett | | N/A | | N/A |
The Statement of Additional Information of the Trust includes additional information about the Fund’s Trustees and is available upon request, without charge, by calling 1.800.959.4246. Please refer to the Fund’s Statement of Additional Information for information on the Fund’s sub-advisers.
| | | | | | |
| Office of the Fund | | Investment Adviser | | Distributor | | Auditors |
| 11 Greenway Plaza | | Invesco Advisers, Inc. | | Invesco Distributors, Inc. | | PricewaterhouseCoopers LLP |
| Houston, TX 77046-1173 | | 1331 Spring Street, NW, Suite 2500 | | 11 Greenway Plaza | | 1000 Louisiana Street, Suite 5800 |
| | Atlanta, GA 30309 | | Houston, TX 77046-1173 | | Houston, TX 77002-5021 |
| | | |
| Counsel to the Fund | | Counsel to the Independent Trustees | | Transfer Agent | | Custodian |
| Stradley Ronon Stevens & Young, LLP | | Sidley Austin LLP | | Invesco Investment Services, Inc. | | State Street Bank and Trust Company |
| 2005 Market Street, Suite 2600 | | 787 Seventh Avenue | | 11 Greenway Plaza | | 225 Franklin Street |
| Philadelphia, PA 19103-7018 | | New York, NY 10019 | | Houston, TX 77046-1173 | | Boston, MA 02110-2801 |
| | |
| T-6 | | Invesco Main Street Fund® |

Go paperless with eDelivery
Visit invesco.com/edelivery to enjoy the convenience and security of anytime electronic access to your investment documents.
With eDelivery, you can elect to have any or all of the following materials delivered straight to your inbox to download, save and print from your own computer:
∎ Fund reports and prospectuses
∎ Quarterly statements
∎ Daily confirmations
∎ Tax forms
Invesco mailing information
Send general correspondence to Invesco Investment Services, Inc., P.O. Box 219078, Kansas City, MO 64121-9078.
Important notice regarding delivery of security holder documents
To reduce Fund expenses, only one copy of most shareholder documents may be mailed to shareholders with multiple accounts at the same address (Householding). Mailing of your shareholder documents may be householded indefinitely unless you instruct us otherwise. If you do not want the mailing of these documents to be combined with those for other members of your household, please contact Invesco Investment Services, Inc. at 800 959 4246 or contact your financial institution. We will begin sending you individual copies for each account within 30 days after receiving your request.
Fund holdings and proxy voting information
The Fund provides a complete list of its portfolio holdings four times each year, at the end of each fiscal quarter. For the second and fourth quarters, the list appears, respectively, in the Fund’s semiannual and annual reports to shareholders. For the first and third quarters, the Fund files the list with the Securities and Exchange Commission (SEC) as an exhibit to its reports on Form N-PORT. The most recent list of portfolio holdings is available at invesco.com/completeqtrholdings. Shareholders can also look up the Fund’s Form N-PORT filings on the SEC website, sec.gov. The SEC file numbers for the Fund are shown below.
A description of the policies and procedures that the Fund uses to determine how to vote proxies relating to portfolio securities is available without charge, upon request, from our Client Services department at 800 959 4246, or at invesco.com/corporate/about-us/esg. The information is also available on the SEC website, sec.gov.
Information regarding how the Fund voted proxies related to its portfolio securities during the most recent 12-month period ended June 30 is available at invesco.com/proxysearch. This information is also available on the SEC website, sec.gov.
Invesco Advisers, Inc. is an investment adviser; it provides investment advisory services to individual and institutional clients and does not sell securities. Invesco Distributors, Inc. is the US distributor for Invesco Ltd.’s retail mutual funds, exchange-traded funds and institutional money market funds. Both are wholly owned, indirect subsidiaries of Invesco Ltd.
| | | | |
| SEC file number(s): 811-01424 and 002-25469 | | Invesco Distributors, Inc. | | O-MST-AR-1 |

| | |
| | |
| Annual Report to Shareholders | | October 31, 2023 |
Invesco Main Street All Cap Fund®
Nasdaq:
A: OMSOX ∎ C: OMSCX ∎ R: OMSNX ∎ Y: OMSYX ∎ R5: MSAZX ∎ R6: IOAPX
Management’s Discussion of Fund Performance
| | | | |
| |
Performance summary | |
For the fiscal year ended October 31, 2023, Class A shares of Invesco Main Street All Cap Fund® (the Fund), at net asset value (NAV), outperformed the Russell 3000 Index. | |
Your Fund’s long-term performance appears later in this report. | |
| |
Fund vs. Indexes | |
Total returns, 10/31/22 to 10/31/23, at net asset value (NAV). Performance shown does not include applicable contingent deferred sales charges (CDSC) or front-end sales charges, which would have reduced performance. | |
Class A Shares | | | 11.10 | % |
Class C Shares | | | 10.27 | |
Class R Shares | | | 10.87 | |
Class Y Shares | | | 11.41 | |
Class R5 Shares | | | 11.48 | |
Class R6 Shares | | | 11.52 | |
Russell 3000 Index▼ | | | 8.38 | |
| |
Source(s): ▼RIMES Technologies Corp. | | | | |
Market conditions and your Fund
Despite various domestic and global head-winds during the fiscal year, the overall US economy proved to be resilient. The US labor market remained tight with unemployment near historic lows while consumers continued to spend, complicating the US Federal Reserve’s (the Fed’s) efforts to tame inflation which had reached multi-decade highs. The Fed tightened monetary policy over the fiscal year, with multiple increases in its target rate during the fiscal year, before taking a long-awaited “pause” in June. Inflation has trended lower over the fiscal year but has stayed above the Fed’s 2% target. The Fed held interest rates steady at its September and October 2023 meetings but signaled that interest rates could stay elevated for an extended length of time if inflation remains stubborn. COVID-19 lockdowns and related supply chain disruptions have moderated, although an uncertain global backdrop threatens to act as a headwind to the US economy. While risks remain, gross domestic product growth in the US has been above expectations and the much-anticipated recession has not yet arrived.
Amid this backdrop, US equity markets delivered a positive return during the fiscal year but were volatile and reactionary to inflation indicators and policy moves by the Fed. Large technology companies were among the leaders in US equities and buoyed the overall market, while smaller cap equities notably lagged. A banking crisis in March 2023 that saw the failure of US regional banks caused significant turmoil but Fed actions to stabilize the banking system sent markets higher and investors appeared to move on by April, supported by better-than-expected corporate earnings. Whether the economy eventually enters a recession remains an open question, but investors remain keenly focused on whether tight monetary conditions will sufficiently lower
inflation without imperiling the forward outlook.
During the fiscal year, stock selections in the information technology and communication services sectors were the largest contributors to the Fund’s performance relative to the Russell 3000 Index. This was partially offset by weaker stock selections in the industrials and consumer discretionary sectors.
The largest individual contributors to the Fund’s performance relative to the Russell 3000 Index during the fiscal year included Meta Platforms, NVIDIA and Microsoft. Meta Platforms outperformed as it returned to revenue growth and benefited from steps taken to optimize its cost structure and improve execution. NVIDIA experienced large share price gains as demand for chips has surged, with notable growth driven by the company’s customers building out graphics processing units for generative artificial intelligence (AI). Microsoft surged on the back of strong results driven by its cloud computing business and investor optimism about its leading position in AI capabilities.
The largest individual detractors to the Fund’s performance relative to the Russell 3000 Index during the fiscal year included SVB Financial, Dollar General and Exxon Mobil. SVB Financial was taken over by the Federal Deposit Insurance Corporation after a bank run precipitated by risk management and liquidity concerns among its concentrated depositor base; the Fund did not hold a position in SVB at fiscal year-end. The Fund exited a position held in Dollar General, which struggled as profit has been negatively impacted by a mix of headwinds including elevated inventory and a customer base squeezed by continuing high inflation. Exxon Mobil struggled amid a negative period for major oil companies and the energy sector more broadly.
We continue to maintain our discipline around valuation and focus on companies that we believe have competitive advantages
and skilled management teams that are out-executing peers. We believe this disciplined approach is essential to generating attractive long-term performance.
We thank you for your continued investment in Invesco Main Street All Cap Fund®.
Portfolio manager(s):
Joy Budzinski
Belinda Cavazos
Magnus Krantz - Lead
The views and opinions expressed in management’s discussion of Fund performance are those of Invesco Advisers, Inc. and its affiliates. These views and opinions are subject to change at any time based on factors such as market and economic conditions. These views and opinions may not be relied upon as investment advice or recommendations, or as an offer for a particular security. The information is not a complete analysis of every aspect of any market, country, industry, security or the Fund. Statements of fact are from sources considered reliable, but Invesco Advisers, Inc. makes no representation or warranty as to their completeness or accuracy. Although historical performance is no guarantee of future results, these insights may help you understand our investment management philosophy.
See important Fund and, if applicable, index disclosures later in this report.
| | |
| 2 | | Invesco Main Street All Cap Fund® |
Your Fund’s Long-Term Performance
Results of a $10,000 Investment – Oldest Share Class(es)
Fund and index data from 10/31/13
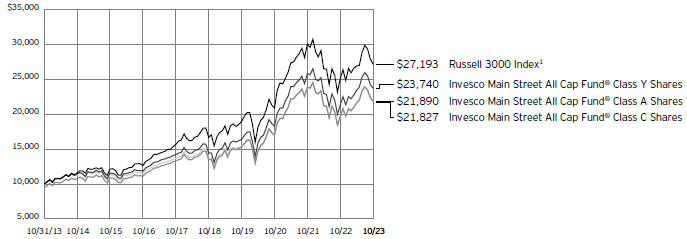
1 Source: RIMES Technologies Corp.
Past performance cannot guarantee future results.
The data shown in the chart include reinvested distributions, applicable sales charges and Fund expenses including management
fees. Index results include reinvested dividends, but they do not reflect sales charges. Performance of the peer group, if applicable, reflects fund expenses and management fees;
performance of a market index does not. Performance shown in the chart does not reflect deduction of taxes a shareholder would pay on Fund distributions or sale of Fund shares.
| | |
| 3 | | Invesco Main Street All Cap Fund® |
| | | | |
| |
Average Annual Total Returns | |
As of 10/31/23, including maximum applicable sales charges | |
| |
Class A Shares | | | | |
Inception (9/25/00) | | | 7.33 | % |
10 Years | | | 8.15 | |
5 Years | | | 8.95 | |
1 Year | | | 5.01 | |
| |
Class C Shares | | | | |
Inception (9/25/00) | | | 7.32 | % |
10 Years | | | 8.12 | |
5 Years | | | 9.36 | |
1 Year | | | 9.27 | |
| |
Class R Shares | | | | |
Inception (3/1/01) | | | 7.51 | % |
10 Years | | | 8.49 | |
5 Years | | | 9.90 | |
1 Year | | | 10.87 | |
| |
Class Y Shares | | | | |
Inception (9/25/00) | | | 7.92 | % |
10 Years | | | 9.03 | |
5 Years | | | 10.45 | |
1 Year | | | 11.41 | |
| |
Class R5 Shares | | | | |
10 Years | | | 8.92 | % |
5 Years | | | 10.51 | |
1 Year | | | 11.48 | |
| |
Class R6 Shares | | | | |
10 Years | | | 8.93 | % |
5 Years | | | 10.53 | |
1 Year | | | 11.52 | |
Effective May 24, 2019, Class A, Class C, Class R and Class Y shares of the Oppenheimer Main Street All Cap Fund®, (the predecessor fund), were reorganized into Class A, Class C, Class R and Class Y shares, respectively, of the Invesco Oppenheimer Main Street All Cap Fund®. Note: The Fund was subsequently renamed the Invesco Main Street All Cap Fund® (the Fund). Returns shown above, for periods ending on or prior to May 24, 2019, for Class A, Class C, Class R and Class Y shares are those for Class A, Class C, Class R and Class Y shares of the predecessor fund. Share class returns will differ from the predecessor fund because of different expenses.
Class R5 shares incepted on May 24, 2019. Performance shown on and prior to that date is that of the predecessor fund’s Class A shares and includes the 12b-1 fees applicable to Class A shares.
Class R6 shares incepted on May 24, 2019. Performance shown on and prior to that date is that of the predecessor fund’s Class A shares and includes the 12b-1 fees applicable to Class A shares.
The performance data quoted represent past performance and cannot guarantee future results; current performance may be lower or higher. Please visit invesco.com/performance for the most recent month-end performance. Performance figures
reflect reinvested distributions, changes in net asset value and the effect of the maximum sales charge unless otherwise stated. Performance figures do not reflect deduction of taxes a shareholder would pay on Fund distributions or sale of Fund shares. Investment return and principal value will fluctuate so that you may have a gain or loss when you sell shares.
Class A share performance reflects the maximum 5.50% sales charge, and Class C share performance reflects the applicable contingent deferred sales charge (CDSC) for the period involved. The CDSC on Class C shares is 1% for the first year after purchase. Class R, Class Y, Class R5 and Class R6 shares do not have a front-end sales charge or a CDSC; therefore, performance is at net asset value.
The performance of the Fund’s share classes will differ primarily due to different sales charge structures and class expenses.
Fund performance reflects any applicable fee waivers and/or expense reimbursements. Had the adviser not waived fees and/or reimbursed expenses currently or in the past, returns would have been lower. See current prospectus for more information.
| | |
| 4 | | Invesco Main Street All Cap Fund® |
Supplemental Information
Invesco Main Street All Cap Fund’s® investment objective is to seek capital appreciation.
| ∎ | Unless otherwise stated, information presented in this report is as of October 31, 2023, and is based on total net assets. |
| ∎ | Unless otherwise noted, all data is provided by Invesco. |
| ∎ | To access your Fund’s reports/prospectus, visit invesco.com/fundreports. |
About indexes used in this report
| ∎ | The Russell 3000® Index is an unmanaged index considered representative of the US stock market. The Russell 3000 Index is a trademark/service mark of the Frank Russell Co. Russell® is a trademark of the Frank Russell Co. |
| ∎ | The Fund is not managed to track the performance of any particular index, including the index(es) described here, and consequently, the performance of the Fund may deviate significantly from the performance of the index(es). |
| ∎ | A direct investment cannot be made in an index. Unless otherwise indicated, index results include reinvested dividends, and they do not reflect sales charges. Performance of the peer group, if applicable, reflects fund expenses; performance of a market index does not. |
|
|
This report must be accompanied or preceded by a currently effective Fund prospectus, which contains more complete information, including sales charges and expenses. Investors should read it carefully before investing. |
|
| NOT FDIC INSURED | MAY LOSE VALUE | NO BANK GUARANTEE |
| | |
| 5 | | Invesco Main Street All Cap Fund® |
Fund Information
Portfolio Composition
| | | | | |
| By sector | | % of total net assets |
| |
Information Technology | | | | 24.95 | % |
| |
Health Care | | | | 13.12 | |
| |
Financials | | | | 12.22 | |
| |
Communication Services | | | | 11.57 | |
| |
Consumer Discretionary | | | | 10.38 | |
| |
Industrials | | | | 8.55 | |
| |
Consumer Staples | | | | 6.51 | |
| |
Energy | | | | 4.61 | |
| |
Materials | | | | 2.48 | |
| |
Utilities | | | | 2.30 | |
| |
Real Estate | | | | 1.68 | |
| |
Money Market Funds Plus Other Assets Less Liabilities | | | | 1.63 | |
Top 10 Equity Holdings*
| | | | | | | |
| | | | | % of total net assets |
| | |
| 1. | | Microsoft Corp. | | | | 8.53 | % |
| | |
| 2. | | Apple, Inc. | | | | 5.67 | |
| | |
| 3. | | Amazon.com, Inc. | | | | 5.25 | |
| | |
| 4. | | Alphabet, Inc., Class A | | | | 4.62 | |
| | |
| 5. | | NVIDIA Corp. | | | | 3.79 | |
| | |
| 6. | | Meta Platforms, Inc., Class A | | | | 3.36 | |
| | |
| 7. | | JPMorgan Chase & Co. | | | | 3.05 | |
| | |
| 8. | | Exxon Mobil Corp. | | | | 2.47 | |
| | |
| 9. | | Eli Lilly and Co. | | | | 2.05 | |
| | |
| 10. | | UnitedHealth Group, Inc. | | | | 1.88 | |
The Fund’s holdings are subject to change, and there is no assurance that the Fund will continue to hold any particular security.
| * | Excluding money market fund holdings, if any. |
Data presented here are as of October 31, 2023.
| | |
| 6 | | Invesco Main Street All Cap Fund® |
Schedule of Investments(a)
October 31, 2023
| | | | | | | | |
| | | Shares | | | Value | |
|
| |
Common Stocks & Other Equity Interests-98.37% | |
Aerospace & Defense-2.81% | |
Boeing Co. (The)(b) | | | 73,030 | | | $ | 13,643,465 | |
|
| |
Howmet Aerospace, Inc. | | | 266,330 | | | | 11,745,153 | |
|
| |
Huntington Ingalls Industries, Inc. | | | 25,928 | | | | 5,699,493 | |
|
| |
| | | | | | | 31,088,111 | |
|
| |
|
Agricultural & Farm Machinery-0.82% | |
Deere & Co. | | | 24,887 | | | | 9,092,714 | |
|
| |
|
Air Freight & Logistics-1.23% | |
United Parcel Service, Inc., Class B | | | 96,796 | | | | 13,672,435 | |
|
| |
|
Application Software-2.09% | |
Klaviyo, Inc., Class A(b) | | | 61,684 | | | | 1,757,377 | |
|
| |
Manhattan Associates, Inc.(b) | | | 33,042 | | | | 6,442,529 | |
|
| |
Synopsys, Inc.(b) | | | 17,857 | | | | 8,382,790 | |
|
| |
Tyler Technologies, Inc.(b) | | | 17,442 | | | | 6,504,122 | |
|
| |
| | | | | | | 23,086,818 | |
|
| |
|
Automobile Manufacturers-0.55% | |
Tesla, Inc.(b) | | | 30,587 | | | | 6,143,093 | |
|
| |
|
Automotive Parts & Equipment-0.56% | |
Aptiv PLC(b) | | | 71,227 | | | | 6,210,994 | |
|
| |
|
Automotive Retail-0.64% | |
AutoNation, Inc.(b)(c) | | | 54,335 | | | | 7,067,897 | |
|
| |
|
Biotechnology-1.36% | |
Gilead Sciences, Inc. | | | 192,032 | | | | 15,082,193 | |
|
| |
|
Broadline Retail-5.25% | |
Amazon.com, Inc.(b) | | | 436,801 | | | | 58,133,845 | |
|
| |
|
Communications Equipment-1.29% | |
Motorola Solutions, Inc. | | | 51,430 | | | | 14,321,198 | |
|
| |
|
Construction Materials-1.19% | |
Vulcan Materials Co. | | | 67,003 | | | | 13,165,420 | |
|
| |
|
Distillers & Vintners-1.49% | |
Constellation Brands, Inc., Class A | | | 70,302 | | | | 16,461,213 | |
|
| |
|
Distributors-0.68% | |
LKQ Corp. | | | 170,186 | | | | 7,474,569 | |
|
| |
|
Diversified Banks-3.05% | |
JPMorgan Chase & Co. | | | 243,002 | | | | 33,791,858 | |
|
| |
|
Diversified Financial Services-0.83% | |
Equitable Holdings, Inc. | | | 345,785 | | | | 9,187,507 | |
|
| |
|
Electrical Components & Equipment-1.32% | |
Hubbell, Inc. | | | 36,459 | | | | 9,847,576 | |
|
| |
Regal Rexnord Corp. | | | 39,907 | | | | 4,725,388 | |
|
| |
| | | | | | | 14,572,964 | |
|
| |
|
Electronic Equipment & Instruments-0.61% | |
Keysight Technologies, Inc.(b) | | | 55,036 | | | | 6,717,144 | |
|
| |
|
Fertilizers & Agricultural Chemicals-0.52% | |
Mosaic Co. (The) | | | 178,010 | | | | 5,781,765 | |
|
| |
| | | | | | | | |
| | | Shares | | | Value | |
|
| |
Financial Exchanges & Data-0.94% | |
Intercontinental Exchange, Inc. | | | 96,531 | | | $ | 10,371,291 | |
|
| |
|
Health Care Equipment-2.63% | |
Baxter International, Inc. | | | 169,356 | | | | 5,492,215 | |
|
| |
Boston Scientific Corp.(b) | | | 235,216 | | | | 12,040,707 | |
|
| |
Zimmer Biomet Holdings, Inc. | | | 110,593 | | | | 11,547,015 | |
|
| |
| | | | | | | 29,079,937 | |
|
| |
|
Health Care Facilities-1.87% | |
Acadia Healthcare Co., Inc.(b)(c) | | | 83,711 | | | | 6,153,596 | |
|
| |
HCA Healthcare, Inc. | | | 32,114 | | | | 7,262,260 | |
|
| |
Tenet Healthcare Corp.(b) | | | 136,678 | | | | 7,339,608 | |
|
| |
| | | | | | | 20,755,464 | |
|
| |
|
Homebuilding-0.56% | |
D.R. Horton, Inc. | | | 58,923 | | | | 6,151,561 | |
|
| |
|
Hotels, Resorts & Cruise Lines-1.30% | |
Airbnb, Inc., Class A(b) | | | 57,378 | | | | 6,787,244 | |
|
| |
Wyndham Hotels & Resorts, Inc. | | | 105,809 | | | | 7,660,571 | |
|
| |
| | | | | | | 14,447,815 | |
|
| |
|
Household Products-1.57% | |
Procter & Gamble Co. (The) | | | 115,730 | | | | 17,362,972 | |
|
| |
|
Industrial Conglomerates-0.84% | |
Honeywell International, Inc. | | | 50,609 | | | | 9,274,605 | |
|
| |
|
Industrial Machinery & Supplies & Components-0.58% | |
Lincoln Electric Holdings, Inc.(c) | | | 36,816 | | | | 6,435,437 | |
|
| |
|
Industrial REITs-1.24% | |
Prologis, Inc. | | | 135,801 | | | | 13,681,951 | |
|
| |
|
Insurance Brokers-1.42% | |
Arthur J. Gallagher & Co. | | | 66,758 | | | | 15,720,841 | |
|
| |
|
Integrated Oil & Gas-2.47% | |
Exxon Mobil Corp. | | | 258,147 | | | | 27,324,860 | |
|
| |
|
Integrated Telecommunication Services-2.49% | |
Deutsche Telekom AG (Germany) | | | 551,984 | | | | 11,961,181 | |
|
| |
Verizon Communications, Inc. | | | 444,731 | | | | 15,623,400 | |
|
| |
| | | | | | | 27,584,581 | |
|
| |
|
Interactive Home Entertainment-1.10% | |
Electronic Arts, Inc. | | | 97,993 | | | | 12,130,554 | |
|
| |
|
Interactive Media & Services-7.98% | |
Alphabet, Inc., Class A(b) | | | 412,310 | | | | 51,159,425 | |
|
| |
Meta Platforms, Inc., Class A(b) | | | 123,322 | | | | 37,153,219 | |
|
| |
| | | | | | | 88,312,644 | |
|
| |
|
Investment Banking & Brokerage-2.56% | |
Charles Schwab Corp. (The) | | | 312,299 | | | | 16,252,040 | |
|
| |
Raymond James Financial, Inc. | | | 126,231 | | | | 12,047,487 | |
|
| |
| | | | | | | 28,299,527 | |
|
| |
|
IT Consulting & Other Services-0.86% | |
Amdocs Ltd. | | | 118,254 | | | | 9,479,241 | |
|
| |
See accompanying Notes to Financial Statements which are an integral part of the financial statements.
| | |
| 7 | | Invesco Main Street All Cap Fund® |
| | | | | | | | |
| | | Shares | | | Value | |
|
| |
Managed Health Care-2.52% | |
Molina Healthcare, Inc.(b) | | | 21,270 | | | $ | 7,081,847 | |
|
| |
UnitedHealth Group, Inc. | | | 38,870 | | | | 20,817,217 | |
|
| |
| | | | | | | 27,899,064 | |
|
| |
|
Multi-Utilities-2.30% | |
CMS Energy Corp. | | | 121,413 | | | | 6,597,582 | |
|
| |
Dominion Energy, Inc. | | | 151,253 | | | | 6,098,521 | |
|
| |
WEC Energy Group, Inc. | | | 156,772 | | | | 12,759,673 | |
|
| |
| | | | | | | 25,455,776 | |
|
| |
|
Oil & Gas Exploration & Production-2.14% | |
APA Corp. | | | 199,800 | | | | 7,936,056 | |
|
| |
Chesapeake Energy Corp.(c) | | | 90,517 | | | | 7,791,703 | |
|
| |
Marathon Oil Corp. | | | 292,127 | | | | 7,977,989 | |
|
| |
| | | | | | | 23,705,748 | |
|
| |
|
Personal Care Products-0.62% | |
BellRing Brands, Inc.(b) | | | 156,392 | | | | 6,839,022 | |
|
| |
|
Pharmaceuticals-4.74% | |
AstraZeneca PLC, ADR (United Kingdom) | | | 174,463 | | | | 11,031,296 | |
|
| |
Eli Lilly and Co. | | | 40,995 | | | | 22,708,360 | |
|
| |
Merck & Co., Inc. | | | 182,861 | | | | 18,779,825 | |
|
| |
| | | | | | | 52,519,481 | |
|
| |
|
Property & Casualty Insurance-1.20% | |
Hartford Financial Services Group, Inc. (The) | | | 180,463 | | | | 13,255,007 | |
|
| |
|
Rail Transportation-0.95% | |
Union Pacific Corp. | | | 50,681 | | | | 10,521,882 | |
|
| |
|
Regional Banks-0.94% | |
M&T Bank Corp. | | | 92,787 | | | | 10,461,734 | |
|
| |
|
Restaurants-0.84% | |
Starbucks Corp. | | | 100,973 | | | | 9,313,750 | |
|
| |
|
Retail REITs-0.44% | |
Kimco Realty Corp. | | | 274,517 | | | | 4,924,835 | |
|
| |
|
Semiconductor Materials & Equipment-1.33% | |
Applied Materials, Inc. | | | 110,937 | | | | 14,682,512 | |
|
| |
|
Semiconductors-4.58% | |
ARM Holdings PLC, ADR(b) | | | 177,759 | | | | 8,761,741 | |
|
| |
NVIDIA Corp. | | | 102,814 | | | | 41,927,549 | |
|
| |
| | | | | | | 50,689,290 | |
|
| |
| | | | | | | | |
| | | Shares | | | Value | |
|
| |
Soft Drinks & Non-alcoholic Beverages-1.68% | |
Coca-Cola Consolidated, Inc. | | | 9,288 | | | $ | 5,910,976 | |
|
| |
PepsiCo, Inc. | | | 77,981 | | | | 12,732,738 | |
|
| |
| | | | | | | 18,643,714 | |
|
| |
|
Specialty Chemicals-0.77% | |
PPG Industries, Inc. | | | 69,178 | | | | 8,492,983 | |
|
| |
|
Systems Software-8.52% | |
Microsoft Corp. | | | 279,073 | | | | 94,357,372 | |
|
| |
|
Technology Hardware, Storage & Peripherals-5.67% | |
Apple, Inc. | | | 367,418 | | | | 62,743,972 | |
|
| |
|
Tobacco-1.15% | |
Philip Morris International, Inc. | | | 143,165 | | | | 12,764,591 | |
|
| |
|
Transaction & Payment Processing Services-1.28% | |
Mastercard, Inc., Class A | | | 37,671 | | | | 14,177,481 | |
|
| |
Total Common Stocks & Other Equity Interests
(Cost $813,024,441) | | | | 1,088,913,233 | |
|
| |
|
Money Market Funds-1.08% | |
Invesco Government & Agency Portfolio, Institutional Class, 5.27%(d)(e) | | | 4,178,447 | | | | 4,178,447 | |
|
| |
Invesco Liquid Assets Portfolio, Institutional Class, 5.40%(d)(e) | | | 2,983,844 | | | | 2,984,739 | |
|
| |
Invesco Treasury Portfolio, Institutional Class, 5.27%(d)(e) | | | 4,775,369 | | | | 4,775,369 | |
|
| |
Total Money Market Funds
(Cost $11,938,131) | | | | 11,938,555 | |
|
| |
TOTAL INVESTMENTS IN SECURITIES (excluding investments purchased with cash collateral from securities on loan)-99.45%
(Cost $824,962,572) | | | | 1,100,851,788 | |
|
| |
|
Investments Purchased with Cash Collateral from Securities on Loan | |
Money Market Funds-2.26% | |
Invesco Private Government Fund, 5.32%(d)(e)(f) | | | 7,012,280 | | | | 7,012,280 | |
|
| |
Invesco Private Prime Fund, 5.53%(d)(e)(f) | | | 18,033,418 | | | | 18,035,221 | |
|
| |
Total Investments Purchased with Cash Collateral from Securities on Loan
(Cost $25,047,886) | | | | 25,047,501 | |
|
| |
TOTAL INVESTMENTS IN SECURITIES-101.71%
(Cost $850,010,458) | | | | 1,125,899,289 | |
|
| |
OTHER ASSETS LESS LIABILITIES-(1.71)% | | | | (18,952,721 | ) |
|
| |
NET ASSETS-100.00% | | | $ | 1,106,946,568 | |
|
| |
Investment Abbreviations:
ADR - American Depositary Receipt
REIT - Real Estate Investment Trust
See accompanying Notes to Financial Statements which are an integral part of the financial statements.
| | |
| 8 | | Invesco Main Street All Cap Fund® |
Notes to Schedule of Investments:
| (a) | Industry and/or sector classifications used in this report are generally according to the Global Industry Classification Standard, which was developed by and is the exclusive property and a service mark of MSCI Inc. and Standard & Poor’s. |
| (b) | Non-income producing security. |
| (c) | All or a portion of this security was out on loan at October 31, 2023. |
| (d) | Affiliated holding. Affiliated holdings are investments in entities which are under common ownership or control of Invesco Ltd. or are investments in entities in which the Fund owns 5% or more of the outstanding voting securities. The table below shows the Fund’s transactions in, and earnings from, its investments in affiliates for the fiscal year ended October 31, 2023. |
| | | | | | | | | | | | | | | | | | | | | | | | | | | | |
| | | Value October 31, 2022 | | Purchases at Cost | | | Proceeds from Sales | | | Change in Unrealized Appreciation (Depreciation) | | Realized Gain (Loss) | | | Value October 31, 2023 | | Dividend Income |
| Investments in Affiliated Money Market Funds: | | | | | | | | | | | | | | | | | | | | | | | | | | | | |
Invesco Government & Agency Portfolio, Institutional Class | | $ | 9,930,667 | | | $ | 62,838,974 | | | $ | (68,591,194) | | | $ | - | | | $ | - | | | $ | 4,178,447 | | | $ | 176,213 | |
Invesco Liquid Assets Portfolio, Institutional Class | | | 7,093,550 | | | | 44,884,981 | | | | (48,992,830) | | | | 268 | | | | (1,230) | | | | 2,984,739 | | | | 122,806 | |
Invesco Treasury Portfolio, Institutional Class | | | 11,349,333 | | | | 71,815,972 | | | | (78,389,936) | | | | - | | | | - | | | | 4,775,369 | | | | 191,576 | |
| Investments Purchased with Cash Collateral from Securities on Loan: | | | | | | | | | | | | | | | | | | | | | | | | | | | | |
Invesco Private Government Fund | | | 9,076,122 | | | | 168,197,357 | | | | (170,261,199) | | | | - | | | | - | | | | 7,012,280 | | | | 282,418* | |
Invesco Private Prime Fund | | | 23,431,130 | | | | 366,684,486 | | | | (372,088,377) | | | | (385) | | | | 8,367 | | | | 18,035,221 | | | | 783,860* | |
Total | | $ | 60,880,802 | | | $ | 714,421,770 | | | $ | (738,323,536) | | | $ | (117) | | | $ | 7,137 | | | $ | 36,986,056 | | | $ | 1,556,873 | |
| | * | Represents the income earned on the investment of cash collateral, which is included in securities lending income on the Statement of Operations. Does not include rebates and fees paid to lending agent or premiums received from borrowers, if any. |
| (e) | The rate shown is the 7-day SEC standardized yield as of October 31, 2023. |
| (f) | The security has been segregated to satisfy the commitment to return the cash collateral received in securities lending transactions upon the borrower’s return of the securities loaned. See Note 1I. |
See accompanying Notes to Financial Statements which are an integral part of the financial statements.
| | |
| 9 | | Invesco Main Street All Cap Fund® |
Statement of Assets and Liabilities
October 31, 2023
| | | | |
Assets: | | | | |
Investments in unaffiliated securities, at value (Cost $813,024,441)* | | $ | 1,088,913,233 | |
|
| |
Investments in affiliated money market funds, at value (Cost $36,986,017) | | | 36,986,056 | |
|
| |
Cash | | | 500,000 | |
|
| |
Foreign currencies, at value (Cost $351) | | | 339 | |
|
| |
Receivable for: | | | | |
Investments sold | | | 9,280,790 | |
|
| |
Fund shares sold | | | 322,131 | |
|
| |
Dividends | | | 502,492 | |
|
| |
Investment for trustee deferred compensation and retirement plans | | | 108,834 | |
|
| |
Other assets | | | 69,264 | |
|
| |
Total assets | | | 1,136,683,139 | |
|
| |
| |
Liabilities: | | | | |
Payable for: | | | | |
Investments purchased | | | 3,442,945 | |
|
| |
Fund shares reacquired | | | 603,598 | |
|
| |
Collateral upon return of securities loaned | | | 25,047,886 | |
|
| |
Accrued fees to affiliates | | | 479,754 | |
|
| |
Accrued other operating expenses | | | 53,554 | |
|
| |
Trustee deferred compensation and retirement plans | | | 108,834 | |
|
| |
Total liabilities | | | 29,736,571 | |
|
| |
Net assets applicable to shares outstanding | | $ | 1,106,946,568 | |
|
| |
| |
Net assets consist of: | | | | |
Shares of beneficial interest | | $ | 786,235,283 | |
|
| |
Distributable earnings | | | 320,711,285 | |
|
| |
| | $ | 1,106,946,568 | |
|
| |
| | | | |
Net Assets: | | | | |
Class A | | $ | 952,567,421 | |
|
| |
Class C | | $ | 41,278,778 | |
|
| |
Class R | | $ | 50,630,379 | |
|
| |
Class Y | | $ | 58,642,027 | |
|
| |
Class R5 | | $ | 9,421 | |
|
| |
Class R6 | | $ | 3,818,542 | |
|
| |
|
Shares outstanding, no par value, with an unlimited number of shares authorized: | |
Class A | | | 45,401,587 | |
|
| |
Class C | | | 2,305,445 | |
|
| |
Class R | | | 2,531,975 | |
|
| |
Class Y | | | 2,694,106 | |
|
| |
Class R5 | | | 446 | |
|
| |
Class R6 | | | 180,661 | |
|
| |
Class A: | | | | |
Net asset value per share | | $ | 20.98 | |
|
| |
Maximum offering price per share
(Net asset value of $20.98 ÷ 94.50%) | | $ | 22.20 | |
|
| |
Class C: | | | | |
Net asset value and offering price per share | | $ | 17.90 | |
|
| |
Class R: | | | | |
Net asset value and offering price per share | | $ | 20.00 | |
|
| |
Class Y: | | | | |
Net asset value and offering price per share | | $ | 21.77 | |
|
| |
Class R5: | | | | |
Net asset value and offering price per share | | $ | 21.12 | |
|
| |
Class R6: | | | | |
Net asset value and offering price per share | | $ | 21.14 | |
|
| |
| * | At October 31, 2023, securities with an aggregate value of $24,658,831 were on loan to brokers. |
See accompanying Notes to Financial Statements which are an integral part of the financial statements.
| | |
| 10 | | Invesco Main Street All Cap Fund® |
Statement of Operations
For the year ended October 31, 2023
| | | | |
Investment income: | | | | |
Dividends (net of foreign withholding taxes of $7,151) | | $ | 16,122,580 | |
|
| |
Dividends from affiliated money market funds (includes net securities lending income of $56,697) | | | 547,292 | |
|
| |
Total investment income | | | 16,669,872 | |
|
| |
| |
Expenses: | | | | |
Advisory fees | | | 7,482,642 | |
|
| |
Administrative services fees | | | 162,163 | |
|
| |
Custodian fees | | | 8,562 | |
|
| |
Distribution fees: | | | | |
Class A | | | 2,372,332 | |
|
| |
Class C | | | 433,876 | |
|
| |
Class R | | | 250,380 | |
|
| |
Transfer agent fees – A, C, R and Y | | | 1,393,718 | |
|
| |
Transfer agent fees – R5 | | | 3 | |
|
| |
Transfer agent fees – R6 | | | 1,028 | |
|
| |
Trustees’ and officers’ fees and benefits | | | 24,920 | |
|
| |
Registration and filing fees | | | 113,480 | |
|
| |
Reports to shareholders | | | 88,358 | |
|
| |
Professional services fees | | | 54,515 | |
|
| |
Other | | | 26,553 | |
|
| |
Total expenses | | | 12,412,530 | |
|
| |
Less: Fees waived and/or expense offset arrangement(s) | | | (66,007 | ) |
|
| |
Net expenses | | | 12,346,523 | |
|
| |
Net investment income | | | 4,323,349 | |
|
| |
| |
Realized and unrealized gain (loss) from: | | | | |
Net realized gain from: | | | | |
Unaffiliated investment securities | | | 45,270,124 | |
|
| |
Affiliated investment securities | | | 7,137 | |
|
| |
Foreign currencies | | | 4,595 | |
|
| |
| | | 45,281,856 | |
|
| |
Change in net unrealized appreciation (depreciation) of: | | | | |
Unaffiliated investment securities | | | 67,586,070 | |
|
| |
Affiliated investment securities | | | (117 | ) |
|
| |
Foreign currencies | | | (12 | ) |
|
| |
| | | 67,585,941 | |
|
| |
Net realized and unrealized gain | | | 112,867,797 | |
|
| |
Net increase in net assets resulting from operations | | $ | 117,191,146 | |
|
| |
See accompanying Notes to Financial Statements which are an integral part of the financial statements.
| | |
| 11 | | Invesco Main Street All Cap Fund® |
Statement of Changes in Net Assets
For the years ended October 31, 2023 and 2022
| | | | | | | | |
| | | 2023 | | | 2022 | |
|
| |
Operations: | | | | | | | | |
Net investment income | | $ | 4,323,349 | | | $ | 6,350,518 | |
|
| |
Net realized gain | | | 45,281,856 | | | | 60,324,740 | |
|
| |
Change in net unrealized appreciation (depreciation) | | | 67,585,941 | | | | (306,783,599 | ) |
|
| |
Net increase (decrease) in net assets resulting from operations | | | 117,191,146 | | | | (240,108,341 | ) |
|
| |
| | |
Distributions to shareholders from distributable earnings: | | | | | | | | |
Class A | | | (50,576,639 | ) | | | (183,271,754 | ) |
|
| |
Class C | | | (2,550,094 | ) | | | (9,801,181 | ) |
|
| |
Class R | | | (2,602,128 | ) | | | (9,041,566 | ) |
|
| |
Class Y | | | (3,159,556 | ) | | | (10,690,443 | ) |
|
| |
Class R5 | | | (525 | ) | | | (1,964 | ) |
|
| |
Class R6 | | | (176,587 | ) | | | (527,650 | ) |
|
| |
Total distributions from distributable earnings | | | (59,065,529 | ) | | | (213,334,558 | ) |
|
| |
| | |
Share transactions–net: | | | | | | | | |
Class A | | | (28,008,129 | ) | | | 89,682,738 | |
|
| |
Class C | | | (2,148,934 | ) | | | 1,756,250 | |
|
| |
Class R | | | 1,621,406 | | | | 6,464,474 | |
|
| |
Class Y | | | (1,849,565 | ) | | | 8,811,450 | |
|
| |
Class R6 | | | 768,777 | | | | 697,012 | |
|
| |
Net increase (decrease) in net assets resulting from share transactions | | | (29,616,445 | ) | | | 107,411,924 | |
|
| |
Net increase (decrease) in net assets | | | 28,509,172 | | | | (346,030,975 | ) |
|
| |
| | |
Net assets: | | | | | | | | |
Beginning of year | | | 1,078,437,396 | | | | 1,424,468,371 | |
|
| |
End of year | | $ | 1,106,946,568 | | | $ | 1,078,437,396 | |
|
| |
See accompanying Notes to Financial Statements which are an integral part of the financial statements.
| | |
| 12 | | Invesco Main Street All Cap Fund® |
Financial Highlights
The following schedule presents financial highlights for a share of the Fund outstanding throughout the periods indicated.
| | | | | | | | | | | | | | | | | | | | | | | | | | | | | | | | | | | | | | | | | | | | | | | | | | | | | | | | |
| | | Net asset value, beginning of period | | Net investment income (loss)(a) | | Net gains (losses) on securities (both realized and unrealized) | | Total from investment operations | | Dividends from net investment income | | Distributions from net realized gains | | Total distributions | | Net asset value, end of period | | Total return(b) | | Net assets, end of period (000’s omitted) | | Ratio of expenses to average net assets with fee waivers and/or expenses absorbed | | Ratio of expenses to average net assets without fee waivers and/or expenses absorbed(c) | | Ratio of net investment income (loss) to average net assets | | Portfolio turnover (d) |
Class A | | | | | | | | | | | | | | | | | | | | | | | | | | | | | | | | | | | | | | | | | | | | | | | | | | | | | | | | |
Year ended 10/31/23 | | | $19.99 | | | | $ 0.09 | | | | $ 2.00 | | | | $ 2.09 | | | | $(0.04 | ) | | | $(1.06 | ) | | | $(1.10 | ) | | | $20.98 | | | | 11.05 | %(e) | | | $ 952,567 | | | | 1.06 | %(e) | | | 1.06 | %(e) | | | 0.41 | %(e) | | | 56 | % |
Year ended 10/31/22 | | | 28.54 | | | | 0.12 | | | | (4.36 | ) | | | (4.24 | ) | | | (0.16 | ) | | | (4.15 | ) | | | (4.31 | ) | | | 19.99 | | | | (17.59 | )(e) | | | 929,660 | | | | 1.06 | (e) | | | 1.06 | (e) | | | 0.53 | (e) | | | 45 | |
Year ended 10/31/21 | | | 20.45 | | | | 0.05 | | | | 8.25 | | | | 8.30 | | | | (0.11 | ) | | | (0.10 | ) | | | (0.21 | ) | | | 28.54 | | | | 40.84 | (e) | | | 1,229,595 | | | | 1.07 | (e) | | | 1.07 | (e) | | | 0.18 | (e) | | | 35 | |
Year ended 10/31/20 | | | 18.53 | | | | 0.14 | | | | 1.94 | | | | 2.08 | | | | (0.09 | ) | | | (0.07 | ) | | | (0.16 | ) | | | 20.45 | | | | 11.24 | (e) | | | 938,494 | | | | 1.12 | (e) | | | 1.12 | (e) | | | 0.73 | (e) | | | 28 | |
Three months ended 10/31/19 | | | 18.30 | | | | 0.03 | | | | 0.20 | | | | 0.23 | | | | – | | | | – | | | | – | | | | 18.53 | | | | 1.26 | | | | 957,529 | | | | 1.14 | (f) | | | 1.14 | (f) | | | 0.73 | (f) | | | 7 | |
Year ended 07/31/19 | | | 18.77 | | | | 0.13 | | | | 0.75 | | | | 0.88 | | | | (0.07 | ) | | | (1.28 | ) | | | (1.35 | ) | | | 18.30 | | | | 5.84 | | | | 976,093 | | | | 1.13 | | | | 1.13 | | | | 0.73 | | | | 48 | |
Class C | | | | | | | | | | | | | | | | | | | | | | | | | | | | | | | | | | | | | | | | | | | | | | | | | | | | | | | | |
Year ended 10/31/23 | | | 17.30 | | | | (0.06 | ) | | | 1.72 | | | | 1.66 | | | | – | | | | (1.06 | ) | | | (1.06 | ) | | | 17.90 | | | | 10.20 | | | | 41,279 | | | | 1.82 | | | | 1.82 | | | | (0.35 | ) | | | 56 | |
Year ended 10/31/22 | | | 25.35 | | | | (0.04 | ) | | | (3.80 | ) | | | (3.84 | ) | | | (0.06 | ) | | | (4.15 | ) | | | (4.21 | ) | | | 17.30 | | | | (18.25 | ) | | | 41,846 | | | | 1.82 | | | | 1.82 | | | | (0.23 | ) | | | 45 | |
Year ended 10/31/21 | | | 18.31 | | | | (0.13 | ) | | | 7.37 | | | | 7.24 | | | | (0.10 | ) | | | (0.10 | ) | | | (0.20 | ) | | | 25.35 | | | | 39.78 | | | | 60,285 | | | | 1.83 | | | | 1.83 | | | | (0.58 | ) | | | 35 | |
Year ended 10/31/20 | | | 16.66 | | | | (0.01 | ) | | | 1.76 | | | | 1.75 | | | | (0.03 | ) | | | (0.07 | ) | | | (0.10 | ) | | | 18.31 | | | | 10.52 | | | | 61,600 | | | | 1.88 | | | | 1.88 | | | | (0.03 | ) | | | 28 | |
Three months ended 10/31/19 | | | 16.49 | | | | – | | | | 0.17 | | | | 0.17 | | | | – | | | | – | | | | – | | | | 16.66 | | | | 1.03 | | | | 69,736 | | | | 1.90 | (f) | | | 1.90 | (f) | | | (0.03 | )(f) | | | 7 | |
Year ended 07/31/19 | | | 17.10 | | | | – | | | | 0.67 | | | | 0.67 | | | | – | | | | (1.28 | ) | | | (1.28 | ) | | | 16.49 | | | | 5.18 | | | | 73,404 | | | | 1.89 | | | | 1.89 | | | | (0.02 | ) | | | 48 | |
Class R | | | | | | | | | | | | | | | | | | | | | | | | | | | | | | | | | | | | | | | | | | | | | | | | | | | | | | | | |
Year ended 10/31/23 | | | 19.12 | | | | 0.03 | | | | 1.92 | | | | 1.95 | | | | (0.01 | ) | | | (1.06 | ) | | | (1.07 | ) | | | 20.00 | | | | 10.81 | | | | 50,630 | | | | 1.32 | | | | 1.32 | | | | 0.15 | | | | 56 | |
Year ended 10/31/22 | | | 27.48 | | | | 0.06 | | | | (4.18 | ) | | | (4.12 | ) | | | (0.09 | ) | | | (4.15 | ) | | | (4.24 | ) | | | 19.12 | | | | (17.82 | ) | | | 46,688 | | | | 1.32 | | | | 1.32 | | | | 0.27 | | | | 45 | |
Year ended 10/31/21 | | | 19.74 | | | | (0.02 | ) | | | 7.96 | | | | 7.94 | | | | (0.10 | ) | | | (0.10 | ) | | | (0.20 | ) | | | 27.48 | | | | 40.47 | | | | 59,603 | | | | 1.33 | | | | 1.33 | | | | (0.08 | ) | | | 35 | |
Year ended 10/31/20 | | | 17.91 | | | | 0.09 | | | | 1.88 | | | | 1.97 | | | | (0.07 | ) | | | (0.07 | ) | | | (0.14 | ) | | | 19.74 | | | | 11.01 | | | | 49,869 | | | | 1.38 | | | | 1.38 | | | | 0.47 | | | | 28 | |
Three months ended 10/31/19 | | | 17.70 | | | | 0.02 | | | | 0.19 | | | | 0.21 | | | | – | | | | – | | | | – | | | | 17.91 | | | | 1.19 | | | | 53,064 | | | | 1.40 | (f) | | | 1.40 | (f) | | | 0.47 | (f) | | | 7 | |
Year ended 07/31/19 | | | 18.20 | | | | 0.08 | | | | 0.73 | | | | 0.81 | | | | (0.03 | ) | | | (1.28 | ) | | | (1.31 | ) | | | 17.70 | | | | 5.63 | | | | 55,265 | | | | 1.38 | | | | 1.38 | | | | 0.48 | | | | 48 | |
Class Y | | | | | | | | | | | | | | | | | | | | | | | | | | | | | | | | | | | | | | | | | | | | | | | | | | | | | | | | |
Year ended 10/31/23 | | | 20.70 | | | | 0.14 | | | | 2.09 | | | | 2.23 | | | | (0.10 | ) | | | (1.06 | ) | | | (1.16 | ) | | | 21.77 | | | | 11.36 | | | | 58,642 | | | | 0.82 | | | | 0.82 | | | | 0.65 | | | | 56 | |
Year ended 10/31/22 | | | 29.41 | | | | 0.18 | | | | (4.52 | ) | | | (4.34 | ) | | | (0.22 | ) | | | (4.15 | ) | | | (4.37 | ) | | | 20.70 | | | | (17.41 | ) | | | 57,359 | | | | 0.82 | | | | 0.82 | | | | 0.77 | | | | 45 | |
Year ended 10/31/21 | | | 21.03 | | | | 0.11 | | | | 8.49 | | | | 8.60 | | | | (0.12 | ) | | | (0.10 | ) | | | (0.22 | ) | | | 29.41 | | | | 41.15 | | | | 71,664 | | | | 0.83 | | | | 0.83 | | | | 0.42 | | | | 35 | |
Year ended 10/31/20 | | | 19.01 | | | | 0.19 | | | | 2.01 | | | | 2.20 | | | | (0.11 | ) | | | (0.07 | ) | | | (0.18 | ) | | | 21.03 | | | | 11.59 | | | | 49,316 | | | | 0.88 | | | | 0.88 | | | | 0.97 | | | | 28 | |
Three months ended 10/31/19 | | | 18.77 | | | | 0.05 | | | | 0.19 | | | | 0.24 | | | | – | | | | – | | | | – | | | | 19.01 | | | | 1.28 | | | | 46,309 | | | | 0.91 | (f) | | | 0.91 | (f) | | | 0.97 | (f) | | | 7 | |
Year ended 07/31/19 | | | 19.22 | | | | 0.18 | | | | 0.77 | | | | 0.95 | | | | (0.12 | ) | | | (1.28 | ) | | | (1.40 | ) | | | 18.77 | | | | 6.11 | | | | 44,719 | | | | 0.89 | | | | 0.89 | | | | 0.98 | | | | 48 | |
Class R5 | | | | | | | | | | | | | | | | | | | | | | | | | | | | | | | | | | | | | | | | | | | | | | | | | | | | | | | | |
Year ended 10/31/23 | | | 20.13 | | | | 0.16 | | | | 2.01 | | | | 2.17 | | | | (0.12 | ) | | | (1.06 | ) | | | (1.18 | ) | | | 21.12 | | | | 11.42 | | | | 9 | | | | 0.73 | | | | 0.73 | | | | 0.74 | | | | 56 | |
Year ended 10/31/22 | | | 28.72 | | | | 0.20 | | | | (4.39 | ) | | | (4.19 | ) | | | (0.25 | ) | | | (4.15 | ) | | | (4.40 | ) | | | 20.13 | | | | (17.32 | ) | | | 9 | | | | 0.72 | | | | 0.72 | | | | 0.87 | | | | 45 | |
Year ended 10/31/21 | | | 20.53 | | | | 0.13 | | | | 8.28 | | | | 8.41 | | | | (0.12 | ) | | | (0.10 | ) | | | (0.22 | ) | | | 28.72 | | | | 41.24 | | | | 13 | | | | 0.73 | | | | 0.73 | | | | 0.52 | | | | 35 | |
Year ended 10/31/20 | | | 18.56 | | | | 0.20 | | | | 1.95 | | | | 2.15 | | | | (0.11 | ) | | | (0.07 | ) | | | (0.18 | ) | | | 20.53 | | | | 11.64 | | | | 12 | | | | 0.80 | | | | 0.80 | | | | 1.05 | | | | 28 | |
Three months ended 10/31/19 | | | 18.31 | | | | 0.05 | | | | 0.20 | | | | 0.25 | | | | – | | | | – | | | | – | | | | 18.56 | | | | 1.37 | | | | 11 | | | | 0.84 | (f) | | | 0.84 | (f) | | | 1.04 | (f) | | | 7 | |
Period ended 07/31/19(g) | | | 17.13 | | | | 0.04 | | | | 1.14 | | | | 1.18 | | | | – | | | | – | | | | – | | | | 18.31 | | | | 6.89 | | | | 11 | | | | 0.79 | (f) | | | 0.79 | (f) | | | 1.07 | (f) | | | 48 | |
Class R6 | | | | | | | | | | | | | | | | | | | | | | | | | | | | | | | | | | | | | | | | | | | | | | | | | | | | | | | | |
Year ended 10/31/23 | | | 20.14 | | | | 0.16 | | | | 2.02 | | | | 2.18 | | | | (0.12 | ) | | | (1.06 | ) | | | (1.18 | ) | | | 21.14 | | | | 11.46 | | | | 3,819 | | | | 0.73 | | | | 0.73 | | | | 0.74 | | | | 56 | |
Year ended 10/31/22 | | | 28.74 | | | | 0.20 | | | | (4.40 | ) | | | (4.20 | ) | | | (0.25 | ) | | | (4.15 | ) | | | (4.40 | ) | | | 20.14 | | | | (17.35 | ) | | | 2,875 | | | | 0.72 | | | | 0.72 | | | | 0.87 | | | | 45 | |
Year ended 10/31/21 | | | 20.53 | | | | 0.14 | | | | 8.29 | | | | 8.43 | | | | (0.12 | ) | | | (0.10 | ) | | | (0.22 | ) | | | 28.74 | | | | 41.34 | | | | 3,309 | | | | 0.73 | | | | 0.73 | | | | 0.52 | | | | 35 | |
Year ended 10/31/20 | | | 18.56 | | | | 0.20 | | | | 1.96 | | | | 2.16 | | | | (0.12 | ) | | | (0.07 | ) | | | (0.19 | ) | | | 20.53 | | | | 11.68 | | | | 102 | | | | 0.80 | | | | 0.80 | | | | 1.05 | | | | 28 | |
Three months ended 10/31/19 | | | 18.31 | | | | 0.05 | | | | 0.20 | | | | 0.25 | | | | – | | | | – | | | | – | | | | 18.56 | | | | 1.37 | | | | 11 | | | | 0.73 | (f) | | | 0.73 | (f) | | | 1.15 | (f) | | | 7 | |
Period ended 07/31/19(g) | | | 17.13 | | | | 0.04 | | | | 1.14 | | | | 1.18 | | | | – | | | | – | | | | – | | | | 18.31 | | | | 6.89 | | | | 11 | | | | 0.74 | (f) | | | 0.74 | (f) | | | 1.12 | (f) | | | 48 | |
| (a) | Calculated using average shares outstanding. |
| (b) | Includes adjustments in accordance with accounting principles generally accepted in the United States of America and as such, the net asset value for financial reporting purposes and the returns based upon those net asset values may differ from the net asset value and returns for shareholder transactions. Does not include sales charges and is not annualized for periods less than one year, if applicable. |
| (c) | Does not include indirect expenses from affiliated fund fees and expenses of 0.00% for the three months ended October 31, 2019 and the year ended July 31, 2019, respectively. |
| (d) | Portfolio turnover is calculated at the fund level and is not annualized for periods less than one year, if applicable. |
| (e) | The total return, ratio of expenses to average net assets and ratio of net investment income (loss) to average net assets reflect actual 12b-1 fees of 0.24% for the years ended October 31, 2023, 2022, 2021 and 2020. |
| (g) | Commencement date after the close of business on May 24, 2019. |
See accompanying Notes to Financial Statements which are an integral part of the financial statements.
| | |
| 13 | | Invesco Main Street All Cap Fund® |
Notes to Financial Statements
October 31, 2023
NOTE 1–Significant Accounting Policies
Invesco Main Street All Cap Fund® (the “Fund”) is a series portfolio of AIM Equity Funds (Invesco Equity Funds) (the “Trust”). The Trust is a Delaware statutory trust registered under the Investment Company Act of 1940, as amended (the “1940 Act”), as an open-end series management investment company authorized to issue an unlimited number of shares of beneficial interest. Information presented in these financial statements pertains only to the Fund. Matters affecting the Fund or each class will be voted on exclusively by the shareholders of the Fund or each class.
The Fund’s investment objective is to seek capital appreciation.
The Fund currently consists of six different classes of shares: Class A, Class C, Class R, Class Y, Class R5 and Class R6. Class Y shares are available only to certain investors. Class A shares are sold with a front-end sales charge unless certain waiver criteria are met. Under certain circumstances, load waived shares may be subject to contingent deferred sales charges (“CDSC”). Class C shares are sold with a CDSC. Class R, Class Y, Class R5 and Class R6 shares are sold at net asset value. Class C shares held for eight years after purchase are eligible for automatic conversion into Class A shares of the same Fund (the “Conversion Feature”). The automatic conversion pursuant to the Conversion Feature will generally occur at the end of the month following the eighth anniversary after a purchase of Class C shares.
The Fund is an investment company and accordingly follows the investment company accounting and reporting guidance in accordance with Financial Accounting Standards Board Accounting Standards Codification Topic 946, Financial Services – Investment Companies.
The following is a summary of the significant accounting policies followed by the Fund in the preparation of its financial statements.
| A. | Security Valuations – Securities, including restricted securities, are valued according to the following policy. |
A security listed or traded on an exchange is generally valued at its trade price or official closing price that day as of the close of the exchange where the security is principally traded, or lacking any trades or official closing price on a particular day, the security may be valued at the closing bid or ask price on that day. Securities traded in the over-the-counter market are valued based on prices furnished by independent pricing services or market makers. When such securities are valued using prices provided by an independent pricing service they may be considered fair valued. Futures contracts are valued at the daily settlement price set by an exchange on which they are principally traded. Where a final settlement price exists, exchange-traded options are valued at the final settlement price from the exchange where the option principally trades. Where a final settlement price does not exist, exchange-traded options are valued at the mean between the last bid and ask price generally from the exchange where the option principally trades.
Securities of investment companies that are not exchange-traded (e.g., open-end mutual funds) are valued using such company’s end-of-business-day net asset value per share.
Deposits, other obligations of U.S. and non-U.S. banks and financial institutions are valued at their daily account value.
Fixed income securities (including convertible debt securities) generally are valued on the basis of prices provided by independent pricing services. Prices provided by the pricing service may be determined without exclusive reliance on quoted prices, and may reflect appropriate factors such as institution-size trading in similar groups of securities, developments related to specific securities, dividend rate (for unlisted equities), yield (for debt obligations), quality, type of issue, coupon rate (for debt obligations), maturity (for debt obligations), individual trading characteristics and other market data. Pricing services generally value debt obligations assuming orderly transactions of institutional round lot size, but a fund may hold or transact in the same securities in smaller, odd lot sizes. Odd lots often trade at lower prices than institutional round lots, and their value may be adjusted accordingly. Debt obligations are subject to interest rate and credit risks. In addition, all debt obligations involve some risk of default with respect to interest and/or principal payments.
Foreign securities’ (including foreign exchange contracts) prices are converted into U.S. dollar amounts using the applicable exchange rates as of the close of the New York Stock Exchange (“NYSE”). If market quotations are available and reliable for foreign exchange-traded equity securities, the securities will be valued at the market quotations. Invesco Advisers, Inc. (the “Adviser” or “Invesco”) may use various pricing services to obtain market quotations as well as fair value prices. Because trading hours for certain foreign securities end before the close of the NYSE, closing market quotations may become not representative of market value in the Adviser’s judgment (“unreliable”). If, between the time trading ends on a particular security and the close of the customary trading session on the NYSE, a significant event occurs that makes the closing price of the security unreliable, the Adviser may fair value the security. If the event is likely to have affected the closing price of the security, the security will be valued at fair value in good faith in accordance with Board- approved policies and related Adviser procedures (“Valuation Procedures”). Adjustments to closing prices to reflect fair value may also be based on a screening process of an independent pricing service to indicate the degree of certainty, based on historical data, that the closing price in the principal market where a foreign security trades is not the current value as of the close of the NYSE. Foreign securities’ prices meeting the degree of certainty that the price is not reflective of current value will be priced at the indication of fair value from the independent pricing service. Multiple factors may be considered by the independent pricing service in determining adjustments to reflect fair value and may include information relating to sector indices, American Depositary Receipts and domestic and foreign index futures. Foreign securities may have additional risks including exchange rate changes, potential for sharply devalued currencies and high inflation, political and economic upheaval, the relative lack of issuer information, relatively low market liquidity and the potential lack of strict financial and accounting controls and standards.
Unlisted securities will be valued using prices provided by independent pricing services or by another method that the Adviser, in its judgment, believes better reflects the security’s fair value in accordance with the Valuation Procedures.
Securities for which market prices are not provided by any of the above methods may be valued based upon quotes furnished by independent sources. The mean between the last bid and ask prices may be used to value debt obligations, including corporate loans.
Securities for which market quotations are not readily available are fair valued by the Adviser in accordance with the Valuation Procedures. If a fair value price provided by a pricing service is unreliable, the Adviser will fair value the security using the Valuation Procedures. Issuer specific events, market trends, bid/ask quotes of brokers and information providers and other market data may be reviewed in the course of making a good faith determination of a security’s fair value.
The Fund may invest in securities that are subject to interest rate risk, meaning the risk that the prices will generally fall as interest rates rise and, conversely, the prices will generally rise as interest rates fall. Specific securities differ in their sensitivity to changes in interest rates depending on their individual characteristics. Changes in interest rates may result in increased market volatility, which may affect the value and/or liquidity of certain Fund investments.
Valuations change in response to many factors including the historical and prospective earnings of the issuer, the value of the issuer’s assets, general market conditions which are not specifically related to the particular issuer, such as real or perceived adverse economic conditions, changes in the general outlook for revenues or corporate earnings, changes in interest or currency rates, regional or global instability, natural or environmental disasters, widespread disease or other public health issues, war, acts of terrorism, significant governmental actions or adverse investor sentiment generally and market liquidity. Because of the inherent uncertainties of valuation, the values reflected in the financial statements may materially differ from the value received upon actual sale of those investments.
The price the Fund could receive upon the sale of any investment may differ from the Adviser’s valuation of the investment, particularly for securities that are valued using a fair valuation technique. When fair valuation techniques are applied, the Adviser uses available information, including both observable and unobservable inputs and assumptions, to determine a methodology that will result in a valuation that the Adviser believes approximates market value. Fund securities that are fair valued may be subject to greater fluctuation in their value from one day to the next than would be the case if market quotations were used. Because of the inherent uncertainties of valuation, and the degree of subjectivity in such decisions, the Fund could realize a greater or lesser than expected gain or loss upon the sale of the investment.
| | |
| 14 | | Invesco Main Street All Cap Fund® |
| B. | Securities Transactions and Investment Income – Securities transactions are accounted for on a trade date basis. Realized gains or losses on sales are computed on the basis of specific identification of the securities sold. Interest income (net of withholding tax, if any) is recorded on an accrual basis from settlement date and includes coupon interest and amortization of premium and accretion of discount on debt securities as applicable. Dividend income (net of withholding tax, if any) is recorded on the ex-dividend date. |
The Fund may periodically participate in litigation related to Fund investments. As such, the Fund may receive proceeds from litigation settlements. Any proceeds received are included in the Statement of Operations as realized gain (loss) for investments no longer held and as unrealized gain (loss) for investments still held.
Brokerage commissions and mark ups are considered transaction costs and are recorded as an increase to the cost basis of securities purchased and/or a reduction of proceeds on a sale of securities. Such transaction costs are included in the determination of net realized and unrealized gain (loss) from investment securities reported in the Statement of Operations and the Statement of Changes in Net Assets and the net realized and unrealized gains (losses) on securities per share in the Financial Highlights. Transaction costs are included in the calculation of the Fund’s net asset value and, accordingly, they reduce the Fund’s total returns. These transaction costs are not considered operating expenses and are not reflected in net investment income reported in the Statement of Operations and the Statement of Changes in Net Assets, or the net investment income per share and the ratios of expenses and net investment income reported in the Financial Highlights, nor are they limited by any expense limitation arrangements between the Fund and the investment adviser.
The Fund allocates income and realized and unrealized capital gains and losses to a class based on the relative net assets of each class.
| C. | Country Determination – For the purposes of making investment selection decisions and presentation in the Schedule of Investments, the investment adviser may determine the country in which an issuer is located and/or credit risk exposure based on various factors. These factors include the laws of the country under which the issuer is organized, where the issuer maintains a principal office, the country in which the issuer derives 50% or more of its total revenues, the country that has the primary market for the issuer’s securities and its “country of risk” as determined by a third party service provider, as well as other criteria. Among the other criteria that may be evaluated for making this determination are the country in which the issuer maintains 50% or more of its assets, the type of security, financial guarantees and enhancements, the nature of the collateral and the sponsor organization. Country of issuer and/or credit risk exposure has been determined to be the United States of America, unless otherwise noted. |
| D. | Distributions – Distributions from net investment income and net realized capital gain, if any, are generally declared and paid annually and recorded on the ex-dividend date. The Fund may elect to treat a portion of the proceeds from redemptions as distributions for federal income tax purposes. |
| E. | Federal Income Taxes – The Fund intends to comply with the requirements of Subchapter M of the Internal Revenue Code of 1986, as amended (the “Internal Revenue Code”), necessary to qualify as a regulated investment company and to distribute substantially all of the Fund’s taxable earnings to shareholders. As such, the Fund will not be subject to federal income taxes on otherwise taxable income (including net realized capital gain) that is distributed to shareholders. Therefore, no provision for federal income taxes is recorded in the financial statements. |
The Fund recognizes the tax benefits of uncertain tax positions only when the position is more likely than not to be sustained. Management has analyzed the Fund’s uncertain tax positions and concluded that no liability for unrecognized tax benefits should be recorded related to uncertain tax positions. Management is not aware of any tax positions for which it is reasonably possible that the total amounts of unrecognized tax benefits will change materially in the next 12 months.
The Fund files tax returns in the U.S. Federal jurisdiction and certain other jurisdictions. Generally, the Fund is subject to examinations by such taxing authorities for up to three years after the filing of the return for the tax period.
| F. | Expenses – Fees provided for under the Rule 12b-1 plan of a particular class of the Fund are charged to the operations of such class. Transfer agency fees and expenses and other shareholder recordkeeping fees and expenses attributable to Class R5 and Class R6 are allocated based on relative net assets of Class R5 and Class R6. Sub-accounting fees attributable to Class R5 are charged to the operations of the class. Transfer agency fees and expenses and other shareholder recordkeeping fees and expenses relating to all other classes are allocated among those classes based on relative net assets. All other expenses are allocated among the classes based on relative net assets. |
| G. | Accounting Estimates – The preparation of financial statements in conformity with accounting principles generally accepted in the United States of America (“GAAP”) requires management to make estimates and assumptions that affect the reported amounts of assets and liabilities at the date of the financial statements and the reported amounts of revenues and expenses during the reporting period including estimates and assumptions related to taxation. Actual results could differ from those estimates by a significant amount. In addition, the Fund monitors for material events or transactions that may occur or become known after the period-end date and before the date the financial statements are released to print. |
| H. | Indemnifications – Under the Trust’s organizational documents, each Trustee, officer, employee or other agent of the Trust is indemnified against certain liabilities that may arise out of the performance of their duties to the Fund. Additionally, in the normal course of business, the Fund enters into contracts, including the Fund’s servicing agreements, that contain a variety of indemnification clauses. The Fund’s maximum exposure under these arrangements is unknown as this would involve future claims that may be made against the Fund that have not yet occurred. The risk of material loss as a result of such indemnification claims is considered remote. |
| I. | Securities Lending – The Fund may lend portfolio securities having a market value up to one-third of the Fund’s total assets. Such loans are secured by collateral equal to no less than the market value of the loaned securities determined daily by the securities lending provider. Such collateral will be cash or debt securities issued or guaranteed by the U.S. Government or any of its sponsored agencies. Cash collateral received in connection with these loans is invested in short-term money market instruments or affiliated, unregistered investment companies that comply with Rule 2a-7 under the 1940 Act and money market funds (collectively, “affiliated money market funds”) and is shown as such on the Schedule of Investments. The Fund bears the risk of loss with respect to the investment of collateral. It is the Fund’s policy to obtain additional collateral from or return excess collateral to the borrower by the end of the next business day, following the valuation date of the securities loaned. Therefore, the value of the collateral held may be temporarily less than the value of the securities on loan. When loaning securities, the Fund retains certain benefits of owning the securities, including the economic equivalent of dividends or interest generated by the security. Lending securities entails a risk of loss to the Fund if, and to the extent that, the market value of the securities loaned were to increase and the borrower did not increase the collateral accordingly, and the borrower failed to return the securities. The securities loaned are subject to termination at the option of the borrower or the Fund. Upon termination, the borrower will return to the Fund the securities loaned and the Fund will return the collateral. Upon the failure of the borrower to return the securities, collateral may be liquidated and the securities may be purchased on the open market to replace the loaned securities. The Fund could experience delays and costs in gaining access to the collateral and the securities may lose value during the delay which could result in potential losses to the Fund. Some of these losses may be indemnified by the lending agent. The Fund bears the risk of any deficiency in the amount of the collateral available for return to the borrower due to any loss on the collateral invested. Dividends received on cash collateral investments for securities lending transactions, which are net of compensation to counterparties, are included in Dividends from affiliated money market funds on the Statement of Operations. The aggregate value of securities out on loan, if any, is shown as a footnote on the Statement of Assets and Liabilities. |
The Adviser serves as an affiliated securities lending agent for the Fund. The Bank of New York Mellon also serves as a securities lending agent. To the extent the Fund utilizes the Adviser as an affiliated securities lending agent, the Fund conducts its securities lending in accordance with, and in reliance upon, no-action letters issued by the SEC staff that provide guidance on how an affiliate may act as a direct agent lender and receive compensation for those services in a manner consistent with the federal securities laws. For the year ended October 31, 2023, the Fund paid the Adviser $4,004 in fees for securities lending agent services. Fees paid to the Adviser for securities lending agent services, if any, are included in Dividends from affiliated money market funds on the Statement of Operations.
| J. | Foreign Currency Translations – Foreign currency is valued at the close of the NYSE based on quotations posted by banks and major currency dealers. Portfolio securities and other assets and liabilities denominated in foreign currencies are translated into U.S. dollar amounts at the date of valuation. Purchases |
| | |
| 15 | | Invesco Main Street All Cap Fund® |
| | and sales of portfolio securities (net of foreign taxes withheld on disposition) and income items denominated in foreign currencies are translated into U.S. dollar amounts on the respective dates of such transactions. The Fund does not separately account for the portion of the results of operations resulting from changes in foreign exchange rates on investments and the fluctuations arising from changes in market prices of securities held. The combined results of changes in foreign exchange rates and the fluctuation of market prices on investments (net of estimated foreign tax withholding) are included with the net realized and unrealized gain or loss from investments in the Statement of Operations. Reported net realized foreign currency gains or losses arise from (1) sales of foreign currencies, (2) currency gains or losses realized between the trade and settlement dates on securities transactions, and (3) the difference between the amounts of dividends, interest, and foreign withholding taxes recorded on the Fund’s books and the U.S. dollar equivalent of the amounts actually received or paid. Net unrealized foreign currency gains and losses arise from changes in the fair values of assets and liabilities, other than investments in securities at fiscal period end, resulting from changes in exchange rates. |
The Fund may invest in foreign securities, which may be subject to foreign taxes on income, gains on investments or currency repatriation, a portion of which may be recoverable. Foreign taxes, if any, are recorded based on the tax regulations and rates that exist in the foreign markets in which the Fund invests and are shown in the Statement of Operations.
| K. | Forward Foreign Currency Contracts – The Fund may engage in foreign currency transactions either on a spot (i.e. for prompt delivery and settlement) basis, or through forward foreign currency contracts, to manage or minimize currency or exchange rate risk. |
The Fund may also enter into forward foreign currency contracts for the purchase or sale of a security denominated in a foreign currency in order to “lock in” the U.S. dollar price of that security, or the Fund may also enter into forward foreign currency contracts that do not provide for physical exchange of the two currencies on the settlement date, but instead are settled by a single cash payment calculated as the difference between the agreed upon exchange rate and the spot rate at settlement based upon an agreed upon notional amount (non-deliverable forwards).
A forward foreign currency contract is an obligation between two parties (“Counterparties”) to purchase or sell a specific currency for an agreed-upon price at a future date. The use of forward foreign currency contracts for hedging does not eliminate fluctuations in the price of the underlying securities the Fund owns or intends to acquire but establishes a rate of exchange in advance. Fluctuations in the value of these contracts are measured by the difference in the contract date and reporting date exchange rates and are recorded as unrealized appreciation (depreciation) until the contracts are closed. When the contracts are closed, realized gains (losses) are recorded. Realized and unrealized gains (losses) on the contracts are included in the Statement of Operations. The primary risks associated with forward foreign currency contracts include failure of the Counterparty to meet the terms of the contract and the value of the foreign currency changing unfavorably. These risks may be in excess of the amounts reflected in the Statement of Assets and Liabilities.
NOTE 2–Advisory Fees and Other Fees Paid to Affiliates
The Trust has entered into a master investment advisory agreement with the Adviser. Under the terms of the investment advisory agreement, the Fund accrues daily and pays monthly an advisory fee to the Adviser based on the annual rate of the Fund’s average daily net assets as follows:
| | | | |
| Average Daily Net Assets | | Rate* | |
|
| |
First $200 million | | | 0.750% | |
|
| |
Next $200 million | | | 0.720% | |
|
| |
Next $200 million | | | 0.690% | |
|
| |
Next $200 million | | | 0.660% | |
|
| |
Next $4.2 billion | | | 0.600% | |
|
| |
Over $5 billion | | | 0.580% | |
|
| |
| * | The advisory fee paid by the Fund shall be reduced by any amounts paid by the Fund under the administrative services agreement with the Adviser. |
For the year ended October 31, 2023, the effective advisory fee rate incurred by the Fund was 0.66%.
Under the terms of a master sub-advisory agreement between the Adviser and each of Invesco Asset Management Deutschland GmbH, Invesco Asset Management Limited, Invesco Asset Management (Japan) Limited, Invesco Hong Kong Limited, Invesco Senior Secured Management, Inc. and Invesco Canada Ltd. and separate sub-advisory agreements with Invesco Capital Management LLC and Invesco Asset Management (India) Private Limited (collectively, the “Affiliated Sub-Advisers”) the Adviser, not the Fund, will pay 40% of the fees paid to the Adviser to any such Affiliated Sub-Adviser(s) that provide(s) discretionary investment management services to the Fund based on the percentage of assets allocated to such Affiliated Sub-Adviser(s). Invesco has also entered into a sub-advisory agreement with OppenheimerFunds, Inc. to provide discretionary management services to the Fund.
Effective July 1, 2023, the Adviser has agreed, for an indefinite period, to waive advisory fees and/or reimburse expenses of all shares to the extent necessary to limit total annual fund operating expenses after fee waiver and/or expense reimbursement (excluding certain items discussed below) of Class A, Class C, Class R, Class Y, Class R5 and Class R6 shares to 2.00%, 2.75%, 2.25%, 1.75%, 1.75% and 1.75%, respectively, of the Fund’s average daily net assets (the “boundary limits”). Prior to July 1, 2023, the same boundary limits were in effect with an expiration date of June 30, 2023. In determining the Adviser’s obligation to waive advisory fees and/or reimburse expenses, the following expenses are not taken into account, and could cause the total annual fund operating expenses after fee waiver and/or expense reimbursement to exceed the numbers reflected above: (1) interest; (2) taxes; (3) dividend expense on short sales; (4) extraordinary or non-routine items, including litigation expenses; and (5) expenses that the Fund has incurred but did not actually pay because of an expense offset arrangement. Invesco may amend and/or terminate these boundary limits at any time in its sole discretion and will inform the Board of Trustees of any such changes. The Adviser did not waive fees and/or reimburse expenses during the period under these boundary limits.
Further, the Adviser has contractually agreed, through at least June 30, 2025, to waive the advisory fee payable by the Fund in an amount equal to 100% of the net advisory fees the Adviser receives from the affiliated money market funds on investments by the Fund of uninvested cash (excluding investments of cash collateral from securities lending) in such affiliated money market funds.
For the year ended October 31, 2023, the Adviser waived advisory fees of $11,362.
The Trust has entered into a master administrative services agreement with Invesco pursuant to which the Fund has agreed to pay Invesco for certain administrative costs incurred in providing accounting services to the Fund. For the year ended October 31, 2023, expenses incurred under the agreement are shown in the Statement of Operations as Administrative services fees. Invesco has entered into a sub-administration agreement whereby State Street Bank and Trust Company (“SSB”) serves as fund accountant and provides certain administrative services to the Fund. Pursuant to a custody agreement with the Trust on behalf of the Fund, SSB also serves as the Fund’s custodian.
The Trust has entered into a transfer agency and service agreement with Invesco Investment Services, Inc. (“IIS”) pursuant to which the Fund has agreed to pay IIS a fee for providing transfer agency and shareholder services to the Fund and reimburse IIS for certain expenses incurred by IIS in the course of providing such services. IIS may make payments to intermediaries that provide omnibus account services, sub-accounting services and/or networking services. All fees payable by IIS to intermediaries that provide omnibus account services or sub-accounting services are charged back to the Fund, subject to certain limitations approved by the Trust’s Board of Trustees. For the year ended October 31, 2023, expenses incurred under the agreement are shown in the Statement of Operations as Transfer agent fees.
| | |
| 16 | | Invesco Main Street All Cap Fund® |
The Trust has entered into master distribution agreements with Invesco Distributors, Inc. (“IDI”) to serve as the distributor for the Class A, Class C, Class R, Class Y, Class R5 and Class R6 shares of the Fund. The Trust has adopted plans pursuant to Rule 12b-1 under the 1940 Act with respect to the Fund’s Class A, Class C and Class R shares (collectively, the “Plans”). The Fund, pursuant to the Class A Plan, reimburses IDI for its allocated share of expenses incurred for the period, up to a maximum annual rate of 0.25% of the average daily net assets of Class A shares. The Fund, pursuant to the Class C and Class R Plans, pays IDI compensation at the annual rate of 1.00% of the average daily net assets of Class C shares and 0.50% of the average daily net assets of Class R shares. The fees are accrued daily and paid monthly. Of the Plans payments, up to 0.25% of the average daily net assets of each class of shares may be paid to furnish continuing personal shareholder services to customers who purchase and own shares of such classes. Any amounts not paid as a service fee under the Plans would constitute an asset-based sales charge. Rules of the Financial Industry Regulatory Authority (“FINRA”) impose a cap on the total sales charges, including asset-based sales charges, that may be paid by any class of shares of the Fund. For the year ended October 31, 2023, expenses incurred under the Plans are shown in the Statement of Operations as Distribution fees.
Front-end sales commissions and CDSC (collectively, the “sales charges”) are not recorded as expenses of the Fund. Front-end sales commissions are deducted from proceeds from the sales of Fund shares prior to investment in Class A shares of the Fund. CDSC are deducted from redemption proceeds prior to remittance to the shareholder. During the year ended October 31, 2023, IDI advised the Fund that IDI retained $70,202 in front-end sales commissions from the sale of Class A shares and $967 and $934 from Class A and Class C shares, respectively, for CDSC imposed upon redemptions by shareholders.
For the year ended October 31, 2023, the Fund incurred $48,172 in brokerage commissions with Invesco Capital Markets, Inc., an affiliate of the Adviser and IDI, for portfolio transactions executed on behalf of the Fund.
Certain officers and trustees of the Trust are officers and directors of the Adviser, IIS and/or IDI.
NOTE 3–Additional Valuation Information
GAAP defines fair value as the price that would be received to sell an asset or paid to transfer a liability in an orderly transaction between market participants at the measurement date, under current market conditions. GAAP establishes a hierarchy that prioritizes the inputs to valuation methods, giving the highest priority to readily available unadjusted quoted prices in an active market for identical assets (Level 1) and the lowest priority to significant unobservable inputs (Level 3), generally when market prices are not readily available. Based on the valuation inputs, the securities or other investments are tiered into one of three levels. Changes in valuation methods may result in transfers in or out of an investment’s assigned level:
| | |
| Level 1 - | | Prices are determined using quoted prices in an active market for identical assets. |
| Level 2 - | | Prices are determined using other significant observable inputs. Observable inputs are inputs that other market participants may use in pricing a security. These may include quoted prices for similar securities, interest rates, prepayment speeds, credit risk, yield curves, loss severities, default rates, discount rates, volatilities and others. |
| Level 3 - | | Prices are determined using significant unobservable inputs. In situations where quoted prices or observable inputs are unavailable (for example, when there is little or no market activity for an investment at the end of the period), unobservable inputs may be used. Unobservable inputs reflect the Adviser’s assumptions about the factors market participants would use in determining fair value of the securities or instruments and would be based on the best available information. |
The following is a summary of the tiered valuation input levels, as of October 31, 2023. The level assigned to the securities valuations may not be an indication of the risk or liquidity associated with investing in those securities. Because of the inherent uncertainties of valuation, the values reflected in the financial statements may materially differ from the value received upon actual sale of those investments.
| | | | | | | | | | | | | | | | |
| | | Level 1 | | | Level 2 | | | Level 3 | | | Total | |
|
| |
Investments in Securities | | | | | | | | | | | | | | | | |
|
| |
Common Stocks & Other Equity Interests | | $ | 1,076,952,052 | | | $ | 11,961,181 | | | | $– | | | $ | 1,088,913,233 | |
|
| |
Money Market Funds | | | 11,938,555 | | | | 25,047,501 | | | | – | | | | 36,986,056 | |
|
| |
Total Investments | | $ | 1,088,890,607 | | | $ | 37,008,682 | | | | $– | | | $ | 1,125,899,289 | |
|
| |
NOTE 4–Expense Offset Arrangement(s)
The expense offset arrangement is comprised of transfer agency credits which result from balances in demand deposit accounts used by the transfer agent for clearing shareholder transactions. For the year ended October 31, 2023, the Fund received credits from this arrangement, which resulted in the reduction of the Fund’s total expenses of $54,645.
NOTE 5–Trustees’ and Officers’ Fees and Benefits
Trustees’ and Officers’ Fees and Benefits include amounts accrued by the Fund to pay remuneration to certain Trustees and Officers of the Fund. Trustees have the option to defer compensation payable by the Fund, and Trustees’ and Officers’ Fees and Benefits also include amounts accrued by the Fund to fund such deferred compensation amounts. Those Trustees who defer compensation have the option to select various Invesco Funds in which their deferral accounts shall be deemed to be invested. Finally, certain current Trustees were eligible to participate in a retirement plan that provided for benefits to be paid upon retirement to Trustees over a period of time based on the number of years of service. The Fund may have certain former Trustees who also participate in a retirement plan and receive benefits under such plan. Trustees’ and Officers’ Fees and Benefits include amounts accrued by the Fund to fund such retirement benefits. Obligations under the deferred compensation and retirement plans represent unsecured claims against the general assets of the Fund.
NOTE 6–Cash Balances
The Fund is permitted to temporarily carry a negative or overdrawn balance in its account with SSB, the custodian bank. Such balances, if any at period-end, are shown in the Statement of Assets and Liabilities under the payable caption Amount due custodian. To compensate the custodian bank for such overdrafts, the overdrawn Fund may either (1) leave funds as a compensating balance in the account so the custodian bank can be compensated by earning the additional interest; or (2) compensate by paying the custodian bank at a rate agreed upon by the custodian bank and Invesco, not to exceed the contractually agreed upon rate.
| | |
| 17 | | Invesco Main Street All Cap Fund® |
NOTE 7–Distributions to Shareholders and Tax Components of Net Assets
Tax Character of Distributions to Shareholders Paid During the Fiscal Years Ended October 31, 2023 and 2022:
| | | | | | | | | | | | |
| | | 2023 | | | | | | 2022 | |
|
| |
Ordinary income* | | $ | 2,182,688 | | | | | | | $ | 34,758,897 | |
|
| |
Long-term capital gain | | | 56,882,841 | | | | | | | | 178,575,661 | |
|
| |
Total distributions | | $ | 59,065,529 | | | | | | | $ | 213,334,558 | |
|
| |
| * | Includes short-term capital gain distributions, if any. |
Tax Components of Net Assets at Period-End:
| | | | |
| | | 2023 | |
|
| |
Undistributed ordinary income | | $ | 7,851,785 | |
|
| |
Undistributed long-term capital gain | | | 39,031,250 | |
|
| |
Net unrealized appreciation – investments | | | 273,933,667 | |
|
| |
Net unrealized appreciation (depreciation) – foreign currencies | | | (12 | ) |
|
| |
Temporary book/tax differences | | | (105,405 | ) |
|
| |
Shares of beneficial interest | | | 786,235,283 | |
|
| |
Total net assets | | $ | 1,106,946,568 | |
|
| |
The difference between book-basis and tax-basis unrealized appreciation (depreciation) is due to differences in the timing of recognition of gains and losses on investments for tax and book purposes. The Fund’s net unrealized appreciation (depreciation) difference is attributable primarily to wash sales.
The temporary book/tax differences are a result of timing differences between book and tax recognition of income and/or expenses. The Fund’s temporary book/tax differences are the result of the trustee deferral of compensation and retirement plan benefits.
Capital loss carryforward is calculated and reported as of a specific date. Results of transactions and other activity after that date may affect the amount of capital loss carryforward actually available for the Fund to utilize. The ability to utilize capital loss carryforward in the future may be limited under the Internal Revenue Code and related regulations based on the results of future transactions.
The Fund does not have a capital loss carryforward as of October 31, 2023.
NOTE 8–Investment Transactions
The aggregate amount of investment securities (other than short-term securities, U.S. Government obligations and money market funds, if any) purchased and sold by the Fund during the year ended October 31, 2023 was $625,070,373 and $697,275,993, respectively. Cost of investments, including any derivatives, on a tax basis includes the adjustments for financial reporting purposes as of the most recently completed federal income tax reporting period-end.
| | | | |
Unrealized Appreciation (Depreciation) of Investments on a Tax Basis | |
Aggregate unrealized appreciation of investments | | | $321,843,419 | |
|
| |
Aggregate unrealized (depreciation) of investments | | | (47,909,752 | ) |
|
| |
Net unrealized appreciation of investments | | | $273,933,667 | |
|
| |
Cost of investments for tax purposes is $851,965,622.
NOTE 9–Reclassification of Permanent Differences
Primarily as a result of differing book/tax treatment of equalization and partnerships, on October 31, 2023, undistributed net investment income was decreased by $2,286,694, undistributed net realized gain was increased by $855,517 and shares of beneficial interest was increased by $1,431,177. This reclassification had no effect on the net assets of the Fund.
NOTE 10–Share Information
| | | | | | | | | | | | | | | | |
| | | Summary of Share Activity | |
|
| |
| | |
| | | Year ended | | | Year ended | |
| | | October 31, 2023(a) | | | October 31, 2022 | |
| | | Shares | | | Amount | | | Shares | | | Amount | |
|
| |
Sold: | | | | | | | | | | | | | | | | |
Class A | | | 1,977,880 | | | $ | 41,388,137 | | | | 1,992,480 | | | $ | 45,372,661 | |
|
| |
Class C | | | 367,018 | | | | 6,632,127 | | | | 384,037 | | | | 7,665,292 | |
|
| |
Class R | | | 364,337 | | | | 7,304,579 | | | | 383,339 | | | | 8,375,556 | |
|
| |
Class Y | | | 404,985 | | | | 8,858,258 | | | | 750,170 | | | | 18,166,185 | |
|
| |
Class R6 | | | 84,117 | | | | 1,760,882 | | | | 48,489 | | | | 1,086,836 | |
|
| |
| | | | |
Issued as reinvestment of dividends: | | | | | | | | | | | | | | | | |
Class A | | | 2,574,836 | | | | 48,715,893 | | | | 7,218,472 | | | | 176,202,873 | |
|
| |
Class C | | | 155,648 | | | | 2,529,277 | | | | 456,878 | | | | 9,717,789 | |
|
| |
Class R | | | 143,592 | | | | 2,594,701 | | | | 383,102 | | | | 8,968,412 | |
|
| |
Class Y | | | 134,714 | | | | 2,639,050 | | | | 357,732 | | | | 9,025,576 | |
|
| |
Class R6 | | | 8,846 | | | | 168,167 | | | | 20,844 | | | | 511,312 | |
|
| |
| | |
| 18 | | Invesco Main Street All Cap Fund® |
| | | | | | | | | | | | | | | | |
| | | Summary of Share Activity | |
|
| |
| | |
| | | Year ended | | | Year ended | |
| | | October 31, 2023(a) | | | October 31, 2022 | |
| | | Shares | | | Amount | | | Shares | | | Amount | |
|
| |
| | | | |
Automatic conversion of Class C shares to Class A shares: | | | | | | | | | | | | | | | | |
Class A | | | 215,950 | | | $ | 4,446,667 | | | | 243,316 | | | $ | 5,409,517 | |
|
| |
Class C | | | (252,011 | ) | | | (4,446,667 | ) | | | (279,667 | ) | | | (5,409,517 | ) |
|
| |
| | | | |
Reacquired: | | | | | | | | | | | | | | | | |
Class A | | | (5,881,703 | ) | | | (122,558,826 | ) | | | (6,015,894 | ) | | | (137,302,313 | ) |
|
| |
Class C | | | (384,102 | ) | | | (6,863,671 | ) | | | (520,590 | ) | | | (10,217,314 | ) |
|
| |
Class R | | | (417,729 | ) | | | (8,277,874 | ) | | | (493,260 | ) | | | (10,879,494 | ) |
|
| |
Class Y | | | (616,487 | ) | | | (13,346,873 | ) | | | (773,350 | ) | | | (18,380,311 | ) |
|
| |
Class R6 | | | (55,058 | ) | | | (1,160,272 | ) | | | (41,727 | ) | | | (901,136 | ) |
|
| |
Net increase (decrease) in share activity | | | (1,175,167 | ) | | $ | (29,616,445 | ) | | | 4,114,371 | | | $ | 107,411,924 | |
|
| |
| (a) | There are entities that are record owners of more than 5% of the outstanding shares of the Fund and in the aggregate own 11% of the outstanding shares of the Fund. IDI has an agreement with these entities to sell Fund shares. The Fund, Invesco and/or Invesco affiliates may make payments to these entities, which are considered to be related to the Fund, for providing services to the Fund, Invesco and/or Invesco affiliates including but not limited to services such as securities brokerage, distribution, third party record keeping and account servicing. The Fund has no knowledge as to whether all or any portion of the shares owned of record by these entities are also owned beneficially. |
| | |
| 19 | | Invesco Main Street All Cap Fund® |
Report of Independent Registered Public Accounting Firm
To the Board of Trustees of AIM Equity Funds (Invesco Equity Funds) and Shareholders of Invesco Main Street All Cap Fund®
Opinion on the Financial Statements
We have audited the accompanying statement of assets and liabilities, including the schedule of investments, of Invesco Main Street All Cap Fund® (one of the funds constituting AIM Equity Funds (Invesco Equity Funds), referred to hereafter as the “Fund”) as of October 31, 2023, the related statement of operations for the year ended October 31, 2023, the statement of changes in net assets for each of the two years in the period ended October 31, 2023, including the related notes, and the financial highlights for each of the periods indicated therein (collectively referred to as the “financial statements”). In our opinion, the financial statements present fairly, in all material respects, the financial position of the Fund as of October 31, 2023, the results of its operations for the year then ended, the changes in its net assets for each of the two years in the period ended October 31, 2023 and the financial highlights for each of the periods indicated therein in conformity with accounting principles generally accepted in the United States of America.
Basis for Opinion
These financial statements are the responsibility of the Fund’s management. Our responsibility is to express an opinion on the Fund’s financial statements based on our audits. We are a public accounting firm registered with the Public Company Accounting Oversight Board (United States) (PCAOB) and are required to be independent with respect to the Fund in accordance with the U.S. federal securities laws and the applicable rules and regulations of the Securities and Exchange Commission and the PCAOB.
We conducted our audits of these financial statements in accordance with the standards of the PCAOB. Those standards require that we plan and perform the audit to obtain reasonable assurance about whether the financial statements are free of material misstatement, whether due to error or fraud.
Our audits included performing procedures to assess the risks of material misstatement of the financial statements, whether due to error or fraud, and performing procedures that respond to those risks. Such procedures included examining, on a test basis, evidence regarding the amounts and disclosures in the financial statements. Our audits also included evaluating the accounting principles used and significant estimates made by management, as well as evaluating the overall presentation of the financial statements. Our procedures included confirmation of securities owned as of October 31, 2023 by correspondence with the custodian, transfer agent and brokers. We believe that our audits provide a reasonable basis for our opinion.
/s/PricewaterhouseCoopers LLP
Houston, Texas
December 21, 2023
We have served as the auditor of one or more of the investment companies in the Invesco group of investment companies since at least 1995. We have not been able to determine the specific year we began serving as auditor.
| | |
| 20 | | Invesco Main Street All Cap Fund® |
Calculating your ongoing Fund expenses
Example
As a shareholder of the Fund, you incur two types of costs: (1) transaction costs, which may include sales charges (loads) on purchase payments or contingent deferred sales charges on redemptions, if any; and (2) ongoing costs, including management fees, distribution and/or service (12b-1) fees, and other Fund expenses. This example is intended to help you understand your ongoing costs (in dollars) of investing in the Fund and to compare these costs with ongoing costs of investing in other mutual funds. The example is based on an investment of $1,000 invested at the beginning of the period and held for the entire period May 1, 2023 through October 31, 2023.
Actual expenses
The table below provides information about actual account values and actual expenses. You may use the information in this table, together with the amount you invested, to estimate the expenses that you paid over the period. Simply divide your account value by $1,000 (for example, an $8,600 account value divided by $1,000 = 8.6), then multiply the result by the number in the table under the heading entitled “Actual Expenses Paid During Period” to estimate the expenses you paid on your account during this period.
Hypothetical example for comparison purposes
The table below also provides information about hypothetical account values and hypothetical expenses based on the Fund’s actual expense ratio and an assumed rate of return of 5% per year before expenses, which is not the Fund’s actual return.
The hypothetical account values and expenses may not be used to estimate the actual ending account balance or expenses you paid for the period. You may use this information to compare the ongoing costs of investing in the Fund and other funds. To do so, compare this 5% hypothetical example with the 5% hypothetical examples that appear in the shareholder reports of the other funds.
Please note that the expenses shown in the table are meant to highlight your ongoing costs only and do not reflect any transaction costs, such as sales charges (loads) on purchase payments or contingent deferred sales charges on redemptions, if any. Therefore, the hypothetical information is useful in comparing ongoing costs only, and will not help you determine the relative total costs of owning different funds. In addition, if these transaction costs were included, your costs would have been higher.
| | | | | | | | | | | | |
| | | | | ACTUAL | | HYPOTHETICAL (5% annual return before expenses) | | |
| | | Beginning Account Value (05/01/23) | | Ending Account Value (10/31/23)1 | | Expenses Paid During Period2 | | Ending Account Value (10/31/23) | | Expenses Paid During Period2 | | Annualized Expense Ratio |
Class A | | $1,000.00 | | $1,012.10 | | $5.27 | | $1,019.96 | | $5.30 | | 1.04% |
Class C | | 1,000.00 | | 1,007.90 | | 9.11 | | 1,016.13 | | 9.15 | | 1.80 |
Class R | | 1,000.00 | | 1,011.10 | | 6.59 | | 1,018.65 | | 6.61 | | 1.30 |
Class Y | | 1,000.00 | | 1,013.50 | | 4.06 | | 1,021.17 | | 4.08 | | 0.80 |
Class R5 | | 1,000.00 | | 1,013.90 | | 3.81 | | 1,021.42 | | 3.82 | | 0.75 |
Class R6 | | 1,000.00 | | 1,013.90 | | 3.71 | | 1,021.53 | | 3.72 | | 0.73 |
| 1 | The actual ending account value is based on the actual total return of the Fund for the period May 1, 2023 through October 31, 2023, after actual expenses and will differ from the hypothetical ending account value which is based on the Fund’s expense ratio and a hypothetical annual return of 5% before expenses. |
| 2 | Expenses are equal to the Fund’s annualized expense ratio as indicated above multiplied by the average account value over the period, multiplied by 184/365 to reflect the most recent fiscal half year. |
| | |
| 21 | | Invesco Main Street All Cap Fund® |
Approval of Investment Advisory and Sub-Advisory Contracts
At meetings held on June 13, 2023, the Board of Trustees (the Board or the Trustees) of AIM Equity Funds (Invesco Equity Funds) as a whole, and the independent Trustees, who comprise over 75% of the Board, voting separately, approved the continuance of the Invesco Main Street All Cap Fund®’s (the Fund) Master Investment Advisory Agreement with Invesco Advisers, Inc. (Invesco Advisers and the investment advisory agreement) and the Master Intergroup Sub-Advisory Contract for Mutual Funds with Invesco Asset Management Deutschland GmbH, Invesco Asset Management Limited, Invesco Asset Management (Japan) Limited, Invesco Hong Kong Limited, Invesco Senior Secured Management, Inc. and Invesco Canada Ltd. and separate sub-advisory contracts with Invesco Capital Management LLC and Invesco Asset Management (India) Private Limited and OppenheimerFunds, Inc. (collectively, the Affiliated Sub-Advisers and the sub-advisory contracts) for another year, effective July 1, 2023. After evaluating the factors discussed below, among others, the Board approved the renewal of the Fund’s investment advisory agreement and the sub-advisory contracts and determined that the compensation payable thereunder by the Fund to Invesco Advisers and by Invesco Advisers to the Affiliated Sub-Advisers is fair and reasonable.
The Board’s Evaluation Process
The Board has established an Investments Committee, which in turn has established Sub-Committees, that meet throughout the year to review the performance of funds advised by Invesco Advisers (the Invesco Funds). The Sub-Committees meet regularly with portfolio managers for their assigned Invesco Funds and other members of management to review information about investment performance and portfolio attributes of these funds. The Board has established additional standing and ad hoc committees that meet regularly throughout the year to review matters within their purview, including a working group focused on opportunities to make ongoing and continuous improvements to the annual review process for the Invesco Funds’ investment advisory and sub-advisory contracts. The Board took into account evaluations and reports that it received from its committees and sub-committees, as well as the information provided to the Board and its committees and sub-committees throughout the year, in considering whether to approve each Invesco Fund’s investment advisory agreement and sub-advisory contracts.
As part of the contract renewal process, the Board reviews and considers information provided in response to requests for information submitted to management by the independent Trustees with assistance from legal counsel to the independent Trustees and the Senior Officer, an officer of the Invesco Funds who reports directly to the independent Trustees. The Board receives comparative investment performance and fee and expense data regarding the Invesco Funds prepared by Broadridge Financial Solutions, Inc. (Broadridge), an independent mutual fund data provider, as well as information on the composition of the peer groups provided by Broadridge and its methodology for determining peer groups. The Board also receives an independent written evaluation from the Senior
Officer. The Senior Officer’s evaluation is prepared as part of his responsibility to manage the process by which the Invesco Funds’ proposed management fees are negotiated during the annual contract renewal process to ensure they are negotiated in a manner that is at arms’ length and reasonable in accordance with certain negotiated regulatory requirements. In addition to meetings with Invesco Advisers and fund counsel throughout the year and as part of meetings convened on May 2, 2023 and June 13, 2023, the independent Trustees also discussed the continuance of the investment advisory agreement and sub-advisory contracts in separate sessions with the Senior Officer and with independent legal counsel. Also, as part of the contract renewal process, the independent Trustees reviewed and considered information provided in response to follow-up requests for information submitted by the independent Trustees to management. The independent Trustees met and discussed those follow-up responses with legal counsel to the independent Trustees and the Senior Officer.
The discussion below is a summary of the Senior Officer’s independent written evaluation with respect to the Fund’s investment advisory agreement and sub-advisory contracts, as well as a discussion of the material factors and related conclusions that formed the basis for the Board’s approval of the Fund’s investment advisory agreement and sub-advisory contracts. The Trustees’ review and conclusions are based on the comprehensive consideration of all information presented to them during the course of the year and in prior years and are not the result of any single determinative factor. Moreover, one Trustee may have weighed a particular piece of information or factor differently than another Trustee. The information received and considered by the Board was current as of various dates prior to the Board’s approval on June 13, 2023.
Factors and Conclusions and Summary of Independent Written Fee Evaluation
| A. | Nature, Extent and Quality of Services Provided by Invesco Advisers and the Affiliated Sub-Advisers |
The Board reviewed the nature, extent and quality of the advisory services provided to the Fund by Invesco Advisers under the Fund’s investment advisory agreement, and the credentials and experience of the officers and employees of Invesco Advisers who provide these services, including the Fund’s portfolio manager(s). The Board considered recent senior management changes at Invesco and Invesco Advisers, including the appointment of new Co-Heads of Investments, that had been presented to and discussed with the Board. The Board’s review included consideration of Invesco Advisers’ investment process and oversight, credit analysis, and research capabilities. The Board considered information regarding Invesco Advisers’ programs for and resources devoted to risk management, including management of investment, enterprise, operational, liquidity, derivatives, valuation and compliance risks, and technology used to manage such risks. The Board received information regarding Invesco’s methodology for compensating its investment professionals and the incentives and accountability it creates, as well as how it impacts Invesco’s ability to attract and retain talent. The Board received a
description of, and reports related to, Invesco Advisers’ global security program and business continuity plans and of its approach to data privacy and cybersecurity, including related testing. The Board also considered non-advisory services that Invesco Advisers and its affiliates provide to the Invesco Funds, such as various middle office and back office support functions, third party oversight, internal audit, valuation, portfolio trading and legal and compliance. The Board observed that Invesco Advisers’ systems preparedness and ongoing investment enabled Invesco Advisers to manage, operate and oversee the Invesco Funds with minimal impact or disruption through challenging environments. The Board reviewed and considered the benefits to shareholders of investing in a Fund that is part of the family of funds under the umbrella of Invesco Ltd., Invesco Advisers’ parent company, and noted Invesco Ltd.’s depth and experience in running an investment management business, as well as its commitment of financial and other resources to such business. The Board concluded that the nature, extent and quality of the services provided to the Fund by Invesco Advisers are appropriate and satisfactory.
The Board reviewed the services that may be provided to the Fund by the Affiliated Sub-Advisers under the sub-advisory contracts and the credentials and experience of the officers and employees of the Affiliated Sub-Advisers who provide these services. The Board noted the Affiliated Sub-Advisers’ expertise with respect to certain asset classes and that the Affiliated Sub-Advisers have offices and personnel that are located in financial centers around the world. As a result, the Board noted that the Affiliated Sub-Advisers can provide research and investment analysis on the markets and economies of various countries and territories in which the Fund may invest, make recommendations regarding securities and assist with portfolio trading. The Board concluded that the sub-advisory contracts may benefit the Fund and its shareholders by permitting Invesco Advisers to use the resources and talents of the Affiliated Sub-Advisers in managing the Fund. The Board concluded that the nature, extent and quality of the services that may be provided to the Fund by the Affiliated Sub-Advisers are appropriate and satisfactory.
| B. | Fund Investment Performance |
The Board considered Fund investment performance as a relevant factor in considering whether to approve the investment advisory agreement. The Board did not view Fund investment performance as a relevant factor in considering whether to approve the sub-advisory contracts for the Fund, as no Affiliated Sub-Adviser currently manages assets of the Fund.
The Board compared the Fund’s investment performance over multiple time periods ending December 31, 2022 to the performance of funds in the Broadridge performance universe and against the Russell 3000® Index (Index). The Board noted that performance of Class A shares of the Fund was in the fourth quintile of its performance universe for the one year period, and the third quintile for the three and five year periods (the first quintile being the best performing funds and the fifth quintile being the worst performing funds). The Board noted that performance of Class A shares of the Fund was
| | |
| 22 | | Invesco Main Street All Cap Fund® |
reasonably comparable to the performance of the Index for the one and three year periods and below the performance of the Index for the five year period. The Board considered that the Fund was created in connection with Invesco Ltd.’s acquisition of OppenheimerFunds, Inc. and its subsidiaries (the “Transaction”) and that the Fund’s performance prior to the closing of the Transaction on May 24, 2019 is that of its predecessor fund. The Board recognized that the performance data reflects a snapshot in time as of a particular date and that selecting a different performance period could produce different results. The Board also reviewed more recent Fund performance as well as other performance metrics, which did not change its conclusions.
| C. | Advisory and Sub-Advisory Fees and Fund Expenses |
The Board compared the Fund’s contractual management fee rate to the contractual management fee rates of funds in the Fund’s Broadridge expense group. The Board noted that the contractual management fee rate for Class A shares of the Fund was reasonably comparable to the median contractual management fee rate of funds in its expense group. The Board noted that the term “contractual management fee” for funds in the expense group may include both advisory and certain non-portfolio management administrative services fees, but that Broadridge is not able to provide information on a fund-by-fund basis as to what is included. The Board also reviewed the methodology used by Broadridge in calculating expense group information, which includes using each fund’s contractual management fee schedule (including any applicable breakpoints) as reported in the most recent prospectus or statement of additional information for each fund in the expense group. The Board also considered comparative information regarding the Fund’s total expense ratio and its various components.
The Board noted that Invesco Advisers has contractually agreed to waive fees and/or limit expenses of the Fund for the term disclosed in the Fund’s registration statement in an amount necessary to limit total annual operating expenses to a specified percentage of average daily net assets for each class of the Fund.
The Board noted that Invesco Advisers and the Affiliated Sub-Advisers do not manage other similarly managed mutual funds or client accounts.
The Board also considered the services that may be provided by the Affiliated Sub-Advisers pursuant to the sub-advisory contracts, as well as the fees payable by Invesco Advisers to the Affiliated Sub-Advisers pursuant to the sub-advisory contracts.
| D. | Economies of Scale and Breakpoints |
The Board considered the extent to which there may be economies of scale in the provision of advisory services to the Fund and the Invesco Funds, and the extent to which such economies of scale are shared with the Fund and the Invesco Funds. The Board acknowledged the difficulty in calculating and measuring economies of scale at the individual fund level; noting that only indicative and estimated measures are available at the individual fund level and that such measures are subject to uncertainty. The Board considered that the Fund benefits from economies of scale through contractual breakpoints in the Fund’s advisory fee schedule, which generally operate to reduce the Fund’s expense ratio as it grows in size. The Board noted that the Fund also shares in economies of scale through Invesco
Advisers’ ability to negotiate lower fee arrangements with third party service providers. The Board noted that the Fund may also benefit from economies of scale through initial fee setting, fee waivers and expense reimbursements, as well as Invesco Advisers’ investment in its business, including investments in business infrastructure, technology and cybersecurity.
| E. | Profitability and Financial Resources |
The Board reviewed information from Invesco Advisers concerning the costs of the advisory and other services that Invesco Advisers and its affiliates provide to the Fund and the Invesco Funds and the profitability of Invesco Advisers and its affiliates in providing these services in the aggregate and on an individual fund-by-fund basis. The Board considered the methodology used for calculating profitability and the periodic review and enhancement of such methodology. The Board noted that Invesco Advisers continues to operate at a net profit from services Invesco Advisers and its affiliates provide to the Invesco Funds in the aggregate and to most Invesco Funds individually. The Board considered that profits to Invesco Advisers can vary significantly depending on the particular Invesco Fund, with some Invesco Funds showing indicative losses to Invesco Advisers and others showing indicative profits at healthy levels, and that Invesco Advisers’ support for and commitment to an Invesco Fund are not, however, solely dependent on the profits realized as to that Fund. The Board did not deem the level of profits realized by Invesco Advisers and its affiliates from providing such services to be excessive, given the nature, extent and quality of the services provided. The Board noted that Invesco Advisers provided information demonstrating that Invesco Advisers is financially sound and has the resources necessary to perform its obligations under the investment advisory agreement, and provided representations indicating that the Affiliated Sub-Advisers are financially sound and have the resources necessary to perform their obligations under the sub-advisory contracts. The Board noted the cyclical and competitive nature of the global asset management industry.
| F. | Collateral Benefits to Invesco Advisers and its Affiliates |
The Board considered various other benefits received by Invesco Advisers and its affiliates from the relationship with the Fund, including the fees received for providing administrative, transfer agency and distribution services to the Fund. The Board received comparative information regarding fees charged for these services, including information provided by Broadridge and other independent sources. The Board reviewed the performance of Invesco Advisers and its affiliates in providing these services and the organizational structure employed to provide these services. The Board noted that these services are provided to the Fund pursuant to written contracts that are reviewed and subject to approval on an annual basis by the Board based on its determination that the services are required for the operation of the Fund.
The Board considered the benefits realized by Invesco Advisers and the Affiliated Sub-Advisers as a result of portfolio brokerage transactions executed through “soft dollar” arrangements. The Board noted that soft dollar arrangements may result in the Fund bearing costs to purchase research that may be used by Invesco Advisers or the Affiliated Sub-Advisers with other clients and may reduce Invesco Advisers’ or the Affiliated Sub-Advisers’ expenses. The Board
also considered that it receives from Invesco Advisers periodic reports that include a representation to the effect that these arrangements are consistent with regulatory requirements. The Board did not deem the soft dollar arrangements to be inappropriate.
The Board considered that the Fund’s uninvested cash and cash collateral from any securities lending arrangements may be invested in registered money market funds or, with regard to securities lending cash collateral, unregistered funds that comply with Rule 2a-7 (collectively referred to as “affiliated money market funds”) advised by Invesco Advisers. The Board considered information regarding the returns of the affiliated money market funds relative to comparable overnight investments, as well as the fees paid by the affiliated money market funds to Invesco Advisers and its affiliates. In this regard, the Board noted that Invesco Advisers receives advisory fees from these affiliated money market funds attributable to the Fund’s investments. The Board also noted that Invesco Advisers has contractually agreed to waive through varying periods an amount equal to 100% of the net advisory fee Invesco Advisers receives from the affiliated money market funds with respect to the Fund’s investment in the affiliated money market funds of uninvested cash, but not cash collateral. The Board concluded that the advisory fees payable to Invesco Advisers from the Fund’s investment of cash collateral from any securities lending arrangements in the affiliated money market funds are for services that are not duplicative of services provided by Invesco Advisers to the Fund.
The Board considered that Invesco Advisers may serve as the Fund’s affiliated securities lending agent and evaluated the benefits realized by Invesco Advisers when serving in such role, including the compensation received. The Board considered Invesco Advisers’ securities lending platform and corporate governance structure for securities lending, including Invesco Advisers’ Securities Lending Governance Committee and its related responsibilities. The Board noted that to the extent the Fund utilizes Invesco Advisers as an affiliated securities lending agent, the Fund conducts its securities lending in accordance with, and in reliance upon, no-action letters issued by the SEC staff that provide guidance on how an affiliate may act as a direct agent lender and receive compensation for those services without obtaining exemptive relief. The Board considered information provided by Invesco Advisers related to the performance of Invesco Advisers as securities lending agent, including a summary of the securities lending services provided to the Fund by Invesco Advisers and the compensation paid to Invesco Advisers for such services, as well as any revenues generated for the Fund in connection with such securities lending activity and the allocation of such revenue between the Fund and Invesco Advisers.
The Board also received information about commissions that an affiliated broker may receive for executing certain trades for the Fund. Invesco Advisers and the Affiliated Sub-Advisers advised the Board of the benefits to the Fund of executing trades through the affiliated broker and that such trades were executed in compliance with rules under the federal securities laws and consistent with best execution obligations.
| | |
| 23 | | Invesco Main Street All Cap Fund® |
Tax Information
Form 1099-DIV, Form 1042-S and other year–end tax information provide shareholders with actual calendar year amounts that should be included in their tax returns. Shareholders should consult their tax advisers.
The following distribution information is being provided as required by the Internal Revenue Code or to meet a specific state’s requirement.
The Fund designates the following amounts or, if subsequently determined to be different, the maximum amount allowable for its fiscal year ended October 31, 2023:
| | | | | | | | |
Federal and State Income Tax | | | | | | |
Long-Term Capital Gain Distributions | | | $58,345,841 | | | | | |
Qualified Dividend Income* | | | 100.00 | % | | | | |
Corporate Dividends Received Deduction* | | | 100.00 | % | | | | |
U.S. Treasury Obligations* | | | 0.00 | % | | | | |
Qualified Business Income* | | | 0.00 | % | | | | |
Business Interest Income* | | | 0.00 | % | | | | |
|
| * The above percentages are based on ordinary income dividends paid to shareholders during the Fund’s fiscal year. | |
| | |
| 24 | | Invesco Main Street All Cap Fund® |
Trustees and Officers
The address of each trustee and officer is AIM Equty Funds (Invesco Equity Funds) (the “Trust”), 11 Greenway Plaza, Houston, Texas 77046-1173. The trustees serve for the life of the Trust, subject to their earlier death, incapacitation, resignation, retirement or removal as more specifically provided in the Trust’s organizational documents. Each officer serves for a one year term or until their successors are elected and qualified. Column two below includes length of time served with predecessor entities, if any.
| | | | | | | | |
Name, Year of Birth and Position(s) Held with the Trust | | Trustee and/or Officer Since | | Principal Occupation(s) During Past 5 Years | | Number of Funds in Fund Complex Overseen by Trustee | | Other Directorship(s) Held by Trustee During Past 5 Years |
| Interested Trustee | | | | | | | | |
| Martin L. Flanagan1 - 1960 Trustee and Vice Chair | | 2007 | | Chairman Emeritus, Invesco Ltd.; Trustee and Vice Chair, The Invesco Funds; and Member of Executive Board, SMU Cox School of Business Formerly: Executive Director, Chief Executive Officer and President, Invesco Ltd. (ultimate parent of Invesco and a global investment management firm); Vice Chair, Investment Company Institute; Advisor to the Board, Invesco Advisers, Inc. (formerly known as Invesco Institutional (N.A.), Inc.); Chairman and Chief Executive Officer, Invesco Advisers, Inc. (registered investment adviser); Director, Chairman, Chief Executive Officer and President, Invesco Holding Company Limited (parent of Invesco and a global investment management firm); Director, Invesco Ltd.; Chairman, Investment Company Institute and President, Co-Chief Executive Officer, Co-President, Chief Operating Officer and Chief Financial Officer, Franklin Resources, Inc. (global investment management organization) | | 169 | | None |
| 1 | Mr. Flanagan is considered an interested person (within the meaning of Section 2(a)(19) of the 1940 Act) of the Trust because he is an officer of the Adviser to the Trust, and an officer and a director of Invesco Ltd., ultimate parent of the Adviser. |
| | |
| T-1 | | Invesco Main Street All Cap Fund® |
Trustees and Officers–(continued)
| | | | | | | | |
Name, Year of Birth and Position(s) Held with the Trust | | Trustee and/or Officer Since | | Principal Occupation(s) During Past 5 Years | | Number of Funds in Fund Complex Overseen by Trustee | | Other Directorship(s) Held by Trustee During Past 5 Years |
| Independent Trustees | | | | | | | | |
Beth Ann Brown - 1968 Trustee (2019) and Chair (August 2022) | | 2019 | | Independent Consultant Formerly: Head of Intermediary Distribution, Managing Director, Strategic Relations, Managing Director, Head of National Accounts, Senior Vice President, National Account Manager and Senior Vice President, Key Account Manager, Columbia Management Investment Advisers LLC; Vice President, Key Account Manager, Liberty Funds Distributor, Inc.; and Trustee of certain Oppenheimer Funds | | 169 | | Director, Board of Directors of Caron Engineering Inc.; Advisor, Board of Advisors of Caron Engineering Inc.; President and Director, Acton Shapleigh Youth Conservation Corps (non-profit) Formerly: President and Director Director of Grahamtastic Connection (non-profit) |
Cynthia Hostetler - 1962 Trustee | | 2017 | | Non-Executive Director and Trustee of a number of public and private business corporations Formerly: Director, Aberdeen Investment Funds (4 portfolios); Director, Artio Global Investment LLC (mutual fund complex); Director, Edgen Group, Inc. (specialized energy and infrastructure products distributor); Director, Genesee & Wyoming, Inc. (railroads); Head of Investment Funds and Private Equity, Overseas Private Investment Corporation; President, First Manhattan Bancorporation, Inc.; and Attorney, Simpson Thacher & Bartlett LLP | | 169 | | Resideo Technologies, Inc. (smart home technology); Vulcan Materials Company (construction materials company); Trilinc Global Impact Fund; Textainer Group Holdings, (shipping container leasing company); Investment Company Institute (professional organization); and Independent Directors Council (professional organization) |
Eli Jones - 1961 Trustee | | 2016 | | Professor and Dean Emeritus, Mays Business School - Texas A&M University Formerly: Dean of Mays Business School-Texas A&M University; Professor and Dean, Walton College of Business, University of Arkansas and E.J. Ourso College of Business, Louisiana State University; and Director, Arvest Bank | | 169 | | Insperity, Inc. (formerly known as Administaff) (human resources provider); Board Member of the regional board, First Financial Bank Texas; and Board Member, First Financial Bankshares, Inc. Texas |
Elizabeth Krentzman - 1959 Trustee | | 2019 | | Formerly: Principal and Chief Regulatory Advisor for Asset Management Services and U.S. Mutual Fund Leader of Deloitte & Touche LLP; General Counsel of the Investment Company Institute (trade association); National Director of the Investment Management Regulatory Consulting Practice, Principal, Director and Senior Manager of Deloitte & Touche LLP; Assistant Director of the Division of Investment Management - Office of Disclosure and Investment Adviser Regulation of the U.S. Securities and Exchange Commission and various positions with the Division of Investment Management - Office of Regulatory Policy of the U.S. Securities and Exchange Commission; Associate at Ropes & Gray LLP; and Trustee of certain Oppenheimer Funds | | 169 | | Formerly: Member of the Cartica Funds Board of Directors (private investment fund); Trustee of the University of Florida National Board Foundation; and Member of the University of Florida Law Center Association, Inc. Board of Trustees, Audit Committee and Membership Committee |
Anthony J. LaCava, Jr. - 1956 Trustee | | 2019 | | Formerly: Director and Member of the Audit Committee, Blue Hills Bank (publicly traded financial institution) and Managing Partner, KPMG LLP | | 169 | | Blue Hills Bank; Member and Chairman, Bentley University, Business School Advisory Council; and Nominating Committee, KPMG LLP |
Prema Mathai-Davis - 1950 Trustee | | 1998 | | Retired Formerly: Co-Founder & Partner of Quantalytics Research, LLC, (a FinTech Investment Research Platform for the Self-Directed Investor); Trustee of YWCA Retirement Fund; CEO of YWCA of the USA; Board member of the NY Metropolitan Transportation Authority; Commissioner of the NYC Department of Aging; and Board member of Johns Hopkins Bioethics Institute | | 169 | | Member of Board of Positive Planet US (non-profit) and HealthCare Chaplaincy Network (non-profit) |
| | |
| T-2 | | Invesco Main Street All Cap Fund® |
Trustees and Officers–(continued)
| | | | | | | | |
Name, Year of Birth and Position(s) Held with the Trust | | Trustee and/or Officer Since | | Principal Occupation(s) During Past 5 Years | | Number of Funds in Fund Complex Overseen by Trustee | | Other Directorship(s) Held by Trustee During Past 5 Years |
| Independent Trustees–(continued) | | | | | | |
Joel W. Motley - 1952 Trustee | | 2019 | | Director of Office of Finance, Federal Home Loan Bank System; Managing Director of Carmona Motley Inc. (privately held financial advisor); Member of the Council on Foreign Relations and its Finance and Budget Committee; Chairman Emeritus of Board of Human Rights Watch and Member of its Investment Committee; and Member of Investment Committee Board of Historic Hudson Valley (non-profit cultural organization); Member of the Board, Blue Ocean Acquisition Corp.; and Member of the Vestry and the Investment Committee of Trinity Church Wall Street. Formerly: Managing Director of Public Capital Advisors, LLC (privately held financial advisor); Managing Director of Carmona Motley Hoffman, Inc. (privately held financial advisor); Trustee of certain Oppenheimer Funds; and Director of Columbia Equity Financial Corp. (privately held financial advisor) | | 169 | | Member of Board of Trust for Mutual Understanding (non-profit promoting the arts and environment); Member of Board of Greenwall Foundation (bioethics research foundation) and its Investment Committee; Member of Board of Friends of the LRC (non-profit legal advocacy); and Board Member and Investment Committee Member of Pulitzer Center for Crisis Reporting (non-profit journalism) |
Teresa M. Ressel - 1962 Trustee | | 2017 | | Non-executive director and trustee of a number of public and private business corporations Formerly: Chief Executive Officer, UBS Securities LLC (investment banking); Chief Operating Officer, UBS AG Americas (investment banking); Sr. Management Team Olayan America, The Olayan Group (international investor/commercial/industrial); and Assistant Secretary for Management & Budget and Designated Chief Financial Officer, U.S. Department of Treasury | | 169 | | None |
Robert C. Troccoli - 1949 Trustee | | 2016 | | Retired Formerly: Adjunct Professor, University of Denver - Daniels College of Business; and Managing Partner, KPMG LLP | | 169 | | None |
Daniel S. Vandivort - 1954 Trustee | | 2019 | | President, Flyway Advisory Services LLC (consulting and property management) Formerly: President and Chief Investment Officer, previously Head of Fixed Income, Weiss Peck and Greer/Robeco Investment Management; Trustee and Chair, Weiss Peck and Greer Funds Board; and various capacities at CS First Boston including Head of Fixed Income at First Boston Asset Management. | | 169 | | Formerly: Trustee and Governance Chair, Oppenheimer Funds; Treasurer, Chairman of the Audit and Finance Committee, Huntington Disease Foundation of America |
| | |
| T-3 | | Invesco Main Street All Cap Fund® |
Trustees and Officers–(continued)
| | | | | | | | |
Name, Year of Birth and Position(s) Held with the Trust | | Trustee and/or Officer Since | | Principal Occupation(s) During Past 5 Years | | Number of Funds in Fund Complex Overseen by Trustee | | Other Directorship(s) Held by Trustee During Past 5 Years |
| Officers | | | | | | | | |
Glenn Brightman - 1972 President and Principal Executive Officer | | 2023 | | Chief Operating Officer, Americas, Invesco Ltd.; President and Principal Executive Officer, The Invesco Funds. Formerly: Global Head of Finance, Invesco Ltd; Executive Vice President and Chief Financial Officer, Nuveen | | N/A | | N/A |
Melanie Ringold - 1975 Senior Vice President, Chief Legal Officer and Secretary | | 2023 | | Head of Legal of the Americas, Invesco Ltd.; Senior Vice President and Secretary, Invesco Advisers, Inc. (formerly known as Invesco Institutional (N.A.), Inc.) (registered investment adviser); Secretary, Invesco Distributors, Inc. (formerly known as Invesco AIM Distributors, Inc.); Secretary, Invesco Investment Services, Inc. (formerly known as Invesco AIM Investment Services, Inc.); Senior Vice President, Chief Legal Officer and Secretary, The Invesco Funds; Secretary, Invesco Investment Advisers LLC, Invesco Capital Markets, Inc.; Chief Legal Officer, Invesco Exchange-Traded Fund Trust, Invesco Exchange-Traded Fund Trust II, Invesco India Exchange-Traded Fund Trust, Invesco Actively Managed Exchange-Traded Fund Trust, Invesco Actively Secretary and Vice President, Harbourview Asset Management Corporation; Secretary and Senior Vice President, OppenheimerFunds, Inc. and Invesco Managed Accounts, LLC; Secretary and Senior Vice President, OFI SteelPath, Inc.; Secretary and Senior Vice President, Oppenheimer Acquisition Corp.; Secretary, SteelPath Funds Remediation LLC; and Secretary and Senior Vice President, Trinity Investment Management Corporation Formerly: Assistant Secretary, Invesco Distributors, Inc., Invesco Advisers, Inc., Invesco Investment Services, Inc., Invesco Capital Markets, Inc., Invesco Capital Management LLC and Invesco Investment Advisers LLC; and Assistant Secretary and Investment Vice President, Invesco Funds | | N/A | | N/A |
Andrew R. Schlossberg - 1974 Senior Vice President | | 2019 | | Chief Executive Officer, President and Executive Director, Invesco Ltd.; Senior Vice President, Invesco Group Services, Inc.; Director and Senior Vice President, Invesco Advisers, Inc. (formerly known as Invesco Institutional (N.A.), Inc.) (registered investment adviser); Director and Chairman, Invesco Investment Services, Inc. (formerly known as Invesco AIM Investment Services, Inc.) (registered transfer agent); Senior Vice President, The Invesco Funds and Trustee, Invesco Foundation, Inc. Formerly: Head of the Americas and Senior Managing Director, Invesco Ltd.; Director, Invesco Investment Advisers LLC (formerly known as Van Kampen Asset Management); Director, President and Chairman, Invesco Insurance Agency, Inc.; Director, Invesco UK Limited; Director and Chief Executive, Invesco Asset Management Limited and Invesco Fund Managers Limited; Assistant Vice President, The Invesco Funds; Senior Vice President, Invesco Advisers, Inc. (formerly known as Invesco Institutional (N.A.), Inc.) (registered investment adviser); Director and Chief Executive, Invesco Administration Services Limited and Invesco Global Investment Funds Limited; Director, Invesco Distributors, Inc.; Head of EMEA, Invesco Ltd.; President, Invesco Actively Managed Exchange-Traded Commodity Fund Trust, Invesco Actively Managed Exchange-Traded Fund Trust, Invesco Exchange-Traded Fund Trust, Invesco Exchange-Traded Fund Trust II and Invesco India Exchange-Traded Fund Trust; and Managing Director and Principal Executive Officer, Invesco Capital Management LLC | | N/A | | N/A |
| | |
| T-4 | | Invesco Main Street All Cap Fund® |
Trustees and Officers–(continued)
| | | | | | | | |
Name, Year of Birth and Position(s) Held with the Trust | | Trustee and/or Officer Since | | Principal Occupation(s) During Past 5 Years | | Number of Funds in Fund Complex Overseen by Trustee | | Other Directorship(s) Held by Trustee During Past 5 Years |
| Officers–(continued) | | | | | | | | |
John M. Zerr - 1962 Senior Vice President | | 2006 | | Chief Operating Officer of the Americas; Senior Vice President, Invesco Advisers, Inc. (formerly known as Invesco Institutional (N.A.), Inc.) (registered investment adviser); Senior Vice President, Invesco Distributors, Inc. (formerly known as Invesco AIM Distributors, Inc.); Director and Vice President, Invesco Investment Services, Inc. (formerly known as Invesco AIM Investment Services, Inc.) Senior Vice President, The Invesco Funds; Managing Director, Invesco Capital Management LLC; Senior Vice President, Invesco Capital Markets, Inc. (formerly known as Van Kampen Funds Inc.); Manager, Invesco Indexing LLC; Manager, Invesco Specialized Products, LLC; Member, Invesco Canada Funds Advisory Board; Director, President and Chief Executive Officer, Invesco Corporate Class Inc. (corporate mutual fund company); Director, Chairman, President and Chief Executive Officer, Invesco Canada Ltd. (formerly known as Invesco Trimark Ltd./Invesco Trimark Ltèe) (registered investment adviser and registered transfer agent); President, Invesco, Inc.; President, Invesco Global Direct Real Estate Feeder GP Ltd.; President, Invesco IP Holdings (Canada) Ltd; President, Invesco Global Direct Real Estate GP Ltd.; President, Invesco Financial Services Ltd. / Services Financiers Invesco Ltée; and Director and Chairman, Invesco Trust Company Formerly: Director, Invesco Investment Advisers LLC (formerly known as Van Kampen Asset Management); President, Trimark Investments Ltd/Services Financiers Invesco Ltee; Director and Senior Vice President, Invesco Insurance Agency, Inc.; Director and Senior Vice President, Invesco Management Group, Inc. (formerly known as Invesco AIM Management Group, Inc.); Secretary and General Counsel, Invesco Management Group, Inc. (formerly known as Invesco AIM Management Group, Inc.); Secretary, Invesco Investment Services, Inc. (formerly known as Invesco AIM Investment Services, Inc.); Chief Legal Officer and Secretary, The Invesco Funds; Secretary and General Counsel, Invesco Investment Advisers LLC (formerly known as Van Kampen Asset Management); Secretary and General Counsel, Invesco Capital Markets, Inc. (formerly known as Van Kampen Funds Inc.); Chief Legal Officer, Invesco Exchange-Traded Fund Trust, Invesco Exchange-Traded Fund Trust II, Invesco India Exchange-Traded Fund Trust, Invesco Actively Managed Exchange-Traded Fund Trust, Invesco Actively Managed Exchange-Traded Commodity Fund Trust and Invesco Exchange-Traded Self-Indexed Fund Trust; Secretary, Invesco Indexing LLC; Director, Secretary, General Counsel and Senior Vice President, Van Kampen Exchange Corp.; Director, Vice President and Secretary, IVZ Distributors, Inc. (formerly known as INVESCO Distributors, Inc.); Director and Vice President, INVESCO Funds Group, Inc.; Director and Vice President, Van Kampen Advisors Inc.; Director, Vice President, Secretary and General Counsel, Van Kampen Investor Services Inc.; Director and Secretary, Invesco Distributors, Inc. (formerly known as Invesco AIM Distributors, Inc.); Director, Senior Vice President, General Counsel and Secretary, Invesco AIM Advisers, Inc. and Van Kampen Investments Inc.; Director, Vice President and Secretary, Fund Management Company; Director, Senior Vice President, Secretary, General Counsel and Vice President, Invesco AIM Capital Management, Inc.; and Chief Operating Officer and General Counsel, Liberty Ridge Capital, Inc. (an investment adviser) | | N/A | | N/A |
Tony Wong - 1973 Senior Vice President | | 2023 | | Senior Managing Director, Invesco Ltd.; Director, Chairman, Chief Executive Officer and President, Invesco Advisers, Inc.; Director and Chairman, Invesco Private Capital, Inc., INVESCO Private Capital Investments, Inc. and INVESCO Realty, Inc.; Director, Invesco Senior Secured Management, Inc.; President, Invesco Managed Accounts, LLC and SNW Asset Management Corporation; and Senior Vice President, The Invesco Funds Formerly: Assistant Vice President, The Invesco Funds; and Vice President, Invesco Advisers, Inc. | | N/A | | N/A |
Stephanie C. Butcher - 1971 Senior Vice President | | 2023 | | Senior Managing Director, Invesco Ltd.; Senior Vice President, The Invesco Funds; Director and Chief Executive Officer, Invesco Asset Management Limited | | N/A | | N/A |
Adrien Deberghes - 1967 Principal Financial Officer, Treasurer and Senior Vice President | | 2020 | | Head of the Fund Office of the CFO and Fund Administration; Vice President, Invesco Advisers, Inc.; Principal Financial Officer, Treasurer and Senior Vice President, The Invesco Funds; Vice President, Invesco Exchange-Traded Fund Trust, Invesco Exchange-Traded Fund Trust II, Invesco India Exchange-Traded Fund Trust, Invesco Actively Managed Exchange-Traded Fund Trust, Invesco Actively Managed Exchange-Traded Commodity Fund Trust and Invesco Exchange-Traded Self-Indexed Fund Trust Formerly: Vice President, The Invesco Funds; Senior Vice President and Treasurer, Fidelity Investments | | N/A | | N/A |
Crissie M. Wisdom - 1969 Anti-Money Laundering Compliance Officer | | 2013 | | Anti-Money Laundering and OFAC Compliance Officer for Invesco U.S. entities including: Invesco Advisers, Inc. and its affiliates, Invesco Capital Markets, Inc., Invesco Distributors, Inc., Invesco Investment Services, Inc., The Invesco Funds, Invesco Capital Management, LLC, Invesco Trust Company; and Fraud Prevention Manager for Invesco Investment Services, Inc. | | N/A | | N/A |
| | |
| T-5 | | Invesco Main Street All Cap Fund® |
Trustees and Officers–(continued)
| | | | | | | | |
Name, Year of Birth and Position(s) Held with the Trust | | Trustee and/or Officer Since | | Principal Occupation(s) During Past 5 Years | | Number of Funds in Fund Complex Overseen by Trustee | | Other Directorship(s) Held by Trustee During Past 5 Years |
| Officers–(continued) | | | | | | | | |
Todd F. Kuehl - 1969 Chief Compliance Officer and Senior Vice President | | 2020 | | Chief Compliance Officer, Invesco Advisers, Inc. (registered investment adviser); and Chief Compliance Officer and Senior Vice President, The Invesco Funds Formerly: Managing Director and Chief Compliance Officer, Legg Mason (Mutual Funds); Chief Compliance Officer, Legg Mason Private Portfolio Group (registered investment adviser) | | N/A | | N/A |
James Bordewick, Jr. - 1959 Senior Vice President and Senior Officer | | 2022 | | Senior Vice President and Senior Officer, The Invesco Funds Formerly: Chief Legal Officer, KingsCrowd, Inc. (research and analytical platform for investment in private capital markets); Chief Operating Officer and Head of Legal and Regulatory, Netcapital (private capital investment platform); Managing Director, General Counsel of asset management and Chief Compliance Officer for asset management and private banking, Bank of America Corporation; Chief Legal Officer, Columbia Funds and BofA Funds; Senior Vice President and Associate General Counsel, MFS Investment Management; Chief Legal Officer, MFS Funds; Associate, Ropes & Gray; and Associate, Gaston Snow & Ely Bartlett | | N/A | | N/A |
The Statement of Additional Information of the Trust includes additional information about the Fund’s Trustees and is available upon request, without charge, by calling 1.800.959.4246. Please refer to the Fund’s Statement of Additional Information for information on the Fund’s sub-advisers.
| | | | | | |
| Office of the Fund | | Investment Adviser | | Distributor | | Auditors |
| 11 Greenway Plaza | | Invesco Advisers, Inc. | | Invesco Distributors, Inc. | | PricewaterhouseCoopers LLP |
| Houston, TX 77046-1173 | | 1331 Spring Street, NW, Suite 2500 | | 11 Greenway Plaza | | 1000 Louisiana Street, Suite 5800 |
| | Atlanta, GA 30309 | | Houston, TX 77046-1173 | | Houston, TX 77002-5021 |
| | | |
| Counsel to the Fund | | Counsel to the Independent Trustees | | Transfer Agent | | Custodian |
| Stradley Ronon Stevens & Young, LLP | | Sidley Austin LLP | | Invesco Investment Services, Inc. | | State Street Bank and Trust Company |
| 2005 Market Street, Suite 2600 | | 787 Seventh Avenue | | 11 Greenway Plaza | | 225 Franklin Street |
| Philadelphia, PA 19103-7018 | | New York, NY 10019 | | Houston, TX 77046-1173 | | Boston, MA 02110-2801 |
| | |
| T-6 | | Invesco Main Street All Cap Fund® |
(This page intentionally left blank)

Go paperless with eDelivery
Visit invesco.com/edelivery to enjoy the convenience and security of anytime electronic access to your investment documents.
With eDelivery, you can elect to have any or all of the following materials delivered straight to your inbox to download, save and print from your own computer:
∎ Fund reports and prospectuses
∎ Quarterly statements
∎ Daily confirmations
∎ Tax forms
Invesco mailing information
Send general correspondence to Invesco Investment Services, Inc., P.O. Box 219078, Kansas City, MO 64121-9078.
Important notice regarding delivery of security holder documents
To reduce Fund expenses, only one copy of most shareholder documents may be mailed to shareholders with multiple accounts at the same address (Householding). Mailing of your shareholder documents may be householded indefinitely unless you instruct us otherwise. If you do not want the mailing of these documents to be combined with those for other members of your household, please contact Invesco Investment Services, Inc. at 800 959 4246 or contact your financial institution. We will begin sending you individual copies for each account within 30 days after receiving your request.
Fund holdings and proxy voting information
The Fund provides a complete list of its portfolio holdings four times each year, at the end of each fiscal quarter. For the second and fourth quarters, the list appears, respectively, in the Fund’s semiannual and annual reports to shareholders. For the first and third quarters, the Fund files the list with the Securities and Exchange Commission (SEC) as an exhibit to its reports on Form N-PORT. The most recent list of portfolio holdings is available at invesco.com/completeqtrholdings. Shareholders can also look up the Fund’s Form N-PORT filings on the SEC website, sec.gov. The SEC file numbers for the Fund are shown below.
A description of the policies and procedures that the Fund uses to determine how to vote proxies relating to portfolio securities is available without charge, upon request, from our Client Services department at 800 959 4246, or at invesco.com/corporate/about-us/esg. The information is also available on the SEC website, sec.gov.
Information regarding how the Fund voted proxies related to its portfolio securities during the most recent 12-month period ended June 30 is available at invesco.com/proxysearch. This information is also available on the SEC website, sec.gov.
Invesco Advisers, Inc. is an investment adviser; it provides investment advisory services to individual and institutional clients and does not sell securities. Invesco Distributors, Inc. is the US distributor for Invesco Ltd.’s retail mutual funds, exchange-traded funds and institutional money market funds. Both are wholly owned, indirect subsidiaries of Invesco Ltd.

| | | | |
| SEC file number(s): 811-01424 and 002-25469 | | Invesco Distributors, Inc. | | O-MSA-AR-1 |

| | |
| | |
| Annual Report to Shareholders | | October 31, 2023 |
Invesco Rising Dividends Fund
Nasdaq:
A: OARDX ∎ C: OCRDX ∎ R: ONRDX ∎ Y: OYRDX ∎ R5: RSDQX ∎ R6: OIRDX
Management’s Discussion of Fund Performance
| | | | |
| |
Performance summary | |
For the fiscal year ended October 31, 2023, Class A shares of Invesco Rising Dividends Fund (the Fund), at net asset value (NAV), underperformed the Russell 1000 Index. | |
Your Fund’s long-term performance appears later in this report. | |
| |
Fund vs. Indexes | |
Total returns, 10/31/22 to 10/31/23, at net asset value (NAV). Performance shown does not include applicable contingent deferred sales charges (CDSC) or front-end sales charges, which would have reduced performance. | |
Class A Shares | | | 7.74 | % |
Class C Shares | | | 6.90 | |
Class R Shares | | | 7.48 | |
Class Y Shares | | | 7.98 | |
Class R5 Shares | | | 8.11 | |
Class R6 Shares | | | 8.09 | |
S&P 500 Index▼ | | | 10.14 | |
Russell 1000 Index▼ | | | 9.48 | |
| |
Source(s): ▼RIMES Technologies Corp. | | | | |
Market conditions and your Fund
At the start of the fiscal year, US equity markets rebounded, despite mixed data on the economy and corporate earnings. However, the US Federal Reserve’s (the Fed’s) message that rate hikes would continue until data showed inflation meaningfully declining, sent markets lower in December 2022. As energy prices declined, the rate of inflation slowed modestly in the fourth quarter of 2022. Corporate earnings generally met expectations, though companies provided cautious future guidance. With inflation still at multi-decade highs and little evidence of a slowing economy, the Fed raised its target rate by 0.75% in November and by 0.50% in December.1
US equities managed to deliver gains in the first quarter of 2023 despite significant volatility and a banking crisis. A January rally gave way to a February selloff as higher-than-expected inflation, a tight labor market and solid economic growth indicated that the Fed’s monetary policy would remain tight for the foreseeable future, raising the risk of a deeper than expected recession. In March, the failure of two US regional banks, Silicon Valley Bank and Signature Bank, prompted steep losses in the banking sector. The subsequent takeover of Credit Suisse and ongoing fear that bank troubles would spread sent investors to safe-haven assets, sparking a bond rally, particularly among securities at the short end of the yield curve. With instability in the banking sector, the Fed raised the federal funds rate by only 0.25% in February 2023 and again in March.1 The Fed’s actions to stabilize the banking system in March sent markets higher, so equities were surprisingly resilient despite the turmoil.
The US economy and equity markets remained resilient in the second quarter of 2023, as milder inflation data and better-than-expected corporate earnings supported
equities, with most major indexes posting gains for the quarter and with some big tech names providing optimistic future guidance. Following the March banking crisis, markets stabilized in April, as corporate earnings season got underway, with many companies surprising consensus earnings and revenue estimates. Facing persistently strong employment data, the Fed raised the federal funds rate by 0.25% at its May meeting,1 but left rates unchanged at its June meeting, giving investors the long-awaited “pause” in rate hikes, which sent equities broadly higher.
Equity markets declined in the third quarter and into October 2023 as a resilient US economy complicated the Fed’s efforts to tame inflation. While inflation has slowed from its peak, the Consumer Price Index (CPI) rose by 0.2% in July, and the 12-month headline inflation rate rose to 3.2% from 3% in June.2 Due to the persistence of inflation, the Fed raised the federal funds rate again in July by 0.25%. The CPI data released in September was higher-than-expected and the overall US labor market remained tight with unemployment near historic lows. At the same time, wages rose and consumers continued to spend, pushing the third quarter year-over-year Gross Domestic Product (GDP) to 4.9%, far above expectations.2 Despite the higher-than-expected GDP for the third quarter of 2023, the Fed held interest rates steady at its September and October meetings, but left open the possibility of another rate hike before the end of the calendar year.1
Despite higher rates and increased market volatility, US stocks for the fiscal year had positive returns of 10.69%, as measured by the S&P 500 Index.3
The Fund underperformed the Russell 1000 Index during the fiscal year. Within the Fund’s style-specific benchmark, information technology (IT) and communication services were the best-performing sectors, while
utilities and real estate were the worst-performing sectors during the fiscal year. Our focus on high-quality, attractively valued dividend paying companies was a headwind during the fiscal year, as the market was led by more growth-oriented, non-dividend paying stocks that don’t fit our disciplined approach. Stock selection and an underweight in communication services for the fiscal year detracted the most from relative return, as the sector posted strong gains. We didn’t own several of the fiscal year’s best performers in this sector, including Meta Platforms and Alphabet, because they don’t pay a dividend, which was a meaningful detractor from relative return. Stock selection in the industrials sector also hurt performance versus the Russell 1000 Index. Alternatively, strong stock selection in the IT sector was the largest positive contributor to relative Fund performance. Strong stock selection in financials also helped performance versus the index.
Holdings within the IT sector were among the largest contributors to absolute Fund performance during the fiscal year. Software company Microsoft was the largest individual contributor to overall Fund performance for the fiscal year. Shares of the company benefited from continued strength in their Azure cloud computing business and investor excitement around how artificial intelligence could supplement Microsoft’s already robust technology platform. Semiconductor company NVIDIA was also a top contributor to overall Fund performance for the fiscal year. The launch of Open AI’s ChatGPT service in the fourth quarter of 2022 has continued to catalyze the AI market and companies are rushing in. NVIDIA is the only vendor currently capable of supplying the GPU computing infrastructure necessary to develop and run enormous AI models.
Holdings within the financials and consumer discretionary sectors were among the largest detractors from absolute Fund performance. Financial services company Charles Schwab was the largest individual detractor from Fund performance during the fiscal year. Shares of the company underperformed following the banking crisis that began with the failure of Silicon Valley Bank in the first quarter of 2023. Like many leveraged financial institutions, Schwab was heavily scrutinized for unrealized losses in their securities portfolio following the Fed’s tightening campaign. Unlike Silicon Valley Bank, Schwab has a highly diversified deposit base across 34 million accounts and approximately 80% of deposits are insured. Discount store Dollar General was also among the largest detractors from overall performance for the fiscal year. Dollar General reported weak first quarter same store sales growth and margins while noting they needed to get more aggressive on price. These factors culminated in the company cutting full-year guidance and indicated that management had been downplaying internal and competitive issues the past
| | |
| 2 | | Invesco Rising Dividends Fund |
��
few quarters. While we believe Dollar General is not a broken business, it will likely take some time and a significant margin reset from here to get the business back on track. Consequently, we decided to exit our position.
We continue to maintain our discipline around valuation and focus on companies which we believe have competitive advantages and skilled management teams that are out-executing peers. We believe this disciplined approach is essential to generating attractive long-term performance.
We thank you for your continued investment in the Invesco Rising Dividends Fund.
| 1 | Source: US Federal Reserve |
| 2 | Source: US Bureau of Labor Statistics |
Portfolio manager(s):
Belinda Cavazos
Peter Santoro - Lead
Raman Vardharaj
The views and opinions expressed in management’s discussion of Fund performance are those of Invesco Advisers, Inc. and its affiliates. These views and opinions are subject to change at any time based on factors such as market and economic conditions. These views and opinions may not be relied upon as investment advice or recommendations, or as an offer for a particular security. The information is not a complete analysis of every aspect of any market, country, industry, security or the Fund. Statements of fact are from sources considered reliable, but Invesco Advisers, Inc. makes no representation or warranty as to their completeness or accuracy. Although historical performance is no guarantee of future results, these insights may help you understand our investment management philosophy.
See important Fund and, if applicable, index disclosures later in this report.
| | |
| 3 | | Invesco Rising Dividends Fund |
Your Fund’s Long-Term Performance
Results of a $10,000 Investment – Oldest Share Class(es)
Fund and index data from 10/31/13
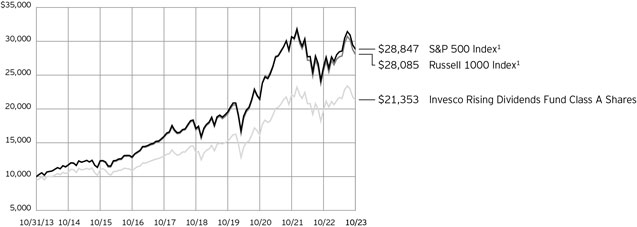
1 Source: RIMES Technologies Corp.
Past performance cannot guarantee future results.
The data shown in the chart include reinvested distributions, applicable sales charges and Fund expenses including management
fees. Index results include reinvested dividends, but they do not reflect sales charges. Performance of the peer group, if applicable, reflects fund expenses and management fees;
performance of a market index does not. Performance shown in the chart does not reflect deduction of taxes a shareholder would pay on Fund distributions or sale of Fund shares.
| | |
| 4 | | Invesco Rising Dividends Fund |
| | | | |
| |
Average Annual Total Returns | |
As of 10/31/23, including maximum applicable sales charges | |
| |
Class A Shares | | | | |
Inception (4/30/80) | | | 11.58 | % |
10 Years | | | 7.88 | |
5 Years | | | 8.27 | |
1 Year | | | 1.80 | |
| |
Class C Shares | | | | |
Inception (9/1/93) | | | 8.30 | % |
10 Years | | | 7.85 | |
5 Years | | | 8.67 | |
1 Year | | | 5.90 | |
| |
Class R Shares | | | | |
Inception (3/1/01) | | | 6.52 | % |
10 Years | | | 8.22 | |
5 Years | | | 9.22 | |
1 Year | | | 7.48 | |
| |
Class Y Shares | | | | |
Inception (12/16/96) | | | 7.73 | % |
10 Years | | | 8.75 | |
5 Years | | | 9.75 | |
1 Year | | | 7.98 | |
| |
Class R5 Shares | | | | |
10 Years | | | 8.66 | % |
5 Years | | | 9.84 | |
1 Year | | | 8.11 | |
| |
Class R6 Shares | | | | |
Inception (2/28/12) | | | 9.71 | % |
10 Years | | | 8.92 | |
5 Years | | | 9.89 | |
1 Year | | | 8.09 | |
Effective May 24, 2019, Class A, Class C, Class R, Class Y and Class I shares of the Oppenheimer Rising Dividend Fund, (the predecessor fund), were reorganized into Class A, Class C, Class R, Class Y and Class R6 shares, respectively, of the Invesco Oppenheimer Rising Dividend Fund. Note: The Fund was subsequently renamed the Invesco Rising Dividends Fund (the Fund). Returns shown above, for periods ending on or prior to May 24, 2019, for Class A, Class C, Class R, Class Y and Class R6 shares are those for Class A, Class C, Class R, Class Y and Class I shares of the predecessor fund. Share class returns will differ from the predecessor fund because of different expenses.
Class R5 shares incepted on May 24, 2019. Performance shown on and prior to that date is that of the predecessor fund’s Class A shares and includes the 12b-1 fees applicable to Class A shares.
The performance data quoted represent past performance and cannot guarantee future results; current performance may be lower or higher. Please visit invesco.com/ performance for the most recent month-end performance. Performance figures reflect reinvested distributions, changes in net asset value and the effect of the maximum sales charge unless otherwise stated. Performance figures do not reflect
deduction of taxes a shareholder would pay on Fund distributions or sale of Fund shares. Investment return and principal value will fluctuate so that you may have a gain or loss when you sell shares.
Class A share performance reflects the maximum 5.50% sales charge, and Class C share performance reflects the applicable contingent deferred sales charge (CDSC) for the period involved. The CDSC on Class C shares is 1% for the first year after purchase. Class R, Class Y, Class R5 and Class R6 shares do not have a front-end sales charge or a CDSC; therefore, performance is at net asset value.
The performance of the Fund’s share classes will differ primarily due to different sales charge structures and class expenses.
Fund performance reflects any applicable fee waivers and/or expense reimbursements. Had the adviser not waived fees and/or reimbursed expenses currently or in the past, returns would have been lower. See current prospectus for more information.
| | |
| 5 | | Invesco Rising Dividends Fund |
Supplemental Information
Invesco Rising Dividends Fund’s investment objective is to seek total return.
| ∎ | Unless otherwise stated, information presented in this report is as of October 31, 2023, and is based on total net assets. |
| ∎ | Unless otherwise noted, all data is provided by Invesco. |
| ∎ | To access your Fund’s reports/prospectus, visit invesco.com/fundreports. |
About indexes used in this report
| ∎ | The S&P 500® Index is an unmanaged index considered representative of the US stock market. |
| ∎ | The Russell 1000® Index is an unmanaged index considered representative of large-cap stocks. The Russell 1000 Index is a trademark/service mark of the Frank Russell Co. Russell® is a trademark of the Frank Russell Co. |
| ∎ | The Fund is not managed to track the performance of any particular index, including the index(es) described here, and consequently, the performance of the Fund may deviate significantly from the performance of the index(es). |
| ∎ | A direct investment cannot be made in an index. Unless otherwise indicated, index results include reinvested dividends, and they do not reflect sales charges. Performance of the peer group, if applicable, reflects fund expenses; performance of a market index does not. |
|
|
This report must be accompanied or preceded by a currently effective Fund prospectus, which contains more complete information, including sales charges and expenses. Investors should read it carefully before investing. |
|
| NOT FDIC INSURED | MAY LOSE VALUE | NO BANK GUARANTEE |
| | |
| 6 | | Invesco Rising Dividends Fund |
Fund Information
Portfolio Composition
| | | | | |
| By sector | | % of total net assets |
| |
Information Technology | | | | 24.78 | % |
| |
Health Care | | | | 14.88 | |
| |
Financials | | | | 12.98 | |
| |
Industrials | | | | 10.83 | |
| |
Consumer Staples | | | | 9.92 | |
| |
Energy | | | | 5.73 | |
| |
Consumer Discretionary | | | | 4.98 | |
| |
Communication Services | | | | 3.39 | |
| |
Materials | | | | 3.25 | |
| |
Utilities | | | | 3.07 | |
| |
Real Estate | | | | 2.68 | |
| |
Money Market Funds Plus Other Assets Less Liabilities | | | | 3.51 | |
Top 10 Equity Holdings*
| | | | | | | |
| | | | | % of total net assets |
| | |
| 1. | | Microsoft Corp. | | | | 8.37 | % |
| | |
| 2. | | Apple, Inc. | | | | 4.12 | |
| | |
| 3. | | NVIDIA Corp. | | | | 2.89 | |
| | |
| 4. | | UnitedHealth Group, Inc. | | | | 2.52 | |
| | |
| 5. | | Walmart, Inc. | | | | 2.24 | |
| | |
| 6. | | Visa, Inc., Class A | | | | 2.21 | |
| | |
| 7. | | JPMorgan Chase & Co. | | | | 2.20 | |
| | |
| 8. | | Procter & Gamble Co. (The) | | | | 2.19 | |
| | |
| 9. | | Broadcom, Inc. | | | | 1.97 | |
| | |
| 10. | | Johnson & Johnson | | | | 1.97 | |
The Fund’s holdings are subject to change, and there is no assurance that the Fund will continue to hold any particular security.
| * | Excluding money market fund holdings, if any. |
Data presented here are as of October 31, 2023.
| | |
| 7 | | Invesco Rising Dividends Fund |
Schedule of Investments(a)
October 31, 2023
| | | | | | | | |
| | | Shares | | | Value | |
|
| |
Common Stocks & Other Equity Interests–96.49% | |
Aerospace & Defense–2.02% | |
Howmet Aerospace, Inc. | | | 613,989 | | | $ | 27,076,915 | |
|
| |
Northrop Grumman Corp. | | | 55,781 | | | | 26,296,837 | |
|
| |
| | | | | | | 53,373,752 | |
|
| |
|
Agricultural & Farm Machinery–0.95% | |
Deere & Co. | | | 68,637 | | | | 25,077,214 | |
|
| |
|
Air Freight & Logistics–1.14% | |
United Parcel Service, Inc., Class B | | | 213,963 | | | | 30,222,274 | |
|
| |
|
Application Software–0.99% | |
Intuit, Inc. | | | 52,925 | | | | 26,195,229 | |
|
| |
|
Asset Management & Custody Banks–1.35% | |
BlackRock, Inc. | | | 58,186 | | | | 35,626,124 | |
|
| |
|
Cable & Satellite–1.62% | |
Comcast Corp., Class A | | | 1,036,177 | | | | 42,783,748 | |
|
| |
|
Communications Equipment–1.17% | |
Motorola Solutions, Inc. | | | 111,083 | | | | 30,932,172 | |
|
| |
|
Construction Materials–0.98% | |
Vulcan Materials Co. | | | 131,517 | | | | 25,841,775 | |
|
| |
|
Consumer Finance–0.94% | |
American Express Co. | | | 170,465 | | | | 24,893,004 | |
|
| |
|
Consumer Staples Merchandise Retail–2.24% | |
Walmart, Inc. | | | 362,029 | | | | 59,159,159 | |
|
| |
|
Distillers & Vintners–1.28% | |
Constellation Brands, Inc., Class A | | | 144,221 | | | | 33,769,347 | |
|
| |
|
Distributors–0.59% | |
LKQ Corp. | | | 355,437 | | | | 15,610,793 | |
|
| |
|
Diversified Banks–2.20% | |
JPMorgan Chase & Co. | | | 418,429 | | | | 58,186,737 | |
|
| |
|
Electric Utilities–1.16% | |
American Electric Power Co., Inc. | | | 405,796 | | | | 30,653,830 | |
|
| |
|
Electrical Components & Equipment–0.83% | |
Hubbell, Inc. | | | 80,994 | | | | 21,876,479 | |
|
| |
|
Electronic Manufacturing Services–1.28% | |
TE Connectivity Ltd. | | | 287,974 | | | | 33,937,736 | |
|
| |
|
Environmental & Facilities Services–1.31% | |
Republic Services, Inc. | | | 233,953 | | | | 34,739,681 | |
|
| |
|
Fertilizers & Agricultural Chemicals–0.51% | |
Mosaic Co. (The) | | | 413,027 | | | | 13,415,117 | |
|
| |
|
Financial Exchanges & Data–2.62% | |
CME Group, Inc., Class A | | | 150,628 | | | | 32,153,053 | |
|
| |
S&P Global, Inc. | | | 106,249 | | | | 37,113,838 | |
|
| |
| | | | | | | 69,266,891 | |
|
| |
| | | | | | | | |
| | | Shares | | | Value | |
|
| |
Food Distributors–0.85% | | | | | | | | |
Sysco Corp. | | | 336,671 | | | $ | 22,385,255 | |
|
| |
|
Health Care Equipment–3.98% | |
Becton, Dickinson and Co. | | | 161,156 | | | | 40,737,014 | |
|
| |
Stryker Corp. | | | 128,605 | | | | 34,751,643 | |
|
| |
Zimmer Biomet Holdings, Inc. | | | 283,750 | | | | 29,626,337 | |
|
| |
| | | | | | | 105,114,994 | |
|
| |
|
Home Improvement Retail–1.71% | |
Lowe’s Cos., Inc. | | | 237,920 | | | | 45,340,414 | |
|
| |
|
Household Products–2.19% | |
Procter & Gamble Co. (The) | | | 386,219 | | | | 57,944,437 | |
|
| |
|
Industrial Conglomerates–1.29% | |
Honeywell International, Inc. | | | 185,611 | | | | 34,015,072 | |
|
| |
|
Industrial Machinery & Supplies & Components–1.65% | |
Otis Worldwide Corp. | | | 212,046 | | | | 16,372,072 | |
|
| |
Parker-Hannifin Corp. | | | 74,013 | | | | 27,304,136 | |
|
| |
| | | | | | | 43,676,208 | |
|
| |
|
Industrial REITs–1.53% | |
Prologis, Inc. | | | 401,500 | | | | 40,451,125 | |
|
| |
|
Insurance Brokers–1.35% | |
Marsh & McLennan Cos., Inc. | | | 188,768 | | | | 35,799,851 | |
|
| |
|
Integrated Oil & Gas–1.83% | |
Chevron Corp.(b) | | | 332,588 | | | | 48,468,049 | |
|
| |
|
Integrated Telecommunication Services–0.81% | |
Deutsche Telekom AG (Germany) | | | 989,673 | | | | 21,445,653 | |
|
| |
|
Interactive Home Entertainment–0.96% | |
Electronic Arts, Inc. | | | 205,229 | | | | 25,405,298 | |
|
| |
|
Investment Banking & Brokerage–0.48% | |
Charles Schwab Corp. (The) | | | 246,367 | | | | 12,820,939 | |
|
| |
|
IT Consulting & Other Services–1.74% | |
Accenture PLC, Class A | | | 154,905 | | | | 46,020,727 | |
|
| |
|
Life Sciences Tools & Services–1.19% | |
Danaher Corp. | | | 163,952 | | | | 31,482,063 | |
|
| |
|
Managed Health Care–2.52% | |
UnitedHealth Group, Inc. | | | 124,370 | | | | 66,607,597 | |
|
| |
|
Multi-Utilities–1.91% | |
Ameren Corp. | | | 251,641 | | | | 19,051,740 | |
|
| |
WEC Energy Group, Inc. | | | 386,710 | | | | 31,474,327 | |
|
| |
| | | | | | | 50,526,067 | |
|
| |
|
Oil & Gas Exploration & Production–2.83% | |
APA Corp. | | | 454,753 | | | | 18,062,789 | |
|
| |
ConocoPhillips | | | 352,175 | | | | 41,838,390 | |
|
| |
Marathon Oil Corp. | | | 551,310 | | | | 15,056,276 | |
|
| |
| | | | | | | 74,957,455 | |
|
| |
|
Oil & Gas Storage & Transportation–1.07% | |
Cheniere Energy, Inc. | | | 169,655 | | | | 28,233,985 | |
|
| |
See accompanying Notes to Financial Statements which are an integral part of the financial statements.
| | |
| 8 | | Invesco Rising Dividends Fund |
| | | | | | | | |
| | | Shares | | | Value | |
|
| |
Pharmaceuticals–7.19% | |
AstraZeneca PLC, ADR (United Kingdom)(b) | | | 465,413 | | | $ | 29,428,064 | |
|
| |
Eli Lilly and Co. | | | 90,529 | | | | 50,146,729 | |
|
| |
Johnson & Johnson | | | 350,009 | | | | 51,920,335 | |
|
| |
Merck & Co., Inc. | | | 369,037 | | | | 37,900,100 | |
|
| |
Zoetis, Inc. | | | 132,413 | | | | 20,788,841 | |
|
| |
| | | | | | | 190,184,069 | |
|
| |
|
Property & Casualty Insurance–1.05% | |
Hartford Financial Services Group, Inc. (The) | | | 379,138 | | | | 27,847,686 | |
|
| |
|
Rail Transportation–1.64% | |
Union Pacific Corp. | | | 208,817 | | | | 43,352,497 | |
|
| |
|
Regional Banks–0.78% | |
M&T Bank Corp. | | | 181,888 | | | | 20,507,872 | |
|
| |
|
Restaurants–2.68% | |
McDonald’s Corp. | | | 146,718 | | | | 38,465,058 | |
|
| |
Starbucks Corp. | | | 350,416 | | | | 32,322,372 | |
|
| |
| | | | | | | 70,787,430 | |
|
| |
|
Semiconductor Materials & Equipment–2.25% | |
Applied Materials, Inc. | | | 275,049 | | | | 36,402,735 | |
|
| |
ASML Holding N.V., New York Shares (Netherlands) | | | 38,497 | | | | 23,052,389 | |
|
| |
| | | | | | | 59,455,124 | |
|
| |
|
Semiconductors–4.87% | |
Broadcom, Inc. | | | 62,000 | | | | 52,164,940 | |
|
| |
NVIDIA Corp. | | | 187,584 | | | | 76,496,755 | |
|
| |
| | | | | | | 128,661,695 | |
|
| |
|
Soft Drinks & Non-alcoholic Beverages–1.71% | |
PepsiCo, Inc. | | | 276,443 | | | | 45,137,613 | |
|
| |
|
Specialty Chemicals–1.76% | |
DuPont de Nemours, Inc.(b) | | | 394,195 | | | | 28,728,932 | |
|
| |
PPG Industries, Inc. | | | 145,307 | | | | 17,839,340 | |
|
| |
| | | | | | | 46,568,272 | |
|
| |
|
Systems Software–8.36% | |
Microsoft Corp. | | | 654,064 | | | | 221,145,579 | |
|
| |
Investment Abbreviations:
ADR – American Depositary Receipt
REIT – Real Estate Investment Trust
| | | | | | | | |
| | | Shares | | | Value | |
|
| |
Technology Hardware, Storage & Peripherals–4.12% | |
Apple, Inc. | | | 637,656 | | | $ | 108,892,515 | |
|
| |
|
Telecom Tower REITs–1.15% | |
American Tower Corp. | | | 170,292 | | | | 30,344,332 | |
|
| |
|
Tobacco–1.65% | |
Philip Morris International, Inc.(b) | | | 489,010 | | | | 43,600,132 | |
|
| |
|
Transaction & Payment Processing Services–2.21% | |
Visa, Inc., Class A(b) | | | 248,390 | | | | 58,396,489 | |
|
| |
Total Common Stocks & Other Equity Interests (Cost $1,743,344,330) | | | | | | | 2,551,137,556 | |
|
| |
|
Money Market Funds–3.41% | |
Invesco Government & Agency Portfolio, Institutional Class, 5.27%(c)(d) | | | 31,552,739 | | | | 31,552,739 | |
|
| |
Invesco Liquid Assets Portfolio, Institutional Class, 5.40%(c)(d) | | | 22,658,974 | | | | 22,665,771 | |
|
| |
Invesco Treasury Portfolio, Institutional Class, 5.27%(c)(d) | | | 36,060,273 | | | | 36,060,273 | |
|
| |
Total Money Market Funds (Cost $90,276,206) | | | | | | | 90,278,783 | |
|
| |
TOTAL INVESTMENTS IN SECURITIES
(excluding investments purchased with cash collateral from securities on loan)-99.90%
(Cost $1,833,620,536) | | | | | | | 2,641,416,339 | |
|
| |
|
Investments Purchased with Cash Collateral from Securities on Loan | |
Money Market Funds–3.08% | |
Invesco Private Government Fund, 5.32%(c)(d)(e) | | | 22,763,350 | | | | 22,763,350 | |
|
| |
Invesco Private Prime Fund, 5.53%(c)(d)(e) | | | 58,544,415 | | | | 58,550,269 | |
|
| |
Total Investments Purchased with Cash Collateral from Securities on Loan (Cost $81,311,957) | | | | 81,313,619 | |
|
| |
TOTAL INVESTMENTS IN SECURITIES–102.98%
(Cost $1,914,932,493) | | | | 2,722,729,958 | |
|
| |
OTHER ASSETS LESS LIABILITIES–(2.98)% | | | | (78,720,184 | ) |
|
| |
NET ASSETS–100.00% | | | $ | 2,644,009,774 | |
|
| |
See accompanying Notes to Financial Statements which are an integral part of the financial statements.
| | |
| 9 | | Invesco Rising Dividends Fund |
Notes to Schedule of Investments:
| (a) | Industry and/or sector classifications used in this report are generally according to the Global Industry Classification Standard, which was developed by and is the exclusive property and a service mark of MSCI Inc. and Standard & Poor’s. |
| (b) | All or a portion of this security was out on loan at October 31, 2023. |
| (c) | Affiliated holding. Affiliated holdings are investments in entities which are under common ownership or control of Invesco Ltd. or are investments in entities in which the Fund owns 5% or more of the outstanding voting securities. The table below shows the Fund’s transactions in, and earnings from, its investments in affiliates for the fiscal year ended October 31, 2023. |
| | | | | | | | | | | | | | | | | | | | | | | | | | | | |
| | | Value
October 31, 2022 | | | Purchases
at Cost | | | Proceeds
from Sales | | | Change in
Unrealized
Appreciation | | | Realized
Gain | | | Value
October 31, 2023 | | | Dividend Income | |
| Investments in Affiliated Money Market Funds: | | | | | | | | | | | | | | | | | | | | | | | | | | | | |
Invesco Government & Agency Portfolio, Institutional Class | | $ | 10,129,054 | | | $ | 134,422,447 | | | $ | (112,998,762 | ) | | $ | - | | | $ | - | | | $ | 31,552,739 | | | $ | 648,641 | |
Invesco Liquid Assets Portfolio, Institutional Class | | | 7,529,405 | | | | 96,016,033 | | | | (80,883,094 | ) | | | 1,787 | | | | 1,640 | | | | 22,665,771 | | | | 473,895 | |
Invesco Treasury Portfolio, Institutional Class | | | 11,576,061 | | | | 153,625,654 | | | | (129,141,442 | ) | | | - | | | | - | | | | 36,060,273 | | | | 728,547 | |
| Investments Purchased with Cash Collateral from Securities on Loan: | | | | | | | | | | | | | | | | | | | | | | | | | | | | |
Invesco Private Government Fund | | | 33,912,047 | | | | 281,479,782 | | | | (292,628,479 | ) | | | - | | | | - | | | | 22,763,350 | | | | 1,145,810* | |
Invesco Private Prime Fund | | | 87,205,356 | | | | 460,412,982 | | | | (489,073,493 | ) | | | 218 | | | | 5,206 | | | | 58,550,269 | | | | 3,035,683* | |
Total | | $ | 150,351,923 | | | $ | 1,125,956,898 | | | $ | (1,104,725,270 | ) | | $ | 2,005 | | | $ | 6,846 | | | $ | 171,592,402 | | | $ | 6,032,576 | |
| | * | Represents the income earned on the investment of cash collateral, which is included in securities lending income on the Statement of Operations. Does not include rebates and fees paid to lending agent or premiums received from borrowers, if any. |
| (d) | The rate shown is the 7-day SEC standardized yield as of October 31, 2023. |
| (e) | The security has been segregated to satisfy the commitment to return the cash collateral received in securities lending transactions upon the borrower’s return of the securities loaned. See Note 1J. |
See accompanying Notes to Financial Statements which are an integral part of the financial statements.
| | |
| 10 | | Invesco Rising Dividends Fund |
Statement of Assets and Liabilities
October 31, 2023
| | | | |
Assets: | | | | |
| |
Investments in unaffiliated securities, at value (Cost $1,743,344,330)* | | $ | 2,551,137,556 | |
|
| |
Investments in affiliated money market funds, at value (Cost $171,588,163) | | | 171,592,402 | |
|
| |
Cash | | | 3,000,000 | |
|
| |
Foreign currencies, at value (Cost $569) | | | 549 | |
|
| |
Receivable for: | | | | |
Fund shares sold | | | 710,365 | |
|
| |
Dividends | | | 1,630,735 | |
|
| |
Foreign withholding tax claims | | | 66,715 | |
|
| |
Investment for trustee deferred compensation and retirement plans | | | 160,995 | |
|
| |
Other assets | | | 52,242 | |
|
| |
Total assets | | | 2,728,351,559 | |
|
| |
| |
Liabilities: | | | | |
| |
Payable for: | | | | |
Fund shares reacquired | | | 1,577,955 | |
|
| |
Collateral upon return of securities loaned | | | 81,311,957 | |
|
| |
Accrued fees to affiliates | | | 1,106,353 | |
|
| |
Accrued trustees’ and officers’ fees and benefits | | | 1,361 | |
|
| |
Accrued other operating expenses | | | 74,821 | |
|
| |
Trustee deferred compensation and retirement plans | | | 269,338 | |
|
| |
Total liabilities | | | 84,341,785 | |
|
| |
Net assets applicable to shares outstanding | | $ | 2,644,009,774 | |
|
| |
| |
Net assets consist of: | | | | |
Shares of beneficial interest | | $ | 1,645,476,096 | |
|
| |
Distributable earnings | | | 998,533,678 | |
|
| |
| | $ | 2,644,009,774 | |
|
| |
| | | | |
Net Assets: | | | | |
| |
Class A | | $ | 2,102,472,271 | |
|
| |
Class C | | $ | 119,923,017 | |
|
| |
Class R | | $ | 103,798,642 | |
|
| |
Class Y | | $ | 278,380,627 | |
|
| |
Class R5 | | $ | 11,837 | |
|
| |
Class R6 | | $ | 39,423,380 | |
|
| |
|
Shares outstanding, no par value, with an unlimited number of shares authorized: | |
Class A | | | 95,145,579 | |
|
| |
Class C | | | 6,860,749 | |
|
| |
Class R | | | 4,740,037 | |
|
| |
Class Y | | | 12,007,234 | |
|
| |
Class R5 | | | 536 | |
|
| |
Class R6 | | | 1,705,715 | |
|
| |
Class A: | | | | |
Net asset value per share | | $ | 22.10 | |
|
| |
Maximum offering price per share
(Net asset value of $22.10 ÷ 94.50%) | | $ | 23.39 | |
|
| |
Class C: | | | | |
Net asset value and offering price per share | | $ | 17.48 | |
|
| |
Class R: | | | | |
Net asset value and offering price per share | | $ | 21.90 | |
|
| |
Class Y: | | | | |
Net asset value and offering price per share | | $ | 23.18 | |
|
| |
Class R5: | | | | |
Net asset value and offering price per share | | $ | 22.08 | |
|
| |
Class R6: | | | | |
Net asset value and offering price per share | | $ | 23.11 | |
|
| |
| * | At October 31, 2023, securities with an aggregate value of $80,201,854 were on loan to brokers. |
See accompanying Notes to Financial Statements which are an integral part of the financial statements.
| | |
| 11 | | Invesco Rising Dividends Fund |
Statement of Operations
For the year ended October 31, 2023
| | | | |
Investment income: | | | | |
| |
Dividends (net of foreign withholding taxes of $68,959) | | $ | 52,309,148 | |
|
| |
Dividends from affiliated money market funds (includes net securities lending income of $240,116) | | | 2,091,199 | |
|
| |
Foreign withholding tax claims | | | 66,715 | |
|
| |
Total investment income | | | 54,467,062 | |
|
| |
| |
Expenses: | | | | |
| |
Advisory fees | | | 16,189,476 | |
|
| |
Administrative services fees | | | 392,757 | |
|
| |
Custodian fees | | | 18,550 | |
|
| |
Distribution fees: | | | | |
Class A | | | 5,459,689 | |
|
| |
Class C | | | 1,351,060 | |
|
| |
Class R | | | 533,144 | |
|
| |
Transfer agent fees – A, C, R and Y | | | 3,137,563 | |
|
| |
Transfer agent fees – R5 | | | 4 | |
|
| |
Transfer agent fees – R6 | | | 11,558 | |
|
| |
Trustees’ and officers’ fees and benefits | | | 52,260 | |
|
| |
Registration and filing fees | | | 131,283 | |
|
| |
Reports to shareholders | | | 172,659 | |
|
| |
Professional services fees | | | 77,466 | |
|
| |
Other | | | 56,032 | |
|
| |
Total expenses | | | 27,583,501 | |
|
| |
Less: Fees waived and/or expense offset arrangement(s) | | | (135,046 | ) |
|
| |
Net expenses | | | 27,448,455 | |
|
| |
Net investment income | | | 27,018,607 | |
|
| |
| |
Realized and unrealized gain (loss) from: | | | | |
Net realized gain from: | | | | |
Unaffiliated investment securities | | | 200,749,855 | |
|
| |
Affiliated investment securities | | | 6,846 | |
|
| |
Foreign currencies | | | 8,350 | |
|
| |
| | | 200,765,051 | |
|
| |
Change in net unrealized appreciation (depreciation) of: | | | | |
Unaffiliated investment securities | | | (25,288,954 | ) |
|
| |
Affiliated investment securities | | | 2,005 | |
|
| |
Foreign currencies | | | 10,602 | |
|
| |
| | | (25,276,347 | ) |
|
| |
Net realized and unrealized gain | | | 175,488,704 | |
|
| |
Net increase in net assets resulting from operations | | $ | 202,507,311 | |
|
| |
See accompanying Notes to Financial Statements which are an integral part of the financial statements.
| | |
| 12 | | Invesco Rising Dividends Fund |
Statement of Changes in Net Assets
For the years ended October 31, 2023 and 2022
| | | | | | | | |
| | | 2023 | | | 2022 | |
|
| |
Operations: | | | | | | | | |
Net investment income | | $ | 27,018,607 | | | $ | 24,499,849 | |
|
| |
Net realized gain | | | 200,765,051 | | | | 143,368,493 | |
|
| |
Change in net unrealized appreciation (depreciation) | | | (25,276,347 | ) | | | (484,270,649 | ) |
|
| |
Net increase (decrease) in net assets resulting from operations | | | 202,507,311 | | | | (316,402,307 | ) |
|
| |
| | |
Distributions to shareholders from distributable earnings: | | | | | | | | |
Class A | | | (125,800,903 | ) | | | (290,632,861 | ) |
|
| |
Class C | | | (8,431,540 | ) | | | (26,390,273 | ) |
|
| |
Class R | | | (5,795,329 | ) | | | (13,192,438 | ) |
|
| |
Class Y | | | (16,416,932 | ) | | | (36,961,371 | ) |
|
| |
Class R5 | | | (750 | ) | | | (1,766 | ) |
|
| |
Class R6 | | | (2,196,164 | ) | | | (4,795,326 | ) |
|
| |
Total distributions from distributable earnings | | | (158,641,618 | ) | | | (371,974,035 | ) |
|
| |
| | |
Share transactions–net: | | | | | | | | |
Class A | | | (18,516,358 | ) | | | 127,354,509 | |
|
| |
Class C | | | (19,681,808 | ) | | | (11,296,859 | ) |
|
| |
Class R | | | 3,916,774 | | | | 7,952,353 | |
|
| |
Class Y | | | (8,465,589 | ) | | | 26,500,911 | |
|
| |
Class R6 | | | 3,593,179 | | | | 3,207,862 | |
|
| |
Net increase (decrease) in net assets resulting from share transactions | | | (39,153,802 | ) | | | 153,718,776 | |
|
| |
Net increase (decrease) in net assets | | | 4,711,891 | | | | (534,657,566 | ) |
|
| |
| | |
Net assets: | | | | | | | | |
Beginning of year | | | 2,639,297,883 | | | | 3,173,955,449 | |
|
| |
End of year | | $ | 2,644,009,774 | | | $ | 2,639,297,883 | |
|
| |
See accompanying Notes to Financial Statements which are an integral part of the financial statements.
| | |
| 13 | | Invesco Rising Dividends Fund |
Financial Highlights
The following schedule presents financial highlights for a share of the Fund outstanding throughout the periods indicated.
| | | | | | | | | | | | | | | | | | | | | | | | | | | | | | | | | | | | | | | | | | | | | | | | | | | | | | | | |
| | | Net asset value, beginning of period | | Net investment income (loss)(a) | | Net gains (losses) on securities (both realized and unrealized) | | Total from investment operations | | Dividends from net investment income | | Distributions from net realized gains | | Total distributions | | Net asset value, end of period | | Total return(b) | | Net assets, end of period (000’s omitted) | | Ratio of expenses to average net assets with fee waivers and/or expenses absorbed | | Ratio of expenses to average net assets without fee waivers and/or expenses absorbed(c) | | Ratio of net investment income (loss) to average net assets | | Portfolio turnover (d) |
Class A | | | | | | | | | | | | | | | | | | | | | | | | | | | | | | | | | | | | | | | | | | | | | | | | | | | | | | | | |
Year ended 10/31/23 | | | $21.76 | | | | $ 0.22 | | | | $ 1.45 | | | | $ 1.67 | | | | $(0.26 | ) | | | $(1.07 | ) | | | $(1.33 | ) | | | $22.10 | | | | 7.74 | % | | | $2,102,472 | | | | 0.99 | % | | | 0.99 | % | | | 0.99 | % | | | 29 | % |
Year ended 10/31/22 | | | 27.44 | | | | 0.20 | | | | (2.67 | ) | | | (2.47 | ) | | | (0.12 | ) | | | (3.09 | ) | | | (3.21 | ) | | | 21.76 | | | | (10.33 | ) | | | 2,085,512 | | | | 0.96 | | | | 0.96 | | | | 0.87 | | | | 38 | |
Year ended 10/31/21 | | | 20.52 | | | | 0.15 | | | | 7.30 | | | | 7.45 | | | | (0.15 | ) | | | (0.38 | ) | | | (0.53 | ) | | | 27.44 | | | | 36.83 | | | | 2,497,385 | | | | 1.00 | | | | 1.00 | | | | 0.62 | | | | 30 | |
Year ended 10/31/20 | | | 20.21 | | | | 0.20 | | | | 0.99 | | | | 1.19 | | | | (0.23 | ) | | | (0.65 | ) | | | (0.88 | ) | | | 20.52 | | | | 6.05 | | | | 1,944,346 | | | | 1.04 | | | | 1.04 | | | | 0.99 | | | | 28 | |
Year ended 10/31/19 | | | 19.48 | | | | 0.22 | | | | 1.98 | | | | 2.20 | | | | (0.18 | ) | | | (1.29 | ) | | | (1.47 | ) | | | 20.21 | | | | 12.30 | | | | 2,055,643 | | | | 1.05 | | | | 1.05 | | | | 1.13 | | | | 29 | |
Class C | | | | | | | | | | | | | | | | | | | | | | | | | | | | | | | | | | | | | | | | | | | | | | | | | | | | | | | | |
Year ended 10/31/23 | | | 17.37 | | | | 0.04 | | | | 1.15 | | | | 1.19 | | | | (0.01 | ) | | | (1.07 | ) | | | (1.08 | ) | | | 17.48 | | | | 6.90 | | | | 119,923 | | | | 1.74 | | | | 1.74 | | | | 0.24 | | | | 29 | |
Year ended 10/31/22 | | | 22.56 | | | | 0.02 | | | | (2.12 | ) | | | (2.10 | ) | | | — | | | | (3.09 | ) | | | (3.09 | ) | | | 17.37 | | | | (11.00 | ) | | | 138,325 | | | | 1.71 | | | | 1.71 | | | | 0.12 | | | | 38 | |
Year ended 10/31/21 | | | 16.95 | | | | (0.03 | ) | | | 6.02 | | | | 5.99 | | | | (0.00 | ) | | | (0.38 | ) | | | (0.38 | ) | | | 22.56 | | | | 35.83 | | | | 195,831 | | | | 1.75 | | | | 1.75 | | | | (0.13 | ) | | | 30 | |
Year ended 10/31/20 | | | 16.77 | | | | 0.04 | | | | 0.82 | | | | 0.86 | | | | (0.03 | ) | | | (0.65 | ) | | | (0.68 | ) | | | 16.95 | | | | 5.23 | | | | 238,458 | | | | 1.79 | | | | 1.79 | | | | 0.24 | | | | 28 | |
Year ended 10/31/19 | | | 16.44 | | | | 0.06 | | | | 1.64 | | | | 1.70 | | | | (0.08 | ) | | | (1.29 | ) | | | (1.37 | ) | | | 16.77 | | | | 11.44 | | | | 317,475 | | | | 1.80 | | | | 1.80 | | | | 0.38 | | | | 29 | |
Class R | | | | | | | | | | | | | | | | | | | | | | | | | | | | | | | | | | | | | | | | | | | | | | | | | | | | | | | | |
Year ended 10/31/23 | | | 21.57 | | | | 0.17 | | | | 1.43 | | | | 1.60 | | | | (0.20 | ) | | | (1.07 | ) | | | (1.27 | ) | | | 21.90 | | | | 7.48 | | | | 103,799 | | | | 1.24 | | | | 1.24 | | | | 0.74 | | | | 29 | |
Year ended 10/31/22 | | | 27.23 | | | | 0.14 | | | | (2.65 | ) | | | (2.51 | ) | | | (0.06 | ) | | | (3.09 | ) | | | (3.15 | ) | | | 21.57 | | | | (10.58 | ) | | | 98,241 | | | | 1.21 | | | | 1.21 | | | | 0.62 | | | | 38 | |
Year ended 10/31/21 | | | 20.36 | | | | 0.09 | | | | 7.25 | | | | 7.34 | | | | (0.09 | ) | | | (0.38 | ) | | | (0.47 | ) | | | 27.23 | | | | 36.53 | | | | 115,326 | | | | 1.25 | | | | 1.25 | | | | 0.37 | | | | 30 | |
Year ended 10/31/20 | | | 20.06 | | | | 0.15 | | | | 0.97 | | | | 1.12 | | | | (0.17 | ) | | | (0.65 | ) | | | (0.82 | ) | | | 20.36 | | | | 5.75 | | | | 94,605 | | | | 1.29 | | | | 1.29 | | | | 0.74 | | | | 28 | |
Year ended 10/31/19 | | | 19.35 | | | | 0.17 | | | | 1.97 | | | | 2.14 | | | | (0.14 | ) | | | (1.29 | ) | | | (1.43 | ) | | | 20.06 | | | | 12.00 | | | | 104,287 | | | | 1.30 | | | | 1.30 | | | | 0.88 | | | | 29 | |
Class Y | | | | | | | | | | | | | | | | | | | | | | | | | | | | | | | | | | | | | | | | | | | | | | | | | | | | | | | | |
Year ended 10/31/23 | | | 22.78 | | | | 0.30 | | | | 1.50 | | | | 1.80 | | | | (0.33 | ) | | | (1.07 | ) | | | (1.40 | ) | | | 23.18 | | | | 7.98 | | | | 278,381 | | | | 0.74 | | | | 0.74 | | | | 1.24 | | | | 29 | |
Year ended 10/31/22 | | | 28.59 | | | | 0.27 | | | | (2.80 | ) | | | (2.53 | ) | | | (0.19 | ) | | | (3.09 | ) | | | (3.28 | ) | | | 22.78 | | | | (10.12 | ) | | | 281,984 | | | | 0.71 | | | | 0.71 | | | | 1.12 | | | | 38 | |
Year ended 10/31/21 | | | 21.36 | | | | 0.22 | | | | 7.61 | | | | 7.83 | | | | (0.22 | ) | | | (0.38 | ) | | | (0.60 | ) | | | 28.59 | | | | 37.21 | | | | 324,469 | | | | 0.75 | | | | 0.75 | | | | 0.87 | | | | 30 | |
Year ended 10/31/20 | | | 21.02 | | | | 0.26 | | | | 1.02 | | | | 1.28 | | | | (0.29 | ) | | | (0.65 | ) | | | (0.94 | ) | | | 21.36 | | | | 6.29 | | | | 255,399 | | | | 0.79 | | | | 0.79 | | | | 1.24 | | | | 28 | |
Year ended 10/31/19 | | | 20.21 | | | | 0.27 | | | | 2.06 | | | | 2.33 | | | | (0.23 | ) | | | (1.29 | ) | | | (1.52 | ) | | | 21.02 | | | | 12.52 | | | | 311,750 | | | | 0.80 | | | | 0.80 | | | | 1.38 | | | | 29 | |
Class R5 | | | | | | | | | | | | | | | | | | | | | | | | | | | | | | | | | | | | | | | | | | | | | | | | | | | | | | | | |
Year ended 10/31/23 | | | 21.74 | | | | 0.30 | | | | 1.44 | | | | 1.74 | | | | (0.33 | ) | | | (1.07 | ) | | | (1.40 | ) | | | 22.08 | | | | 8.11 | | | | 12 | | | | 0.65 | | | | 0.65 | | | | 1.33 | | | | 29 | |
Year ended 10/31/22 | | | 27.43 | | | | 0.28 | | | | (2.68 | ) | | | (2.40 | ) | | | (0.20 | ) | | | (3.09 | ) | | | (3.29 | ) | | | 21.74 | | | | (10.06 | ) | | | 12 | | | | 0.63 | | | | 0.63 | | | | 1.20 | | | | 38 | |
Year ended 10/31/21 | | | 20.51 | | | | 0.24 | | | | 7.30 | | | | 7.54 | | | | (0.24 | ) | | | (0.38 | ) | | | (0.62 | ) | | | 27.43 | | | | 37.33 | | | | 15 | | | | 0.65 | | | | 0.65 | | | | 0.97 | | | | 30 | |
Year ended 10/31/20 | | | 20.21 | | | | 0.27 | | | | 0.98 | | | | 1.25 | | | | (0.30 | ) | | | (0.65 | ) | | | (0.95 | ) | | | 20.51 | | | | 6.41 | | | | 11 | | | | 0.67 | | | | 0.67 | | | | 1.36 | | | | 28 | |
Period ended 10/31/19(e) | | | 18.65 | | | | 0.13 | | | | 1.55 | | | | 1.68 | | | | (0.12 | ) | | | — | | | | (0.12 | ) | | | 20.21 | | | | 9.05 | | | | 11 | | | | 0.70 | (f) | | | 0.70 | (f) | | | 1.49 | (f) | | | 29 | |
Class R6 | | | | | | | | | | | | | | | | | | | | | | | | | | | | | | | | | | | | | | | | | | | | | | | | | | | | | | | | |
Year ended 10/31/23 | | | 22.71 | | | | 0.31 | | | | 1.51 | | | | 1.82 | | | | (0.35 | ) | | | (1.07 | ) | | | (1.42 | ) | | | 23.11 | | | | 8.09 | | | | 39,423 | | | | 0.65 | | | | 0.65 | | | | 1.33 | | | | 29 | |
Year ended 10/31/22 | | | 28.51 | | | | 0.29 | | | | (2.79 | ) | | | (2.50 | ) | | | (0.21 | ) | | | (3.09 | ) | | | (3.30 | ) | | | 22.71 | | | | (10.04 | ) | | | 35,224 | | | | 0.63 | | | | 0.63 | | | | 1.20 | | | | 38 | |
Year ended 10/31/21 | | | 21.31 | | | | 0.25 | | | | 7.58 | | | | 7.83 | | | | (0.25 | ) | | | (0.38 | ) | | | (0.63 | ) | | | 28.51 | | | | 37.30 | | | | 40,929 | | | | 0.65 | | | | 0.65 | | | | 0.97 | | | | 30 | |
Year ended 10/31/20 | | | 20.97 | | | | 0.29 | | | | 1.02 | | | | 1.31 | | | | (0.32 | ) | | | (0.65 | ) | | | (0.97 | ) | | | 21.31 | | | | 6.47 | | | | 28,537 | | | | 0.64 | | | | 0.67 | | | | 1.39 | | | | 28 | |
Year ended 10/31/19 | | | 20.16 | | | | 0.30 | | | | 2.06 | | | | 2.36 | | | | (0.26 | ) | | | (1.29 | ) | | | (1.55 | ) | | | 20.97 | | | | 12.72 | | | | 29,624 | | | | 0.64 | | | | 0.64 | | | | 1.54 | | | | 29 | |
| (a) | Calculated using average shares outstanding. |
| (b) | Includes adjustments in accordance with accounting principles generally accepted in the United States of America and as such, the net asset value for financial reporting purposes and the returns based upon those net asset values may differ from the net asset value and returns for shareholder transactions. Does not include sales charges and is not annualized for periods less than one year, if applicable. |
| (c) | Does not include indirect expenses from affiliated fund fees and expenses of 0.00% for the year ended October 31, 2019. |
| (d) | Portfolio turnover is calculated at the fund level and is not annualized for periods less than one year, if applicable. |
| (e) | Commencement date after the close of business on May 24, 2019. |
See accompanying Notes to Financial Statements which are an integral part of the financial statements.
| | |
| 14 | | Invesco Rising Dividends Fund |
Notes to Financial Statements
October 31, 2023
NOTE 1–Significant Accounting Policies
Invesco Rising Dividends Fund (the “Fund”) is a series portfolio of AIM Equity Funds (Invesco Equity Funds) (the “Trust”). The Trust is a Delaware statutory trust registered under the Investment Company Act of 1940, as amended (the “1940 Act”), as an open-end series management investment company authorized to issue an unlimited number of shares of beneficial interest. Information presented in these financial statements pertains only to the Fund. Matters affecting the Fund or each class will be voted on exclusively by the shareholders of the Fund or each class.
The Fund’s investment objective is to seek total return.
The Fund currently consists of six different classes of shares: Class A, Class C, Class R, Class Y, Class R5 and Class R6. Class Y shares are available only to certain investors. Class A shares are sold with a front-end sales charge unless certain waiver criteria are met. Under certain circumstances, load waived shares may be subject to contingent deferred sales charges (“CDSC”). Class C shares are sold with a CDSC. Class R, Class Y, Class R5 and Class R6 shares are sold at net asset value. Class C shares held for eight years after purchase are eligible for automatic conversion into Class A shares of the same Fund (the “Conversion Feature”). The automatic conversion pursuant to the Conversion Feature will generally occur at the end of the month following the eighth anniversary after a purchase of Class C shares.
The Fund is an investment company and accordingly follows the investment company accounting and reporting guidance in accordance with Financial Accounting Standards Board Accounting Standards Codification Topic 946, Financial Services – Investment Companies.
The following is a summary of the significant accounting policies followed by the Fund in the preparation of its financial statements.
| A. | Security Valuations - Securities, including restricted securities, are valued according to the following policy. |
A security listed or traded on an exchange is generally valued at its trade price or official closing price that day as of the close of the exchange where the security is principally traded, or lacking any trades or official closing price on a particular day, the security may be valued at the closing bid or ask price on that day. Securities traded in the over-the-counter market are valued based on prices furnished by independent pricing services or market makers. When such securities are valued using prices provided by an independent pricing service they may be considered fair valued. Futures contracts are valued at the daily settlement price set by an exchange on which they are principally traded. Where a final settlement price exists, exchange-traded options are valued at the final settlement price from the exchange where the option principally trades. Where a final settlement price does not exist, exchange-traded options are valued at the mean between the last bid and ask price generally from the exchange where the option principally trades.
Securities of investment companies that are not exchange-traded (e.g., open-end mutual funds) are valued using such company’s end-of-business-day net asset value per share.
Deposits, other obligations of U.S. and non-U.S. banks and financial institutions are valued at their daily account value.
Fixed income securities (including convertible debt securities) generally are valued on the basis of prices provided by independent pricing services. Prices provided by the pricing service may be determined without exclusive reliance on quoted prices, and may reflect appropriate factors such as institution-size trading in similar groups of securities, developments related to specific securities, dividend rate (for unlisted equities), yield (for debt obligations), quality, type of issue, coupon rate (for debt obligations), maturity (for debt obligations), individual trading characteristics and other market data. Pricing services generally value debt obligations assuming orderly transactions of institutional round lot size, but a fund may hold or transact in the same securities in smaller, odd lot sizes. Odd lots often trade at lower prices than institutional round lots, and their value may be adjusted accordingly. Debt obligations are subject to interest rate and credit risks. In addition, all debt obligations involve some risk of default with respect to interest and/or principal payments.
Foreign securities’ (including foreign exchange contracts) prices are converted into U.S. dollar amounts using the applicable exchange rates as of the close of the New York Stock Exchange (“NYSE”). If market quotations are available and reliable for foreign exchange-traded equity securities, the securities will be valued at the market quotations. Invesco Advisers, Inc. (the “Adviser” or “Invesco”) may use various pricing services to obtain market quotations as well as fair value prices. Because trading hours for certain foreign securities end before the close of the NYSE, closing market quotations may become not representative of market value in the Adviser’s judgment (“unreliable”). If, between the time trading ends on a particular security and the close of the customary trading session on the NYSE, a significant event occurs that makes the closing price of the security unreliable, the Adviser may fair value the security. If the event is likely to have affected the closing price of the security, the security will be valued at fair value in good faith in accordance with Board- approved policies and related Adviser procedures (“Valuation Procedures”). Adjustments to closing prices to reflect fair value may also be based on a screening process of an independent pricing service to indicate the degree of certainty, based on historical data, that the closing price in the principal market where a foreign security trades is not the current value as of the close of the NYSE. Foreign securities’ prices meeting the degree of certainty that the price is not reflective of current value will be priced at the indication of fair value from the independent pricing service. Multiple factors may be considered by the independent pricing service in determining adjustments to reflect fair value and may include information relating to sector indices, American Depositary Receipts and domestic and foreign index futures. Foreign securities may have additional risks including exchange rate changes, potential for sharply devalued currencies and high inflation, political and economic upheaval, the relative lack of issuer information, relatively low market liquidity and the potential lack of strict financial and accounting controls and standards.
Unlisted securities will be valued using prices provided by independent pricing services or by another method that the Adviser, in its judgment, believes better reflects the security’s fair value in accordance with the Valuation Procedures.
Securities for which market prices are not provided by any of the above methods may be valued based upon quotes furnished by independent sources. The mean between the last bid and ask prices may be used to value debt obligations, including corporate loans.
Securities for which market quotations are not readily available are fair valued by the Adviser in accordance with the Valuation Procedures. If a fair value price provided by a pricing service is unreliable, the Adviser will fair value the security using the Valuation Procedures. Issuer specific events, market trends, bid/ask quotes of brokers and information providers and other market data may be reviewed in the course of making a good faith determination of a security’s fair value.
The Fund may invest in securities that are subject to interest rate risk, meaning the risk that the prices will generally fall as interest rates rise and, conversely, the prices will generally rise as interest rates fall. Specific securities differ in their sensitivity to changes in interest rates depending on their individual characteristics. Changes in interest rates may result in increased market volatility, which may affect the value and/or liquidity of certain Fund investments.
Valuations change in response to many factors including the historical and prospective earnings of the issuer, the value of the issuer’s assets, general market conditions which are not specifically related to the particular issuer, such as real or perceived adverse economic conditions, changes in the general outlook for revenues or corporate earnings, changes in interest or currency rates, regional or global instability, natural or environmental disasters, widespread disease or other public health issues, war, acts of terrorism, significant governmental actions or adverse investor sentiment generally and market liquidity. Because of the inherent uncertainties of valuation, the values reflected in the financial statements may materially differ from the value received upon actual sale of those investments.
The price the Fund could receive upon the sale of any investment may differ from the Adviser’s valuation of the investment, particularly for securities that are valued using a fair valuation technique. When fair valuation techniques are applied, the Adviser uses available information, including both observable and unobservable inputs and assumptions, to determine a methodology that will result in a valuation that the Adviser believes approximates market value. Fund securities that are fair valued may be subject to greater fluctuation in their value from one day to the next than would be the case if market quotations were used. Because of the inherent uncertainties of valuation, and the degree of subjectivity in such decisions, the Fund could realize a greater or lesser than expected gain or loss upon the sale of the investment.
| | |
| 15 | | Invesco Rising Dividends Fund |
| B. | Securities Transactions and Investment Income – Securities transactions are accounted for on a trade date basis. Realized gains or losses on sales are computed on the basis of specific identification of the securities sold. Interest income (net of withholding tax, if any) is recorded on an accrual basis from settlement date and includes coupon interest and amortization of premium and accretion of discount on debt securities as applicable. Dividend income (net of withholding tax, if any) is recorded on the ex-dividend date. |
The Fund may periodically participate in litigation related to Fund investments. As such, the Fund may receive proceeds from litigation settlements. Any proceeds received are included in the Statement of Operations as realized gain (loss) for investments no longer held and as unrealized gain (loss) for investments still held.
Brokerage commissions and mark ups are considered transaction costs and are recorded as an increase to the cost basis of securities purchased and/or a reduction of proceeds on a sale of securities. Such transaction costs are included in the determination of net realized and unrealized gain (loss) from investment securities reported in the Statement of Operations and the Statement of Changes in Net Assets and the net realized and unrealized gains (losses) on securities per share in the Financial Highlights. Transaction costs are included in the calculation of the Fund’s net asset value and, accordingly, they reduce the Fund’s total returns. These transaction costs are not considered operating expenses and are not reflected in net investment income reported in the Statement of Operations and the Statement of Changes in Net Assets, or the net investment income per share and the ratios of expenses and net investment income reported in the Financial Highlights, nor are they limited by any expense limitation arrangements between the Fund and the investment adviser.
The Fund allocates income and realized and unrealized capital gains and losses to a class based on the relative net assets of each class.
| C. | Country Determination – For the purposes of making investment selection decisions and presentation in the Schedule of Investments, the investment adviser may determine the country in which an issuer is located and/or credit risk exposure based on various factors. These factors include the laws of the country under which the issuer is organized, where the issuer maintains a principal office, the country in which the issuer derives 50% or more of its total revenues, the country that has the primary market for the issuer’s securities and its “country of risk” as determined by a third party service provider, as well as other criteria. Among the other criteria that may be evaluated for making this determination are the country in which the issuer maintains 50% or more of its assets, the type of security, financial guarantees and enhancements, the nature of the collateral and the sponsor organization. Country of issuer and/or credit risk exposure has been determined to be the United States of America, unless otherwise noted. |
| D. | Distributions – Distributions from net investment income, if any, are declared and paid quarterly and are recorded on the ex-dividend date. Distributions from net realized capital gain, if any, are generally declared and paid annually and recorded on the ex-dividend date. The Fund may elect to treat a portion of the proceeds from redemptions as distributions for federal income tax purposes. |
| E. | Federal Income Taxes – The Fund intends to comply with the requirements of Subchapter M of the Internal Revenue Code of 1986, as amended (the “Internal Revenue Code”), necessary to qualify as a regulated investment company and to distribute substantially all of the Fund’s taxable earnings to shareholders. As such, the Fund will not be subject to federal income taxes on otherwise taxable income (including net realized capital gain) that is distributed to shareholders. Therefore, no provision for federal income taxes is recorded in the financial statements. |
The Fund recognizes the tax benefits of uncertain tax positions only when the position is more likely than not to be sustained. Management has analyzed the Fund’s uncertain tax positions and concluded that no liability for unrecognized tax benefits should be recorded related to uncertain tax positions. Management is not aware of any tax positions for which it is reasonably possible that the total amounts of unrecognized tax benefits will change materially in the next 12 months.
The Fund files tax returns in the U.S. Federal jurisdiction and certain other jurisdictions. Generally, the Fund is subject to examinations by such taxing authorities for up to three years after the filing of the return for the tax period.
| F. | Foreign Withholding Taxes – The Fund is subject to foreign withholding tax imposed by certain foreign countries in which the Fund may invest. Withholding taxes are incurred on certain foreign dividends and are accrued at the time the dividend is recognized based on applicable foreign tax laws. The Fund may file withholding tax refunds in certain jurisdictions to seek to recover a portion of amounts previously withheld. The Fund will record a receivable for such tax refunds based on several factors including; an assessment of a jurisdiction’s legal obligation to pay reclaims, administrative practices and payment history. Any receivables recorded will be shown under receivables for Foreign withholding tax claims on the Statement of Assets and Liabilities. There is no guarantee that the Fund will receive refunds applied for in a timely manner or at all. |
As a result of recent court rulings in certain countries across the European Union, tax refunds for previously withheld taxes on dividends earned in those countries have been received by investment companies. Any tax refund payments are reflected as Foreign withholding tax claims in the Statement of Operations, and any related interest is included in Interest income. The Fund may incur fees paid to third party providers that assist in the recovery of the tax reclaims. These fees are reflected on the Statement of Operations as Professional services fees, if any. In the event tax refunds received by the Fund during the fiscal year exceed the foreign withholding taxes paid by the Fund for the year, and the Fund previously passed foreign tax credits on to its shareholders, the Fund intends to enter into a closing agreement with the Internal Revenue Service in order to pay the associated liability on behalf of the Funds’ shareholders. For the year ended October 31, 2023, the Fund did not enter into any closing agreements.
| G. | Expenses – Fees provided for under the Rule 12b-1 plan of a particular class of the Fund are charged to the operations of such class. Transfer agency fees and expenses and other shareholder recordkeeping fees and expenses attributable to Class R5 and Class R6 are allocated based on relative net assets of Class R5 and Class R6. Sub-accounting fees attributable to Class R5 are charged to the operations of the class. Transfer agency fees and expenses and other shareholder recordkeeping fees and expenses relating to all other classes are allocated among those classes based on relative net assets. All other expenses are allocated among the classes based on relative net assets. |
| H. | Accounting Estimates –The preparation of financial statements in conformity with accounting principles generally accepted in the United States of America (“GAAP”) requires management to make estimates and assumptions that affect the reported amounts of assets and liabilities at the date of the financial statements and the reported amounts of revenues and expenses during the reporting period including estimates and assumptions related to taxation. Actual results could differ from those estimates by a significant amount. In addition, the Fund monitors for material events or transactions that may occur or become known after the period-end date and before the date the financial statements are released to print. |
| I. | Indemnifications – Under the Trust’s organizational documents, each Trustee, officer, employee or other agent of the Trust is indemnified against certain liabilities that may arise out of the performance of their duties to the Fund. Additionally, in the normal course of business, the Fund enters into contracts, including the Fund’s servicing agreements, that contain a variety of indemnification clauses. The Fund’s maximum exposure under these arrangements is unknown as this would involve future claims that may be made against the Fund that have not yet occurred. The risk of material loss as a result of such indemnification claims is considered remote. |
| J. | Securities Lending – The Fund may lend portfolio securities having a market value up to one-third of the Fund’s total assets. Such loans are secured by collateral equal to no less than the market value of the loaned securities determined daily by the securities lending provider. Such collateral will be cash or debt securities issued or guaranteed by the U.S. Government or any of its sponsored agencies. Cash collateral received in connection with these loans is invested in short-term money market instruments or affiliated, unregistered investment companies that comply with Rule 2a-7 under the 1940 Act and money market funds (collectively, “affiliated money market funds”) and is shown as such on the Schedule of Investments. The Fund bears the risk of loss with respect to the investment of collateral. It is the Fund’s policy to obtain additional collateral from or return excess collateral to the borrower by the end of the next business day, following the valuation date of the securities loaned. Therefore, the value of the collateral held may be temporarily less than the value of the securities on loan. When loaning securities, the Fund retains certain benefits of owning the securities, including the economic equivalent of dividends or interest generated by the security. Lending securities entails a risk of loss to the Fund if, and to the extent that, the market value of the securities loaned were to increase and the borrower did not increase the collateral accordingly, and the borrower failed to return the securities. The securities loaned are subject to termination at the option of the borrower |
| | |
| 16 | | Invesco Rising Dividends Fund |
| | or the Fund. Upon termination, the borrower will return to the Fund the securities loaned and the Fund will return the collateral. Upon the failure of the borrower to return the securities, collateral may be liquidated and the securities may be purchased on the open market to replace the loaned securities. The Fund could experience delays and costs in gaining access to the collateral and the securities may lose value during the delay which could result in potential losses to the Fund. Some of these losses may be indemnified by the lending agent. The Fund bears the risk of any deficiency in the amount of the collateral available for return to the borrower due to any loss on the collateral invested. Dividends received on cash collateral investments for securities lending transactions, which are net of compensation to counterparties, are included in Dividends from affiliated money market funds on the Statement of Operations. The aggregate value of securities out on loan, if any, is shown as a footnote on the Statement of Assets and Liabilities. |
The Adviser serves as an affiliated securities lending agent for the Fund. The Bank of New York Mellon also serves as a securities lending agent. To the extent the Fund utilizes the Adviser as an affiliated securities lending agent, the Fund conducts its securities lending in accordance with, and in reliance upon, no-action letters issued by the SEC staff that provide guidance on how an affiliate may act as a direct agent lender and receive compensation for those services in a manner consistent with the federal securities laws. For the year ended October 31, 2023, the Fund paid the Adviser $15,749 in fees for securities lending agent services. Fees paid to the Adviser for securities lending agent services, if any, are included in Dividends from affiliated money market funds on the Statement of Operations.
| K. | Foreign Currency Translations – Foreign currency is valued at the close of the NYSE based on quotations posted by banks and major currency dealers. Portfolio securities and other assets and liabilities denominated in foreign currencies are translated into U.S. dollar amounts at the date of valuation. Purchases and sales of portfolio securities (net of foreign taxes withheld on disposition) and income items denominated in foreign currencies are translated into U.S. dollar amounts on the respective dates of such transactions. The Fund does not separately account for the portion of the results of operations resulting from changes in foreign exchange rates on investments and the fluctuations arising from changes in market prices of securities held. The combined results of changes in foreign exchange rates and the fluctuation of market prices on investments (net of estimated foreign tax withholding) are included with the net realized and unrealized gain or loss from investments in the Statement of Operations. Reported net realized foreign currency gains or losses arise from (1) sales of foreign currencies, (2) currency gains or losses realized between the trade and settlement dates on securities transactions, and (3) the difference between the amounts of dividends, interest, and foreign withholding taxes recorded on the Fund’s books and the U.S. dollar equivalent of the amounts actually received or paid. Net unrealized foreign currency gains and losses arise from changes in the fair values of assets and liabilities, other than investments in securities at fiscal period end, resulting from changes in exchange rates. |
The Fund may invest in foreign securities, which may be subject to foreign taxes on income, gains on investments or currency repatriation, a portion of which may be recoverable. Foreign taxes, if any, are recorded based on the tax regulations and rates that exist in the foreign markets in which the Fund invests and are shown in the Statement of Operations.
| L. | Forward Foreign Currency Contracts – The Fund may engage in foreign currency transactions either on a spot (i.e. for prompt delivery and settlement) basis, or through forward foreign currency contracts, to manage or minimize currency or exchange rate risk. |
The Fund may also enter into forward foreign currency contracts for the purchase or sale of a security denominated in a foreign currency in order to “lock in” the U.S. dollar price of that security, or the Fund may also enter into forward foreign currency contracts that do not provide for physical exchange of the two currencies on the settlement date, but instead are settled by a single cash payment calculated as the difference between the agreed upon exchange rate and the spot rate at settlement based upon an agreed upon notional amount (non-deliverable forwards).
A forward foreign currency contract is an obligation between two parties (“Counterparties”) to purchase or sell a specific currency for an agreed-upon price at a future date. The use of forward foreign currency contracts for hedging does not eliminate fluctuations in the price of the underlying securities the Fund owns or intends to acquire but establishes a rate of exchange in advance. Fluctuations in the value of these contracts are measured by the difference in the contract date and reporting date exchange rates and are recorded as unrealized appreciation (depreciation) until the contracts are closed. When the contracts are closed, realized gains (losses) are recorded. Realized and unrealized gains (losses) on the contracts are included in the Statement of Operations. The primary risks associated with forward foreign currency contracts include failure of the Counterparty to meet the terms of the contract and the value of the foreign currency changing unfavorably. These risks may be in excess of the amounts reflected in the Statement of Assets and Liabilities.
NOTE 2–Advisory Fees and Other Fees Paid to Affiliates
The Trust has entered into a master investment advisory agreement with the Adviser. Under the terms of the investment advisory agreement, the Fund accrues daily and pays monthly an advisory fee to the Adviser based on the annual rate of the Fund’s average daily net assets as follows:
| | | | |
| Average Daily Net Assets | | Rate* | |
|
| |
First $800 million | | | 0.650% | |
|
| |
Next $700 million | | | 0.600% | |
|
| |
Next $1 billion | | | 0.580% | |
|
| |
Next $2.5 billion | | | 0.560% | |
|
| |
Next $5 billion | | | 0.540% | |
|
| |
Over $10 billion | | | 0.520% | |
|
| |
| * | The advisory fee paid by the Fund shall be reduced by any amounts paid by the Fund under the administrative services agreement with the Adviser. |
For the year ended October 31, 2023, the effective advisory fee rate incurred by the Fund was 0.59%.
Under the terms of a master sub-advisory agreement between the Adviser and each of Invesco Asset Management Deutschland GmbH, Invesco Asset Management Limited, Invesco Asset Management (Japan) Limited, Invesco Hong Kong Limited, Invesco Senior Secured Management, Inc. and Invesco Canada Ltd. and separate sub-advisory agreements with Invesco Capital Management LLC and Invesco Asset Management (India) Private Limited (collectively, the “Affiliated Sub-Advisers”) the Adviser, not the Fund, will pay 40% of the fees paid to the Adviser to any such Affiliated Sub-Adviser(s) that provide(s) discretionary investment management services to the Fund based on the percentage of assets allocated to such Affiliated Sub-Adviser(s). Invesco has also entered into a sub-advisory agreement with OppenheimerFunds, Inc. to provide discretionary management services to the Fund.
Effective July 1, 2023, the Adviser has agreed, for an indefinite period, to waive advisory fees and/or reimburse expenses of all shares to the extent necessary to limit total annual fund operating expenses after fee waiver and/or expense reimbursement (excluding certain items discussed below) of Class A, Class C, Class R, Class Y, Class R5 and Class R6 shares to 2.00%, 2.75%, 2.25%, 1.75%, 1.75% and 1.75%, respectively, of the Fund’s average daily net assets (the “boundary limits”). Prior to July 1, 2023, the same boundary limits were in effect with an expiration date of June 30, 2023. In determining the Adviser’s obligation to waive advisory fees and/or reimburse expenses, the following expenses are not taken into account, and could cause the total annual fund operating expenses after fee waiver and/or expense reimbursement to exceed the numbers reflected above: (1) interest; (2) taxes; (3) dividend expense on short sales; (4) extraordinary or non-routine items, including litigation expenses; and (5) expenses that the Fund has incurred but did not actually pay because of an expense offset arrangement. Invesco may amend and/or terminate these boundary limits at any time in its sole discretion and will inform the Board of Trustees of any such changes. The Adviser did not waive fees and/or reimburse expenses during the period under these boundary limits.
| | |
| 17 | | Invesco Rising Dividends Fund |
Further, the Adviser has contractually agreed, through at least June 30, 2025, to waive the advisory fee payable by the Fund in an amount equal to 100% of the net advisory fees the Adviser receives from the affiliated money market funds on investments by the Fund of uninvested cash (excluding investments of cash collateral from securities lending) in such affiliated money market funds.
For the year ended October 31, 2023, the Adviser waived advisory fees of $42,094.
The Trust has entered into a master administrative services agreement with Invesco pursuant to which the Fund has agreed to pay Invesco for certain administrative costs incurred in providing accounting services to the Fund. For the year ended October 31, 2023, expenses incurred under the agreement are shown in the Statement of Operations as Administrative services fees. Invesco has entered into a sub-administration agreement whereby State Street Bank and Trust Company (“SSB”) serves as fund accountant and provides certain administrative services to the Fund. Pursuant to a custody agreement with the Trust on behalf of the Fund, SSB also serves as the Fund’s custodian.
The Trust has entered into a transfer agency and service agreement with Invesco Investment Services, Inc. (“IIS”) pursuant to which the Fund has agreed to pay IIS a fee for providing transfer agency and shareholder services to the Fund and reimburse IIS for certain expenses incurred by IIS in the course of providing such services. IIS may make payments to intermediaries that provide omnibus account services, sub-accounting services and/or networking services. All fees payable by IIS to intermediaries that provide omnibus account services or sub-accounting services are charged back to the Fund, subject to certain limitations approved by the Trust’s Board of Trustees. For the year ended October 31, 2023, expenses incurred under the agreement are shown in the Statement of Operations as Transfer agent fees.
The Trust has entered into master distribution agreements with Invesco Distributors, Inc. (“IDI”) to serve as the distributor for the Class A, Class C, Class R, Class Y, Class R5 and Class R6 shares of the Fund. The Trust has adopted plans pursuant to Rule 12b-1 under the 1940 Act with respect to the Fund’s Class A, Class C and Class R shares (collectively, the “Plans”). The Fund, pursuant to the Class A Plan, reimburses IDI for its allocated share of expenses incurred for the period, up to a maximum annual rate of 0.25% of the average daily net assets of Class A shares. The Fund, pursuant to the Class C and Class R Plans, pays IDI compensation at the annual rate of 1.00% of the average daily net assets of Class C shares and 0.50% of the average daily net assets of Class R shares. The fees are accrued daily and paid monthly. Of the Plans payments, up to 0.25% of the average daily net assets of each class of shares may be paid to furnish continuing personal shareholder services to customers who purchase and own shares of such classes. Any amounts not paid as a service fee under the Plans would constitute an asset-based sales charge. Rules of the Financial Industry Regulatory Authority (“FINRA”) impose a cap on the total sales charges, including asset-based sales charges, that may be paid by any class of shares of the Fund. For the year ended October 31, 2023, expenses incurred under the Plans are shown in the Statement of Operations as Distribution fees.
Front-end sales commissions and CDSC (collectively, the “sales charges”) are not recorded as expenses of the Fund. Front-end sales commissions are deducted from proceeds from the sales of Fund shares prior to investment in Class A shares of the Fund. CDSC are deducted from redemption proceeds prior to remittance to the shareholder. During the year ended October 31, 2023, IDI advised the Fund that IDI retained $226,363 in front-end sales commissions from the sale of Class A shares and $3,765 and $4,100 from Class A and Class C shares, respectively, for CDSC imposed upon redemptions by shareholders.
For the year ended October 31, 2023, the Fund incurred $16,011 in brokerage commissions with Invesco Capital Markets, Inc., an affiliate of the Adviser and IDI, for portfolio transactions executed on behalf of the Fund.
Certain officers and trustees of the Trust are officers and directors of the Adviser, IIS and/or IDI.
NOTE 3–Additional Valuation Information
GAAP defines fair value as the price that would be received to sell an asset or paid to transfer a liability in an orderly transaction between market participants at the measurement date, under current market conditions. GAAP establishes a hierarchy that prioritizes the inputs to valuation methods, giving the highest priority to readily available unadjusted quoted prices in an active market for identical assets (Level 1) and the lowest priority to significant unobservable inputs (Level 3), generally when market prices are not readily available. Based on the valuation inputs, the securities or other investments are tiered into one of three levels. Changes in valuation methods may result in transfers in or out of an investment’s assigned level:
| | |
| Level 1 - | | Prices are determined using quoted prices in an active market for identical assets. |
| Level 2 - | | Prices are determined using other significant observable inputs. Observable inputs are inputs that other market participants may use in pricing a security. These may include quoted prices for similar securities, interest rates, prepayment speeds, credit risk, yield curves, loss severities, default rates, discount rates, volatilities and others. |
| Level 3 - | | Prices are determined using significant unobservable inputs. In situations where quoted prices or observable inputs are unavailable (for example, when there is little or no market activity for an investment at the end of the period), unobservable inputs may be used. Unobservable inputs reflect the Adviser’s assumptions about the factors market participants would use in determining fair value of the securities or instruments and would be based on the best available information. |
The following is a summary of the tiered valuation input levels, as of October 31, 2023. The level assigned to the securities valuations may not be an indication of the risk or liquidity associated with investing in those securities. Because of the inherent uncertainties of valuation, the values reflected in the financial statements may materially differ from the value received upon actual sale of those investments.
| | | | | | | | | | | | | | | | |
| | | Level 1 | | | Level 2 | | | Level 3 | | | Total | |
|
| |
Investments in Securities | | | | | | | | | | | | | | | | |
|
| |
Common Stocks & Other Equity Interests | | $ | 2,529,691,903 | | | $ | 21,445,653 | | | | $– | | | $ | 2,551,137,556 | |
|
| |
Money Market Funds | | | 90,278,783 | | | | 81,313,619 | | | | – | | | | 171,592,402 | |
|
| |
Total Investments | | $ | 2,619,970,686 | | | $ | 102,759,272 | | | | $– | | | $ | 2,722,729,958 | |
|
| |
NOTE 4–Expense Offset Arrangement(s)
The expense offset arrangement is comprised of transfer agency credits which result from balances in demand deposit accounts used by the transfer agent for clearing shareholder transactions. For the year ended October 31, 2023, the Fund received credits from this arrangement, which resulted in the reduction of the Fund’s total expenses of $92,952.
NOTE 5–Trustees’ and Officers’ Fees and Benefits
Trustees’ and Officers’ Fees and Benefits include amounts accrued by the Fund to pay remuneration to certain Trustees and Officers of the Fund. Trustees have the option to defer compensation payable by the Fund, and Trustees’ and Officers’ Fees and Benefits also include amounts accrued by the Fund to fund such deferred compensation amounts. Those Trustees who defer compensation have the option to select various Invesco Funds in which their deferral accounts shall be deemed to be invested. Finally, certain current Trustees were eligible to participate in a retirement plan that provided for benefits to be paid upon retirement to Trustees over a period of time based on the number of years of service. The Fund may have certain former Trustees who also participate in a retirement plan and receive benefits under such plan. Trustees’ and Officers’ Fees and Benefits include amounts accrued by the Fund to fund such retirement benefits. Obligations under the deferred compensation and retirement plans represent unsecured claims against the general assets of the Fund.
| | |
| 18 | | Invesco Rising Dividends Fund |
NOTE 6–Cash Balances
The Fund is permitted to temporarily carry a negative or overdrawn balance in its account with SSB, the custodian bank. Such balances, if any at period-end, are shown in the Statement of Assets and Liabilities under the payable caption Amount due custodian. To compensate the custodian bank for such overdrafts, the overdrawn Fund may either (1) leave funds as a compensating balance in the account so the custodian bank can be compensated by earning the additional interest; or (2) compensate by paying the custodian bank at a rate agreed upon by the custodian bank and Invesco, not to exceed the contractually agreed upon rate.
NOTE 7–Distributions to Shareholders and Tax Components of Net Assets
Tax Character of Distributions to Shareholders Paid During the Fiscal Years Ended October 31, 2023 and 2022:
| | | | | | | | | | | | |
| | | 2023 | | | | | | 2022 | |
|
| |
Ordinary income* | | $ | 30,184,179 | | | | | | | $ | 68,984,758 | |
|
| |
Long-term capital gain | | | 128,457,439 | | | | | | | | 302,989,277 | |
|
| |
Total distributions | | $ | 158,641,618 | | | | | | | $ | 371,974,035 | |
|
| |
| * | Includes short-term capital gain distributions, if any. |
Tax Components of Net Assets at Period-End:
| | | | |
| | | 2023 | |
|
| |
Undistributed ordinary income | | $ | 7,125,009 | |
|
| |
Undistributed long-term capital gain | | | 184,331,898 | |
|
| |
Net unrealized appreciation – investments | | | 807,343,212 | |
|
| |
Net unrealized appreciation (depreciation) – foreign currencies | | | (221 | ) |
|
| |
Temporary book/tax differences | | | (266,220 | ) |
|
| |
Shares of beneficial interest | | | 1,645,476,096 | |
|
| |
Total net assets | | $ | 2,644,009,774 | |
|
| |
The difference between book-basis and tax-basis unrealized appreciation (depreciation) is due to differences in the timing of recognition of gains and losses on investments for tax and book purposes. The Fund’s net unrealized appreciation (depreciation) difference is attributable primarily to wash sales.
The temporary book/tax differences are a result of timing differences between book and tax recognition of income and/or expenses. The Fund’s temporary book/tax differences are the result of the trustee deferral of compensation and retirement plan benefits.
Capital loss carryforward is calculated and reported as of a specific date. Results of transactions and other activity after that date may affect the amount of capital loss carryforward actually available for the Fund to utilize. The ability to utilize capital loss carryforward in the future may be limited under the Internal Revenue Code and related regulations based on the results of future transactions.
The Fund does not have a capital loss carryforward as of October 31, 2023.
NOTE 8–Investment Transactions
The aggregate amount of investment securities (other than short-term securities, U.S. Government obligations and money market funds, if any) purchased and sold by the Fund during the year ended October 31, 2023 was $783,461,677 and $1,023,919,466, respectively. Cost of investments, including any derivatives, on a tax basis includes the adjustments for financial reporting purposes as of the most recently completed federal income tax reporting period-end.
| | | | |
Unrealized Appreciation (Depreciation) of Investments on a Tax Basis | |
Aggregate unrealized appreciation of investments | | | $872,342,202 | |
|
| |
Aggregate unrealized (depreciation) of investments | | | (64,998,990 | ) |
|
| |
Net unrealized appreciation of investments | | | $807,343,212 | |
|
| |
Cost of investments for tax purposes is $1,915,386,746.
NOTE 9–Reclassification of Permanent Differences
Primarily as a result of differing book/tax treatment of equalization, on October 31, 2023, undistributed net investment income was increased by $8,350, undistributed net realized gain was decreased by $16,273,351 and shares of beneficial interest was increased by $16,265,001. This reclassification had no effect on the net assets of the Fund.
NOTE 10–Share Information
| | | | | | | | | | | | | | | | |
| | | Summary of Share Activity | |
|
| |
| | |
| | | Year ended | | | Year ended | |
| | | October 31, 2023(a) | | | October 31, 2022 | |
| | | Shares | | | Amount | | | Shares | | | Amount | |
|
| |
Sold: | | | | | | | | | | | | | | | | |
Class A | | | 5,171,112 | | | $ | 116,345,046 | | | | 5,379,754 | | | $ | 126,763,812 | |
|
| |
Class C | | | 929,334 | | | | 16,469,101 | | | | 974,210 | | | | 18,438,619 | |
|
| |
Class R | | | 633,753 | | | | 14,092,207 | | | | 572,381 | | | | 13,255,010 | |
|
| |
Class Y | | | 1,468,507 | | | | 34,876,808 | | | | 1,929,786 | | | | 47,193,508 | |
|
| |
Class R6 | | | 405,246 | | | | 9,581,382 | | | | 257,534 | | | | 6,341,062 | |
|
| |
| | |
| 19 | | Invesco Rising Dividends Fund |
| | | | | | | | | | | | | | | | |
| | | Summary of Share Activity | |
|
| |
| | |
| | | Year ended | | | Year ended | |
| | | October 31, 2023(a) | | | October 31, 2022 | |
| | | Shares | | | Amount | | | Shares | | | Amount | |
|
| |
| | | | |
Issued as reinvestment of dividends: | | | | | | | | | | | | | | | | |
Class A | | | 5,348,271 | | | $ | 117,028,737 | | | | 10,983,287 | | | $ | 270,845,937 | |
|
| |
Class C | | | 476,089 | | | | 8,227,684 | | | | 1,295,270 | | | | 25,646,349 | |
|
| |
Class R | | | 266,029 | | | | 5,767,207 | | | | 536,890 | | | | 13,152,871 | |
|
| |
Class Y | | | 557,248 | | | | 12,795,225 | | | | 1,197,470 | | | | 30,869,636 | |
|
| |
Class R6 | | | 80,946 | | | | 1,853,944 | | | | 176,677 | | | | 4,538,725 | |
|
| |
| | | | |
Automatic conversion of Class C shares to Class A shares: | | | | | | | | | | | | | | | | |
Class A | | | 941,390 | | | | 20,938,467 | | | | 1,245,374 | | | | 28,819,568 | |
|
| |
Class C | | | (1,189,527 | ) | | | (20,938,467 | ) | | | (1,556,119 | ) | | | (28,819,568 | ) |
|
| |
| | | | |
Reacquired: | | | | | | | | | | | | | | | | |
Class A | | | (12,154,813 | ) | | | (272,828,608 | ) | | | (12,780,473 | ) | | | (299,074,808 | ) |
|
| |
Class C | | | (1,320,003 | ) | | | (23,440,126 | ) | | | (1,430,199 | ) | | | (26,562,259 | ) |
|
| |
Class R | | | (713,853 | ) | | | (15,942,640 | ) | | | (790,969 | ) | | | (18,455,528 | ) |
|
| |
Class Y | | | (2,395,802 | ) | | | (56,137,622 | ) | | | (2,099,613 | ) | | | (51,562,233 | ) |
|
| |
Class R6 | | | (331,246 | ) | | | (7,842,147 | ) | | | (318,950 | ) | | | (7,671,925 | ) |
|
| |
Net increase (decrease) in share activity | | | (1,827,319 | ) | | $ | (39,153,802 | ) | | | 5,572,310 | | | $ | 153,718,776 | |
|
| |
| (a) | There are entities that are record owners of more than 5% of the outstanding shares of the Fund and in the aggregate own 21% of the outstanding shares of the Fund. IDI has an agreement with these entities to sell Fund shares. The Fund, Invesco and/or Invesco affiliates may make payments to these entities, which are considered to be related to the Fund, for providing services to the Fund, Invesco and/or Invesco affiliates including but not limited to services such as securities brokerage, distribution, third party record keeping and account servicing. The Fund has no knowledge as to whether all or any portion of the shares owned of record by these entities are also owned beneficially. |
| | |
| 20 | | Invesco Rising Dividends Fund |
Report of Independent Registered Public Accounting Firm
To the Board of Trustees of AIM Equity Funds (Invesco Equity Funds) and Shareholders of Invesco Rising Dividends Fund
Opinion on the Financial Statements
We have audited the accompanying statement of assets and liabilities, including the schedule of investments, of Invesco Rising Dividends Fund (one of the funds constituting AIM Equity Funds (Invesco Equity Funds), referred to hereafter as the “Fund”) as of October 31, 2023, the related statement of operations for the year ended October 31, 2023, the statement of changes in net assets for each of the two years in the period ended October 31, 2023, including the related notes, and the financial highlights for each of the periods indicated therein (collectively referred to as the “financial statements”). In our opinion, the financial statements present fairly, in all material respects, the financial position of the Fund as of October 31, 2023, the results of its operations for the year then ended, the changes in its net assets for each of the two years in the period ended October 31, 2023 and the financial highlights for each of the periods indicated therein in conformity with accounting principles generally accepted in the United States of America.
Basis for Opinion
These financial statements are the responsibility of the Fund’s management. Our responsibility is to express an opinion on the Fund’s financial statements based on our audits. We are a public accounting firm registered with the Public Company Accounting Oversight Board (United States) (PCAOB) and are required to be independent with respect to the Fund in accordance with the U.S. federal securities laws and the applicable rules and regulations of the Securities and Exchange Commission and the PCAOB.
We conducted our audits of these financial statements in accordance with the standards of the PCAOB. Those standards require that we plan and perform the audit to obtain reasonable assurance about whether the financial statements are free of material misstatement, whether due to error or fraud.
Our audits included performing procedures to assess the risks of material misstatement of the financial statements, whether due to error or fraud, and performing procedures that respond to those risks. Such procedures included examining, on a test basis, evidence regarding the amounts and disclosures in the financial statements. Our audits also included evaluating the accounting principles used and significant estimates made by management, as well as evaluating the overall presentation of the financial statements. Our procedures included confirmation of securities owned as of October 31, 2023 by correspondence with the custodian, transfer agent and broker. We believe that our audits provide a reasonable basis for our opinion.
/s/ PricewaterhouseCoopers LLP
Houston, Texas
December 21, 2023
We have served as the auditor of one or more of the investment companies in the Invesco group of investment companies since at least 1995. We have not been able to determine the specific year we began serving as auditor.
| | |
| 21 | | Invesco Rising Dividends Fund |
Calculating your ongoing Fund expenses
Example
As a shareholder of the Fund, you incur two types of costs: (1) transaction costs, which may include sales charges (loads) on purchase payments or contingent deferred sales charges on redemptions, if any; and (2) ongoing costs, including management fees, distribution and/or service (12b-1) fees, and other Fund expenses. This example is intended to help you understand your ongoing costs (in dollars) of investing in the Fund and to compare these costs with ongoing costs of investing in other mutual funds. The example is based on an investment of $1,000 invested at the beginning of the period and held for the entire period May 1, 2023 through October 31, 2023.
Actual expenses
The table below provides information about actual account values and actual expenses. You may use the information in this table, together with the amount you invested, to estimate the expenses that you paid over the period. Simply divide your account value by $1,000 (for example, an $8,600 account value divided by $1,000 = 8.6), then multiply the result by the number in the table under the heading entitled “Actual Expenses Paid During Period” to estimate the expenses you paid on your account during this period.
Hypothetical example for comparison purposes
The table below also provides information about hypothetical account values and hypothetical expenses based on the Fund’s actual expense ratio and an assumed rate of return of 5% per year before expenses, which is not the Fund’s actual return.
The hypothetical account values and expenses may not be used to estimate the actual ending account balance or expenses you paid for the period. You may use this information to compare the ongoing costs of investing in the Fund and other funds. To do so, compare this 5% hypothetical example with the 5% hypothetical examples that appear in the shareholder reports of the other funds.
Please note that the expenses shown in the table are meant to highlight your ongoing costs only and do not reflect any transaction costs, such as sales charges (loads) on purchase payments or contingent deferred sales charges on redemptions, if any. Therefore, the hypothetical information is useful in comparing ongoing costs only, and will not help you determine the relative total costs of owning different funds. In addition, if these transaction costs were included, your costs would have been higher.
| | | | | | | | | | | | |
| | | | | ACTUAL | | HYPOTHETICAL (5% annual return before expenses) | | |
| | | Beginning
Account Value
(05/01/23) | | Ending
Account Value
(10/31/23)1 | | Expenses
Paid During
Period2 | | Ending
Account Value
(10/31/23) | | Expenses
Paid During
Period2 | | Annualized
Expense Ratio |
Class A | | $1,000.00 | | $984.00 | | $4.85 | | $1,020.32 | | $4.94 | | 0.97% |
Class C | | 1,000.00 | | 980.10 | | 8.58 | | 1,016.53 | | 8.74 | | 1.72 |
Class R | | 1,000.00 | | 982.60 | | 6.10 | | 1,019.06 | | 6.21 | | 1.22 |
Class Y | | 1,000.00 | | 984.90 | | 3.60 | | 1,021.58 | | 3.67 | | 0.72 |
Class R5 | | 1,000.00 | | 985.60 | | 3.25 | | 1,021.93 | | 3.31 | | 0.65 |
Class R6 | | 1,000.00 | | 985.20 | | 3.25 | | 1,021.93 | | 3.31 | | 0.65 |
| 1 | The actual ending account value is based on the actual total return of the Fund for the period May 1, 2023 through October 31, 2023, after actual expenses and will differ from the hypothetical ending account value which is based on the Fund’s expense ratio and a hypothetical annual return of 5% before expenses. |
| 2 | Expenses are equal to the Fund’s annualized expense ratio as indicated above multiplied by the average account value over the period, multiplied by 184/365 to reflect the most recent fiscal half year. |
| | |
| 22 | | Invesco Rising Dividends Fund |
Approval of Investment Advisory and Sub-Advisory Contracts
At meetings held on June 13, 2023, the Board of Trustees (the Board or the Trustees) of AIM Equity Funds (Invesco Equity Funds) as a whole, and the independent Trustees, who comprise over 75% of the Board, voting separately, approved the continuance of the Invesco Rising Dividends Fund’s (the Fund) Master Investment Advisory Agreement with Invesco Advisers, Inc. (Invesco Advisers and the investment advisory agreement) and the Master Intergroup Sub-Advisory Contract for Mutual Funds with Invesco Asset Management Deutschland GmbH, Invesco Asset Management Limited, Invesco Asset Management (Japan) Limited, Invesco Hong Kong Limited, Invesco Senior Secured Management, Inc. and Invesco Canada Ltd. and separate sub-advisory contracts with Invesco Capital Management LLC and Invesco Asset Management (India) Private Limited and OppenheimerFunds, Inc. (collectively, the Affiliated Sub-Advisers and the sub-advisory contracts) for another year, effective July 1, 2023. After evaluating the factors discussed below, among others, the Board approved the renewal of the Fund’s investment advisory agreement and the sub-advisory contracts and determined that the compensation payable thereunder by the Fund to Invesco Advisers and by Invesco Advisers to the Affiliated Sub-Advisers is fair and reasonable.
The Board’s Evaluation Process
The Board has established an Investments Committee, which in turn has established Sub-Committees, that meet throughout the year to review the performance of funds advised by Invesco Advisers (the Invesco Funds). The Sub-Committees meet regularly with portfolio managers for their assigned Invesco Funds and other members of management to review information about investment performance and portfolio attributes of these funds. The Board has established additional standing and ad hoc committees that meet regularly throughout the year to review matters within their purview, including a working group focused on opportunities to make ongoing and continuous improvements to the annual review process for the Invesco Funds’ investment advisory and sub-advisory contracts. The Board took into account evaluations and reports that it received from its committees and sub-committees, as well as the information provided to the Board and its committees and sub-committees throughout the year, in considering whether to approve each Invesco Fund’s investment advisory agreement and sub-advisory contracts.
As part of the contract renewal process, the Board reviews and considers information provided in response to requests for information submitted to management by the independent Trustees with assistance from legal counsel to the independent Trustees and the Senior Officer, an officer of the Invesco Funds who reports directly to the independent Trustees. The Board receives comparative investment performance and fee and expense data regarding the Invesco Funds prepared by Broadridge Financial Solutions, Inc. (Broadridge), an independent mutual fund data provider, as well as information on the composition of the peer groups provided by Broadridge and its methodology for determining peer groups. The Board also receives an independent written evaluation from the Senior
Officer. The Senior Officer’s evaluation is prepared as part of his responsibility to manage the process by which the Invesco Funds’ proposed management fees are negotiated during the annual contract renewal process to ensure they are negotiated in a manner that is at arms’ length and reasonable in accordance with certain negotiated regulatory requirements. In addition to meetings with Invesco Advisers and fund counsel throughout the year and as part of meetings convened on May 2, 2023 and June 13, 2023, the independent Trustees also discussed the continuance of the investment advisory agreement and sub-advisory contracts in separate sessions with the Senior Officer and with independent legal counsel. Also, as part of the contract renewal process, the independent Trustees reviewed and considered information provided in response to follow-up requests for information submitted by the independent Trustees to management. The independent Trustees met and discussed those follow-up responses with legal counsel to the independent Trustees and the Senior Officer.
The discussion below is a summary of the Senior Officer’s independent written evaluation with respect to the Fund’s investment advisory agreement and sub-advisory contracts, as well as a discussion of the material factors and related conclusions that formed the basis for the Board’s approval of the Fund’s investment advisory agreement and sub-advisory contracts. The Trustees’ review and conclusions are based on the comprehensive consideration of all information presented to them during the course of the year and in prior years and are not the result of any single determinative factor. Moreover, one Trustee may have weighed a particular piece of information or factor differently than another Trustee. The information received and considered by the Board was current as of various dates prior to the Board’s approval on June 13, 2023.
Factors and Conclusions and Summary of Independent Written Fee Evaluation
| A. | Nature, Extent and Quality of Services Provided by Invesco Advisers and the Affiliated Sub-Advisers |
The Board reviewed the nature, extent and quality of the advisory services provided to the Fund by Invesco Advisers under the Fund’s investment advisory agreement, and the credentials and experience of the officers and employees of Invesco Advisers who provide these services, including the Fund’s portfolio manager(s). The Board considered recent senior management changes at Invesco and Invesco Advisers, including the appointment of new Co-Heads of Investments, that had been presented to and discussed with the Board. The Board’s review included consideration of Invesco Advisers’ investment process and oversight, credit analysis, and research capabilities. The Board considered information regarding Invesco Advisers’ programs for and resources devoted to risk management, including management of investment, enterprise, operational, liquidity, derivatives, valuation and compliance risks, and technology used to manage such risks. The Board received information regarding Invesco’s methodology for compensating its investment professionals and the incentives and accountability it creates, as well as how it impacts Invesco’s ability to attract and retain talent. The Board received a
description of, and reports related to, Invesco Advisers’ global security program and business continuity plans and of its approach to data privacy and cybersecurity, including related testing. The Board also considered non-advisory services that Invesco Advisers and its affiliates provide to the Invesco Funds, such as various middle office and back office support functions, third party oversight, internal audit, valuation, portfolio trading and legal and compliance. The Board observed that Invesco Advisers’ systems preparedness and ongoing investment enabled Invesco Advisers to manage, operate and oversee the Invesco Funds with minimal impact or disruption through challenging environments. The Board reviewed and considered the benefits to shareholders of investing in a Fund that is part of the family of funds under the umbrella of Invesco Ltd., Invesco Advisers’ parent company, and noted Invesco Ltd.’s depth and experience in running an investment management business, as well as its commitment of financial and other resources to such business. The Board concluded that the nature, extent and quality of the services provided to the Fund by Invesco Advisers are appropriate and satisfactory.
The Board reviewed the services that may be provided to the Fund by the Affiliated Sub-Advisers under the sub-advisory contracts and the credentials and experience of the officers and employees of the Affiliated Sub-Advisers who provide these services. The Board noted the Affiliated Sub-Advisers’ expertise with respect to certain asset classes and that the Affiliated Sub-Advisers have offices and personnel that are located in financial centers around the world. As a result, the Board noted that the Affiliated Sub-Advisers can provide research and investment analysis on the markets and economies of various countries and territories in which the Fund may invest, make recommendations regarding securities and assist with portfolio trading. The Board concluded that the sub-advisory contracts may benefit the Fund and its shareholders by permitting Invesco Advisers to use the resources and talents of the Affiliated Sub-Advisers in managing the Fund. The Board concluded that the nature, extent and quality of the services that may be provided to the Fund by the Affiliated Sub-Advisers are appropriate and satisfactory.
| B. | Fund Investment Performance |
The Board considered Fund investment performance as a relevant factor in considering whether to approve the investment advisory agreement. The Board did not view Fund investment performance as a relevant factor in considering whether to approve the sub-advisory contracts for the Fund, as no Affiliated Sub-Adviser currently manages assets of the Fund.
The Board compared the Fund’s investment performance over multiple time periods ending December 31, 2022 to the performance of funds in the Broadridge performance universe and against the Russell 1000® Index (Index). The Board noted that performance of Class A shares of the Fund was in the first quintile of its performance universe for the one year period, the second quintile for the three year period and the third quintile for the five year period (the first quintile being the best performing funds and the fifth quintile being the worst performing funds). The Board noted that performance of Class A shares
| | |
| 23 | | Invesco Rising Dividends Fund |
of the Fund was above the performance of the Index for the one and three year periods and reasonably comparable to the performance of the Index for the five year periods. The Board considered that the Fund was created in connection with Invesco Ltd.’s acquisition of OppenheimerFunds, Inc. and its subsidiaries (the “Transaction”) and that the Fund’s performance prior to the closing of the Transaction on May 24, 2019 is that of its predecessor fund. The Board considered that the Fund underwent a change in portfolio management in February 2020. The Board recognized that the performance data reflects a snapshot in time as of a particular date and that selecting a different performance period could produce different results. The Board also reviewed more recent Fund performance as well as other performance metrics, which did not change its conclusions.
| C. | Advisory and Sub-Advisory Fees and Fund Expenses |
The Board compared the Fund’s contractual management fee rate to the contractual management fee rates of funds in the Fund’s Broadridge expense group. The Board noted that the contractual management fee rate for Class A shares of the Fund was the same as the median contractual management fee rate of funds in its expense group. The Board noted that the term “contractual management fee” for funds in the expense group may include both advisory and certain non-portfolio management administrative services fees, but that Broadridge is not able to provide information on a fund-by-fund basis as to what is included. The Board also reviewed the methodology used by Broadridge in calculating expense group information, which includes using each fund’s contractual management fee schedule (including any applicable breakpoints) as reported in the most recent prospectus or statement of additional information for each fund in the expense group. The Board also considered comparative information regarding the Fund’s total expense ratio and its various components.
The Board noted that Invesco Advisers has contractually agreed to waive fees and/or limit expenses of the Fund for the term disclosed in the Fund’s registration statement in an amount necessary to limit total annual operating expenses to a specified percentage of average daily net assets for each class of the Fund.
The Board noted that Invesco Advisers and the Affiliated Sub-Advisers do not manage other similarly managed mutual funds or client accounts.
The Board also considered the services that may be provided by the Affiliated Sub-Advisers pursuant to the sub-advisory contracts, as well as the fees payable by Invesco Advisers to the Affiliated Sub-Advisers pursuant to the sub-advisory contracts.
| D. | Economies of Scale and Breakpoints |
The Board considered the extent to which there may be economies of scale in the provision of advisory services to the Fund and the Invesco Funds, and the extent to which such economies of scale are shared with the Fund and the Invesco Funds. The Board acknowledged the difficulty in calculating and measuring economies of scale at the individual fund level; noting that only indicative and estimated measures are available at the individual fund level and that such measures are subject to uncertainty. The Board considered that the Fund benefits from economies of scale through contractual breakpoints in the Fund’s advisory fee schedule, which generally operate to reduce the Fund’s expense ratio as it
grows in size. The Board noted that the Fund also shares in economies of scale through Invesco Advisers’ ability to negotiate lower fee arrangements with third party service providers. The Board noted that the Fund may also benefit from economies of scale through initial fee setting, fee waivers and expense reimbursements, as well as Invesco Advisers’ investment in its business, including investments in business infrastructure, technology and cybersecurity.
| E. | Profitability and Financial Resources |
The Board reviewed information from Invesco Advisers concerning the costs of the advisory and other services that Invesco Advisers and its affiliates provide to the Fund and the Invesco Funds and the profitability of Invesco Advisers and its affiliates in providing these services in the aggregate and on an individual fund-by-fund basis. The Board considered the methodology used for calculating profitability and the periodic review and enhancement of such methodology. The Board noted that Invesco Advisers continues to operate at a net profit from services Invesco Advisers and its affiliates provide to the Invesco Funds in the aggregate and to most Invesco Funds individually. The Board considered that profits to Invesco Advisers can vary significantly depending on the particular Invesco Fund, with some Invesco Funds showing indicative losses to Invesco Advisers and others showing indicative profits at healthy levels, and that Invesco Advisers’ support for and commitment to an Invesco Fund are not, however, solely dependent on the profits realized as to that Fund. The Board did not deem the level of profits realized by Invesco Advisers and its affiliates from providing such services to be excessive, given the nature, extent and quality of the services provided. The Board noted that Invesco Advisers provided information demonstrating that Invesco Advisers is financially sound and has the resources necessary to perform its obligations under the investment advisory agreement, and provided representations indicating that the Affiliated Sub-Advisers are financially sound and have the resources necessary to perform their obligations under the sub-advisory contracts. The Board noted the cyclical and competitive nature of the global asset management industry.
| F. | Collateral Benefits to Invesco Advisers and its Affiliates |
The Board considered various other benefits received by Invesco Advisers and its affiliates from the relationship with the Fund, including the fees received for providing administrative, transfer agency and distribution services to the Fund. The Board received comparative information regarding fees charged for these services, including information provided by Broadridge and other independent sources. The Board reviewed the performance of Invesco Advisers and its affiliates in providing these services and the organizational structure employed to provide these services. The Board noted that these services are provided to the Fund pursuant to written contracts that are reviewed and subject to approval on an annual basis by the Board based on its determination that the services are required for the operation of the Fund.
The Board considered the benefits realized by Invesco Advisers and the Affiliated Sub-Advisers as a result of portfolio brokerage transactions executed through “soft dollar” arrangements. The Board noted that soft dollar arrangements may result in the Fund bearing costs to purchase research that may be used by Invesco Advisers or the Affiliated Sub-Advisers
with other clients and may reduce Invesco Advisers’ or the Affiliated Sub-Advisers’ expenses. The Board also considered that it receives from Invesco Advisers periodic reports that include a representation to the effect that these arrangements are consistent with regulatory requirements. The Board did not deem the soft dollar arrangements to be inappropriate.
The Board considered that the Fund’s uninvested cash and cash collateral from any securities lending arrangements may be invested in registered money market funds or, with regard to securities lending cash collateral, unregistered funds that comply with Rule 2a-7 (collectively referred to as “affiliated money market funds”) advised by Invesco Advisers. The Board considered information regarding the returns of the affiliated money market funds relative to comparable overnight investments, as well as the fees paid by the affiliated money market funds to Invesco Advisers and its affiliates. In this regard, the Board noted that Invesco Advisers receives advisory fees from these affiliated money market funds attributable to the Fund’s investments. The Board also noted that Invesco Advisers has contractually agreed to waive through varying periods an amount equal to 100% of the net advisory fee Invesco Advisers receives from the affiliated money market funds with respect to the Fund’s investment in the affiliated money market funds of uninvested cash, but not cash collateral. The Board concluded that the advisory fees payable to Invesco Advisers from the Fund’s investment of cash collateral from any securities lending arrangements in the affiliated money market funds are for services that are not duplicative of services provided by Invesco Advisers to the Fund.
The Board considered that Invesco Advisers may serve as the Fund’s affiliated securities lending agent and evaluated the benefits realized by Invesco Advisers when serving in such role, including the compensation received. The Board considered Invesco Advisers’ securities lending platform and corporate governance structure for securities lending, including Invesco Advisers’ Securities Lending Governance Committee and its related responsibilities. The Board noted that to the extent the Fund utilizes Invesco Advisers as an affiliated securities lending agent, the Fund conducts its securities lending in accordance with, and in reliance upon, no-action letters issued by the SEC staff that provide guidance on how an affiliate may act as a direct agent lender and receive compensation for those services without obtaining exemptive relief. The Board considered information provided by Invesco Advisers related to the performance of Invesco Advisers as securities lending agent, including a summary of the securities lending services provided to the Fund by Invesco Advisers and the compensation paid to Invesco Advisers for such services, as well as any revenues generated for the Fund in connection with such securities lending activity and the allocation of such revenue between the Fund and Invesco Advisers.
The Board also received information about commissions that an affiliated broker may receive for executing certain trades for the Fund. Invesco Advisers and the Affiliated Sub-Advisers advised the Board of the benefits to the Fund of executing trades through the affiliated broker and that such trades were executed in compliance with rules under the federal securities laws and consistent with best execution obligations.
| | |
| 24 | | Invesco Rising Dividends Fund |
Tax Information
Form 1099-DIV, Form 1042-S and other year–end tax information provide shareholders with actual calendar year amounts that should be included in their tax returns. Shareholders should consult their tax advisers.
The following distribution information is being provided as required by the Internal Revenue Code or to meet a specific state’s requirement.
The Fund designates the following amounts or, if subsequently determined to be different, the maximum amount allowable for its fiscal year ended October 31, 2023:
| | | | | | | | |
Federal and State Income Tax | | | | | | |
Long-Term Capital Gain Distributions | | | $144,722,439 | | | | | |
Qualified Dividend Income* | | | 100.00 | % | | | | |
Corporate Dividends Received Deduction* | | | 100.00 | % | | | | |
U.S. Treasury Obligations* | | | 0.00 | % | | | | |
Qualified Business Income* | | | 0.00 | % | | | | |
Business Interest Income* | | | 0.00 | % | | | | |
|
| * The above percentages are based on ordinary income dividends paid to shareholders during the Fund’s fiscal year. | |
| | |
| 25 | | Invesco Rising Dividends Fund |
Trustees and Officers
The address of each trustee and officer is AIM Equity Funds (Invesco Equity Funds) (the “Trust”), 11 Greenway Plaza, Houston, Texas 77046-1173. The trustees serve for the life of the Trust, subject to their earlier death, incapacitation, resignation, retirement or removal as more specifically provided in the Trust’s organizational documents. Each officer serves for a one year term or until their successors are elected and qualified. Column two below includes length of time served with predecessor entities, if any.
| | | | | | | | |
Name, Year of Birth and Position(s) Held with the Trust | | Trustee and/or Officer Since | | Principal Occupation(s) During Past 5 Years | | Number of Funds in Fund Complex Overseen by Trustee | | Other Directorship(s) Held by Trustee During Past 5 Years |
| Interested Trustee | | | | | | | | |
Martin L. Flanagan1 - 1960 Trustee and Vice Chair | | 2007 | | Chairman Emeritus, Invesco Ltd.; Trustee and Vice Chair, The Invesco Funds; and Member of Executive Board, SMU Cox School of Business Formerly: Executive Director, Chief Executive Officer and President, Invesco Ltd. (ultimate parent of Invesco and a global investment management firm); Vice Chair, Investment Company Institute; Advisor to the Board, Invesco Advisers, Inc. (formerly known as Invesco Institutional (N.A.), Inc.); Chairman and Chief Executive Officer, Invesco Advisers, Inc. (registered investment adviser); Director, Chairman, Chief Executive Officer and President, Invesco Holding Company Limited (parent of Invesco and a global investment management firm); Director, Invesco Ltd.; Chairman, Investment Company Institute and President, Co-Chief Executive Officer, Co-President, Chief Operating Officer and Chief Financial Officer, Franklin Resources, Inc. (global investment management organization) | | 169 | | None |
| 1 | Mr. Flanagan is considered an interested person (within the meaning of Section 2(a)(19) of the 1940 Act) of the Trust because he is an officer of the Adviser to the Trust, and an officer and a director of Invesco Ltd., ultimate parent of the Adviser. |
| | |
| T-1 | | Invesco Rising Dividends Fund |
Trustees and Officers–(continued)
| | | | | | | | |
Name, Year of Birth and Position(s) Held with the Trust | | Trustee and/or Officer Since | | Principal Occupation(s) During Past 5 Years | | Number of Funds in Fund Complex Overseen by Trustee | | Other Directorship(s) Held by Trustee During Past 5 Years |
| Independent Trustees | | | | | | | | |
Beth Ann Brown - 1968 Trustee (2019) and Chair (August 2022) | | 2019 | | Independent Consultant Formerly: Head of Intermediary Distribution, Managing Director, Strategic Relations, Managing Director, Head of National Accounts, Senior Vice President, National Account Manager and Senior Vice President, Key Account Manager, Columbia Management Investment Advisers LLC; Vice President, Key Account Manager, Liberty Funds Distributor, Inc.; and Trustee of certain Oppenheimer Funds | | 169 | | Director, Board of Directors of Caron Engineering Inc.; Advisor, Board of Advisors of Caron Engineering Inc.; President and Director, Acton Shapleigh Youth Conservation Corps (non-profit) Formerly: President and Director Director of Grahamtastic Connection (non-profit) |
Cynthia Hostetler - 1962 Trustee | | 2017 | | Non-Executive Director and Trustee of a number of public and private business corporations Formerly: Director, Aberdeen Investment Funds (4 portfolios); Director, Artio Global Investment LLC (mutual fund complex); Director, Edgen Group, Inc. (specialized energy and infrastructure products distributor); Director, Genesee & Wyoming, Inc. (railroads); Head of Investment Funds and Private Equity, Overseas Private Investment Corporation; President, First Manhattan Bancorporation, Inc.; and Attorney, Simpson Thacher & Bartlett LLP | | 169 | | Resideo Technologies, Inc. (smart home technology); Vulcan Materials Company (construction materials company); Trilinc Global Impact Fund; Textainer Group Holdings, (shipping container leasing company); Investment Company Institute (professional organization); and Independent Directors Council (professional organization) |
Eli Jones - 1961 Trustee | | 2016 | | Professor and Dean Emeritus, Mays Business School - Texas A&M University Formerly: Dean of Mays Business School-Texas A&M University; Professor and Dean, Walton College of Business, University of Arkansas and E.J. Ourso College of Business, Louisiana State University; and Director, Arvest Bank | | 169 | | Insperity, Inc. (formerly known as Administaff) (human resources provider); Board Member of the regional board, First Financial Bank Texas; and Boad Member, First Financial Bankshares, Inc. Texas |
Elizabeth Krentzman - 1959 Trustee | | 2019 | | Formerly: Principal and Chief Regulatory Advisor for Asset Management Services and U.S. Mutual Fund Leader of Deloitte & Touche LLP; General Counsel of the Investment Company Institute (trade association); National Director of the Investment Management Regulatory Consulting Practice, Principal, Director and Senior Manager of Deloitte & Touche LLP; Assistant Director of the Division of Investment Management - Office of Disclosure and Investment Adviser Regulation of the U.S. Securities and Exchange Commission and various positions with the Division of Investment Management - Office of Regulatory Policy of the U.S. Securities and Exchange Commission; Associate at Ropes & Gray LLP; and Trustee of certain Oppenheimer Funds | | 169 | | Formerly: Member of the Cartica Funds Board of Directors (private investment fund); Trustee of the University of Florida National Board Foundation; and Member of the University of Florida Law Center Association, Inc. Board of Trustees, Audit Committee and Membership Committee |
Anthony J. LaCava, Jr. - 1956 Trustee | | 2019 | | Formerly: Director and Member of the Audit Committee, Blue Hills Bank (publicly traded financial institution) and Managing Partner, KPMG LLP | | 169 | | Blue Hills Bank; Member and Chairman, Bentley University, Business School Advisory Council; and Nominating Committee, KPMG LLP |
Prema Mathai-Davis - 1950 Trustee | | 1998 | | Retired Formerly: Co-Founder & Partner of Quantalytics Research, LLC, (a FinTech Investment Research Platform for the Self-Directed Investor); Trustee of YWCA Retirement Fund; CEO of YWCA of the USA; Board member of the NY Metropolitan Transportation Authority; Commissioner of the NYC Department of Aging; and Board member of Johns Hopkins Bioethics Institute | | 169 | | Member of Board of Positive Planet US (non-profit) and HealthCare Chaplaincy Network (non-profit) |
| | |
| T-2 | | Invesco Rising Dividends Fund |
Trustees and Officers–(continued)
| | | | | | | | |
Name, Year of Birth and Position(s) Held with the Trust | | Trustee and/or Officer Since | | Principal Occupation(s) During Past 5 Years | | Number of Funds in Fund Complex Overseen by Trustee | | Other Directorship(s) Held by Trustee During Past 5 Years |
| Independent Trustees–(continued) | | | | | | |
Joel W. Motley - 1952 Trustee | | 2019 | | Director of Office of Finance, Federal Home Loan Bank System; Managing Director of Carmona Motley Inc. (privately held financial advisor); Member of the Council on Foreign Relations and its Finance and Budget Committee; Chairman Emeritus of Board of Human Rights Watch and Member of its Investment Committee; and Member of Investment Committee Board of Historic Hudson Valley (non-profit cultural organization); Member of the Board, Blue Ocean Acquisition Corp.; and Member of the Vestry and the Investment Committee of Trinity Church Wall Street. Formerly: Managing Director of Public Capital Advisors, LLC (privately held financial advisor); Managing Director of Carmona Motley Hoffman, Inc. (privately held financial advisor); Trustee of certain Oppenheimer Funds; and Director of Columbia Equity Financial Corp. (privately held financial advisor) | | 169 | | Member of Board of Trust for Mutual Understanding (non-profit promoting the arts and environment); Member of Board of Greenwall Foundation (bioethics research foundation) and its Investment Committee; Member of Board of Friends of the LRC (non-profit legal advocacy); and Board Member and Investment Committee Member of Pulitzer Center for Crisis Reporting (non-profit journalism) |
Teresa M. Ressel - 1962 Trustee | | 2017 | | Non-executive director and trustee of a number of public and private business corporations Formerly: Chief Executive Officer, UBS Securities LLC (investment banking); Chief Operating Officer, UBS AG Americas (investment banking); Sr. Management Team Olayan America, The Olayan Group (international investor/commercial/industrial); and Assistant Secretary for Management & Budget and Designated Chief Financial Officer, U.S. Department of Treasury | | 169 | | None |
Robert C. Troccoli - 1949 Trustee | | 2016 | | Retired Formerly: Adjunct Professor, University of Denver - Daniels College of Business; and Managing Partner, KPMG LLP | | 169 | | None |
Daniel S. Vandivort - 1954 Trustee | | 2019 | | President, Flyway Advisory Services LLC (consulting and property management) Formerly: President and Chief Investment Officer, previously Head of Fixed Income, Weiss Peck and Greer/Robeco Investment Management; Trustee and Chair, Weiss Peck and Greer Funds Board; and various capacities at CS First Boston including Head of Fixed Income at First Boston Asset Management. | | 169 | | Formerly: Trustee and Governance Chair, Oppenheimer Funds; Treasurer, Chairman of the Audit and Finance Committee, Huntington Disease Foundation of America |
| | |
| T-3 | | Invesco Rising Dividends Fund |
Trustees and Officers–(continued)
| | | | | | | | |
Name, Year of Birth and
Position(s) Held with the Trust | | Trustee and/or Officer Since | | Principal Occupation(s) During Past 5 Years | | Number of Funds in Fund Complex Overseen by Trustee | | Other Directorship(s) Held by Trustee During Past 5 Years |
| Officers | | | | | | | | |
Glenn Brightman - 1972 President and Principal Executive Officer | | 2023 | | Chief Operating Officer, Americas, Invesco Ltd.; President and Principal Executive Officer, The Invesco Funds. Formerly: Global Head of Finance, Invesco Ltd; Executive Vice President and Chief Financial Officer, Nuveen | | N/A | | N/A |
Melanie Ringold - 1975 Senior Vice President, Chief Legal Officer and Secretary | | 2023 | | Head of Legal of the Americas, Invesco Ltd.; Senior Vice President and Secretary, Invesco Advisers, Inc. (formerly known as Invesco Institutional (N.A.), Inc.) (registered investment adviser); Secretary, Invesco Distributors, Inc. (formerly known as Invesco AIM Distributors, Inc.); Secretary, Invesco Investment Services, Inc. (formerly known as Invesco AIM Investment Services, Inc.); Senior Vice President, Chief Legal Officer and Secretary, The Invesco Funds; Secretary, Invesco Investment Advisers LLC, Invesco Capital Markets, Inc.; Chief Legal Officer, Invesco Exchange-Traded Fund Trust, Invesco Exchange-Traded Fund Trust II, Invesco India Exchange-Traded Fund Trust, Invesco Actively Managed Exchange-Traded Fund Trust, Invesco Actively Secretary and Vice President, Harbourview Asset Management Corporation; Secretary and Senior Vice President, OppenheimerFunds, Inc. and Invesco Managed Accounts, LLC; Secretary and Senior Vice President, OFI SteelPath, Inc.; Secretary and Senior Vice President, Oppenheimer Acquisition Corp.; Secretary, SteelPath Funds Remediation LLC; and Secretary and Senior Vice President, Trinity Investment Management Corporation Formerly: Assistant Secretary, Invesco Distributors, Inc., Invesco Advisers, Inc., Invesco Investment Services, Inc., Invesco Capital Markets, Inc., Invesco Capital Management LLC and Invesco Investment Advisers LLC; and Assistant Secretary and Investment Vice President, Invesco Funds | | N/A | | N/A |
Andrew R. Schlossberg - 1974 Senior Vice President | | 2019 | | Chief Executive Officer, President and Executive Director, Invesco Ltd.; Senior Vice President, Invesco Group Services, Inc.; Director and Senior Vice President, Invesco Advisers, Inc. (formerly known as Invesco Institutional (N.A.), Inc.) (registered investment adviser); Director and Chairman, Invesco Investment Services, Inc. (formerly known as Invesco AIM Investment Services, Inc.) (registered transfer agent); Senior Vice President, The Invesco Funds and Trustee, Invesco Foundation, Inc. Formerly: Head of the Americas and Senior Managing Director, Invesco Ltd.; Director, Invesco Investment Advisers LLC (formerly known as Van Kampen Asset Management); Director, President and Chairman, Invesco Insurance Agency, Inc.; Director, Invesco UK Limited; Director and Chief Executive, Invesco Asset Management Limited and Invesco Fund Managers Limited; Assistant Vice President, The Invesco Funds; Senior Vice President, Invesco Advisers, Inc. (formerly known as Invesco Institutional (N.A.), Inc.) (registered investment adviser); Director and Chief Executive, Invesco Administration Services Limited and Invesco Global Investment Funds Limited; Director, Invesco Distributors, Inc.; Head of EMEA, Invesco Ltd.; President, Invesco Actively Managed Exchange-Traded Commodity Fund Trust, Invesco Actively Managed Exchange-Traded Fund Trust, Invesco Exchange-Traded Fund Trust, Invesco Exchange-Traded Fund Trust II and Invesco India Exchange-Traded Fund Trust; and Managing Director and Principal Executive Officer, Invesco Capital Management LLC | | N/A | | N/A |
| | |
| T-4 | | Invesco Rising Dividends Fund |
Trustees and Officers–(continued)
| | | | | | | | |
Name, Year of Birth and
Position(s) Held with the Trust | | Trustee and/or Officer Since | | Principal Occupation(s) During Past 5 Years | | Number of Funds in Fund Complex Overseen by Trustee | | Other Directorship(s) Held by Trustee During Past 5 Years |
| Officers–(continued) | | | | | | | | |
John M. Zerr - 1962 Senior Vice President | | 2006 | | Chief Operating Officer of the Americas; Senior Vice President, Invesco Advisers, Inc. (formerly known as Invesco Institutional (N.A.), Inc.) (registered investment adviser); Senior Vice President, Invesco Distributors, Inc. (formerly known as Invesco AIM Distributors, Inc.); Director and Vice President, Invesco Investment Services, Inc. (formerly known as Invesco AIM Investment Services, Inc.) Senior Vice President, The Invesco Funds; Managing Director, Invesco Capital Management LLC; Senior Vice President, Invesco Capital Markets, Inc. (formerly known as Van Kampen Funds Inc.); Manager, Invesco Indexing LLC; Manager, Invesco Specialized Products, LLC; Member, Invesco Canada Funds Advisory Board; Director, President and Chief Executive Officer, Invesco Corporate Class Inc. (corporate mutual fund company); Director, Chairman, President and Chief Executive Officer, Invesco Canada Ltd. (formerly known as Invesco Trimark Ltd./Invesco Trimark Ltèe) (registered investment adviser and registered transfer agent); President, Invesco, Inc.; President, Invesco Global Direct Real Estate Feeder GP Ltd.; President, Invesco IP Holdings (Canada) Ltd; President, Invesco Global Direct Real Estate GP Ltd.; President, Invesco Financial Services Ltd. / Services Financiers Invesco Ltée; and Director and Chairman, Invesco Trust Company Formerly: Director, Invesco Investment Advisers LLC (formerly known as Van Kampen Asset Management); President, Trimark Investments Ltd/Services Financiers Invesco Ltee; Director and Senior Vice President, Invesco Insurance Agency, Inc.; Director and Senior Vice President, Invesco Management Group, Inc. (formerly known as Invesco AIM Management Group, Inc.); Secretary and General Counsel, Invesco Management Group, Inc. (formerly known as Invesco AIM Management Group, Inc.); Secretary, Invesco Investment Services, Inc. (formerly known as Invesco AIM Investment Services, Inc.); Chief Legal Officer and Secretary, The Invesco Funds; Secretary and General Counsel, Invesco Investment Advisers LLC (formerly known as Van Kampen Asset Management); Secretary and General Counsel, Invesco Capital Markets, Inc. (formerly known as Van Kampen Funds Inc.); Chief Legal Officer, Invesco Exchange-Traded Fund Trust, Invesco Exchange-Traded Fund Trust II, Invesco India Exchange-Traded Fund Trust, Invesco Actively Managed Exchange-Traded Fund Trust, Invesco Actively Managed Exchange-Traded Commodity Fund Trust and Invesco Exchange-Traded Self-Indexed Fund Trust; Secretary, Invesco Indexing LLC; Director, Secretary, General Counsel and Senior Vice President, Van Kampen Exchange Corp.; Director, Vice President and Secretary, IVZ Distributors, Inc. (formerly known as INVESCO Distributors, Inc.); Director and Vice President, INVESCO Funds Group, Inc.; Director and Vice President, Van Kampen Advisors Inc.; Director, Vice President, Secretary and General Counsel, Van Kampen Investor Services Inc.; Director and Secretary, Invesco Distributors, Inc. (formerly known as Invesco AIM Distributors, Inc.); Director, Senior Vice President, General Counsel and Secretary, Invesco AIM Advisers, Inc. and Van Kampen Investments Inc.; Director, Vice President and Secretary, Fund Management Company; Director, Senior Vice President, Secretary, General Counsel and Vice President, Invesco AIM Capital Management, Inc.; and Chief Operating Officer and General Counsel, Liberty Ridge Capital, Inc. (an investment adviser) | | N/A | | N/A |
Tony Wong - 1973 Senior Vice President | | 2023 | | Senior Managing Director, Invesco Ltd.; Director, Chairman, Chief Executive Officer and President, Invesco Advisers, Inc.; Director and Chairman, Invesco Private Capital, Inc., INVESCO Private Capital Investments, Inc. and INVESCO Realty, Inc.; Director, Invesco Senior Secured Management, Inc.; President, Invesco Managed Accounts, LLC and SNW Asset Management Corporation; and Senior Vice President, The Invesco Funds Formerly: Assistant Vice President, The Invesco Funds; and Vice President, Invesco Advisers, Inc. | | N/A | | N/A |
Stephanie C. Butcher - 1971 Senior Vice President | | 2023 | | Senior Managing Director, Invesco Ltd.; Senior Vice President, The Invesco Funds; Director and Chief Executive Officer, Invesco Asset Management Limited | | N/A | | N/A |
Adrien Deberghes - 1967 Principal Financial Officer, Treasurer and Senior Vice President | | 2020 | | Head of the Fund Office of the CFO and Fund Administration; Vice President, Invesco Advisers, Inc.; Principal Financial Officer, Treasurer and Senior Vice President, The Invesco Funds; Vice President, Invesco Exchange-Traded Fund Trust, Invesco Exchange-Traded Fund Trust II, Invesco India Exchange-Traded Fund Trust, Invesco Actively Managed Exchange-Traded Fund Trust, Invesco Actively Managed Exchange-Traded Commodity Fund Trust and Invesco Exchange-Traded Self-Indexed Fund Trust Formerly: Vice President, The Invesco Funds; Senior Vice President and Treasurer, Fidelity Investments | | N/A | | N/A |
Crissie M. Wisdom - 1969 Anti-Money Laundering Compliance Officer | | 2013 | | Anti-Money Laundering and OFAC Compliance Officer for Invesco U.S. entities including: Invesco Advisers, Inc. and its affiliates, Invesco Capital Markets, Inc., Invesco Distributors, Inc., Invesco Investment Services, Inc., The Invesco Funds, Invesco Capital Management, LLC, Invesco Trust Company; and Fraud Prevention Manager for Invesco Investment Services, Inc. | | N/A | | N/A |
| | |
| T-5 | | Invesco Rising Dividends Fund |
Trustees and Officers–(continued)
| | | | | | | | |
Name, Year of Birth and
Position(s) Held with the Trust | | Trustee and/or Officer Since | | Principal Occupation(s) During Past 5 Years | | Number of Funds in Fund Complex Overseen by Trustee | | Other Directorship(s) Held by Trustee During Past 5 Years |
| Officers—(continued) | | | | | | | | |
Todd F. Kuehl - 1969 Chief Compliance Officer and Senior Vice President | | 2020 | | Chief Compliance Officer, Invesco Advisers, Inc. (registered investment adviser); and Chief Compliance Officer and Senior Vice President, The Invesco Funds Formerly: Managing Director and Chief Compliance Officer, Legg Mason (Mutual Funds); Chief Compliance Officer, Legg Mason Private Portfolio Group (registered investment adviser) | | N/A | | N/A |
| James Bordewick, Jr. - 1959 Senior Vice President and Senior Officer | | 2022 | | Senior Vice President and Senior Officer, The Invesco Funds Formerly: Chief Legal Officer, KingsCrowd, Inc. (research and analytical platform for investment in private capital markets); Chief Operating Officer and Head of Legal and Regulatory, Netcapital (private capital investment platform); Managing Director, General Counsel of asset management and Chief Compliance Officer for asset management and private banking, Bank of America Corporation; Chief Legal Officer, Columbia Funds and BofA Funds; Senior Vice President and Associate General Counsel, MFS Investment Management; Chief Legal Officer, MFS Funds; Associate, Ropes & Gray; and Associate, Gaston Snow & Ely Bartlett | | N/A | | N/A |
The Statement of Additional Information of the Trust includes additional information about the Fund’s Trustees and is available upon request, without charge, by calling 1.800.959.4246. Please refer to the Fund’s Statement of Additional Information for information on the Fund’s sub-advisers.
| | | | | | |
| Office of the Fund | | Investment Adviser | | Distributor | | Auditors |
| 11 Greenway Plaza | | Invesco Advisers, Inc. | | Invesco Distributors, Inc. | | PricewaterhouseCoopers LLP |
| Houston, TX 77046-1173 | | 1331 Spring Street, NW, Suite 2500 | | 11 Greenway Plaza | | 1000 Louisiana Street, Suite 5800 |
| | Atlanta, GA 30309 | | Houston, TX 77046-1173 | | Houston, TX 77002-5021 |
| | | |
| Counsel to the Fund | | Counsel to the Independent Trustees | | Transfer Agent | | Custodian |
| Stradley Ronon Stevens & Young, LLP | | Sidley Austin LLP | | Invesco Investment Services, Inc. | | State Street Bank and Trust Company |
| 2005 Market Street, Suite 2600 | | 787 Seventh Avenue | | 11 Greenway Plaza | | 225 Franklin Street |
| Philadelphia, PA 19103-7018 | | New York, NY 10019 | | Houston, TX 77046-1173 | | Boston, MA 02110-2801 |
| | |
| T-6 | | Invesco Rising Dividends Fund |

Go paperless with eDelivery
Visit invesco.com/edelivery to enjoy the convenience and security of anytime electronic access to your investment documents.
With eDelivery, you can elect to have any or all of the following materials delivered straight to your inbox to download, save and print from your own computer:
∎ Fund reports and prospectuses
∎ Quarterly statements
∎ Daily confirmations
∎ Tax forms
Invesco mailing information
Send general correspondence to Invesco Investment Services, Inc., P.O. Box 219078, Kansas City, MO 64121-9078.
Important notice regarding delivery of security holder documents
To reduce Fund expenses, only one copy of most shareholder documents may be mailed to shareholders with multiple accounts at the same address (Householding). Mailing of your shareholder documents may be householded indefinitely unless you instruct us otherwise. If you do not want the mailing of these documents to be combined with those for other members of your household, please contact Invesco Investment Services, Inc. at 800 959 4246 or contact your financial institution. We will begin sending you individual copies for each account within 30 days after receiving your request.
Fund holdings and proxy voting information
The Fund provides a complete list of its portfolio holdings four times each year, at the end of each fiscal quarter. For the second and fourth quarters, the list appears, respectively, in the Fund’s semiannual and annual reports to shareholders. For the first and third quarters, the Fund files the list with the Securities and Exchange Commission (SEC) as an exhibit to its reports on Form N-PORT. The most recent list of portfolio holdings is available at invesco.com/completeqtrholdings. Shareholders can also look up the Fund’s Form N-PORT filings on the SEC website, sec.gov. The SEC file numbers for the Fund are shown below.
A description of the policies and procedures that the Fund uses to determine how to vote proxies relating to portfolio securities is available without charge, upon request, from our Client Services department at 800 959 4246, or at invesco.com/corporate/about-us/esg. The information is also available on the SEC website, sec.gov.
Information regarding how the Fund voted proxies related to its portfolio securities during the most recent 12-month period ended June 30 is available at invesco.com/proxysearch. This information is also available on the SEC website, sec.gov.
Invesco Advisers, Inc. is an investment adviser; it provides investment advisory services to individual and institutional clients and does not sell securities. Invesco Distributors, Inc. is the US distributor for Invesco Ltd.’s retail mutual funds, exchange-traded funds and institutional money market funds. Both are wholly owned, indirect subsidiaries of Invesco Ltd.
| | | | |
| SEC file number(s): 811-01424 and 002-25469 | | Invesco Distributors, Inc. | | O-RISD-AR-1 |

| | |
| | |
| Annual Report to Shareholders | | October 31, 2023 |
Invesco Summit Fund
Nasdaq:
A: ASMMX ∎ C: CSMMX ∎ P: SMMIX ∎ S: SMMSX ∎ Y: ASMYX ∎ R5: SMITX ∎ R6: SMISX
Management’s Discussion of Fund Performance
| | | | |
| | |
Performance summary | | | | |
For the fiscal year ended October 31, 2023, Class A shares of Invesco Summit Fund (the Fund), at net asset value (NAV), underperformed the Russell 1000 Growth Index, the Fund’s style-specific benchmark. | |
Your Fund’s long-term performance appears later in this report. | | | | |
| | |
Fund vs. Indexes | | | | |
Total returns, 10/31/22 to 10/31/23, at net asset value (NAV). Performance shown does not include applicable contingent deferred sales charges (CDSC) or front-end sales charges, which would have reduced performance. | |
Class A Shares | | | 13.19 | % |
Class C Shares | | | 12.41 | |
Class P Shares | | | 13.40 | |
Class S Shares | | | 13.32 | |
Class Y Shares | | | 13.50 | |
Class R5 Shares | | | 13.48 | |
Class R6 Shares | | | 13.54 | |
S&P 500 Index▼ (Broad Market Index) | | | 10.14 | |
Russell 1000 Growth Index▼ (Style-Specific Index) | | | 18.95 | |
Lipper Multi-Cap Growth Funds Index∎ (Peer Group Index) | | | 9.87 | |
| |
Source(s): ▼RIMES Technologies Corp.; ∎Lipper Inc. | | | | |
Market conditions and your Fund
At the start of the fiscal year, US equity markets rebounded, despite mixed data on the economy and corporate earnings. However, the US Federal Reserve’s (the Fed’s) message that rate hikes would continue until data showed inflation meaningfully declining, sent markets lower in December 2022. As energy prices declined, the rate of inflation slowed modestly in the fourth quarter of 2022. Corporate earnings generally met expectations, though companies provided cautious future guidance. With inflation still at multi-decade highs and little evidence of a slowing economy, the Fed raised its target rate by 0.75% in November and by 0.50% in December.1
US equities managed to deliver gains in the first quarter of 2023 despite significant volatility and a banking crisis. A January rally gave way to a February selloff as higher-than-expected inflation, a tight labor market and solid economic growth indicated that the Fed’s monetary policy would remain tight for the foreseeable future, raising the risk of a deeper than expected recession. In March, the failure of two US regional banks, Silicon Valley Bank and Signature Bank, prompted steep losses in the banking sector. The subsequent takeover of Credit Suisse and ongoing fear that bank troubles would spread sent investors to safe-haven assets, sparking a bond rally, particularly among securities at the short end of the yield curve. With instability in the banking sector, the Fed raised the federal funds rate by only 0.25% in February 2023 and again in March.1 The Fed’s actions to stabilize the banking system in March sent markets higher, so equities were surprisingly resilient despite the turmoil.
The US economy and equity markets remained resilient in the second quarter of
2023, as milder inflation data and better-than-expected corporate earnings supported equities, with most major indexes posting gains for the quarter and with some big tech names providing optimistic future guidance. Following the March banking crisis, markets stabilized in April, as corporate earnings season got underway, with many companies surprising consensus earnings and revenue estimates. Facing persistently strong employment data, the Fed raised the federal funds rate by 0.25% at its May meeting,1 but left rates unchanged at its June meeting, giving investors the long-awaited “pause” in rate hikes, which sent equities broadly higher.
Equity markets declined in the third quarter and into October 2023 as a resilient US economy complicated the Fed’s efforts to tame inflation. While inflation has slowed from its peak, the Consumer Price Index (CPI) rose by 0.2% in July, and the 12-month headline inflation rate rose to 3.2% from 3% in June.2 Due to the persistence of inflation, the Fed raised the federal funds rate again in July by 0.25%. The CPI data released in September was higher-than-expected and the overall US labor market remained tight with unemployment near historic lows. At the same time, wages rose and consumers continued to spend, pushing the third quarter year-over-year Gross Domestic Product (GDP) to 4.9%, far above expectations.2 Despite the higher-than-expected GDP for the third quarter of 2023, the Fed held interest rates steady at its September and October meetings, but left open the possibility of another rate hike before the end of the calendar year.1
Despite higher rates and increased market volatility, US stocks for the fiscal year had positive returns of 10.69%, as measured by the S&P 500 Index.3
In this environment, the Fund delivered a double-digit positive return for the fiscal year, while trailing its style specific benchmark, the Russell 1000 Growth Index. Large-cap companies significantly outperformed small-and mid-cap stocks resulting in more modest relative returns for the Fund given its small-and mid-cap exposure. The leading detractors from relative results included stock selection in the health care, information technology (IT), financials and industrials sectors. An overweight allocation in the health care and financials sectors combined with an underweight allocation in the IT sector also weighed on relative results during the fiscal year. Strong performance in the communication services sector and an overweight contributed to absolute returns, however the Fund’s relative stock selection lagged in comparison to this strongest performing sector of the benchmark. An intentional underweight to the consumer staples sector was the leading relative contributor to fiscal year-end results as the sector ended the fiscal year with a negative return. Stock selection in the energy and real estate sectors were also top contributors during the fiscal year and benefited from increasing oil and gas prices as well as rising real estate costs.
The top individual detractors from an absolute perspective during the fiscal year included SVB Financial, Farfetch and DexCom.
A small position in SVB Financial was initiated at the beginning of the fiscal year because it was one of the few banks with a tangible growth trajectory given its focus on venture-backed technology startups. Its strong liquidity position also provided confidence that it could withstand a slowing economy. However, management spooked the market and customers with a poorly timed, poorly communicated and unnecessary attempt to raise capital to boost earnings. We began selling the position as the probability of a run on the bank increased.
Farfetch is a leading online aggregator of luxury goods that experienced unforeseen regulatory issues following the launch of its long-term strategic partnership with Reebok, which led management to reduce its forward looking guidance as a result. Though we like the company and the industry long-term, Farfetch has committed too many execution issues for the Fund to continue to hold given current equity market dynamics and was sold during the fiscal year.
Companies that manufacture glucose monitoring devices such as DexCom are being impacted by new GLP-1 drugs that improve blood sugar for type 2 diabetes patients. While these drugs are shown to delay the onset of diabetes, they do not prevent diabetes implying that investor fears surrounding the impact of GLP-1 drugs may be overstated. Nevertheless, negative investor sentiment resulted in the decline of DexCom’s share price during the fiscal year.
Top individual contributors on an absolute basis during the fiscal year included NVIDIA, Microsoft and Amazon.com.
Semiconductor darling, NVIDIA exhibited strong fundamental growth during the fiscal year and generative artificial intelligence (AI) excitement boosted sentiment and drove upward revisions to estimates. NVIDIA also reported record revenue on its financial results during the fiscal year that significantly exceeded expectations signaling the rise of a “new computing era” in the race to expand generative AI capabilities and use cases.
Microsoft benefited from a general rotation toward stable earnings profiles, particularly mega-cap growth, given slowing inflation and tightening financial conditions. Microsoft has also undertaken significant cost cutting measures to improve efficiency and profitability. Lastly, the software company has significant exposure to AI, a key momentum driver amid the generative AI hype.
Amazon.com shares rallied early in the fiscal year riding broader tailwinds among tech stocks as investor sentiment turned more bullish amid growing evidence that inflation had peaked allowing the Fed to reduce the pace of interest rate hikes. Amazon.com also made a few announcements that supported its strong performance including measures to reign in labor costs, expanding its “Buy with Prime” program to third party retailers, and “RxPass”, which is a pharmacy benefit allowing customers to get generic medications delivered at home for a flat monthly fee. Financial results were also positive during the fiscal year with revenue growth topping consensus estimates, which included improved performance from every segment. While the online retail giant noted that its cloud computing segment, AWS experienced slowing growth, recent data suggest trends have stabilized as AI products begin to offset reduced customer spending.
At the close of the fiscal year, the largest overweight sector exposures included industrials, communication services and financials. IT is the largest underweight, primarily due to significant index exposure in Apple and Microsoft, which is more than 12% in each name at the end of the fiscal year. Fund allocations to the consumer discretionary and health care sectors were also underweight relative to the index.
The economy, the consumer and capital spending have remained resilient despite higher interest rates. Higher interest rates, however, create a greater likelihood we will enter a slowdown in 2024, as their effects tend to set in on a lag. To position for such a slowdown, we reduced cyclical exposure in the Fund. We have also reduced higher volatility stocks in favor of higher quality companies with secular-driven growth prospects. A slowing economy should favor companies with resilient secular growth, as well as those focused on cost efficiencies to deliver earnings stability, in our view.
Longer term, we believe that change is the fuel for growth, thus we generally seek “share-takers”, companies that can gain market
share through technology-enabled advantages in their business models and with offerings that benefit from the continued disruptive shifts in enterprise and consumer behavior.
Thank you for your commitment to the Invesco Summit Fund and for sharing our long-term investment horizon.
1 Source: US Federal Reserve
2 Source: US Bureau of Labor Statistics
3 Source: Lipper Inc.
Portfolio manager(s):
Ido Cohen
Ronald Zibelli
The views and opinions expressed in management’s discussion of Fund performance are those of Invesco Advisers, Inc. and its affiliates. These views and opinions are subject to change at any time based on factors such as market and economic conditions. These views and opinions may not be relied upon as investment advice or recommendations, or as an offer for a particular security. The information is not a complete analysis of every aspect of any market, country, industry, security or the Fund. Statements of fact are from sources considered reliable, but Invesco Advisers, Inc. makes no representation or warranty as to their completeness or accuracy. Although historical performance is no guarantee of future results, these insights may help you understand our investment management philosophy.
See important Fund and, if applicable, index disclosures later in this report.
Your Fund’s Long-Term Performance
Results of a $10,000 Investment – Oldest Share Class(es)
Fund and index data from 10/31/13
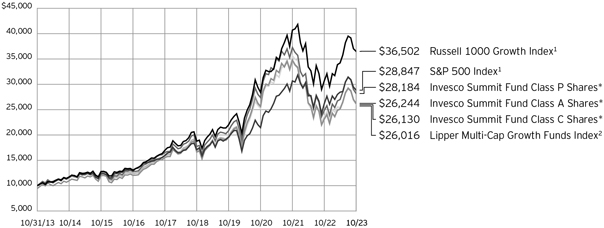
| 1 | Source: RIMES Technologies Corp. |
| * | The Fund’s oldest share class (Class P) does not have a sales charge; therefore, the second-oldest share classes with a sales charge (Class A and Class C) are also included in the chart. |
Past performance cannot guarantee future results.
The data shown in the chart include reinvested distributions, applicable sales charges and Fund expenses including management
fees. Index results include reinvested dividends, but they do not reflect sales charges. Performance of the peer group, if applicable, reflects fund expenses and management fees;
performance of a market index does not. Performance shown in the chart does not reflect deduction of taxes a shareholder would pay on Fund distributions or sale of Fund shares.
| | | | |
| |
Average Annual Total Returns | |
As of 10/31/23, including maximum applicable sales charges | |
| |
Class A Shares | | | | |
Inception (10/31/05) | | | 8.33 | % |
10 Years | | | 10.13 | |
5 Years | | | 8.31 | |
1 Year | | | 6.95 | |
| |
Class C Shares | | | | |
Inception (10/31/05) | | | 8.30 | % |
10 Years | | | 10.08 | |
5 Years | | | 8.72 | |
1 Year | | | 11.41 | |
| |
Class P Shares | | | | |
Inception (11/1/82) | | | 9.52 | % |
10 Years | | | 10.92 | |
5 Years | | | 9.72 | |
1 Year | | | 13.40 | |
| |
Class S Shares | | | | |
Inception (9/25/09) | | | 11.82 | % |
10 Years | | | 10.86 | |
5 Years | | | 9.66 | |
1 Year | | | 13.32 | |
| |
Class Y Shares | | | | |
Inception (10/3/08) | | | 10.78 | % |
10 Years | | | 11.02 | |
5 Years | | | 9.81 | |
1 Year | | | 13.50 | |
| |
Class R5 Shares | | | | |
Inception (10/3/08) | | | 10.85 | % |
10 Years | | | 11.05 | |
5 Years | | | 9.79 | |
1 Year | | | 13.48 | |
| |
Class R6 Shares | | | | |
10 Years | | | 10.96 | % |
5 Years | | | 9.87 | |
1 Year | | | 13.54 | |
Class R6 shares incepted on April 4, 2017. Performance shown prior to that date is that of Class A shares at net asset value and includes the 12b-1 fees applicable to Class A shares.
The performance data quoted represent past performance and cannot guarantee future results; current performance may be lower or higher. Please visit invesco.com/performance for the most recent month-end performance. Performance figures reflect reinvested distributions, changes in net asset value and the effect of the maximum sales charge unless otherwise stated. Performance figures do not reflect deduction of taxes a shareholder would pay on Fund distributions or sale of Fund shares. Investment return and principal value will fluctuate so that you may have a gain or loss when you sell shares.
Class A share performance reflects the maximum 5.50% sales charge, and Class C share performance reflects the applicable contingent deferred sales charge (CDSC) for the period involved. The CDSC on Class C shares is 1% for the first year after purchase. Class P, Class S, Class Y,
Class R5 and Class R6 shares do not have a front-end sales charge or contingent deferred sales charge (CDSC); therefore, returns shown are at net asset value.
The performance numbers shown do not reflect the creation and sales charges and other fees assessed by the AIM Summit Investors Plans, which were dissolved effective December 8, 2006.
The performance of the Fund’s share classes will differ primarily due to different sales charge structures and class expenses.
Fund performance reflects any applicable fee waivers and/or expense reimbursements. Had the adviser not waived fees and/or reimbursed expenses currently or in the past, returns would have been lower. See current prospectus for more information.
Supplemental Information
Invesco Summit Fund’s investment objective is long-term growth of capital.
| ∎ | Unless otherwise stated, information presented in this report is as of October 31, 2023, and is based on total net assets. |
| ∎ | Unless otherwise noted, all data is provided by Invesco. |
| ∎ | To access your Fund’s reports/prospectus, visit invesco.com/fundreports. |
About indexes used in this report
| ∎ | The S&P 500® Index is an unmanaged index considered representative of the US stock market. |
| ∎ | The Russell 1000® Growth Index is an unmanaged index considered representative of large-cap growth stocks. The Russell 1000 Growth Index is a trademark/service mark of the Frank Russell Co. Russell® is a trademark of the Frank Russell Co. |
| ∎ | The Lipper Multi-Cap Growth Funds Index is an unmanaged index considered representative of multi-cap growth funds tracked by Lipper. |
| ∎ | The Fund is not managed to track the performance of any particular index, including the index(es) described here, and consequently, the performance of the Fund may deviate significantly from the performance of the index(es). |
| ∎ | A direct investment cannot be made in an index. Unless otherwise indicated, index results include reinvested dividends, and they do not reflect sales charges. Performance of the peer group, if applicable, reflects fund expenses; performance of a market index does not. |
|
|
This report must be accompanied or preceded by a currently effective Fund prospectus, which contains more complete information, including sales charges and expenses. Investors should read it carefully before investing. |
|
| NOT FDIC INSURED | MAY LOSE VALUE | NO BANK GUARANTEE |
Fund Information
| | | | | |
| Portfolio Composition | | | | | |
| |
| By sector | | % of total net assets |
| |
Information Technology | | | | 38.38 | % |
| |
Communication Services | | | | 14.19 | |
| |
Consumer Discretionary | | | | 11.76 | |
| |
Health Care | | | | 9.20 | |
| |
Financials | | | | 9.00 | |
| |
Industrials | | | | 8.70 | |
| |
Consumer Staples | | | | 2.65 | |
| |
Energy | | | | 2.42 | |
| |
Real Estate | | | | 2.01 | |
| |
Materials | | | | 0.71 | |
| |
Money Market Funds Plus Other Assets Less Liabilities | | | | 0.98 | |
| | | | | | | |
Top 10 Equity Holdings* | | | | | |
| | | | | % of total net assets |
| | |
1. | | Microsoft Corp. | | | | 10.33 | % |
| | |
2. | | Amazon.com, Inc. | | | | 6.55 | |
| | |
3. | | NVIDIA Corp. | | | | 6.23 | |
| | |
4. | | Alphabet, Inc., Class C | | | | 6.01 | |
| | |
5. | | Apple, Inc. | | | | 5.44 | |
| | |
6. | | Mastercard, Inc., Class A | | | | 4.14 | |
| | |
7. | | Meta Platforms, Inc., Class A | | | | 3.24 | |
| | |
8. | | Adobe, Inc. | | | | 2.44 | |
| | |
9. | | EPR Properties | | | | 2.01 | |
| | |
10. | | ServiceNow, Inc. | | | | 1.81 | |
The Fund’s holdings are subject to change, and there is no assurance that the Fund will continue to hold any particular security.
| * | Excluding money market fund holdings, if any. |
Data presented here are as of October 31, 2023.
Schedule of Investments(a)
October 31, 2023
| | | | | | | | |
| | | Shares | | | Value | |
|
| |
Common Stocks & Other Equity Interests–99.02% | |
Advertising–1.03% | |
Trade Desk, Inc. (The), Class A(b) | | | 373,757 | | | $ | 26,521,797 | |
|
| |
|
Aerospace & Defense–0.64% | |
Airbus SE (France) | | | 122,850 | | | | 16,432,171 | |
|
| |
|
Agricultural & Farm Machinery–0.36% | |
Deere & Co. | | | 25,668 | | | | 9,378,060 | |
|
| |
|
Aluminum–0.11% | |
Alcoa Corp. | | | 107,100 | | | | 2,746,044 | |
|
| |
|
Apparel Retail–0.03% | |
MYT Netherlands Parent B.V., ADR (Germany)(b) | | | 276,429 | | | | 804,408 | |
|
| |
|
Application Software–6.90% | |
Adobe, Inc.(b) | | | 118,260 | | | | 62,921,415 | |
|
| |
Confluent, Inc., Class A(b)(c) | | | 372,600 | | | | 10,771,866 | |
|
| |
HubSpot, Inc.(b) | | | 53,280 | | | | 22,578,466 | |
|
| |
Procore Technologies, Inc.(b)(c) | | | 160,200 | | | | 9,786,618 | |
|
| |
Synopsys, Inc.(b) | | | 90,540 | | | | 42,503,098 | |
|
| |
Workday, Inc., Class A(b) | | | 138,075 | | | | 29,231,858 | |
|
| |
| | | | | | | 177,793,321 | |
|
| |
|
Asset Management & Custody Banks–2.09% | |
Blackstone, Inc., Class A | | | 244,800 | | | | 22,607,280 | |
|
| |
KKR & Co., Inc., Class A | | | 566,900 | | | | 31,406,260 | |
|
| |
| | | | | | | 54,013,540 | |
|
| |
|
Automobile Manufacturers–0.27% | |
Tesla, Inc.(b) | | | 34,560 | | | | 6,941,030 | |
|
| |
|
Automotive Parts & Equipment–0.72% | |
Autoliv, Inc. (Sweden)(c) | | | 201,600 | | | | 18,476,640 | |
|
| |
|
Automotive Retail–0.48% | |
AutoZone, Inc.(b) | | | 4,950 | | | | 12,261,794 | |
|
| |
|
Broadline Retail–7.50% | |
Amazon.com, Inc.(b) | | | 1,267,650 | | | | 168,711,538 | |
|
| |
MercadoLibre, Inc. (Brazil)(b) | | | 19,890 | | | | 24,678,319 | |
|
| |
| | | | | | | 193,389,857 | |
|
| |
|
Construction Machinery & Heavy Transportation Equipment– 0.32% | |
Caterpillar, Inc. | | | 36,000 | | | | 8,137,800 | |
|
| |
|
Construction Materials–0.60% | |
Vulcan Materials Co. | | | 78,300 | | | | 15,385,167 | |
|
| |
|
Consumer Electronics–0.51% | |
Sony Group Corp. (Japan) | | | 158,400 | | | | 13,109,789 | |
|
| |
|
Consumer Staples Merchandise Retail–0.81% | |
Walmart, Inc. | | | 127,800 | | | | 20,883,798 | |
|
| |
|
Diversified Support Services–0.49% | |
Cintas Corp. | | | 24,885 | | | | 12,619,681 | |
|
| |
|
Electrical Components & Equipment–2.98% | |
AMETEK, Inc. | | | 139,320 | | | | 19,612,076 | |
|
| |
| | | | | | | | |
| | | Shares | | | Value | |
|
| |
Electrical Components & Equipment–(continued) | |
Eaton Corp. PLC | | | 96,300 | | | $ | 20,021,733 | |
|
| |
Rockwell Automation, Inc. | | | 44,550 | | | | 11,708,186 | |
|
| |
Vertiv Holdings Co. | | | 649,800 | | | | 25,517,646 | |
|
| |
| | | | | | | 76,859,641 | |
|
| |
|
Environmental & Facilities Services–1.21% | |
Clean Harbors, Inc.(b)(c) | | | 149,760 | | | | 23,013,619 | |
|
| |
Waste Connections, Inc. | | | 62,730 | | | | 8,123,535 | |
|
| |
| | | | | | | 31,137,154 | |
|
| |
|
Financial Exchanges & Data–2.07% | |
Intercontinental Exchange, Inc. | | | 179,894 | | | | 19,327,811 | |
|
| |
Moody’s Corp. | | | 110,160 | | | | 33,929,280 | |
|
| |
| | | | | | | 53,257,091 | |
|
| |
|
Food Retail–0.58% | |
HelloFresh SE (Germany)(b)(c) | | | 686,700 | | | | 14,911,984 | |
|
| |
|
Health Care Distributors–1.66% | |
McKesson Corp. | | | 94,050 | | | | 42,826,608 | |
|
| |
|
Health Care Equipment–2.05% | |
Boston Scientific Corp.(b) | | | 449,100 | | | | 22,989,429 | |
|
| |
Intuitive Surgical, Inc.(b) | | | 114,390 | | | | 29,995,346 | |
|
| |
| | | | | | | 52,984,775 | |
|
| |
|
Health Care Facilities–0.31% | |
Surgery Partners, Inc.(b)(c) | | | 351,000 | | | | 8,118,630 | |
|
| |
|
Health Care Technology–1.61% | |
Veeva Systems, Inc., Class A(b) | | | 215,100 | | | | 41,451,921 | |
|
| |
|
Home Improvement Retail–0.66% | |
Lowe’s Cos., Inc. | | | 89,990 | | | | 17,149,394 | |
|
| |
|
Hotels, Resorts & Cruise Lines–1.12% | |
Booking Holdings, Inc.(b) | | | 10,359 | | | | 28,897,052 | |
|
| |
|
Industrial Machinery & Supplies & Components–0.73% | |
Parker-Hannifin Corp. | | | 51,210 | | | | 18,891,881 | |
|
| |
|
Integrated Oil & Gas–0.35% | |
Suncor Energy, Inc. (Canada) | | | 280,800 | | | | 9,093,729 | |
|
| |
|
Interactive Home Entertainment–1.89% | |
Nintendo Co. Ltd. (Japan) | | | 322,200 | | | | 13,339,474 | |
|
| |
Sea Ltd., ADR (Singapore)(b)(c) | | | 173,150 | | | | 7,220,355 | |
|
| |
Take-Two Interactive Software, Inc.(b) | | | 211,080 | | | | 28,231,950 | |
|
| |
| | | | | | | 48,791,779 | |
|
| |
|
Interactive Media & Services–9.28% | |
Alphabet, Inc., Class A(b) | | | 8,280 | | | | 1,027,382 | |
|
| |
Alphabet, Inc., Class C(b) | | | 1,235,160 | | | | 154,765,548 | |
|
| |
Meta Platforms, Inc., Class A(b) | | | 277,380 | | | | 83,566,273 | |
|
| |
| | | | | | | 239,359,203 | |
|
| |
|
Internet Services & Infrastructure–1.60% | |
MongoDB, Inc.(b) | | | 93,680 | | | | 32,281,191 | |
|
| |
Snowflake, Inc., Class A(b) | | | 61,920 | | | | 8,986,450 | |
|
| |
| | | | | | | 41,267,641 | |
|
| |
See accompanying Notes to Financial Statements which are an integral part of the financial statements.
| | | | | | | | |
| | | Shares | | | Value | |
|
| |
IT Consulting & Other Services–0.26% | |
Globant S.A.(b) | | | 38,700 | | | $ | 6,590,223 | |
|
| |
|
Leisure Facilities–0.47% | |
Life Time Group Holdings, Inc.(b)(c) | | | 1,026,265 | | | | 12,130,452 | |
|
| |
|
Managed Health Care–0.80% | |
UnitedHealth Group, Inc. | | | 38,700 | | | | 20,726,172 | |
|
| |
|
Movies & Entertainment–1.99% | |
IMAX Corp.(b) | | | 397,800 | | | | 7,243,938 | |
Netflix, Inc.(b) | | | 107,010 | | | | 44,054,947 | |
|
| |
| | | | | | | 51,298,885 | |
|
| |
|
Oil & Gas Equipment & Services–1.26% | |
TechnipFMC PLC (United Kingdom) | | | 1,505,900 | | | | 32,406,968 | |
|
| |
|
Oil & Gas Exploration & Production–0.81% | |
Hess Corp. | | | 144,000 | | | | 20,793,600 | |
|
| |
|
Other Specialized REITs–2.01% | |
EPR Properties | | | 1,215,000 | | | | 51,880,500 | |
|
| |
|
Packaged Foods & Meats–0.35% | |
Lamb Weston Holdings, Inc. | | | 99,270 | | | | 8,914,446 | |
|
| |
|
Passenger Ground Transportation–1.14% | |
Uber Technologies, Inc.(b) | | | 678,600 | | | | 29,369,808 | |
|
| |
|
Pharmaceuticals–2.77% | |
Bayer AG (Germany) | | | 349,380 | | | | 15,014,512 | |
Eli Lilly and Co. | | | 70,110 | | | | 38,836,032 | |
Novo Nordisk A/S, ADR (Denmark) | | | 181,200 | | | | 17,498,484 | |
|
| |
| | | | | | | 71,349,028 | |
|
| |
|
Semiconductor Materials & Equipment–0.78% | |
ASML Holding N.V., New York Shares | | | | | | | | |
(Netherlands) | | | 10,295 | | | | 6,164,749 | |
Entegris, Inc. | | | 158,040 | | | | 13,913,842 | |
|
| |
| | | | | | | 20,078,591 | |
|
| |
|
Semiconductors–8.43% | |
Advanced Micro Devices, Inc.(b) | | | 127,980 | | | | 12,606,030 | |
Broadcom, Inc. | | | 13,500 | | | | 11,358,495 | |
First Solar, Inc.(b) | | | 86,550 | | | | 12,329,047 | |
Monolithic Power Systems, Inc. | | | 46,440 | | | | 20,514,406 | |
NVIDIA Corp. | | | 393,570 | | | | 160,497,846 | |
|
| |
| | | | | | | 217,305,824 | |
|
| |
|
Soft Drinks & Non-alcoholic Beverages–0.91% | |
Monster Beverage Corp.(b) | | | 459,900 | | | | 23,500,890 | |
|
| |
| | | | | | | | |
| | | Shares | | | Value | |
|
| |
Systems Software–14.97% | |
Gitlab, Inc., Class A(b) | | | 232,200 | | | $ | 10,049,616 | |
Microsoft Corp. | | | 787,860 | | | | 266,383,345 | |
Oracle Corp. | | | 338,040 | | | | 34,953,336 | |
Palo Alto Networks, Inc.(b) | | | 115,740 | | | | 28,127,135 | |
ServiceNow, Inc.(b) | | | 79,893 | | | | 46,485,742 | |
|
| |
| | | | | | | 385,999,174 | |
|
| |
|
Technology Hardware, Storage & Peripherals–5.44% | |
Apple, Inc. | | | 821,473 | | | | 140,282,944 | |
|
| |
|
Trading Companies & Distributors–0.83% | |
Fastenal Co. | | | 192,600 | | | | 11,236,284 | |
United Rentals, Inc.(c) | | | 25,110 | | | | 10,201,440 | |
|
| |
| | | | | | | 21,437,724 | |
|
| |
|
Transaction & Payment Processing Services–4.84% | |
Mastercard, Inc., Class A | | | 283,806 | | | | 106,810,388 | |
StoneCo Ltd., Class A (Brazil)(b)(c) | | | 1,812,600 | | | | 17,971,929 | |
|
| |
| | | | | | | 124,782,317 | |
|
| |
Total Common Stocks & Other Equity Interests
(Cost $1,554,653,656) | | | | 2,552,740,926 | |
|
| |
|
Money Market Funds–0.76% | |
Invesco Government & Agency Portfolio, Institutional Class, 5.27%(d)(e) | | | 6,889,486 | | | | 6,889,486 | |
Invesco Liquid Assets Portfolio, Institutional Class, 5.40%(d)(e) | | | 4,978,382 | | | | 4,979,875 | |
Invesco Treasury Portfolio, Institutional Class, 5.27%(d)(e) | | | 7,873,698 | | | | 7,873,698 | |
|
| |
Total Money Market Funds
(Cost $19,742,727) | | | | 19,743,059 | |
|
| |
TOTAL INVESTMENTS IN SECURITIES
(excluding investments purchased with cash collateral from securities on loan)-99.78%
(Cost $1,574,396,383) | | | | 2,572,483,985 | |
|
| |
|
Investments Purchased with Cash Collateral from Securities on Loan | |
Money Market Funds–1.69% | |
Invesco Private Government Fund, 5.32%(d)(e)(f) | | | 12,120,822 | | | | 12,120,822 | |
Invesco Private Prime Fund, 5.53%(d)(e)(f) | | | 31,352,500 | | | | 31,355,635 | |
|
| |
Total Investments Purchased with Cash Collateral from Securities on Loan
(Cost $43,476,457) | | | | 43,476,457 | |
|
| |
TOTAL INVESTMENTS IN SECURITIES–101.47%
(Cost $1,617,872,840) | | | | 2,615,960,442 | |
|
| |
OTHER ASSETS LESS LIABILITIES–(1.47)% | | | | (37,846,300 | ) |
|
| |
NET ASSETS–100.00% | | | | | | $ | 2,578,114,142 | |
|
| |
Investment Abbreviations:
ADR – American Depositary Receipt
REIT – Real Estate Investment Trust
See accompanying Notes to Financial Statements which are an integral part of the financial statements.
Notes to Schedule of Investments:
| (a) | Industry and/or sector classifications used in this report are generally according to the Global Industry Classification Standard, which was developed by and is the exclusive property and a service mark of MSCI Inc. and Standard & Poor’s. |
| (b) | Non-income producing security. |
| (c) | All or a portion of this security was out on loan at October 31, 2023. |
| (d) | Affiliated holding. Affiliated holdings are investments in entities which are under common ownership or control of Invesco Ltd. or are investments in entities in which the Fund owns 5% or more of the outstanding voting securities. The table below shows the Fund’s transactions in, and earnings from, its investments in affiliates for the fiscal year ended October 31, 2023. |
| | | | | | | | | | | | | | | | | | | | | | | | | | | | |
| | | Value
October 31, 2022 | | Purchases at Cost | | Proceeds from Sales | | Change in Unrealized Appreciation (Depreciation) | | Realized Gain (Loss) | | Value
October 31, 2023 | | Dividend Income |
| Investments in Affiliated Money Market Funds: | | | | | | | | | | | | | | | | | | | | | | | | | | | | |
Invesco Government & Agency Portfolio, Institutional Class | | $ | 10,299,580 | | | $ | 139,153,200 | | | $ | (142,563,294 | ) | | $ | - | | | $ | - | | | $ | 6,889,486 | | | $ | 248,688 | |
Invesco Liquid Assets Portfolio, Institutional Class | | | 7,417,590 | | | | 99,395,142 | | | | (101,830,924 | ) | | | (1,250) | | | | (683) | | | | 4,979,875 | | | | 186,330 | |
Invesco Treasury Portfolio, Institutional Class | | | 11,770,948 | | | | 159,032,228 | | | | (162,929,478 | ) | | | - | | | | - | | | | 7,873,698 | | | | 283,901 | |
| Investments Purchased with Cash Collateral from Securities on Loan: | | | | | | | | | | | | | | | | | | | | | | | | | | | | |
Invesco Private Government Fund | | | 29,567,684 | | | | 406,000,995 | | | | (423,447,857 | ) | | | - | | | | - | | | | 12,120,822 | | | | 1,250,331* | |
Invesco Private Prime Fund | | | 84,109,480 | | | | 881,965,097 | | | | (934,720,298 | ) | | | (310) | | | | 1,666 | | | | 31,355,635 | | | | 3,365,185* | |
Total | | $ | 143,165,282 | | | $ | 1,685,546,662 | | | $ | (1,765,491,851 | ) | | $ | (1,560) | | | $ | 983 | | | $ | 63,219,516 | | | $ | 5,334,435 | |
| | * | Represents the income earned on the investment of cash collateral, which is included in securities lending income on the Statement of Operations. Does not include rebates and fees paid to lending agent or premiums received from borrowers, if any. |
| (e) | The rate shown is the 7-day SEC standardized yield as of October 31, 2023. |
| (f) | The security has been segregated to satisfy the commitment to return the cash collateral received in securities lending transactions upon the borrower’s return of the securities loaned. See Note 1J. |
See accompanying Notes to Financial Statements which are an integral part of the financial statements.
Statement of Assets and Liabilities
October 31, 2023
| | | | |
Assets: | | | | |
Investments in unaffiliated securities, at value
(Cost $1,554,653,656)* | | $ | 2,552,740,926 | |
|
| |
Investments in affiliated money market funds, at value (Cost $63,219,184) | | | 63,219,516 | |
|
| |
Foreign currencies, at value (Cost $124,369) | | | 127,874 | |
|
| |
Receivable for: | | | | |
Investments sold | | | 36,324,977 | |
|
| |
Fund shares sold | | | 142,607 | |
|
| |
Dividends | | | 1,532,581 | |
|
| |
Investment for trustee deferred compensation and retirement plans | | | 265,971 | |
|
| |
Other assets | | | 82,382 | |
|
| |
Total assets | | | 2,654,436,834 | |
|
| |
| |
Liabilities: | | | | |
Payable for: | | | | |
Investments purchased | | | 31,187,566 | |
|
| |
Fund shares reacquired | | | 690,625 | |
|
| |
Collateral upon return of securities loaned | | | 43,476,457 | |
|
| |
Accrued fees to affiliates | | | 599,984 | |
|
| |
Accrued trustees’ and officers’ fees and benefits | | | 4,911 | |
|
| |
Accrued other operating expenses | | | 71,547 | |
|
| |
Trustee deferred compensation and retirement plans | | | 291,602 | |
|
| |
Total liabilities | | | 76,322,692 | |
|
| |
Net assets applicable to shares outstanding | | $ | 2,578,114,142 | |
|
| |
| |
Net assets consist of: | | | | |
Shares of beneficial interest | | $ | 1,773,507,934 | |
|
| |
Distributable earnings | | | 804,606,208 | |
|
| |
| | $ | 2,578,114,142 | |
|
| |
| | | | |
Net Assets: | | | | |
Class A | | $ | 328,711,406 | |
|
| |
Class C | | $ | 19,675,563 | |
|
| |
Class P | | $ | 2,189,443,130 | |
|
| |
Class S | | $ | 3,647,112 | |
|
| |
Class Y | | $ | 22,986,253 | |
|
| |
Class R5 | | $ | 7,462 | |
|
| |
Class R6 | | $ | 13,643,216 | |
|
| |
|
Shares outstanding, no par value, with an unlimited number of shares authorized: | |
| |
Class A | | | 17,466,438 | |
|
| |
Class C | | | 1,320,798 | |
|
| |
Class P | | | 112,357,137 | |
|
| |
Class S | | | 190,295 | |
|
| |
Class Y | | | 1,177,335 | |
|
| |
Class R5 | | | 380 | |
|
| |
Class R6 | | | 691,404 | |
|
| |
Class A: | | | | |
Net asset value per share | | $ | 18.82 | |
|
| |
Maximum offering price per share
(Net asset value of $18.82 ÷ 94.50%) | | $ | 19.92 | |
|
| |
Class C: | | | | |
Net asset value and offering price per share | | $ | 14.90 | |
|
| |
Class P: | | | | |
Net asset value and offering price per share | | $ | 19.49 | |
|
| |
Class S: | | | | |
Net asset value and offering price per share | | $ | 19.17 | |
|
| |
Class Y: | | | | |
Net asset value and offering price per share | | $ | 19.52 | |
|
| |
Class R5: | | | | |
Net asset value and offering price per share | | $ | 19.64 | |
|
| |
Class R6: | | | | |
Net asset value and offering price per share | | $ | 19.73 | |
|
| |
| * | At October 31, 2023, securities with an aggregate value of $43,173,907 were on loan to brokers. |
See accompanying Notes to Financial Statements which are an integral part of the financial statements.
Statement of Operations
For the year ended October 31, 2023
| | | | |
Investment income: | | | | |
Dividends (net of foreign withholding taxes of $543,024) | | $ | 18,276,968 | |
|
| |
Dividends from affiliated money market funds (includes net securities lending income of $241,220) | | | 960,139 | |
|
| |
Foreign withholding tax claims | | | 20,587 | |
|
| |
Total investment income | | | 19,257,694 | |
|
| |
| |
Expenses: | | | | |
Advisory fees | | | 16,433,752 | |
|
| |
Administrative services fees | | | 367,274 | |
|
| |
Custodian fees | | | 37,635 | |
|
| |
Distribution fees: | | | | |
Class A | | | 791,974 | |
|
| |
Class C | | | 183,532 | |
|
| |
Class P | | | 2,217,863 | |
|
| |
Class S | | | 5,732 | |
|
| |
Transfer agent fees – A, C, P, S and Y | | | 2,025,982 | |
|
| |
Transfer agent fees – R5 | | | 269 | |
|
| |
Transfer agent fees – R6 | | | 4,263 | |
|
| |
Trustees’ and officers’ fees and benefits | | | 42,597 | |
|
| |
Registration and filing fees | | | 199,929 | |
|
| |
Reports to shareholders | | | 125,603 | |
|
| |
Professional services fees | | | 92,213 | |
|
| |
Other | | | 42,403 | |
|
| |
Total expenses | | | 22,571,021 | |
|
| |
Less: Fees waived and/or expense offset arrangement(s) | | | (91,856 | ) |
|
| |
Net expenses | | | 22,479,165 | |
|
| |
Net investment income (loss) | | | (3,221,471 | ) |
|
| |
| |
Realized and unrealized gain (loss) from: | | | | |
Net realized gain (loss) from: | | | | |
Unaffiliated investment securities | | | (126,110,947 | ) |
|
| |
Affiliated investment securities | | | 983 | |
|
| |
Foreign currencies | | | (86,960 | ) |
|
| |
| | | (126,196,924 | ) |
|
| |
Change in net unrealized appreciation (depreciation) of: | | | | |
Unaffiliated investment securities | | | 445,725,857 | |
|
| |
Affiliated investment securities | | | (1,560 | ) |
|
| |
Foreign currencies | | | 31,797 | |
|
| |
| | | 445,756,094 | |
|
| |
Net realized and unrealized gain | | | 319,559,170 | |
|
| |
Net increase in net assets resulting from operations | | $ | 316,337,699 | |
|
| |
See accompanying Notes to Financial Statements which are an integral part of the financial statements.
Statement of Changes in Net Assets
For the years ended October 31, 2023 and 2022
| | | | | | | | |
| | | 2023 | | | 2022 | |
|
| |
Operations: | | | | | | | | |
Net investment income (loss) | | $ | (3,221,471 | ) | | $ | (506,283 | ) |
|
| |
Net realized gain (loss) | | | (126,196,924 | ) | | | 168,087,354 | |
|
| |
Change in net unrealized appreciation (depreciation) | | | 445,756,094 | | | | (1,458,266,190 | ) |
|
| |
Net increase (decrease) in net assets resulting from operations | | | 316,337,699 | | | | (1,290,685,119 | ) |
|
| |
| | |
Distributions to shareholders from distributable earnings: | | | | | | | | |
Class A | | | (26,019,917 | ) | | | (78,272,021 | ) |
|
| |
Class C | | | (1,757,107 | ) | | | (5,900,518 | ) |
|
| |
Class P | | | (181,531,713 | ) | | | (532,643,508 | ) |
|
| |
Class S | | | (320,005 | ) | | | (908,447 | ) |
|
| |
Class Y | | | (1,941,154 | ) | | | (13,495,999 | ) |
|
| |
Class R5 | | | (69,840 | ) | | | (286,940 | ) |
|
| |
Class R6 | | | (1,199,760 | ) | | | (3,733,745 | ) |
|
| |
Total distributions from distributable earnings | | | (212,839,496 | ) | | | (635,241,178 | ) |
|
| |
| | |
Share transactions–net: | | | | | | | | |
Class A | | | 24,787,667 | | | | 50,497,336 | |
|
| |
Class C | | | 2,961,502 | | | | 1,157,785 | |
|
| |
Class P | | | 10,226,981 | | | | 337,150,527 | |
|
| |
Class S | | | (159,219 | ) | | | 770,393 | |
|
| |
Class Y | | | (37,481,770 | ) | | | 17,588,619 | |
|
| |
Class R5 | | | (739,632 | ) | | | (307,978 | ) |
|
| |
Class R6 | | | (1,314,920 | ) | | | 1,937,178 | |
|
| |
Net increase (decrease) in net assets resulting from share transactions | | | (1,719,391 | ) | | | 408,793,860 | |
|
| |
Net increase (decrease) in net assets | | | 101,778,812 | | | | (1,517,132,437 | ) |
|
| |
| | |
Net assets: | | | | | | | | |
Beginning of year | | | 2,476,335,330 | | | | 3,993,467,767 | |
|
| |
End of year | | $ | 2,578,114,142 | | | $ | 2,476,335,330 | |
|
| |
See accompanying Notes to Financial Statements which are an integral part of the financial statements.
Financial Highlights
The following schedule presents financial highlights for a share of the Fund outstanding throughout the periods indicated.
| | | | | | | | | | | | | | | | | | | | | | | | | | | | | | | | | | | | | | | | | | | | | | | | |
| | | Net asset value, beginning of period | | Net investment income (loss)(a) | | Net gains (losses) on securities (both realized and unrealized) | | Total from investment operations | | Distributions from net realized gains | | Net asset value, end of period | | Total return(b) | | Net assets, end of period (000’s omitted) | | Ratio of expenses to average net assets with fee waivers and/or expenses absorbed | | Ratio of expenses to average net assets without fee waivers and/or expenses absorbed | | Ratio of net investment income (loss) to average net assets | | Portfolio turnover (c) |
Class A | | | | | | | | | | | | | | | | | | | | | | | | | | | | | | | | | | | | | | | | | | | | | | | | |
Year ended 10/31/23 | | $ | 18.33 | | | $ | (0.05 | ) | | $ | 2.20 | | | $ | 2.15 | | | $ | (1.66 | ) | | $ | 18.82 | | | | 13.19 | % | | $ | 328,711 | | | | 1.00 | % | | | 1.00 | % | | | (0.26 | )% | | | 62 | % |
Year ended 10/31/22 | | | 33.40 | | | | (0.03 | ) | | | (9.58 | ) | | | (9.61 | ) | | | (5.46 | ) | | | 18.33 | | | | (33.39 | ) | | | 293,295 | | | | 0.99 | | | | 0.99 | | | | (0.15 | ) | | | 78 | |
Year ended 10/31/21 | | | 26.25 | | | | (0.16 | ) | | | 9.21 | | | | 9.05 | | | | (1.90 | ) | | | 33.40 | | | | 35.85 | | | | 476,470 | | | | 0.99 | | | | 0.99 | | | | (0.53 | ) | | | 47 | |
Year ended 10/31/20 | | | 21.77 | | | | (0.07 | ) | | | 6.42 | | | | 6.35 | | | | (1.87 | ) | | | 26.25 | | | | 31.23 | | | | 299,616 | | | | 0.99 | | | | 0.99 | | | | (0.30 | ) | | | 38 | |
Year ended 10/31/19 | | | 20.75 | | | | (0.04 | ) | | | 3.17 | | | | 3.13 | | | | (2.11 | ) | | | 21.77 | | | | 17.36 | | | | 169,883 | | | | 1.01 | | | | 1.01 | | | | (0.18 | ) | | | 29 | |
Class C | | | | | | | | | | | | | | | | | | | | | | | | | | | | | | | | | | | | | | | | | | | | | | | | |
Year ended 10/31/23 | | | 14.96 | | | | (0.15 | ) | | | 1.75 | | | | 1.60 | | | | (1.66 | ) | | | 14.90 | | | | 12.41 | | | | 19,676 | | | | 1.75 | | | | 1.75 | | | | (1.01 | ) | | | 62 | |
Year ended 10/31/22 | | | 28.53 | | | | (0.17 | ) | | | (7.94 | ) | | | (8.11 | ) | | | (5.46 | ) | | | 14.96 | | | | (33.93 | ) | | | 16,613 | | | | 1.74 | | | | 1.74 | | | | (0.90 | ) | | | 78 | |
Year ended 10/31/21 | | | 22.82 | | | | (0.34 | ) | | | 7.95 | | | | 7.61 | | | | (1.90 | ) | | | 28.53 | | | | 34.86 | | | | 31,198 | | | | 1.74 | | | | 1.74 | | | | (1.28 | ) | | | 47 | |
Year ended 10/31/20 | | | 19.29 | | | | (0.22 | ) | | | 5.62 | | | | 5.40 | | | | (1.87 | ) | | | 22.82 | | | | 30.25 | | | | 24,427 | | | | 1.74 | | | | 1.74 | | | | (1.05 | ) | | | 38 | |
Year ended 10/31/19 | | | 18.77 | | | | (0.17 | ) | | | 2.80 | | | | 2.63 | | | | (2.11 | ) | | | 19.29 | | | | 16.43 | | | | 15,470 | | | | 1.76 | | | | 1.76 | | | | (0.93 | ) | | | 29 | |
Class P | | | | | | | | | | | | | | | | | | | | | | | | | | | | | | | | | | | | | | | | | | | | | | | | |
Year ended 10/31/23 | | | 18.89 | | | | (0.02 | ) | | | 2.28 | | | | 2.26 | | | | (1.66 | ) | | | 19.49 | | | | 13.40 | | | | 2,189,443 | | | | 0.85 | | | | 0.85 | | | | (0.11 | ) | | | 62 | |
Year ended 10/31/22 | | | 34.21 | | | | 0.00 | | | | (9.86 | ) | | | (9.86 | ) | | | (5.46 | ) | | | 18.89 | | | | (33.32 | ) | | | 2,086,384 | | | | 0.84 | | | | 0.84 | | | | 0.00 | | | | 78 | |
Year ended 10/31/21 | | | 26.80 | | | | (0.12 | ) | | | 9.43 | | | | 9.31 | | | | (1.90 | ) | | | 34.21 | | | | 36.09 | | | | 3,369,237 | | | | 0.84 | | | | 0.84 | | | | (0.38 | ) | | | 47 | |
Year ended 10/31/20 | | | 22.16 | | | | (0.04 | ) | | | 6.55 | | | | 6.51 | | | | (1.87 | ) | | | 26.80 | | | | 31.42 | | | | 2,675,601 | | | | 0.84 | | | | 0.84 | | | | (0.15 | ) | | | 38 | |
Year ended 10/31/19 | | | 21.05 | | | | (0.01 | ) | | | 3.23 | | | | 3.22 | | | | (2.11 | ) | | | 22.16 | | | | 17.55 | | | | 2,204,984 | | | | 0.86 | | | | 0.86 | | | | (0.03 | ) | | | 29 | |
Class S | | | | | | | | | | | | | | | | | | | | | | | | | | | | | | | | | | | | | | | | | | | | | | | | |
Year ended 10/31/23 | | | 18.62 | | | | (0.03 | ) | | | 2.24 | | | | 2.21 | | | | (1.66 | ) | | | 19.17 | | | | 13.32 | | | | 3,647 | | | | 0.90 | | | | 0.90 | | | | (0.16 | ) | | | 62 | |
Year ended 10/31/22 | | | 33.81 | | | | (0.01 | ) | | | (9.72 | ) | | | (9.73 | ) | | | (5.46 | ) | | | 18.62 | | | | (33.33 | ) | | | 3,631 | | | | 0.89 | | | | 0.89 | | | | (0.05 | ) | | | 78 | |
Year ended 10/31/21 | | | 26.52 | | | | (0.13 | ) | | | 9.32 | | | | 9.19 | | | | (1.90 | ) | | | 33.81 | | | | 36.02 | | | | 5,626 | | | | 0.89 | | | | 0.89 | | | | (0.43 | ) | | | 47 | |
Year ended 10/31/20 | | | 21.95 | | | | (0.05 | ) | | | 6.49 | | | | 6.44 | | | | (1.87 | ) | | | 26.52 | | | | 31.40 | | | | 4,435 | | | | 0.89 | | | | 0.89 | | | | (0.20 | ) | | | 38 | |
Year ended 10/31/19 | | | 20.89 | | | | (0.02 | ) | | | 3.19 | | | | 3.17 | | | | (2.11 | ) | | | 21.95 | | | | 17.44 | | | | 3,711 | | | | 0.91 | | | | 0.91 | | | | (0.08 | ) | | | 29 | |
Class Y | | | | | | | | | | | | | | | | | | | | | | | | | | | | | | | | | | | | | | | | | | | | | | | | |
Year ended 10/31/23 | | | 18.90 | | | | 0.00 | | | | 2.28 | | | | 2.28 | | | | (1.66 | ) | | | 19.52 | | | | 13.50 | | | | 22,986 | | | | 0.75 | | | | 0.75 | | | | (0.01 | ) | | | 62 | |
Year ended 10/31/22 | | | 34.20 | | | | 0.02 | | | | (9.86 | ) | | | (9.84 | ) | | | (5.46 | ) | | | 18.90 | | | | (33.26 | ) | | | 61,282 | | | | 0.74 | | | | 0.74 | | | | 0.10 | | | | 78 | |
Year ended 10/31/21 | | | 26.77 | | | | (0.09 | ) | | | 9.42 | | | | 9.33 | | | | (1.90 | ) | | | 34.20 | | | | 36.22 | | | | 85,356 | | | | 0.74 | | | | 0.74 | | | | (0.28 | ) | | | 47 | |
Year ended 10/31/20 | | | 22.12 | | | | (0.01 | ) | | | 6.53 | | | | 6.52 | | | | (1.87 | ) | | | 26.77 | | | | 31.53 | | | | 47,894 | | | | 0.74 | | | | 0.74 | | | | (0.05 | ) | | | 38 | |
Year ended 10/31/19 | | | 21.00 | | | | 0.02 | | | | 3.21 | | | | 3.23 | | | | (2.11 | ) | | | 22.12 | | | | 17.65 | | | | 13,414 | | | | 0.76 | | | | 0.76 | | | | 0.07 | | | | 29 | |
Class R5 | | | | | | | | | | | | | | | | | | | | | | | | | | | | | | | | | | | | | | | | | | | | | | | | |
Year ended 10/31/23 | | | 19.01 | | | | (0.00 | ) | | | 2.29 | | | | 2.29 | | | | (1.66 | ) | | | 19.64 | | | | 13.48 | | | | 7 | | | | 0.77 | | | | 0.77 | | | | (0.03 | ) | | | 62 | |
Year ended 10/31/22 | | | 34.37 | | | | 0.02 | | | | (9.92 | ) | | | (9.90 | ) | | | (5.46 | ) | | | 19.01 | | | | (33.27 | ) | | | 801 | | | | 0.77 | | | | 0.77 | | | | 0.07 | | | | 78 | |
Year ended 10/31/21 | | | 26.91 | | | | (0.10 | ) | | | 9.46 | | | | 9.36 | | | | (1.90 | ) | | | 34.37 | | | | 36.14 | | | | 1,848 | | | | 0.77 | | | | 0.77 | | | | (0.31 | ) | | | 47 | |
Year ended 10/31/20 | | | 22.22 | | | | (0.02 | ) | | | 6.58 | | | | 6.56 | | | | (1.87 | ) | | | 26.91 | | | | 31.57 | | | | 1,002 | | | | 0.76 | | | | 0.76 | | | | (0.07 | ) | | | 38 | |
Year ended 10/31/19 | | | 21.09 | | | | 0.01 | | | | 3.23 | | | | 3.24 | | | | (2.11 | ) | | | 22.22 | | | | 17.63 | | | | 96 | | | | 0.77 | | | | 0.77 | | | | 0.06 | | | | 29 | |
Class R6 | | | | | | | | | | | | | | | | | | | | | | | | | | | | | | | | | | | | | | | | | | | | | | | | |
Year ended 10/31/23 | | | 19.08 | | | | 0.01 | | | | 2.30 | | | | 2.31 | | | | (1.66 | ) | | | 19.73 | | | | 13.54 | | | | 13,643 | | | | 0.70 | | | | 0.70 | | | | 0.04 | | | | 62 | |
Year ended 10/31/22 | | | 34.45 | | | | 0.03 | | | | (9.94 | ) | | | (9.91 | ) | | | (5.46 | ) | | | 19.08 | | | | (33.22 | ) | | | 14,329 | | | | 0.70 | | | | 0.70 | | | | 0.14 | | | | 78 | |
Year ended 10/31/21 | | | 26.95 | | | | (0.07 | ) | | | 9.47 | | | | 9.40 | | | | (1.90 | ) | | | 34.45 | | | | 36.24 | | | | 23,732 | | | | 0.70 | | | | 0.70 | | | | (0.24 | ) | | | 47 | |
Year ended 10/31/20 | | | 22.24 | | | | (0.00 | ) | | | 6.58 | | | | 6.58 | | | | (1.87 | ) | | | 26.95 | | | | 31.64 | | | | 16,436 | | | | 0.70 | | | | 0.70 | | | | (0.01 | ) | | | 38 | |
Year ended 10/31/19 | | | 21.09 | | | | 0.03 | | | | 3.23 | | | | 3.26 | | | | (2.11 | ) | | | 22.24 | | | | 17.73 | | | | 12,556 | | | | 0.71 | | | | 0.71 | | | | 0.12 | | | | 29 | |
| (a) | Calculated using average shares outstanding. |
| (b) | Includes adjustments in accordance with accounting principles generally accepted in the United States of America and as such, the net asset value for financial reporting purposes and the returns based upon those net asset values may differ from the net asset value and returns for shareholder transactions. Does not include sales charges and is not annualized for periods less than one year, if applicable. |
| (c) | Portfolio turnover is calculated at the fund level and is not annualized for periods less than one year, if applicable. |
See accompanying Notes to Financial Statements which are an integral part of the financial statements.
Notes to Financial Statements
October 31, 2023
NOTE 1—Significant Accounting Policies
Invesco Summit Fund (the “Fund”) is a series portfolio of AIM Equity Funds (Invesco Equity Funds) (the “Trust”). The Trust is a Delaware statutory trust registered under the Investment Company Act of 1940, as amended (the “1940 Act”), as an open-end series management investment company authorized to issue an unlimited number of shares of beneficial interest. Information presented in these financial statements pertains only to the Fund. Matters affecting the Fund or each class will be voted on exclusively by the shareholders of the Fund or each class.
The Fund’s investment objective is long-term growth of capital.
The Fund currently consists of seven different classes of shares: Class A, Class C, Class P, Class S, Class Y, Class R5 and Class R6. Class P shares are not sold to members of the general public. Only shareholders who had accounts in the AIM Summit Investors Plans I and AIM Summit Investors Plans II at the close of business on December 8, 2006, may continue to purchase Class P shares as described in the Fund’s prospectus. Class Y shares are available only to certain investors. Class A shares are sold with a front-end sales charge unless certain waiver criteria are met. Under certain circumstances, load waiver shares may be subject to contingent deferred sales charges (“CDSC”). Class C shares are sold with a CDSC. Class P, Class S, Class Y, Class R5 and Class R6 shares are sold at net asset value. Class C shares held for eight years after purchase are eligible for automatic conversion into Class A shares of the same Fund (the “Conversion Feature”). The automatic conversion pursuant to the Conversion Feature will generally occur at the end of the month following the eighth anniversary after a purchase of Class C shares.
The Fund is an investment company and accordingly follows the investment company accounting and reporting guidance in accordance with Financial Accounting Standards Board Accounting Standards Codification Topic 946, Financial Services – Investment Companies.
The following is a summary of the significant accounting policies followed by the Fund in the preparation of its financial statements.
| A. | Security Valuations – Securities, including restricted securities, are valued according to the following policy. |
A security listed or traded on an exchange is generally valued at its trade price or official closing price that day as of the close of the exchange where the security is principally traded, or lacking any trades or official closing price on a particular day, the security may be valued at the closing bid or ask price on that day. Securities traded in the over-the-counter market are valued based on prices furnished by independent pricing services or market makers. When such securities are valued using prices provided by an independent pricing service they may be considered fair valued. Futures contracts are valued at the daily settlement price set by an exchange on which they are principally traded. Where a final settlement price exists, exchange-traded options are valued at the final settlement price from the exchange where the option principally trades. Where a final settlement price does not exist, exchange-traded options are valued at the mean between the last bid and ask price generally from the exchange where the option principally trades.
Securities of investment companies that are not exchange-traded (e.g., open-end mutual funds) are valued using such company’s end-of-business-day net asset value per share.
Deposits, other obligations of U.S. and non-U.S. banks and financial institutions are valued at their daily account value.
Fixed income securities (including convertible debt securities) generally are valued on the basis of prices provided by independent pricing services. Prices provided by the pricing service may be determined without exclusive reliance on quoted prices, and may reflect appropriate factors such as institution-size trading in similar groups of securities, developments related to specific securities, dividend rate (for unlisted equities), yield (for debt obligations), quality, type of issue, coupon rate (for debt obligations), maturity (for debt obligations), individual trading characteristics and other market data. Pricing services generally value debt obligations assuming orderly transactions of institutional round lot size, but a fund may hold or transact in the same securities in smaller, odd lot sizes. Odd lots often trade at lower prices than institutional round lots, and their value may be adjusted accordingly. Debt obligations are subject to interest rate and credit risks. In addition, all debt obligations involve some risk of default with respect to interest and/or principal payments.
Foreign securities’ (including foreign exchange contracts) prices are converted into U.S. dollar amounts using the applicable exchange rates as of the close of the New York Stock Exchange (“NYSE”). If market quotations are available and reliable for foreign exchange-traded equity securities, the securities will be valued at the market quotations. Invesco Advisers, Inc. (the “Adviser” or “Invesco”) may use various pricing services to obtain market quotations as well as fair value prices. Because trading hours for certain foreign securities end before the close of the NYSE, closing market quotations may become not representative of market value in the Adviser’s judgment (“unreliable”). If, between the time trading ends on a particular security and the close of the customary trading session on the NYSE, a significant event occurs that makes the closing price of the security unreliable, the Adviser may fair value the security. If the event is likely to have affected the closing price of the security, the security will be valued at fair value in good faith in accordance with Board- approved policies and related Adviser procedures (“Valuation Procedures”). Adjustments to closing prices to reflect fair value may also be based on a screening process of an independent pricing service to indicate the degree of certainty, based on historical data, that the closing price in the principal market where a foreign security trades is not the current value as of the close of the NYSE. Foreign securities’ prices meeting the degree of certainty that the price is not reflective of current value will be priced at the indication of fair value from the independent pricing service. Multiple factors may be considered by the independent pricing service in determining adjustments to reflect fair value and may include information relating to sector indices, American Depositary Receipts and domestic and foreign index futures. Foreign securities may have additional risks including exchange rate changes, potential for sharply devalued currencies and high inflation, political and economic upheaval, the relative lack of issuer information, relatively low market liquidity and the potential lack of strict financial and accounting controls and standards.
Unlisted securities will be valued using prices provided by independent pricing services or by another method that the Adviser, in its judgment, believes better reflects the security’s fair value in accordance with the Valuation Procedures.
Securities for which market prices are not provided by any of the above methods may be valued based upon quotes furnished by independent sources. The mean between the last bid and ask prices may be used to value debt obligations, including corporate loans.
Securities for which market quotations are not readily available are fair valued by the Adviser in accordance with the Valuation Procedures. If a fair value price provided by a pricing service is unreliable, the Adviser will fair value the security using the Valuation Procedures. Issuer specific events, market trends, bid/ask quotes of brokers and information providers and other market data may be reviewed in the course of making a good faith determination of a security’s fair value.
The Fund may invest in securities that are subject to interest rate risk, meaning the risk that the prices will generally fall as interest rates rise and, conversely, the prices will generally rise as interest rates fall. Specific securities differ in their sensitivity to changes in interest rates depending on their individual characteristics. Changes in interest rates may result in increased market volatility, which may affect the value and/or liquidity of certain Fund investments.
Valuations change in response to many factors including the historical and prospective earnings of the issuer, the value of the issuer’s assets, general market conditions which are not specifically related to the particular issuer, such as real or perceived adverse economic conditions, changes in the general outlook for revenues or corporate earnings, changes in interest or currency rates, regional or global instability, natural or environmental disasters, widespread disease or other public health issues, war, acts of terrorism, significant governmental actions or adverse investor sentiment generally and market liquidity. Because of the inherent uncertainties of valuation, the values reflected in the financial statements may materially differ from the value received upon actual sale of those investments.
The price the Fund could receive upon the sale of any investment may differ from the Adviser’s valuation of the investment, particularly for securities that are valued using a fair valuation technique. When fair valuation techniques are applied, the Adviser uses available information, including both observable and unobservable inputs and assumptions, to determine a methodology that will result in a valuation that the Adviser believes approximates market value. Fund securities that are fair valued may be subject to greater fluctuation in their value from one day to the next than would be the case if market quotations were used.
Because of the inherent uncertainties of valuation, and the degree of subjectivity in such decisions, the Fund could realize a greater or lesser than expected gain or loss upon the sale of the investment.
| B. | Securities Transactions and Investment Income – Securities transactions are accounted for on a trade date basis. Realized gains or losses on sales are computed on the basis of specific identification of the securities sold. Interest income (net of withholding tax, if any) is recorded on an accrual basis from settlement date and includes coupon interest and amortization of premium and accretion of discount on debt securities as applicable. Dividend income (net of withholding tax, if any) is recorded on the ex-dividend date. |
The Fund may periodically participate in litigation related to Fund investments. As such, the Fund may receive proceeds from litigation settlements. Any proceeds received are included in the Statement of Operations as realized gain (loss) for investments no longer held and as unrealized gain (loss) for investments still held.
Brokerage commissions and mark ups are considered transaction costs and are recorded as an increase to the cost basis of securities purchased and/or a reduction of proceeds on a sale of securities. Such transaction costs are included in the determination of net realized and unrealized gain (loss) from investment securities reported in the Statement of Operations and the Statement of Changes in Net Assets and the net realized and unrealized gains (losses) on securities per share in the Financial Highlights. Transaction costs are included in the calculation of the Fund’s net asset value and, accordingly, they reduce the Fund’s total returns. These transaction costs are not considered operating expenses and are not reflected in net investment income reported in the Statement of Operations and the Statement of Changes in Net Assets, or the net investment income per share and the ratios of expenses and net investment income reported in the Financial Highlights, nor are they limited by any expense limitation arrangements between the Fund and the investment adviser.
The Fund allocates income and realized and unrealized capital gains and losses to a class based on the relative net assets of each class.
| C. | Country Determination – For the purposes of making investment selection decisions and presentation in the Schedule of Investments, the investment adviser may determine the country in which an issuer is located and/or credit risk exposure based on various factors. These factors include the laws of the country under which the issuer is organized, where the issuer maintains a principal office, the country in which the issuer derives 50% or more of its total revenues, the country that has the primary market for the issuer’s securities and its “country of risk” as determined by a third party service provider, as well as other criteria. Among the other criteria that may be evaluated for making this determination are the country in which the issuer maintains 50% or more of its assets, the type of security, financial guarantees and enhancements, the nature of the collateral and the sponsor organization. Country of issuer and/or credit risk exposure has been determined to be the United States of America, unless otherwise noted. |
| D. | Distributions - Distributions from net investment income and net realized capital gain, if any, are generally declared and paid annually and recorded on the ex-dividend date. The Fund may elect to treat a portion of the proceeds from redemptions as distributions for federal income tax purposes. |
| E. | Federal Income Taxes – The Fund intends to comply with the requirements of Subchapter M of the Internal Revenue Code of 1986, as amended (the “Internal Revenue Code”), necessary to qualify as a regulated investment company and to distribute substantially all of the Fund’s taxable earnings to shareholders. As such, the Fund will not be subject to federal income taxes on otherwise taxable income (including net realized capital gain) that is distributed to shareholders. Therefore, no provision for federal income taxes is recorded in the financial statements. |
The Fund recognizes the tax benefits of uncertain tax positions only when the position is more likely than not to be sustained. Management has analyzed the Fund’s uncertain tax positions and concluded that no liability for unrecognized tax benefits should be recorded related to uncertain tax positions. Management is not aware of any tax positions for which it is reasonably possible that the total amounts of unrecognized tax benefits will change materially in the next 12 months.
The Fund files tax returns in the U.S. Federal jurisdiction and certain other jurisdictions. Generally, the Fund is subject to examinations by such taxing authorities for up to three years after the filing of the return for the tax period.
| F. | Foreign Withholding Taxes – The Fund is subject to foreign withholding tax imposed by certain foreign countries in which the Fund may invest. Withholding taxes are incurred on certain foreign dividends and are accrued at the time the dividend is recognized based on applicable foreign tax laws. The Fund may file withholding tax refunds in certain jurisdictions to seek to recover a portion of amounts previously withheld. The Fund will record a receivable for such tax refunds based on several factors including; an assessment of a jurisdiction’s legal obligation to pay reclaims, administrative practices and payment history. Any receivables recorded will be shown under receivables for Foreign withholding tax claims on the Statement of Assets and Liabilities. There is no guarantee that the Fund will receive refunds applied for in a timely manner or at all. |
As a result of recent court rulings in certain countries across the European Union, tax refunds for previously withheld taxes on dividends earned in those countries have been received by investment companies. Any tax refund payments are reflected as Foreign withholding tax claims in the Statement of Operations, and any related interest is included in Interest income. The Fund may incur fees paid to third party providers that assist in the recovery of the tax reclaims. These fees are reflected on the Statement of Operations as Professional services fees, if any. In the event tax refunds received by the Fund during the fiscal year exceed the foreign withholding taxes paid by the Fund for the year, and the Fund previously passed foreign tax credits on to its shareholders, the Fund intends to enter into a closing agreement with the Internal Revenue Service in order to pay the associated liability on behalf of the Funds’ shareholders. For the year ended October 31, 2023, the Fund did not enter into any closing agreements.
| G. | Expenses – Fees provided for under the Rule 12b-1 plan of a particular class of the Fund are charged to the operations of such class. Transfer agency fees and expenses and other shareholder recordkeeping fees and expenses attributable to Class R5 and Class R6 are allocated based on relative net assets of Class R5 and Class R6. Sub-accounting fees attributable to Class R5 are charged to the operations of the class. Transfer agency fees and expenses and other shareholder recordkeeping fees and expenses relating to all other classes are allocated among those classes based on relative net assets. All other expenses are allocated among the classes based on relative net assets. |
| H. | Accounting Estimates – The preparation of financial statements in conformity with accounting principles generally accepted in the United States of America (“GAAP”) requires management to make estimates and assumptions that affect the reported amounts of assets and liabilities at the date of the financial statements and the reported amounts of revenues and expenses during the reporting period including estimates and assumptions related to taxation. Actual results could differ from those estimates by a significant amount. In addition, the Fund monitors for material events or transactions that may occur or become known after the period-end date and before the date the financial statements are released to print. |
| I. | Indemnifications - Under the Trust’s organizational documents, each Trustee, officer, employee or other agent of the Trust is indemnified against certain liabilities that may arise out of the performance of their duties to the Fund. Additionally, in the normal course of business, the Fund enters into contracts, including the Fund’s servicing agreements, that contain a variety of indemnification clauses. The Fund’s maximum exposure under these arrangements is unknown as this would involve future claims that may be made against the Fund that have not yet occurred. The risk of material loss as a result of such indemnification claims is considered remote. |
| J. | Securities Lending - The Fund may lend portfolio securities having a market value up to one-third of the Fund’s total assets. Such loans are secured by collateral equal to no less than the market value of the loaned securities determined daily by the securities lending provider. Such collateral will be cash or debt securities issued or guaranteed by the U.S. Government or any of its sponsored agencies. Cash collateral received in connection with these loans is invested in short-term money market instruments or affiliated, unregistered investment companies that comply with Rule 2a-7 under the 1940 Act and money market funds (collectively, “affiliated money market funds”) and is shown as such on the Schedule of Investments. The Fund bears the risk of loss with respect to the investment of collateral. It is the Fund’s policy to obtain additional collateral from or return excess collateral to the borrower by the end of the next business day, following the valuation date of the securities loaned. Therefore, the value of the collateral held may be temporarily less than the value of the securities on loan. When loaning securities, the Fund retains certain benefits of owning the securities, including the economic equivalent of dividends or interest generated by the security. Lending securities entails a risk of loss to the Fund if, and to the extent that, the market value of the securities loaned were to increase and the borrower did not |
increase the collateral accordingly, and the borrower failed to return the securities. The securities loaned are subject to termination at the option of the borrower or the Fund. Upon termination, the borrower will return to the Fund the securities loaned and the Fund will return the collateral. Upon the failure of the borrower to return the securities, collateral may be liquidated and the securities may be purchased on the open market to replace the loaned securities. The Fund could experience delays and costs in gaining access to the collateral and the securities may lose value during the delay which could result in potential losses to the Fund. Some of these losses may be indemnified by the lending agent. The Fund bears the risk of any deficiency in the amount of the collateral available for return to the borrower due to any loss on the collateral invested. Dividends received on cash collateral investments for securities lending transactions, which are net of compensation to counterparties, are included in Dividends from affiliated money market funds on the Statement of Operations. The aggregate value of securities out on loan, if any, is shown as a footnote on the Statement of Assets and Liabilities.
The Adviser serves as an affiliated securities lending agent for the Fund. The Bank of New York Mellon also serves as a securities lending agent. To the extent the Fund utilizes the Adviser as an affiliated securities lending agent, the Fund conducts its securities lending in accordance with, and in reliance upon, no-action letters issued by the SEC staff that provide guidance on how an affiliate may act as a direct agent lender and receive compensation for those services in a manner consistent with the federal securities laws. For the year ended October 31, 2023, the Fund paid the Adviser $15,811 in fees for securities lending agent services. Fees paid to the Adviser for securities lending agent services, if any, are included in Dividends from affiliated money market funds on the Statement of Operations.
| K. | Foreign Currency Translations – Foreign currency is valued at the close of the NYSE based on quotations posted by banks and major currency dealers. Portfolio securities and other assets and liabilities denominated in foreign currencies are translated into U.S. dollar amounts at the date of valuation. Purchases and sales of portfolio securities (net of foreign taxes withheld on disposition) and income items denominated in foreign currencies are translated into U.S. dollar amounts on the respective dates of such transactions. The Fund does not separately account for the portion of the results of operations resulting from changes in foreign exchange rates on investments and the fluctuations arising from changes in market prices of securities held. The combined results of changes in foreign exchange rates and the fluctuation of market prices on investments (net of estimated foreign tax withholding) are included with the net realized and unrealized gain or loss from investments in the Statement of Operations. Reported net realized foreign currency gains or losses arise from (1) sales of foreign currencies, (2) currency gains or losses realized between the trade and settlement dates on securities transactions, and (3) the difference between the amounts of dividends, interest, and foreign withholding taxes recorded on the Fund’s books and the U.S. dollar equivalent of the amounts actually received or paid. Net unrealized foreign currency gains and losses arise from changes in the fair values of assets and liabilities, other than investments in securities at fiscal period end, resulting from changes in exchange rates. |
The Fund may invest in foreign securities, which may be subject to foreign taxes on income, gains on investments or currency repatriation, a portion of which may be recoverable. Foreign taxes, if any, are recorded based on the tax regulations and rates that exist in the foreign markets in which the Fund invests and are shown in the Statement of Operations.
| L. | Forward Foreign Currency Contracts – The Fund may engage in foreign currency transactions either on a spot (i.e. for prompt delivery and settlement) basis, or through forward foreign currency contracts, to manage or minimize currency or exchange rate risk. |
The Fund may also enter into forward foreign currency contracts for the purchase or sale of a security denominated in a foreign currency in order to “lock in” the U.S. dollar price of that security, or the Fund may also enter into forward foreign currency contracts that do not provide for physical exchange of the two currencies on the settlement date, but instead are settled by a single cash payment calculated as the difference between the agreed upon exchange rate and the spot rate at settlement based upon an agreed upon notional amount (non-deliverable forwards).
A forward foreign currency contract is an obligation between two parties (“Counterparties”) to purchase or sell a specific currency for an agreed-upon price at a future date. The use of forward foreign currency contracts for hedging does not eliminate fluctuations in the price of the underlying securities the Fund owns or intends to acquire but establishes a rate of exchange in advance. Fluctuations in the value of these contracts are measured by the difference in the contract date and reporting date exchange rates and are recorded as unrealized appreciation (depreciation) until the contracts are closed. When the contracts are closed, realized gains (losses) are recorded. Realized and unrealized gains (losses) on the contracts are included in the Statement of Operations. The primary risks associated with forward foreign currency contracts include failure of the Counterparty to meet the terms of the contract and the value of the foreign currency changing unfavorably. These risks may be in excess of the amounts reflected in the Statement of Assets and Liabilities.
| M. | Other Risks – The Fund is non-diversified and may invest in securities of fewer issuers than if it were diversified. Thus, the value of the Fund’s shares may vary more widely and the Fund may be subject to greater market and credit risk than if the Fund invested more broadly. |
NOTE 2—Advisory Fees and Other Fees Paid to Affiliates
The Trust has entered into a master investment advisory agreement with the Adviser. Under the terms of the investment advisory agreement, the Fund accrues daily and pays monthly an advisory fee to the Adviser based on the annual rate of the Fund’s average daily net assets as follows:
| | | | | | |
| Average Daily Net Assets | | Rate | |
| |
First $ 10 million | | | 1.000% | |
| |
Next $140 million | | | 0.750% | |
| |
Over $150 million | | | 0.625% | |
| |
For the year ended October 31, 2023, the effective advisory fee rate incurred by the Fund was 0.63%.
Under the terms of a master sub-advisory agreement between the Adviser and each of Invesco Asset Management Deutschland GmbH, Invesco Asset Management Limited, Invesco Asset Management (Japan) Limited, Invesco Hong Kong Limited, Invesco Senior Secured Management, Inc. and Invesco Canada Ltd. (collectively, the “Affiliated Sub-Advisers”) the Adviser, not the Fund, will pay 40% of the fees paid to the Adviser to any such Affiliated Sub-Adviser(s) that provide(s) discretionary investment management services to the Fund based on the percentage of assets allocated to such Affiliated Sub-Adviser(s).
Effective July 1, 2023, the Adviser has agreed, for an indefinite period, to waive advisory fees and/or reimburse expenses of all shares to the extent necessary to limit total annual fund operating expenses after fee waiver and/or expense reimbursement (excluding certain items discussed below) of Class A, Class C, Class P, Class S, Class Y, Class R5 and Class R6 shares to 2.00%, 2.75%, 1.85%, 1.90%, 1.75%, 1.75% and 1.75%, respectively, of the Fund’s average daily net assets (the “boundary limits”). Prior to July 1, 2023, the same boundary limits were in effect with an expiration date of June 30, 2023. In determining the Adviser’s obligation to waive advisory fees and/or reimburse expenses, the following expenses are not taken into account, and could cause the total annual fund operating expenses after fee waiver and/or expense reimbursement to exceed the numbers reflected above: (1) interest; (2) taxes; (3) dividend expense on short sales; (4) extraordinary or non-routine items, including litigation expenses; and (5) expenses that the Fund has incurred but did not actually pay because of an expense offset arrangement. Invesco may amend and/or terminate these boundary limits at any time in its sole discretion and will inform the Board of Trustees of any such changes. The Adviser did not waive fees and/or reimburse expenses during the period under these boundary limits.
Further, the Adviser has contractually agreed, through at least June 30, 2025, to waive the advisory fee payable by the Fund in an amount equal to 100% of the net advisory fees the Adviser receives from the affiliated money market funds on investments by the Fund of uninvested cash (excluding investments of cash collateral from securities lending) in such affiliated money market funds.
For the year ended October 31, 2023, the Adviser waived advisory fees of $19,193.
The Trust has entered into a master administrative services agreement with Invesco pursuant to which the Fund has agreed to pay Invesco for certain administrative costs incurred in providing accounting services to the Fund. For the year ended October 31, 2023, expenses incurred under the agreement are shown in the Statement of Operations as Administrative services fees. Invesco has entered into a sub-administration agreement whereby State Street Bank and Trust Company (“SSB”) serves as fund accountant and provides certain administrative services to the Fund. Pursuant to a custody agreement with the Trust on behalf of the Fund, SSB also serves as the Fund’s custodian.
The Trust has entered into a transfer agency and service agreement with Invesco Investment Services, Inc. (“IIS”) pursuant to which the Fund has agreed to pay IIS a fee for providing transfer agency and shareholder services to the Fund and reimburse IIS for certain expenses incurred by IIS in the course of providing such services. IIS may make payments to intermediaries that provide omnibus account services, sub-accounting services and/or networking services. All fees payable by IIS to intermediaries that provide omnibus account services or sub-accounting services are charged back to the Fund, subject to certain limitations approved by the Trust’s Board of Trustees. For the year ended October 31, 2023, expenses incurred under the agreement are shown in the Statement of Operations as Transfer agent fees.
The Fund has entered into master distribution agreements with Invesco Distributors, Inc. (“IDI”) to serve as the distributor for the Class A, Class C, Class P, Class S, Class Y, Class R5 and Class R6 shares. The Fund has adopted plans pursuant to Rule 12b-1 under the 1940 Act with respect to the Fund’s Class A, Class C shares, Class P shares and Class S shares (collectively, the “Plans”). The Fund, pursuant to the Plans, pays IDI compensation at the annual rate of 0.25% of the Fund’s average daily net assets of Class A shares, 1.00% of the average daily net assets of Class C shares, 0.10% of the average daily net assets of Class P shares and 0.15% of the average daily net assets of Class S shares. The fees are accrued daily and paid monthly. Of the Plans payments, up to 0.25% of the average daily net assets of Class A and Class C shares, 0.10% of the average daily net assets of Class P shares and 0.15% of the average daily net assets of Class S shares may be paid to furnish continuing personal shareholder services to customers who purchase and own shares of such classes. Any amounts not paid as a service fee under the Plans would constitute an asset-based sales charge. Rules of the Financial Industry Regulatory Authority (“FINRA”) impose a cap on the total sales charges, including asset-based sales charges, that may be paid by any class of shares of the Fund. For the year ended October 31, 2023, expenses incurred under the Plans are shown in the Statement of Operations as Distribution fees.
Front-end sales commissions and CDSC (collectively, the “sales charges”) are not recorded as expenses of the Fund. Front-end sales commissions are deducted from proceeds from the sales of Fund shares prior to investment in Class A shares of the Fund. CDSC are deducted from redemption proceeds prior to remittance to the shareholder. During the year ended October 31, 2023, IDI advised the Fund that IDI retained $120,886 in front-end sales commissions from the sale of Class A shares and $1,675 and $375 from Class A and Class C shares, respectively, for CDSC imposed upon redemptions by shareholders.
For the year ended October 31, 2023, the Fund incurred $95,680 in brokerage commissions with Invesco Capital Markets, Inc., an affiliate of the Adviser and IDI, for portfolio transactions executed on behalf of the Fund.
Certain officers and trustees of the Trust are officers and directors of the Adviser, IIS and/or IDI.
NOTE 3—Additional Valuation Information
GAAP defines fair value as the price that would be received to sell an asset or paid to transfer a liability in an orderly transaction between market participants at the measurement date, under current market conditions. GAAP establishes a hierarchy that prioritizes the inputs to valuation methods, giving the highest priority to readily available unadjusted quoted prices in an active market for identical assets (Level 1) and the lowest priority to significant unobservable inputs (Level 3), generally when market prices are not readily available. Based on the valuation inputs, the securities or other investments are tiered into one of three levels. Changes in valuation methods may result in transfers in or out of an investment’s assigned level:
| | |
| Level 1 - | | Prices are determined using quoted prices in an active market for identical assets. |
| Level 2 - | | Prices are determined using other significant observable inputs. Observable inputs are inputs that other market participants may use in pricing a security. These may include quoted prices for similar securities, interest rates, prepayment speeds, credit risk, yield curves, loss severities, default rates, discount rates, volatilities and others. |
| Level 3 - | | Prices are determined using significant unobservable inputs. In situations where quoted prices or observable inputs are unavailable (for example, when there is little or no market activity for an investment at the end of the period), unobservable inputs may be used. Unobservable inputs reflect the Adviser’s assumptions about the factors market participants would use in determining fair value of the securities or instruments and would be based on the best available information. |
The following is a summary of the tiered valuation input levels, as of October 31, 2023. The level assigned to the securities valuations may not be an indication of the risk or liquidity associated with investing in those securities. Because of the inherent uncertainties of valuation, the values reflected in the financial statements may materially differ from the value received upon actual sale of those investments.
| | | | | | | | | | | | | | | | |
| | | Level 1 | | | Level 2 | | | Level 3 | | | Total | |
|
| |
Investments in Securities | | | | | | | | | | | | | | | | |
|
| |
Common Stocks & Other Equity Interests | | $ | 2,479,932,996 | | | $ | 72,807,930 | | | | $– | | | $ | 2,552,740,926 | |
|
| |
Money Market Funds | | | 19,743,059 | | | | 43,476,457 | | | | – | | | | 63,219,516 | |
|
| |
Total Investments | | $ | 2,499,676,055 | | | $ | 116,284,387 | | | | $– | | | $ | 2,615,960,442 | |
|
| |
NOTE 4–Expense Offset Arrangement(s)
The expense offset arrangement is comprised of transfer agency credits which result from balances in demand deposit accounts used by the transfer agent for clearing shareholder transactions. For the year ended October 31, 2023, the Fund received credits from this arrangement, which resulted in the reduction of the Fund’s total expenses of $72,663.
NOTE 5—Trustees’ and Officers’ Fees and Benefits
Trustees’ and Officers’ Fees and Benefits include amounts accrued by the Fund to pay remuneration to certain Trustees and Officers of the Fund. Trustees have the option to defer compensation payable by the Fund, and Trustees’ and Officers’ Fees and Benefits also include amounts accrued by the Fund to fund such deferred compensation amounts. Those Trustees who defer compensation have the option to select various Invesco Funds in which their deferral accounts shall be deemed to be invested. Finally, certain current Trustees were eligible to participate in a retirement plan that provided for benefits to be paid upon retirement to Trustees over a period of time based on the number of years of service. The Fund may have certain former Trustees who also participate in a retirement plan and receive benefits under such plan. Trustees’ and Officers’ Fees and Benefits include amounts accrued by the Fund to fund such retirement benefits. Obligations under the deferred compensation and retirement plans represent unsecured claims against the general assets of the Fund.
NOTE 6—Cash Balances
The Fund is permitted to temporarily carry a negative or overdrawn balance in its account with SSB, the custodian bank. Such balances, if any at period-end, are shown in the Statement of Assets and Liabilities under the payable caption Amount due custodian. To compensate the custodian bank for such overdrafts, the overdrawn Fund may either (1) leave funds as a compensating balance in the account so the custodian bank can be compensated by earning the additional interest; or (2) compensate by paying the custodian bank at a rate agreed upon by the custodian bank and Invesco, not to exceed the contractually agreed upon rate.
NOTE 7—Distributions to Shareholders and Tax Components of Net Assets
Tax Character of Distributions to Shareholders Paid During the Fiscal Years Ended October 31, 2023 and 2022:
| | | | | | | | | | | | |
| | | 2023 | | | | | | 2022 | |
|
| |
Ordinary income* | | $ | – | | | | | | | $ | 33,580,367 | |
|
| |
Long-term capital gain | | | 212,839,496 | | | | | | | | 601,660,811 | |
|
| |
Total distributions | | $ | 212,839,496 | | | | | | | $ | 635,241,178 | |
|
| |
| * | Includes short-term capital gain distributions, if any. |
Tax Components of Net Assets at Period-End:
| | | | |
| | | 2023 | |
|
| |
Net unrealized appreciation – investments | | $ | 984,328,810 | |
|
| |
Net unrealized appreciation – foreign currencies | | | 2,364 | |
|
| |
Temporary book/tax differences | | | (220,725 | ) |
|
| |
Late-Year ordinary loss deferral | | | (2,572,899 | ) |
|
| |
Capital loss carryforward | | | (176,931,342 | ) |
|
| |
Shares of beneficial interest | | | 1,773,507,934 | |
|
| |
Total net assets | | $ | 2,578,114,142 | |
|
| |
The difference between book-basis and tax-basis unrealized appreciation (depreciation) is due to differences in the timing of recognition of gains and losses on investments for tax and book purposes. The Fund’s net unrealized appreciation (depreciation) difference is attributable primarily to wash sales.
The temporary book/tax differences are a result of timing differences between book and tax recognition of income and/or expenses. The Fund’s temporary book/tax differences are the result of the trustee deferral of compensation and retirement plan benefits.
Capital loss carryforward is calculated and reported as of a specific date. Results of transactions and other activity after that date may affect the amount of capital loss carryforward actually available for the Fund to utilize. The ability to utilize capital loss carryforward in the future may be limited under the Internal Revenue Code and related regulations based on the results of future transactions.
The Fund has a capital loss carryforward as of October 31, 2023, as follows:
| | | | | | | | |
Capital Loss Carryforward* | |
| Expiration | | Short-Term | | Long-Term | | Total | |
|
| |
Not subject to expiration | | $110,229,323 | | $66,702,019 | | $ | 176,931,342 | |
|
| |
| * | Capital loss carryforward is reduced for limitations, if any, to the extent required by the Internal Revenue Code and may be further limited depending upon a variety of factors, including the realization of net unrealized gains or losses as of the date of any reorganization. |
NOTE 8—Investment Transactions
The aggregate amount of investment securities (other than short-term securities, U.S. Government obligations and money market funds, if any) purchased and sold by the Fund during the year ended October 31, 2023 was $1,605,356,174 and $1,812,761,644, respectively. Cost of investments, including any derivatives, on a tax basis includes the adjustments for financial reporting purposes as of the most recently completed federal income tax reporting period-end.
| | | | |
Unrealized Appreciation (Depreciation) of Investments on a Tax Basis | |
Aggregate unrealized appreciation of investments | | | $1,051,086,381 | |
|
| |
Aggregate unrealized (depreciation) of investments | | | (66,757,571 | ) |
|
| |
Net unrealized appreciation of investments | | | $984,328,810 | |
|
| |
Cost of investments for tax purposes is $1,631,631,632.
NOTE 9—Reclassification of Permanent Differences
Primarily as a result of differing book/tax treatment of foreign currency transactions, distributions and REITs, on October 31, 2023, undistributed net investment income (loss) was increased by $666,241, undistributed net realized gain (loss) was increased by $236,703 and shares of beneficial interest was decreased by $902,944. This reclassification had no effect on the net assets of the Fund.
NOTE 10–Share Information
| | | | | | | | | | | | | | | | |
| | | Summary of Share Activity | |
|
| |
| | | Year ended | | | Year ended |
| | | October 31, 2023 | | | October 31, 2022 |
| | | Shares | | | Amount | | | Shares | | Amount | |
|
| |
Sold: | | | | | | | | | | | | | | | | |
Class A | | | 3,305,931 | | | $ | 61,596,151 | | | | 3,078,141 | | | $ | 71,284,538 | |
|
| |
Class C | | | 443,160 | | | | 6,604,358 | | | | 241,400 | | | | 4,595,450 | |
|
| |
Class P | | | 959,068 | | | | 18,227,818 | | | | 986,852 | | | | 23,197,605 | |
|
| |
Class S | | | 1,052 | | | | 19,458 | | | | 2,687 | | | | 62,618 | |
|
| |
Class Y | | | 341,162 | | | | 6,751,191 | | | | 3,426,993 | | | | 77,519,531 | |
|
| |
Class R5 | | | 1,285 | | | | 22,627 | | | | 5,415 | | | | 116,462 | |
|
| |
Class R6 | | | 64,783 | | | | 1,235,695 | | | | 121,196 | | | | 2,832,188 | |
|
| |
| | | | |
Issued as reinvestment of dividends: | | | | | | | | | | | | | | | | |
Class A | | | 1,538,373 | | | | 24,890,864 | | | | 2,912,828 | | | | 74,394,174 | |
|
| |
Class C | | | 130,448 | | | | 1,681,472 | | | | 262,274 | | | | 5,505,135 | |
|
| |
Class P | | | 10,545,687 | | | | 176,429,315 | | | | 19,723,009 | | | | 518,517,916 | |
|
| |
Class S | | | 19,052 | | | | 313,597 | | | | 34,274 | | | | 888,373 | |
|
| |
Class Y | | | 102,318 | | | | 1,713,834 | | | | 475,616 | | | | 12,499,183 | |
|
| |
Class R5 | | | 4,107 | | | | 69,211 | | | | 10,774 | | | | 284,868 | |
|
| |
Class R6 | | | 68,127 | | | | 1,152,701 | | | | 134,215 | | | | 3,559,383 | |
|
| |
| | | | |
Automatic conversion of Class C shares to Class A shares: | | | | | | | | | | | | | | | | |
Class A | | | 64,325 | | | | 1,186,714 | | | | 69,466 | | | | 1,575,742 | |
|
| |
Class C | | | (80,915 | ) | | | (1,186,714 | ) | | | (84,384 | ) | | | (1,575,742 | ) |
|
| |
| | | | |
Reacquired: | | | | | | | | | | | | | | | | |
Class A | | | (3,445,755 | ) | | | (62,886,062 | ) | | | (4,320,402 | ) | | | (96,757,118 | ) |
|
| |
Class C | | | (282,210 | ) | | | (4,137,614 | ) | | | (402,433 | ) | | | (7,367,058 | ) |
|
| |
Class P | | | (9,596,587 | ) | | | (184,430,152 | ) | | | (8,755,394 | ) | | | (204,564,994 | ) |
|
| |
Class S | | | (24,838 | ) | | | (492,274 | ) | | | (8,343 | ) | | | (180,598 | ) |
|
| |
Class Y | | | (2,508,035 | ) | | | (45,946,795 | ) | | | (3,156,718 | ) | | | (72,430,095 | ) |
|
| |
Class R5 | | | (47,165 | ) | | | (831,470 | ) | | | (27,802 | ) | | | (709,308 | ) |
|
| |
Class R6 | | | (192,471 | ) | | | (3,703,316 | ) | | | (193,260 | ) | | | (4,454,393 | ) |
|
| |
Net increase (decrease) in share activity | | | 1,410,902 | | | $ | (1,719,391 | ) | | | 14,536,404 | | | $ | 408,793,860 | |
|
| |
Report of Independent Registered Public Accounting Firm
To the Board of Trustees of AIM Equity Funds (Invesco Equity Funds) and Shareholders of Invesco Summit Fund
Opinion on the Financial Statements
We have audited the accompanying statement of assets and liabilities, including the schedule of investments, of Invesco Summit Fund (one of the funds constituting AIM Equity Funds (Invesco Equity Funds), referred to hereafter as the “Fund”) as of October 31, 2023, the related statement of operations for the year ended October 31, 2023, the statement of changes in net assets for each of the two years in the period ended October 31, 2023, including the related notes, and the financial highlights for each of the five years in the period ended October 31, 2023 (collectively referred to as the “financial statements”). In our opinion, the financial statements present fairly, in all material respects, the financial position of the Fund as of October 31, 2023, the results of its operations for the year then ended, the changes in its net assets for each of the two years in the period ended October 31, 2023 and the financial highlights for each of the five years in the period ended October 31, 2023 in conformity with accounting principles generally accepted in the United States of America.
Basis for Opinion
These financial statements are the responsibility of the Fund’s management. Our responsibility is to express an opinion on the Fund’s financial statements based on our audits. We are a public accounting firm registered with the Public Company Accounting Oversight Board (United States) (PCAOB) and are required to be independent with respect to the Fund in accordance with the U.S. federal securities laws and the applicable rules and regulations of the Securities and Exchange Commission and the PCAOB.
We conducted our audits of these financial statements in accordance with the standards of the PCAOB. Those standards require that we plan and perform the audit to obtain reasonable assurance about whether the financial statements are free of material misstatement, whether due to error or fraud.
Our audits included performing procedures to assess the risks of material misstatement of the financial statements, whether due to error or fraud, and performing procedures that respond to those risks. Such procedures included examining, on a test basis, evidence regarding the amounts and disclosures in the financial statements. Our audits also included evaluating the accounting principles used and significant estimates made by management, as well as evaluating the overall presentation of the financial statements. Our procedures included confirmation of securities owned as of October 31, 2023 by correspondence with the custodian, transfer agent and brokers. We believe that our audits provide a reasonable basis for our opinion.
/s/PricewaterhouseCoopers LLP
Houston, Texas
December 21, 2023
We have served as the auditor of one or more of the investment companies in the Invesco group of investment companies since at least 1995. We have not been able to determine the specific year we began serving as auditor.
Calculating your ongoing Fund expenses
Example
As a shareholder of the Fund, you incur two types of costs: (1) transaction costs, which may include sales charges (loads) on purchase payments or contingent deferred sales charges on redemptions, if any; and (2) ongoing costs, including management fees, distribution and/or service (12b-1) fees, and other Fund expenses. This example is intended to help you understand your ongoing costs (in dollars) of investing in the Fund and to compare these costs with ongoing costs of investing in other mutual funds. The example is based on an investment of $1,000 invested at the beginning of the period and held for the entire period May 1, 2023 through October 31, 2023.
Actual expenses
The table below provides information about actual account values and actual expenses. You may use the information in this table, together with the amount you invested, to estimate the expenses that you paid over the period. Simply divide your account value by $1,000 (for example, an $8,600 account value divided by $1,000 = 8.6), then multiply the result by the number in the table under the heading entitled “Actual Expenses Paid During Period” to estimate the expenses you paid on your account during this period.
Hypothetical example for comparison purposes
The table below also provides information about hypothetical account values and hypothetical expenses based on the Fund’s actual expense ratio and an assumed rate of return of 5% per year before expenses, which is not the Fund’s actual return.
The hypothetical account values and expenses may not be used to estimate the actual ending account balance or expenses you paid for the period. You may use this information to compare the ongoing costs of investing in the Fund and other funds. To do so, compare this 5% hypothetical example with the 5% hypothetical examples that appear in the shareholder reports of the other funds.
Please note that the expenses shown in the table are meant to highlight your ongoing costs only and do not reflect any transaction costs, such as sales charges (loads) on purchase payments or contingent deferred sales charges on redemptions, if any. Therefore, the hypothetical information is useful in comparing ongoing costs only, and will not help you determine the relative total costs of owning different funds. In addition, if these transaction costs were included, your costs would have been higher.
| | | | | | | | | | | | |
| | | | | ACTUAL | | HYPOTHETICAL
(5% annual return before expenses) | | |
| | | Beginning Account Value (05/01/23) | | Ending Account Value (10/31/23)1 | | Expenses Paid During Period2 | | Ending Account Value (10/31/23) | | Expenses Paid During Period2 | | Annualized Expense Ratio |
Class A | | $1,000.00 | | $1,043.20 | | $5.05 | | $1,020.27 | | $4.99 | | 0.98% |
Class C | | 1,000.00 | | 1,039.10 | | 8.89 | | 1,016.48 | | 8.79 | | 1.73 |
Class P | | 1,000.00 | | 1,043.90 | | 4.28 | | 1,021.02 | | 4.23 | | 0.83 |
Class S | | 1,000.00 | | 1,043.60 | | 4.53 | | 1,020.77 | | 4.48 | | 0.88 |
Class Y | | 1,000.00 | | 1,043.90 | | 3.76 | | 1,021.53 | | 3.72 | | 0.73 |
Class R5 | | 1,000.00 | | 1,044.10 | | 3.45 | | 1,021.83 | | 3.41 | | 0.67 |
Class R6 | | 1,000.00 | | 1,044.50 | | 3.61 | | 1,021.68 | | 3.57 | | 0.70 |
| 1 | The actual ending account value is based on the actual total return of the Fund for the period May 1, 2023 through October 31, 2023, after actual expenses and will differ from the hypothetical ending account value which is based on the Fund’s expense ratio and a hypothetical annual return of 5% before expenses. |
| 2 | Expenses are equal to the Fund’s annualized expense ratio as indicated above multiplied by the average account value over the period, multiplied by 184/365 to reflect the most recent fiscal half year. |
Approval of Investment Advisory and Sub-Advisory Contracts
At meetings held on June 13, 2023, the Board of Trustees (the Board or the Trustees) of AIM Equity Funds (Invesco Equity Funds) as a whole, and the independent Trustees, who comprise over 75% of the Board, voting separately, approved the continuance of the Invesco Summit Fund’s (the Fund) Master Investment Advisory Agreement with Invesco Advisers, Inc. (Invesco Advisers and the investment advisory agreement) and the Master Intergroup Sub-Advisory Contract for Mutual Funds with Invesco Asset Management Deutschland GmbH, Invesco Asset Management Limited, Invesco Asset Management (Japan) Limited, Invesco Hong Kong Limited, Invesco Senior Secured Management, Inc. and Invesco Canada Ltd. (collectively, the Affiliated Sub-Advisers and the sub-advisory contracts) for another year, effective July 1, 2023. After evaluating the factors discussed below, among others, the Board approved the renewal of the Fund’s investment advisory agreement and the sub-advisory contracts and determined that the compensation payable thereunder by the Fund to Invesco Advisers and by Invesco Advisers to the Affiliated Sub-Advisers is fair and reasonable.
The Board’s Evaluation Process
The Board has established an Investments Committee, which in turn has established Sub-Committees, that meet throughout the year to review the performance of funds advised by Invesco Advisers (the Invesco Funds). The Sub-Committees meet regularly with portfolio managers for their assigned Invesco Funds and other members of management to review information about investment performance and portfolio attributes of these funds. The Board has established additional standing and ad hoc committees that meet regularly throughout the year to review matters within their purview, including a working group focused on opportunities to make ongoing and continuous improvements to the annual review process for the Invesco Funds’ investment advisory and sub-advisory contracts. The Board took into account evaluations and reports that it received from its committees and sub-committees, as well as the information provided to the Board and its committees and sub-committees throughout the year, in considering whether to approve each Invesco Fund’s investment advisory agreement and sub-advisory contracts.
As part of the contract renewal process, the Board reviews and considers information provided in response to requests for information submitted to management by the independent Trustees with assistance from legal counsel to the independent Trustees and the Senior Officer, an officer of the Invesco Funds who reports directly to the independent Trustees. The Board receives comparative investment performance and fee and expense data regarding the Invesco Funds prepared by Broadridge Financial Solutions, Inc. (Broadridge), an independent mutual fund data provider, as well as information on the composition of the peer groups provided by Broadridge and its methodology for determining peer groups. The Board also receives an independent written evaluation from the Senior Officer. The Senior Officer’s evaluation is prepared as part of his responsibility to manage the process by which the Invesco Funds’ proposed management fees are negotiated during the annual contract renewal
process to ensure they are negotiated in a manner that is at arms’ length and reasonable in accordance with certain negotiated regulatory requirements. In addition to meetings with Invesco Advisers and fund counsel throughout the year and as part of meetings convened on May 2, 2023 and June 13, 2023, the independent Trustees also discussed the continuance of the investment advisory agreement and sub-advisory contracts in separate sessions with the Senior Officer and with independent legal counsel. Also, as part of the contract renewal process, the independent Trustees reviewed and considered information provided in response to follow-up requests for information submitted by the independent Trustees to management. The independent Trustees met and discussed those follow-up responses with legal counsel to the independent Trustees and the Senior Officer.
The discussion below is a summary of the Senior Officer’s independent written evaluation with respect to the Fund’s investment advisory agreement and sub-advisory contracts, as well as a discussion of the material factors and related conclusions that formed the basis for the Board’s approval of the Fund’s investment advisory agreement and sub-advisory contracts. The Trustees’ review and conclusions are based on the comprehensive consideration of all information presented to them during the course of the year and in prior years and are not the result of any single determinative factor. Moreover, one Trustee may have weighed a particular piece of information or factor differently than another Trustee. The information received and considered by the Board was current as of various dates prior to the Board’s approval on June 13, 2023.
Factors and Conclusions and Summary of Independent Written Fee Evaluation
| A. | Nature, Extent and Quality of Services Provided by Invesco Advisers and the Affiliated Sub-Advisers |
The Board reviewed the nature, extent and quality of the advisory services provided to the Fund by Invesco Advisers under the Fund’s investment advisory agreement, and the credentials and experience of the officers and employees of Invesco Advisers who provide these services, including the Fund’s portfolio manager(s). The Board considered recent senior management changes at Invesco and Invesco Advisers, including the appointment of new Co-Heads of Investments, that had been presented to and discussed with the Board. The Board’s review included consideration of Invesco Advisers’ investment process and oversight, credit analysis, and research capabilities. The Board considered information regarding Invesco Advisers’ programs for and resources devoted to risk management, including management of investment, enterprise, operational, liquidity, derivatives, valuation and compliance risks, and technology used to manage such risks. The Board received information regarding Invesco’s methodology for compensating its investment professionals and the incentives and accountability it creates, as well as how it impacts Invesco’s ability to attract and retain talent. The Board received a description of, and reports related to, Invesco Advisers’ global security program and business continuity plans and of its approach to data privacy and cybersecurity, including related testing. The
Board also considered non-advisory services that Invesco Advisers and its affiliates provide to the Invesco Funds, such as various middle office and back office support functions, third party oversight, internal audit, valuation, portfolio trading and legal and compliance. The Board observed that Invesco Advisers’ systems preparedness and ongoing investment enabled Invesco Advisers to manage, operate and oversee the Invesco Funds with minimal impact or disruption through challenging environments. The Board reviewed and considered the benefits to shareholders of investing in a Fund that is part of the family of funds under the umbrella of Invesco Ltd., Invesco Advisers’ parent company, and noted Invesco Ltd.’s depth and experience in running an investment management business, as well as its commitment of financial and other resources to such business. The Board concluded that the nature, extent and quality of the services provided to the Fund by Invesco Advisers are appropriate and satisfactory.
The Board reviewed the services that may be provided to the Fund by the Affiliated Sub-Advisers under the sub-advisory contracts and the credentials and experience of the officers and employees of the Affiliated Sub-Advisers who provide these services. The Board noted the Affiliated Sub-Advisers’ expertise with respect to certain asset classes and that the Affiliated Sub-Advisers have offices and personnel that are located in financial centers around the world. As a result, the Board noted that the Affiliated Sub-Advisers can provide research and investment analysis on the markets and economies of various countries and territories in which the Fund may invest, make recommendations regarding securities and assist with portfolio trading. The Board concluded that the sub-advisory contracts may benefit the Fund and its shareholders by permitting Invesco Advisers to use the resources and talents of the Affiliated Sub-Advisers in managing the Fund. The Board concluded that the nature, extent and quality of the services that may be provided to the Fund by the Affiliated Sub-Advisers are appropriate and satisfactory.
| B. | Fund Investment Performance |
The Board considered Fund investment performance as a relevant factor in considering whether to approve the investment advisory agreement. The Board did not view Fund investment performance as a relevant factor in considering whether to approve the sub-advisory contracts for the Fund, as no Affiliated Sub-Adviser currently manages assets of the Fund.
The Board compared the Fund’s investment performance over multiple time periods ending December 31, 2022 to the performance of funds in the Broadridge performance universe and against the Russell 1000® Growth Index (Index). The Board noted that performance of Class A shares of the Fund was in the fourth quintile of its performance universe for the one, three and five year periods (the first quintile being the best performing funds and the fifth quintile being the worst performing funds). The Board noted that performance of Class A shares of the Fund was below the performance of the Index for the one, three and five year periods. The Board acknowledged limitations regarding the Broadridge data, in particular that differences may exist between a Fund’s investment objective, principal investment
strategies and/or investment restrictions and those of the funds in its performance universe and specifically that the Fund, unlike many of its peers and the Index, excludes tobacco, alcohol and gambling-related stocks. The Board also considered that the Fund underwent a portfolio management team change in November 2022, and that performance results prior to such date were those of the prior portfolio management team. The Board recognized that the performance data reflects a snapshot in time as of a particular date and that selecting a different performance period could produce different results. The Board also reviewed more recent Fund performance as well as other performance metrics, which did not change its conclusions.
| C. | Advisory and Sub-Advisory Fees and Fund Expenses |
The Board compared the Fund’s contractual management fee rate to the contractual management fee rates of funds in the Fund’s Broadridge expense group. The Board noted that the contractual management fee rate for Class A shares of the Fund was below the median contractual management fee rate of funds in its expense group. The Board noted that the term “contractual management fee” for funds in the expense group may include both advisory and certain non-portfolio management administrative services fees, but that Broadridge is not arable to provide information on a fund-by-fund basis as to what is included. The Board also reviewed the methodology used by Broadridge in calculating expense group information, which includes using each fund’s contractual management fee schedule (including any applicable breakpoints) as reported in the most recent prospectus or statement of additional information for each fund in the expense group. The Board requested and considered additional information from management regarding the Fund’s actual management fees and the levels of the Fund’s breakpoints in light of current asset levels. The Board also considered comparative information regarding the Fund’s total expense ratio and its various components.
The Board noted that Invesco Advisers has contractually agreed to waive fees and/or limit expenses of the Fund for the term disclosed in the Fund’s registration statement in an amount necessary to limit total annual operating expenses to a specified percentage of average daily net assets for each class of the Fund.
The Board noted that Invesco Advisers and the Affiliated Sub-Advisers do not manage other similarly managed mutual funds or client accounts.
The Board also considered the services that may be provided by the Affiliated Sub-Advisers pursuant to the sub-advisory contracts, as well as the fees payable by Invesco Advisers to the Affiliated Sub-Advisers pursuant to the sub-advisory contracts.
| D. | Economies of Scale and Breakpoints |
The Board considered the extent to which there may be economies of scale in the provision of advisory services to the Fund and the Invesco Funds, and the extent to which such economies of scale are shared with the Fund and the Invesco Funds. The Board acknowledged the difficulty in calculating and measuring economies of scale at the individual fund level; noting that only indicative and estimated measures are available at the individual fund level and that such measures are subject to uncertainty. The Board considered that the Fund benefits from economies of scale through contractual breakpoints
in the Fund’s advisory fee schedule, which generally operate to reduce the Fund’s expense ratio as it grows in size. The Board considered information from Invesco Advisers regarding the levels of the Fund’s breakpoints in light of current assets. The Board noted that the Fund also shares in economies of scale through Invesco Advisers’ ability to negotiate lower fee arrangements with third party service providers. The Board noted that the Fund may also benefit from economies of scale through initial fee setting, fee waivers and expense reimbursements, as well as Invesco Advisers’ investment in its business, including investments in business infrastructure, technology and cybersecurity.
| E. | Profitability and Financial Resources |
The Board reviewed information from Invesco Advisers concerning the costs of the advisory and other services that Invesco Advisers and its affiliates provide to the Fund and the Invesco Funds and the profitability of Invesco Advisers and its affiliates in providing these services in the aggregate and on an individual fund-by-fund basis. The Board considered the methodology used for calculating profitability and the periodic review and enhancement of such methodology. The Board noted that Invesco Advisers continues to operate at a net profit from services Invesco Advisers and its affiliates provide to the Invesco Funds in the aggregate and to most Invesco Funds individually. The Board considered that profits to Invesco Advisers can vary significantly depending on the particular Invesco Fund, with some Invesco Funds showing indicative losses to Invesco Advisers and others showing indicative profits at healthy levels, and that Invesco Advisers’ support for and commitment to an Invesco Fund are not, however, solely dependent on the profits realized as to that Fund. The Board did not deem the level of profits realized by Invesco Advisers and its affiliates from providing such services to be excessive, given the nature, extent and quality of the services provided. The Board noted that Invesco Advisers provided information demonstrating that Invesco Advisers is financially sound and has the resources necessary to perform its obligations under the investment advisory agreement, and provided representations indicating that the Affiliated Sub-Advisers are financially sound and have the resources necessary to perform their obligations under the sub-advisory contracts. The Board noted the cyclical and competitive nature of the global asset management industry.
| F. | Collateral Benefits to Invesco Advisers and its Affiliates |
The Board considered various other benefits received by Invesco Advisers and its affiliates from the relationship with the Fund, including the fees received for providing administrative, transfer agency and distribution services to the Fund. The Board received comparative information regarding fees charged for these services, including information provided by Broadridge and other independent sources. The Board reviewed the performance of Invesco Advisers and its affiliates in providing these services and the organizational structure employed to provide these services. The Board noted that these services are provided to the Fund pursuant to written contracts that are reviewed and subject to approval on an annual basis by the Board based on its determination that the services are required for the operation of the Fund.
The Board considered the benefits realized by Invesco Advisers and the Affiliated Sub-Advisers as a result of portfolio brokerage transactions executed
through “soft dollar” arrangements. The Board noted that soft dollar arrangements may result in the Fund bearing costs to purchase research that may be used by Invesco Advisers or the Affiliated Sub-Advisers with other clients and may reduce Invesco Advisers’ or the Affiliated Sub-Advisers’ expenses. The Board also considered that it receives from Invesco Advisers periodic reports that include a representation to the effect that these arrangements are consistent with regulatory requirements. The Board did not deem the soft dollar arrangements to be inappropriate.
The Board considered that the Fund’s uninvested cash and cash collateral from any securities lending arrangements may be invested in registered money market funds or, with regard to securities lending cash collateral, unregistered funds that comply with Rule 2a-7 (collectively referred to as “affiliated money market funds”) advised by Invesco Advisers. The Board considered information regarding the returns of the affiliated money market funds relative to comparable overnight investments, as well as the fees paid by the affiliated money market funds to Invesco Advisers and its affiliates. In this regard, the Board noted that Invesco Advisers receives advisory fees from these affiliated money market funds attributable to the Fund’s investments. The Board also noted that Invesco Advisers has contractually agreed to waive through varying periods an amount equal to 100% of the net advisory fee Invesco Advisers receives from the affiliated money market funds with respect to the Fund’s investment in the affiliated money market funds of uninvested cash, but not cash collateral. The Board concluded that the advisory fees payable to Invesco Advisers from the Fund’s investment of cash collateral from any securities lending arrangements in the affiliated money market funds are for services that are not duplicative of services provided by Invesco Advisers to the Fund.
The Board considered that Invesco Advisers may serve as the Fund’s affiliated securities lending agent and evaluated the benefits realized by Invesco Advisers when serving in such role, including the compensation received. The Board considered Invesco Advisers’ securities lending platform and corporate governance structure for securities lending, including Invesco Advisers’ Securities Lending Governance Committee and its related responsibilities. The Board noted that to the extent the Fund utilizes Invesco Advisers as an affiliated securities lending agent, the Fund conducts its securities lending in accordance with, and in reliance upon, no-action letters issued by the SEC staff that provide guidance on how an affiliate may act as a direct agent lender and receive compensation for those services without obtaining exemptive relief. The Board considered information provided by Invesco Advisers related to the performance of Invesco Advisers as securities lending agent, including a summary of the securities lending services provided to the Fund by Invesco Advisers and the compensation paid to Invesco Advisers for such services, as well as any revenues generated for the Fund in connection with such securities lending activity and the allocation of such revenue between the Fund and Invesco Advisers.
The Board also received information about commissions that an affiliated broker may receive for executing certain trades for the Fund. Invesco Advisers and the Affiliated Sub-Advisers advised the Board of the benefits to the Fund of executing trades through the affiliated broker and that such trades
were executed in compliance with rules under the federal securities laws and consistent with best execution obligations.
Tax Information
Form 1099-DIV, Form 1042-S and other year–end tax information provide shareholders with actual calendar year amounts that should be included in their tax returns. Shareholders should consult their tax advisers.
The following distribution information is being provided as required by the Internal Revenue Code or to meet a specific state’s requirement.
The Fund designates the following amounts or, if subsequently determined to be different, the maximum amount allowable for its fiscal year ended October 31, 2023:
| | | | | | | | |
Federal and State Income Tax | | | | | | |
Long-Term Capital Gain Distributions | | | $212,839,496 | | | | | |
Qualified Dividend Income* | | | 0.00 | % | | | | |
Corporate Dividends Received Deduction* | | | 0.00 | % | | | | |
U.S. Treasury Obligations* | | | 0.00 | % | | | | |
Qualified Business Income* | | | 0.00 | % | | | | |
Business Interest Income* | | | 0.00 | % | | | | |
|
| * The above percentages are based on ordinary income dividends paid to shareholders during the Fund’s fiscal year. | |
Trustees and Officers
The address of each trustee and officer is AIM Equity Funds (Invesco Equity Funds) (the “Trust”), 11 Greenway Plaza, Houston, Texas 77046-1173. The trustees serve for the life of the Trust, subject to their earlier death, incapacitation, resignation, retirement or removal as more specifically provided in the Trust’s organizational documents. Each officer serves for a one year term or until their successors are elected and qualified. Column two below includes length of time served with predecessor entities, if any.
| | | | | | | | |
Name, Year of Birth and Position(s) Held with the Trust | | Trustee and/or Officer Since | | Principal Occupation(s) During Past 5 Years | | Number of Funds in Fund Complex Overseen by Trustee | | Other Directorship(s) Held by Trustee During Past 5 Years |
| Interested Trustee | | | | | | | | |
Martin L. Flanagan1 - 1960 Trustee and Vice Chair | | 2007 | | Chairman Emeritus, Invesco Ltd.; Trustee and Vice Chair, The Invesco Funds; and Member of Executive Board, SMU Cox School of Business Formerly: Executive Director, Chief Executive Officer and President, Invesco Ltd. (ultimate parent of Invesco and a global investment management firm); Vice Chair, Investment Company Institute; Advisor to the Board, Invesco Advisers, Inc. (formerly known as Invesco Institutional (N.A.), Inc.); Chairman and Chief Executive Officer, Invesco Advisers, Inc. (registered investment adviser); Director, Chairman, Chief Executive Officer and President, Invesco Holding Company Limited (parent of Invesco and a global investment management firm); Director, Invesco Ltd.; Chairman, Investment Company Institute and President, Co-Chief Executive Officer, Co-President, Chief Operating Officer and Chief Financial Officer, Franklin Resources, Inc. (global investment management organization) | | 169 | | None |
| 1 | Mr. Flanagan is considered an interested person (within the meaning of Section 2(a)(19) of the 1940 Act) of the Trust because he is an officer of the Adviser to the Trust, and an officer and a director of Invesco Ltd., ultimate parent of the Adviser. |
Trustees and Officers–(continued)
| | | | | | | | |
Name, Year of Birth and Position(s) Held with the Trust | | Trustee and/or Officer Since | | Principal Occupation(s) During Past 5 Years | | Number of Funds in Fund Complex Overseen by Trustee | | Other Directorship(s) Held by Trustee During Past 5 Years |
| Independent Trustees | | | | | | | | |
Beth Ann Brown - 1968 Trustee (2019) and Chair (August 2022) | | 2019 | | Independent Consultant Formerly: Head of Intermediary Distribution, Managing Director, Strategic Relations, Managing Director, Head of National Accounts, Senior Vice President, National Account Manager and Senior Vice President, Key Account Manager, Columbia Management Investment Advisers LLC; Vice President, Key Account Manager, Liberty Funds Distributor, Inc.; and Trustee of certain Oppenheimer Funds | | 169 | | Director, Board of Directors of Caron Engineering Inc.; Advisor, Board of Advisors of Caron Engineering Inc.; President and Director, Acton Shapleigh Youth Conservation Corps (non-profit) Formerly: President and Director Director of Grahamtastic Connection (non-profit) |
Cynthia Hostetler - 1962 Trustee | | 2017 | | Non-Executive Director and Trustee of a number of public and private business corporations Formerly: Director, Aberdeen Investment Funds (4 portfolios); Director, Artio Global Investment LLC (mutual fund complex); Director, Edgen Group, Inc. (specialized energy and infrastructure products distributor); Director, Genesee & Wyoming, Inc. (railroads); Head of Investment Funds and Private Equity, Overseas Private Investment Corporation; President, First Manhattan Bancorporation, Inc.; and Attorney, Simpson Thacher & Bartlett LLP | | 169 | | Resideo Technologies, Inc. (smart home technology); Vulcan Materials Company (construction materials company); Trilinc Global Impact Fund; Textainer Group Holdings, (shipping container leasing company); Investment Company Institute (professional organization); and Independent Directors Council (professional organization) |
Eli Jones - 1961 Trustee | | 2016 | | Professor and Dean Emeritus, Mays Business School - Texas A&M University Formerly: Dean of Mays Business School-Texas A&M University; Professor and Dean, Walton College of Business, University of Arkansas and E.J. Ourso College of Business, Louisiana State University; and Director, Arvest Bank | | 169 | | Insperity, Inc. (formerly known as Administaff) (human resources provider); Board Member of the regional board, First Financial Bank Texas; and Board Member, First Financial Bankshares, Inc. Texas |
Elizabeth Krentzman - 1959 Trustee | | 2019 | | Formerly: Principal and Chief Regulatory Advisor for Asset Management Services and U.S. Mutual Fund Leader of Deloitte & Touche LLP; General Counsel of the Investment Company Institute (trade association); National Director of the Investment Management Regulatory Consulting Practice, Principal, Director and Senior Manager of Deloitte & Touche LLP; Assistant Director of the Division of Investment Management - Office of Disclosure and Investment Adviser Regulation of the U.S. Securities and Exchange Commission and various positions with the Division of Investment Management - Office of Regulatory Policy of the U.S. Securities and Exchange Commission; Associate at Ropes & Gray LLP; and Trustee of certain Oppenheimer Funds | | 169 | | Formerly: Member of the Cartica Funds Board of Directors (private investment fund); Trustee of the University of Florida National Board Foundation; and Member of the University of Florida Law Center Association, Inc. Board of Trustees, Audit Committee and Membership Committee |
Anthony J. LaCava, Jr. - 1956 Trustee | | 2019 | | Formerly: Director and Member of the Audit Committee, Blue Hills Bank (publicly traded financial institution) and Managing Partner, KPMG LLP | | 169 | | Blue Hills Bank; Member and Chairman, Bentley University, Business School Advisory Council; and Nominating Committee, KPMG LLP |
Prema Mathai-Davis - 1950 Trustee | | 1998 | | Retired Formerly: Co-Founder & Partner of Quantalytics Research, LLC, (a FinTech Investment Research Platform for the Self-Directed Investor); Trustee of YWCA Retirement Fund; CEO of YWCA of the USA; Board member of the NY Metropolitan Transportation Authority; Commissioner of the NYC Department of Aging; and Board member of Johns Hopkins Bioethics Institute | | 169 | | Member of Board of Positive Planet US (non-profit) and HealthCare Chaplaincy Network (non-profit) |
Trustees and Officers–(continued)
| | | | | | | | |
Name, Year of Birth and Position(s) Held with the Trust | | Trustee and/or Officer Since | | Principal Occupation(s) During Past 5 Years | | Number of Funds in Fund Complex Overseen by Trustee | | Other Directorship(s) Held by Trustee During Past 5 Years |
| Independent Trustees–(continued) | | | | | | |
Joel W. Motley - 1952 Trustee | | 2019 | | Director of Office of Finance, Federal Home Loan Bank System; Managing Director of Carmona Motley Inc. (privately held financial advisor); Member of the Council on Foreign Relations and its Finance and Budget Committee; Chairman Emeritus of Board of Human Rights Watch and Member of its Investment Committee; and Member of Investment Committee Board of Historic Hudson Valley (non-profit cultural organization); Member of the Board, Blue Ocean Acquisition Corp.; and Member of the Vestry and the Investment Committee of Trinity Church Wall Street. Formerly: Managing Director of Public Capital Advisors, LLC (privately held financial advisor); Managing Director of Carmona Motley Hoffman, Inc. (privately held financial advisor); Trustee of certain Oppenheimer Funds; and Director of Columbia Equity Financial Corp. (privately held financial advisor) | | 169 | | Member of Board of Trust for Mutual Understanding (non-profit promoting the arts and environment); Member of Board of Greenwall Foundation (bioethics research foundation) and its Investment Committee; Member of Board of Friends of the LRC (non-profit legal advocacy); and Board Member and Investment Committee Member of Pulitzer Center for Crisis Reporting (non-profit journalism) |
Teresa M. Ressel - 1962 Trustee | | 2017 | | Non-executive director and trustee of a number of public and private business corporations Formerly: Chief Executive Officer, UBS Securities LLC (investment banking); Chief Operating Officer, UBS AG Americas (investment banking); Sr. Management Team Olayan America, The Olayan Group (international investor/commercial/industrial); and Assistant Secretary for Management & Budget and Designated Chief Financial Officer, U.S. Department of Treasury | | 169 | | None |
Robert C. Troccoli - 1949 Trustee | | 2016 | | Retired Formerly: Adjunct Professor, University of Denver - Daniels College of Business; and Managing Partner, KPMG LLP | | 169 | | None |
Daniel S. Vandivort - 1954 Trustee | | 2019 | | President, Flyway Advisory Services LLC (consulting and property management) Formerly: President and Chief Investment Officer, previously Head of Fixed Income, Weiss Peck and Greer/Robeco Investment Management; Trustee and Chair, Weiss Peck and Greer Funds Board; and various capacities at CS First Boston including Head of Fixed Income at First Boston Asset Management. | | 169 | | Formerly: Trustee and Governance Chair, Oppenheimer Funds; Treasurer, Chairman of the Audit and Finance Committee, Huntington Disease Foundation of America |
Trustees and Officers–(continued)
| | | | | | | | |
Name, Year of Birth and Position(s) Held with the Trust | | Trustee and/or Officer Since | | Principal Occupation(s) During Past 5 Years | | Number of Funds in Fund Complex Overseen by Trustee | | Other Directorship(s) Held by Trustee During Past 5 Years |
| Officers | | | | | | | | |
Glenn Brightman - 1972 President and Principal Executive Officer | | 2023 | | Chief Operating Officer, Americas, Invesco Ltd.; President and Principal Executive Officer, The Invesco Funds. Formerly: Global Head of Finance, Invesco Ltd; Executive Vice President and Chief Financial Officer, Nuveen | | N/A | | N/A |
Melanie Ringold - 1975 Senior Vice President, Chief Legal Officer and Secretary | | 2023 | | Head of Legal of the Americas, Invesco Ltd.; Senior Vice President and Secretary, Invesco Advisers, Inc. (formerly known as Invesco Institutional (N.A.), Inc.) (registered investment adviser); Secretary, Invesco Distributors, Inc. (formerly known as Invesco AIM Distributors, Inc.); Secretary, Invesco Investment Services, Inc. (formerly known as Invesco AIM Investment Services, Inc.); Senior Vice President, Chief Legal Officer and Secretary, The Invesco Funds; Secretary, Invesco Investment Advisers LLC, Invesco Capital Markets, Inc.; Chief Legal Officer, Invesco Exchange-Traded Fund Trust, Invesco Exchange-Traded Fund Trust II, Invesco India Exchange-Traded Fund Trust, Invesco Actively Managed Exchange-Traded Fund Trust, Invesco Actively Secretary and Vice President, Harbourview Asset Management Corporation; Secretary and Senior Vice President, OppenheimerFunds, Inc. and Invesco Managed Accounts, LLC; Secretary and Senior Vice President, OFI SteelPath, Inc.; Secretary and Senior Vice President, Oppenheimer Acquisition Corp.; Secretary, SteelPath Funds Remediation LLC; and Secretary and Senior Vice President, Trinity Investment Management Corporation Formerly: Assistant Secretary, Invesco Distributors, Inc., Invesco Advisers, Inc., Invesco Investment Services, Inc., Invesco Capital Markets, Inc., Invesco Capital Management LLC and Invesco Investment Advisers LLC; and Assistant Secretary and Investment Vice President, Invesco Funds | | N/A | | N/A |
Andrew R. Schlossberg - 1974 Senior Vice President | | 2019 | | Chief Executive Officer, President and Executive Director, Invesco Ltd.; Senior Vice President, Invesco Group Services, Inc.; Director and Senior Vice President, Invesco Advisers, Inc. (formerly known as Invesco Institutional (N.A.), Inc.) (registered investment adviser); Director and Chairman, Invesco Investment Services, Inc. (formerly known as Invesco AIM Investment Services, Inc.) (registered transfer agent); Senior Vice President, The Invesco Funds and Trustee, Invesco Foundation, Inc. Formerly: Head of the Americas and Senior Managing Director, Invesco Ltd.; Director, Invesco Investment Advisers LLC (formerly known as Van Kampen Asset Management); Director, President and Chairman, Invesco Insurance Agency, Inc.; Director, Invesco UK Limited; Director and Chief Executive, Invesco Asset Management Limited and Invesco Fund Managers Limited; Assistant Vice President, The Invesco Funds; Senior Vice President, Invesco Advisers, Inc. (formerly known as Invesco Institutional (N.A.), Inc.) (registered investment adviser); Director and Chief Executive, Invesco Administration Services Limited and Invesco Global Investment Funds Limited; Director, Invesco Distributors, Inc.; Head of EMEA, Invesco Ltd.; President, Invesco Actively Managed Exchange-Traded Commodity Fund Trust, Invesco Actively Managed Exchange-Traded Fund Trust, Invesco Exchange-Traded Fund Trust, Invesco Exchange-Traded Fund Trust II and Invesco India Exchange-Traded Fund Trust; and Managing Director and Principal Executive Officer, Invesco Capital Management LLC | | N/A | | N/A |
Trustees and Officers–(continued)
| | | | | | | | |
Name, Year of Birth and Position(s) Held with the Trust | | Trustee and/or Officer Since | | Principal Occupation(s) During Past 5 Years | | Number of Funds in Fund Complex Overseen by Trustee | | Other Directorship(s) Held by Trustee During Past 5 Years |
| Officers–(continued) | | | | | | | | |
John M. Zerr - 1962 Senior Vice President | | 2006 | | Chief Operating Officer of the Americas; Senior Vice President, Invesco Advisers, Inc. (formerly known as Invesco Institutional (N.A.), Inc.) (registered investment adviser); Senior Vice President, Invesco Distributors, Inc. (formerly known as Invesco AIM Distributors, Inc.); Director and Vice President, Invesco Investment Services, Inc. (formerly known as Invesco AIM Investment Services, Inc.) Senior Vice President, The Invesco Funds; Managing Director, Invesco Capital Management LLC; Senior Vice President, Invesco Capital Markets, Inc. (formerly known as Van Kampen Funds Inc.); Manager, Invesco Indexing LLC; Manager, Invesco Specialized Products, LLC; Member, Invesco Canada Funds Advisory Board; Director, President and Chief Executive Officer, Invesco Corporate Class Inc. (corporate mutual fund company); Director, Chairman, President and Chief Executive Officer, Invesco Canada Ltd. (formerly known as Invesco Trimark Ltd./Invesco Trimark Ltèe) (registered investment adviser and registered transfer agent); President, Invesco, Inc.; President, Invesco Global Direct Real Estate Feeder GP Ltd.; President, Invesco IP Holdings (Canada) Ltd; President, Invesco Global Direct Real Estate GP Ltd.; President, Invesco Financial Services Ltd. / Services Financiers Invesco Ltée; and Director and Chairman, Invesco Trust Company Formerly: Director, Invesco Investment Advisers LLC (formerly known as Van Kampen Asset Management); President, Trimark Investments Ltd/Services Financiers Invesco Ltee; Director and Senior Vice President, Invesco Insurance Agency, Inc.; Director and Senior Vice President, Invesco Management Group, Inc. (formerly known as Invesco AIM Management Group, Inc.); Secretary and General Counsel, Invesco Management Group, Inc. (formerly known as Invesco AIM Management Group, Inc.); Secretary, Invesco Investment Services, Inc. (formerly known as Invesco AIM Investment Services, Inc.); Chief Legal Officer and Secretary, The Invesco Funds; Secretary and General Counsel, Invesco Investment Advisers LLC (formerly known as Van Kampen Asset Management); Secretary and General Counsel, Invesco Capital Markets, Inc. (formerly known as Van Kampen Funds Inc.); Chief Legal Officer, Invesco Exchange-Traded Fund Trust, Invesco Exchange-Traded Fund Trust II, Invesco India Exchange-Traded Fund Trust, Invesco Actively Managed Exchange-Traded Fund Trust, Invesco Actively Managed Exchange-Traded Commodity Fund Trust and Invesco Exchange-Traded Self-Indexed Fund Trust; Secretary, Invesco Indexing LLC; Director, Secretary, General Counsel and Senior Vice President, Van Kampen Exchange Corp.; Director, Vice President and Secretary, IVZ Distributors, Inc. (formerly known as INVESCO Distributors, Inc.); Director and Vice President, INVESCO Funds Group, Inc.; Director and Vice President, Van Kampen Advisors Inc.; Director, Vice President, Secretary and General Counsel, Van Kampen Investor Services Inc.; Director and Secretary, Invesco Distributors, Inc. (formerly known as Invesco AIM Distributors, Inc.); Director, Senior Vice President, General Counsel and Secretary, Invesco AIM Advisers, Inc. and Van Kampen Investments Inc.; Director, Vice President and Secretary, Fund Management Company; Director, Senior Vice President, Secretary, General Counsel and Vice President, Invesco AIM Capital Management, Inc.; and Chief Operating Officer and General Counsel, Liberty Ridge Capital, Inc. (an investment adviser) | | N/A | | N/A |
Tony Wong - 1973 Senior Vice President | | 2023 | | Senior Managing Director, Invesco Ltd.; Director, Chairman, Chief Executive Officer and President, Invesco Advisers, Inc.; Director and Chairman, Invesco Private Capital, Inc., INVESCO Private Capital Investments, Inc. and INVESCO Realty, Inc.; Director, Invesco Senior Secured Management, Inc.; President, Invesco Managed Accounts, LLC and SNW Asset Management Corporation; and Senior Vice President, The Invesco Funds Formerly: Assistant Vice President, The Invesco Funds; and Vice President, Invesco Advisers, Inc. | | N/A | | N/A |
Stephanie C. Butcher - 1971 Senior Vice President | | 2023 | | Senior Managing Director, Invesco Ltd.; Senior Vice President, The Invesco Funds; Director and Chief Executive Officer, Invesco Asset Management Limited | | N/A | | N/A |
Adrien Deberghes - 1967 Principal Financial Officer, Treasurer and Senior Vice President | | 2020 | | Head of the Fund Office of the CFO and Fund Administration; Vice President, Invesco Advisers, Inc.; Principal Financial Officer, Treasurer and Senior Vice President, The Invesco Funds; Vice President, Invesco Exchange-Traded Fund Trust, Invesco Exchange-Traded Fund Trust II, Invesco India Exchange-Traded Fund Trust, Invesco Actively Managed Exchange-Traded Fund Trust, Invesco Actively Managed Exchange-Traded Commodity Fund Trust and Invesco Exchange-Traded Self-Indexed Fund Trust Formerly: Vice President, The Invesco Funds; Senior Vice President and Treasurer, Fidelity Investments | | N/A | | N/A |
Crissie M. Wisdom - 1969 Anti-Money Laundering Compliance Officer | | 2013 | | Anti-Money Laundering and OFAC Compliance Officer for Invesco U.S. entities including: Invesco Advisers, Inc. and its affiliates, Invesco Capital Markets, Inc., Invesco Distributors, Inc., Invesco Investment Services, Inc., The Invesco Funds, Invesco Capital Management, LLC, Invesco Trust Company; and Fraud Prevention Manager for Invesco Investment Services, Inc. | | N/A | | N/A |
Trustees and Officers–(continued)
| | | | | | | | |
Name, Year of Birth and Position(s) Held with the Trust | | Trustee and/or Officer Since | | Principal Occupation(s) During Past 5 Years | | Number of Funds in Fund Complex Overseen by Trustee | | Other Directorship(s) Held by Trustee During Past 5 Years |
| Officers–(continued) | | | | | | | | |
Todd F. Kuehl - 1969 Chief Compliance Officer and Senior Vice President | | 2020 | | Chief Compliance Officer, Invesco Advisers, Inc. (registered investment adviser); and Chief Compliance Officer and Senior Vice President, The Invesco Funds Formerly: Managing Director and Chief Compliance Officer, Legg Mason (Mutual Funds); Chief Compliance Officer, Legg Mason Private Portfolio Group (registered investment adviser) | | N/A | | N/A |
James Bordewick, Jr. - 1959 Senior Vice President and Senior Officer | | 2022 | | Senior Vice President and Senior Officer, The Invesco Funds Formerly: Chief Legal Officer, KingsCrowd, Inc. (research and analytical platform for investment in private capital markets); Chief Operating Officer and Head of Legal and Regulatory, Netcapital (private capital investment platform); Managing Director, General Counsel of asset management and Chief Compliance Officer for asset management and private banking, Bank of America Corporation; Chief Legal Officer, Columbia Funds and BofA Funds; Senior Vice President and Associate General Counsel, MFS Investment Management; Chief Legal Officer, MFS Funds; Associate, Ropes & Gray; and Associate, Gaston Snow & Ely Bartlett | | N/A | | N/A |
The Statement of Additional Information of the Trust includes additional information about the Fund’s Trustees and is available upon request, without charge, by calling 1.800.959.4246. Please refer to the Fund’s Statement of Additional Information for information on the Fund’s sub-advisers.
| | | | | | |
| Office of the Fund | | Investment Adviser | | Distributor | | Auditors |
| 11 Greenway Plaza | | Invesco Advisers, Inc. | | Invesco Distributors, Inc. | | PricewaterhouseCoopers LLP |
| Houston, TX 77046-1173 | | 1331 Spring Street, NW, Suite 2500 | | 11 Greenway Plaza | | 1000 Louisiana Street, Suite 5800 |
| | Atlanta, GA 30309 | | Houston, TX 77046-1173 | | Houston, TX 77002-5021 |
| | | |
| Counsel to the Fund | | Counsel to the Independent Trustees | | Transfer Agent | | Custodian |
| Stradley Ronon Stevens & Young, LLP | | Sidley Austin LLP | | Invesco Investment Services, Inc. | | State Street Bank and Trust Company |
| 2005 Market Street, Suite 2600 | | 787 Seventh Avenue | | 11 Greenway Plaza | | 225 Franklin Street |
| Philadelphia, PA 19103-7018 | | New York, NY 10019 | | Houston, TX 77046-1173 | | Boston, MA 02110-2801 |
(This page intentionally left blank)
(This page intentionally left blank)
(This page intentionally left blank)

Go paperless with eDelivery
Visit invesco.com/edelivery to enjoy the convenience and security of anytime electronic access to your investment documents.
With eDelivery, you can elect to have any or all of the following materials delivered straight to your inbox to download, save and print from your own computer:
∎ Fund reports and prospectuses
∎ Quarterly statements
∎ Daily confirmations
∎ Tax forms
Invesco mailing information
Send general correspondence to Invesco Investment Services, Inc., P.O. Box 219078, Kansas City, MO 64121-9078.
Important notice regarding delivery of security holder documents
To reduce Fund expenses, only one copy of most shareholder documents may be mailed to shareholders with multiple accounts at the same address (Householding). Mailing of your shareholder documents may be householded indefinitely unless you instruct us otherwise. If you do not want the mailing of these documents to be combined with those for other members of your household, please contact Invesco Investment Services, Inc. at 800 959 4246 or contact your financial institution. We will begin sending you individual copies for each account within 30 days after receiving your request.
Fund holdings and proxy voting information
The Fund provides a complete list of its portfolio holdings four times each year, at the end of each fiscal quarter. For the second and fourth quarters, the list appears, respectively, in the Fund’s semiannual and annual reports to shareholders. For the first and third quarters, the Fund files the list with the Securities and Exchange Commission (SEC) as an exhibit to its reports on Form N-PORT. The most recent list of portfolio holdings is available at invesco.com/completeqtrholdings. Shareholders can also look up the Fund’s Form N-PORT filings on the SEC website, sec.gov. The SEC file numbers for the Fund are shown below.
A description of the policies and procedures that the Fund uses to determine how to vote proxies relating to portfolio securities is available without charge, upon request, from our Client Services department at 800 959 4246, or at invesco.com/corporate/about-us/esg. The information is also available on the SEC website, sec.gov.
Information regarding how the Fund voted proxies related to its portfolio securities during the most recent 12-month period ended June 30 is available at invesco.com/proxysearch. This information is also available on the SEC website, sec.gov.
Invesco Advisers, Inc. is an investment adviser; it provides investment advisory services to individual and institutional clients and does not sell securities. Invesco Distributors, Inc. is the US distributor for Invesco Ltd.’s retail mutual funds, exchange-traded funds and institutional money market funds. Both are wholly owned, indirect subsidiaries of Invesco Ltd.
| | | | |
| SEC file number(s): 811-01424 and 002-25469 | | Invesco Distributors, Inc. | | SUM-AR-1 |
(b) Not applicable.
There were no amendments to the Code of Ethics (the “Code”) that applies to the Registrant’s Principal Executive Officer (“PEO”) and Principal Financial Officer (“PFO”) during the period covered by the report. The Registrant did not grant any waivers, including implicit waivers, from any provisions of the Code to the PEO or PFO during the period covered by this report.
| ITEM 3. | AUDIT COMMITTEE FINANCIAL EXPERT. |
The Board of Trustees has determined that the Registrant has at least one audit committee financial expert serving on its Audit Committee. The Audit Committee financial experts are Cynthia Hostetler, Anthony J. LaCava, Jr., and Robert C. Troccoli. Cynthia Hostetler, Anthony J. LaCava, Jr., and Robert C. Troccoli are “independent” within the meaning of that term as used in Form N-CSR.
| ITEM 4. | PRINCIPAL ACCOUNTANT FEES AND SERVICES. |
(a) to (d)
Fees Billed by PwC Related to the Registrant
PricewaterhouseCoopers LLP (“PwC”), the Registrant’s independent registered public accounting firm, billed the Registrant aggregate fees for services rendered to the Registrant for the last two fiscal years as shown in the following table. The Audit Committee pre-approved all audit and non-audit services provided to the Registrant.
| | | | | | | | |
| | | Fees Billed for
Services Rendered
to the Registrant for
fiscal year end 2023 | | | | Fees Billed for
Services Rendered
to the Registrant for
fiscal year end 2022 | | |
| | | | | | | | |
Audit Fees | | $ 199,748 | | | | $ 191,294 | | |
Audit-Related Fees | | $ 0 | | | | $ 0 | | |
Tax Fees(1) | | $ 156,494 | | | | $ 128,037 | | |
All Other Fees | | $ 0 | | | | $ 0 | | |
Total Fees | | $ 356,242 | | | | $ 319,331 | | |
| | (1) | Tax Fees for the fiscal years ended 2023 and 2022 includes fees billed for preparation of U.S. Tax Returns and Taxable Income calculations, including excise tax and year-to-date estimates for various book-to-tax differences. |
Fees Billed by PwC Related to Invesco and Affiliates
PwC billed Invesco Advisers, Inc. (“Invesco”), the Registrant’s investment adviser, and any entity controlling, controlled by or under common control with Invesco that provides ongoing services to the Registrant (“Affiliates”) aggregate fees for pre-approved non-audit services rendered to Invesco and Affiliates for the last two fiscal years as shown in the following table. The Audit Committee pre-approved all non-audit services provided to Invesco and Affiliates that were required to be pre-approved.
| | | | | | | | |
| | | Fees Billed for Non- Audit Services
Rendered to Invesco and
Invesco Affiliates for
fiscal year end 2023
That Were Required to be Pre-Approved by the Registrant’s Audit Committee | | | | Fees Billed for Non-Audit
Services Rendered to
Invesco and Invesco
Affiliates for fiscal year end
2022 That Were Required to be Pre-Approved by the Registrant’s Audit Committee | | |
Audit-Related Fees(1) | | $ 1,067,000 | | | | $ 760,000 | | |
Tax Fees | | $ 0 | | | | $ 0 | | |
All Other Fees | | $ 0 | | | | $ 0 | | |
Total Fees | | $ 1,067,000
| | | | $ 760,000 | | |
(1) Audit-Related Fees for the fiscal years ended 2023 and 2022 include fees billed related to reviewing controls at a service organization.
(e)(1)
PRE-APPROVAL OF AUDIT AND NON-AUDIT SERVICES
POLICIES AND PROCEDURES
As adopted by the Audit Committees
of the Invesco Funds (the “Funds”)
Last Amended March 29, 2017
| | I. | Statement of Principles |
The Audit Committees (the “Audit Committee”) of the Boards of Trustees of the Funds (the “Board”) have adopted these policies and procedures (the “Procedures”) with respect to the pre-approval of audit and non-audit services to be provided by the Funds’ independent auditor (the “Auditor”) to the Funds, and to the Funds’ investment adviser(s) and any entity controlling, controlled by, or under common control with the investment adviser(s) that provides ongoing services to the Funds (collectively, “Service Affiliates”).
Under Section 202 of the Sarbanes-Oxley Act of 2002, all audit and non-audit services provided to the Funds by the Auditor must be preapproved by the Audit Committee. Rule 2-01 of Regulation S-X requires that the Audit Committee also pre-approve a Service Affiliate’s engagement of the Auditor for non-audit services if the engagement relates directly to the operations and financial reporting of the Funds (a “Service Affiliate’s Covered Engagement”).
These Procedures set forth the procedures and the conditions pursuant to which the Audit Committee may pre-approve audit and non-audit services for the Funds and a Service Affiliate’s Covered Engagement pursuant to rules and regulations of the Securities and Exchange Commission (“SEC”) and other
organizations and regulatory bodies applicable to the Funds (“Applicable Rules”).1 They address both general pre-approvals without consideration of specific case-by-case services (“general pre-approvals”) and pre-approvals on a case-by-case basis (“specific pre-approvals”). Any services requiring pre-approval that are not within the scope of general pre-approvals hereunder are subject to specific pre-approval. These Procedures also address the delegation by the Audit Committee of pre-approval authority to the Audit Committee Chair or Vice Chair.
| | II. | Pre-Approval of Fund Audit Services |
The annual Fund audit services engagement, including terms and fees, is subject to specific pre-approval by the Audit Committee. Audit services include the annual financial statement audit and other procedures required to be performed by an independent auditor to be able to form an opinion on the Funds’ financial statements. The Audit Committee will receive, review and consider sufficient information concerning a proposed Fund audit engagement to make a reasonable evaluation of the Auditor’s qualifications and independence. The Audit Committee will oversee the Fund audit services engagement as necessary, including approving any changes in terms, audit scope, conditions and fees.
In addition to approving the Fund audit services engagement at least annually and specifically approving any changes, the Audit Committee may generally or specifically pre-approve engagements for other audit services, which are those services that only an independent auditor reasonably can provide. Other audit services may include services associated with SEC registration statements, periodic reports and other documents filed with the SEC.
| | III. | General and Specific Pre-Approval of Non-Audit Fund Services |
The Audit Committee will consider, at least annually, the list of General Pre-Approved Non-Audit Services which list may be terminated or modified at any time by the Audit Committee. To inform the Audit Committee’s review and approval of General Pre-Approved Non-Audit Services, the Funds’ Treasurer (or his or her designee) and Auditor shall provide such information regarding independence or other matters as the Audit Committee may request.
Any services or fee ranges that are not within the scope of General Pre-Approved Non-Audit Services have not received general pre-approval and require specific pre-approval. Each request for specific pre-approval by the Audit Committee for services to be provided by the Auditor to the Funds must be submitted to the Audit Committee by the Funds’ Treasurer (or his or her designee) and must include detailed information about the services to be provided, the fees or fee ranges to be charged, and other relevant information sufficient to allow the Audit Committee to consider whether to pre-approve such engagement, including evaluating whether the provision of such services will impair the independence of the Auditor and is otherwise consistent with Applicable Rules.
| | IV. | Non-Audit Service Types |
The Audit Committee may provide either general or specific pre-approval of audit-related, tax or other services, each as described in more detail below.
| | (a) | Audit-Related Services |
1 Applicable Rules include, for example, New York Stock Exchange (“NYSE”) rules applicable to closed-end funds managed by Invesco and listed on NYSE.
“Audit-related services” are assurance and related services that are reasonably related to the performance of the audit or review of the Fund’s financial statements or that are traditionally performed by an independent auditor. Audit-related services include, among others, accounting consultations related to accounting, financial reporting or disclosure matters not classified as “Audit services”; assistance with understanding and implementing new accounting and financial reporting guidance from rulemaking authorities; services related to mergers, acquisitions or dispositions; compliance with ratings agency requirements and interfund lending activities; and assistance with internal control reporting requirements.
“Tax services” include, but are not limited to, the review and signing of the Funds’ federal tax returns, the review of required distributions by the Funds and consultations regarding tax matters such as the tax treatment of new investments or the impact of new regulations. The Audit Committee will not approve proposed services of the Auditor which the Audit Committee believes are to be provided in connection with a service or transaction initially recommended by the Auditor, the sole business purpose of which may be tax avoidance and the tax treatment of which may not be supported in the Internal Revenue Code and related regulations. The Audit Committee will consult with the Funds’ Treasurer (or his or her designee) and may consult with outside counsel or advisers as necessary to ensure the consistency of tax services rendered by the Auditor with the foregoing policy. The Auditor shall not represent any Fund or any Service Affiliate before a tax court, district court or federal court of claims.
Each request to provide tax services under either the general or specific pre-approval of the Audit Committee will include a description from the Auditor in writing of (i) the scope of the service, the fee structure for the engagement, and any side letter or other amendment to the engagement letter, or any other agreement (whether oral, written, or otherwise) between the Auditor and the Funds, relating to the service; and (ii) any compensation arrangement or other agreement, such as a referral agreement, a referral fee or fee-sharing arrangement, between the Auditor (or an affiliate of the Auditor) and any person (other than the Funds or Service Affiliates receiving the services) with respect to the promoting, marketing, or recommending of a transaction covered by the service. The Auditor will also discuss with the Audit Committee the potential effects of the services on the independence of the Auditor, and document the substance of its discussion with the Audit Committee.
The Audit Committee may pre-approve other non-audit services so long as the Audit Committee believes that the service will not impair the independence of the Auditor. Appendix I includes a list of services that the Auditor is prohibited from performing by the SEC rules. Appendix I also includes a list of services that would impair the Auditor’s independence unless the Audit Committee reasonably concludes that the results of the services will not be subject to audit procedures during an audit of the Funds’ financial statements.
| | V. | Pre-Approval of Service Affiliate’s Covered Engagements |
Rule 2-01 of Regulation S-X requires that the Audit Committee pre-approve a Service Affiliate’s engagement of the Auditor for non-audit services if the engagement relates directly to the operations and financial reporting of the Funds, defined above as a “Service Affiliate’s Covered Engagement”.
The Audit Committee may provide either general or specific pre-approval of any Service Affiliate’s Covered Engagement, including for audit-related, tax or other services, as described above, if the Audit Committee believes that the provision of the services to a Service Affiliate will not impair the independence of the Auditor with respect to the Funds. Any Service Affiliate’s Covered Engagements that are not within
the scope of General Pre-Approved Non-Audit Services have not received general pre-approval and require specific pre-approval.
Each request for specific pre-approval by the Audit Committee of a Service Affiliate’s Covered Engagement must be submitted to the Audit Committee by the Funds’ Treasurer (or his or her designee) and must include detailed information about the services to be provided, the fees or fee ranges to be charged, a description of the current status of the pre-approval process involving other audit committees in the Invesco investment company complex (as defined in Rule 2-201 of Regulation S-X) with respect to the proposed engagement, and other relevant information sufficient to allow the Audit Committee to consider whether the provision of such services will impair the independence of the Auditor from the Funds. Additionally, the Funds’ Treasurer (or his or her designee) and the Auditor will provide the Audit Committee with a statement that the proposed engagement requires pre-approval by the Audit Committee, the proposed engagement, in their view, will not impair the independence of the Auditor and is consistent with Applicable Rules, and the description of the proposed engagement provided to the Audit Committee is consistent with that presented to or approved by the Invesco audit committee.
Information about all Service Affiliate engagements of the Auditor for non-audit services, whether or not subject to pre-approval by the Audit Committee, shall be provided to the Audit Committee at least quarterly, to allow the Audit Committee to consider whether the provision of such services is compatible with maintaining the Auditor’s independence from the Funds. The Funds’ Treasurer and Auditor shall provide the Audit Committee with sufficiently detailed information about the scope of services provided and the fees for such services, to ensure that the Audit Committee can adequately consider whether the provision of such services is compatible with maintaining the Auditor’s independence from the Fund
| | VI. | Pre-Approved Fee Levels or Established Amounts |
Pre-approved fee levels or ranges for audit and non-audit services to be provided by the Auditor to the Funds, and for a Service Affiliate’s Covered Engagement, under general pre-approval or specific pre-approval will be set periodically by the Audit Committee. Any proposed fees exceeding 110% of the maximum pre-approved fee levels or ranges for such services or engagements will be promptly presented to the Audit Committee and will require specific pre-approval by the Audit Committee before payment of any additional fees is made.
The Audit Committee hereby delegates, subject to the dollar limitations set forth below, specific authority to its Chair, or in his or her absence, Vice Chair, to pre-approve audit and non-audit services proposed to be provided by the Auditor to the Funds and/or a Service Affiliate’s Covered Engagement, between Audit Committee meetings. Such delegation does not preclude the Chair or Vice Chair from declining, on a case by case basis, to exercise his or her delegated authority and instead convening the Audit Committee to consider and pre-approve any proposed services or engagements.
Notwithstanding the foregoing, the Audit Committee must pre-approve: (a) any non-audit services to be provided to the Funds for which the fees are estimated to exceed $500,000; (b) any Service Affiliate’s Covered Engagement for which the fees are estimated to exceed $500,000; or (c) any cost increase to any previously approved service or engagement that exceeds the greater of $250,000 or 50% of the previously approved fees up to a maximum increase of $500,000.
| | VIII. | Compliance with Procedures |
Notwithstanding anything herein to the contrary, failure to pre-approve any services or engagements that are not required to be pre-approved pursuant to the de minimis exception provided for in Rule 2-01(c)(7)(i)(C) of Regulation S-X shall not constitute a violation of these Procedures. The Audit Committee has designated the Funds’ Treasurer to ensure services and engagements are pre-approved in compliance with these Procedures. The Funds’ Treasurer will immediately report to the Chair of the Audit Committee, or the Vice Chair in his or her absence, any breach of these Procedures that comes to the attention of the Funds’ Treasurer or any services or engagements that are not required to be pre-approved pursuant to the de minimis exception provided for in Rule 2-01(c)(7)(i)(C) of Regulation S-X.
On at least an annual basis, the Auditor will provide the Audit Committee with a summary of all non-audit services provided to any entity in the investment company complex (as defined in section 2-01(f)(14) of Regulation S-X, including the Funds and Service Affiliates) that were not pre-approved, including the nature of services provided and the associated fees.
| | IX. | Amendments to Procedures |
All material amendments to these Procedures must be approved in advance by the Audit Committee. Non-material amendments to these Procedures may be made by the Legal and Compliance Departments and will be reported to the Audit Committee at the next regularly scheduled meeting of the Audit Committee.
Appendix I
Non-Audit Services That May Impair the Auditor’s Independence
The Auditor is not independent if, at any point during the audit and professional engagement, the Auditor provides the following non-audit services:
| | ● | | Broker-dealer, investment adviser, or investment banking services; |
| | ● | | Expert services unrelated to the audit; |
| | ● | | Any service or product provided for a contingent fee or a commission; |
| | ● | | Services related to marketing, planning, or opining in favor of the tax treatment of confidential transactions or aggressive tax position transactions, a significant purpose of which is tax avoidance; |
| | ● | | Tax services for persons in financial reporting oversight roles at the Fund; and |
| | ● | | Any other service that the Public Company Oversight Board determines by regulation is impermissible. |
An Auditor is not independent if, at any point during the audit and professional engagement, the Auditor provides the following non-audit services unless it is reasonable to conclude that the results of the services will not be subject to audit procedures during an audit of the Funds’ financial statements:
| | ● | | Bookkeeping or other services related to the accounting records or financial statements of the audit client; |
| | ● | | Financial information systems design and implementation; |
| | ● | | Appraisal or valuation services, fairness opinions, or contribution-in-kind reports; |
| | ● | | Actuarial services; and |
| | ● | | Internal audit outsourcing services. |
(e)(2) There were no amounts that were pre-approved by the Audit Committee pursuant to the de minimus exception under Rule 2-01 of Regulation S-X.
(f) Not applicable.
(g) In addition to the amounts shown in the tables above, PwC billed Invesco and Invesco Affiliates aggregate fees of $6,507,000 for the fiscal year ended October 31, 2023 and $6,370,000 for the fiscal year ended October 31, 2022. In total, PwC billed the Registrant, Invesco and Invesco Affiliates aggregate non-audit fees of $7,730,494 for the fiscal year ended October 31, 2023 and $7,258,037 for the fiscal year ended October 31, 2022.
PwC provided audit services to the Investment Company complex of approximately $33 million.
(h) The Audit Committee also has considered whether the provision of non-audit services that were rendered to Invesco and Invesco Affiliates that were not required to be pre-approved pursuant to SEC regulations, if any, is compatible with maintaining PwC’s independence.
(i) Not applicable
(j) Not applicable
| ITEM 5. | AUDIT COMMITTEE OF LISTED REGISTRANTS. |
Not applicable.
| ITEM 6. | SCHEDULE OF INVESTMENTS. |
Investments in securities of unaffiliated issuers is included as part of the reports to stockholders filed under Item 1 of this Form.
| ITEM 7. | DISCLOSURE OF PROXY VOTING POLICIES AND PROCEDURES FOR CLOSED-END MANAGEMENT INVESTMENT COMPANIES. |
Not applicable.
| ITEM 8. | PORTFOLIO MANAGERS OF CLOSED-END MANAGEMENT COMPANIES. |
Not applicable.
| ITEM 9. | PURCHASES OF EQUITY SECURITIES BY CLOSED-END MANAGEMENT INVESTMENT COMPANY AND AFFILIATED PURCHASERS. |
Not applicable.
| ITEM 10. | SUBMISSION OF MATTERS TO A VOTE OF SECURITY HOLDERS. |
None.
| ITEM 11. | CONTROLS AND PROCEDURES. |
| | (a) | As of December 14, 2023, an evaluation was performed under the supervision and with the participation of the officers of the Registrant, including the PEO and PFO, to assess the effectiveness of the Registrant’s disclosure controls and procedures, as that term is defined in Rule 30a-3(c) under the Investment Company Act of 1940 (the “Act”), as amended. Based on that evaluation, the Registrant’s officers, including the PEO and PFO, concluded that, as of December 14, 2023, the Registrant’s disclosure controls and procedures were reasonably |
| | designed to ensure: (1) that information required to be disclosed by the Registrant on Form N-CSR is recorded, processed, summarized and reported within the time periods specified by the rules and forms of the Securities and Exchange Commission; and (2) that material information relating to the Registrant is made known to the PEO and PFO as appropriate to allow timely decisions regarding required disclosure. |
| | (b) | There have been no changes in the Registrant’s internal control over financial reporting (as defined in Rule 30a-3(d) under the Act) that occurred during the period covered by this report that have materially affected, or are reasonably likely to materially affect, the Registrant’s internal control over financial reporting. |
| ITEM 12. | DISCLOSURE OF SECURITIES LENDING ACTIVITIES FOR CLOSED-END MANAGEMENT INVESTMENT COMPANIES. |
Not applicable.
SIGNATURES
Pursuant to the requirements of the Securities Exchange Act of 1934 and the Investment Company Act of 1940, the Registrant has duly caused this report to be signed on its behalf by the undersigned, thereunto duly authorized.
Registrant: AIM Equity Funds (Invesco Equity Funds)
| | |
By: | | /s/ Glenn Brightman |
| | Glenn Brightman |
| | Principal Executive Officer |
| |
Date: | | January 3, 2024 |
Pursuant to the requirements of the Securities and Exchange Act of 1934 and the Investment Company Act of 1940, this report has been signed below by the following persons on behalf of the Registrant and in the capacities and on the dates indicated.
| | |
By: | | /s/ Glenn Brightman |
| | Glenn Brightman |
| | Principal Executive Officer |
| |
Date: | | January 3, 2024 |
| | |
By: | | /s/ Adrien Deberghes |
| | Adrien Deberghes |
| | Principal Financial Officer |
| |
Date: | | January 3, 2024 |