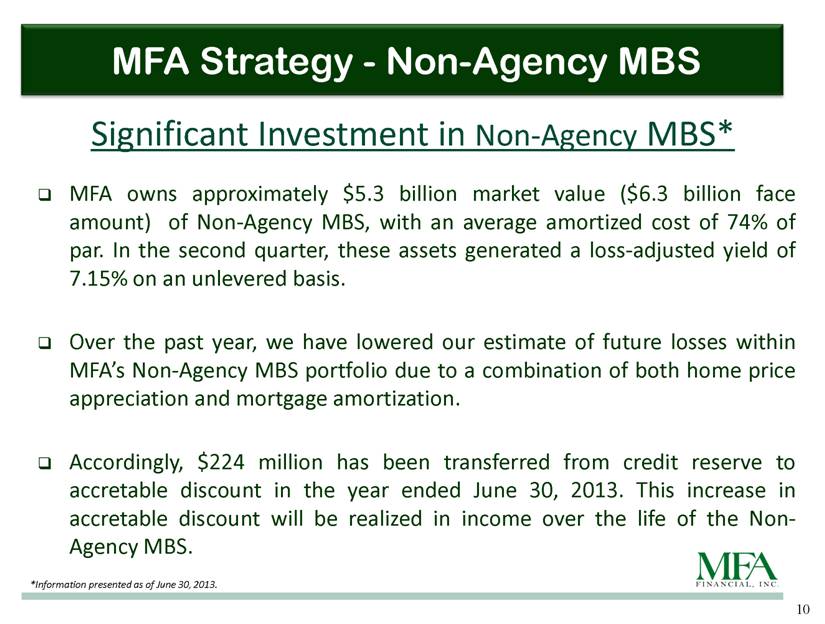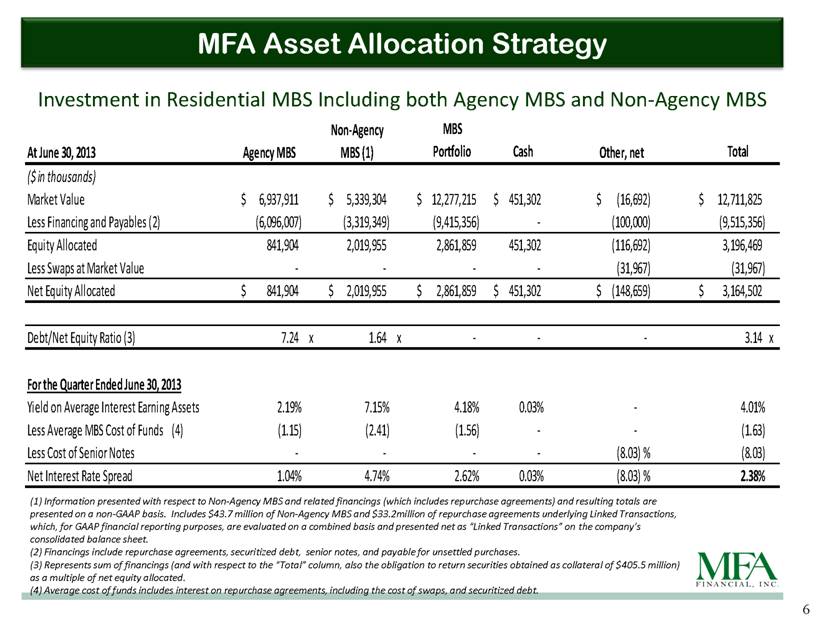
| MFA Asset Allocation Strategy Investment in Residential MBS Including both Agency MBS and Non-Agency MBS 6 (1) Information presented with respect to Non-Agency MBS and related financings (which includes repurchase agreements) and resulting totals are presented on a non-GAAP basis. Includes $43.7 million of Non-Agency MBS and $33.2million of repurchase agreements underlying Linked Transactions, which, for GAAP financial reporting purposes, are evaluated on a combined basis and presented net as “Linked Transactions” on the company’s consolidated balance sheet. (2) Financings include repurchase agreements, securitized debt, senior notes, and payable for unsettled purchases. (3) Represents sum of financings (and with respect to the “Total” column, also the obligation to return securities obtained as collateral of $405.5 million) as a multiple of net equity allocated. (4) Average cost of funds includes interest on repurchase agreements, including the cost of swaps, and securitized debt. At June 30, 2013 MBS Portfolio Cash Total ($ in thousands) Market Value $ 6,937,911 $ 5,339,304 $ 12,277,215 $ 451,302 $ (16,692) $ 12,711,825 Less Financing and Payables (2) (6,096,007) (3,319,349) (9,415,356) - (100,000) (9,515,356) Equity Allocated 841,904 2,019,955 2,861,859 451,302 (116,692) 3,196,469 Less Swaps at Market Value - - - - (31,967) (31,967) Net Equity Allocated $ 841,904 $ 2,019,955 $ 2,861,859 $ 451,302 $ (148,659) $ 3,164,502 Debt/Net Equity Ratio (3) 7.24 x 1.64 x - - - 3.14 x Yield on Average Interest Earning Assets 2.19% 7.15% 4.18% 0.03% - 4.01% Less Average MBS Cost of Funds (4) (1.15) (2.41) (1.56) - - (1.63) Less Cost of Senior Notes - - - - (8.03) % (8.03) Net Interest Rate Spread 1.04% 4.74% 2.62% 0.03% (8.03) % 2.38% For the Quarter Ended June 30, 2013 Agency MBS Non-Agency MBS (1) Other, net |