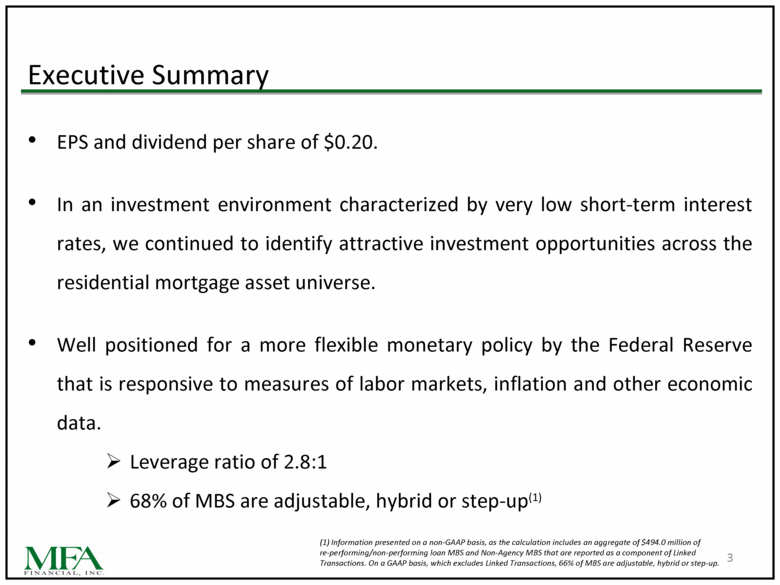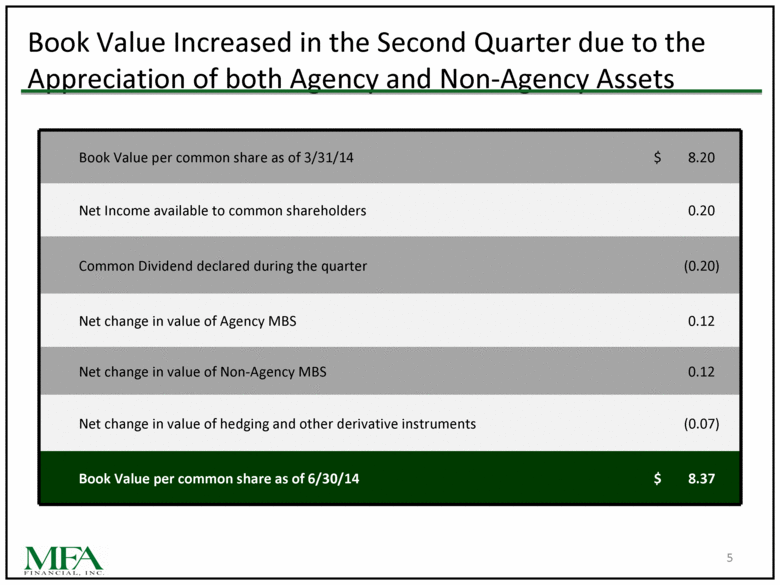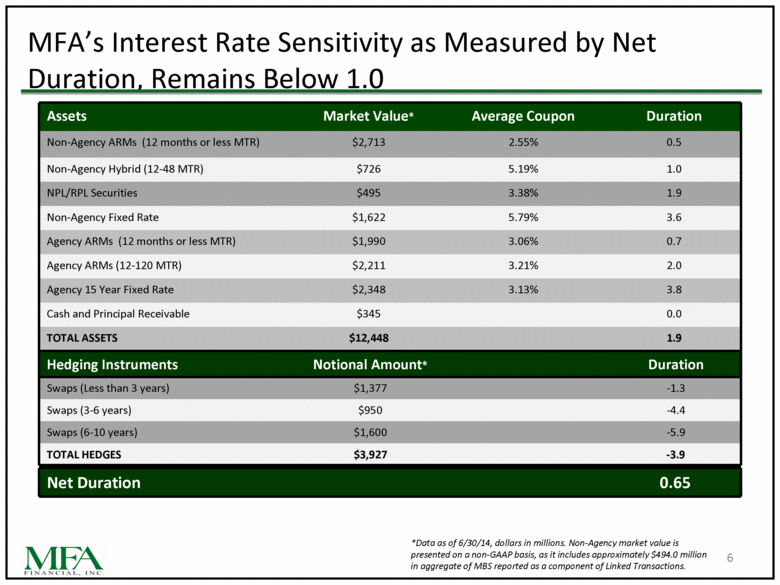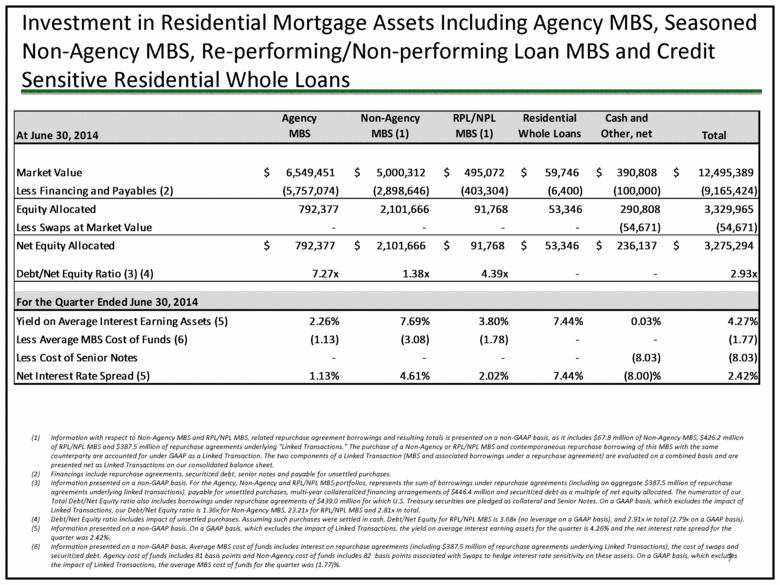
| Investment in Residential Mortgage Assets Including Agency MBS, Seasoned Non-Agency MBS, Re-performing/Non-performing Loan MBS and Credit Sensitive Residential Whole Loans 7 Information with respect to Non-Agency MBS and RPL/NPL MBS, related repurchase agreement borrowings and resulting totals is presented on a non-GAAP basis, as it includes $67.8 million of Non-Agency MBS, $426.2 million of RPL/NPL MBS and $387.5 million of repurchase agreements underlying "Linked Transactions." The purchase of a Non-Agency or RPL/NPL MBS and contemporaneous repurchase borrowing of this MBS with the same counterparty are accounted for under GAAP as a Linked Transaction. The two components of a Linked Transaction (MBS and associated borrowings under a repurchase agreement) are evaluated on a combined basis and are presented net as Linked Transactions on our consolidated balance sheet. Financings include repurchase agreements, securitized debt, senior notes and payable for unsettled purchases. Information presented on a non-GAAP basis. For the Agency, Non-Agency and RPL/NPL MBS portfolios, represents the sum of borrowings under repurchase agreements (including an aggregate $387.5 million of repurchase agreements underlying linked transactions), payable for unsettled purchases, multi-year collateralized financing arrangements of $446.4 million and securitized debt as a multiple of net equity allocated. The numerator of our Total Debt/Net Equity ratio also includes borrowings under repurchase agreements of $439.0 million for which U.S. Treasury securities are pledged as collateral and Senior Notes. On a GAAP basis, which excludes the impact of Linked Transactions, our Debt/Net Equity ratio is 1.36x for Non-Agency MBS, 23.21x for RPL/NPL MBS and 2.81x in total. Debt/Net Equity ratio includes impact of unsettled purchases. Assuming such purchases were settled in cash, Debt/Net Equity for RPL/NPL MBS is 3.68x (no leverage on a GAAP basis), and 2.91x in total (2.79x on a GAAP basis). Information presented on a non-GAAP basis. On a GAAP basis, which excludes the impact of Linked Transactions, the yield on average interest earning assets for the quarter is 4.26% and the net interest rate spread for the quarter was 2.42%. Information presented on a non-GAAP basis. Average MBS cost of funds includes interest on repurchase agreements (including $387.5 million of repurchase agreements underlying Linked Transactions), the cost of swaps and securitized debt. Agency cost of funds includes 81 basis points and Non-Agency cost of funds includes 82 basis points associated with Swaps to hedge interest rate sensitivity on these assets. On a GAAP basis, which excludes the impact of Linked Transactions, the average MBS cost of funds for the quarter was (1.77)%. At June 30, 2014 Agency MBS Non-Agency MBS (1) RPL/NPL MBS (1) Residential Whole Loans Cash and Other, net Total Market Value $ 6,549,451 $ 5,000,312 $ 495,072 $ 59,746 $ 390,808 $ 12,495,389 Less Financing and Payables (2) (5,757,074) (2,898,646) (403,304) (6,400) (100,000) (9,165,424) Equity Allocated 792,377 2,101,666 $ 91,768 53,346 290,808 3,329,965 Less Swaps at Market Value - - - - (54,671) (54,671) Net Equity Allocated $ 792,377 $ 2,101,666 $ 91,768 $ 53,346 $ 236,137 $ 3,275,294 Debt/Net Equity Ratio (3) (4) 7.27x 1.38x 4.39x - - 2.93x For the Quarter Ended June 30, 2014 Yield on Average Interest Earning Assets (5) 2.26% 7.69% 3.80% 7.44% 0.03% 4.27% Less Average MBS Cost of Funds (6) (1.13) (3.08) (1.78) - - (1.77) Less Cost of Senior Notes - - - - (8.03) (8.03) Net Interest Rate Spread (5) 1.13% 4.61% 2.02% 7.44% (8.00)% 2.42% |
