UNITED STATES
SECURITIES AND EXCHANGE COMMISSION
Washington, D.C. 20549
FORM N-CSR
CERTIFIED SHAREHOLDER REPORT
OF
REGISTERED MANAGEMENT INVESTMENT COMPANIES
Investment Company Act file number: 811-00121
| Name of Registrant: | Vanguard Wellington Fund |
| Address of Registrant: | P.O. Box 2600 |
| Valley Forge, PA 19482 |
| Name and address of agent for service: | Anne E. Robinson, Esquire |
| P.O. Box 876 | |
| Valley Forge, PA 19482 |
Registrant’s telephone number, including area code: (610) 669-1000
Date of fiscal year end: November 30
Date of reporting period: December 1, 2020—November 30, 2021
Item 1: Reports to Shareholders

| 1 | |
| 2 | |
| 6 | |
| 8 | |
| 10 | |
| 56 |
| • | For the 12 months ended November 30, 2021, Vanguard Wellington Fund returned 17.25% for Admiral Shares and 17.16% for Investor Shares. It beat the 17.04% return of its benchmark index, a 65% stocks/35% bonds composite measure that reflects the fund’s target asset allocation. |
| • | The U.S. economy continued to heal. Vaccination programs started to be rolled out shortly after the beginning of the period; some of the hardest-hit sectors such as hospitality, leisure, and travel began to rebound; and more workers returned to the labor force. While stocks turned in an excellent performance, bonds were hurt by the prospect of inflation being less transitory than expected and the Federal Reserve dialing back more of its monetary support. |
| • | The stock portfolio lagged the 27.92% return of its benchmark, the Standard & Poor’s 500 Index. Subpar stock selection in consumer discretionary and energy, as well as an underweight to information technology, hurt returns the most. Strong selections in the communication services and financial sectors performed well. |
| • | The bond portfolio slightly outpaced its benchmark, the Bloomberg U.S. Credit A or Better Bond Index, which returned –1.26%. The portfolio benefited from security selection—particularly among industrial issuers—but an underweight to credit spread duration was a primary detractor. Mortgage-backed securities also hurt relative returns. |
| • | For the decade ended November 30, 2021, the fund produced an average annual return of 11.23% for Admiral Shares and 11.14% for Investor Shares, compared with the 12.03% return of its expense-free benchmark. |
| Average Annual Total Returns Periods Ended November 30, 2021 | |||
| One Year | Three Years | Five Years | |
| Stocks | |||
| Russell 1000 Index (Large-caps) | 26.67% | 20.65% | 17.93% |
| Russell 2000 Index (Small-caps) | 22.03 | 14.22 | 12.14 |
| Russell 3000 Index (Broad U.S. market) | 26.34 | 20.20 | 17.51 |
| FTSE All-World ex US Index (International) | 9.63 | 10.38 | 9.56 |
| Bonds | |||
| Bloomberg U.S. Aggregate Bond Index (Broad taxable market) | -1.15% | 5.52% | 3.65% |
| Bloomberg Municipal Bond Index (Broad tax-exempt market) | 1.97 | 5.09 | 4.38 |
| FTSE Three-Month U.S. Treasury Bill Index | 0.05 | 1.02 | 1.12 |
| CPI | |||
| Consumer Price Index | 6.81% | 3.32% | 2.86% |
Fixed Income Portfolio Manager
Equity Portfolio Manager
| • | Based on actual fund return. This section helps you to estimate the actual expenses that you paid over the period. The ”Ending Account Value“ shown is derived from the fund’s actual return, and the third column shows the dollar amount that would have been paid by an investor who started with $1,000 in the fund. You may use the information here, together with the amount you invested, to estimate the expenses that you paid over the period. |
| • | Based on hypothetical 5% yearly return. This section is intended to help you compare your fund‘s costs with those of other mutual funds. It assumes that the fund had a yearly return of 5% before expenses, but that the expense ratio is unchanged. In this case—because the return used is not the fund’s actual return—the results do not apply to your investment. The example is useful in making comparisons because the Securities and Exchange Commission requires all mutual funds to calculate expenses based on a 5% return. You can assess your fund’s costs by comparing this hypothetical example with the hypothetical examples that appear in shareholder reports of other funds. |
| Six Months Ended November 30, 2021 | |||
| Beginning Account Value 5/31/2021 | Ending Account Value 11/30/2021 | Expenses Paid During Period | |
| Based on Actual Fund Return | |||
| Wellington Fund | |||
| Investor Shares | $1,000.00 | $1,054.40 | $1.24 |
| Admiral™ Shares | 1,000.00 | 1,054.70 | 0.82 |
| Based on Hypothetical 5% Yearly Return | |||
| Wellington Fund | |||
| Investor Shares | $1,000.00 | $1,023.86 | $1.22 |
| Admiral Shares | 1,000.00 | 1,024.27 | 0.81 |
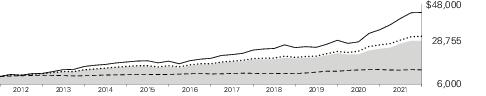
| Average Annual Total Returns Periods Ended November 30, 2021 | |||||
| One Year | Five Years | Ten Years | Final Value of a $10,000 Investment | ||
 | Wellington Fund Investor Shares | 17.16% | 11.94% | 11.14% | $28,755 |
 | Wellington Composite Index | 17.04 | 13.34 | 12.03 | 31,154 |
 | Bloomberg U.S. Aggregate Bond Index | -1.15 | 3.65 | 3.04 | 13,488 |
 | Dow Jones U.S. Total Stock Market Float Adjusted Index | 26.49 | 17.49 | 15.91 | 43,757 |
| One Year | Five Years | Ten Years | Final Value of a $50,000 Investment | ||
| Wellington Fund Admiral Shares | 17.25% | 12.03% | 11.23% | $144,944 | |
| Wellington Composite Index | 17.04 | 13.34 | 12.03 | 155,770 | |
| Bloomberg U.S. Aggregate Bond Index | -1.15 | 3.65 | 3.04 | 67,441 | |
| Dow Jones U.S. Total Stock Market Float Adjusted Index | 26.49 | 17.49 | 15.91 | 218,787 | |
| Asset-Backed/Commercial Mortgage-Backed Securities | 1.5% |
| Common Stocks | 66.4 |
| Corporate Bonds | 21.0 |
| Sovereign Bonds | 1.0 |
| Taxable Municipal Bonds | 1.6 |
| U.S. Government and Agency Obligations | 8.5 |
| Shares | Market Value• ($000) | |||||
| Common Stocks (66.0%) | ||||||
| Communication Services (8.4%) | ||||||
| * | Alphabet Inc. Class A | 1,941,770 | 5,510,646 | |||
| * | Meta Platforms Inc. Class A | 10,611,397 | 3,442,974 | |||
| Comcast Corp. Class A | 21,993,301 | 1,099,225 | ||||
| Electronic Arts Inc. | 3,329,191 | 413,552 | ||||
| 10,466,397 | ||||||
| Consumer Discretionary (7.7%) | ||||||
| McDonald's Corp. | 8,314,779 | 2,033,795 | ||||
| * | Amazon.com Inc. | 565,954 | 1,984,840 | |||
| Home Depot Inc. | 4,583,420 | 1,836,164 | ||||
| TJX Cos. Inc. | 18,472,078 | 1,281,962 | ||||
| Starbucks Corp. | 8,258,035 | 905,411 | ||||
| Dollar General Corp. | 3,397,999 | 751,977 | ||||
| * | Coupang Inc. Class A | 9,961,421 | 263,978 | |||
| DR Horton Inc. | 2,094,152 | 204,599 | ||||
| Lennar Corp. Class A | 1,904,018 | 200,017 | ||||
| * | Rivian Automotive Inc. Class A | 354,769 | 42,487 | |||
| 9,505,230 | ||||||
| Consumer Staples (4.1%) | ||||||
| Procter & Gamble Co. | 12,373,565 | 1,788,970 | ||||
| Sysco Corp. | 18,107,775 | 1,268,269 | ||||
| Nestle SA (Registered) | 7,771,740 | 996,118 | ||||
| Coca-Cola Co. | 13,925,459 | 730,390 | ||||
| Diageo plc | 5,499,993 | 277,575 | ||||
| 5,061,322 | ||||||
| Energy (2.0%) | ||||||
| TotalEnergies SE | 32,813,629 | 1,509,846 | ||||
| Royal Dutch Shell plc Class A | 45,865,451 | 966,121 | ||||
| Royal Dutch Shell plc Class A (XMEX) | 2,607,900 | 54,555 | ||||
| 2,530,522 | ||||||
| Financials (10.7%) | ||||||
| Charles Schwab Corp. | 38,877,116 | 3,008,700 | ||||
| JPMorgan Chase & Co. | 14,260,014 | 2,264,918 | ||||
| BlackRock Inc. | 1,474,891 | 1,334,201 | ||||
| Bank of America Corp. | 29,482,555 | 1,311,089 | ||||
| Progressive Corp. | 12,627,007 | 1,173,554 | ||||
| Blackstone Inc. | 7,301,910 | 1,032,855 | ||||
| American Express Co. | 6,510,294 | 991,518 | ||||
| S&P Global Inc. | 1,815,068 | 827,181 | ||||
| Morgan Stanley | 6,790,327 | 643,859 | ||||
| Shares | Market Value• ($000) | |||||
| Prudential plc | 20,926,697 | 353,478 | ||||
| Goldman Sachs Group Inc. | 656,201 | 250,006 | ||||
| 13,191,359 | ||||||
| Health Care (9.2%) | ||||||
| Pfizer Inc. | 34,912,188 | 1,875,832 | ||||
| UnitedHealth Group Inc. | 3,978,441 | 1,767,303 | ||||
| HCA Healthcare Inc. | 6,341,920 | 1,430,674 | ||||
| Anthem Inc. | 2,576,370 | 1,046,599 | ||||
| Novartis AG (Registered) | 12,852,161 | 1,024,391 | ||||
| Becton Dickinson & Co. | 3,876,623 | 919,302 | ||||
| AstraZeneca plc ADR | 15,451,135 | 847,186 | ||||
| Humana Inc. | 1,945,729 | 816,642 | ||||
| Danaher Corp. | 2,389,686 | 768,618 | ||||
| Abbott Laboratories | 3,836,548 | 482,523 | ||||
| Baxter International Inc. | 5,117,520 | 381,613 | ||||
| 11,360,683 | ||||||
| Industrials (6.0%) | ||||||
| Johnson Controls International plc | 14,484,407 | 1,082,854 | ||||
| Raytheon Technologies Corp. | 11,823,774 | 956,780 | ||||
| Trane Technologies plc | 4,632,795 | 864,711 | ||||
| Fortive Corp. | 11,528,814 | 851,634 | ||||
| Deere & Co. | 2,401,913 | 829,957 | ||||
| Illinois Tool Works Inc. | 2,961,833 | 687,590 | ||||
| Union Pacific Corp. | 2,284,619 | 538,348 | ||||
| Northrop Grumman Corp. | 1,525,349 | 532,042 | ||||
| Schneider Electric SE | 2,440,941 | 433,203 | ||||
| Parker-Hannifin Corp. | 1,115,978 | 337,092 | ||||
| * | Airbus SE | 2,850,137 | 318,132 | |||
| 7,432,343 | ||||||
| Information Technology (14.6%) | ||||||
| Microsoft Corp. | 20,719,810 | 6,849,761 | ||||
| Apple Inc. | 18,428,327 | 3,046,203 | ||||
| Texas Instruments Inc. | 8,614,452 | 1,657,162 | ||||
| Taiwan Semiconductor Manufacturing Co. Ltd. ADR | 8,392,840 | 983,221 | ||||
| Accenture plc Class A | 2,633,121 | 941,077 | ||||
| * | salesforce.com Inc. | 2,934,483 | 836,210 | |||
| * | Workday Inc. Class A | 2,937,883 | 805,656 | |||
| Marvell Technology Inc. | 9,460,262 | 673,287 | ||||
| Global Payments Inc. | 5,368,309 | 639,044 | ||||
| Cisco Systems Inc. | 9,175,839 | 503,203 | ||||
| Lam Research Corp. | 608,990 | 414,022 | ||||
| KLA Corp. | 977,071 | 398,772 | ||||
| Fidelity National Information Services Inc. | 3,440,537 | 359,536 | ||||
| 18,107,154 | ||||||
| Real Estate (1.3%) | ||||||
| American Tower Corp. | 2,944,348 | 772,833 | ||||
| Prologis Inc. | 3,714,848 | 560,013 | ||||
| VICI Properties Inc. | 8,830,111 | 240,179 | ||||
| 1,573,025 | ||||||
| Utilities (2.0%) | ||||||
| Exelon Corp. | 26,355,358 | 1,389,718 | ||||
| Duke Energy Corp. | 11,274,218 | 1,093,712 | ||||
| 2,483,430 | ||||||
| Total Common Stocks (Cost $44,537,568) | 81,711,465 | |||||
| Coupon | Maturity Date | Face Amount ($000) | Market Value• ($000) | |||
| U.S. Government and Agency Obligations (8.4%) | ||||||
| U.S. Government Securities (8.1%) | ||||||
| United States Treasury Note/Bond | 0.125% | 4/30/23 | 224,460 | 223,583 | ||
| United States Treasury Note/Bond | 0.125% | 5/15/23 | 164,470 | 163,853 | ||
| United States Treasury Note/Bond | 0.125% | 5/31/23 | 400,000 | 398,250 | ||
| United States Treasury Note/Bond | 2.625% | 6/30/23 | 119,090 | 123,202 | ||
| United States Treasury Note/Bond | 0.125% | 7/31/23 | 98,000 | 97,464 | ||
| United States Treasury Note/Bond | 2.750% | 7/31/23 | 104,000 | 107,965 | ||
| United States Treasury Note/Bond | 0.125% | 8/31/23 | 287,000 | 285,251 | ||
| United States Treasury Note/Bond | 0.250% | 9/30/23 | 2,530 | 2,519 | ||
| United States Treasury Note/Bond | 0.375% | 10/31/23 | 20,000 | 19,944 | ||
| United States Treasury Note/Bond | 0.125% | ��� 1/15/24 | 116,810 | 115,605 | ||
| United States Treasury Note/Bond | 0.125% | 2/15/24 | 117,355 | 116,071 | ||
| United States Treasury Note/Bond | 0.250% | 3/15/24 | 157,000 | 155,553 | ||
| United States Treasury Note/Bond | 0.250% | 5/15/24 | 24,315 | 24,041 | ||
| United States Treasury Note/Bond | 0.250% | 6/15/24 | 386,000 | 381,296 | ||
| United States Treasury Note/Bond | 1.750% | 6/30/24 | 316,970 | 325,092 | ||
| United States Treasury Note/Bond | 0.375% | 8/15/24 | 305,000 | 301,807 | ||
| United States Treasury Note/Bond | 0.375% | 9/15/24 | 108,000 | 106,768 | ||
| United States Treasury Note/Bond | 0.625% | 10/15/24 | 610,000 | 606,950 | ||
| United States Treasury Note/Bond | 2.000% | 2/15/25 | 244,920 | 253,339 | ||
| United States Treasury Note/Bond | 1.125% | 2/28/25 | 198,905 | 200,210 | ||
| United States Treasury Note/Bond | 0.250% | 5/31/25 | 717,325 | 699,392 | ||
| United States Treasury Note/Bond | 0.250% | 7/31/25 | 245,975 | 239,288 | ||
| United States Treasury Note/Bond | 2.000% | 8/15/25 | 61,860 | 64,102 | ||
| United States Treasury Note/Bond | 0.250% | 8/31/25 | 125,010 | 121,455 | ||
| United States Treasury Note/Bond | 0.375% | 11/30/25 | 208,000 | 202,345 | ||
| United States Treasury Note/Bond | 0.375% | 1/31/26 | 936,810 | 909,584 | ||
| United States Treasury Note/Bond | 0.750% | 3/31/26 | 107,000 | 105,395 | ||
| United States Treasury Note/Bond | 0.750% | 4/30/26 | 89,000 | 87,596 | ||
| United States Treasury Note/Bond | 1.625% | 5/15/26 | 78,110 | 79,843 | ||
| United States Treasury Note/Bond | 0.750% | 5/31/26 | 281,245 | 276,675 | ||
| United States Treasury Note/Bond | 0.750% | 8/31/26 | 175,000 | 171,855 | ||
| 1 | United States Treasury Note/Bond | 0.875% | 9/30/26 | 254,100 | 250,844 | |
| United States Treasury Note/Bond | 1.125% | 10/31/26 | 174,360 | 174,115 | ||
| United States Treasury Note/Bond | 2.000% | 11/15/26 | 30,000 | 31,238 | ||
| United States Treasury Note/Bond | 2.250% | 11/15/27 | 183,280 | 193,647 | ||
| United States Treasury Note/Bond | 0.625% | 5/15/30 | 8,450 | 7,932 | ||
| United States Treasury Note/Bond | 1.125% | 2/15/31 | 690 | 674 | ||
| United States Treasury Note/Bond | 1.250% | 8/15/31 | 24,835 | 24,443 | ||
| United States Treasury Note/Bond | 1.375% | 11/15/31 | 45,565 | 45,294 | ||
| United States Treasury Note/Bond | 2.250% | 5/15/41 | 1,154,810 | 1,229,512 | ||
| United States Treasury Note/Bond | 1.750% | 8/15/41 | 661,580 | 649,486 | ||
| United States Treasury Note/Bond | 1.875% | 2/15/51 | 4,560 | 4,636 | ||
| United States Treasury Note/Bond | 2.000% | 8/15/51 | 321,205 | 336,412 | ||
| United States Treasury Note/Bond | 1.875% | 11/15/51 | 121,650 | 124,045 | ||
| 10,038,571 | ||||||
| Conventional Mortgage-Backed Securities (0.1%) | ||||||
| 2,3 | Fannie Mae Pool | 1.770% | 1/1/36 | 20,592 | 20,192 | |
| 2,3 | Fannie Mae Pool | 3.070% | 2/1/25 | 11,700 | 12,297 | |
| 2,3 | Freddie Mac Gold Pool | 3.000% | 9/1/22 | 1 | 1 | |
| 2 | Ginnie Mae I Pool | 7.000% | 11/15/31–11/15/33 | 1,133 | 1,281 | |
| 2,3,4 | UMBS Pool | 2.500% | 9/1/27–1/25/52 | 133,055 | 136,411 | |
| 2,3 | UMBS Pool | 3.000% | 8/1/42–11/1/46 | 312 | 326 | |
| 2,3 | UMBS Pool | 3.500% | 11/1/45–6/1/46 | 79 | 83 | |
| 170,591 | ||||||
| Coupon | Maturity Date | Face Amount ($000) | Market Value• ($000) | |||
| Nonconventional Mortgage-Backed Securities (0.2%) | ||||||
| 2,3 | Fannie Mae REMICS | 1.500% | 8/25/41–11/25/42 | 15,634 | 15,708 | |
| 2,3 | Fannie Mae REMICS | 1.700% | 6/25/43 | 2,556 | 2,573 | |
| 2,3 | Fannie Mae REMICS | 2.000% | 6/25/44 | 1,246 | 1,259 | |
| 2,3 | Fannie Mae REMICS | 3.000% | 2/25/49–9/25/57 | 25,727 | 26,769 | |
| 2,3 | Fannie Mae REMICS | 3.500% | 4/25/31–11/25/57 | 92,509 | 98,079 | |
| 2,3 | Fannie Mae REMICS | 4.000% | 5/25/31–7/25/53 | 10,873 | 11,435 | |
| 2,3 | Freddie Mac REMICS | 1.500% | 10/15/42 | 7,222 | 7,242 | |
| 2,3 | Freddie Mac REMICS | 1.750% | 3/15/41 | 7,412 | 7,451 | |
| 2,3 | Freddie Mac REMICS | 2.000% | 7/15/31 | 6,343 | 6,410 | |
| 2,3 | Freddie Mac REMICS | 3.000% | 12/15/39 | 27 | 26 | |
| 2,3 | Freddie Mac REMICS | 3.500% | 3/15/31 | 2,732 | 2,888 | |
| 2,3 | Freddie Mac REMICS | 4.000% | 12/15/30–4/15/31 | 52,052 | 55,254 | |
| 2 | Ginnie Mae REMICS | 1.700% | 10/20/45 | 3,403 | 3,431 | |
| 2 | Ginnie Mae REMICS | 1.800% | 5/20/41 | 908 | 909 | |
| 239,434 | ||||||
| Total U.S. Government and Agency Obligations (Cost $10,388,936) | 10,448,596 | |||||
| Asset-Backed/Commercial Mortgage-Backed Securities (1.5%) | ||||||
| 2,5 | Aaset Trust Series 2019-1 | 3.844% | 5/15/39 | 11,800 | 11,342 | |
| 2,5 | Affirm Asset Securitization Trust Series 2021-B | 1.030% | 8/17/26 | 17,590 | 17,521 | |
| 2,5 | Affirm Asset Securitization Trust Series 2021-Z1 | 1.070% | 8/15/25 | 14,431 | 14,405 | |
| 2,5,6 | Affirm Asset Securitization Trust Series 2021-Z2 | 1.170% | 11/16/26 | 19,585 | 19,572 | |
| 2,5 | Aligned Data Centers Issuer LLC Series 2021-1A | 1.937% | 8/15/46 | 43,270 | 42,844 | |
| 2,5 | American Tower Trust | 3.070% | 3/15/23 | 43,000 | 43,107 | |
| 2,5 | Angel Oak Mortgage Trust Series 2019-5 | 2.593% | 10/25/49 | 4,643 | 4,635 | |
| 2,5 | Angel Oak Mortgage Trust Series 2019-6 | 2.620% | 11/25/59 | 10,140 | 10,266 | |
| 2,5 | Angel Oak Mortgage Trust Series 2021-6 | 1.458% | 9/25/66 | 30,945 | 30,725 | |
| 2,5 | Angel Oak Mortgage Trust I LLC Series 2019-2 | 3.628% | 3/25/49 | 1,585 | 1,610 | |
| 2,5 | Angel Oak Mortgage Trust I LLC Series 2019-4 | 2.993% | 7/26/49 | 6,551 | 6,591 | |
| 2,5,7 | Atlas Senior Loan Fund X Ltd. Series 2018-10A, 3M USD LIBOR + 1.090% | 1.214% | 1/15/31 | 7,799 | 7,797 | |
| 2,5,7 | Bain Capital Credit CLO Ltd. Series 2021-3A, 3M USD LIBOR + 1.160% | 1.346% | 7/24/34 | 11,155 | 11,159 | |
| 2,5,7 | Barings CLO Ltd. Series 2020-4A, 3M USD LIBOR + 1.550% | 1.681% | 1/20/32 | 13,600 | 13,602 | |
| 2,5,7 | Battalion CLO XX Ltd. Series 2021-20A, 3M USD LIBOR + 1.750% | 1.888% | 7/15/34 | 16,000 | 15,887 | |
| 2,5,7 | Battalion CLO XXII Ltd. Series 2021-22A, 3M USD LIBOR + 1.180% | 1.299% | 1/20/35 | 42,990 | 42,964 | |
| 2,5,7 | BlueMountain CLO XXXI Ltd. Series 2021-31A, 3M USD LIBOR + 1.150% | 1.274% | 4/19/34 | 30,000 | 29,991 | |
| 2,5,7 | BlueMountain CLO XXXII Ltd. Series 2021-32A, 3M USD LIBOR + 1.170% | 1.253% | 10/15/34 | 21,445 | 21,396 | |
| 2,5,7 | Bristol Park CLO Ltd. Series 2016-1A, 3M USD LIBOR + 1.450% | 1.574% | 4/15/29 | 10,000 | 10,001 | |
| 2,5,7 | BX Commercial Mortgage Trust Series 2021-VOLT, 1M USD LIBOR + 0.700% | 0.790% | 9/15/36 | 29,050 | 28,953 | |
| 2,5,7 | BX Trust Series 2021-ARIA, 1M USD LIBOR + 0.899% | 0.989% | 10/15/36 | 14,785 | 14,756 | |
| 2,5,7 | BXHPP Trust Series 2021-FILM, 1M USD LIBOR + 0.650% | 0.740% | 8/15/36 | 15,225 | 15,175 | |
| 2,5,7 | BXHPP Trust Series 2021-FILM, 1M USD LIBOR + 0.900% | 0.990% | 8/15/36 | 3,140 | 3,121 | |
| Coupon | Maturity Date | Face Amount ($000) | Market Value• ($000) | |||
| 2,5 | Canadian Pacer Auto Receivables Trust Series 2018-2A | 3.270% | 12/19/22 | 57 | 57 | |
| 2,5 | Castlelake Aircraft Structured Trust Series 2019-1A | 3.967% | 4/15/39 | 23,365 | 23,285 | |
| 2,5 | CF Hippolyta LLC Series 2021-1A | 1.530% | 3/15/61 | 23,894 | 23,517 | |
| 2,5 | Chesapeake Funding II LLC Series 2018-3A | 3.390% | 1/15/31 | 9,603 | 9,751 | |
| 2,5,7 | CIFC Funding 2021-III Ltd. Series 2021-3A, 3M USD LIBOR + 1.700% | 1.824% | 7/15/36 | 6,400 | 6,400 | |
| 2,5,7 | CIFC Funding Ltd. Series 2018-1A, 3M USD LIBOR + 1.000% | 1.122% | 4/18/31 | 12,000 | 11,997 | |
| 2,5 | Cloud Pass-Through Trust Series 2019-1A | 3.554% | 12/5/22 | 615 | 617 | |
| 2,5 | COLT Mortgage Loan Trust Series 2020-1 | 2.488% | 2/25/50 | 4,488 | 4,487 | |
| 2,5,7 | Columbia Cent CLO 27 Ltd. Series 2018-27A, 3M USD LIBOR + 1.150% | 1.274% | 10/25/28 | 16,364 | 16,364 | |
| 2,5,7 | Columbia Cent CLO 30 Ltd. Series 2020-30A, 3M USD LIBOR + 1.750% | 1.882% | 1/20/34 | 15,255 | 15,266 | |
| 2,5,7 | Columbia Cent CLO 31 Ltd. Series 2021-31A, 3M USD LIBOR + 1.550% | 1.681% | 4/20/34 | 14,400 | 14,259 | |
| 2 | COMM Mortgage Trust Series 2012-CR2 | 3.147% | 8/15/45 | 18,085 | 18,204 | |
| 2,5 | DB Master Finance LLC Series 2019-1A | 4.021% | 5/20/49 | 13,925 | 14,459 | |
| 2,5 | Domino's Pizza Master Issuer LLC Series 2021-1A | 2.662% | 4/25/51 | 34,954 | 35,164 | |
| 2,5 | Domino's Pizza Master Issuer LLC Series 2021-1A | 3.151% | 4/25/51 | 29,014 | 29,943 | |
| 2,5,7 | Dryden 87 CLO Ltd. Series 2021-87A, 3M USD LIBOR + 1.100% | 1.260% | 5/20/34 | 36,675 | 36,657 | |
| 2,5 | Enterprise Fleet Financing LLC Series 2018-3 | 3.380% | 5/20/24 | 397 | 399 | |
| 2,5 | Enterprise Fleet Financing LLC Series 2019-1 | 2.980% | 10/20/24 | 3,725 | 3,740 | |
| 2,5 | Enterprise Fleet Financing LLC Series 2019-2 | 2.290% | 2/20/25 | 12,474 | 12,586 | |
| 2,5 | Enterprise Fleet Financing LLC Series 2019-3 | 2.060% | 5/20/25 | 8,769 | 8,844 | |
| 2,3,7 | Fannie Mae Connecticut Avenue Securities Series 2016-C03, 1M USD LIBOR + 5.900% | 5.992% | 10/25/28 | 4,757 | 5,032 | |
| 2,5 | FirstKey Homes Trust Series 2021-SFR1 | 1.538% | 8/17/38 | 64,899 | 63,559 | |
| 2,3 | Freddie Mac Multifamily Structured Pass-Through Certificates Series K-1512 | 3.059% | 4/25/34 | 6,000 | 6,613 | |
| 2,3 | Freddie Mac Multifamily Structured Pass-Through Certificates Series K-1513 | 2.797% | 8/25/34 | 7,500 | 8,071 | |
| 2,3 | Freddie Mac Multifamily Structured Pass-Through Certificates Series K-1521 | 2.184% | 8/25/36 | 17,705 | 17,903 | |
| 2,5 | Home Partners of America Trust Series 2021-2 | 1.901% | 12/17/26 | 36,570 | 36,435 | |
| 2,5 | Horizon Aircraft Finance II Ltd. Series 2019-1 | 3.721% | 7/15/39 | 10,274 | 10,181 | |
| 2,5 | Horizon Aircraft Finance III Ltd. Series 2019-2 | 3.425% | 11/15/39 | 10,343 | 10,246 | |
| 2,5,7 | Life Mortgage Trust Series 2021-BMR, 1M USD LIBOR + 0.700% | 0.790% | 3/15/38 | 9,305 | 9,273 | |
| 2,5 | MACH 1 Cayman Ltd. Series 2019-1 | 3.474% | 10/15/39 | 10,540 | 10,426 | |
| 2,5,7 | Madison Park Funding XI Ltd. Series 2013-11A, 3M USD LIBOR + 1.450% | 1.574% | 7/23/29 | 8,550 | 8,548 | |
| 2,5,7 | Madison Park Funding XIII Ltd. Series 2014-13A, 3M USD LIBOR + 0.950% | 1.074% | 4/19/30 | 33,025 | 33,020 | |
| 2,5,7 | Magnetite VII Ltd. Series 2012-7A, 3M USD LIBOR + 0.800% | 0.924% | 1/15/28 | 25,887 | 25,883 | |
| 2,5 | MAPS Ltd. Series 2019-1A | 4.458% | 3/15/44 | 5,960 | 5,980 | |
| Coupon | Maturity Date | Face Amount ($000) | Market Value• ($000) | |||
| 2,5,7 | Master Credit Card Trust II Series 2018-1A, 1M USD LIBOR + 0.490% | 0.581% | 7/21/24 | 30,925 | 31,028 | |
| 2,5 | Mercury Financial Credit Card Master Trust Series 2021-1A | 1.540% | 3/20/26 | 33,270 | 33,303 | |
| 2,5 | New Economy Assets Phase 1 Sponsor LLC Series 2021-1 | 1.910% | 10/20/61 | 100,980 | 99,242 | |
| 2,5 | New Economy Assets Phase 1 Sponsor LLC Series 2021-1 | 2.410% | 10/20/61 | 10,325 | 10,334 | |
| 2,5,7 | Oaktree CLO Ltd. Series 2021-1A, 3M USD LIBOR + 1.160% | 1.284% | 7/15/34 | 29,000 | 29,020 | |
| 2,5,7 | Octagon 54 Ltd. Series 2021-1A, 3M USD LIBOR + 1.120% | 1.253% | 7/15/34 | 35,000 | 34,940 | |
| 2,5,7 | Octagon Investment Partners 51 Ltd. Series 2021-1A, 3M USD LIBOR + 1.150% | 1.281% | 7/20/34 | 30,000 | 30,000 | |
| 2,5,7 | OHA Credit Funding 3 Ltd. Series 2019-3A, 3M USD LIBOR + 1.140% | 1.271% | 7/2/35 | 43,800 | 43,776 | |
| 2,5 | OneMain Direct Auto Receivables Trust Series 2018-1A | 3.430% | 12/16/24 | 2,560 | 2,562 | |
| 2,5 | OneMain Direct Auto Receivables Trust Series 2021-1A | 0.870% | 7/14/28 | 30,280 | 29,933 | |
| 2,5 | OneMain Financial Issuance Trust Series 2019-1A | 3.480% | 2/14/31 | 9,745 | 9,755 | |
| 2,5,7 | Regatta VI Funding Ltd. Series 2016-1A, 3M USD LIBOR + 1.160% | 1.292% | 4/20/34 | 22,000 | 22,020 | |
| 2,5,7 | Rockland Park CLO Ltd. Series 2021-1A, 3M USD LIBOR + 1.120% | 1.252% | 4/20/34 | 20,000 | 20,091 | |
| 2,5,7 | Rockland Park CLO Ltd. Series 2021-1A, 3M USD LIBOR + 1.650% | 1.781% | 4/20/34 | 9,970 | 10,005 | |
| 2,5,7 | RR 16 Ltd. Series 2021-16A, 3M USD LIBOR + 1.110% | 1.234% | 7/15/36 | 26,720 | 26,674 | |
| 2,5,7 | RR 16 Ltd. Series 2021-16A, 3M USD LIBOR + 1.650% | 1.774% | 7/15/36 | 15,540 | 15,589 | |
| 2,5,7 | RR 18 Ltd. Series 2021-18A, 3M USD LIBOR + 1.600% | 1.684% | 10/15/34 | 30,080 | 30,034 | |
| 2,5 | Santander Retail Auto Lease Trust Series 2019-B | 2.300% | 1/20/23 | 4,417 | 4,429 | |
| 2 | Seasoned Credit Risk Transfer Trust Series 2019-3 | 3.500% | 10/25/58 | 34,066 | 35,315 | |
| 2,5 | SFAVE Commercial Mortgage Securities Trust Series 2015-5AVE | 4.144% | 1/5/43 | 27,300 | 28,988 | |
| 2,5,7 | Shackleton CLO Ltd. Series 2021-16A, 3M USD LIBOR + 1.210% | 1.332% | 10/20/34 | 24,870 | 24,874 | |
| 2,5 | SoFi Consumer Loan Program Trust Series 2020-1 | 2.020% | 1/25/29 | 3,122 | 3,137 | |
| 2,5 | SoFi Professional Loan Program Trust Series 2021-B | 1.140% | 2/15/47 | 20,196 | 19,989 | |
| 2,5,7 | Sound Point CLO XXXI Ltd. Series 2021-3A, 3M USD LIBOR + 1.650% | 1.781% | 10/25/34 | 11,405 | 11,326 | |
| 2,5 | START Ireland Series 2019-1 | 4.089% | 3/15/44 | 12,203 | 12,227 | |
| 2,5,7 | Symphony CLO XIV Ltd. Series 2014-14A, 3M USD LIBOR + 0.950% | 1.077% | 7/14/26 | 15,742 | 15,743 | |
| 2,5,7 | Symphony CLO XXVIII Ltd. Series 2021-28A, 3M USD LIBOR + 1.650% | 1.738% | 10/23/34 | 25,350 | 25,317 | |
| 2,5 | Taco Bell Funding LLC Series 2021-1A | 1.946% | 8/25/51 | 39,345 | 38,675 | |
| 2,5 | Taco Bell Funding LLC Series 2021-1A | 2.294% | 8/25/51 | 36,015 | 35,687 | |
| 2,5,7 | Taconic Park CLO Ltd. Series 2016-1A, 3M USD LIBOR + 1.450% | 1.582% | 1/20/29 | 12,291 | 12,292 | |
| 2,5 | Towd Point Mortgage Trust Series 2016-3 | 2.250% | 4/25/56 | 125 | 125 | |
| 2,5 | Vantage Data Centers Issuer LLC Series 2019-1A | 3.188% | 7/15/44 | 10,679 | 10,915 | |
| Coupon | Maturity Date | Face Amount ($000) | Market Value• ($000) | |||
| 2,5 | Vantage Data Centers Issuer LLC Series 2021-1A | 2.165% | 10/15/46 | 48,430 | 48,305 | |
| 2,5 | Vantage Data Centers LLC Series 2020-1A | 1.645% | 9/15/45 | 29,505 | 28,933 | |
| 2,5,7 | Venture 43 CLO Ltd. Series 2021-43A, 3M USD LIBOR + 1.240% | 1.364% | 4/15/34 | 9,500 | 9,504 | |
| 2,5,7 | Voya CLO Ltd. Series 2014-1A, 3M USD LIBOR + 0.990% | 1.112% | 4/18/31 | 20,525 | 20,519 | |
| 2,5,7 | Voya CLO Ltd. Series 2021-2A, 3M USD LIBOR + 1.150% | 1.277% | 10/20/34 | 37,765 | 37,815 | |
| 2,5,7 | Wellfleet CLO X Ltd. Series 2019-XA, 3M USD LIBOR + 1.750% | 1.882% | 7/20/32 | 10,000 | 9,970 | |
| Total Asset-Backed/Commercial Mortgage-Backed Securities (Cost $1,870,135) | 1,866,977 | |||||
| Corporate Bonds (20.9%) | ||||||
| Communications (1.8%) | ||||||
| America Movil SAB de CV | 3.125% | 7/16/22 | 84,600 | 85,928 | ||
| America Movil SAB de CV | 3.625% | 4/22/29 | 26,990 | 29,306 | ||
| America Movil SAB de CV | 6.125% | 3/30/40 | 7,380 | 10,429 | ||
| AT&T Inc. | 2.750% | 6/1/31 | 36,795 | 37,344 | ||
| AT&T Inc. | 4.300% | 12/15/42 | 35,590 | 40,116 | ||
| AT&T Inc. | 3.650% | 6/1/51 | 8,341 | 8,655 | ||
| AT&T Inc. | 3.500% | 9/15/53 | 33,515 | 33,851 | ||
| AT&T Inc. | 3.850% | 6/1/60 | 26,704 | 27,995 | ||
| AT&T Inc. | 3.500% | 2/1/61 | 9,685 | 9,485 | ||
| 5 | British Telecommunications plc | 3.250% | 11/8/29 | 19,060 | 19,583 | |
| Charter Communications Operating LLC | 2.800% | 4/1/31 | 32,150 | 31,836 | ||
| Charter Communications Operating LLC | 2.300% | 2/1/32 | 7,150 | 6,756 | ||
| Charter Communications Operating LLC | 3.500% | 3/1/42 | 24,235 | 23,454 | ||
| Charter Communications Operating LLC | 5.375% | 5/1/47 | 3,455 | 4,159 | ||
| Charter Communications Operating LLC | 5.125% | 7/1/49 | 2,904 | 3,412 | ||
| Charter Communications Operating LLC | 4.800% | 3/1/50 | 3,777 | 4,256 | ||
| Charter Communications Operating LLC | 3.700% | 4/1/51 | 17,760 | 17,303 | ||
| Charter Communications Operating LLC | 3.850% | 4/1/61 | 16,610 | 15,884 | ||
| Charter Communications Operating LLC | 4.400% | 12/1/61 | 13,740 | 14,350 | ||
| Comcast Corp. | 3.600% | 3/1/24 | 50,730 | 53,983 | ||
| Comcast Corp. | 3.375% | 2/15/25 | 2,540 | 2,694 | ||
| Comcast Corp. | 4.250% | 1/15/33 | 42,890 | 50,159 | ||
| Comcast Corp. | 4.200% | 8/15/34 | 26,890 | 31,573 | ||
| Comcast Corp. | 5.650% | 6/15/35 | 4,725 | 6,268 | ||
| Comcast Corp. | 4.400% | 8/15/35 | 32,325 | 38,414 | ||
| Comcast Corp. | 6.500% | 11/15/35 | 945 | 1,360 | ||
| Comcast Corp. | 3.969% | 11/1/47 | 8,452 | 9,779 | ||
| Comcast Corp. | 4.000% | 3/1/48 | 12,180 | 14,159 | ||
| Comcast Corp. | 3.999% | 11/1/49 | 23,162 | 27,028 | ||
| 5 | Comcast Corp. | 2.887% | 11/1/51 | 67,805 | 66,694 | |
| Comcast Corp. | 2.450% | 8/15/52 | 25,780 | 23,567 | ||
| Comcast Corp. | 4.049% | 11/1/52 | 10,339 | 12,327 | ||
| 5 | Comcast Corp. | 2.937% | 11/1/56 | 198,153 | 192,430 | |
| 5 | Comcast Corp. | 2.987% | 11/1/63 | 95,407 | 92,298 | |
| 5 | Cox Communications Inc. | 3.150% | 8/15/24 | 2,503 | 2,620 | |
| 5 | Cox Communications Inc. | 2.600% | 6/15/31 | 17,795 | 17,862 | |
| 5 | Cox Communications Inc. | 4.800% | 2/1/35 | 30,000 | 35,678 | |
| 5 | Deutsche Telekom International Finance BV | 3.600% | 1/19/27 | 10,918 | 11,775 | |
| 5 | Deutsche Telekom International Finance BV | 4.375% | 6/21/28 | 21,754 | 24,750 | |
| Discovery Communications LLC | 3.950% | 3/20/28 | 14,288 | 15,583 | ||
| Discovery Communications LLC | 4.125% | 5/15/29 | 14,172 | 15,650 | ||
| Coupon | Maturity Date | Face Amount ($000) | Market Value• ($000) | |||
| Discovery Communications LLC | 3.625% | 5/15/30 | 29,710 | 31,819 | ||
| Discovery Communications LLC | 4.650% | 5/15/50 | 22,028 | 26,025 | ||
| Discovery Communications LLC | 4.000% | 9/15/55 | 16,442 | 17,569 | ||
| NBCUniversal Media LLC | 4.450% | 1/15/43 | 6,331 | 7,704 | ||
| 5 | NTT Finance Corp. | 1.162% | 4/3/26 | 44,235 | 43,488 | |
| 5 | NTT Finance Corp. | 2.065% | 4/3/31 | 9,445 | 9,511 | |
| 5 | Ooredoo International Finance Ltd. | 2.625% | 4/8/31 | 23,430 | 23,524 | |
| Orange SA | 9.000% | 3/1/31 | 20,280 | 31,170 | ||
| 5 | SK Telecom Co. Ltd. | 3.750% | 4/16/23 | 11,995 | 12,465 | |
| 5 | Sky Ltd. | 3.750% | 9/16/24 | 45,046 | 48,148 | |
| 5 | Sprint Spectrum Co. LLC | 4.738% | 3/20/25 | 37,857 | 39,672 | |
| Telefonica Emisiones SA | 5.213% | 3/8/47 | 19,100 | 23,922 | ||
| Telefonica Emisiones SA | 5.520% | 3/1/49 | 19,772 | 25,806 | ||
| Time Warner Entertainment Co. LP | 8.375% | 3/15/23 | 3,925 | 4,300 | ||
| T-Mobile USA Inc. | 2.050% | 2/15/28 | 24,985 | 24,596 | ||
| T-Mobile USA Inc. | 3.875% | 4/15/30 | 61,875 | 67,242 | ||
| T-Mobile USA Inc. | 2.550% | 2/15/31 | 4,750 | 4,691 | ||
| T-Mobile USA Inc. | 2.250% | 11/15/31 | 4,745 | 4,559 | ||
| T-Mobile USA Inc. | 4.375% | 4/15/40 | 15,735 | 17,884 | ||
| T-Mobile USA Inc. | 4.500% | 4/15/50 | 22,950 | 26,989 | ||
| T-Mobile USA Inc. | 3.300% | 2/15/51 | 19,300 | 18,876 | ||
| T-Mobile USA Inc. | 3.600% | 11/15/60 | 9,460 | 9,415 | ||
| TWDC Enterprises 18 Corp. | 4.375% | 8/16/41 | 26,724 | 32,268 | ||
| 2 | TWDC Enterprises 18 Corp. | 4.125% | 6/1/44 | 14,185 | 16,965 | |
| Verizon Communications Inc. | 4.329% | 9/21/28 | 23,335 | 26,596 | ||
| 5 | Verizon Communications Inc. | 2.355% | 3/15/32 | 3,321 | 3,284 | |
| Verizon Communications Inc. | 4.812% | 3/15/39 | 85,963 | 107,913 | ||
| Verizon Communications Inc. | 4.750% | 11/1/41 | 7,750 | 9,731 | ||
| Verizon Communications Inc. | 4.862% | 8/21/46 | 20,077 | 26,435 | ||
| Verizon Communications Inc. | 2.987% | 10/30/56 | 9,247 | 8,953 | ||
| ViacomCBS Inc. | 3.700% | 6/1/28 | 15,190 | 16,582 | ||
| Vodafone Group plc | 5.000% | 5/30/38 | 1,895 | 2,366 | ||
| Vodafone Group plc | 5.250% | 5/30/48 | 45,220 | 58,815 | ||
| Walt Disney Co. | 3.000% | 9/15/22 | 11,891 | 12,120 | ||
| Walt Disney Co. | 2.650% | 1/13/31 | 3,850 | 4,003 | ||
| Walt Disney Co. | 3.500% | 5/13/40 | 50,260 | 55,387 | ||
| Walt Disney Co. | 4.750% | 9/15/44 | 2,358 | 3,034 | ||
| Walt Disney Co. | 4.750% | 11/15/46 | 14,000 | 18,446 | ||
| Walt Disney Co. | 2.750% | 9/1/49 | 16,835 | 16,508 | ||
| Walt Disney Co. | 3.600% | 1/13/51 | 27,250 | 31,259 | ||
| Walt Disney Co. | 3.800% | 5/13/60 | 28,415 | 33,656 | ||
| 2,174,449 | ||||||
| Consumer Discretionary (0.8%) | ||||||
| Amazon.com Inc. | 2.800% | 8/22/24 | 14,010 | 14,639 | ||
| Amazon.com Inc. | 4.800% | 12/5/34 | 37,370 | 47,708 | ||
| Amazon.com Inc. | 4.950% | 12/5/44 | 22,605 | 30,930 | ||
| Amazon.com Inc. | 4.250% | 8/22/57 | 41,385 | 53,807 | ||
| 2 | American Honda Finance Corp. | 2.000% | 3/24/28 | 19,250 | 19,408 | |
| AutoZone Inc. | 3.700% | 4/15/22 | 46,136 | 46,315 | ||
| 5 | BMW US Capital LLC | 0.800% | 4/1/24 | 12,590 | 12,522 | |
| 5 | BMW US Capital LLC | 1.250% | 8/12/26 | 28,900 | 28,478 | |
| 5 | Daimler Finance North America LLC | 3.250% | 8/1/24 | 5,870 | 6,171 | |
| 2 | Duke University | 2.832% | 10/1/55 | 25,700 | 27,414 | |
| 2 | Emory University | 2.143% | 9/1/30 | 25,351 | 25,813 | |
| General Motors Financial Co. Inc. | 3.950% | 4/13/24 | 57,810 | 60,960 | ||
| 2 | Georgetown University | 4.315% | 4/1/49 | 5,405 | 6,865 | |
| 2 | Georgetown University | 2.943% | 4/1/50 | 9,430 | 9,714 | |
| Coupon | Maturity Date | Face Amount ($000) | Market Value• ($000) | |||
| Home Depot Inc. | 3.900% | 12/6/28 | 10,250 | 11,599 | ||
| Home Depot Inc. | 3.300% | 4/15/40 | 18,410 | 19,992 | ||
| Home Depot Inc. | 4.400% | 3/15/45 | 28,655 | 36,117 | ||
| Home Depot Inc. | 4.500% | 12/6/48 | 12,215 | 15,986 | ||
| 5 | Hyundai Capital America | 0.800% | 4/3/23 | 91,160 | 91,016 | |
| 5 | Hyundai Capital America | 0.875% | 6/14/24 | 49,225 | 48,580 | |
| 5 | Hyundai Capital America | 1.650% | 9/17/26 | 36,480 | 35,805 | |
| 2 | Johns Hopkins University | 4.083% | 7/1/53 | 7,805 | 10,169 | |
| 2 | Johns Hopkins University | 2.813% | 1/1/60 | 6,420 | 6,604 | |
| Leland Stanford Junior University | 6.875% | 2/1/24 | 13,685 | 15,413 | ||
| 2 | Leland Stanford Junior University | 7.650% | 6/15/26 | 29,000 | 35,901 | |
| Lowe's Cos. Inc. | 3.100% | 5/3/27 | 68,700 | 73,205 | ||
| Lowe's Cos. Inc. | 6.500% | 3/15/29 | 13,301 | 17,103 | ||
| 2 | McDonald's Corp. | 3.250% | 6/10/24 | 5,460 | 5,757 | |
| 2 | McDonald's Corp. | 4.875% | 7/15/40 | 10,000 | 12,694 | |
| 2 | McDonald's Corp. | 4.875% | 12/9/45 | 9,940 | 12,893 | |
| 2 | McDonald's Corp. | 3.625% | 9/1/49 | 37,735 | 42,149 | |
| 2 | Northeastern University | 2.894% | 10/1/50 | 6,995 | 7,170 | |
| Stanley Black & Decker Inc. | 4.850% | 11/15/48 | 24,455 | 33,463 | ||
| Starbucks Corp. | 4.500% | 11/15/48 | 51,181 | 64,080 | ||
| 2 | University of Chicago | 2.761% | 4/1/45 | 5,825 | 5,976 | |
| VF Corp. | 2.800% | 4/23/27 | 17,615 | 18,467 | ||
| VF Corp. | 2.950% | 4/23/30 | 37,015 | 38,595 | ||
| 1,049,478 | ||||||
| Consumer Staples (0.7%) | ||||||
| Altria Group Inc. | 5.800% | ��� 2/14/39 | 18,665 | 22,676 | ||
| Altria Group Inc. | 4.500% | 5/2/43 | 5,945 | 6,288 | ||
| Altria Group Inc. | 3.875% | 9/16/46 | 22,775 | 22,351 | ||
| Anheuser-Busch Cos. LLC | 6.500% | 1/1/28 | 19,550 | 24,038 | ||
| 2 | Anheuser-Busch Cos. LLC | 4.700% | 2/1/36 | 35,700 | 42,947 | |
| 2 | Anheuser-Busch Cos. LLC | 4.900% | 2/1/46 | 39,700 | 50,416 | |
| Anheuser-Busch InBev Worldwide Inc. | 3.750% | 7/15/42 | 19,610 | 21,437 | ||
| Archer-Daniels-Midland Co. | 4.500% | 3/15/49 | 35,045 | 46,736 | ||
| BAT Capital Corp. | 3.557% | 8/15/27 | 63,450 | 66,538 | ||
| 5 | Cargill Inc. | 6.875% | 5/1/28 | 19,355 | 24,422 | |
| 5 | Cargill Inc. | 2.125% | 4/23/30 | 5,265 | 5,273 | |
| 5 | Cargill Inc. | 4.760% | 11/23/45 | 28,190 | 37,685 | |
| 5 | CK Hutchison International 20 Ltd. | 3.375% | 5/8/50 | 22,015 | 24,586 | |
| 5 | Coca-Cola Europacific Partners plc | 0.800% | 5/3/24 | 32,165 | 31,684 | |
| 2 | Colgate-Palmolive Co. | 7.600% | 5/19/25 | 13,920 | 16,830 | |
| Conagra Brands Inc. | 4.600% | 11/1/25 | 7,855 | 8,706 | ||
| Conagra Brands Inc. | 1.375% | 11/1/27 | 11,765 | 11,275 | ||
| Conagra Brands Inc. | 5.300% | 11/1/38 | 6,410 | 8,124 | ||
| Constellation Brands Inc. | 3.750% | 5/1/50 | 2,415 | 2,683 | ||
| 5 | Danone SA | 2.947% | 11/2/26 | 30,550 | 32,110 | |
| Diageo Capital plc | 2.625% | 4/29/23 | 48,310 | 49,354 | ||
| Diageo Capital plc | 2.375% | 10/24/29 | 20,000 | 20,533 | ||
| Diageo Capital plc | 2.000% | 4/29/30 | 5,830 | 5,798 | ||
| Diageo Capital plc | 2.125% | 4/29/32 | 1,845 | 1,843 | ||
| Diageo Investment Corp. | 2.875% | 5/11/22 | 26,991 | 27,266 | ||
| Estee Lauder Cos. Inc. | 2.375% | 12/1/29 | 12,615 | 12,970 | ||
| Hormel Foods Corp. | 1.700% | 6/3/28 | 8,125 | 8,067 | ||
| 5 | Imperial Brands Finance plc | 3.750% | 7/21/22 | 34,745 | 35,203 | |
| Kroger Co. | 3.850% | 8/1/23 | 10,770 | 11,242 | ||
| Kroger Co. | 4.000% | 2/1/24 | 22,290 | 23,569 | ||
| McCormick & Co. Inc. | 2.500% | 4/15/30 | 3,205 | 3,248 | ||
| Molson Coors Beverage Co. | 3.500% | 5/1/22 | 16,525 | 16,726 | ||
| Coupon | Maturity Date | Face Amount ($000) | Market Value• ($000) | |||
| Molson Coors Beverage Co. | 3.000% | 7/15/26 | 54,900 | 57,594 | ||
| Philip Morris International Inc. | 2.500% | 8/22/22 | 21,645 | 21,986 | ||
| Philip Morris International Inc. | 3.600% | 11/15/23 | 7,000 | 7,383 | ||
| Philip Morris International Inc. | 3.375% | 8/11/25 | 14,440 | 15,385 | ||
| Philip Morris International Inc. | 4.875% | 11/15/43 | 6,185 | 7,520 | ||
| 5 | Sigma Alimentos SA de CV | 4.125% | 5/2/26 | 14,750 | 15,581 | |
| 848,073 | ||||||
| Energy (1.1%) | ||||||
| BP Capital Markets America Inc. | 1.749% | 8/10/30 | 7,780 | 7,480 | ||
| BP Capital Markets America Inc. | 3.060% | 6/17/41 | 20,000 | 20,169 | ||
| BP Capital Markets America Inc. | 2.772% | 11/10/50 | 11,870 | 11,168 | ||
| BP Capital Markets America Inc. | 2.939% | 6/4/51 | 30,385 | 29,468 | ||
| BP Capital Markets America Inc. | 3.001% | 3/17/52 | 68,790 | 67,421 | ||
| BP Capital Markets America Inc. | 3.379% | 2/8/61 | 12,750 | 13,178 | ||
| BP Capital Markets plc | 2.500% | 11/6/22 | 22,000 | 22,403 | ||
| BP Capital Markets plc | 3.994% | 9/26/23 | 16,185 | 17,081 | ||
| BP Capital Markets plc | 3.814% | 2/10/24 | 38,938 | 41,117 | ||
| BP Capital Markets plc | 3.506% | 3/17/25 | 50,285 | 53,541 | ||
| Chevron Corp. | 3.191% | 6/24/23 | 25,330 | 26,163 | ||
| ConocoPhillips Co. | 4.950% | 3/15/26 | 4,385 | 4,953 | ||
| 5 | Coterra Energy Inc. | 4.375% | 6/1/24 | 31,555 | 33,576 | |
| 5 | Eastern Gas Transmission & Storage Inc. | 3.000% | 11/15/29 | 19,580 | 20,544 | |
| 5 | Eastern Gas Transmission & Storage Inc. | 4.800% | 11/1/43 | 4,185 | 5,162 | |
| 5 | Eastern Gas Transmission & Storage Inc. | 4.600% | 12/15/44 | 24,863 | 30,293 | |
| Energy Transfer LP | 5.250% | 4/15/29 | 40,000 | 45,656 | ||
| Energy Transfer LP | 5.350% | 5/15/45 | 3,500 | 4,055 | ||
| Energy Transfer LP | 5.300% | 4/15/47 | 5,745 | 6,638 | ||
| Energy Transfer LP | 5.400% | 10/1/47 | 750 | 886 | ||
| Energy Transfer LP | 5.000% | 5/15/50 | 10,000 | 11,471 | ||
| Enterprise Products Operating LLC | 5.100% | 2/15/45 | 9,720 | 12,125 | ||
| Enterprise Products Operating LLC | 4.250% | 2/15/48 | 26,420 | 29,931 | ||
| Enterprise Products Operating LLC | 3.700% | 1/31/51 | 5,935 | 6,275 | ||
| Enterprise Products Operating LLC | 3.300% | 2/15/53 | 15,000 | 15,000 | ||
| Exxon Mobil Corp. | 2.726% | 3/1/23 | 11,910 | 12,184 | ||
| Exxon Mobil Corp. | 3.043% | 3/1/26 | 8,115 | 8,608 | ||
| Exxon Mobil Corp. | 2.275% | 8/16/26 | 36,735 | 38,013 | ||
| Exxon Mobil Corp. | 2.440% | 8/16/29 | 25,195 | 25,841 | ||
| Exxon Mobil Corp. | 2.610% | 10/15/30 | 35,925 | 37,179 | ||
| Exxon Mobil Corp. | 4.114% | 3/1/46 | 12,060 | 14,309 | ||
| 5 | Galaxy Pipeline Assets Bidco Ltd. | 2.160% | 3/31/34 | 47,605 | 46,314 | |
| 5 | Galaxy Pipeline Assets Bidco Ltd. | 2.940% | 9/30/40 | 44,479 | 43,923 | |
| Plains All American Pipeline LP | 3.850% | 10/15/23 | 36,775 | 38,313 | ||
| 5 | Schlumberger Holdings Corp. | 3.900% | 5/17/28 | 31,025 | 33,820 | |
| 5 | Schlumberger Investment SA | 2.400% | 8/1/22 | 23,925 | 24,124 | |
| Schlumberger Investment SA | 3.650% | 12/1/23 | 44,520 | 46,598 | ||
| Shell International Finance BV | 3.250% | 5/11/25 | 11,051 | 11,782 | ||
| Shell International Finance BV | 4.125% | 5/11/35 | 43,465 | 51,021 | ||
| Shell International Finance BV | 5.500% | 3/25/40 | 12,990 | 17,872 | ||
| Shell International Finance BV | 2.875% | 11/26/41 | 15,000 | 15,086 | ||
| Shell International Finance BV | 4.375% | 5/11/45 | 96,700 | 119,209 | ||
| Shell International Finance BV | 3.000% | 11/26/51 | 42,435 | 43,330 | ||
| Suncor Energy Inc. | 5.950% | 12/1/34 | 20,700 | 27,053 | ||
| TotalEnergies Capital International SA | 2.700% | 1/25/23 | 36,510 | 37,363 | ||
| TotalEnergies Capital International SA | 3.750% | 4/10/24 | 41,500 | 44,095 | ||
| TransCanada PipeLines Ltd. | 4.875% | 1/15/26 | 47,256 | 52,845 | ||
| TransCanada PipeLines Ltd. | 4.100% | 4/15/30 | 7,125 | 7,923 | ||
| 1,332,559 | ||||||
| Coupon | Maturity Date | Face Amount ($000) | Market Value• ($000) | |||
| Financials (8.4%) | ||||||
| ACE Capital Trust II | 9.700% | 4/1/30 | 20,000 | 29,427 | ||
| AerCap Ireland Capital DAC | 3.000% | 10/29/28 | 15,230 | 15,336 | ||
| AerCap Ireland Capital DAC | 3.300% | 1/30/32 | 11,930 | 12,012 | ||
| AerCap Ireland Capital DAC | 3.400% | 10/29/33 | 6,030 | 6,065 | ||
| AerCap Ireland Capital DAC | 3.850% | 10/29/41 | 7,230 | 7,457 | ||
| 5 | AIA Group Ltd. | 3.600% | 4/9/29 | 50,475 | 55,424 | |
| 5 | AIA Group Ltd. | 3.375% | 4/7/30 | 12,460 | 13,528 | |
| 2 | American Express Credit Corp. | 2.700% | 3/3/22 | 54,990 | 55,203 | |
| American International Group Inc. | 3.750% | 7/10/25 | 8,990 | 9,657 | ||
| American International Group Inc. | 4.250% | 3/15/29 | 35,227 | 40,195 | ||
| American International Group Inc. | 4.700% | 7/10/35 | 16,375 | 19,759 | ||
| American International Group Inc. | 6.250% | 5/1/36 | 7,775 | 10,946 | ||
| American International Group Inc. | 4.500% | 7/16/44 | 12,612 | 15,515 | ||
| American International Group Inc. | 4.800% | 7/10/45 | 7,130 | 9,232 | ||
| American International Group Inc. | 4.750% | 4/1/48 | 17,010 | 22,362 | ||
| American International Group Inc. | 4.375% | 6/30/50 | 9,505 | 11,975 | ||
| American International Group Inc. | 4.375% | 1/15/55 | 4,755 | 5,982 | ||
| 5 | Athene Global Funding | 1.000% | 4/16/24 | 22,095 | 21,971 | |
| 5 | Australia & New Zealand Banking Group Ltd. | 2.570% | 11/25/35 | 22,135 | 21,382 | |
| Banco Santander SA | 3.125% | 2/23/23 | 28,400 | 29,183 | ||
| Banco Santander SA | 3.848% | 4/12/23 | 16,400 | 17,046 | ||
| Banco Santander SA | 1.849% | 3/25/26 | 14,000 | 13,954 | ||
| Banco Santander SA | 2.749% | 12/3/30 | 15,600 | 15,252 | ||
| Banco Santander SA | 2.958% | 3/25/31 | 10,000 | 10,165 | ||
| 2 | Bank of America Corp. | 4.000% | 1/22/25 | 32,900 | 35,191 | |
| 2 | Bank of America Corp. | 3.500% | 4/19/26 | 10,000 | 10,767 | |
| 2 | Bank of America Corp. | 3.559% | 4/23/27 | 86,705 | 92,571 | |
| 2 | Bank of America Corp. | 3.593% | 7/21/28 | 37,950 | 40,790 | |
| 2 | Bank of America Corp. | 3.419% | 12/20/28 | 8,681 | 9,249 | |
| 2 | Bank of America Corp. | 4.271% | 7/23/29 | 74,365 | 83,067 | |
| 2 | Bank of America Corp. | 3.974% | 2/7/30 | 120,185 | 132,837 | |
| 2 | Bank of America Corp. | 3.194% | 7/23/30 | 35,285 | 37,241 | |
| 2 | Bank of America Corp. | 2.496% | 2/13/31 | 50,870 | 51,026 | |
| Bank of America Corp. | 2.572% | 10/20/32 | 17,275 | 17,376 | ||
| 2 | Bank of America Corp. | 5.875% | 2/7/42 | 9,965 | 14,290 | |
| Bank of America Corp. | 3.311% | 4/22/42 | 55,635 | 58,942 | ||
| 2 | Bank of America Corp. | 5.000% | 1/21/44 | 39,433 | 51,629 | |
| 2 | Bank of America Corp. | 3.946% | 1/23/49 | 5,380 | 6,373 | |
| 2 | Bank of America Corp. | 4.330% | 3/15/50 | 78,120 | 97,960 | |
| Bank of America Corp. | 2.972% | 7/21/52 | 65,950 | 67,230 | ||
| 5 | Bank of Montreal | 2.500% | 1/11/22 | 60,000 | 60,144 | |
| 2 | Bank of New York Mellon Corp. | 3.000% | 2/24/25 | 27,990 | 29,541 | |
| Bank of Nova Scotia | 2.700% | 8/3/26 | 63,160 | 66,053 | ||
| 5 | Banque Federative du Credit Mutuel SA | 1.604% | 10/4/26 | 34,305 | 34,017 | |
| 2 | Barclays plc | 3.932% | 5/7/25 | 55,605 | 58,737 | |
| Barclays plc | 2.667% | 3/10/32 | 44,170 | 43,742 | ||
| Barclays plc | 2.894% | 11/24/32 | 43,865 | 44,052 | ||
| Barclays plc | 3.330% | 11/24/42 | 37,170 | 37,718 | ||
| 7 | Barclays plc, 3M USD LIBOR + 1.380% | 1.535% | 5/16/24 | 36,385 | 36,893 | |
| 5 | BNP Paribas SA | 2.950% | 5/23/22 | 4,105 | 4,153 | |
| 2 | BNP Paribas SA | 3.250% | 3/3/23 | 7,620 | 7,870 | |
| 5 | BNP Paribas SA | 3.800% | 1/10/24 | 25,780 | 27,149 | |
| 5 | BNP Paribas SA | 3.375% | 1/9/25 | 60,670 | 63,961 | |
| 5 | BNP Paribas SA | 2.819% | 11/19/25 | 45,685 | 47,143 | |
| 5 | BNP Paribas SA | 1.323% | 1/13/27 | 18,995 | 18,508 | |
| 5 | BNP Paribas SA | 3.500% | 11/16/27 | 69,325 | 74,374 | |
| Coupon | Maturity Date | Face Amount ($000) | Market Value• ($000) | |||
| 5 | BNP Paribas SA | 2.159% | 9/15/29 | 31,165 | 30,568 | |
| 5 | BNP Paribas SA | 2.871% | 4/19/32 | 23,435 | 23,766 | |
| 5 | BPCE SA | 5.700% | 10/22/23 | 6,225 | 6,733 | |
| BPCE SA | 4.000% | 4/15/24 | 30,615 | 32,674 | ||
| 5 | BPCE SA | 5.150% | 7/21/24 | 43,790 | 47,684 | |
| 5 | BPCE SA | 2.045% | 10/19/27 | 25,245 | 25,032 | |
| 5 | BPCE SA | 3.500% | 10/23/27 | 64,230 | 68,070 | |
| 5 | BPCE SA | 2.700% | 10/1/29 | 50,000 | 51,691 | |
| 5 | Brighthouse Financial Global Funding | 1.000% | 4/12/24 | 2,425 | 2,412 | |
| 5 | Brighthouse Financial Global Funding | 1.550% | 5/24/26 | 20,210 | 19,999 | |
| 5 | Brighthouse Financial Global Funding | 2.000% | 6/28/28 | 16,275 | 16,139 | |
| 5 | Canadian Imperial Bank of Commerce | 1.150% | 7/8/26 | 33,885 | 33,582 | |
| 7 | Canadian Imperial Bank of Commerce, 3M USD LIBOR + 0.720% | 0.838% | 6/16/22 | 57,780 | 57,986 | |
| Capital One Financial Corp. | 3.750% | 4/24/24 | 55,460 | 58,660 | ||
| Capital One Financial Corp. | 3.200% | 2/5/25 | 24,185 | 25,478 | ||
| Charles Schwab Corp. | 0.750% | 3/18/24 | 30,130 | 30,009 | ||
| Charles Schwab Corp. | 3.200% | 3/2/27 | 19,665 | 21,156 | ||
| Charles Schwab Corp. | 2.000% | 3/20/28 | 27,375 | 27,688 | ||
| Chubb Corp. | 6.000% | 5/11/37 | 50,000 | 71,905 | ||
| Chubb INA Holdings Inc. | 3.350% | 5/15/24 | 22,345 | 23,623 | ||
| Chubb INA Holdings Inc. | 4.350% | 11/3/45 | 29,835 | 38,117 | ||
| Citigroup Inc. | 4.500% | 1/14/22 | 33,920 | 34,084 | ||
| Citigroup Inc. | 0.981% | 5/1/25 | 32,820 | 32,591 | ||
| Citigroup Inc. | 1.462% | 6/9/27 | 66,630 | 65,357 | ||
| Citigroup Inc. | 4.125% | 7/25/28 | 14,550 | 15,990 | ||
| 2 | Citigroup Inc. | 3.520% | 10/27/28 | 72,550 | 77,646 | |
| Citigroup Inc. | 6.625% | 6/15/32 | 45,000 | 60,232 | ||
| Citigroup Inc. | 2.520% | 11/3/32 | 25,750 | 25,753 | ||
| 2 | Citigroup Inc. | 3.878% | 1/24/39 | 37,030 | 42,121 | |
| Citigroup Inc. | 2.904% | 11/3/42 | 19,370 | 19,269 | ||
| 2 | Comerica Bank | 2.500% | 7/23/24 | 27,415 | 28,417 | |
| 5 | Commonwealth Bank of Australia | 2.688% | 3/11/31 | 74,015 | 73,258 | |
| 5 | Cooperatieve Rabobank UA | 1.106% | 2/24/27 | 46,710 | 45,527 | |
| 5 | Credit Agricole SA | 3.750% | 4/24/23 | 31,675 | 32,982 | |
| 5 | Credit Agricole SA | 3.250% | 10/4/24 | 71,600 | 75,477 | |
| 2 | Credit Suisse AG | 3.625% | 9/9/24 | 4,885 | 5,197 | |
| 5 | Credit Suisse Group AG | 3.574% | 1/9/23 | 20,675 | 20,733 | |
| 5 | Credit Suisse Group AG | 4.207% | 6/12/24 | 12,375 | 12,931 | |
| Credit Suisse Group AG | 3.750% | 3/26/25 | 67,850 | 72,211 | ||
| 5 | Credit Suisse Group AG | 2.593% | 9/11/25 | 17,585 | 17,981 | |
| 5 | Credit Suisse Group AG | 3.869% | 1/12/29 | 10,980 | 11,768 | |
| 5 | Credit Suisse Group AG | 3.091% | 5/14/32 | 59,185 | 60,023 | |
| 5,7 | Credit Suisse Group AG, 3M USD LIBOR + 1.240% | 1.354% | 6/12/24 | 25,015 | 25,311 | |
| Credit Suisse Group Funding Guernsey Ltd. | 3.800% | 9/15/22 | 55,260 | 56,608 | ||
| 5 | Danske Bank A/S | 5.000% | 1/12/22 | 21,605 | 21,706 | |
| 5 | Danske Bank A/S | 3.875% | 9/12/23 | 46,290 | 48,411 | |
| 5 | Danske Bank A/S | 5.375% | 1/12/24 | 28,240 | 30,519 | |
| 5 | Danske Bank A/S | 1.621% | 9/11/26 | 28,990 | 28,675 | |
| 5 | Danske Bank A/S | 1.549% | 9/10/27 | 55,460 | 54,333 | |
| 5 | DNB Bank ASA | 1.535% | 5/25/27 | 44,030 | 43,459 | |
| 5 | DNB Bank ASA | 1.605% | 3/30/28 | 45,870 | 45,029 | |
| 5 | DNB Boligkreditt A/S | 2.500% | 3/28/22 | 47,550 | 47,876 | |
| 5 | Equitable Financial Life Global Funding | 1.400% | 7/7/25 | 10,395 | 10,340 | |
| 5 | Equitable Financial Life Global Funding | 1.300% | 7/12/26 | 26,755 | 26,193 | |
| 5 | Equitable Financial Life Global Funding | 1.400% | 8/27/27 | 18,220 | 17,793 | |
| Coupon | Maturity Date | Face Amount ($000) | Market Value• ($000) | |||
| 5 | Equitable Financial Life Global Funding | 1.800% | 3/8/28 | 28,220 | 27,803 | |
| 5 | Farmers Exchange Capital | 7.050% | 7/15/28 | 25,000 | 30,654 | |
| Fifth Third Bancorp | 2.550% | 5/5/27 | 19,150 | 19,809 | ||
| 5 | Five Corners Funding Trust | 4.419% | 11/15/23 | 5,935 | 6,314 | |
| 5 | GA Global Funding Trust | 1.000% | 4/8/24 | 21,750 | 21,633 | |
| Global Payments Inc. | 2.150% | 1/15/27 | 20,910 | 20,910 | ||
| Global Payments Inc. | 2.900% | 5/15/30 | 14,680 | 14,888 | ||
| Globe Life Inc. | 7.875% | 5/15/23 | 45,000 | 49,280 | ||
| Goldman Sachs Group Inc. | 5.750% | 1/24/22 | 40,725 | 41,044 | ||
| Goldman Sachs Group Inc. | 3.625% | 1/22/23 | 35,320 | 36,468 | ||
| Goldman Sachs Group Inc. | 3.500% | 1/23/25 | 17,545 | 18,557 | ||
| 2 | Goldman Sachs Group Inc. | 3.272% | 9/29/25 | 46,260 | 48,534 | |
| Goldman Sachs Group Inc. | 3.850% | 1/26/27 | 17,980 | 19,294 | ||
| Goldman Sachs Group Inc. | 1.431% | 3/9/27 | 71,545 | 70,170 | ||
| Goldman Sachs Group Inc. | 1.542% | 9/10/27 | 97,685 | 95,662 | ||
| 2 | Goldman Sachs Group Inc. | 3.691% | 6/5/28 | 15,055 | 16,214 | |
| 2 | Goldman Sachs Group Inc. | 3.814% | 4/23/29 | 23,795 | 25,906 | |
| 2 | Goldman Sachs Group Inc. | 4.223% | 5/1/29 | 67,740 | 75,265 | |
| Goldman Sachs Group Inc. | 3.800% | 3/15/30 | 19,490 | 21,366 | ||
| Goldman Sachs Group Inc. | 1.992% | 1/27/32 | 30,600 | 29,222 | ||
| Goldman Sachs Group Inc. | 2.615% | 4/22/32 | 74,125 | 74,270 | ||
| Goldman Sachs Group Inc. | 2.383% | 7/21/32 | 67,160 | 66,030 | ||
| Goldman Sachs Group Inc. | 2.650% | 10/21/32 | 14,050 | 14,110 | ||
| Goldman Sachs Group Inc. | 6.750% | 10/1/37 | 43,995 | 62,232 | ||
| Goldman Sachs Group Inc. | 6.250% | 2/1/41 | 20,135 | 29,267 | ||
| 2 | Goldman Sachs Group Inc. | 4.800% | 7/8/44 | 25,675 | 32,898 | |
| 5 | Guardian Life Global Funding | 1.250% | 5/13/26 | 6,735 | 6,665 | |
| HSBC Holdings plc | 3.600% | 5/25/23 | 60,200 | 62,657 | ||
| HSBC Holdings plc | 0.976% | 5/24/25 | 10,150 | 10,028 | ||
| HSBC Holdings plc | 3.900% | 5/25/26 | 12,085 | 13,063 | ||
| HSBC Holdings plc | 1.589% | 5/24/27 | 25,850 | 25,275 | ||
| HSBC Holdings plc | 2.251% | 11/22/27 | 49,725 | 49,796 | ||
| 2 | HSBC Holdings plc | 4.041% | 3/13/28 | 21,805 | 23,599 | |
| 2 | HSBC Holdings plc | 4.583% | 6/19/29 | 40,480 | 45,388 | |
| HSBC Holdings plc | 2.206% | �� 8/17/29 | 53,960 | 52,833 | ||
| 2 | HSBC Holdings plc | 2.357% | 8/18/31 | 54,320 | 53,173 | |
| HSBC Holdings plc | 2.804% | 5/24/32 | 50,910 | 50,928 | ||
| HSBC Holdings plc | 2.871% | 11/22/32 | 52,995 | 53,165 | ||
| HSBC Holdings plc | 6.500% | 5/2/36 | 25,000 | 33,994 | ||
| HSBC Holdings plc | 6.100% | 1/14/42 | 40,665 | 58,257 | ||
| HSBC Holdings plc | 5.250% | 3/14/44 | 13,210 | 17,164 | ||
| 7 | HSBC Holdings plc, 3M USD LIBOR + 1.000% | 1.160% | 5/18/24 | 26,340 | 26,575 | |
| HSBC USA Inc. | 3.500% | 6/23/24 | 28,025 | 29,644 | ||
| ING Groep NV | 3.150% | 3/29/22 | 12,955 | 13,065 | ||
| ING Groep NV | 3.950% | 3/29/27 | 44,565 | 48,776 | ||
| ING Groep NV | 1.726% | 4/1/27 | 16,075 | 15,999 | ||
| Intercontinental Exchange Inc. | 1.850% | 9/15/32 | 9,525 | 8,973 | ||
| Intercontinental Exchange Inc. | 2.650% | 9/15/40 | 5,860 | 5,635 | ||
| Intercontinental Exchange Inc. | 3.000% | 6/15/50 | 39,540 | 39,688 | ||
| 5 | JAB Holdings BV | 2.200% | 11/23/30 | 9,385 | 9,203 | |
| 5 | JAB Holdings BV | 3.750% | 5/28/51 | 19,275 | 21,313 | |
| 5 | Jackson National Life Global Funding | 3.250% | 1/30/24 | 24,070 | 25,207 | |
| 5 | Jackson National Life Insurance Co. | 8.150% | 3/15/27 | 18,890 | 24,411 | |
| JPMorgan Chase & Co. | 3.375% | 5/1/23 | 15,450 | 16,002 | ||
| JPMorgan Chase & Co. | 3.875% | 2/1/24 | 39,000 | 41,404 | ||
| JPMorgan Chase & Co. | 3.900% | 7/15/25 | 13,870 | 15,000 | ||
| JPMorgan Chase & Co. | 4.125% | 12/15/26 | 29,835 | 33,001 | ||
| Coupon | Maturity Date | Face Amount ($000) | Market Value• ($000) | |||
| JPMorgan Chase & Co. | 4.250% | 10/1/27 | 13,420 | 14,994 | ||
| JPMorgan Chase & Co. | 2.069% | 6/1/29 | 42,085 | 41,602 | ||
| 2 | JPMorgan Chase & Co. | 4.452% | 12/5/29 | 64,735 | 73,607 | |
| 2 | JPMorgan Chase & Co. | 3.702% | 5/6/30 | 16,000 | 17,393 | |
| JPMorgan Chase & Co. | 2.580% | 4/22/32 | 58,675 | 59,176 | ||
| 2 | JPMorgan Chase & Co. | 3.109% | 4/22/41 | 19,440 | 20,248 | |
| JPMorgan Chase & Co. | 5.600% | 7/15/41 | 96,000 | 134,679 | ||
| JPMorgan Chase & Co. | 5.400% | 1/6/42 | 18,035 | 24,803 | ||
| JPMorgan Chase & Co. | 3.157% | 4/22/42 | 50,000 | 52,215 | ||
| JPMorgan Chase & Co. | 5.625% | 8/16/43 | 16,100 | 22,329 | ||
| JPMorgan Chase & Co. | 4.950% | 6/1/45 | 15,000 | 19,791 | ||
| 2 | JPMorgan Chase & Co. | 3.964% | 11/15/48 | 159,600 | 189,751 | |
| 2 | JPMorgan Chase & Co. | 3.109% | 4/22/51 | 19,885 | 20,876 | |
| 5 | Liberty Mutual Group Inc. | 4.250% | 6/15/23 | 3,160 | 3,316 | |
| 5 | Liberty Mutual Group Inc. | 4.569% | 2/1/29 | 11,170 | 12,980 | |
| 5 | Liberty Mutual Insurance Co. | 7.875% | 10/15/26 | 31,210 | 38,877 | |
| 5 | LSEGA Financing plc | 1.375% | 4/6/26 | 56,790 | 55,935 | |
| 5 | LSEGA Financing plc | 2.000% | 4/6/28 | 24,615 | 24,426 | |
| 5 | LSEGA Financing plc | 2.500% | 4/6/31 | 37,780 | 38,140 | |
| 5 | Macquarie Group Ltd. | 4.150% | 3/27/24 | 49,500 | 51,514 | |
| 5 | Macquarie Group Ltd. | 1.935% | 4/14/28 | 42,835 | 42,275 | |
| 5 | Macquarie Group Ltd. | 2.871% | 1/14/33 | 59,895 | 60,012 | |
| 2 | Manufacturers & Traders Trust Co. | 2.900% | 2/6/25 | 24,685 | 25,993 | |
| Marsh & McLennan Cos. Inc. | 4.375% | 3/15/29 | 23,405 | 26,695 | ||
| Marsh & McLennan Cos. Inc. | 4.900% | 3/15/49 | 10,915 | 15,021 | ||
| 5 | Massachusetts Mutual Life Insurance Co. | 3.200% | 12/1/61 | 30,000 | 30,384 | |
| MetLife Inc. | 3.600% | 4/10/24 | 35,035 | 37,121 | ||
| MetLife Inc. | 4.125% | 8/13/42 | 5,565 | 6,602 | ||
| MetLife Inc. | 4.875% | 11/13/43 | 17,000 | 22,396 | ||
| 5 | Metropolitan Life Global Funding I | 2.650% | 4/8/22 | 13,770 | 13,883 | |
| 5 | Metropolitan Life Global Funding I | 3.450% | 12/18/26 | 23,660 | 25,648 | |
| 5 | Metropolitan Life Global Funding I | 3.000% | 9/19/27 | 21,455 | 22,787 | |
| Mitsubishi UFJ Financial Group Inc. | 2.623% | 7/18/22 | 67,980 | 68,883 | ||
| 2 | Morgan Stanley | 3.875% | 4/29/24 | 97,010 | 102,975 | |
| 2 | Morgan Stanley | 3.700% | 10/23/24 | 29,050 | 30,959 | |
| Morgan Stanley | 0.790% | 5/30/25 | 42,545 | 41,911 | ||
| 2 | Morgan Stanley | 2.720% | 7/22/25 | 53,860 | 55,612 | |
| 2 | Morgan Stanley | 4.000% | 7/23/25 | 29,455 | 31,956 | |
| 2 | Morgan Stanley | 3.125% | 7/27/26 | 11,435 | 12,096 | |
| 2 | Morgan Stanley | 6.250% | 8/9/26 | 20,000 | 23,962 | |
| Morgan Stanley | 3.625% | 1/20/27 | 60,000 | 64,882 | ||
| 2 | Morgan Stanley | 3.772% | 1/24/29 | 56,905 | 62,009 | |
| 2 | Morgan Stanley | 2.699% | 1/22/31 | 74,290 | 76,358 | |
| 2 | Morgan Stanley | 1.928% | 4/28/32 | 50,000 | 47,825 | |
| 2 | Morgan Stanley | 2.239% | 7/21/32 | 81,175 | 79,548 | |
| 2 | Morgan Stanley | 2.511% | 10/20/32 | 32,340 | 32,415 | |
| Morgan Stanley | 2.484% | 9/16/36 | 34,305 | 33,097 | ||
| Morgan Stanley | 4.300% | 1/27/45 | 18,360 | 22,716 | ||
| Nasdaq Inc. | 3.250% | 4/28/50 | 6,670 | 6,872 | ||
| 5 | National Australia Bank Ltd. | 2.332% | 8/21/30 | 75,550 | 72,740 | |
| 5 | National Australia Bank Ltd. | 2.990% | 5/21/31 | 62,492 | 62,932 | |
| 5 | Nationwide Building Society | 3.622% | 4/26/23 | 23,975 | 24,244 | |
| 5 | Nationwide Financial Services Inc. | 3.900% | 11/30/49 | 48,905 | 58,085 | |
| 5 | Nationwide Mutual Insurance Co. | 4.350% | 4/30/50 | 41,675 | 48,503 | |
| NatWest Group plc | 1.642% | 6/14/27 | 29,040 | 28,570 | ||
| 5 | NatWest Markets plc | 0.800% | 8/12/24 | 22,050 | 21,743 | |
| 5 | NBK SPC Ltd. | 2.750% | 5/30/22 | 56,530 | 57,019 | |
| 5 | NBK SPC Ltd. | 1.625% | 9/15/27 | 67,900 | 66,093 | |
| Coupon | Maturity Date | Face Amount ($000) | Market Value• ($000) | |||
| 5 | New York Life Global Funding | 2.900% | 1/17/24 | 29,050 | 30,232 | |
| 5 | New York Life Insurance Co. | 5.875% | 5/15/33 | 55,395 | 73,298 | |
| 5 | New York Life Insurance Co. | 3.750% | 5/15/50 | 9,245 | 10,667 | |
| 5 | New York Life Insurance Co. | 4.450% | 5/15/69 | 15,270 | 19,884 | |
| 5 | Nordea Bank Abp | 1.500% | 9/30/26 | 65,800 | 64,734 | |
| 5 | Northwestern Mutual Life Insurance Co. | 3.850% | 9/30/47 | 24,134 | 27,985 | |
| 5 | Northwestern Mutual Life Insurance Co. | 3.625% | 9/30/59 | 9,324 | 10,465 | |
| 5 | Pacific Life Global Funding II | 1.375% | 4/14/26 | 27,085 | 27,104 | |
| 5 | Penske Truck Leasing Co. LP | 3.450% | 7/1/24 | 16,420 | 17,296 | |
| 5 | Penske Truck Leasing Co. LP | 2.700% | 11/1/24 | 10,220 | 10,572 | |
| 5 | Penske Truck Leasing Co. LP | 3.950% | 3/10/25 | 52,010 | 55,730 | |
| 5 | Penske Truck Leasing Co. LP | 4.450% | 1/29/26 | 16,450 | 18,133 | |
| 2 | PNC Bank NA | 3.300% | 10/30/24 | 18,195 | 19,337 | |
| 2 | PNC Bank NA | 4.200% | 11/1/25 | 16,650 | 18,380 | |
| 2 | PNC Bank NA | 3.100% | 10/25/27 | 41,975 | 45,210 | |
| 2 | PNC Bank NA | 3.250% | 1/22/28 | 60,465 | 65,417 | |
| PNC Financial Services Group Inc. | 3.900% | 4/29/24 | 41,565 | 44,223 | ||
| PNC Financial Services Group Inc. | 2.550% | 1/22/30 | 54,405 | 55,974 | ||
| 5 | Principal Life Global Funding II | 2.500% | 9/16/29 | 25,000 | 26,181 | |
| Prudential plc | 3.125% | 4/14/30 | 14,640 | 15,717 | ||
| Santander Holdings USA Inc. | 3.700% | 3/28/22 | 33,065 | 33,300 | ||
| Santander Holdings USA Inc. | 3.400% | 1/18/23 | 20,375 | 20,894 | ||
| 5 | Societe Generale SA | 3.250% | 1/12/22 | 38,635 | 38,754 | |
| 5 | Standard Chartered plc | 1.214% | 3/23/25 | 6,465 | 6,419 | |
| 2 | State Street Corp. | 2.653% | 5/15/23 | 30,770 | 31,059 | |
| 5 | Sumitomo Mitsui Trust Bank Ltd. | 0.850% | 3/25/24 | 58,195 | 57,847 | |
| 5 | Svenska Handelsbanken AB | 1.418% | 6/11/27 | 62,395 | 61,410 | |
| 5 | Teachers Insurance & Annuity Association of America | 4.900% | 9/15/44 | 24,830 | 32,562 | |
| 5 | Teachers Insurance & Annuity Association of America | 4.270% | 5/15/47 | 42,390 | 52,017 | |
| Truist Bank | 2.625% | 1/15/22 | 16,800 | 16,832 | ||
| 2 | Truist Bank | 3.300% | 5/15/26 | 12,895 | 13,763 | |
| 2 | Truist Financial Corp. | 2.750% | 4/1/22 | 61,300 | 61,654 | |
| 2 | Truist Financial Corp. | 2.200% | 3/16/23 | 31,045 | 31,612 | |
| 2 | Truist Financial Corp. | 3.700% | 6/5/25 | 49,000 | 52,945 | |
| 2 | Truist Financial Corp. | 1.950% | 6/5/30 | 22,005 | 21,797 | |
| 5 | UBS AG | 1.250% | 6/1/26 | 36,125 | 35,531 | |
| 5 | UBS Group AG | 1.494% | 8/10/27 | 40,005 | 39,131 | |
| 5 | UBS Group AG | 3.126% | 8/13/30 | 16,000 | 16,775 | |
| 5 | UBS Group AG | 2.095% | 2/11/32 | 23,650 | 22,900 | |
| 5 | UniCredit SpA | 1.982% | 6/3/27 | 35,165 | 34,353 | |
| 5 | UniCredit SpA | 3.127% | 6/3/32 | 38,145 | 37,892 | |
| 2 | US Bancorp | 3.700% | 1/30/24 | 52,500 | 55,519 | |
| US Bancorp | 2.491% | 11/3/36 | 64,150 | 63,825 | ||
| 2 | Wells Fargo & Co. | 3.500% | 3/8/22 | 10,720 | 10,809 | |
| 2 | Wells Fargo & Co. | 3.450% | 2/13/23 | 48,895 | 50,433 | |
| Wells Fargo & Co. | 4.480% | 1/16/24 | 46,156 | 49,373 | ||
| 2 | Wells Fargo & Co. | 3.750% | 1/24/24 | 50,755 | 53,518 | |
| 2 | Wells Fargo & Co. | 0.805% | 5/19/25 | 13,885 | 13,741 | |
| 2 | Wells Fargo & Co. | 3.550% | 9/29/25 | 32,170 | 34,481 | |
| Wells Fargo & Co. | 3.000% | 4/22/26 | 39,405 | 41,379 | ||
| 2 | Wells Fargo & Co. | 3.196% | 6/17/27 | 60,555 | 64,010 | |
| 2 | Wells Fargo & Co. | 2.879% | 10/30/30 | 15,000 | 15,579 | |
| 2 | Wells Fargo & Co. | 2.572% | 2/11/31 | 76,020 | 77,133 | |
| Wells Fargo & Co. | 5.606% | 1/15/44 | 68,281 | 92,651 | ||
| 2 | Wells Fargo & Co. | 4.650% | 11/4/44 | 10,315 | 12,647 | |
| 2 | Wells Fargo & Co. | 4.900% | 11/17/45 | 19,160 | 24,451 | |
| Coupon | Maturity Date | Face Amount ($000) | Market Value• ($000) | |||
| 2 | Wells Fargo & Co. | 4.400% | 6/14/46 | 73,300 | 88,109 | |
| 2 | Wells Fargo & Co. | 4.750% | 12/7/46 | 23,150 | 29,135 | |
| 10,458,329 | ||||||
| Health Care (2.5%) | ||||||
| AbbVie Inc. | 3.450% | 3/15/22 | 18,695 | 18,761 | ||
| AbbVie Inc. | 3.800% | 3/15/25 | 15,725 | 16,821 | ||
| AbbVie Inc. | 4.050% | 11/21/39 | 20,255 | 23,194 | ||
| AbbVie Inc. | 4.850% | 6/15/44 | 18,000 | 22,751 | ||
| AbbVie Inc. | 4.450% | 5/14/46 | 29,520 | 35,850 | ||
| AbbVie Inc. | 4.250% | 11/21/49 | 18,435 | 22,221 | ||
| 2 | AdventHealth Obligated Group | 2.795% | 11/15/51 | 30,030 | 30,521 | |
| 2 | Advocate Health & Hospitals Corp. | 2.211% | 6/15/30 | 7,210 | 7,289 | |
| 2 | Advocate Health & Hospitals Corp. | 3.008% | 6/15/50 | 8,980 | 9,535 | |
| Aetna Inc. | 2.800% | 6/15/23 | 25,660 | 26,335 | ||
| 5 | Alcon Finance Corp. | 2.750% | 9/23/26 | 5,830 | 6,041 | |
| 5 | Alcon Finance Corp. | 2.600% | 5/27/30 | 4,690 | 4,750 | |
| 5 | Alcon Finance Corp. | 3.800% | 9/23/49 | 22,830 | 25,775 | |
| AmerisourceBergen Corp. | 0.737% | 3/15/23 | 56,400 | 56,384 | ||
| Amgen Inc. | 2.300% | 2/25/31 | 43,075 | 42,767 | ||
| Amgen Inc. | 3.150% | 2/21/40 | 29,570 | 30,272 | ||
| Amgen Inc. | 5.150% | 11/15/41 | 10,583 | 13,636 | ||
| Amgen Inc. | 2.770% | 9/1/53 | 14,741 | 13,915 | ||
| Anthem Inc. | 3.300% | 1/15/23 | 42,468 | 43,700 | ||
| Anthem Inc. | 3.650% | 12/1/27 | 26,975 | 29,387 | ||
| Anthem Inc. | 4.101% | 3/1/28 | 40,910 | 45,618 | ||
| Anthem Inc. | 2.550% | 3/15/31 | 35,565 | 36,257 | ||
| Anthem Inc. | 4.650% | 8/15/44 | 2,876 | 3,621 | ||
| 2 | Ascension Health | 2.532% | 11/15/29 | 22,515 | 23,499 | |
| 2 | Ascension Health | 4.847% | 11/15/53 | 23,970 | 35,674 | |
| AstraZeneca plc | 4.000% | 1/17/29 | 47,000 | 53,126 | ||
| AstraZeneca plc | 6.450% | 9/15/37 | 23,385 | 34,687 | ||
| Banner Health | 2.907% | 1/1/42 | 29,965 | 30,819 | ||
| 4,5 | Baxter International Inc. | 2.272% | 12/1/28 | 27,495 | 27,651 | |
| 5 | Bayer US Finance II LLC | 4.250% | 12/15/25 | 46,665 | 50,850 | |
| 5 | Bayer US Finance LLC | 3.375% | 10/8/24 | 33,220 | 34,840 | |
| 2 | Beth Israel Lahey Health Inc. | 3.080% | 7/1/51 | 13,585 | 14,025 | |
| 2 | Bon Secours Mercy Health Inc. | 3.464% | 6/1/30 | 17,085 | 18,474 | |
| 2 | Bon Secours Mercy Health Inc. | 2.095% | 6/1/31 | 11,305 | 11,171 | |
| Boston Scientific Corp. | 4.000% | 3/1/29 | 6,810 | 7,614 | ||
| Bristol-Myers Squibb Co. | 2.750% | 2/15/23 | 4,553 | 4,663 | ||
| Bristol-Myers Squibb Co. | 3.400% | 7/26/29 | 31,020 | 33,964 | ||
| Bristol-Myers Squibb Co. | 4.125% | 6/15/39 | 17,720 | 21,038 | ||
| Bristol-Myers Squibb Co. | 4.550% | 2/20/48 | 7,347 | 9,492 | ||
| Bristol-Myers Squibb Co. | 4.250% | 10/26/49 | 20,963 | 26,196 | ||
| Bristol-Myers Squibb Co. | 2.550% | 11/13/50 | 11,865 | 11,334 | ||
| 2,4 | Cedars-Sinai Health System | 2.288% | 8/15/31 | 43,795 | 44,272 | |
| 2 | Children's Hospital Corp. | 2.585% | 2/1/50 | 5,460 | 5,414 | |
| 2 | Cigna Corp. | 3.250% | 4/15/25 | 31,655 | 33,359 | |
| Cigna Corp. | 4.375% | 10/15/28 | 18,600 | 21,103 | ||
| CommonSpirit Health | 2.950% | 11/1/22 | 13,735 | 13,997 | ||
| CommonSpirit Health | 4.200% | 8/1/23 | 9,885 | 10,387 | ||
| CommonSpirit Health | 2.760% | 10/1/24 | 29,395 | 30,456 | ||
| CommonSpirit Health | 3.347% | 10/1/29 | 36,655 | 39,102 | ||
| CommonSpirit Health | 2.782% | 10/1/30 | 21,827 | 22,430 | ||
| 2 | CommonSpirit Health | 4.350% | 11/1/42 | 27,490 | 31,593 | |
| CommonSpirit Health | 4.187% | 10/1/49 | 54,248 | 64,720 | ||
| CommonSpirit Health | 3.910% | 10/1/50 | 5,345 | 6,151 | ||
| Coupon | Maturity Date | Face Amount ($000) | Market Value• ($000) | |||
| 2 | Cottage Health Obligated Group | 3.304% | 11/1/49 | 9,875 | 10,962 | |
| CVS Health Corp. | 4.300% | 3/25/28 | 953 | 1,073 | ||
| CVS Health Corp. | 4.875% | 7/20/35 | 6,900 | 8,440 | ||
| CVS Health Corp. | 4.125% | 4/1/40 | 11,570 | 13,270 | ||
| CVS Health Corp. | 5.125% | 7/20/45 | 31,100 | 40,838 | ||
| Dignity Health | 3.812% | 11/1/24 | 20,780 | 22,191 | ||
| 5 | EMD Finance LLC | 2.950% | 3/19/22 | 23,660 | 23,660 | |
| Gilead Sciences Inc. | 3.700% | 4/1/24 | 26,895 | 28,327 | ||
| Gilead Sciences Inc. | 3.500% | 2/1/25 | 22,335 | 23,671 | ||
| Gilead Sciences Inc. | 2.600% | 10/1/40 | 20,000 | 19,130 | ||
| Gilead Sciences Inc. | 4.500% | 2/1/45 | 9,915 | 12,212 | ||
| Gilead Sciences Inc. | 4.150% | 3/1/47 | 14,930 | 17,690 | ||
| Gilead Sciences Inc. | 2.800% | 10/1/50 | 48,610 | 47,267 | ||
| GlaxoSmithKline Capital Inc. | 2.800% | 3/18/23 | 31,740 | 32,577 | ||
| GlaxoSmithKline Capital Inc. | 5.375% | 4/15/34 | 45,000 | 59,871 | ||
| 2 | Indiana University Health Inc. Obligated Group | 2.852% | 11/1/51 | 12,370 | 12,751 | |
| Kaiser Foundation Hospitals | 3.150% | 5/1/27 | 14,823 | 15,879 | ||
| 2 | Kaiser Foundation Hospitals | 2.810% | 6/1/41 | 37,455 | 38,227 | |
| Kaiser Foundation Hospitals | 4.875% | 4/1/42 | 14,250 | 19,105 | ||
| 2 | Kaiser Foundation Hospitals | 3.002% | 6/1/51 | 36,720 | 38,534 | |
| 2 | Mass General Brigham Inc. | 3.192% | 7/1/49 | 24,480 | 26,991 | |
| 2 | Mass General Brigham Inc. | 3.342% | 7/1/60 | 32,045 | 36,082 | |
| Medtronic Inc. | 3.500% | 3/15/25 | 13,468 | 14,423 | ||
| 2 | Memorial Sloan-Kettering Cancer Center | 2.955% | 1/1/50 | 18,985 | 19,891 | |
| Memorial Sloan-Kettering Cancer Center | 4.125% | 7/1/52 | 12,320 | 15,879 | ||
| 2 | Memorial Sloan-Kettering Cancer Center | 4.200% | 7/1/55 | 10,630 | 14,227 | |
| Merck & Co. Inc. | 3.400% | 3/7/29 | 49,240 | 53,910 | ||
| Merck & Co. Inc. | 4.150% | 5/18/43 | 22,090 | 26,857 | ||
| Merck & Co. Inc. | 4.000% | 3/7/49 | 52,385 | 64,706 | ||
| 2 | Mercy Health | 4.302% | 7/1/28 | 20,339 | 22,788 | |
| Novartis Capital Corp. | 3.400% | 5/6/24 | 16,695 | 17,666 | ||
| Novartis Capital Corp. | 4.400% | 5/6/44 | 25,896 | 33,310 | ||
| OhioHealth Corp. | 2.297% | 11/15/31 | 26,665 | 27,071 | ||
| OhioHealth Corp. | 2.834% | 11/15/41 | 16,515 | 17,082 | ||
| Pfizer Inc. | 3.450% | 3/15/29 | 70,335 | 77,618 | ||
| Pfizer Inc. | 1.700% | 5/28/30 | 6,065 | 5,942 | ||
| Pfizer Inc. | 4.100% | 9/15/38 | 53,995 | 64,649 | ||
| Pfizer Inc. | 2.550% | 5/28/40 | 7,535 | 7,504 | ||
| Pfizer Inc. | 2.700% | 5/28/50 | 8,330 | 8,439 | ||
| 2 | Piedmont Healthcare Inc. | 2.044% | 1/1/32 | 8,825 | 8,616 | |
| 2 | Piedmont Healthcare Inc. | 2.719% | 1/1/42 | 8,830 | 8,761 | |
| Piedmont Healthcare Inc. | 2.864% | 1/1/52 | 11,725 | 11,767 | ||
| 2 | Providence St. Joseph Health Obligated Group | 2.532% | 10/1/29 | 17,470 | 18,134 | |
| 2 | Providence St. Joseph Health Obligated Group | 3.930% | 10/1/48 | 11,805 | 14,209 | |
| 2 | Providence St. Joseph Health Obligated Group | 2.700% | 10/1/51 | 39,905 | 39,144 | |
| Royalty Pharma plc | 3.300% | 9/2/40 | 14,550 | 14,577 | ||
| Royalty Pharma plc | 3.550% | 9/2/50 | 44,555 | 44,828 | ||
| 2 | Rush Obligated Group | 3.922% | 11/15/29 | 11,880 | 13,367 | |
| 2 | SSM Health Care Corp. | 3.823% | 6/1/27 | 34,910 | 38,560 | |
| 2 | Sutter Health | 2.294% | 8/15/30 | 18,345 | 18,536 | |
| Takeda Pharmaceutical Co. Ltd. | 2.050% | 3/31/30 | 30,355 | 29,591 | ||
| Takeda Pharmaceutical Co. Ltd. | 3.025% | 7/9/40 | 18,255 | 18,485 | ||
| Thermo Fisher Scientific Inc. | 1.750% | 10/15/28 | 8,965 | 8,826 | ||
| Thermo Fisher Scientific Inc. | 2.000% | 10/15/31 | 19,335 | 18,932 | ||
| Coupon | Maturity Date | Face Amount ($000) | Market Value• ($000) | |||
| Toledo Hospital | 5.750% | 11/15/38 | 18,440 | 21,774 | ||
| UnitedHealth Group Inc. | 2.875% | 3/15/22 | 4,696 | 4,705 | ||
| UnitedHealth Group Inc. | 3.100% | 3/15/26 | 15,350 | 16,377 | ||
| UnitedHealth Group Inc. | 3.850% | 6/15/28 | 34,565 | 38,676 | ||
| UnitedHealth Group Inc. | 2.000% | 5/15/30 | 7,515 | 7,469 | ||
| UnitedHealth Group Inc. | 4.625% | 7/15/35 | 9,595 | 11,961 | ||
| UnitedHealth Group Inc. | 2.750% | 5/15/40 | 8,505 | 8,561 | ||
| UnitedHealth Group Inc. | 4.250% | 3/15/43 | 67,400 | 82,310 | ||
| UnitedHealth Group Inc. | 4.750% | 7/15/45 | 24,520 | 32,373 | ||
| UnitedHealth Group Inc. | 4.200% | 1/15/47 | 8,620 | 10,600 | ||
| UnitedHealth Group Inc. | 4.250% | 6/15/48 | 22,215 | 27,728 | ||
| UnitedHealth Group Inc. | 4.450% | 12/15/48 | 4,970 | 6,393 | ||
| UnitedHealth Group Inc. | 3.700% | 8/15/49 | 23,160 | 26,800 | ||
| UnitedHealth Group Inc. | 2.900% | 5/15/50 | 26,720 | 27,337 | ||
| UnitedHealth Group Inc. | 3.250% | 5/15/51 | 10,000 | 10,869 | ||
| UnitedHealth Group Inc. | 3.875% | 8/15/59 | 4,125 | 4,987 | ||
| UnitedHealth Group Inc. | 3.125% | 5/15/60 | 13,830 | 14,408 | ||
| Wyeth LLC | 5.950% | 4/1/37 | 25,000 | 35,494 | ||
| Zeneca Wilmington Inc. | 7.000% | 11/15/23 | 29,000 | 32,467 | ||
| 3,105,834 | ||||||
| Industrials (0.9%) | ||||||
| 5 | Ashtead Capital Inc. | 2.450% | 8/12/31 | 17,915 | 17,561 | |
| 5 | BAE Systems Holdings Inc. | 3.850% | 12/15/25 | 11,010 | 11,879 | |
| 5 | BAE Systems plc | 3.400% | 4/15/30 | 7,335 | 7,860 | |
| Boeing Co. | 1.433% | 2/4/24 | 15,490 | 15,491 | ||
| Boeing Co. | 2.700% | 2/1/27 | 17,155 | 17,497 | ||
| Boeing Co. | 3.625% | 2/1/31 | 24,800 | 26,334 | ||
| Boeing Co. | 8.625% | 11/15/31 | 9,460 | 13,845 | ||
| Boeing Co. | 3.950% | 8/1/59 | 16,150 | 16,851 | ||
| Burlington Northern Santa Fe LLC | 3.050% | 3/15/22 | 7,595 | 7,602 | ||
| Burlington Northern Santa Fe LLC | 3.000% | 3/15/23 | 21,397 | 21,908 | ||
| Burlington Northern Santa Fe LLC | 3.850% | 9/1/23 | 20,891 | 21,877 | ||
| Burlington Northern Santa Fe LLC | 4.550% | 9/1/44 | 6,000 | 7,591 | ||
| Burlington Northern Santa Fe LLC | 4.150% | 4/1/45 | 13,365 | 16,312 | ||
| Burlington Northern Santa Fe LLC | 4.050% | 6/15/48 | 2,715 | 3,310 | ||
| Burlington Northern Santa Fe LLC | 3.050% | 2/15/51 | 9,950 | 10,430 | ||
| 4 | Burlington Northern Santa Fe LLC | 2.875% | 6/15/52 | 32,935 | 33,470 | |
| Canadian National Railway Co. | 2.450% | 5/1/50 | 6,870 | 6,457 | ||
| 4 | Canadian Pacific Railway Co. | 2.450% | 12/2/31 | 8,735 | 8,843 | |
| 4 | Canadian Pacific Railway Co. | 3.100% | 12/2/51 | 16,340 | 16,823 | |
| Carrier Global Corp. | 2.722% | 2/15/30 | 15,418 | 15,735 | ||
| Caterpillar Inc. | 3.400% | 5/15/24 | 14,200 | 14,969 | ||
| 2 | Continental Airlines Pass-Through Trust Class A Series 2007-1 | 5.983% | 4/19/22 | 4,726 | 4,796 | |
| CSX Corp. | 4.300% | 3/1/48 | 16,150 | 19,848 | ||
| CSX Corp. | 3.350% | 9/15/49 | 5,535 | 5,986 | ||
| Deere & Co. | 7.125% | 3/3/31 | 17,500 | 24,694 | ||
| 5 | ERAC USA Finance LLC | 5.625% | 3/15/42 | 21,787 | 30,176 | |
| 2 | Federal Express Corp. 1998 Pass-Through Trust | 6.720% | 1/15/22 | 1,226 | 1,240 | |
| Illinois Tool Works Inc. | 3.500% | 3/1/24 | 52,955 | 55,703 | ||
| 2 | John Deere Capital Corp. | 3.450% | 3/13/25 | 43,145 | 46,254 | |
| 2 | Kansas City Southern | 4.950% | 8/15/45 | 16,985 | 22,357 | |
| Lockheed Martin Corp. | 2.900% | 3/1/25 | 10,450 | 10,986 | ||
| Lockheed Martin Corp. | 1.850% | 6/15/30 | 1,700 | 1,683 | ||
| Lockheed Martin Corp. | 4.500% | 5/15/36 | 8,015 | 9,878 | ||
| Lockheed Martin Corp. | 4.700% | 5/15/46 | 14,370 | 19,002 | ||
| Lockheed Martin Corp. | 4.090% | 9/15/52 | 5,500 | 6,874 | ||
| Coupon | Maturity Date | Face Amount ($000) | Market Value• ($000) | |||
| Otis Worldwide Corp. | 2.565% | 2/15/30 | 8,000 | 8,144 | ||
| Parker-Hannifin Corp. | 3.250% | 6/14/29 | 9,650 | 10,272 | ||
| 2 | Parker-Hannifin Corp. | 4.450% | 11/21/44 | 17,735 | 21,635 | |
| Raytheon Technologies Corp. | 4.125% | 11/16/28 | 16,675 | 18,769 | ||
| Raytheon Technologies Corp. | 4.450% | 11/16/38 | 9,325 | 11,398 | ||
| Raytheon Technologies Corp. | 4.500% | 6/1/42 | 8,727 | 10,831 | ||
| Raytheon Technologies Corp. | 3.750% | 11/1/46 | 5,923 | 6,703 | ||
| 5 | Siemens Financieringsmaatschappij NV | 3.125% | 3/16/24 | 61,400 | 64,290 | |
| 5 | Siemens Financieringsmaatschappij NV | 1.700% | 3/11/28 | 20,360 | 20,111 | |
| 5 | Siemens Financieringsmaatschappij NV | 2.150% | 3/11/31 | 35,655 | 35,591 | |
| 5 | Siemens Financieringsmaatschappij NV | 4.400% | 5/27/45 | 34,365 | 44,438 | |
| 2 | Southwest Airlines Co. Pass-Through Trust Series 2007-1 | 6.150% | 8/1/22 | 3,501 | 3,558 | |
| Teledyne Technologies Inc. | 2.250% | 4/1/28 | 37,435 | 37,690 | ||
| Teledyne Technologies Inc. | 2.750% | 4/1/31 | 41,220 | 42,020 | ||
| Union Pacific Corp. | 3.700% | 3/1/29 | 17,470 | 19,387 | ||
| Union Pacific Corp. | 3.250% | 2/5/50 | 5,565 | 6,037 | ||
| Union Pacific Corp. | 3.799% | 10/1/51 | 38,061 | 44,862 | ||
| Union Pacific Corp. | 3.839% | 3/20/60 | 29,365 | 34,837 | ||
| Union Pacific Corp. | 2.973% | 9/16/62 | 22,015 | 22,180 | ||
| Union Pacific Corp. | 3.750% | 2/5/70 | 10,510 | 12,231 | ||
| 2 | United Airlines Pass-Through Trust Class B Series 2018-1 | 4.600% | 3/1/26 | 5,665 | 5,713 | |
| 1,052,819 | ||||||
| Materials (0.0%) | ||||||
| International Paper Co. | 4.350% | 8/15/48 | 24,132 | 30,380 | ||
| Real Estate (0.5%) | ||||||
| American Tower Corp. | 5.000% | 2/15/24 | 2,770 | 2,993 | ||
| American Tower Corp. | 4.400% | 2/15/26 | 7,315 | 8,019 | ||
| American Tower Corp. | 3.800% | 8/15/29 | 33,804 | 36,680 | ||
| Boston Properties LP | 3.125% | 9/1/23 | 13,275 | 13,718 | ||
| Boston Properties LP | 3.800% | 2/1/24 | 1,750 | 1,835 | ||
| Crown Castle International Corp. | 3.650% | 9/1/27 | 10,215 | 10,995 | ||
| Crown Castle International Corp. | 3.800% | 2/15/28 | 8,435 | 9,189 | ||
| Crown Castle International Corp. | 2.100% | 4/1/31 | 71,340 | 68,230 | ||
| CubeSmart LP | 2.250% | 12/15/28 | 12,135 | 12,182 | ||
| Equinix Inc. | 3.000% | 7/15/50 | 34,420 | 32,957 | ||
| Healthpeak Properties Inc. | 2.125% | 12/1/28 | 30,395 | 30,405 | ||
| Healthpeak Properties Inc. | 3.000% | 1/15/30 | 31,475 | 33,132 | ||
| Realty Income Corp. | 3.400% | 1/15/28 | 5,900 | 6,343 | ||
| Realty Income Corp. | 2.200% | 6/15/28 | 24,400 | 24,620 | ||
| Realty Income Corp. | 3.250% | 1/15/31 | 12,940 | 13,904 | ||
| Realty Income Corp. | 2.850% | 12/15/32 | 16,610 | 17,334 | ||
| 5 | SBA Tower Trust | 3.448% | 3/15/23 | 23,770 | 23,963 | |
| 5 | SBA Tower Trust | 2.836% | 1/15/25 | 25,075 | 25,906 | |
| 5 | SBA Tower Trust | 1.884% | 1/15/26 | 8,960 | 8,996 | |
| 5 | SBA Tower Trust | 1.631% | 11/15/26 | 19,150 | 18,798 | |
| 5 | SBA Tower Trust | 1.840% | 4/15/27 | 54,190 | 53,830 | |
| 5 | SBA Tower Trust | 2.593% | 10/15/31 | 51,750 | 52,419 | |
| 5 | Scentre Group Trust 1 | 4.375% | 5/28/30 | 19,110 | 22,077 | |
| Simon Property Group LP | 3.750% | 2/1/24 | 3,265 | 3,434 | ||
| Simon Property Group LP | 3.375% | 10/1/24 | 10,055 | 10,628 | ||
| Simon Property Group LP | 2.450% | 9/13/29 | 19,865 | 20,117 | ||
| 562,704 | ||||||
| Technology (1.6%) | ||||||
| Apple Inc. | 3.000% | 2/9/24 | 22,535 | 23,488 | ||
| Apple Inc. | 3.450% | 5/6/24 | 39,950 | 42,267 | ||
| Coupon | Maturity Date | Face Amount ($000) | Market Value• ($000) | |||
| Apple Inc. | 2.850% | 5/11/24 | 44,990 | 46,943 | ||
| Apple Inc. | 3.250% | 2/23/26 | 37,631 | 40,270 | ||
| Apple Inc. | 2.450% | 8/4/26 | 43,466 | 45,293 | ||
| Apple Inc. | 3.350% | 2/9/27 | 55,925 | 60,602 | ||
| Apple Inc. | 3.200% | 5/11/27 | 39,185 | 42,198 | ||
| Apple Inc. | 2.900% | 9/12/27 | 55,355 | 58,849 | ||
| Apple Inc. | 3.850% | 5/4/43 | 17,000 | 20,152 | ||
| Apple Inc. | 4.450% | 5/6/44 | 5,075 | 6,532 | ||
| Apple Inc. | 3.850% | 8/4/46 | 36,890 | 44,085 | ||
| Apple Inc. | 2.650% | 5/11/50 | 17,660 | 17,556 | ||
| Apple Inc. | 2.550% | 8/20/60 | 48,290 | 45,713 | ||
| Broadcom Corp. | 3.875% | 1/15/27 | 11,385 | 12,247 | ||
| Broadcom Inc. | 4.250% | 4/15/26 | 3,505 | 3,828 | ||
| Broadcom Inc. | 4.110% | 9/15/28 | 37,859 | 41,483 | ||
| Broadcom Inc. | 4.150% | 11/15/30 | 4,480 | 4,909 | ||
| 5 | Broadcom Inc. | 2.600% | 2/15/33 | 4,375 | 4,206 | |
| 5 | Broadcom Inc. | 3.419% | 4/15/33 | 10,535 | 10,870 | |
| 5 | Broadcom Inc. | 3.500% | 2/15/41 | 34,030 | 33,997 | |
| 5 | Broadcom Inc. | 3.750% | 2/15/51 | 11,745 | 12,139 | |
| Cisco Systems Inc. | 2.500% | 9/20/26 | 15,676 | 16,505 | ||
| Fidelity National Information Services Inc. | 1.650% | 3/1/28 | 8,070 | 7,799 | ||
| Fiserv Inc. | 3.200% | 7/1/26 | 23,105 | 24,391 | ||
| Intel Corp. | 2.875% | 5/11/24 | 29,395 | 30,681 | ||
| Intel Corp. | 4.100% | 5/19/46 | 51,605 | 62,110 | ||
| Intel Corp. | 4.100% | 5/11/47 | 21,904 | 26,380 | ||
| Intel Corp. | 3.734% | 12/8/47 | 8,096 | 9,310 | ||
| Intel Corp. | 3.250% | 11/15/49 | 19,400 | 20,633 | ||
| Intel Corp. | 3.050% | 8/12/51 | 43,925 | 45,518 | ||
| International Business Machines Corp. | 3.625% | 2/12/24 | 35,000 | 36,972 | ||
| International Business Machines Corp. | 3.000% | 5/15/24 | 86,100 | 90,082 | ||
| International Business Machines Corp. | 3.300% | 5/15/26 | 155,985 | 167,137 | ||
| International Business Machines Corp. | 3.500% | 5/15/29 | 103,700 | 112,832 | ||
| International Business Machines Corp. | 5.875% | 11/29/32 | 20,240 | 26,825 | ||
| Microsoft Corp. | 3.125% | 11/3/25 | 17,700 | 18,888 | ||
| Microsoft Corp. | 3.500% | 2/12/35 | 23,520 | 27,018 | ||
| Microsoft Corp. | 3.450% | 8/8/36 | 31,097 | 35,768 | ||
| Microsoft Corp. | 2.525% | 6/1/50 | 122,844 | 121,875 | ||
| Microsoft Corp. | 2.921% | 3/17/52 | 123,829 | 131,614 | ||
| Oracle Corp. | 2.950% | 11/15/24 | 79,830 | 83,380 | ||
| Oracle Corp. | 1.650% | 3/25/26 | 17,300 | 17,212 | ||
| Oracle Corp. | 3.250% | 11/15/27 | 97,075 | 102,757 | ||
| Oracle Corp. | 4.000% | 11/15/47 | 32,175 | 34,611 | ||
| Oracle Corp. | 3.950% | 3/25/51 | 12,525 | 13,481 | ||
| Oracle Corp. | 3.850% | 4/1/60 | 18,200 | 18,957 | ||
| QUALCOMM Inc. | 1.300% | 5/20/28 | 27,474 | 26,635 | ||
| QUALCOMM Inc. | 2.150% | 5/20/30 | 29,475 | 29,815 | ||
| QUALCOMM Inc. | 1.650% | 5/20/32 | 41,155 | 39,100 | ||
| QUALCOMM Inc. | 3.250% | 5/20/50 | 10,605 | 11,801 | ||
| 2,007,714 | ||||||
| Utilities (2.6%) | ||||||
| 2 | AEP Texas Inc. | 4.150% | 5/1/49 | 5,065 | 5,935 | |
| 2 | AEP Texas Inc. | 3.450% | 1/15/50 | 16,810 | 17,766 | |
| Alabama Power Co. | 5.700% | 2/15/33 | 15,000 | 19,579 | ||
| Alabama Power Co. | 3.750% | 3/1/45 | 24,430 | 27,721 | ||
| 2 | Alabama Power Co. | 4.300% | 7/15/48 | 28,015 | 34,743 | |
| Ameren Illinois Co. | 3.800% | 5/15/28 | 22,215 | 24,770 | ||
| Ameren Illinois Co. | 6.125% | 12/15/28 | 54,000 | 64,457 | ||
| Coupon | Maturity Date | Face Amount ($000) | Market Value• ($000) | |||
| Ameren Illinois Co. | 3.700% | 12/1/47 | 5,045 | 5,917 | ||
| American Water Capital Corp. | 2.950% | 9/1/27 | 9,975 | 10,557 | ||
| American Water Capital Corp. | 3.750% | 9/1/47 | 1,435 | 1,640 | ||
| American Water Capital Corp. | 4.200% | 9/1/48 | 30,403 | 37,291 | ||
| American Water Capital Corp. | 4.150% | 6/1/49 | 850 | 1,022 | ||
| American Water Capital Corp. | 3.450% | 5/1/50 | 2,280 | 2,495 | ||
| Arizona Public Service Co. | 3.350% | 5/15/50 | 11,220 | 11,931 | ||
| Baltimore Gas & Electric Co. | 2.900% | 6/15/50 | 6,549 | 6,676 | ||
| Berkshire Hathaway Energy Co. | 6.125% | 4/1/36 | 41,185 | 56,289 | ||
| Berkshire Hathaway Energy Co. | 5.950% | 5/15/37 | 830 | 1,137 | ||
| Berkshire Hathaway Energy Co. | 5.150% | 11/15/43 | 10,715 | 14,064 | ||
| Berkshire Hathaway Energy Co. | 4.250% | 10/15/50 | 15,865 | 19,552 | ||
| 5 | Boston Gas Co. | 3.150% | 8/1/27 | 5,385 | 5,624 | |
| 5 | Boston Gas Co. | 3.001% | 8/1/29 | 5,970 | 6,176 | |
| 5 | Brooklyn Union Gas Co. | 3.407% | 3/10/26 | 2,685 | 2,840 | |
| 5 | Brooklyn Union Gas Co. | 4.273% | 3/15/48 | 61,265 | 72,054 | |
| CenterPoint Energy Resources Corp. | 4.000% | 4/1/28 | 8,068 | 8,947 | ||
| Cleco Corporate Holdings LLC | 3.375% | 9/15/29 | 9,180 | 9,451 | ||
| Commonwealth Edison Co. | 4.350% | 11/15/45 | 13,610 | 16,890 | ||
| Commonwealth Edison Co. | 3.650% | 6/15/46 | 6,365 | 7,348 | ||
| Commonwealth Edison Co. | 4.000% | 3/1/48 | 17,455 | 20,914 | ||
| Consolidated Edison Co. of New York Inc. | 4.500% | 12/1/45 | 36,735 | 44,518 | ||
| Consolidated Edison Co. of New York Inc. | 3.850% | 6/15/46 | 2,729 | 3,058 | ||
| 2 | Consolidated Edison Co. of New York Inc. | 3.950% | 4/1/50 | 1,690 | 1,972 | |
| 4 | Consolidated Edison Co. of New York Inc. | 3.200% | 12/1/51 | 22,155 | 22,500 | |
| Consolidated Edison Co. of New York Inc. | 4.625% | 12/1/54 | 66,625 | 84,568 | ||
| Consolidated Edison Co. of New York Inc. | 4.500% | 5/15/58 | 22,530 | 28,360 | ||
| Delmarva Power & Light Co. | 3.500% | 11/15/23 | 11,816 | 12,356 | ||
| 5 | Dominion Energy Inc. | 2.450% | 1/15/23 | 111,320 | 113,429 | |
| 2 | Dominion Energy Inc. | 5.250% | 8/1/33 | 5,706 | 7,046 | |
| 2 | Dominion Energy Inc. | 4.600% | 3/15/49 | 27,385 | 35,070 | |
| Dominion Energy South Carolina Inc. | 6.625% | 2/1/32 | 4,886 | 6,688 | ||
| Dominion Energy South Carolina Inc. | 5.800% | 1/15/33 | 9,000 | 11,579 | ||
| Dominion Energy South Carolina Inc. | 5.300% | 5/15/33 | 1,438 | 1,849 | ||
| Dominion Energy South Carolina Inc. | 6.050% | 1/15/38 | 44,155 | 62,852 | ||
| Dominion Energy South Carolina Inc. | 5.450% | 2/1/41 | 2,945 | 4,034 | ||
| Dominion Energy South Carolina Inc. | 4.600% | 6/15/43 | 7,251 | 9,060 | ||
| Dominion Energy South Carolina Inc. | 5.100% | 6/1/65 | 29,850 | 44,415 | ||
| Duke Energy Carolinas LLC | 6.050% | 4/15/38 | 4,000 | 5,606 | ||
| Duke Energy Carolinas LLC | 3.700% | 12/1/47 | 17,085 | 19,260 | ||
| Duke Energy Corp. | 2.650% | 9/1/26 | 11,775 | 12,214 | ||
| Duke Energy Corp. | 3.400% | 6/15/29 | 12,030 | 12,871 | ||
| Duke Energy Corp. | 3.300% | 6/15/41 | 31,380 | 31,996 | ||
| Duke Energy Corp. | 4.800% | 12/15/45 | 44,700 | 56,210 | ||
| Duke Energy Corp. | 3.750% | 9/1/46 | 9,940 | 10,730 | ||
| Duke Energy Corp. | 3.500% | 6/15/51 | 34,035 | 35,562 | ||
| Duke Energy Florida LLC | 6.350% | 9/15/37 | 8,000 | 11,601 | ||
| Duke Energy Florida LLC | 6.400% | 6/15/38 | 27,055 | 39,411 | ||
| Duke Energy Progress LLC | 6.300% | 4/1/38 | 14,705 | 20,982 | ||
| Duke Energy Progress LLC | 4.100% | 3/15/43 | 615 | 724 | ||
| Duke Energy Progress LLC | 4.200% | 8/15/45 | 40,400 | 48,949 | ||
| 2 | Duke Energy Progress NC Storm Funding LLC | 2.387% | 7/1/37 | 34,870 | 35,346 | |
| 5 | East Ohio Gas Co. | 2.000% | 6/15/30 | 8,960 | 8,784 | |
| 5 | East Ohio Gas Co. | 3.000% | 6/15/50 | 13,050 | 13,178 | |
| Eastern Energy Gas Holdings LLC | 3.550% | 11/1/23 | 21,445 | 22,378 | ||
| Emera US Finance LP | 3.550% | 6/15/26 | 34,050 | 36,416 | ||
| Entergy Louisiana LLC | 3.120% | 9/1/27 | 14,935 | 15,871 | ||
| Coupon | Maturity Date | Face Amount ($000) | Market Value• ($000) | |||
| Evergy Inc. | 2.450% | 9/15/24 | 10,420 | 10,705 | ||
| Evergy Kansas Central Inc. | 3.250% | 9/1/49 | 9,000 | 9,646 | ||
| 2 | Evergy Metro Inc. | 2.250% | 6/1/30 | 5,680 | 5,700 | |
| Evergy Metro Inc. | 4.200% | 3/15/48 | 3,419 | 4,197 | ||
| 2 | Eversource Energy | 2.900% | 10/1/24 | 17,450 | 18,159 | |
| 2 | Eversource Energy | 3.150% | 1/15/25 | 5,025 | 5,279 | |
| 2 | Eversource Energy | 3.300% | 1/15/28 | 14,410 | 15,463 | |
| Florida Power & Light Co. | 5.650% | 2/1/35 | 50,000 | 66,622 | ||
| Florida Power & Light Co. | 4.950% | 6/1/35 | 10,000 | 12,906 | ||
| Florida Power & Light Co. | 5.650% | 2/1/37 | 5,000 | 6,810 | ||
| Florida Power & Light Co. | 5.950% | 2/1/38 | 39,215 | 55,560 | ||
| Florida Power & Light Co. | 5.690% | 3/1/40 | 4,000 | 5,732 | ||
| Florida Power & Light Co. | 3.700% | 12/1/47 | 17,370 | 20,344 | ||
| Fortis Inc. | 3.055% | 10/4/26 | 28,565 | 29,858 | ||
| Georgia Power Co. | 5.400% | 6/1/40 | 6,665 | 8,367 | ||
| 2 | Georgia Power Co. | 4.750% | 9/1/40 | 34,703 | 41,039 | |
| Georgia Power Co. | 4.300% | 3/15/42 | 9,934 | 11,394 | ||
| Indiana Michigan Power Co. | 4.250% | 8/15/48 | 14,980 | 18,585 | ||
| 5 | KeySpan Gas East Corp. | 2.742% | 8/15/26 | 25,345 | 26,081 | |
| 5 | Massachusetts Electric Co. | 5.900% | 11/15/39 | 21,565 | 29,133 | |
| 5 | Metropolitan Edison Co. | 4.300% | 1/15/29 | 6,572 | 7,371 | |
| MidAmerican Energy Co. | 4.400% | 10/15/44 | 1,050 | 1,307 | ||
| MidAmerican Energy Co. | 4.250% | 5/1/46 | 5,485 | 6,884 | ||
| MidAmerican Energy Co. | 4.250% | 7/15/49 | 11,545 | 14,485 | ||
| MidAmerican Energy Co. | 3.150% | 4/15/50 | 45,450 | 48,798 | ||
| 5 | Mid-Atlantic Interstate Transmission LLC | 4.100% | 5/15/28 | 3,170 | 3,511 | |
| 5 | Monongahela Power Co. | 5.400% | 12/15/43 | 4,570 | 5,980 | |
| National Rural Utilities Cooperative Finance Corp. | 2.950% | 2/7/24 | 15,255 | 15,864 | ||
| National Rural Utilities Cooperative Finance Corp. | 2.850% | 1/27/25 | 40,345 | 42,185 | ||
| 2 | Nevada Power Co. | 3.125% | 8/1/50 | 17,790 | 18,770 | |
| NextEra Energy Capital Holdings Inc. | 3.250% | 4/1/26 | 9,260 | 9,800 | ||
| NextEra Energy Capital Holdings Inc. | 3.550% | 5/1/27 | 32,275 | 34,835 | ||
| NextEra Energy Capital Holdings Inc. | 1.900% | 6/15/28 | 27,465 | 27,143 | ||
| NextEra Energy Capital Holdings Inc. | 3.500% | 4/1/29 | 14,165 | 15,359 | ||
| NextEra Energy Capital Holdings Inc. | 2.250% | 6/1/30 | 40,110 | 39,941 | ||
| 5 | Niagara Mohawk Power Corp. | 4.278% | 12/15/28 | 35,970 | 40,084 | |
| 5 | Niagara Mohawk Power Corp. | 3.025% | 6/27/50 | 14,840 | 14,527 | |
| NiSource Inc. | 5.250% | 2/15/43 | 14,588 | 19,147 | ||
| NiSource Inc. | 4.800% | 2/15/44 | 10,370 | 12,886 | ||
| Northern States Power Co. | 6.250% | 6/1/36 | 50,000 | 71,977 | ||
| 5 | Oglethorpe Power Corp. | 6.191% | 1/1/31 | 36,565 | 45,294 | |
| Oglethorpe Power Corp. | 5.950% | 11/1/39 | 6,075 | 8,151 | ||
| Oglethorpe Power Corp. | 4.550% | 6/1/44 | 1,825 | 2,119 | ||
| Oglethorpe Power Corp. | 4.250% | 4/1/46 | 19,060 | 20,845 | ||
| Oglethorpe Power Corp. | 5.050% | 10/1/48 | 5,640 | 7,150 | ||
| Oglethorpe Power Corp. | 5.250% | 9/1/50 | 17,220 | 22,579 | ||
| Oncor Electric Delivery Co. LLC | 4.550% | 12/1/41 | 2,675 | 3,371 | ||
| 5 | Oncor Electric Delivery Co. LLC | 2.700% | 11/15/51 | 21,180 | ��� 21,028 | |
| PacifiCorp | 2.950% | 6/1/23 | 29,675 | 30,504 | ||
| PacifiCorp | 2.700% | 9/15/30 | 5,025 | 5,230 | ||
| PacifiCorp | 5.900% | 8/15/34 | 12,500 | 16,490 | ||
| PacifiCorp | 6.250% | 10/15/37 | 36,635 | 51,889 | ||
| PacifiCorp | 4.125% | 1/15/49 | 3,611 | 4,339 | ||
| PacifiCorp | 4.150% | 2/15/50 | 11,625 | 13,938 | ||
| PacifiCorp | 3.300% | 3/15/51 | 11,806 | 12,537 | ||
| 2 | PG&E Energy Recovery Funding LLC | 2.280% | 1/15/36 | 3,775 | 3,764 | |
| Coupon | Maturity Date | Face Amount ($000) | Market Value• ($000) | |||
| 2 | PG&E Energy Recovery Funding LLC | 2.822% | 7/15/46 | 16,989 | 17,107 | |
| Potomac Electric Power Co. | 3.050% | 4/1/22 | 3,765 | 3,797 | ||
| Potomac Electric Power Co. | 6.500% | 11/15/37 | 25,000 | 36,625 | ||
| San Diego Gas & Electric Co. | 6.000% | 6/1/26 | 3,600 | 4,272 | ||
| 2 | San Diego Gas & Electric Co. | 3.750% | 6/1/47 | 5,390 | 6,212 | |
| San Diego Gas & Electric Co. | 4.150% | 5/15/48 | 5,940 | 7,272 | ||
| 2 | SCE Recovery Funding LLC | 0.861% | 11/15/31 | 9,867 | 9,439 | |
| 2 | SCE Recovery Funding LLC | 1.942% | 5/15/38 | 3,655 | 3,511 | |
| 2 | SCE Recovery Funding LLC | 2.510% | 11/15/43 | 3,310 | 3,214 | |
| Sempra Energy | 2.875% | 10/1/22 | 27,530 | 27,944 | ||
| Sempra Energy | 3.250% | 6/15/27 | 80,765 | 85,594 | ||
| Sempra Energy | 6.000% | 10/15/39 | 14,800 | 20,565 | ||
| 2 | Sierra Pacific Power Co. | 3.375% | 8/15/23 | 34,040 | 35,312 | |
| Sierra Pacific Power Co. | 2.600% | 5/1/26 | 7,857 | 8,195 | ||
| 2 | Southern California Edison Co. | 2.400% | 2/1/22 | 4,295 | 4,302 | |
| 2 | Southern California Edison Co. | 3.700% | 8/1/25 | 3,315 | 3,553 | |
| Southern California Edison Co. | 6.000% | 1/15/34 | 7,695 | 10,110 | ||
| 2 | Southern California Edison Co. | 5.550% | 1/15/37 | 50,475 | 63,183 | |
| 2 | Southern California Edison Co. | 5.950% | 2/1/38 | 40,000 | 52,357 | |
| Southern California Edison Co. | 6.050% | 3/15/39 | 1,980 | 2,648 | ||
| Southern California Edison Co. | 4.000% | 4/1/47 | 6,530 | 7,291 | ||
| 2 | Southern California Edison Co. | 4.125% | 3/1/48 | 11,495 | 13,058 | |
| Southern California Edison Co. | 3.650% | 2/1/50 | 5,405 | 5,806 | ||
| Southern Co. | 3.250% | 7/1/26 | 30,885 | 32,690 | ||
| Southern Co. | 4.400% | 7/1/46 | 41,137 | 48,700 | ||
| Southwest Gas Corp. | 2.200% | 6/15/30 | 6,310 | 6,232 | ||
| Southwestern Electric Power Co. | 6.200% | 3/15/40 | 9,800 | 13,866 | ||
| Southwestern Public Service Co. | 3.700% | 8/15/47 | 3,756 | 4,321 | ||
| Union Electric Co. | 4.000% | 4/1/48 | 14,316 | 17,385 | ||
| 2 | Virginia Electric & Power Co. | 2.750% | 3/15/23 | 34,540 | 35,206 | |
| 2 | Virginia Electric & Power Co. | 3.500% | 3/15/27 | 16,025 | 17,348 | |
| 2 | Virginia Electric & Power Co. | 6.000% | 5/15/37 | 1,740 | 2,408 | |
| Wisconsin Electric Power Co. | 5.700% | 12/1/36 | 17,280 | 22,908 | ||
| Wisconsin Public Service Corp. | 6.080% | 12/1/28 | 45,000 | 55,279 | ||
| 3,254,601 | ||||||
| Total Corporate Bonds (Cost $23,945,992) | 25,876,940 | |||||
| Sovereign Bonds (1.0%) | ||||||
| 2,5 | Bermuda | 2.375% | 8/20/30 | 17,415 | 17,229 | |
| 2,5 | Bermuda | 3.375% | 8/20/50 | 6,835 | 6,767 | |
| 2,5 | Corp. Nacional del Cobre de Chile | 3.700% | 1/30/50 | 20,705 | 21,019 | |
| 2,5 | Electricite de France SA | 4.875% | 9/21/38 | 69,680 | 86,078 | |
| 2,5 | Electricite de France SA | 4.950% | 10/13/45 | 15,100 | 19,517 | |
| Equinor ASA | 2.450% | 1/17/23 | 15,017 | 15,316 | ||
| Equinor ASA | 2.650% | 1/15/24 | 14,000 | 14,478 | ||
| Equinor ASA | 3.700% | 3/1/24 | 25,320 | 26,836 | ||
| Equinor ASA | 3.250% | 11/10/24 | 25,200 | 26,673 | ||
| Equinor ASA | 2.875% | 4/6/25 | 4,775 | 5,009 | ||
| Equinor ASA | 3.125% | 4/6/30 | 80,155 | 86,232 | ||
| Equinor ASA | 2.375% | 5/22/30 | 7,585 | 7,731 | ||
| 2 | International Bank for Reconstruction & Development | 4.750% | 2/15/35 | 40,000 | 53,547 | |
| 2,5 | Kingdom of Saudi Arabia | 2.875% | 3/4/23 | 30,195 | 30,979 | |
| 2,5 | NBN Co. Ltd. | 1.625% | 1/8/27 | 26,265 | 25,906 | |
| 2,5 | NBN Co. Ltd. | 2.625% | 5/5/31 | 12,993 | 13,171 | |
| 2,5 | NBN Co. Ltd. | 2.500% | 1/8/32 | 62,667 | 62,658 | |
| 2,5 | Qatar Energy | 2.250% | 7/12/31 | 31,765 | 31,228 | |
| Coupon | Maturity Date | Face Amount ($000) | Market Value• ($000) | |||
| 2,5 | Qatar Energy | 3.125% | 7/12/41 | 23,200 | 23,329 | |
| 2 | Republic of Chile | 2.550% | 1/27/32 | 35,135 | 35,002 | |
| 2 | Republic of Chile | 2.550% | 7/27/33 | 44,260 | 43,450 | |
| Republic of Chile | 3.500% | 4/15/53 | 25,155 | 25,980 | ||
| 2 | Republic of Chile | 3.100% | 1/22/61 | 13,390 | 12,511 | |
| 2 | Republic of Colombia | 4.000% | 2/26/24 | 30,240 | 31,210 | |
| 2 | Republic of Panama | 2.252% | 9/29/32 | 51,385 | 47,920 | |
| Republic of Panama | 4.500% | 4/1/56 | 2,450 | 2,618 | ||
| 2 | Republic of Panama | 3.870% | 7/23/60 | 44,660 | 43,155 | |
| 2,5 | Saudi Arabian Oil Co. | 3.500% | 4/16/29 | 28,670 | 30,506 | |
| 2,5 | State Grid Overseas Investment BVI Ltd. | 2.750% | 5/4/22 | 62,480 | 62,970 | |
| 2,5 | State Grid Overseas Investment BVI Ltd. | 3.500% | 5/4/27 | 28,630 | 31,077 | |
| 2,5 | State of Kuwait | 2.750% | 3/20/22 | 4,255 | 4,282 | |
| 2,5 | State of Qatar | 3.875% | 4/23/23 | 56,160 | 58,526 | |
| 2,5 | State of Qatar | 3.375% | 3/14/24 | 3,360 | 3,527 | |
| 2,5 | State of Qatar | 4.400% | 4/16/50 | 14,035 | 17,215 | |
| 2,5 | Temasek Financial I Ltd. | 2.375% | 1/23/23 | 45,150 | 46,035 | |
| 2,5 | Temasek Financial I Ltd. | 3.625% | 8/1/28 | 36,800 | 41,373 | |
| 2,5 | Temasek Financial I Ltd. | 2.375% | 8/2/41 | 46,170 | 46,046 | |
| 2,5 | Temasek Financial I Ltd. | 2.250% | 4/6/51 | 39,210 | 38,007 | |
| 2,5 | Temasek Financial I Ltd. | 2.500% | 10/6/70 | 22,880 | 22,373 | |
| Total Sovereign Bonds (Cost $1,163,334) | 1,217,486 | |||||
| Taxable Municipal Bonds (1.6%) | ||||||
| Alabama Federal Aid Highway Finance Authority Special Obligation Revenue | 2.650% | 9/1/37 | 4,935 | 4,976 | ||
| Bay Area Toll Authority California Toll Bridge Revenue (San Francisco Bay Area) | 2.574% | 4/1/31 | 14,455 | 15,233 | ||
| Bay Area Toll Authority California Toll Bridge Revenue (San Francisco Bay Area) | 6.263% | 4/1/49 | 1,965 | 3,299 | ||
| Bay Area Toll Authority California Toll Bridge Revenue (San Francisco Bay Area) | 7.043% | 4/1/50 | 26,165 | 47,602 | ||
| Broward County FL Airport System Revenue | 3.477% | 10/1/43 | 10,370 | 11,112 | ||
| California GO | 7.350% | 11/1/39 | 56,970 | 91,469 | ||
| California State University Systemwide Revenue | 2.719% | 11/1/52 | 12,090 | 12,421 | ||
| California State University Systemwide Revenue | 2.939% | 11/1/52 | 15,225 | 15,627 | ||
| Chicago IL O'Hare International Airport Revenue | 6.395% | 1/1/40 | 3,205 | 4,910 | ||
| Chicago IL Transit Authority Sales & Transfer Tax Receipts Revenue | 6.899% | 12/1/40 | 33,870 | 48,710 | ||
| Chicago IL Transit Authority Sales & Transfer Tax Receipts Revenue | 6.899% | 12/1/40 | 57,835 | 83,249 | ||
| Chicago IL Transit Authority Sales Tax Receipts Revenue | 6.200% | 12/1/40 | 2,260 | 3,172 | ||
| City of Riverside CA Pension Obligation Bonds | 3.857% | 6/1/45 | 8,775 | 9,622 | ||
| Dallas/Fort Worth International Airport Revenue | 3.089% | 11/1/40 | 7,405 | 7,689 | ||
| Dallas-Fort Worth TX International Airport Revenue | 2.843% | 11/1/46 | 18,860 | 19,200 | ||
| Florida State Board of Administration Finance Corp. Revenue | 1.705% | 7/1/27 | 29,555 | 29,629 | ||
| Foothill-Eastern Transportation Corridor Agency CA Toll Road Revenue | 4.094% | 1/15/49 | 5,345 | 5,791 | ||
| Coupon | Maturity Date | Face Amount ($000) | Market Value• ($000) | |||
| 8 | Foothill-Eastern Transportation Corridor Agency CA Toll Road Revenue | 3.924% | 1/15/53 | 39,440 | 42,537 | |
| Georgia Municipal Electric Power Authority Revenue | 6.637% | 4/1/57 | 62,624 | 97,423 | ||
| Georgia Water & Wastewater Revenue | 2.257% | 11/1/35 | 1,230 | 1,250 | ||
| Golden State Tobacco Securitization Corp. California Revenue | 2.746% | 6/1/34 | 2,430 | 2,504 | ||
| Golden State Tobacco Securitization Corp. California Revenue | 3.293% | 6/1/42 | 4,645 | 4,786 | ||
| Golden State Tobacco Securitization Corp. California Revenue | 3.000% | 6/1/46 | 11,430 | 11,767 | ||
| Grand Parkway Transportation Corp. Texas System Toll Revenue | 5.184% | 10/1/42 | 5,645 | 7,776 | ||
| Grand Parkway Transportation Corp. Texas System Toll Revenue | 3.236% | 10/1/52 | 28,900 | 30,214 | ||
| Great Lakes Michigan Water Authority Sewage Disposal System Revenue | 3.056% | 7/1/39 | 8,495 | 9,079 | ||
| Houston TX GO | 6.290% | 3/1/32 | 15,875 | 20,164 | ||
| Illinois GO | 5.100% | 6/1/33 | 126,980 | 148,462 | ||
| Illinois Toll Highway Authority Revenue | 6.184% | 1/1/34 | 29,200 | 40,945 | ||
| Jobs Ohio Beverage System Statewide Liquor Profits Revenue | 2.833% | 1/1/38 | 5,480 | 5,808 | ||
| Kansas Development Finance Authority Revenue | 4.927% | 4/15/45 | 7,745 | 10,476 | ||
| 9 | Kansas Development Finance Authority Revenue | 2.774% | 5/1/51 | 15,140 | 15,482 | |
| 8 | Kansas Development Finance Authority Revenue (Employees Retirement System) | 5.501% | 5/1/34 | 50,000 | 63,029 | |
| Louisville & Jefferson County KY Metropolitan Sewer District Sewer & Drainage System Revenue | 6.250% | 5/15/43 | 19,000 | 28,737 | ||
| Maryland Transportation Authority Facilities Projects Revenue | 5.888% | 7/1/43 | 18,985 | 26,738 | ||
| Massachusetts GO | 2.514% | 7/1/41 | 8,175 | 8,254 | ||
| Massachusetts School Building Authority Dedicated Sales Tax Revenue | 1.753% | 8/15/30 | 27,675 | 27,516 | ||
| Massachusetts School Building Authority Dedicated Sales Tax Revenue | 5.715% | 8/15/39 | 22,105 | 30,840 | ||
| Massachusetts School Building Authority Dedicated Sales Tax Revenue | 3.395% | 10/15/40 | 16,745 | 17,980 | ||
| Massachusetts School Building Authority Dedicated Sales Tax Revenue | 2.950% | 5/15/43 | 21,350 | 22,025 | ||
| Michigan Finance Authority Revenue (Trinity Health Credit Group) | 3.084% | 12/1/34 | 11,320 | 12,208 | ||
| New Jersey Turnpike Authority Revenue | 7.414% | 1/1/40 | 30,285 | 49,856 | ||
| New York Metropolitan Transportation Authority Revenue (Build America Bonds) | 6.200% | 11/15/26 | 2,195 | 2,497 | ||
| New York Metropolitan Transportation Authority Revenue (Build America Bonds) | 6.814% | 11/15/40 | 27,295 | 39,399 | ||
| New York Metropolitan Transportation Authority Revenue (Climate Bond Certified) | 5.175% | 11/15/49 | 23,665 | 32,949 | ||
| New York Metropolitan Transportation Authority Revenue (Dedicated Tax Fund) | 7.336% | 11/15/39 | 10,860 | 17,586 | ||
| New York Metropolitan Transportation Authority Revenue (Dedicated Tax Fund) | 6.089% | 11/15/40 | 16,085 | 22,614 | ||
| New York State Dormitory Authority Revenue (Personal Income Tax) | 3.110% | 2/15/39 | 21,260 | 22,876 | ||
| Coupon | Maturity Date | Face Amount ($000) | Market Value• ($000) | |||
| New York State Dormitory Authority Revenue (Personal Income Tax) | 3.190% | 2/15/43 | 12,095 | 13,039 | ||
| New York State Thruway Authority General Revenue | 2.900% | 1/1/35 | 16,730 | 17,896 | ||
| New York State Thruway Authority General Revenue | 3.500% | 1/1/42 | 9,430 | 10,014 | ||
| New York State Urban Development Corp. Revenue (Personal Income Tax) | 2.100% | 3/15/22 | 28,840 | 29,000 | ||
| North Texas Tollway Authority System Revenue | 3.011% | 1/1/43 | 9,145 | 9,420 | ||
| North Texas Tollway Authority System Revenue | 6.718% | 1/1/49 | 11,035 | 18,952 | ||
| Oregon Department of Transportation Highway User Tax Revenue | 5.834% | 11/15/34 | 25,930 | 35,393 | ||
| 9 | Oregon GO | 3.424% | 3/1/60 | 28,000 | 29,374 | |
| 8 | Oregon School Boards Association GO | 5.528% | 6/30/28 | 50,000 | 57,729 | |
| 10 | Philadelphia PA Authority for Industrial Development Revenue | 6.550% | 10/15/28 | 66,810 | 85,284 | |
| Port Authority of New York & New Jersey Revenue | 5.859% | 12/1/24 | 2,600 | 2,969 | ||
| Port Authority of New York & New Jersey Revenue | 4.458% | 10/1/62 | 44,055 | 60,338 | ||
| Port Authority of New York & New Jersey Revenue | 4.810% | 10/15/65 | 21,985 | 31,275 | ||
| Riverside County CA Pension Obligation Bonds | 3.818% | 2/15/38 | 9,585 | 10,876 | ||
| Rutgers State University New Jersey Revenue | 3.270% | 5/1/43 | 11,960 | 12,946 | ||
| Sales Tax Securitization Corp. Illinois Revenue | 4.787% | 1/1/48 | 20,690 | 27,430 | ||
| San Antonio TX Electric & Gas Systems Revenue | 2.905% | 2/1/48 | 8,220 | 8,465 | ||
| Texas Transportation Commission GO | 2.562% | 4/1/42 | 7,310 | 7,410 | ||
| Texas Transportation Commission State Highway Revenue | 4.000% | 10/1/33 | 12,640 | 15,246 | ||
| University of California Regents Medical Center Pooled Revenue | 6.548% | 5/15/48 | 10,400 | 16,533 | ||
| University of California Regents Medical Center Pooled Revenue | 6.583% | 5/15/49 | 15,150 | 23,975 | ||
| University of California Regents Medical Center Pooled Revenue | 3.006% | 5/15/50 | 15,445 | 16,328 | ||
| University of California Regents Medical Center Pooled Revenue | 3.256% | 5/15/60 | 26,520 | 29,640 | ||
| University of California Revenue | 1.316% | 5/15/27 | 13,075 | 12,975 | ||
| University of California Revenue | 1.614% | 5/15/30 | 16,140 | 15,759 | ||
| University of California Revenue | 4.601% | 5/15/31 | 21,975 | 25,734 | ||
| University of California Revenue | 4.765% | 5/15/44 | 5,980 | 6,411 | ||
| University of California Revenue | 3.931% | 5/15/45 | 22,370 | 25,814 | ||
| Utility Debt Securitization Authority NY Restructuring Bonds | 3.435% | 12/15/25 | 7,129 | 7,288 | ||
| Total Taxable Municipal Bonds (Cost $1,657,023) | 1,951,001 | |||||
| Shares | ||||||
| Temporary Cash Investments (0.6%) | ||||||
| Money Market Fund (0.0%) | ||||||
| 11 | Vanguard Market Liquidity Fund | 0.077% | 1,437 | 144 | ||
| Coupon | Maturity Date | Face Amount ($000) | Market Value• ($000) | |||
| Repurchase Agreements (0.1%) | ||||||
| Bank of America Securities, LLC (Dated 11/30/21, Repurchase Value $9,400,000, collateralized by U.S. Treasury Note/Bond 2.375%, 4/30/26, with a value of $9,588,000) | 0.050% | 12/1/21 | 9,400 | 9,400 | ||
| Citigroup Global Markets Inc. (Dated 11/30/21, Repurchase Value $800,000, collateralized by U.S. Treasury Bill 0.000%, 12/2/21–12/9/21, and U.S. Treasury Note/Bond 1.875%, 7/31/26, with a value of $816,000) | 0.050% | 12/1/21 | 800 | 800 | ||
| Credit Agricole Securities (USA) Inc. (Dated 11/30/21, Repurchase Value $7,200,000, collateralized by Treasury Inflation Indexed Note/Bond 3.625%, 4/15/28, with a value of $7,344,000) | 0.050% | 12/1/21 | 7,200 | 7,200 | ||
| Deutsche Bank Securities, Inc. (Dated 11/30/21, Repurchase Value $67,000,000, collateralized by U.S. Treasury Note/Bond 1.625%, 5/15/31, with a value of $68,340,000) | 0.050% | 12/1/21 | 67,000 | 67,000 | ||
| HSBC Bank USA (Dated 11/30/21, Repurchase Value $13,300,000, collateralized by U.S. Treasury Note/Bond 2.000%, 10/31/22, with a value of $13,566,000) | 0.045% | 12/1/21 | 13,300 | 13,300 | ||
| HSBC Bank USA (Dated 11/30/21, Repurchase Value $300,000, collateralized by Fannie Mae 4.690%, 2/1/49, with a value of $306,000) | 0.050% | 12/1/21 | 300 | 300 | ||
| Nomura International plc (Dated 11/30/21, Repurchase Value $64,200,000, collateralized by U.S. Treasury Note/Bond 0.625%–3.125%, 3/31/27–2/15/45, with a value of $65,484,000) | 0.050% | 12/1/21 | 64,200 | 64,200 | ||
| RBC Capital Markets LLC (Dated 11/30/21, Repurchase Value $2,700,000, collateralized by Fannie Mae 3.000%, 11/1/50–1/1/60, and Freddie Mac 3.000%–3.500%, 7/1/51–7/2/51, with a value of $2,754,000) | 0.050% | 12/1/21 | 2,700 | 2,700 | ||
| TD Securities (USA) LLC (Dated 11/30/21, Repurchase Value $200,000, collateralized by Ginnie Mae 4.000%, 12/20/43, with a value of $204,000) | 0.050% | 12/1/21 | 200 | 200 | ||
| 165,100 | ||||||
| U.S. Government and Agency Obligations (0.5%) | ||||||
| United States Treasury Bill | 0.054% | 1/6/22 | 200,000 | 199,990 | ||
| Coupon | Maturity Date | Face Amount ($000) | Market Value• ($000) | |||
| United States Treasury Bill | 0.040% | 1/11/22 | 300,000 | 299,986 | ||
| United States Treasury Bill | 0.041% | 1/25/22 | 120,000 | 119,992 | ||
| 619,968 | ||||||
| Total Temporary Cash Investments (Cost $785,210) | 785,212 | |||||
| Total Investments (100.0%) (Cost $84,348,198) | 123,857,677 | |||||
| Other Assets and Liabilities—Net (0.0%) | (2,158) | |||||
| Net Assets (100%) | 123,855,519 | |||||
| Cost is in $000. |
| • | See Note A in Notes to Financial Statements. |
| * | Non-income-producing security. |
| 1 | Securities with a value of $12,004,000 have been segregated as initial margin for open futures contracts. |
| 2 | The average or expected maturity is shorter than the final maturity shown because of the possibility of interim principal payments and prepayments or the possibility of the issue being called. |
| 3 | The issuer was placed under federal conservatorship in September 2008; since that time, its daily operations have been managed by the Federal Housing Finance Agency and it receives capital from the U.S. Treasury, as needed to maintain a positive net worth, in exchange for senior preferred stock. |
| 4 | Includes securities purchased on a when-issued or delayed-delivery basis for which the fund has not taken delivery as of November 30, 2021. |
| 5 | Security exempt from registration under Rule 144A of the Securities Act of 1933. Such securities may be sold in transactions exempt from registration, normally to qualified institutional buyers. At November 30, 2021, the aggregate value was $8,264,445,000, representing 6.7% of net assets. |
| 6 | Security value determined using significant unobservable inputs. |
| 7 | Variable-rate security; rate shown is effective rate at period end. Certain variable-rate securities are not based on a published reference rate and spread but are determined by the issuer or agent based on current market conditions. |
| 8 | Scheduled principal and interest payments are guaranteed by Assured Guaranty Municipal Corp. |
| 9 | Scheduled principal and interest payments are guaranteed by Build America Mutual Assurance Co. |
| 10 | Scheduled principal and interest payments are guaranteed by National Public Finance Guarantee Corp. |
| 11 | Affiliated money market fund available only to Vanguard funds and certain trusts and accounts managed by Vanguard. Rate shown is the 7-day yield. |
| 1M—1-month. | |
| 3M—3-month. | |
| ADR—American Depositary Receipt. | |
| GO—General Obligation Bond. | |
| LIBOR—London Interbank Offered Rate. | |
| REMICS—Real Estate Mortgage Investment Conduits. | |
| UMBS—Uniform Mortgage-Backed Securities. | |
| USD—U.S. Dollar. |
| Futures Contracts | ||||
| ($000) | ||||
| Expiration | Number of Long (Short) Contracts | Notional Amount | Value and Unrealized Appreciation (Depreciation) | |
| Long Futures Contracts | ||||
| 2-Year U.S. Treasury Note | March 2022 | 1,640 | 358,724 | 740 |
| 5-Year U.S. Treasury Note | March 2022 | 4,019 | 487,900 | 2,534 |
| 10-Year U.S. Treasury Note | March 2022 | 2,027 | 265,157 | 3,640 |
| Ultra 10-Year U.S. Treasury Note | March 2022 | 1,779 | 261,319 | 4,542 |
| 11,456 | ||||
| ($000s, except shares and per-share amounts) | Amount |
| Assets | |
| Investments in Securities, at Value | |
| Unaffiliated Issuers (Cost $84,348,056) | 123,857,533 |
| Affiliated Issuers (Cost $142) | 144 |
| Total Investments in Securities | 123,857,677 |
| Investment in Vanguard | 4,083 |
| Cash | 6,831 |
| Foreign Currency, at Value (Cost $1,666) | 1,625 |
| Receivables for Investment Securities Sold | 128,735 |
| Receivables for Accrued Income | 384,213 |
| Receivables for Capital Shares Issued | 43,247 |
| Variation Margin Receivable—Futures Contracts | 3,540 |
| Total Assets | 124,429,951 |
| Liabilities | |
| Payables for Investment Securities Purchased | 506,432 |
| Payables for Capital Shares Redeemed | 44,816 |
| Payables to Investment Advisor | 17,502 |
| Payables to Vanguard | 5,682 |
| Total Liabilities | 574,432 |
| Net Assets | 123,855,519 |
| Statement of Assets and Liabilities (continued) | |
| At November 30, 2021, net assets consisted of: | |
| ($000s, except shares and per-share amounts) | Amount |
| Paid-in Capital | 75,789,169 |
| Total Distributable Earnings (Loss) | 48,066,350 |
| Net Assets | 123,855,519 |
| Investor Shares—Net Assets | |
| Applicable to 308,449,581 outstanding $.001 par value shares of beneficial interest (unlimited authorization) | 15,469,062 |
| Net Asset Value Per Share—Investor Shares | $50.15 |
| Admiral Shares—Net Assets | |
| Applicable to 1,251,461,132 outstanding $.001 par value shares of beneficial interest (unlimited authorization) | 108,386,457 |
| Net Asset Value Per Share—Admiral Shares | $86.61 |
| Year Ended November 30, 2021 | |
| ($000) | |
| Investment Income | |
| Income | |
| Dividends1 | 1,294,697 |
| Interest2 | 998,689 |
| Securities Lending—Net | 1,027 |
| Total Income | 2,294,413 |
| Expenses | |
| Investment Advisory Fees—Note B | |
| Basic Fee | 91,034 |
| Performance Adjustment | (20,833) |
| The Vanguard Group—Note C | |
| Management and Administrative—Investor Shares | 27,493 |
| Management and Administrative—Admiral Shares | 99,271 |
| Marketing and Distribution—Investor Shares | 871 |
| Marketing and Distribution—Admiral Shares | 2,371 |
| Custodian Fees | 452 |
| Auditing Fees | 35 |
| Shareholders’ Reports—Investor Shares | 491 |
| Shareholders’ Reports—Admiral Shares | 429 |
| Trustees’ Fees and Expenses | 77 |
| Total Expenses | 201,691 |
| Net Investment Income | 2,092,722 |
| Realized Net Gain (Loss) | |
| Investment Securities Sold2 | 8,498,291 |
| Futures Contracts | 14,406 |
| Forward Currency Contracts | 4,713 |
| Foreign Currencies | (3,178) |
| Realized Net Gain (Loss) | 8,514,232 |
| Change in Unrealized Appreciation (Depreciation) | |
| Investment Securities2 | 7,977,032 |
| Futures Contracts | 12,609 |
| Foreign Currencies | 1,338 |
| Change in Unrealized Appreciation (Depreciation) | 7,990,979 |
| Net Increase (Decrease) in Net Assets Resulting from Operations | 18,597,933 |
| 1 | Dividends are net of foreign withholding taxes of $38,674,000. |
| 2 | Interest income, realized net gain (loss), and change in unrealized appreciation (depreciation) from an affiliated company of the fund were $0, ($45,000), and $2,000, respectively. Purchases and sales are for temporary cash investment purposes. |
| Year Ended November 30, | ||
| 2021 ($000) | 2020 ($000) | |
| Increase (Decrease) in Net Assets | ||
| Operations | ||
| Net Investment Income | 2,092,722 | 2,487,549 |
| Realized Net Gain (Loss) | 8,514,232 | 6,632,872 |
| Change in Unrealized Appreciation (Depreciation) | 7,990,979 | 1,219,484 |
| Net Increase (Decrease) in Net Assets Resulting from Operations | 18,597,933 | 10,339,905 |
| Distributions | ||
| Investor Shares | (1,149,407) | (738,980) |
| Admiral Shares | (7,140,083) | (4,196,596) |
| Total Distributions | (8,289,490) | (4,935,576) |
| Capital Share Transactions | ||
| Investor Shares | (1,554,501) | (2,344,969) |
| Admiral Shares | 3,457,185 | (2,092,620) |
| Net Increase (Decrease) from Capital Share Transactions | 1,902,684 | (4,437,589) |
| Total Increase (Decrease) | 12,211,127 | 966,740 |
| Net Assets | ||
| Beginning of Period | 111,644,392 | 110,677,652 |
| End of Period | 123,855,519 | 111,644,392 |
| Investor Shares | |||||
| For a Share Outstanding Throughout Each Period | Year Ended November 30, | ||||
| 2021 | 2020 | 2019 | 2018 | 2017 | |
| Net Asset Value, Beginning of Period | $46.10 | $43.72 | $41.86 | $43.45 | $39.23 |
| Investment Operations | |||||
| Net Investment Income1 | .811 | .966 | 1.098 | 1.083 | 1.021 |
| Net Realized and Unrealized Gain (Loss) on Investments | 6.638 | 3.345 | 4.269 | .100 | 4.965 |
| Total from Investment Operations | 7.449 | 4.311 | 5.367 | 1.183 | 5.986 |
| Distributions | |||||
| Dividends from Net Investment Income | (.818) | (1.004) | (1.099) | (1.086) | (1.030) |
| Distributions from Realized Capital Gains | (2.581) | (.927) | (2.408) | (1.687) | (.736) |
| Total Distributions | (3.399) | (1.931) | (3.507) | (2.773) | (1.766) |
| Net Asset Value, End of Period | $50.15 | $46.10 | $43.72 | $41.86 | $43.45 |
| Total Return2 | 17.16% | 10.41% | 14.22% | 2.80% | 15.72% |
| Ratios/Supplemental Data | |||||
| Net Assets, End of Period (Millions) | $15,469 | $15,635 | $17,209 | $16,438 | $18,422 |
| Ratio of Total Expenses to Average Net Assets3 | 0.24% | 0.24% | 0.25% | 0.25% | 0.25% |
| Ratio of Net Investment Income to Average Net Assets | 1.70% | 2.28% | 2.70% | 2.58% | 2.50% |
| Portfolio Turnover Rate4 | 35% | 51% | 28% | 34% | 30% |
| 1 | Calculated based on average shares outstanding. |
| 2 | Total returns do not include account service fees that may have applied in the periods shown. Fund prospectuses provide information about any applicable account service fees. |
| 3 | Includes performance-based investment advisory fee increases (decreases) of (0.02%), (0.02%), (0.00%), (0.01%), and (0.01%). |
| 4 | Includes 2%, 3%, 1%, 2%, and 4%, respectively, attributable to mortgage-dollar-roll activity. |
| Admiral Shares | |||||
| For a Share Outstanding Throughout Each Period | Year Ended November 30, | ||||
| 2021 | 2020 | 2019 | 2018 | 2017 | |
| Net Asset Value, Beginning of Period | $79.62 | $75.51 | $72.29 | $75.04 | $67.75 |
| Investment Operations | |||||
| Net Investment Income1 | 1.464 | 1.720 | 1.954 | 1.929 | 1.824 |
| Net Realized and Unrealized Gain (Loss) on Investments | 11.461 | 5.784 | 7.379 | .172 | 8.572 |
| Total from Investment Operations | 12.925 | 7.504 | 9.333 | 2.101 | 10.396 |
| Distributions | |||||
| Dividends from Net Investment Income | (1.477) | (1.794) | (1.955) | (1.936) | (1.836) |
| Distributions from Realized Capital Gains | (4.458) | (1.600) | (4.158) | (2.915) | (1.270) |
| Total Distributions | (5.935) | (3.394) | (6.113) | (4.851) | (3.106) |
| Net Asset Value, End of Period | $86.61 | $79.62 | $75.51 | $72.29 | $75.04 |
| Total Return2 | 17.25% | 10.50% | 14.33% | 2.88% | 15.81% |
| Ratios/Supplemental Data | |||||
| Net Assets, End of Period (Millions) | $108,386 | $96,009 | $93,469 | $86,207 | $87,136 |
| Ratio of Total Expenses to Average Net Assets3 | 0.16% | 0.16% | 0.17% | 0.17% | 0.17% |
| Ratio of Net Investment Income to Average Net Assets | 1.77% | 2.35% | 2.78% | 2.66% | 2.58% |
| Portfolio Turnover Rate4 | 35% | 51% | 28% | 34% | 30% |
| 1 | Calculated based on average shares outstanding. |
| 2 | Total returns do not include account service fees that may have applied in the periods shown. Fund prospectuses provide information about any applicable account service fees. |
| 3 | Includes performance-based investment advisory fee increases (decreases) of (0.02%), (0.02%), (0.00%), (0.01%), and (0.01%). |
| 4 | Includes 2%, 3%, 1%, 2%, and 4%, respectively, attributable to mortgage-dollar-roll activity. |
| Level 1 ($000) | Level 2 ($000) | Level 3 ($000) | Total ($000) | |
| Investments | ||||
| Assets | ||||
| Common Stocks | 75,778,046 | 5,933,419 | — | 81,711,465 |
| U.S. Government and Agency Obligations | — | 10,448,596 | — | 10,448,596 |
| Asset-Backed/Commercial Mortgage-Backed Securities | — | 1,847,405 | 19,572 | 1,866,977 |
| Corporate Bonds | — | 25,876,940 | — | 25,876,940 |
| Sovereign Bonds | — | 1,217,486 | — | 1,217,486 |
| Taxable Municipal Bonds | — | 1,951,001 | — | 1,951,001 |
| Temporary Cash Investments | 144 | 785,068 | — | 785,212 |
| Total | 75,778,190 | 48,059,915 | 19,572 | 123,857,677 |
| Derivative Financial Instruments | ||||
| Assets | ||||
| Futures Contracts1 | 11,456 | — | — | 11,456 |
| 1 | Includes cumulative appreciation (depreciation) on futures contracts and centrally cleared swaps, if any, as reported in the Schedule of Investments. Only current day’s variation margin is reported within the Statement of Assets and Liabilities. |
| Realized Net Gain (Loss) on Derivatives | Interest Rate Contracts ($000) | Foreign Exchange Contracts ($000) | Total ($000) |
| Futures Contracts | 14,406 | — | 14,406 |
| Forward Currency Contracts | — | 4,713 | 4,713 |
| Realized Net Gain (Loss) on Derivatives | 14,406 | 4,713 | 19,119 |
| Change in Unrealized Appreciation (Depreciation) on Derivatives | |||
| Futures Contracts | 12,609 | — | 12,609 |
| Forward Currency Contracts | — | — | — |
| Change in Unrealized Appreciation (Depreciation) on Derivatives | 12,609 | — | 12,609 |
| Amount ($000) | |
| Paid-in Capital | 360,235 |
| Total Distributable Earnings (Loss) | (360,235) |
| Amount ($000) | |
| Undistributed Ordinary Income | 2,091,360 |
| Undistributed Long-Term Gains | 6,482,888 |
| Capital Loss Carryforwards | — |
| Qualified Late-Year Losses | — |
| Net Unrealized Gains (Losses) | 39,492,102 |
| Year Ended November 30, | ||
| 2021 Amount ($000) | 2020 Amount ($000) | |
| Ordinary Income* | 2,502,914 | 2,598,283 |
| Long-Term Capital Gains | 5,786,576 | 2,337,293 |
| Total | 8,289,490 | 4,935,576 |
| * | Includes short-term capital gains, if any. |
| Amount ($000) | |
| Tax Cost | 84,369,401 |
| Gross Unrealized Appreciation | 40,475,451 |
| Gross Unrealized Depreciation | (987,175) |
| Net Unrealized Appreciation (Depreciation) | 39,488,276 |
| Year Ended November 30, | |||||
| 2021 | 2020 | ||||
| Amount ($000) | Shares (000) | Amount ($000) | Shares (000) | ||
| Investor Shares | |||||
| Issued | 1,621,764 | 34,004 | 1,570,553 | 37,036 | |
| Issued in Lieu of Cash Distributions | 1,097,976 | 24,568 | 705,545 | 16,986 | |
| Redeemed | (4,274,241) | (89,265) | (4,621,067) | (108,454) | |
| Net Increase (Decrease)—Investor Shares | (1,554,501) | (30,693) | (2,344,969) | (54,432) | |
| Year Ended November 30, | |||||
| 2021 | 2020 | ||||
| Amount ($000) | Shares (000) | Amount ($000) | Shares (000) | ||
| Admiral Shares | |||||
| Issued | 8,286,366 | 100,452 | 7,817,857 | 105,629 | |
| Issued in Lieu of Cash Distributions | 6,612,568 | 85,613 | 3,891,977 | 54,268 | |
| Redeemed | (11,441,749) | (140,499) | (13,802,454) | (191,768) | |
| Net Increase (Decrease)—Admiral Shares | 3,457,185 | 45,566 | (2,092,620) | (31,871) | |
Philadelphia, Pennsylvania
January 19, 2022
| Matthew Benchener | Thomas M. Rampulla |
| Joseph Brennan | Karin A. Risi |
| Mortimer J. Buckley | Anne E. Robinson |
| Gregory Davis | Michael Rollings |
| John James | Nitin Tandon |
| John T. Marcante | Lauren Valente |
| Chris D. McIsaac |

Who Are Deaf or Hard of Hearing > 800-749-7273
All rights reserved.
Vanguard Marketing Corporation, Distributor.

| Vanguard U.S. Liquidity Factor ETF |
| Vanguard U.S. Minimum Volatility ETF |
| Vanguard U.S. Momentum Factor ETF |
| Vanguard U.S. Multifactor ETF |
| Vanguard U.S. Quality Factor ETF |
| Vanguard U.S. Value Factor ETF |
Your Fund’s Performance at a Glance | 1 |
Advisor’s Report | 2 |
About Your Fund’s Expenses | 4 |
U.S. Liquidity Factor ETF | 6 |
U.S. Minimum Volatility ETF | 25 |
U.S. Momentum Factor ETF | 37 |
U.S. Multifactor ETF | 56 |
U.S. Quality Factor ETF | 73 |
U.S. Value Factor ETF | 92 |
| • | Vanguard’s six U.S. Factor ETFs posted returns ranging from about 17% to nearly 38% (based on net asset value) for the 12 months ended November 30, 2021. Three of the six ETFs beat the 26.34% return of their benchmark, the Russell 3000 Index. |
| • | The U.S. Factor ETFs seek to provide long-term capital appreciation by investing in stocks that have lower or higher measures of certain factors relative to the broad U.S. equity market. |
| • | Vanguard U.S. Value ETF performed best among the group, returning 37.51% based on net asset value. |
| • | Vanguard U.S. Minimum Volatility ETF produced the lowest returns, at 17.22% based on net asset value. Performance was held back as defensive sectors favored by this strategy underperformed as the market recovered over the past 12 months. |
| • | All six ETFs regularly use derivatives to hedge portfolio risks. On balance, the ETFs’ holdings in equity index futures contracts contributed to performance. |
| Average Annual Total Returns Periods Ended November 30, 2021 | |||
| One Year | Three Years | Five Years | |
| Stocks | |||
| Russell 1000 Index (Large-caps) | 26.67% | 20.65% | 17.93% |
| Russell 2000 Index (Small-caps) | 22.03 | 14.22 | 12.14 |
| Russell 3000 Index (Broad U.S. market) | 26.34 | 20.20 | 17.51 |
| FTSE All-World ex US Index (International) | 9.63 | 10.38 | 9.56 |
| Bonds | |||
| Bloomberg U.S. Aggregate Bond Index (Broad taxable market) | -1.15% | 5.52% | 3.65% |
| Bloomberg Municipal Bond Index (Broad tax-exempt market) | 1.97 | 5.09 | 4.38 |
| FTSE Three-Month U.S. Treasury Bill Index | 0.05 | 1.02 | 1.12 |
| CPI | |||
| Consumer Price Index | 6.81% | 3.32% | 2.86% |
| • | Vanguard U.S. Liquidity Factor ETF seeks exposure to stocks with lower measures of trading liquidity, such as daily trading volume and its effect on the security’s price. |
| • | Vanguard U.S. Minimum Volatility ETF seeks to build a portfolio of stocks with lower volatility relative to the broad U.S. equity market. |
| • | Vanguard U.S. Momentum Factor ETF seeks exposure to stocks with relatively strong recent performance as identified by measures such as returns over different periods. |
| • | Vanguard U.S. Multifactor ETF seeks exposure to stocks with relatively strong recent performance, strong fundamentals, and low prices relative to fundamentals. |
| • | Vanguard U.S. Quality Factor ETF seeks exposure to stocks with strong fundamentals as identified by measures |
| • | Vanguard U.S. Value Factor ETF seeks exposure to stocks with lower prices relative to fundamental measures of value such as book/price and earnings/price ratios. |
| • | The U.S. Liquidity Factor ETF was held back on a relative basis by its positions in health care, technology, basic materials, and real estate but posted positive relative results in financials, industrials, telecommunications, and consumer staples. |
| • | The U.S. Minimum Volatility ETF was held back in particular by its positions in telecommunications, financials, and consumer discretionary but benefited from its selection in technology and industrials. |
| • | The U.S. Momentum Factor ETF was held back by its positions in technology, telecommunications, and financials but benefited most on a relative basis from its positions in consumer discretionary, industrials, and consumer staples. |
| • | The U.S. Multifactor ETF benefited most from its positions in consumer discretionary, industrials, and health care but was held back by holdings in technology and real estate. |
| • | The U.S. Quality Factor ETF benefited most from its positions in financials, industrials, and consumer discretionary but was held back by holdings in technology, energy, and consumer staples. |
| • | The U.S. Value Factor ETF was helped most by its positions in financials, energy, industrials, and consumer discretionary but was held back by holdings in technology, utilities, and telecommunications. |
| • | Based on actual fund return. This section helps you to estimate the actual expenses that you paid over the period. The ”Ending Account Value“ shown is derived from the fund‘s actual return, and the third column shows the dollar amount that would have been paid by an investor who started with $1,000 in the fund. You may use the information here, together with the amount you invested, to estimate the expenses that you paid over the period. |
| • | Based on hypothetical 5% yearly return. This section is intended to help you compare your fund‘s costs with those of other mutual funds. It assumes that the fund had a yearly return of 5% before expenses, but that the expense ratio is unchanged. In this case—because the return used is not the fund’s actual return—the results do not apply to your investment. The example is useful in making comparisons because the Securities and Exchange Commission requires all mutual funds to calculate expenses based on a 5% return. You can assess your fund’s costs by comparing this hypothetical example with the hypothetical examples that appear in shareholder reports of other funds. |
| Six Months Ended November 30, 2021 | |||
| Beginning Account Value 5/31/2021 | Ending Account Value 11/30/2021 | Expenses Paid During Period | |
| Based on Actual Fund Return | |||
| U.S. Liquidity Factor ETF | $1,000.00 | $997.60 | $0.65 |
| U.S. Minimum Volatility ETF | $1,000.00 | $1,044.70 | $0.67 |
| U.S. Momentum Factor ETF | $1,000.00 | $1,027.10 | $0.66 |
| U.S. Multifactor ETF | $1,000.00 | $1,019.10 | $0.91 |
| U.S. Quality Factor ETF | $1,000.00 | $1,045.70 | $0.67 |
| U.S. Value Factor ETF | $1,000.00 | $987.80 | $0.65 |
| Based on Hypothetical 5% Yearly Return | |||
| U.S. Liquidity Factor ETF | $1,000.00 | $1,024.42 | $0.66 |
| U.S. Minimum Volatility ETF | $1,000.00 | $1,024.42 | $0.66 |
| U.S. Momentum Factor ETF | $1,000.00 | $1,024.42 | $0.66 |
| U.S. Multifactor ETF | $1,000.00 | $1,024.17 | $0.91 |
| U.S. Quality Factor ETF | $1,000.00 | $1,024.42 | $0.66 |
| U.S. Value Factor ETF | $1,000.00 | $1,024.42 | $0.66 |

| Average Annual Total Returns Periods Ended November 30, 2021 | ||||
| One Year | Since Inception (2/13/2018) | Final Value of a $10,000 Investment | ||
 | U.S. Liquidity Factor ETF Net Asset Value | 24.89% | 12.27% | $15,512 |
| U.S. Liquidity Factor ETF Market Price | 24.88 | 12.28 | 15,517 | |
 | Russell 3000 Index | 26.34 | 17.17 | 18,243 |
| One Year | Since Inception (2/13/2018) | |
| U.S. Liquidity Factor ETF Market Price | 24.88% | 55.17% |
| U.S. Liquidity Factor ETF Net Asset Value | 24.89 | 55.12 |
| Russell 3000 Index | 26.34 | 82.43 |
| Basic Materials | 5.2% |
| Consumer Discretionary | 8.5 |
| Consumer Staples | 3.3 |
| Energy | 2.2 |
| Financials | 24.6 |
| Health Care | 18.7 |
| Industrials | 22.7 |
| Real Estate | 0.9 |
| Technology | 10.5 |
| Telecommunications | 2.0 |
| Utilities | 1.4 |
| Shares | Market Value• ($000) | ||
| Common Stocks (99.5%) | |||
| Basic Materials (5.1%) | |||
| Ecolab Inc. | 1,908 | 423 | |
| Air Products and Chemicals Inc. | 892 | 256 | |
| Dow Inc. | 3,945 | 217 | |
| Balchem Corp. | 1,100 | 174 | |
| Southern Copper Corp. | 2,145 | 125 | |
| Linde plc | 351 | 112 | |
| * | RBC Bearings Inc. | 504 | 100 |
| UFP Industries Inc. | 1,187 | 99 | |
| AdvanSix Inc. | 2,001 | 91 | |
| Timken Co. | 1,335 | 88 | |
| Valvoline Inc. | 2,403 | 82 | |
| Reliance Steel & Aluminum Co. | 526 | 78 | |
| FutureFuel Corp. | 9,610 | 72 | |
| Glatfelter Corp. | 3,885 | 64 | |
| Ryerson Holding Corp. | 2,225 | 52 | |
| Huntsman Corp. | 1,308 | 41 | |
| Chemours Co. | 1,336 | 40 | |
| American Vanguard Corp. | 2,694 | 38 | |
| Royal Gold Inc. | 373 | 37 | |
| Mueller Industries Inc. | 654 | 36 | |
| Scotts Miracle-Gro Co. | 242 | 35 | |
| Stepan Co. | 314 | 35 | |
| * | Orion Engineered Carbons SA | 1,744 | 31 |
| Ashland Global Holdings Inc. | 287 | 29 | |
| * | Clearwater Paper Corp. | 690 | 28 |
| * | Energy Fuels Inc. | 3,170 | 28 |
| * | Koppers Holdings Inc. | 883 | 27 |
| Tredegar Corp. | 2,431 | 27 | |
| * | GCP Applied Technologies Inc. | 1,077 | 25 |
| Minerals Technologies Inc. | 371 | 24 | |
| * | Rayonier Advanced Materials Inc. | 4,307 | 24 |
| Avient Corp. | 370 | 20 | |
| * | Novagold Resources Inc. | 2,580 | 17 |
| Avery Dennison Corp. | 80 | 16 | |
| Verso Corp. Class A | 749 | 16 | |
| Neenah Inc. | 316 | 15 | |
| * | Ur-Energy Inc. | 6,068 | 9 |
| 2,631 | |||
| Consumer Discretionary (8.4%) | |||
| Ross Stores Inc. | 2,103 | 229 | |
| * | Liberty Media Corp.- Liberty SiriusXM Class C | 3,155 | 154 |
| AMERCO | 212 | 149 | |
| * | Terminix Global Holdings Inc. | 3,494 | 130 |
| Shares | Market Value• ($000) | ||
| * | Golden Entertainment Inc. | 2,713 | 125 |
| Pool Corp. | 212 | 117 | |
| * | Aptiv plc | 698 | 112 |
| * | frontdoor Inc. | 3,203 | 111 |
| * | Liberty Media Corp.-Liberty Formula One Class C | 1,788 | 109 |
| Movado Group Inc. | 2,212 | 99 | |
| Churchill Downs Inc. | 391 | 88 | |
| Choice Hotels International Inc. | 583 | 84 | |
| Carriage Services Inc. Class A | 1,605 | 83 | |
| * | Houghton Mifflin Harcourt Co. | 5,038 | 78 |
| * | Vera Bradley Inc. | 8,103 | 77 |
| Fox Corp. Class B | 2,074 | 70 | |
| Franchise Group Inc. | 1,456 | 70 | |
| Haverty Furniture Cos. Inc. | 2,214 | 66 | |
| Johnson Outdoors Inc. Class A | 612 | 64 | |
| * | Stoneridge Inc. | 2,864 | 63 |
| Acushnet Holdings Corp. | 1,095 | 60 | |
| Winmark Corp. | 237 | 60 | |
| ViacomCBS Inc. Class A | 1,808 | 60 | |
| Genuine Parts Co. | 465 | 59 | |
| Penske Automotive Group Inc. | 577 | 57 | |
| Rollins Inc. | 1,641 | 55 | |
| * | Liberty Media Corp.- Liberty Braves Class C | 1,949 | 54 |
| News Corp. Class A | 2,466 | 53 | |
| * | Century Casinos Inc. | 4,016 | 52 |
| Travel + Leisure Co. | 1,024 | 50 | |
| * | PlayAGS Inc. | 6,745 | 49 |
| Service Corp. International | 740 | 49 | |
| EW Scripps Co. Class A | 2,597 | 48 | |
| Kimball International Inc. Class B | 4,183 | 43 | |
| National CineMedia Inc. | 15,218 | 43 | |
| Gentex Corp. | 1,221 | 42 | |
| * | Accel Entertainment Inc. Class A | 3,265 | 42 |
| * | Noodles & Co. Class A | 3,998 | 41 |
| * | Lands' End Inc. | 1,759 | 40 |
| * | MarineMax Inc. | 756 | 40 |
| Leggett & Platt Inc. | 953 | 39 | |
| * | Monarch Casino & Resort Inc. | 582 | 39 |
| Tilly's Inc. Class A | 2,593 | 39 | |
| Cato Corp. Class A | 2,280 | 38 | |
| Global Industrial Co. | 950 | 38 | |
| * | Arlo Technologies Inc. | 4,582 | 36 |
| Autoliv Inc. | 372 | 36 | |
| * | Cooper-Standard Holdings Inc. | 1,492 | 34 |
| * | IAA Inc. | 709 | 34 |
| Shares | Market Value• ($000) | ||
| Qurate Retail Inc. Series A | 4,284 | 34 | |
| * | Boston Omaha Corp. Class A | 1,145 | 33 |
| * | Chuy's Holdings Inc. | 1,141 | 33 |
| * | Duluth Holdings Inc. Class B | 2,365 | 33 |
| * | Universal Electronics Inc. | 843 | 31 |
| Wyndham Hotels & Resorts Inc. | 388 | 31 | |
| * | Lindblad Expeditions Holdings Inc. | 2,135 | 30 |
| Del Taco Restaurants Inc. | 3,836 | 29 | |
| Ethan Allen Interiors Inc. | 1,287 | 29 | |
| Scholastic Corp. | 768 | 29 | |
| * | Mesa Air Group Inc. | 4,027 | 28 |
| * | Floor & Decor Holdings Inc. Class A | 208 | 27 |
| Inter Parfums Inc. | 303 | 27 | |
| * | Entercom Communications Corp. Class A | 11,066 | 27 |
| * | Bright Horizons Family Solutions Inc. | 213 | 26 |
| * | Fox Factory Holding Corp. | 143 | 25 |
| * | Thryv Holdings Inc. | 629 | 25 |
| * | Bally's Corp. | 598 | 23 |
| * | Helen of Troy Ltd. | 93 | 22 |
| * | OneSpaWorld Holdings Ltd. | 2,344 | 22 |
| * | National Vision Holdings Inc. | 439 | 21 |
| * | PROG Holdings Inc. | 457 | 21 |
| * | Lovesac Co. | 315 | 20 |
| Marriott Vacations Worldwide Corp. | 131 | 20 | |
| * | Motorcar Parts of America Inc. | 1,275 | 20 |
| * | VOXX International Corp. Class A | 1,958 | 20 |
| Lennar Corp. Class B | 196 | 17 | |
| * | Chicken Soup For The Soul Entertainment Inc. | 1,275 | 17 |
| * | Lazydays Holdings Inc. | 855 | 17 |
| Carrols Restaurant Group Inc. | 5,330 | 15 | |
| * | Liberty TripAdvisor Holdings Inc. Class A | 6,765 | 15 |
| * | SiteOne Landscape Supply Inc. | 62 | 15 |
| HNI Corp. | 356 | 14 | |
| Rocky Brands Inc. | 391 | 14 | |
| * | Clear Channel Outdoor Holdings Inc. | 4,352 | 13 |
| * | El Pollo Loco Holdings Inc. | 1,004 | 13 |
| * | Viad Corp. | 316 | 13 |
| * | TravelCenters of America Inc. | 252 | 13 |
| Estee Lauder Cos. Inc. Class A | 36 | 12 | |
| * | O'Reilly Automotive Inc. | 18 | 11 |
| * | Clean Energy Fuels Corp. | 1,405 | 10 |
| * | Grand Canyon Education Inc. | 136 | 10 |
| 4,313 | |||
| Consumer Staples (3.2%) | |||
| Flowers Foods Inc. | 9,610 | 248 | |
| Brown-Forman Corp. Class A | 2,698 | 177 | |
| * | Darling Ingredients Inc. | 2,223 | 150 |
| Colgate-Palmolive Co. | 1,839 | 138 | |
| Philip Morris International Inc. | 1,549 | 133 | |
| * | Pilgrim's Pride Corp. | 3,426 | 96 |
| Kimberly-Clark Corp. | 643 | 84 | |
| Weis Markets Inc. | 1,325 | 83 | |
| Seaboard Corp. | 20 | 78 | |
| Keurig Dr Pepper Inc. | 2,193 | 75 | |
| Casey's General Stores Inc. | 284 | 55 | |
| Brown-Forman Corp. Class B | 596 | 42 | |
| Sysco Corp. | 583 | 41 | |
| Shares | Market Value• ($000) | ||
| Andersons Inc. | 1,031 | 35 | |
| Ingredion Inc. | 338 | 32 | |
| ACCO Brands Corp. | 3,700 | 31 | |
| Altria Group Inc. | 545 | 23 | |
| * | Performance Food Group Co. | 542 | 22 |
| SpartanNash Co. | 885 | 21 | |
| * | Mission Produce Inc. | 1,202 | 21 |
| * | Post Holdings Inc. | 201 | 19 |
| * | Freshpet Inc. | 161 | 17 |
| * | Laird Superfood Inc. | 1,207 | 16 |
| Lancaster Colony Corp. | 88 | 13 | |
| Fresh Del Monte Produce Inc. | 512 | 13 | |
| 1,663 | |||
| Energy (2.2%) | |||
| New Fortress Energy Inc. Class A | 3,214 | 80 | |
| * | Select Energy Services Inc. Class A | 12,094 | 69 |
| * | CONSOL Energy Inc. | 3,049 | 67 |
| Berry Corp. | 7,669 | 62 | |
| * | Dril-Quip Inc. | 3,205 | 61 |
| Solaris Oilfield Infrastructure Inc. Class A | 8,445 | 58 | |
| * | Liberty Oilfield Services Inc. Class A | 6,171 | 57 |
| * | National Energy Services Reunited Corp. | 5,641 | 56 |
| * | Expro Group Holdings NV | 3,967 | 56 |
| * | Centrus Energy Corp. Class A | 921 | 51 |
| * | RPC Inc. | 12,545 | 51 |
| Civitas Resources Inc. | 1,004 | 51 | |
| * | Bristow Group Inc. | 1,510 | 45 |
| Archrock Inc. | 5,642 | 42 | |
| * | Newpark Resources Inc. | 13,490 | 37 |
| * | Oil States International Inc. | 7,322 | 37 |
| Texas Pacific Land Corp. | 30 | 36 | |
| EOG Resources Inc. | 407 | 35 | |
| SunCoke Energy Inc. | 5,664 | 34 | |
| * | Talos Energy Inc. | 2,881 | 29 |
| * | MRC Global Inc. | 4,001 | 28 |
| * | FTS International Inc. Class A | 745 | 20 |
| * | Comstock Resources Inc. | 1,791 | 14 |
| * | Par Pacific Holdings Inc. | 1,044 | 14 |
| * | DMC Global Inc. | 266 | 10 |
| * | Contango Oil & Gas Co. | 2,622 | 9 |
| 1,109 | |||
| Financials (24.5%) | |||
| Marsh & McLennan Cos. Inc. | 3,804 | 624 | |
| Moody's Corp. | 1,453 | 568 | |
| T Rowe Price Group Inc. | 2,154 | 431 | |
| Blackstone Inc. | 2,379 | 336 | |
| Truist Financial Corp. | 5,435 | 322 | |
| Chubb Ltd. | 1,652 | 296 | |
| Intercontinental Exchange Inc. | 2,188 | 286 | |
| Progressive Corp. | 2,759 | 256 | |
| MSCI Inc. Class A | 387 | 244 | |
| Bank of New York Mellon Corp. | 4,312 | 236 | |
| US Bancorp | 3,368 | 186 | |
| BlackRock Inc. | 196 | 177 | |
| PNC Financial Services Group Inc. | 860 | 169 | |
| Prosperity Bancshares Inc. | 2,345 | 167 | |
| CME Group Inc. | 744 | 164 | |
| Erie Indemnity Co. Class A | 882 | 164 | |
| Aon plc Class A (XNYS) | 529 | 156 | |
| Axis Capital Holdings Ltd. | 3,095 | 154 | |
| Shares | Market Value• ($000) | ||
| Primerica Inc. | 989 | 146 | |
| First Citizens BancShares Inc. Class A | 179 | 144 | |
| Brown & Brown Inc. | 2,150 | 138 | |
| SouthState Corp. | 1,681 | 131 | |
| * | Customers Bancorp Inc. | 2,214 | 128 |
| S&P Global Inc. | 282 | 128 | |
| East West Bancorp Inc. | 1,647 | 127 | |
| MetLife Inc. | 2,153 | 126 | |
| Morningstar Inc. | 400 | 124 | |
| RLI Corp. | 1,182 | 121 | |
| Stifel Financial Corp. | 1,702 | 121 | |
| American International Group Inc. | 2,223 | 117 | |
| Pinnacle Financial Partners Inc. | 1,184 | 113 | |
| Glacier Bancorp Inc. | 1,958 | 106 | |
| Hanmi Financial Corp. | 4,715 | 106 | |
| ConnectOne Bancorp Inc. | 3,153 | 102 | |
| Live Oak Bancshares Inc. | 1,130 | 101 | |
| Universal Insurance Holdings Inc. | 6,664 | 100 | |
| First Financial Bankshares Inc. | 1,991 | 99 | |
| Popular Inc. | 1,265 | 98 | |
| Selective Insurance Group Inc. | 1,297 | 98 | |
| United Bankshares Inc. | 2,731 | 98 | |
| * | Triumph Bancorp Inc. | 759 | 97 |
| Berkshire Hills Bancorp Inc. | 3,500 | 93 | |
| Kemper Corp. | 1,648 | 91 | |
| Commerce Bancshares Inc. | 1,293 | 90 | |
| Premier Financial Corp. | 2,847 | 84 | |
| Valley National Bancorp | 6,143 | 83 | |
| United Fire Group Inc. | 3,797 | 79 | |
| Trustmark Corp. | 2,424 | 74 | |
| HCI Group Inc. | 648 | 72 | |
| Hanover Insurance Group Inc. | 595 | 72 | |
| Heritage Financial Corp. | 3,071 | 72 | |
| * | Enstar Group Ltd. | 323 | 72 |
| Lazard Ltd. Class A | 1,680 | 72 | |
| Old Republic International Corp. | 2,931 | 70 | |
| Janus Henderson Group plc | 1,538 | 66 | |
| B Riley Financial Inc. | 839 | 65 | |
| Provident Financial Services Inc. | 2,757 | 65 | |
| Univest Financial Corp. | 2,347 | 65 | |
| BOK Financial Corp. | 616 | 64 | |
| Western Alliance Bancorp | 576 | 63 | |
| Synovus Financial Corp. | 1,373 | 62 | |
| Washington Trust Bancorp Inc. | 1,133 | 61 | |
| TFS Financial Corp. | 3,337 | 60 | |
| * | Markel Corp. | 49 | 59 |
| * | Nicolet Bankshares Inc. | 824 | 59 |
| TrustCo Bank Corp. NY | 1,818 | 59 | |
| First American Financial Corp. | 782 | 58 | |
| First Financial Bancorp | 2,517 | 58 | |
| Northfield Bancorp Inc. | 3,466 | 58 | |
| Hope Bancorp Inc. | 3,976 | 57 | |
| First Foundation Inc. | 2,194 | 56 | |
| Globe Life Inc. | 643 | 56 | |
| QCR Holdings Inc. | 1,047 | 56 | |
| ServisFirst Bancshares Inc. | 678 | 54 | |
| * | Bancorp Inc. | 1,876 | 53 |
| Central Pacific Financial Corp. | 1,965 | 53 | |
| SLM Corp. | 2,955 | 53 | |
| Federal Agricultural Mortgage Corp. Class C | 425 | 52 | |
| Jefferies Financial Group Inc. | 1,387 | 52 |
| Shares | Market Value• ($000) | ||
| Essent Group Ltd. | 1,250 | 52 | |
| First Commonwealth Financial Corp. | 3,396 | 51 | |
| Merchants Bancorp | 1,126 | 51 | |
| * | Assetmark Financial Holdings Inc. | 1,983 | 50 |
| Cullen/Frost Bankers Inc. | 392 | 49 | |
| Lakeland Financial Corp. | 693 | 49 | |
| Stock Yards Bancorp Inc. | 821 | 49 | |
| * | Columbia Financial Inc. | 2,615 | 48 |
| 1st Source Corp. | 1,009 | 47 | |
| Tompkins Financial Corp. | 605 | 47 | |
| Cohen & Steers Inc. | 510 | 46 | |
| SEI Investments Co. | 771 | 46 | |
| HomeStreet Inc. | 921 | 45 | |
| Brightsphere Investment Group Inc. | 1,508 | 45 | |
| * | StoneX Group Inc. | 800 | 45 |
| Heritage Commerce Corp. | 3,998 | 44 | |
| Nelnet Inc. Class A | 505 | 44 | |
| First Bancorp Inc. (XNMS) | 1,112 | 43 | |
| Park National Corp. | 327 | 43 | |
| Loews Corp. | 785 | 42 | |
| LPL Financial Holdings Inc. | 260 | 41 | |
| Equitable Holdings Inc. | 1,317 | 41 | |
| Interactive Brokers Group Inc. Class A | 538 | 40 | |
| First Bancorp (XNGS) | 869 | 39 | |
| Origin Bancorp Inc. | 928 | 39 | |
| TriCo Bancshares | 922 | 39 | |
| FB Financial Corp. | 873 | 37 | |
| Preferred Bank | 537 | 37 | |
| Towne Bank | 1,210 | 37 | |
| Banner Corp. | 621 | 36 | |
| MGIC Investment Corp. | 2,522 | 36 | |
| Peoples Bancorp Inc. | 1,157 | 36 | |
| Southside Bancshares Inc. | 863 | 35 | |
| Dime Community Bancshares Inc. | 1,012 | 35 | |
| American Financial Group Inc. | 253 | 34 | |
| Curo Group Holdings Corp. | 2,029 | 34 | |
| First Merchants Corp. | 824 | 33 | |
| Reinsurance Group of America Inc. | 351 | 33 | |
| * | EZCorp. Inc. Class A | 4,150 | 31 |
| PJT Partners Inc. Class A | 405 | 31 | |
| ProAssurance Corp. | 1,340 | 31 | |
| * | Focus Financial Partners Inc. Class A | 491 | 30 |
| Carlyle Group Inc. | 542 | 30 | |
| Atlantic Union Bankshares Corp. | 887 | 29 | |
| First Busey Corp. | 1,136 | 29 | |
| * | Finance of America Cos. Inc. Class A | 7,173 | 29 |
| Northwest Bancshares Inc. | 2,089 | 28 | |
| Safety Insurance Group Inc. | 359 | 28 | |
| Sandy Spring Bancorp Inc. | 589 | 28 | |
| Bank of NT Butterfield & Son Ltd. | 766 | 28 | |
| * | Alleghany Corp. | 40 | 26 |
| * | SiriusPoint Ltd. | 3,340 | 26 |
| National Bank Holdings Corp. Class A | 587 | 25 | |
| OceanFirst Financial Corp. | 1,201 | 25 | |
| S&T Bancorp Inc. | 839 | 25 | |
| Unum Group | 1,074 | 25 | |
| Banc of California Inc. | 1,226 | 24 |
| Shares | Market Value• ($000) | ||
| * | Enova International Inc. | 639 | 24 |
| Hamilton Lane Inc. Class A | 225 | 24 | |
| City Holding Co. | 271 | 21 | |
| Kearny Financial Corp. | 1,568 | 20 | |
| Greenhill & Co. Inc. | 1,125 | 19 | |
| * | Arch Capital Group Ltd. | 472 | 19 |
| BancFirst Corp. | 279 | 18 | |
| Bank OZK | 409 | 18 | |
| Enterprise Financial Services Corp. | 392 | 18 | |
| Heartland Financial USA Inc. | 329 | 16 | |
| Radian Group Inc. | 766 | 16 | |
| * | Credit Acceptance Corp. | 22 | 14 |
| International Bancshares Corp. | 327 | 14 | |
| OFG Bancorp | 583 | 14 | |
| Byline Bancorp Inc. | 492 | 13 | |
| WisdomTree Investments Inc. | 2,100 | 13 | |
| Assured Guaranty Ltd. | 275 | 13 | |
| FNB Corp. | 945 | 11 | |
| Lakeland Bancorp Inc. | 631 | 11 | |
| 12,535 | |||
| Health Care (18.6%) | |||
| * | Edwards Lifesciences Corp. | 4,994 | 536 |
| Zoetis Inc. | 2,099 | 466 | |
| * | IDEXX Laboratories Inc. | 639 | 389 |
| * | IQVIA Holdings Inc. | 1,486 | 385 |
| HCA Healthcare Inc. | 1,650 | 372 | |
| Agilent Technologies Inc. | 2,429 | 367 | |
| Stryker Corp. | 1,476 | 349 | |
| Baxter International Inc. | 2,045 | 152 | |
| * | Veeva Systems Inc. Class A | 479 | 135 |
| Ensign Group Inc. | 1,697 | 130 | |
| * | Neogen Corp. | 2,980 | 120 |
| Premier Inc. Class A | 3,127 | 116 | |
| Bio-Techne Corp. | 243 | 115 | |
| * | Crinetics Pharmaceuticals Inc. | 3,859 | 105 |
| Bruker Corp. | 1,265 | 102 | |
| * | Denali Therapeutics Inc. | 2,071 | 96 |
| * | AngioDynamics Inc. | 3,698 | 95 |
| * | Catalent Inc. | 738 | 95 |
| * | Integra LifeSciences Holdings Corp. | 1,483 | 95 |
| National HealthCare Corp. | 1,474 | 95 | |
| * | CureVac NV | 1,977 | 95 |
| * | Syneos Health Inc. | 941 | 91 |
| * | Acadia Healthcare Co. Inc. | 1,537 | 86 |
| * | Charles River Laboratories International Inc. | 221 | 81 |
| * | CorVel Corp. | 431 | 81 |
| Chemed Corp. | 168 | 78 | |
| Becton Dickinson and Co. | 313 | 74 | |
| * | Hanger Inc. | 4,415 | 74 |
| * | Acutus Medical Inc. | 20,801 | 69 |
| * | Bridgebio Pharma Inc. | 1,688 | 68 |
| * | Option Care Health Inc. | 2,559 | 65 |
| * | Oak Street Health Inc. | 2,073 | 64 |
| * | Stoke Therapeutics Inc. | 2,462 | 61 |
| * | Globus Medical Inc. Class A | 952 | 60 |
| * | Boston Scientific Corp. | 1,560 | 59 |
| * | RadNet Inc. | 2,177 | 59 |
| * | Morphic Holding Inc. | 1,247 | 59 |
| * | Computer Programs and Systems Inc. | 1,965 | 58 |
| * | Accelerate Diagnostics Inc. | 11,323 | 57 |
| * | Aligos Therapeutics Inc. | 3,715 | 57 |
| * | Inhibrx Inc. | 1,395 | 56 |
| * | Ultragenyx Pharmaceutical Inc. | 730 | 55 |
| Shares | Market Value• ($000) | ||
| * | Alnylam Pharmaceuticals Inc. | 287 | 53 |
| * | CytoSorbents Corp. | 10,764 | 53 |
| Atrion Corp. | 73 | 52 | |
| * | ModivCare Inc. | 369 | 51 |
| * | Joint Corp. | 629 | 50 |
| * | NGM Biopharmaceuticals Inc. | 2,801 | 50 |
| * | Mirum Pharmaceuticals Inc. | 3,547 | 50 |
| * | Pulse Biosciences Inc. | 2,421 | 49 |
| * | Stereotaxis Inc. | 8,197 | 48 |
| * | Taysha Gene Therapies Inc. | 3,726 | 48 |
| * | Avid Bioservices Inc. | 1,523 | 47 |
| * | Eiger BioPharmaceuticals Inc. | 7,545 | 46 |
| * | Cogent Biosciences Inc. | 5,839 | 46 |
| * | Affimed NV | 6,510 | 44 |
| * | BioLife Solutions Inc. | 1,121 | 43 |
| * | Blueprint Medicines Corp. | 445 | 43 |
| * | Rapt Therapeutics Inc. | 1,332 | 43 |
| * | Aspira Women's Health Inc. | 20,849 | 43 |
| * | Exelixis Inc. | 2,513 | 42 |
| LeMaitre Vascular Inc. | 870 | 41 | |
| * | Omnicell Inc. | 233 | 41 |
| * | Kronos Bio Inc. | 3,512 | 41 |
| Anthem Inc. | 98 | 40 | |
| * | Evelo Biosciences Inc. | 4,586 | 40 |
| * | SOC Telemed Inc. Class A | 19,715 | 40 |
| * | Applied Therapeutics Inc. | 3,389 | 39 |
| * | 89bio Inc. | 2,973 | 39 |
| * | Immunic Inc. | 4,542 | 39 |
| * | NeoGenomics Inc. | 1,099 | 38 |
| * | Surgery Partners Inc. | 867 | 38 |
| * | Cue Biopharma Inc. | 3,004 | 37 |
| * | Geron Corp. (XNGS) | 25,120 | 37 |
| * | Rocket Pharmaceuticals Inc. | 1,526 | 37 |
| * | Surmodics Inc. | 844 | 37 |
| * | HealthEquity Inc. | 660 | 36 |
| * | ICU Medical Inc. | 157 | 36 |
| * | Novocure Ltd. | 381 | 36 |
| * | Relmada Therapeutics Inc. | 1,990 | 36 |
| * | iTeos Therapeutics Inc. | 1,034 | 36 |
| * | Vaxcyte Inc. | 1,752 | 36 |
| * | Align Technology Inc. | 57 | 35 |
| * | Molecular Templates Inc. | 8,694 | 35 |
| * | Passage Bio Inc. | 4,858 | 35 |
| * | Allovir Inc. | 2,023 | 35 |
| * | HealthStream Inc. | 1,477 | 34 |
| * | Annexon Inc. | 2,058 | 34 |
| * | Orthofix Medical Inc. | 1,081 | 33 |
| * | Alphatec Holdings Inc. | 2,905 | 32 |
| * | Axogen Inc. | 3,340 | 32 |
| * | Heska Corp. | 201 | 32 |
| * | Jounce Therapeutics Inc. | 4,152 | 32 |
| * | MEI Pharma Inc. | 9,512 | 32 |
| * | Arcus Biosciences Inc. | 697 | 31 |
| * | MannKind Corp. | 6,682 | 31 |
| * | OrthoPediatrics Corp. | 564 | 31 |
| * | Ionis Pharmaceuticals Inc. | 1,115 | 30 |
| * | Neoleukin Therapeutics Inc. | 5,547 | 30 |
| * | ORIC Pharmaceuticals Inc. | 2,188 | 30 |
| * | Praxis Precision Medicines Inc. | 1,681 | 29 |
| * | Paratek Pharmaceuticals Inc. | 6,538 | 28 |
| * | TransMedics Group Inc. | 1,274 | 28 |
| * | Prothena Corp. plc | 551 | 28 |
| * | Harpoon Therapeutics Inc. | 4,575 | 28 |
| * | iCAD Inc. | 3,790 | 28 |
| * | DarioHealth Corp. | 1,811 | 28 |
| * | SpringWorks Therapeutics Inc. | 370 | 27 |
| Shares | Market Value• ($000) | ||
| * | Arrowhead Pharmaceuticals Inc. | 373 | 26 |
| * | Natera Inc. | 287 | 26 |
| * | Accuray Inc. | 5,168 | 25 |
| * | Athersys Inc. | 23,540 | 25 |
| * | Fortress Biotech Inc. | 8,817 | 25 |
| * | Gossamer Bio Inc. | 2,314 | 25 |
| * | Quanterix Corp. | 633 | 25 |
| * | SI-BONE Inc. | 1,315 | 25 |
| * | Shattuck Labs Inc. | 2,829 | 24 |
| * | Antares Pharma Inc. | 7,030 | 23 |
| * | Marinus Pharmaceuticals Inc. | 2,112 | 23 |
| * | DexCom Inc. | 39 | 22 |
| * | Avidity Biosciences Inc. | 1,008 | 22 |
| * | Keros Therapeutics Inc. | 387 | 22 |
| * | Harmony Biosciences Holdings Inc. | 654 | 22 |
| * | CryoLife Inc. | 1,207 | 21 |
| * | Cymabay Therapeutics Inc. | 6,332 | 21 |
| * | Lineage Cell Therapeutics Inc. | 9,238 | 21 |
| * | Atreca Inc. Class A | 5,721 | 21 |
| * | Spero Therapeutics Inc. | 1,474 | 21 |
| * | Viemed Healthcare Inc. | 4,102 | 21 |
| * | Cutera Inc. | 567 | 20 |
| * | Haemonetics Corp. | 384 | 20 |
| * | Ideaya Biosciences Inc. | 921 | 20 |
| * | Amedisys Inc. | 133 | 19 |
| * | SeaSpine Holdings Corp. | 1,401 | 19 |
| * | Theravance Biopharma Inc. | 2,269 | 19 |
| * | UroGen Pharma Ltd. | 1,451 | 18 |
| * | Dyne Therapeutics Inc. | 1,201 | 17 |
| * | Gemini Therapeutics Inc. | 6,034 | 17 |
| * | Puma Biotechnology Inc. | 5,027 | 16 |
| * | Sientra Inc. | 3,975 | 16 |
| * | WaVe Life Sciences Ltd. | 4,104 | 16 |
| * | Chinook Therapeutics Inc. | 973 | 16 |
| * | Nuvation Bio Inc. | 1,743 | 16 |
| * | Homology Medicines Inc. | 2,925 | 15 |
| * | Natus Medical Inc. | 653 | 15 |
| *,1 | PDL BioPharma Inc. | 6,046 | 15 |
| PerkinElmer Inc. | 80 | 15 | |
| * | Poseida Therapeutics Inc. | 2,126 | 15 |
| * | Rubius Therapeutics Inc. | 1,097 | 14 |
| * | BeyondSpring Inc. | 1,091 | 14 |
| * | Precigen Inc. | 3,581 | 14 |
| * | Arcutis Biotherapeutics Inc. | 847 | 14 |
| * | Generation Bio Co. | 836 | 14 |
| * | Amphastar Pharmaceuticals Inc. | 686 | 13 |
| * | BioDelivery Sciences International Inc. | 4,544 | 13 |
| * | Inspire Medical Systems Inc. | 59 | 13 |
| * | Rhythm Pharmaceuticals Inc. | 1,442 | 13 |
| * | Rigel Pharmaceuticals Inc. | 4,831 | 13 |
| * | MiMedx Group Inc. | 1,833 | 13 |
| * | Satsuma Pharmaceuticals Inc. | 2,759 | 13 |
| * | Olema Pharmaceuticals Inc. | 1,521 | 13 |
| * | Meridian Bioscience Inc. | 604 | 12 |
| * | Syros Pharmaceuticals Inc. | 2,959 | 12 |
| * | Inotiv Inc. | 233 | 12 |
| * | IntriCon Corp. | 684 | 11 |
| * | Ocular Therapeutix Inc. | 1,564 | 11 |
| * | ViewRay Inc. | 2,229 | 11 |
| * | CorMedix Inc. | 2,023 | 10 |
| * | GlycoMimetics Inc. | 5,974 | 10 |
| * | Pliant Therapeutics Inc. | 734 | 10 |
| * | Quotient Ltd. | 4,713 | 10 |
| Shares | Market Value• ($000) | ||
| * | GT Biopharma Inc. | 2,547 | 10 |
| * | Iovance Biotherapeutics Inc. | 457 | 9 |
| * | Solid Biosciences Inc. | 5,000 | 9 |
| * | Y-mAbs Therapeutics Inc. | 499 | 9 |
| * | Biohaven Pharmaceutical Holding Co. Ltd. | 84 | 9 |
| Perrigo Co. plc | 242 | 9 | |
| * | Akouos Inc. | 1,145 | 9 |
| * | Avita Medical Inc. | 646 | 9 |
| * | Ampio Pharmaceuticals Inc. | 7,372 | 8 |
| * | Invacare Corp. | 2,489 | 7 |
| * | Trevena Inc. | 10,094 | 7 |
| * | TG Therapeutics Inc. | 356 | 5 |
| 9,524 | |||
| Industrials (22.6%) | |||
| Illinois Tool Works Inc. | 2,698 | 626 | |
| Eaton Corp. plc | 2,587 | 419 | |
| General Dynamics Corp. | 2,015 | 381 | |
| Capital One Financial Corp. | 2,484 | 349 | |
| Emerson Electric Co. | 3,866 | 340 | |
| HEICO Corp. Class A | 1,966 | 244 | |
| Trane Technologies plc | 1,211 | 226 | |
| Accenture plc Class A | 613 | 219 | |
| Automatic Data Processing Inc. | 806 | 186 | |
| Deere & Co. | 504 | 174 | |
| Exponent Inc. | 1,492 | 174 | |
| Helios Technologies Inc. | 1,567 | 157 | |
| Johnson Controls International plc | 2,065 | 154 | |
| Kronos Worldwide Inc. | 10,276 | 144 | |
| * | Donnelley Financial Solutions Inc. | 2,937 | 137 |
| * | Cross Country Healthcare Inc. | 5,148 | 135 |
| * | ASGN Inc. | 1,110 | 135 |
| nVent Electric plc | 3,841 | 134 | |
| Tetra Tech Inc. | 702 | 130 | |
| Regal Rexnord Corp. | 812 | 128 | |
| Curtiss-Wright Corp. | 978 | 123 | |
| Sonoco Products Co. | 2,047 | 119 | |
| Donaldson Co. Inc. | 2,080 | 117 | |
| * | Paylocity Holding Corp. | 465 | 117 |
| MSA Safety Inc. | 791 | 113 | |
| Norfolk Southern Corp. | 419 | 111 | |
| ArcBest Corp. | 1,014 | 105 | |
| Nordson Corp. | 413 | 105 | |
| * | MYR Group Inc. | 929 | 103 |
| Littelfuse Inc. | 335 | 100 | |
| * | ACI Worldwide Inc. | 3,379 | 99 |
| Lincoln Electric Holdings Inc. | 734 | 99 | |
| * | Cornerstone Building Brands Inc. | 6,196 | 97 |
| John Bean Technologies Corp. | 599 | 95 | |
| Resources Connection Inc. | 5,418 | 93 | |
| Air Lease Corp. Class A | 2,214 | 90 | |
| Douglas Dynamics Inc. | 2,192 | 87 | |
| L3Harris Technologies Inc. | 412 | 86 | |
| * | Trimble Inc. | 989 | 85 |
| * | AECOM | 1,224 | 84 |
| * | Covenant Logistics Group Inc. Class A | 3,304 | 83 |
| Crane Co. | 859 | 83 | |
| Graco Inc. | 1,127 | 82 | |
| Apogee Enterprises Inc. | 1,969 | 81 | |
| BWX Technologies Inc. | 1,675 | 80 | |
| Herc Holdings Inc. | 437 | 75 | |
| * | Textainer Group Holdings Ltd. | 2,294 | 75 |
| Northrop Grumman Corp. | 213 | 74 | |
| Shares | Market Value• ($000) | ||
| Maximus Inc. | 973 | 73 | |
| TTEC Holdings Inc. | 869 | 73 | |
| Encore Wire Corp. | 510 | 72 | |
| AGCO Corp. | 642 | 71 | |
| * | Napco Security Technologies Inc. | 1,494 | 69 |
| EMCOR Group Inc. | 573 | 68 | |
| * | Teledyne Technologies Inc. | 160 | 67 |
| * | Vivint Smart Home Inc. | 6,307 | 67 |
| * | BlueLinx Holdings Inc. | 916 | 65 |
| * | Willdan Group Inc. | 1,619 | 65 |
| * | Ducommun Inc. | 1,500 | 64 |
| * | Gates Industrial Corp. plc | 3,945 | 63 |
| * | Daseke Inc. | 6,362 | 61 |
| Simpson Manufacturing Co. Inc. | 521 | 60 | |
| MKS Instruments Inc. | 384 | 59 | |
| * | Sterling Construction Co. Inc. | 2,270 | 59 |
| CSW Industrials Inc. | 484 | 58 | |
| ITT Inc. | 616 | 58 | |
| REV Group Inc. | 3,693 | 58 | |
| Chase Corp. | 579 | 57 | |
| Valmont Industries Inc. | 232 | 56 | |
| Pactiv Evergreen Inc. | 4,475 | 56 | |
| Cognex Corp. | 708 | 55 | |
| Cass Information Systems Inc. | 1,325 | 53 | |
| * | DXP Enterprises Inc. | 1,922 | 53 |
| AptarGroup Inc. | 435 | 52 | |
| * | Construction Partners Inc. Class A | 1,506 | 52 |
| Griffon Corp. | 1,977 | 52 | |
| * | AerCap Holdings NV | 923 | 52 |
| RPM International Inc. | 531 | 48 | |
| * | CBIZ Inc. | 1,309 | 47 |
| Genpact Ltd. | 947 | 46 | |
| Genco Shipping & Trading Ltd. | 2,972 | 46 | |
| * | Teekay Corp. | 13,958 | 46 |
| Kaman Corp. | 1,215 | 45 | |
| Myers Industries Inc. | 2,305 | 45 | |
| International Seaways Inc. | 3,091 | 45 | |
| * | Great Lakes Dredge & Dock Corp. | 2,978 | 44 |
| Kelly Services Inc. Class A | 2,626 | 44 | |
| * | Atlanticus Holdings Corp. | 744 | 44 |
| Carrier Global Corp. | 785 | 43 | |
| Franklin Electric Co. Inc. | 477 | 42 | |
| Textron Inc. | 593 | 42 | |
| Woodward Inc. | 396 | 42 | |
| * | Axon Enterprise Inc. | 245 | 41 |
| * | BrightView Holdings Inc. | 3,045 | 41 |
| EnPro Industries Inc. | 399 | 41 | |
| Xylem Inc. | 341 | 41 | |
| * | International Money Express Inc. | 2,698 | 41 |
| Columbus McKinnon Corp. | 888 | 40 | |
| Kforce Inc. | 515 | 40 | |
| Zurn Water Solutions Corp. | 1,142 | 40 | |
| Ennis Inc. | 2,030 | 39 | |
| * | Thermon Group Holdings Inc. | 2,248 | 39 |
| * | US Xpress Enterprises Inc. Class A | 4,920 | 39 |
| Wabash National Corp. | 2,315 | 39 | |
| * | Euronet Worldwide Inc. | 369 | 37 |
| * | Vectrus Inc. | 873 | 37 |
| Pentair plc | 503 | 37 | |
| * | Advantage Solutions Inc. | 5,162 | 37 |
| Kadant Inc. | 155 | 36 |
| Shares | Market Value• ($000) | ||
| AAON Inc. | 455 | 36 | |
| Barrett Business Services Inc. | 493 | 35 | |
| * | FARO Technologies Inc. | 510 | 35 |
| * | Sensata Technologies Holding plc | 634 | 35 |
| * | CIRCOR International Inc. | 1,247 | 34 |
| Hubbell Inc. Class B | 175 | 34 | |
| * | Modine Manufacturing Co. | 3,300 | 34 |
| * | Tutor Perini Corp. | 2,593 | 33 |
| * | Byrna Technologies Inc. | 2,231 | 33 |
| Astec Industries Inc. | 507 | 32 | |
| * | IES Holdings Inc. | 667 | 32 |
| Marten Transport Ltd. | 1,974 | 32 | |
| TriMas Corp. | 958 | 32 | |
| Carlisle Cos. Inc. | 139 | 31 | |
| Landstar System Inc. | 179 | 30 | |
| Quanex Building Products Corp. | 1,398 | 30 | |
| Tennant Co. | 365 | 29 | |
| * | Gibraltar Industries Inc. | 411 | 28 |
| Watsco Inc. | 96 | 28 | |
| * | ExlService Holdings Inc. | 208 | 27 |
| Eagle Materials Inc. | 168 | 26 | |
| * | Franklin Covey Co. | 600 | 26 |
| * | Forrester Research Inc. | 438 | 25 |
| ManpowerGroup Inc. | 273 | 25 | |
| * | Astronics Corp. | 2,253 | 24 |
| * | Manitowoc Co. Inc. | 1,277 | 24 |
| McGrath RentCorp. | 315 | 24 | |
| * | AMN Healthcare Services Inc. | 214 | 24 |
| Sealed Air Corp. | 373 | 23 | |
| * | Energy Recovery Inc. | 1,054 | 22 |
| * | Ranpak Holdings Corp. Class A | 534 | 21 |
| * | SP Plus Corp. | 788 | 21 |
| * | Blue Bird Corp. | 1,001 | 20 |
| DuPont de Nemours Inc. | 275 | 20 | |
| Toro Co. | 196 | 20 | |
| Acuity Brands Inc. | 96 | 19 | |
| * | Veritiv Corp. | 153 | 19 |
| Heidrick & Struggles International Inc. | 409 | 18 | |
| * | Air Transport Services Group Inc. | 677 | 17 |
| * | Titan International Inc. | 2,504 | 17 |
| Advanced Drainage Systems Inc. | 122 | 15 | |
| * | Commercial Vehicle Group Inc. | 1,789 | 15 |
| Sherwin-Williams Co. | 45 | 15 | |
| Standex International Corp. | 143 | 15 | |
| * | TopBuild Corp. | 57 | 15 |
| Primoris Services Corp. | 622 | 14 | |
| Armstrong World Industries Inc. | 117 | 12 | |
| Mueller Water Products Inc. Class A | 873 | 12 | |
| Park Aerospace Corp. | 897 | 12 | |
| * | GreenBox POS | 2,067 | 11 |
| * | Huron Consulting Group Inc. | 220 | 10 |
| * | BM Technologies Inc. (XASE) | 367 | 4 |
| 11,580 | |||
| Real Estate (0.9%) | |||
| Newmark Group Inc. Class A | 6,612 | 106 | |
| St. Joe Co. | 1,732 | 83 | |
| * | Cushman & Wakefield plc | 4,444 | 79 |
| * | CBRE Group Inc. Class A | 472 | 45 |
| RE/MAX Holdings Inc. Class A | 1,182 | 33 | |
| * | Fathom Holdings Inc. | 1,315 | 31 |
| Shares | Market Value• ($000) | ||
| * | Forestar Group Inc. | 1,431 | 28 |
| * | Marcus & Millichap Inc. | 624 | 27 |
| RMR Group Inc. Class A | 429 | 14 | |
| 446 | |||
| Technology (10.5%) | |||
| Amphenol Corp. Class A | 7,407 | 597 | |
| * | Synopsys Inc. | 1,294 | 441 |
| Roper Technologies Inc. | 804 | 373 | |
| * | Cadence Design Systems Inc. | 1,936 | 344 |
| Cognizant Technology Solutions Corp. Class A | 2,202 | 172 | |
| TE Connectivity Ltd. | 942 | 145 | |
| * | Novanta Inc. | 750 | 121 |
| National Instruments Corp. | 2,814 | 117 | |
| * | Manhattan Associates Inc. | 663 | 104 |
| Monolithic Power Systems Inc. | 173 | 96 | |
| Pegasystems Inc. | 792 | 91 | |
| Analog Devices Inc. | 473 | 85 | |
| * | EPAM Systems Inc. | 139 | 85 |
| Dolby Laboratories Inc. Class A | 971 | 81 | |
| Science Applications International Corp. | 971 | 81 | |
| * | Clarivate plc | 3,105 | 72 |
| * | Axcelis Technologies Inc. | 1,136 | 70 |
| * | Agilysys Inc. | 1,577 | 69 |
| CDK Global Inc. | 1,794 | 69 | |
| * | Digimarc Corp. | 1,542 | 66 |
| * | Avid Technology Inc. | 2,033 | 65 |
| * | Tucows Inc. Class A | 795 | 65 |
| * | Grid Dynamics Holdings Inc. | 1,651 | 65 |
| A10 Networks Inc. | 4,155 | 64 | |
| * | Globant SA | 243 | 64 |
| American Software Inc. Class A | 2,779 | 63 | |
| * | Cohu Inc. | 1,910 | 63 |
| * | MaxLinear Inc. | 908 | 61 |
| * | Alarm.com Holdings Inc. | 723 | 58 |
| * | Ceridian HCM Holding Inc. | 524 | 57 |
| TD SYNNEX Corp. | 544 | 56 | |
| Sapiens International Corp. NV | 1,472 | 52 | |
| * | Arrow Electronics Inc. | 417 | 51 |
| * | Black Knight Inc. | 699 | 50 |
| * | CACI International Inc. Class A | 187 | 49 |
| CMC Materials Inc. | 370 | 49 | |
| * | PDF Solutions Inc. | 1,567 | 47 |
| Power Integrations Inc. | 474 | 47 | |
| PC Connection Inc. | 1,047 | 46 | |
| * | CEVA Inc. | 1,006 | 44 |
| Amkor Technology Inc. | 1,973 | 43 | |
| * | Quantum Corp. | 7,909 | 43 |
| CTS Corp. | 1,216 | 42 | |
| * | NCR Corp. | 1,041 | 41 |
| KLA Corp. | 96 | 39 | |
| Brooks Automation Inc. | 333 | 38 | |
| * | Veeco Instruments Inc. | 1,430 | 38 |
| Jabil Inc. | 623 | 36 | |
| Bentley Systems Inc. Class B | 742 | 36 | |
| * | SPS Commerce Inc. | 247 | 35 |
| * | Envestnet Inc. | 433 | 33 |
| Hackett Group Inc. | 1,615 | 33 | |
| Intuit Inc. | 50 | 33 | |
| * | comScore Inc. | 8,938 | 31 |
| Entegris Inc. | 215 | 31 | |
| * | OneSpan Inc. | 1,662 | 28 |
| * | Q2 Holdings Inc. | 349 | 28 |
| * | Rimini Street Inc. | 4,224 | 28 |
| * | ScanSource Inc. | 910 | 28 |
| Shares | Market Value• ($000) | ||
| Simulations Plus Inc. | 585 | 28 | |
| * | Mitek Systems Inc. | 1,431 | 25 |
| * | Photronics Inc. | 1,798 | 24 |
| * | Mediaalpha Inc. Class A | 1,554 | 24 |
| * | eGain Corp. | 2,080 | 22 |
| Methode Electronics Inc. | 482 | 21 | |
| * | FormFactor Inc. | 445 | 19 |
| * | Kimball Electronics Inc. | 913 | 19 |
| * | VirnetX Holding Corp. | 6,166 | 19 |
| * | ePlus Inc. | 169 | 18 |
| * | IPG Photonics Corp. | 108 | 18 |
| * | nLight Inc. | 698 | 17 |
| * | Autodesk Inc. | 63 | 16 |
| * | SecureWorks Corp. Class A | 798 | 14 |
| * | Smith Micro Software Inc. | 2,429 | 13 |
| * | TrueCar Inc. | 2,756 | 9 |
| 5,365 | |||
| Telecommunications (2.0%) | |||
| * | Liberty Broadband Corp. Class A | 967 | 147 |
| * | Liberty Latin America Ltd. Class A | 7,641 | 87 |
| * | WideOpenWest Inc. | 3,888 | 72 |
| * | US Cellular Corp. | 2,290 | 67 |
| * | Iridium Communications Inc. | 1,719 | 66 |
| * | Harmonic Inc. | 6,088 | 65 |
| * | Clearfield Inc. | 963 | 62 |
| * | Liberty Broadband Corp. Class C | 395 | 61 |
| * | Telesat Corp. | 1,783 | 55 |
| * | Ooma Inc. | 2,583 | 49 |
| Cable One Inc. | 26 | 46 | |
| * | Consolidated Communications Holdings Inc. | 5,876 | 44 |
| ADTRAN Inc. | 2,093 | 43 | |
| * | Digi International Inc. | 1,993 | 43 |
| Ubiquiti Inc. | 109 | 33 | |
| ATN International Inc. | 713 | 27 | |
| * | Ribbon Communications Inc. | 2,986 | 16 |
| * | CalAmp Corp. | 1,066 | 10 |
| * | Casa Systems Inc. | 2,014 | 10 |
| 1,003 | |||
| Utilities (1.5%) | |||
| Waste Management Inc. | 3,653 | 587 | |
| * | Stericycle Inc. | 1,775 | 100 |
| * | Clean Harbors Inc. | 573 | 58 |
| 745 | |||
| Total Common Stocks (Cost $38,245) | 50,914 | ||
| Shares | Market Value• ($000) | ||
| Temporary Cash Investments (0.4%) | |||
| Money Market Fund (0.4%) | |||
| 2 | Vanguard Market Liquidity Fund 0.077% (Cost $188) | 1,880 | 188 |
| Total Investments (99.9%) (Cost $38,433) | 51,102 | ||
| Other Assets and Liabilities—Net (0.1%) | 60 | ||
| Net Assets (100%) | 51,162 | ||
| Cost is in $000. | |||
| • | See Note A in Notes to Financial Statements. |
| * | Non-income-producing security. |
| 1 | Security value determined using significant unobservable inputs. |
| 2 | Affiliated money market fund available only to Vanguard funds and certain trusts and accounts managed by Vanguard. Rate shown is the 7-day yield. |
| Futures Contracts | ||||
| ($000) | ||||
| Expiration | Number of Long (Short) Contracts | Notional Amount | Value and Unrealized Appreciation (Depreciation) | |
| Long Futures Contracts | ||||
| Micro E-mini S&P 500 Index | December 2021 | 10 | 228 | 2 |
| ($000s, except shares and per-share amounts) | Amount |
| Assets | |
| Investments in Securities, at Value | |
| Unaffiliated Issuers (Cost $38,245) | 50,914 |
| Affiliated Issuers (Cost $188) | 188 |
| Total Investments in Securities | 51,102 |
| Investment in Vanguard | 2 |
| Cash | 1 |
| Cash Collateral Pledged—Futures Contracts | 20 |
| Receivables for Accrued Income | 45 |
| Total Assets | 51,170 |
| Liabilities | |
| Payables to Vanguard | 4 |
| Variation Margin Payable—Futures Contracts | 4 |
| Total Liabilities | 8 |
| Net Assets | 51,162 |
| At November 30, 2021, net assets consisted of: | |
| Paid-in Capital | 39,426 |
| Total Distributable Earnings (Loss) | 11,736 |
| Net Assets | 51,162 |
| Net Assets | |
| Applicable to 465,000 outstanding $.001 par value shares of beneficial interest (unlimited authorization) | 51,162 |
| Net Asset Value Per Share | $110.02 |
| Year Ended November 30, 2021 | |
| ($000) | |
| Investment Income | |
| Income | |
| Dividends | 702 |
| Interest1 | — |
| Securities Lending—Net | — |
| Total Income | 702 |
| Expenses | |
| The Vanguard Group—Note B | |
| Investment Advisory Services | — |
| Management and Administrative | 27 |
| Marketing and Distribution | — |
| Custodian Fees | 5 |
| Auditing Fees | 32 |
| Shareholders’ Reports | 1 |
| Trustees’ Fees and Expenses | — |
| Total Expenses | 65 |
| Net Investment Income | 637 |
| Realized Net Gain (Loss) | |
| Investment Securities Sold1,2 | 1,794 |
| Futures Contracts | 52 |
| Realized Net Gain (Loss) | 1,846 |
| Change in Unrealized Appreciation (Depreciation) | |
| Investment Securities1 | 7,658 |
| Futures Contracts | (10) |
| Change in Unrealized Appreciation (Depreciation) | 7,648 |
| Net Increase (Decrease) in Net Assets Resulting from Operations | 10,131 |
| 1 | Interest income, realized net gain (loss), and change in unrealized appreciation (depreciation) from an affiliated company of the fund were less than $1,000, less than $1,000, and less than $1,000, respectively. Purchases and sales are for temporary cash investment purposes. |
| 2 | Includes $337,000 of net gain (loss) resulting from in-kind redemptions. |
| Year Ended November 30, | ||
| 2021 ($000) | 2020 ($000) | |
| Increase (Decrease) in Net Assets | ||
| Operations | ||
| Net Investment Income | 637 | 688 |
| Realized Net Gain (Loss) | 1,846 | (1,914) |
| Change in Unrealized Appreciation (Depreciation) | 7,648 | 2,528 |
| Net Increase (Decrease) in Net Assets Resulting from Operations | 10,131 | 1,302 |
| Distributions | ||
| Total Distributions | (661) | (690) |
| Capital Share Transactions | ||
| Issued | 6,433 | 2,195 |
| Issued in Lieu of Cash Distributions | — | — |
| Redeemed | (4,935) | (3,670) |
| Net Increase (Decrease) from Capital Share Transactions | 1,498 | (1,475) |
| Total Increase (Decrease) | 10,968 | (863) |
| Net Assets | ||
| Beginning of Period | 40,194 | 41,057 |
| End of Period | 51,162 | 40,194 |
| For a Share Outstanding Throughout Each Period | Year Ended November 30, | February 13, 20181 to November 30, 2018 | ||
| 2021 | 2020 | 2019 | ||
| Net Asset Value, Beginning of Period | $89.32 | $86.44 | $78.25 | $75.00 |
| Investment Operations | ||||
| Net Investment Income2 | 1.374 | 1.436 | 1.310 | 1.010 |
| Net Realized and Unrealized Gain (Loss) on Investments | 20.757 | 2.882 | 8.047 | 2.834 |
| Total from Investment Operations | 22.131 | 4.318 | 9.357 | 3.844 |
| Distributions | ||||
| Dividends from Net Investment Income | (1.431) | (1.438) | (1.167) | (.594) |
| Distributions from Realized Capital Gains | — | — | — | — |
| Total Distributions | (1.431) | (1.438) | (1.167) | (.594) |
| Net Asset Value, End of Period | $110.02 | $89.32 | $86.44 | $78.25 |
| Total Return | 24.89% | 5.38% | 12.14% | 5.09% |
| Ratios/Supplemental Data | ||||
| Net Assets, End of Period (Millions) | $51 | $40 | $41 | $16 |
| Ratio of Total Expenses to Average Net Assets | 0.13% | 0.13% | 0.14%3 | 0.13%4,5 |
| Ratio of Net Investment Income to Average Net Assets | 1.28% | 1.83% | 1.62% | 1.58%4 |
| Portfolio Turnover Rate | 64%6 | 54%6 | 49% | 20% |
| 1 | Inception. |
| 2 | Calculated based on average shares outstanding. |
| 3 | The ratio of expenses to average net assets for the period net of reduction from custody fee offset arrangements was 0.13%. |
| 4 | Annualized. |
| 5 | The ratio of total expenses to average net assets before an expense reduction of 0.02% was 0.15%. The fund incurred higher than anticipated expenses, in which Vanguard voluntarily agreed to assume payment of certain expenses. The fund is not obligated to repay this amount to Vanguard. |
| 6 | Excludes the value of portfolio securities received or delivered as a result of in-kind purchases or redemptions of the fund’s capital shares, including ETF Creation Units. |
| A. | The following significant accounting policies conform to generally accepted accounting principles for U.S. investment companies. The fund consistently follows such policies in preparing its financial statements. |
| B. | In accordance with the terms of a Funds' Service Agreement (the “FSA”) between Vanguard and the fund, Vanguard furnishes to the fund investment advisory, corporate management, administrative, marketing, and distribution services at Vanguard’s cost of operations (as defined by the FSA). These costs of operations are allocated to the fund based on methods and guidelines approved by the board of trustees and are generally settled twice a month. |
| C. | Various inputs may be used to determine the value of the fund’s investments and derivatives. These inputs are summarized in three broad levels for financial statement purposes. The inputs or methodologies used to value securities are not necessarily an indication of the risk associated with investing in those securities. |
| Level 1 ($000) | Level 2 ($000) | Level 3 ($000) | Total ($000) | |
| Investments | ||||
| Assets | ||||
| Common Stocks | 50,899 | — | 15 | 50,914 |
| Temporary Cash Investments | 188 | — | — | 188 |
| Total | 51,087 | — | 15 | 51,102 |
| Derivative Financial Instruments | ||||
| Assets | ||||
| Futures Contracts1 | 2 | — | — | 2 |
| 1 | Includes cumulative appreciation (depreciation) on futures contracts and centrally cleared swaps, if any, as reported in the Schedule of Investments. Only current day’s variation margin is reported within the Statement of Assets and Liabilities. |
| D. | Permanent differences between book-basis and tax-basis components of net assets are reclassified among capital accounts in the financial statements to reflect their tax character. These reclassifications have no effect on net assets or net asset value per share. As of period end, permanent differences primarily attributable to the accounting for in-kind redemptions and passive foreign investment companies were reclassified between the following accounts: |
| Amount ($000) | |
| Paid-in Capital | 337 |
| Total Distributable Earnings (Loss) | (337) |
| Amount ($000) | |
| Undistributed Ordinary Income | 153 |
| Undistributed Long-Term Gains | — |
| Capital Loss Carryforwards | (1,086) |
| Qualified Late-Year Losses | — |
| Net Unrealized Gains (Losses) | 12,669 |
| Year Ended November 30, | ||
| 2021 Amount ($000) | 2020 Amount ($000) | |
| Ordinary Income* | 661 | 690 |
| Long-Term Capital Gains | — | — |
| Total | 661 | 690 |
| * | Includes short-term capital gains, if any. |
| Amount ($000) | |
| Tax Cost | 38,432 |
| Gross Unrealized Appreciation | 14,230 |
| Gross Unrealized Depreciation | (1,561) |
| Net Unrealized Appreciation (Depreciation) | 12,669 |
| E. | During the year ended November 30, 2021, the fund purchased $33,968,000 of investment securities and sold $32,426,000 of investment securities, other than temporary cash investments. Purchases and sales include $0 and $1,081,000, respectively, in connection with in-kind purchases and redemptions of the fund's capital shares. |
| F. | Capital shares issued and redeemed were: |
| Year Ended November 30, | ||
| 2021 Shares (000) | 2020 Shares (000) | |
| Issued | 60 | 25 |
| Issued in Lieu of Cash Distributions | — | — |
| Redeemed | (45) | (50) |
| Net Increase (Decrease) in Shares Outstanding | 15 | (25) |
| G. | Management has determined that no events or transactions occurred subsequent to November 30, 2021, that would require recognition or disclosure in these financial statements. |

| Average Annual Total Returns Periods Ended November 30, 2021 | ||||
| One Year | Since Inception (2/13/2018) | Final Value of a $10,000 Investment | ||
| U.S. Minimum Volatility ETF Net Asset Value | 17.22% | 10.27% | $14,491 |
| U.S. Minimum Volatility ETF Market Price | 17.21 | 10.27 | 14,490 | |
| Russell 3000 Index | 26.34 | 17.17 | 18,243 |
| One Year | Since Inception (2/13/2018) | |
| U.S. Minimum Volatility ETF Market Price | 17.21% | 44.90% |
| U.S. Minimum Volatility ETF Net Asset Value | 17.22 | 44.91 |
| Russell 3000 Index | 26.34 | 82.43 |
| Basic Materials | 1.8% |
| Consumer Discretionary | 12.7 |
| Consumer Staples | 6.9 |
| Energy | 1.9 |
| Financials | 9.1 |
| Health Care | 17.2 |
| Industrials | 7.2 |
| Real Estate | 1.5 |
| Technology | 23.9 |
| Telecommunications | 8.8 |
| Utilities | 9.0 |
| Shares | Market Value• ($000) | ||
| Common Stocks (99.5%) | |||
| Basic Materials (1.8%) | |||
| Newmont Corp. | 8,236 | 452 | |
| Fastenal Co. | 4,340 | 257 | |
| Balchem Corp. | 786 | 124 | |
| 833 | |||
| Consumer Discretionary (12.7%) | |||
| Costco Wholesale Corp. | 1,547 | 834 | |
| Dollar General Corp. | 3,341 | 739 | |
| Service Corp. International | 10,111 | 669 | |
| * | Amazon.com Inc. | 189 | 663 |
| Walmart Inc. | 4,295 | 604 | |
| Electronic Arts Inc. | 4,768 | 592 | |
| Domino's Pizza Inc. | 1,076 | 564 | |
| * | Walt Disney Co. | 1,872 | 271 |
| * | Terminix Global Holdings Inc. | 6,395 | 239 |
| Target Corp. | 937 | 228 | |
| Murphy USA Inc. | 783 | 136 | |
| Laureate Education Inc. Class A | 13,474 | 135 | |
| * | Madison Square Garden Sports Corp. | 545 | 94 |
| * | QuinStreet Inc. | 6,132 | 94 |
| Hasbro Inc. | 745 | 72 | |
| * | Dollar Tree Inc. | 184 | 25 |
| 5,959 | |||
| Consumer Staples (6.9%) | |||
| Procter & Gamble Co. | 5,059 | 731 | |
| Hershey Co. | 3,645 | 647 | |
| Flowers Foods Inc. | 24,762 | 639 | |
| Colgate-Palmolive Co. | 5,196 | 390 | |
| Mondelez International Inc. Class A | 5,089 | 300 | |
| Church & Dwight Co. Inc. | 2,909 | 260 | |
| Hormel Foods Corp. | 5,462 | 226 | |
| Lancaster Colony Corp. | 375 | 55 | |
| John B Sanfilippo & Son Inc. | 117 | 10 | |
| 3,258 | |||
| Energy (1.9%) | |||
| Williams Cos. Inc. | 28,567 | 766 | |
| Cheniere Energy Inc. | 1,270 | 133 | |
| 899 | |||
| Financials (9.1%) | |||
| Marsh & McLennan Cos. Inc. | 4,806 | 788 | |
| Intercontinental Exchange Inc. | 5,945 | 777 | |
| Broadridge Financial Solutions Inc. | 3,094 | 522 | |
| CME Group Inc. | 1,847 | 407 | |
| Shares | Market Value• ($000) | ||
| * | Columbia Financial Inc. | 21,545 | 393 |
| Waterstone Financial Inc. | 18,268 | 379 | |
| Stock Yards Bancorp Inc. | 4,179 | 250 | |
| Houlihan Lokey Inc. Class A | 1,576 | 171 | |
| Westamerica BanCorp. | 2,915 | 157 | |
| Arthur J Gallagher & Co. | 916 | 149 | |
| HarborOne Bancorp Inc. | 7,498 | 104 | |
| AMERISAFE Inc. | 1,163 | 62 | |
| Bank First Corp. | 700 | 49 | |
| Eastern Bankshares Inc. | 1,815 | 37 | |
| * | Blue Foundry Bancorp | 1,270 | 18 |
| Hingham Institution for Savings | 30 | 12 | |
| 4,275 | |||
| Health Care (17.1%) | |||
| Eli Lilly & Co. | 3,013 | 747 | |
| Gilead Sciences Inc. | 10,322 | 711 | |
| Cerner Corp. | 9,713 | 684 | |
| Johnson & Johnson | 4,290 | 669 | |
| Pfizer Inc. | 12,443 | 669 | |
| Merck & Co. Inc. | 8,606 | 645 | |
| Baxter International Inc. | 8,416 | 628 | |
| * | Regeneron Pharmaceuticals Inc. | 984 | 626 |
| Amgen Inc. | 2,896 | 576 | |
| * | HealthStream Inc. | 23,872 | 554 |
| AbbVie Inc. | 3,908 | 451 | |
| Becton Dickinson and Co. | 1,341 | 318 | |
| Danaher Corp. | 955 | 307 | |
| Bristol-Myers Squibb Co. | 3,023 | 162 | |
| Zoetis Inc. | 474 | 105 | |
| * | Veeva Systems Inc. Class A | 357 | 101 |
| * | Vertex Pharmaceuticals Inc. | 534 | 100 |
| 8,053 | |||
| Industrials (7.1%) | |||
| Expeditors International of Washington Inc. | 6,176 | 751 | |
| Accenture plc Class A | 1,553 | 555 | |
| Landstar System Inc. | 2,729 | 460 | |
| Illinois Tool Works Inc. | 1,721 | 400 | |
| Jack Henry & Associates Inc. | 1,965 | 298 | |
| Graco Inc. | 3,598 | 262 | |
| Sonoco Products Co. | 4,460 | 259 | |
| * | FTI Consulting Inc. | 1,019 | 149 |
| AptarGroup Inc. | 1,228 | 147 | |
| Toro Co. | 792 | 80 | |
| 3,361 | |||
| Real Estate (1.5%) | |||
| * | Equity Commonwealth | 27,855 | 709 |
| Shares | Market Value• ($000) | ||
| Technology (23.8%) | |||
| * | Adobe Inc. | 1,242 | 832 |
| Apple Inc. | 4,957 | 819 | |
| Microsoft Corp. | 2,432 | 804 | |
| * | Alphabet Inc. Class A | 277 | 786 |
| Oracle Corp. | 8,616 | 782 | |
| * | Tyler Technologies Inc. | 1,501 | 779 |
| Texas Instruments Inc. | 3,765 | 724 | |
| * | TTM Technologies Inc. | 51,610 | 711 |
| * | Cadence Design Systems Inc. | 3,581 | 636 |
| * | Verint Systems Inc. | 11,433 | 544 |
| Intuit Inc. | 817 | 533 | |
| Shutterstock Inc. | 3,796 | 433 | |
| * | Meta Platforms Inc. Class A | 1,225 | 398 |
| * | Altair Engineering Inc. Class A | 5,252 | 391 |
| * | Super Micro Computer Inc. | 9,100 | 377 |
| * | Black Knight Inc. | 5,037 | 360 |
| Amdocs Ltd. | 4,198 | 293 | |
| * | Cirrus Logic Inc. | 3,398 | 273 |
| Citrix Systems Inc. | 3,273 | 263 | |
| * | PDF Solutions Inc. | 2,577 | 77 |
| Dolby Laboratories Inc. Class A | 856 | 71 | |
| Analog Devices Inc. | 361 | 65 | |
| * | Dell Technologies Inc. Class C | 1,121 | 63 |
| VMware Inc. Class A | 493 | 58 | |
| American Software Inc. Class A | 2,452 | 56 | |
| * | Rambus Inc. | 1,834 | 49 |
| NortonLifeLock Inc. | 1,606 | 40 | |
| Intel Corp. | 246 | 12 | |
| 11,229 | |||
| Telecommunications (8.7%) | |||
| Verizon Communications Inc. | 15,024 | 755 | |
| * | T-Mobile US Inc. | 6,689 | 728 |
| AT&T Inc. | 30,117 | 688 | |
| * | Charter Communications Inc. Class A | 751 | 485 |
| Comcast Corp. Class A | 8,090 | 404 | |
| Cable One Inc. | 219 | 388 | |
| * | Liberty Broadband Corp. Class A | 2,152 | 326 |
| Cisco Systems Inc. | 3,774 | 207 | |
| * | Liberty Broadband Corp. Class C | 654 | 101 |
| Shares | Market Value• ($000) | ||
| Motorola Solutions Inc. | 85 | 22 | |
| Shenandoah Telecommunications Co. | 351 | 9 | |
| 4,113 | |||
| Utilities (8.9%) | |||
| Republic Services Inc. Class A | 6,160 | 815 | |
| Consolidated Edison Inc. | 9,156 | 711 | |
| WEC Energy Group Inc. | 7,372 | 641 | |
| American Water Works Co. Inc. | 3,149 | 531 | |
| Duke Energy Corp. | 4,820 | 467 | |
| Waste Management Inc. | 1,726 | 277 | |
| CMS Energy Corp. | 2,331 | 137 | |
| American Electric Power Co. Inc. | 1,613 | 131 | |
| NextEra Energy Inc. | 1,339 | 116 | |
| Eversource Energy | 1,342 | 110 | |
| Xcel Energy Inc. | 1,474 | 94 | |
| Ameren Corp. | 770 | 63 | |
| Dominion Energy Inc. | 588 | 42 | |
| DTE Energy Co. | 320 | 35 | |
| American States Water Co. | 305 | 29 | |
| 4,199 | |||
| Total Common Stocks (Cost $39,666) | 46,888 | ||
| Temporary Cash Investments (0.4%) | |||
| Money Market Fund (0.4%) | |||
| 1 | Vanguard Market Liquidity Fund 0.077% (Cost $180) | 1,796 | 179 |
| Total Investments (99.9%) (Cost $39,846) | 47,067 | ||
| Other Assets and Liabilities—Net (0.1%) | 62 | ||
| Net Assets (100%) | 47,129 | ||
| Cost is in $000. | |||
| • | See Note A in Notes to Financial Statements. |
| * | Non-income-producing security. |
| 1 | Affiliated money market fund available only to Vanguard funds and certain trusts and accounts managed by Vanguard. Rate shown is the 7-day yield. |
| Futures Contracts | ||||
| ($000) | ||||
| Expiration | Number of Long (Short) Contracts | Notional Amount | Value and Unrealized Appreciation (Depreciation) | |
| Long Futures Contracts | ||||
| Micro E-mini S&P 500 Index | December 2021 | 8 | 183 | 7 |
| ($000s, except shares and per-share amounts) | Amount |
| Assets | |
| Investments in Securities, at Value | |
| Unaffiliated Issuers (Cost $39,666) | 46,888 |
| Affiliated Issuers (Cost $180) | 179 |
| Total Investments in Securities | 47,067 |
| Investment in Vanguard | 2 |
| Cash Collateral Pledged—Futures Contracts | 14 |
| Receivables for Accrued Income | 52 |
| Total Assets | 47,135 |
| Liabilities | |
| Payables to Vanguard | 3 |
| Variation Margin Payable—Futures Contracts | 3 |
| Total Liabilities | 6 |
| Net Assets | 47,129 |
| At November 30, 2021, net assets consisted of: | |
| Paid-in Capital | 48,100 |
| Total Distributable Earnings (Loss) | (971) |
| Net Assets | 47,129 |
| Net Assets | |
| Applicable to 470,000 outstanding $.001 par value shares of beneficial interest (unlimited authorization) | 47,129 |
| Net Asset Value Per Share | $100.28 |
| Year Ended November 30, 2021 | |
| ($000) | |
| Investment Income | |
| Income | |
| Dividends | 762 |
| Interest1 | — |
| Securities Lending—Net | 1 |
| Total Income | 763 |
| Expenses | |
| The Vanguard Group—Note B | |
| Investment Advisory Services | — |
| Management and Administrative | 26 |
| Marketing and Distribution | — |
| Custodian Fees | 5 |
| Auditing Fees | 28 |
| Shareholders’ Reports | 5 |
| Trustees’ Fees and Expenses | — |
| Total Expenses | 64 |
| Net Investment Income | 699 |
| Realized Net Gain (Loss) | |
| Investment Securities Sold1,2 | 6,328 |
| Futures Contracts | 58 |
| Realized Net Gain (Loss) | 6,386 |
| Change in Unrealized Appreciation (Depreciation) | |
| Investment Securities1 | 903 |
| Futures Contracts | (7) |
| Change in Unrealized Appreciation (Depreciation) | 896 |
| Net Increase (Decrease) in Net Assets Resulting from Operations | 7,981 |
| 1 | Interest income, realized net gain (loss), and change in unrealized appreciation (depreciation) from an affiliated company of the fund were less than $1,000, less than $1,000, and ($2,000), respectively. Purchases and sales are for temporary cash investment purposes. |
| 2 | Includes $3,441,000 of net gain (loss) resulting from in-kind redemptions. |
| Year Ended November 30, | ||
| 2021 ($000) | 2020 ($000) | |
| Increase (Decrease) in Net Assets | ||
| Operations | ||
| Net Investment Income | 699 | 1,847 |
| Realized Net Gain (Loss) | 6,386 | (7,471) |
| Change in Unrealized Appreciation (Depreciation) | 896 | 688 |
| Net Increase (Decrease) in Net Assets Resulting from Operations | 7,981 | (4,936) |
| Distributions | ||
| Total Distributions | (905) | (2,094) |
| Capital Share Transactions | ||
| Issued | 1,451 | 29,188 |
| Issued in Lieu of Cash Distributions | — | ��� |
| Redeemed | (18,000) | (56,656) |
| Net Increase (Decrease) from Capital Share Transactions | (16,549) | (27,468) |
| Total Increase (Decrease) | (9,473) | (34,498) |
| Net Assets | ||
| Beginning of Period | 56,602 | 91,100 |
| End of Period | 47,129 | 56,602 |
| For a Share Outstanding Throughout Each Period | Year Ended November 30, | February 13, 20181 to November 30, 2018 | ||
| 2021 | 2020 | 2019 | ||
| Net Asset Value, Beginning of Period | $87.08 | $91.10 | $81.69 | $75.00 |
| Investment Operations | ||||
| Net Investment Income2 | 1.374 | 1.779 | 2.632 | 1.887 |
| Net Realized and Unrealized Gain (Loss) on Investments | 13.497 | (3.776) | 8.996 | 5.677 |
| Total from Investment Operations | 14.871 | (1.997) | 11.628 | 7.564 |
| Distributions | ||||
| Dividends from Net Investment Income | (1.671) | (2.023) | (2.218) | (.874) |
| Distributions from Realized Capital Gains | — | — | — | — |
| Total Distributions | (1.671) | (2.023) | (2.218) | (.874) |
| Net Asset Value, End of Period | $100.28 | $87.08 | $91.10 | $81.69 |
| Total Return | 17.22% | -1.99% | 14.58% | 10.07% |
| Ratios/Supplemental Data | ||||
| Net Assets, End of Period (Millions) | $47 | $57 | $91 | $22 |
| Ratio of Total Expenses to Average Net Assets | 0.13% | 0.13% | 0.13% | 0.13%3 |
| Ratio of Net Investment Income to Average Net Assets | 1.43% | 2.14% | 3.05% | 2.90%3 |
| Portfolio Turnover Rate | 46%4 | 83%4 | 23% | 5% |
| 1 | Inception. |
| 2 | Calculated based on average shares outstanding. |
| 3 | Annualized. |
| 4 | Excludes the value of portfolio securities received or delivered as a result of in-kind purchases or redemptions of the fund’s capital shares, including ETF Creation Units. |
| A. | The following significant accounting policies conform to generally accepted accounting principles for U.S. investment companies. The fund consistently follows such policies in preparing its financial statements. |
| B. | In accordance with the terms of a Funds' Service Agreement (the “FSA”) between Vanguard and the fund, Vanguard furnishes to the fund investment advisory, corporate management, administrative, marketing, and distribution services at Vanguard’s cost of operations (as defined by the FSA). These costs of operations are allocated to the fund based on methods and guidelines approved by the board of trustees and are generally settled twice a month. |
| C. | Various inputs may be used to determine the value of the fund’s investments and derivatives. These inputs are summarized in three broad levels for financial statement purposes. The inputs or methodologies used to value securities are not necessarily an indication of the risk associated with investing in those securities. |
| D. | Permanent differences between book-basis and tax-basis components of net assets are reclassified among capital accounts in the financial statements to reflect their tax character. These reclassifications have no effect on net assets or net asset value per share. As of period end, permanent differences primarily attributable to the accounting for in-kind redemptions were reclassified between the following accounts: |
| Amount ($000) | |
| Paid-in Capital | 3,441 |
| Total Distributable Earnings (Loss) | (3,441) |
| Amount ($000) | |
| Undistributed Ordinary Income | 131 |
| Undistributed Long-Term Gains | — |
| Capital Loss Carryforwards | (8,322) |
| Qualified Late-Year Losses | — |
| Net Unrealized Gains (Losses) | 7,220 |
| Year Ended November 30, | ||
| 2021 Amount ($000) | 2020 Amount ($000) | |
| Ordinary Income* | 905 | 2,094 |
| Long-Term Capital Gains | — | — |
| Total | 905 | 2,094 |
| * | Includes short-term capital gains, if any. |
| Amount ($000) | |
| Tax Cost | 39,847 |
| Gross Unrealized Appreciation | 8,693 |
| Gross Unrealized Depreciation | (1,473) |
| Net Unrealized Appreciation (Depreciation) | 7,220 |
| E. | During the year ended November 30, 2021, the fund purchased $24,805,000 of investment securities and sold $40,427,000 of investment securities, other than temporary cash investments. Purchases and sales include $0 and $17,977,000, respectively, in connection with in-kind purchases and redemptions of the fund's capital shares. |
| F. | Capital shares issued and redeemed were: |
| Year Ended November 30, | ||
| 2021 Shares (000) | 2020 Shares (000) | |
| Issued | 15 | 350 |
| Issued in Lieu of Cash Distributions | — | — |
| Redeemed | (195) | (700) |
| Net Increase (Decrease) in Shares Outstanding | (180) | (350) |
| G. | Management has determined that no events or transactions occurred subsequent to November 30, 2021, that would require recognition or disclosure in these financial statements. |

| Average Annual Total Returns Periods Ended November 30, 2021 | ||||
| One Year | Since Inception (2/13/2018) | Final Value of a $10,000 Investment | ||
| U.S. Momentum Factor ETF Net Asset Value | 25.01% | 16.99% | $18,140 |
| U.S. Momentum Factor ETF Market Price | 24.99 | 16.99 | 18,140 | |
| Russell 3000 Index | 26.34 | 17.17 | 18,243 |
| One Year | Since Inception (2/13/2018) | |
| U.S. Momentum Factor ETF Market Price | 24.99% | 81.40% |
| U.S. Momentum Factor ETF Net Asset Value | 25.01 | 81.40 |
| Russell 3000 Index | 26.34 | 82.43 |
| Basic Materials | 3.6% |
| Consumer Discretionary | 14.4 |
| Consumer Staples | 1.8 |
| Energy | 11.6 |
| Financials | 22.5 |
| Health Care | 16.0 |
| Industrials | 14.1 |
| Real Estate | 0.7 |
| Technology | 13.2 |
| Telecommunications | 1.6 |
| Utilities | 0.5 |
| Shares | Market Value• ($000) | ||
| Common Stocks (99.5%) | |||
| Basic Materials (3.5%) | |||
| Nucor Corp. | 7,952 | 845 | |
| Steel Dynamics Inc. | 13,050 | 780 | |
| Olin Corp. | 9,136 | 497 | |
| Albemarle Corp. | 1,657 | 442 | |
| Ryerson Holding Corp. | 12,918 | 303 | |
| * | TimkenSteel Corp. | 20,561 | 294 |
| Mosaic Co. | 8,164 | 279 | |
| Verso Corp. Class A | 13,057 | 276 | |
| AdvanSix Inc. | 6,056 | 274 | |
| Avery Dennison Corp. | 1,326 | 272 | |
| Schnitzer Steel Industries Inc. Class A | 5,465 | 263 | |
| * | Intrepid Potash Inc. | 5,699 | 234 |
| *,1 | Meta Materials Inc. | 57,033 | 209 |
| * | Energy Fuels Inc. | 23,908 | 208 |
| * | Cleveland-Cliffs Inc. | 8,356 | 170 |
| * | Ur-Energy Inc. | 112,849 | 168 |
| * | Uranium Energy Corp. | 37,067 | 145 |
| Freeport-McMoRan Inc. | 3,862 | 143 | |
| Southern Copper Corp. | 2,301 | 135 | |
| US Steel Corp. | 5,668 | 128 | |
| Tronox Holdings plc Class A | 5,639 | 124 | |
| CF Industries Holdings Inc. | 1,813 | 110 | |
| Chemours Co. | 2,543 | 76 | |
| Hecla Mining Co. | 12,473 | 69 | |
| * | Amyris Inc. | 9,356 | 64 |
| Celanese Corp. Class A | 355 | 54 | |
| Commercial Metals Co. | 1,709 | 53 | |
| Scotts Miracle-Gro Co. | 349 | 51 | |
| Valvoline Inc. | 1,173 | 40 | |
| Balchem Corp. | 242 | 38 | |
| Olympic Steel Inc. | 1,449 | 30 | |
| 6,774 | |||
| Consumer Discretionary (14.3%) | |||
| * | Tesla Inc. | 1,411 | 1,615 |
| Target Corp. | 6,224 | 1,518 | |
| Ford Motor Co. | 69,240 | 1,329 | |
| eBay Inc. | 12,724 | 858 | |
| * | Chipotle Mexican Grill Inc. Class A | 476 | 782 |
| Macy's Inc. | 22,775 | 649 | |
| * | Avis Budget Group Inc. | 2,317 | 636 |
| * | Crocs Inc. | 3,594 | 590 |
| Interpublic Group of Cos. Inc. | 17,585 | 584 | |
| Lowe's Cos. Inc. | 2,079 | 509 | |
| Shares | Market Value• ($000) | ||
| Tempur Sealy International Inc. | 11,169 | 479 | |
| Dick's Sporting Goods Inc. | 3,619 | 425 | |
| * | Boot Barn Holdings Inc. | 3,456 | 423 |
| H&R Block Inc. | 16,108 | 381 | |
| Bath & Body Works Inc. | 5,023 | 377 | |
| AMERCO | 527 | 371 | |
| MGM Resorts International | 9,231 | 365 | |
| Estee Lauder Cos. Inc. Class A | 1,063 | 353 | |
| * | AutoNation Inc. | 2,807 | 348 |
| * | RH | 550 | 321 |
| * | Scientific Games Corp. Class A | 4,972 | 318 |
| Costco Wholesale Corp. | 568 | 306 | |
| * | Caesars Entertainment Inc. | 3,385 | 305 |
| * | Etsy Inc. | 1,108 | 304 |
| Williams-Sonoma Inc. | 1,546 | 301 | |
| * | Genesco Inc. | 4,404 | 278 |
| Signet Jewelers Ltd. | 2,793 | 271 | |
| Dillard's Inc. Class A | 983 | 269 | |
| Clarus Corp. | 9,884 | 261 | |
| * | Houghton Mifflin Harcourt Co. | 16,757 | 261 |
| * | Boyd Gaming Corp. | 4,442 | 260 |
| * | Chico's FAS Inc. | 43,536 | 249 |
| Movado Group Inc. | 5,432 | 244 | |
| Shoe Carnival Inc. | 6,186 | 242 | |
| * | Thryv Holdings Inc. | 6,140 | 240 |
| * | BJ's Wholesale Club Holdings Inc. | 3,618 | 239 |
| * | Golden Entertainment Inc. | 5,141 | 236 |
| * | Revolve Group Inc. | 2,899 | 221 |
| * | Liquidity Services Inc. | 9,692 | 220 |
| RCI Hospitality Holdings Inc. | 3,458 | 219 | |
| Entravision Communications Corp. Class A | 28,940 | 215 | |
| * | iHeartMedia Inc. Class A | 10,817 | 212 |
| * | Trade Desk Inc. Class A | 2,018 | 209 |
| * | Carvana Co. Class A | 732 | 205 |
| Fox Corp. Class A | 5,563 | 199 | |
| * | Capri Holdings Ltd. | 3,257 | 193 |
| Papa John's International Inc. | 1,556 | 190 | |
| * | SiteOne Landscape Supply Inc. | 755 | 181 |
| International Game Technology plc | 6,665 | 180 | |
| A-Mark Precious Metals Inc. | 2,585 | 179 | |
| * | Clear Channel Outdoor Holdings Inc. | 57,416 | 176 |
| Scholastic Corp. | 4,674 | 176 |
| Shares | Market Value• ($000) | ||
| * | Gannett Co. Inc. | 32,686 | 167 |
| Dollar General Corp. | 734 | 162 | |
| * | Full House Resorts Inc. | 18,110 | 162 |
| * | Citi Trends Inc. | 1,888 | 160 |
| * | Conn's Inc. | 7,239 | 158 |
| 1 | Big 5 Sporting Goods Corp. | 6,002 | 142 |
| * | O'Reilly Automotive Inc. | 222 | 142 |
| * | Lovesac Co. | 2,229 | 141 |
| * | Everi Holdings Inc. | 6,728 | 140 |
| * | Deckers Outdoor Corp. | 327 | 133 |
| * | AutoZone Inc. | 72 | 131 |
| * | Dave & Buster's Entertainment Inc. | 4,029 | ��� 131 |
| Cato Corp. Class A | 7,915 | 130 | |
| Carriage Services Inc. Class A | 2,497 | 129 | |
| Red Rock Resorts Inc. Class A | 2,691 | 128 | |
| * | YETI Holdings Inc. | 1,348 | 124 |
| * | Hovnanian Enterprises Inc. Class A | 1,279 | 122 |
| * | General Motors Co. | 2,077 | 120 |
| * | Floor & Decor Holdings Inc. Class A | 909 | 117 |
| Caleres Inc. | 4,921 | 116 | |
| * | Barnes & Noble Education Inc. | 15,811 | 111 |
| * | Century Casinos Inc. | 8,222 | 107 |
| * | Lululemon Athletica Inc. | 236 | 107 |
| * | Children's Place Inc. | 1,193 | 103 |
| Hibbett Inc. | 1,304 | 102 | |
| Toll Brothers Inc. | 1,607 | 102 | |
| * | XPEL Inc. | 1,414 | 102 |
| * | Mattel Inc. | 4,756 | 101 |
| Camping World Holdings Inc. Class A | 2,258 | 99 | |
| * | MarineMax Inc. | 1,830 | 98 |
| Nexstar Media Group Inc. Class A | 653 | 98 | |
| Century Communities Inc. | 1,355 | 96 | |
| Thor Industries Inc. | 838 | 89 | |
| Pool Corp. | 158 | 88 | |
| Global Industrial Co. | 2,173 | 87 | |
| * | Turtle Beach Corp. | 3,040 | 82 |
| * | Penn National Gaming Inc. | 1,545 | 79 |
| John Wiley & Sons Inc. Class A | 1,503 | 78 | |
| * | Monarch Casino & Resort Inc. | 1,117 | 75 |
| Franchise Group Inc. | 1,545 | 74 | |
| * | Fox Factory Holding Corp. | 417 | 73 |
| * | Clean Energy Fuels Corp. | 10,006 | 72 |
| * | Master Craft Boat Holdings Inc. | 2,592 | 71 |
| Lennar Corp. Class A | 666 | 70 | |
| Hanesbrands Inc. | 4,271 | 69 | |
| Buckle Inc. | 1,441 | 68 | |
| Activision Blizzard Inc. | 1,149 | 67 | |
| * | Green Brick Partners Inc. | 2,664 | 66 |
| Winnebago Industries Inc. | 902 | 65 | |
| Rocky Brands Inc. | 1,767 | 63 | |
| * | Bally's Corp. | 1,615 | 62 |
| * | National Vision Holdings Inc. | 1,229 | 59 |
| Tractor Supply Co. | 263 | 59 | |
| * | SeaWorld Entertainment Inc. | 975 | 58 |
| * | Wayfair Inc. Class A | 234 | 58 |
| Interface Inc. Class A | 4,017 | 57 | |
| Churchill Downs Inc. | 250 | 56 | |
| * | ODP Corp. | 1,483 | 56 |
| Shares | Market Value• ($000) | ||
| * | LGI Homes Inc. | 370 | 53 |
| * | Malibu Boats Inc. Class A | 768 | 53 |
| * | Abercrombie & Fitch Co. Class A | 1,423 | 51 |
| Group 1 Automotive Inc. | 260 | 51 | |
| KB Home | 1,280 | 51 | |
| Kontoor Brands Inc. | 951 | 51 | |
| * | Coty Inc. Class A | 5,172 | 50 |
| * | M/I Homes Inc. | 901 | 50 |
| Best Buy Co. Inc. | 440 | 47 | |
| * | Fossil Group Inc. | 3,894 | 47 |
| * | Tri Pointe Homes Inc. | 1,726 | 43 |
| * | Duluth Holdings Inc. Class B | 2,995 | 42 |
| * | AMMO Inc. | 6,745 | 42 |
| * | Meritage Homes Corp. | 360 | 41 |
| * | Academy Sports & Outdoors Inc. | 923 | 41 |
| * | Adient plc | 939 | 40 |
| * | Five Below Inc. | 191 | 39 |
| * | Sonos Inc. | 1,157 | 37 |
| * | Entercom Communications Corp. Class A | 14,832 | 37 |
| * | Mesa Air Group Inc. | 4,892 | 35 |
| Qurate Retail Inc. Series A | 4,347 | 35 | |
| Haverty Furniture Cos. Inc. | 1,149 | 34 | |
| Lithia Motors Inc. Class A | 117 | 34 | |
| * | CarParts.com Inc. | 2,470 | 31 |
| * | Party City Holdco Inc. | 5,245 | 29 |
| 27,318 | |||
| Consumer Staples (1.8%) | |||
| Albertsons Cos. Inc. Class A | 15,228 | 536 | |
| Philip Morris International Inc. | 5,007 | 430 | |
| Ingles Markets Inc. Class A | 5,184 | 398 | |
| * | United Natural Foods Inc. | 7,184 | 357 |
| Coca-Cola Consolidated Inc. | 414 | 236 | |
| * | Celsius Holdings Inc. | 3,308 | 226 |
| * | Pilgrim's Pride Corp. | 7,443 | 209 |
| * | Beauty Health Co. | 4,871 | 127 |
| * | Hostess Brands Inc. Class A | 7,437 | 126 |
| * | PLBY Group Inc. | 3,187 | 122 |
| * | Freshpet Inc. | 852 | 92 |
| National Beverage Corp. | 1,681 | 87 | |
| MGP Ingredients Inc. | 1,043 | 81 | |
| * | Whole Earth Brands Inc. | 6,169 | 65 |
| * | 22nd Century Group Inc. | 24,075 | 61 |
| Medifast Inc. | 282 | 58 | |
| Fresh Del Monte Produce Inc. | 2,157 | 54 | |
| Bunge Ltd. | �� 531 | 46 | |
| * | Hain Celestial Group Inc. | 1,135 | 45 |
| * | Darling Ingredients Inc. | 475 | 32 |
| 3,388 | |||
| Energy (11.5%) | |||
| ConocoPhillips | 24,491 | 1,718 | |
| EOG Resources Inc. | 18,538 | 1,613 | |
| Schlumberger NV | 40,180 | 1,152 | |
| Exxon Mobil Corp. | 16,598 | 993 | |
| Targa Resources Corp. | 15,455 | 798 | |
| ONEOK Inc. | 12,316 | 737 | |
| Devon Energy Corp. | 16,313 | 686 | |
| Cheniere Energy Inc. | 6,224 | 652 | |
| Williams Cos. Inc. | 18,991 | 509 | |
| * | Denbury Inc. | 6,042 | 481 |
| Diamondback Energy Inc. | 4,303 | 459 | |
| Ovintiv Inc. (XNYS) | 12,077 | 420 | |
| Continental Resources Inc. | 9,277 | 411 | |
| Shares | Market Value• ($000) | ||
| Pioneer Natural Resources Co. | 2,173 | 387 | |
| * | Enphase Energy Inc. | 1,494 | 374 |
| Occidental Petroleum Corp. | 12,025 | 357 | |
| * | Range Resources Corp. | 17,608 | 344 |
| Marathon Oil Corp. | 21,929 | 340 | |
| Marathon Petroleum Corp. | 5,467 | 333 | |
| * | Antero Resources Corp. | 18,420 | 323 |
| Civitas Resources Inc. | 5,529 | 283 | |
| SM Energy Co. | 9,648 | 280 | |
| Northern Oil and Gas Inc. | 12,871 | 262 | |
| Murphy Oil Corp. | 9,729 | 259 | |
| Patterson-UTI Energy Inc. | 36,618 | 259 | |
| * | Aemetis Inc. | 13,015 | 244 |
| * | Peabody Energy Corp. | 24,510 | 244 |
| Baker Hughes Co. Class A | 10,337 | 241 | |
| Arch Resources Inc. | 2,906 | 225 | |
| Matador Resources Co. | 5,713 | 224 | |
| * | Whiting Petroleum Corp. | 3,443 | 223 |
| * | CONSOL Energy Inc. | 9,952 | 218 |
| * | ChampionX Corp. | 10,472 | 214 |
| Oasis Petroleum Inc. | 1,748 | 210 | |
| * | Nabors Industries Ltd. (XNYS) | 2,569 | 209 |
| Brigham Minerals Inc. Class A | 9,949 | 207 | |
| * | Centrus Energy Corp. Class A | 3,734 | 207 |
| Altus Midstream Co. Class A | 3,249 | 206 | |
| * | Callon Petroleum Co. | 4,048 | 206 |
| Antero Midstream Corp. | 19,718 | 191 | |
| * | Laredo Petroleum Inc. | 3,233 | 190 |
| APA Corp. | 7,123 | 184 | |
| California Resources Corp. | 4,537 | 177 | |
| * | Earthstone Energy Inc. Class A | 17,164 | 175 |
| PDC Energy Inc. | 3,452 | 174 | |
| Magnolia Oil & Gas Corp. Class A | 9,052 | 172 | |
| * | Centennial Resource Development Inc. Class A | 27,147 | 169 |
| * | Tellurian Inc. | 51,618 | 168 |
| * | Plug Power Inc. | 4,197 | 167 |
| * | Comstock Resources Inc. | 20,180 | 163 |
| * | W&T Offshore Inc. | 46,379 | 160 |
| * | TETRA Technologies Inc. | 60,958 | 159 |
| Hess Corp. | 2,108 | 157 | |
| Berry Corp. | 19,029 | 155 | |
| Cactus Inc. Class A | 4,080 | 149 | |
| * | Newpark Resources Inc. | 50,914 | 139 |
| Helmerich & Payne Inc. | 5,961 | 134 | |
| * | Ameresco Inc. Class A | 1,334 | 121 |
| * | Green Plains Inc. | 2,989 | 116 |
| * | Oceaneering International Inc. | 10,689 | 114 |
| * | Southwestern Energy Co. | 25,243 | 113 |
| Halliburton Co. | 4,939 | 107 | |
| * | Contango Oil & Gas Co. | 30,529 | 106 |
| * | NexTier Oilfield Solutions Inc. | 27,455 | 99 |
| * | Oil States International Inc. | 19,439 | 98 |
| * | Gevo Inc. | 16,343 | 94 |
| * | RPC Inc. | 22,858 | 92 |
| * | FTS International Inc. Class A | 3,438 | 91 |
| * | FuelCell Energy Inc. | 10,168 | 88 |
| Equitrans Midstream Corp. | 8,733 | 84 | |
| * | National Energy Services Reunited Corp. | 6,569 | 65 |
| * | SunPower Corp. | 1,805 | 52 |
| * | Renewable Energy Group Inc. | 785 | 38 |
| Coterra Energy Inc. | 1,693 | 34 |
| Shares | Market Value• ($000) | ||
| * | Liberty Oilfield Services Inc. Class A | 3,091 | 28 |
| 22,031 | |||
| Financials (22.4%) | |||
| Blackstone Inc. | 14,215 | 2,011 | |
| Morgan Stanley | 19,872 | 1,884 | |
| Charles Schwab Corp. | 23,445 | 1,814 | |
| Wells Fargo & Co. | 37,624 | 1,798 | |
| American Financial Group Inc. | 12,744 | 1,703 | |
| American International Group Inc. | 30,264 | 1,592 | |
| PNC Financial Services Group Inc. | 7,336 | 1,445 | |
| MSCI Inc. Class A | 2,129 | 1,340 | |
| Goldman Sachs Group Inc. | 3,014 | 1,148 | |
| Pinnacle Financial Partners Inc. | 11,270 | 1,075 | |
| T Rowe Price Group Inc. | 5,367 | 1,073 | |
| ServisFirst Bancshares Inc. | 13,107 | 1,054 | |
| Aon plc Class A (XNYS) | 3,264 | 965 | |
| Hartford Financial Services Group Inc. | 12,594 | 832 | |
| First Republic Bank | 3,871 | 812 | |
| * | Customers Bancorp Inc. | 12,703 | 732 |
| Berkshire Hills Bancorp Inc. | 26,550 | 709 | |
| Western Alliance Bancorp | 5,815 | 638 | |
| Signature Bank | 2,063 | 624 | |
| * | SVB Financial Group | 844 | 584 |
| Ally Financial Inc. | 12,477 | 572 | |
| Marsh & McLennan Cos. Inc. | 3,378 | 554 | |
| * | Credit Acceptance Corp. | 863 | 539 |
| Old Republic International Corp. | 20,127 | 482 | |
| Affiliated Managers Group Inc. | 2,716 | 462 | |
| Bank OZK | 9,989 | 447 | |
| Nasdaq Inc. | 2,140 | 435 | |
| Comerica Inc. | 5,036 | 416 | |
| Citizens Financial Group Inc. | 8,386 | 396 | |
| Chubb Ltd. | 2,144 | 385 | |
| Invesco Ltd. | 16,901 | 377 | |
| * | Silvergate Capital Corp. Class A | 1,820 | 372 |
| * | Bancorp Inc. | 12,746 | 360 |
| HCI Group Inc. | 3,253 | 359 | |
| East West Bancorp Inc. | 4,627 | 356 | |
| PacWest Bancorp | 7,959 | 356 | |
| Bank of America Corp. | 7,964 | 354 | |
| Bank of New York Mellon Corp. | 6,277 | 344 | |
| Evercore Inc. Class A | 2,478 | 344 | |
| Flushing Financial Corp. | 14,516 | 343 | |
| Assured Guaranty Ltd. | 6,699 | 328 | |
| KKR & Co. Inc. | 4,372 | 325 | |
| * | Triumph Bancorp Inc. | 2,407 | 307 |
| * | Encore Capital Group Inc. | 5,212 | 304 |
| Navient Corp. | 15,386 | 304 | |
| UMB Financial Corp. | 2,912 | 293 | |
| Jefferies Financial Group Inc. | 7,762 | 292 | |
| Eagle Bancorp Inc. | 4,787 | 270 | |
| BlackRock Inc. | 296 | 268 | |
| Meta Financial Group Inc. | 4,471 | 267 | |
| * | LendingClub Corp. | 8,144 | 266 |
| * | Marathon Digital Holdings Inc. | 5,147 | 263 |
| Northfield Bancorp Inc. | 14,771 | 249 | |
| * | World Acceptance Corp. | 1,201 | 247 |
| Shares | Market Value• ($000) | ||
| Cullen/Frost Bankers Inc. | 1,924 | 242 | |
| Janus Henderson Group plc | 5,632 | 241 | |
| * | Metropolitan Bank Holding Corp. | 2,312 | 219 |
| * | MBIA Inc. | 18,497 | 218 |
| Live Oak Bancshares Inc. | 2,393 | 213 | |
| Towne Bank | 6,902 | 211 | |
| Discover Financial Services | 1,950 | 210 | |
| Tradeweb Markets Inc. Class A | 2,159 | 207 | |
| Prudential Financial Inc. | 1,863 | 191 | |
| * | EZCorp. Inc. Class A | 25,487 | 189 |
| Hancock Whitney Corp. | 3,906 | 187 | |
| Regional Management Corp. | 3,255 | 184 | |
| * | Enova International Inc. | 4,263 | 163 |
| ConnectOne Bancorp Inc. | 4,941 | 161 | |
| Raymond James Financial Inc. | 1,621 | 159 | |
| BankUnited Inc. | 3,943 | 156 | |
| Byline Bancorp Inc. | 6,017 | 156 | |
| Hanmi Financial Corp. | 6,756 | 152 | |
| Sculptor Capital Management Inc. Class A | 7,838 | 142 | |
| Fifth Third Bancorp | 3,309 | 139 | |
| Houlihan Lokey Inc. Class A | 1,216 | 132 | |
| Cohen & Steers Inc. | 1,438 | 129 | |
| Ares Management Corp. Class A | 1,577 | 128 | |
| Kearny Financial Corp. | 9,359 | 119 | |
| Sandy Spring Bancorp Inc. | 2,529 | 119 | |
| Cincinnati Financial Corp. | 1,021 | 116 | |
| Brightsphere Investment Group Inc. | 3,762 | 113 | |
| Curo Group Holdings Corp. | 6,543 | 109 | |
| Cowen Inc. Class A | 2,965 | 105 | |
| First Citizens BancShares Inc. Class A | 127 | 102 | |
| Federal Agricultural Mortgage Corp. Class C | 819 | 100 | |
| Preferred Bank | 1,462 | 100 | |
| S&P Global Inc. | 217 | 99 | |
| First Bancorp (XNGS) | 2,112 | 94 | |
| * | Mr Cooper Group Inc. | 2,340 | 92 |
| Central Pacific Financial Corp. | 2,983 | 80 | |
| Morningstar Inc. | 254 | 79 | |
| QCR Holdings Inc. | 1,417 | 76 | |
| First Financial Bancorp | 3,250 | 75 | |
| Dime Community Bancshares Inc. | 2,193 | 75 | |
| Arthur J Gallagher & Co. | 452 | 74 | |
| Goosehead Insurance Inc. Class A | 556 | 73 | |
| Carlyle Group Inc. | 1,270 | 69 | |
| Kinsale Capital Group Inc. | 320 | 67 | |
| PennyMac Financial Services Inc. | 923 | 58 | |
| MetLife Inc. | 964 | 57 | |
| Hamilton Lane Inc. Class A | 529 | 56 | |
| JPMorgan Chase & Co. | 355 | 56 | |
| HarborOne Bancorp Inc. | 3,948 | 55 | |
| OneMain Holdings Inc. | 1,070 | 53 | |
| US Bancorp | 966 | 53 | |
| Univest Financial Corp. | 1,923 | 53 | |
| Intercontinental Exchange Inc. | 378 | 49 | |
| B Riley Financial Inc. | 592 | 46 | |
| Origin Bancorp Inc. | 1,067 | 45 |
| Shares | Market Value• ($000) | ||
| Virtus Investment Partners Inc. | 134 | 40 | |
| SLM Corp. | 2,074 | 37 | |
| FirstCash Inc. | 435 | 28 | |
| 42,820 | |||
| Health Care (16.0%) | |||
| * | Moderna Inc. | 7,644 | 2,694 |
| HCA Healthcare Inc. | 8,128 | 1,834 | |
| Eli Lilly & Co. | 6,083 | 1,509 | |
| * | DexCom Inc. | 2,554 | 1,437 |
| Bruker Corp. | 9,817 | 795 | |
| * | IDEXX Laboratories Inc. | 1,296 | 788 |
| Danaher Corp. | 2,216 | 713 | |
| * | Edwards Lifesciences Corp. | 5,659 | 607 |
| * | Shockwave Medical Inc. | 3,343 | 603 |
| * | Repligen Corp. | 1,960 | 562 |
| * | Inotiv Inc. | 10,296 | 535 |
| * | Tenet Healthcare Corp. | 6,918 | 504 |
| * | Prestige Consumer Healthcare Inc. | 8,305 | 465 |
| * | OptimizeRx Corp. | 6,566 | 427 |
| * | Omnicell Inc. | 2,332 | 413 |
| Agilent Technologies Inc. | 2,481 | 374 | |
| * | Align Technology Inc. | 590 | 361 |
| * | Intellia Therapeutics Inc. | 3,114 | 358 |
| Pfizer Inc. | 6,612 | 355 | |
| * | Biohaven Pharmaceutical Holding Co. Ltd. | 3,090 | 347 |
| * | CorVel Corp. | 1,753 | 330 |
| * | Apollo Medical Holdings Inc. | 3,123 | 293 |
| *,1 | Senseonics Holdings Inc. | 92,186 | 289 |
| Bio-Techne Corp. | 610 | 288 | |
| * | Avantor Inc. | 7,125 | 281 |
| * | Horizon Therapeutics plc | 2,595 | 269 |
| * | Laboratory Corp. of America Holdings | 923 | 263 |
| ResMed Inc. | 992 | 253 | |
| * | Joint Corp. | 3,111 | 249 |
| * | IQVIA Holdings Inc. | 947 | 245 |
| * | Cerevel Therapeutics Holdings Inc. | 7,846 | 245 |
| * | Avid Bioservices Inc. | 7,912 | 242 |
| * | Zentalis Pharmaceuticals Inc. | 2,955 | 242 |
| * | Prothena Corp. plc | 4,681 | 235 |
| * | Charles River Laboratories International Inc. | 637 | 233 |
| *,1 | Cassava Sciences Inc. | 4,347 | 232 |
| * | Dynavax Technologies Corp. | 14,305 | 231 |
| * | Anavex Life Sciences Corp. | 11,870 | 230 |
| * | Gritstone bio Inc. | 17,331 | 229 |
| Anthem Inc. | 556 | 226 | |
| * | Atossa Therapeutics Inc. | 97,060 | 220 |
| * | Innoviva Inc. | 12,681 | 212 |
| * | Celldex Therapeutics Inc. | 5,489 | 209 |
| * | Oramed Pharmaceuticals Inc. | 10,361 | 199 |
| * | BioCryst Pharmaceuticals Inc. | 16,360 | 197 |
| * | Intuitive Surgical Inc. | 606 | 197 |
| * | Ocugen Inc. | 30,814 | 195 |
| * | AngioDynamics Inc. | 7,168 | 185 |
| * | Acadia Healthcare Co. Inc. | 3,141 | 176 |
| * | Surgery Partners Inc. | 3,944 | 175 |
| * | IVERIC bio Inc. | 11,868 | 173 |
| West Pharmaceutical Services Inc. | 384 | 170 | |
| * | Morphic Holding Inc. | 3,536 | 169 |
| Owens & Minor Inc. | 4,115 | 165 | |
| * | Varex Imaging Corp. | 5,721 | 163 |
| Shares | Market Value• ($000) | ||
| * | EyePoint Pharmaceuticals Inc. | 10,249 | 162 |
| * | Arvinas Inc. | 1,950 | 147 |
| * | Alnylam Pharmaceuticals Inc. | 785 | 144 |
| *,1 | Cortexyme Inc. | 10,990 | 143 |
| * | PAVmed Inc. | 38,559 | 141 |
| * | Cytokinetics Inc. | 3,541 | 139 |
| * | Novavax Inc. | 665 | 139 |
| * | Fulgent Genetics Inc. | 1,491 | 139 |
| * | Brooklyn ImmunoTherapeutics Inc. | 23,288 | 139 |
| * | Fulcrum Therapeutics Inc. | 9,533 | 138 |
| * | Enanta Pharmaceuticals Inc. | 1,557 | 137 |
| * | Lexicon Pharmaceuticals Inc. | 29,980 | 137 |
| * | Lantheus Holdings Inc. | 4,987 | 134 |
| * | STAAR Surgical Co. | 1,397 | 133 |
| * | Asensus Surgical Inc. | 97,419 | 131 |
| Select Medical Holdings Corp. | 4,675 | 126 | |
| * | Veeva Systems Inc. Class A | 440 | 124 |
| * | Evolent Health Inc. Class A | 4,625 | 120 |
| *,1 | Greenwich Lifesciences Inc. | 3,745 | 118 |
| * | Curis Inc. | 23,703 | 116 |
| * | ViewRay Inc. | 22,597 | 116 |
| * | DaVita Inc. | 1,221 | 115 |
| *,1 | Citius Pharmaceuticals Inc. | 67,528 | 114 |
| * | Inspire Medical Systems Inc. | 506 | 113 |
| * | Intra-Cellular Therapies Inc. | 2,780 | 113 |
| * | VistaGen Therapeutics Inc. | 58,490 | 113 |
| * | Natera Inc. | 1,165 | 107 |
| * | Beam Therapeutics Inc. | 1,322 | 105 |
| * | Catalent Inc. | 810 | 104 |
| * | Alkermes plc | 4,624 | 101 |
| * | MannKind Corp. | 21,693 | 100 |
| * | Aclaris Therapeutics Inc. | 7,632 | 98 |
| * | Tandem Diabetes Care Inc. | 734 | 94 |
| * | Community Health Systems Inc. | 7,759 | 93 |
| * | Insulet Corp. | 323 | 93 |
| * | Fate Therapeutics Inc. | 1,658 | 91 |
| * | Inhibrx Inc. | 2,199 | 89 |
| LeMaitre Vascular Inc. | 1,861 | 87 | |
| * | Heska Corp. | 521 | 84 |
| * | Ideaya Biosciences Inc. | 3,714 | 82 |
| * | Myriad Genetics Inc. | 3,116 | 81 |
| * | Pacific Biosciences of California Inc. | 3,450 | 80 |
| * | Alector Inc. | 3,610 | 75 |
| * | Masimo Corp. | 266 | 74 |
| * | Twist Bioscience Corp. | 772 | 74 |
| * | Brookdale Senior Living Inc. | 12,205 | 71 |
| * | Rigel Pharmaceuticals Inc. | 24,604 | 66 |
| * | Kodiak Sciences Inc. | 695 | 64 |
| * | AtriCure Inc. | 998 | 63 |
| * | R1 RCM Inc. | 2,602 | 62 |
| * | RadNet Inc. | 2,275 | 61 |
| * | Affimed NV | 8,913 | 61 |
| * | MEDNAX Inc. | 2,329 | 57 |
| * | Medpace Holdings Inc. | 270 | 56 |
| * | Outlook Therapeutics Inc. | 37,327 | 56 |
| * | Castle Biosciences Inc. | 1,298 | 54 |
| * | SpringWorks Therapeutics Inc. | 727 | 52 |
| * | Meridian Bioscience Inc. | 2,545 | 51 |
| * | Penumbra Inc. | 204 | 50 |
| * | United Therapeutics Corp. | 266 | 50 |
| Zoetis Inc. | 225 | 50 | |
| * | ImmunoGen Inc. | 7,737 | 48 |
| Shares | Market Value• ($000) | ||
| * | Rubius Therapeutics Inc. | 3,708 | 46 |
| * | Veracyte Inc. | 1,112 | 46 |
| * | Novocure Ltd. | 489 | 46 |
| *,1 | Retractable Technologies Inc. | 5,156 | 45 |
| STERIS plc | 199 | 43 | |
| * | HealthStream Inc. | 1,796 | 42 |
| * | Crinetics Pharmaceuticals Inc. | 1,492 | 41 |
| * | TG Therapeutics Inc. | 2,650 | 40 |
| Thermo Fisher Scientific Inc. | 63 | 40 | |
| * | Option Care Health Inc. | 1,565 | 40 |
| Abbott Laboratories | 299 | 38 | |
| * | Quanterix Corp. | 962 | 38 |
| * | LHC Group Inc. | 327 | 37 |
| * | Verastem Inc. | 13,868 | 37 |
| * | Ampio Pharmaceuticals Inc. | 31,519 | 36 |
| * | Marinus Pharmaceuticals Inc. | 3,223 | 36 |
| * | Lineage Cell Therapeutics Inc. | 15,558 | 35 |
| * | Cutera Inc. | 879 | 31 |
| * | Vericel Corp. | 811 | 30 |
| * | ClearPoint Neuro Inc. | 2,176 | 30 |
| * | Seelos Therapeutics Inc. | 16,831 | 29 |
| 30,472 | |||
| Industrials (14.1%) | |||
| Johnson Controls International plc | 33,706 | 2,520 | |
| Capital One Financial Corp. | 11,918 | 1,675 | |
| Carrier Global Corp. | 18,163 | 983 | |
| Deere & Co. | 2,619 | 905 | |
| Eaton Corp. plc | 4,462 | 723 | |
| Automatic Data Processing Inc. | 3,113 | 719 | |
| * | Square Inc. Class A | 3,161 | 659 |
| American Express Co. | 4,123 | 628 | |
| General Electric Co. | 5,344 | 508 | |
| * | Waters Corp. | 1,484 | 487 |
| Eagle Materials Inc. | 3,024 | 466 | |
| Equifax Inc. | 1,658 | 462 | |
| * | Generac Holdings Inc. | 1,057 | 445 |
| * | Cross Country Healthcare Inc. | 16,571 | 433 |
| * | PayPal Holdings Inc. | 2,256 | 417 |
| Zurn Water Solutions Corp. | 11,855 | 415 | |
| Northrop Grumman Corp. | 1,128 | 393 | |
| * | Veritiv Corp. | 2,997 | 378 |
| * | AMN Healthcare Services Inc. | 3,303 | 377 |
| * | Bill.Com Holdings Inc. | 1,339 | 376 |
| * | Aspen Aerogels Inc. | 6,279 | 359 |
| * | Chart Industries Inc. | 2,003 | 350 |
| United Parcel Service Inc. Class B | 1,722 | 342 | |
| nVent Electric plc | 9,127 | 318 | |
| General Dynamics Corp. | 1,678 | 317 | |
| * | WESCO International Inc. | 2,557 | 317 |
| Pentair plc | 4,242 | 313 | |
| Sealed Air Corp. | 4,928 | 306 | |
| Watts Water Technologies Inc. Class A | 1,619 | 306 | |
| * | Atkore Inc. | 2,817 | 300 |
| * | Donnelley Financial Solutions Inc. | 6,315 | 295 |
| Robert Half International Inc. | 2,646 | 294 | |
| * | Trex Co. Inc. | 2,131 | 283 |
| CRA International Inc. | 3,030 | 279 | |
| Acuity Brands Inc. | 1,312 | 264 | |
| Quanta Services Inc. | 2,227 | 253 | |
| Synchrony Financial | 5,602 | 251 | |
| Herc Holdings Inc. | 1,404 | 239 | |
| * | Safe Bulkers Inc. | 65,656 | 238 |
| Shares | Market Value• ($000) | ||
| Accenture plc Class A | 659 | 236 | |
| Genco Shipping & Trading Ltd. | 14,794 | 228 | |
| * | Ranpak Holdings Corp. Class A | 5,613 | 222 |
| Norfolk Southern Corp. | 828 | 220 | |
| * | MYR Group Inc. | 1,959 | 217 |
| Shyft Group Inc. | 4,309 | 209 | |
| EnPro Industries Inc. | 1,978 | 202 | |
| * | BlueLinx Holdings Inc. | 2,534 | 179 |
| Eagle Bulk Shipping Inc. | 4,428 | 177 | |
| Korn Ferry | 2,392 | 174 | |
| Regal Rexnord Corp. | 1,084 | 171 | |
| * | TopBuild Corp. | 622 | 168 |
| * | Atlanticus Holdings Corp. | 2,679 | 159 |
| Helios Technologies Inc. | 1,577 | 158 | |
| Costamare Inc. | 12,930 | 155 | |
| Valmont Industries Inc. | 638 | 152 | |
| Carlisle Cos. Inc. | 662 | 149 | |
| Kforce Inc. | 1,944 | 149 | |
| Fortune Brands Home & Security Inc. | 1,354 | 136 | |
| * | Saia Inc. | 410 | 136 |
| * | ExlService Holdings Inc. | 1,039 | 135 |
| * | Keysight Technologies Inc. | 694 | 135 |
| Old Dominion Freight Line Inc. | 375 | 133 | |
| Textron Inc. | 1,831 | 130 | |
| Kadant Inc. | 479 | 112 | |
| ArcBest Corp. | 1,074 | 111 | |
| Heidrick & Struggles International Inc. | 2,516 | 109 | |
| Trane Technologies plc | 585 | 109 | |
| * | NV5 Global Inc. | 822 | 108 |
| Advanced Drainage Systems Inc. | 846 | 105 | |
| * | Middleby Corp. | 591 | 103 |
| * | Textainer Group Holdings Ltd. | 3,137 | 102 |
| * | Builders FirstSource Inc. | 1,450 | 101 |
| Greenbrier Cos. Inc. | 2,493 | 100 | |
| Maxar Technologies Inc. | 3,610 | 99 | |
| * | CryoPort Inc. | 1,475 | 98 |
| * | Axon Enterprise Inc. | 562 | 95 |
| AGCO Corp. | 751 | 83 | |
| * | Paylocity Holding Corp. | 317 | 80 |
| * | Cornerstone Building Brands Inc. | 4,859 | 76 |
| * | Energy Recovery Inc. | 3,545 | 75 |
| Ryder System Inc. | 877 | 73 | |
| * | XPO Logistics Inc. | 992 | 72 |
| * | API Group Corp. | 3,078 | 72 |
| * | Masonite International Corp. | 655 | 70 |
| * | MasTec Inc. | 764 | 70 |
| Cintas Corp. | 162 | 68 | |
| Mastercard Inc. Class A | 214 | 67 | |
| Pitney Bowes Inc. | 9,481 | 65 | |
| Installed Building Products Inc. | 488 | 63 | |
| * | Triumph Group Inc. | 3,400 | 57 |
| Brunswick Corp. | 597 | 56 | |
| MKS Instruments Inc. | 359 | 55 | |
| * | TrueBlue Inc. | 2,130 | 55 |
| * | Construction Partners Inc. Class A | 1,466 | 51 |
| EMCOR Group Inc. | 428 | 51 | |
| * | Resideo Technologies Inc. | 1,918 | 50 |
| Franklin Electric Co. Inc. | 535 | 47 |
| Shares | Market Value• ($000) | ||
| * | Montrose Environmental Group Inc. | 642 | 47 |
| * | Titan Machinery Inc. | 1,346 | 45 |
| * | Mohawk Industries Inc. | 262 | 44 |
| Patrick Industries Inc. | 558 | 44 | |
| Exponent Inc. | 353 | 41 | |
| * | Zebra Technologies Corp. Class A | 70 | 41 |
| * | Titan International Inc. | 5,223 | 36 |
| * | Teekay Corp. | 10,401 | 35 |
| Cognex Corp. | 429 | 33 | |
| * | Commercial Vehicle Group Inc. | 3,666 | 31 |
| * | GreenBox POS | 5,490 | 29 |
| 26,857 | |||
| Real Estate (0.7%) | |||
| * | Jones Lang LaSalle Inc. | 2,528 | 594 |
| Newmark Group Inc. Class A | 13,001 | 209 | |
| * | Radius Global Infrastructure Inc. Class A (XNMS) | 8,491 | 140 |
| eXp World Holdings Inc. | �� 2,495 | 92 | |
| * | Redfin Corp. | 2,073 | 84 |
| * | Zillow Group Inc. Class C | 1,287 | 70 |
| * | CoStar Group Inc. | 736 | 57 |
| * | Realogy Holdings Corp. | 3,022 | 46 |
| * | CBRE Group Inc. Class A | 400 | 38 |
| 1,330 | |||
| Technology (13.1%) | |||
| Oracle Corp. | 20,146 | 1,828 | |
| NVIDIA Corp. | 4,728 | 1,545 | |
| * | Alphabet Inc. Class C | 468 | 1,333 |
| Microsoft Corp. | 3,682 | 1,217 | |
| Intuit Inc. | 1,844 | 1,203 | |
| Apple Inc. | 6,181 | 1,022 | |
| * | Alphabet Inc. Class A | 312 | 885 |
| Applied Materials Inc. | 4,819 | 709 | |
| * | Synaptics Inc. | 2,371 | 669 |
| * | Fortinet Inc. | 1,943 | 645 |
| * | Atlassian Corp. plc Class A | 1,712 | 644 |
| * | Cloudflare Inc. Class A | 2,907 | 547 |
| * | Gartner Inc. | 1,687 | 527 |
| * | Crowdstrike Holdings Inc. Class A | 2,211 | 480 |
| * | Asana Inc. Class A | 4,315 | 449 |
| * | HubSpot Inc. | 535 | 432 |
| * | Perficient Inc. | 2,959 | 405 |
| * | Advanced Micro Devices Inc. | 2,434 | 385 |
| * | Palantir Technologies Inc. Class A | 17,993 | 372 |
| * | EPAM Systems Inc. | 581 | 354 |
| * | Rapid7 Inc. | 2,715 | 337 |
| * | Teradata Corp. | 7,692 | 334 |
| Lam Research Corp. | 463 | 315 | |
| * | Palo Alto Networks Inc. | 566 | 310 |
| * | Workiva Inc. Class A | 2,218 | 309 |
| Entegris Inc. | 2,074 | 303 | |
| * | Grid Dynamics Holdings Inc. | 6,861 | 269 |
| * | Arrow Electronics Inc. | 2,081 | 253 |
| * | MicroStrategy Inc. Class A | 348 | 251 |
| * | Ziff Davis Inc. | 2,167 | 247 |
| * | Zscaler Inc. | 705 | 245 |
| * | MongoDB Inc. Class A | 484 | 241 |
| * | Rimini Street Inc. | 34,798 | 230 |
| NortonLifeLock Inc. | 9,132 | 227 | |
| * | Identiv Inc. | 8,554 | 197 |
| * | Digital Turbine Inc. | 3,548 | 188 |
| Shares | Market Value• ($000) | ||
| * | DocuSign Inc. Class A | 751 | 185 |
| * | Dropbox Inc. Class A | 6,969 | 171 |
| * | Datadog Inc. Class A | 910 | 162 |
| * | SPS Commerce Inc. | 1,108 | 156 |
| Teradyne Inc. | 1,014 | 155 | |
| * | Cadence Design Systems Inc. | 870 | 154 |
| * | Ultra Clean Holdings Inc. | 2,733 | 150 |
| * | Sitime Corp. | 495 | 148 |
| * | Veritone Inc. | 5,538 | 142 |
| * | MACOM Technology Solutions Holdings Inc. Class H | 1,915 | 138 |
| KLA Corp. | 334 | 136 | |
| * | Globant SA | 496 | 131 |
| * | Twitter Inc. | 2,885 | 127 |
| * | Lattice Semiconductor Corp. | 1,629 | 124 |
| * | 3D Systems Corp. | 5,450 | 124 |
| * | Avid Technology Inc. | 3,824 | 123 |
| * | Mimecast Ltd. | 1,514 | 123 |
| * | DXC Technology Co. | 4,054 | 122 |
| Monolithic Power Systems Inc. | 197 | 109 | |
| * | Box Inc. Class A | 4,559 | 107 |
| * | FormFactor Inc. | 2,473 | 104 |
| Vertiv Holdings Co. Class A | 3,978 | 102 | |
| * | IAC/InterActiveCorp. | 754 | 101 |
| * | Paycom Software Inc. | 226 | 99 |
| * | Atomera Inc. | 4,064 | 98 |
| * | Coupa Software Inc. | 482 | 95 |
| Shutterstock Inc. | 827 | 94 | |
| * | Sprout Social Inc. Class A | 829 | 93 |
| Broadcom Inc. | 154 | 85 | |
| * | Okta Inc. | 393 | 85 |
| * | RingCentral Inc. Class A | 393 | 85 |
| Bentley Systems Inc. Class B | 1,738 | 83 | |
| NetApp Inc. | 913 | 81 | |
| * | Upwork Inc. | 2,046 | 76 |
| * | Domo Inc. Class B | 1,034 | 75 |
| * | Manhattan Associates Inc. | 476 | 74 |
| * | Ambarella Inc. | 386 | 69 |
| * | Qorvo Inc. | 446 | 65 |
| * | TechTarget Inc. | 674 | 65 |
| * | SecureWorks Corp. Class A | 3,472 | 62 |
| * | Avaya Holdings Corp. | 3,013 | 59 |
| * | II-VI Inc. | 911 | 57 |
| * | Synopsys Inc. | 158 | 54 |
| Skyworks Solutions Inc. | 349 | 53 | |
| * | Cerence Inc. | 669 | 50 |
| * | Novanta Inc. | 298 | 48 |
| KBR Inc. | 1,052 | 46 | |
| * | Unisys Corp. | 2,526 | 46 |
| * | Agilysys Inc. | 984 | 43 |
| * | CEVA Inc. | 935 | 41 |
| TD SYNNEX Corp. | 355 | 37 | |
| * | Magnite Inc. | 1,920 | 34 |
| * | LivePerson Inc. | 790 | 30 |
| * | Everbridge Inc. | 259 | 29 |
| 25,012 |
| Shares | Market Value• ($000) | ||
| Telecommunications (1.6%) | |||
| Cisco Systems Inc. | 7,506 | 412 | |
| Motorola Solutions Inc. | 1,286 | 326 | |
| * | WideOpenWest Inc. | 13,361 | 248 |
| * | Calix Inc. | 3,583 | 240 |
| * | Arista Networks Inc. | 1,899 | 236 |
| * | Charter Communications Inc. Class A | 351 | 227 |
| * | IDT Corp. Class B | 3,963 | 215 |
| * | Anterix Inc. | 3,523 | 212 |
| * | Extreme Networks Inc. | 11,912 | 161 |
| * | Globalstar Inc. | 104,932 | 146 |
| * | T-Mobile US Inc. | 1,223 | 133 |
| * | Gogo Inc. | 8,866 | 114 |
| * | Clearfield Inc. | 1,328 | 86 |
| Ubiquiti Inc. | 249 | 74 | |
| * | Consolidated Communications Holdings Inc. | 9,242 | 69 |
| * | Aviat Networks Inc. | 1,721 | 54 |
| Cable One Inc. | 27 | 48 | |
| * | Infinera Corp. | 5,709 | 46 |
| * | Roku Inc. | 137 | 31 |
| 3,078 | |||
| Utilities (0.5%) | |||
| Waste Management Inc. | 5,264 | 846 | |
| * | Evoqua Water Technologies Corp. | 1,097 | 49 |
| 895 | |||
| Total Common Stocks (Cost $158,132) | 189,975 | ||
| Temporary Cash Investments (1.0%) | |||
| Money Market Fund (1.0%) | |||
| 2,3 | Vanguard Market Liquidity Fund, 0.077% (Cost $1,908) | 19,077 | 1,908 |
| Total Investments (100.5%) (Cost $160,040) | 191,883 | ||
| Other Assets and Liabilities—Net (-0.5%) | (967) | ||
| Net Assets (100%) | 190,916 | ||
| Cost is in $000. | |||
| • | See Note A in Notes to Financial Statements. |
| * | Non-income-producing security. |
| 1 | Includes partial security positions on loan to broker-dealers. The total value of securities on loan is $1,042,000. |
| 2 | Affiliated money market fund available only to Vanguard funds and certain trusts and accounts managed by Vanguard. Rate shown is the 7-day yield. |
| 3 | Collateral of $1,151,000 was received for securities on loan. |
| Futures Contracts | ||||
| ($000) | ||||
| Expiration | Number of Long (Short) Contracts | Notional Amount | Value and Unrealized Appreciation (Depreciation) | |
| Long Futures Contracts | ||||
| E-mini S&P 500 Index | December 2021 | 3 | 685 | 12 |
| Micro E-mini S&P 500 Index | December 2021 | 4 | 91 | 4 |
| 16 | ||||
| ($000s, except shares and per-share amounts) | Amount |
| Assets | |
| Investments in Securities, at Value | |
| Unaffiliated Issuers (Cost $158,132) | 189,975 |
| Affiliated Issuers (Cost $1,908) | 1,908 |
| Total Investments in Securities | 191,883 |
| Investment in Vanguard | 6 |
| Cash | 156 |
| Cash Collateral Pledged—Futures Contracts | 46 |
| Receivables for Accrued Income | 167 |
| Receivables for Capital Shares Issued | 3,303 |
| Total Assets | 195,561 |
| Liabilities | |
| Payables for Investment Securities Purchased | 3,469 |
| Collateral for Securities on Loan | 1,151 |
| Payables to Vanguard | 11 |
| Variation Margin Payable—Futures Contracts | 14 |
| Total Liabilities | 4,645 |
| Net Assets | 190,916 |
| At November 30, 2021, net assets consisted of: | |
| Paid-in Capital | 163,272 |
| Total Distributable Earnings (Loss) | 27,644 |
| Net Assets | 190,916 |
| Net Assets | |
| Applicable to 1,445,000 outstanding $.001 par value shares of beneficial interest (unlimited authorization) | 190,916 |
| Net Asset Value Per Share | $132.12 |
| Year Ended November 30, 2021 | |
| ($000) | |
| Investment Income | |
| Income | |
| Dividends | 1,282 |
| Interest1 | — |
| Securities Lending—Net | 29 |
| Total Income | 1,311 |
| Expenses | |
| The Vanguard Group—Note B | |
| Investment Advisory Services | 85 |
| Management and Administrative | 21 |
| Marketing and Distribution | 3 |
| Custodian Fees | 13 |
| Auditing Fees | 31 |
| Shareholders’ Reports | 5 |
| Trustees’ Fees and Expenses | — |
| Total Expenses | 158 |
| Net Investment Income | 1,153 |
| Realized Net Gain (Loss) | |
| Investment Securities Sold1,2 | (49) |
| Futures Contracts | 96 |
| Realized Net Gain (Loss) | 47 |
| Change in Unrealized Appreciation (Depreciation) | |
| Investment Securities1 | 16,403 |
| Futures Contracts | — |
| Change in Unrealized Appreciation (Depreciation) | 16,403 |
| Net Increase (Decrease) in Net Assets Resulting from Operations | 17,603 |
| 1 | Interest income, realized net gain (loss), and change in unrealized appreciation (depreciation) from an affiliated company of the fund were less than $1,000, less than $1,000, and less than $1,000, respectively. Purchases and sales are for temporary cash investment purposes. |
| 2 | Includes $2,683,000 of net gain (loss) resulting from in-kind redemptions. |
| Year Ended November 30, | ||
| 2021 ($000) | 2020 ($000) | |
| Increase (Decrease) in Net Assets | ||
| Operations | ||
| Net Investment Income | 1,153 | 278 |
| Realized Net Gain (Loss) | 47 | 4,610 |
| Change in Unrealized Appreciation (Depreciation) | 16,403 | 10,414 |
| Net Increase (Decrease) in Net Assets Resulting from Operations | 17,603 | 15,302 |
| Distributions | ||
| Total Distributions | (717) | (299) |
| Capital Share Transactions | ||
| Issued | 124,004 | 25,852 |
| Issued in Lieu of Cash Distributions | — | — |
| Redeemed | (8,454) | (14,317) |
| Net Increase (Decrease) from Capital Share Transactions | 115,550 | 11,535 |
| Total Increase (Decrease) | 132,436 | 26,538 |
| Net Assets | ||
| Beginning of Period | 58,480 | 31,942 |
| End of Period | 190,916 | 58,480 |
| For a Share Outstanding Throughout Each Period | Year Ended November 30, | February 13, 20181 to November 30, 2018 | ||
| 2021 | 2020 | 2019 | ||
| Net Asset Value, Beginning of Period | $106.33 | $85.18 | $76.73 | $75.00 |
| Investment Operations | ||||
| Net Investment Income2 | 1.227 | .552 | .985 | .538 |
| Net Realized and Unrealized Gain (Loss) on Investments | 25.325 | 21.279 | 8.336 | 1.489 |
| Total from Investment Operations | 26.552 | 21.831 | 9.321 | 2.027 |
| Distributions | ||||
| Dividends from Net Investment Income | (.762) | (.681) | (.871) | (.297) |
| Distributions from Realized Capital Gains | — | — | — | — |
| Total Distributions | (.762) | (.681) | (.871) | (.297) |
| Net Asset Value, End of Period | $132.12 | $106.33 | $85.18 | $76.73 |
| Total Return | 25.01% | 25.91% | 12.25% | 2.67% |
| Ratios/Supplemental Data | ||||
| Net Assets, End of Period (Millions) | $191 | $58 | $32 | $33 |
| Ratio of Total Expenses to Average Net Assets | 0.13% | 0.13% | 0.13% | 0.13%3 |
| Ratio of Net Investment Income to Average Net Assets | 0.95% | 0.62% | 1.24% | 0.83%3 |
| Portfolio Turnover Rate | 103%4 | 115%4 | 118% | 53% |
| 1 | Inception. |
| 2 | Calculated based on average shares outstanding. |
| 3 | Annualized. |
| 4 | Excludes the value of portfolio securities received or delivered as a result of in-kind purchases or redemptions of the fund’s capital shares, including ETF Creation Units. |
| A. | The following significant accounting policies conform to generally accepted accounting principles for U.S. investment companies. The fund consistently follows such policies in preparing its financial statements. |
| B. | In accordance with the terms of a Funds' Service Agreement (the “FSA”) between Vanguard and the fund, Vanguard furnishes to the fund investment advisory, corporate management, administrative, marketing, and distribution services at Vanguard’s cost of operations (as defined by the FSA). These costs of operations are allocated to the fund based on methods and guidelines approved by the board of trustees and are generally settled twice a month. |
| C. | Various inputs may be used to determine the value of the fund’s investments and derivatives. These inputs are summarized in three broad levels for financial statement purposes. The inputs or methodologies used to value securities are not necessarily an indication of the risk associated with investing in those securities. |
| D. | Permanent differences between book-basis and tax-basis components of net assets are reclassified among capital accounts in the financial statements to reflect their tax character. These reclassifications have no effect on net assets or net asset value per share. As of period end, permanent differences primarily attributable to the accounting for in-kind redemptions and passive foreign investment companies were reclassified between the following accounts: |
| Amount ($000) | |
| Paid-in Capital | 2,683 |
| Total Distributable Earnings (Loss) | (2,683) |
| Amount ($000) | |
| Undistributed Ordinary Income | 523 |
| Undistributed Long-Term Gains | — |
| Capital Loss Carryforwards | (4,512) |
| Qualified Late-Year Losses | — |
| Net Unrealized Gains (Losses) | 31,633 |
| Year Ended November 30, | ||
| 2021 Amount ($000) | 2020 Amount ($000) | |
| Ordinary Income* | 717 | 299 |
| Long-Term Capital Gains | — | — |
| Total | 717 | 299 |
| * | Includes short-term capital gains, if any. |
| Amount ($000) | |
| Tax Cost | 160,251 |
| Gross Unrealized Appreciation | 37,044 |
| Gross Unrealized Depreciation | (5,411) |
| Net Unrealized Appreciation (Depreciation) | 31,633 |
| E. | During the year ended November 30, 2021, the fund purchased $248,422,000 of investment securities and sold $132,757,000 of investment securities, other than temporary cash investments. Purchases and sales include $0 and $8,433,000, respectively, in connection with in-kind purchases and redemptions of the fund's capital shares. |
| F. | Capital shares issued and redeemed were: |
| Year Ended November 30, | ||
| 2021 Shares (000) | 2020 Shares (000) | |
| Issued | 960 | 325 |
| Issued in Lieu of Cash Distributions | — | — |
| Redeemed | (65) | (150) |
| Net Increase (Decrease) in Shares Outstanding | 895 | 175 |
| G. | Management has determined that no events or transactions occurred subsequent to November 30, 2021, that would require recognition or disclosure in these financial statements. |

| Average Annual Total Returns Periods Ended November 30, 2021 | ||||
| One Year | Since Inception (2/13/2018) | Final Value of a $10,000 Investment | ||
| U.S. Multifactor ETF Net Asset Value | 31.43% | 10.51% | $14,612 |
| U.S. Multifactor ETF Market Price | 31.32 | 10.52 | 14,616 | |
| Russell 3000 Index | 26.34 | 17.17 | 18,243 |
| One Year | Since Inception (2/13/2018) | |
| U.S. Multifactor ETF Market Price | 31.32% | 46.16% |
| U.S. Multifactor ETF Net Asset Value | 31.43 | 46.12 |
| Russell 3000 Index | 26.34 | 82.43 |
| Basic Materials | 4.2% |
| Consumer Discretionary | 19.0 |
| Consumer Staples | 5.9 |
| Energy | 9.1 |
| Financials | 24.6 |
| Health Care | 10.6 |
| Industrials | 16.0 |
| Real Estate | 0.1 |
| Technology | 9.2 |
| Telecommunications | 1.3 |
| Shares | Market Value• ($000) | ||
| Common Stocks (99.5%) | |||
| Basic Materials (4.1%) | |||
| Freeport-McMoRan Inc. | 21,106 | 783 | |
| Reliance Steel & Aluminum Co. | 2,590 | 385 | |
| Olin Corp. | 6,556 | 356 | |
| UFP Industries Inc. | 3,831 | 319 | |
| Boise Cascade Co. | 4,406 | 286 | |
| Southern Copper Corp. | 4,184 | 245 | |
| Schnitzer Steel Industries Inc. Class A | 4,055 | 195 | |
| Nucor Corp. | 1,746 | 186 | |
| Celanese Corp. Class A | 1,190 | 180 | |
| AdvanSix Inc. | 3,926 | 178 | |
| Verso Corp. Class A | 8,134 | 172 | |
| Steel Dynamics Inc. | 2,825 | 169 | |
| CF Industries Holdings Inc. | 2,358 | 143 | |
| Timken Co. | 1,840 | 121 | |
| International Paper Co. | 2,467 | 112 | |
| Dow Inc. | 1,986 | 109 | |
| Materion Corp. | 917 | 78 | |
| Commercial Metals Co. | 2,443 | 75 | |
| Stepan Co. | 631 | 71 | |
| US Steel Corp. | 3,156 | 71 | |
| Fastenal Co. | 1,076 | 64 | |
| Tredegar Corp. | 5,775 | 63 | |
| LyondellBasell Industries NV Class A | 644 | 56 | |
| Cabot Corp. | 908 | 48 | |
| Olympic Steel Inc. | 2,219 | 45 | |
| Valvoline Inc. | 1,053 | 36 | |
| Worthington Industries Inc. | 551 | 26 | |
| 4,572 | |||
| Consumer Discretionary (19.0%) | |||
| Target Corp. | 4,519 | 1,102 | |
| Ford Motor Co. | 34,054 | 653 | |
| Lowe's Cos. Inc. | 2,599 | 636 | |
| Bath & Body Works Inc. | 7,803 | 586 | |
| eBay Inc. | 8,591 | 580 | |
| * | AutoNation Inc. | 4,199 | 520 |
| Dick's Sporting Goods Inc. | 4,418 | 519 | |
| Dillard's Inc. Class A | 1,888 | 517 | |
| Williams-Sonoma Inc. | 1,980 | 386 | |
| Fox Corp. Class A | 10,641 | 380 | |
| H&R Block Inc. | 15,743 | 373 | |
| Macy's Inc. | 12,935 | 369 | |
| Hibbett Inc. | 4,349 | 339 | |
| Omnicom Group Inc. | 4,964 | 334 | |
| Movado Group Inc. | 7,137 | 320 | |
| Shares | Market Value• ($000) | ||
| Signet Jewelers Ltd. | 3,262 | 317 | |
| Scholastic Corp. | 8,407 | 316 | |
| * | Etsy Inc. | 1,115 | 306 |
| Travel + Leisure Co. | 6,043 | 297 | |
| * | Citi Trends Inc. | 3,210 | 272 |
| International Game Technology plc | 9,667 | 261 | |
| Whirlpool Corp. | 1,106 | 241 | |
| Rent-A-Center Inc. | 5,390 | 238 | |
| Lennar Corp. Class A | 2,193 | 230 | |
| * | Crocs Inc. | 1,398 | 229 |
| * | Abercrombie & Fitch Co. Class A | 6,195 | 223 |
| * | Deckers Outdoor Corp. | 536 | 217 |
| * | Liquidity Services Inc. | 9,521 | 216 |
| * | Lululemon Athletica Inc. | 453 | 206 |
| * | MarineMax Inc. | 3,796 | 202 |
| Group 1 Automotive Inc. | 1,011 | 197 | |
| Buckle Inc. | 4,154 | 195 | |
| Hanesbrands Inc. | 12,094 | 195 | |
| * | BJ's Wholesale Club Holdings Inc. | 2,904 | 192 |
| Interpublic Group of Cos. Inc. | 5,662 | 188 | |
| * | Turtle Beach Corp. | 6,663 | 179 |
| Lithia Motors Inc. Class A | 601 | 175 | |
| Nexstar Media Group Inc. Class A | 1,147 | 171 | |
| Qurate Retail Inc. Series A | 21,007 | 168 | |
| Gentex Corp. | 4,851 | 167 | |
| PVH Corp. | 1,504 | 161 | |
| * | Helen of Troy Ltd. | 655 | 158 |
| * | Sleep Number Corp. | 1,903 | 152 |
| Shoe Carnival Inc. | 3,830 | 150 | |
| PulteGroup Inc. | 2,974 | 149 | |
| Lear Corp. | 884 | 148 | |
| * | O'Reilly Automotive Inc. | 232 | 148 |
| * | Gentherm Inc. | 1,622 | 137 |
| Century Communities Inc. | 1,914 | 136 | |
| * | NVR Inc. | 26 | 136 |
| Sonic Automotive Inc. Class A | 2,970 | 133 | |
| Garmin Ltd. | 985 | 132 | |
| * | Conn's Inc. | 5,895 | 129 |
| * | XPEL Inc. | 1,784 | 128 |
| Costco Wholesale Corp. | 233 | 126 | |
| * | Malibu Boats Inc. Class A | 1,801 | 125 |
| Best Buy Co. Inc. | 1,111 | 119 | |
| Tapestry Inc. | 2,962 | 119 | |
| Johnson Outdoors Inc. Class A | 1,139 | 118 | |
| * | Zumiez Inc. | 2,583 | 118 |
| Shares | Market Value• ($000) | ||
| * | ODP Corp. | 3,138 | 118 |
| * | GoPro Inc. Class A | 11,609 | 116 |
| Laureate Education Inc. Class A | 11,399 | 114 | |
| * | RH | 191 | 111 |
| * | Central Garden & Pet Co. Class A | 2,518 | 109 |
| * | Master Craft Boat Holdings Inc. | 3,978 | 109 |
| Kontoor Brands Inc. | 2,010 | 108 | |
| * | Take-Two Interactive Software Inc. | 652 | 108 |
| HNI Corp. | 2,684 | 106 | |
| News Corp. Class B | 4,900 | 106 | |
| * | 1-800-Flowers.com Inc. Class A | 3,576 | 106 |
| Penske Automotive Group Inc. | 1,051 | 105 | |
| Tractor Supply Co. | 463 | 104 | |
| Activision Blizzard Inc. | 1,751 | 103 | |
| Dana Inc. | 4,754 | 102 | |
| Acushnet Holdings Corp. | 1,854 | 101 | |
| * | Vera Bradley Inc. | 10,671 | 101 |
| Rush Enterprises Inc. Class A | 1,894 | 97 | |
| * | Asbury Automotive Group Inc. | 579 | 95 |
| Foot Locker Inc. | 2,076 | 95 | |
| Estee Lauder Cos. Inc. Class A | 285 | 95 | |
| * | Clean Energy Fuels Corp. | 13,136 | 94 |
| Polaris Inc. | 815 | 91 | |
| LKQ Corp. | 1,603 | 90 | |
| * | YETI Holdings Inc. | 976 | 90 |
| Matthews International Corp. Class A | 2,448 | 85 | |
| Walmart Inc. | 587 | 83 | |
| Entravision Communications Corp. Class A | 11,020 | 82 | |
| * | Beazer Homes USA Inc. | 4,105 | 81 |
| * | Duluth Holdings Inc. Class B | 5,843 | 81 |
| Haverty Furniture Cos. Inc. | 2,706 | 81 | |
| * | Meritage Homes Corp. | 721 | 81 |
| Toll Brothers Inc. | 1,263 | 80 | |
| Newell Brands Inc. | 3,678 | 79 | |
| Advance Auto Parts Inc. | 342 | 75 | |
| Kohl's Corp. | 1,427 | 73 | |
| Ethan Allen Interiors Inc. | 3,207 | 72 | |
| Rocky Brands Inc. | 1,992 | 71 | |
| John Wiley & Sons Inc. Class A | 1,309 | 68 | |
| TEGNA Inc. | 3,329 | 66 | |
| * | Perdoceo Education Corp. | 6,651 | 66 |
| * | Cars.com Inc. | 3,878 | 65 |
| * | Boot Barn Holdings Inc. | 511 | 63 |
| * | Callaway Golf Co. | 2,252 | 61 |
| * | Copart Inc. | 420 | 61 |
| * | Tri Pointe Homes Inc. | 2,423 | 61 |
| * | Goodyear Tire & Rubber Co. | 2,975 | 60 |
| News Corp. Class A | 2,752 | 59 | |
| Oxford Industries Inc. | 609 | 58 | |
| * | General Motors Co. | 976 | 56 |
| * | Skyline Champion Corp. | 702 | 55 |
| * | Universal Electronics Inc. | 1,446 | 52 |
| * | PROG Holdings Inc. | 1,109 | 50 |
| Murphy USA Inc. | 257 | 45 | |
| Genuine Parts Co. | 342 | 44 | |
| * | American Axle & Manufacturing Holdings Inc. | 4,580 | 41 |
| La-Z-Boy Inc. | 1,113 | 37 | |
| * | Revolve Group Inc. | 480 | 37 |
| Global Industrial Co. | 912 | 37 | |
| * | Lands' End Inc. | 1,495 | 34 |
| Shares | Market Value• ($000) | ||
| Tilly's Inc. Class A | 2,291 | 34 | |
| Steven Madden Ltd. | 575 | 27 | |
| Gap Inc. | 1,554 | 26 | |
| * | iRobot Corp. | 320 | 24 |
| * | AMC Networks Inc. Class A | 595 | 23 |
| * | Lazydays Holdings Inc. | 1,055 | 21 |
| ViacomCBS Inc. Class A | 556 | 19 | |
| Aaron's Co. Inc. | 869 | 19 | |
| 20,901 | |||
| Consumer Staples (5.8%) | |||
| Philip Morris International Inc. | 16,157 | 1,388 | |
| Tyson Foods Inc. Class A | 8,771 | 693 | |
| Kroger Co. | 15,632 | 649 | |
| CVS Health Corp. | 6,334 | 564 | |
| Ingles Markets Inc. Class A | 7,227 | 555 | |
| SpartanNash Co. | 12,479 | 299 | |
| Weis Markets Inc. | 4,195 | 264 | |
| Altria Group Inc. | 5,435 | 232 | |
| McKesson Corp. | 892 | 193 | |
| Albertsons Cos. Inc. Class A | 5,384 | 189 | |
| * | Monster Beverage Corp. | 2,054 | 172 |
| Flowers Foods Inc. | 5,529 | 143 | |
| * | Darling Ingredients Inc. | 2,099 | 142 |
| AmerisourceBergen Corp. Class A | 1,105 | 128 | |
| Kraft Heinz Co. | 3,664 | 123 | |
| * | PLBY Group Inc. | 2,667 | 102 |
| * | BellRing Brands Inc. Class A | 4,579 | 99 |
| Lancaster Colony Corp. | 642 | 94 | |
| Coca-Cola Consolidated Inc. | 163 | 93 | |
| * | Hain Celestial Group Inc. | 2,112 | 83 |
| Edgewell Personal Care Co. | 1,688 | 72 | |
| Casey's General Stores Inc. | 360 | 70 | |
| * | USANA Health Sciences Inc. | 542 | 54 |
| John B Sanfilippo & Son Inc. | 603 | 50 | |
| 6,451 | |||
| Energy (9.1%) | |||
| EOG Resources Inc. | 13,665 | 1,189 | |
| Exxon Mobil Corp. | 18,940 | 1,133 | |
| ConocoPhillips | 9,826 | 689 | |
| Civitas Resources Inc. | 9,553 | 488 | |
| Cheniere Energy Inc. | 4,626 | 485 | |
| Marathon Oil Corp. | 27,230 | 422 | |
| Northern Oil and Gas Inc. | 17,999 | 367 | |
| Schlumberger NV | 11,284 | 324 | |
| * | Centrus Energy Corp. Class A | 5,178 | 287 |
| PDC Energy Inc. | 5,008 | 253 | |
| * | CONSOL Energy Inc. | 10,749 | 236 |
| Oasis Petroleum Inc. | 1,902 | 228 | |
| * | W&T Offshore Inc. | 64,381 | 221 |
| Continental Resources Inc. | 4,908 | 218 | |
| * | Range Resources Corp. | 10,941 | 214 |
| * | Southwestern Energy Co. | 47,625 | 213 |
| * | ChampionX Corp. | 9,702 | 198 |
| Targa Resources Corp. | 3,751 | 194 | |
| Antero Midstream Corp. | 19,230 | 187 | |
| SunCoke Energy Inc. | 29,470 | 179 | |
| Occidental Petroleum Corp. | 5,895 | 175 | |
| Ovintiv Inc. (XNYS) | 5,020 | 174 | |
| * | Comstock Resources Inc. | 21,045 | 170 |
| * | Antero Resources Corp. | 9,326 | 164 |
| Coterra Energy Inc. | 7,791 | 156 | |
| Chevron Corp. | 1,134 | 128 | |
| Magnolia Oil & Gas Corp. Class A | 6,656 | 126 | |
| * | Renewable Energy Group Inc. | 2,470 | 118 |
| Shares | Market Value• ($000) | ||
| Berry Corp. | 12,988 | 106 | |
| Marathon Petroleum Corp. | 1,504 | 91 | |
| California Resources Corp. | 2,340 | 91 | |
| * | Earthstone Energy Inc. Class A | 8,291 | 85 |
| Diamondback Energy Inc. | 700 | 75 | |
| Pioneer Natural Resources Co. | 395 | 70 | |
| Valero Energy Corp. | 1,017 | 68 | |
| * | Talos Energy Inc. | 6,598 | 66 |
| Murphy Oil Corp. | 2,457 | 65 | |
| * | National Energy Services Reunited Corp. | 6,144 | 61 |
| * | FTS International Inc. Class A | 2,247 | 59 |
| * | Contango Oil & Gas Co. | 14,926 | 52 |
| * | Bristow Group Inc. | 1,584 | 47 |
| Equitrans Midstream Corp. | 4,218 | 41 | |
| Arch Resources Inc. | 369 | 29 | |
| Hess Corp. | 330 | 25 | |
| Texas Pacific Land Corp. | 18 | 22 | |
| 9,989 | |||
| Financials (24.5%) | |||
| JPMorgan Chase & Co. | 9,938 | 1,579 | |
| Bank of America Corp. | 28,260 | 1,257 | |
| Goldman Sachs Group Inc. | 2,526 | 962 | |
| US Bancorp | 17,181 | 951 | |
| * | Berkshire Hathaway Inc. Class B | 3,425 | 948 |
| MetLife Inc. | 15,062 | 884 | |
| Allstate Corp. | 7,628 | 829 | |
| Bank of New York Mellon Corp. | 13,478 | 739 | |
| T Rowe Price Group Inc. | 3,581 | 716 | |
| Aon plc Class A (XNYS) | 2,013 | 595 | |
| Wells Fargo & Co. | 12,283 | 587 | |
| Affiliated Managers Group Inc. | 2,817 | 479 | |
| First Commonwealth Financial Corp. | 30,905 | 465 | |
| First BanCorp. (XNYS) | 31,527 | 419 | |
| Ameriprise Financial Inc. | 1,387 | 402 | |
| Jefferies Financial Group Inc. | 10,602 | 398 | |
| Popular Inc. | 5,101 | 397 | |
| HomeStreet Inc. | 7,523 | 371 | |
| Comerica Inc. | 4,216 | 348 | |
| Associated Banc-Corp. | 14,988 | 328 | |
| Eagle Bancorp Inc. | 5,343 | 301 | |
| HarborOne Bancorp Inc. | 21,630 | 300 | |
| Virtus Investment Partners Inc. | 1,009 | 300 | |
| BOK Financial Corp. | 2,821 | 291 | |
| B Riley Financial Inc. | 3,742 | 290 | |
| * | Enstar Group Ltd. | 1,296 | 289 |
| FNB Corp. | 24,427 | 285 | |
| HCI Group Inc. | 2,540 | 280 | |
| S&P Global Inc. | 614 | 280 | |
| Simmons First National Corp. Class A | 9,399 | 274 | |
| Old Republic International Corp. | 10,842 | 260 | |
| Hilltop Holdings Inc. | 7,624 | 259 | |
| * | Mr Cooper Group Inc. | 6,557 | 258 |
| Aflac Inc. | 4,766 | 258 | |
| Washington Federal Inc. | 7,901 | 257 | |
| SLM Corp. | 14,326 | 255 | |
| Stifel Financial Corp. | 3,576 | 254 | |
| First Citizens BancShares Inc. Class A | 311 | 250 | |
| Hanmi Financial Corp. | 10,882 | 245 | |
| * | Credit Acceptance Corp. | 387 | 242 |
| Bank of NT Butterfield & Son Ltd. | 6,431 | 237 | |
| Shares | Market Value• ($000) | ||
| CNO Financial Group Inc. | 10,181 | 231 | |
| Western Alliance Bancorp | 2,051 | 225 | |
| Hope Bancorp Inc. | 15,335 | 220 | |
| Moody's Corp. | 558 | 218 | |
| Fidelity National Financial Inc. | 4,008 | 196 | |
| First Financial Bancorp | 8,275 | 190 | |
| Northfield Bancorp Inc. | 11,032 | 186 | |
| WSFS Financial Corp. | 3,567 | 177 | |
| Nelnet Inc. Class A | 1,950 | 168 | |
| Primerica Inc. | 1,110 | 163 | |
| Evercore Inc. Class A | 1,154 | 160 | |
| Lazard Ltd. Class A | 3,736 | 159 | |
| Zions Bancorp NA | 2,504 | 158 | |
| Kearny Financial Corp. | 12,292 | 156 | |
| Voya Financial Inc. | 2,513 | 156 | |
| Citigroup Inc. | 2,370 | 151 | |
| Janus Henderson Group plc | 3,416 | 146 | |
| Provident Financial Services Inc. | 5,822 | 137 | |
| First American Financial Corp. | 1,776 | 132 | |
| Hartford Financial Services Group Inc. | 1,976 | 131 | |
| Stewart Information Services Corp. | 1,831 | 130 | |
| Federal Agricultural Mortgage Corp. Class C | 1,055 | 128 | |
| City Holding Co. | 1,568 | 123 | |
| Home BancShares Inc. | 5,106 | 122 | |
| UMB Financial Corp. | 1,198 | 121 | |
| Preferred Bank | 1,721 | 117 | |
| * | SVB Financial Group | 166 | 115 |
| 1st Source Corp. | 2,470 | 114 | |
| Oppenheimer Holdings Inc. Class A | 2,255 | 111 | |
| ServisFirst Bancshares Inc. | 1,385 | 111 | |
| OceanFirst Financial Corp. | 5,156 | 106 | |
| Park National Corp. | 810 | 105 | |
| Peoples Bancorp Inc. | 3,323 | 103 | |
| Raymond James Financial Inc. | 1,020 | 100 | |
| Equitable Holdings Inc. | 3,160 | 99 | |
| Ameris Bancorp | 1,954 | 95 | |
| Safety Insurance Group Inc. | 1,232 | 95 | |
| TriCo Bancshares | 2,243 | 95 | |
| Employers Holdings Inc. | 2,386 | 92 | |
| First Bancorp (XNGS) | 2,048 | 91 | |
| First Interstate BancSystem Inc. Class A | 2,225 | 91 | |
| QCR Holdings Inc. | 1,686 | 91 | |
| Commerce Bancshares Inc. | 1,233 | 86 | |
| Northwest Bancshares Inc. | 6,454 | 86 | |
| Morgan Stanley | 862 | 82 | |
| * | Columbia Financial Inc. | 4,460 | 81 |
| Sandy Spring Bancorp Inc. | 1,731 | 81 | |
| Cathay General Bancorp | 1,874 | 79 | |
| OFG Bancorp | 3,238 | 78 | |
| Origin Bancorp Inc. | 1,851 | 78 | |
| BankUnited Inc. | 1,953 | 77 | |
| Byline Bancorp Inc. | 2,937 | 76 | |
| Cohen & Steers Inc. | 805 | 72 | |
| Blackstone Inc. | 510 | 72 | |
| Washington Trust Bancorp Inc. | 1,326 | 71 | |
| PacWest Bancorp | 1,545 | 69 | |
| Central Pacific Financial Corp. | 2,541 | 68 | |
| Banner Corp. | 1,109 | 64 | |
| Fulton Financial Corp. | 3,927 | 62 | |
| Franklin Resources Inc. | 1,822 | 59 | |
| NBT Bancorp Inc. | 1,641 | 59 |
| Shares | Market Value• ($000) | ||
| State Street Corp. | 593 | 53 | |
| KeyCorp | 2,076 | 47 | |
| WesBanco Inc. | 1,411 | 46 | |
| Walker & Dunlop Inc. | 306 | 43 | |
| Artisan Partners Asset Management Inc. Class A | 881 | 39 | |
| Citizens Financial Group Inc. | 816 | 39 | |
| First Financial Corp. | 842 | 37 | |
| TrustCo Bank Corp. NY | 1,041 | 34 | |
| Hanover Insurance Group Inc. | 247 | 30 | |
| Morningstar Inc. | 93 | 29 | |
| Lakeland Financial Corp. | 319 | 23 | |
| Assured Guaranty Ltd. | 446 | 22 | |
| Towne Bank | 699 | 21 | |
| 26,997 | |||
| Health Care (10.6%) | |||
| Pfizer Inc. | 25,688 | 1,380 | |
| * | Moderna Inc. | 3,696 | 1,303 |
| Gilead Sciences Inc. | 15,506 | 1,069 | |
| HCA Healthcare Inc. | 3,354 | 757 | |
| Anthem Inc. | 1,815 | 737 | |
| * | Regeneron Pharmaceuticals Inc. | 881 | 561 |
| AbbVie Inc. | 4,483 | 517 | |
| * | Align Technology Inc. | 822 | 503 |
| Eli Lilly & Co. | 2,030 | 503 | |
| Johnson & Johnson | 2,471 | 385 | |
| Quest Diagnostics Inc. | 1,921 | 286 | |
| UnitedHealth Group Inc. | 621 | 276 | |
| * | Laboratory Corp. of America Holdings | 958 | 273 |
| West Pharmaceutical Services Inc. | 613 | 271 | |
| * | Medpace Holdings Inc. | 1,157 | 240 |
| * | Tenet Healthcare Corp. | 3,042 | 222 |
| * | United Therapeutics Corp. | 1,137 | 215 |
| PerkinElmer Inc. | 1,061 | 193 | |
| * | Community Health Systems Inc. | 13,231 | 159 |
| * | Molina Healthcare Inc. | 528 | 151 |
| * | AngioDynamics Inc. | 5,236 | 135 |
| * | Masimo Corp. | 479 | 133 |
| ResMed Inc. | 511 | 130 | |
| * | Corcept Therapeutics Inc. | 5,998 | 126 |
| * | Quidel Corp. | 819 | 121 |
| * | Catalyst Pharmaceuticals Inc. | 16,308 | 114 |
| * | Vanda Pharmaceuticals Inc. | 6,574 | 106 |
| Patterson Cos. Inc. | 3,258 | 103 | |
| Agilent Technologies Inc. | 643 | 97 | |
| * | DaVita Inc. | 1,023 | 97 |
| * | ModivCare Inc. | 681 | 93 |
| * | Innoviva Inc. | 5,016 | 84 |
| Bruker Corp. | 931 | 75 | |
| * | Computer Programs and Systems Inc. | 2,391 | 70 |
| * | Edwards Lifesciences Corp. | 581 | 62 |
| * | Meridian Bioscience Inc. | 1,928 | 38 |
| * | Amneal Pharmaceuticals Inc. | 7,082 | 30 |
| * | CorVel Corp. | 120 | 23 |
| *,1 | Retractable Technologies Inc. | 2,372 | 21 |
| 11,659 | |||
| Industrials (15.9%) | |||
| Northrop Grumman Corp. | 2,228 | 777 | |
| American Express Co. | 3,745 | 570 | |
| Johnson Controls International plc | 7,560 | 565 | |
| Shares | Market Value• ($000) | ||
| Old Dominion Freight Line Inc. | 946 | 336 | |
| * | TopBuild Corp. | 1,110 | 299 |
| General Dynamics Corp. | 1,536 | 290 | |
| Eaton Corp. plc | 1,771 | 287 | |
| Accenture plc Class A | 784 | 280 | |
| Kforce Inc. | 3,625 | 278 | |
| 3M Co. | 1,597 | 272 | |
| Acuity Brands Inc. | 1,348 | 271 | |
| * | Saia Inc. | 815 | 270 |
| * | Zebra Technologies Corp. Class A | 450 | 265 |
| Louisiana-Pacific Corp. | 4,044 | 264 | |
| Regal Rexnord Corp. | 1,622 | 256 | |
| Insteel Industries Inc. | 5,737 | 242 | |
| Simpson Manufacturing Co. Inc. | 2,070 | 239 | |
| * | Generac Holdings Inc. | 543 | 229 |
| * | Trex Co. Inc. | 1,712 | 227 |
| Fortune Brands Home & Security Inc. | 2,161 | 217 | |
| Encore Wire Corp. | 1,528 | 215 | |
| Matson Inc. | 2,638 | 215 | |
| Crown Holdings Inc. | 1,977 | 209 | |
| Heidrick & Struggles International Inc. | 4,789 | 207 | |
| Ryder System Inc. | 2,497 | 207 | |
| AGCO Corp. | 1,864 | 205 | |
| * | United Rentals Inc. | 588 | 199 |
| Eagle Materials Inc. | 1,250 | 193 | |
| L3Harris Technologies Inc. | 918 | 192 | |
| Werner Enterprises Inc. | 4,189 | 189 | |
| Brunswick Corp. | 1,913 | 180 | |
| EMCOR Group Inc. | 1,481 | 177 | |
| Dover Corp. | 1,065 | 174 | |
| Snap-on Inc. | 830 | 171 | |
| Emerson Electric Co. | 1,930 | 170 | |
| Illinois Tool Works Inc. | 729 | 169 | |
| * | AMN Healthcare Services Inc. | 1,476 | 168 |
| Cummins Inc. | 787 | 165 | |
| * | Textainer Group Holdings Ltd. | 4,907 | 160 |
| * | CoreCivic Inc. | 14,475 | 156 |
| * | Great Lakes Dredge & Dock Corp. | 10,521 | 155 |
| ITT Inc. | 1,641 | 155 | |
| * | TriNet Group Inc. | 1,536 | 154 |
| CSW Industrials Inc. | 1,256 | 151 | |
| Watts Water Technologies Inc. Class A | 789 | 149 | |
| * | MYR Group Inc. | 1,291 | 143 |
| Huntington Ingalls Industries Inc. | 787 | 140 | |
| Pentair plc | 1,874 | 138 | |
| ArcBest Corp. | 1,308 | 135 | |
| * | Hub Group Inc. Class A | 1,734 | 135 |
| ManpowerGroup Inc. | 1,487 | 133 | |
| * | Keysight Technologies Inc. | 679 | 132 |
| Quanta Services Inc. | 1,116 | 127 | |
| * | Titan Machinery Inc. | 3,755 | 125 |
| Owens Corning | 1,403 | 119 | |
| * | Teekay Corp. | 35,729 | 119 |
| Shyft Group Inc. | 2,427 | 118 | |
| * | API Group Corp. | 5,075 | 118 |
| Quanex Building Products Corp. | 5,478 | 117 | |
| Automatic Data Processing Inc. | 495 | 114 | |
| * | FTI Consulting Inc. | 772 | 113 |
| Westrock Co. | 2,602 | 113 |
| Shares | Market Value• ($000) | ||
| Franklin Electric Co. Inc. | 1,262 | 111 | |
| Landstar System Inc. | 634 | 107 | |
| Oshkosh Corp. | 985 | 106 | |
| JB Hunt Transport Services Inc. | 552 | 105 | |
| Myers Industries Inc. | 5,331 | 104 | |
| Argan Inc. | 2,585 | 102 | |
| * | Safe Bulkers Inc. | 28,156 | 102 |
| Robert Half International Inc. | 909 | 101 | |
| * | Construction Partners Inc. Class A | 2,884 | 100 |
| * | Berry Global Group Inc. | 1,433 | 99 |
| * | Cross Country Healthcare Inc. | 3,790 | 99 |
| Kadant Inc. | 421 | 99 | |
| * | Atlas Air Worldwide Holdings Inc. | 1,117 | 98 |
| Deere & Co. | 281 | 97 | |
| Hubbell Inc. Class B | 497 | 97 | |
| Resources Connection Inc. | 5,652 | 97 | |
| * | TrueBlue Inc. | 3,684 | 96 |
| CRA International Inc. | 1,012 | 93 | |
| WW Grainger Inc. | 191 | 92 | |
| DHT Holdings Inc. | 16,347 | 91 | |
| Crane Co. | 937 | 90 | |
| Triton International Ltd. | 1,587 | 89 | |
| Federal Signal Corp. | 2,002 | 85 | |
| * | Modine Manufacturing Co. | 7,899 | 82 |
| Costamare Inc. | 6,680 | 80 | |
| Badger Meter Inc. | 746 | 76 | |
| * | Sterling Construction Co. Inc. | 2,947 | 76 |
| Zurn Water Solutions Corp. | 2,149 | 75 | |
| Ennis Inc. | 3,816 | 73 | |
| Watsco Inc. | 241 | 71 | |
| United Parcel Service Inc. Class B | 348 | 69 | |
| EVERTEC Inc. | 1,604 | 67 | |
| * | Mohawk Industries Inc. | 399 | 67 |
| Genco Shipping & Trading Ltd. | 4,354 | 67 | |
| * | Masonite International Corp. | 616 | 66 |
| * | Covenant Logistics Group Inc. Class A | 2,579 | 65 |
| * | Atkore Inc. | 559 | 60 |
| REV Group Inc. | 3,804 | 60 | |
| SFL Corp. Ltd. | 7,183 | 60 | |
| MSA Safety Inc. | 415 | 59 | |
| * | Beacon Roofing Supply Inc. | 1,136 | 57 |
| Columbus McKinnon Corp. | 1,264 | 56 | |
| Knight-Swift Transportation Holdings Inc. | 948 | 54 | |
| * | Gibraltar Industries Inc. | 778 | 53 |
| * | MasTec Inc. | 551 | 51 |
| Apogee Enterprises Inc. | 1,181 | 49 | |
| Caterpillar Inc. | 256 | 49 | |
| * | WESCO International Inc. | 391 | 49 |
| Standex International Corp. | 461 | 47 | |
| Greenbrier Cos. Inc. | 1,146 | 46 | |
| Primoris Services Corp. | 2,005 | 45 | |
| ABM Industries Inc. | 976 | 44 | |
| Barrett Business Services Inc. | 587 | 41 | |
| * | XPO Logistics Inc. | 560 | 41 |
| * | Vectrus Inc. | 919 | 38 |
| Comfort Systems USA Inc. | 387 | 37 | |
| Exponent Inc. | 314 | 37 | |
| * | Vicor Corp. | 227 | 33 |
| Packaging Corp. of America | 214 | 28 | |
| SPX FLOW Inc. | 337 | 28 | |
| Sealed Air Corp. | 446 | 28 | |
| ADT Inc. | 3,257 | 27 |
| Shares | Market Value• ($000) | ||
| Hillenbrand Inc. | 582 | 26 | |
| * | Blue Bird Corp. | 1,222 | 25 |
| Maximus Inc. | 291 | 22 | |
| 17,502 | |||
| Real Estate (0.1%) | |||
| * | CBRE Group Inc. Class A | 683 | 65 |
| * | Jones Lang LaSalle Inc. | 176 | 42 |
| 107 | |||
| Technology (9.1%) | |||
| * | Alphabet Inc. Class C | 308 | 878 |
| International Business Machines Corp. | 7,211 | 844 | |
| Applied Materials Inc. | 3,739 | 550 | |
| KLA Corp. | 1,191 | 486 | |
| NVIDIA Corp. | 1,172 | 383 | |
| * | Synaptics Inc. | 1,324 | 374 |
| * | Alphabet Inc. Class A | 130 | 369 |
| Apple Inc. | 1,872 | 309 | |
| * | Diodes Inc. | 2,622 | 279 |
| Oracle Corp. | 2,989 | 271 | |
| Teradyne Inc. | 1,716 | 262 | |
| Jabil Inc. | 4,461 | 261 | |
| NortonLifeLock Inc. | 9,507 | 236 | |
| Texas Instruments Inc. | 1,029 | 198 | |
| * | Dropbox Inc. Class A | 7,993 | 197 |
| * | Arrow Electronics Inc. | 1,594 | 194 |
| Microsoft Corp. | 584 | 193 | |
| Shutterstock Inc. | 1,645 | 188 | |
| * | Lattice Semiconductor Corp. | 2,449 | 186 |
| * | Dell Technologies Inc. Class C | 3,084 | 174 |
| * | Meta Platforms Inc. Class A | 520 | 169 |
| Intel Corp. | 3,377 | 166 | |
| * | TechTarget Inc. | 1,709 | 165 |
| * | Ziff Davis Inc. | 1,395 | 159 |
| NetApp Inc. | 1,769 | 157 | |
| * | Avid Technology Inc. | 4,830 | 155 |
| Amdocs Ltd. | 2,035 | 142 | |
| Cognizant Technology Solutions Corp. Class A | 1,716 | 134 | |
| * | Qorvo Inc. | 917 | 134 |
| Skyworks Solutions Inc. | 749 | 114 | |
| Vishay Intertechnology Inc. | 5,573 | 114 | |
| * | Perficient Inc. | 827 | 113 |
| * | Gartner Inc. | 358 | 112 |
| * | FormFactor Inc. | 2,541 | 107 |
| * | Fortinet Inc. | 304 | 101 |
| TD SYNNEX Corp. | 912 | 94 | |
| HP Inc. | 2,564 | 90 | |
| * | Photronics Inc. | 6,808 | 90 |
| * | ePlus Inc. | 831 | 88 |
| VMware Inc. Class A | 732 | 85 | |
| * | Rimini Street Inc. | 12,213 | 81 |
| * | F5 Inc. | 342 | 78 |
| * | Fabrinet | 672 | 74 |
| * | Mitek Systems Inc. | 3,936 | 67 |
| * | Sanmina Corp. | 1,804 | 66 |
| * | Plexus Corp. | 624 | 52 |
| * | Onto Innovation Inc. | 386 | 36 |
| * | EMCORE Corp. | 4,596 | 34 |
| * | IAC/InterActiveCorp. | 258 | 34 |
| * | Cadence Design Systems Inc. | 173 | 31 |
| * | NCR Corp. | 782 | 30 |
| Hewlett Packard Enterprise Co. | 1,999 | 29 | |
| * | Consensus Cloud Solutions Inc. | 464 | 29 |
| Vertiv Holdings Co. Class A | 1,033 | 26 | |
| Shares | Market Value• ($000) | ||
| CDW Corp. | 130 | 25 | |
| * | Manhattan Associates Inc. | 154 | 24 |
| Amkor Technology Inc. | 1,007 | 22 | |
| * | Kyndryl Holdings Inc. | 1,243 | 20 |
| 10,079 | |||
| Telecommunications (1.3%) | |||
| Cisco Systems Inc. | 11,361 | 623 | |
| Lumen Technologies Inc. | 33,188 | 410 | |
| * | WideOpenWest Inc. | 11,384 | 212 |
| * | Calix Inc. | 1,733 | 116 |
| * | Charter Communications Inc. Class A | 112 | 72 |
| * | NETGEAR Inc. | 1,433 | 38 |
| 1,471 | |||
| Total Common Stocks (Cost $85,446) | 109,728 | ||
| Temporary Cash Investments (0.3%) | |||
| Money Market Fund (0.3%) | |||
| 2,3 | Vanguard Market Liquidity Fund, 0.077% (Cost $341) | 3,414 | 342 |
| Total Investments (99.8%) (Cost $85,787) | 110,070 | ||
| Other Assets and Liabilities—Net (0.2%) | 210 | ||
| Net Assets (100%) | 110,280 | ||
| Cost is in $000. | |||
| • | See Note A in Notes to Financial Statements. |
| * | Non-income-producing security. |
| 1 | Includes partial security positions on loan to broker-dealers. The total value of securities on loan is $19,000. |
| 2 | Affiliated money market fund available only to Vanguard funds and certain trusts and accounts managed by Vanguard. Rate shown is the 7-day yield. |
| 3 | Collateral of $22,000 was received for securities on loan. |
| Futures Contracts | ||||
| ($000) | ||||
| Expiration | Number of Long (Short) Contracts | Notional Amount | Value and Unrealized Appreciation (Depreciation) | |
| Long Futures Contracts | ||||
| Micro E-mini S&P 500 Index | December 2021 | 22 | 502 | 3 |
| ($000s, except shares and per-share amounts) | Amount |
| Assets | |
| Investments in Securities, at Value | |
| Unaffiliated Issuers (Cost $85,446) | 109,728 |
| Affiliated Issuers (Cost $341) | 342 |
| Total Investments in Securities | 110,070 |
| Investment in Vanguard | 4 |
| Cash | 3 |
| Cash Collateral Pledged—Futures Contracts | 28 |
| Receivables for Accrued Income | 217 |
| Total Assets | 110,322 |
| Liabilities | |
| Payables for Investment Securities Purchased | 2 |
| Collateral for Securities on Loan | 22 |
| Payables to Vanguard | 9 |
| Variation Margin Payable—Futures Contracts | 9 |
| Total Liabilities | 42 |
| Net Assets | 110,280 |
| At November 30, 2021, net assets consisted of: | |
| Paid-in Capital | 101,377 |
| Total Distributable Earnings (Loss) | 8,903 |
| Net Assets | 110,280 |
| Net Assets | |
| Applicable to 1,065,000 outstanding $.001 par value shares of beneficial interest (unlimited authorization) | 110,280 |
| Net Asset Value Per Share | $103.55 |
| Year Ended November 30, 2021 | |
| ($000) | |
| Investment Income | |
| Income | |
| Dividends1 | 1,516 |
| Interest2 | — |
| Securities Lending—Net | 6 |
| Total Income | 1,522 |
| Expenses | |
| The Vanguard Group—Note B | |
| Investment Advisory Services | 32 |
| Management and Administrative | 87 |
| Marketing and Distribution | — |
| Custodian Fees | 4 |
| Auditing Fees | 31 |
| Shareholders’ Reports | 4 |
| Trustees’ Fees and Expenses | — |
| Total Expenses | 158 |
| Net Investment Income | 1,364 |
| Realized Net Gain (Loss) | |
| Investment Securities Sold2,3 | 2,994 |
| Futures Contracts | 74 |
| Realized Net Gain (Loss) | 3,068 |
| Change in Unrealized Appreciation (Depreciation) | |
| Investment Securities2 | 15,647 |
| Futures Contracts | (2) |
| Change in Unrealized Appreciation (Depreciation) | 15,645 |
| Net Increase (Decrease) in Net Assets Resulting from Operations | 20,077 |
| 1 | Dividends are net of foreign withholding taxes of $2,000. |
| 2 | Interest income, realized net gain (loss), and change in unrealized appreciation (depreciation) from an affiliated company of the fund were less than $1,000, $0, and $1,000, respectively. Purchases and sales are for temporary cash investment purposes. |
| 3 | Includes $444,000 of net gain (loss) resulting from in-kind redemptions. |
| Year Ended November 30, | ||
| 2021 ($000) | 2020 ($000) | |
| Increase (Decrease) in Net Assets | ||
| Operations | ||
| Net Investment Income | 1,364 | 1,134 |
| Realized Net Gain (Loss) | 3,068 | (10,370) |
| Change in Unrealized Appreciation (Depreciation) | 15,645 | 1,583 |
| Net Increase (Decrease) in Net Assets Resulting from Operations | 20,077 | (7,653) |
| Distributions | ||
| Total Distributions | (1,170) | (1,209) |
| Capital Share Transactions | ||
| Issued | 31,503 | 12,089 |
| Issued in Lieu of Cash Distributions | — | — |
| Redeemed | (2,076) | (30,826) |
| Net Increase (Decrease) from Capital Share Transactions | 29,427 | (18,737) |
| Total Increase (Decrease) | 48,334 | (27,599) |
| Net Assets | ||
| Beginning of Period | 61,946 | 89,545 |
| End of Period | 110,280 | 61,946 |
| For a Share Outstanding Throughout Each Period | Year Ended November 30, | February 13, 20181 to November 30, 2018 | ||
| 2021 | 2020 | 2019 | ||
| Net Asset Value, Beginning of Period | $79.93 | $79.60 | $76.07 | $75.00 |
| Investment Operations | ||||
| Net Investment Income2 | 1.534 | 1.191 | 1.340 | 1.007 |
| Net Realized and Unrealized Gain (Loss) on Investments | 23.442 | .372 | 3.458 | .543 |
| Total from Investment Operations | 24.976 | 1.563 | 4.798 | 1.550 |
| Distributions | ||||
| Dividends from Net Investment Income | (1.356) | (1.233) | (1.268) | (.480) |
| Distributions from Realized Capital Gains | — | — | — | — |
| Total Distributions | (1.356) | (1.233) | (1.268) | (.480) |
| Net Asset Value, End of Period | $103.55 | $79.93 | $79.60 | $76.07 |
| Total Return | 31.43% | 2.35% | 6.46% | 2.03% |
| Ratios/Supplemental Data | ||||
| Net Assets, End of Period (Millions) | $110 | $62 | $90 | $76 |
| Ratio of Total Expenses to Average Net Assets | 0.18% | 0.19%3 | 0.19%3 | 0.18%4 |
| Ratio of Net Investment Income to Average Net Assets | 1.56% | 1.66% | 1.79% | 1.59%4 |
| Portfolio Turnover Rate | 75%5 | 95%5 | 98% | 64% |
| 1 | Inception. |
| 2 | Calculated based on average shares outstanding. |
| 3 | The ratio of expenses to average net assets for the period net of reduction from custody fee offset arrangements was 0.18%. |
| 4 | Annualized. |
| 5 | Excludes the value of portfolio securities received or delivered as a result of in-kind purchases or redemptions of the fund’s capital shares, including ETF Creation Units. |
| A. | The following significant accounting policies conform to generally accepted accounting principles for U.S. investment companies. The fund consistently follows such policies in preparing its financial statements. |
| B. | In accordance with the terms of a Funds' Service Agreement (the “FSA”) between Vanguard and the fund, Vanguard furnishes to the fund investment advisory, corporate management, administrative, marketing, and distribution services at Vanguard’s cost of operations (as defined by the FSA). These costs of operations are allocated to the fund based on methods and guidelines approved by the board of trustees and are generally settled twice a month. |
| C. | Various inputs may be used to determine the value of the fund’s investments and derivatives. These inputs are summarized in three broad levels for financial statement purposes. The inputs or methodologies used to value securities are not necessarily an indication of the risk associated with investing in those securities. |
| D. | Permanent differences between book-basis and tax-basis components of net assets are reclassified among capital accounts in the financial statements to reflect their tax character. These reclassifications have no effect on net assets or net asset value per share. As of period end, permanent differences primarily attributable to the accounting for in-kind redemptions were reclassified between the following accounts: |
| Amount ($000) | |
| Paid-in Capital | 444 |
| Total Distributable Earnings (Loss) | (444) |
| Amount ($000) | |
| Undistributed Ordinary Income | 446 |
| Undistributed Long-Term Gains | — |
| Capital Loss Carryforwards | (15,829) |
| Qualified Late-Year Losses | — |
| Net Unrealized Gains (Losses) | 24,286 |
| Year Ended November 30, | ||
| 2021 Amount ($000) | 2020 Amount ($000) | |
| Ordinary Income* | 1,170 | 1,209 |
| Long-Term Capital Gains | — | — |
| Total | 1,170 | 1,209 |
| * | Includes short-term capital gains, if any. |
| Amount ($000) | |
| Tax Cost | 85,784 |
| Gross Unrealized Appreciation | 26,179 |
| Gross Unrealized Depreciation | (1,893) |
| Net Unrealized Appreciation (Depreciation) | 24,286 |
| E. | During the year ended November 30, 2021, the fund purchased $96,088,000 of investment securities and sold $66,646,000 of investment securities, other than temporary cash investments. Purchases and sales include $0 and $2,076,000, respectively, in connection with in-kind purchases and redemptions of the fund's capital shares. |
| F. | Capital shares issued and redeemed were: |
| Year Ended November 30, | ||
| 2021 Shares (000) | 2020 Shares (000) | |
| Issued | 315 | 150 |
| Issued in Lieu of Cash Distributions | — | — |
| Redeemed | (25) | (500) |
| Net Increase (Decrease) in Shares Outstanding | 290 | (350) |
| G. | Management has determined that no events or transactions occurred subsequent to November 30, 2021, that would require recognition or disclosure in these financial statements. |

| Average Annual Total Returns Periods Ended November 30, 2021 | ||||
| One Year | Since Inception (2/13/2018) | Final Value of a $10,000 Investment | ||
| U.S. Quality Factor ETF Net Asset Value | 30.42% | 15.20% | $17,105 |
| U.S. Quality Factor ETF Market Price | 30.46 | 15.22 | 17,117 | |
| Russell 3000 Index | 26.34 | 17.17 | 18,243 |
| One Year | Since Inception (2/13/2018) | |
| U.S. Quality Factor ETF Market Price | 30.46% | 71.17% |
| U.S. Quality Factor ETF Net Asset Value | 30.42 | 71.05 |
| Russell 3000 Index | 26.34 | 82.43 |
| Basic Materials | 2.7% |
| Consumer Discretionary | 22.2 |
| Consumer Staples | 4.5 |
| Energy | 2.3 |
| Financials | 16.4 |
| Health Care | 14.0 |
| Industrials | 17.4 |
| Real Estate | 0.4 |
| Technology | 19.0 |
| Telecommunications | 1.0 |
| Utilities | 0.1 |
| Shares | Market Value• ($000) | ||
| Common Stocks (99.6%) | |||
| Basic Materials (2.7%) | |||
| Freeport-McMoRan Inc. | 27,896 | 1,034 | |
| Fastenal Co. | 7,780 | 460 | |
| Alcoa Corp. | 4,968 | 231 | |
| Tredegar Corp. | 20,445 | 225 | |
| Reliance Steel & Aluminum Co. | 1,315 | 195 | |
| Southern Copper Corp. | 3,154 | 185 | |
| Boise Cascade Co. | 2,352 | 152 | |
| * | Clearwater Paper Corp. | 3,633 | 146 |
| CF Industries Holdings Inc. | 2,228 | 135 | |
| UFP Industries Inc. | 1,449 | 121 | |
| Balchem Corp. | 693 | 110 | |
| Avery Dennison Corp. | 466 | 96 | |
| Mueller Industries Inc. | 1,218 | 67 | |
| Ryerson Holding Corp. | 2,844 | 67 | |
| Verso Corp. Class A | 3,057 | 65 | |
| * | Orion Engineered Carbons SA | 3,706 | 65 |
| Compass Minerals International Inc. | 1,057 | 51 | |
| Materion Corp. | 575 | 49 | |
| Commercial Metals Co. | 1,505 | 47 | |
| Innospec Inc. | 583 | 47 | |
| Steel Dynamics Inc. | 773 | 46 | |
| Sensient Technologies Corp. | 453 | 44 | |
| * | Univar Solutions Inc. | 1,437 | 37 |
| Ecolab Inc. | 136 | 30 | |
| Olin Corp. | 550 | 30 | |
| Worthington Industries Inc. | 618 | 30 | |
| Cabot Corp. | 541 | 28 | |
| * | GCP Applied Technologies Inc. | 1,110 | 26 |
| * | TimkenSteel Corp. | 1,822 | 26 |
| * | RBC Bearings Inc. | 126 | 25 |
| 3,870 | |||
| Consumer Discretionary (22.1%) | |||
| Walmart Inc. | 9,802 | 1,378 | |
| Costco Wholesale Corp. | 2,542 | 1,371 | |
| * | Lululemon Athletica Inc. | 2,959 | 1,345 |
| Lowe's Cos. Inc. | 5,105 | 1,249 | |
| Target Corp. | 4,837 | 1,179 | |
| TJX Cos. Inc. | 14,259 | 990 | |
| NIKE Inc. Class B | 5,799 | 981 | |
| Ross Stores Inc. | 8,853 | 966 | |
| * | O'Reilly Automotive Inc. | 1,464 | 934 |
| Estee Lauder Cos. Inc. Class A | 1,792 | 595 | |
| Genuine Parts Co. | 3,511 | 448 | |
| Best Buy Co. Inc. | 3,781 | 404 | |
| Williams-Sonoma Inc. | 1,991 | 388 | |
| Shares | Market Value• ($000) | ||
| * | YETI Holdings Inc. | 4,099 | 378 |
| * | Ulta Beauty Inc. | 980 | 376 |
| Rollins Inc. | 10,063 | 335 | |
| Movado Group Inc. | 7,377 | 331 | |
| * | Perdoceo Education Corp. | 32,878 | 324 |
| * | Deckers Outdoor Corp. | 790 | 320 |
| * | Under Armour Inc. Class A | 13,078 | 309 |
| New York Times Co. Class A | 6,405 | 304 | |
| Buckle Inc. | 6,245 | 294 | |
| Columbia Sportswear Co. | 2,828 | 276 | |
| Dick's Sporting Goods Inc. | 2,345 | 276 | |
| Acushnet Holdings Corp. | 4,852 | 264 | |
| * | Amazon.com Inc. | 72 | 252 |
| * | Turtle Beach Corp. | 9,341 | 250 |
| * | Citi Trends Inc. | 2,853 | 242 |
| HNI Corp. | 6,015 | 238 | |
| Signet Jewelers Ltd. | 2,398 | 233 | |
| Macy's Inc. | 8,154 | 232 | |
| Polaris Inc. | 2,073 | 232 | |
| Carter's Inc. | 2,223 | 225 | |
| Ralph Lauren Corp. Class A | 1,936 | 225 | |
| * | Burlington Stores Inc. | 765 | 224 |
| * | Kirkland's Inc. | 10,370 | 224 |
| Dillard's Inc. Class A | 810 | 222 | |
| * | PROG Holdings Inc. | 4,900 | 221 |
| * | Zumiez Inc. | 4,801 | 220 |
| * | Genesco Inc. | 3,414 | 216 |
| Group 1 Automotive Inc. | 1,091 | 212 | |
| * | AutoNation Inc. | 1,695 | 210 |
| * | Etsy Inc. | 721 | 198 |
| Gentex Corp. | 5,630 | 194 | |
| Shoe Carnival Inc. | 4,936 | 193 | |
| Advance Auto Parts Inc. | 856 | 189 | |
| Ethan Allen Interiors Inc. | 8,301 | 187 | |
| Hanesbrands Inc. | 11,128 | 180 | |
| * | Sonos Inc. | 5,703 | 180 |
| * | BJ's Wholesale Club Holdings Inc. | 2,697 | 178 |
| Kontoor Brands Inc. | 3,285 | 177 | |
| * | MarineMax Inc. | 3,312 | 176 |
| * | iRobot Corp. | 2,300 | 175 |
| * | GoPro Inc. Class A | 17,356 | 174 |
| * | Liquidity Services Inc. | 7,668 | 174 |
| * | Bed Bath & Beyond Inc. | 9,361 | 172 |
| * | Revolve Group Inc. | 2,238 | 170 |
| 1 | Big 5 Sporting Goods Corp. | 6,998 | 166 |
| * | Cars.com Inc. | 9,840 | 164 |
| * | Duluth Holdings Inc. Class B | 11,712 | 162 |
| * | NVR Inc. | 31 | 162 |
| Shares | Market Value• ($000) | ||
| Kohl's Corp. | 3,120 | 160 | |
| La-Z-Boy Inc. | 4,588 | 153 | |
| Pool Corp. | 277 | 153 | |
| * | Lumber Liquidators Holdings Inc. | 9,923 | 152 |
| Tempur Sealy International Inc. | 3,506 | 150 | |
| * | National Vision Holdings Inc. | 3,104 | 149 |
| * | Under Armour Inc. Class C | 7,401 | 149 |
| * | Children's Place Inc. | 1,708 | 148 |
| Scholastic Corp. | 3,941 | 148 | |
| * | Lovesac Co. | 2,288 | 145 |
| Tapestry Inc. | 3,602 | 145 | |
| American Eagle Outfitters Inc. | 5,557 | 144 | |
| * | Master Craft Boat Holdings Inc. | 4,895 | 134 |
| * | Crocs Inc. | 802 | 132 |
| * | XPEL Inc. | 1,840 | 132 |
| Oxford Industries Inc. | 1,364 | 130 | |
| * | Skyline Champion Corp. | 1,633 | 128 |
| Standard Motor Products Inc. | 2,539 | 127 | |
| Tractor Supply Co. | 561 | 126 | |
| Caleres Inc. | 5,202 | 123 | |
| * | Lands' End Inc. | 5,259 | 121 |
| * | Abercrombie & Fitch Co. Class A | 3,296 | 119 |
| Aaron's Co. Inc. | 5,380 | 119 | |
| Gap Inc. | 7,121 | 118 | |
| * | Gentherm Inc. | 1,396 | 118 |
| Johnson Outdoors Inc. Class A | 1,134 | 118 | |
| Garmin Ltd. | 885 | 118 | |
| * | Container Store Group Inc. | 9,547 | 111 |
| Entravision Communications Corp. Class A | 14,934 | 111 | |
| * | Nordstrom Inc. | 5,204 | 110 |
| Tilly's Inc. Class A | 7,318 | 110 | |
| Hibbett Inc. | 1,385 | 108 | |
| * | ODP Corp. | 2,863 | 108 |
| LKQ Corp. | 1,887 | 105 | |
| * | Helen of Troy Ltd. | 432 | 104 |
| * | Take-Two Interactive Software Inc. | 624 | 103 |
| Qurate Retail Inc. Series A | 12,711 | 102 | |
| * | Cavco Industries Inc. | 325 | 97 |
| * | Sally Beauty Holdings Inc. | 4,885 | 96 |
| * | Vera Bradley Inc. | 10,077 | 96 |
| H&R Block Inc. | 4,013 | 95 | |
| Wolverine World Wide Inc. | 3,055 | 95 | |
| * | Lazydays Holdings Inc. | 4,637 | 94 |
| * | Universal Electronics Inc. | 2,581 | 93 |
| Global Industrial Co. | 2,287 | 92 | |
| * | Conn's Inc. | 4,009 | 88 |
| * | Mattel Inc. | 4,006 | 85 |
| Rush Enterprises Inc. Class A | 1,624 | 83 | |
| * | Gannett Co. Inc. | 16,190 | 83 |
| * | Fossil Group Inc. | 6,790 | 81 |
| * | Party City Holdco Inc. | 14,195 | 78 |
| World Wrestling Entertainment Inc. Class A | 1,574 | 78 | |
| Sonic Automotive Inc. Class A | 1,708 | 77 | |
| * | Dorman Products Inc. | 684 | 76 |
| Whirlpool Corp. | 344 | 75 | |
| eBay Inc. | 1,099 | 74 | |
| * | Visteon Corp. | 703 | 74 |
| Rent-A-Center Inc. | 1,661 | 73 | |
| * | Noodles & Co. Class A | 6,816 | 70 |
| * | Asbury Automotive Group Inc. | 423 | 69 |
| Inter Parfums Inc. | 775 | 68 | |
| * | Copart Inc. | 463 | 67 |
| Shares | Market Value• ($000) | ||
| * | Bloomin' Brands Inc. | 3,743 | 66 |
| * | Houghton Mifflin Harcourt Co. | 4,242 | 66 |
| News Corp. Class A | 3,071 | 66 | |
| * | elf Beauty Inc. | 2,168 | 65 |
| * | Malibu Boats Inc. Class A | 921 | 64 |
| Matthews International Corp. Class A | 1,807 | 63 | |
| * | Academy Sports & Outdoors Inc. | 1,421 | 63 |
| * | Skechers USA Inc. Class A | 1,350 | 61 |
| Steven Madden Ltd. | 1,262 | 60 | |
| * | Adtalem Global Education Inc. | 1,972 | 59 |
| * | American Axle & Manufacturing Holdings Inc. | 6,604 | 59 |
| Omnicom Group Inc. | 879 | 59 | |
| * | SiteOne Landscape Supply Inc. | 246 | 59 |
| Haverty Furniture Cos. Inc. | 1,935 | 58 | |
| * | 1-800-Flowers.com Inc. Class A | 1,732 | 52 |
| John Wiley & Sons Inc. Class A | 1,003 | 52 | |
| Guess? Inc. | 2,240 | 51 | |
| OneWater Marine Inc. Class A | 975 | 50 | |
| MillerKnoll Inc. | 1,245 | 47 | |
| Murphy USA Inc. | 263 | 46 | |
| PVH Corp. | 402 | 43 | |
| * | Tenneco Inc. Class A | 3,944 | 41 |
| * | Dollar Tree Inc. | 295 | 39 |
| International Game Technology plc | 1,341 | 36 | |
| Interface Inc. Class A | 2,440 | 35 | |
| * | American Public Education Inc. | 1,707 | 32 |
| Camping World Holdings Inc. Class A | 688 | 30 | |
| * | Everi Holdings Inc. | 1,343 | 28 |
| * | G-III Apparel Group Ltd. | 959 | 28 |
| * | Capri Holdings Ltd. | 468 | 28 |
| PriceSmart Inc. | 379 | 27 | |
| Cato Corp. Class A | 1,559 | 26 | |
| VF Corp. | 355 | 25 | |
| * | Funko Inc. Class A | 1,423 | 23 |
| Interpublic Group of Cos. Inc. | 686 | 23 | |
| * | VOXX International Corp. Class A | 2,226 | 23 |
| * | CarParts.com Inc. | 1,765 | 22 |
| * | Fluent Inc. | 10,907 | 20 |
| * | Nautilus Inc. | 2,331 | 16 |
| 31,763 | |||
| Consumer Staples (4.5%) | |||
| Colgate-Palmolive Co. | 9,197 | 690 | |
| Sysco Corp. | 7,720 | 541 | |
| * | Monster Beverage Corp. | 5,060 | 424 |
| Procter & Gamble Co. | 2,919 | 422 | |
| * | Boston Beer Co. Inc. Class A | 716 | 323 |
| Flowers Foods Inc. | 10,946 | 283 | |
| PetMed Express Inc. | 10,266 | 281 | |
| Altria Group Inc. | 6,276 | 268 | |
| Clorox Co. | 1,617 | 263 | |
| National Beverage Corp. | 4,963 | 258 | |
| Kroger Co. | 6,183 | 257 | |
| John B Sanfilippo & Son Inc. | 2,797 | 230 | |
| Albertsons Cos. Inc. Class A | 5,613 | 197 | |
| Ingles Markets Inc. Class A | 2,388 | 183 | |
| Medifast Inc. | 853 | 175 | |
| SpartanNash Co. | 6,608 | 158 | |
| Weis Markets Inc. | 2,218 | 140 | |
| * | United Natural Foods Inc. | 2,717 | 135 |
| * | USANA Health Sciences Inc. | 1,318 | 131 |
| Shares | Market Value• ($000) | ||
| WD-40 Co. | 564 | 127 | |
| J & J Snack Foods Corp. | 905 | 124 | |
| Hershey Co. | 627 | 111 | |
| Coca-Cola Consolidated Inc. | 176 | 100 | |
| Tyson Foods Inc. Class A | 1,269 | 100 | |
| AmerisourceBergen Corp. Class A | 853 | 99 | |
| Casey's General Stores Inc. | 464 | 90 | |
| * | Veru Inc. | 10,411 | 78 |
| McKesson Corp. | 255 | 55 | |
| Lancaster Colony Corp. | 349 | 51 | |
| MGP Ingredients Inc. | 498 | 39 | |
| Nu Skin Enterprises Inc. Class A | 820 | 36 | |
| * | Sprouts Farmers Market Inc. | 1,119 | 30 |
| Brown-Forman Corp. Class A | 408 | 27 | |
| * | Hain Celestial Group Inc. | 661 | 26 |
| * | Rite Aid Corp. | 2,114 | 26 |
| 6,478 | |||
| Energy (2.2%) | |||
| EOG Resources Inc. | 12,534 | 1,091 | |
| * | ProPetro Holding Corp. | 31,453 | 259 |
| * | Whiting Petroleum Corp. | 2,799 | 181 |
| * | Talos Energy Inc. | 16,292 | 162 |
| * | Dril-Quip Inc. | 7,713 | 147 |
| * | Denbury Inc. | 1,806 | 144 |
| * | Enphase Energy Inc. | 495 | 124 |
| SM Energy Co. | 4,287 | 124 | |
| * | NOW Inc. | 14,283 | 119 |
| Coterra Energy Inc. | 5,162 | 104 | |
| * | FTS International Inc. Class A | 3,240 | 85 |
| Civitas Resources Inc. | 1,548 | 79 | |
| Magnolia Oil & Gas Corp. Class A | 4,108 | 78 | |
| * | CONSOL Energy Inc. | 3,528 | 77 |
| Continental Resources Inc. | 1,537 | 68 | |
| * | Array Technologies Inc. | 3,414 | 62 |
| World Fuel Services Corp. | 1,715 | 43 | |
| * | Kosmos Energy Ltd. | 11,340 | 42 |
| Cactus Inc. Class A | 1,102 | 40 | |
| * | RPC Inc. | 7,961 | 32 |
| * | DMC Global Inc. | 854 | 31 |
| * | MRC Global Inc. | 3,959 | 27 |
| * | Renewable Energy Group Inc. | 493 | 24 |
| Texas Pacific Land Corp. | 20 | 24 | |
| * | TETRA Technologies Inc. | 8,484 | 22 |
| * | Expro Group Holdings NV | 1,477 | 21 |
| 3,210 | |||
| Financials (16.4%) | |||
| Aon plc Class A (XNYS) | 4,531 | 1,340 | |
| Voya Financial Inc. | 11,822 | 735 | |
| Moody's Corp. | 1,757 | 686 | |
| * | Berkshire Hathaway Inc. Class B | 2,313 | 640 |
| S&P Global Inc. | 1,344 | 613 | |
| Discover Financial Services | 4,060 | 438 | |
| SLM Corp. | 24,595 | 437 | |
| Ameriprise Financial Inc. | 1,419 | 411 | |
| Allstate Corp. | 3,560 | 387 | |
| Evercore Inc. Class A | 2,399 | 333 | |
| JPMorgan Chase & Co. | 1,995 | 317 | |
| First BanCorp. (XNYS) | 22,513 | 299 | |
| PennyMac Financial Services Inc. | 4,728 | 299 | |
| HomeStreet Inc. | 6,044 | ��� 298 | |
| Affiliated Managers Group Inc. | 1,722 | 293 | |
| Shares | Market Value• ($000) | ||
| Fidelity National Financial Inc. | 5,935 | 290 | |
| BankUnited Inc. | 7,186 | 285 | |
| * | Enstar Group Ltd. | 1,262 | 282 |
| * | Credit Acceptance Corp. | 449 | 281 |
| Federated Hermes Inc. | 8,293 | 280 | |
| OneMain Holdings Inc. | 5,398 | 269 | |
| BOK Financial Corp. | 2,523 | 260 | |
| * | World Acceptance Corp. | 1,225 | 252 |
| Hilltop Holdings Inc. | 7,279 | 248 | |
| OFG Bancorp | 10,310 | 248 | |
| Navient Corp. | 12,516 | 247 | |
| Comerica Inc. | 2,978 | 246 | |
| Meta Financial Group Inc. | 3,831 | 229 | |
| Washington Federal Inc. | 6,914 | 225 | |
| Banner Corp. | 3,916 | 224 | |
| FactSet Research Systems Inc. | 478 | 224 | |
| WSFS Financial Corp. | 4,500 | 224 | |
| Bank of NT Butterfield & Son Ltd. | 5,852 | 216 | |
| First Citizens BancShares Inc. Class A | 268 | 215 | |
| Brightsphere Investment Group Inc. | 7,162 | 215 | |
| * | Encore Capital Group Inc. | 3,667 | 214 |
| Virtu Financial Inc. Class A | 7,555 | 213 | |
| Regional Management Corp. | 3,731 | 211 | |
| WesBanco Inc. | 6,417 | 209 | |
| SEI Investments Co. | 3,368 | 201 | |
| * | Bancorp Inc. | 6,998 | 198 |
| City Holding Co. | 2,485 | 195 | |
| * | Triumph Bancorp Inc. | 1,530 | 195 |
| Popular Inc. | 2,499 | 194 | |
| FNB Corp. | 16,537 | 193 | |
| Primerica Inc. | 1,302 | 192 | |
| Atlantic Union Bankshares Corp. | 5,835 | 190 | |
| * | Nicolet Bankshares Inc. | 2,664 | 190 |
| Cathay General Bancorp | 4,428 | 186 | |
| * | Mr Cooper Group Inc. | 4,740 | 186 |
| Assured Guaranty Ltd. | 3,802 | 186 | |
| CNO Financial Group Inc. | 7,932 | 180 | |
| * | PRA Group Inc. | 4,155 | 176 |
| First American Financial Corp. | 2,356 | 175 | |
| American Financial Group Inc. | 1,276 | 171 | |
| LPL Financial Holdings Inc. | 1,043 | 164 | |
| * | Axos Financial Inc. | 2,883 | 163 |
| Curo Group Holdings Corp. | 9,792 | 162 | |
| WisdomTree Investments Inc. | 26,361 | 162 | |
| Jefferies Financial Group Inc. | 3,944 | 148 | |
| QCR Holdings Inc. | 2,632 | 142 | |
| Associated Banc-Corp. | 6,344 | 139 | |
| Lakeland Financial Corp. | 1,954 | 138 | |
| Cboe Global Markets Inc. | 1,004 | 129 | |
| Equitable Holdings Inc. | 4,100 | 129 | |
| First Commonwealth Financial Corp. | 8,451 | 127 | |
| Marsh & McLennan Cos. Inc. | 772 | 127 | |
| Premier Financial Corp. | 4,267 | 125 | |
| Washington Trust Bancorp Inc. | 2,281 | 123 | |
| * | Columbia Financial Inc. | 6,683 | 122 |
| TriCo Bancshares | 2,892 | 122 | |
| 1st Source Corp. | 2,625 | 121 | |
| Lazard Ltd. Class A | 2,816 | 120 | |
| First Bancorp (XNGS) | 2,659 | 118 | |
| Veritex Holdings Inc. | 2,929 | 116 | |
| First Financial Bancorp | 4,980 | 115 | |
| Park National Corp. | 883 | 115 |
| Shares | Market Value• ($000) | ||
| First Merchants Corp. | 2,862 | 114 | |
| Fifth Third Bancorp | 2,564 | 108 | |
| Southside Bancshares Inc. | 2,536 | 103 | |
| Oppenheimer Holdings Inc. Class A | 2,073 | 102 | |
| Employers Holdings Inc. | 2,523 | 97 | |
| Eagle Bancorp Inc. | 1,650 | 93 | |
| T Rowe Price Group Inc. | 465 | 93 | |
| Ally Financial Inc. | 1,926 | 88 | |
| Walker & Dunlop Inc. | 620 | 87 | |
| First Hawaiian Inc. | 3,259 | 86 | |
| FirstCash Inc. | 1,333 | 85 | |
| Hope Bancorp Inc. | 5,762 | 83 | |
| Kearny Financial Corp. | 6,501 | 83 | |
| State Street Corp. | 902 | 80 | |
| First Financial Corp. | 1,806 | 79 | |
| PJT Partners Inc. Class A | 1,027 | 78 | |
| B Riley Financial Inc. | 980 | 76 | |
| Synovus Financial Corp. | 1,686 | 76 | |
| Cadence Bank | 2,590 | 76 | |
| First Interstate BancSystem Inc. Class A | 1,821 | 74 | |
| First Foundation Inc. | 2,818 | 72 | |
| Janus Henderson Group plc | 1,662 | 71 | |
| * | Customers Bancorp Inc. | 1,217 | 70 |
| Wells Fargo & Co. | 1,468 | 70 | |
| Federal Agricultural Mortgage Corp. Class C | 564 | 69 | |
| Houlihan Lokey Inc. Class A | 596 | 65 | |
| Northfield Bancorp Inc. | 3,852 | 65 | |
| UMB Financial Corp. | 650 | 65 | |
| Cohen & Steers Inc. | 714 | 64 | |
| Hanmi Financial Corp. | 2,862 | 64 | |
| Ameris Bancorp | 1,287 | 63 | |
| * | Markel Corp. | 51 | 61 |
| Heritage Financial Corp. | 2,538 | 59 | |
| Simmons First National Corp. Class A | 2,023 | 59 | |
| Tompkins Financial Corp. | 739 | 58 | |
| * | Brighthouse Financial Inc. | 1,179 | 57 |
| Commerce Bancshares Inc. | 819 | 57 | |
| * | SVB Financial Group | 83 | 57 |
| Bank of New York Mellon Corp. | 961 | 53 | |
| Northern Trust Corp. | 455 | 53 | |
| Wintrust Financial Corp. | 605 | 53 | |
| Zions Bancorp NA | 823 | 52 | |
| Mercury General Corp. | 963 | 49 | |
| Central Pacific Financial Corp. | 1,702 | 46 | |
| Home BancShares Inc. | 1,903 | 46 | |
| KeyCorp | 2,058 | 46 | |
| Radian Group Inc. | 2,227 | 45 | |
| Diamond Hill Investment Group Inc. | 226 | 43 | |
| HarborOne Bancorp Inc. | 3,082 | 43 | |
| US Bancorp | 780 | 43 | |
| Artisan Partners Asset Management Inc. Class A | 949 | 42 | |
| * | Enova International Inc. | 1,087 | 41 |
| Hanover Insurance Group Inc. | 312 | 38 | |
| Morningstar Inc. | 114 | 35 | |
| BancFirst Corp. | 505 | 32 | |
| Stewart Information Services Corp. | 450 | 32 | |
| United Community Banks Inc. | 931 | 32 | |
| Westamerica BanCorp. | 576 | 31 | |
| Berkshire Hills Bancorp Inc. | 1,114 | 30 | |
| Byline Bancorp Inc. | 1,145 | 30 |
| Shares | Market Value• ($000) | ||
| Brookline Bancorp Inc. | 1,860 | 29 | |
| * | Focus Financial Partners Inc. Class A | 471 | 29 |
| OceanFirst Financial Corp. | 1,422 | 29 | |
| Preferred Bank | 431 | 29 | |
| Provident Financial Services Inc. | 1,229 | 29 | |
| Columbia Banking System Inc. | 855 | 28 | |
| Fulton Financial Corp. | 1,767 | 28 | |
| Greenhill & Co. Inc. | 1,665 | 28 | |
| MarketAxess Holdings Inc. | 79 | 28 | |
| Origin Bancorp Inc. | 665 | 28 | |
| Towne Bank | 923 | 28 | |
| Safety Insurance Group Inc. | 352 | 27 | |
| Trustmark Corp. | 889 | 27 | |
| Universal Insurance Holdings Inc. | 1,812 | 27 | |
| Independent Bank Group Inc. | 353 | 25 | |
| 23,509 | |||
| Health Care (14.0%) | |||
| * | Moderna Inc. | 5,839 | 2,058 |
| * | Veeva Systems Inc. Class A | 3,870 | 1,094 |
| Abbott Laboratories | 8,037 | 1,011 | |
| Johnson & Johnson | 6,061 | 945 | |
| * | Regeneron Pharmaceuticals Inc. | 1,450 | 923 |
| Eli Lilly & Co. | 3,298 | 818 | |
| Merck & Co. Inc. | 9,506 | 712 | |
| AbbVie Inc. | 5,968 | 688 | |
| * | Align Technology Inc. | 1,103 | 674 |
| * | Vertex Pharmaceuticals Inc. | 3,594 | 672 |
| * | Edwards Lifesciences Corp. | 4,698 | 504 |
| Gilead Sciences Inc. | 6,913 | 476 | |
| Cerner Corp. | 6,507 | 458 | |
| Chemed Corp. | 869 | 404 | |
| * | IDEXX Laboratories Inc. | 618 | 376 |
| Humana Inc. | 881 | 370 | |
| * | Seagen Inc. | 2,141 | 343 |
| * | Incyte Corp. | 4,933 | 334 |
| ResMed Inc. | 1,212 | 309 | |
| * | Molina Healthcare Inc. | 1,063 | 303 |
| * | Amedisys Inc. | 2,066 | 288 |
| * | ABIOMED Inc. | 913 | 287 |
| Agilent Technologies Inc. | 1,767 | 267 | |
| Amgen Inc. | 1,302 | 259 | |
| Atrion Corp. | 329 | 234 | |
| * | Quidel Corp. | 1,558 | 230 |
| * | Masimo Corp. | 786 | 219 |
| * | ICU Medical Inc. | 892 | 202 |
| Bruker Corp. | 2,468 | 200 | |
| * | STAAR Surgical Co. | 2,050 | 195 |
| * | CorVel Corp. | 1,005 | 189 |
| * | Globus Medical Inc. Class A | 2,876 | 180 |
| * | Catalyst Pharmaceuticals Inc. | 25,401 | 178 |
| * | BioDelivery Sciences International Inc. | 63,228 | 176 |
| * | Natus Medical Inc. | 7,596 | 172 |
| * | Fulgent Genetics Inc. | 1,689 | 158 |
| * | NextGen Healthcare Inc. | 9,871 | 153 |
| Owens & Minor Inc. | 3,707 | 148 | |
| * | Eagle Pharmaceuticals Inc. | 3,049 | 145 |
| West Pharmaceutical Services Inc. | 306 | 135 | |
| Anthem Inc. | 324 | 132 | |
| * | Medpace Holdings Inc. | 626 | 130 |
| * | Merit Medical Systems Inc. | 1,981 | 124 |
| * | Orthofix Medical Inc. | 4,037 | 124 |
| Shares | Market Value• ($000) | ||
| * | Vanda Pharmaceuticals Inc. | 7,635 | 124 |
| * | Henry Schein Inc. | 1,736 | 123 |
| * | Exelixis Inc. | 7,067 | 119 |
| LeMaitre Vascular Inc. | 2,388 | 112 | |
| * | Meridian Bioscience Inc. | 5,522 | 110 |
| Quest Diagnostics Inc. | 678 | 101 | |
| * | Tivity Health Inc. | 4,228 | 101 |
| * | Sage Therapeutics Inc. | 2,514 | 98 |
| * | Stereotaxis Inc. | 15,881 | 93 |
| * | Hologic Inc. | 1,222 | 91 |
| * | Inari Medical Inc. | 1,103 | 91 |
| Healthcare Services Group Inc. | 4,612 | 81 | |
| * | Computer Programs and Systems Inc. | 2,547 | 75 |
| * | AngioDynamics Inc. | 2,547 | 66 |
| * | Corcept Therapeutics Inc. | 3,149 | 66 |
| * | ModivCare Inc. | 476 | 65 |
| * | Myriad Genetics Inc. | 2,418 | 62 |
| Patterson Cos. Inc. | 1,952 | 61 | |
| * | Surmodics Inc. | 1,292 | 57 |
| * | Joint Corp. | 597 | 48 |
| *,1 | Retractable Technologies Inc. | 5,264 | 46 |
| Cardinal Health Inc. | 823 | 38 | |
| * | Ovid therapeutics Inc. | 11,234 | 38 |
| * | DaVita Inc. | 380 | 36 |
| * | Akebia Therapeutics Inc. | 10,727 | 29 |
| * | United Therapeutics Corp. | 138 | 26 |
| * | Cutera Inc. | 730 | 25 |
| * | Biogen Inc. | 103 | 24 |
| Phibro Animal Health Corp. Class A | 1,151 | 22 | |
| 20,025 | |||
| Industrials (17.4%) | |||
| American Express Co. | 7,441 | 1,133 | |
| Sherwin-Williams Co. | 3,242 | 1,074 | |
| Accenture plc Class A | 2,644 | 945 | |
| Automatic Data Processing Inc. | 3,075 | 710 | |
| Paychex Inc. | 4,754 | 567 | |
| A O Smith Corp. | 6,572 | 520 | |
| Synchrony Financial | 11,361 | 509 | |
| Jack Henry & Associates Inc. | 3,295 | 500 | |
| Capital One Financial Corp. | 2,869 | 403 | |
| Robert Half International Inc. | 3,419 | 380 | |
| Graco Inc. | 5,107 | 372 | |
| WW Grainger Inc. | 747 | 360 | |
| * | Zebra Technologies Corp. Class A | 595 | 350 |
| Lincoln Electric Holdings Inc. | 2,392 | 323 | |
| Louisiana-Pacific Corp. | 4,620 | 302 | |
| ManpowerGroup Inc. | 3,274 | 293 | |
| Watsco Inc. | 975 | 285 | |
| Acuity Brands Inc. | 1,411 | 284 | |
| * | TriNet Group Inc. | 2,814 | 282 |
| * | AMN Healthcare Services Inc. | 2,477 | 282 |
| Heartland Express Inc. | 16,130 | 270 | |
| Kforce Inc. | 3,519 | 270 | |
| * | Donnelley Financial Solutions Inc. | 5,594 | 261 |
| Cognex Corp. | 3,320 | 256 | |
| * | MYR Group Inc. | 2,255 | 250 |
| * | Keysight Technologies Inc. | 1,252 | 244 |
| 3M Co. | 1,434 | 244 | |
| Brunswick Corp. | 2,584 | 243 | |
| EMCOR Group Inc. | 2,031 | 242 | |
| Simpson Manufacturing Co. Inc. | 2,078 | 240 | |
| * | Veritiv Corp. | 1,905 | 240 |
| Shares | Market Value• ($000) | ||
| Astec Industries Inc. | 3,807 | 239 | |
| Landstar System Inc. | 1,395 | 235 | |
| Illinois Tool Works Inc. | 1,002 | 233 | |
| Badger Meter Inc. | 2,015 | 206 | |
| * | NV5 Global Inc. | 1,559 | 205 |
| Snap-on Inc. | 991 | 204 | |
| * | Saia Inc. | 610 | 202 |
| JB Hunt Transport Services Inc. | 1,041 | 199 | |
| * | Napco Security Technologies Inc. | 4,121 | 192 |
| Heidrick & Struggles International Inc. | 4,389 | 189 | |
| AAON Inc. | 2,383 | 186 | |
| * | Covenant Logistics Group Inc. Class A | 7,203 | 181 |
| Emerson Electric Co. | 1,992 | 175 | |
| John Bean Technologies Corp. | 1,068 | 169 | |
| Watts Water Technologies Inc. Class A | 868 | 164 | |
| Western Union Co. | 10,286 | 163 | |
| * | ASGN Inc. | 1,327 | 161 |
| Rockwell Automation Inc. | 469 | 158 | |
| Crane Co. | 1,611 | 156 | |
| Pentair plc | 2,122 | 156 | |
| Marten Transport Ltd. | 9,638 | 155 | |
| AGCO Corp. | 1,380 | 152 | |
| Insperity Inc. | 1,305 | 151 | |
| Hillenbrand Inc. | 3,371 | 150 | |
| * | Mettler-Toledo International Inc. | 96 | 145 |
| * | Conduent Inc. | 28,545 | 144 |
| Ennis Inc. | 7,573 | 144 | |
| * | Generac Holdings Inc. | 342 | 144 |
| Expeditors International of Washington Inc. | 1,161 | 141 | |
| * | Trex Co. Inc. | 1,057 | 140 |
| CH Robinson Worldwide Inc. | 1,465 | 139 | |
| MSC Industrial Direct Co. Inc. Class A | 1,767 | 139 | |
| Insteel Industries Inc. | 3,229 | 136 | |
| * | Franklin Covey Co. | 3,007 | 132 |
| Cintas Corp. | 297 | 125 | |
| Encore Wire Corp. | 886 | 124 | |
| Schneider National Inc. Class B | 4,908 | 121 | |
| Apogee Enterprises Inc. | 2,909 | 120 | |
| Nordson Corp. | 473 | 120 | |
| Enerpac Tool Group Corp. Class A | 5,676 | 120 | |
| Trane Technologies plc | 635 | 119 | |
| Argan Inc. | 2,858 | 112 | |
| Kadant Inc. | 476 | 112 | |
| Old Dominion Freight Line Inc. | 312 | 111 | |
| * | TrueBlue Inc. | 4,284 | 111 |
| CSW Industrials Inc. | 901 | 108 | |
| * | Builders FirstSource Inc. | 1,506 | 105 |
| Quanex Building Products Corp. | 4,904 | 105 | |
| Donaldson Co. Inc. | 1,840 | 104 | |
| Quanta Services Inc. | 918 | 104 | |
| * | GMS Inc. | 1,804 | 101 |
| Werner Enterprises Inc. | 2,226 | 100 | |
| Exponent Inc. | 852 | 99 | |
| * | Cross Country Healthcare Inc. | 3,748 | 98 |
| MKS Instruments Inc. | 641 | 98 | |
| Toro Co. | 970 | 98 | |
| * | Vicor Corp. | 672 | 96 |
| H&E Equipment Services Inc. | 2,256 | 95 |
| Shares | Market Value• ($000) | ||
| Resources Connection Inc. | 5,447 | 94 | |
| Comfort Systems USA Inc. | 980 | 93 | |
| MSA Safety Inc. | 629 | 90 | |
| * | Dycom Industries Inc. | 943 | 88 |
| * | Energy Recovery Inc. | 4,094 | 87 |
| EVERTEC Inc. | 2,071 | 87 | |
| Allison Transmission Holdings Inc. | 2,450 | 85 | |
| Cummins Inc. | 406 | 85 | |
| ABM Industries Inc. | 1,835 | 83 | |
| Myers Industries Inc. | 4,156 | 81 | |
| Franklin Electric Co. Inc. | 903 | 80 | |
| PPG Industries Inc. | 517 | 80 | |
| * | TopBuild Corp. | 297 | 80 |
| Ryder System Inc. | 939 | 78 | |
| Terex Corp. | 1,787 | 76 | |
| * | Mohawk Industries Inc. | 449 | 75 |
| Xylem Inc. | 623 | 75 | |
| Dover Corp. | 450 | 74 | |
| * | OSI Systems Inc. | 793 | 72 |
| Valmont Industries Inc. | 302 | 72 | |
| Matson Inc. | 866 | 71 | |
| Applied Industrial Technologies Inc. | 735 | 70 | |
| * | Sterling Construction Co. Inc. | 2,660 | 69 |
| Pitney Bowes Inc. | 9,256 | 63 | |
| * | DXP Enterprises Inc. | 2,241 | 62 |
| Barrett Business Services Inc. | 862 | 61 | |
| CRA International Inc. | 645 | 59 | |
| Allegion plc | 477 | 59 | |
| Hubbell Inc. Class B | 295 | 58 | |
| Advanced Drainage Systems Inc. | 454 | 56 | |
| Shyft Group Inc. | 1,162 | 56 | |
| ICF International Inc. | 555 | 54 | |
| * | FTI Consulting Inc. | 361 | 53 |
| * | FARO Technologies Inc. | 760 | 53 |
| * | Waters Corp. | 162 | 53 |
| ITT Inc. | 540 | 51 | |
| McGrath RentCorp. | 648 | 50 | |
| * | Modine Manufacturing Co. | 4,843 | 50 |
| * | ShotSpotter Inc. | 1,400 | 49 |
| UniFirst Corp. | 257 | 49 | |
| Albany International Corp. Class A | 587 | 48 | |
| * | Masonite International Corp. | 445 | 48 |
| * | Hub Group Inc. Class A | 590 | 46 |
| Owens Corning | 540 | 46 | |
| Wabash National Corp. | 2,760 | 46 | |
| AZZ Inc. | 849 | 44 | |
| * | Construction Partners Inc. Class A | 1,252 | 43 |
| * | United Rentals Inc. | 126 | 43 |
| Brady Corp. Class A | 780 | 39 | |
| Maximus Inc. | 521 | 39 | |
| * | ExlService Holdings Inc. | 294 | 38 |
| Regal Rexnord Corp. | 243 | 38 | |
| Flowserve Corp. | 1,222 | 37 | |
| AptarGroup Inc. | 297 | 36 | |
| Deluxe Corp. | 1,065 | 36 | |
| Forward Air Corp. | 368 | 36 | |
| Littelfuse Inc. | 122 | 36 | |
| Packaging Corp. of America | 279 | 36 | |
| * | Cornerstone Building Brands Inc. | 2,164 | 34 |
| Huntington Ingalls Industries Inc. | 193 | 34 |
| Shares | Market Value• ($000) | ||
| * | Axalta Coating Systems Ltd. | 1,095 | 33 |
| Mastercard Inc. Class A | 97 | 31 | |
| Fortune Brands Home & Security Inc. | 295 | 30 | |
| Hyster-Yale Materials Handling Inc. | 772 | 30 | |
| Kelly Services Inc. Class A | 1,756 | 30 | |
| Helios Technologies Inc. | 275 | 28 | |
| SPX FLOW Inc. | 334 | 28 | |
| Granite Construction Inc. | 692 | 27 | |
| * | Daseke Inc. | 2,586 | 25 |
| Alamo Group Inc. | 165 | 23 | |
| * | JELD-WEN Holding Inc. | 910 | 22 |
| * | O-I Glass Inc. | 1,929 | 21 |
| * | BM Technologies Inc. (XASE) | 194 | 2 |
| 24,939 | |||
| Real Estate (0.3%) | |||
| Simon Property Group Inc. | 1,913 | 293 | |
| Iron Mountain Inc. | 1,920 | 87 | |
| Lamar Advertising Co. Class A | 526 | 58 | |
| Empire State Realty Trust Inc. Class A | 3,644 | 33 | |
| Urban Edge Properties | 1,520 | 26 | |
| 497 | |||
| Technology (18.9%) | |||
| * | Advanced Micro Devices Inc. | 9,894 | 1,567 |
| * | Alphabet Inc. Class C | 508 | 1,447 |
| Texas Instruments Inc. | 6,053 | 1,164 | |
| * | Zoom Video Communications Inc. Class A | 5,327 | 1,126 |
| * | Cadence Design Systems Inc. | 6,105 | 1,083 |
| Applied Materials Inc. | 7,255 | 1,068 | |
| KLA Corp. | 2,237 | 913 | |
| * | Adobe Inc. | 1,243 | 833 |
| QUALCOMM Inc. | 3,898 | 704 | |
| * | Synopsys Inc. | 1,781 | 607 |
| Teradyne Inc. | 3,534 | 540 | |
| * | Fortinet Inc. | 1,436 | 477 |
| NetApp Inc. | 4,999 | 444 | |
| * | Meta Platforms Inc. Class A | 1,328 | 431 |
| Apple Inc. | 2,439 | 403 | |
| VMware Inc. Class A | 3,407 | 398 | |
| * | Manhattan Associates Inc. | 2,494 | 389 |
| * | Gartner Inc. | 1,164 | 363 |
| Intuit Inc. | 539 | 352 | |
| NVIDIA Corp. | 1,076 | 352 | |
| Monolithic Power Systems Inc. | 603 | 334 | |
| * | Cirrus Logic Inc. | 4,154 | 333 |
| * | Alphabet Inc. Class A | 109 | 309 |
| * | Allegro MicroSystems Inc. | 9,887 | 309 |
| Intel Corp. | 6,138 | 302 | |
| * | Teradata Corp. | 6,860 | 298 |
| * | Yelp Inc. Class A | 8,398 | 288 |
| * | Qualys Inc. | 2,161 | 282 |
| * | Anaplan Inc. | 5,875 | 252 |
| * | CommVault Systems Inc. | 4,009 | 252 |
| Skyworks Solutions Inc. | 1,575 | 239 | |
| Lam Research Corp. | 348 | 237 | |
| * | Atlassian Corp. plc Class A | 608 | 229 |
| Microsoft Corp. | 691 | 228 | |
| * | Synaptics Inc. | 796 | 225 |
| National Instruments Corp. | 5,305 | 220 | |
| Advanced Energy Industries Inc. | 2,470 | 217 | |
| * | Lattice Semiconductor Corp. | 2,858 | 217 |
| TE Connectivity Ltd. | 1,401 | 216 | |
| Shares | Market Value• ($000) | ||
| A10 Networks Inc. | 13,817 | 213 | |
| * | Agilysys Inc. | 4,894 | 213 |
| * | Elastic NV | 1,362 | 212 |
| * | EPAM Systems Inc. | 342 | 208 |
| Xperi Holding Corp. | 11,475 | 206 | |
| * | Digital Turbine Inc. | 3,715 | 197 |
| * | ON Semiconductor Corp. | 3,138 | 193 |
| Shutterstock Inc. | 1,621 | 185 | |
| * | Appian Corp. Class A | 2,427 | 180 |
| * | Onto Innovation Inc. | 1,761 | 166 |
| * | TrueCar Inc. | 50,227 | 165 |
| CTS Corp. | 4,532 | 158 | |
| Cognizant Technology Solutions Corp. Class A | 1,980 | 154 | |
| * | eGain Corp. | 14,434 | 152 |
| * | F5 Inc. | 662 | 151 |
| * | Paycom Software Inc. | 336 | 147 |
| * | Upwork Inc. | 3,737 | 139 |
| Universal Display Corp. | 897 | 128 | |
| * | FormFactor Inc. | 2,837 | 119 |
| International Business Machines Corp. | 997 | 117 | |
| * | PDF Solutions Inc. | 3,879 | 116 |
| * | Veritone Inc. | 4,328 | 111 |
| * | Sprout Social Inc. Class A | 984 | 110 |
| * | Yandex NV Class A | 1,514 | 109 |
| American Software Inc. Class A | 4,751 | 108 | |
| * | IPG Photonics Corp. | 646 | 106 |
| * | TechTarget Inc. | 1,101 | 106 |
| Vertiv Holdings Co. Class A | 4,008 | 103 | |
| * | ChannelAdvisor Corp. | 4,062 | 102 |
| CSG Systems International Inc. | 1,904 | 100 | |
| * | MaxLinear Inc. | 1,456 | 98 |
| * | OneSpan Inc. | 5,350 | 91 |
| * | CyberOptics Corp. | 2,106 | 91 |
| * | ePlus Inc. | 855 | 90 |
| Amdocs Ltd. | 1,278 | 89 | |
| * | Dropbox Inc. Class A | 3,570 | 88 |
| * | Alpha & Omega Semiconductor Ltd. | 1,783 | 88 |
| * | ScanSource Inc. | 2,778 | 87 |
| * | Groupon Inc. Class A | 4,147 | 86 |
| * | Novanta Inc. | 519 | 84 |
| * | Box Inc. Class A | 3,537 | 83 |
| Dolby Laboratories Inc. Class A | 945 | 79 | |
| * | SPS Commerce Inc. | 556 | 78 |
| * | Cargurus Inc. | 2,040 | 76 |
| * | 3D Systems Corp. | 3,200 | 73 |
| * | Cohu Inc. | 2,116 | 70 |
| Jabil Inc. | 1,206 | 70 | |
| * | Crowdstrike Holdings Inc. Class A | 313 | 68 |
| CDW Corp. | 352 | 67 | |
| * | Appfolio Inc. Class A | 538 | 65 |
| * | Brightcove Inc. | 6,471 | 62 |
| * | Mimecast Ltd. | 764 | 62 |
| * | Arrow Electronics Inc. | 496 | 60 |
| Kulicke & Soffa Industries Inc. | 1,027 | 59 | |
| Vishay Intertechnology Inc. | 2,831 | 58 | |
| Power Integrations Inc. | 566 | 57 | |
| * | Diodes Inc. | 522 | 56 |
| * | SecureWorks Corp. Class A | 3,180 | 56 |
| Concentrix Corp. | 331 | 55 | |
| * | Avaya Holdings Corp. | 2,776 | 54 |
| PC Connection Inc. | 1,147 | 50 | |
| * | Perficient Inc. | 367 | 50 |
| Shares | Market Value• ($000) | ||
| * | Jamf Holding Corp. | 1,476 | 48 |
| Simulations Plus Inc. | 987 | 46 | |
| Avnet Inc. | 1,253 | 45 | |
| Amkor Technology Inc. | 2,050 | 44 | |
| * | MACOM Technology Solutions Holdings Inc. Class H | 609 | 44 |
| Brooks Automation Inc. | 378 | 43 | |
| * | Axcelis Technologies Inc. | 675 | 42 |
| * | Blackbaud Inc. | 554 | 42 |
| * | SMART Global Holdings Inc. | 688 | 39 |
| * | Alarm.com Holdings Inc. | 474 | 38 |
| * | Semtech Corp. | 447 | 38 |
| Hackett Group Inc. | 1,711 | 35 | |
| * | II-VI Inc. | 555 | 35 |
| TD SYNNEX Corp. | 331 | 34 | |
| * | Altair Engineering Inc. Class A | 422 | 31 |
| * | Verint Systems Inc. | 662 | 31 |
| * | Mitek Systems Inc. | 1,640 | 28 |
| * | comScore Inc. | 6,966 | 24 |
| * | Nutanix Inc. Class A | 727 | 24 |
| * | Pinterest Inc. Class A | 490 | 20 |
| * | Kyndryl Holdings Inc. | 199 | 3 |
| 27,156 | |||
| Telecommunications (1.0%) | |||
| Cisco Systems Inc. | 4,920 | 270 | |
| * | Calix Inc. | 2,581 | 173 |
| * | Clearfield Inc. | 2,421 | 157 |
| * | IDT Corp. Class B | 2,533 | 137 |
| Ubiquiti Inc. | 342 | 102 | |
| * | Ciena Corp. | 1,350 | 81 |
| * | Arista Networks Inc. | 644 | 80 |
| * | Digi International Inc. | 3,080 | 66 |
| * | Extreme Networks Inc. | 4,641 | 63 |
| * | Ooma Inc. | 3,259 | 61 |
| * | Cambium Networks Corp. | 1,828 | 50 |
| * | NETGEAR Inc. | 1,831 | 49 |
| * | Viavi Solutions Inc. | 2,655 | 39 |
| * | Consolidated Communications Holdings Inc. | 4,522 | 34 |
| ADTRAN Inc. | 1,417 | 29 | |
| * | Aviat Networks Inc. | 826 | 26 |
| * | CommScope Holding Co. Inc. | 2,368 | 24 |
| 1,441 | |||
| Utilities (0.1%) | |||
| * | Clean Harbors Inc. | 683 | 69 |
| Total Common Stocks (Cost $115,997) | 142,957 | ||
| Shares | Market Value• ($000) | ||
| Temporary Cash Investments (0.5%) | |||
| Money Market Fund (0.5%) | |||
| 2,3 | Vanguard Market Liquidity Fund, 0.077% (Cost $734) | 7,338 | 734 |
| Total Investments (100.1%) (Cost $116,731) | 143,691 | ||
| Other Assets and Liabilities—Net (-0.1%) | (109) | ||
| Net Assets (100%) | 143,582 | ||
| Cost is in $000. | |||
| • | See Note A in Notes to Financial Statements. |
| * | Non-income-producing security. |
| 1 | Includes partial security positions on loan to broker-dealers. The total value of securities on loan is $200,000. |
| 2 | Affiliated money market fund available only to Vanguard funds and certain trusts and accounts managed by Vanguard. Rate shown is the 7-day yield. |
| 3 | Collateral of $222,000 was received for securities on loan. |
| Futures Contracts | ||||
| ($000) | ||||
| Expiration | Number of Long (Short) Contracts | Notional Amount | Value and Unrealized Appreciation (Depreciation) | |
| Long Futures Contracts | ||||
| Micro E-mini S&P 500 Index | December 2021 | 24 | 548 | (1) |
| ($000s, except shares and per-share amounts) | Amount |
| Assets | |
| Investments in Securities, at Value | |
| Unaffiliated Issuers (Cost $115,997) | 142,957 |
| Affiliated Issuers (Cost $734) | 734 |
| Total Investments in Securities | 143,691 |
| Investment in Vanguard | 4 |
| Cash Collateral Pledged—Futures Contracts | 35 |
| Receivables for Investment Securities Sold | 2 |
| Receivables for Accrued Income | 146 |
| Total Assets | 143,878 |
| Liabilities | |
| Due to Custodian | 56 |
| Collateral for Securities on Loan | 222 |
| Payables to Vanguard | 8 |
| Variation Margin Payable—Futures Contracts | 10 |
| Total Liabilities | 296 |
| Net Assets | 143,582 |
| At November 30, 2021, net assets consisted of: | |
| Paid-in Capital | 116,576 |
| Total Distributable Earnings (Loss) | 27,006 |
| Net Assets | 143,582 |
| Net Assets | |
| Applicable to 1,175,000 outstanding $.001 par value shares of beneficial interest (unlimited authorization) | 143,582 |
| Net Asset Value Per Share | $122.20 |
| Year Ended November 30, 2021 | |
| ($000) | |
| Investment Income | |
| Income | |
| Dividends | 1,209 |
| Interest1 | — |
| Securities Lending—Net | 8 |
| Total Income | 1,217 |
| Expenses | |
| The Vanguard Group—Note B | |
| Investment Advisory Services | 43 |
| Management and Administrative | 39 |
| Marketing and Distribution | 1 |
| Custodian Fees | 3 |
| Auditing Fees | 31 |
| Shareholders’ Reports | 2 |
| Trustees’ Fees and Expenses | — |
| Total Expenses | 119 |
| Net Investment Income | 1,098 |
| Realized Net Gain (Loss) | |
| Investment Securities Sold1,2 | 2,470 |
| Futures Contracts | 75 |
| Realized Net Gain (Loss) | 2,545 |
| Change in Unrealized Appreciation (Depreciation) | |
| Investment Securities1 | 14,528 |
| Futures Contracts | (7) |
| Change in Unrealized Appreciation (Depreciation) | 14,521 |
| Net Increase (Decrease) in Net Assets Resulting from Operations | 18,164 |
| 1 | Interest income, realized net gain (loss), and change in unrealized appreciation (depreciation) from an affiliated company of the fund were less than $1,000, less than $1,000, and less than $1,000, respectively. Purchases and sales are for temporary cash investment purposes. |
| 2 | Includes $1,239,000 of net gain (loss) resulting from in-kind redemptions. |
| Year Ended November 30, | ||
| 2021 ($000) | 2020 ($000) | |
| Increase (Decrease) in Net Assets | ||
| Operations | ||
| Net Investment Income | 1,098 | 595 |
| Realized Net Gain (Loss) | 2,545 | (1,375) |
| Change in Unrealized Appreciation (Depreciation) | 14,521 | 10,696 |
| Net Increase (Decrease) in Net Assets Resulting from Operations | 18,164 | 9,916 |
| Distributions | ||
| Total Distributions | (932) | (495) |
| Capital Share Transactions | ||
| Issued | 74,754 | 26,166 |
| Issued in Lieu of Cash Distributions | — | — |
| Redeemed | (2,908) | (2,136) |
| Net Increase (Decrease) from Capital Share Transactions | 71,846 | 24,030 |
| Total Increase (Decrease) | 89,078 | 33,451 |
| Net Assets | ||
| Beginning of Period | 54,504 | 21,053 |
| End of Period | 143,582 | 54,504 |
| For a Share Outstanding Throughout Each Period | Year Ended November 30, | February 13, 20181 to November 30, 2018 | ||
| 2021 | 2020 | 2019 | ||
| Net Asset Value, Beginning of Period | $94.79 | $84.21 | $78.58 | $75.00 |
| Investment Operations | ||||
| Net Investment Income2 | 1.403 | 1.291 | 1.199 | .899 |
| Net Realized and Unrealized Gain (Loss) on Investments | 27.292 | 10.428 | 5.559 | 3.266 |
| Total from Investment Operations | 28.695 | 11.719 | 6.758 | 4.165 |
| Distributions | ||||
| Dividends from Net Investment Income | (1.285) | (1.139) | (1.128) | (.585) |
| Distributions from Realized Capital Gains | — | — | — | — |
| Total Distributions | (1.285) | (1.139) | (1.128) | (.585) |
| Net Asset Value, End of Period | $122.20 | $94.79 | $84.21 | $78.58 |
| Total Return | 30.42% | 14.29% | 8.75% | 5.52% |
| Ratios/Supplemental Data | ||||
| Net Assets, End of Period (Millions) | $144 | $55 | $21 | $18 |
| Ratio of Total Expenses to Average Net Assets | 0.13% | 0.13% | 0.13% | 0.13%3,4 |
| Ratio of Net Investment Income to Average Net Assets | 1.21% | 1.59% | 1.52% | 1.40%3 |
| Portfolio Turnover Rate | 56%5 | 58% | 80% | 25% |
| 1 | Inception. |
| 2 | Calculated based on average shares outstanding. |
| 3 | Annualized. |
| 4 | The ratio of total expenses to average net assets before an expense reduction of 0.04% was 0.17%. The fund incurred higher than anticipated expenses, in which Vanguard voluntarily agreed to assume payment of certain expenses. The fund is not obligated to repay this amount to Vanguard. |
| 5 | Excludes the value of portfolio securities received or delivered as a result of in-kind purchases or redemptions of the fund’s capital shares, including ETF Creation Units. |
| A. | The following significant accounting policies conform to generally accepted accounting principles for U.S. investment companies. The fund consistently follows such policies in preparing its financial statements. |
| B. | In accordance with the terms of a Funds' Service Agreement (the “FSA”) between Vanguard and the fund, Vanguard furnishes to the fund investment advisory, corporate management, administrative, marketing, and distribution services at Vanguard’s cost of operations (as defined by the FSA). These costs of operations are allocated to the fund based on methods and guidelines approved by the board of trustees and are generally settled twice a month. |
| C. | Various inputs may be used to determine the value of the fund’s investments and derivatives. These inputs are summarized in three broad levels for financial statement purposes. The inputs or methodologies used to value securities are not necessarily an indication of the risk associated with investing in those securities. |
| D. | Permanent differences between book-basis and tax-basis components of net assets are reclassified among capital accounts in the financial statements to reflect their tax character. These reclassifications have no effect on net assets or net asset value per share. As of period end, permanent differences primarily attributable to the accounting for in-kind redemptions were reclassified between the following accounts: |
| Amount ($000) | |
| Paid-in Capital | 1,239 |
| Total Distributable Earnings (Loss) | (1,239) |
| Amount ($000) | |
| Undistributed Ordinary Income | 340 |
| Undistributed Long-Term Gains | — |
| Capital Loss Carryforwards | (281) |
| Qualified Late-Year Losses | — |
| Net Unrealized Gains (Losses) | 26,947 |
| Year Ended November 30, | ||
| 2021 Amount ($000) | 2020 Amount ($000) | |
| Ordinary Income* | 932 | 495 |
| Long-Term Capital Gains | — | — |
| Total | 932 | 495 |
| * | Includes short-term capital gains, if any. |
| Amount ($000) | |
| Tax Cost | 116,744 |
| Gross Unrealized Appreciation | 31,275 |
| Gross Unrealized Depreciation | (4,328) |
| Net Unrealized Appreciation (Depreciation) | 26,947 |
| E. | During the year ended November 30, 2021, the fund purchased $125,609,000 of investment securities and sold $53,889,000 of investment securities, other than temporary cash investments. Purchases and sales include $0 and $2,907,000, respectively, in connection with in-kind purchases and redemptions of the fund's capital shares. |
| F. | Capital shares issued and redeemed were: |
| Year Ended November 30, | ||
| 2021 Shares (000) | 2020 Shares (000) | |
| Issued | 625 | 350 |
| Issued in Lieu of Cash Distributions | — | — |
| Redeemed | (25) | (25) |
| Net Increase (Decrease) in Shares Outstanding | 600 | 325 |
| G. | Management has determined that no events or transactions occurred subsequent to November 30, 2021, that would require recognition or disclosure in these financial statements. |

| Average Annual Total Returns Periods Ended November 30, 2021 | ||||
| One Year | Since Inception (2/13/2018) | Final Value of a $10,000 Investment | ||
| U.S. Value Factor ETF Net Asset Value | 37.51% | 10.02% | $14,367 |
| U.S. Value Factor ETF Market Price | 37.48 | 10.03 | 14,371 | |
| Russell 3000 Index | 26.34 | 17.17 | 18,243 |
| One Year | Since Inception (2/13/2018) | |
| U.S. Value Factor ETF Market Price | 37.48% | 43.71% |
| U.S. Value Factor ETF Net Asset Value | 37.51 | 43.67 |
| Russell 3000 Index | 26.34 | 82.43 |
| Basic Materials | 6.7% |
| Consumer Discretionary | 17.0 |
| Consumer Staples | 5.9 |
| Energy | 9.5 |
| Financials | 22.1 |
| Health Care | 10.8 |
| Industrials | 15.3 |
| Real Estate | 0.4 |
| Technology | 7.3 |
| Telecommunications | 4.5 |
| Utilities | 0.5 |
| Shares | Market Value• ($000) | ||
| Common Stocks (99.5%) | |||
| Basic Materials (6.6%) | |||
| Dow Inc. | 75,330 | 4,138 | |
| Newmont Corp. | 49,247 | 2,705 | |
| International Paper Co. | 42,527 | 1,936 | |
| Freeport-McMoRan Inc. | 51,358 | 1,904 | |
| LyondellBasell Industries NV Class A | 20,613 | 1,796 | |
| Nucor Corp. | 11,235 | 1,194 | |
| Mosaic Co. | 30,827 | 1,055 | |
| Reliance Steel & Aluminum Co. | 6,838 | 1,016 | |
| Steel Dynamics Inc. | 13,487 | 807 | |
| US Steel Corp. | 33,820 | 765 | |
| Westlake Chemical Corp. | 7,457 | 693 | |
| * | Alto Ingredients Inc. | 130,153 | 678 |
| UFP Industries Inc. | 7,517 | 626 | |
| AdvanSix Inc. | 12,618 | 571 | |
| * | Koppers Holdings Inc. | 18,217 | 550 |
| Glatfelter Corp. | 31,618 | 521 | |
| GrafTech International Ltd. | 43,824 | 511 | |
| Huntsman Corp. | 15,614 | 495 | |
| * | Cleveland-Cliffs Inc. | 23,972 | 488 |
| Ashland Global Holdings Inc. | 4,458 | 451 | |
| * | TimkenSteel Corp. | 30,464 | 436 |
| * | Clearwater Paper Corp. | 10,284 | 414 |
| Chemours Co. | 13,714 | 407 | |
| Tronox Holdings plc Class A | 18,100 | 398 | |
| Schnitzer Steel Industries Inc. Class A | 7,778 | 374 | |
| Worthington Industries Inc. | 7,485 | 359 | |
| Commercial Metals Co. | 10,598 | 328 | |
| Olin Corp. | 5,498 | 299 | |
| Boise Cascade Co. | 4,587 | 297 | |
| Eastman Chemical Co. | 2,802 | 292 | |
| * | Univar Solutions Inc. | 11,270 | 292 |
| * | Intrepid Potash Inc. | 7,006 | 288 |
| CF Industries Holdings Inc. | 3,764 | 228 | |
| Hecla Mining Co. | 40,697 | 225 | |
| Valvoline Inc. | 6,447 | 220 | |
| Trinseo plc | 4,277 | 202 | |
| Schweitzer-Mauduit International Inc. | 6,452 | 185 | |
| Element Solutions Inc. | 7,931 | 181 | |
| Timken Co. | 2,473 | 163 | |
| Olympic Steel Inc. | 7,848 | 160 | |
| Verso Corp. Class A | 7,529 | 159 | |
| FutureFuel Corp. | 20,961 | 158 | |
| Shares | Market Value• ($000) | ||
| * | Rayonier Advanced Materials Inc. | 22,109 | 121 |
| Cabot Corp. | 2,246 | 118 | |
| Minerals Technologies Inc. | 1,803 | 118 | |
| Celanese Corp. Class A | 761 | 115 | |
| Haynes International Inc. | 2,677 | 107 | |
| * | Orion Engineered Carbons SA | 5,886 | 103 |
| 29,647 | |||
| Consumer Discretionary (16.9%) | |||
| Ford Motor Co. | 233,234 | 4,476 | |
| * | General Motors Co. | 56,013 | 3,241 |
| * | Discovery Inc. Class C | 70,066 | 1,591 |
| Macy's Inc. | 49,106 | 1,399 | |
| * | AutoZone Inc. | 718 | 1,305 |
| * | Taylor Morrison Home Corp. Class A | 41,081 | 1,276 |
| Penske Automotive Group Inc. | 12,480 | 1,243 | |
| * | Meritage Homes Corp. | 10,518 | 1,187 |
| Bath & Body Works Inc. | 15,775 | 1,185 | |
| Whirlpool Corp. | 5,252 | 1,144 | |
| Dick's Sporting Goods Inc. | 8,498 | 999 | |
| * | SkyWest Inc. | 24,835 | 973 |
| Toll Brothers Inc. | 15,305 | 971 | |
| Century Communities Inc. | 13,421 | 954 | |
| Kohl's Corp. | 18,595 | 953 | |
| Target Corp. | 3,895 | 950 | |
| Qurate Retail Inc. Series A | 114,705 | 918 | |
| eBay Inc. | 13,559 | 915 | |
| Gray Television Inc. | 43,956 | 906 | |
| Lennar Corp. Class A | 8,298 | 872 | |
| Nexstar Media Group Inc. Class A | 5,692 | 851 | |
| Lithia Motors Inc. Class A | 2,901 | 845 | |
| ViacomCBS Inc. Class B | 26,149 | 809 | |
| PVH Corp. | 7,514 | 802 | |
| * | Perdoceo Education Corp. | 81,474 | 802 |
| Lear Corp. | 4,763 | 799 | |
| * | Cars.com Inc. | 47,554 | 793 |
| Fox Corp. Class B | 23,486 | 789 | |
| * | TravelCenters of America Inc. | 14,604 | 763 |
| AMERCO | 1,062 | 748 | |
| * | AutoNation Inc. | 5,981 | 741 |
| Nielsen Holdings plc | 38,105 | 730 | |
| * | Genesco Inc. | 11,012 | 696 |
| PulteGroup Inc. | 13,652 | 683 | |
| * | KAR Auction Services Inc. | 45,272 | 679 |
| Signet Jewelers Ltd. | 6,915 | 672 | |
| Harley-Davidson Inc. | 18,328 | 671 | |
| Shares | Market Value• ($000) | ||
| * | Tri Pointe Homes Inc. | 26,845 | 670 |
| * | Avis Budget Group Inc. | 2,337 | 642 |
| Walmart Inc. | 4,512 | 634 | |
| Rush Enterprises Inc. Class A | 12,360 | 630 | |
| Omnicom Group Inc. | 9,245 | 622 | |
| * | Goodyear Tire & Rubber Co. | 30,517 | 614 |
| LKQ Corp. | 10,947 | 612 | |
| * | Capri Holdings Ltd. | 9,932 | 588 |
| Strategic Education Inc. | 10,874 | 582 | |
| * | JetBlue Airways Corp. | 42,109 | 565 |
| Standard Motor Products Inc. | 11,158 | 558 | |
| Travel + Leisure Co. | 11,270 | 555 | |
| Fox Corp. Class A | 14,715 | 525 | |
| * | MarineMax Inc. | 9,731 | 518 |
| * | Conn's Inc. | 22,828 | 499 |
| * | Container Store Group Inc. | 42,235 | 491 |
| La-Z-Boy Inc. | 14,642 | 489 | |
| Movado Group Inc. | 10,681 | 479 | |
| Thor Industries Inc. | 4,330 | 458 | |
| * | WW International Inc. | 26,867 | 452 |
| * | Dine Brands Global Inc. | 6,206 | 446 |
| Murphy USA Inc. | 2,571 | 446 | |
| Activision Blizzard Inc. | 7,567 | 443 | |
| TEGNA Inc. | 21,667 | 428 | |
| * | Adtalem Global Education Inc. | 14,387 | 427 |
| * | Tupperware Brands Corp. | 27,327 | 427 |
| * | American Axle & Manufacturing Holdings Inc. | 48,026 | 425 |
| EW Scripps Co. Class A | 22,815 | 423 | |
| * | Fossil Group Inc. | 34,911 | 417 |
| * | Lazydays Holdings Inc. | 20,321 | 411 |
| * | Grand Canyon Education Inc. | 5,602 | 406 |
| * | Mesa Air Group Inc. | 57,268 | 404 |
| * | G-III Apparel Group Ltd. | 13,604 | 403 |
| * | Tenneco Inc. Class A | 38,315 | 402 |
| * | Zumiez Inc. | 8,766 | 401 |
| * | Brinker International Inc. | 11,421 | 395 |
| * | Discovery Inc. Class A | 16,976 | 395 |
| * | Alaska Air Group Inc. | 7,897 | 384 |
| H&R Block Inc. | 16,231 | 384 | |
| Leggett & Platt Inc. | 9,184 | 371 | |
| * | Bed Bath & Beyond Inc. | 20,053 | 368 |
| * | Adient plc | 8,518 | 362 |
| * | Nautilus Inc. | 52,667 | 361 |
| Laureate Education Inc. Class A | 34,968 | 350 | |
| * | Dollar Tree Inc. | 2,554 | 342 |
| * | Knowles Corp. | 15,501 | 337 |
| OneWater Marine Inc. Class A | 6,430 | 329 | |
| * | Lumber Liquidators Holdings Inc. | 21,289 | 327 |
| Group 1 Automotive Inc. | 1,635 | 318 | |
| Hibbett Inc. | 4,024 | 314 | |
| Caleres Inc. | 12,955 | 306 | |
| * | Entercom Communications Corp. Class A | 121,340 | 300 |
| Shoe Carnival Inc. | 7,565 | 296 | |
| Lennar Corp. Class B | 3,407 | 292 | |
| Cato Corp. Class A | 17,515 | 288 | |
| Haverty Furniture Cos. Inc. | 9,503 | 284 | |
| * | Beazer Homes USA Inc. | 14,255 | 280 |
| * | ODP Corp. | 7,378 | 279 |
| Interpublic Group of Cos. Inc. | 8,338 | 277 | |
| Hasbro Inc. | 2,829 | 274 | |
| 1 | Big 5 Sporting Goods Corp. | 11,439 | 271 |
| Shares | Market Value• ($000) | ||
| Scholastic Corp. | 7,179 | 270 | |
| KB Home | 6,702 | 268 | |
| Newell Brands Inc. | 12,485 | 268 | |
| * | AMC Networks Inc. Class A | 6,895 | 266 |
| 1 | Sirius XM Holdings Inc. | 42,339 | 258 |
| DR Horton Inc. | 2,612 | 255 | |
| * | Vera Bradley Inc. | 25,431 | 242 |
| Matthews International Corp. Class A | 6,805 | 236 | |
| Carter's Inc. | 2,254 | 228 | |
| * | Penn National Gaming Inc. | 4,444 | 228 |
| Dillard's Inc. Class A | 819 | 224 | |
| Dana Inc. | 10,244 | 220 | |
| * | Kirkland's Inc. | 10,055 | 217 |
| * | Green Brick Partners Inc. | 7,838 | 196 |
| * | Asbury Automotive Group Inc. | 1,171 | 192 |
| * | Fluent Inc. | 101,385 | 189 |
| Big Lots Inc. | 4,270 | 185 | |
| Foot Locker Inc. | 3,987 | 182 | |
| Aaron's Co. Inc. | 8,158 | 181 | |
| Rent-A-Center Inc. | 4,068 | 180 | |
| * | Sleep Number Corp. | 2,188 | 175 |
| * | Lions Gate Entertainment Corp. Class B | 12,555 | 171 |
| International Game Technology plc | 6,320 | 171 | |
| HNI Corp. | 4,267 | 169 | |
| ViacomCBS Inc. Class A | 4,940 | 165 | |
| Winnebago Industries Inc. | 2,277 | 164 | |
| Del Taco Restaurants Inc. | 21,007 | 161 | |
| * | NVR Inc. | 30 | 157 |
| Interface Inc. Class A | 10,924 | 156 | |
| * | Stride Inc. | 4,509 | 154 |
| * | M/I Homes Inc. | 2,719 | 152 |
| Tilly's Inc. Class A | 10,146 | 152 | |
| * | Universal Electronics Inc. | 4,180 | 151 |
| * | PROG Holdings Inc. | 3,280 | 148 |
| Sonic Automotive Inc. Class A | 3,275 | 147 | |
| * | Boyd Gaming Corp. | 2,490 | 146 |
| Best Buy Co. Inc. | 1,314 | 140 | |
| * | Abercrombie & Fitch Co. Class A | 3,860 | 139 |
| * | Funko Inc. Class A | 8,199 | 134 |
| * | iHeartMedia Inc. Class A | 6,742 | 132 |
| Guess? Inc. | 5,794 | 131 | |
| * | VOXX International Corp. Class A | 12,737 | 131 |
| * | Victoria's Secret & Co. | 2,348 | 127 |
| * | Central Garden & Pet Co. Class A | 2,811 | 122 |
| Graham Holdings Co. Class B | 207 | 117 | |
| Tapestry Inc. | 2,923 | 117 | |
| MillerKnoll Inc. | 2,998 | 114 | |
| Buckle Inc. | 2,350 | 111 | |
| * | Lakeland Industries Inc. | 5,778 | 111 |
| Carriage Services Inc. Class A | 2,014 | 104 | |
| Ethan Allen Interiors Inc. | 4,382 | 99 | |
| Jack in the Box Inc. | 1,177 | 97 | |
| BorgWarner Inc. (XNYS) | 2,099 | 91 | |
| Advance Auto Parts Inc. | 406 | 90 | |
| * | 1-800-Flowers.com Inc. Class A | 2,921 | 87 |
| Gap Inc. | 5,177 | 86 | |
| Marriott Vacations Worldwide Corp. | 560 | 85 | |
| * | Lands' End Inc. | 3,551 | 82 |
| Shares | Market Value• ($000) | ||
| Rocky Brands Inc. | 2,234 | 79 | |
| 75,857 | |||
| Consumer Staples (5.9%) | |||
| CVS Health Corp. | 43,106 | 3,839 | |
| Molson Coors Beverage Co. Class B | 42,463 | 1,887 | |
| Kraft Heinz Co. | 54,597 | 1,835 | |
| McKesson Corp. | 6,709 | 1,454 | |
| Philip Morris International Inc. | 14,067 | 1,209 | |
| Tyson Foods Inc. Class A | 14,384 | 1,136 | |
| Walgreens Boots Alliance Inc. | 23,007 | 1,031 | |
| Archer-Daniels-Midland Co. | 14,909 | 928 | |
| * | Herbalife Nutrition Ltd. | 24,571 | 918 |
| SpartanNash Co. | 38,210 | 914 | |
| Kroger Co. | 21,714 | 902 | |
| Conagra Brands Inc. | 28,023 | 856 | |
| J M Smucker Co. | 5,882 | 744 | |
| Ingredion Inc. | 7,874 | 733 | |
| ACCO Brands Corp. | 87,878 | 726 | |
| Weis Markets Inc. | 10,512 | 662 | |
| Edgewell Personal Care Co. | 15,454 | 656 | |
| General Mills Inc. | 10,370 | 641 | |
| Ingles Markets Inc. Class A | 6,663 | 512 | |
| * | United Natural Foods Inc. | 9,337 | 464 |
| Altria Group Inc. | 10,612 | 453 | |
| Flowers Foods Inc. | 16,150 | 417 | |
| Universal Corp. | 8,685 | 404 | |
| * | Pilgrim's Pride Corp. | 12,980 | 365 |
| AmerisourceBergen Corp. Class A | 2,989 | 346 | |
| * | Darling Ingredients Inc. | 4,412 | 298 |
| Nu Skin Enterprises Inc. Class A | 6,800 | 298 | |
| Fresh Del Monte Produce Inc. | 10,229 | 253 | |
| Corteva Inc. | 5,610 | 252 | |
| Andersons Inc. | 7,056 | 240 | |
| Keurig Dr Pepper Inc. | 6,533 | 222 | |
| Seaboard Corp. | 52 | 202 | |
| * | US Foods Holding Corp | 6,143 | 193 |
| * | Hostess Brands Inc. Class A | 10,591 | 180 |
| * | Sprouts Farmers Market Inc. | 5,243 | 139 |
| Vector Group Ltd. | 6,775 | 105 | |
| * | Rite Aid Corp. | 7,988 | 98 |
| 26,512 | |||
| Energy (9.4%) | |||
| ConocoPhillips | 37,457 | 2,627 | |
| Exxon Mobil Corp. | 34,079 | 2,039 | |
| Chevron Corp. | 17,806 | 2,010 | |
| APA Corp. | 57,218 | 1,474 | |
| EOG Resources Inc. | 15,368 | 1,337 | |
| Schlumberger NV | 43,616 | 1,251 | |
| Diamondback Energy Inc. | 11,276 | 1,203 | |
| Kinder Morgan Inc. | 77,563 | 1,199 | |
| Ovintiv Inc. (XNYS) | 28,976 | 1,007 | |
| SM Energy Co. | 33,583 | 974 | |
| * | CONSOL Energy Inc. | 44,072 | 967 |
| * | EQT Corp. | 46,842 | 910 |
| Marathon Oil Corp. | 54,755 | 848 | |
| * | Whiting Petroleum Corp. | 12,981 | 840 |
| Equitrans Midstream Corp. | 85,730 | 825 | |
| * | Range Resources Corp. | 42,037 | 822 |
| * | Antero Resources Corp. | 42,342 | 744 |
| * | Comstock Resources Inc. | 89,953 | 728 |
| HollyFrontier Corp. | 22,358 | 723 | |
| Coterra Energy Inc. | 35,757 | 718 | |
| Devon Energy Corp. | 15,573 | 655 | |
| Shares | Market Value• ($000) | ||
| Civitas Resources Inc. | 12,325 | 630 | |
| Murphy Oil Corp. | 23,006 | 611 | |
| * | Centennial Resource Development Inc. Class A | 92,125 | 574 |
| Baker Hughes Co. Class A | 24,546 | 573 | |
| Pioneer Natural Resources Co. | 3,148 | 561 | |
| * | Kosmos Energy Ltd. | 151,982 | 556 |
| PDC Energy Inc. | 10,980 | 554 | |
| Continental Resources Inc. | 12,330 | 547 | |
| * | Callon Petroleum Co. | 10,560 | 537 |
| Archrock Inc. | 65,261 | 482 | |
| Northern Oil and Gas Inc. | 23,349 | 476 | |
| * | Bristow Group Inc. | 15,710 | 467 |
| * | Southwestern Energy Co. | 103,602 | 464 |
| SunCoke Energy Inc. | 75,576 | 460 | |
| * | CNX Resources Corp. | 33,530 | 457 |
| * | Peabody Energy Corp. | 45,239 | 451 |
| * | Laredo Petroleum Inc. | 7,435 | 438 |
| Phillips 66 | 6,094 | 422 | |
| * | National Energy Services Reunited Corp. | 42,480 | 421 |
| * | Delek US Holdings Inc. | 26,201 | 411 |
| Warrior Met Coal Inc. | 19,130 | 411 | |
| Halliburton Co. | 18,812 | 406 | |
| * | Newpark Resources Inc. | 147,286 | 402 |
| * | Helix Energy Solutions Group Inc. | 129,926 | 395 |
| ONEOK Inc. | 6,275 | 375 | |
| Williams Cos. Inc. | 13,830 | 370 | |
| Matador Resources Co. | 9,291 | 365 | |
| * | Centrus Energy Corp. Class A | 6,349 | 352 |
| Arch Resources Inc. | 4,292 | 333 | |
| Antero Midstream Corp. | 33,987 | 330 | |
| * | PBF Energy Inc. Class A | 25,100 | 314 |
| * | Nabors Industries Ltd. (XNYS) | 3,829 | 312 |
| Occidental Petroleum Corp. | 10,490 | 311 | |
| Cheniere Energy Inc. | 2,911 | 305 | |
| Valero Energy Corp. | 4,559 | 305 | |
| World Fuel Services Corp. | 11,654 | 291 | |
| Targa Resources Corp. | 5,419 | 280 | |
| Magnolia Oil & Gas Corp. Class A | 13,955 | 265 | |
| Altus Midstream Co. Class A | 4,115 | 261 | |
| * | Golar LNG Ltd. | 21,029 | 248 |
| * | W&T Offshore Inc. | 71,876 | 247 |
| * | Talos Energy Inc. | 22,053 | 220 |
| * | Oil States International Inc. | 35,489 | 180 |
| * | First Solar Inc. | 1,709 | 177 |
| Brigham Minerals Inc. Class A | 7,754 | 161 | |
| Berry Corp. | 19,687 | 160 | |
| * | NOV Inc. | 11,815 | 141 |
| Arcosa Inc. | 2,592 | 133 | |
| * | Renewable Energy Group Inc. | 2,431 | 116 |
| * | REX American Resources Corp. | 1,041 | 95 |
| 42,254 | |||
| Financials (22.0%) | |||
| Citigroup Inc. | 43,526 | 2,773 | |
| Truist Financial Corp. | 43,271 | 2,566 | |
| Goldman Sachs Group Inc. | 6,681 | 2,545 | |
| American International Group Inc. | 47,226 | 2,484 | |
| JPMorgan Chase & Co. | 13,969 | 2,219 | |
| Wells Fargo & Co. | 43,854 | 2,095 | |
| MetLife Inc. | 35,555 | 2,086 | |
| Shares | Market Value• ($000) | ||
| Bank of New York Mellon Corp. | 36,843 | 2,019 | |
| Chubb Ltd. | 11,222 | 2,014 | |
| Morgan Stanley | 20,508 | 1,945 | |
| Bank of America Corp. | 37,659 | 1,675 | |
| PNC Financial Services Group Inc. | 7,049 | 1,389 | |
| Essent Group Ltd. | 31,264 | 1,300 | |
| US Bancorp | 23,368 | 1,293 | |
| Hope Bancorp Inc. | 89,507 | 1,284 | |
| Regions Financial Corp. | 54,960 | 1,250 | |
| Radian Group Inc. | 59,494 | 1,212 | |
| Allstate Corp. | 11,083 | 1,205 | |
| Citizens Financial Group Inc. | 25,382 | 1,200 | |
| Zions Bancorp NA | 18,161 | 1,146 | |
| * | Berkshire Hathaway Inc. Class B | 3,909 | 1,082 |
| BlackRock Inc. | 1,168 | 1,057 | |
| Axis Capital Holdings Ltd. | 21,021 | 1,044 | |
| Prudential Financial Inc. | 10,176 | 1,041 | |
| FNB Corp. | 84,597 | 986 | |
| Reinsurance Group of America Inc. | 10,376 | 985 | |
| KeyCorp | 43,303 | 972 | |
| MGIC Investment Corp. | 61,962 | 874 | |
| Unum Group | 37,595 | 868 | |
| Heartland Financial USA Inc. | 18,241 | 866 | |
| Travelers Cos. Inc. | 5,719 | 840 | |
| New York Community Bancorp Inc. | 69,865 | 837 | |
| First American Financial Corp. | 10,705 | 794 | |
| Aflac Inc. | 14,268 | 772 | |
| * | Customers Bancorp Inc. | 13,219 | 762 |
| American Equity Investment Life Holding Co. | 21,784 | 733 | |
| Jefferies Financial Group Inc. | 19,463 | 731 | |
| Popular Inc. | 9,107 | 709 | |
| Everest Re Group Ltd. | 2,743 | 703 | |
| * | Genworth Financial Inc. Class A | 175,524 | 670 |
| Principal Financial Group Inc. | 9,713 | 666 | |
| RenaissanceRe Holdings Ltd. | 4,251 | 655 | |
| OFG Bancorp | 26,356 | 635 | |
| Fidelity National Financial Inc. | 12,968 | 634 | |
| Globe Life Inc. | 7,323 | 634 | |
| Raymond James Financial Inc. | 6,376 | 627 | |
| CNA Financial Corp. | 13,915 | 579 | |
| Associated Banc-Corp. | 26,174 | 573 | |
| Affiliated Managers Group Inc. | 3,266 | 556 | |
| Voya Financial Inc. | 8,881 | 552 | |
| * | Mr Cooper Group Inc. | 13,975 | 549 |
| T Rowe Price Group Inc. | 2,625 | 525 | |
| Valley National Bancorp | 39,083 | 525 | |
| Comerica Inc. | 6,333 | 523 | |
| Universal Insurance Holdings Inc. | 34,453 | 519 | |
| Old National Bancorp | 29,215 | 516 | |
| * | Encore Capital Group Inc. | 8,736 | 510 |
| CNO Financial Group Inc. | 22,388 | 507 | |
| Horace Mann Educators Corp. | 13,671 | 507 | |
| PacWest Bancorp | 11,097 | 496 | |
| PennyMac Financial Services Inc. | 7,832 | 496 | |
| Lakeland Bancorp Inc. | 27,693 | 495 | |
| Bank OZK | 10,698 | 478 |
| Shares | Market Value• ($000) | ||
| BOK Financial Corp. | 4,592 | 474 | |
| * | Brighthouse Financial Inc. | 9,604 | 467 |
| * | Credit Acceptance Corp. | 737 | 461 |
| Hanmi Financial Corp. | 20,471 | 460 | |
| Lincoln National Corp. | 6,789 | 450 | |
| Western Alliance Bancorp | 4,068 | 447 | |
| * | SiriusPoint Ltd. | 57,693 | 444 |
| Hancock Whitney Corp. | 9,266 | 443 | |
| Navient Corp. | 22,340 | 441 | |
| * | Arch Capital Group Ltd. | 10,932 | 441 |
| Nelnet Inc. Class A | 5,033 | 434 | |
| M&T Bank Corp. | 2,905 | 426 | |
| Banner Corp. | 7,311 | 419 | |
| Charles Schwab Corp. | 5,419 | 419 | |
| Ally Financial Inc. | 8,765 | 402 | |
| Stifel Financial Corp. | 5,579 | 396 | |
| State Street Corp. | 4,400 | 391 | |
| Old Republic International Corp. | 16,120 | 386 | |
| First Busey Corp. | 14,545 | 374 | |
| * | Alleghany Corp. | 577 | 373 |
| ConnectOne Bancorp Inc. | 11,313 | 368 | |
| * | MoneyGram International Inc. | 61,571 | 365 |
| Ameriprise Financial Inc. | 1,244 | 360 | |
| SouthState Corp. | 4,554 | 356 | |
| Atlantic Union Bankshares Corp. | 10,676 | 347 | |
| SLM Corp. | 19,457 | 346 | |
| Franklin Resources Inc. | 10,544 | 342 | |
| * | NMI Holdings Inc. Class A | 17,457 | 342 |
| Hartford Financial Services Group Inc. | 5,124 | 339 | |
| * | Enstar Group Ltd. | 1,473 | 329 |
| Heritage Financial Corp. | 13,871 | 325 | |
| Hilltop Holdings Inc. | 9,455 | 322 | |
| * | Bancorp Inc. | 11,200 | 317 |
| Invesco Ltd. | 14,131 | 316 | |
| First Commonwealth Financial Corp. | 20,339 | 306 | |
| United Bankshares Inc. | 8,526 | 305 | |
| Park National Corp. | 2,313 | 301 | |
| CVB Financial Corp. | 15,715 | 300 | |
| Signature Bank | 989 | 299 | |
| Flushing Financial Corp. | 12,605 | 298 | |
| Equitable Holdings Inc. | 9,476 | 298 | |
| Columbia Banking System Inc. | 8,875 | 292 | |
| * | GoHealth Inc. Class A | 82,407 | 292 |
| Stewart Information Services Corp. | 4,078 | 290 | |
| Assurant Inc. | 1,903 | 289 | |
| Eagle Bancorp Inc. | 5,113 | 288 | |
| HarborOne Bancorp Inc. | 20,509 | 285 | |
| Northern Trust Corp. | 2,429 | 281 | |
| UMB Financial Corp. | 2,775 | 279 | |
| Fifth Third Bancorp | 6,513 | 274 | |
| Pinnacle Financial Partners Inc. | 2,816 | 269 | |
| Cowen Inc. Class A | 7,586 | 268 | |
| First BanCorp. (XNYS) | 20,103 | 267 | |
| Prosperity Bancshares Inc. | 3,690 | 263 | |
| American Financial Group Inc. | 1,955 | 261 | |
| * | Enova International Inc. | 6,754 | 257 |
| * | PRA Group Inc. | 5,960 | 253 |
| Enterprise Financial Services Corp. | 5,346 | 248 | |
| OneMain Holdings Inc. | 4,895 | 244 |
| Shares | Market Value• ($000) | ||
| Progressive Corp. | 2,620 | 243 | |
| Cullen/Frost Bankers Inc. | 1,923 | 242 | |
| 1st Source Corp. | 5,238 | 242 | |
| Southside Bancshares Inc. | 5,913 | 241 | |
| Wintrust Financial Corp. | 2,745 | 240 | |
| * | StoneX Group Inc. | 4,160 | 234 |
| Simmons First National Corp. Class A | 8,007 | 233 | |
| Sandy Spring Bancorp Inc. | 4,940 | 232 | |
| East West Bancorp Inc. | 2,997 | 231 | |
| First Financial Bancorp | 10,038 | 231 | |
| Synovus Financial Corp. | 5,021 | 227 | |
| * | Triumph Bancorp Inc. | 1,745 | 222 |
| * | Nicolet Bankshares Inc. | 3,094 | 221 |
| Webster Financial Corp. | 4,076 | 220 | |
| First Bancorp (XNGS) | 4,921 | 219 | |
| Meta Financial Group Inc. | 3,490 | 209 | |
| Berkshire Hills Bancorp Inc. | 7,673 | 205 | |
| Independent Bank Group Inc. | 2,847 | 198 | |
| First Horizon Corp. | 12,088 | 195 | |
| S&T Bancorp Inc. | 6,461 | 193 | |
| Washington Trust Bancorp Inc. | 3,558 | 191 | |
| Assured Guaranty Ltd. | 3,894 | 191 | |
| First Merchants Corp. | 4,741 | 189 | |
| Northfield Bancorp Inc. | 11,095 | 187 | |
| Argo Group International Holdings Ltd. | 3,447 | 187 | |
| Ameris Bancorp | 3,811 | 185 | |
| Central Pacific Financial Corp. | 6,629 | 177 | |
| HomeStreet Inc. | 3,559 | 176 | |
| Fulton Financial Corp. | 11,083 | 175 | |
| Dime Community Bancshares Inc. | 5,067 | 174 | |
| Univest Financial Corp. | 6,162 | 170 | |
| NBT Bancorp Inc. | 4,667 | 169 | |
| Towne Bank | 5,493 | 168 | |
| Banc of California Inc. | 8,500 | 166 | |
| Brookline Bancorp Inc. | 10,415 | 161 | |
| Virtus Investment Partners Inc. | 537 | 160 | |
| OceanFirst Financial Corp. | 7,358 | 152 | |
| Veritex Holdings Inc. | 3,842 | 152 | |
| Walker & Dunlop Inc. | 1,080 | 152 | |
| Discover Financial Services | 1,401 | 151 | |
| Washington Federal Inc. | 4,634 | 151 | |
| * | World Acceptance Corp. | 734 | 151 |
| First Hawaiian Inc. | 5,639 | 148 | |
| Safety Insurance Group Inc. | 1,914 | 148 | |
| BGC Partners Inc. Class A | 32,668 | 146 | |
| Mercury General Corp. | 2,805 | 143 | |
| Premier Financial Corp. | 4,803 | 141 | |
| Cathay General Bancorp | 3,323 | 139 | |
| Trustmark Corp. | 4,534 | 139 | |
| WSFS Financial Corp. | 2,784 | 138 | |
| Preferred Bank | 2,013 | 137 | |
| Hanover Insurance Group Inc. | 1,117 | 136 | |
| Federal Agricultural Mortgage Corp. Class C | 1,109 | 135 | |
| First Interstate BancSystem Inc. Class A | 3,255 | 133 | |
| * | SVB Financial Group | 189 | 131 |
| Huntington Bancshares Inc. | 8,697 | 129 | |
| Northwest Bancshares Inc. | 9,703 | 129 | |
| TrustCo Bank Corp. NY | 3,939 | 129 | |
| Bank of NT Butterfield & Son Ltd. | 3,470 | 128 |
| Shares | Market Value• ($000) | ||
| Pacific Premier Bancorp Inc. | 3,135 | 121 | |
| TriCo Bancshares | 2,832 | 119 | |
| * | eHealth Inc. | 5,138 | 113 |
| Cadence Bank | 3,864 | 113 | |
| Renasant Corp. | 3,075 | 112 | |
| First Foundation Inc. | 4,267 | 108 | |
| Kearny Financial Corp. | 8,076 | 103 | |
| * | Markel Corp. | 83 | 99 |
| WesBanco Inc. | 3,032 | 99 | |
| Provident Financial Services Inc. | 4,063 | 96 | |
| Employers Holdings Inc. | 2,474 | 95 | |
| BankUnited Inc. | 2,350 | 93 | |
| Tompkins Financial Corp. | 1,186 | 93 | |
| Federated Hermes Inc. | 2,730 | 92 | |
| Intercontinental Exchange Inc. | 696 | 91 | |
| Heritage Commerce Corp. | 8,204 | 90 | |
| FB Financial Corp. | 2,079 | 89 | |
| National Bank Holdings Corp. Class A | 2,095 | 89 | |
| Selective Insurance Group Inc. | 1,181 | 89 | |
| 98,558 | |||
| Health Care (10.8%) | |||
| Bristol-Myers Squibb Co. | 82,405 | 4,419 | |
| Gilead Sciences Inc. | 63,074 | 4,348 | |
| Cigna Corp. | 18,423 | 3,535 | |
| * | Centene Corp. | 39,655 | 2,832 |
| Pfizer Inc. | 51,359 | 2,760 | |
| * | Moderna Inc. | 7,662 | 2,700 |
| Anthem Inc. | 6,376 | 2,590 | |
| * | Regeneron Pharmaceuticals Inc. | 3,056 | 1,945 |
| Becton Dickinson and Co. | 6,913 | 1,639 | |
| Merck & Co. Inc. | 16,851 | 1,262 | |
| AbbVie Inc. | 9,867 | 1,138 | |
| Cardinal Health Inc. | 24,251 | 1,121 | |
| * | Biogen Inc. | 4,527 | 1,067 |
| * | Jazz Pharmaceuticals plc | 8,687 | 1,041 |
| HCA Healthcare Inc. | 4,522 | 1,020 | |
| * | Emergent BioSolutions Inc. | 22,853 | 1,008 |
| Johnson & Johnson | 5,590 | 872 | |
| * | Quidel Corp. | 4,915 | 725 |
| * | Innoviva Inc. | 41,983 | 702 |
| Quest Diagnostics Inc. | 4,635 | 689 | |
| Universal Health Services Inc. Class B | 5,441 | 646 | |
| * | Multiplan Corp. | 152,277 | 615 |
| * | Endo International plc | 109,031 | 611 |
| * | Prestige Consumer Healthcare Inc. | 9,595 | 537 |
| Royalty Pharma plc Class A | 13,073 | 520 | |
| Encompass Health Corp. | 8,983 | 518 | |
| PerkinElmer Inc. | 2,824 | 514 | |
| * | United Therapeutics Corp. | 2,596 | 492 |
| * | Hologic Inc. | 5,922 | 443 |
| * | Fulgent Genetics Inc. | 4,545 | 425 |
| * | Community Health Systems Inc. | 34,580 | 416 |
| * | Tenet Healthcare Corp. | 5,572 | 406 |
| * | Laboratory Corp. of America Holdings | 1,395 | 398 |
| * | Catalyst Pharmaceuticals Inc. | 48,845 | 342 |
| National HealthCare Corp. | 5,027 | 324 | |
| Humana Inc. | 757 | 318 | |
| Shares | Market Value• ($000) | ||
| * | Collegium Pharmaceutical Inc. | 16,947 | 298 |
| * | Syneos Health Inc. | 2,879 | 280 |
| Viatris Inc. | 19,078 | 235 | |
| * | Computer Programs and Systems Inc. | 7,184 | 212 |
| * | Atea Pharmaceuticals Inc. | 25,374 | 205 |
| UnitedHealth Group Inc. | 456 | 203 | |
| * | Eagle Pharmaceuticals Inc. | 4,029 | 192 |
| * | Acadia Healthcare Co. Inc. | 3,205 | 180 |
| Thermo Fisher Scientific Inc. | 280 | 177 | |
| * | BioDelivery Sciences International Inc. | 48,753 | 136 |
| Owens & Minor Inc. | 3,330 | 133 | |
| * | ANI Pharmaceuticals Inc. | 3,163 | 130 |
| Select Medical Holdings Corp. | 4,767 | 128 | |
| * | Co-Diagnostics Inc. | 12,980 | 125 |
| * | DaVita Inc. | 1,314 | 124 |
| * | Ovid therapeutics Inc. | 33,745 | 113 |
| * | MEDNAX Inc. | 4,576 | 112 |
| * | Supernus Pharmaceuticals Inc. | 3,619 | 109 |
| * | Amneal Pharmaceuticals Inc. | 23,490 | 98 |
| Amgen Inc. | 446 | 89 | |
| 48,217 | |||
| Industrials (15.2%) | |||
| FedEx Corp. | 19,008 | 4,379 | |
| Global Payments Inc. | 23,174 | 2,759 | |
| Fidelity National Information Services Inc. | 25,115 | 2,625 | |
| Capital One Financial Corp. | 13,206 | 1,856 | |
| General Dynamics Corp. | 9,755 | 1,843 | |
| Northrop Grumman Corp. | 4,329 | 1,510 | |
| L3Harris Technologies Inc. | 7,113 | 1,487 | |
| Lockheed Martin Corp. | 3,911 | 1,304 | |
| Knight-Swift Transportation Holdings Inc. | 22,200 | 1,271 | |
| * | Atlas Air Worldwide Holdings Inc. | 14,379 | 1,260 |
| * | Fiserv Inc. | 11,701 | 1,129 |
| * | Veritiv Corp. | 7,993 | 1,007 |
| Allison Transmission Holdings Inc. | 28,955 | 1,002 | |
| Westrock Co. | 22,081 | 958 | |
| Alliance Data Systems Corp. | 13,768 | 938 | |
| ManpowerGroup Inc. | 10,451 | 937 | |
| Triton International Ltd. | 15,872 | 888 | |
| Johnson Controls International plc | 11,554 | 864 | |
| * | Meritor Inc. | 33,330 | 843 |
| * | Berry Global Group Inc. | 12,180 | 841 |
| PACCAR Inc. | 9,344 | 779 | |
| Air Lease Corp. Class A | 19,141 | 777 | |
| ArcBest Corp. | 7,302 | 753 | |
| * | WESCO International Inc. | 6,054 | 751 |
| Louisiana-Pacific Corp. | 11,217 | 733 | |
| * | BlueLinx Holdings Inc. | 10,350 | 730 |
| Graphic Packaging Holding Co. | 36,213 | 715 | |
| SFL Corp. Ltd. | 84,050 | 701 | |
| Ryder System Inc. | 8,367 | 695 | |
| * | Tutor Perini Corp. | 48,284 | 621 |
| Costamare Inc. | 51,381 | 617 | |
| * | Textainer Group Holdings Ltd. | 18,224 | 595 |
| Herc Holdings Inc. | 3,465 | 591 | |
| Owens Corning | 6,930 | 588 | |
| Shares | Market Value• ($000) | ||
| Acuity Brands Inc. | 2,768 | 557 | |
| * | GMS Inc. | 9,790 | 547 |
| * | US Xpress Enterprises Inc. Class A | 68,820 | 541 |
| * | Sterling Construction Co. Inc. | 20,758 | 535 |
| Kelly Services Inc. Class A | 31,092 | 524 | |
| International Seaways Inc. | 35,873 | 524 | |
| Genco Shipping & Trading Ltd. | 33,301 | 513 | |
| * | Frontline Ltd. | 74,544 | 511 |
| Wabash National Corp. | 29,828 | 498 | |
| * | Titan Machinery Inc. | 14,693 | 488 |
| nVent Electric plc | 13,892 | 484 | |
| * | United Rentals Inc. | 1,427 | 483 |
| Raytheon Technologies Corp. | 5,898 | 477 | |
| * | CoreCivic Inc. | 44,047 | 474 |
| * | Air Transport Services Group Inc. | 18,447 | 455 |
| Dorian LPG Ltd. | 34,243 | 422 | |
| Hillenbrand Inc. | 9,338 | 416 | |
| MKS Instruments Inc. | 2,728 | 415 | |
| * | American Woodmark Corp. | 6,707 | 413 |
| Quanta Services Inc. | 3,547 | 404 | |
| * | JELD-WEN Holding Inc. | 16,461 | 399 |
| * | Conduent Inc. | 76,472 | 385 |
| DuPont de Nemours Inc. | 5,175 | 383 | |
| * | BrightView Holdings Inc. | 27,542 | 375 |
| * | Covenant Logistics Group Inc. Class A | 14,932 | 374 |
| * | Infrastructure and Energy Alternatives Inc. | 38,089 | 360 |
| * | DXP Enterprises Inc. | 12,945 | 358 |
| Sonoco Products Co. | 6,068 | 353 | |
| Synchrony Financial | 7,825 | 350 | |
| REV Group Inc. | 21,531 | 338 | |
| ADT Inc. | 39,799 | 331 | |
| * | MYR Group Inc. | 2,924 | 324 |
| * | Teekay Corp. | 96,385 | 320 |
| * | XPO Logistics Inc. | 4,345 | 315 |
| Scorpio Tankers Inc. | 22,120 | 308 | |
| DHT Holdings Inc. | 55,264 | 307 | |
| Textron Inc. | 4,225 | 299 | |
| Crane Co. | 3,060 | 295 | |
| * | Kirby Corp. | 5,492 | 287 |
| 3M Co. | 1,645 | 280 | |
| Kaman Corp. | 7,500 | 278 | |
| Curtiss-Wright Corp. | 2,157 | 271 | |
| * | TrueBlue Inc. | 10,172 | 265 |
| Argan Inc. | 6,173 | 243 | |
| AGCO Corp. | 2,192 | 242 | |
| Primoris Services Corp. | 10,751 | 241 | |
| EMCOR Group Inc. | 1,984 | 237 | |
| Resources Connection Inc. | 13,774 | 237 | |
| Greif Inc. Class A | 3,869 | 235 | |
| Matson Inc. | 2,810 | 229 | |
| Oshkosh Corp. | 2,119 | 228 | |
| * | MasTec Inc. | 2,419 | 223 |
| * | Colfax Corp. | 4,751 | 221 |
| Schneider National Inc. Class B | 8,719 | 214 | |
| * | Modine Manufacturing Co. | 20,403 | 211 |
| Flowserve Corp. | 6,977 | 209 | |
| * | Mohawk Industries Inc. | 1,244 | 209 |
| * | Donnelley Financial Solutions Inc. | 4,417 | 206 |
| Quanex Building Products Corp. | 9,609 | 205 | |
| * | O-I Glass Inc. | 18,455 | 204 |
| Shares | Market Value• ($000) | ||
| * | FTI Consulting Inc. | 1,383 | 202 |
| Norfolk Southern Corp. | 756 | 201 | |
| Westinghouse Air Brake Technologies Corp. | 2,257 | 200 | |
| * | Beacon Roofing Supply Inc. | 3,992 | 199 |
| * | Gates Industrial Corp. plc | 12,172 | 195 |
| Deluxe Corp. | 5,717 | 193 | |
| Kronos Worldwide Inc. | 13,692 | 192 | |
| Regal Rexnord Corp. | 1,215 | 192 | |
| * | ASGN Inc. | 1,563 | 190 |
| * | Builders FirstSource Inc. | 2,618 | 182 |
| * | AAR Corp. | 5,478 | 179 |
| * | Manitowoc Co. Inc. | 9,253 | 176 |
| HB Fuller Co. | 2,390 | 175 | |
| Moog Inc. Class A | 2,531 | 175 | |
| * | Summit Materials Inc. Class A | 4,604 | 172 |
| Apogee Enterprises Inc. | 4,137 | 171 | |
| * | Ducommun Inc. | 3,984 | 169 |
| * | Hub Group Inc. Class A | 2,178 | 169 |
| * | API Group Corp. | 7,134 | 166 |
| American Express Co. | 1,076 | 164 | |
| * | Cornerstone Building Brands Inc. | 10,342 | 163 |
| * | Resideo Technologies Inc. | 6,244 | 163 |
| Carlisle Cos. Inc. | 703 | 158 | |
| * | Fluor Corp. | 7,039 | 156 |
| GATX Corp. | 1,575 | 155 | |
| ABM Industries Inc. | 3,387 | 152 | |
| Emerson Electric Co. | 1,641 | 144 | |
| Brunswick Corp. | 1,521 | 143 | |
| Werner Enterprises Inc. | 3,049 | 138 | |
| Trinity Industries Inc. | 5,157 | 137 | |
| Huntington Ingalls Industries Inc. | 725 | 129 | |
| * | Vectrus Inc. | 3,043 | 127 |
| * | Great Lakes Dredge & Dock Corp. | 8,524 | 126 |
| Maxar Technologies Inc. | 4,551 | 125 | |
| * | Safe Bulkers Inc. | 34,170 | 124 |
| Greenbrier Cos. Inc. | 2,986 | 119 | |
| * | Thermon Group Holdings Inc. | 6,705 | 116 |
| Sealed Air Corp. | 1,852 | 115 | |
| * | AECOM | 1,642 | 113 |
| Silgan Holdings Inc. | 2,670 | 111 | |
| Ennis Inc. | 5,626 | 107 | |
| Heidrick & Struggles International Inc. | 2,466 | 106 | |
| Otter Tail Corp. | 1,624 | 106 | |
| Griffon Corp. | 3,993 | 105 | |
| * | PGT Innovations Inc. | 5,112 | 105 |
| Packaging Corp. of America | 804 | 105 | |
| Altra Industrial Motion Corp. | 1,883 | 99 | |
| Belden Inc. | 1,585 | 98 | |
| Snap-on Inc. | 472 | 97 | |
| Marten Transport Ltd. | 5,910 | 95 | |
| * | Ardmore Shipping Corp. | 25,636 | 94 |
| Deere & Co. | 265 | 92 | |
| MDU Resources Group Inc. | 3,347 | 91 | |
| Eagle Bulk Shipping Inc. | 2,261 | 91 | |
| * | Loyalty Ventures Inc. | 2,511 | 72 |
| * | BM Technologies Inc. (XASE) | 1,618 | 20 |
| 68,236 | |||
| Real Estate (0.4%) | |||
| Newmark Group Inc. Class A | 23,411 | 376 | |
| * | Jones Lang LaSalle Inc. | 1,380 | 324 |
| * | Realogy Holdings Corp. | 20,856 | 317 |
| Shares | Market Value• ($000) | ||
| RE/MAX Holdings Inc. Class A | 6,051 | 166 | |
| Preferred Apartment Communities Inc. Class A | 11,947 | 157 | |
| EPR Properties | 3,103 | 143 | |
| VICI Properties Inc. | 5,059 | 138 | |
| Brixmor Property Group Inc. | 4,905 | 112 | |
| STORE Capital Corp. | 3,180 | 105 | |
| 1,838 | |||
| Technology (7.3%) | |||
| Micron Technology Inc. | 48,380 | 4,064 | |
| International Business Machines Corp. | 24,842 | 2,909 | |
| HP Inc. | 63,565 | 2,243 | |
| QUALCOMM Inc. | 9,684 | 1,749 | |
| Hewlett Packard Enterprise Co. | 111,643 | 1,602 | |
| * | Arrow Electronics Inc. | 11,873 | 1,444 |
| Cognizant Technology Solutions Corp. Class A | 15,087 | 1,176 | |
| * | TTM Technologies Inc. | 80,252 | 1,106 |
| Vishay Intertechnology Inc. | 47,327 | 964 | |
| * | Western Digital Corp. | 15,396 | 891 |
| * | CACI International Inc. Class A | 2,972 | 771 |
| Amkor Technology Inc. | 33,590 | 724 | |
| Jabil Inc. | 11,421 | 668 | |
| * | II-VI Inc. | 10,583 | 662 |
| * | ScanSource Inc. | 20,638 | 645 |
| * | Photronics Inc. | 46,537 | 615 |
| * | Sanmina Corp. | 16,544 | 605 |
| Broadcom Inc. | 1,037 | 574 | |
| Amdocs Ltd. | 7,298 | 510 | |
| Xperi Holding Corp. | 27,951 | 501 | |
| * | Alpha & Omega Semiconductor Ltd. | 9,307 | 457 |
| * | DXC Technology Co. | 14,685 | 440 |
| Ebix Inc. | 12,909 | 394 | |
| Science Applications International Corp. | 4,670 | 392 | |
| Xerox Holdings Corp. | 20,321 | 374 | |
| Corning Inc. | 9,163 | 340 | |
| Concentrix Corp. | 2,034 | 338 | |
| Benchmark Electronics Inc. | 14,081 | 332 | |
| * | NCR Corp. | 7,939 | 309 |
| * | Ultra Clean Holdings Inc. | 5,003 | 274 |
| * | Ziff Davis Inc. | 2,368 | 270 |
| * | Ichor Holdings Ltd. | 5,624 | 269 |
| NortonLifeLock Inc. | 10,788 | 268 | |
| Oracle Corp. | 2,937 | 267 | |
| TD SYNNEX Corp. | 2,543 | 263 | |
| SolarWinds Corp. | 17,890 | 258 | |
| * | NetScout Systems Inc. | 8,332 | 249 |
| Intel Corp. | 4,742 | 233 | |
| * | Dell Technologies Inc. Class C | 3,913 | 221 |
| Methode Electronics Inc. | 4,979 | 221 | |
| * | Parsons Corp. | 6,460 | 214 |
| Avnet Inc. | 5,845 | 212 | |
| Applied Materials Inc. | 1,367 | 201 | |
| VMware Inc. Class A | 1,724 | 201 | |
| * | Insight Enterprises Inc. | 1,939 | 191 |
| * | Synaptics Inc. | 569 | 161 |
| * | SMART Global Holdings Inc. | 2,757 | 157 |
| * | Allscripts Healthcare Solutions Inc. | 8,335 | 139 |
| * | VirnetX Holding Corp. | 40,786 | 122 |
| * | Cohu Inc. | 3,563 | 117 |
| Shares | Market Value• ($000) | ||
| * | Qorvo Inc. | 768 | 112 |
| * | Super Micro Computer Inc. | 2,602 | 108 |
| NXP Semiconductors NV | 475 | 106 | |
| KBR Inc. | 2,114 | 93 | |
| * | Kyndryl Holdings Inc. | 2,513 | 40 |
| 32,766 | |||
| Telecommunications (4.5%) | |||
| Verizon Communications Inc. | 128,892 | 6,479 | |
| Comcast Corp. Class A | 60,344 | 3,016 | |
| AT&T Inc. | 69,608 | 1,589 | |
| * | Altice USA Inc. Class A | 80,051 | 1,268 |
| * | DISH Network Corp. Class A | 33,173 | 1,037 |
| Cisco Systems Inc. | 15,912 | 873 | |
| Lumen Technologies Inc. | 69,191 | 854 | |
| Telephone and Data Systems Inc. | 44,165 | 781 | |
| * | Charter Communications Inc. Class A | 1,093 | 706 |
| * | T-Mobile US Inc. | 4,601 | 501 |
| * | EchoStar Corp. Class A | 16,497 | 451 |
| * | Liberty Latin America Ltd. Class C | 37,261 | 419 |
| * | Lumentum Holdings Inc. | 4,812 | 418 |
| * | US Cellular Corp. | 13,975 | 407 |
| Juniper Networks Inc. | 12,679 | 395 | |
| * | WideOpenWest Inc. | 17,876 | 332 |
| * | Consolidated Communications Holdings Inc. | 20,143 | 151 |
| * | Liberty Latin America Ltd. Class A | 12,267 | 139 |
| * | Liberty Global plc Class C | 4,008 | 107 |
| 19,923 | |||
| Utilities (0.5%) | |||
| UGI Corp. | 9,943 | 410 | |
| Public Service Enterprise Group Inc. | 6,529 | 408 | |
| Shares | Market Value• ($000) | ||
| Southern Co. | 5,090 | 311 | |
| National Fuel Gas Co. | 5,304 | 307 | |
| Exelon Corp. | 3,897 | 206 | |
| Avangrid Inc. | 3,440 | 174 | |
| FirstEnergy Corp. | 3,676 | 138 | |
| ALLETE Inc. | 2,120 | 124 | |
| Evergy Inc. | 1,470 | 93 | |
| Hawaiian Electric Industries Inc. | 2,346 | 89 | |
| 2,260 | |||
| Total Common Stocks (Cost $374,947) | 446,068 | ||
| Temporary Cash Investments (0.4%) | |||
| Money Market Fund (0.4%) | |||
| 2,3 | Vanguard Market Liquidity Fund, 0.077% (Cost $1,870) | 18,696 | 1,870 |
| Total Investments (99.9%) (Cost $376,817) | 447,938 | ||
| Other Assets and Liabilities—Net (0.1%) | 326 | ||
| Net Assets (100%) | 448,264 | ||
| Cost is in $000. | |||
| • | See Note A in Notes to Financial Statements. |
| * | Non-income-producing security. |
| 1 | Includes partial security positions on loan to broker-dealers. The total value of securities on loan is $481,000. |
| 2 | Affiliated money market fund available only to Vanguard funds and certain trusts and accounts managed by Vanguard. Rate shown is the 7-day yield. |
| 3 | Collateral of $540,000 was received for securities on loan. |
| Futures Contracts | ||||
| ($000) | ||||
| Expiration | Number of Long (Short) Contracts | Notional Amount | Value and Unrealized Appreciation (Depreciation) | |
| Long Futures Contracts | ||||
| E-mini S&P 500 Index | December 2021 | 7 | 1,598 | 45 |
| Micro E-mini S&P 500 Index | December 2021 | 9 | 205 | 4 |
| 49 | ||||
| ($000s, except shares and per-share amounts) | Amount |
| Assets | |
| Investments in Securities, at Value | |
| Unaffiliated Issuers (Cost $374,947) | 446,068 |
| Affiliated Issuers (Cost $1,870) | 1,870 |
| Total Investments in Securities | 447,938 |
| Investment in Vanguard | 14 |
| Cash Collateral Pledged—Futures Contracts | 98 |
| Receivables for Investment Securities Sold | 10 |
| Receivables for Accrued Income | 815 |
| Total Assets | 448,875 |
| Liabilities | |
| Due to Custodian | 13 |
| Collateral for Securities on Loan | 540 |
| Payables to Vanguard | 25 |
| Variation Margin Payable—Futures Contracts | 33 |
| Total Liabilities | 611 |
| Net Assets | 448,264 |
| At November 30, 2021, net assets consisted of: | |
| Paid-in Capital | 385,868 |
| Total Distributable Earnings (Loss) | 62,396 |
| Net Assets | 448,264 |
| Net Assets | |
| Applicable to 4,490,000 outstanding $.001 par value shares of beneficial interest (unlimited authorization) | 448,264 |
| Net Asset Value Per Share | $99.84 |
| Year Ended November 30, 2021 | |
| ($000) | |
| Investment Income | |
| Income | |
| Dividends1 | 6,947 |
| Interest2 | 1 |
| Securities Lending—Net | 9 |
| Total Income | 6,957 |
| Expenses | |
| The Vanguard Group—Note B | |
| Investment Advisory Services | 296 |
| Management and Administrative | 77 |
| Marketing and Distribution | 13 |
| Custodian Fees | 4 |
| Auditing Fees | 31 |
| Shareholders’ Reports | 8 |
| Trustees’ Fees and Expenses | — |
| Total Expenses | 429 |
| Net Investment Income | 6,528 |
| Realized Net Gain (Loss) | |
| Investment Securities Sold2,3 | 7,456 |
| Futures Contracts | 203 |
| Realized Net Gain (Loss) | 7,659 |
| Change in Unrealized Appreciation (Depreciation) | |
| Investment Securities2 | 52,678 |
| Futures Contracts | 36 |
| Change in Unrealized Appreciation (Depreciation) | 52,714 |
| Net Increase (Decrease) in Net Assets Resulting from Operations | 66,901 |
| 1 | Dividends are net of foreign withholding taxes of $2,000. |
| 2 | Interest income, realized net gain (loss), and change in unrealized appreciation (depreciation) from an affiliated company of the fund were $1,000, less than $1,000, and less than $1,000, respectively. Purchases and sales are for temporary cash investment purposes. |
| 3 | Includes $8,033,000 of net gain (loss) resulting from in-kind redemptions. |
| Year Ended November 30, | ||
| 2021 ($000) | 2020 ($000) | |
| Increase (Decrease) in Net Assets | ||
| Operations | ||
| Net Investment Income | 6,528 | 2,769 |
| Realized Net Gain (Loss) | 7,659 | (5,254) |
| Change in Unrealized Appreciation (Depreciation) | 52,714 | 17,857 |
| Net Increase (Decrease) in Net Assets Resulting from Operations | 66,901 | 15,372 |
| Distributions | ||
| Total Distributions | (5,430) | (2,473) |
| Capital Share Transactions | ||
| Issued | 273,133 | 63,070 |
| Issued in Lieu of Cash Distributions | — | — |
| Redeemed | (19,466) | (24,015) |
| Net Increase (Decrease) from Capital Share Transactions | 253,667 | 39,055 |
| Total Increase (Decrease) | 315,138 | 51,954 |
| Net Assets | ||
| Beginning of Period | 133,126 | 81,172 |
| End of Period | 448,264 | 133,126 |
| For a Share Outstanding Throughout Each Period | Year Ended November 30, | February 13, 20181 to November 30, 2018 | ||
| 2021 | 2020 | 2019 | ||
| Net Asset Value, Beginning of Period | $73.96 | $75.51 | $74.35 | $75.00 |
| Investment Operations | ||||
| Net Investment Income2 | 1.923 | 1.689 | 1.671 | 1.276 |
| Net Realized and Unrealized Gain (Loss) on Investments | 25.644 | (1.634) | 1.053 | (1.295) |
| Total from Investment Operations | 27.567 | .055 | 2.724 | (.019) |
| Distributions | ||||
| Dividends from Net Investment Income | (1.687) | (1.605) | (1.564) | (.631) |
| Distributions from Realized Capital Gains | — | — | — | — |
| Total Distributions | (1.687) | (1.605) | (1.564) | (.631) |
| Net Asset Value, End of Period | $99.84 | $73.96 | $75.51 | $74.35 |
| Total Return | 37.51% | 0.70% | 3.83% | -0.08% |
| Ratios/Supplemental Data | ||||
| Net Assets, End of Period (Millions) | $448 | $133 | $81 | $37 |
| Ratio of Total Expenses to Average Net Assets | 0.13% | 0.14%3 | 0.14%3 | 0.13%4 |
| Ratio of Net Investment Income to Average Net Assets | 1.98% | 2.68% | 2.32% | 2.05%4 |
| Portfolio Turnover Rate | 43%5 | 52%5 | 73% | 16% |
| 1 | Inception. |
| 2 | Calculated based on average shares outstanding. |
| 3 | The ratio of expenses to average net assets for the period net of reduction from custody fee offset arrangements was 0.13%. |
| 4 | Annualized. |
| 5 | Excludes the value of portfolio securities received or delivered as a result of in-kind purchases or redemptions of the fund’s capital shares, including ETF Creation Units. |
| A. | The following significant accounting policies conform to generally accepted accounting principles for U.S. investment companies. The fund consistently follows such policies in preparing its financial statements. |
| B. | In accordance with the terms of a Funds' Service Agreement (the “FSA”) between Vanguard and the fund, Vanguard furnishes to the fund investment advisory, corporate management, administrative, marketing, and distribution services at Vanguard’s cost of operations (as defined by the FSA). These costs of operations are allocated to the fund based on methods and guidelines approved by the board of trustees and are generally settled twice a month. |
| C. | Various inputs may be used to determine the value of the fund’s investments and derivatives. These inputs are summarized in three broad levels for financial statement purposes. The inputs or methodologies used to value securities are not necessarily an indication of the risk associated with investing in those securities. |
| D. | Permanent differences between book-basis and tax-basis components of net assets are reclassified among capital accounts in the financial statements to reflect their tax character. These reclassifications have no effect on net assets or net asset value per share. As of period end, permanent differences primarily attributable to the accounting for in-kind redemptions and passive foreign investment companies were reclassified between the following accounts: |
| Amount ($000) | |
| Paid-in Capital | 8,034 |
| Total Distributable Earnings (Loss) | (8,034) |
| Amount ($000) | |
| Undistributed Ordinary Income | 1,813 |
| Undistributed Long-Term Gains | — |
| Capital Loss Carryforwards | (10,521) |
| Qualified Late-Year Losses | — |
| Net Unrealized Gains (Losses) | 71,104 |
| Year Ended November 30, | ||
| 2021 Amount ($000) | 2020 Amount ($000) | |
| Ordinary Income* | 5,430 | 2,473 |
| Long-Term Capital Gains | — | — |
| Total | 5,430 | 2,473 |
| * | Includes short-term capital gains, if any. |
| Amount ($000) | |
| Tax Cost | 376,835 |
| Gross Unrealized Appreciation | 85,903 |
| Gross Unrealized Depreciation | (14,799) |
| Net Unrealized Appreciation (Depreciation) | 71,104 |
| E. | During the year ended November 30, 2021, the fund purchased $410,283,000 of investment securities and sold $157,000,000 of investment securities, other than temporary cash investments. Purchases and sales include $0 and $19,381,000, respectively, in connection with in-kind purchases and redemptions of the fund's capital shares. |
| F. | Capital share transactions for each class of shares were: |
| Year Ended November 30, | ||
| 2021 Shares (000) | 2020 Shares (000) | |
| Issued | 2,895 | 1,150 |
| Issued in Lieu of Cash Distributions | — | — |
| Redeemed | (205) | (425) |
| Net Increase (Decrease) in Shares Outstanding | 2,690 | 725 |
| G. | Management has determined that no events or transactions occurred subsequent to November 30, 2021, that would require recognition or disclosure in these financial statements. |
Philadelphia, Pennsylvania
January 19, 2022
| Fund | ($000) |
| U.S. Liquidity Factor ETF | 647 |
| U.S. Minimum Volatility ETF | 839 |
| U.S. Momentum Factor ETF | 717 |
| U.S. Multifactor ETF | 1,170 |
| U.S. Quality Factor ETF | 932 |
| U.S. Value Factor ETF | 5,430 |
| Fund | ($000) |
| U.S. Liquidity Factor ETF | 13 |
| U.S. Minimum Volatility ETF | 66 |
| U.S. Momentum Factor ETF | — |
| U.S. Multifactor ETF | — |
| U.S. Quality Factor ETF | — |
| U.S. Value Factor ETF | — |
| Fund | Percentage |
| U.S. Liquidity Factor ETF | 100.0% |
| U.S. Minimum Volatility ETF | 100.0 |
| U.S. Momentum Factor ETF | 100.0 |
| U.S. Multifactor ETF | 100.0 |
| U.S. Quality Factor ETF | 100.0 |
| U.S. Value Factor ETF | 99.7 |
| Matthew Benchener | Thomas M. Rampulla |
| Joseph Brennan | Karin A. Risi |
| Mortimer J. Buckley | Anne E. Robinson |
| Gregory Davis | Michael Rollings |
| John James | Nitin Tandon |
| John T. Marcante | Lauren Valente |
| Chris D. Mclsaac |

All rights reserved.
Vanguard Marketing Corporation, Distributor.

Your Fund’s Performance at a Glance | 1 |
Advisor’s Report | 2 |
About Your Fund’s Expenses | 4 |
Performance Summary | 6 |
Financial Statements | 8 |
| • | Vanguard U.S. Multifactor Fund returned 31.39% for the 12 months ended November 30, 2021. It outperformed its benchmark, the Russell 3000 Index, which returned 26.34%. |
| • | The global economy continued to recover from the sharp pandemic-induced contraction in the spring of 2020. Swift and extensive fiscal and monetary support from policymakers was a key to the rebound. Even amid concerns toward the end of the fiscal year about inflation and the prospect of less accommodative monetary policy, stock returns for the period were excellent. |
| • | Eight of the fund’s 11 industry sectors contributed positively to relative performance. Selection in consumer discretionary, industrials, and health care stocks drove much of the fund’s outperformance. Underweight positions in technology and real estate detracted the most. |
| • | The fund regularly uses derivatives to hedge portfolio risks. On balance, the fund’s holdings in equity index futures contracts contributed to performance. |
| Average Annual Total Returns Periods Ended November 30, 2021 | |||
| One Year | Three Years | Five Years | |
| Stocks | |||
| Russell 1000 Index (Large-caps) | 26.67% | 20.65% | 17.93% |
| Russell 2000 Index (Small-caps) | 22.03 | 14.22 | 12.14 |
| Russell 3000 Index (Broad U.S. market) | 26.34 | 20.20 | 17.51 |
| FTSE All-World ex US Index (International) | 9.63 | 10.38 | 9.56 |
| Bonds | |||
| Bloomberg U.S. Aggregate Bond Index (Broad taxable market) | -1.15% | 5.52% | 3.65% |
| Bloomberg Municipal Bond Index (Broad tax-exempt market) | 1.97 | 5.09 | 4.38 |
| FTSE Three-Month U.S. Treasury Bill Index | 0.05 | 1.02 | 1.12 |
| CPI | |||
| Consumer Price Index | 6.81% | 3.32% | 2.86% |
| • | Based on actual fund return. This section helps you to estimate the actual expenses that you paid over the period. The ”Ending Account Value“ shown is derived from the fund‘s actual return, and the third column shows the dollar amount that would have been paid by an investor who started with $1,000 in the fund. You may use the information here, together with the amount you invested, to estimate the expenses that you paid over the period. |
| • | Based on hypothetical 5% yearly return. This section is intended to help you compare your fund‘s costs with those of other mutual funds. It assumes that the fund had a yearly return of 5% before expenses, but that the expense ratio is unchanged. In this case—because the return used is not the fund’s actual return—the results do not apply to your investment. The example is useful in making comparisons because the Securities and Exchange Commission requires all mutual funds to calculate expenses based on a 5% return. You can assess your fund’s costs by comparing this hypothetical example with the hypothetical examples that appear in shareholder reports of other funds. |
| Six Months Ended November 30, 2021 | |||
| U.S. Multifactor Fund | Beginning Account Value 5/31/2021 | Ending Account Value 11/30/2021 | Expenses Paid During Period |
| Based on Actual Fund Return | $1,000.00 | $1,015.80 | $0.91 |
| Based on Hypothetical 5% Yearly Return | 1,000.00 | 1,024.17 | 0.91 |

| Average Annual Total Returns Periods Ended November 30, 2021 | ||||
| One Year | Since Inception (2/15/2018) | Final Value of a $50,000 Investment | ||
 | U.S. Multifactor Fund | 31.39% | 9.24% | $69,892 |
 | Russell 3000 Index | 26.34 | 16.39 | 88,853 |
| Basic Materials | 4.3% |
| Consumer Discretionary | 18.6 |
| Consumer Staples | 5.9 |
| Energy | 10.0 |
| Financials | 25.5 |
| Health Care | 9.7 |
| Industrials | 15.9 |
| Real Estate | 0.1 |
| Technology | 8.6 |
| Telecommunications | 1.4 |
| Utilities | 0.0 |
| Shares | Market Value• ($000) | ||
| Common Stocks (98.8%) | |||
| Basic Materials (4.2%) | |||
| Freeport-McMoRan Inc. | 10,598 | 393 | |
| Dow Inc. | 2,514 | 138 | |
| Olin Corp. | 2,382 | 130 | |
| UFP Industries Inc. | 1,477 | 123 | |
| Nucor Corp. | 1,134 | 121 | |
| CF Industries Holdings Inc. | 1,785 | 108 | |
| Southern Copper Corp. | 1,727 | 101 | |
| AdvanSix Inc. | 2,026 | 92 | |
| Reliance Steel & Aluminum Co. | 596 | 89 | |
| Steel Dynamics Inc. | 1,359 | 81 | |
| Commercial Metals Co. | 2,470 | 76 | |
| Mosaic Co. | 1,906 | 65 | |
| Boise Cascade Co. | 954 | 62 | |
| Schnitzer Steel Industries Inc. Class A | 1,245 | 60 | |
| Verso Corp. Class A | 2,647 | 56 | |
| Timken Co. | 823 | 54 | |
| International Paper Co. | 904 | 41 | |
| Fastenal Co. | 556 | 33 | |
| LyondellBasell Industries NV Class A | 371 | 32 | |
| Haynes International Inc. | 724 | 29 | |
| US Steel Corp. | 1,050 | 24 | |
| Eastman Chemical Co. | 216 | 23 | |
| GrafTech International Ltd. | 1,830 | 21 | |
| Element Solutions Inc. | 783 | 18 | |
| Olympic Steel Inc. | 779 | 16 | |
| Valvoline Inc. | 412 | 14 | |
| Innospec Inc. | 115 | 9 | |
| Worthington Industries Inc. | 172 | 8 | |
| 2,017 | |||
| Consumer Discretionary (18.4%) | |||
| Target Corp. | 1,819 | 444 | |
| Ford Motor Co. | 16,800 | 322 | |
| eBay Inc. | 3,735 | 252 | |
| * | AutoNation Inc. | 1,978 | 245 |
| Bath & Body Works Inc. | 3,010 | 226 | |
| * | O'Reilly Automotive Inc. | 266 | 170 |
| * | Deckers Outdoor Corp. | 412 | 167 |
| Dick's Sporting Goods Inc. | 1,339 | 157 | |
| Movado Group Inc. | 3,434 | 154 | |
| H&R Block Inc. | 6,412 | 152 | |
| Williams-Sonoma Inc. | 760 | 148 | |
| Scholastic Corp. | 3,910 | 147 | |
| Dillard's Inc. Class A | 533 | 146 | |
| Macy's Inc. | 5,125 | 146 | |
| Shares | Market Value• ($000) | ||
| Lennar Corp. Class A | 1,353 | 142 | |
| Walmart Inc. | 873 | 123 | |
| Lowe's Cos. Inc. | 490 | 120 | |
| Acushnet Holdings Corp. | 2,169 | 118 | |
| Kohl's Corp. | 2,187 | 112 | |
| Hibbett Inc. | 1,401 | 109 | |
| LKQ Corp. | 1,936 | 108 | |
| Group 1 Automotive Inc. | 537 | 105 | |
| Omnicom Group Inc. | 1,526 | 103 | |
| * | AutoZone Inc. | 56 | 102 |
| Signet Jewelers Ltd. | 1,052 | 102 | |
| Shoe Carnival Inc. | 2,554 | 100 | |
| Advance Auto Parts Inc. | 450 | 99 | |
| Buckle Inc. | 2,019 | 95 | |
| * | Crocs Inc. | 567 | 93 |
| Interpublic Group of Cos. Inc. | 2,730 | 91 | |
| AMERCO | 126 | 89 | |
| * | Citi Trends Inc. | 1,024 | 87 |
| PulteGroup Inc. | 1,747 | 87 | |
| Fox Corp. Class A | 2,408 | 86 | |
| Rent-A-Center Inc. | 1,955 | 86 | |
| * | Revolve Group Inc. | 1,086 | 83 |
| Century Communities Inc. | 1,137 | 81 | |
| * | MarineMax Inc. | 1,486 | 79 |
| Hanesbrands Inc. | 4,845 | 78 | |
| * | Abercrombie & Fitch Co. Class A | 2,146 | 77 |
| Matthews International Corp. Class A | 2,219 | 77 | |
| * | BJ's Wholesale Club Holdings Inc. | 1,143 | 76 |
| Whirlpool Corp. | 346 | 75 | |
| Tilly's Inc. Class A | 4,948 | 74 | |
| Johnson Outdoors Inc. Class A | 700 | 73 | |
| * | Academy Sports & Outdoors Inc. | 1,612 | 72 |
| Gentex Corp. | 2,058 | 71 | |
| * | Gentherm Inc. | 825 | 70 |
| Best Buy Co. Inc. | 646 | 69 | |
| * | NVR Inc. | 13 | 68 |
| Penske Automotive Group Inc. | 629 | 63 | |
| * | ODP Corp. | 1,619 | 61 |
| * | Conn's Inc. | 2,724 | 60 |
| Entravision Communications Corp. Class A | 8,027 | 60 | |
| * | Goodyear Tire & Rubber Co. | 2,987 | 60 |
| * | Liquidity Services Inc. | 2,609 | 59 |
| DR Horton Inc. | 571 | 56 | |
| * | General Motors Co. | 975 | 56 |
| Shares | Market Value• ($000) | ||
| * | Malibu Boats Inc. Class A | 802 | 56 |
| * | Duluth Holdings Inc. Class B | 3,949 | 55 |
| * | RH | 94 | 55 |
| HNI Corp. | 1,379 | 54 | |
| Standard Motor Products Inc. | 1,037 | 52 | |
| Travel + Leisure Co. | 1,059 | 52 | |
| * | Meritage Homes Corp. | 430 | 49 |
| Rush Enterprises Inc. Class A | 954 | 49 | |
| PVH Corp. | 447 | 48 | |
| * | Master Craft Boat Holdings Inc. | 1,709 | 47 |
| Nexstar Media Group Inc. Class A | 312 | 47 | |
| * | Sleep Number Corp. | 590 | 47 |
| * | Turtle Beach Corp. | 1,771 | 47 |
| * | Zumiez Inc. | 1,019 | 47 |
| * | Asbury Automotive Group Inc. | 275 | 45 |
| * | XPEL Inc. | 599 | 43 |
| Fox Corp. Class B | 1,250 | 42 | |
| Sonic Automotive Inc. Class A | 936 | 42 | |
| Dana Inc. | 1,894 | 41 | |
| * | GoPro Inc. Class A | 4,069 | 41 |
| Estee Lauder Cos. Inc. Class A | 123 | 41 | |
| News Corp. Class A | 1,913 | 41 | |
| * | Tri Pointe Homes Inc. | 1,659 | 41 |
| Foot Locker Inc. | 871 | 40 | |
| * | Cars.com Inc. | 2,357 | 39 |
| * | YETI Holdings Inc. | 423 | 39 |
| Oxford Industries Inc. | 369 | 35 | |
| Toll Brothers Inc. | 553 | 35 | |
| Newell Brands Inc. | 1,558 | 33 | |
| * | Vera Bradley Inc. | 3,481 | 33 |
| Haverty Furniture Cos. Inc. | 1,066 | 32 | |
| Big Lots Inc. | 720 | 31 | |
| Kontoor Brands Inc. | 581 | 31 | |
| John Wiley & Sons Inc. Class A | 588 | 31 | |
| Gap Inc. | 1,795 | 30 | |
| Tapestry Inc. | 733 | 29 | |
| Tractor Supply Co. | 125 | 28 | |
| * | Central Garden & Pet Co. Class A | 615 | 27 |
| Ethan Allen Interiors Inc. | 1,210 | 27 | |
| * | Lands' End Inc. | 1,161 | 27 |
| Murphy USA Inc. | 155 | 27 | |
| Ralph Lauren Corp. Class A | 236 | 27 | |
| International Game Technology plc | 988 | 27 | |
| Garmin Ltd. | 205 | 27 | |
| * | Under Armour Inc. Class A | 1,112 | 26 |
| Nielsen Holdings plc | 1,366 | 26 | |
| Activision Blizzard Inc. | 415 | 24 | |
| New York Times Co. Class A | 511 | 24 | |
| News Corp. Class B | 1,114 | 24 | |
| Polaris Inc. | 205 | 23 | |
| * | Funko Inc. Class A | 1,312 | 21 |
| * | Universal Electronics Inc. | 591 | 21 |
| * | AMC Networks Inc. Class A | 481 | 19 |
| Lithia Motors Inc. Class A | 63 | 18 | |
| * | American Axle & Manufacturing Holdings Inc. | 1,940 | 17 |
| * | Lions Gate Entertainment Corp. Class A | 1,159 | 17 |
| Qurate Retail Inc. Series A | 2,107 | 17 | |
| Rocky Brands Inc. | 492 | 17 | |
| Pool Corp. | 28 | 16 | |
| * | Helen of Troy Ltd. | 67 | 16 |
| Steven Madden Ltd. | 312 | 15 | |
| Thor Industries Inc. | 140 | 15 |
| Shares | Market Value• ($000) | ||
| PriceSmart Inc. | 190 | 14 | |
| * | Perdoceo Education Corp. | 1,466 | 14 |
| Interface Inc. Class A | 903 | 13 | |
| * | Victoria's Secret & Co. | 248 | 13 |
| Aaron's Co. Inc. | 530 | 12 | |
| * | iRobot Corp. | 128 | 10 |
| BorgWarner Inc. (XNYS) | 203 | 9 | |
| * | American Public Education Inc. | 381 | 7 |
| * | Tenneco Inc. Class A | 683 | 7 |
| 8,823 | |||
| Consumer Staples (5.8%) | |||
| Philip Morris International Inc. | 7,416 | 637 | |
| Ingles Markets Inc. Class A | 5,131 | 394 | |
| Tyson Foods Inc. Class A | 3,162 | 250 | |
| Kroger Co. | 5,555 | 231 | |
| SpartanNash Co. | 7,091 | 170 | |
| CVS Health Corp. | 1,647 | 147 | |
| Weis Markets Inc. | 2,322 | 146 | |
| McKesson Corp. | 445 | 96 | |
| * | PLBY Group Inc. | 2,499 | 96 |
| Altria Group Inc. | 2,185 | 93 | |
| Kraft Heinz Co. | 2,206 | 74 | |
| Walgreens Boots Alliance Inc. | 1,460 | 65 | |
| Casey's General Stores Inc. | 332 | 64 | |
| AmerisourceBergen Corp. Class A | 534 | 62 | |
| Vector Group Ltd. | 3,335 | 52 | |
| * | Hain Celestial Group Inc. | 982 | 39 |
| Edgewell Personal Care Co. | 591 | 25 | |
| * | BellRing Brands Inc. Class A | 1,109 | 24 |
| * | Sprouts Farmers Market Inc. | 725 | 19 |
| * | Monster Beverage Corp. | 206 | 17 |
| J M Smucker Co. | 131 | 17 | |
| Albertsons Cos. Inc. Class A | 419 | 15 | |
| * | Darling Ingredients Inc. | 197 | 13 |
| Medifast Inc. | 62 | 13 | |
| Fresh Del Monte Produce Inc. | 432 | 11 | |
| National Beverage Corp. | 198 | 10 | |
| ACCO Brands Corp. | 1,260 | 10 | |
| 2,790 | |||
| Energy (9.9%) | |||
| EOG Resources Inc. | 8,821 | 767 | |
| Exxon Mobil Corp. | 6,541 | 391 | |
| Cheniere Energy Inc. | 2,735 | 287 | |
| Oasis Petroleum Inc. | 2,262 | 271 | |
| ConocoPhillips | 3,748 | 263 | |
| * | Southwestern Energy Co. | 50,166 | 225 |
| Continental Resources Inc. | 4,973 | 221 | |
| * | Centrus Energy Corp. Class A | 3,024 | 168 |
| Northern Oil and Gas Inc. | 8,146 | 166 | |
| Civitas Resources Inc. | 3,122 | 160 | |
| * | Antero Resources Corp. | 8,357 | 147 |
| Ovintiv Inc. (XNYS) | 4,236 | 147 | |
| * | W&T Offshore Inc. | 35,864 | 123 |
| Occidental Petroleum Corp. | 3,889 | 115 | |
| * | CONSOL Energy Inc. | 5,089 | 112 |
| Diamondback Energy Inc. | 918 | 98 | |
| PDC Energy Inc. | 1,887 | 95 | |
| Marathon Oil Corp. | 5,522 | 86 | |
| Antero Midstream Corp. | 7,959 | 77 | |
| * | Comstock Resources Inc. | 9,496 | 77 |
| Targa Resources Corp. | 1,379 | 71 | |
| * | ChampionX Corp. | 3,479 | 71 |
| Magnolia Oil & Gas Corp. Class A | 3,381 | 64 | |
| * | Range Resources Corp. | 2,837 | 56 |
| Shares | Market Value• ($000) | ||
| SunCoke Energy Inc. | 9,260 | 56 | |
| Devon Energy Corp. | 1,145 | 48 | |
| Pioneer Natural Resources Co. | 251 | 45 | |
| Patterson-UTI Energy Inc. | 5,170 | 37 | |
| * | National Energy Services Reunited Corp. | 3,474 | 34 |
| * | Newpark Resources Inc. | 11,483 | 31 |
| * | Talos Energy Inc. | 3,108 | 31 |
| Hess Corp. | 407 | 30 | |
| California Resources Corp. | 761 | 30 | |
| * | Earthstone Energy Inc. Class A | 2,678 | 27 |
| Texas Pacific Land Corp. | 18 | 22 | |
| * | CNX Resources Corp. | 1,373 | 19 |
| Berry Corp. | 2,060 | 17 | |
| * | Green Plains Inc. | 417 | 16 |
| World Fuel Services Corp. | 455 | 11 | |
| * | Renewable Energy Group Inc. | 188 | 9 |
| 4,721 | |||
| Financials (25.2%) | |||
| Goldman Sachs Group Inc. | 1,112 | 424 | |
| * | Mr Cooper Group Inc. | 10,797 | 424 |
| * | Berkshire Hathaway Inc. Class B | 1,470 | 407 |
| Aon plc Class A (XNYS) | 1,278 | 378 | |
| MetLife Inc. | 6,029 | 354 | |
| Bank of New York Mellon Corp. | 6,286 | 344 | |
| JPMorgan Chase & Co. | 1,998 | 317 | |
| Allstate Corp. | 2,883 | 313 | |
| T Rowe Price Group Inc. | 1,567 | 313 | |
| Bank of America Corp. | 6,425 | 286 | |
| US Bancorp | 5,094 | 282 | |
| Jefferies Financial Group Inc. | 6,188 | 233 | |
| Wells Fargo & Co. | 4,753 | 227 | |
| Popular Inc. | 2,480 | 193 | |
| Citigroup Inc. | 3,007 | 192 | |
| SLM Corp. | 9,725 | 173 | |
| First BanCorp. (XNYS) | 12,671 | 168 | |
| Hilltop Holdings Inc. | 4,882 | 166 | |
| Chubb Ltd. | 907 | 163 | |
| HarborOne Bancorp Inc. | 11,630 | 162 | |
| Citizens Financial Group Inc. | 3,356 | 159 | |
| Ameriprise Financial Inc. | 519 | 150 | |
| Virtus Investment Partners Inc. | 464 | 138 | |
| Affiliated Managers Group Inc. | 783 | 133 | |
| PNC Financial Services Group Inc. | 673 | 133 | |
| Primerica Inc. | 894 | 132 | |
| Oppenheimer Holdings Inc. Class A | 2,643 | 130 | |
| * | SVB Financial Group | 187 | 129 |
| HomeStreet Inc. | 2,579 | 127 | |
| B Riley Financial Inc. | 1,612 | 125 | |
| CNO Financial Group Inc. | 5,402 | 122 | |
| First Citizens BancShares Inc. Class A | 137 | 110 | |
| KeyCorp | 4,925 | 110 | |
| Zions Bancorp NA | 1,738 | 110 | |
| Comerica Inc. | 1,295 | 107 | |
| Janus Henderson Group plc | 2,287 | 98 | |
| * | Credit Acceptance Corp. | 154 | 96 |
| Hartford Financial Services Group Inc. | 1,457 | 96 | |
| Nelnet Inc. Class A | 1,054 | 91 | |
| Stifel Financial Corp. | 1,260 | 89 | |
| Associated Banc-Corp. | 4,006 | 88 | |
| Travelers Cos. Inc. | 583 | 86 | |
| Northfield Bancorp Inc. | 5,067 | 85 | |
| Shares | Market Value• ($000) | ||
| Simmons First National Corp. Class A | 2,872 | 84 | |
| * | Axos Financial Inc. | 1,472 | 83 |
| Morningstar Inc. | 263 | 82 | |
| Equitable Holdings Inc. | 2,592 | 82 | |
| Old Republic International Corp. | 3,219 | 77 | |
| Aflac Inc. | 1,349 | 73 | |
| Byline Bancorp Inc. | 2,774 | 72 | |
| Moody's Corp. | 178 | 70 | |
| Meta Financial Group Inc. | 1,153 | 69 | |
| Federated Hermes Inc. | 2,007 | 68 | |
| Sandy Spring Bancorp Inc. | 1,427 | 67 | |
| Evercore Inc. Class A | 477 | 66 | |
| Park National Corp. | 505 | 66 | |
| Cincinnati Financial Corp. | 571 | 65 | |
| Merchants Bancorp | 1,429 | 65 | |
| Trustmark Corp. | 2,035 | 62 | |
| Kearny Financial Corp. | 4,798 | 61 | |
| Fidelity National Financial Inc. | 1,236 | 60 | |
| First American Financial Corp. | 811 | 60 | |
| Hanmi Financial Corp. | 2,664 | 60 | |
| OFG Bancorp | 2,505 | 60 | |
| Voya Financial Inc. | 958 | 60 | |
| BOK Financial Corp. | 567 | 58 | |
| Bank OZK | 1,265 | 57 | |
| Federal Agricultural Mortgage Corp. Class C | 461 | 56 | |
| UMB Financial Corp. | 552 | 56 | |
| Fifth Third Bancorp | 1,294 | 55 | |
| First Commonwealth Financial Corp. | 3,659 | 55 | |
| * | Enstar Group Ltd. | 242 | 54 |
| Preferred Bank | 779 | 53 | |
| Eagle Bancorp Inc. | 925 | 52 | |
| First Financial Bancorp | 2,249 | 52 | |
| Northern Trust Corp. | 449 | 52 | |
| WSFS Financial Corp. | 1,043 | 52 | |
| Walker & Dunlop Inc. | 373 | 52 | |
| Raymond James Financial Inc. | 517 | 51 | |
| PacWest Bancorp | 1,117 | 50 | |
| Washington Trust Bancorp Inc. | 910 | 49 | |
| Hanover Insurance Group Inc. | 398 | 48 | |
| Morgan Stanley | 506 | 48 | |
| Washington Federal Inc. | 1,473 | 48 | |
| BankUnited Inc. | 1,179 | 47 | |
| 1st Source Corp. | 999 | 46 | |
| Home BancShares Inc. | 1,919 | 46 | |
| BancFirst Corp. | 696 | 44 | |
| Hope Bancorp Inc. | 3,065 | 44 | |
| Bank of NT Butterfield & Son Ltd. | 1,190 | 44 | |
| First Foundation Inc. | 1,687 | 43 | |
| Fulton Financial Corp. | 2,726 | 43 | |
| Provident Financial Services Inc. | 1,808 | 43 | |
| FNB Corp. | 3,519 | 41 | |
| Brookline Bancorp Inc. | 2,481 | 38 | |
| First Bancorp (XNGS) | 856 | 38 | |
| Renasant Corp. | 1,053 | 38 | |
| East West Bancorp Inc. | 487 | 37 | |
| ServisFirst Bancshares Inc. | 465 | 37 | |
| Towne Bank | 1,210 | 37 | |
| Regions Financial Corp. | 1,600 | 36 | |
| City Holding Co. | 430 | 34 | |
| Ameris Bancorp | 670 | 33 | |
| NBT Bancorp Inc. | 908 | 33 | |
| Employers Holdings Inc. | 840 | 32 |
| Shares | Market Value• ($000) | ||
| QCR Holdings Inc. | 595 | 32 | |
| Origin Bancorp Inc. | 712 | 30 | |
| Lakeland Financial Corp. | 396 | 28 | |
| Pinnacle Financial Partners Inc. | 282 | 27 | |
| Blackstone Inc. | 191 | 27 | |
| Old National Bancorp | 1,380 | 24 | |
| Southside Bancshares Inc. | 584 | 24 | |
| Virtu Financial Inc. Class A | 837 | 24 | |
| Lazard Ltd. Class A | 558 | 24 | |
| Diamond Hill Investment Group Inc. | 121 | 23 | |
| TrustCo Bank Corp. NY | 713 | 23 | |
| Artisan Partners Asset Management Inc. Class A | 500 | 22 | |
| TriCo Bancshares | 521 | 22 | |
| Atlantic Union Bankshares Corp. | 587 | 19 | |
| * | Columbia Financial Inc. | 1,027 | 19 |
| Central Pacific Financial Corp. | 662 | 18 | |
| First Hawaiian Inc. | 698 | 18 | |
| Heritage Financial Corp. | 790 | 18 | |
| Cathay General Bancorp | 410 | 17 | |
| Tompkins Financial Corp. | 210 | 16 | |
| Invesco Ltd. | 723 | 16 | |
| Truist Financial Corp. | 263 | 16 | |
| Banner Corp. | 262 | 15 | |
| PennyMac Financial Services Inc. | 219 | 14 | |
| Radian Group Inc. | 667 | 14 | |
| OceanFirst Financial Corp. | 531 | 11 | |
| Signature Bank | 34 | 10 | |
| 12,058 | |||
| Health Care (9.6%) | |||
| Gilead Sciences Inc. | 7,172 | 494 | |
| * | Moderna Inc. | 1,403 | 494 |
| Pfizer Inc. | 8,339 | 448 | |
| Anthem Inc. | 1,048 | 426 | |
| HCA Healthcare Inc. | 1,599 | 361 | |
| AbbVie Inc. | 1,878 | 217 | |
| Eli Lilly & Co. | 859 | 213 | |
| * | Align Technology Inc. | 265 | 162 |
| Agilent Technologies Inc. | 845 | 128 | |
| Johnson & Johnson | 815 | 127 | |
| * | Tenet Healthcare Corp. | 1,536 | 112 |
| * | United Therapeutics Corp. | 593 | 112 |
| UnitedHealth Group Inc. | 247 | 110 | |
| * | Laboratory Corp. of America Holdings | 345 | 98 |
| * | Molina Healthcare Inc. | 334 | 95 |
| Bristol-Myers Squibb Co. | 1,742 | 93 | |
| * | Community Health Systems Inc. | 7,138 | 86 |
| Abbott Laboratories | 607 | 76 | |
| * | Biogen Inc. | 285 | 67 |
| * | Medpace Holdings Inc. | 307 | 64 |
| * | Corcept Therapeutics Inc. | 2,644 | 56 |
| * | Vanda Pharmaceuticals Inc. | 3,469 | 56 |
| * | Catalyst Pharmaceuticals Inc. | 6,841 | 48 |
| * | DaVita Inc. | 460 | 43 |
| * | Henry Schein Inc. | 612 | 43 |
| West Pharmaceutical Services Inc. | 96 | 43 | |
| * | ModivCare Inc. | 262 | 36 |
| Cerner Corp. | 473 | 33 | |
| * | Computer Programs and Systems Inc. | 1,054 | 31 |
| Quest Diagnostics Inc. | 185 | 28 | |
| Shares | Market Value• ($000) | ||
| * | Regeneron Pharmaceuticals Inc. | 42 | 27 |
| * | AngioDynamics Inc. | 952 | 25 |
| * | Joint Corp. | 319 | 25 |
| Bruker Corp. | 302 | 24 | |
| Cardinal Health Inc. | 476 | 22 | |
| * | IDEXX Laboratories Inc. | 36 | 22 |
| * | Quidel Corp. | 115 | 17 |
| * | Acadia Healthcare Co. Inc. | 259 | 15 |
| * | Meridian Bioscience Inc. | 631 | 13 |
| * | STAAR Surgical Co. | 90 | 9 |
| * | Amneal Pharmaceuticals Inc. | 1,944 | 8 |
| 4,607 | |||
| Industrials (15.7%) | |||
| American Express Co. | 2,235 | 340 | |
| Accenture plc Class A | 718 | 257 | |
| Johnson Controls International plc | 3,415 | 255 | |
| Northrop Grumman Corp. | 590 | 206 | |
| Louisiana-Pacific Corp. | 3,078 | 201 | |
| * | Zebra Technologies Corp. Class A | 298 | 175 |
| Automatic Data Processing Inc. | 575 | 133 | |
| Brunswick Corp. | 1,359 | 128 | |
| Eaton Corp. plc | 761 | 123 | |
| Cummins Inc. | 558 | 117 | |
| Acuity Brands Inc. | 562 | 113 | |
| * | Saia Inc. | 334 | 111 |
| Regal Rexnord Corp. | 661 | 105 | |
| Sherwin-Williams Co. | 315 | 104 | |
| United Parcel Service Inc. Class B | 513 | 102 | |
| Encore Wire Corp. | 715 | 100 | |
| * | MYR Group Inc. | 896 | 99 |
| Deere & Co. | 277 | 96 | |
| AGCO Corp. | 858 | 95 | |
| Huntington Ingalls Industries Inc. | 500 | 89 | |
| Quanta Services Inc. | 782 | 89 | |
| * | Generac Holdings Inc. | 206 | 87 |
| Caterpillar Inc. | 445 | 86 | |
| * | Covenant Logistics Group Inc. Class A | 3,397 | 85 |
| General Dynamics Corp. | 449 | 85 | |
| ManpowerGroup Inc. | 949 | 85 | |
| Crown Holdings Inc. | 796 | 84 | |
| Emerson Electric Co. | 959 | 84 | |
| L3Harris Technologies Inc. | 399 | 83 | |
| * | Hub Group Inc. Class A | 1,044 | 81 |
| Old Dominion Freight Line Inc. | 220 | 78 | |
| * | Trex Co. Inc. | 584 | 78 |
| Kforce Inc. | 1,003 | 77 | |
| ArcBest Corp. | 725 | 75 | |
| Badger Meter Inc. | 703 | 72 | |
| Watts Water Technologies Inc. Class A | 380 | 72 | |
| 3M Co. | 412 | 70 | |
| Knight-Swift Transportation Holdings Inc. | 1,207 | 69 | |
| Snap-on Inc. | 334 | 69 | |
| Genco Shipping & Trading Ltd. | 4,386 | 68 | |
| * | United Rentals Inc. | 189 | 64 |
| EMCOR Group Inc. | 529 | 63 | |
| Robert Half International Inc. | 561 | 62 | |
| ITT Inc. | 645 | 61 | |
| * | TriNet Group Inc. | 608 | 61 |
| * | Textainer Group Holdings Ltd. | 1,852 | 61 |
| Shares | Market Value• ($000) | ||
| Marten Transport Ltd. | 3,756 | 60 | |
| Ryder System Inc. | 726 | 60 | |
| Simpson Manufacturing Co. Inc. | 508 | 59 | |
| Heidrick & Struggles International Inc. | 1,334 | 58 | |
| Advanced Drainage Systems Inc. | 457 | 57 | |
| Triton International Ltd. | 1,023 | 57 | |
| Owens Corning | 649 | 55 | |
| Hubbell Inc. Class B | 270 | 53 | |
| Matson Inc. | 651 | 53 | |
| JB Hunt Transport Services Inc. | 271 | 52 | |
| * | Cross Country Healthcare Inc. | 1,962 | 51 |
| Landstar System Inc. | 301 | 51 | |
| Kadant Inc. | 215 | 50 | |
| Granite Construction Inc. | 1,257 | 49 | |
| Quanex Building Products Corp. | 2,298 | 49 | |
| * | Teekay Corp. | 14,517 | 48 |
| * | Titan Machinery Inc. | 1,423 | 47 |
| * | API Group Corp. | 1,965 | 46 |
| * | Beacon Roofing Supply Inc. | 902 | 45 |
| Franklin Electric Co. Inc. | 516 | 45 | |
| WW Grainger Inc. | 94 | 45 | |
| * | Mohawk Industries Inc. | 271 | 45 |
| * | Sterling Construction Co. Inc. | 1,731 | 45 |
| Apogee Enterprises Inc. | 1,051 | 43 | |
| Crane Co. | 439 | 42 | |
| Ennis Inc. | 2,172 | 41 | |
| * | Masonite International Corp. | 380 | 41 |
| * | Middleby Corp. | 227 | 40 |
| Watsco Inc. | 132 | 39 | |
| * | TrueBlue Inc. | 1,425 | 37 |
| Shyft Group Inc. | 771 | 37 | |
| Insteel Industries Inc. | 847 | 36 | |
| Werner Enterprises Inc. | 789 | 36 | |
| * | Safe Bulkers Inc. | 9,937 | 36 |
| Zurn Water Solutions Corp. | 1,036 | 36 | |
| * | Berry Global Group Inc. | 510 | 35 |
| Packaging Corp. of America | 264 | 34 | |
| Graphic Packaging Holding Co. | 1,693 | 33 | |
| * | Modine Manufacturing Co. | 3,178 | 33 |
| Westrock Co. | 766 | 33 | |
| AAON Inc. | 424 | 33 | |
| Argan Inc. | 782 | 31 | |
| Astec Industries Inc. | 493 | 31 | |
| nVent Electric plc | 876 | 31 | |
| Costamare Inc. | 2,586 | 31 | |
| * | MasTec Inc. | 326 | 30 |
| * | Atlas Air Worldwide Holdings Inc. | 335 | 29 |
| AZZ Inc. | 540 | 28 | |
| Valmont Industries Inc. | 115 | 27 | |
| * | GXO Logistics Inc. | 284 | 27 |
| * | Construction Partners Inc. Class A | 762 | 26 |
| Eagle Materials Inc. | 169 | 26 | |
| Textron Inc. | 373 | 26 | |
| * | ASGN Inc. | 214 | 26 |
| SPX FLOW Inc. | 283 | 24 | |
| Greif Inc. Class A | 380 | 23 | |
| Myers Industries Inc. | 1,162 | 23 | |
| CRA International Inc. | 240 | 22 | |
| * | AMN Healthcare Services Inc. | 192 | 22 |
| * | FTI Consulting Inc. | 146 | 21 |
| Primoris Services Corp. | 950 | 21 | |
| * | XPO Logistics Inc. | 284 | 21 |
| Shares | Market Value• ($000) | ||
| Resources Connection Inc. | 1,178 | 20 | |
| * | CoreCivic Inc. | 1,736 | 19 |
| ABM Industries Inc. | 403 | 18 | |
| ADT Inc. | 2,004 | 17 | |
| * | Atkore Inc. | 151 | 16 |
| Sonoco Products Co. | 276 | 16 | |
| Comfort Systems USA Inc. | 150 | 14 | |
| REV Group Inc. | 886 | 14 | |
| Trane Technologies plc | 73 | 14 | |
| Patrick Industries Inc. | 164 | 13 | |
| McGrath RentCorp. | 153 | 12 | |
| UniFirst Corp. | 61 | 12 | |
| * | American Woodmark Corp. | 176 | 11 |
| * | SPX Corp. | 192 | 11 |
| Barrett Business Services Inc. | 135 | 10 | |
| Deluxe Corp. | 254 | 9 | |
| 7,515 | |||
| Real Estate (0.1%) | |||
| St. Joe Co. | 779 | 37 | |
| * | Jones Lang LaSalle Inc. | 72 | 17 |
| 54 | |||
| Technology (8.5%) | |||
| Applied Materials Inc. | 2,937 | 432 | |
| * | Alphabet Inc. Class A | 118 | 335 |
| KLA Corp. | 696 | 284 | |
| International Business Machines Corp. | 2,240 | 262 | |
| * | Alphabet Inc. Class C | 80 | 228 |
| HP Inc. | 6,029 | 213 | |
| Broadcom Inc. | 281 | 156 | |
| Texas Instruments Inc. | 713 | 137 | |
| Intel Corp. | 2,767 | 136 | |
| Micron Technology Inc. | 1,450 | 122 | |
| Cognizant Technology Solutions Corp. Class A | 1,311 | 102 | |
| Oracle Corp. | 1,053 | 96 | |
| * | Dell Technologies Inc. Class C | 1,677 | 95 |
| * | Arrow Electronics Inc. | 739 | 90 |
| * | Meta Platforms Inc. Class A | 255 | 83 |
| Jabil Inc. | 1,428 | 83 | |
| * | Avid Technology Inc. | 2,434 | 78 |
| Seagate Technology Holdings plc | 700 | 72 | |
| TE Connectivity Ltd. | 342 | 53 | |
| NortonLifeLock Inc. | 2,114 | 53 | |
| * | TechTarget Inc. | 534 | 52 |
| * | Kimball Electronics Inc. | 2,389 | 51 |
| TD SYNNEX Corp. | 494 | 51 | |
| NetApp Inc. | 510 | 45 | |
| Shutterstock Inc. | 392 | 45 | |
| Hackett Group Inc. | 2,074 | 42 | |
| * | Dropbox Inc. Class A | 1,581 | 39 |
| Lam Research Corp. | 56 | 38 | |
| * | Ziff Davis Inc. | 294 | 33 |
| Methode Electronics Inc. | 734 | 33 | |
| * | Rimini Street Inc. | 5,050 | 33 |
| * | Teradata Corp. | 771 | 33 |
| * | Gartner Inc. | 102 | 32 |
| * | Rambus Inc. | 1,178 | 32 |
| Vertiv Holdings Co. Class A | 1,209 | 31 | |
| * | Manhattan Associates Inc. | 192 | 30 |
| * | ePlus Inc. | 279 | 29 |
| * | Fortinet Inc. | 83 | 28 |
| * | Sanmina Corp. | 735 | 27 |
| Kulicke & Soffa Industries Inc. | 473 | 27 | |
| * | NetScout Systems Inc. | 875 | 26 |
| Shares | Market Value• ($000) | ||
| * | EMCORE Corp. | 3,401 | 25 |
| * | F5 Inc. | 104 | 24 |
| Hewlett Packard Enterprise Co. | 1,530 | 22 | |
| VMware Inc. Class A | 186 | 22 | |
| * | Plexus Corp. | 250 | 21 |
| Concentrix Corp. | 126 | 21 | |
| * | NCR Corp. | 425 | 16 |
| A10 Networks Inc. | 1,006 | 15 | |
| * | ScanSource Inc. | 452 | 14 |
| * | SMART Global Holdings Inc. | 222 | 13 |
| Xperi Holding Corp. | 723 | 13 | |
| * | Unisys Corp. | 411 | 7 |
| * | Kyndryl Holdings Inc. | 448 | 7 |
| 4,087 | |||
| Telecommunications (1.4%) | |||
| Cisco Systems Inc. | 5,005 | 274 | |
| Lumen Technologies Inc. | 9,213 | 114 | |
| * | WideOpenWest Inc. | 5,547 | 103 |
| * | Calix Inc. | 678 | 45 |
| * | Consolidated Communications Holdings Inc. | 4,997 | 38 |
| * | NETGEAR Inc. | 870 | 23 |
| * | Lumentum Holdings Inc. | 237 | 21 |
| * | Clearfield Inc. | 198 | 13 |
| * | Ciena Corp. | 195 | 12 |
| 643 | |||
| Shares | Market Value• ($000) | ||
| Utilities (0.0%) | |||
| * | Evoqua Water Technologies Corp. | 428 | 19 |
| Total Common Stocks (Cost $38,058) | 47,334 | ||
| Temporary Cash Investments (1.8%) | |||
| Money Market Fund (1.8%) | |||
| 1 | Vanguard Market Liquidity Fund 0.077% (Cost $869) | 8,684 | 868 |
| Total Investments (100.6%) (Cost $38,927) | 48,202 | ||
| Other Assets and Liabilities—Net (-0.6%) | (266) | ||
| Net Assets (100%) | 47,936 | ||
| Cost is in $000. | |||
| • | See Note A in Notes to Financial Statements. |
| * | Non-income-producing security. |
| 1 | Affiliated money market fund available only to Vanguard funds and certain trusts and accounts managed by Vanguard. Rate shown is the 7-day yield. |
| Futures Contracts | ||||
| ($000) | ||||
| Expiration | Number of Long (Short) Contracts | Notional Amount | Value and Unrealized Appreciation (Depreciation) | |
| Long Futures Contracts | ||||
| Micro E-mini S&P 500 Index | December 2021 | 26 | 594 | (13) |
| ($000s, except shares and per-share amounts) | Amount |
| Assets | |
| Investments in Securities, at Value | |
| Unaffiliated Issuers (Cost $38,058) | 47,334 |
| Affiliated Issuers (Cost $869) | 868 |
| Total Investments in Securities | 48,202 |
| Investment in Vanguard | 2 |
| Cash Collateral Pledged—Futures Contracts | 48 |
| Receivables for Accrued Income | 82 |
| Receivables for Capital Shares Issued | 158 |
| Total Assets | 48,492 |
| Liabilities | |
| Payables for Investment Securities Purchased | 125 |
| Payables for Capital Shares Redeemed | 411 |
| Payables to Vanguard | 5 |
| Variation Margin Payable—Futures Contracts | 15 |
| Total Liabilities | 556 |
| Net Assets | 47,936 |
| At November 30, 2021, net assets consisted of: | |
| Paid-in Capital | 40,996 |
| Total Distributable Earnings (Loss) | 6,940 |
| Net Assets | 47,936 |
| Net Assets | |
| Applicable to 1,453,162 outstanding $.001 par value shares of beneficial interest (unlimited authorization) | 47,936 |
| Net Asset Value Per Share | $32.99 |
| Year Ended November 30, 2021 | |
| ($000) | |
| Investment Income | |
| Income | |
| Dividends | 638 |
| Interest1 | — |
| Securities Lending—Net | 2 |
| Total Income | 640 |
| Expenses | |
| The Vanguard Group—Note B | |
| Investment Advisory Services | — |
| Management and Administrative | 30 |
| Marketing and Distribution | — |
| Custodian Fees | 5 |
| Auditing Fees | 31 |
| Shareholders’ Reports | 3 |
| Trustees’ Fees and Expenses | — |
| Total Expenses | 69 |
| Net Investment Income | 571 |
| Realized Net Gain (Loss) | |
| Investment Securities Sold1 | 2,892 |
| Futures Contracts | 126 |
| Realized Net Gain (Loss) | 3,018 |
| Change in Unrealized Appreciation (Depreciation) | |
| Investment Securities1 | 4,989 |
| Futures Contracts | (15) |
| Change in Unrealized Appreciation (Depreciation) | 4,974 |
| Net Increase (Decrease) in Net Assets Resulting from Operations | 8,563 |
| 1 | Interest income, realized net gain (loss), and change in unrealized appreciation (depreciation) from an affiliated company of the fund were each less than $1,000, respectively. Purchases and sales are for temporary cash investment purposes. |
| Year Ended November 30, | ||
| 2021 ($000) | 2020 ($000) | |
| Increase (Decrease) in Net Assets | ||
| Operations | ||
| Net Investment Income | 571 | 434 |
| Realized Net Gain (Loss) | 3,018 | (2,761) |
| Change in Unrealized Appreciation (Depreciation) | 4,974 | 1,336 |
| Net Increase (Decrease) in Net Assets Resulting from Operations | 8,563 | (991) |
| Distributions | ||
| Total Distributions | (509) | (472) |
| Capital Share Transactions | ||
| Issued | 30,399 | 11,365 |
| Issued in Lieu of Cash Distributions | 417 | 380 |
| Redeemed | (17,122) | (17,034) |
| Net Increase (Decrease) from Capital Share Transactions | 13,694 | (5,289) |
| Total Increase (Decrease) | 21,748 | (6,752) |
| Net Assets | ||
| Beginning of Period | 26,188 | 32,940 |
| End of Period | 47,936 | 26,188 |
| For a Share Outstanding Throughout Each Period | Year Ended November 30, | February 15, 20181 to November 30, 2018 | ||
| 2021 | 2020 | 2019 | ||
| Net Asset Value, Beginning of Period | $25.47 | $25.70 | $24.53 | $25.00 |
| Investment Operations | ||||
| Net Investment Income2 | .466 | .382 | .425 | .333 |
| Net Realized and Unrealized Gain (Loss) on Investments | 7.485 | (.214) | 1.143 | (.598) |
| Total from Investment Operations | 7.951 | .168 | 1.568 | (.265) |
| Distributions | ||||
| Dividends from Net Investment Income | (.431) | (.398) | (.398) | (.205) |
| Distributions from Realized Capital Gains | — | — | — | — |
| Total Distributions | (.431) | (.398) | (.398) | (.205) |
| Net Asset Value, End of Period | $32.99 | $25.47 | $25.70 | $24.53 |
| Total Return3 | 31.39% | 0.97% | 6.54% | -1.11% |
| Ratios/Supplemental Data | ||||
| Net Assets, End of Period (Millions) | $48 | $26 | $33 | $36 |
| Ratio of Total Expenses to Average Net Assets | 0.18% | 0.18% | 0.18% | 0.18%4 |
| Ratio of Net Investment Income to Average Net Assets | 1.48% | 1.66% | 1.76% | 1.64%4 |
| Portfolio Turnover Rate | 62% | 74% | 96% | 58% |
| 1 | Inception. |
| 2 | Calculated based on average shares outstanding. |
| 3 | Total returns do not include transaction or account service fees that may have applied in the periods shown. Fund prospectuses provide information about any applicable transaction and account service fees. |
| 4 | Annualized. |
| A. | The following significant accounting policies conform to generally accepted accounting principles for U.S. investment companies. The fund consistently follows such policies in preparing its financial statements. |
| B. | In accordance with the terms of a Funds' Service Agreement (the “FSA”) between Vanguard and the fund, Vanguard furnishes to the fund investment advisory, corporate management, administrative, marketing, and distribution services at Vanguard’s cost of operations (as defined by the FSA). These costs of operations are allocated to the fund based on methods and guidelines approved by the board of trustees and are generally settled twice a month. |
| C. | Various inputs may be used to determine the value of the fund’s investments and derivatives. These inputs are summarized in three broad levels for financial statement purposes. The inputs or methodologies used to value securities are not necessarily an indication of the risk associated with investing in those securities. |
| D. | Permanent differences between book-basis and tax-basis components of net assets, if any, are reclassified among capital accounts in the financial statements to reflect their tax character. These reclassifications have no effect on net assets or net asset value per share. |
| Amount ($000) | |
| Undistributed Ordinary Income | 164 |
| Undistributed Long-Term Gains | — |
| Capital Loss Carryforwards | (2,500) |
| Qualified Late-Year Losses | — |
| Net Unrealized Gains (Losses) | 9,276 |
| Year Ended November 30, | ||
| 2021 Amount ($000) | 2020 Amount ($000) | |
| Ordinary Income* | 509 | 472 |
| Long-Term Capital Gains | — | — |
| Total | 509 | 472 |
| * | Includes short-term capital gains, if any. |
| Amount ($000) | |
| Tax Cost | 38,926 |
| Gross Unrealized Appreciation | 10,221 |
| Gross Unrealized Depreciation | (945) |
| Net Unrealized Appreciation (Depreciation) | 9,276 |
| E. | During the year ended November 30, 2021, the fund purchased $36,653,000 of investment securities and sold $23,139,000 of investment securities, other than temporary cash investments. |
| F. | Capital shares issued and redeemed were: |
| Year Ended November 30, | ||
| 2021 Shares (000) | 2020 Shares (000) | |
| Issued | 960 | 524 |
| Issued in Lieu of Cash Distributions | 14 | 18 |
| Redeemed | (549) | (795) |
| Net Increase (Decrease) in Shares Outstanding | 425 | (253) |
| G. | Management has determined that no events or transactions occurred subsequent to November 30, 2021, that would require recognition or disclosure in these financial statements. |
Philadelphia, Pennsylvania
January 19, 2022
| Matthew Benchener | Thomas M. Rampulla |
| Joseph Brennan | Karin A. Risi |
| Mortimer J. Buckley | Anne E. Robinson |
| Gregory Davis | Michael Rollings |
| John James | Nitin Tandon |
| John T. Marcante | Lauren Valente |
| Chris D. Mclsaac |

All rights reserved.
Vanguard Marketing Corporation, Distributor.
Item 2: Code of Ethics.
The Registrant has adopted a code of ethics that applies to the Registrant’s principal executive officer, principal financial officer, principal accounting officer or controller or persons performing similar functions. The Code of Ethics was amended during the reporting period covered by this report to make certain technical, non-material changes.
Item 3: Audit Committee Financial Expert.
All members of the Audit Committee have been determined by the Registrant’s Board of Trustees to be Audit Committee Financial Experts and to be independent: F. Joseph Loughrey, Mark Loughridge, Sarah Bloom Raskin, and Peter F. Volanakis.
Item 4: Principal Accountant Fees and Services.
(a) Audit Fees.
Audit Fees of the Registrant.
Fiscal Year Ended November 30, 2021: $250,000
Fiscal Year Ended November 30, 2020: $168,000
Aggregate Audit Fees of Registered Investment Companies in the Vanguard Group.
Fiscal Year Ended November 30, 2021: $11,244,694
Fiscal Year Ended November 30, 2020: $10,761,407
Includes fees billed in connection with audits of the Registrant, other registered investment companies in the Vanguard complex, The Vanguard Group, Inc., and Vanguard Marketing Corporation.
(b) Audit-Related Fees.
Fiscal Year Ended November 30, 2021: $2,955,181
Fiscal Year Ended November 30, 2020: $2,915,863
Includes fees billed in connection with assurance and related services provided to the Registrant, other registered investment companies in the Vanguard complex, The Vanguard Group, Inc., and Vanguard Marketing Corporation.
(c) Tax Fees.
Fiscal Year Ended November 30, 2021: $2,047,574
Fiscal Year Ended November 30, 2020: $247,168
Includes fees billed in connection with tax compliance, planning, and advice services provided to the Registrant, other registered investment companies in the Vanguard complex, The Vanguard Group, Inc., and Vanguard Marketing Corporation.
(d) All Other Fees.
Fiscal Year Ended November 30, 2021: $280,000
Fiscal Year Ended November 30, 2020: $115,000
Includes fees billed for services related to tax reported information provided to the Registrant, other registered investment companies in the Vanguard complex, The Vanguard Group, Inc., and Vanguard Marketing Corporation.
(e) (1) Pre-Approval Policies. The policy of the Registrant’s Audit Committee is to consider, and, if appropriate, approve before the principal accountant is engaged for such services, all specific audit and non-audit services provided to: the Registrant, other registered investment companies in the Vanguard complex, The Vanguard Group, Inc., and entities controlled by The Vanguard Group, Inc. that provide ongoing services to the Registrant. In making a determination, the Audit Committee considers whether the services are consistent with maintaining the principal accountant’s independence.
In the event of a contingency situation in which the principal accountant is needed to provide services in between scheduled Audit Committee meetings, the Chairman of the Audit Committee would be called on to consider and, if appropriate, pre-approve audit or permitted non-audit services in an amount sufficient to complete services through the next Audit Committee meeting, and to determine if such services would be consistent with maintaining the accountant’s independence. At the next scheduled Audit Committee meeting, services and fees would be presented to the Audit Committee for formal consideration, and, if appropriate, approval by the entire Audit Committee. The Audit Committee would again consider whether such services and fees are consistent with maintaining the principal accountant’s independence.
The Registrant’s Audit Committee is informed at least annually of all audit and non-audit services provided by the principal accountant to the Vanguard complex, whether such services are provided to: the Registrant, other registered investment companies in the Vanguard complex, The Vanguard Group, Inc., or other entities controlled by The Vanguard Group, Inc. that provide ongoing services to the Registrant.
(2) No percentage of the principal accountant’s fees or services were approved pursuant to the waiver provision of paragraph (c)(7)(i)(C) of Rule 2-01 of Regulation S-X.
(f) For the most recent fiscal year, over 50% of the hours worked under the principal accountant’s engagement were not performed by persons other than full-time, permanent employees of the principal accountant.
(g) Aggregate Non-Audit Fees.
Fiscal Year Ended November 30, 2021: $2,327,574
Fiscal Year Ended November 30, 2020: $362,168
Includes fees billed for non-audit services provided to the Registrant, other registered investment companies in the Vanguard complex, The Vanguard Group, Inc., and Vanguard Marketing Corporation.
(h) For the most recent fiscal year, the Audit Committee has determined that the provision of all non-audit services was consistent with maintaining the principal accountant’s independence.
Item 5: Audit Committee of Listed Registrants.
The Registrant is a listed issuer as defined in rule 10A-3 under the Securities Exchange Act of 1934 (“Exchange Act”). The Registrant has a separately-designated standing audit committee established in accordance with Section 3(a)(58)(A) of the Exchange Act. The Registrant’s audit committee members are: F. Joseph Loughrey, Mark Loughridge, Sarah Bloom Raskin, and Peter F. Volanakis.
Item 6: Investments.
Not applicable. The complete schedule of investments is included as part of the report to shareholders filed under Item 1 of this Form.
Item 7: Disclosure of Proxy Voting Policies and Procedures for Closed-End Management Investment Companies.
Not applicable.
Item 8: Portfolio Managers of Closed-End Management Investment Companies.
Not applicable.
Item 9: Purchase of Equity Securities by Closed-End Management Investment Company and Affiliated Purchasers.
Not applicable.
Item 10: Submission of Matters to a Vote of Security Holders.
Not applicable.
Item 11: Controls and Procedures.
(a) Disclosure Controls and Procedures. The Principal Executive and Financial Officers concluded that the Registrant’s Disclosure Controls and Procedures are effective based on their evaluation of the Disclosure Controls and Procedures as of a date within 90 days of the filing date of this report.
(b) Internal Control Over Financial Reporting. There were no significant changes in the Registrant’s Internal Control Over Financial Reporting or in other factors that could significantly affect this control subsequent to the date of the evaluation, including any corrective actions with regard to significant deficiencies and material weaknesses.
Item 12: Disclosure of Securities Lending Activities for Closed-End Management Investment Companies.
Not applicable.
Item 13: Exhibits.
| (a)(1) | Code of Ethics filed herewith. |
| (a)(2) | Certifications filed herewith. |
| (b) | Certifications field herewith. |
Pursuant to the requirements of the Securities Exchange Act of 1934 and the Investment Company Act of 1940, the registrant has duly caused this report to be signed on its behalf by the undersigned, thereunto duly authorized.
| VANGUARD WELLINGTON FUND | |||
| BY: | /s/ MORTIMER J. BUCKLEY* | ||
| MORTIMER J. BUCKLEY | |||
| CHIEF EXECUTIVE OFFICER |
Date: January 21, 2022
Pursuant to the requirements of the Securities Exchange Act of 1934 and the Investment Company Act of 1940, this report has been signed below by the following persons on behalf of the registrant and in the capacities and on the dates indicated.
| VANGUARD WELLINGTON FUND | |||
| BY: | /s/ MORTIMER J. BUCKLEY* | ||
| MORTIMER J. BUCKLEY | |||
| CHIEF EXECUTIVE OFFICER |
Date: January 21, 2022
| VANGUARD WELLINGTON FUND | |||
| BY: | /s/ CHRISTINE BUCHANAN* | ||
| CHRISTINE BUCHANAN | |||
| CHIEF FINANCIAL OFFICER |
Date: January 21, 2022
* By: /s/ Anne E. Robinson
Anne E. Robinson, pursuant to a Power of Attorney filed on November 29, 2021 (see File Number 33-64845), a Power of Attorney filed on October 12, 2021 (see File Number 33-23444), and a Power of Attorney filed on August 26, 2021 (see file Number 811-02652), Incorporated by Reference.