Table of Contents
Exhibit 99.1
MANAGEMENT’S DISCUSSION AND ANALYSIS
FOR THE YEAR ENDED DECEMBER 31, 2007

TABLE OF CONTENTS
Table of Contents
THE THOMSON CORPORATION
MANAGEMENT’S DISCUSSION AND ANALYSIS
| Page | ||||
| Overview | 1 | |||
| Use of Non-GAAP Financial Measures | 11 | |||
| Results of Operations | 12 | |||
| Liquidity and Capital Resources | 29 | |||
| Outlook | 40 | |||
| Related Party Transactions | 40 | |||
| Actual and Estimated Costs of Employee Future Benefits | 41 | |||
| Subsequent Events | 42 | |||
| Changes in Accounting Policies | 43 | |||
| Critical Accounting Policies | 45 | |||
| Recently Issued Accounting Standards | 48 | |||
| Additional Information | 49 | |||
| Reconciliations | 50 | |||
| Quarterly Information | 52 | |||
| Cautionary Note Concerning Factors That May Affect Future Results | 53 | |||
2
Table of Contents
The following management’s discussion and analysis is intended to assist you in understanding and evaluating changes in our financial condition and operations for the year ended December 31, 2007, compared to the preceding two fiscal years. We recommend that you read this management’s discussion and analysis in conjunction with our consolidated financial statements prepared in accordance with accounting principles generally accepted in Canada, or Canadian GAAP, and the related notes to those financial statements. All dollar amounts in this discussion are in U.S. dollars unless otherwise specified. References in this discussion to “$” are to U.S. dollars, references to “£” are to British pounds sterling and references to “C$” are to Canadian dollars. Unless otherwise indicated, references in this discussion to “we”, “our” and “us” are to The Thomson Corporation and its subsidiaries. In addition to historical information, this management’s discussion and analysis contains forward-looking statements. Readers are cautioned that these forward-looking statements are subject to risks and uncertainties that could cause our actual results to differ materially from those reflected in the forward-looking statements. These factors include those identified in the sections of this management’s discussion and analysis entitled “Cautionary Note Concerning Factors That May Affect Future Results” and in the “Risk Factors” section of our management information circular dated February 29, 2008 relating to our special meeting of shareholders to be held on March 26, 2008. These risk factors are also incorporated by reference in our annual information form for the year ended December 31, 2007, which is also contained in our annual report onForm 40-F for the year ended December 31, 2007. This management’s discussion and analysis is dated as of March 6, 2008.
OVERVIEW
Our Business and Strategy
What Thomson does —We are one of the world’s leading information services providers to business and professional customers. Our target customers are knowledge workers whose expertise in particular markets is critical to the success of economies throughout the world. As economies evolve and become more global, we believe that the needs of knowledge workers will continue to grow.
How Thomson makes money —We generate revenues by supplying knowledge workers with business-critical information solutions and services. We make our information more valuable by adding expert analysis, insight and commentary, and couple it with software tools and applications that our customers can use to search, compare, synthesize and communicate the information. To further enhance our customers’ workflows, we deliver information and services electronically, integrate our solutions with our customers’ own data and tailor the delivery of information to meet specific customer needs. As we integrate critical information with analysis, tools and applications, we place greater focus on the way our customers use our content, rather than simply on selling the content itself, and are moving from just informing our customers to enabling their decisions. We believe our ability to embed our solutions into customers’ workflows is a significant competitive advantage as it leads to strong customer retention. Over time, we believe that these attributes will translate into higher margins and better cash flow. Thus, our shift to workflow solutions is important to our growth and profitability.
Thomson’s business environment —As a global company, we are affected by economic and market dynamics, governmental regulations and business conditions for each market and country in which we operate. We have traditionally encountered competition in each of our markets from both large information providers and smaller niche market businesses. However, we now face an evolving competitive landscape. Certain of our traditional competitors are implementing solutions strategies of their own. In the future, other competitors could come from outside our traditional competitive set. For instance, Internet service companies and search providers could pose a threat to some of our businesses by providing more in-depth offerings than are currently available from such services. In response to this, we are continuing to move forward aggressively in segmenting our markets and developing solutions that will allow us to remain embedded in our customers’ workflows.
We strive for leadership positions in each market we serve in order to secure broad and deep market expertise. To maintain our leadership positions, we plan to continue to invest in our existing businesses and also to acquire new businesses. During the past few years, we have achieved efficiencies by leveraging resources within our various businesses, which has increased our profitability. We have had consistently strong cash flow generation, reflecting the strength of our businesses and the quality of our earnings, as well as contributions from operating efficiencies and improvements in our use of working capital.
1
Table of Contents
Thomson’s operational structure —In order to further execute our strategy, in 2006, we announced our intention to sell our Thomson Learning businesses, including those serving the higher education, careers, library reference, corporate e-learning and e-testing markets. We completed the sale of these businesses in 2007. Additionally, in May 2007, we announced our proposed acquisition of Reuters Group PLC, which is currently expected to close in April 2008. See the section entitled “Proposed Acquisition of Reuters Group PLC” for further discussion.
In January 2007, we realigned our operations into the following five business segments:
| • | Thomson Legal- a leading provider of critical information, decision support tools and services to legal, intellectual property, compliance, business and government professionals throughout the world. Major brands include Westlaw, Aranzadi, BAR/BRI, Carswell, Thomson CompuMark, Thomson Elite, FindLaw, LIVEDGAR and Sweet & Maxwell; | ||
| • | Thomson Financial- a leading provider of products and integration services to financial and technology professionals in the corporate, investment banking, institutional, wealth management and fixed income sectors of the global financial community. Our flagship brand is Thomson ONE. Other major businesses and brands include AutEx, Baseline, Datastream, First Call, I/B/E/S, Investext, IR Channel, SDC Platinum, StreetEvents, Thomson Transaction Services and TradeWeb; | ||
| • | Thomson Tax & Accounting- a leading provider of critical information, decision support tools and software applications for tax and accounting professionals in North America. Major brands include Checkpoint, Creative Solutions and RIA; | ||
| • | Thomson Scientific- a leading provider of critical information and decision support tools to researchers, scientists and information professionals in the academic, scientific, corporate and government marketplaces. Major businesses and information solutions include Derwent World Patents Index, MicroPatent, Thomson Pharma, Web of Science and ISI Web of Knowledge; and | ||
| • | Thomson Healthcare- a leading provider of critical information and decision support tools to physicians and other professionals in the healthcare, corporate and government marketplaces. Major businesses and information solutions include Medstat, Micromedex, PDR (Physicians’ Desk Reference) and Solucient. |
We also report financial results for a “Corporate and Other” reporting category, as well as discontinued operations. The Corporate and Other category principally includes corporate expenses, certain costs associated with our stock-related compensation, costs associated with our THOMSONplus business optimization program, which are discussed in the section entitled “THOMSONplus”, and costs associated with the Reuters acquisition.
Additionally, in the first quarter of 2007, we transferred our broker research operation from Thomson Legal to Thomson Financial. Results for all periods reflect this change.
2
Table of Contents
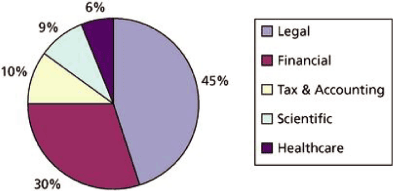
Percentage of Total 2007
Revenues
Revenues
The following table summarizes selected financial information for 2007, 2006 and 2005, including certain metrics that are non-GAAP financial measures. Please see the section below entitled “Use of Non-GAAP Financial Measures” for definitions of these terms and references to the reconciliations of these measures to the most directly comparable Canadian GAAP measures.
| Year ended December 31 | ||||||||||||
| (millions of U.S. dollars, except per share amounts) | 2007 | 2006 | 2005(3) | |||||||||
Consolidated Statement of Earnings Data: | ||||||||||||
| Revenues | 7,296 | 6,591 | 6,122 | |||||||||
Operating profit(1) | 1,297 | 1,248 | 1,159 | |||||||||
Earnings from continuing operations(1) | 1,096 | 912 | 652 | |||||||||
Earnings from discontinued operations, net of tax(1) | 2,908 | 208 | 282 | |||||||||
Net earnings(1) | 4,004 | 1,120 | 934 | |||||||||
Diluted earnings per common share from continuing operations(1) | $ | 1.69 | $ | 1.41 | $ | 0.99 | ||||||
Diluted earnings per common share(1) | $ | 6.20 | $ | 1.73 | $ | 1.42 | ||||||
Consolidated Balance Sheet Data: | ||||||||||||
| Cash and cash equivalents | 7,497 | 334 | 407 | |||||||||
| Total assets | 22,831 | 20,142 | 19,434 | |||||||||
| Total long-term liabilities | 6,021 | 5,922 | 6,364 | |||||||||
| Total shareholders’ equity | 13,571 | 10,481 | 9,963 | |||||||||
Dividend Data: | ||||||||||||
| Dividends per common share (US$) | $ | 0.98 | $ | 0.88 | $ | 0.79 | ||||||
| Dividends per Series II preferred share (C$) | C$ | 1.07 | C$ | 1.00 | C$ | 0.77 | ||||||
Other Data(2): | ||||||||||||
| Underlying operating profit | 1,492 | 1,308 | 1,159 | |||||||||
| Adjusted earnings from continuing operations | 1,089 | 857 | 677 | |||||||||
| Adjusted earnings per common share from continuing operations | $ | 1.69 | $ | 1.33 | $ | 1.03 | ||||||
| Net debt | (3,048 | ) | 3,741 | 3,646 | ||||||||
| Free cash flow | 1,066 | 1,440 | 1,194 | |||||||||
| (1) | Results are not directly comparable due to certain non-recurring or special items. For more information, please see the “Results of Operations” section of this management’s discussion and analysis. | |
| (2) | These are non-GAAP financial measures. Definitions are provided in the “Use of Non-GAAP Financial Measures” section of this management’s discussion and analysis. | |
| (3) | A full discussion of results for 2006 compared to 2005 is included in our management’s discussion and analysis for the year ended December 31, 2006. Significant trends and items affecting comparability over the three-year period are noted within this management’s discussion and analysis. |
3
Table of Contents
Proposed Acquisition of Reuters Group PLC
Overview.In May 2007, we agreed to acquire Reuters Group PLC (Reuters) by implementing a dual listed company (DLC) structure. The transaction is currently expected to close in April 2008.
Under the DLC structure, Thomson Reuters will have two parent companies, both of which will be publicly listed — The Thomson Corporation, an Ontario, Canada corporation, will be renamed Thomson Reuters Corporation, and Thomson Reuters PLC will be a new United Kingdom company in which existing Reuters shareholders will receive shares as part of their consideration in the transaction. Those companies will operate as a unified group pursuant to contractual arrangements as well as provisions in their organizational documents. Under the DLC structure, shareholders of Thomson Reuters Corporation and Thomson Reuters PLC will both have a stake in Thomson Reuters, with cash dividend, capital distribution and voting rights that are comparable to the rights they would have if they were holding shares in one company carrying on the Thomson Reuters business. The boards of the two parent companies will comprise the same individuals, as will the companies’ executive management teams. The transaction has been cleared by antitrust regulators in Europe, the United States and Canada, and the only significant conditions to close that remain are shareholder and court approvals.
Consideration.As consideration for the proposed transaction, Reuters shareholders will be entitled to receive, for each Reuters ordinary share held, 352.5 pence in cash and 0.16 Thomson Reuters PLC ordinary shares. To effect the transaction, Reuters will be indirectly acquired by Thomson Reuters PLC pursuant to a scheme of arrangement. On closing, one Thomson Reuters PLC ordinary share will be equivalent to one Thomson Reuters Corporation common share under the DLC structure. Thomson shareholders will continue to own their existing common shares. Based on the closing Thomson share price and the applicable $/£ exchange rate on May 14, 2007, which was the day before our company and Reuters announced our agreement, each Reuters share was valued at approximately 691 pence per share. As of February 22, 2008, we estimate that, based on the shares outstanding, Reuters shareholders will receive about 202 million Thomson Reuters PLC shares. For this purpose, we have assumed that all outstanding Reuters in-the-money stock options and other share-based awards granted by Reuters have vested or been exercised and subsequently converted into Reuters shares prior to the closing. The consideration that is required to be issued to Reuters shareholders will depend on the actual number of Reuters shares outstanding when the acquisition closes. To fund the cash consideration, we plan to use proceeds from the sales of the Thomson Learning businesses as well as borrowings under a credit facility. Based on the exchange rate of $/£ on February 22, 2008, this funding would be approximately $8.8 billion. Please see the “Hedging Program for Reuters Consideration” section of this management’s discussion and analysis regarding our hedging program related to $/£ currency exchange rate fluctuations. The Thomson Learning sales are discussed in the “Discontinued Operations” section and Thomson’s credit facilities are discussed in the “Liquidity and Capital Resources” section of this management’s discussion and analysis.
Ownership.Based on the issued share capital of each of Thomson and Reuters (on a fully diluted basis) as of February 22, 2008, The Woodbridge Company Limited and other companies affiliated with it (Woodbridge) will have an economic and voting interest in Thomson Reuters of approximately 53%, other Thomson shareholders will have an interest of approximately 23% and Reuters shareholders will have an interest of approximately 24%. As of March 6, 2008, Woodbridge and other companies affiliated with it beneficially owned approximately 70% of our company’s common shares. More information about Woodbridge is provided in the “Related Party Transactions” section of this management’s discussion and analysis.
4
Table of Contents
Synergies.The boards of our company and Reuters believe that there is a natural fit and compelling logic in creating a global leader in electronic information services, trading systems and news. While the principal reason for the transaction is to expand growth opportunities, we also anticipate that the transaction will generate synergies at an annual run rate in excess of $500 million by the end of the third year after closing from shared technology platforms, distribution, third party content and corporate services.
Antitrust/Regulatory review process.On February 19, 2008, we and Reuters received antitrust clearances from the U.S. Department of Justice, the European Commission and the Canadian Competition Bureau. See the section of this management’s discussion and analysis entitled “Subsequent Events”.
Shareholder approvals.We and Reuters have submitted the proposed transaction to our respective shareholders for approval and applied for requisite court approvals in Ontario, Canada and England. Special shareholder meetings for our company and Reuters are each scheduled for March 26, 2008 to approve the transaction. Our board of directors has unanimously approved the transaction and has unanimously recommended that our shareholders vote in favor of it. Woodbridge has irrevocably committed to vote in favor of the transaction. The Reuters board of directors has unanimously approved the transaction and is also unanimously recommending that Reuters shareholders vote in favor of it.
Information regarding Reuters.Reuters is incorporated in England and Wales and is listed on the London Stock Exchange and on NASDAQ. Reuters principal executive office is located at The Reuters Building, South Colonnade, Canary Wharf, London, E14 5EP, England. It is one of the world’s largest providers of financial information, trading room software and news. Through its divisions in sales and trading, enterprise, research and asset management and media, Reuters provides a range of products including:
| • | advanced desktop financial information products, analytics and trading systems designed for use by traders and salespeople; | ||
| • | information feeds and tools designed for use by machines to help customers automate their businesses; | ||
| • | in-depth information, analysis and research products designed mainly for use by people making investment decisions; and | ||
| • | news for use by professional publishers, multimedia websites and mobile information services for use by individual consumers. |
Further information regarding Reuters can be found in our management information circular dated February 29, 2008 relating to our special meeting of shareholders to be held on March 26, 2008, which we refer to in this management’s discussion and analysis as the Special Meeting Circular. The Special Meeting Circular was filed with the Canadian securities regulatory authorities and furnished to the Securities and Exchange Commission on Form 6-K on February 29, 2008. A copy of the circular is also available on our website.
We make no representation or warranty as to the accuracy or completeness of information disclosed by Reuters, information published by Reuters on its website or in any other format, information about Reuters obtained from any other source or the information provided above.
Risk factors.Certain risks and uncertainties related to the proposed acquisition and to Thomson and Reuters are described in the section of this management’s discussion and analysis entitled “Cautionary Note Concerning Factors That May Affect Future Results” as well as in the “Risk Factors” section of the Special Meeting Circular.
5
Table of Contents
Revenues
The following graphs show the percentage of our 2007 revenues by media, type and geography.
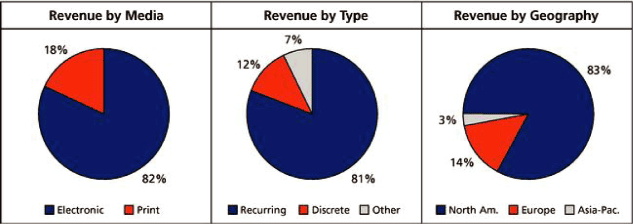
Our revenues are derived from a diverse customer base. In 2007, 2006 and 2005, no single customer accounted for more than 3% of our total revenues.
By media.We use a variety of media to deliver our products and services to customers. Increasingly, our customers are seeking products and services delivered electronically and are migrating away from print-based products. We deliver information electronically over the Internet, through dedicated transmission lines, CDs and handheld wireless devices. In 2007, electronic, software and services revenues represented 82% of our total revenues compared to 81% in 2006 and 80% in 2005. The increase in these electronic, software and services revenues in 2007 compared to 2006 was due to the continued growth of our online offerings, particularly in our legal segment. We anticipate that with the acquisition of Reuters, this percentage will increase in 2008 given that a significant portion of its revenues is derived from these media. In the long term, we expect that electronic, software and services as a percentage of our total revenues will continue to gradually increase as we continue to emphasize electronic delivery, add more solution-based and software-based acquisitions to our portfolio, and as markets outside North America continue to incorporate technology into their workflows. Electronic delivery of our products and services improves our ability to more rapidly and profitably provide additional products and services to our existing customers and to access new customers around the world.
By type.In 2007, 81% of our revenues were generated from subscription or similar contractual arrangements, which we refer to as recurring revenues. This was a slight decline from 2006 (83%) and 2005 (83%). Subscription revenues are from sales of products and services that are delivered under a contract over a period of time. Our subscription arrangements are most often for a term of one year, though increasingly they are for three year terms, after which they automatically renew or are renewable at the customer’s option. The renewal dates are spread over the course of the year. Because a high proportion of our revenues comes from subscriptions and similar arrangements where our customers contract with us for a period of time, our revenue patterns are generally more stable compared to other business models that sell products in discrete or one-off arrangements. In the case of some of our subscription arrangements, we realize additional fees based upon usage. Following the acquisition of Reuters, we expect that our percentage of recurring revenues will increase in 2008 as a significant portion of Reuters revenues is from subscriptions or similar contractual arrangements.
By geography.We segment our revenues geographically by origin of sale in our financial statements. In 2007, 83% of our revenues were generated from our operations in North America, consistent with 2006 (84%) and 2005 (84%). In 2008, following the acquisition of Reuters, we anticipate that this percentage will decrease as Reuters operations are more geographically diverse than our existing operations. In the long term, we are striving to increase our revenues from outside North America as a percentage of our overall revenues. We can modify and offer internationally many of the products and services we have developed originally for customers in North America
6
Table of Contents
without excessive customization or translation. This represents an opportunity for us to earn incremental revenues. For some of the products and services we sell internationally, we incur additional costs to customize our products and services for the local market and this can result in lower margins if we cannot achieve adequate scale. Development of additional products and services and expansion into new geographic markets are integral parts of our growth strategy. While development and expansion present an element of risk, particularly in foreign countries where local knowledge of our products may be lacking, we believe that the quality and brand recognition of our products and services help to mitigate that risk.
We routinely update a number of our key products and services by adding functionality or providing additional services to our existing offerings to make them more valuable and attractive to our customers and, thereby, increase our revenues from existing customers. Because of the dynamic nature of our products and services, management does not find it useful to analyze large portions of our revenue base using traditional price versus volume measurements. As it is difficult to assess our revenue changes from a pure price versus volume standpoint when products are continually evolving, we limit these measurements to our analysis of more static products and service offerings.
Expenses
As an information provider, our most significant expense is labor. Our labor costs include all costs related to our employees, including salaries, bonuses, commissions, benefits, payroll taxes and stock-related compensation. Labor represented approximately 67% of our cost of sales, selling, marketing, general and administrative expenses (operating costs) in 2007 compared to approximately 66% in 2006 and 65% in 2005. No other category of expenses accounted for more than 15% of our operating costs in 2007, 2006 or 2005.
Acquisitions
Acquisitions play a key role in fulfilling our strategy. Our acquisitions are generally tactical in nature and primarily relate to the purchase of information, products or services that we integrate into our operations to broaden the range of our product and service offerings to better serve our customers. As alternatives to the development of new products and services, tactical acquisitions often have the advantages of faster integration into our product and service offerings and cost efficiencies. When integrating acquired businesses, we focus on eliminating cost redundancies and combining the acquired products and services with our existing offerings. We may incur costs, such as severance payments to terminate employees and contract cancellation fees, when we integrate businesses. In 2007, acquired businesses generated approximately one quarter of our total growth in revenues and a lesser portion of the growth in operating profit. Generally, the businesses that we acquired have initially had lower margins than our existing businesses.
The following table sets forth information about closed acquisitions in the periods presented.
| Aggregate Cost | ||||||||
| Year Ended December 31, | Number | ($ in millions) | ||||||
| 2007 | 33 | 488 | ||||||
| 2006 | 25 | 744 | ||||||
| 2005 | 28 | 246 | ||||||
7
Table of Contents
Our largest acquisitions during the years ended December 31, 2007, 2006 and 2005 were:
| • | 2007- Deloitte Tax LLP Property Tax Services, a provider of property tax outsourcing and compliance services; CrossBorder Solutions, a provider of tax software; and Prous Science, a provider of life sciences information solutions; | ||
| • | 2006- Solucient, LLC, a provider of data and advanced analytics to hospitals and health systems; Quantitative Analytics, Inc., a provider of financial database integration and analysis solutions; and LiveNote Technologies, a provider of transcript and evidence management software to litigators and court reporters; and | ||
| • | 2005- Global Securities Information (GSI), a provider of online securities and securities-related information and research services. |
Dispositions
As part of our continuing strategy to optimize our portfolio of businesses, to sharpen our strategic focus on providing electronic workflow solutions to business and professional markets and to ensure that we are investing in the parts of our business that offer the greatest opportunities to achieve higher growth and returns, management decided to sell the businesses discussed below. Results for these businesses were classified as discontinued operations within the consolidated financial statements for all periods presented. None of these businesses was considered fundamental to our current integrated information offerings.
Pending
As of December 31, 2007, our only pending disposition was PLM, a provider of drug and therapeutic information in Latin America, which was approved for sale in March 2007.
Completed
In 2007, we completed the sale of Thomson Learning through three independent processes:
| • | In July 2007, we sold Thomson Learning’s higher education, careers and library reference businesses to funds advised by Apax Partners and OMERS Capital Partners. As a result of the sale, we received gross proceeds of approximately $7.6 billion. | ||
| • | In May 2007, we sold NETg, a leading provider of continuing corporate education and training, to SkillSoft PLC for approximately $270 million. | ||
| • | In October 2007, we sold Prometric, a provider of assessment services, to ETS for $310 million in cash and a 6% promissory note for approximately $79 million due in 2014. The principal amount of the note, which was previously reported as $125 million, was adjusted to $79 million reflecting adjustments made based on the continuity of offerings from certain customer contracts. The promissory note was reflected in our financial statements at its estimated fair value of $60 million to account for the difference between the market and stated rates of interest. The principal amount of the note is subject to further adjustment based on certain contingencies. |
8
Table of Contents
The following table describes certain other dispositions that we closed during 2007 and 2006. Other than certain minor investments, there were no other dispositions in 2005.
| Business | Segment | Closed | ||
| GEE — a regulatory information business in the United Kingdom | Legal | December 2007 | ||
| New England Institutional Review Board — an ethical review board that monitors clinical research involving human subjects | Healthcare | December 2007 | ||
| CenterWatch — a provider of clinical research information | Healthcare | December 2007 | ||
| Fakta — a Swedish regulatory information business | Legal | November 2007 | ||
| NewsEdge — a provider of business information and news | Legal | July 2007 | ||
| Market Research — a provider of business information and news | Legal | May 2007 | ||
| IOB — a regulatory information business in Brazil | Legal | June 2007 | ||
| Thomson Medical Education — a provider of medical education | Healthcare | April 2007 | ||
| North American operations of Thomson Education Direct, a consumer-based distance learning career school | Learning | March 2007 | ||
| American Health Consultants — a medical newsletter publisher and medical education provider | Healthcare | August 2006 | ||
| K.G. Saur — a German publisher of biographical and bibliographical reference titles serving the library and academic communities | Learning | August 2006 | ||
| Peterson’s — a publisher of college preparatory guides | Learning | July 2006 | ||
| Lawpoint — an Australian provider of print/online regulatory information services | Legal | June 2006 | ||
| Law Manager — a software and services provider | Legal | April 2006 | ||
Our proceeds from the sales of discontinued operations, net of taxes paid, were $7 billion in 2007 and $81 million in 2006. In 2005, we paid $105 million in taxes associated with discontinued operations sold in a prior year.
Additionally, over the past few years we have sold certain minority equity investments and businesses that did not qualify as discontinued operations. Proceeds from these sales amounted to $18 million in 2007, $88 million in 2006 and $4 million in 2005.
THOMSONplus
THOMSONplusis a series of initiatives, announced in 2006, which will allow us to become a more integrated operating company by leveraging assets and infrastructure across all segments of our business. The program is expected to produce cost savings for our businesses by:
9
Table of Contents
| • | Realigning our business units into five segments; | ||
| • | Streamlining and consolidating certain functions such as finance, accounting and business systems; | ||
| • | Leveraging infrastructure and technology for customer contact centers; | ||
| • | Establishing low-cost shared service centers; | ||
| • | Consolidating certain technology infrastructure operations such as voice and data networks, data centers, storage and desktop support; and | ||
| • | Re-engineering certain product development and production functions and realigning particular sales forces within our business segments. |
To accomplish these initiatives, we had previously reported that we expected to incur approximately $250 million of expenses from inception through 2009 primarily related to technology and restructuring costs and consulting services. Because THOMSONplusis a series of initiatives, it was noted that the timing of these costs and savings may shift between different calendar years. While our overall estimates of costs and savings for the program remain unchanged, we now expect to complete the program and reach our savings targets earlier than originally estimated. As a result, we have accelerated spending that was initially planned for future years into 2007. Currently, we expect to incur expenses of approximately $30 million in 2008. We do not expect to incur expenses in 2009 as was originally reported.
In 2007, we incurred $153 million of expenses associated with THOMSONplusconsisting primarily of consulting fees, severance costs and charges associated with the restructuring of Thomson Legal’s North American sales force. The consulting costs primarily related to our efforts to deploy SAP as our company-wide ERP system, which will continue into 2008, as well as efforts to improve the customer service infrastructure. The severance costs principally related to the elimination of certain finance positions in conjunction with the establishment of centralized service centers, efforts to streamline the operations of Thomson Financial and the restructuring of Thomson Legal’s North American sales force.
In 2006, we incurred $60 million of expenses consisting primarily of consulting fees and severance costs. The consulting costs primarily related to our efforts to deploy SAP. Additionally, we incurred $9 million of expenses associated with businesses that were reclassified to discontinued operations in 2006. These expenses consisted of severance costs and losses on vacated leased properties.
THOMSONplusprogram initiatives have generated an annualized cost reduction of approximately $120 million primarily due to the elimination of certain positions and the relocation of others to lower cost locations, including those resulting from our establishment of a facility in Hyderabad, India to perform certain finance functions. We expect to reach a savings rate of $160 million per year by the middle of 2008, which is $10 million above our previously stated targeted savings rate of $150 million per year. These savings will largely be driven by improved efficiencies and effectiveness of procurement, supply chain management, financial reporting systems, including the implementation of a common ERP system, the consolidation of common back office financial processes into regional and global shared service centers and the integration of platforms across all of our segments. Our anticipated savings from THOMSONplusare in addition to the synergies that we anticipate from the proposed Reuters acquisition.
Because THOMSONplusis a corporate program, expenses associated with it are reported within the Corporate and Other segment. Restructuring activities represented approximately $91 million of the expense for 2007. The liabilities associated with these restructuring activities were not material as of December 31, 2007 and 2006.
10
Table of Contents
Seasonality
Historically, our revenues and operating profits from continuing operations have been proportionately the smallest in the first quarter and the largest in the fourth quarter, as certain product releases are concentrated at the end of the year, particularly in the regulatory and healthcare markets. As costs continue to be incurred more evenly throughout the year, our operating margins have historically increased as the year progresses. For these reasons, the performance of our businesses may not be comparable quarter to consecutive quarter and should be considered on the basis of results for the whole year or by comparing results in a quarter with the results in the same quarter for the previous year. As Reuters revenues have not historically fluctuated significantly throughout the year, we anticipate that, upon completion of this acquisition, the seasonality of Thomson Reuters revenues will be slightly less pronounced.
USE OF NON-GAAP FINANCIAL MEASURES
In addition to our results reported in accordance with Canadian GAAP, we use non-GAAP financial measures as supplemental indicators of our operating performance and financial position. We use these non-GAAP financial measures internally for comparing actual results from one period to another, as well as for future planning purposes. We have historically reported non-GAAP financial results, as we believe their use provides more insight into our performance. The following discussion defines the measures that we currently use and explains why we believe they are useful measures of our performance, including our ability to generate cash flow:
| • | Underlying operating profit and underlying operating profit margin.We measure our operating profit to adjust for costs associated with our corporate efficiency initiatives and other items affecting comparability, which we refer to as underlying operating profit. We refer to underlying operating profit as a percentage of revenues as the underlying operating profit margin. We use these measures to assist in comparisons from one period to another as they remove the impact of items which distort the performance of our operations. See the reconciliation of this measure to the most directly comparable Canadian GAAP measure in the “Results of Operations” section of this management’s discussion and analysis. | ||
| • | Adjusted earnings and adjusted earnings per common share from continuing operations. We measure our earnings attributable to common shares and per share amounts to adjust for non-recurring items, discontinued operations and other items affecting comparability, which we refer to as adjusted earnings from continuing operations and adjusted earnings per common share from continuing operations. We use these measures to assist in comparisons from one period to another. Adjusted earnings per common share from continuing operations do not represent actual earnings per share attributable to shareholders. | ||
| In interim periods, we adjust our reported earnings and earnings per common share to reflect a normalized effective tax rate. Specifically, the normalized effective rate is computed as the estimated full-year effective tax rate applied to the consolidated pre-tax income of the interim period. The reported effective tax rate is based on separate annual effective income tax rates for each taxing jurisdiction that are applied to each interim period’s pre-tax income. Because the seasonality of our businesses impacts our geographical mix of profits in interim periods and therefore distorts the reported effective tax rate, we believe that using the expected full-year effective tax rate provides a more meaningful comparison among interim periods. The adjustment to normalize the effective tax rate reallocates estimated full-year income taxes between interim periods, but has no effect on full year income taxes or on cash taxes paid. | |||
| See the reconciliation of this measure to the most directly comparable Canadian GAAP measure in the “Results of Operations” section of this management’s discussion and analysis. | |||
| • | Net debt.We measure our net debt, which we define as our total indebtedness, including associated fair value hedging instruments (swaps) on our debt, less cash and cash equivalents. Given that we hedge some of our debt to reduce risk, we include hedging |
11
Table of Contents
| instruments as we believe it provides a better measure of the total obligation associated with our outstanding debt. However, because we generally intend to hold our debt and related hedges to maturity, we do not consider the associated fair market value of cash flow hedges in our measurements. We reduce gross indebtedness by cash and cash equivalents on the basis that they could be used to pay down debt. See the reconciliation of this measure to the most directly comparable Canadian GAAP measure in the “Liquidity and Capital Resources” section of this management’s discussion and analysis. | |||
| • | Free cash flow.We evaluate our operating performance based on free cash flow, which we define as net cash provided by operating activities less capital expenditures, other investing activities and dividends paid on our preference shares. We use free cash flow as a performance measure because it represents cash available to repay debt, pay common dividends and fund new acquisitions. See the reconciliation of this measure to the most directly comparable Canadian GAAP measure in the “Liquidity and Capital Resources” section of this management’s discussion and analysis. |
These and related measures do not have any standardized meaning prescribed by Canadian GAAP and, therefore, are unlikely to be comparable with the calculation of similar measures used by other companies. You should not view these measures as alternatives to net earnings, total debt, cash flow from operations or other measures of financial performance calculated in accordance with GAAP. We encourage you to review the reconciliations of these non-GAAP financial measures to the most directly comparable Canadian GAAP measure within this management’s discussion and analysis.
While in accordance with Canadian GAAP, our definition of segment operating profit may not be comparable to that of other companies. We define segment operating profit as operating profit before the amortization of identifiable intangible assets. We use this measure for our segments because we do not consider amortization to be a controllable operating cost for purposes of assessing the current performance of our segments. We also use segment operating profit margin, which we define as segment operating profit as a percentage of revenues.
We report depreciation for each of our segments within the section entitled “Additional Information.”
RESULTS OF OPERATIONS
The following discussion compares our results for the fiscal years ended December 31, 2007, 2006 and 2005 and for the three-month periods ended December 31, 2007 and 2006, and provides analyses of results from continuing operations and discontinued operations.
Basis of Analysis
Our results from continuing operations include the performance of acquired businesses from the date of their purchase and exclude results from operations classified as discontinued. Results from operations that qualify as discontinued operations have been reclassified to that category for all periods presented. Please see the section below entitled “Discontinued Operations” for a discussion of these operations. In analyzing the results of our operating segments, we measure the performance of existing businesses and the impact of acquired businesses and foreign currency translation.
12
Table of Contents
The following table summarizes our consolidated results for the years indicated.
| Year ended December 31 | ||||||||||||
| (millions of U.S. dollars, except per share amounts) | 2007 | 2006 | 2005 | |||||||||
| Revenues | 7,296 | 6,591 | 6,122 | |||||||||
Operating profit(1) | 1,297 | 1,248 | 1,159 | |||||||||
Operating profit margin(1) | 17.8 | % | 18.9 | % | 18.9 | % | ||||||
Net earnings(1) | 4,004 | 1,120 | 934 | |||||||||
Diluted earnings per common shares(1) | $ | 6.20 | $ | 1.73 | $ | 1.42 | ||||||
| (1) | Results are not directly comparable due to certain non-recurring or special items. |
| Revenues. | In 2007, revenues increased 11% comprised of the following: |
| • | 6% from higher revenues of existing businesses; | ||
| • | 3% from contributions of newly acquired businesses; and | ||
| • | 2% from foreign currency translation. |
For our existing businesses, revenue growth was exhibited in almost all of our segments, reflecting customer demand for our integrated solutions, particularly in the legal and tax and accounting markets, and overall growth in these markets. Contributions from acquired businesses were primarily related to Solucient in our Thomson Healthcare segment, as well as CrossBorder Solutions and the Deloitte Tax LLP Property Tax Services business in our Thomson Tax & Accounting segment.
Revenues in 2006 grew 8% comprised of contributions from acquired businesses and growth from existing businesses, as foreign currency translation had a minimal impact. Contributions from acquired businesses were primarily related to Quantitative Analytics, Inc. and AFX News in our Thomson Financial segment and Solucient and MercuryMD in our Thomson Healthcare segment.
Operating profit.In 2007, operating profit increased 4% primarily due to the increase in revenues. Our results also reflected a nonrecurring gain of $34 million associated with the settlement of a pension plan. Our operating profit margin decreased compared to the prior year as higher expenses resulting from costs associated with the Reuters acquisition and the timing of spending related to our THOMSONplusprogram more than offset the effects of scale and efficiency initiatives. See the section entitled “THOMSONplus” for a discussion of the program’s initiatives and our associated costs.
13
Table of Contents
The following table presents a summary of our operating profit and operating profit margin after adjusting for THOMSONpluscosts and other items affecting comparability in each year.
| Year ended December 31 | ||||||||||||
| (millions of U.S. dollars, except per share amounts) | 2007 | 2006 | 2005 | |||||||||
| Operating profit | 1,297 | 1,248 | 1,159 | |||||||||
| Adjustments: | ||||||||||||
THOMSONpluscosts | 153 | 60 | — | |||||||||
| Reuters transaction costs | 76 | — | — | |||||||||
| Settlement of pension plan | (34 | ) | — | — | ||||||||
| Underlying operating profit | 1,492 | 1,308 | 1,159 | |||||||||
Underlying operating profit margin | 20.4 | % | 19.8 | % | 18.9 | % | ||||||
In 2007, underlying operating profit increased 14% as a result of higher revenues. The underlying operating profit margin increased compared to the prior year due to the effects of scale and efficiency initiatives, as well as savings attributable to certain spending which was deferred due to the pending Reuters acquisition.
In 2006, operating profit rose 8% primarily due to the increase in revenues. The operating profit margin remained constant as compared to the prior year as the effects of scale were offset by higher corporate costs resulting from our THOMSONplusprogram, increased pension and other defined benefit plans expense and higher stock-related compensation expense.
Excluding the impact of costs associated with the THOMSONplusprogram, underlying operating profit increased 13% due to the increase in revenues and the underlying operating margin rose as a result of the effects of scale.
Depreciation and amortization.Depreciation expense increased 7% in 2007 compared to the prior year. This increase reflected recent acquisitions and capital expenditures. Amortization expense increased 7% in 2007 compared to the prior year. This increase reflected the amortization of newly acquired assets, which more than offset the impact from the completion of amortization for certain intangible assets acquired in previous years.
Depreciation in 2006 increased 6% compared to 2005. This increase reflected recent acquisitions and capital expenditures. Amortization increased 2% compared to 2005, as increases due to the amortization of newly acquired assets were partially offset by decreases arising from the completion of amortization for certain intangible assets acquired in previous years.
Net other income/expense.Net other expense in 2007 of $34 million primarily reflected the change in fair value of sterling call options, which were acquired in the third quarter of 2007 as part of a hedging program to mitigate exposure to changes in the $/£ exchange rate resulting from the Reuters acquisition. See the section entitled “Hedging Program for Reuters Consideration” for further discussion. The change in fair value of these options was partially offset by earnings from, and gains on the sales of, equity investments.
Net other income in 2006 of $1 million primarily consisted of gains on the sales of certain equity investments offset by a $36 million charge for a legal reserve representing our portion of a cash settlement related to theRodriguez v. West Publishing Corp. and Kaplan Inc.case.
Net other expense in 2005 was $28 million, which primarily represented a loss associated with the early redemption of certain debt securities of $23 million and a charge of $15 million to reduce the carrying value of one of our equity investments to its fair value, partially offset by income from equity investments and gains from the sale of certain other investments.
14
Table of Contents
Net interest income/expense and other financing costs.In 2007, net interest expense and other financing costs of $12 million reflected $203 million of interest income from the investment of the proceeds from the sale of Thomson Learning’s higher education, careers and library reference businesses in money market funds. Excluding this interest income, net interest expense approximated that of the prior year.
In 2006, our net interest expense and other financing costs approximated that of 2005.
Income taxes.Our income tax expense in 2007 represented 12.4% of our earnings from continuing operations before income taxes. This compares with effective rates of 11.3% in 2006 and 28.4% in 2005. Our effective income tax rate is lower than the Canadian corporate income tax rate of 35.4% in 2007 (35.4% in 2006 and 36.0% in 2005), principally due to the lower tax rates and differing tax rules applicable to certain of our operating and financing subsidiaries outside Canada. Specifically, while we generate revenues in numerous jurisdictions, our tax provision on earnings is computed after taking account of intercompany interest and other charges among our subsidiaries resulting from their capital structure and from the various jurisdictions in which operations, technology and content assets are owned. Our income tax expense was further impacted by certain non-recurring or special items and the accounting for discontinued operations in 2007, 2006 and 2005 as described below.
| • | In 2007, our provision included benefits of $60 million resulting primarily from the recognition of Canadian tax losses, but also reflecting a change in Australian tax law. These benefits reduced our 2007 effective tax rate by approximately 5%. The Canadian tax losses were recognized in anticipation of using them against taxable income from the sale of Thomson Learning’s Canadian education operations, which was completed in July 2007. | ||
| • | In 2006, we increased valuation allowances against deferred tax assets which increased our tax rate by 4%. The net change in the valuation allowance included benefits associated with our Thomson Learning segment which, under the requirements of discontinued operations accounting, were not allowed to be reclassified to discontinued operations along with the other results for the business. The impact of including the benefits related to the Thomson Learning segment in our continuing operations tax charge reduced our effective tax rate by 3% in 2006, and 2% in 2005. | ||
| • | In 2005, we released $98 million of contingent income tax liabilities based upon the outcome of certain tax audits of prior year periods. Additionally, we repatriated a substantial portion of certain of our subsidiaries’ accumulated profits. The repatriation was related to the recapitalization of these subsidiaries, which was effected through intercompany financing arrangements. We incurred a non-recurring tax charge of $125 million in connection with this repatriation, which reduced our cash flow from operations and our net earnings in the fourth quarter by the same amount. The net effect of both of these non-recurring or special tax items was a $27 million increase in the tax provision for the full year of 2005. |
The balance of our deferred tax assets at December 31, 2007 was $1,439 million compared to $1,346 million at December 31, 2006. Our deferred tax assets consist primarily of tax losses and other credit carryforwards, the majority of which can only be utilized against taxable income in Canada. In assessing the likelihood of using our deferred tax assets, we first offset them against deferred tax liabilities which do not relate to indefinite lived intangible assets. We establish valuation allowances for any remaining deferred tax assets that we do not expect to be able to use against such deferred tax liabilities or future taxable income. Our valuation allowance against our deferred tax assets at December 31, 2007 was $395 million compared to $441 million at December 31, 2006. The net movement in the valuation allowance from 2006 to 2007 primarily related to increases in deferred tax liabilities from the revaluation of debt and currency swaps, which would be offset by a corresponding decrease in the valuation allowance, and increases due to additional Canadian losses recorded that we do not anticipate using because we expect to continue to incur losses in Canada.
15
Table of Contents
We expect to consummate our acquisition of Reuters in April 2008 and, at this time, we are unable to forecast our 2008 effective tax rate. However, we expect our businesses to continue with initiatives to consolidate the ownership of their technology platforms and content, and we expect that a proportion of our profits will continue to be taxed at lower rates than the Canadian statutory tax rate. Additionally, our effective tax rate and our cash tax cost in the future will depend on the laws of numerous countries and the provisions of multiple income tax conventions between various countries in which we operate. Our ability to maintain a low effective tax rate will be dependent upon such laws and conventions remaining unchanged, as well as the geographic mix of our profits.
See the section entitled “Contingencies” for further discussion of income tax liabilities.
Earnings attributable to common shares and earnings per common share.Earnings attributable to common shares were $3,998 million in 2007 compared to $1,115 million in 2006. Diluted earnings per common share were $6.20 in 2007 compared to $1.73 in 2006. The significant increases in reported earnings and earnings per common share were primarily the result of the gain on the sales of the Thomson Learning businesses.
Earnings attributable to common shares were $1,115 million in 2006 compared to $930 million in 2005. Earnings per common share were $1.73 in 2006 compared to $1.42 in 2005. The increases in reported earnings and earnings per common share were the result of higher operating profit and lower tax expense due to the recapitalization of certain subsidiaries in the fourth quarter of 2005 and certain non-recurring or special items in 2005.
The results for each of these periods are not directly comparable because of certain non-recurring or special items, as well as the variability in discontinued operations due to the timing of dispositions. The following table presents a summary of our earnings and earnings per common share from continuing operations for the periods indicated, after adjusting for items affecting comparability in each year.
| Year ended December 31 | ||||||||||||
| (millions of U.S. dollars, except per common share amounts) | 2007 | 2006 | 2005 | |||||||||
| Earnings attributable to common shares | 3,998 | 1,115 | 930 | |||||||||
| Adjustments for non-recurring or special items: | ||||||||||||
| Net other expense (income) | 34 | (1 | ) | 28 | ||||||||
| Reuters transaction costs | 76 | — | — | |||||||||
| Gain on settlement of pension plan | (34 | ) | — | — | ||||||||
| Tax on above items | (17 | ) | (16 | ) | (4 | ) | ||||||
| Tax (benefits) charges | (60 | ) | (33 | ) | 5 | |||||||
| Discontinued operations | (2,908 | ) | (208 | ) | (282 | ) | ||||||
| Adjusted earnings from continuing operations | 1,089 | 857 | 677 | |||||||||
| Adjusted earnings per common share from continuing operations | $ | 1.69 | $ | 1.33 | $ | 1.03 | ||||||
Our adjusted earnings from continuing operations for 2007 increased 27% compared to 2006 largely as a result of interest income from the investment of the proceeds from the sale of Thomson Learning’s higher education, careers and library reference businesses and higher operating profit stemming from higher revenues. These more than offset higher costs associated with THOMSONplus.
Our adjusted earnings from continuing operations for 2006 increased 27% compared to 2005 largely as a result of higher operating profit from higher revenues and a lower effective tax rate, which more than offset costs associated with THOMSONplusas well as higher pension and other benefit plans expense and higher stock-related compensation expense.
16
Table of Contents
Operating Results by Business Segment
Thomson Legal
| Year ended December 31 | ||||||||||||
| (millions of U.S. dollars) | 2007 | 2006 | 2005 | |||||||||
| Revenues | 3,318 | 3,008 | 2,795 | |||||||||
| Segment operating profit | 1,044 | 943 | 849 | |||||||||
Segment operating profit margin | 31.5 | % | 31.3 | % | 30.4 | % | ||||||
Year Ended December 31, 2007 Compared to Year Ended December 31, 2006
Results for Thomson Legal reflected continued demand for our online services in the United States, United Kingdom and other international markets. Revenues increased 10% comprised of the following:
| • | 7% from higher revenues of existing businesses; | ||
| • | 1% from contributions of newly acquired businesses; and | ||
| • | 2% from foreign currency translation. |
Growth within our existing businesses reflected the strong performance of online services, consisting primarily of Westlaw and our international online services, which increased 10% over the prior year. Revenue from sales of software and services increased 12% as a result of higher new sales of website design and hosting services. Additionally, revenues from print and CD products increased slightly compared to the prior year as higher print revenues offset a decline in CD product revenues as customers continued to migrate to Thomson Legal’s online offerings. Contributions from acquired businesses reflected the results from Baker Robbins, a provider of technology and information management consulting to law firms and law departments, acquired in January 2007, and LiveNote Technologies, a provider of transcript and evidence management software that brings new functionality to Westlaw Litigator, which is our integrated litigation platform, acquired in September 2006.
Within our North American legal businesses, revenues increased primarily due to higher online and services revenues. Westlaw revenue experienced growth in all of its major market segments: law firm, corporate, government and academic, primarily due to new sales. Revenues from the Westlaw Litigator suite of online products increased in part due to the expansion of content and functionality of the offerings, such as the integration of legal briefs, trial documents and dockets and the introduction of Medical Litigator. Revenues from services increased primarily due to higher sales at FindLaw due to new sales, new product introduction and improved retention rates. Outside of North America, online revenues increased due to higher customer demand for our products and, to a lesser extent, the continued migration of international customers from CD to online products. Revenues from trademark services increased due to higher volume. International print revenues increased slightly compared to the prior year.
The growth in segment operating profit was primarily a result of the revenue growth described above. Results reflected continued investments in localized content and technology for Asian markets, particularly in Japan related to a joint venture with Shin Nippon Hoki, as well as in China. Segment operating profit also reflected a $13 million charge for an anticipated legal settlement. The segment operating profit margin for 2007 approximated that of the prior year as the effects of scale in the existing businesses and the continued impact of efficiency initiatives were offset by the impact of our Asian investments and the legal settlement charge.
17
Table of Contents
Year Ended December 31, 2006 Compared to Year Ended December 31, 2005
Revenues in 2006 increased 8% comprised of the following:
| • | 7% from higher revenues of existing businesses; | ||
| • | 1% from contributions of newly acquired businesses; and | ||
| • | a negligible impact from foreign currency translation. |
Growth within our existing businesses reflected the strong performance of online services, as well as higher revenue from sales of software and services. Contributions from acquired businesses reflected the results from LiveNote Technologies, a provider of transcript and evidence management software that brings new functionality to Westlaw Litigator, and several small acquisitions in 2006 that supplement existing offerings.
Within our North American legal businesses, revenues increased primarily due to higher online and services revenues. Westlaw revenue experienced growth in all of its major market segments as a result of higher new sales. Revenues from services increased primarily due to higher sales at FindLaw. Outside of North America, online revenues increased, particularly in Europe and Australia, due to higher customer demand for our products and the migration of international customers from CD to online products.
The growth in segment operating profit and its corresponding margin was primarily a result of the revenue growth described above. The increase in the segment operating profit margin reflected the effects of scale in our existing businesses and a favorable product mix.
Outlook
Growth in the overall legal information market remains modest but steady. We expect that customer spending worldwide on print products will remain constant, while spending on CD products will continue to decline. We anticipate the most significant elements of growth in this market will be in spending for online products and integrated information offerings. In North America, law firms are increasingly interested in productivity solutions. In this environment, we anticipate continued demand for both our “practice of law” workflow products and our “business of law” products and services. We also anticipate that the Thomson Legal segment operating profit margin will increase in 2008.
Thomson Financial
| Year ended December 31 | ||||||||||||
| (millions of U.S. dollars) | 2007 | 2006 | 2005 | |||||||||
| Revenues | 2,186 | 2,025 | 1,908 | |||||||||
| Segment operating profit | 454 | 380 | 334 | |||||||||
Segment operating profit margin | 20.8 | % | 18.8 | % | 17.5 | % | ||||||
Year Ended December 31, 2007 Compared to Year Ended December 31, 2006
Results in 2007 for Thomson Financial reflected the continued success of Thomson ONE offerings. Revenues increased 8% comprised of the following:
| • | 5% from higher revenues of existing businesses; |
18
Table of Contents
| • | 1% from contributions of newly acquired businesses; and | ||
| • | 2% from foreign currency translation. |
Revenues from existing businesses increased as a result of new sales as well as higher transaction revenues. Revenues increased primarily in the investment management, corporate services and investment banking markets due to new sales and migrations from legacy offerings, as well as higher revenues from Omgeo. In the investment management market, revenues increased from Thomson Quantitative Analytics, StreetEvents and Datafeeds, as well as an increase in Thomson ONE desktop sales. Corporate services revenues increased due to higher Thomson ONE Investor Relations sales and increased revenues from investor relations communications services. Revenues from Omgeo’s straight-through-processing services increased due to continued customer demand. TradeWeb’s overall revenues increased slightly due to higher transaction fees from higher volume in the mortgage-backed securities marketplace. Revenue growth from existing businesses was slightly tempered by lower pricing on our indications of interest offering and, in the wealth management sector, the exiting of a low-margin contract and declines in low-margin legacy desktops.
Increases in revenues from existing businesses were experienced in Thomson Financial’s three primary geographic regions, the U.S., Europe and Asia. The increases in revenues in Europe and Asia were attributable to greater localized solutions, including Japanese language versions of Thomson ONE Investment Banking and Thomson ONE Investment Management, and higher sales of investor relations communication services.
Results also reflected contributions from eXimius, a workflow solution provider for the private client investment management community that was acquired in February 2007; AFX News, a real-time financial news agency that was acquired in July 2006; and Quantitative Analytics, a provider of financial database integration and analysis solutions that was acquired in March 2006.
Segment operating profit increased primarily due to higher revenues, as well as the effect of efficiency initiatives and savings attributable to deferred spending due to the pending Reuters acquisition. The segment operating profit margin increased due to the effects of higher revenues, the impact of completed and ongoing efficiency efforts to relocate certain activities to lower cost locations, certain deferred spending as discussed above and a decline in depreciation expense as a result of more efficient capital spending.
Year Ended December 31, 2006 Compared to Year Ended December 31, 2005
Revenues in 2006 increased 6% comprised of the following:
| • | 4% from higher revenues of existing businesses; | ||
| • | 2% from contributions of newly acquired businesses; and | ||
| • | a negligible impact from foreign currency translation. |
Revenues from existing businesses increased as a result of new sales of Thomson ONE products, as well as higher usage and transaction revenues. Revenues from Thomson ONE products increased across the investment banking, corporate, investment management and institutional equities sectors. Notably, performance in the corporate sector reflected the adoption of Thomson ONE Investor Relations. Increases in revenues from existing businesses were experienced in our three primary geographic regions, the U.S., Europe and Asia. International growth benefited from demand for our webcasting solutions as European and Asian markets increasingly are adopting U.S.-style investor relations practices. TradeWeb’s overall revenues increased due to higher subscription fees despite TradeWeb’s decline in transaction fees, which resulted from lower trading volumes in its U.S. Treasuries marketplace. Revenue growth from existing businesses was also tempered by the discontinuation of a low margin service in the wealth management sector. Results also reflected contributions from Quantitative Analytics, Inc., a provider of financial database integration and analysis solutions that was acquired in March 2006, and AFX News, a real-time financial news agency that was acquired in July 2006.
19
Table of Contents
Segment operating profit increased due to the increase in revenues. The segment operating profit margin increased due to the effects of scale and efficiency efforts to relocate certain activities to lower cost locations.
Outlook
Certain sectors of the financial services market have experienced losses recently as a result of declines in the values of mortgage-backed and other securities. As a result, some companies have announced layoffs and other cost-cutting actions. Performance for our desktops in the investment banking and investment management sectors could be sensitive to these market dynamics. However, we believe that Thomson Financial is diversified, as 40% of Thomson Financial’s revenues in 2007 were derived from transaction-related businesses and corporate services, and thus, we believe that Thomson Financial is less sensitive to economic downturns than it was historically. Additionally, we expect our analytical tools to remain attractive despite economic conditions.
Upon the closing of the Reuters acquisition, Thomson Financial and Reuters will be combined to form the Markets division of Thomson Reuters. We anticipate over the next few years that we will incur additional costs associated with integrating the operations of Thomson Financial and Reuters. We plan to provide a further outlook after the completion of the transaction.
Thomson Tax & Accounting
| Year ended December 31 | ||||||||||||
| (millions of U.S. dollars) | 2007 | 2006 | 2005 | |||||||||
| Revenues | 705 | 598 | 532 | |||||||||
| Segment operating profit | 184 | 168 | 141 | |||||||||
Segment operating profit margin | 26.1 | % | 28.1 | % | 26.5 | % | ||||||
Year Ended December 31, 2007 Compared to Year Ended December 31, 2006
Results for Thomson Tax & Accounting reflected continuing customer demand for our online solutions and software products and acquired businesses. Revenues increased 18% comprised of the following:
| • | 10% from higher revenues of existing businesses; and | ||
| • | 8% from contributions of newly acquired businesses. |
Revenues from Thomson Tax & Accounting’s existing businesses increased as a result of higher online, software and services sales as well as improved retention. In the research and guidance sector, Checkpoint online revenue continued to increase significantly as a result of new sales and continued migration of customers from print to online products. Revenues in the professional software and services sector increased due to higher tax transaction revenues and increased sales of product suites derived from additional offerings and increased customer retention. Within the corporate software and services sector, revenues increased primarily as a result of higher sales of income tax and transaction tax products and services. These income tax revenues benefited from customer demand and increased sales of additional value-added services, such as consulting and training.
Results also reflected contributions from the Deloitte Tax LLP Sales & Use Outsourcing business, a provider of sales and use tax compliance services that was acquired in January 2007; CrossBorder Solutions, a tax software provider specializing in international tax compliance areas such as transfer pricing that was purchased in March 2007; the Employee Benefits Institute of America, a provider of employee benefits research and guidance purchased in June 2007; and the Deloitte Tax LLP Property Tax Services business, a provider of property tax compliance outsourcing and consulting services, acquired in October 2007.
20
Table of Contents
Growth in segment operating profit compared to the prior year reflected the increase in revenues. The segment operating profit margin decreased as the impact of lower initial margins for certain acquired businesses as a result of acquisition accounting adjustments which more than offset the effects of scale and the impact of integration and efficiency initiatives. We anticipate that the impacts of these accounting adjustments will normalize in 2008 and the operating profit margin will return to historical averages by the end of 2008.
Year Ended December 31, 2006 Compared to Year Ended December 31, 2005
Revenues in 2006 increased 12% comprised of the following:
| • | 11% from higher revenues of existing businesses; and | ||
| • | 1% from contributions of newly acquired businesses. |
Revenues from existing businesses increased as a result of higher online and software and services sales. Thomson’s Checkpoint online service revenue continued to increase significantly as a result of new sales and continued migration of customers from print to online products. Software revenues increased due to higher sales of our UltraTax and InSource offerings. Service revenues increased primarily as a result of higher sales and use tax outsourcing services at Tax Partners.
The growth in segment operating profit and its corresponding margin was primarily a result of the revenue growth described above. The increase in the segment operating profit margin reflected the effects of scale in our existing businesses and a favorable product mix.
Outlook
Increasing regulatory complexity and stringency have significantly affected the accounting labor market, causing shortages of experienced staff and increasing the demand in excess of supply. As a result, there has been an increase in the demand for compliance information and software and for workflow efficiency tools and integrated solutions. In this environment, we anticipate continued strong demand for our tax and accounting compliance products and our outsourcing solutions.
Thomson Scientific
| Year ended December 31 | ||||||||||||
| (millions of U.S. dollars) | 2007 | 2006 | 2005 | |||||||||
| Revenues | 651 | 602 | 569 | |||||||||
| Segment operating profit | 175 | 151 | 129 | |||||||||
Segment operating profit margin | 26.9 | % | 25.1 | % | 22.7 | % | ||||||
Year Ended December 31, 2007 Compared to Year Ended December 31, 2006
Results for Thomson Scientific reflected continuing customer demand for our solutions. Revenues increased 8% comprised of the following:
| • | 4% from higher revenues of existing businesses; | ||
| • | 2% from contributions of newly acquired businesses; and |
21
Table of Contents
| • | 2% from foreign currency translation. |
Growth in revenues from existing businesses was primarily a result of higher revenues for the Web of Science and ISI Web of Knowledge, as well as increased revenues from corporate information solutions. The Web of Science and ISI Web of Knowledge benefited from an increase in new sales and higher renewal rates. Revenues from corporate information solutions increased due to higher demand for patent management services and data, as well as for industry standards information. These increases were partially offset by lower revenues from online hosted content and legacy products. Results also reflected contributions from ScholarOne, a provider of subscription-based software for authoring, evaluating and publishing research that was acquired in August 2006, and Prous Science, a provider of life sciences information solutions that was acquired in September 2007.
Growth in segment operating profit compared to the prior year reflected higher revenues and the impact of efficiency initiatives. These initiatives, which include the relocation of certain activities to lower cost locations, have enabled Thomson Scientific to control costs and improve its segment operating profit margin.
Year Ended December 31, 2006 Compared to Year Ended December 31, 2005
Revenues in 2006 increased 6% comprised of the following:
| • | 4% from higher revenues of existing businesses; | ||
| • | 2% from contributions of newly acquired businesses; and | ||
| • | a negligible impact from foreign currency translation. |
Growth in revenues from existing businesses was primarily a result of higher subscription revenues for the Web of Science and Thomson Pharma solutions. These increases were partially offset by lower revenues from our other online and legacy print products.
Growth in segment operating profit compared to the prior year reflected higher revenues from our workflow solutions and the benefits from completed and ongoing integration initiatives. Those initiatives have increased operating efficiencies enabling us to control costs and improve the segment operating profit margin.
Outlook
The increasing importance of technological innovation to global competition and the underlying shift of enterprise values from tangible to intangible assets continue to drive greater investments in scientific research and development (R&D). Based on these broad driving forces, we expect continued customer demand, from academic research institutions to global pharmaceutical companies, for our information solutions and analytical tools that help them conduct more effective and efficient R&D, as well as our services and offerings that protect and maintain the intellectual property that result from their R&D efforts.
Thomson Healthcare
| Year ended December 31 | ||||||||||||
| (millions of U.S. dollars) | 2007 | 2006 | 2005 | |||||||||
| Revenues | 452 | 374 | 334 | |||||||||
| Segment operating profit | 85 | 81 | 80 | |||||||||
Segment operating profit margin | 18.8 | % | 21.7 | % | 24.0 | % | ||||||
22
Table of Contents
Year Ended December 31, 2007 Compared to Year Ended December 31, 2006
Results for Thomson Healthcare reflected a recent investment in our management decision support offerings and continued customer demand in that sector. Revenues increased 21% as a result of contributions from newly acquired businesses.
Revenues from existing business were consistent with those of the prior year as continuing demand for management decision support offerings offset a decline in PDR monograph and project sales. While revenues increased compared to the prior year periods, the impact of new sales for point-of-care (clinical) decision support and payer decision support offerings were tempered by the losses of certain customer contracts. Results from newly acquired businesses primarily reflected the addition of Solucient, a provider of data and advanced analytics to hospitals and health systems acquired in October 2006.
Segment operating profit increased as the effect of the increase in revenues more than offset an increase in expenses due to product development and integration expenses associated with acquired offerings. The segment operating profit margin decreased as the effects of a less profitable revenue mix, higher product development expenses and integration costs more than offset the savings from integration initiatives.
Year Ended December 31, 2006 Compared to Year Ended December 31, 2005
Results for Thomson Healthcare reflected continuing customer demand for our solutions and services and additional investments in the healthcare marketplace. Revenues increased 12% comprised of the following:
| • | 3% from higher revenues of existing businesses; | ||
| • | 9% from contributions of newly acquired businesses; and | ||
| • | a negligible impact from foreign currency translation. |
Growth in revenues from existing businesses was primarily a result of increased customer spending for healthcare decision support products. Results also reflected contributions from Solucient, a provider of data and advanced analytics to hospitals and health systems acquired in October 2006, and MercuryMD, a provider of mobile information systems serving the healthcare market acquired in May 2006.
The growth in segment operating profit compared to the prior year reflected higher revenues from our workflow solutions and costs from completed and ongoing integration initiatives. The segment operating profit margin decreased in 2006 due primarily to costs incurred in connection with the integration initiatives.
Outlook
The aging U.S. population, growth in chronic conditions and the increasing complexity of healthcare therapeutic options are continuing to drive healthcare costs higher, as well as highlight the need for improved quality and patient safety. These trends are creating the need for decision support solutions. We, therefore, anticipate continued growth from our healthcare management and point-of-care decision support solutions.
23
Table of Contents
Corporate and Other
| Year ended December 31 | ||||||||||||
| (millions of U.S. dollars) | 2007 | 2006 | 2005 | |||||||||
Expenses excluding THOMSONplusand Reuters transaction costs | 160 | 175 | 139 | |||||||||
THOMSONplus | 153 | 60 | — | |||||||||
| Reuters transaction costs | 76 | — | — | |||||||||
| Total | 389 | 235 | 139 | |||||||||
Year Ended December 31, 2007 Compared to Year Ended December 31, 2006
In 2007, Corporate and Other expenses increased $154 million over the prior year. The increase was primarily due to expenses associated with the THOMSONplusprogram and with the Reuters transaction, as well as higher healthcare costs. Results also reflected a $34 million gain associated with the settlement of a pension plan. Reuters transaction costs included in corporate expenses primarily consisted of consulting costs for integration planning as well as expenses associated with retention programs. We expect to continue to incur transaction-related costs in future periods.
In 2007, we incurred $153 million of expenses associated with THOMSONplus. These expenses primarily related to consulting services, severance costs and charges associated with the restructuring of Thomson Legal’s North American sales force. The consulting costs primarily related to our efforts to deploy SAP as our company-wide ERP system, which will continue into 2008, as well as efforts to improve the customer service infrastructure. The severance costs principally related to the elimination of certain finance positions in conjunction with the establishment of centralized service centers, efforts to streamline the operations of Thomson Financial and the restructuring of Thomson Legal’s North American sales force.
Year Ended December 31, 2006 Compared to Year Ended December 31, 2005
In 2006, Corporate and Other expenses increased $96 million, or 69%, compared to 2005. The increase was primarily due to expenses associated with our THOMSONplusprogram, as well as higher pension and other defined benefit plans expense and stock-related compensation expense.
In 2006, we incurred $60 million of expenses associated with THOMSONplus. These expenses primarily related to consulting services, but also included severance costs.
Outlook
We anticipate Corporate and Other expenses in 2008 to reflect reduced expenditures associated with THOMSONplusas the program is expected to be concluded in the first half of the year. However, following the completion of the Reuters acquisition, additional expenses will be recorded within Corporate and Other related to the Reuters integration.
Discontinued Operations
As part of our continuing strategy to optimize our portfolio of businesses to ensure that we are investing in parts of our business that offer the greatest opportunities to achieve growth and returns, management decided to actively pursue the sale of certain businesses. These businesses were classified as discontinued operations within the consolidated financial statements for years ended December 31, 2007, 2006 and 2005. Results of discontinued operations reflected the activity of these businesses until their date of sale and the gain or loss on their disposition and were comprised of the following operations.
24
Table of Contents
In the fourth quarter of 2007, we approved plans to sell GEE, our regulatory information business in the United Kingdom that was managed by Thomson Legal. The sale was completed in December 2007.
In April 2007, we approved plans to sell Fakta, our regulatory information business in Sweden. This business was managed within Thomson Legal. The sale was completed in November 2007.
In March 2007, we approved plans within Thomson Healthcare to sell PLM, a provider of drug and therapeutic information in Latin America; the New England Institutional Review Board (NEIRB), an ethical review board that monitors clinical research involving human subjects; and CenterWatch, a provider of clinical research information. The sale of NEIRB and CenterWatch was completed in December 2007.
In 2007, we completed the sale of Thomson Learning through three independent processes, each on its own schedule, as follows:
| • | In July 2007, we sold Thomson Learning’s higher education, careers and library reference businesses to funds advised by Apax Partners and OMERS Capital Partners. As a result of the sale, we received gross proceeds of approximately $7.6 billion and recognized a post-tax gain of $2.7 billion. | ||
| • | In May 2007, we sold NETg, a leading provider of continuing corporate education and training, to SkillSoft PLC for approximately $270 million and recorded a post-tax loss of $10 million. | ||
| • | In October 2007, we sold Prometric, a provider of assessment services, to ETS for $310 million in cash and a 6% promissory note for approximately $79 million due in 2014. The principal amount of the note, which was previously reported as $125 million, was adjusted to $79 million reflecting adjustments made based on the continuity of offerings from certain customer contracts. The promissory note was reflected in our financial statements at its estimated fair value of $60 million to account for the difference between the market and stated rates of interest. We recognized a post-tax gain of $18 million related to this transaction. The principal amount of the note is subject to further adjustment based on certain contingencies. |
In future periods, our net proceeds will be adjusted for certain post-closing adjustments. We recorded pre-tax impairment charges associated with certain of these businesses of $14 million in the fourth quarter of 2006. Based on estimates of fair value, as well as carrying value at March 31, 2007, these impairment charges were reversed in the first quarter of 2007.
Additionally, in the fourth quarter of 2006 we approved plans within Thomson Legal to sell our business information and news operations, which include our Market Research and NewsEdge businesses. Based on estimates of fair value at March 31, 2007, we recorded pre-tax impairment charges to identifiable intangible assets of $3 million related to these businesses. We completed the sale of the Market Research and NewsEdge businesses in May 2007 and July 2007, respectively.
In June 2006, our board of directors approved plans to sell IOB, a Brazilian regulatory business within Thomson Legal and Thomson Medical Education, a provider of sponsored medical education within Thomson Healthcare. We completed the sale of Thomson Medical Education in April 2007 and IOB in June 2007.
In the first quarter of 2006, we approved plans within Thomson Legal to sell Lawpoint Pty Limited, an Australian provider of print and online regulatory information services; and Law Manager, Inc., a software and services provider. We completed the sale of Law Manager in April 2006 and Lawpoint in June 2006.
25
Table of Contents
Also in the first quarter of 2006, we approved plans within Thomson Learning to sell Peterson’s, a college preparatory guide; the North American operations of Thomson Education Direct, a consumer-based distance learning career school; and K.G. Saur, a German publisher of biographical and bibliographical reference titles serving the library and academic communities. Based on estimates of fair market value at March 31, 2006, we recorded pre-tax impairment charges associated with certain of these businesses related to identifiable intangible assets and goodwill of $63 million in the first half of 2006. We completed the sale of Peterson’s in July 2006 and K.G. Saur in August 2006. We recorded a pre-tax impairment charge associated with Thomson Education Direct of $15 million relating to goodwill in the fourth quarter of 2006. We completed the sale of our North American operations of Thomson Education Direct in March 2007.
In December 2005, our board of directors approved the plan to dispose of American Health Consultants, a medical newsletter publisher and medical education provider within Thomson Healthcare. We completed the sale in the third quarter of 2006.
We adjust liabilities previously established for businesses that have been sold when actual results differ from estimates used in establishing such liabilities. Adjustments are made in conjunction with the expiration of representations and warranty periods or to reflect the refinement of earlier estimates. In 2007, we adjusted $9 million of disposal liabilities related to previous dispositions. The adjustments related principally to tax liabilities.
For more information on discontinued operations, see note 8 to our annual financial statements for the year ended December 31, 2007.
Return on Invested Capital
We measure our return on invested capital (ROIC) to assess, over the long term, our ability to create value for our shareholders. Our goal is to increase this return over the long term by efficiently and effectively utilizing our capital to invest in areas with high returns and realizing operating efficiencies to further enhance our profitability. We have historically calculated our ROIC as the ratio of our operating profit (including businesses classified within discontinued operations) before amortization, less taxes paid, to our average invested capital (see the “Reconciliations” section for the calculation and a reconciliation to the most directly comparable Canadian GAAP measure). However, as the mid-2007 disposal of Thomson Learning, a highly seasonal business, as well as other businesses sold during the year distorts the calculation, we have computed 2007 ROIC by excluding the impacts of businesses classified as discontinued operations. ROIC calculated in this manner for 2007 was 8.7%, an increase from 8.2% for 2006 and 7.8% for 2005.
Review of Fourth Quarter Results
The following table summarizes our consolidated results for the fourth quarter of 2007 and 2006.
| Three months ended | ||||||||
| December 31 | ||||||||
| (millions of U.S. dollars) | 2007 | 2006 | ||||||
| Revenues | 2,033 | 1,850 | ||||||
Operating profit(1) | 410 | 422 | ||||||
Operating profit margin(1) | 20.2 | % | 22.8 | % | ||||
Net earnings(1) | 434 | 391 | ||||||
Diluted earnings per common shares(1) | $ | 0.67 | $ | 0.61 | ||||
| (1) | Results are not directly comparable due to certain non-recurring or special items, as noted below. |
26
Table of Contents
Revenues.The 10% increase in revenues for the three months ended December 31, 2007 was comprised of the following:
| • | 6% from growth of existing businesses; | ||
| • | 2% from contributions of acquired businesses; and | ||
| • | 2% from the favorable impact of foreign currency translation. |
The growth from existing businesses was primarily contributed by the online products and solutions of Thomson Legal and Thomson Tax & Accounting, as well as those of Thomson Financial and Thomson Scientific. Contributions from acquired businesses were primarily related to the results of Solucient within Thomson Healthcare and CrossBorder Solutions within Thomson Tax & Accounting.
Operating profit.Operating profit for the three months ended December 31, 2007 decreased 3%. This decrease was primarily due to expenses associated with our THOMSONplusprogram and Reuters transaction costs. These expenses more than offset the effect of higher revenues and a $34 million nonrecurring gain on the settlement of a pension plan. The corresponding operating profit margin also decreased as a result of these higher expenses.
The following table presents a summary of our operating profit and operating profit margin for the three months ended December 31, 2007 and 2006 after adjusting for THOMSONpluscosts and other items affecting comparability in each period.
| Three months ended | ||||||||
| December 31 | ||||||||
| (millions of U.S. dollars) | 2007 | 2006 | ||||||
| Operating profit | 410 | 422 | ||||||
| Adjustments: | ||||||||
THOMSONpluscosts | 68 | 29 | ||||||
| Reuters transaction costs | 45 | — | ||||||
| Settlement of pension plan | (34 | ) | — | |||||
| Underlying operating profit | 489 | 451 | ||||||
Underlying operating profit margin | 24.1 | % | 24.4 | % | ||||
Underlying operating profit for the three months ended December 31, 2007 increased 8% as a result of higher revenues. The underlying operating profit margin decreased compared to the prior year as the effects of scale and of efficiency initiatives were more than offset by investments in Asia and the timing of expenses in our Thomson Legal segment and the impact of lower initial margins for certain acquired business in our Thomson Tax & Accounting segment as a result of acquisition accounting adjustments.
Depreciation and amortization.Depreciation for the three months ended December 31, 2007 increased $4 million, or 3%, compared to the same period in 2006 due to the newly acquired assets and the timing of capital expenditures. Amortization for the three months ended December 31, 2007 increased $5 million, or 8%, compared to the 2006 period reflecting the expense of newly acquired intangible assets.
Net other expense.Net other expense for the three months ended December 31, 2007 of $40 million primarily reflected the change in the fair value of our sterling call options (see the section entitled “Hedging Program for Reuters Consideration” for further discussion).
27
Table of Contents
Net other expense for the three months ended December 31, 2006 of $35 million primarily consisted of a legal reserve representing our portion of a cash settlement related to theRodriguez v. West Publishing Corp. and Kaplan Inc.case.
Net interest income/expense and other financing costs.Net interest income and other financing costs for the three months ended December 31, 2007 of $52 million reflected $111 million of interest income from the investment of the proceeds from the sale of Thomson Learning’s higher education, careers and library reference businesses in money market funds. Excluding this interest income, net interest expense approximated that of the prior year.
Income taxes.Income taxes for the three-month period ended December 31, 2007 increased compared to the prior year period due to higher taxable income in the current period and certain non-recurring tax credits in the prior period. Income taxes for both periods in the current and prior year reflected the mix of taxing jurisdictions in which pre-tax profits and losses were recognized. Because the seasonality in our businesses impacts our geographic mix of pre-tax profits and losses in interim periods and, therefore, distorts our reported tax rate, our effective tax rate for interim periods is not indicative of our effective tax rate for the full year.
Earnings attributable to common shares and earnings per common share.Earnings attributable to common shares were $432 million for the three months ended December 31, 2007 compared to $390 million in the same period in 2006.
Earnings per common share were $0.67 in the three months ended December 31, 2007 compared to $0.61 in the comparable period in 2006. The increases in earnings and earnings per common share were primarily due to interest income from the investment of the proceeds from the sale of Thomson Learning’s higher education, careers and library reference businesses and the results from discontinued operations. The results for the three months ended December 31, 2007 and 2006 are not directly comparable because of certain non-recurring or special items, the impacts from accounting for income taxes in interim periods, and the variability in discontinued operations due to the timing of dispositions.
The following table presents a summary of our earnings and our earnings per common share from continuing operations for the periods indicated, after adjusting for items affecting comparability in both years.
| Three months ended | ||||||||
| December 31 | ||||||||
| (millions of U.S. dollars, except per common share amounts) | 2007 | 2006 | ||||||
| Earnings attributable to common shares | 432 | 390 | ||||||
| Adjustments for non-recurring or special items: | ||||||||
| Net other expense | 40 | 35 | ||||||
| Reuters transactions costs | 45 | — | ||||||
| Gain on settlement of pension plan | (34 | ) | — | |||||
| Tax on above items | (9 | ) | (15 | ) | ||||
| Tax (benefits) charges | 1 | (12 | ) | |||||
| Interim period effective tax rate normalization | 32 | 8 | ||||||
| Discontinued operations | (123 | ) | (86 | ) | ||||
| Adjusted earnings from continuing operations | 384 | 320 | ||||||
| Adjusted earnings per common share from continuing operations | $ | 0.60 | $ | 0.50 | ||||
On a comparable basis, our adjusted earnings from continuing operations for the fourth quarter of 2007 improved over 2006 largely as a result of interest income from the investment of the proceeds from the sale of Thomson Learning’s higher education, careers and library reference businesses, which more than offset higher costs associated with THOMSONplus.
28
Table of Contents
LIQUIDITY AND CAPITAL RESOURCES
Financial Position
At December 31, 2007, our total assets were $22,831 million, which represented a 13% increase from the total of $20,142 million at December 31, 2006. The increase in assets primarily reflected the receipt of the proceeds from the sale of Thomson Learning’s higher education, careers and library reference businesses in excess of their book value.
Our total assets by segment as of December 31, 2007 and 2006 were as follows:
| As of December 31 | ||||||||
| (millions of U.S. dollars) | 2007 | 2006 | ||||||
| Thomson Legal | 6,562 | 6,445 | ||||||
| Thomson Financial | 3,618 | 3,489 | ||||||
| Thomson Tax & Accounting | 1,440 | 1,086 | ||||||
| Thomson Scientific | 1,419 | 1,344 | ||||||
| Thomson Healthcare | 772 | 755 | ||||||
| Corporate and Other | 9,010 | 1,452 | ||||||
| Discontinued operations | 10 | 5,571 | ||||||
| Total assets | 22,831 | 20,142 | ||||||
Assets by Segment
(Excluding Discontinued Operations,
as of December 31, 2007)
(Excluding Discontinued Operations,
as of December 31, 2007)
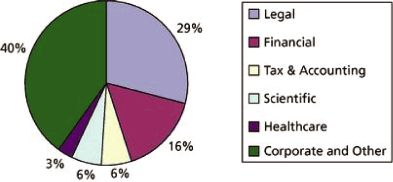
29
Table of Contents
The following table presents comparative information related to net debt, shareholders’ equity and the ratio of net debt to shareholders’ equity:
| As of December 31 | ||||||||
| (millions of U.S. dollars) | 2007 | 2006 | ||||||
| Short-term indebtedness | 183 | 333 | ||||||
| Current portion of long-term debt | 412 | 264 | ||||||
| Long-term debt | 4,264 | 3,681 | ||||||
| Total debt | 4,859 | 4,278 | ||||||
| Swaps | (424 | ) | (257 | ) | ||||
| Total debt after swaps | 4,435 | 4,021 | ||||||
| Remove fair value adjustment of cash flow hedges | 14 | 54 | ||||||
| Less: Cash and cash equivalents | (7,497 | ) | (334 | ) | ||||
| Net debt | (3,048 | ) | 3,741 | |||||
| Total shareholders’ equity | 13,571 | 10,481 | ||||||
| Net debt/equity ratio | (0.22:1 | ) | 0.36:1 | |||||
The change in net debt is principally attributable to the proceeds from the sale of Thomson Learning.
We guarantee certain obligations of our subsidiaries, including borrowings by our subsidiaries under our revolving credit facilities. Under the terms of our syndicated credit agreement and acquisition credit agreement discussed below, we must maintain a ratio of net debt (as used in the table above) as of the last day of each fiscal quarter to adjusted EBITDA (earnings before interest, income taxes, depreciation and amortization and other modifications described in the agreement) for the last four quarters ended of not more than 4.5:1. As of December 31, 2007, we were in compliance with this covenant.
In October 2007, we completed an offering of $800 million of 5.70% notes due 2014. The net proceeds from this offering were $794 million. We used these proceeds (i) to repay holders of our $400 million principal amount of 5.75% notes which matured in February 2008, (ii) to replace funds used to repay our C$250 million principal amount of 6.50% notes which matured in July 2007, and (iii) for general corporate purposes.
In July 2007, we repaid C$250 million of debentures upon their maturity.
In January 2006, we repaid $50 million of privately placed notes upon their maturity.
30
Table of Contents
The following table displays the changes in our shareholders’ equity for the year ended December 31, 2007:
| (millions of U.S. dollars) | ||||
| Balance at December 31, 2006 | 10,481 | |||
Effect of accounting change for income taxes(1) | (33 | ) | ||
| Restated balance as of December 31, 2006 | 10,448 | |||
| Earnings attributable to common shares for the year ended December 31, 2007 | 3,998 | |||
| Additions to paid in capital related to stock compensation and other plans | 48 | |||
| Common share issuances | 102 | |||
| Repurchases of common shares | (168 | ) | ||
| Common share dividends declared | (628 | ) | ||
Net unrealized gains on derivatives that qualify as cash flow hedges(2) | (55 | ) | ||
| Change in translation adjustment | (174 | ) | ||
| Balance at December 31, 2007 | 13,571 | |||
| (1) | Effective January 1, 2007, we voluntarily adopted a new accounting policy for uncertain tax positions and recorded a non-cash charge to opening retained earnings with an offsetting increase to non-current liabilities. | |
| (2) | Effective January 1, 2006, the unrealized gains and losses on certain derivatives that qualify as cash flow hedges are recorded as a component of accumulated other comprehensive income within shareholders’ equity in our consolidated balance sheet. |
See the section entitled “Accounting Changes” for further discussion on both of these changes.
The following table sets forth the ratings that we have received from rating agencies in respect of our outstanding securities as of December 31, 2007.
| Standard & | DBRS Limited | |||||||||||
| Moody’s | Poor’s | (DBRS) | ||||||||||
| Long-term debt | Baa1 | A- | A (low) | |||||||||
| Commercial paper | — | — | R-1 (low) | |||||||||
| Trend/Outlook | Stable | Negative | Stable | |||||||||
In the fourth quarter of 2007, DBRS confirmed our long-term debt rating and raised its outlook to “stable”.
In the third quarter of 2007, Moody’s downgraded the debt ratings for us by one notch from “A3” to “Baa1”, the third-lowest investment grade, citing a significant increase in leverage that will result from our pending acquisition of Reuters. Moody’s changed its outlook to “stable”, indicating another rating change is not expected over the next 12 to 18 months. Additionally, Standard & Poor’s affirmed our existing long-term debt rating and changed its outlook to negative.
You should be aware that a rating is not a recommendation to buy, sell or hold securities and may be subject to revision, suspension or withdrawal at any time by the assigning rating organization. We cannot assure you that our credit ratings will not be lowered in the future or that rating agencies will not issue adverse commentaries regarding our securities.
31
Table of Contents
The maturity dates for our long-term debt are well balanced with no significant concentration in any one year.
Generally, the carrying amounts of our total current liabilities exceeds the carrying amounts of our total current assets because current liabilities include deferred revenue. Deferred revenue does not represent a cash obligation, however, but rather an obligation to perform services or deliver products in the future. The costs to fulfill these obligations are included in our operating costs. As of December 31, 2007, current assets exceeded current liabilities as our current assets included the proceeds from the sale of Thomson Learning.
Hedging Program for Reuters Consideration
As the funding of the cash consideration required to be paid to Reuters shareholders will fluctuate based on the $/£ exchange rate, in July 2007 we commenced a hedging program to mitigate exposure to changes in the $/£ exchange rate. In the third quarter of 2007, we paid $76 million for the purchase of several sterling call options with a cumulative notional value of £2,300 million and various strike prices approximating $2.05/£1.00.
These options are stated at their fair value in our consolidated balance sheet and changes in their fair value are reflected within our consolidated statement of earnings. The fair value of these options at December 31, 2007 was approximately $27 million.
Additionally, after completion of the sale of Thomson Learning’s higher education, careers and library reference businesses, we invested a portion of the proceeds in sterling-denominated money market funds and in sterling term bank deposits. As of December 31, 2007, our balance in these funds, which were included in the consolidated balance sheet as cash and cash equivalents, totaled approximately £2.2 billion.
Share Repurchase Program
Since May 2005, we have had in place a share repurchase program which has allowed us to repurchase up to 15 million of our shares in a given 12 month period. We most recently renewed this program in May 2007. Since May 2005, we have repurchased and subsequently cancelled 22 million shares for $836 million. We suspended repurchases from May through November 2007 as a result of our proposed acquisition of Reuters. We resumed share repurchases in late November 2007 continuing through December 2007. The following summarizes our repurchases in 2006 and 2007.
| Number of Shares | ||||||||||||
| Shares | Average Price | Available for | ||||||||||
| Three-month period ended | Repurchased | per Share | Repurchase | |||||||||
| March 31, 2006 | 4,570,000 | $ | 36.83 | |||||||||
| June 30, 2006 | 3,110,000 | $ | 39.58 | |||||||||
| September 30, 2006 | 1,710,600 | $ | 39.27 | |||||||||
| December 31, 2006 | 1,289,400 | $ | 41.41 | |||||||||
| March 31, 2007 | 1,305,000 | $ | 41.74 | |||||||||
| June 30, 2007 | 495,000 | $ | 42.68 | |||||||||
| September 30, 2007 | — | — | ||||||||||
| December 31, 2007 | 2,370,500 | $ | 38.76 | 12,629,500 | ||||||||
Shares that we repurchase are cancelled. We may repurchase shares in open market transactions on the Toronto Stock Exchange or the New York Stock Exchange. Decisions regarding the timing of future repurchases will be based on market conditions, share price and other factors. We may elect to suspend or discontinue the program at any time. From time to time, when we do not possess material nonpublic information
32
Table of Contents
about ourselves or our securities, we may enter into a pre-defined plan with our broker to allow for the repurchase of shares at times when we ordinarily would not be active in the market due to our own internal trading blackout periods, insider trading rules or otherwise. Any such plans entered into with our broker will be adopted in accordance with applicable Canadian securities laws and the requirements of Rule 10b5-1 under the U.S. Securities Exchange Act of 1934.
Dividend Reinvestment Plan (DRIP)
All eligible Thomson shareholders may elect to reinvest their dividends in our common shares at the prevailing market price. During the course of 2008, Woodbridge plans to reinvest the equivalent of 50% of the dividends that it receives during the first three quarters of 2008. Woodbridge’s reinvestment in additional common shares of our company at the prevailing market rates will be in accordance with the terms of our DRIP.
Cash Flow
Our principal sources of liquidity are cash provided by our operations, borrowings under our revolving bank credit facilities and our commercial paper program and the issuance of public debt. In 2007, the proceeds from our divestitures, notably the sale of Thomson Learning, have also been a large source of liquidity. Our principal uses of cash have been to finance working capital and debt servicing costs, repay debt, and finance dividend payments, capital expenditures and acquisitions. Additionally, as discussed in the section entitled “Share Repurchase Program,” we have also used our cash to repurchase outstanding common shares in open market transactions.
Operating activities.Cash provided by operating activities in 2007 was $1,816 million compared to $2,125 million for 2006. The change primarily reflected higher interest income from the investment of the proceeds from divestitures, which was more than offset by lower cash from discontinued operations and costs associated with the proposed Reuters acquisition and THOMSONplus, as well as a payment of $36 million to settle theRodriguez v. West Publishing Corp. and Kaplan Inc.lawsuit. Excluding discontinued operations, cash from operating activities increased compared to the prior year primarily due to higher interest income. Working capital levels increased in 2007 due to the impact of deferred acquisition costs associated with the Reuters transaction.
Cash provided by operating activities in 2006 was $2,125 million compared to $1,879 million for 2005. The change primarily reflected the increase in operating profit from 2005 to 2006 and lower tax payments. The reduction in tax payments was principally due to a $125 million withholding tax paid in 2005 associated with the repatriation of certain subsidiary earnings. Working capital levels decreased slightly in 2006 due to the timing of accounts receivable collections and payments for normal operating expenses, though not to the extent of the prior year.
Investing activities.Cash provided by investing activities in 2007 was $5,883 million compared to cash used of $1,290 million for 2006. The activity in 2007 reflected higher proceeds from the sales of discontinued operations and decreased acquisition spending compared to the prior year. In future periods, these proceeds will be adjusted for the payment of certain post-closing adjustments. Acquisitions in 2007 included CrossBorder Solutions in our Thomson Tax & Accounting segment, Prous Science in our Thomson Scientific segment and Deloitte LLP Property Tax Services in our Thomson Tax & Accounting segment. In 2007, capital expenditures increased compared to 2006 due to higher spending on, and the timing of, technology initiatives, as well as $48 million in expenditures resulting from a data center expansion in Eagan, Minnesota.
Capital expenditures in 2007 increased 35% to $608 million from $452 million in 2006. This represented 8.3% and 6.9% of revenues in 2007 and 2006, respectively. Higher capital expenditures in 2007 were incurred primarily at Thomson Legal and within Corporate and Other, and primarily related to initiatives to standardize technology platforms across businesses and other efficiency initiatives.
The majority of our capital expenditures is focused on technology-related investments. We make significant investments in technology because it is essential to providing integrated information solutions to our customers and because we intend to maintain the significant competitive advantage we believe we have in this area. Our technology expenditures include spending on computer hardware, software, electronic systems, telecommunications infrastructure and digitization of content. In 2007, approximately 80% of our total capital expenditures were for
33
Table of Contents
technology-related investments. Although we can give no assurance that investments in technology will result in an increase in our revenues or a decrease in our operating costs, we expect our technology-related investments to continue at a significant level.
Cash used in investing activities in 2006 was $1,290 million compared to $1,071 million for 2005. The increased use of cash in 2006 was attributable to greater acquisition spending. In 2006, spending on acquisitions included the purchase of Solucient within Thomson Healthcare, Quantitative Analytics within Thomson Financial and LiveNote within Thomson Legal. In 2005, investing activities included tax payments of $105 million associated with the sale of Thomson Media in 2004.
Financing activities.Cash used in financing activities was $464 million in 2007 compared to $912 million in 2006. The decreased outflow of cash reflected proceeds from a debt offering in 2007 and a reduction in our repurchases of common shares (see “Share Repurchase Program” above). These effects were partially offset by outflows associated with the purchase of sterling call options (see “Hedging Program for Reuters Consideration” above) and higher dividend payments.
Cash used in financing activities was $912 million for 2006 compared to $798 million for 2005. The increased use of cash largely reflected repurchases of common shares (see “Share Repurchase Program” above) and higher dividend payments in 2006.
The following table sets forth our common share dividend activity.
| Year ended | ||||||||
| December 31 | ||||||||
| (millions of U.S. dollars) | 2007 | 2006 | ||||||
| Dividends declared | 628 | 567 | ||||||
| Dividends reinvested | (16 | ) | (14 | ) | ||||
| Dividends paid | 612 | 553 | ||||||
Discussion of other significant financing activities from each year are noted under the section entitled “Financial Position.”
Free cash flow.The following table sets forth a calculation of our free cash flow for 2007 and 2006:
| Year ended | ||||||||
| December 31 | ||||||||
| (millions of U.S. dollars) | 2007 | 2006 | ||||||
| Net cash provided by operating activities | 1,816 | 2,125 | ||||||
| Capital expenditures | (608 | ) | (452 | ) | ||||
| Additions to property and equipment of discontinued operations | (97 | ) | (185 | ) | ||||
| Other investing activities | (37 | ) | (26 | ) | ||||
| Dividends paid on preference shares | (6 | ) | (5 | ) | ||||
| Other investing activities of discontinued operations | (2 | ) | (17 | ) | ||||
| Free cash flow | 1,066 | 1,440 | ||||||
34
Table of Contents
Our free cash flow for 2007 decreased due to the composition of businesses in discontinued operations and costs associated with their disposition, as well as costs associated with THOMSONplusand the Reuters transaction. The increases in such costs for 2007 were offset by higher interest income on cash balances that have risen substantially as a result of the sale of Thomson Learning. Results for 2007 also reflected a $36 million payment to settle theRodriguez v. West Publishing Corp. and Kaplan Inc.lawsuit. Following is an analysis of the impact of such items on our free cash flow:
| Year ended | ||||||||
| December 31 | ||||||||
| (millions of U.S. dollars) | 2007 | 2006 | ||||||
| Free cash flow | 1,066 | 1,440 | ||||||
| Items affecting comparability: | ||||||||
| Cash used in (provided by) operating and investing activities of discontinued operations | 93 | (370 | ) | |||||
| Interest on proceeds from the sale of Thomson Learning, net of taxes | (155 | ) | — | |||||
Spending on THOMSONplusinitiatives | 162 | 69 | ||||||
| Spending on Reuters related costs | 73 | — | ||||||
| Settlement of lawsuit | 36 | — | ||||||
| 1,275 | 1,139 | |||||||
Credit facilities and commercial paper program.In August 2007, we entered into a syndicated credit agreement with a group of banks. This new agreement consists of a $2.5 billion five-year unsecured revolving credit facility. Under the terms of the new agreement, we may request an increase (subject to approval by applicable lenders) in the amount of the lenders’ commitments up to a maximum amount of $3.0 billion. This agreement is available to provide liquidity in connection with our commercial paper program and for general corporate purposes of our company and our subsidiaries including, following the closing of our proposed transaction with Reuters, Thomson Reuters PLC and its subsidiaries. The maturity date of the agreement is August 14, 2012. However, we may request that the maturity date be extended under certain circumstances, as set forth in the agreement, for up to two additional one-year periods. The syndicated credit agreement contains certain customary affirmative and negative covenants, each with customary exceptions. The financial covenant related to this agreement is described in the “Financial Position” subsection above. In connection with entering into this agreement, we terminated our existing unsecured revolving bilateral loan agreements that had previously provided an aggregate commitment of $1.6 billion.
The credit facility is structured such that, if our long-term debt rating was downgraded by Moody’s or Standard & Poor’s, our facility fee and borrowing costs may increase, although availability would be unaffected. Conversely, an upgrade in our ratings may reduce our credit facility fees and borrowing costs.
Additionally, in May 2007, we entered into a £4.8 billion acquisition credit facility. We entered into this facility as a result of requirements of the U.K. Panel on Takeovers and Mergers, which require us and our financial advisors for the transaction to confirm our ability to finance our proposed acquisition of Reuters. We may only draw down amounts under this facility to finance the proposed acquisition, to refinance any existing debt of Reuters or its subsidiaries after the closing, and to pay fees and expenses that we incur in connection with the proposed acquisition and the credit facility. As of March 6, 2008, we had not utilized this facility. In July 2007, we reduced the aggregate lending commitment under the facility to £2.5 billion after receiving proceeds from the sale of Thomson Learning’s higher education, careers and library reference assets. In accordance with the terms of the new facility, we are required to hold certain of these sale proceeds in “permitted investments,” as defined by the facility, until the closing of the proposed Reuters acquisition. These “permitted investments” include, among other investments, highly rated money market funds. The facility is structured as a 364-day credit line with subsequent extension/term-out options that would allow our company to extend the final maturity until May 2009.
35
Table of Contents
Debt shelf registration.In November 2007, we filed a new shelf prospectus that allows us to issue up to $3 billion of debt securities from time to time. The shelf prospectus will be valid until December 2009. We have not issued any debt securities under this shelf prospectus.
For the foreseeable future, we believe that cash from our operations and available credit facilities will be sufficient to fund our future cash dividends, debt service, projected capital expenditures, acquisitions that we pursue in the normal course of business and share repurchases.
Off-Balance Sheet Arrangements, Commitments and Contractual Obligations
The following table presents a summary of our long-term debt and off-balance sheet contractual obligations as of December 31, 2007 for the years indicated:
| (millions of U.S. dollars) | 2008 | 2009 | 2010 | 2011 | 2012 | Thereafter | Total | |||||||||||||||||||||
Long-term debt(1) | 412 | 634 | 326 | 254 | 700 | 1,942 | 4,268 | |||||||||||||||||||||
| Operating lease payments | 157 | 135 | 107 | 82 | 68 | 204 | 753 | |||||||||||||||||||||
| Unconditional purchase obligations | 92 | 45 | 18 | 10 | — | 2 | 167 | |||||||||||||||||||||
| Total | 661 | 814 | 451 | 346 | 768 | 2,148 | 5,188 | |||||||||||||||||||||
| (1) | Represents hedged principal payments. As substantially all non-U.S. dollar-denominated debt has been hedged into U.S. dollars, amounts represent the net cash outflows associated with principal payments on our long-term debt. |
We have entered into operating leases in the ordinary course of business, primarily for real property and equipment. Payments for these leases are contractual obligations as scheduled per each agreement. With certain leases, we guarantee a portion of the residual value loss, if any, incurred by the lessors in disposing of the assets, or to restore a property to a specified condition after completion of the lease period. The liability associated with these restorations is recorded on our consolidated balance sheet. With certain real property leases, banking arrangements and commercial contracts, we guarantee the obligations of some of our subsidiaries. We believe, based upon current facts and circumstances, that a material payment pursuant to any such guarantees is remote.
We have various unconditional purchase obligations. These obligations are for materials, supplies and services incidental to the ordinary conduct of business.
We have obligations to pay additional consideration for prior acquisitions, typically based upon performance measures contractually agreed to at the time of purchase. We do not believe that additional payments in connection with these transactions would have a material impact on our financial statements.
In certain disposition agreements, we guarantee to the purchaser the recoverability of certain assets or limits on certain liabilities. We believe, based upon current facts and circumstances, that the likelihood of a material payment pursuant to such guarantees is remote.
In the third quarter of 2007, the U.S. District Court for the Western District of Pennsylvania adversely decided against us in a patent infringement case related to a business formerly owned by Thomson Financial. We subsequently posted a $95 million letter of credit in connection with our appeal. The letter of credit represents the amount of the district court’s judgment, plus fees and interest.
We plan to fund the proposed Reuters transaction with proceeds from the sales of our Thomson Learning businesses and borrowings available to us under our acquisition credit facility. We believe that cash from our operations and other available credit facilities will be sufficient to fund
36
Table of Contents
our future cash dividends, debt service, projected capital expenditures, acquisitions that we pursue in the normal course of business and share repurchases.
We guarantee certain obligations of our subsidiaries, including borrowings by our subsidiaries under our revolving credit facility.
Under the terms of the syndicated credit agreement and acquisition facility, we must maintain a ratio of net debt as of the last day of each fiscal quarter to adjusted EBITDA (earnings before interest, income taxes, depreciation and amortization and other modifications described in the agreement) for the last four quarters ended of not more than 4.5:1. Net debt is total debt adjusted to factor in the impact of swaps and other hedge agreements related to the debt, less our cash and cash equivalents balance. As of December 31, 2007, we were in compliance with this covenant.
Other than as described above, we do not engage in any off-balance sheet financing arrangements. In particular, we do not have any interests in unconsolidated special-purpose or structured finance entities.
Contingencies
Lawsuits and Legal Claims
In 2005, we became aware of an inquiry by the Serious Fraud Office in the United Kingdom regarding the refund practices relating to certain duplicate subscription payments made by some of our customers in our Sweet & Maxwell and GEE businesses in the United Kingdom. In 2007, we were notified by the authorities that they had completed their inquiry and no action would be taken against us.
In February 2007, we entered into a settlement agreement related to a lawsuit involving our BAR/BRI business that alleged violations of antitrust laws (Rodriguez v. West Publishing Corp. and Kaplan Inc.). Our part of the settlement was $36 million, which was accrued for in the fourth quarter of 2006 and paid in June 2007. We are a defendant in a lawsuit involving our BAR/BRI business,Park v. The Thomson Corporation and Thomson Legal & Regulatory Inc., which was filed in the U.S. District Court for the Southern District of New York. The lawsuit alleges primarily violations of U.S. federal antitrust laws. In the third quarter of 2007, we accrued $13 million in connection with an agreement in principle to settle the case, which is subject to court approval. In June 2006, an additional complaint with substantially identical allegations to the Park matter, which is now captionedArendas v. The Thomson Corporation, West Publishing Corporation d/b/a BAR/BRI and Doe Corporation, was filed in the Circuit Court for the Ninth Judicial Circuit in and for Orange County, Florida, alleging violations of Florida state antitrust law. We continue to defend ourselves vigorously in this case. See the section of this management’s discussion and analysis entitled “Subsequent Events” for further developments.
In addition to the matters described above, we are engaged in various legal proceedings and claims that have arisen in the ordinary course of business. The outcome of all of the proceedings and claims against us including, without limitation, those described above, is subject to future resolution, including the uncertainties of litigation. Based on information currently known by us and after consultation with outside legal counsel, management believes that the probable ultimate resolution of any such proceedings and claims, individually or in the aggregate, will not have a material adverse effect on our financial condition, taken as a whole.
Taxes
We maintain liabilities for tax contingencies (or uncertain tax positions) associated with known issues under discussion with tax authorities and transactions yet to be settled. We regularly assess the adequacy of this liability. Contingencies are reversed to income in the period in which we assess that they are no longer required, or when they become no longer required by statute, or when they are resolved through the normal tax audit process. Our contingency reserves principally represent liabilities for the years 2000 to 2007. It is anticipated that these reserves will either result in a cash payment or be reversed to income between 2008 and 2011.
37
Table of Contents
In the normal course of business, we enter into numerous intercompany transactions related to the sharing of data and technology. The tax rules governing such transactions are complex and necessitate us to make numerous assumptions. We have established certain contingencies related to these items. However, because of the volume and complexity of such transactions, it is possible that at some future date an additional liability could result from audits by the relevant taxing authorities.
Financial Risk
Our activities expose us to a variety of financial risks: market risk (including currency risk, fair value interest rate risk, cash flow interest rate risk and price risk), credit risk and liquidity risk. Our risk management strategy is to minimize potential adverse effects of these risks on our financial performance.
Market Risk
Currency Risk
Our consolidated financial statements are expressed in U.S. dollars but a portion of our business is conducted in currencies other than U.S. dollars. Changes in the exchange rates for such currencies into U.S. dollars can increase or decrease our revenues, earnings and the carrying values of our assets and liabilities in our consolidated balance sheet. Changes in exchange rates between 2006 and 2007 increased our revenues by approximately 2%. The translation effects of changes in exchange rates in our consolidated balance sheet are recorded within the translation adjustment component of accumulated other comprehensive income in our shareholders’ equity. In 2007, we recorded net translation gains of $89 million, reflecting the 2007 effect of changes in exchange rates of various currencies compared to the U.S. dollar.
We use derivative instruments only to reduce our foreign currency and interest rate exposures. In particular, when we borrow money in currencies other than the U.S. dollar, we generally enter into currency swap arrangements to effectively convert our obligations into U.S. dollars. All such swap arrangements are entered into only with counterparties that are investment-grade financial institutions. At December 31, 2007, substantially all of our indebtedness was denominated in U.S. dollars or had been swapped into U.S. dollar obligations.
Set out below are the U.S. dollar equivalents of our local currency revenues and operating profit for the year ended December 31, 2007. Based on our 2007 results of operations, a 10% change in the average exchange rate for each of these currencies into U.S. dollars would increase or decrease our full-year revenues and operating profit by the following amounts:
| Operating | Impact on | |||||||||||||||
| Currency | Revenues as | Impact on | profit as | operating | ||||||||||||
| (millions of U.S. dollars) | reported | revenues | reported | profit | ||||||||||||
| U.S. dollar | 5,859 | — | 1,138 | — | ||||||||||||
| British pounds sterling | 715 | 72 | 71 | 7 | ||||||||||||
| Euro | 230 | 23 | 9 | 1 | ||||||||||||
| Canadian dollar | 170 | 17 | 4 | — | ||||||||||||
| Australian dollar | 100 | 10 | 7 | 1 | ||||||||||||
| Other | 222 | 22 | 68 | 7 | ||||||||||||
| Total | 7,296 | 144 | 1,297 | 16 | ||||||||||||
In addition to exposing us to changes in foreign currency exchange rates and interest rates, operating in foreign countries subjects us to inherent risks in doing business in certain jurisdictions outside North America. These include difficulties in penetrating new markets, exposure to varying legal standards in other jurisdictions and the potential instability of local economies and governments.
38
Table of Contents
As of December 31, 2007, we held approximately £2.2 billion of cash and cash equivalents in British pounds sterling as part of our hedging program related to the Reuters acquisition. A 1% appreciation or depreciation in the value of sterling versus the U.S. dollar would give rise to an increase or decrease in the value of such funds by approximately $45 million as compared to the U.S. dollar equivalent as of December 31, 2007.
Additionally, as of December 31, 2007, we held sterling call options with a cumulative notional value of £2,300 million and various strike prices approximating $2.05/£1.00. A 1% appreciation or depreciation in the value of sterling versus the U.S. dollar as compared to the exchange rate at December 31, 2007, would change the value of the options by approximately $10 million, as compared to their value as of December 31, 2007.
Cash Flow and Fair Value Interest Rate Risk
We are exposed to fluctuations in interest rates with respect to our cash and cash equivalent balances and our long-term borrowings.
As of December 31, 2007, our interest-bearing assets comprised approximately $7.5 billion of cash and cash equivalents, substantially all of which is invested in money market mutual funds. Based on amounts as of December 31, 2007, a 100 basis point change in interest rates would have the effect of increasing or decreasing annual interest income by approximately $75 million.
Substantially all of our borrowings have been issued at fixed rates and a portion of such borrowings were maintained at fixed rates and other borrowings were converted into variable rate debt through the use of derivative instruments. At December 31, 2007, after taking into account swap agreements, 89% of our total debt was at fixed rates of interest and the remainder was at floating rates of interest. Based upon these levels, a 100 basis point change in interest rates would increase or decrease our full-year interest expense by approximately $5 million. A 100 basis point change in interest rates would increase or decrease the fair value of our debt by approximately $200 million.
As of December 31, 2007, we had entered into two treasury lock agreements with a total notional amount of $800 million. The treasury lock agreements expire in May 2008 and have a weighted average interest rate of 4.22%. The fair value of the treasury lock agreements represented a loss of $10 million at December 31, 2007. A 100 basis point change in interest rates would increase or decrease the value of the treasury lock agreements by approximately $50 million.
Price Risk
We have no significant exposure to equity securities price risk or to commodity price risk.
Credit Risk
Credit risk arises from cash and cash equivalents and derivative financial instruments, as well as credit exposure to customers including outstanding receivables.
We place our cash investments with high-quality financial institutions and limit the amount of exposure to any one institution. At December 31, 2007, approximately 70% of our cash was invested in money market funds with numerous institutions. All of the money market funds were rated AAA. The majority of the remaining cash and cash equivalents amounts were held by institutions that were rated at least AA-.
We attempt to minimize our credit exposure on derivative contracts by entering into transactions only with counterparties that are major investment-grade international financial institutions.
39
Table of Contents
With respect to customers, we use credit limits to minimize our exposure to any one customer.
Our maximum exposure with respect to credit, assuming no mitigating factors, would be the aggregate of our cash and cash equivalents ($7.5 billion), derivative exposure ($450 million) and accounts and notes receivable ($1.6 billion).
Liquidity Risk
We aim to maintain flexibility in funding by keeping committed credit lines available. Additionally, we evaluate our expectations of future cash flow.
OUTLOOK
The information in this section is forward-looking and should be read in conjunction with the section below entitled “Cautionary Note Concerning Factors That May Affect Future Results”.
We and Reuters have submitted our proposed acquisition of Reuters to our respective shareholders for approval and applied for requisite court approvals in Ontario, Canada and England. Special shareholder meetings for our Company and Reuters are each scheduled for March 26, 2008 to approve the transaction. Assuming the requisite shareholder and court approvals are received, we anticipate completing the transaction on April 17, 2008.
We expect to provide a 2008 outlook when we release our results for the first quarter of 2008.
RELATED PARTY TRANSACTIONS
As of March 6, 2008, The Woodbridge Company Limited (Woodbridge) and other companies affiliated with it together beneficially owned approximately 70% of our common shares.
From time to time, in the normal course of business, Woodbridge and its affiliates purchase some of our products and service offerings. These transactions are negotiated at arm’s length on standard terms, including price, and are not significant to our results of operations or financial condition individually or in the aggregate.
In the normal course of business, a Woodbridge-owned company rents office space from one of our subsidiaries. Additionally, a number of our subsidiaries charge a Woodbridge-owned company fees for various administrative services. In 2007, the total amounts charged to Woodbridge for these rentals and services were approximately $1 million (2006 – $2 million).
The employees of Jane’s Information Group (Jane’s) participated in our pension plans in the United States and United Kingdom, as well as the defined contribution plan in the United States, until June 2007. We had owned Jane’s until we sold it to Woodbridge in April 2001. As part of the original purchase from us, Woodbridge assumed the pension liability associated with the active employees of Jane’s. As a consequence of the sale of Jane’s by Woodbridge in June 2007, Jane’s employees have ceased active participation in our plans. From April 2001 until June 2007, Jane’s made proportional contributions to these pension plans as required, and made matching contributions in accordance with the provisions of the defined contribution plan. Coincident with the sale of Jane’s by Woodbridge in June 2007, Jane’s ceased to be a participating employer in any Thomson benefit plan. As a result of this change, and in compliance with applicable regulations in the United Kingdom, Jane’s made a cash contribution to our United Kingdom pension plan of approximately $12 million (£6 million).
We purchase property and casualty insurance from third party insurers and retain the first $1 million of each and every claim under the programs via our captive insurance subsidiary. Woodbridge is included in these programs and pays us a premium commensurate with its exposures. In 2007, these premiums were about $50,000 (2006 – $50,000), which would approximate the premium charged by a third party insurer for such coverage. In 2007, we paid approximately $100,000 in claims to Woodbridge.
40
Table of Contents
We have entered into an agreement with Woodbridge under which Woodbridge has agreed to indemnify up to $100 million of liabilities incurred either by our current and former directors and officers or by our company in providing indemnification to these individuals on substantially the same terms and conditions as would apply under an arm’s length, commercial arrangement. A third party administrator will manage any claims under the indemnity. We pay Woodbridge an annual fee of $750,000, which is less than the premium that we would have paid for commercial insurance. In connection with the closing of the Reuters transaction, we plan to replace this agreement with a conventional insurance arrangement.
In September 2006, we entered into a contract with Hewitt Associates Inc. to outsource certain human resources administrative functions in order to improve operating and cost efficiencies. Under the current contract, we expect to pay Hewitt an aggregate of approximately $165 million over the ten year period of the contract. In 2007, we paid Hewitt $11 million (2006 – $16 million) for its services. Mr. Denning, one of our directors and the chairman of the board’s Human Resources Committee, is also a director of Hewitt. Mr. Denning has not participated in negotiations related to the contract and has refrained from deliberating and voting on the matter by the Human Resources Committee and the board of directors.
During the course of 2008, Woodbridge plans to reinvest the equivalent of 50% of the dividends that it receives during the first three quarters of 2008. Woodbridge’s reinvestment in additional common shares of our company at the prevailing market rate will be in accordance with the terms of our DRIP. Thomson shareholders may elect to reinvest their dividends in our common shares at the prevailing market price.
ACTUAL AND ESTIMATED COSTS OF EMPLOYEE FUTURE BENEFITS
We sponsor defined benefit plans providing pension and other post-retirement benefits to covered employees. The largest plan consists of a qualified defined benefit pension plan in the United States, which we closed to new participants in March 2006. Other smaller plans exist primarily in the United Kingdom and Canada. We use a measurement date of September 30 for the majority of these plans.
Management of our company currently estimates that, excluding the impact of the Reuters acquisition, the 2008 cost of employee future benefits will be approximately 30% lower than that of 2007 due to changes in assumptions, principally related to increases in the discount rates. The determination of the cost and obligations associated with employee future benefits requires the use of various assumptions, including an expected rate of return on assets and a discount rate to measure obligations. We consult with our actuary regarding the selection of these assumptions each year.
In determining our long-term rate of return assumption for our pension plans, we evaluated historical investment returns, as well as input from investment advisors. For our primary pension plan in the United States, we also consider our actuary’s simulation model of expected long-term rates of return assuming our targeted investment portfolio mix. We will reduce our 2008 assumption of the expected rate of return on assets available to fund obligations for our primary pension plan in the United States by 0.50% to 7.25%. While the actual return on plan assets in 2007 of 14% exceeded the expected rate of return due to higher than expected equity returns, management nevertheless decided to decrease the expected rate of return in 2008 in anticipation of changes to the plan’s investment portfolio mix. Adjusting the expected rate of return on assets for this plan upward or downward by another 50 basis points would decrease or increase, respectively, pension expense by less than $6 million in 2008.
Our discount rate is selected based on a review of current market interest rates of high-quality, fixed-rate debt securities adjusted to reflect the duration of expected future cash outflows for pension benefit payments. In developing the discount rate assumption for our primary pension plan in the United States for 2008, we reviewed the high-grade bond indices published by Moody’s and Merrill Lynch as of September 30, 2007, which are based on debt securities with average durations of 10 to 15 years. Because we have a relatively young workforce, the duration of our expected future cash outflows for our plan tends to be longer than the duration of the bond indices we reviewed. Therefore, our discount rate tends to be higher than the rates of these benchmarks. To appropriately reflect the timing and amounts of the plan’s expected future pension benefit payments, our actuary analyzed market data and constructed a hypothetical yield curve that represents yields on high quality zero-coupon bonds with durations that mirrored the duration of the expected payment stream of the benefit obligation. The discount rate determined on this basis was 6.35%, approximately 40 basis points higher than that of the prior year. Adjusting the discount rate upward or downward by another 40 basis points would result in a decrease or increase, respectively, in pension expense of approximately $16 million in 2008.
41
Table of Contents
As of December 31, 2007, we had cumulative unrecognized actuarial losses associated with all of our pension plans of $220 million, compared to $466 million at December 31, 2006. The majority of these losses are a result of the decline in discount rates over the past five years reflecting the overall decline in interest rates, primarily in the United States. These amounts also include actuarial gains and losses associated with the difference between our expected and actual returns on plan assets. Actuarial gains and losses are included in the calculation of our annual pension expense subject to the following amortization methodology. Unrecognized actuarial gains or losses are netted with the difference between the market-related value and fair value of plan assets. To the extent this net figure exceeds 10% of the greater of the projected benefit obligation or market-related value of plan assets, it is amortized into pension expense on a straight-line basis over the expected average service life of active participants (approximately 8 years at December 31, 2007). Unrecognized actuarial gains and losses below the 10% corridor are deferred. In applying this amortization method, the estimated pension expense for 2008 includes $17 million of the unrecognized actuarial losses at December 31, 2007.
As of December 31, 2007, the fair value of plan assets for our primary pension plan in the United States represented about 109% of the plan’s projected benefit obligation. We did not make any voluntary contributions in 2007. During 2007, we contributed $37 million to our defined benefit plan in the United Kingdom. The contributions were required by statute as a result of the disposal of certain businesses in the United Kingdom. Of the total, $25 million was required in connection with the disposal of Thomson Learning and $12 million was required in connection with Jane’s.
We are not required to make contributions to our primary pension plan in the United States in 2008. However, from time to time, we may elect to voluntarily contribute to the plan in order to improve its funded status. Because the decision to voluntarily contribute is based on various market-related factors, including asset values and interest rates, which are used to determine the plan’s funded status, we cannot predict whether, or the amount, we may elect to voluntarily contribute in 2008.
We provide post-retirement healthcare benefits for certain retired employees. However, these liabilities are significantly less than those associated with our pension plans. Retired employees share a portion of the cost of these benefits. We fund the accrued costs of these plans as benefits are paid. Annual post-retirement expense for 2008 was calculated based upon a number of actuarial assumptions, including a healthcare cost trend rate of 9% that declines 50 basis points per year for nine years, and thereafter remains constant at 5%. The healthcare cost trend rate is based on our actual medical claims experience and future projections of medical costs. A 1% change in the trend rate would result in an increase or decrease in the benefit obligation for post-retirement benefits of approximately $15 million at December 31, 2007.
SUBSEQUENT EVENTS
TaxStream Acquisition
In January 2008, we completed the acquisition of TaxStream, a provider of income tax provision software for corporations. TaxStream will be included in our Thomson Tax & Accounting segment.
Dividends
In February 2008, our board of directors approved an annual 2008 dividend of $1.08 per common share, an increase of $0.10 per common share, or 10%, over 2007. The new quarterly dividend rate of $0.27 per share is payable on March 17, 2008, to common shareholders of record as of February 21, 2008.
42
Table of Contents
TradeWeb Partnership
In October 2007, we announced that we had agreed to form a partnership with a consortium of nine global securities dealers to seek to further expand TradeWeb, our electronic trading unit within Thomson Financial. This transaction closed in January 2008.
Reuters Acquisition
On February 19, 2008, we announced that the European Commission, the U.S. Department of Justice and the Canadian Competition Bureau had given approval for our acquisition of Reuters.
In order to obtain the antitrust clearance for the acquisition, we agreed to sell a copy of the Thomson Fundamentals (Worldscope) database and Reuters has agreed to sell a copy of Reuters Estimates, Reuters Aftermarket Research and Reuters Economics (EcoWin) databases. The sales include copies of the databases, source data and training materials, as well as certain contracts and employees connected to the databases.
We and Reuters do not expect the required sales to have any material adverse effect on the revenues or profitability of Thomson Reuters or to have any impact on the synergies expected to be generated by the acquisition. The two companies are not required to complete the sales prior to the closing of the acquisition. All regulatory approvals to close the transaction have now been obtained.
We and Reuters will be seeking shareholder and court approvals and expect the transaction to close on or about April 17, 2008.
Litigation
In February 2008, a purported class action complaint alleging violations of U.S. federal antitrust laws was filed in the United States District Court for the Central District of California against West Publishing Corporation, d/b/a BAR/BRI and Kaplan Inc. Thomson intends to defend itself vigorously in this case.
CHANGES IN ACCOUNTING POLICIES
Income Taxes
Effective January 1, 2007, we voluntarily adopted a new accounting policy for uncertain income tax positions. As a result of this change in accounting policy, we recorded a non-cash charge of $33 million to our opening retained earnings as of January 1, 2007 with an offsetting increase to non-current liabilities.
Under our previous policy, we would reserve for tax contingencies if it was probable that an uncertain position would not be upheld. Under our new policy, we evaluate a tax position using a two-step process:
| • | First, we determine whether it is more likely than not that a tax position will be sustained upon examination, including resolution of any related appeals or litigation processes, based on the technical merits of the position. In evaluating whether a tax position has met the more-likely-than-not recognition threshold, we presume that the position will be examined by the appropriate taxing authority that has full knowledge of all relevant information. | ||
| • | Second, a tax position that meets the more-likely-than-not recognition threshold is measured to determine the amount of benefit to recognize in the financial statements. The tax position is measured at the largest amount of benefit that is greater than 50% likely of being realized upon ultimate settlement. If the tax position does not meet the more-likely-than-not recognition threshold, no benefit from the tax position is recorded. |
43
Table of Contents
We were not able to retroactively apply this new policy as the data to determine the amounts and probabilities of the possible outcomes of the various tax positions that could be realized upon ultimate settlement was not collected in prior periods. Further, significant judgments are involved in assessing these tax positions and we concluded that it is not possible to estimate the effects of adopting the policy at an earlier date.
Financial Instruments and Comprehensive Income
As of December 31, 2007, the Company adopted Canadian Institute of Chartered Accountants (CICA) Handbook Section 1535,Capital Disclosures, and CICA Handbook Section 3862,Financial Instruments – Disclosures.
Effective January 1, 2006, we adopted CICA Handbook Section 1530,Comprehensive Income, CICA Handbook Section 3855,Financial Instruments – Recognition and Measurementand CICA Handbook Section 3865,Hedges. These new Handbook Sections provide comprehensive requirements for the recognition and measurement of financial instruments, as well as standards on when and how hedge accounting may be applied. Handbook Section 1530 also introduces a new component of equity referred to as accumulated other comprehensive income.
Under these new standards, all financial instruments, including derivatives, are included on our consolidated balance sheet and are measured either at fair market value or, in limited circumstances, at cost or amortized cost. Derivatives that qualify as hedging instruments must be designated either as a “cash flow hedge”, when the hedged item is a future cash flow, or a “fair value hedge”, when the hedged item is the fair value of a recognized asset or liability. The effective portion of unrealized gains and losses related to a cash flow hedge are included in other comprehensive income. For a fair value hedge, both the derivative and the hedged item are recorded at fair value in our consolidated balance sheet and the unrealized gains and losses from both items are included in earnings. For derivatives that do not qualify as hedging instruments, unrealized gains and losses are reported in earnings.
In accordance with the provisions of these new standards, we reflected the following adjustments as of January 1, 2006:
| • | an increase of $53 million to “Other non-current assets” and “Accumulated other comprehensive income” in the consolidated balance sheet relative to derivative instruments that consisted primarily of interest rate contracts, which convert floating rate debt to fixed rate debt and qualify as cash flow hedges; | ||
| • | a reclassification of $5 million from “Other current assets” and $3 million from “Other current liabilities” to “Accumulated other comprehensive income” in the consolidated balance sheet related primarily to previously deferred gains and losses on settled cash flow hedges; and | ||
| • | an increase of $16 million to “Other non-current assets” and “Long-term debt” in the consolidated balance sheet related to derivative instruments and their related hedged items. These derivative instruments consist primarily of interest rate contracts to convert fixed rate debt to floating and qualify as fair value hedges. |
The adoption of these new standards had no material impact on our consolidated statement of earnings. The unrealized gains and losses included in “Accumulated other comprehensive income” were recorded net of taxes, which were nil.
Discontinued Operations
In April 2006, the Emerging Issues Committee of the CICA (EIC) issued Abstract 161,Discontinued Operations(EIC-161). The abstract addresses the appropriateness of allocating interest expense to a discontinued operation and disallows allocations of general corporate overhead. EIC-161 was effective upon its issuance and did not have an impact on our consolidated financial statements.
44
Table of Contents
Stock-Based Compensation
In July 2006, we adopted EIC Abstract 162,Stock-Based Compensation for Employees Eligible to Retire Before the Vesting Date(EIC-162), retroactively to January 1, 2006. The abstract clarifies the proper accounting for stock-based awards granted to employees who either are eligible for retirement at the grant date or will be eligible before the end of the vesting period and continue vesting after, or vest upon, retirement. In such cases, the compensation expense associated with the stock-based award will be recognized over the period from the grant date to the date the employee becomes eligible to retire. EIC-162 did not have an impact on our consolidated financial statements for any period in 2006.
CRITICAL ACCOUNTING POLICIES
The preparation of our financial statements requires management to make judgments, estimates and assumptions that affect the reported amounts of assets and liabilities, disclosure of contingent assets and liabilities at the date of the financial statements and the reported amounts of revenues and expenses during the reporting period. Our estimates are based on historical experience and on various other assumptions that are believed to be reasonable under the circumstances. The result of our ongoing evaluation of these estimates forms the basis for making judgments about the carrying values of assets and liabilities and the reported amounts of revenues and expenses that are not readily apparent from other sources. Actual results may differ from these estimates under different assumptions.
Our critical accounting policies are those that we believe are the most important in portraying our financial condition and results, and require the most subjective judgment and estimates on the part of management. A summary of our significant accounting policies, including the critical accounting policies discussed below, is set forth in note 1 to our consolidated financial statements.
Revenue Recognition
Revenues from subscription-based products, excluding software, generally are recognized ratably over the term of the subscription. Where applicable, we recognize usage fees as earned. Subscription payments received or receivable in advance of delivery of our products or services are included in our deferred revenue account on our consolidated balance sheet. As we deliver subscription-based products and services to subscribers, we recognize the proportionate share of deferred revenue in our consolidated statement of earnings and our deferred revenue account balance is reduced. Certain incremental costs that are directly related to the subscription revenue are deferred and amortized over the subscription period.
Increasingly, we derive revenue from the sale of software products, license fees, software subscriptions, product support, professional services, transaction fees and multiple element arrangements that may include any combination of these items. We generally recognize revenue when persuasive evidence of an arrangement exists, we have delivered the product or performed the service, the fee is fixed or determinable and collectibility is probable. However, determining whether and when some of these criteria have been satisfied often involves assumptions and judgments that can have a significant impact on the timing and amount of revenue we report. For multiple element arrangements we must make assumptions and judgments in order to allocate the total price among the various elements we must deliver to determine whether undelivered services are essential to the functionality of the delivered products and services, to determine whether objective evidence of fair value exists for each undelivered element and to determine whether and when each element has been delivered. If we were to change any of these assumptions or judgments, it could cause a material increase or decrease in the amount of revenue that we report in a particular period. Amounts for fees collected or invoiced and due relating to arrangements where revenue cannot be recognized are reflected on our balance sheet as deferred revenue and recognized when the applicable revenue recognition criteria are satisfied.
For all accounts receivable, we must make a judgment regarding the ability of our customers to pay and, accordingly, we establish an allowance for estimated losses arising from non-payment. We consider customer creditworthiness, current economic trends and our past experience when evaluating the adequacy of this allowance. If future collections differ from our estimates, our future earnings would be affected.
45
Table of Contents
At December 31, 2007, our combined allowances on our accounts receivable balance were $81 million, or 5% of the gross accounts receivable balance. A 1% increase in this percentage would have resulted in additional expense of approximately $16 million.
Capitalized Software
A significant portion of our expenditures relates to software that is developed as part of our electronic databases, delivery systems and internal infrastructures, and, to a lesser extent, software sold directly to our customers. During the software development process, our judgment is required to determine the expected period of benefit over which capitalized costs should be amortized. Due to rapidly changing technology and the uncertainty of the software development process itself, our future results could be affected if our current assessment of our various projects differs from actual performance. At December 31, 2007, we had $721 million of capitalized costs related to software on our consolidated balance sheet.
Identifiable Intangible Assets and Goodwill
We account for our business acquisitions using the purchase method of accounting. We allocate the total cost of an acquisition to the underlying net assets based on their respective estimated fair values. As part of this allocation process, we must identify and attribute values and estimated lives to the intangible assets acquired. These determinations involve significant estimates and assumptions, including those with respect to future cash inflows and outflows, discount rates and asset lives, and therefore require considerable judgment. These determinations will affect the amount of amortization expense recognized in future periods.
We review the carrying values of identifiable intangible assets with indefinite lives and goodwill at least annually to assess impairment because these assets are not amortized. Additionally, we review the carrying value of any intangible asset or goodwill whenever events or changes in circumstances indicate that its carrying amount may not be recoverable. Examples of such events or changes in circumstances include significant negative industry or economic trends, significant changes in the manner of our use of the acquired assets or our strategy, a significant decrease in the market value of the asset, or a significant change in legal factors or in the business climate that could affect the value of the asset.
We assess impairment by comparing the fair value of an identifiable intangible asset or goodwill with its carrying value. The determination of fair value involves significant management judgment. Impairments are expensed when incurred. Specifically, we test for impairment as follows:
Identifiable intangible assets with finite lives
We compare the expected undiscounted future operating cash flows associated with the asset to its carrying value to determine if the asset is recoverable. If the expected future operating cash flows are not sufficient to recover the carrying value, we estimate the fair value of the asset. Impairment is recognized when the carrying amount of the asset is not recoverable and when the carrying value exceeds fair value.
Identifiable intangible assets with indefinite lives
Selected tradenames comprise the entire balance of our identifiable intangible assets with indefinite lives. We determine the fair values of our intangible assets with indefinite lives using an income approach, specifically the relief from royalties method. Impairment is recognized when the carrying amount exceeds fair value.
Goodwill
We test goodwill for impairment on a “reporting unit” level. A reporting unit is a business for which: (a) discrete financial information is available; and (b) segment management regularly reviews the operating results of that business. Two or more businesses shall be aggregated
46
Table of Contents
and deemed a single reporting unit if the businesses have similar economic characteristics. We test goodwill for impairment using the following two-step approach:
| • | In the first step, we determine the fair value of each reporting unit. If the fair value of a reporting unit is less than its carrying value, this is an indicator that the goodwill assigned to that reporting unit might be impaired, which requires performance of the second step. | ||
| • | In the second step, we allocate the fair value of the reporting unit to the assets and liabilities of the reporting unit as if it had just been acquired in a business combination, and as if the purchase price was equivalent to the fair value of the reporting unit. The excess of the fair value of the reporting unit over the amounts assigned to its assets and liabilities is referred to as the implied fair value of goodwill. We then compare that implied fair value of the reporting unit’s goodwill to the carrying value of that goodwill. If the implied fair value is less than the carrying value, we recognize an impairment loss for that excess. |
We determine the fair value of our reporting units based on a combination of various techniques, including the present value of future cash flows, earnings multiples of competitors and multiples from sales of like-businesses.
As the valuation of identifiable intangible assets and goodwill requires significant estimates and judgment about future performance and fair values, our future results could be affected if our current estimates of future performance and fair values change. At December 31, 2007, identifiable intangible assets and goodwill amounted to $10.4 billion, or 45% of our total assets on our consolidated balance sheet.
Income Taxes
We are required to estimate our income taxes in each of the jurisdictions in which we operate. For interim periods, we provide income taxes based on our estimate of how much we will earn in each jurisdiction for the full year. To the extent that our forecasts differ from actual results, we must true-up our estimates of income tax expense. Actual amounts of income tax expense only become final upon filing and acceptance of the tax return by the relevant authorities, which occur subsequent to the issuance of the financial statements. To the extent our estimates differ from the final tax return, our earnings would be affected in a subsequent period. For 2007, our effective tax rate was 12.4% of our earnings from continuing operations before income taxes. A 1% increase in our effective tax rate would have resulted in additional income tax expense of approximately $13 million.
Estimation of income taxes includes estimating a value for our existing net operating losses based on our assessment of our ability to utilize them against future taxable income before they expire. Our assessment is based upon existing tax laws and estimates of future taxable income. If our assessment of our ability to use our net operating losses proves inaccurate in the future, we might be required to recognize more or less of the net operating losses as assets, which would decrease or increase our income tax expense in the relevant year. This would affect our earnings in that year.
Effective January 1, 2007, we voluntarily adopted a new accounting policy for uncertain income tax positions. As a result of this change in accounting policy, we recorded a non-cash charge of $33 million to our opening retained earnings as of January 1, 2007 with an offsetting increase to non-current liabilities.
Under our previous policy, we would reserve for tax contingencies if it was probable that an uncertain position would not be upheld. Under our new policy, we evaluate a tax position using a two-step process:
| • | First, we determine whether it is more likely than not that a tax position will be sustained upon examination, including resolution of any related appeals or litigation processes, based on the technical merits of the position. In evaluating whether a tax position has met the more-likely-than-not recognition threshold, we presume that the position will be examined by the appropriate taxing authority that has full knowledge of all relevant information. |
47
Table of Contents
| • | Second, a tax position that meets the more-likely-than-not recognition threshold is measured to determine the amount of benefit to recognize in the financial statements. The tax position is measured at the largest amount of benefit that is greater than 50% likely of being realized upon ultimate settlement. If the tax position does not meet the more-likely-than-not recognition threshold, no benefit from the tax position is recorded. |
Our accounting for income taxes requires us to exercise judgment for issues relating to known matters under discussion with tax authorities and transactions yet to be settled. It is reasonably possible that actual amounts payable resulting from audits by tax authorities could be materially different from the liabilities we have recorded due to the complex nature of the tax legislation that affects us.
Employee Future Benefits
The determination of the cost and obligations associated with our employee future benefits requires the use of various assumptions. We must select assumptions such as the expected return on assets available to fund pension obligations, the discount rate to measure obligations, the projected age of employees upon retirement, the expected rate of future compensation and the expected healthcare cost trend rate. These assumptions are re-evaluated each year, and variations between the actual results and the results based on our assumptions for any period will affect reported amounts in future periods. We retain an independent actuarial expert to prepare the calculations and to advise us on the selection of assumptions. See further discussion under the section entitled “Actual and Estimated Costs of Employee Future Benefits.”
RECENTLY ISSUED ACCOUNTING STANDARDS
In 2006, the CICA announced that it will no longer converge Canadian GAAP with generally accepted accounting principles of the United States (U.S. GAAP). Rather, the CICA will work towards convergence with International Financial Reporting Standards (IFRS) with the expectation that Canadian GAAP will be replaced by IFRS in 2011. As a public company, we are allowed to file our financial statements with the Canadian securities regulatory authorities under either Canadian GAAP or U.S. GAAP. We are also required to file an annual reconciliation of our earnings and shareholders’ equity between Canadian GAAP and U.S. GAAP with the U.S. Securities and Exchange Commission (SEC). This reconciliation is presented in note 24 of our financial statements.
We plan to adopt IFRS as soon as permissible under Ontario Securities Commission regulations.
48
Table of Contents
ADDITIONAL INFORMATION
Depreciation by Segment
The following table details depreciation expense by segment for 2007, 2006 and 2005.
| Year ended | ||||||||||||
| December 31 | ||||||||||||
| (millions of U.S. dollars) | 2007 | 2006 | 2005 | |||||||||
| Legal | 205 | 187 | 171 | |||||||||
| Financial | 172 | 180 | 178 | |||||||||
| Tax & Accounting | 21 | 22 | 20 | |||||||||
| Scientific | 32 | 23 | 20 | |||||||||
| Healthcare | 24 | 16 | 14 | |||||||||
| Corporate and Other | 14 | 10 | 10 | |||||||||
| Total | 468 | 438 | 413 | |||||||||
Disclosure Controls and Procedures
Our Chief Executive Officer and Chief Financial Officer, after evaluating the effectiveness of our disclosure controls and procedures (as defined in applicable U.S. and Canadian securities law) as of December 31, 2007, have concluded that our disclosure controls and procedures are effective to ensure that all information required to be disclosed by our company in reports that it files or furnishes under the U.S. Securities Exchange Act and applicable Canadian securities law is (i) recorded, processed, summarized and reported within the time periods specified in the rules and forms of the SEC and Canadian securities regulatory authorities and (ii) accumulated and communicated to our management, including our Chief Executive Officer and Chief Financial Officer, to allow timely decisions regarding required disclosure.
Internal Control over Financial Reporting
During the second quarter of 2007, we migrated certain of our financial processing systems to SAP software as well as transferred related workflows to shared service centers. This is an initiative within our ongoing THOMSONplusprogram, and we plan to continue implementing such changes throughout other parts of our businesses in 2008. In connection with this SAP implementation and transfer of workflows, we are modifying the design and documentation of our internal control processes and procedures. Except as described above, there have been no other changes in our internal control over financial reporting during 2007 that materially affected, or are reasonably likely to materially affect, our internal control over financial reporting.
Our management is responsible for establishing and maintaining adequate internal control over financial reporting to provide reasonable assurance regarding the reliability of financial reporting and the preparation of financial statements for external purposes in accordance with Canadian GAAP. Our management assessed the effectiveness of our internal control over financial reporting as of December 31, 2007, and based on that assessment determined that our internal control over financial reporting was effective. See our annual financial statements for the year ended December 31, 2007 for our management’s report on internal control over financial reporting.
Share Capital
As of March 6, 2008, we had outstanding 638,943,437 common shares, 6,000,000 Series II preference shares, 2,263,445 restricted share units and 13,723,359 stock options.
49
Table of Contents
Public Securities Filings
You may access other information about our company, including our annual information form and our other disclosure documents, reports, statements or other information that we file with the Canadian securities regulatory authorities through SEDAR atwww.sedar.comand in the United States with the SEC through EDGAR at www.sec.gov.
RECONCILIATIONS
RECONCILIATION OF RETURN ON INVESTED CAPITAL (ROIC) TO GAAP MEASURES
| 2007 | ||||||||||||
| (excluding | ||||||||||||
| discontinued | 2006 | |||||||||||
| (millions of U.S. dollars) (unaudited) | operations)(1) | (as reported) | 2005 | |||||||||
Calculation of Adjusted Operating Profit After Taxes | ||||||||||||
| Operating profit | 1,297 | 1,248 | 1,159 | |||||||||
| Add: | ||||||||||||
| Amortization | 256 | 240 | 235 | |||||||||
Reduce amount by Thomson Learning adjustments(2) | — | (19 | ) | — | ||||||||
| Segment operating profit of discontinued operations | — | 398 | 386 | |||||||||
| Adjusted operating profit | 1,553 | 1,867 | 1,780 | |||||||||
Taxes paid on operations(3) | (315 | ) | (311 | ) | (326 | ) | ||||||
| Post-tax adjusted operating profit | 1,238 | 1,556 | 1,454 | |||||||||
Calculation of Adjusted Invested Capital | ||||||||||||
| Equity | 13,571 | 10,481 | 9,963 | |||||||||
Total debt(3) | 4,859 | 4,321 | 4,283 | |||||||||
| Invested capital | 18,430 | 14,802 | 14,246 | |||||||||
| Adjustments: | ||||||||||||
Cash and other investments(4) | (7,497 | ) | (334 | ) | (423 | ) | ||||||
Debt swaps(5) | (424 | ) | (257 | ) | (193 | ) | ||||||
Current and long-term deferred taxes(3)(4) | 846 | 1,122 | 1,310 | |||||||||
Accumulated amortization and non-cash goodwill(3)(6) | 1,844 | 2,390 | 1,885 | |||||||||
Present value of operating leases(3)(7) | 604 | 783 | 754 | |||||||||
Historical intangible asset and equity investment write-downs(8) | 124 | 162 | 162 | |||||||||
Other(3)(4) | 778 | 798 | 821 | |||||||||
| Adjusted invested capital | 14,705 | 19,466 | 18,562 | |||||||||
| Average invested capital | 14,288 | 19,014 | 18,639 | |||||||||
| Return on invested capital | 8.7 | % | 8.2 | % | 7.8 | % | ||||||
| (1) | For 2007, we calculated ROIC based on reported results from continuing operations. No adjustment was made to add back the results of discontinued operations given that numerous disposals occurred during the year and partial year adjustments in these circumstances distort annualized results. In particular, the largest disposal, Thomson Learning, had a significant impact due to the fact that it is a highly seasonal business which was disposed of mid-year. Accordingly, the 2007 ROIC calculation excludes all impacts from businesses classified as discontinued operations. |
50
Table of Contents
| (2) | This adjustment reflects the actual results of the higher education, careers and library reference, NETg and Prometric businesses in Thomson Learning as if they had been part of continuing operations for the periods presented. Specifically, this amount reflects depreciation expense which is excluded from GAAP results under the accounting requirements for discontinued operations. Costs incurred in connection with the disposal of the businesses have been excluded. | |
| (3) | For 2006 (as reported) and 2005, amounts include discontinued operations. | |
| (4) | Items excluded as not deemed components of invested capital; “Other” primarily consists of non-current liabilities. | |
| (5) | Excludes debt swaps as balances are financing rather than operating-related. | |
| (6) | Excludes accumulated amortization as only gross identifiable intangible assets and goodwill cost are considered components of invested capital. Excludes goodwill arising from adoption of CICA 3465. This goodwill was created via deferred tax liability instead of cash purchase price. | |
| (7) | Present value of operating leases deemed component of invested capital. | |
| (8) | Adds back write-downs that were not cash transactions. |
51
Table of Contents
QUARTERLY INFORMATION (UNAUDITED)
The following table presents a summary of our consolidated operating results for our eight most recent quarters.
| Quarter ended | Quarter ended | Quarter ended | Quarter ended | |||||||||||||||||||||||||||||
| March 31 | June 30 | September 30 | December 31 | |||||||||||||||||||||||||||||
| (millions of U.S. dollars, except per common share amounts) | 2007 | 2006 | 2007 | 2006 | 2007 | 2006 | 2007 | 2006 | ||||||||||||||||||||||||
| Revenues | 1,662 | 1,500 | 1,805 | 1,624 | 1,796 | 1,617 | 2,033 | 1,850 | ||||||||||||||||||||||||
| Operating profit | 225 | 208 | 352 | 306 | 310 | 312 | 410 | 422 | ||||||||||||||||||||||||
| Earnings from continuing operations | 209 | 204 | 262 | 197 | 314 | 206 | 311 | 305 | ||||||||||||||||||||||||
| Discontinued operations, net of tax | 15 | (67 | ) | 115 | (24 | ) | 2,655 | 213 | 123 | 86 | ||||||||||||||||||||||
Net earnings | 224 | 137 | 377 | 173 | 2,969 | 419 | 434 | 391 | ||||||||||||||||||||||||
| Dividends declared on preference shares | (1 | ) | (1 | ) | (2 | ) | (2 | ) | (1 | ) | (1 | ) | (2 | ) | (1 | ) | ||||||||||||||||
Earnings attributable to common shares | 223 | 136 | 375 | 171 | 2,968 | 418 | 432 | 390 | ||||||||||||||||||||||||
Basic earnings (loss) per common share | ||||||||||||||||||||||||||||||||
| From continuing operations | $ | 0.32 | $ | 0.31 | $ | 0.41 | $ | 0.30 | $ | 0.49 | $ | 0.32 | $ | 0.48 | $ | 0.47 | ||||||||||||||||
| From discontinued operations | 0.03 | (0.10 | ) | 0.18 | (0.03 | ) | 4.14 | 0.33 | 0.19 | 0.14 | ||||||||||||||||||||||
| $ | 0.35 | $ | 0.21 | $ | 0.59 | $ | 0.27 | $ | 4.63 | $ | 0.65 | $ | 0.67 | $ | 0.61 | |||||||||||||||||
Diluted earnings (loss) per common share | ||||||||||||||||||||||||||||||||
| From continuing operations | $ | 0.33 | $ | 0.31 | $ | 0.40 | $ | 0.30 | $ | 0.49 | $ | 0.32 | $ | 0.48 | $ | 0.47 | ||||||||||||||||
| From discontinued operations | 0.02 | (0.10 | ) | 0.18 | (0.04 | ) | 4.12 | 0.33 | 0.19 | 0.14 | ||||||||||||||||||||||
| $ | 0.35 | $ | 0.21 | $ | 0.58 | $ | 0.26 | $ | 4.61 | $ | 0.65 | $ | 0.67 | $ | 0.61 | |||||||||||||||||
Historically, in terms of revenues and profits, the first quarter is proportionately the smallest quarter for us and the fourth quarter our largest, as certain product releases are concentrated at the end of the year, particularly in the regulatory and healthcare markets. Costs are incurred more evenly throughout the year. As a result, our operating margins will generally increase as the year progresses. In general, our year-over-year performance reflected increased operating profit driven by higher revenues from existing businesses and contributions from acquired businesses.
52
Table of Contents
In the quarter ended March 31, 2006, earnings from continuing operations and net earnings reflected the recognition of certain tax credits. In the quarter ended September 30, 2007, earnings from discontinued operations reflected a gain on the sale of Thomson Learning’s higher education, careers and library reference businesses.
CAUTIONARY NOTE CONCERNING FACTORS THAT MAY AFFECT FUTURE RESULTS
Certain information in this management’s discussion and analysis are forward-looking statements that are not historical facts but reflect our current expectations regarding future results. These forward-looking statements also include statements about our beliefs and expectations related to anticipated run-rate savings and costs related to THOMSONplus as well as the timing for the program and the delivery of expected synergies arising from the proposed Reuters acquisition. There can be no assurance that the proposed Reuters acquisition will be consummated or that the anticipated benefits will be realized. The proposed Reuters acquisition is subject to shareholder and court approvals and the fulfillment of certain closing conditions, and there can be no assurance that any such approvals will be obtained and/or such conditions will be met. These forward-looking statements are subject to a number of risks and uncertainties that could cause actual results or events to differ materially from current expectations. These risks and uncertainties include the ability to achieve the synergies contemplated through the proposed acquisition; the failure of Reuters shareholders to approve the proposed acquisition; the reaction of Thomson’s and Reuters customers, employees and suppliers to the proposed acquisition; the ability to promptly and effectively integrate the businesses of Thomson and Reuters after the acquisition closes; and the diversion of management time on proposed acquisition-related issues. Some of the factors that could also cause our actual results or events to differ materially from current expectations are: changes in the general economy; actions of competitors; changes to legislation and regulations; increased accessibility to free or relatively inexpensive information sources; failure to derive fully anticipated benefits from future or existing acquisitions, joint ventures, investments or dispositions; failure to develop new products, services, applications and functionalities to meet customers’ needs, attract new customers or expand into new geographic markets; failure of electronic delivery systems, network systems or the Internet; detrimental reliance on third parties for information; failure to meet the challenges involved in the expansion of international operations; failure to realize the anticipated cost savings and operating efficiencies from ongoing initiatives; failure to protect our reputation; impairment of goodwill and identifiable intangible assets; failure of significant investments in technology to increase revenues or decrease operating costs; increased self-sufficiency of customers; inadequate protection of intellectual property rights; downgrading of credit ratings; threat of legal actions and claims; changes in foreign currency exchange and interest rates; failure to recruit and retain high quality management and key employees; funding obligations in respect of pension and post-retirement benefit arrangements; and actions or potential actions that could be taken by Woodbridge. Additional factors are discussed in our materials filed with the securities regulatory authorities in Canada and the United States from time to time, including our management information circular dated February 29, 2008, relating to our special meeting of shareholders to be held on March 26, 2008. These risks are also incorporated by reference in our annual information form for the year ended December 31, 2007, which is contained in our annual report on Form 40-F for the year ended December 31, 2007. We disclaim any intention or obligation to update or revise any forward-looking statements, whether as a result of new information, future events or otherwise, other than as required by law, rule or regulation.
53