UNITED STATES
SECURITIES AND EXCHANGE COMMISSION
Washington, DC 20549
FORM 10-K/A
(Amendment No. 1)
| x | ANNUAL REPORT PURSUANT TO SECTION 13 OR 15(d) OF THE SECURITIES EXCHANGE ACT OF 1934 |
For the fiscal year ended December 31, 2007
OR
| ¨ | TRANSITION REPORT PURSUANT TO SECTION 13 OR 15(d) OF THE SECURITIES EXCHANGE ACT OF 1934 |
For the transition period from to .
Commission file number: 000-31989
INTERNAP NETWORK SERVICES CORPORATION
(Exact Name of Registrant as Specified in Its Charter)
| Delaware | 91-2145721 | |
(State or Other Jurisdiction of Incorporation or Organization) | (I.R.S. Employer Identification No.) | |
250 Williams Street Atlanta, Georgia | 30303 | |
| (Address of principal executive offices) | (Zip Code) |
(404) 302-9700
Securities registered pursuant to Section 12(b) of the Act:
| Title of Each Class | Name of Exchange on Which Registered | |
| Common Stock, $0.001 par value | The NASDAQ Stock Market LLC (NASDAQ Global Market) |
Securities registered pursuant to Section 12(g) of the Act: None
Indicate by check mark if the registrant is a well-known seasoned issuer, as defined in Rule 405 of the Securities Act. Yes o No x
Indicate by check mark if the registrant is not required to file reports pursuant to Section 13 or Section 15(d) of the Act. Yes o No x
Indicate by check mark whether the registrant (1) has filed all reports required to be filed by Section 13 or 15(d) of the Securities Exchange Act of 1934 during the preceding 12 months (or for such shorter period that the registrant was required to file such reports), and (2) has been subject to such filing requirements for the past 90 days. Yes x No o
Indicate by check mark if disclosure of delinquent filers pursuant to Item 405 of Regulation S-K (§229.405) is not contained herein, and will not be contained, to the best of registrant’s knowledge, in definitive proxy or information statements incorporated by reference in Part III of this Form 10-K/A or any amendment to this Form 10-K/A. o
Indicate by check mark whether the registrant is a large accelerated filer, an accelerated filer, a non-accelerated filer, or a smaller reporting company. See the definitions of “large accelerated filer,” “accelerated filer” and “smaller reporting company” in Rule 12b-2 of the Exchange Act. (Check one):
Large accelerated filer o | Accelerated filer x |
Non-accelerated filer o (Do not check if a smaller reporting company) | Smaller reporting company o |
Indicate by check mark whether the registrant is a shell company (as defined in Rule 12b-2 of the Act). Yes o No x
The aggregate market value of the registrant’s outstanding common stock held by non-affiliates of the registrant was $698,160,175 based on a closing price of $14.42 on June 30, 2007 as quoted on the NASDAQ Global Market.
As of March 6, 2008, 49,793,430 shares of the registrant’s common stock, par value $0.001 per share, were issued and outstanding.
DOCUMENTS INCORPORATED BY REFERENCE
None.
EXPLANATORY NOTE
Internap Network Services Corporation (the “Company” or “Internap”) is filing this Amendment No. 1 on Form 10-K/A (the “Amendment”) to amend its Annual Report on Form 10-K for the fiscal year ended December 31, 2007, originally filed on March 31, 2008 (the “Original Filing”) to set forth the information required by Items 10, 11, 12, 13, and 14 under Part III of Form 10-K because a definitive proxy statement containing such information will not be filed within 120 days after the end of the fiscal year covered by the Company’s original Form 10-K filing. This Annual Report on Form 10-K/A amends Part III of the Company’s Original Filing only, and all other portions of the Company’s Original Filing remain in effect and have not been amended to reflect events and developments since the original March 31, 2008 filing date.
As required by Rule 12b-15 promulgated under the Securities and Exchange Act of 1934, our Chief Executive Officer and Chief Financial Officer are providing Rule 13a-14(a) certifications dated April 30, 2008 in connection with this Amendment No. 1 on Form 10-K/A and written statements pursuant to Section 906 of the Sarbanes-Oxley Act of 2002 dated April 30, 2008.
The Original Filing as amended hereby continues to speak as of the date of the Original Filing and the disclosures have not been amended to speak to any later date. Any items in the Original Filing that are not expressly amended hereby shall be as set forth in the Original Filing. The Company has included the portions of the Original Filing that are not amended by this Amendment for informational purposes only. All information contained in this Amendment and the Original Filing is subject to updating and supplementing as provided in our subsequent periodic reports filed with the Securities and Exchange Commission.
TABLE OF CONTENTS
| Page | ||||
| PART I | ||||
| 4 | ||||
| 14 | ||||
| 27 | ||||
27 | ||||
27 | ||||
27 | ||||
| PART II | ||||
| 27 | ||||
| 30 | ||||
| 32 | ||||
| 54 | ||||
| 55 | ||||
| 55 | ||||
| 55 | ||||
| 56 | ||||
| PART III | ||||
| 57 | ||||
| 60 | ||||
| 78 | ||||
| 80 | ||||
| 80 | ||||
| PART IV | ||||
| 81 | ||||
| 85 | ||||
FORWARD-LOOKING STATEMENTS
This Annual Report on Form 10-K/A contains “forward-looking statements” within the meaning of Section 21E of the Securities Exchange Act of 1934, as amended. Forward-looking statements include statements regarding industry trends, our future financial position and performance, business strategy, revenues and expenses in future periods, projected levels of growth, and other matters that do not relate strictly to historical facts. These statements are often identified by the use of words such as “may,” “will,” “seeks,” “anticipates,” “believes,” “estimates,” “expects,” “projects,” “forecasts,” “plans,” “intends,” “continue,” “could,” “should,” or similar expressions or variations. These statements are based on the beliefs and expectations of our management team based on information currently available. Such forward-looking statements are not guarantees of future performance and are subject to risks and uncertainties that could cause actual results to differ materially from those contemplated by forward-looking statements. Important factors currently known to our management that could cause or contribute to such differences include, but are not limited to, those set forth in this annual report under “Item 1A . Risk Factors.” We undertake no obligation to update any forward-looking statements as a result of new information, future events or otherwise.
As used herein, except as otherwise indicated by context, references to “we,” “us,” “our,” or the “Company” refer to Internap Network Services Corporation.
PART I
Overview
We were incorporated as a Washington corporation in 1996 and reincorporated in Delaware in 2001. Our principal executive offices are located at 250 Williams Street, Suite E-100, Atlanta, Georgia 30303, and our telephone number at that location is (404) 302-9700. Our common stock trades on the NASDAQ Global Market under the symbol “INAP.”
We market products and services that optimize the performance and reliability of strategic business Internet applications for e-commerce, customer relationship management, or CRM, multimedia streaming, Voice-over Internet-Protocol, or VoIP, virtual private networks, or VPNs, and supply chain management. Our product and service offerings are complemented by value-added services such as colocation and data center services and managed security services. We also provide products and services for storing and delivering audio and video digital media to large audiences over the Internet through a subsidiary, VitalStream Holdings, Inc., or VitalStream. Our content delivery network, or CDN, was purpose-built for streaming digital media and enables content owners to monetize their digital media assets via both subscription and advertising-based business models. Our VitalStream subsidiary also offers: proprietary advertising selection and advertising insertion capabilities, enabling customers to turn existing streaming traffic into content packaged with advertising; Internet Protocol Television, or IPTV; professional services; and small business services. Additionally, we offer high levels of pre- and post- installation service and consulting.
As of December 31, 2007, we delivered services through our 50 service points across North America, Europe, Asia, and Australia, which feature direct high-speed connections to multiple major Internet backbones such as AT&T Inc., Sprint Nextel Corporation, Verizon Communications Inc., Savvis, Inc., Global Crossing Limited, Level 3 Communications, Inc., and Verio, an NTT Communications Company. Our proprietary route optimization technology monitors the performance of Internet networks allowing our customer traffic to be “intelligently” routed over the optimal path in a way that maximizes performance and reliability of the transactions by minimizing loss and delays inherent across the Internet. We believe our unique managed multi-network approach provides better performance, control and reliability compared to conventional Internet connectivity alternatives. Our service level agreements, or SLAs, guarantee performance across the entire Internet, excluding local connections, whereas providers of conventional Internet connectivity typically only guarantee performance on their own network. Internap serves customers in a variety of industries including financial services, entertainment and media, travel, e-commerce, retail, and technology. As of December 31, 2007, we provided our services to approximately 3,800 customers in the United States and abroad.
4
Developments in 2007
VitalStream Acquisition. On February 20, 2007, we completed our acquisition of VitalStream pursuant to an Agreement and Plan of Merger, dated October 12, 2006. As a result, we issued approximately 12.2 million shares of common stock to VitalStream stockholders, which represented approximately 25% of our outstanding shares. We also assumed outstanding options for the purchase of shares of VitalStream common stock, which we converted into options to purchase approximately 1.5 million shares of Internap common stock. VitalStream is now a wholly-owned subsidiary of Internap.
Restructuring Liability. On March 31, 2007, we incurred a restructuring and impairment charge totaling $10.3 million. The charge was the result of a review of our business, particularly in light of our acquisition of VitalStream, and the finalization of our overall integration and implementation plan during the first quarter. The charge to expense included $7.8 million for leased facilities, representing both the net present value of costs less anticipated sublease recoveries that will continue to be incurred without economic benefit to us and costs to terminate leases before the end of their term. The charge also included severance payments of $1.1 million for the termination of certain Internap employees and $1.4 million for impairment of assets. Related expenditures are estimated to be $10.7 million, of which $2.8 million has been paid during the year ended December 31, 2007, and the balance continuing through December 2016, the last date of the longest lease term. The impairment charge of $1.3 million was related to the leases referenced above and less than $0.1 million for other assets.
We also incurred a $1.1 million impairment recorded for a sales order-through-billing system, which was a result of an evaluation of the existing infrastructure relative to our new financial accounting system and the acquisition of VitalStream.
Write-Off of Investment. In connection with the preparation of our quarterly report for the quarter ended June 30, 2007, we wrote-off an investment, totaling $1.2 million, representing the remaining carrying value of our investment in series D preferred stock of Aventail Corporation, or Aventail. We made an initial cash investment of $6.0 million in Aventail series D preferred stock pursuant to an investment agreement in February 2000. In connection with a subsequent round of financing by Aventail, we recognized an initial impairment loss on our investment of $4.8 million in 2001. On June 12, 2007, SonicWall, Inc. announced that it had entered into an agreement to acquire Aventail for approximately $25.0 million in cash. The transaction closed on July 11, 2007, and all shares of series D preferred stock were cancelled and the holders of series D preferred stock did not receive any consideration for such shares. Consequently, we recorded a write-off of our investment in Aventail to reduce our carrying value to $0.
Rights Agreement. On March 15, 2007, the Board of Directors declared a dividend of one preferred share purchase right, or a Right, for each outstanding share of common stock, par value $0.001 per share, of the Company. The dividend was payable on March 23, 2007 to the stockholders of record on that date. Each Right entitles the registered holder to purchase from the Company one one-thousandth of a share of Series B Preferred Stock of the Company, par value $0.001 per share, or the Preferred Shares, at a price of $100.00 per one one-thousandth of a Preferred Share, subject to adjustment. The description and terms of the Rights are set forth in a Rights Agreement between the Company and American Stock Transfer & Trust Company, as Rights Agent dated April 11, 2007.
Data Center Expansion. On June 12, 2007, we announced that we approved an investment of up to $40.0 million to fund the expansion of our data center facilities in several key markets. We anticipate implementing the expansion over the next several calendar quarters, with at least a portion of the funding to be provided under our credit agreement, discussed below. As of December 31, 2007, we have incurred costs of less than $10.0 million pursuant to this expansion.
5
Credit Agreement. On September 14, 2007, we entered into a $35.0 million credit agreement. We discuss this agreement in note 10 to the consolidated financial statements and the section captioned “Liquidity and Capital Resources” under “Item 2. Managements Discussion and Analysis of Financial Condition and Results of Operations.”
Industry Background
The emergence of multiple Internet networks
The Internet originated as a restricted network designed to provide efficient and reliable long distance data communications among the disparate computer systems used by government-funded researchers and organizations. As the Internet evolved, businesses began to use the Internet for functions critical to their core business and communications. Telecommunications companies established additional networks to supplement the original public infrastructure and satisfy increasing demand. Currently, the Internet is a global collection of multitudes of interconnected computer networks, forming a network of networks. These networks were developed at great expense but are nonetheless constrained by the fundamental limitations of the Internet’s architecture. Each network must connect to one another, or peer, to permit its users to communicate with each other. Consequently, many Internet network service providers, or ISPs, have agreed to exchange large volumes of data traffic through a limited number of public network access points and a growing number of private connections called peering.
Peering network access points are not centrally managed. We believe that no single entity has the economic incentive or ability to facilitate problem resolution or to optimize peering within the public network access points, nor the authority to bring about centralized routing administration. Additionally, since these arrangements are based on non-regulated agreements, disagreements between carriers impact performance. As a consequence of the lack of coordination among networks at these public peering points, and in order to avoid the increasing congestion and the potential for resulting data loss at the public network access points, a number of the ISPs have established private interfaces connecting with their peers for the exchange of traffic. Although private peering arrangements are helpful for exchanging traffic, they do not solve all of the structural and economic shortcomings of the Internet.
The problem of inefficient routing of data traffic on the Internet
An individual ISP only controls the routing of data within its network, and its routing practices tend to compound the inefficiencies of the Internet. When an ISP receives a packet that is not destined for one of its own customers, it must route that packet to another ISP to complete the delivery of the packet on the Internet. Since the use of a public network access point or a private peering point typically involves no economic settlement, an ISP will often route the data to the nearest point of traffic exchange, in an effort to get the packet off its network and onto a competitor’s network as quickly as possible to reduce capacity and management burdens on its transport network. Once the origination traffic leaves the network of an ISP, service level agreements with that ISP typically do not apply since that carrier cannot control the quality of service on another ISPs network. Consequently, in order to complete a communication, data ordinarily passes through multiple networks and peering points without consideration for congestion or other factors that inhibit performance. For customers of conventional Internet connectivity providers, this transfer can result in lost data, slower and more erratic transmission speeds, and an overall lower quality of service, especially where the ISP is not familiar with the performance of the destination network. Equally important, these customers have no control over the transmission arrangements and have no single point of contact that they can hold accountable for degradation in service levels, such as poor data transmission performance, or service failures. As a result, it is virtually impossible for a single ISP to offer a high quality of service across disparate networks.
6
The problem of poor application performance over distant network paths
The major protocols often utilized over data networks perform poorly when network latency is large or network paths are subject to packet and data loss. Network latency is a measure of the time it takes data to travel between two network points. In networks, network latency often depends on physical distance but may also depend on conditions such as congestion. One measure of performance is effective throughput. Throughput is defined as the rate of data transfer, typically expressed in bits per second or megabits per second, or Mbps. It can be limited by the size of the network connection, for example, 1.5Mbps for a standard T1 data connection, or it can be limited by the protocols reacting to certain network conditions such as latency or packet loss. Typically, throughput is inversely proportional to network latency. Network latency is a significant factor when communicating over vast distances such as the global network paths between two continents. The more distant the communicating parties are from each other, the higher the network latency will be resulting in lower effective throughput. This throughput may be lower than the available network capacity and often results in poor utilization of purchased network capacity. Additionally, many network protocols react to packet loss by requesting a retransmission of the missing data. This retransmission is often interpreted as intermediate network congestion by the protocol that then responds with more conservative network usage and a further reduction of effective throughput. As a result, business applications that must communicate over the vast distances common in the global economy are subject to these limitations, which result in poor application performance and poor utilization of network assets. Network conditions vary significantly in many parts of the developing world and may also result in poor application performance. Yet the global economy is a factor in many businesses operating in these parts of the developing world where distances are vast and network conditions are poor.
The growing importance of the Internet for business-critical Internet-based applications
Once primarily used for e-mail and basic information retrieval, the Internet is now used as a communications platform for an increasing number of business-critical Internet-based applications, such as those relating to electronic commerce, VoIP, supply chain management, customer relationship management, project coordination, streaming media, and video conferencing and collaboration.
Businesses are unable to benefit from the full potential of the Internet primarily because of performance issues discussed above. The emergence of technologies and applications that rely on network quality and require consistent, high-speed data transfer, such as VoIP, multimedia document distribution and streaming, and audio and video conferencing and collaboration, are hindered by inconsistent performance. We believe that providers who provide a consistently high quality of service that enables businesses to successfully and cost effectively execute their business-critical Internet-based applications over the public network infrastructure through superior performance Internet routing services will drive the market for Internet services.
The growing demand for delivery of rich media content over the Internet
The proliferation of Internet-connected devices and broadband Internet connections coupled with increased consumption of media over the Internet including personalized media content have created a demand for delivery of rich media content. Increasingly, as the volume and quality of dynamic content progresses, viewers of all ages are spending more and more time using the Internet. Viewers now expect to be able to watch a movie or television show online, view the latest news clips, take a virtual walk-through of a home, hear a podcast, watch a live sporting event or concert, or participate in an educational course just to name a few examples. Companies that need to deliver rich media content can either deliver the content using basic Internet connectivity or utilize a content distribution network, or CDN. Because of the inherit weaknesses of the Internet, delivery of rich media content is not reliable. To overcome this problem, companies can either invest substantial capital to build the infrastructure to bypass the public Internet or utilize a third party’s CDN.
Our Market Opportunity
Historically, network service providers, or NSPs, have maintained at-will agreements to deliver Internet traffic on a “best efforts” basis without guaranteeing various levels of quality of service. This best efforts delivery is sub-optimal for time-sensitive and real-time applications that require uninterrupted streams of data such as voice and video. For companies that rely on the Internet as a medium for commerce or relationship management, this unpredictable performance often translates into lost revenue, decreased productivity and dissatisfied customers.
7
The Internet serves as a core component of many direct sales, supply chain and collaboration strategies and has extended our customers’ ability to reach global partners, suppliers and customers. This changing landscape, combined with an increasingly dispersed workforce and the adoption of emerging technologies like VoIP and streaming media, has increased the need for fast, reliable connectivity and delivery of content rich media. We believe Internap meets this requirement and is well positioned to help businesses leverage the Internet to attain improved productivity, decreased transactional costs and new revenue streams.
Services and Technology
We offer the following managed services and premise-based products:
High Performance Internet Protocol, or IP
Our managed intelligent routing service provides fast, reliable connectivity to all major backbones and dynamically identifies the optimal path for our customers’ traffic. The service is also supported by industry leading service level agreements with 100 percent network availability, excluding local connections. Our team of certified network engineers supports our customers 24 hours a day, every day of the year. We charge for these services based on a fixed-fee, usage or a combination of both fixed fee and usage basis.
Data Center Services
We operate data centers where customers can host their applications directly on our network to eliminate issues associated with the quality of local connections. Data center services also enable us to have a more flexible product offering, such as bundling our high performance IP connectivity and managed services such as content delivery along with hosting customers’ applications. We charge monthly fees for data center services based on the amount of square footage that the customer leases in our facilities. We also have relationships with various providers to extend our Private Network Access Point, or P-NAP, model into markets with high demand.
Flow Control Platform, or FCP
Our FCP is a premise-based intelligent routing hardware product for customers who run their own multiple network architectures, known as multi-homing. The prevalence of multi-homed networks is increasing. To operate each network at the highest performance level, a significant amount of expertise is required to monitor and adjust to global Internet routing, which is very dynamic in nature. The FCP functions similarly to our P-NAP, monitoring the global Internet and automatically adjusting routing real-time to balance the traffic across multiple links to optimize performance. FCP can be tuned to manage network traffic on two dimensions: cost and performance. The user can set thresholds that balance performance against cost, for example routing all traffic across low cost providers while specific minimum performance thresholds are met. If the performance deteriorates, then the traffic can be routed over a better performing but more costly provider to maintain minimum specified performance. This option allows the customer to enjoy service with the optimized performance and economics. Another key feature is minute-by-minute visibility reports and logs on the performance and operation of the customer’s network. Our customers find this information to be very useful for carrier SLA verification, monitoring and overall network management.
8
FCP is one of only a few of the industry’s route control appliances that analyzes and re-routes Internet traffic flows in real-time. We offer FCP as either a one-time hardware purchase or as a monthly subscription service. Sales of FCP also generate annual maintenance fees and professional service fees for installation and ongoing network configuration. Since the FCP emulates our P-NAP service in many ways, this product affords us the opportunity to serve customers outside of our P-NAP market footprint.
Other Products & Services
To complement our existing portfolio, we also offer managed Internet services via third parties. These services include virtual private networking and managed security services, including VeriSign, Inc. intrusion detection/prevention and managed firewall services to more broadly support our clients’ Internet applications. These also include a continuation of Akamai Technologies, Inc., or Akamai, CDN services through September 30, 2007.
We offer the following products and services based on our CDN:
Next Generation Cluster Architecture Content Delivery Network
Our CDN is designed to optimize delivery of streaming media content. The network incorporates high performance equipment with unparalleled 10 Gigabit uplinks to multiple tier-1 network providers and geographic diversity. The network is comprised of multiple data centers containing distributed server clusters. This multi-homed network helps minimize exposure at congested peers. Our close proximity to other backbone providers ensures we can quickly add bandwidth when needed. Distributed clustering technology for streaming and hosting services allows us to scale the network based on customer demand.
Our network is protected by advanced security systems, including firewalls, proxies and private networking to protect critical systems from intruders. We continuously monitor for security vulnerabilities and malicious activity and employ a staff of security experts to respond to security-related incidents. Additionally, we provide various encryption and digital rights management services that allow our customers to protect their content on our network.
Streaming Service for Flash
We worked hand-in-hand with Adobe, which was formerly known as Macromedia, to develop a Flash streaming platform, and are an experienced Flash video streaming service provider. This method of delivering video on demand is reliable, interactive and easy to use, giving our customers the opportunity to utilize their existing Flash development environment, and streamlining their workflow. Our Flash video streaming service permits our customers to upload files to our streaming network without having to set up and maintain video servers.
As an Adobe Flash Video Streaming Service provider, we can support Flash 8 and Flash Media Server 2.0. The new video features found in the Flash Platform with the announcement of Flash Player 8 offer enhanced capabilities for interactive video, enabling our customers to deliver high-quality video at the smallest file sizes while ensuring faster and smoother video playback. These enhancements significantly improve the overall viewing experience of streaming video.
Streaming Service for Windows Media
Our streaming service for windows media is ideal for businesses seeking to distribute or sell their high-quality video online with maximum control of their content. Windows Media is a flexible platform that enables content providers to protect and deliver live events, corporate presentations, news, sports, music, entertainment events, or movies with the confidence that digital media files will stay protected, no matter how they are distributed. We have been a Microsoft Premier Certified Hosting Service provider since October 2002.
Content Delivery Service
Our streaming customers often need to utilize download services as part of their business solution. In response to this customer demand, we provide file download services to enable our customers to download critical content including HTML, graphics, media files, software, and podcasts to their customers.
9
Professional Services
This division assists our customers in building the unique solutions required for their specialized business models. Through internal and external resources, these services design, build and deploy custom solutions, such as video players, graphical user interfaces, or GUIs, advertising components, control panels for content management and reporting, authentication web services, and Flash Communication Server applications. These solutions are fully integrated into our CDN. We also architect, design, build, and deploy web applications that feature video or audio streaming and interface with existing customer systems. Fees for these services vary by project.
Authentication
Our authentication service provides token-based authentication services. This service protects and delivers customers’ offerings by allowing only authorized viewers to access content, which enables customers to take greater advantage of the Internet as a reliable and cost-effective distribution channel.
Managed Servers
Our managed servers are an outsourced hosting service for our customers. We provide server hardware, bandwidth and continuous system administration, including server and network monitoring, reporting, ongoing maintenance, security, and backup. We charge a fixed monthly fee for standard hosting services.
Advertising
Internap advertising services provides customers with a one-stop solution for delivering integrated streaming and digital advertising content on the Internet. The solution inserts in-stream advertisements into “live” and “on-demand” Internet streaming broadcasts to target specific listener demographics, enabling advertisers to reach the most engaged opt-in audio and video audiences with a seamless, in-stream advertising experience. Campaign management and advertising results reporting complete the comprehensive solution.
Network Access Points, Points of Presence and Data Centers
We provide our services through our network access points across North America, and in Europe, Asia, and Australia. Our network access points and data centers feature direct high speed connections to multiple major ISPs, including AT&T Inc., Sprint Nextel Corporation, Verizon Communications Inc., Savvis, Inc., Global Crossing Limited, Level 3 Communications, and Verio, an NTT Communications Company, as well as Internet Initiative Japan, Inc. and KDDI Corp. in Asia. Through our CDN points of presence, or POPs, we provide access to the Internet for our CDN customers. As of December 31, 2007, we provided services worldwide through 50 IP service points, 42 data center locations and 12 POPs. We directly operate eight of these sites and have operating agreements with third parties for the remaining locations in the following markets:
| Internap operated | Operated under third party agreements | ||||
| Boston | Orange County/ | Amsterdam | |||
| Boston | Chicago | San Diego | Hong Kong | ||
| Houston | Dallas | Philadelphia | London | ||
| New York | Denver | Phoenix | Osaka(1) | ||
| Seattle | Los Angeles | San Francisco | Singapore | ||
| Miami | San Jose | Sydney | |||
| New York | Washington DC | Tokyo(1) | |||
| Oakland | Toronto | ||||
| (1) | Through our joint venture in Internap Japan Co., Ltd. with NTT-ME Corporation and Nippon Telegraph and Telephone Corporation. |
10
We are dependent upon the ISPs noted above as well as other ISPs, telecommunications carriers and other vendors in the United States, Europe and the Asia-Pacific region, some of whom have experienced significant system failures and electrical outages in the past. Users of our services may experience difficulties due to system failures unrelated to our systems and services. If for any reason, our vendors and providers fail to provide the required services, our business, consolidated financial condition, results of operations or cash flows could be materially adversely impacted.
Segments
As discussed in note 5 to the consolidated financial statements included in this annual report on Form 10-K/A, we operate in three business segments: IP services, data center services and CDN services.
The following is a brief description of each of our reportable business segments.
IP Services
Our patented and patent-pending network performance optimization technologies address the inherent weaknesses of the Internet, allowing enterprises to take advantage of the convenience, flexibility and reach of the Internet to connect to customers, suppliers and partners. Our solutions take into account the unique performance requirements of each business application to ensure performance as designed, without unnecessary cost. Prior to recommending appropriate network solutions for our customers’ applications, we consider key performance objectives including (1) performance and cost optimization, (2) application control and speed and (3) delivery and reach. Our charges for IP services are based on a fixed-fee, usage or a combination of both fixed fee and usage.
Our IP services segment also includes our flow control platform, or FCP. The FCP provides network performance management and monitoring for companies with multi-homed networks and redundant Internet connections. The FCP proactively reviews customer networks for the best performing route or the most cost-effective and routes according to our customers’ requirements. We offer FCP as either a one-time hardware purchase or as a monthly subscription service. Sales of FCP also generate annual maintenance fees and professional service fees for installation and ongoing network configuration. Since the FCP emulates our private network access points, or P-NAP, service in many ways, this product affords us the opportunity to serve customers outside of our P-NAP market footprint. This product represents approximately 4% of our IP services revenue and approximately 2% of our consolidated revenue for the year ended December 31, 2007.
Data Center Services
Our data center services provide a single source for network infrastructure, IP and security, all of which are designed to maximize solution performance while providing a more stable, dependable infrastructure, and are backed by guaranteed service levels and our team of dedicated support professionals. We offer a comprehensive solution at 42 service points, including eight locations managed by us and 34 locations managed by third parties.
Data center services also enable us to have a more flexible product offering, including bundling our high performance IP connectivity and managed services, such as content delivery, along with hosting customers' applications. We charge monthly fees for data center services based on the amount of square footage that the customer leases in our facilities. We also have relationships with various providers to extend our P-NAP model into markets with high demand.
CDN Services
Our CDN services enable our customers to quickly and securely stream and distribute video, audio, advertising, and software to audiences across the globe through strategically located data centers. Providing capacity-on-demand to handle large events and unanticipated traffic spikes, content is delivered with high quality regardless of audience size or geographic location. Our MediaConsole® content management tool provides our customers the benefit of a single, easy to navigate system featuring Media Asset Management, Digital Rights Management, or DRM, support, and detailed reporting tools. With MediaConsole, our customers can use one application to manage and control access to their digital assets, deliver advertising campaigns, view network conditions, and gain insight into habits of their viewing audience.
11
Our CDN and monetization services provide a complete turnkey solution for the monetization of online media. These multi-faceted “live” and “on-demand” advertising insertion and advertising placement solutions include a full campaign management suite, inventory prediction tools, audience research and metrics, and extensive reporting features to effectively track advertising campaigns in real-time. Online advertising solutions enable our customers to offset the costs associated with the creation, transformation, licensing, and management of online content. Prior to our acquisition of VitalStream on February 20, 2007, we did not offer proprietary CDN services, but instead, we were a reseller of third party CDN services for which the results of operations are included in Other revenues and direct costs of network, sales and services, discussed below.
Other
Other revenues and direct costs of network, sales and services include our non-segmented results of operations, including certain reseller and miscellaneous services such as third party CDN services, termination fee revenue, other hardware sales, and consulting services.
Financial Information about Geographic Areas
For each of the years ended December 31, 2007, 2006 and 2005, less than 10% of our total revenues was derived from our operations outside the United States.
Sales and Marketing
Our sales and marketing objective is to achieve market penetration and increase brand recognition among business customers in key industries that use the Internet for strategic and business-critical operations. We employ a direct sales team with extensive and relevant sales experience with our target market. Our sales offices are located in key cities across North America, as well as one office each in the United Kingdom and Singapore.
Our sales and service organization includes 116 employees in direct and channel sales, professional services, account management, and technical consulting. As of December 31, 2007, we had approximately 45 direct sales representatives whose performance is measured on the basis of achievement of quota objectives.
To support our sales efforts and promote the Internap brand, we conduct comprehensive marketing programs. Our marketing strategies include on-line advertisements, participation at trade shows, an active public relations campaign, and continuing customer communications. As of December 31, 2007, we had seven employees in our marketing department.
Research and Development
Product development costs are primarily related to network engineering costs associated with changes to the functionality of our proprietary services and network architecture. Such costs that do not qualify for capitalization as software development costs are expensed as incurred. Research and development costs, which are included in product development cost and are expensed as incurred, primarily consist of compensation related to our development and enhancement of IP routing technology, progressive download and streaming technology for our CDN, and acceleration technologies. Research and development costs were $3.1 million, $2.4 million and $2.9 million for the years ended December 31, 2007, 2006, and 2005, respectively. These costs do not include $1.6 million and $0.9 million in internal software development costs capitalized during the years ended December 31, 2007 and 2006, respectively. We did not capitalize any software development costs during the year ended December 31, 2005.
12
Customers
As of December 31, 2007, we had approximately 3,800 customers. We provide services to customers in multiple vertical industry segments including financial services, media and communications, travel, e-commerce and retail, and technology. However, our customer base is not concentrated in any particular industry. In each of the past three fiscal years, no single customer has accounted for 10 percent or more of our net sales. No significant amounts of revenue for any of the years ended December 31, 2007, 2006 and 2005 were derived from contracts or subcontracts terminable or renegotiation at the election of the federal government, and we do not expect such contracts to be a significant percentage of our total revenue in 2008.
Competition
The market for managed services, premise-based products and content delivery is intensely competitive and is characterized by technological change, the introduction of new products and services, and price erosion. We believe that the principal factors of competition for service providers in our target markets include: speed and reliability of connectivity, quality of facilities, level of customer service and technical support, price, and brand recognition. We believe that we compete favorably on the basis of these factors.
Our current and potential competition primarily consists of:
| · | network service providers that provide connectivity services, including AT&T Inc., Sprint Nextel Corporation, Verizon Communications Inc., Level 3 Communications, Inc., Global Crossing Limited, and Verio, an NTT Communications Company.; | |
| · | regional Bell operating companies that offer Internet access and managed services; | |
| · | global, national and regional ISPs such as Orange Business Services (formerly Equant), BT Infonet and Savvis, Inc.; | |
| · | providers of specific applications or solutions, such as content delivery, security or storage such as Akamai Technologies, Inc., Limelight Networks, Inc., Mirror Image Internet, Inc., Symantec Corporation, Network Appliance, Inc., and Virtela Communications, Inc.; | |
| · | software-based, Internet infrastructure companies focused on IP route control and wide area network optimization products such as Riverbed Technology, Inc., F5 Networks, Inc. and Radware Ltd.; and | |
| · | colocation and data center providers, including Equinix, Inc., Terremark Worldwide, Inc., Navisite, Inc., 365 Main Inc., Savvis, Inc., and Neon Communications Group, Inc., formerly known as The Globix Corporation. |
Competition has resulted, and will continue to result, in declining prices for our services.
Many of our competitors have longer operating histories and presence in key markets, greater name recognition, larger customer bases and significantly greater financial, sales and marketing, distribution, technical, and other resources than we have. As a result, these competitors may be able to adapt more quickly to new or emerging technologies and changes in customer requirements or to devote greater resources to the promotion and sale of their products. In all of our target markets, we also may face competition from newly established competitors, suppliers of products or services based on new or emerging technologies, and customers that choose to develop their own network solutions. We also may encounter further consolidation in the markets in which we compete. In addition, competitors may develop technologies that more effectively address our markets with services that offer enhanced features or lower costs. Increased competition could result in pricing pressures, decreased gross margins and loss of market share, which may materially and adversely affect our business, consolidated financial condition, results of operations and cash flows.
13
Intellectual Property
We rely on a combination of copyright, patent, trademark, trade secret, and other intellectual property law, nondisclosure agreements, and other protective measures to protect our proprietary rights. We also utilize unpatented proprietary know-how and trade secrets and employ various methods to protect such intellectual property. As of December 31, 2007, we have five patents that extend to various dates between approximately 2019 and 2026, and eight registered trademarks. Taken as a whole, we believe our intellectual property rights are significant and that the loss of all or a substantial portion of such rights could have a material adverse effect on our results of operations. We can offer no assurances that our intellectual property protection measures will be sufficient to prevent misappropriation of our technology. In addition, the laws of many foreign countries do not protect our intellectual properties to the same extent as the laws of the United States. From time to time, third parties have or may assert infringement claims against us or against our customers in connection with their use of our products or services. In addition, we may desire or be required to renew or to obtain licenses from others in order to further develop and market commercially viable products or services effectively. We can offer no assurances that any necessary licenses will be available on reasonable terms.
Employees
As of December 31, 2007, we had approximately 420 full-time employees. None of our employees are represented by a labor union, and we have not experienced any work stoppages to date. We consider the relationships with our employees to be good. Competition for technical personnel in the industry in which we compete is intense. We believe that our future success depends in part on our continued ability to hire, assimilate and retain qualified personnel. To date, we believe that we have been successful in recruiting and retaining qualified employees, but we can offer no assurances that we will continue to be successful in the future.
Other Matters
While we are dependent upon our proprietary technology and vendors, including ISPs, telecommunications carriers and others, we are not dependent upon raw materials. Our business is generally not seasonal. We do not have significant backlog orders, nor do we have any practices relating to required working capital items.
Available Information
Internap files annual, quarterly and current reports, proxy statements, and other information with the Securities and Exchange Commission, or SEC. The Company makes its annual report on Form 10-K/A, quarterly reports on Form 10-Q, current reports on Form 8-K, and all amendments to such reports filed pursuant to Section 13(a) or 15(d) of the Securities Exchange Act of 1934, as amended, or the Exchange Act, available free of charge on or through its Internet site, located at www.internap.com, as soon as reasonably practicable after they are filed with or furnished to the SEC. You may read and copy any materials Internap files with the SEC, at the SEC’s Public Reference Room at 100 F Street, N.E., Washington, D.C. 20549. For information on the operation of the Public Reference Room, call the SEC at 1-800-SEC-0330. The SEC maintains an Internet site that contains reports, proxy and information statements, and other information regarding issuers such as Internap that file electronically with the SEC at http://www.sec.gov. Information on the Company’s Web site is not incorporated by reference into this Form 10-K/A.
You should carefully consider the risks described below. These risks are not the only ones that we may face. Additional risks and uncertainties that we are unaware of, or that we currently deem immaterial, also may become important factors that affect us. If any of the following risks occurs, our business, consolidated financial condition, results of operations or cash flows could be materially and adversely affected.
14
We have a history of losses and may not sustain profitability.
We incurred net losses in each quarterly and annual period since we began operations in May 1996 through the year ended December 31, 2005. For the years ended December 31, 2007, 2006 and 2005, we recognized net loss of $5.6 million, net income of $3.7 million and net loss of $5.0 million, respectively. As of December 31, 2007, our accumulated deficit was $862.0 million. Considering the competitive and evolving nature of the industry in which we operate, we may not be able to achieve or sustain profitability on a quarterly or annual basis, and our failure to do so could materially and adversely affect our business, including our ability to raise additional funds.
Our operations have historically been cash flow negative, and we have depended on equity and debt financings to meet our cash requirements, which may not be available to us in the future on favorable terms.
Historically, we have experienced negative operating cash flows and have depended upon equity and debt financings, as well as borrowings under our credit facilities, to meet our cash requirements in most quarterly and annual periods since we began our operations in May 1996. We expect to meet our cash requirements for 2008 through a combination of cash flows from operations, existing cash, cash equivalents and investments in marketable securities, and borrowings under our credit facilities. Our capital requirements depend on several factors, including the rate of market acceptance of our services, the ability to expand and retain our customer base and other factors. If our cash requirements vary materially from those currently planned, if our cost reduction initiatives are unsuccessful or have unanticipated adverse effects on our business or if we fail to generate sufficient cash flows from the sales of our services, we may require additional financing sooner than anticipated. We can offer no assurances that we will be able to obtain additional financing on commercially favorable terms, or at all. In addition, provisions in our credit agreement limit our ability to incur additional indebtedness. Our business could be materially and adversely affected by our failure to obtain such funding. We might also be required to take other actions that could lessen the value of our stock in order to obtain such funding, such as issuing securities with greater rights than our common stock or borrowing money on terms that are not favorable to us.
We have identified a material weakness in our internal control over financial reporting that may prevent us from accurately reporting our financial results in a timely manner.
We must maintain effective internal controls in order to provide reliable and accurate financial reports and prevent fraud. In addition, Section 404 of the Sarbanes-Oxley Act of 2002 requires that we assess the design and operating effectiveness of our internal control over financial reporting. In connection with our evaluation of internal control over financial reporting, we identified a material weakness related to effective controls over the analysis of requests for sales credits and billing adjustments to provide timely information for management to assess the completeness, accuracy, valuation and disclosure of sales adjustments. We may also discover additional areas of our internal controls that need improvement. We discuss our efforts regarding internal controls in detail in this report under Item 9A, “Controls and Procedures.” We cannot be certain that any remedial measures we take will sufficiently address and eliminate this material weakness. Remedying this material weakness, any additional deficiencies, significant deficiencies, or material weaknesses that we may identify in the future, could require us to incur significant costs, expend significant time and management resources or make other changes. We have not yet remediated this material weakness. As a result, we may be required to report in our Quarterly Report on Form 10-Q for the first quarter of 2008 or in subsequent reports filed with the Securities and Exchange Commission that a material weakness in our internal control over financial reporting continues to exist. Any delay or failure to design and implement new or improved controls, or difficulties encountered in their implementation or operation may cause us to fail to meet our financial reporting obligations or prevent us from providing reliable and accurate financial reports or avoiding or detecting fraud. Disclosure of this material weakness, any failure to remediate such material weakness in a timely fashion or having or maintaining ineffective internal controls could cause investors to lose confidence in our reported financial information.
We may not be able to compete successfully against current and future competitors.
The Internet connectivity and IP services market is highly competitive, as evidenced by recent declines in pricing for Internet connectivity services. The content delivery market is also intensely competitive and rapidly changing. We expect competition from existing competitors to continue to intensify in the future, and we may not have the financial resources, technical expertise, sales and marketing abilities, or support capabilities to compete successfully. Our competitors currently include: regional Bell operating companies that offer Internet access; global, national and regional ISPs; providers of specific applications or solutions such as content delivery, security or storage; software-based and other Internet infrastructure providers and manufacturers; and colocation and data center providers. In addition, ISPs may make technological advancements, such as the introduction of improved routing protocols to enhance the quality of their services, which could negatively impact the demand for our products and services.
15
In addition, more and more businesses are deciding to develop their own solutions rather than outsource such solutions to providers like us. If we are unable to provide services that are competitive with such in-sourced solutions, we will lose customers and our business and financial results will suffer.
Failure to develop new products and services, as well as enhancements to our existing services, may cause our operating results to suffer.
Our industry is constantly evolving. The process of developing new services and the technologies that support them is expensive, time and labor intensive and uncertain. We may fail to understand the market demand for new services or not be able to overcome technical problems with new services. In addition, our customers’ needs may change in ways that we do not anticipate and these changes could eliminate our customers’ needs for our services and render our products and services obsolete. If we fail to develop new products and services before our competitors, we may lose market share, resulting in a decrease in our revenues and earnings.
Many of our current and potential customers are pursuing emerging or unproven business models and the demand for our services and products may decline if such models are unsuccessful.
The need for a content delivery network is a recent technological advancement and our customers’ business models that rely on the delivery of streaming video and other content remain unproven. These customers will not continue to purchase our products and services if their investment does not generate a sufficient return. A reduction in spending on CDN services by such customers could materially and adversely affect our financial condition.
Pricing pressure could decrease our revenue and threaten the attractiveness of our premium priced services.
Pricing for Internet connectivity services has declined significantly in recent years and may decline in the future. An economic downturn could further contribute to this effect. We currently charge, and expect to continue to charge, higher prices for our high performance IP services than prices charged by our competitors for their connectivity services. By bundling their services and reducing the overall cost of their solutions, certain of our competitors may be able to provide customers with reduced communications costs in connection with their Internet connectivity services or private network services, thereby significantly increasing the pressure on us to decrease our prices. Increased price competition, significant price deflation and other related competitive pressures could erode our revenue and could materially and adversely affect our results of operations if we are unable to control or reduce our costs. Because we rely on ISPs to deliver our services and have agreed with some of these providers to purchase minimum amounts of service at predetermined prices, our profitability could be adversely affected by competitive price reductions to our customers even if accompanied with an increased number of customers.
In addition, in light of economic factors and technological advances, companies that require Internet connectivity have evaluated and will continue to evaluate the cost of such services, particularly high performance connectivity services such as those we currently offer. Consequently, existing and potential customers may be less willing to pay premium prices for high performance Internet connectivity services and may choose to purchase lower quality services at lower prices, which could materially and adversely affect our business, consolidated financial condition, results of operations and cash flows.
Failure to increase our revenues may cause our business and financial results to suffer.
We have considerable fixed expenses and we plan to continue to incur significant expenses with the expansion of our colocation facilities. We must, therefore, generate higher revenues to maintain profitability. Numerous factors could affect our ability to increase revenue, either alone or in combination with other factors, including:
| · | failure to increase sales of our products and services; | |
| · | pricing pressures; | |
| · | failure of our services or software to operate as expected; | |
16
| · | loss of customers and inability to attract new customers; | |
| · | inability of a customer to pay our fees; or | |
| · | network failures and any breach or unauthorized access to our network. |
We depend on a number of ISPs to provide Internet connectivity to our network access points. If we are unable to obtain required connectivity services on a cost-effective basis, or at all, or if such services are interrupted or terminated, our growth prospects and business, consolidated financial condition, results of operations and cash flows may be adversely affected.
In delivering our services, we rely on a number of Internet networks, many of which are built and operated by others. In order to provide high performance connectivity services to our customers through our network access points, we purchase connections from several ISPs. We can offer no assurances that these ISPs will continue to provide service to us on a cost-effective basis or on otherwise competitive terms, if at all, or that these providers will provide us with additional capacity to adequately meet customer demand or to expand our business. Consolidation among ISPs limits the number of vendors from which we obtain service, possibly resulting in higher network costs to us. We may be unable to establish and maintain relationships with other ISPs that may emerge or that are significant in geographic areas, such as Asia and Europe, in which we may locate our future network access points. Any of these situations could limit our growth prospects and materially and adversely affect our business, consolidated financial condition, results of operations and cash flows.
We depend on third party suppliers for services and key elements of our network infrastructure. If we are unable to obtain products or services, such as network access loops or local loops, on favorable terms, or at all, or in the event of a failure of these suppliers to deliver their products and services as agreed, our ability to provide our services on a competitive and timely basis may be impaired and our consolidated financial condition, results of operations and cash flows could be adversely affected.
In addition to depending on services from third party ISPs, we depend on other companies to supply various key elements of our infrastructure, including the network access loops between our network access points and our ISPs and the local loops between our network access points and our customers’ networks. Pricing for such network access loops and local loops has risen significantly over time, and we generally bill these charges to our customers at low or no margin. Some of our competitors have their own network access loops and local loops and are, therefore, not subject to similar availability and pricing issues. In addition, we currently purchase routers and switches from a limited number of vendors. Furthermore, we do not carry significant inventories of the products we purchase, and we have no guaranteed supply arrangements with our vendors. A loss of a significant vendor could delay any build-out of our infrastructure and increase our costs. If our limited source of suppliers fails to provide products or services that comply with evolving Internet standards or that interoperate with other products or services we use in our network infrastructure, we may be unable to meet all or a portion of our customer service commitments, which could materially and adversely affect our business, consolidated financial condition, results of operations and cash flows.
A failure in the redundancies in our network operations centers, network access points or computer systems could cause a significant disruption in our IP services, and we may experience significant disruptions in our ability to service our customers.
Our business depends on the efficient and uninterrupted operation of our network operations centers, our network access points and our computer and communications hardware systems and infrastructure. Interruptions could result from natural or human-caused disasters, power loss, telecommunications failure, and similar events. If we experience a problem at our network operations centers, including the failure of redundant systems, we may be unable to provide IP services to our customers, provide customer service and support or monitor our network infrastructure or network access points, any of which would seriously harm our business and operating results. Also, because we provide continuous Internet availability under our service level agreements, we may be required to issue a significant amount of customer credits as a result of such interruptions in service. These credits could negatively affect our revenues and results of operations. In addition, interruptions in service to our customers could harm our customer relations, expose us to potential lawsuits and require additional capital expenditures.
17
A significant number of our network access points are located in facilities owned and operated by third parties. In many of those arrangements, we do not have property rights similar to those customarily possessed by a lessee or subtenant but instead have lesser rights of occupancy. In certain situations, the financial condition of those parties providing occupancy to us could have an adverse impact on the continued occupancy arrangement or the level of service delivered to us under such arrangements.
The increased use of high power density equipment may limit our ability to fully utilize our data centers.
Customers continue to increase their use of high-density equipment, such as blade servers, in our data centers, which has significantly increased the demand for power on a per cabinet basis. The current demand for electrical power may exceed our designed capacity in these facilities. As electrical power, not space, is typically the primary factor limiting capacity in our data centers, our ability to fully utilize our data centers may be limited in these facilities. If we are unable to adequately utilize our data centers, our ability to grow our business cost-effectively could be materially and adversely affected.
Our business could be harmed by prolonged electrical power outages or shortages, increased costs of energy or general availability of electrical resources.
Our data centers and P-NAPs are susceptible to regional costs of power, electrical power shortages, planned or unplanned power outages or natural disasters, and limitations, especially internationally, on availability of adequate power resources. Power outages could harm our customers and our business. We attempt to limit exposure to system downtime by using backup generators and uninterruptible power systems. We may not be able to limit our exposure entirely, however, even with these protections in place, as has been the case with power outages we have experienced in the past and may experience in the future. In addition, we may not be able to pass on to our customers the increased cost of energy caused by power shortages.
In each of our markets, we rely on utility companies to provide a sufficient amount of power for current and future customers. At the same time, power and cooling requirements are growing on a per unit basis. As a result, some customers are consuming an increasing amount of power per cabinet. We do not have long-term power agreements in all our markets for long-term guarantees of provisioned amounts and may face power limitations in our centers. This limitation could have a negative impact on the effective available capacity of a given center and limit our ability to grow our business, which could have a negative impact on our consolidated financial condition, results of operations and cash flows.
Any failure of our physical infrastructure or services could lead to significant costs and disruptions that could reduce our revenue and harm our business reputation, consolidated financial condition, results of operations and cash flows.
Our business depends on providing customers with highly reliable service. We must protect our infrastructure and our customers’ data and their equipment located in our data centers. The services we provide in each of our data centers are subject to failure resulting from numerous factors, including:
| · | human error; | ||
| · | physical or electronic security breaches; | ||
| · | fire, earthquake, flood, and other natural disasters; | ||
| · | water damage; | ||
18
| · | fiber cuts; | ||
| · | power loss; | ||
| · | sabotage and vandalism; and | ||
| · | failure of business partners who provide our resale products. | ||
Problems at one or more of the data centers operated by us or any of our colocation providers, whether or not within our control, could result in service interruptions or significant equipment damage, which could result in difficulty maintaining our service level commitments to these customers. If we incur significant financial commitments to our customers in connection with a loss of power or we fail to meet other service level commitment obligations, our revenue reserves may not be adequate. In addition, any loss of services, equipment damage or inability to meet our service level commitment obligations could reduce the confidence of our customers and could consequently impair our ability to obtain and retain customers, which would adversely affect both our ability to generate revenues and our operating results.
Furthermore, we are dependent upon ISPs and telecommunications carriers in the United States, Europe and the Asia-Pacific region, some of whom have experienced significant system failures and electrical outages in the past. Users of our services may experience difficulties due to system failures unrelated to our systems and services. If for any reason, these providers fail to provide the required services, our business, consolidated financial condition, results of operations and cash flows could be materially adversely impacted.
No prevention or defense against denial of service attacks exists. During a prolonged denial of service attack, Internet service may not be available for several hours, thus negatively impacting hosted customers’ on-line business transactions. Affected customers might file claims against us under such circumstances, and our property and liability insurance may not be adequate to cover these claims.
Our results of operations have fluctuated in the past and may continue to fluctuate, which could have a negative impact on the price of our common stock.
We have experienced fluctuations in our results of operations on a quarterly and annual basis. The fluctuation in our operating results may cause the market price of our common stock to decline. We expect to experience significant fluctuations in our operating results in the foreseeable future due to a variety of factors, including:
| · | competition and the introduction of new services by our competitors; | ||
| · | continued pricing pressures resulting from competitors’ strategies or excess bandwidth supply; | ||
| · | fluctuations in the demand and sales cycle for our services; | ||
| · | fluctuations in the market for qualified sales and other personnel; | ||
| · | changes in the prices for Internet connectivity we pay to ISPs; | ||
| · | the cost and availability of adequate public utilities, including power; | ||
| · | our ability to obtain local loop connections to our network access points at favorable prices; | ||
| · | integration of people, operations, products, and technologies of acquired businesses; and | ||
| · | general economic conditions. | ||
19
In addition, fluctuations in our results of operations may arise from strategic decisions we have made or may make with respect to the timing and magnitude of capital expenditures such as those associated with the expansion of our colocation facilities, the deployment of additional network access points and the terms of our network connectivity purchase agreements. These and other factors discussed in this annual report on Form 10-K/A could have a material adverse effect on our business, consolidated financial condition, results of operations and cash flows. In addition, a relatively large portion of our expenses are fixed in the short-term, particularly with respect to lease and personnel expense, depreciation and amortization and interest expense. Our results of operations, therefore, are particularly sensitive to fluctuations in revenue. Because our results of operations have fluctuated in the past and are expected to continue to fluctuate in the future, we can offer no assurance that the results of any particular period are an indication of future performance in our business operations. Fluctuations in our results of operations could have a negative impact on our ability to raise additional capital and execute our business plan. Our operating results in one or more future quarters may fail to meet the expectations of securities analysts or investors, which could cause an immediate and significant decline in the trading price of our stock.
We have acquired and may acquire other businesses, and these acquisitions involve numerous risks.
We may pursue acquisitions of complementary businesses, products, services, and technologies to expand our geographic footprint, enhance our existing services, expand our service offerings, and enlarge our customer base. If we complete future acquisitions, we may be required to incur or assume additional debt, make capital expenditures or issue additional shares of our common stock or securities convertible into our common stock as consideration, which would dilute our existing stockholders’ ownership interest and may adversely affect our results of operations. Our ability to grow through acquisitions involves a number of additional risks, including the following:
| · | the ability to identify and consummate complementary acquisitions; | ||
| · | the possibility that we may not be able to integrate the operations, personnel, technologies, products, and services of the acquired companies in a timely and efficient manner; | ||
| · | diversion of management’s attention from other ongoing business concerns; | ||
| · | insufficient revenue to offset significant unforeseen costs and increased expenses associated with the acquisitions; | ||
| · | challenges in completing projects associated with in-process research and development being conducted by the acquired businesses; | ||
| · | risks associated with our entrance into markets in which we have little or no prior experience and where competitors have a stronger market presence; | ||
| · | deferral of purchasing decisions by current and potential customers as they evaluate the likelihood of success of our acquisitions; | ||
| · | incurring or assuming contingent liabilities and amortization expense for acquired intangible assets; | ||
| · | incurring acquisition liabilities as a result of integrating acquired businesses; | ||
| · | difficulties in successfully integrating the management teams and employees of both companies; and | ||
| · | loss of key employees of the acquired companies. | ||
Failure to effectively manage our growth through acquisitions could adversely affect our growth prospects, business, consolidated financial condition, results of operations and cash flows.
20
The terms of our existing credit agreement impose restrictions upon us.
The terms of our existing credit agreement impose operating and financial restrictions on us and require us to meet certain financial tests. These restrictions may also have a negative impact on our business, consolidated financial condition, results of operations and cash flows by significantly limiting or prohibiting us from engaging in certain transactions. The credit agreement contains certain covenants, including covenants that restrict our ability to incur further indebtedness.
The failure to comply with any of these covenants would cause a default under the credit agreement. Any defaults, if not waived, could result in the lender ceasing to make loans or extending credit to us, accelerating or declaring all or any obligations immediately due, or taking possession of or liquidating collateral. If any of these events occur, we may not be able to borrow sufficient funds to refinance the credit agreement on terms that are acceptable to us, which could materially and adversely impact our business, consolidated financial condition, results of operations and cash flows.
As of December 31, 2007, we were in compliance with the various loan covenants required by the credit agreement.
Our investments in auction rate securities are subject to risks that may cause losses and affect the liquidity of these investments.
As of December 31, 2007, we held $7.2 million of auction rate securities classified as short-term investments. Auction rate securities are variable rate bonds tied to short-term interest rates with maturities on the face of the securities in excess of 90 days and have interest rate resets through a modified Dutch auction, at predetermined short-term intervals, usually every 7, 28 or 35 days. Although these securities are issued and rated as long term bonds, they are priced and traded as short-term instruments because of the liquidity provided through the interest rate resets. The underlying assets of our auction rate securities are state-issued student and educational loans that are substantially backed by the federal government and carried AAA/Aaa ratings as of December 31, 2007. The Dutch auctions have in the past provided a liquid market for these types of securities. With the liquidity issues experienced in global credit and capital markets, auctions of each of the auction rate securities that we hold failed subsequent to December 31, 2007, as the amount of securities submitted for sale exceeded the amount of purchase orders. If the uncertainties in the credit and capital market continue, these markets deteriorate further or the various rating agencies downgrade any of the auction rare securities that we hold, we may be required to adjust the value of these investments through an impairment charge to earnings if the fair value of these securities has declined to below their cost and such decline is assessed to be “other than temporary” under SFAS No. 115. Further, we may not be able to liquidate these investments until successful auctions occur, a buyer outside the auction process is found, the issuer calls these debt securities, or the securities mature.
Continued overcapacity in the Internet connectivity and IP services market may result in our recording additional significant restructuring charges and goodwill impairment.
We have undertaken significant operational restructurings and have taken restructuring and impairment charges and recorded total restructuring costs of $11.3 million for the year ended December 31, 2007 and less than $1.0 million for the years ended December 31, 2006 and 2005. We may incur additional restructuring charges or adjustments in the future. Such additional restructuring charges or adjustments could materially and adversely affect our business, net profit and stockholders’ equity.
Adverse experience in the CDN services market may result in our recording additional goodwill impairment charges.
Upon completion of our acquisition of VitalStream, we recorded $154.8 million in goodwill. We tested this goodwill in August of 2007 as part of our annual testing, and concluded that such goodwill had not been impaired. We can offer no assurances, however, that this goodwill will remain unimpaired. We may incur impairment charges in the future, which could materially and adversely affect our net profit and stockholders’ equity.
21
If we are unable to deploy new network access points or do not adequately control expense associated with the deployment of new network access points, our results of operations could be adversely affected.
As part of our strategy, we intend to continue to expand our network access points, particularly into new geographic markets. We will face various risks associated with identifying, obtaining and integrating attractive network access point sites, negotiating leases for centers on competitive terms, cost estimation errors or overruns, delays in connecting with local exchanges, equipment and material delays or shortages, the inability to obtain necessary permits on a timely basis, if at all, and other factors, many of which are beyond our control and all of which could delay the deployment of a new network access point. We can offer no assurance that we will be able to open and operate new network access points on a timely or profitable basis. Deployment of new network access points will increase operating expense, including expense associated with hiring, training, retaining, and managing new employees, provisioning capacity from ISPs, purchasing new equipment, implementing new systems, leasing additional real estate, and incurring additional depreciation expense. If we are unable to control our costs as we expand in geographically dispersed locations, our consolidated financial condition, results of operations and cash flows could be materially and adversely affected.
Our international operations may not be successful.
We have limited experience operating internationally and have only recently begun to achieve successful international experiences. We currently have network access points in London, England, Hong Kong, Singapore, and Sydney, Australia. We also participate in a joint venture with NTT-ME Corporation and Nippon Telegraph and Telephone Corporation, or NTT Holdings, that operates a network access point in Tokyo and Osaka, Japan and maintain a marketing agreement with Telefonica USA, which provides us with further access in Europe and access to the Latin American market. As part of our strategy to expand our geographic markets, we may develop or acquire network access points or complementary businesses in additional international markets. The risks associated with expansion of our international business operations include:
| · | challenges in establishing and maintaining relationships with foreign customers as well as foreign ISPs and local vendors, including data center and local network operators; | |||
| · | challenges in staffing and managing network operations centers and network access points across disparate geographic areas; | |||
| · | limited protection for intellectual property rights in some countries; | |||
| · | challenges in reducing operating expense or other costs required by local laws; | |||
| · | exposure to fluctuations in foreign currency exchange rates; | |||
| · | costs of customizing network access points for foreign countries and customers; | |||
| · | protectionist laws and practices favoring local competition; | |||
| · | political and economic instability; and | |||
| · | compliance with governmental regulations. | |||
We may be unsuccessful in our efforts to address the risks associated with our international operations, which may limit our international sales growth and materially and adversely affect our business and results of operations.
22
Disputes with vendors regarding the delivery of services may materially impact our results of operations and cash flows.
In delivering our services, we rely on a number of Internet network, telecommunication and other vendors. We work directly with these vendors to provide services such as establishing, modifying or discontinuing services for our customers. Because of the volume of activity, billing disputes inevitably arise. These disputes typically stem from disagreements concerning the starting and ending dates of service, quoted rates, usage, and various other factors. We research and discuss disputed costs, both in the vendors’ favor and our favor, with vendors on an ongoing basis until ultimately resolved. We record the cost and a liability based on our estimate of the most likely outcome of the dispute. These estimates are periodically reviewed by management and modified in light of new information or developments, if any. Because estimates regarding disputed costs include assessments of uncertain outcomes, such estimates are inherently vulnerable to changes due to unforeseen circumstances that could materially and adversely affect our consolidated financial condition, results of operations and cash flows.
We depend upon our key employees and may be unable to attract or retain sufficient numbers of qualified personnel.
Our future performance depends to a significant degree upon the continued contributions of our executive management team and other key employees. To the extent we are able to expand our operations and deploy additional network access points, we may need to increase our workforce. Accordingly, our future success depends on our ability to attract, hire, train, and retain highly skilled management, technical, sales, marketing, and customer support personnel. Competition for qualified employees is intense, and we compete for qualified employees with companies that may have greater financial resources than we have. Our employment security plan with our executive officers provide that either party may terminate their employment at any time. Consequently, we may not be successful in attracting, hiring, training, and retaining the people we need, which would seriously impede our ability to implement our business strategy.
Our senior management team has had limited time to develop a working relationship with each other and may not be able to manage our business effectively.
Our Chief Operating Officer, General Counsel, Chief Technology Officer, and Chief Strategy Officer have been hired since March 2007, and we are currently seeking a Chief Financial Officer. This limited experience working together could harm our management team’s ability to quickly and efficiently respond to problems and effectively manage our business.
If we fail to adequately protect our intellectual property, we may lose rights to some of our most valuable assets.
We rely on a combination of copyright, patent, trademark, trade secret, and other intellectual property law, nondisclosure agreements, and other protective measures to protect our proprietary rights. We also utilize unpatented proprietary know-how and trade secrets and employ various methods to protect such intellectual property. Taken as a whole, we believe our intellectual property rights are significant and that the loss of all or a substantial portion of such rights could have a material adverse effect on our results of operations. We can offer no assurance that our intellectual property protection measures will be sufficient to prevent misappropriation of our technology. In addition, the laws of many foreign countries do not protect our intellectual property to the same extent as the laws of the United States. From time to time, third parties have or may assert infringement claims against us or against our customers in connection with their use of our products or services.
In addition, we rely on the intellectual property of others. We may desire or be required to renew or to obtain licenses from these other parties in order to further develop and market commercially viable products or services effectively. We can offer no assurance that any necessary licenses will be available on reasonable terms.
We may face litigation and liability due to claims of infringement of third party intellectual property rights.
The Internet services industry is characterized by the existence of a large number of patents and frequent litigation based on allegations of patent infringement. From time to time, third parties may assert patent, copyright, trademark, trade secret, and other intellectual property rights to technologies that are important to our business. Any claims that our products or services infringe or may infringe proprietary rights of third parties, with or without merit, could be time-consuming, result in costly litigation, divert the efforts of our technical and management personnel, or require us to enter into royalty or licensing agreements, any of which could significantly harm our operating results. In addition, our customer agreements generally provide for us to indemnify our customers for expenses and liabilities resulting from claimed infringement of patents or copyrights of third parties, subject to certain limitations. If an infringement claim against us were to be successful, and we were not able to obtain a license to the relevant technology or a substitute technology on acceptable terms or redesign our products or services to avoid infringement, our ability to compete successfully in our competitive market would be materially impaired.
23
We may become involved in other litigation that may adversely affect us.
In the ordinary course of business, we are or may become involved in litigation, administrative proceedings and governmental proceedings. Such matters can be time-consuming, divert management’s attention and resources and cause us to incur significant expenses. Furthermore, the results of any such actions could have a material adverse effect on our business, consolidated financial condition, results of operations or cash flows.
Risks Related to Our Industry
We cannot predict with certainty the future evolution of the high performance Internet connectivity market, and therefore the role of our products and services.
We face the risk that the market for high performance Internet connectivity services might develop more slowly or differently than currently projected, or that our services may not achieve continued widespread market acceptance. Furthermore, we may be unable to market and sell our services successfully and cost-effectively to a sufficiently large number of customers. We typically charge a premium for our services, which may affect market acceptance of our services or adversely impact the rate of market acceptance. We believe the danger of non-acceptance is particularly acute during economic slowdowns, which exert significant pricing pressure on ISPs. If the Internet becomes subject to a form of central management, or if ISPs establish an economic settlement arrangement regarding the exchange of traffic between Internet networks, the demand for our IP services could be materially and adversely affected.
If we are unable to respond effectively and on a timely basis to rapid technological change, we may lose or fail to establish a competitive advantage in our market.
Our industry is characterized by rapidly changing technology, industry standards and customer needs, as well as by frequent new product and service introductions. New technologies and industry standards have the potential to replace or provide lower cost alternatives to our services. The adoption of such new technologies or industry standards could render our existing services obsolete and unmarketable. Our failure to anticipate the prevailing standard, to adapt our technology to any changes in the prevailing standard or the failure of a common standard to emerge could materially and adversely affect our business. Our pursuit of necessary technological advances may require substantial time and expense, and we may be unable to successfully adapt our network and services to alternative access devices and technologies.
Our network and software are subject to potential security breaches and similar threats that could result in our liability for damages and harm our reputation.
A number of widespread and disabling attacks on public and private networks have occurred recently. The number and severity of these attacks may increase in the future as network assailants take advantage of outdated software, security breaches or incompatibility between or among networks. Computer viruses, intrusions and similar disruptive problems could cause us to be liable for damages under agreements with our customers, and our reputation could suffer, thereby deterring potential customers from working with us. Security problems or other attacks caused by third parties could lead to interruptions and delays, or to the cessation of service to our customers. Furthermore, inappropriate use of the network by third parties could also jeopardize the security of confidential information stored in our computer systems and in those of our customers and could expose us to liability under unsolicited commercial e-mail, or “spam,” regulations. In the past, third parties have occasionally circumvented some of these industry-standard measures. We can offer no assurance that the measures we implement will not be circumvented. Our efforts to eliminate computer viruses and alleviate other security problems, or any circumvention of those efforts, may result in increased costs, interruptions, delays or cessation of service to our customers, which could hurt our business, consolidated financial condition, results of operations and cash flows.
24
Terrorist activity throughout the world and military action to counter terrorism could adversely impact our business.
The continued threat of terrorist activity and other acts of war or hostility may have an adverse effect on business, financial and general economic conditions internationally. Effects from any future terrorist activity, including cyber terrorism, may, in turn, increase our costs due to the need to provide enhanced security, which would adversely affect our business, consolidated financial condition, results of operations and cash flows. These circumstances may also damage or destroy the Internet infrastructure and may materially and adversely affect our ability to attract and retain customers, our ability to raise capital and the operation and maintenance of our network access points.
If governments modify or increase regulation of the Internet, the provision of our services could become more costly.
International bodies and federal, state and local governments have adopted a number of laws and regulations that affect the Internet and are likely to continue to seek to implement additional laws and regulations. For example, a federal law regulating spam was enacted in 2003. In addition, federal and state agencies are actively considering regulation of various aspects of the Internet, including taxation of transactions, and imposing access fees for voice over IP, or VoIP. The Federal Communications Commission and state agencies also review the regulatory requirements, if any, that should be applicable to VoIP. If we seek to offer additional products and services, we could be required to obtain certain, additional authorizations from regulatory agencies. We may not be able to obtain such authorizations in a timely manner, or at all, and conditions could be imposed upon such authorization that may not be favorable to us.
Congress recently extended the Internet Tax Freedom Act, which placed a moratorium against certain state and local taxation of Internet access, until November 1, 2014. Pursuant to this moratorium, most of our services are not subject to state and local taxation.
In addition, laws relating to the liability of private network operators and information carried on or disseminated through their networks are unsettled, both in the United States and abroad. Network operators have been sued in the past based on the content of material disseminated through their networks. We may become subject to legal claims such as defamation, invasion of privacy and copyright infringement in connection with content stored on or distributed through our network. Also, our reputation could suffer as a result of our perceived association with the type of content that some of our customers deliver.
The adoption of any future laws or regulations might decrease the growth of the Internet, decrease demand for our services, impose taxes or other costly technical requirements, regulate the Internet similar to the regulation of traditional telecommunications services, or otherwise increase the cost of doing business on the Internet in some other manner. Any of these actions could have a significantly harmful effect on our customers or us. Moreover, the nature of any new laws and regulations and the interpretation of applicability to the Internet of existing laws governing intellectual property ownership and infringement, copyright, trademark, trade secret, obscenity, libel, employment, personal privacy, and other issues is uncertain and developing. We cannot predict the impact, if any, that future regulation or regulatory changes may have on our business.
If our ability to deliver media files in certain formats is restricted or becomes cost-prohibitive, demand for our services would decline and our financial results would suffer.
Our CDN products and services depend on our ability to deliver media content in all major formats. If our legal right to store and deliver content in certain formats, like Adobe Flash or Windows Media, for example, was limited, we could not serve our customers and the demand for our services would decline. Owners of proprietary content formats may be able to block, restrict or impose fees or other costs on our use of such formats, leading to additional expenses or prevent our delivery of this type of content, which could materially and adversely affect our operating results.
25
Risks Related to Our Capital Stock
Our common stockholders may experience significant dilution, which could depress the market price of our common stock.
Holders of our stock options and warrants to purchase common stock may exercise their options or warrants to purchase our common stock, which would increase the number of outstanding shares of common stock in the future. As of December 31, 2007, options to purchase an aggregate of 3.2 million shares of our common stock at a weighted average exercise price of $13.29 were outstanding, and warrants to purchase approximately 34,000 shares of our common stock at an exercise price of $9.50 per share were outstanding. Also, the vesting of 0.7 million outstanding restricted stock awards will increase the weighted average number of shares used for calculating diluted net income per share. We issued approximately 12.2 million shares of our common stock to VitalStream’s stockholders in connection with the acquisition in February of 2007. We also assumed outstanding options for the purchase of shares of VitalStream common stock, converted into options to purchase approximately 1.5 million shares of Internap common stock. Furthermore, greater than expected capital requirements could require us to obtain additional financing through the issuance of securities, which could be in the form of common stock or preferred stock or other securities having greater rights than our common stock. The issuance of our common stock or other securities, whether upon the exercise of options and warrants, the future vesting and issuance of stock awards to our executives and employees, or in financing transactions, could depress the market price of the common stock by increasing the number of shares of common stock or other securities outstanding on an absolute basis or as a result of the timing of additional shares of common stock becoming available on the market.
Provisions of our charter documents, our stockholder rights plan and Delaware law may have anti-takeover effects that could prevent a change in control even if the change in control would be beneficial to our stockholders.
Provisions of our certificate of incorporation, as amended, amended and restated bylaws and Delaware law could make an acquisition more difficult, even if doing so would be beneficial to our stockholders. In addition, our Board of Directors recently adopted a stockholder rights plan that renders the consummation of an acquisition without the approval of the Board of Directors more difficult.
Our stock price may be volatile.
The market for our equity securities has been extremely volatile. Our stock price could suffer in the future as a result of any failure to meet the expectations of public market analysts and investors about our results of operations from quarter to quarter. The following factors could cause the price of our common stock in the public market to fluctuate significantly:
| · | actual or anticipated variations in our quarterly and annual results of operations; | ||
| · | changes in market valuations of companies in the Internet connectivity and services industry; | ||
| · | changes in expectations of future financial performance or changes in estimates of securities analysts; | ||
| · | fluctuations in stock market prices and volumes; | ||
26
| · | future issuances of common stock or other securities; | ||
| · | the addition or departure of key personnel; and | ||
| · | announcements by us or our competitors of acquisitions, investments or strategic alliances. | ||
Changes in financial accounting standards may adversely affect our reported results of operations.
New accounting pronouncements and interpretations have occurred and may occur in the future that adversely affect on our reported results. For example, Statement of Financial Accounting Standards No. 123 (revised 2004) “Share Based Payment,” or SFAS No. 123R, required us to account for our stock-based awards as a compensation expense and, as a result, our net income and net income per share in subsequent periods has been significantly reduced.
None.
Our principal executive offices are located in Atlanta, Georgia adjacent to our network operations center, one of our P-NAPs and data center facilities. The Atlanta facility consists of 120,298 square feet under a lease agreement that expires in 2020. We lease other facilities to fulfill our real estate requirements in metropolitan areas and specific cities where our service points are located. We believe our existing facilities are adequate for our current needs and that suitable additional or alternative space will be available in the future on commercially reasonable terms as needed.
We currently, and from time to time, are involved in litigation incidental to the conduct of our business. Although the amount of liability that may result from these matters cannot be ascertained, we do not currently believe that, in the aggregate, such matters will result in liabilities material to our consolidated financial condition, results of operations or cash flows.
None.
PART II
Our common stock is listed on the NASDAQ Global Market under the symbol “INAP” and has traded on the NASDAQ Global Market since September 19, 2006. Our common stock traded on the American Stock Exchange under the symbol “IIP” from February 18, 2004 through September 18, 2006. Our common stock traded on the NASDAQ Small Cap Market from October 4, 2002 through February 17, 2004. The following table presents, for the periods indicated, the range of high and low per share sales prices for our common stock, as reported on the NASDAQ Global Market since September 19, 2006 and on the American Stock Exchange prior to September 19, 2006.
On July 11, 2006, we implemented a one-for-ten reverse stock split of our common stock. The information in the following table has been adjusted to reflect this stock split. Our fiscal year ends on December 31.
27
| Year Ended December 31, 2007: | High | Low | ||||||
| Fourth Quarter | $ | 17.18 | $ | 8.14 | ||||
| Third Quarter | 16.15 | 13.04 | ||||||
| Second Quarter | 19.33 | 12.95 | ||||||
| First Quarter | 20.98 | 15.60 | ||||||
| Year Ended December 31, 2006: | High | Low | ||||||
| Fourth Quarter | $ | 21.25 | $ | 14.10 | ||||
| Third Quarter | 16.80 | 9.30 | ||||||
| Second Quarter | 15.50 | 9.00 | ||||||
| First Quarter | 10.60 | 4.20 | ||||||
As of March 6, 2008, the number of stockholders of record of our common stock was approximately 24,600.
We have never declared or paid any cash dividends on our capital stock, and we do not anticipate paying cash dividends in the foreseeable future. We are prohibited from paying cash dividends under covenants contained in our current credit agreement. We currently intend to retain our earnings, if any, for future growth. Future dividends on our common stock, if any, will be at the discretion of our board of directors and will depend on, among other things, our operations, capital requirements and surplus, general financial condition, contractual restrictions, and such other factors as our board of directors may deem relevant.
The following table provides information regarding our current equity compensation plans as of December 31, 2007 (shares in thousands):
| Equity Compensation Plan Information | ||||||||
Number of securities to be issued upon exercise of outstanding options, warrants and rights (a) | Weighted-average exercise price of outstanding options, warrants and rights (b) | Number of securities remaining available for future issuance under equity compensation plans (excluding securities reflected in column (a) (c) | ||||||
Equity compensation plans approved by security holders | 3,173 | (1) | $ 13.29 | 5,990 | (2) | |||
Equity compensation plans not approved by security holders | — | — | — | |||||
| Total | 3,173 | $ 13.29 | 5,990 | |||||
| (1) | Excludes purchase rights accruing under the 2004 Employee Stock Purchase Plan ("Purchase Plan"). Under the Purchase Plan, each eligible employee may purchase up to $12,500 worth of common stock at each semi-annual purchase date (the last business day of June and December each year), but not more than $25,000 worth of such stock (determined on the basis of the fair market value per share on the date or dates such rights are granted) per calendar year his or her purchase right remains outstanding. The purchase price payable per share will be equal to ninety-five percent (95%) of the closing selling price per share of common stock on the semi-annual purchase date. |
| (2) | Includes 276,000 shares available for issuance under the Purchase Plan. |
28
STOCK PERFORMANCE GRAPH
The graph set forth below compares cumulative total return to our stockholders from an investment in our common stock with the cumulative total return of the NASDAQ Market Index and the Hemscott Group Index, resulting from an initial assumed investment of $100 in each on December 31, 2002, assuming the reinvestment of any dividends, ending at December 31, of each year, 2003 - 2007, respectively.
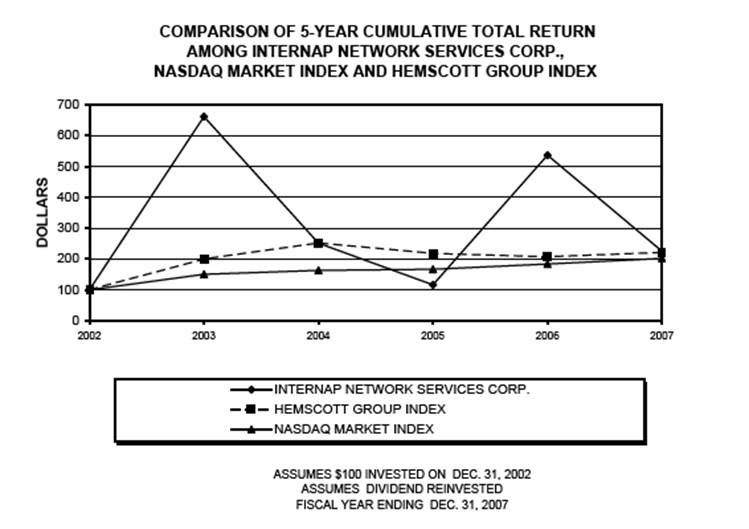
29
The consolidated statement of operations data and other financial data presented below were prepared using our consolidated financial statements for the five years ended December 31, 2007. You should read this selected consolidated financial data together with the consolidated financial statements and related notes contained in this annual report on Form 10-K/A and in our 2006 and 2005 annual reports on Form 10-K/A and Form 10-K, respectively, filed with the SEC, as well as the section of this annual report and of our 2006 and 2005 annual reports on Form 10-K/A and Form 10-K, respectively, entitled, “Management’s Discussion and Analysis of Financial Condition and Results of Operations.”
| Year Ended December 31, | ||||||||||||||||||||
2007 (1) | 2006 (2) | 2005 | 2004 | 2003 | ||||||||||||||||
| (in thousands, except per share data) | ||||||||||||||||||||
| Revenue | $ | 234,090 | $ | 181,375 | $ | 153,717 | $ | 144,546 | $ | 138,580 | ||||||||||
| Operating costs and expenses: | ||||||||||||||||||||
Direct costs of network, sales and services, exclusive of depreciation and amortization, shown below (3) | 118,394 | 97,338 | 81,958 | 76,990 | 78,200 | |||||||||||||||
Direct costs of amortization of acquired technologies (3) | 4,165 | 516 | 577 | 579 | 134 | |||||||||||||||
| Direct costs of customer support | 16,547 | 11,566 | 10,670 | 10,180 | 9,483 | |||||||||||||||
| Product development | 6,564 | 4,475 | 4,864 | 6,412 | 6,982 | |||||||||||||||
| Sales and marketing | 31,533 | 27,173 | 25,864 | 23,411 | 21,491 | |||||||||||||||
| General and administrative | 32,512 | 22,104 | 20,096 | 24,772 | 16,711 | |||||||||||||||
| Depreciation and amortization | 22,242 | 15,856 | 14,737 | 15,461 | 37,087 | |||||||||||||||
| Gain on disposals of property and equipment | (5 | ) | (113 | ) | (19 | ) | (3 | ) | (53 | ) | ||||||||||
| Restructuring and asset impairment | 11,349 | 323 | 44 | 3,644 | 1,084 | |||||||||||||||
| Acquired in-process research and development | 450 | — | — | — | — | |||||||||||||||
| Amortization of deferred stock compensation | — | — | 60 | — | 390 | |||||||||||||||
| Pre-acquisition liability adjustment | 50 | — | — | — | (1,313 | ) | ||||||||||||||
| Total operating costs and expense | 243,801 | 179,238 | 158,851 | 161,446 | 170,196 | |||||||||||||||
| (Loss) income from operations | (9,711 | ) | 2,137 | (5,134 | ) | (16,900 | ) | (31,616 | ) | |||||||||||
| Non-operating (income) expense | (937 | ) | (1,551 | ) | (87 | ) | 772 | 2,158 | ||||||||||||
| (Loss) income before income taxes and equity in earnings of equity method investment | (8,774 | ) | 3,688 | (5,047 | ) | (17,672 | ) | (33,774 | ) | |||||||||||
| (Benefit) provision for income taxes | (3,080 | ) | 145 | — | — | — | ||||||||||||||
| Equity in (earnings) loss of equity-method investment, net of taxes | (139 | ) | (114 | ) | (83 | ) | 390 | 827 | ||||||||||||
Less deemed dividend related to beneficial conversion feature (4) | — | — | — | — | 34,576 | |||||||||||||||
| Net (loss) income | $ | (5,555 | ) | $ | 3,657 | $ | (4,964 | ) | $ | (18,062 | ) | $ | (69,177 | ) | ||||||
| Net (loss) income per share: | ||||||||||||||||||||
| Basic | $ | (0.12 | ) | $ | 0.11 | $ | (0.15 | ) | $ | (0.63 | ) | $ | (3.96 | ) | ||||||
| Diluted | $ | (0.12 | ) | $ | 0.10 | $ | (0.15 | ) | $ | (0.63 | ) | $ | (3.96 | ) | ||||||
| Weighted average shares used in per share calculations | ||||||||||||||||||||
| Basic | 46,942 | 34,748 | 33,939 | 28,732 | 17,460 | |||||||||||||||
| Diluted | 46,942 | 35,739 | 33,939 | 28,732 | 17,460 | |||||||||||||||
30
| December 31, | ||||||||||||||||||||
| 2007 (1) | 2006 | 2005 | 2004 | 2003 | ||||||||||||||||
| Consolidated Balance Sheet Data: | ||||||||||||||||||||
Cash, cash equivalents and short-term marketable securities | $ | 71,599 | $ | 58,882 | $ | 40,494 | $ | 45,985 | $ | 18,885 | ||||||||||
| Non-current marketable securities | — | — | — | 4,656 | — | |||||||||||||||
| Total assets | 427,010 | 173,702 | 155,369 | 168,149 | 135,839 | |||||||||||||||
| Note payable and capital lease obligations, less current portion | 17,806 | 3,364 | 7,903 | 12,837 | 12,742 | |||||||||||||||
| Total stockholders’ equity | 346,633 | 126,525 | 109,728 | 113,738 | 70,524 | |||||||||||||||
| Year Ended December 31, | ||||||||||||||||||||
2007 (1) | 2006 | 2005 | 2004 | 2003 | ||||||||||||||||
| Other Financial Data: | ||||||||||||||||||||
| Purchases of property and equipment | $ | 30,271 | $ | 13,382 | $ | 10,161 | $ | 13,066 | $ | 3,799 | ||||||||||
| Net cash provided by (used in) operating activities | 27,592 | 29,599 | 5,493 | (1,150 | ) | (11,175 | ) | |||||||||||||
| Net cash (used in) provided by investing activities | (36,393 | ) | (10,399 | ) | (9,428 | ) | (29,659 | ) | 561 | |||||||||||
| Net cash provided by (used in) financing activities | 15,240 | 1,957 | (5,454 | ) | 45,747 | 4,280 | ||||||||||||||
| (1) | On February 20, 2007 we completed our acquisition of VitalStream, whereby VitalStream became a wholly-owned subsidiary of Internap. Prior to our acquisition of VitalStream, we did not offer proprietary CDN services, but instead, we were a reseller of third party CDN services. Under the purchase method of accounting, we allocated the total estimated purchase price to VitalStream’s net tangible and intangible assets based on their estimated fair values as of February 20, 2007. We recorded the excess purchase price over the value of the net tangible and identifiable intangible assets as goodwill. Also, as a result of the acquisition we issued approximately 12.2 million shares of Internap common stock. |
| (2) | Effective January 1, 2006, we adopted SFAS No. 123 (revised 2004), “Share-Based Payment” (SFAS No. 123R) and related interpretations, using the modified prospective transition method and therefore have not restated prior periods’ results. Prior to the adoption of SFAS No. 123R on January 1, 2006, we accounted for stock-based compensation plans under the recognition and measurement provisions of Accounting Principles Board (APB) Opinion No. 25, “Accounting for Stock Issued to Employees,” and related interpretations. We also provided disclosures in accordance with SFAS No. 123, “Accounting for Stock-Based Compensation,” as amended by SFAS No. 148, “Accounting for Stock-Based Compensation — Transition and Disclosures — an Amendment of FASB Statement No. 123.” Accordingly, no expense was recognized for options to purchase our common stock that we granted with an exercise price equal to fair market value at the date of grant and no expense was recognized in connection with purchases under employee stock purchase plans for any periods prior to January 1, 2006. |
| (3) | Prior to 2007, direct costs of amortization of acquired technologies were included in the caption direct costs of network, sales and services, exclusive of depreciation and amortization. In 2007, we reclassified these costs to a separate caption. These reclassifications had no effect on previously reported operating loss (income) or net loss (income). |
| (4) | In August 2003, we completed a private placement of our common stock, which resulted in a decrease of the conversion price of our series A preferred stock to $9.50 per share and an increase in the number of shares of common stock issuable upon conversion of all shares of series A preferred stock by 3.5 million shares. We recorded a deemed dividend of $34.6 million in connection with the conversion price adjustment, which is attributable to the additional incremental number of shares of common stock was issuable upon conversion of our series A preferred stock. |
31
The following discussion should be read in conjunction with the consolidated financial statements and accompanying notes provided under Part II, Item 8 of this annual report on Form 10-K/A.
Overview
We deliver high performance and reliable Internet solutions through a suite of network optimization and delivery products and services. These solutions, combined with progressive and proactive technical support, enable companies to confidently migrate business-critical applications, including audio and video streaming and monetization services, to the Internet. Our suite of products and services support a broad range of Internet applications. We currently have approximately 3,800 customers, serving financial services, healthcare, technology, retail, travel, and media/entertainment markets. Our customers are located in the United States and abroad and include several Fortune 1000 and mid-tier enterprises. Our product and service offerings are complemented by Internet protocol, or IP, access solutions such as data center services, content delivery networks, or CDN, and managed security. We deliver services through our 50 service points across North America, Europe and the Asia-Pacific region. Our Private Network Access Points, or P-NAPs, feature multiple direct high-speed connections to major Internet networks including AT&T Inc., Sprint Nextel Corporation, Verizon Communications Inc., Savvis, Inc., Global Crossing Limited, and Level 3 Communications, Inc.
The key characteristic that differentiates us from our competition is our portfolio of patented and patent-pending route optimization solutions that address the inherent weaknesses of the Internet and overcome the inefficiencies of traditional IP connectivity options. Our intelligent routing technology can facilitate traffic over multiple carriers, as opposed to just one carrier's network, to ensure highly reliable performance over the Internet.
We believe our unique managed multi-network approach provides better performance, control and reliability compared to conventional Internet connectivity alternatives. Our service level agreements guarantee performance across the entire Internet in the United States, excluding local connections, whereas providers of conventional Internet connectivity typically only guarantee performance on their own network.
On October 12, 2006, we entered into a definitive agreement to acquire VitalStream Holdings, Inc., or VitalStream, in an all-stock transaction accounted for using the purchase method of accounting for business combinations. The transaction closed on February 20, 2007. Our results of operations include the activities of VitalStream from February 21, 2007 through December 31, 2007.
As discussed in note 18 to our consolidated financial statements, we revised our quarterly statement of operations for the quarter ended September 30, 2007 to appropriately record (1) $0.5 million for sales adjustments, which reduced net accounts receivable and revenue, and (2) $0.1 million for accretion of interest income that we initially included as unrealized gain in accumulated other comprehensive income within stockholders’ equity. The effect of these revisions had no impact on our consolidated statement of cash flows. We have determined that these adjustments are not material to our consolidated financial statements for any of the affected quarterly periods. Accordingly, we have not revised the 2007 quarterly financial statements included in our previously filed Forms 10-Q for the quarterly periods ended March 31, June 30 and September 30, 2007, for these adjustments.
We operate in three business segments: IP services, data center services and CDN services. For additional information about these segments, see note 5 to the consolidated financial statements included in Part II, Item 8.
The following is a brief description of each of our reportable business segments.
IP Services
Our patented and patent-pending network performance optimization technologies address the inherent weaknesses of the Internet, allowing enterprises to take advantage of the convenience, flexibility and reach of the Internet to connect to customers, suppliers and partners. Our solutions take into account the unique performance requirements of each business application to ensure performance as designed, without unnecessary cost. Prior to recommending appropriate network solutions for our customers’ applications, we consider key performance objectives including (1) performance and cost optimization, (2) application control and speed and (3) delivery and reach. Our charges for IP services are based on a fixed-fee, usage or a combination of both fixed fee and usage.
32
Our IP services segment also includes our flow control platform, or FCP. The FCP provides network performance management and monitoring for companies with multi-homed networks and redundant Internet connections. The FCP proactively reviews customer networks for the best performing route or the most cost-effective and routes according to our customers’ requirements. We offer FCP as either a one-time hardware purchase or as a monthly subscription service. Sales of FCP also generate annual maintenance fees and professional service fees for installation and ongoing network configuration. Since the FCP emulates our P-NAP service in many ways, this product affords us the opportunity to serve customers outside of our P-NAP market footprint. This product represents approximately 4% of our IP services revenue and approximately 2% of our consolidated revenue for the year ended December 31, 2007.
Data Center Services
Our data center services provide a single source for network infrastructure, IP and security, all of which are designed to maximize solution performance while providing a more stable, dependable infrastructure, and are backed by guaranteed service levels and our team of dedicated support professionals. We offer a comprehensive solution at 42 service points, including eight locations managed by us and 34 locations managed by third parties.
Data center services also enable us to have a more flexible product offering, including bundling our high performance IP connectivity and managed services, such as content delivery, along with hosting customers' applications. We charge monthly fees for data center services based on the amount of square footage that the customer leases in our facilities. We also have relationships with various providers to extend our P-NAP model into markets with high demand.
CDN Services
Our CDN services enable our customers to quickly and securely stream and distribute video, audio, advertising, and software to audiences across the globe through strategically located data centers. Providing capacity-on-demand to handle large events and unanticipated traffic spikes, content is delivered with high quality regardless of audience size or geographic location. Our MediaConsole® content management tool provides our customers the benefit of a single, easy to navigate system featuring Media Asset Management, Digital Rights Management, or DRM, support, and detailed reporting tools. With MediaConsole, our customers can use one application to manage and control access to their digital assets, deliver advertising campaigns, view network conditions, and gain insight into habits of their viewing audience.
Our CDN and monetization services provide a complete turnkey solution for the monetization of online media. These multi-faceted “live” and “on-demand” advertisement insertion and advertising placement solutions include a full campaign management suite, inventory prediction tools, audience research and metrics, and extensive reporting features to effectively track advertising campaigns in real-time. Online advertising solutions enable our customers to offset the costs associated with the creation, transformation, licensing, and management of online content. Prior to our acquisition of VitalStream on February 20, 2007, we did not offer proprietary CDN services, but instead, we were a reseller of third party CDN services for which results of operations are included in Other revenues and direct costs of network, sales and services, discussed below.
Other
Other revenues and direct costs of network, sales and services include our non-segmented results of operations, including certain reseller and miscellaneous services such as third party CDN services, termination fee revenue, other hardware sales, and consulting services.
Highlights and Outlook
| · | Due to the nature of the services we provide, we generally price our IP services at a premium compared to the services offered by conventional Internet connectivity service providers. We believe customers with business-critical Internet applications will continue to demand the highest quality of service as their Internet connectivity needs grow and become even more complex and, as such, will continue to pay a premium for our high performance managed IP services. |
33
| · | Our success in executing our premium pricing strategy depends, to a significant degree, on our ability to differentiate our connectivity solutions from lower cost alternatives. The key measures of our success in achieving this differentiation are revenue and customer growth. During 2007, we added approximately 1,500 net customers (including approximately 900 VitalStream customers that we added as part of the VitalStream acquisition), bringing our total to approximately 3,800 enterprise customers as of December 31, 2007. Revenue for the year ended December 31, 2007 increased 29% to $234.1 million, compared to revenue of $181.4 million for the year ended December 31, 2006. |
| · | We intend to increase revenue by leveraging the capabilities of our existing network access points. In our existing markets, we realize incremental margins as new customers are added. Additional volume in an existing market allows improved utilization of existing facilities and an improved ability to cost-effectively predict and acquire additional network capacity. We experienced a net increase in customers from 2006 to 2007. Conversely, decreases in the number of customers in an established market lead to decreased facility utilization and increase the possibility that direct network resources are not cost-efficiently employed. These factors have a direct bearing on our financial position and results of operations. | |
| · | We offer a 100% operational uptime guarantee for our network performance management. Coupled with the lowest packet loss and latency in the industry, we provide our customers with a proactive industry-leading Service Level Agreement (SLA) that covers the entire Internet - not just one single network. Unlike our competitors, we believe so strongly in the consistent performance of our network that we offer proactive SLA notification and automatic bill credits if we ever break our SLAs. We believe that this commitment allows us to provide the best network performance available. |
Developments in 2007
| · | VitalStream’s services were a logical extension and complement to our high performance route control products and services. |
| · | We evaluated demand for CDN services within our customer base and determined that a market for proprietary CDN services existed. |
| · | VitalStream’s services offered our legacy customers additional high growth and high margin revenue streams. |
| · | We believed that large audio and video files are more effectively delivered over the Internet with a combination of VitalStream’s platform and our route management network. |
| · | VitalStream’s initiatives in the rich media advertising services business present an entirely new set of opportunities and potential customer relationships for us, as advertisers seek to access a large and growing base of Internet users that watch increasing amounts of video online. |
34
We accounted for the acquisition using the purchase method of accounting in accordance with SFAS No. 141, “Business Combinations.” Our results of operations include the activities of VitalStream from February 21, 2007 through December 31, 2007.
Restructuring Liability. On March 31, 2007, we incurred a restructuring and impairment charge totaling $10.3 million. The charge was the result of a review of our business, particularly in light of our acquisition of VitalStream, and our plan to finalize the overall integration and implementation plan before the end of the first quarter. The charge to expense included $7.8 million for leased facilities, representing both the net present value of costs less anticipated sublease recoveries that will continue to be incurred without economic benefit to us and costs to terminate leases before the end of their term. The charge also included severance payments of $1.1 million for the termination of certain Internap employees and $1.4 million for impairment of assets. Related expenditures are estimated to be $10.7 million, of which $3.7 million has been paid during the year ended December 31, 2007, and the balance continuing through December 2016, the last date of the longest lease term. The impairment charge of $1.3 million was related to the leases referenced above and less than $0.1 million for other assets.
We also incurred a $1.1 million impairment recorded for a sales order-through-billing system, which was a result of an evaluation of the existing infrastructure relative to our new financial accounting system and the acquisition of VitalStream.
Write-Off of Investment. In connection with the preparation of our quarterly report for the quarter ended June 30, 2007, we wrote-off an investment, totaling $1.2 million, representing the remaining carrying value of our investment in series D preferred stock of Aventail Corporation, or Aventail. We made an initial cash investment of $6.0 million in Aventail series D preferred stock pursuant to an investment agreement in February 2000. In connection with a subsequent round of financing by Aventail, we recognized an initial impairment loss on our investment of $4.8 million in 2001. On June 12, 2007, SonicWall, Inc. announced that it had entered into an agreement to acquire Aventail for approximately $25.0 million in cash. The transaction closed on July 11, 2007, all shares of series D preferred stock were cancelled and the holders of series D preferred stock did not receive any consideration for such shares. Consequently, we recorded a write-off of our investment in Aventail to reduce our carrying value to $0.
Rights Agreement. On March 15, 2007, the Board of Directors declared a dividend of one preferred share purchase right, or a Right, for each outstanding share of common stock, par value $0.001 per share, of the Company. The dividend was payable on March 23, 2007 to the stockholders of record on that date. Each Right entitles the registered holder to purchase from the Company one one-thousandth of a share of Series B Preferred Stock of the Company, par value $0.001 per share, or the Preferred Shares, at a price of $100.00 per one one-thousandth of a Preferred Share, subject to adjustment. The description and terms of the Rights are set forth in a Rights Agreement between the Company and American Stock Transfer & Trust Company, as Rights Agent dated April 11, 2007.
Data Center Expansion. On June 12, 2007, we announced that we approved an investment of up to $40.0 million to fund the expansion of our data center facilities in several key markets. We anticipate implementing the expansion over the next several calendar quarters, with at least a portion of the funding to be provided under our credit agreement, discussed below. Through December 31, 2007, we have spent less than $10.0 million.
Credit Agreement. On September 14, 2007, we entered into a $35.0 million credit agreement. We discuss this agreement in note 10 to the consolidated financial statements and the section captioned “Liquidity and Capital Resources” under “Item 2. Managements Discussion and Analysis of Financial Condition and Results of Operations.” At December 31, 2007, the outstanding balance was $19.8 million, of which we used $4.4 million to repay prior debt, approximately $7.8 million for capital expenditures and the balance for general corporate and other purposes. The availability under the revolving credit facility and term loan was $1.1 million and $10.0 million, respectively at December 31, 2007.
35
Critical Accounting Policies and Estimates
The discussion and analysis of our financial condition and results of operations are based upon our consolidated financial statements, which have been prepared in accordance with accounting principles generally accepted in the United States. The preparation of these financial statements requires management to make estimates and judgments that affect the reported amounts of assets, liabilities, revenue, and expense, and related disclosure of contingent assets and liabilities. On an ongoing basis, we evaluate our estimates, including those summarized below. We base our estimates on historical experience and on various other assumptions that are believed to be reasonable under the circumstances, the results of which form the basis for making judgments about the carrying values of assets and liabilities that are not readily apparent from other sources. Actual results may differ materially from these estimates under different assumptions or conditions.
Management believes the following critical accounting policies affect the judgments and estimates used in the preparation of our consolidated financial statements.
Revenue recognition. The majority of our revenue is derived from high performance IP services, related data center services, CDN services, and other ancillary products and services throughout the United States. Our IP services revenue is derived from the sale of high performance Internet connectivity services at fixed rates or usage-based pricing to our customers that desire a DS-3 or faster connection. Slower T-1 and fractional DS-3 connections are provided at fixed rates. Data center revenue includes both physical space for hosting customers’ network and other equipment plus associated services such as redundant power and network connectivity, environmental controls and security. Data center revenue is based on occupied square feet and both allocated and variable-based usage. CDN revenue includes three components, none of which are sold separately: (1) data storage; (2) streaming/delivery and (3) a user interface/reporting tool. We provide the CDN service components via internally developed and acquired technology that resides on our network. CDN revenue is based on either fixed rates or usage-based pricing. All of the foregoing revenue arrangements have contractual terms and in many instances, include minimum usage commitments. Other ancillary products and services include our Flow Control Platform, or FCP, product, server management and installation, virtual private networking, managed security, data backup, remote storage and restoration.
We recognize revenue in accordance with the Securities and Exchange Commission’s Staff Accounting Bulletin No. 104, Revenue Recognition, or SAB No. 104, and the Financial Accounting Standards Board’s, or FASB, Emerging Issues Task Force Issue No. 00-21, Revenue Arrangements with Multiple Deliverables, or EITF No. 00-21. Revenue is recognized when persuasive evidence of an arrangement exists, the product or service has been delivered, the fees are fixed or determinable and collectibility is probable. For most of our IP, data center and CDN revenue, services are delivered ratably over the contract term. Contracts and sales or purchase orders are used to determine the existence of an arrangement. We test for availability or connectivity to verify delivery of our services. We assess whether the fee is fixed or determinable based on the payment terms associated with the transaction and whether the sales price is subject to refund or adjustment. Because the software component of our FCP is more than incidental to the product as a whole, we recognize associated FCP revenue in accordance with the American Institute of Certified Public Accountants’ (AICPA) Statement of Position 97-2, Software Revenue Recognition.
We derive revenue from the sale of IP services, data center services and CDN services to customers under contracts that generally commit the customer to a minimum monthly level of usage on a calendar month basis and provide the rate at which the customer must pay for actual usage above the monthly minimum. For these services, we recognize the monthly minimum as revenue each month provided that an enforceable contract has been signed by both parties, the service has been delivered to the customer, the fee for the service is fixed or determinable and collection is reasonably assured. Should a customer’s usage of our services exceed the monthly minimum, we recognize revenue for such excess in the period of the usage. We record the installation fees as deferred revenue and recognize as revenue ratably over the estimated life of the customer arrangement. We also derive revenue from services sold as discrete, non-recurring events or based solely on usage. For these services, we recognize revenue after both parties have signed an enforceable contract, the fee is fixed or determinable, the event or usage has occurred and collection is reasonably assured.
36
We also enter into multiple-element arrangements or bundled services, such as combining IP services with data center, CDN services or both. When we enter into such arrangements, we account for each element separately over its respective service period or at the time of delivery, provided that there is objective evidence of fair value for the separate elements. Objective evidence of fair value includes the price charged for the element when sold separately. If we cannot objectively determine the fair value of each element, we recognize the total value of the arrangement ratably over the entire service period to the extent that we have begun to provide the services, and other revenue recognition criteria have been satisfied.
Deferred revenue consists of revenue for services to be delivered in the future and consist primarily of advance billings, which are amortized over the respective service period. Revenue associated with billings for installation of customer network equipment are deferred and amortized over the estimated life of the customer relationship, which was two to three years for each of the three years in the period ended December 31, 2007. Revenue for installation services is deferred and amortized because the installation service is integral to our primary service offering and does not have value to a customer on a stand-alone basis. Deferred post-contract customer support associated with sales of our FCP solution and similar products are amortized ratably over the contract period, which is generally one year.
Customer credit risk. We routinely review the creditworthiness of our customers. If we determine that collection of service revenue is uncertain, we do not recognize revenue until collection is probable. Additionally, we maintain allowances for doubtful accounts resulting from the inability of our customers to make required payments on accounts receivable. The allowance for doubtful accounts is based upon specific and general customer information, which also includes estimates based on management's best understanding of the customer’s ability to pay. A customer’s ability to pay takes into consideration payment history, legal status (i.e., bankruptcy) and the status of services we are providing. Once we have exhausted all collection efforts, we write the uncollectible balance off against the allowance for doubtful accounts.
We record an amount for sales adjustments, which reduces net accounts receivable and revenue. The amount for sales adjustments is based upon specific and general customer information, including outstanding promotional credits, customer disputes, credit adjustments not yet processed through the billing system, and historical activity.
Accounting for leases and leasehold improvements. We record leases as capital or operating leases and account for leasehold improvements in accordance with SFAS No. 13, “Accounting for Leases” and related literature. We record rent expense for operating leases in accordance with FASB Technical Bulletin (FTB) No. 88-1, “Issues Relating to Accounting for Leases.” This FTB requires lease agreements that include periods of free rent or other incentives, specific escalating lease payments, or both, to be recorded on a straight-line or other systematic basis over the initial lease term and those renewal periods that are reasonably assured. The difference between rent expense and rent paid is recorded as deferred rent in non-current liabilities in the consolidated balance sheets.
Investments. We account for investments without readily determinable fair values at historical cost, as determined by our initial investment. The recorded value of cost-basis investments is periodically reviewed to determine the propriety of the recorded basis. When a decline in the value that is judged to be other than temporary has occurred, based on available data, the cost basis is reduced and an investment loss is recorded. We incurred a charge during the three months ended June 30, 2007, totaling $1.2 million, representing the write-off of the remaining carrying value of our investment in series D preferred stock of Aventail Corporation, or Aventail. See note 6 to the consolidated financial statements for further discussion of this investment and the recorded loss.
37
We account for investments that provide us with the ability to exercise significant influence, but not control, over an investee using the equity method of accounting. Significant influence, but not control, is generally deemed to exist if we have an ownership interest in the voting stock of the investee of between 20% and 50%, although other factors, such as minority interest protections, are considered in determining whether the equity method of accounting is appropriate. As of December 31, 2007, Internap Japan Co, Ltd. (Internap Japan), our joint venture with NTT-ME Corporation of Japan and NTT Holdings, qualifies for equity method accounting. We record our proportional share of the income and losses of Internap Japan one month in arrears on the consolidated balance sheets as a component of non-current investments and as a separate caption on the consolidated statement of operations.
Pursuant to our formal investment policy, investments in marketable securities include high credit quality corporate debt securities, auction rate securities, commercial paper, and U.S. Government Agency debt securities. Auction rate securities are variable rate bonds tied to short-term interest rates with maturities on the face of the securities in excess of 90 days and have interest rate resets through a modified Dutch auction, at predetermined short-term intervals, usually every 7, 28 or 35 days. Auction rate securities generally trade at par and are callable at par on any interest payment date at the option of the issuer. Interest received during a given period is based upon the interest rate determined through the auction process. Although these securities are issued and rated as long term bonds, they are priced and traded as short-term instruments because of the liquidity provided through the interest rate reset. All of our marketable securities are classified as available for sale and are recorded at fair value with changes in fair value reflected in other comprehensive income.
Goodwill. We account for goodwill under SFAS No. 142, “Goodwill and Other Intangible Assets.” This statement requires an impairment-only approach to accounting for goodwill. The SFAS No. 142 goodwill impairment model is a two-step process. As a first step, it requires a comparison of the book value of net assets to the fair value of the related operations that have goodwill assigned to them. If the fair value is determined to be less than book value, a second step is performed to compute the amount of the impairment. In this process, a fair value for goodwill is estimated, based in part on the fair value of the operations used in the first step, and is compared to the carrying value for goodwill. Any shortfall of the fair value below carrying value represents the amount of goodwill impairment. SFAS No. 142 requires goodwill to be tested for impairment annually at the same time every year and when an event occurs or circumstances change such that it is reasonably possible that impairment may exist. We selected August 1 as our annual testing date. We also assess on a quarterly basis whether any events have occurred or circumstances have changed that would indicate an impairment could exist.
Accrued liabilities. Similar to accruals for disputed telecommunications costs above, it is necessary for us to estimate other significant costs such as utilities and sales, use, telecommunications, and other taxes. These estimates are often necessary either because invoices for services are not received on a timely basis from our vendors or by virtue of the complexity surrounding the costs. In every instance in which an estimate is necessary, we record the related cost and liability based on all available facts and circumstances, including but not limited to historical trends, related usage, forecasts, and quotes. Management periodically reviews and modifies estimates in light of new information or developments, if any. Because estimates regarding accrued liabilities include assessments of uncertain outcomes, such estimates are inherently vulnerable to changes due to unforeseen circumstances that could materially and adversely affect our results of operations and cash flows.
38
Restructuring liability. When circumstances warrant, we may elect to exit certain business activities or change the manner in which we conduct ongoing operations. When we make such a change, management will estimate the costs to exit a business or restructure ongoing operations. The components of the estimates may include estimates and assumptions regarding the timing and costs of future events and activities that represent management's best expectations based on known facts and circumstances at the time of estimation. Management periodically reviews its restructuring estimates and assumptions relative to new information, if any, of which it becomes aware. Should circumstances warrant, management will adjust its previous estimates to reflect what it then believes to be a more accurate representation of expected future costs. Because management's estimates and assumptions regarding restructuring costs include probabilities of future events, such estimates are inherently vulnerable to changes due to unforeseen circumstances, changes in market conditions, regulatory changes, changes in existing business practices, and other circumstances that could materially and adversely affect our results of operations. A 10% change in our restructuring estimates in a future period, compared to the $10.1 million restructuring liability at December 31, 2007 would result in an $1.0 million expense or benefit in the statement of operations during the period in which the change in estimate occurred.
Deferred taxes. We record a valuation allowance to reduce our deferred tax assets to the amount that is more likely than not to be realized. Historically, we have recorded a valuation allowance equal to our net deferred tax assets. Although we consider the potential for future taxable income and ongoing prudent and feasible tax planning strategies in assessing the need for the valuation allowance, in the event we determine we would be able to realize our deferred tax assets in the future in excess of our net recorded amount, an adjustment to reduce the valuation allowance would increase income in the period such determination was made.
For the year ended December 31, 2007, the tax provision includes a net benefit of $3.5 million related to the release of the valuation allowance associated with U.K. deferred tax assets. The gross amount of U.K. deferred tax assets was $4.4 million, which was offset by a reserve of $0.9 million. The net tax provision benefit of $3.5 million reduced our loss for the year ended December 31, 2007.
The reduction in valuation allowance was due to the existence of sufficient positive evidence as of December 31, 2007 to indicate that our net operating losses in the U.K. would more likely than not be realized in the future. The evidence primarily consists of the results of prior performance in the U.K. and the expectation of future performance based on historical results. We will continue to assess in the future the recoverability of U.S. and other deferred tax assets, and whether or not the valuation allowance should be reduced relative to the U.S. and other deferred tax assets outside the U.K.
Stock-based compensation. We account for stock-based instruments issued to employees in exchange for their services under the fair value recognition provisions of SFAS No. 123 (revised 2004), “Share-Based Payment,” or SFAS No. 123R, and related interpretations. Under SFAS No. 123R, share-based compensation cost is measured at the grant date based on the calculated fair value of the award. The expense is recognized over the employee’s requisite service period, generally the vesting period of the award. Prior to the adoption of SFAS No. 123R on January 1, 2006, we utilized the disclosure only provisions of SFAS No. 123, “Accounting for Stock-Based Compensation,” and accounted for stock-based compensation plans under the recognition and measurement provisions of APB Opinion No. 25, “Accounting for Stock Issued to Employees,” and related interpretations. Accordingly, we did not recognize any expense for options to purchase our common stock granted with an exercise price equal to fair market value at the date of grant and did not recognize any expense in connection with purchases under our employee stock purchase plans for any periods prior to January 1, 2006.
We elected to adopt SFAS No. 123R using the modified prospective application method. Under this method, compensation cost recognized during the period includes: (1) compensation cost for all share-based payments granted prior to, but not yet vested as of January 1, 2006, based on the grant date fair value estimated in accordance with the original provisions of SFAS No. 123 amortized over the awards’ vesting period, and (2) compensation cost for all share-based payments granted subsequent to January 1, 2006, based on the grant-date fair value estimated in accordance with the provisions of SFAS No. 123R amortized on a straight-line basis over the awards’ vesting period. The fair value of stock options is estimated at the date of grant using the Black-Scholes option pricing model with weighted average assumptions for the activity under our stock plans. Option pricing model input assumptions such as expected term, expected volatility, and risk-free interest rate, impact the fair value estimate. Further, the forfeiture rate impacts the amount of aggregate compensation. These assumptions are subjective and generally require significant analysis and judgment to develop.
39
The expected term represents the weighted average period of time that granted options are expected to be outstanding, giving consideration to the vesting schedules and our historical exercise patterns. Because our options are not publicly traded, assumed volatility is based on the historical volatility of our stock. The risk-free interest rate is based on the U.S. Treasury yield curve in effect at the time of grant for periods corresponding to the expected life of the options. We have also used historical data to estimate option exercises, employee termination and stock option forfeiture rates. Changes in any of these assumptions could materially impact our results of operations in the period the change is made.
Recent Accounting Pronouncements
In September 2006, the FASB issued SFAS No. 157, “Fair Value Measurements,” or SFAS No. 157. SFAS No. 157 defines fair value, establishes a framework for measuring fair value under generally accepted accounting principles, or GAAP, and expands disclosures about fair value measurements. SFAS No. 157 is effective for fiscal years beginning after December 15, 2007. In February 2008, the FASB issued Staff Position, or FSP, FAS 157-1, which provides supplemental guidance on the application of SFAS No. 157, and FSP FAS 157-2, which delays the effective date of SFAS No. 157 for nonfinancial assets and nonfinancial liabilities. We are currently in the process of evaluating the impact that the adoption of SFAS No. 157 will have on our financial position, results of operations and cash flows.
In February 2007, the FASB issued SFAS No. 159, “The Fair Value Option for Financial Assets and Financial Liabilities,” or SFAS NO. 159. SFAS No. 159 permits companies to choose to measure, on an instrument-by-instrument basis, many financial instruments and certain other assets and liabilities at fair value that are not currently required to be measured at fair value. SFAS No. 159 is effective as of the beginning of a fiscal year that begins after November 15, 2007. While we will not elect to adopt fair value accounting to any assets or liabilities allowed by SFAS No. 159, we are currently in the process of evaluating SFAS No. 159 and its potential impact to us.
In December 2007, the FASB issued SFAS No. 141 (revised 2007), “Business Combinations,” or SFAS No. 141R. SFAS No. 141R replaces SFAS No. 141, “Business Combinations.” SFAS No. 141R establishes principles and requirements for how an acquiror recognizes and measures in its financial statements the identifiable assets acquired, the liabilities assumed, any noncontrolling interest in the acquiree, and the goodwill acquired or a gain from a bargain purchase. SFAS No. 141R also determines disclosure requirements to enable the evaluation of the nature and financial effects of the business combination. SFAS No. 141R applies prospectively to business combinations for which the acquisition date is on or after the beginning of a fiscal year that begins on or after December 15, 2008 and has implications for acquisitions that occur prior to this date. We are currently in the process of evaluating the impact that the adoption of SFAS No. 141R will have on our financial position, results of operations and cash flows.
In December 2007, the FASB issued SFAS No. 160, “Noncontrolling Interests in Consolidated Financial Statements,” or SFAS No. 160. SFAS No. 160 amends Accounting Research Bulletin 51, “Consolidated Financial Statements,” or ARB 51, and requires all entities to report noncontrolling (minority) interests in subsidiaries within equity in the consolidated financial statements, but separate from the parent shareholders’ equity. SFAS No. 160 also requires any acquisitions or dispositions of noncontrolling interests that do not result in a change of control to be accounted for as equity transactions. Further, SFAS No. 160 requires that a parent recognize a gain or loss in net income when a subsidiary is deconsolidated. SFAS No. 160 is effective for fiscal years beginning on or after December 15, 2008. We do not expect the adoption of SFAS No. 160 will have a significant, if any, impact on our financial position, results of operations and cash flows.
40
Revenues. Revenues are generated primarily from the sale of IP services, data center services and CDN services. Our revenues typically consist of monthly recurring revenues from contracts with terms of one year or more. These contracts usually have fixed minimum commitments based on a certain level of usage with additional charges for any usage over a specified limit. We also provide premise-based route optimization products and other ancillary services, such as server management and installation services, virtual private networking services, managed security services, data back-up, remote storage, restoration services, and professional services.
Direct costs of network, sales and services. Direct costs of network, sales and services are comprised primarily of:
| · | costs for connecting to and accessing Internet network service providers, or ISPs, and competitive local exchange providers; | |
| · | facility and occupancy costs for housing and operating our and our customers’ network equipment; | |
| · | costs of license fees for operating systems software, advertising royalties to content rights owners and advertising distribution costs; | |
| · | costs incurred for providing additional third party services to our customers; and | |
| · | costs of FCP solutions sold. | |
To the extent a network access point is located a distance from the respective ISP, we may incur additional local loop charges on a recurring basis. Connectivity costs vary depending on customer demands and pricing variables while network access point facility costs are generally fixed in nature. Direct costs of network, sales and services do not include compensation, depreciation or amortization.
Direct costs of amortization of acquired technologies. Direct costs of amortization of acquired technologies are for technologies acquired through business combinations that are an integral part of the services and products we sell. The cost of the acquired technologies is amortized over original lives of three to eight years.
Direct costs of customer support. Direct costs of customer support consist primarily of compensation and other personnel costs for employees engaged in connecting customers to our network, installing customer equipment into network access point facilities, and servicing customers through our network operations centers. In addition, facilities costs associated with the network operations center are included in direct costs of customer support.
Product development costs. Product development costs consist principally of compensation and other personnel costs, consultant fees and prototype costs related to the design, development and testing of our proprietary technology, enhancement of our network management software and development of internal systems. Costs for software to be sold, leased or otherwise marketed are capitalized upon establishing technological feasibility and ending when the software is available for general release to customers. Costs associated with internal use software are capitalized when the software enters the application development stage until the software is ready for its intended use. All other product development costs are expensed as incurred.
Sales and marketing costs. Sales and marketing costs consist of compensation, commissions and other costs for personnel engaged in marketing, sales and field service support functions, as well as advertising, tradeshows, direct response programs, new service point launch events, management of our web site, and other promotional costs.
General and administrative costs. General and administrative costs consist primarily of compensation and other expense for executive, finance, human resources and administrative personnel, professional fees, and other general corporate costs.
41
The following table sets forth, as a percentage of total revenue, selected statement of operations data for the periods indicated:
| Year Ended December 31, | ||||||||
| 2007 | 2006 | 2005 | ||||||
| Revenues: | ||||||||
| Internet protocol (IP) services | 51.2 | % | 60.5 | % | 68.3 | % | ||
| Data center services | 35.5 | 31.0 | 24.1 | |||||
| Content delivery network (CDN) services | 7.6 | — | — | |||||
| Other | 5.7 | 8.5 | 7.6 | |||||
| Total revenues | 100.0 | 100.0 | 100.0 | |||||
| Operating costs and expenses: | ||||||||
| Direct costs of network, sales and services, exclusive of depreciation and amortization, shown below: | ||||||||
| IP services | 18.7 | 21.9 | 25.0 | |||||
| Data center services | 25.4 | 25.6 | 22.9 | |||||
| CDN services | 2.8 | — | — | |||||
| Other | 3.7 | 6.1 | 5.4 | |||||
| Direct costs of amortization of acquired technologies | 1.8 | 0.3 | 0.4 | |||||
| Direct costs of customer support | 7.1 | 6.4 | 6.9 | |||||
| Product development | 2.8 | 2.5 | 3.2 | |||||
| Sales and marketing | 13.4 | 15.0 | 16.8 | |||||
| General and administrative | 13.9 | 12.2 | 13.1 | |||||
| Depreciation and amortization | 9.5 | 8.7 | 9.6 | |||||
| Restructuring and asset impairment | 4.9 | 0.2 | — | |||||
| Other operating costs and expenses | 0.2 | (0.1 | ) | — | ||||
| Total operating costs and expenses | 104.2 | 98.8 | 103.3 | |||||
| (Loss) income from operations | ( 4.2 | ) % | 1.2 | % | (3.3 | ) % | ||
Revenues
Revenues for the years ended December 31, 2007, 2006 and 2005 are summarized as follows (in thousands):
| Year Ended December 31, | ||||||||||||
| 2007 | 2006 | 2005 | ||||||||||
| Revenues: | ||||||||||||
| Internet protocol (IP) services | $ | 119,848 | $ | 109,748 | $ | 105,032 | ||||||
| Data center services | 83,058 | 56,152 | 36,996 | |||||||||
| Content delivery network (CDN) services | 17,718 | — | — | |||||||||
| Other | 13,466 | 15,475 | 11,689 | |||||||||
| $ | 234,090 | $ | 181,375 | $ | 153,717 | |||||||
Segment information. We have three business segments: IP services, data center services and CDN services. IP services include managed and premise-based high performance IP and route optimization technologies. Data center services include hosting of customer applications directly on our network to eliminate issues associated with the quality of local connections. Data center services are increasingly bundled with our high performance IP connectivity services. CDN services include products and services for storing, delivering and monetizing digital media to large global audiences over the Internet. Prior to our acquisition of VitalStream on February 20, 2007, we did not offer proprietary CDN services, but instead, we were a reseller of third party CDN services for which revenues and direct costs are included in other revenues and direct costs of network, sales and services, discussed below.
42
Our reportable segments are strategic business units that offer different products and services. As of December 31, 2007, our customer base totaled approximately 3,800 customers across more than 20 metropolitan markets.
IP services. Revenue for IP services increased $10.1 million, or 9%, to $119.9 million for the year ended December 31, 2007, compared to $109.7 million for the year ended December 31, 2006. The increase in IP revenue is driven by an increase in demand, partially offset by a decline in pricing, and an increase in sales of our premise-based FCP products and other large hardware sales. We continue to experience increasing demand for our traditional IP services, with IP traffic for the year ended December 31, 2007 increasing approximately 35% from the year ended December 31, 2006. The increase in IP traffic has resulted from both existing and new customers requiring greater overall capacity due to growth in the usage of their applications, as well as in the nature of applications consuming greater amounts of bandwidth. In particular, we have continued to add high-traffic customers through competitive IP pricing and minimum commitments during the year ended December 31, 2007. New IP services customers added approximately $1.7 million of revenue. Ongoing industry-wide pricing declines over the last 12 months, however, offset a portion of our gains in customers and IP traffic. The blended rate in megabits per second, or Mbps, decreased approximately 23% annually from December 31, 2006 to December 31, 2007. We recorded approximately $0.5 million of sales adjustments in the fourth quarter of 2007 related predominantly to disputes over contractual service periods.
Revenue for IP services increased $4.7 million, or 5%, to $109.7 million for the year ended December 31, 2006, compared to $105.0 million for the year ended December 31, 2005. This change is due to the increase in demand for IP traffic, partially offset by declining prices. During the year ended December 31, 2006, IP traffic over our networks increased approximately 83% from the year ended December 31, 2005. The increase in IP traffic has come as both existing and new customers require greater overall capacity due to growth in the usage of their applications as well as in the nature of applications consuming greater amounts of bandwidth. In particular, we added a number of high-traffic customers through competitive IP pricing and minimum commitments during the year ended December 31, 2006.
Data center services. Data center services are a significant source of revenue growth for our business. Revenue for data center services increased $26.9 million, or 48%, to $83.1 million for the year ended December 31, 2007, compared to $56.2 million for the year ended December 31, 2006. During the year ended December 31, 2007, we (1) implemented a broad-based rate increase, generating additional revenue of approximately $8.0 million, (2) began executing a data center growth initiative and (3) completed the build-out of our Seattle facility. The overall increase in revenue has resulted from both new and existing customers, with new customers adding approximately $1.7 million of revenue during 2007. The remaining increase is largely due to existing customers using more space within our facilities, and the design and installation revenue from new customers. We have also structured our data center business to accommodate larger, global customers and ensure a platform for robust traffic growth.
Revenue for data center services increased $19.2 million, or 52%, to $56.2 million for the year ended December 31, 2006, compared to $37.0 million for the year ended December 31, 2005. The revenue increase is primarily attributable to growth in new and existing data center customers. Revenue growth is facilitated in part by the continued expansion of our available data center space and our continued efforts to bundle our IP and data center services. The demand for data center services has outpaced industry-wide supply, which has allowed us to increase the overall pricing for the data center component of our pricing models.
CDN services. Revenue for our CDN services segment was $17.7 million for the year ended December 31, 2007. This activity represents the operations from our acquisition of VitalStream, which we completed on February 20, 2007. Revenue for the year was slightly lower than originally anticipated as we completed the integration of the VitalStream business with and into our network and infrastructure. As previously noted, we did not offer proprietary CDN services prior to our acquisition of VitalStream, but instead, we were a reseller of third party CDN services, which is included in Other revenue, below. We expect CDN to be an area of significant growth and have upgraded and expanded related infrastructure, including in Europe and Asia, to serve the expected industry-wide demand, particularly in those regions. In December 2007, we extended our 100% uptime SLA to CDN services. In the second half of 2007, the Company experienced platform instability in its CDN business, which caused an increase in customer dissatisfaction and a higher than historical amount of customer disputes over service billings. In the fourth quarter of 2007, we recorded a total of appoximately $1.4 million in sales and billing adjustments related to both service interruptions and disputes over contractual service periods. These sales and billing adjustments have been recorded against revenue. We have substantially completed integrating our combined networks through technological improvements and systems integration with operational stability achieved late in the year and expect this integration to result in a decrease in performance-related adjustments in 2008.
43
Other. Other revenues primarily include reseller and miscellaneous services such as third party CDN services, termination fee revenue, referral fees for other hardware sales, and consulting services. Other revenues decreased substantially as the revenue streams from our acquisition of VitalStream replaced the activity of the former third party CDN service provider.
Direct Costs of Network, Sales and Services (exclusive of depreciation and amortization)
IP services. Direct costs of IP network, sales and services, exclusive of depreciation and amortization, increased $3.9 million, or 10%, to $43.7 million for the year ended December 31, 2007, compared to $39.7 million for the year ended December 31, 2006. For the year ended December 31, 2006 compared to the year ended December 31, 2005, the related direct costs increased $1.4 million, or 4%, to $39.7 million as of December 31, 2006, compared to $38.4 million as of December 31, 2005. While IP services revenue has increased, the direct costs of IP network, sales and services has continued to be approximately 36% of IP services revenue for each of the last three years, even as we have had a change in the mix of revenue with traditionally higher margin IP services, lower margin high volume customers, and FCP and other hardware sales. Connectivity costs vary based upon customer traffic and other demand-based pricing variables. Costs for IP services are especially subject to ongoing negotiations for pricing and minimum commitments. As our IP traffic continues to grow, we expect to have greater bargaining power for lower bandwidth rates and more opportunities to proactively manage network costs, such as utilization and traffic optimization among network service providers.
Data center services. The direct costs of data center services, exclusive of depreciation and amortization, increased $13.0 million, or 28%, to $59.4 million for the year ended December 31, 2007, compared to $46.5 million for the year ended December 31, 2006. For the year ended December 31, 2006 compared to the year ended December 31, 2005, the related direct costs increased $11.2 million, or 32%, to $46.5 million as of December 31, 2006, compared to $35.2 million as of December 31, 2005. As data center services revenue has increased, direct costs of data center services as a percentage of corresponding revenue have decreased to approximately 72%, 83% and 95% for the year ended December 31, 2007, 2006 and 2005, respectively. This trend is the result of an increase in total occupancy at higher rates, as discussed with revenues above, while substantial direct costs are subject to previously negotiated rates. Direct costs of data center services, exclusive of depreciation and amortization, have substantial fixed cost components, primarily for rent, but also significant demand-based pricing variables, such as utilities, which are highest in the summer for cooling the facilities.
The growth in data center services largely follows our expansion of data center space. The demand for data center services is outpacing industry-wide supply, which contributes to our improvement of data center direct costs as a percentage of data center revenue. At December 31, 2007, we had approximately 179,000 square feet of data center space with a utilization rate of approximately 75%, as compared to approximately 149,000 square feet of data center space with a utilization rate of approximately 79% at December 31, 2006. At December 31, 2005, we had approximately 124,000 square feet of data center space with a utilization rate of approximately 76%. Our recent data center expansion has resulted in the lower utilization rate as of December 31, 2007 compared to December 31, 2006. However, the recent expansion should provide us lower costs per occupied square foot in future periods, enabling us to increase revenue compared to relatively lower direct costs of data center services. At December 31, 2007, 104,000 square feet, or approximately 58% of total square feet, was in data centers operated by us versus data centers operated by our vendors, or partner sites. Additionally, approximately 62% of our available square feet as of December 31, 2007 are in data centers operated by us.
CDN services. Direct costs of network, sales and services, exclusive of depreciation and amortization, for our CDN services segment were $6.6 million for the year ended December 31, 2007. Direct costs of CDN network, sales and services were approximately 37% of CDN services revenue for the year ended December 31, 2007, which was a little more favorable than our initial expectations. This activity represents the operations from our acquisition of VitalStream, which was completed on February 20, 2007. The direct costs include the benefit of lower rates throughout the year as we have migrated VitalStream’s former contracts and terms to our own. Direct costs of CDN network sales and services also includes an allocation of $0.7 million from direct costs of IP network sales and services based on the average cost of actual usage by the CDN segment. As previously noted, we did not offer proprietary CDN services prior to our acquisition of VitalStream, but instead, we were a reseller of third party CDN services, which is included in Other direct costs, below. We expect CDN to be an area of significant growth and are expanding related infrastructure, including in Europe and Asia, to serve the expected industry-wide demand, particularly in those regions.
44
Other. Other direct costs of network, sales and services, exclusive of depreciation and amortization primarily include reseller and miscellaneous services such as third party CDN services and consulting services. These costs decreased substantially as the revenue streams from our acquisition of VitalStream replaced the activity of the former third party CDN service provider.
Other Operating Expenses
Other than direct costs of network, sales and services, compensation and facilities-related costs have the most pervasive impact on operating expenses. Compensation and benefits comprise the largest expenses after direct costs of network, sales and services. Cash-basis compensation and benefits increased $12.0 million to $53.4 million for the year ended December 31, 2007 from $41.4 million for the year ended December 31, 2006. Stock-based compensation increased $2.8 million to $8.7 million for the year ended December 31, 2007 from $5.9 million for the year ended December 31, 2006. All of the increases in compensation and benefits are primarily due to increased headcount, largely attributable to the additional employees resulting from the VitalStream acquisition. For the year ended December 31, 2007, the additional VitalStream employees accounted for $6.6 million of the increase in cash-basis compensation and $1.3 million of the increase in stock-based compensation. Compensation also increased due to the hiring of other employees throughout the Company, including at the senior management level. Total headcount increased to 420 at December 31, 2007 compared to 330 at December 31, 2006.
As discussed in note 2 of the consolidated financial statements, we adopted SFAS No. 123R on January 1, 2006. Accordingly, total operating costs and expense and net income for 2007 and 2006 includes stock-based compensation expense in the following amounts:
| Year Ended December 31, | |||||||
| 2007 | 2006 | ||||||
| Direct costs of customer support | $ | 1,892 | $ | 1,102 | |||
| Product development | 856 | 628 | |||||
| Sales and marketing | 2,135 | 2,145 | |||||
| General and administrative | 3,798 | 2,067 | |||||
| Total stock-based compensation | $ | 8,681 | $ | 5,942 | |||
Total unrecognized compensation costs related to non-vested stock-based compensation as of December 31, 2007 was $26.9 million with a weighted-average remaining recognition period of 2.8 years.
Cash-basis compensation and benefits decreased $1.5 million to $41.4 million for the year ended December 31, 2006 from $42.9 million for the year ended December 31, 2005, which reflects a net decrease in salaries and wages and a decrease in employee benefits, partially offset by a net increase in commissions. The decreases in compensation and benefits reflect a consistent headcount of approximately 330 full-time employees for both 2006 and 2005, but favorable experience on self-insured medical claims in 2006, while the increase in commissions is revenue driven. Compensation for the year ended December 31, 2006 also includes an increase of $1.8 million in employee bonuses over the year ended December 31, 2005.
Prior to the adoption of SFAS No. 123R on January 1, 2006, we utilized the disclosure-only provisions of SFAS No. 123 and accounted for stock-based compensation plans under the recognition and measurement provisions of APB Opinion No. 25 and related interpretations. Accordingly, we did not recognize any expense for options to purchase our common stock with an exercise price equal to fair market value at the date of grant for any periods prior to January 1, 2006.
45
Pro forma stock-based compensation expense as previously reported for 2005 was $9.7 million. The decrease of $3.8 million in recorded stock-based compensation expense for the year ended December 31, 2006 compared to the pro forma stock-based compensation expense for the year ended December 31, 2005 is due primarily to cancellations of outstanding stock options and the difference between estimated and actual forfeitures. SFAS No. 123R requires compensation expense to be recorded net of estimated forfeitures with a subsequent adjustment to reflect actual forfeitures as they occur. Previously, forfeitures of unvested stock options were accounted for on a pro forma basis as they were incurred, generally resulting in higher pro forma stock compensation than under the current provisions of SFAS No. 123R. In addition, a significant number of unvested stock options were forfeited upon the resignation of Mr. Gregory Peters, our former Chief Executive Officer, thus reducing the number of outstanding stock options for determining comparative stock-based compensation expense for the year ended December 31, 2006.
Overall, facility and related costs, including repairs and maintenance, communications and office supplies but excluding direct costs of network, sales and services, increased $1.0 million, or 17%, to $7.0 million for the year ended December 31, 2007 compared to $6.0 million for the year ended December 31, 2006. The increase is primarily due to $0.7 million of VitalStream post-acquisition operating costs.
Facility and related costs decreased $0.9 million, or 13%, to $6.0 million for the year ended December 31, 2006 compared $6.9 million for the year ended December 31, 2005. Facility costs decreased $0.7 million in sales and marketing and $0.9 million in general and administrative primarily through consolidation and cost containment efforts.
Other significant operating costs are discussed with the financial statement captions below:
Direct costs of amortization of acquired technologies
Direct costs of amortization of acquired technologies increased $3.7 million from $0.5 million for the year ended December 31, 2006 to $4.2 million for the year ended December 31, 2007. The increase in amortization expense is due to the amortization of the post-acquisition intangible technology assets of VitalStream.
Direct costs of customer support
Direct costs of customer support increased 43% from $11.6 million for the year ended December 31, 2006 to $16.5 million for the year ended December 31, 2007. The increase of more than $4.9 million was primarily due to compensation of employees and facilities-related costs as discussed above. VitalStream employees accounted for $1.7 million of added cash-basis compensation and benefits and $0.5 million of additional stock-based compensation for the year ended December 31, 2007. Other increases in cash-basis and stock-based compensation amounted to $1.3 million and $0.3 million, respectively, whereas facilities-related costs increased $0.6 million.
Direct costs of customer support increased 8% from $10.7 million for the year ended December 31, 2005 to $11.6 million for the year ended December 31, 2006. The increase of $0.9 million was primarily due to increases in costs related to stock-based compensation of $1.1 million, offset by decreased compensation and employee benefits of $0.7 million, as discussed above. In addition, facilities and related expenses increased $0.7 million based on more accurate data for allocation of costs, primarily from sales and marketing.
Product development
Product development costs for the year ended December 31, 2007 increased 47% to $6.6 million from $4.5 million for the year ended December 31, 2006. The increase of $2.1 million is primarily attributable to the addition of VitalStream employees and facilities-related costs. For the year ended December 31, 2007, the additional VitalStream employees accounted for $1.0 million of additional cash-basis compensation and benefits costs and $0.3 million of additional stock-based compensation costs. In addition, facilities-related costs amounted to $0.3 million of this increase.
46
Product development costs for the year ended December 31, 2006 decreased 8% to $4.5 million from $4.9 million for the year ended December 31, 2005. The decrease of $0.4 million is attributable to decreases in costs related to compensation and employee benefits of $0.5 million, outside professional services of $0.5 million and training expenses of $0.1 million. The decreases were offset by an increase in stock-based compensation expense of $0.6 million for the year ended December 31, 2006, as discussed above. The decrease in compensation and employee benefits partially reflects the redeployment of technical resources from product support to internal network support, which is accounted for in general and administrative expense. The decrease in outside professional services is primarily due to a specific project in 2005.
Sales and marketing
Sales and marketing costs for the year ended December 31, 2007 increased 16% to $31.5 million from $27.2 million for the year ended December 31, 2006. The increase of more than $4.3 million is primarily comprised of VitalStream employee costs. Cash-basis compensation, benefits and commissions related to VitalStream employees accounted for $2.8 million and stock-basis compensation for these employees amounted to $0.4 million for the year ended December 31, 2007.
Sales and marketing costs for the year ended December 31, 2006 increased 5% to $27.2 million from $25.9 million for the year ended December 31, 2005. The net increase of $1.3 million was primarily due to increases in stock-based compensation expense of $2.1 million and commissions of $1.6 million, offset by decreases in compensation and employee benefits expenses of $1.4 million, all of which were discussed above. Also, as discussed with direct costs of customer support above, facilities and related expenses decreased $0.7 million largely due to more accurate data allocations of expenses to direct costs of customer support. Outside professional services decreased $0.3 million and travel, entertainment and training expenses decreased $0.2 million. The decreases in outside professional services and training are the result of better utilization of internal resources while the decrease in travel and entertainment resulted from an effort to reduce less-essential travel. All of these reductions were partially offset by an increase of $0.3 million in marketing and advertising efforts during the year ended December 31, 2006.
General and administrative
General and administrative costs for the year ended December 31, 2007 increased 47% to $32.5 million from $22.1 million for the year ended December 31, 2006. The increase of $10.4 million is primarily due to increases in cash-basis compensation and benefits, professional services and stock-based compensation. Cash-basis compensation and benefits for the year ended December 31, 2007 increased $3.6 million, including $1.0 million for the additional VitalStream employees. As discussed earlier, the other cause for the increase in cash-basis compensation is the hiring of other employees throughout the Company, including at the senior management level. The overall increase in head-count caused us to accrue employee bonuses $0.3 million higher during 2007 than we did for 2006 and caused higher self-insured medical claims of $0.6 million compared to 2006. Professional services for the year ended December 31, 2007 increased $2.0 million primarily due to consultation fees on our information technology systems, compliance activities for domestic and international tax and financial statement requirements, recruiting fees and contract labor to fill a number of open job requisitions, and legal fees, including those associated with new proxy disclosure requirements and ongoing litigation. Bad debt expense increased approximately $1.7 million to $2.2 million for the year ended December 31, 2007. The increase in bad debt expense is due primarily to our integration of VitalStream with their legacy customers causing bad debt expense to be greater than our historical expense. Stock-based compensation costs increased $1.7 million for the year ended December 31, 2007 due to annual grants of stock options and unvested restricted common stock to non-employee directors, the stock options assumed in the VitalStream acquisition and initial grants and awards to new members of senior management.
General and administrative costs for the year ended December 31, 2006 increased 10% to $22.1 million from $20.1 million for the year ended December 31, 2005. The increase of $2.0 million primarily reflects a $2.4 million increase in taxes (non-income based), licenses, fees, a $2.1 million increase in stock-based compensation expense, and a $1.1 million increase in compensation and employee benefits. These increases were offset by decreases in outside professional services of $0.9 million, bad debt expense of $0.9 million, facility and related expense of $0.9 million, a reduction of insurance and administrative expense of $0.3 million, and a reduction of training expense of $0.2 million. Part of the increase in cash-basis compensation and benefits is the redeployment of technical resources from product support as noted under the caption product development above.
47
The increases in compensation and benefits, including stock-based compensation, and the decrease in facility-related costs are discussed above. In addition, the decrease in outside professional services can be attributed to a number of factors, including focused cost control and better utilization of internal resources. Professional services for the year ended December 31, 2006 also includes $0.6 million related to an abandoned corporate development project.
Restructuring and asset impairment
As discussed in note 4 to the financial statements, we incurred a restructuring and asset impairment charge of $10.3 million during the three months ended March 31, 2007. The charge was the result of a review of our business, particularly in light of our acquisition of VitalStream and our plan to finalize the overall integration and implementation plan before the end of the first quarter. The charge to expense included $7.8 million for leased facilities, representing both the costs less anticipated sublease recoveries that will continue to be incurred without economic benefit to us and costs to terminate leases before the end of their term. The charge also included severance payments of $1.1 million for the termination of certain employees and $1.4 million for impairment of assets. Net related expenditures were estimated to be $10.7 million, of which $2.8 million has been paid during the year ended December 31, 2007, and the balance continuing through December 2016, the last date of the longest lease term. These expenditures are expected to be paid out of operating cash flows. Cost savings from the restructuring were estimated to be approximately $0.8 million per year through 2016, primarily for rent expense.
We incurred a $1.1 million impairment charge during the three months ended March 31, 2007 for the sales order-through-billing system, which was a result of an evaluation of the existing infrastructure relative to our new financial accounting system and the acquisition of VitalStream.
Depreciation and amortization
For the year ended December 31, 2007, depreciation and amortization, including other intangible assets but excluding acquired technologies, increased 40% to $22.2 million compared to $15.9 million for the year ended December 31, 2006. The increase of $6.4 million primarily relates to post-acquisition depreciation and amortization of VitalStream property and equipment and acquired amortizable intangible assets, excluding amortization of acquired technologies. The VitalStream property and equipment and acquired amortizable intangible assets account for $5.8 million of the expense for the year ended December 31, 2007. The remaining increase in depreciation and amortization relates to the expansion of P-NAPs and on-going expansion of data center facilities. The restructuring and asset impairment described above initially reduced depreciation and amortization by approximately $0.4 million per year, decreasing to $0 in 2009. The amortization of acquired technologies is included in its own caption and discussed above.
Depreciation and amortization, including other intangible assets, for the year ended December 31, 2006 increased 8% to $15.9 million compared to $14.7 million for the year ended December 31, 2005. The increase of $1.2 million was primarily attributed to an increased depreciable base of assets as we upgraded our P-NAP facilities and continue to expand our data center facilities.
48
Write-off of investment
We incurred a charge of $1.2 million representing the write-off of the remaining carrying value of our investment in series D preferred stock of Aventail Corporation, or Aventail. We made an initial cash investment of $6.0 million in Aventail series D preferred stock pursuant to an investment agreement in February 2000. In connection with a subsequent round of financing by Aventail, we recognized an initial loss on our investment of $4.8 million in 2001. On June 12, 2007, SonicWall, Inc. announced that it entered into an agreement to acquire Aventail for approximately $25.0 million in cash. The transaction closed on July 11, 2007, and all shares of series D preferred stock were cancelled and the holders of series D preferred stock did not receive any consideration for such shares. The write-off is included in non-operating (income) expense in the accompanying consolidated statement of operations.
Income taxes
The provision for income taxes was a net benefit of $3.1 million for the year ended December 31, 2007 and expense of $0.1 million for the year ended December 31, 2006. For the year ended December 31, 2007, the tax provision includes a $4.4 million benefit related to the release of the valuation allowance associated with our U.K. deferred tax assets. The U.K. benefit is offset by a reserve of $0.9 million and a U.S. deferred tax liability relating to the VitalStream acquisition.
The reduction in valuation allowance was due to the existence of sufficient positive evidence as of December 31, 2007 to indicate that our net operating losses in the U.K. would more likely than not be realized in the future. The evidence primarily consists of the results of prior performance in the U.K. and the expectation of future performance based on historical results. We will continue to assess in the future the recoverability of U.S. and other deferred tax assets, and whether or not the valuation allowance should be reduced relative to the U.S. and other deferred tax assets outside the U.K.
Cash Flows for the Years Ended December 31, 2007, 2006 and 2005
Net cash from operating activities.
Net cash provided by operating activities was $27.6 million for the year ended December 31, 2007. Our net loss, adjusted for non-cash items, generated cash from operations of $32.1 million while changes in operating assets and liabilities, excluding effects of the VitalStream acquisition, represented a use of cash from operations of $4.5 million. The primary non-cash adjustment was $26.4 million for depreciation and amortization, which includes the amortizable intangible assets acquired through the acquisition of VitalStream on February 20, 2007 and the expansion of our P-NAP and data center facilities throughout 2007. Non-cash adjustments also include $8.7 million for stock-based compensation expense, which is discussed above in the section captioned “Results of Operations.” The change in working capital includes an increase in accounts receivable of $15.8 million. The increase in accounts receivable results in quarterly days sales outstanding at December 31, 2007 increasing to 54 days from 38 days as of December 31, 2006. This increase in accounts receivable is largely due to revenue growth and also, in part, our day sales outstanding trending up from lower than historical levels at December 31, 2006. We have also experienced some collection delays on certain larger, high credit quality customers that tend to pay over longer terms and in conjunction with the migration of some former VitalStream and other customers to Internap billing and systems platforms. We expect our quarterly days sales outstanding to improve over the next several quarters. The change in working capital also includes a net increase in accounts payable of $7.9 million due to the growth of our business, primarily attributed to the acquisition of VitalStream and our data center growth initiative. A portion of the increase is also caused by the implementation near year-end of a new telecommunications expense management system for our direct costs. We do not expect this implementation to have an impact on our accounts payable balance in the future. We anticipate continuing to generate cash flows from our results of operations, that is net income (loss) adjusted for non-cash items and manage changes in operating assets and liabilities towards a net $0 change over time in subsequent periods. We also expect to use cash flows from operating activities to fund a portion of our capital expenditures and other requirements, to repay our outstanding debt as it becomes due and to meet our other commitments and obligations as they become due.
49
Net cash provided by operating activities was $29.6 million for the year ended December 31, 2006, and was primarily due to net income of $3.7 million adjusted for non-cash items of $25.4 million offset by changes in working capital items of $0.5 million. The changes in working capital items include net use of cash for accounts receivable of $1.7 million, inventory, prepaid expense and other assets of $1.8 million, and accrued restructuring of $1.5 million. These were offset by net sources of cash in accounts payable of $3.0 million, accrued liabilities of $1.4 million and deferred revenue of $1.1 million. The increase in receivables at December 31, 2006 compared to December 31, 2005 was related to the 18% increase in revenue. Quarterly days sales outstanding at December 31, 2006 decreased to 38 days from 43 days as of December 31, 2005. The increase in payables is primarily related to the timing of payments with the 2006 balance being consistent with our normal operating expenses and payment terms.
Net cash provided by operating activities was $5.5 million for the year ended December 31, 2005, and was primarily due to the net loss of $5.0 million adjusted for non-cash items of $19.7 million offset by changes in working capital items of $9.3 million. The changes in working capital items include net use of cash for accounts payable of $5.4 million, accounts receivable of $3.6 million, accrued restructuring of $1.9 million, and $0.2 million of inventory, prepaid expense and other assets. These were offset by net sources of cash in accrued liabilities of $0.8 million and deferred revenue of $1.0 million. The increase in receivables at December 31, 2005 compared to December 31, 2004 was related to the 6% increase in revenue. The decrease in payables is primarily related to a general decrease in expenses when compared to last year.
Net cash used in investing activities for the year ended December 31, 2007 was $36.4 million primarily due to capital expenditures of $30.3 million and net purchases of short-term investments of $6.1 million. Our capital expenditures were principally for the expansion of our data center facilities, CDN infrastructure and upgrading our P-NAP facilities and were funded from both cash from operations and borrowings from the new credit agreement we entered into on September 14, 2007. We discuss the credit agreement in greater detail in the section below captioned “Liquidity.” Our forecast for capital expenditures in 2008 ranges from $45 - $50 million. However, our credit agreement, discussed below, limits us to unfunded capital expenditures of $25.0 million per year. Investing activities for the year ended December 31, 2007 also includes purchases and sales of auction rate securities. While we have noted auction rate reset failures in the market and have experienced our own auction rate reset failures subsequent to year-end, we do not expect to incur any significant liquidity constraints in the current auction rate securities market and anticipate that, based on the nature of the underlying assets, we will be able to recover the full cost basis of the assets within one year.
Net cash used in investing activities for the year ended December 31, 2006 was $10.4 million primarily due to capital expenditures of $13.4 million. Our capital expenditures were principally for upgrading our P-NAP facilities and the expansion of our data center facilities.
Net cash used in investing activities for the year ended December 31, 2005 was $9.4 million primarily due to capital expenditures of $10.2 million. Our capital expenditures were principally comprised of leasehold improvements related to the upgrade of several data center facilities.
Net cash from financing activities.
Net cash provided by financing activities for the year ended December 31, 2007 was $15.2 million. Cash provided by financing activities was primarily due to proceeds from note payable of $19.7 million, net of discount, and proceeds from stock compensation plan activity of $8.6 million, partially offset by the repayment of prior outstanding debt of $11.3 million and payments on capital leases of $1.6 million. The proceeds from note payable were a result of entering into the new credit agreement on September 14, 2007. As a result of these activities, we had balances of $19.8 million in a note payable (net of discount) and $1.3 million in capital lease obligations as of December 31, 2007 with $3.2 million in the note payable and capital leases scheduled as due within the next 12 months. While we anticipate funding a large portion of our capital expenditures by drawing down on our credit facility, we expect to meet most of our cash requirements, including repayment of debt as it becomes due, through cash from operations, and as needed, cash on hand and short-term investments. We may also utilize our revolving line of credit if we consider it economically favorable to do so.
50
Net cash provided by financing activities for the year ended December 31, 2006 was $2.0 million. Cash provided by financing activities was primarily due to proceeds from stock options, employee stock purchase plan and exercise of warrants of $6.8 million offset by principal payments on a note payable of $4.4 million and payments on capital lease obligations of $0.5 million. As a result of these activities, we had balances of $7.7 million in a note payable and $0.4 million in capital lease obligations as of December 31, 2006 with $4.7 million in the note payable and capital leases scheduled as due within the next 12 months.
Net cash used in financing activities for the year ended December 31, 2005 was $5.5 million. Cash used in financing activity included principal payments on notes payable of $6.5 million and payments on capital lease obligations of $0.5 million. These payments were partially offset by proceeds received from the exercise of stock options of $1.5 million. As a result of these activities, we had balances of $12.0 million in notes payable and $0.8 million in capital lease obligations as of December 31, 2005.
We recorded a net loss of $5.6 million of the year ended December 31, 2007 and net income of $3.7 million for the year ended December 31, 2006. As of December 31, 2007, our accumulated deficit was $862.0 million. Our net loss for the year ended December 31, 2007 includes $13.0 million in charges for restructuring, asset impairment, write-off of an investment, and acquired in-process research and development, none of which we expect to incur on a regular basis. We cannot guarantee that we will return to profitability given the competitive and evolving nature of the industry in which we operate. We may not be able to sustain or increase profitability on a quarterly basis, and our failure to do so would adversely affect our business, including our ability to raise additional funds.
We expect to meet our cash requirements in 2008 through a combination of net cash provided by operating activities, existing cash, cash equivalents and short-term investments in marketable securities, and borrowings under our credit agreement, especially for capital expenditures. We expect to incur these capital expenditures primarily for the expansion of our P-NAP and data center facilities. We may also utilize our revolving line of credit, particularly if we consider it economically favorable to do so. Our capital requirements depend on a number of factors, including the continued market acceptance of our services and products, the ability to expand and retain our customer base and other factors. If our cash requirements vary materially from those currently planned, if our cost reduction initiatives have unanticipated adverse effects on our business or if we fail to generate sufficient cash flows from the sales of our services and products, we may require greater or additional financing sooner than anticipated. We can offer no assurance that we will be able to obtain additional financing on commercially favorable terms, or at all, and provisions in our existing credit agreement limit our ability to incur additional indebtedness. We believe we have sufficient cash to operate our business for the foreseeable future.
Short-term investments. Short-term investments primarily consist of high credit quality corporate debt securities, auction rate securities whose underlying assets are state-issued student and educational loans which are substantially backed by the federal government, commercial paper, and U.S. Government Agency debt securities. At December 31, 2007, our balance in short-term investments was $19.6 million, of which $7.2 million were auction rate securities carrying AAA/Aaa ratings as of December 31, 2007. Auction rate securities are variable rate bonds tied to short-term interest rates with maturities on the face of the securities in excess of 90 days and have interest rate resets through a modified Dutch auction, at predetermined short-term intervals, usually every 7, 28 or 35 days. They generally trade at par and are callable at par on any interest payment date at the option of the issuer. Interest received during a given period is based upon the interest rate determined through the auction process. Although these securities are issued and rated as long-term bonds, they are priced and traded as short-term instruments because of the liquidity provided through the interest rate reset. We have also noted auction rate reset failures in the market and have experienced our own auction rate reset failures subsequent to year-end, however, we do not expect to incur any significant liquidity constraints and anticipate that, based on the nature of the underlying assets, we will be able to recover the full cost basis of the assets within one year. We expect to hold the auction rate securities until liquidity improves or the borrower calls the underlying securities. All short-term investments either (1) have original maturities greater than 90 days but less than one year or (2) are auction rate securities expected to be liquidated within one year, are classified as available for sale, and reported at fair value.
51
Credit agreement. On September 14, 2007, we entered into a $35.0 million credit agreement, or the Credit Agreement, with Bank of America, N.A., as administrative agent, and lenders who may become a party to the Credit Agreement from time to time. VitalStream Holdings, Inc., VitalStream, Inc., PlayStream, Inc., and VitalStream Advertising Services, Inc., four of our subsidiaries, are guarantors of the Credit Agreement.
The Credit Agreement replaced the prior credit agreement, a $5.0 million revolving credit facility and a $17.5 million term loan, which was evidenced by a Loan and Security Agreement between the Company and Silicon Valley Bank that was last amended on December 27, 2005. We paid off and terminated this prior credit agreement concurrently with the execution of the Credit Agreement.
Our obligations under the Credit Agreement are pledged, pursuant to a pledge and security agreement and an intellectual property security agreement by a security interest granted in substantially all of our assets including the capital stock of our domestic subsidiaries and 65% of the capital stock of our foreign subsidiaries.
The Credit Agreement provides for a four-year revolving credit facility, or the Revolving Credit Facility, in the aggregate amount of up to $5.0 million which includes a $5.0 million sub-limit for letters of credit. With the prior approval of the administrative agent, we may increase the total commitments by up to $15.0 million for a total commitment under the Revolving Credit Facility of $20.0 million. The Revolving Credit Facility is available to finance working capital, capital expenditures and other general corporate purposes. As December 31, 2007, no amounts were outstanding on the Revolving Credit Facility.
The Credit Agreement also provides for a four-year term loan, or the Term Loan, in the amount of $30.0 million. We borrowed $20.0 million concurrently with the closing and used a portion of the proceeds from the Term Loan to pay off our prior credit facility. We intend to use the remaining proceeds to fund capital expenditures related to the expansion of our data center facilities.
The interest rate on the Revolving Credit Facility and Term Loan is a tiered LIBOR-based rate that depends on our 12-month trailing EBITDA. As of December 31, 2007, the interest rate was 7.075%.
We will only pay interest on the Term Loan during the first 12 months of its four-year term. Commencing on the last day of the first calendar quarter after the first anniversary of the closing, the outstanding amount of the Term Loan will amortize on a straight-line schedule with the payment of 1/16 of the original principal amount of the Term Loan due quarterly. We will pay all unpaid amounts at maturity, which is September 14, 2011.
The Credit Agreement includes customary representations, warranties, negative and affirmative covenants, including certain financial covenants relating to net funded debt to EBITDA ratio and fixed charge coverage ratio, as well as customary events of default and certain default provisions that could result in acceleration of the Credit Agreement. As of December 31, 2007, we were in compliance with the financial and other covenants.
The net proceeds received from the Term Loan were reduced by $0.3 million for fees paid to Bank of America and its agents. We treated these fees as a debt discount and will amortize the fees to interest expense using the interest method over the term of the loan. We recorded less than $0.1 million of related amortization during the year ended December 31, 2007. As of December 31, 2007, the balance on the Term Loan, net of the discount, was $19.8 million. We incurred other costs of less than $0.1 million in connection with entering into the Credit Agreement, which were recorded as debt issue costs and will amortize over the term of the Credit Agreement.
52
As a result of the transactions discussed above, we recorded a loss on extinguishment of debt of less than $0.1 million during the year ended December 31, 2007. The loss on extinguishment of debt is included in Other, net in the non-operating (income) expense section of the consolidated statements of operations.
Also during the year ended December 31, 2007, we paid off the term loans and line of credit issued pursuant to the loan and security agreement assumed in the VitalStream acquisition.
Capital leases. Our future minimum lease payments on remaining capital lease obligations at December 31, 2007 totaled $1.4 million.
Commitments and other obligations. We have commitments and other obligations that are contractual in nature and will represent a use of cash in the future unless there are modifications to the terms of those agreements. Network commitments primarily represent purchase commitments made to our largest bandwidth vendors and contractual payments to license data center space used for resale to customers. Our ability to improve cash used in operations in the future would be negatively impacted if we do not grow our business at a rate that would allow us to offset the service commitments with corresponding revenue growth.
| Payments Due by Period | ||||||||||||||||||
| Total | Less than 1 year | 1- 3 Years | 3-5 Years | More than 5 years | ||||||||||||||
Note payable(1) | $ | 23,815 | $ | 3,980 | $ | 11,980 | $ | 7,855 | $ | — | ||||||||
| Capital lease obligations | 1,392 | 922 | 470 | — | — | |||||||||||||
| Operating lease commitments | 220,894 | 28,211 | 50,689 | 53,208 | 88,786 | |||||||||||||
| Service commitments | 22,014 | 12,167 | 9,847 | — | — | |||||||||||||
| $ | 268,115 | $ | 45,280 | $ | 72,986 | $ | 61,063 | $ | 88,786 | |||||||||
| (1) | As noted in the section captioned “Credit Agreement” under this Item 7, the interest rate on the Term Loan is a tiered LIBOR-based rate that depends on our 12-month trailing EBITDA as defined in the Credit Agreement. As of December 31, 2007, the interest rate was 7.075%. The projected interest included in the debt payments above incorporates this rate. |
Common and preferred stock. Our Certificate of Incorporation includes designation for 3.5 million shares of preferred stock, which includes 0.5 million shares of series B preferred stock. As of December 31, 2007, no shares of preferred stock were issued or outstanding.
We issued approximately 12.2 million shares of our common stock to the former stockholders of VitalStream in connection with the acquisition, which closed on February 20, 2007.
On July 10, 2006, we implemented a one-for-ten reverse stock split and amended our Certificate of Incorporation to reduce our authorized shares from 600 million to 60 million. We began trading on a post-reverse split basis on July 11, 2006. All share and per share information herein (including shares outstanding, earnings per share and warrant and stock option data) have been retroactively adjusted for all periods presented to reflect this reverse split.
53
In June 2006, our stockholders approved a measure to reprice certain outstanding options under our existing equity incentive plans. Options with an exercise price per share greater than or equal to $13.00 were eligible for the repricing. The repricing was implemented through an exchange program under which eligible participants were offered the opportunity to exchange their eligible options for new options to purchase shares. Each new option had substantially the same terms and conditions as the eligible options cancelled except as follows:
| · | The exercise price per share of each replacement option granted in the exchange offer was $14.46, the average of the closing prices of the common stock as reported by the American Stock Exchange and the NASDAQ Global Market, as applicable, for the 15 consecutive trading days ending immediately prior to the grant date of the replacement options; |
| · | For all eligible options with an exercise price per share greater than or equal to $20.00, the exchange ratio was 1-for-2; and |
| · | Each new option has a three-year vesting period, vesting in equal monthly installments over three years, so long as the grantee continues to be a full-time employee of the company and a ten-year term. |
As discussed in note 15 to the consolidated financial statements, warrants to purchase approximately 34,000 shares of our common stock at a weighted exercise price of $9.50 per share were outstanding as of December 31, 2007.
Short-term investments in marketable securities. Short-term investments primarily consist of high credit quality corporate debt securities, auction rate securities whose underlying assets are state-issued student and educational loans which are substantially backed by the federal government, commercial paper, and U.S. Government Agency debt securities. All of our investments have original maturities greater than 90 days but less than one year, except for investments in auction rate securities, further discussed below. All short-term investments are classified as available for sale and reported at fair value. Due to the short-term nature of our investments in marketable securities, we do not believe there is any material exposure to market risk changes in interest rates. We estimate that a change in the effective yield of 100 basis points would change our interest income by less than $0.2 million per year.
Auction rate securities are variable rate bonds tied to short-term interest rates with maturities on the face of the securities in excess of 90 days and have interest rate resets through a modified Dutch auction, at predetermined short-term intervals, usually every 7, 28 or 35 days. Auction rate securities generally trade at par and are callable at par on any interest payment date at the option of the issuer. Interest received during a given period is based upon the interest rate determined through the auction process. Although these securities are issued and rated as long term bonds, they are priced and traded as short-term instruments because of the liquidity provided through the interest rate resets. Uncertainties in the credit markets may affect the liquidity of our holdings in auction rate securities. We did not experience any unsuccessful auction rate resets during the year ended or the initial rate resets immediately following December 31, 2007, however, we have experienced failures on each of our subsequent auction rate resets. Nevertheless, we continue to receive interest every 28-35 days. While our investments are of high credit quality, at this time we are uncertain as to whether or when the liquidity issues relating to these investments will worsen or improve. We do not expect to incur any significant liquidity constraints and anticipate that, based on the nature of the underlying assets, we will be able to recover the full cost basis of the assets within one year. Therefore, we do not believe that adjusting the fair value of our portfolio of auction rate securities is necessary at this time. We expect to hold the auction rate securities until liquidity improves or the borrower calls the underlying securities. In the meantime, we believe we have sufficient liquidity through our cash balances, other short-term investments and available credit. As of December 31, 2007, we have a total of $7.2 million invested in auction rate securities.
54
Other investments. We have invested $4.1 million in Internap Japan, our joint venture with NTT-ME Corporation and NTT Holdings. We account for this investment using the equity-method and to date we have recognized $3.3 million in equity-method losses, representing our proportionate share of the aggregate joint venture losses and income. Furthermore, the joint venture investment is subject to foreign currency exchange rate risk. The market for services offered by Internap Japan has not been proven and may never materialize.
| 2008 | 2009 | 2010 | 2011 | Fair Value | |||||||||||||||
| Long-term debt: | |||||||||||||||||||
| Term loan | $ | 2,500 | $ | 5,000 | $ | 5,000 | $ | 7,500 | $ | 20,000 | |||||||||
| Interest rate | 7.075 | % | 7.075 | % | 7.075 | % | 7.075 | % | 7.075 | % | |||||||||
Foreign currency risk. Substantially all of our revenue is currently in U.S. dollars and from customers primarily in the U.S. We do not believe, therefore, that we currently have any significant direct foreign currency exchange rate risk.
Our consolidated financial statements, financial statement schedule and the report of the independent registered public accounting firm appear in Part IV of this annual report on Form 10-K/A. Our report on internal controls over financial reporting appear in Item 9A of this annual report on Form 10-K/A.
None.
Evaluation of Disclosure Controls and Procedures
Our management, with the participation of our Chief Executive Officer and Principal Accounting Officer, evaluated the effectiveness of our disclosure controls and procedures as defined in Rule 13a-15(e) under the Securities Exchange Act of 1934, as amended (the “Exchange Act”) as of December 31, 2007. Our disclosure controls and procedures are designed to ensure that information we are required to disclose in the reports we file or submit under the Exchange Act is accumulated and communicated to our management, including our Chief Executive Officer and Principal Accounting Officer, as appropriate, to allow timely decisions regarding required disclosures, and is recorded, processed, summarized, and reported within the time periods specified in the SEC's rules and forms. Based upon the evaluation described above our Chief Executive Officer and Principal Accounting Officer concluded that, as of December 31, 2007, our disclosure controls and procedures were not effective because of the material weakness described below in Management's Report on Internal Control Over Financial Reporting.
Background
During its review of sales credit activity subsequent to year end, management identified the activity as an area for further review and investigation. Management concluded that an investigation was appropriate to identify the underlying cause and to obtain completeness, accuracy, valuation, and disclosure of sales adjustments. This investigation caused the Company to file this annual report on Form 10-K late.
Management’s Report on Internal Control Over Financial Reporting
Our management is responsible for establishing and maintaining adequate internal control over financial reporting, as such term is defined in Exchange Act Rule 13a-15(f).
We assessed the effectiveness of our internal control over financial reporting as of December 31, 2007. In making this assessment, we used the criteria set forth by the Committee of Sponsoring Organizations of the Treadway Commission (COSO) in Internal Control — Integrated Framework.
A material weakness is a deficiency, or a combination of deficiencies, in internal control over financial reporting, such that there is a reasonable possibility that a material misstatement of the company's annual or interim financial statements will not be prevented or detected on a timely basis.
Management identified the following material weakness in our internal control over financial reporting as of December 31, 2007:
We did not maintain effective controls over the completeness, accuracy, valuation, and disclosure of sales adjustments. Specifically, we did not maintain effective controls, including controls over the analysis of requests for sales credits and billing adjustments, to provide timely information for management to assess the completeness, accuracy, valuation, and disclosure of sales adjustments. This control deficiency resulted in the misstatement of our revenue, net accounts receivable and related financial disclosures, and in the revision of the Company’s consolidated financial statements for the quarter ended September 30, 2007 and in an adjustment to the consolidated financial statements for the quarter ended December 31, 2007. Additionally, this control deficiency could result in misstatements of the aforementioned accounts and disclosures that would result in a material misstatement of the consolidated financial statements that would not be prevented or detected. Accordingly, our management has determined that this control deficiency constitutes a material weakness.
As a result of the material weakness described above, management concluded that our internal control over financial reporting was not effective as of December 31, 2007 based on the criteria established in Internal Control - Integrated Framework issued by the COSO.
The effectiveness of our internal control over financial reporting as of December 31, 2007 has been audited by PricewaterhouseCoopers LLP, an independent registered public accounting firm, as stated in their report, which is included herein.
55
Plan for Remediation of the Material Weakness
To remediate the material weakness described above and to enhance our internal control over financial reporting, management implemented plans in the first quarter of 2008, or will supplement plans during 2008, to its existing controls for the analysis of requests for sales adjustments, which may include but are not limited to, the following additional processes and controls:
| · | A single, common logging system for customers to record all disputes, disconnects and requests for credits, |
| · | A weekly review of a customer request log with appropriate designated management and approval pursuant to the schedule of authorization, |
| · | A more robust, proactive tracking of customer usage patterns and overall customer satisfaction, and |
| · | Perform a review by the appropriate designated finance management of the accounting estimates developed from the relevant, sufficient, and reliable data collected above |
Notwithstanding the material weakness, management believes that the financial statements included in this report fairly present in all material respects our financial position, results of operations and cash flows for the periods presented.
Changes in Internal Control Over Financial Reporting
No change in our internal control over financial reporting (as defined in Rules 13a-15(f) and 15d-15(f) under the Exchange Act) occurred during the quarter ended December 31, 2007 that has materially affected, or is reasonably likely to materially affect, our internal control over financial reporting.
None.
56
PART III
Our Executive Officers and Directors
The following table sets forth information regarding our executive officers and Directors as of December 31, 2007.
| Name | Age | Position | ||
| James P. DeBlasio | 52 | President, Chief Executive Officer and Director | ||
| Tamara Augustyn | 38 | Vice President and Principal Accounting Officer | ||
| David A. Buckel | 45 | Vice President and Chief Financial Officer (1) | ||
| Richard Dobb | 53 | Vice President and General Counsel | ||
| Phil Kaplan | 41 | Chief Strategy Officer | ||
| Vince Molinaro | 44 | Chief Operating Officer (2) |
| Charles B. Coe | 60 | Director (4) (5) | ||
| Eugene Eidenberg | 68 | Director (5) | ||
| William J. Harding | 60 | Director (3) | ||
| Patricia L. Higgins | 58 | Director (3) (4) (5) | ||
| Kevin L. Ober | 47 | Director (3) | ||
| Gary Pfeiffer | 58 | Director (3) (4) |
| Daniel C. Stanzione | 62 | Director (4) (5) |
| (1) | Mr. Buckel resigned his position as Vice President and Chief Financial Officer on November 19, 2007. |
| (2) | Mr. Molinaro resigned his position as Chief Operating Officer on April 7, 2008. |
| (3) | Member of the Audit Committee. |
| (4) | Member of the Compensation Committee. |
| (5) | Member of the Nominations and Governance Committee. |
Directors and Executive Officers
James DeBlasio was appointed as Internap’s President and Chief Executive Officer in November 2005, after serving as President and Chief Operating Officer of Internap from September 2005 until November 2005. Mr. DeBlasio has served as a Director of Internap since July 2003. His term expires in 2010. He also previously served as Chairman of the Audit Committee and member of the Nominations and Governance Committee of Internap’s Board of Directors, until he resigned from these committee appointments upon commencing employment as the Company’s President and Chief Operating Officer in September 2005. From 2003 until September 2005, Mr. DeBlasio served as Financial Vice President of the wireline and wireless product portfolio of Lucent Technologies, a network communications equipment provider. Prior to that, from 2002 to 2003, he was Financial Vice President for Lucent’s Mobility Solutions Group. He served as Financial Vice President—Corporate Planning and Analysis for Lucent from 2001 to 2002, as Chief Financial Officer of Lucent’s Optical Networking Group from 2000 to 2001 and as Financial Vice President and Chief Financial Officer of Lucent’s Wireless Networks Group from 1997 to 2000. Mr. DeBlasio holds a M.B.A degree in Finance and Financial Portfolio Analysis from Seton Hall University and a B.S. degree in Industrial Management from Villanova University.
Eugene Eidenberg has served as a Director since November 1997 and non-executive chairman of our Board of Directors since April 2002. Dr. Eidenberg’s term expires in 2011. From November 1997 until April 2002, Dr. Eidenberg was the chairman of the Board of Directors. From July 2001 until April 2002, Dr. Eidenberg served as our chief executive officer. Dr. Eidenberg has been a Strategic Advisor of Granite Venture Associates LLC, an early-stage high tech venture capital firm, since 2005, after co-founding the firm and serving as a Managing Director from 1999 until 2005. He has served as a Principal of Hambrecht & Quist Venture Associates, an early-stage high tech venture capital firm, since 1998 and was an advisory director at the San Francisco investment-banking firm of Hambrecht & Quist from 1995 to 1998. Dr. Eidenberg served for 12 years in a number of senior management positions with MCI Communications Corporation. His positions at MCI included Senior Vice President for Regulatory and Public Policy, President of MCI’s Pacific Division, Executive Vice President for Strategic Planning and Corporate Development and Executive Vice President for MCI’s international businesses. Dr. Eidenberg was Secretary to the Cabinet and Assistant to the President during the Carter Administration. Dr. Eidenberg is currently a director of several private companies. Dr. Eidenberg holds a Ph.D. and a M.A. degree from Northwestern University and a B.A. degree from the University of Wisconsin.
Charles B. Coe has served as a Director since July 2003. His term expires in 2009. Mr. Coe is a 28-year veteran of the telecommunications industry, including 15 years with BellSouth. During his tenure at BellSouth, he served as President of BellSouth Network Services, President of BellSouth Telecommunications, President of BellSouth International, and Group President of Customer Operations for BellSouth Telecommunications. Previously, Mr. Coe had served in various management positions with AT&T Communications and American Telesystems Corporation. Mr. Cole is currently a director of Dycom Industries, Inc. Mr. Coe holds a M.B.A. degree from Georgia State University and a B.S. degree from The Citadel.
William J. Harding is currently a Managing Director of VantagePoint Venture Partners since October 2007. Dr. Harding’s term expires in 2011. Dr. Harding served as a Managing Member of Morgan Stanley Venture Partners III, LLC since 1997 and a Managing Director of Morgan Stanley & Co., Inc. from 1999 until October 2007. He joined Morgan Stanley & Co., Inc. in October 1994. Dr. Harding is currently a director of Aviza Technology, Inc. and several private companies. Prior to joining Morgan Stanley, Dr. Harding was a General Partner of several venture capital partnerships affiliated with J.H. Whitney & Co. Previously, Dr. Harding was associated with Amdahl Corporation from 1976 to 1985, serving in various technical and business development roles. Prior to Amdahl, Dr. Harding held several technical positions with Honeywell Information Systems. Dr. Harding holds a B.S. degree in Engineering Mathematics and a M.S. degree in Systems Engineering from the University of Arizona and a Ph.D. in Engineering from Arizona State University. Dr. Harding also served as an officer in the Military Intelligence Branch of the United States Army Reserve.
Patricia L. Higgins has served as a Director since December 2004. Her term expires in 2009. Ms. Higgins has nearly 30 years of experience in the telecommunications industry. Ms. Higgins is the former President, CEO, and a Board member of Switch & Data Facilities Company, Inc., a leading provider of neutral interconnection and collocation services. Until 2000, Ms. Higgins served as Chairman and CEO of The Research Board, a premier consulting and research services company for information technology. Prior to 1999, Ms. Higgins was the CIO of Alcoa Inc. and also held senior management positions at UNISYS Corporation, Verizon (NYNEX) and AT&T Inc. Ms. Higgins currently serves on the Board of Directors of The Travelers Companies, Inc., Visteon Corporation and Barnes and Noble, Inc. Ms. Higgins holds a B.A. degree from Montclair State University and attended Harvard Business School’s Advanced Management Program.
Kevin L. Ober has served as a Director of Internap since October 1997 and is a Managing Partner of Divergent Venture Partners. Mr. Ober’s term expires in 2010. Mr. Ober currently leads Divergent’s investment in Plaint Technology. Prior to Divergent, he spent seven years with Vulcan Ventures, a national venture capital firm owned by Paul Allen, co-founder of Microsoft Corporation. While with Vulcan, he led investments in Internet infrastructure companies such as Nexabit Networks, Wavtrace and Net Perceptions, as well as Internap. Other investments included Command Audio, Capstone Turbine, Colorado Micro Displays, ShareWave, Terastor, and Netschools. Prior to working at Vulcan Ventures, Mr. Ober served in various positions at Conner Peripherals, Inc., a computer hard disk drive manufacturer in San Jose California. He holds a B.S. degree in Business Administration from St. John’s University and a M.B.A. degree from Santa Clara University.
57
Gary Pfeiffer has served as a Director since August 2007. His term expires in 2008. Mr. Pfeiffer joined Delaware-based E. I. du Pont de Nemours and Company, in 1974, where he held numerous positions in finance and international operations in several DuPont divisions. He served as Senior Vice President and Chief Financial Officer of the company from 1997 to 2006. Currently a member of the Board of Directors of The Talbots, Inc., Mr. Pfeiffer serves as Presiding Director, Chairperson of the Compensation Committee, and is also a member of the Audit Committee. He also serves as a Director of Quest Diagnostics, Inc. where he chairs the Audit and Finance Committee and is a member of the Compensation Committee, Governance Committee and Executive Committee.
Daniel C. Stanzione has served as a Director since October 2004. Dr. Stanzione’s term expires in 2011. Dr. Stanzione retired from Lucent Technologies in 2000 where he served as Chief Operating Officer and President of Bell Laboratories. At Lucent’s formation in 1995, Dr. Stanzione was President of Network Systems, Lucent’s business unit that sold products and services to telecommunication service providers around the world. Dr. Stanzione is currently a director of Quest Diagnostics Inc., a public company, and Telecordia, a private company. Dr. Stanzione is currently a consultant and serves on the Network Advisory Board at Accenture. Dr. Stanzione holds a B.S. degree in Electrical Engineering, a M.S. degree in Environmental Systems Engineering and a Ph. D. in Electrical and Computer Engineering, all from Clemson University.
Tamara Augustyn assumed the role of the Company’s Principal Accounting Officer effective as of November 19, 2007 in addition to serving as Vice President, Finance and Chief Accountant since January 2007. Ms. Augustyn served as the Company’s Corporate Controller and Chief Accountant from August 2006 to January 2007, and prior to that time, as the Company’s Operational Controller since June 2004. Before she joined the Company in June 2004, Ms. Augustyn held a number of positions with American Tower Corporation from June 1999 to January 2004, most recently as the Director of Finance for one of its wholly-owned subsidiaries, Galaxy Engineering Services, which was acquired by Incode Telecom Group in August of 2003. Ms. Augustyn worked in Internal Audit at Fluor Corporation from 1997 to 1999 and began her career in the audit department of Dixon Hughes PLLC. Ms. Augustyn has a B.S. degree in Business from Wake Forest University and is a certified public accountant.
David A. Buckel served as the Company’s Vice President and Chief Financial Officer from May 2004 to November 2007, after serving as Financial Vice President from October 2003 until May 2004. Mr. Buckel also previously served as an Investor Relations consultant with the Company from July 2003 until October 2003. From November 2002 to July 2003, he served as Senior Manager and President of AJC Finance & Market Group, a financial consulting firm. Prior to that, Mr. Buckel was Senior Vice President and Chief Financial Officer for two NASDAQ-listed companies, Web.com, which was formerly known as Interland Corporation, a provider of applications and web hosting and consulting services from March 2001 through November 2002, and Applied Theory Corporation, a provider of hosting, software development and Internet connectivity products, from July 1995 through March 2001. Mr. Buckel, a Certified Management Accountant, holds a B.S. degree in Accounting from Canisius College and a M.B.A. degree in Finance and Operations Management from Syracuse University.
Richard Dobb has served as Vice President, General Counsel and Secretary of the Company since April 2007. Prior to joining the Company, Mr. Dobb served as Chief Legal Officer and Corporate Secretary for S1 Corporation from 2001 - 2007. Prior to joining S1, Mr. Dobb was Vice President, General Counsel and Corporate Secretary of eShare Communications, Inc., a global provider of Web-based customer care software solutions. Mr. Dobb has also served as a senior counsel at Digital Equipment Corporation, as Chief Legal Officer of the Georgia Institute of Technology. Additionally, he was a member of the corporate finance practice at King & Spalding. Mr. Dobb holds a B.A. from Rutgers University and J.D from the Emory University School of Law.
Philip N. Kaplan has served as Chief Strategy Officer of the Company since February 2007 when the Company acquired VitalStream Holdings, Inc., or VitalStream. He served as president of VitalStream since November 2004, as chief operating officer and a director of VitalStream since April 2002, and as Secretary of VitalStream from April 2002 until November 2004. Mr. Kaplan served as chief operating officer, secretary and a director of VitalStream, Inc. since its inception in March 2000, which merged with VitalStream in 2002. Mr. Kaplan was also co-founder of AnaServe, Inc. where he held the position of senior vice president, secretary and treasurer from its formation in 1995 until its acquisition by Concentric Network Corporation in August 1998. Mr. Kaplan remained employed by Concentric until April 1999. Mr. Kaplan received a Bachelor of Arts degree in Economics with a minor in Russian language from the University of California, Davis.
Vincent J. Molinaro served as the Company’s Chief Operating Officer from April 2007 to April 7, 2008. From December 2006 to April 2007, Mr. Molinaro served as president of the Europe & North Region for Alcatel-Lucent. From July 2005 to December 2006, Mr. Molinaro served as president of North America Region for Lucent Technologies and led the sales, technical support and delivery teams to grow the company’s service provider business and extend its legacy products into next-generation enterprise solutions. Additionally, from December 1994 to July 2000, Mr. Molinaro lived in the Netherlands serving as vice president and chief operating officer of Lucent’s Europe, Middle East & Africa Regions. In that position, he oversaw all marketing, sales, service, support, and program management for Internet and telecommunications companies throughout the region. He was also an executive in the Data Networking Systems Group and the Applications Software Business Unit. Mr. Molinaro joined AT&T Bell Laboratories as a member of the technical staff in 1988, and then transferred to AT&T Network Systems two years later. During his tenure with AT&T he held many global roles ranging from systems engineering and product management to marketing and business development. Mr. Molinaro holds a Bachelor of Science degree in Biomedical Engineering from Boston University and a Master of Science in Electrical Engineering from the University of Bridgeport.
Family Relationships
No family relationships exist among any of our Directors or executive officers.
Agreements to Elect Directors or Executive Officers
No agreements exist to elect any of our Directors or our executive officers.
58
Board of Directors’ Committees and Meetings
The Board of Directors conducts its business through meetings and it may take action by unanimous written consent of the full Board, but only in rare instances following fulsome consideration and discussion of the issues presented, and through three standing committees of the Board, which are an Audit Committee, a Compensation Committee and a Nominations and Governance Committee. The Board of Directors has adopted a charter for each of these committees that can be found on our website at www.internap.com.
During the fiscal year ended December 31, 2007, the Board of Directors held nine meetings, the Audit Committee held 11 meetings, the Compensation Committee held nine meetings, and the Nominations and Governance Committee held six meetings. During the fiscal year ended December 31, 2007, each member of our Board of Directors attended at least 75% of the meetings of the Board of Directors and of the committees on which he or she served that were held during the period for which he or she was a Director or committee member.
We have not adopted a formal policy regarding Director attendance at our annual meetings. We, however, strongly encourage all Directors to attend the annual meeting. Each of our Directors, who was a Director at the time of our 2007 annual meeting, was in attendance at the 2007 annual meeting of stockholders.
Audit Committee. The Audit Committee is composed of Dr. Harding, Ms. Higgins, Mr. Ober, and Mr. Pfeiffer. Ms. Higgins is the Chair of the Audit Committee. The Audit Committee is responsible for, among other things:
| • | directly appointing our independent registered public accountants; |
| • | discussing with our independent registered public accountants their independence from management; |
| • | reviewing with our independent registered public accountants the scope and results of their audit; |
| • | approving all audit services and pre-approving all permissible non-audit services to be performed by the independent registered public accountants; |
| • | overseeing the financial reporting process and discussing with management and our independent registered public accountants the interim and annual financial statements that we file with the SEC; and |
| • | reviewing and monitoring our accounting principles, policies and financial and accounting controls. |
All committee members are independent as defined in applicable NASDAQ rules. The Board of Directors has determined that Ms. Higgins, the current committee Chair, qualifies as an audit committee financial expert within the meaning of NASDAQ rules and regulations.
Compensation Committee. The Compensation Committee consists of Mr. Coe, Ms. Higgins, Mr. Pfeiffer, and Dr. Stanzione. Mr. Harman was a member of the Compensation Committee prior to his resignation on March 15, 2007. Mr. Coe currently serves as Chair of the Compensation Committee. The Compensation Committee reviews and recommends to the Board the compensation and benefits of all our officers and establishes and reviews general policies relating to compensation and benefits for our employees. All committee members are independent as defined in applicable NASDAQ rules.
Nominations and Governance Committee. The Nominations and Governance Committee consists of Doctors Stanzione and Eidenberg, Mr. Coe, and Ms. Higgins. Dr. Stanzione currently serves as Chair of the Nominations and Governance Committee. The Nominations and Governance Committee is responsible for assisting the Board of Directors in identifying and attracting highly qualified individuals to serve as Directors and selecting Director nominees and recommending them to the Board for election at annual meetings of stockholders. Each member of the Nominations and Governance Committee is independent as defined in applicable NASDAQ rules. The Nominations and Governance Committee is also responsible for monitoring significant developments in the regulation and practice of corporate governance and the duties and responsibilities of directors generally, evaluating and administering the Corporate Governance Guidelines of the Company and recommending changes to the Board and periodically reviewing the Company’s governance structure.
Section 16(a) of the Exchange Act and regulations of the SEC thereunder require our Directors, officers and persons who own more than 10% of our common stock, as well as certain affiliates of such persons, to file initial reports of their ownership of our common stock and subsequent reports of changes in such ownership with the SEC. Directors, officers and persons owning more than 10% of our common stock are required by SEC regulations to furnish us with copies of all Section 16(a) reports they file.
Based solely on our review of these reports or of certifications to us that no report was required to be filed, we believe that all of our Directors and executive officers complied with all Section 16(a) filing requirements applicable to them during the 2007 fiscal year, except: Mr. Buckel, who filed two late Form 4s in connection with the sale of shares of his common stock; Mr. Abrahamson, who resigned in August of 2007, who filed one late Form 4 in connection with his exercise of stock options prior to the Board’s determination that he no longer have filing obligations pursuant to Section 16(a); Mr. Kaplan, who filed one late Form 4 in connection with his grant of stock options; and Ms. Augustyn, who filed one late Form 4 in connection with her grant of stock options.
Code of Conduct
We have adopted a code of conduct that applies to our officers and all of our employees, which includes an addendum that applies to our senior executive and financial officers. A copy of the code of conduct is available on our website at www.internap.com. We will furnish copies without charge upon request at the following address: Internap Network Services Corporation, Attn: General Counsel, 250 Williams Street, Atlanta, Georgia 30303.
If we make any amendments to the code of conduct other than technical, administrative or other non-substantive amendments, or grant any waivers, including implicit waivers, from the addendum to this code, we will disclose the nature of the amendment or waiver, its effective date and to whom it applies on our website or in a current report on Form 8-K filed with the SEC.
Selection of Director Nominees
General Criteria and Process. The policy of the Nominations and Governance Committee is to consider candidates for Board membership received by Nominations and Governance Committee members, other Board members, management, the Company’s stockholders, third party search firms, and any other appropriate sources. In identifying and evaluating Director candidates, the Nominations and Governance Committee has not set specific criteria for Directors. Under its committee charter, the Nominations and Governance Committee is responsible for determining desired skills and attributes and may consider strength of character, mature judgment, career specialization, relevant technical skills, diversity, and the extent to which the candidate would fill a present need on the Board. The Nominations and Governance Committee may retain a third party search firm to identify Director candidates and has sole authority to select the search firm and approve the terms and fees of any Director search engagement.
Stockholder Nominations. Stockholders who wish to recommend nominees for consideration by the Nominations and Governance Committee must submit their nominations in writing to our Corporate Secretary. Submissions must include sufficient biographical information concerning the recommended individual for the committee to consider the recommended nominee, including age, five-year employment history with employer names and a description of the employer’s business, whether such individual can read and comprehend basic financial statements, and other board memberships, if any, held by the recommended individual. The submission must be accompanied by a written consent of the individual to stand for election if nominated by the Board of Directors and to serve if elected by the stockholders. The Nominations and Governance Committee may consider such stockholder recommendations when it evaluates and recommends nominees to the Board of Directors for submission to the stockholders at each annual meeting. Stockholder nominations made in accordance with these procedures and requirements must be addressed to Internap Network Services Corporation, Attn: Corporate Secretary, at 250 Williams Street, Suite E-100, Atlanta, Georgia 30303.
59
In addition, stockholders may nominate Directors for election without consideration by the Nominations and Governance Committee. Any stockholder of record may nominate an individual by following the procedures and deadlines set forth in the “Stockholders’ Proposals for 2009 Annual Meeting” section of this proxy statement and by complying with the eligibility, advance notice and other provisions of our bylaws. Under our bylaws, a stockholder is eligible to submit a stockholder proposal if the stockholder is of record and entitled to vote at the annual meeting. The stockholder also must provide timely notice of the proposal to us. To be timely, the stockholder must provide advance notice not less than 90 nor more than 120 calendar days prior to the anniversary date of the preceding year’s annual meeting.
As of December 31, 2007, the Nominations and Governance Committee had not received a recommended nominee from any stockholder or group of stockholders that beneficially owned more than 5% of our common stock for at least one year as of the date of the recommendation.
Compensation of Directors
We discuss the compensation of our Directors in the section “Compensation Discussion and Analysis.”
Stockholder Communications with the Board of Directors
The Board of Directors has a policy and process to facilitate stockholder communications with Directors. Stockholders who wish to communicate directly with the Board of Directors may do so by writing to Internap Network Services Corporation, 250 Williams Street, Suite E-100, Atlanta, Georgia 30303, Attn: Corporate Secretary or by sending electronic mail to boardofdirectors@internap.com.
The Corporate Secretary will forward all communications received without reviewing or editing them. The Chairman of the Board of Directors, or the other Director to whom your communication is addressed, if other than the Board, will decide whether and how to respond to your communication. Such person may consult with the Corporate Secretary regarding his or her response.
Compensation Discussion and Analysis
Introduction
In this section, we discuss certain aspects of our compensation program as it pertains to our principal executive officer, our principal accounting officer, our three other most highly compensated executive officers as of December 31, 2007, and one individual who would have been among the three most highly compensated executive officers had he been an executive officer as of December 31, 2007. We refer to these individuals as the “named executive officers.” Our discussion focuses on compensation and practices relating to 2007, our most recently completed fiscal year, and includes relevant actions we have taken thus far in 2008 that affect the compensation of our named executive officers.
We believe that the individual performance of our named executive officers can have a significant impact on our overall results. We, therefore, place considerable importance on the design and administration of our executive compensation program.
This Compensation Discussion and Analysis will outline our compensation philosophy, the administration of our policies, our use of consultants, and provide a detailed description of how and why we paid each element of the compensation plan to our named executive officers.
Philosophy
Our executive compensation program is designed to: (1) attract, motivate, reward, and retain high quality executives necessary for our leadership; (2) ensure that compensation provided to executive officers is closely aligned with our short and long-term business objectives, financial performance and strategic goals; (3) build a strong link between an individual’s performance and his or her related paid compensation; and (4) further align the interests of management with our stockholders by providing equity incentive compensation. Our executive compensation practices are intended to provide each executive a total annual compensation that is commensurate with the executive’s responsibilities, experience and demonstrated performance and are intended to be competitive with a select group of peer companies, as well as a larger group of other technology companies.
The Company is in an industry characterized by intense competition, rapid technological change and the introduction of new products and services. Successful companies in this industry are those that achieve growth in this environment. Our compensation program reflects our commitment to growth and increasing stockholder value by providing for bonuses and equity awards only when the Company has achieved certain levels of growth. For example, the bonuses received by our named executive officers in 2007 for performance in 2006 were the first such bonuses awarded by the Company and coincided with the Company’s unprecedented financial performance.
Determination Process
The Compensation Committee, or the Committee, oversees the establishment of executive compensation policies and programs consistent with our corporate objectives and stockholder interests, as well as reviews the general policies relating to the compensation and benefits for all of our employees. The Board of Directors determines the Committee’s membership. All members of the Committee are independent Directors under NASDAQ rules. The Committee meets at scheduled times during the year, and it may take action by unanimous written consent, but only in rare instances following fulsome consideration and discussion of the issues presented. The Chair of the Committee reports on Committee actions and recommendations at meetings of the full Board of Directors. The Committee engages independent compensation consultants and considers their data and input.
The Committee’s charter, which is available on our website, mandates that the Committee annually review each named executive officer’s compensation package. The Committee considers: (1) the extent to which we attained specified corporate objectives for the preceding year; (2) the extent to which the named executive officer attained his or her individual objectives for the preceding year; (3) the recommendations of the Chief Executive Officer with respect to compensation of the other named executive officers; (4) the experience and contribution levels of the named executive officer; (5) internal pay equity; and (6) benchmarking the total compensation levels of executive officers in similar positions in companies in a select group of peer companies, as well as a larger group of other technology companies, through surveys conducted by independent compensation consultants.
The Committee approves the total compensation, including base salary adjustments, cash bonus and long-term incentive awards, of the named executive officers, other than the Chief Executive Officer, based on the factors described in the preceding paragraph. The Committee considers the same factors when evaluating the Chief Executive Officer’s performance and recommends a compensation package, including base salary adjustments, cash bonus and long-term incentive awards, to the Board of Directors for its review, discussion and approval. A majority of the independent Directors of the full Board of Directors must approve the compensation of our Chief Executive Officer.
The Committee typically makes changes to our named executive officers’ base salaries in December of each year, but made such adjustments to base salaries for 2007 in January of 2007. The Committee typically determines bonus awards in March after financial results for the preceding year are available. The Committee also determines the long-term incentives in March during its prescheduled meeting.
60
Use of Consultants
We recognize that competitive compensation is critical for attracting, motivating and rewarding qualified executives. To ensure our named executive officers are compensated appropriately, the Committee retained the services of Aon Consulting, or Aon, an independent compensation consultant, to identify appropriate compensation levels and compensation program design features. Aon assisted the Committee in identifying and establishing median total compensation goals and assisted in general oversight of our executive compensation program. This oversight includes helping the Committee evaluate compensation practices and assisting the Committee with developing and implementing our executive compensation program and philosophy. The Committee used information provided by Aon when approving or recommending compensation levels, but does not delegate authority to set compensation to Aon or to any other party.
At the Committee’s direction to ensure independence, neither Aon nor any of its affiliates or subsidiaries provided any other services to the Company.
Compensation for 2007
In September 2006, Aon conducted a review of labor market salary levels for top executives in similar sized companies and similar industries using published compensation surveys and a selected peer group of companies. Aon provided a preliminary list of potential peer companies using publicly available databases and screening on relevant industry categories. The Committee reviewed this preliminary list and considered the similarities of products and services offered, revenue size, market capitalization, and number of employees, as well as revenue growth and profitability. Based on this review, the Committee determined that the following companies would constitute the peer group: Akamai Technologies Inc., Arbinet-Thexchange Inc., Cbeyond Communications Inc., Cogent Communications Group, Covad Communications Group, Equinix Inc., Globix Corp., Infospace Inc., Internet Security Systems Inc., Ipass Inc., ITC Deltacom Inc., Navisite Inc., Savvis Inc., Terremark Worldwide Inc., and VitalStream Holdings, Inc. The peer group companies are Internet infrastructure companies, as well as a larger group of similarly situated and sized technology companies, but these companies are not necessarily dispositive of the companies we consider in all comparative analyses. While the these peer companies differed in relative revenue size, Aon used regression analysis of its database to factor in size differences and to calculate actual and expected compensation for executives relative to net sales and completed an analysis that linked the peer group executive regression data, the published survey data and the Company’s internal hierarchy. Aon matched our executive positions to published compensation survey data for similarly sized companies. These surveys are generally broad in scope and incorporate the comparison data from hundreds of respondent companies. The survey sources on which Aon relied included Aon’s Radford Technology Compensation Surveys and surveys from other well-known sources, including William M. Mercer and Watson Wyatt. Data utilized represented companies of similar size, industry and scope to us, with revenues generally less than $200 million.
Aon conducted a regression analysis using the peer group database to calculate actual and expected compensation for chief executive officers relative to 2005 net sales and completed an analysis that linked the peer group chief executive officer regression data, the published survey data and our internal hierarchy. This analysis compared relative values from published surveys of positions below the chief executive officer by creating a published survey index to the chief executive officer. Aon set the chief executive officer index at 100% and the indices for positions below the chief executive officer are calculated by dividing the published survey median results for each position by the published median for the chief executive officer’s compensation. These indices were applied to calculate expected compensation levels for the positions below the chief executive officer.
For base salaries, the Committee focused on the published survey data results because the Committee viewed those results as more indicative of the labor market since the published survey data sources covered many more companies. For total cash compensation, which is salary plus bonus and total direct compensation, which is total cash plus the present value of stock or other long-term compensation, the Committee focused on the peer group regression results because those companies are growth companies and better represented the labor market on these elements of compensation.
Aon identified the market median salary for each of our named executive officers. Based on that median, we concluded that the base salaries of our named executive officers were between 94% and 112% of the published surveys’ market median salary for each position. We also concluded that our named executive officers had total cash compensation that ranged from 105% to 139% of expected total cash compensation from the peer group regressions, and total direct compensation that ranged from 85% to 151% of the expected total direct compensation from the peer group regressions.
The overall results of the Aon engagement provided the foundation for our actions involving executive compensation in 2007.
Compensation for 2008
To assist with its decisions for executive compensation for 2008, the Committee asked Aon to conduct a review of the competitiveness of Internap’s executive compensation program for its top executives and to compare Internap’s executive compensation to published surveys and a mutually selected peer group. Aon presented the results of this review in August of 2007 and formed the foundation for our actions related to executive compensation in 2008.
Aon utilized published surveys and a selected peer group of similar companies to Internap. Aon developed key findings from an analysis of competitive compensation data and its review of reports and documents provided by the Company. Aon compared the Company’s top executive positions to the executives listed in the proxy statement of each of the selected peer companies. The Committee, with Aon’s advice, selected the peer companies. Aon then matched the Company’s executive positions to published compensation survey data for similarly sized companies. The surveys are generally broad in scope and incorporate the compensation data from hundreds of respondent companies. Aon aged this salary information to October 1, 2007 at a 3.5% annualized increase rate, which was based on actual 2006 and projected 2007 median merit salary increase rates for technology companies. The surveys Aon used were:
● The 2005 Radford Executive Compensation Survey, Telecommunications Products/Services with revenues from $200 million to $1 billion;
● The 2006 William M. Mercer Executive Compensation Report, All Organizations with revenues less than $500 million; and
● The 2006 Watson Wyatt Industry Report on Top Management Compensation, All Organizations with revenues from $150 million to $750 million.
61
Aon then evaluated the Company’s compensation components and total compensation levels, including base salary and annual and long-term incentives, for the positions matched to the survey sources. Aon also developed a database of compensation and financial information for the Company and the peer group. The peer group consisted of the following companies: Akamai Technologies Inc., Cbeyond Communications Inc., Cogent Communications Group, Covad Communications Group, Equinix Inc., Infospace Inc., ITC Deltacom Inc., Limelight Networks Inc., Navisite Inc., Neustar Inc., Premier Global Services, Radiant Systems Inc., Savvis Inc., Switch & Data Facilities Co., and Terremark Worldwide Inc.
The following companies were included as peers in Aon’s 2006 analysis, but were not included as peers in this 2007 analysis: Arbinet-Thexchange Inc., Globix Corp., Internet Security Systems Inc., Ipass Inc., and VitalStream Holdings, Inc. The Committee did not include Globix because it underwent business changes and portions were acquired. Similarly, the Committee did not include Internet Security Systems Inc. or VitalStream Holdings, Inc. because both were acquired. The following companies were not included as peers in the 2006 analysis, but were peers in this 2007 analysis: Infospace Inc., Limelight Networks Inc., Neustar Inc., Premier Global Services, Radiant Systems Inc., and Switch & Data Facilities Co. The Committee did not include Limelight in its 2006 analysis because it was not publicly traded. It added Infospace, Neustar, Premier, Radiant, and Switch & Data this year because those companies are succeeding in areas we expect to grow. The Committee did not include Arbinet-Thexchange Inc. and Ipass Inc. because it concluded that the newly included companies were more relevant peers.
Aon then conducted regression analyses using the peer group database to calculate actual and expected CEO compensation. Aon completed an Executive Value Index analysis that linked peer group CEO regression data, the published survey data and the Company’s internal hierarchy. This analysis compared relative values from published surveys of positions below the CEO by creating a published survey index to CEO. The CEO index is set at 100% and the indices for positions below the CEO are calculated by dividing the published survey results for each position by the published survey median for the CEO’s compensation. This approach is particularly accurate in measuring job values based on the duties and responsibilities of each job, rather than a ranking of by salary only.
Aon also identified the prevalence of performance-based long-term incentive grants for the peer companies. Aon evaluated stock compensation dilution levels for the peer companies to identify competitive annual stock compensation grants and total stock compensation shares outstanding and available for grant relative to total shares issued and outstanding.
Aon then developed recommended target compensation levels for certain executives, including target base salaries, bonus opportunity ranges and long-term incentive award ranges.
Based on the published survey data, Aon concluded that the Company’s base salaries for these executives were 103.7% of the median survey data and 87.2% of the 75th percentile survey data. Based on the trended peer group analysis, which was unadjusted for differences in net sales size, Aon concluded that the Company’s base salaries for these executives was 98.7% of the median survey data and 88.7% of the 75th percentile survey data.
Executive Compensation Program Overview
The three primary components of our executive compensation program are:
| • | Base salary; |
| • | Annual cash incentives; and |
| • | Long-term equity incentives, which consist of stock options and restricted stock. |
We strive to provide sufficiently competitive levels of base salary and annual and long-term incentive opportunities in order to attract and retain the talent needed to ensure continued operational and financial success, high quality customer service and creation of sustained stockholder value. To this end, we target each element to the median of our peer group and the broader published survey pay data for similar sized companies in the technology industry, which reflects the Committee’s commitment to pay for performance. When the Company’s performance exceeds established benchmarks, the compensation of our named executive officers will exceed this median.
We believe that the compensation of our named executive officers should be predominately performance-based because these individuals have the greatest ability to influence our performance. To that end, our compensation practices provide ong-term award opportunities to reflect the strategic roles of our named executive officers in leading us toward long-term growth, increasing profitability and stockholder value creation. Accordingly, the Committee does not target a particular mix of compensation elements and the amounts awarded or paid pursuant to each element do not affect decisions regarding the other elements.
A description of these three components and related programs follows.
62
Executive Summary
The total compensation of our President and Chief Executive Officer, Jim DeBlasio, was $1,750,408, which consisted of base salary of $425,000, awards of restricted stock of $524,831, awards of stock options of $435,452, and a bonus of $337,663 of which $297,500 was paid in cash and $40,163 was paid in shares of common stock. The cash component of Mr. DeBlasio’s compensation equals approximately 41% of his total compensation and the equity component of his compensation equals approximately 59% of his total compensation.
The total compensation of our former Chief Financial Officer, David Buckel, was $750,248, which consisted of salary of $240,333, which is a prorated amount of his base salary of $260,000 for the portion of the year he was employed by the Company, awards of restricted stock of $222,204 and awards of stock options of $287,711. The cash component of Mr. Buckel’s compensation equals approximately 32% of his total compensation and the equity component of his compensation equals approximately 68% of his total compensation.
The total compensation of our Chief Operating Officer, Vincent Molinaro, was $661,336, which consisted of salary of $247,917, which is a prorated amount of his base salary of $350,000 for the portion of the year he was employed by the Company, a portion of his signing bonus of $13,333, awards of restricted stock of $325,086, and a cash bonus of $75,000. The cash component of Mr. Molinaro’s compensation equals approximately 51% of his total compensation and the equity component of his compensation equals approximately 49% of his total compensation.
The total compensation of our Vice President and General Counsel, Richard Dobb, was $381,363, which consisted of salary of $180,000, which is a prorated amount of his base salary of $240,000 for the portion of the year he was employed by the Company, awards of restricted stock of $78,783 and a bonus of $122,580 of which $108,000 was paid in cash and $14,180 was paid in shares of common stock. The cash component of Mr. Dobb’s compensation equals approximately 76% of his total compensation and the equity component of his compensation equals approximately 24% of his total compensation.
The total compensation of our Vice President and Chief Strategy Officer, Phil Kaplan, was $726,137, which consisted of base salary of $230,808, which is a prorated amount of his base salary of $235,000 for the portion of the year he was employed by the Company, awards of stock options of $396,641 and a bonus of $98,688 of which $87,000 was paid in cash and $11,688 was paid in shares of common stock. The cash component of Mr. Kaplan’s compensation equals approximately 44% of his total compensation and the equity component of his compensation equals approximately 56% of his total compensation.
The total compensation of our Vice President and Principal Accounting Officer, Tamara Augustyn, was $347,428, which consisted of base salary of $172,500 awards of restricted stock of $42,987, awards of stock options of $41,941, and a cash bonus of $90,000. The cash component of Ms. Augustyn’s compensation equals approximately 76% of her total compensation and the equity component of her compensation equals approximately 24% of her total compensation.
| 1. | Base Salary |
The Committee establishes base salaries that are sufficient to attract and retain individuals with the qualities it believes are necessary for our long-term financial success and that are competitive in the marketplace. A named executive officer’s base salary generally reflects the officer’s responsibilities, tenure, job performance, special circumstances, and direct competition for the officer’s services. In other cases, the Committee determines salaries in negotiations to recruit certain highly qualified executives for key positions, after consideration of, with no specific weighting, the importance of the position being filled, the experience and background of the candidate, the level of compensation required to induce the candidate to leave his or her current position, and the compensation historically paid to others in that position.
The Committee reviews the salaries of our executive officers annually. In addition to these periodic reviews, the Committee may at any time review the salary of an executive who has received a significant promotion, whose responsibilities have been increased significantly or who is a retention risk. Salaries for the named executive officers generally are based upon their personal performance in light of individual levels of responsibility, our overall performance and profitability during the preceding year, economic trends that may affect us, and the competitiveness of the executive’s salary with the salaries of executives in comparable positions at companies of comparable size or with operational characteristics. While the Committee considered each of these factors, it did not assign a specific value to each factor.
63
As part of the compensation setting process for the named executive officers other than the Chief Executive Officer, the Committee met with our Chief Executive Officer and reviewed the performance of each of the other named executive officers. The Committee considered the recommendations of the Chief Executive Officer along with the competitiveness of the named executive officer’s salary compared to salaries of executives of our peer group. The base salary component of our executive compensation provides each named executive officer with a fixed minimum amount of annual cash compensation. Set forth below and effective as of January 2007 are the fiscal year 2007 base salaries for our named executive officers:
Name | Base Salary | |||
| James DeBlasio | $ | 425,000 | ||
| Vincent Molinaro | $ | 350,000 | ||
| David Buckel | $ | 260,000 | (1) | |
| Richard Dobb | $ | 240,000 | ||
| Phil Kaplan | $ | 235,000 | ||
| Tamara Augustyn | $ | 175,000 | ||
| (1) | Mr. Buckel resigned his position as Chief Financial Officer in November 2007. |
In December 2007, the Board conducted its annual review of the salaries of the named executive officers. The Board compared each named executive officer’s base salary to market median levels and considered each named executive officer’s experience and sustained performance in the position and also considered each named executive officer’s job performance balanced against his or her retention risk. Effective January 1, 2008, the Board increased Mr. DeBlasio’s base salary to $460,000, increased Mr. Molinaro’s base salary to $360,000, Mr. Dobb’s base salary to $248,000, Mr. Kaplan’s base salary to $244,000, and Ms. Augustyn’s base salary to $185,000.
| 2. | Annual Cash Incentives |
We believe that our compensation program should focus the named executive officers and other key executives on our annual financial performance and should reward individual performance. To that end, we have adopted the 2007 Executive Bonus Award Incentive Plan, or the Plan. Named executive officers and other executives participate in the Plan and our Chief Executive Officer may recommend to the Committee that other key contributors participate in the Plan.
The purpose of the Plan is to:
| • | Focus participants’ actions on the achievement of annual revenue growth and profitability goals; |
| • | Align participants’ actions on the accomplishment of key operational and strategic goals; |
| • | Encourage and reward participants for the achievement of specific objectives; and |
| • | Maintain a competitive range of incentive compensation opportunities. |
Each named executive officer’s award is based on the following three criteria:
| 1. | Achievement of revenue goals by us, which comprises 25% of the potential award; |
| 2. | Achievement of adjusted EBITDA goals by us, which comprises 50% of the potential award; and |
| 3. | Achievement of individual goals by the named executive officer, which comprises 25% of the potential award. |
64
We must meet a threshold of financial performance based on revenue, adjusted EBITDA and net income, which excludes equity compensation expenses, for the year in order for any awards to be made pursuant to the Plan. The Board established this minimum financial performance in November of 2006 as part of our business plan for 2007. In addition, a named executive officer must achieve a certain rating in his or her performance review, which includes attaining his or her individual and department budget objectives, to receive any award pursuant to the Plan.
We choose to base awards pursuant to the Plan on adjusted EBITDA and revenue because we believe they are accurate measurements of our core performance. We chose to base the majority of awards pursuant to the Plan based on adjusted EBITDA because adjusted EBITDA has become a commonly used metric, especially for capital-intensive technology companies such as ours, for assessing operating performance, liquidity and valuations by investors, analysts and banks.
For 2007, the adjusted EBITDA target was $36.1 million and the revenue target was $235.0 million, compared to an adjusted EBITDA target of $18.8 million and revenue target of $160.1 million for 2006. The change in these targets from 2006 to 2007 represents an approximately 92% increase in adjusted EBITDA and a 46% increase in revenue.
The Committee chose these revenue and adjusted EBITDA targets because they reflected the substantial growth the Company expected in 2007, particularly in light of its acquisition of VitalStream Holdings, Inc. Further, these targets complemented the earnings guidance the Company issued, which was adjusted EBITDA of $34-37 million and revenue of $235 million.
With respect to individual goals, the Chief Executive Officer establishes his goals with the Committee and the Chief Executive Officer oversees the establishment of each of the other named executive officer’s goals for the upcoming year. Upon completion of the year, the Chief Executive Officer rates each of the other named executive officer on the attainment of those goals. A named executive officer receives a Needs Improvement rating, or NI, a Meets Expectations rating, or ME, an Often Exceeds Expectations rating, or OE, or an Exceeds Expectations rating, or EE. The Board rates the Chief Executive Officer using the same rating system. If a named executive officer receives a Needs Improvement rating, he or she is not eligible for any award pursuant to the Plan, regardless of the Company’s financial performance.
To be eligible for awards, a participant must be a full-time employee at the time the Board determines achievement under the Plan. If an executive joins the Company mid-year, his or her award is pro-rated for the portion of the year during which he or she was an executive.
The Board assigns each executive a target level as a percentage of his or her salary, which are based on survey analysis. The target award levels for 2007 were:
Name | Target | Maximum | ||||
| James DeBlasio | 70 | % | 140 | % | ||
| David Buckel (1) | 50 | % | 100 | % | ||
| Vincent Molinaro | 50 | % | 100 | % | ||
| Richard Dobb | 45 | % | 90 | % | ||
| Phil Kaplan | 37 | % | 74 | % | ||
| Tamara Augustyn (2) | -- | % | -- | % |
| (1) | Mr. Buckel resigned his position as Chief Financial Officer in November 2007. |
| (2) | Ms. Augustyn assumed the role of Principal Accounting Officer following Mr. Buckel’s resignation in November 2007 and was not a participant in the Plan when the Board established these percentages. |
The Board retains the sole discretion to determine whether the Company and the named executive officer have met the objectives.
The Board established the following four levels for each of the three criteria: threshold, target, above and maximum.
65
Potential payment for achievement of the “Threshold” objective for the annual revenue goal and annual adjusted EBITDA goal equals 40% of each respective criterion’s allocated percentage of the individual named executive officer’s target award amount, which is 40% of 25% of the total target award amount in the case of the annual revenue goal and 40% of 50% of the total target award amount, in the case of the annual adjusted EBITDA goal. Potential payment for achievement of the threshold objective for the individual goals is $0.
Potential payment of achievement of the “Target” objective for the annual revenue goal, annual adjusted EBITDA goal and individual goals equals 100% of each criterion’s allocated percentage of the named executive officer’s total target award amount, which are 25%, 50% and 25% of the total target award amount, respectively.
Potential payment for achievement of the “Above” objective for the annual revenue goal, annual adjusted EBITDA goal and individual goals are 130% of each respective goal’s allocated portion of the individual’s target award amount.
Potential payment for achievement of the “Maximum” objective for the annual revenue goal, annual adjusted EBITDA goal and individual goals is 200% of each such goal’s allocated portion of the individual’s target award amount.
The Board determines the potential payment for performance for the annual revenue and annual adjusted EBITDA goals that fall between the “Target,” “Threshold,” “Above,” or “Maximum” objectives by interpolating on a straight-line basis to determine an incentive amount.
The following table is an illustrative example for a named executive officer whose salary is $240,000 and whose target award is 45%.
| Weight | Threshold | Target | Above | Maximum | |||||||||||||||
| Annual Revenue Bonus Payout | 25 | % | 95 | % | 100 | % | 105 | % | 110 | % | |||||||||
| $ | 10,800 | $ | 27,000 | $ | 35,100 | $ | 54,000 | ||||||||||||
| Annual Adjusted EBITDA Bonus Payout | 50 | % | 90 | % | 100 | % | 110 | % | 120 | % | |||||||||
| $ | 21,600 | $ | 54,000 | $ | 70,200 | $ | 108,000 | ||||||||||||
| Individual Goals Bonus Payout | 25 | % | NI | ME | OE | EE | |||||||||||||
| $ | 0 | $ | 27,000 | $ | 35,100 | $ | 54,000 | ||||||||||||
If our annual revenue was 110% of the annual revenue goal established by the Board, then this named executive officer would receive a bonus for those criteria of $54,000. If our annual adjusted EBITDA objective was 110% of the adjusted EBITDA goal established by the Board, then this named executive officer would receive a bonus of $70,200. If this named executive officer received a rating of Often Exceeds Expectations, or OE, this named executive officer would receive a bonus of $35,100. In total, this named executive officer would receive a total bonus of $159,300.
The Board decided that the Company would pay the Target Award Level, as defined in the Plan, in cash and pay the excess of the Target Award Level in shares of common stock. The Company determined the number of shares of common stock to be awarded based on the closing price of the Company’s stock price on the day preceding the date on which the Company paid such bonus. The Company withheld the number of shares necessary to cover the taxes each participant owed the Internal Revenue Service as a result of the vesting of the shares of common stock.
66
In 2007, the Company’s revenue was $235 million, which equaled the revenue target established in the Plan, and adjusted EBITDA was $37.7 million, which exceeded the adjusted EBITDA target established in the Plan. In consideration of this matrix and as provided in the Plan, the Committee determined in 2008 and approved bonus payment amounts not directly calculated by reference to the Plan in excess of the targets established in the Plan for each named executive officer, other than the Chief Executive Officer, and the Board determined the bonus payment for the Chief Executive Officer, as follows and paid such amounts on March 15, 2008:
Name: | Total Bonus Amount | Cash Portion | Stock Portion | |||||||||
James DeBlasio | $ | 337,663 | $ | 297,500 | $ | 40,163, or 6,638 shares | ||||||
David Buckel (1) | -- | -- | -- | |||||||||
Vincent Molinaro | $ | 75,000 | $ | 75,000 | $ | 0 | ||||||
Richard Dobb | $ | 122,580 | $ | 108,000 | $ | 14,580, or 2,409 shares | ||||||
Phil Kaplan | $ | 98,688 | $ | 87,000 | $ | 11,688, or 1,931 shares | ||||||
Tamara Augustyn (2) | $ | 90,000 | $ | 90,000 | $ | 0 | ||||||
| (1) | Mr. Buckel resigned his position as Chief Financial Officer in November 2007 and thus, was not eligible for an award pursuant to the Plan. |
| (2) | Ms. Augustyn assumed the role of Principal Accounting Officer following Mr. Buckel’s resignation in November 2007. |
In the fourth quarter of 2007, the Board established the target revenue and target adjusted EBITDA goals for 2008. The Committee established the following target award levels for our named executive officers, other than our Chief Executive Officer, and the Board established the target award level for Mr. DeBlasio:
Name | Target | Maximum | ||||
| James DeBlasio | 70 | % | 140 | % | ||
| David Buckel (1) | -- | % | -- | % | ||
| Vice President and Chief Financial Officer | 50 | % | 100 | % | ||
| Vincent Molinaro (2) | 50 | % | 100 | % | ||
| Richard Dobb | 45 | % | 90 | % | ||
| Phil Kaplan | 45 | % | 90 | % | ||
| Tamara Augustyn (3) | -- | % | -- | % |
| (1) | Mr. Buckel resigned his position as Vice President and Chief Financial Officer on November 18, 2007. |
| (2) | Mr. Molinaro resigned his position as Chief Operating Officer on April 7, 2008. |
| (3) | Ms. Augustyn will not be a participant in the Plan for 2008. |
The changes in performance targets are not an indication of how we will perform in 2008. The sole purpose of these targets, which the Board established in the fourth quarter of 2007, is to establish internal performance-based goals under an annual incentive compensation plan. Consistent with our pay-for-performance compensation philosophy, the Board establishes these goals to align executive compensation with our performance and to encourage the achievement of our goals. As disclosed in the press release we furnished in our Current Report on Form 8-K on February 28, 2008, we issued revenue guidance of 25% growth and full year adjusted EBIDTA of approximately 20% of total revenue. We are not providing any guidance, nor updating any prior guidance, of our future performance with the disclosure of these performance targets, and you are cautioned not to place any reliance on these performance targets as an indication of our future performance.
67
| 3. | Long-Term Equity Incentives |
Historically, the primary form of equity compensation that we awarded consisted of non-qualified stock options. We selected this form because of the favorable accounting and tax treatments and the near universal expectation by employees in our industry that they would receive stock options. Beginning in 2006, however, the accounting treatment for stock options changed as a result of Statement of Financial Accounting Standards (SFAS) No. 123R, Share-Based Payment (revised 2004), making the accounting treatment of stock options less attractive because it required the Company to record an expense related to stock options. As a result, we assessed the desirability of granting shares of restricted stock to employees, particularly members of senior management, and concluded that restricted stock would provide an equally motivating form of incentive compensation while permitting us to issue fewer shares, thereby reducing potential dilution. We continue to award stock options to new hires, upon a promotion, as a result of performance evaluations, and in other special situations.
The Committee grants stock options and restricted stock to named executive officers, other than the Chief Executive Officer, under the Amended and Restated Internap Network Services Corporation 2005 Incentive Stock Plan, or the Stock Plan, which our stockholders approved, to provide long-term incentives that are aligned with the creation of increased stockholder value over time. We believe an executive who owns options or restricted stock will have an increased personal interest in our growth and success. Because these awards vest over time, they also serve as a retention device. The Committee recommends the amounts of the Chief Executive Officer’s awards to the Board and the Board determines his grants. The strike price of options is the fair market value of our stock at the date of grant. Options also typically have a ten-year term and generally vest 25% on the first anniversary of the grant date and in 36 equal monthly installments thereafter. Shares of restricted stock typically vest in 16 equal quarterly installments.
The Committee reviews long-term incentive levels for all named executive officers each fiscal year in light of long-term strategic and performance objectives and each named executive officer’s current and anticipated contributions to our future performance. When determining the number of stock options or restricted shares to be awarded to a named executive officer, the Committee considers: (1) the named executive officer’s current contribution to our performance; (2)�� the named executive officer’s anticipated contribution in meeting our long-term strategic performance goals and (3) comparisons to formal surveys of executive long-term incentive awards relative to the median of the peer group, as well as a larger group of other similarly sized technology companies.
With the exception of significant promotions and new hires, we generally make these awards at the first meeting of the Committee each year following the availability of the financial results for the prior year. These grants were made on March 15, 2007 for our 2006 fiscal year and March 20, 2008 for our 2007 fiscal year. We selected this timing in March because it enables us to consider both the Company’s performance and the named executive officer’s performance for the previous year, as well as to consider our expectations for the current year. The Committee’s schedule is determined several months in advance and the proximity of any awards to earnings announcements or other market events is coincidental.
We do not time, and have never timed, the grant of stock options or restricted stock in coordination with the release of material non-public information nor have we timed our release of non-public information for the purpose of affecting the value of executive compensation. Although our Chief Executive Officer may recommend the amount of stock awards granted to management, the Committee, or in the case of awards to our Chief Executive Officer, the Board, approves the grant of all stock awards and does not delegate the timing of grants. We have retained a third party service provider to administer the day-to-day activities of the Stock Plan, but the provider does not determine the recipient of stock awards, the amount of stock awards granted to a participant, the exercise price, or vesting of stock awards.
Prior to the scheduled meeting of the Committee in March, our Chief Executive Officer provided a list of recommended incentive restricted stock grants for the other named executive officers to the Committee. The following paragraph describes the formula he used to determine the number of shares restricted stock he recommended that the other named executive officers receive.
The named executive officer’s base salary is multiplied by the target bonus percentage established by the Board for that named executive officer for 2007 to arrive at a target bonus. The target bonus percentage is multiplied by a market competitive multiple, which Aon developed based on its analysis. Based on this analysis, the Committee determined that our chief executive officer would receive a multiple of 6.0. Other executives receive a lower multiple, which is expressed in increments of 0.5 based on his or her decreasing level of responsibilities from the chief executive officer. These multiples of target bonus reinforce our named executive officers’ strategic role in driving the achievement of our long-term performance objectives and the creation of stockholder value. We calculated the target long-term incentive opportunities for our named executive officers using the following multiples of their target bonus percentages:
Name | Multiple | |
| James DeBlasio | 6.0 | |
| David Buckel (1) | -- | |
| Vince Molinaro | 5 | |
| Richard Dobb | 4 | |
| Phil Kaplan | 4 | |
| Tamara Augustyn | 1.5 |
| (1) | Mr. Buckel resigned his position as Vice President and Chief Financial Officer on November 18, 2007 prior to the Board’s determination of awards and thus, was not eligible for an award pursuant to the Stock Plan. |
68
The target bonus percentage multiplied by this multiple yields a target long-term incentive as a percentage of target salary. This percentage of target salary is then multiplied by the named executive officer’s 2007 base salary to yield a target long-term incentive amount. This target long-term incentive amount is then divided by the volume-weighted average price of our common stock from March 19, 2007 to March 19, 2008 to yield a target number of restricted shares. Our Chief Executive Officer then presented his recommendations to the Committee.
The calculation of these awards is materially different from such calculation in 2007 in that the Committee chose to use the volume-weighted average price of our common stock from March 19, 2007 to March 19, 2008 rather than the closing price of the stock on the day before the grant. Using the volume-weighted average price rather than the closing price the day before reduced the number of shares granted by approximately 66%. In making its determination to use the volume-weighted average price, the Committee considered the unusual volatility of the stock price and that the closing price of the Company’s stock on March 19, 2007 was $16.49, while the closing price on March 19, 2008 was $4.09. Given this decline in value, the Committee concluded that using the closing price the day before rather than the volume-weighted average price would result in equity awards that do not reflect the goal of paying for performance.
The Board concluded that half of each award should be time-based and half should be performance-based in order to tie the long term incentive to performance. Previous equity awards were all time-based. The Board made this change to further align the interest of our named executive officers with our stockholders’ interests. For the time-based portion, the shares vest in 16 equal quarterly installments. For the performance-based portion, the shares vest in 33% annual increments starting with the year that includes the first anniversary of the grant date. Executives earn annual tranches of awards, which vest on each of the first three anniversaries from the date of grant, to the extent that the Company achieves certain revenue and EBITDA targets established by the Board of Directors for each respective year in the performance cycle. The Company will either meet or not meet both goals in a given year. With respect to all shares of performance-based restricted stock that do not vest during any of the three years, 50% of such shares will vest on the fourth anniversary of the date of the grant.
The vesting of any restricted stock (including both time-based and performance-based) is subject to the executive being an employee in good standing on the date of vesting.
The Committee considered the recommendation in light of the named executive officer’s contribution and anticipated contribution and the results provided from Aon’s competitive market survey. In making its determination of both cash incentives and long-term incentive awards and its recommendation to the Board for Mr. DeBlasio’s awards, the Committee considered the Company’s performance in 2007 and granted each named executive officer, other than the Chief Executive Officer, a target award based on the above-described matrix.
The Board then considered the number of shares of restricted stock to grant to our Chief Executive Officer. The Board applied the same process as described above, and granted Mr. DeBlasio 149,776 shares, as indicated in the following table.
69
Name | Total Number of Shares | Time-Based | Performance-Based | |
James DeBlasio | 149,776 | 74,888 | 74,888 | |
David Buckel (1) | -- | -- | -- | |
Vincent Molinaro | 69,771 | 34,886 | 34,886 | |
Richard Dobb | 34,607 | 17,303 | 17,303 | |
Phil Kaplan | 34,048 | 17,024 | 17,024 | |
Tamara Augustyn | 3,980 | 3,980 | -- |
| (1) | Mr. Buckel resigned his position as Vice President and Chief Financial Officer on November 18, 2007 prior to the Board’s determination of awards and thus, was not eligible for an award pursuant to the Stock Plan. |
Stock Retention Guidelines
On March 20, 2008, the Board adopted stock retention guidelines for certain executives. The stock retention guidelines are based on net shares obtained from option exercises or vesting of restricted shares after costs of exercise and taxes. The percentage of net shares obtained from option exercises or vesting of restricted shares after costs of exercise and taxes that each executive is to retain and the time in which he or she is to hold such shares are set forth in the following table:
| Position | Retention Ratio | Time to Retain | ||
| Chief Executive Officer | 50.0% | 5 Years from date of acquisition | ||
| Chief Operating Officer | 33.3% | 4 Years from date of acquisition | ||
| Chief Financial Officer | 33.3% | 4 Years from date of acquisition | ||
| Chief Technology Officer | 25.0% | 3 Years from date of acquisition | ||
| Chief Strategy Officer | 25.0% | 3 Years from date of acquisition | ||
| Vice President, Human Resources | 25.0% | 3 Years from date of acquisition | ||
| Vice President and General Counsel | 25.0% | 3 Years from date of acquisition | ||
| Vice President, Sales | 25.0% | 3 Years from date of acquisition |
These guidelines apply to the grants made pursuant to the Stock Plan on March 20, 2008 described above and will apply to all future grants. The enumerated executives are subject to these guidelines for as long as he or she is an employee of the Company.
The Board concluded that the emerging best practices in corporate governance include such guidelines and and adopted these stock retention guidelines to further align the interests of the executives with our stockholders’ interests.
Perquisites; Other Compensation
We annually review any perquisites that our named executive officers may receive. In general, we do not provide our named executive officers with many of the types of perquisites that other companies offer their executives. As reflected in our Summary Compensation Table, our Chief Executive Officer received $18,900 for corporate housing and $8,561.91 for car service during fiscal year 2007. The aggregate cost of these perquisites was $27,462.
70
We provide named executive officers with the same benefit package available to all of our salaried employees. This package includes:
| • | Health and dental insurance; |
| • | Basic life insurance; |
| • | Long-term disability insurance; and |
| • | Participation in our 401(k) plan, including matching contributions. |
Limitations on the Deductibility of Executive Compensation
Compensation payments in excess of $1 million to the chief executive officer or the other five most highly compensated executive officers are subject to a limitation on deductibility by us under Section 162(m) of the Internal Revenue Code of 1986, as amended. Certain performance-based compensation is not subject to the limitation on deductibility. The Committee does not expect cash compensation in 2007 to our Chief Executive Officer or any other named executive officer to be in excess of $1 million. We intend to maintain qualification of the Amended and Restated Internap Network Services Corporation 2005 Incentive Stock Plan for the performance-based exception to the $1 million limitation on deductibility of compensation payments.
Summary Compensation Table
The following table sets forth total compensation for 2007 for our named executive officers.
Name and Principal Position | Year | Salary $(1) | Bonus $ | Stock Awards $(2) | Option Awards $ (2) | Non-Equity Incentive Plan Compensation(3) $ | Change in Pension Value & Non-Qualified Deferred Compensation Earnings $ | All Other Compensation $ | Total $ | |||||||||||||||||
James DeBlasio Chief Executive Officer | 2007 | 425,000 | — | 524,831 | 435,452 | 337,663 | — | 27,462 | 1,750,408 | |||||||||||||||||
| 2006 | 350,000 | — | 119,918 | 435,452 | — | — | 47,599 | 952,969 | ||||||||||||||||||
David Buckel (4) Chief Financial Officer | 2007 | 240,333 | — | 222,204 | 287,711 | — | — | — | 750,248 | |||||||||||||||||
| 2006 | 235,385 | — | 70,097 | 390,611 | 100,000 | — | — | 796,093 | ||||||||||||||||||
Vincent Molinaro Chief Operating Officer | 2007 | 247,917 | 13,333 | 325,086 | — | 75,000 | — | — | 661,336 | |||||||||||||||||
| 2006 | — | — | — | — | — | — | — | — | ||||||||||||||||||
Richard Dobb Vice President and General Counsel | 2007 | 180,000 | — | 78,783 | — | 122,580 | — | — | 381,363 | |||||||||||||||||
| 2006 | — | — | — | — | — | — | — | — | ||||||||||||||||||
Philip Kaplan Chief Strategy Officer | 2007 | 230,808 | — | — | 396,641 | 98,688 | — | — | 726,137 | |||||||||||||||||
| 2006 | — | — | — | — | — | — | — | — | ||||||||||||||||||
Tamara Augustyn Vice President and Principal Accounting Officer | 2007 | 172,500 | — | 42,987 | 41,941 | 90,000 | — | — | 347,428 | |||||||||||||||||
| 2006 | 152,274 | — | 14,902 | 41,227 | 50,000 | — | — | 202,274 | ||||||||||||||||||
| (1) | The salary of each of Mr. Buckel, Mr. Molinaro, Mr. Dobb, and Mr. Kaplan is prorated for the portion of the year he was employed by the Company. | |||||||||||||||||||||||||||
| (2) | Represents the proportionate amount of the total fair value of stock and option awards recognized by the Company as an expense in 2007 and 2006 for inancial accounting purposes, excluding forfeitures related to service-based vesting conditions. The fair values of these awards and the amounts expensed were determined in accordance with FAS 123R. The awards for which expense is shown in this table include the awards described in the Grants of Plan-Based Awards table of this Proxy Statement, as well as awards granted in prior years for which the Company continued to recognize expense in 2007 and 2006. The assumptions used in determining the grant date fair values of these awards are set forth in the notes to the Company’s consolidated financial statements, which are included in our Annual Report on Form 10-K for the year ended December 31, 2007. | |||||||||||||||||||||||||||
| (3) | As provided in the Plan, the Committee determined and approved bonus payments in 2008 in excess of the targets established in the Plan for each named executive officer, other than the Chief Executive Officer, and the Board determined the bonus payment for the Chief Executive Officer, and paid such excess in shares of common stock on March 15, 2008. Mr. DeBlasio’s bonus consisted of $297,500 paid in cash and $40,163 paid in shares of common stock. Mr. Dobb’s bonus consisted of $108,000 paid in cash and $14,180 paid in shares of common stock. Mr. Kaplan’s bonus consisted of $87,000 paid in cash and $11,688 paid in shares of common stock. The amounts reported in this column include the value of such shares. The value of these shares is not, however, reflected in column (e). | |||||||||||||||||||||||||||
| (4) | Mr. Buckel resigned as Chief Financial Officer in November of 2007. As a result, he forfeited 9,375 options that were a part of a grant made on May 12, 2004, 1,597 options that were part of a grant made on September 28, 2006, 1,298 options that were part of a second grant made on September 28, 2006, 5,090 options that were part of a third grant made on September 28, 2006, as well as 30,934 shares of restricted common stock that were part of an award made on January 18, 2006 and 65,625 shares of restricted common stock that were part of an award made on March 15, 2007. The aggregate amount of this forfeiture is $249,525.60 based on the assumptions delineated in footnote (2) above. | |||||||||||||||||||||||||||
71
All Other Compensation
Name and Principal Position | Perquisites and Other Personal Benefits $ | Tax Reimburse- ments $ | Dividend Equivalents $ | Payments/ Accruals on Termination Plans $ | Registrant Contributions to Defined Contribution Plans $ | Insurance Premiums $ | Other $ | |||||||||||||||||||||||||||||||
James DeBlasio Chief Executive Officer | 27,462 | (1) | — | — | — | — | — | — | ||||||||||||||||||||||||||||||
David Buckel Chief Financial Officer | — | — | — | — | — | — | — | |||||||||||||||||||||||||||||||
Vincent Molinaro Chief Operating Officer | — | — | — | — | — | — | — | |||||||||||||||||||||||||||||||
Richard Dobb Vice President and General Counsel | — | — | — | — | — | — | — | |||||||||||||||||||||||||||||||
Philip Kaplan Chief Strategy Officer | — | — | — | — | — | — | — | |||||||||||||||||||||||||||||||
Tamara Augustyn Vice President and Principal Accounting Officer | — | — | — | — | — | — | — | |||||||||||||||||||||||||||||||
| (1) | The amounts shown for fiscal 2007 include personal use of corporate housing of $18,900 and car service of $8,562. |
Grants of Plan-Based Awards Table
The following table sets forth information regarding grants of annual incentive awards and stock based compensation for 2007 for each named executive officer.
Grant Date | Estimated Future Payouts Under Non-Equity Incentive Plan Awards | Estimated Future Payouts Under Equity Incentive Plan Awards | All Other Stock Awards: Number of Shares of Stock or Units # | All Other Stock Awards: Number of Securities Underlying Options # | Exercise or Base Price of Option Awards $/Sh | Grant Date Fair Value of Stock and Option Awards | ||||||||||||||||||||||
Name and Principal Position | Threshold $ | Target $ | Maximum $ | Threshold # | Target # | Maximum # | ||||||||||||||||||||||
James DeBlasio Chief Executive Officer | 3/15/2007 | — | — | — | — | — | — | 125,000 | — | — | $ | 2,082,500 | ||||||||||||||||
| 3/15/2008 | (1) | — | — | — | 6,638 | 40,160 | ||||||||||||||||||||||
David Buckel Chief Financial Officer | 3/15/2007 | — | — | — | — | — | — | 75,000 | — | — | 1,249,500 | |||||||||||||||||
Vincent Molinaro Chief Operating Officer | 4/24/2007 | — | — | — | — | — | — | 125,000 | — | — | 2,005,000 | |||||||||||||||||
| Richard Dobb | 4/23/2007 | — | — | — | — | — | — | 30,000 | — | — | 474,600 | |||||||||||||||||
Vice President and General Counsel | 3/15/2008 | (1) | — | — | — | — — | — — | — — | 2,409 | — | — | 14,574 | ||||||||||||||||
| Philip Kaplan | 6/22/2007 | — | — | — | — | — | — | — | 30,000 | 13.64 | 409,200 | |||||||||||||||||
| Chief Strategy Officer | 3/15/2008 | (1) | — | — | — | — | — | — | 1,931 | — | — | 11,683 | ||||||||||||||||
72
Tamara Augustyn Vice President and Principal Accounting Officer | 03/15/07 12/19/2007 | — | — — | — — | — — | — — | — — | 7,500 — | — 10,000 | — 9.15 | 124,950 91,500 | |||||||||||||||||||
(1) As provided in the Plan, the Committee determined and approved bonus payments in 2008 in excess of the targets established in the Plan for each named executive officer, other than the Chief Executive Officer, and the Board determined the bonus payment for the Chief Executive Officer, and paid such excess in shares of common stock on March 15, 2008. Mr. DeBlasio’s bonus consisted of $297,500 paid in cash and $40,163 paid in shares of common stock, or 6,638 shares. Mr. Dobb’s bonus consisted of $108,000 paid in cash and $14,180 paid in shares of common stock, or 2,409 shares. Mr. Kaplan’s bonus consisted of $87,000 paid in cash and $11,688 paid in shares of common stock, or 1,931 shares. The Company included these shares even though the Company did not award these shares in fiscal year 2007 to enhance the overall disclosure of our executive compensation policies.
Outstanding Equity Awards Table
The following table provides a detail of outstanding stock options and restricted stock awards for each named executive officer as of December 31, 2007.
| Option Awards | Stock Awards | |||||||||||||||||||||||
Name and Principal Position | Number of Securities Underlying Unexercised Options # Exercisable | Number of Securities Underlying Unexercised Options # Unexercisable | Equity Incentive Plan Awards: Number of Securities Underlying Unexercised Unearned Options # | Option Exercise Price $ | Option Expiration Date | Number of Shares or Units of Stock That Have Not Vested # | Market Value of Shares or Units of Stock That Have Not Vested (1) $ | Equity Incentive Plan Awards: Number of Unearned Shares, Units or Other Rights That Have Not Vested # | Equity Incentive Plan Awards: Market or Payout Value of Unearned Shares, Units or Other Rights That Have Not Vested $ | |||||||||||||||
James DeBlasio Chief Executive Officer | 8,000 17,000 2,000 2,000 312,5000 | (2) | — — — — — | — — — — — | 13.50 13.50 14.90 4.60 4.80 | 9/16/2013 9/16/2013 5/27/2014 6/23/2015 9/30/2015 | 33,330 101,562 — — — | (3) (4) | 277,639 846,011 — — — | — — — — — | — — — — — | |||||||||||||
David Buckel Chief Financial Officer | 15,000 65,625 903 734 2,877 | (5) | — — — — — | — — — — — | 11.10 14.30 14.46 14.46 14.46 | 10/31/2013 5/12/2014 9/28/2016 9/28/2016 9/28/2016 | — — — — — | — — — — — | — — — — — | — — — — — | ||||||||||||||
Vincent Molinaro Chief Operating Officer | — | — | — | — | — | 125,000 | (6) | 1,041,250 | — | — | ||||||||||||||
Richard Dobb Vice President and General Counsel | — | — | — | — | — | 30,000 | (7) | 249,900 | — | — | ||||||||||||||
Philip Kaplan Chief Strategy Officer | 25,569 13,471 24,056 | (8) | — 13,471 52,924 | — — — | 4.06 10.53 17.31 | 12/2/2014 12/16/2015 07/13/2016 | — — — | — — — | — — — | — — — | ||||||||||||||
| 30,000 | (9) | — | 13.64 | 6/22/2017 | — | — | — | — | ||||||||||||||||
Tamara Augustyn Vice President and Principal | 13,125 479 | 1,875 521 | (10) | — — | 12.10 5.30 | 6/30/2014 1/18/2016 | 6,250 6,094 | (11) (12) | 52,063 50,763 | — — | — — | |||||||||||||
| Accounting Officer | — | 10,000 | — | 9.15 | 12/19/2017 | — | — | — | — | |||||||||||||||
| (1) | The fair market value of a share of Internap stock on the last day of the 2007 fiscal year was $8.33. |
| (2) | Mr. DeBlasio was granted 500,000 options on September 30, 2005. 25% vested immediately, but were not exercisable until September 30, 2006 with the remaining shares vesting annually over a four-year period beginning September 30, 2005, and the other options were granted for Mr. DeBlasio’s service as a Director. |
| (3) | Mr. DeBlasio was awarded restricted shares on September 30, 2005. 50% of those shares vested on September 30, 2006, with the remaining shares vesting annually over a three-year period beginning September 30, 2006. |
73
| (4) | Mr. DeBlasio was granted 125,000 shares of restricted stock on March 15, 2007 that vest in a series of 16 quarterly installments at the end of each calendar quarter beginning with the second quarter of 2007. |
| (5) | Mr. Buckel was granted options on October 31, 2003, May 12, 2004, January 18, 2006, and three separate grants on September 29, 2006. The options vest over a four-year period with the exception of options granted on September 28, 2006. The options vest monthly over a three-year period. |
| (6) | Mr. Molinaro was granted 125,000 shares of restricted common stock on April 24, 2007 of which 25% of the award vests on the anniversary of grant. |
| (7) | Mr. Dobb was granted 30,000 shares of restricted common stock on April 23, 2007 and 25% of the award vests on the anniversary of grant. |
| (8) | Mr. Kaplan was granted options on December 2, 2004, December 16, 2005 and July 13, 2006. One-fourth of the number of shares vested on the anniversary of the grant date and then vest quarterly over the next three years. |
| (9) | Mr. Kaplan was granted 30,000 options on June 22, 2007. One-fourth of the number of shares vest on each of the first, second, third, and fourth anniversary of the grant date. |
| (10) | Ms. Augustyn was granted options on June 30, 2004, January 18, 2006 and December 19, 2007. One-fourth of the number of shares vest on the anniversary of the grant date and 1/48 of the number of shares vest per month thereafter. |
| (11) | Ms. Augustyn was granted 10,000 shares of restricted common stock on February 27, 2006. One-eighth of the number of shares vest every six months after the grant date. |
| (12) | Ms. Augustyn was granted 7,500 shares of restricted common stock on March 15, 2007 that vest in a series of 16 quarterly installments at the end of each calendar quarter beginning with the second quarter of 2007. |
Option Exercises and Stock Vesting
The following table provides information with respect to options exercised during fiscal 2007.
| Option Awards | Stock Awards | |||||||||||||||||||||
Name and Principal Position | Number of Shares Acquired on Exercise # | Value Realized Upon Exercise $ | Number of Shares Acquired on Vesting # | Value Realized On Vesting $ | ||||||||||||||||||
James DeBlasio Chief Executive Officer | — | — | 40,108 | 535,124 | ||||||||||||||||||
David Buckel Chief Financial Officer | — | — | 19,689 | 288,753 | ||||||||||||||||||
Vincent Molinaro Chief Operating Officer | — | — | — | — | ||||||||||||||||||
Richard Dobb Vice President and General Counsel | — | — | — | — | ||||||||||||||||||
Philip Kaplan Chief Strategy Officer | — | — | — | — | ||||||||||||||||||
Tamara Augustyn Vice President and Principal Accounting Officer | — | — | 3,906 | 59,222 | ||||||||||||||||||
Pension Benefits
None of our named executive officers are covered by a pension plan or other similar benefit plan that provides for payments or other benefits at, following or in connection with retirement.
Nonqualified Deferred Compensation
None of our named executive officers are covered by a nonqualified defined contribution or other nonqualified plan that provides for the deferral of compensation.
Employment Agreements and Potential Payments Upon Termination or Change in Control
We have entered into an employment security plan with Mr. Molinaro, Mr. Dobb, Mr. Kaplan, and certain other officers and an employment agreement with Mr. DeBlasio that provide for payments in the event of a change in control or termination of the officer’s employment. We believe that we should protect these individuals in the event of a change in control. We also believe that the interests of our stockholders will be best served if the interests of these officers are aligned with them. Providing change in control benefits should eliminate, or at least reduce, the reluctance of these officers to pursue potential change in control transactions that may be in the best interests of our stockholders. The employment security plan and Mr. DeBlasio’s employment agreement are designed to promote stability and continuity of our officers.
74
Mr. DeBlasio’s employment agreement provides that if the Company terminates his employment without cause, as defined in the agreement, or if Mr. DeBlasio terminates his employment for good reason, also as defined in the agreement, Mr. DeBlasio shall receive a cash severance payment equal to one and one-half (1-1/2) times his then-current base salary. If the Company terminates Mr. DeBlasio’s employment without cause or if Mr. DeBlasio terminates his employment for good reason within 24 months of a change in control, as such term is defined in the agreement, instead of the severance benefits previously described, Mr. DeBlasio shall receive a severance payment equal to two (2) times the sum of his then-current base salary plus the greater of (A) his maximum bonus for the year in which the termination occurs and (B) his average bonus during the prior two completed years (as a percentage of his base salary upon which his bonus awards were calculated) multiplied by his then-current base salary, and all of his then-unvested stock options and additional equity compensation shall vest and become exercisable. In addition, he will continue to receive health care and life insurance coverage for 18 months as if he were an active employee, subject to the employee portion of premiums for such coverage. If Mr. DeBlasio dies while employed pursuant to this agreement, all of his unvested equity compensation that would, had he not have died, have become vested within twelve months after the date of his death (assuming fulfillment of any performance criteria and his continued employment by the Company) shall become vested, free of restrictions, other than those imposed by law, and immediately exercisable for a period ending on the earlier of twelve months after the date of death and the original expiration date thereof.
On November 14, 2007, the Company entered into an Employment Security Plan for certain executive officers of the Company (the “Plan”). The Plan supersedes the employment agreements that were in place for the executives who executed Joinder Agreements to the Plan, including Mr. Molinaro, Mr. Dobb and Mr. Kaplan. The Board adopted the Plan in order to bring consistency to its executives’ agreements and to minimize the negotiation of individual contracts. The Board and Mr. DeBlasio decided to keep Mr. DeBlasio’s employment agreement in place rather than have him enter into the Plan in order to preserve maximum flexibility and to acknowledge the unique relationship of a chief executive officer with a company.
The purpose of the Plan is to provide certain benefits in the event an executive’s employment is terminated, either in connection with or unrelated to a change of control of the Company.
Upon a qualifying termination, as defined in the Plan, other than during a protection period, also as defined in the Plan, a participant will receive severance equal to his or her then-current base salary. Upon a qualifying termination during a protection period, a participant will receive severance equal to the sum of his or her then-current base salary plus maximum bonus for the participant under the applicable bonus plan as established by Company’s Board of Directors for the year in which the termination occurs, and all of his or her unvested equity-based compensation will vest.
A participant is entitled to severance benefits under the Plan in consideration for his or her execution of an agreement with terms substantially similar to the terms of the General Release and Separation Agreement set forth as Exhibit B to the Plan. The Company’s obligation to provide such severance benefits is also conditioned upon the participant’s continued compliance with confidentiality, non-competition, non-solicitation, and non-disparagement covenants.
The Joinder Agreement for each of Mr. Molinaro, Mr. Dobb and Mr. Kaplan preserves certain benefits of each executive’s superseded employment agreement that were greater than those provided by the Plan.
Upon a qualifying termination, as defined in the Plan, other than during a protection period, also as defined in the Plan, Mr. Molinaro receives severance equal to one and one-half times his then-current base salary. Upon a qualifying termination during a protection period, he receives severance equal to the sum of two times his then-current base salary plus maximum bonus for him under the applicable bonus plan.
Upon a qualifying termination during a protection period, Mr. Dobb receives severance equal to the sum of two times his then-current base salary plus maximum bonus for him under the applicable bonus plan.
Upon a qualifying termination during a protection period, Mr. Kaplan receives severance equal to the sum of two times his then-current base salary plus maximum bonus for him under the applicable bonus plan and the options holds that were originally granted on December 2, 2004 and December 16, 2005, shall become vested in their entirety.
The table below details the calculation of the payments based upon an assumed January 1, 2008 termination date and assuming the termination was without cause:
75
Potential Termination and Change in Control Payments
Termination Benefit | Change in Control Benefit | |||||||||||||||||||||||||||
Name and Principal Position | Estimate of Total Severance Value $ | Termination Reason | Cash Severance Multiple | Equity Treatment (3) | Benefit Continu- ation | Retirement Continu- ation | Other | Estimate of Total Change in Control Value $ | Protection Period | Cash Severance Multiple | Equity Award Treatment | Benefit Continu- ation | Retirement Continu- ation | |||||||||||||||
James DeBlasio Chief Executive Officer | 637,500 | Involuntary Termination Without cause | 1.5x Base Salary | No accelerated vesting - Executive has 90 days to exercise vested options | 18 months | — | — | 2,332,400 | 24 months | 2x(Base Salary + Maximum Target Bonus) | 100% vesting of restricted stock and options | 18 months | — | |||||||||||||||
David Buckel (1) Chief Financial Officer | — | — | — | — | — | — | — | — | — | — | — | — | — | |||||||||||||||
Vincent Molinaro Chief Operating Officer | 525,000 | Involuntary Termination Without cause | 1.5x Base Salary | No accelerated vesting - Executive has 90 days to exercise vested options | 18 months | — | — | 2,091,250 | 24 months | 2x(Base Salary + Maximum Target Bonus) | 100% vesting of restricted stock and options | 18 months | — | |||||||||||||||
Richard Dobb Vice President and General Counsel | 240,000 | Involuntary Termination Without cause | 1x Base Salary | No accelerated vesting - Executive has 90 days to exercise vested options | 18 months | — | — | 924,900 | 24 months | 2x(Base Salary + Maximum Target Bonus) | 100% vesting of restricted stock and options | 18 months | — | |||||||||||||||
Philip Kaplan Chief Strategy Officer | 235,000 | Involuntary Termination Without cause | 1x Base Salary | No accelerated vesting - Executive has 90 days to exercise vested options | 18 months | — | — | 643,900 | 24 months | 2x(Base Salary + Maximum Target Bonus) | 100% vesting of restricted stock and options | 18 months | — | |||||||||||||||
Tamara Augustyn Vice President and Principal Accounting Officer | — | — | — | — | — | — | — | — | — | — | — | — | — | |||||||||||||||
| (1) | Mr. Buckel resigned in November of 2007. |
Compensation of Directors
Effective as of January 1, 2007, compensation for non-employee Directors is as follows:
| • | The cash fee for Directors for attendance at a Board meeting in person is $1,500 and by telephone is $750 per meeting; | |
| • | The cash fee for Directors for attendance at a Committee meeting in person is $1,000 and by telephone is $750 per meeting; | |
| • | The annual retainer paid to each Director is $20,000. | |
| • | An annual stock option grant to each Director of 5,000 shares of the Company’s common stock. The options have an exercise price equal to 100% of the fair market value of our common stock on the date of grant and are fully vested and exercisable as of the date of grant; |
| • | An annual grant of 2,500 restricted stock units, which vests ratably over a three-year period, subject to the terms in the stock grant agreement and Stock Plan under which the restricted stock units are granted; |
| • | The Chair of the Compensation Committee of the Board of Directors receives an annual retainer of $7,500; |
| • | Other members of the Compensation Committee receive an annual retainer of $2,500; |
| • | Members of the Audit Committee, other than the Chair, receive an annual retainer of $5,000. The Audit Committee Chair’s retainer is $10,000. | |
| • | The Chair of the Nominations and Governance Committee of the Board of Directors receives an annual retainer of $5,000. |
| • | The Chairman of the Board of Directors receives an annual retainer of $40,000. |
| • | New non-employee Directors receive a grant of 12,500 restricted stock units, which vests ratably over a three-year period, subject to the terms of the stock grant agreement and Stock Plan under which the restricted stock units are granted. |
We also reimburse Directors for certain expenses in connection with attendance at Board of Director and committee meetings. Directors who are also employees do not receive any additional compensation for serving on the Board of Directors or any committees of the Board of Directors.
In addition, the Board adopted a stock retention policy starting in 2007 that requires each Director to retain a fixed percentage of the “net shares” he or she acquires through stock option exercise and vesting of restricted stock units. Net shares are shares obtained after costs of exercise and taxes to the Director. For 2007, the stock retention requirement is fifty percent (50%) of these net shares. A Director must retain the stock so acquired until six months following the completion of his or her service as a Director. The Board concluded that the best practices emerging in corporate governance include such retention policies and adopted this stock retention policy to further align the interests of the Directors with our stockholders’ interests.
76
The following table provides information concerning the compensation of our non-employee Directors for our most recently completed fiscal year.
Name | Fees Earned or Paid in Cash $ | Stock Awards $(1) | Option Awards $(1) | Non-Equity Incentive Plan Compensation $ | Change in Pension Value and Non-Qualified Deferred Compensation Earnings $ | All Other Compensation (2) $ | Total $ | |||||||||||
| Eidenberg, Eugene | 42,000 | 4,779 | 57,631 | — | — | 9,879 | 114,289 | |||||||||||
| Higgins, Patricia | 45,250 | 4,779 | 57,631 | — | — | — | 107,659 | |||||||||||
| Coe, Charles | 35,875 | 4,779 | 57,631 | — | — | 2,113 | 100,397 | |||||||||||
| Harding, William | 10,250 | 4,779 | 57,631 | — | — | 1,497 | 74,157 | |||||||||||
| Harman, Frederick (3) | 9,000 | — | — | — | — | 2,399 | 11,399 | |||||||||||
| Ober, Kevin | 33,000 | 4,779 | 57,631 | — | — | 8,347 | 103,757 | |||||||||||
| Pfeiffer, Gary | 10,250 | 17,813 | — | — | — | 3,069 | 31,132 | |||||||||||
| Stanzione, Daniel | 36,000 | 4,779 | 57,631 | — | — | 124 | 98,533 | |||||||||||
| (1) | Based on the grant date fair value of outstanding awards that vested in 2007 computed in accordance with FAS 123R. |
| (2) | Includes consulting fees and reimbursement for expenses. |
| (3) | Mr. Harman resigned on March 15, 2007. |
The Board also targets its compensation to the median based on a survey provided by Aon for software and Internet technology companies with $200 to $499.9 million in revenues.
The following table lists the number of outstanding stock options and restricted stock awards held by our non-employee Directors as of December 31, 2007. All outstanding options are fully vested.
Name | Options | Shares of Restricted Stock | ||||
| Eidenberg, Eugene | 142,999 | 2,500 | ||||
| Higgins, Patricia | 34,000 | 2,500 | ||||
| Coe, Charles | 36,000 | 2,500 | ||||
| Harding, William (1) | — | — | ||||
| Harman, Frederick (2) | — | — | ||||
| Ober, Kevin | 21,000 | 2,500 | ||||
| Pfeiffer, Gary | — | 12,500 | ||||
| Stanzione, Daniel | 34,000 | 2,500 | ||||
| (1) | Dr. Harding retired from Morgan Stanley Venture Partners III, LLC and Morgan Stanley & Co., Inc. in October of 2007. He assigned all of his equity compensation received while serving on our Board of Directors to Morgan Stanley, which consists of 2,500 shares of restricted common stock and options to purchase 27,000 shares of common stock that are vested and exercisable. Dr. Harding disclaims beneficial ownership in all such shares. Because Dr. Harding has retired from Morgan Stanley, such shares are excluded from the table above. |
| (2) | Mr. Harman resigned on March 15, 2007. |
77
Compensation Committee Report
The Compensation Committee has reviewed and discussed with management the Compensation Discussion and Analysis and, based on this review and discussion, recommends that the Compensation Discussion and Analysis be included in the proxy statement and filed with the Securities and Exchange Commission.
| The Compensation Committee | |
| Charles B. Coe |
| Patricia L. Higgins | |
| Gary Pfeiffer |
| Daniel Stanzione |
Note that Mr. Harman served as a member of the Compensation Committee and resigned from the Board of Directors on March 15, 2007. Accordingly, he did not review the Compensation Discussion and Analysis and did not sign the Compensation Committee Report.
Compensation Committee Interlocks and Insider Participation
None of the members of the Compensation Committee is a former or current officer or employee of the Company or any of its subsidiaries. None of our executive officers or Directors serves as a member of the board of directors or compensation committee of any entity that has one or more of its executive officers serving as a member of our Board of Directors or Compensation Committee.
The following table sets forth the beneficial ownership of shares of common stock as of March 25, 2008 for:
| • | our Directors and Director nominees; | |
| • | our principal executive officer, our principal accounting officer, our three most highly compensated named executive officers other than the principal executive officer and principal accounting officer as of December 31, 2007, and one individual who would have been the principal financial officer had he been an executive officer as of December 31, 2007; | |
| • | our Directors, Director nominees and executive officers as a group; and | |
| • | each stockholder who holds more than a 5% interest in our outstanding common stock. |
Unless otherwise indicated in the footnotes, all of such interests are owned directly and the indicated person or entity has sole voting and disposition power.
Beneficial ownership is determined in accordance with the rules of the SEC. In computing the number of shares beneficially owned by a person and the percentage of ownership held by that person, shares of common stock subject to options and warrants held by that person that are currently exercisable or will become exercisable within 60 days after March 25, 2008 are deemed outstanding, while these shares are not deemed outstanding for computing percentage ownership of any other person.
78
The percentage of common stock beneficially owned is based on 50,249,871 shares of our common stock outstanding at March 25, 2008.
The address for those individuals for which an address is not otherwise indicated is: c/o Internap Network Services Corporation, 250 Williams Street, Atlanta, Georgia 30303.
| Common Stock Beneficially Owned | |||||
| Number of Shares | Percent of Class | ||||
| Tamara Augustyn (1) | 36,751 | * | |||
| David A. Buckel (2) | -- | -- | |||
| Charles B. Coe (3) | 53,500 | * | |||
| James P. DeBlasio (4) | 681,323 | * | |||
| Richard Dobb (5) | 66,235 | * | |||
| Eugene Eidenberg (6) | 242,656 | * | |||
| Franklin Resources, Inc. (7) | 3,696,290 | 7.4% | |||
| William J. Harding (8) | 24,783 | * | |||
| Patricia L. Higgins (9) | 41,229 | * | |||
Integral Capital Management VII, LLC, Integral Capital Management VIII, LLC and ICP Absolute Return Management, LLC (10) | 2,999,000 | 6.0% | |||
| Phil Kaplan (11) | 437,862 | * | |||
| Kornitzer Capital Management, Inc. (12) | 3,736,800 | 7.4% | |||
| Vince Molinaro (13) | 194,771 | * | |||
| Kevin L. Ober (14) | 23,500 | * | |||
| Gary Pfeiffer (15) | 12,500 | * | |||
| Daniel C. Stanzione (16) | 45,500 | * | |||
| All Directors and executive officers as a group (13 persons) | 1,860,610 | 3.7% | |||
* Less than 1%.
| (1) | Consists of 3,980 shares of restricted common stock awarded on March 20, 2008 that vest in 16 quarterly installments, 7,500 shares of restricted common stock awarded on March 15, 2007 that vest in 16 quarterly installments, 10,000 shares of restricted common stock awarded on February 27, 2006 of which 12.5% vest every six months, and options to purchase 15,271 shares of common stock that are vested and exercisable or that will vest within 60 days. |
| (2) | Mr. Buckel resigned his position as Vice President and Chief Financial Officer on November 19, 2007. |
Consists of 15,000 shares of common stock, 2,500 shares of restricted common stock awarded on June 22, 2007 one-third of which vest on each of the first, second and third anniversary of the grant date, provided Mr. Coe is a Director of the Company on such date, and options to purchase 36,000 shares of common stock that are vested and exercisable. | |
| (4) | Consists of: (i) 5,000 shares purchased in the open market; (ii) 100,000 shares of restricted stock of which 50,000 vested on September 30, 2006 and 17,325 shares were withheld to cover taxes, 16,667 vested on September 30, 2007 with 16,667 shares to vest on September 30, 2008 and 16,666 shares to vest on September 30, 2009, provided that Mr. DeBlasio is employed by the Company on such vesting dates. Thus far, Mr. DeBlasio has sold 27,000 shares in accordance with his 10b-5 plan; (iii) 125,000 shares of restricted stock that vest in a series of 16 quarterly installments at the end of each calendar quarter beginning with the second quarter of 2007 provided that Mr. DeBlasio is employed by the Company at the end of such quarter; (iv) 149,776 shares of restricted common stock awarded on March 20, 2008, half of which are time-based and half are performance-based vesting. The time-based portion vests in 16 equal quarterly installments. The performance-based portion vests in increments of one-third beginning on the first anniversary of the grant date if the Company achieves revenue and EBITDA levels established by the Board. The Company will either meet or not meet both goals in a given year. With respect to all shares of performance-based restricted stock that do not vest during any of the three years, 50% of such shares will vest on the fourth anniversary of the date of the grant. The vesting of any restricted stock (including both time-based and performance-based) is subject to Mr. DeBlasio being an employee in good standing on the date of vesting; (v) 4,372 shares awarded on March 15, 2008; and (vi) and options to purchase 341,500 shares of common stock that are vested and exercisable or that will vest within 60 days. |
| (5) | Consists of 30,000 shares of restricted common stock awarded on April 23, 2007 and 25% of the award vests on the anniversary of grant, provided that Mr. Dobb is employed by the Company on that date, 1,628 shares awarded on March 15, 2008 that are fully vested, and 34,607 shares of restricted common stock awarded on March 20, 2008, half of which are time-based and half are performance-based vesting. The time-based portion vests in 16 equal quarterly installments. The performance-based portion vests in increments of one-third beginning on the first anniversary of the grant date if the Company achieves revenue and EBITDA levels established by the Board. The Company will either meet or not meet both goals in a given year. With respect to all shares of performance-based restricted stock that do not vest during any of the three years, 50% of such shares will vest on the fourth anniversary of the date of the grant. The vesting of any restricted stock (including both time-based and performance-based) is subject to Mr. Dobb being an employee in good standing on the date of vesting. |
| (6) | Consists of the 2,500 shares of restricted common stock awarded on June 22, 2007 one-third of which vest on each of the first, second and third anniversary of the grant date, provided Dr. Eidenberg is a Director of the Company on such date, 236 shares of common stock held by Mr. Eidenberg, 45,556 shares of common stock held by Mr. Eidenberg, as trustee of the Eugene Eidenberg Trust dated 9/97, 2,799 shares of common stock held by Eugene Eidenberg, as trustee of the Anna M. Chavez Educational Trust, 40,000 shares of common stock held by the Eugene Eidenberg Grantor Retained Annuity Trust, 8,566 shares held by Anna M. Chavez, and options to purchase 142,999 shares of common stock that are vested and exercisable. |
79
| (7) | As of December 31, 2007. The address of Franklin Resources, Inc. is One Franklin Parkway, San Mateo, California 94403. |
| (8) | Dr. Harding retired from Morgan Stanley Venture Partners III, LLC and Morgan Stanley & Co., Inc. in 2007. He assigned all of his equity compensation received while serving on our Board of Directors to Morgan Stanley, which consists of 2,500 shares of restricted common stock and options to purchase 27,000 shares of common stock that are vested and exercisable. Dr. Harding disclaims beneficial ownership in all such shares. Because Dr. Harding has retired from Morgan Stanley, such shares are excluded from the table above. |
| (9) | Consists of 4,729 shares of common stock, 2,500 shares of restricted common stock awarded on June 22, 2007 one-third of which vest on each of the first, second and third anniversary of the grant date, provided Ms. Higgins is a Director of the Company on such date, and options to purchase 34,000 shares of common stock that are vested and exercisable. |
| (10) | As of January 4, 2008. The address is 3000 Sand Hill Road, Building 3, Suite 240, Menlo Park, California 94025. |
| (11) | Consists of 329,321 shares owned by Mr. Kaplan’s family trust, options to purchase 74,493 shares of common stock that are vested and exercisable or that will vest within 60 days and 34,048 shares of restricted common stock awarded on March 20, 2008, half of which are time-based and half are performance-based vesting. The time-based portion vests in 16 equal quarterly installments. The performance-based portion vests in increments of one-third beginning on the first anniversary of the grant date if the Company achieves revenue and EBITDA levels established by the Board. The Company will either meet or not meet both goals in a given year. With respect to all shares of performance-based restricted stock that do not vest during any of the three years, 50% of such shares will vest on the fourth anniversary of the date of the grant. The vesting of any restricted stock (including both time-based and performance-based) is subject to Mr. Kaplan being an employee in good standing on the date of vesting. |
| (12) | As of December 31, 2007. The address is 5420 West 61st Place, Shawnee Mission, Kansas 66205. |
| (13) | Consists of 125,000 shares of restricted common stock awarded on April 24, 2007 of which 25% of the award vests on the anniversary of grant, provided that Mr. Molinaro is employed by the Company on that date and 69,771 shares of restricted common stock awarded on March 20, 2008, half of which are time-based and half are performance-based vesting. The time-based portion vests in 16 equal quarterly installments. The performance-based portion vests in increments of one-third beginning on the first anniversary of the grant date if the Company achieves revenue and EBITDA levels established by the Board. The Company will either meet or not meet both goals in a given year. With respect to all shares of performance-based restricted stock that do not vest during any of the three years, 50% of such shares will vest on the fourth anniversary of the date of the grant. The vesting of any restricted stock (including both time-based and performance-based) is subject to Mr. Molinaro being an employee in good standing on the date of vesting. Mr. Molinaro resigned his position as Chief Operating Officer on April 7, 2008 and plans to remain an employee through June 30, 2008. |
| (14) | Consists of 2,500 shares of restricted common stock awarded on June 22, 2007 one-third of which vest on each of the first, second and third anniversary of the grant date, provided Mr. Ober is a Director of the Company on such date, and options to purchase 21,000 shares of common stock that are vested and exercisable. |
| (15) | Consists of 12,500 shares of restricted common stock awarded on August 21, 2007 one-third of which vest on each of the first, second and third anniversary of the grant date, provided Mr. Pfeiffer is a Director of the Company on such date. |
| (16) | Consists of 9,000 shares purchased in the open market, 2,500 shares of restricted common stock awarded on June 22, 2007 one-third of which vest on each of the first, second and third anniversary of the grant date, provided Dr. Stanzione is a Director of the Company on such date, and options to purchase 34,000 shares of common stock that are vested and exercisable. |
Equity Compensation Plan Information
Information concerning our equity compensation plans is set forth under Part II - Item 5 "Equity Compensation Plan Information."
We have entered into indemnification agreements with our Directors and executive officers for the indemnification of and advancement of expenses to such persons to the fullest extent permitted by law. We also intend to enter into these agreements with our future Directors and executive officers.
There are no transactions, since the beginning of our last fiscal year, or any currently proposed transaction, in which the Company was or is to be a participant and the amount involved exceeds $120,000, and in which any related person had or will have a direct or indirect material interest.
We do not have policies and procedures for the review, approval, or ratification of any transactions with related persons because we have never had occasion to consider a related party transaction.
The Board of Directors has affirmatively determined that each current non-employee Director is an “independent director” as that term is defined under NASDAQ rules and regulations. Mr. DeBlasio, the President and Chief Executive Officer, is not an independent Director because of his employment by the Company. Mr. DeBlasio does not participate in any action of the Board or the Compensation Committee related to his compensation.
Additional information concerning the independence of the members of our Board of Directors and its committees is set forth under Part III - Item 10, "Directors, Executive Officers and Corporate Governance."
The following table shows the fees paid or accrued by us for the audit and other services provided by PricewaterhouseCoopers LLP for the fiscal years ended December 31, 2007 and 2006.
| 2007 | 2006 | |||||
| Audit Fees (1) | $ | 1,988,994 | $ | 1,298,297 | ||
| Audit-Related Fees (2) | 325,694 | 399,966 | ||||
| Tax Fees (3) | 78,530 | 52,768 | ||||
| All Other Fees (4) | 1,500 | 142,804 | ||||
| Total | $ | 2,394,718 | $ | 1,893,835 | ||
| (1) | Fees related to the audit of Internap’s annual financial statements, including the audit of the effectiveness of internal control over financial reporting and the reviews of the quarterly financial statements filed on Forms 10-Q, and, for 2006, included the audit of management’s assessment of internal control over financial reporting. | ||||||||
| (2) | Fees primarily related to international statutory filings and, in 2006, also included registration statements. | ||||||||
| (3) | Fees primarily related to tax compliance, advice and planning. | ||||||||
| (4) | Fees related to services performed in conjunction with other professional services. | ||||||||
Approval of Audit and Permissible Non-Audit Services
Our Audit Committee Charter requires the Audit Committee to review and approve all audit services and all permissible non-audit services to be performed for us by our independent registered public accounting firm, and the Audit Committee will not approve any services that are not permitted by SEC rules.
The Audit Committee pre-approved all audit and audit related, tax and non-audit related services to be performed for us by our independent registered public accounting firm.
80
PART IV
| (a) | Documents filed as a part of the report: |
| (1) | Consolidated Financial Statements. |
The following consolidated financial statements of the Company and its subsidiaries are filed herewith:
| Page | ||
| Report of Independent Registered Public Accounting Firm | F-2 | |
| Consolidated Statements of Operations | F-3 | |
| Consolidated Balance Sheets | F-4 | |
| Consolidated Statement of Stockholders’ Equity and Comprehensive Loss | F-5 | |
| Consolidated Statements of Cash Flows | F-6 | |
| Notes to Consolidated Financial Statements | F-8 |
| (2) | Financial Statement Schedule. |
The following financial statement schedule of the Company and its subsidiaries is filed herewith:
| Page | ||
| Schedule II - Valuation and Qualifying Accounts for the Three Years Ended December 31, 2007 | S-1 |
| (3) | Index to Exhibits. |
Exhibit Number | Description | |
| 2.1 | Agreement and Plan of Merger dated October 12, 2006, by and among the Company, Ivy Acquisition Corp. and VitalStream Holdings, Inc. (incorporated herein by reference to Exhibit 2.1 to the Company’s Current Report on Form 8-K, filed on October 12, 2006). | |
| 3.1 | Certificate of Incorporation of the Company, as amended (incorporated by reference herein to Exhibit 4.1 to the Company’s Registration Statement on Form S-3, filed on September 8, 2003, File No. 333-108573). | |
| 3.2 | Certificate of Amendment of Certificate of Incorporation of the Company (incorporated by reference herein to Exhibit 3.1 to the Company’s Current Report on Form 8-K filed on July 11, 2006). | |
| 3.3 | Amended and Restated Bylaws of the Company (incorporated by reference herein to Exhibit 4.2 to the Company’s Registration Statement on Form S-3, filed September 8, 2003, File No. 333-108573). | |
| 3.4 | Certificate of Designation of Rights, Preferences and Privileges of Series B Preferred Stock (incorporated by reference herein to Exhibit 3.4 to the Company’s Current Report on Form 8-K filed on April 13, 2007). | |
| 4.1 | Rights Agreement, dated as of April 11, 2007, between Internap Network Services Corporation and American Stock Transfer & Trust Company, as Rights Agreement (incorporated by reference to Exhibit 4.1 to the Company’s Current Report on Form 8-K, filed on April 13, 2007). | |
| 10.1 | Form of Indemnification Agreement between the Company and each of its directors and certain of its officers (incorporated herein by reference to Exhibit 10.1 to the Company’s Registration Statement on Form S-1, File No. 333-84035 dated July 29, 1999).+ |
81
| 10.2 | Amended and Restated Internap Network Services Corporation 1998 Stock Option/Stock Issuance Plan (incorporated herein by reference to Exhibit 10.1 to the Company’s Quarterly Report on Form 10-Q for the quarter ended September 30, 2000, filed on November 14, 2000).+ | |
| 10.3 | Internap Network Services Corporation 1999 Non-Employee Directors’ Stock Option Plan (incorporated herein by reference to Appendix L to the Company’s Definitive Proxy Statement dated April 29, 2003).+ | |
| 10.4 | First Amendment to the Internap Network Services Corporation 1999 Non-Employee Directors’ Stock Option Plan (incorporated herein by reference to Appendix E to the Company’s Definitive Proxy Statement dated April 29, 2003).+ | |
| 10.5 | Internap Network Services Corporation 1999 Employee Stock Purchase Plan (incorporated herein by reference to Exhibit 10.4 to the Company’s Registration Statement on Form S-1, File No. 333-84035 dated July 29, 1999).+ | |
| 10.6 | Amended and Restated Internap Network Services Corporation 1999 Stock Incentive Plan for Non-Officers (incorporated herein by reference to Exhibit 10.2 to the Company’s Quarterly Report on Form 10-Q for the quarter ended September 30, 2000, filed on November 14, 2000).+ | |
| 10.7 | Amended Internap Network Services Corporation 1999 Equity Incentive Plan (incorporated herein by reference to Exhibit 10.7 to the Company’s Registration Statement on Form S-1, File No. 333-95503 dated January 27, 2000).+ | |
| 10.8 | Form of 1999 Equity Incentive Plan Stock Option Agreement (incorporated herein by reference to Exhibit 10.8 to the Company’s Registration Statement on Form S-1, File No. 333-84035 dated July 29, 1999).+ | |
| 10.9 | Internap Network Services Corporation 2000 Non-Officer Equity Incentive Plan (incorporated herein by reference to Exhibit 99.1 to the Company’s Registration Statement on Form S-8, File No. 333-37400 dated May 19, 2000).+ | |
| 10.10 | Internap Network Services Corporation 2002 Stock Compensation Plan (incorporated herein by reference to Exhibit 99(d)(1) to the Company’s Tender Offer Statement on Schedule TO, filed on November 18, 2002).+ | |
| 10.11 | Form of Nonstatutory Stock Option Agreement under the Internap Network Services Corporation 2002 Stock Compensation Plan (incorporated herein by reference to Exhibit 99(d)(2) to the Company’s Tender Offer Statement on Schedule TO, filed on November 18, 2002).+ | |
| 10.12 | Form of Employee Confidentiality, Nonraiding and Noncompetition Agreement used between Company and its Executive Officers (incorporated herein by reference to Exhibit 10.11 to the Company’s Registration Statement on Form S-1, File No. 333-84035 dated July 29, 1999). | |
| 10.13 | Form of Warrant (incorporated herein by reference to Appendix E to the Company’s Definitive Proxy Statement dated August 10, 2001). | |
| 10.14 | Amended and Restated 2005 Incentive Stock Plan, dated March 15, 2006 (incorporated by reference to Exhibit 10.1 to the Company’s Quarterly Report on Form 10-Q for the quarter ended March 31, 2006, filed on May 10, 2006).+ | |
82
| 10.15 | Employment Agreement dated as of July 10, 2007 between the Company and James DeBlasio (incorporated herein by reference to Exhibit 99.1 to the Company’s Current Report on Form 8-K, filed on July 11, 2007).+ | |
| 10.16 | First Amendment to Employment Agreement between James P. DeBlasio and Internap Network Services Corporation dated November 14, 2007 (incorporated herein by reference to Exhibit 99.1 to the Company’s Current Report on Form 8-K, filed on November 19, 2007).+ |
| 10.17 | Amended and Restated 2004 Internap Network Services Corporation Employee Stock Purchase Plan, dated January 11, 2006 (incorporated by reference to Exhibit 10.2 to the Company’s Quarterly Report on Form 10-Q for the quarter ended March 31, 2006, filed on May 10, 2006).+ | |
| 10.18 | Form of Stock Grant Certificate under the Amended and Restated Internap Network Services Corporation 2005 Incentive Stock Plan (incorporated by reference to Exhibit 10.1 to the Company’s Quarterly Report on Form 10-Q for the quarter ended June 30, 2006, filed on August 8, 2006).+ | |
| 10.19 | Form of Stock Option Grant Certificate under the Amended and Restated Internap Network Services Corporation 2005 Incentive Stock Plan (incorporated by reference to Exhibit 10.2 to the Company’s Quarterly Report on Form 10-Q for the quarter ended June 30, 2006, filed on August 8, 2006).+ | |
| 10.20 | VitalStream Holdings, Inc. 2001 Stock Incentive Plan (Third Amended and Restated) (incorporated by reference to Exhibit 4.4 to the Company’s Registration Statement on Form S-8, File No. 333-141245, filed on March 13, 2007).+ | |
| 10.21 | Employment Agreement dated as of October 12, 2006 between the Company and Patrick Ritto (incorporated by reference to Exhibit 10.4 to the Company’s Registration Statement on Form S-4, filed on November 29, 2006, File No. 33-138993 ).+ | |
| 10.22 | General Release and Separation Agreement between Eric Klinker and Internap Network Services Corporation (incorporated by reference to Exhibit 10.1 to the Company’s Current Report on Form 8-K, filed on April 12, 2007).+ | |
| 10.23 | 2007 Executive Bonus Award Incentive Plan (incorporated by reference to Exhibit 10.1 to the Company’s Quarterly Report on Form 10-Q for the quarter ended March 31, 2007, filed on May 10, 2007).+ | |
| 10.24 | Amendment to the 2007 Executive Bonus Award Incentive Plan (incorporated herein by reference to Exhibit 99.6 to the Company’s Current Report on Form 8-K, filed on November 19, 2007).+ | |
| 10.25 | Credit Agreement dated as of September 14, 2007 by and among Internap Network Services Corporation, as the Borrower, Bank of America, N.A., as Administrative Agent, Swing Line Lender and L/C Issuer, and the other Lenders party thereto (incorporated by reference to Exhibit 10.1 to the Company’s Current Report on Form 8-K, filed on September 19, 2007). | |
| 10.26 | Pledge and Security Agreement dated as of September 14, 2007 among Internap Network Services Corporation, and certain of its Subsidiaries party thereto from time to time, as Grantors, and Bank of America, N.A., as Administrative Agent (incorporated by reference to Exhibit 10.2 to the Company’s Current Report on Form 8-K, filed on September 19, 2007). | |
| 10.27 | Intellectual Property Security Agreement dated as of September 14, 2007 among Internap Network Services Corporation, and certain of its Subsidiaries party thereto from time to time, as Grantors, and Bank of America, N.A., as Administrative Agent (incorporated by reference to Exhibit 10.3 to the Company’s Current Report on Form 8-K, filed on September 19, 2007). | |
83
| 10.28 | Employment Security Plan dated November 14, 2007 (incorporated herein by reference to Exhibit 99.2 to the Company’s Current Report on Form 8-K, filed on November 19, 2007).+ | |
| 10.29 | Joinder Agreement to the Employment Security Plan executed by Richard Dobb (incorporated herein by reference to Exhibit 99.3 to the Company’s Current Report on Form 8-K, filed on November 19, 2007).+ | |
| 10.30 | Joinder Agreement to the Employment Security Plan executed by Phil Kaplan (incorporated herein by reference to Exhibit 99.4 to the Company’s Current Report on Form 8-K, filed on November 19, 2007).+ | |
| 10.31 | Joinder Agreement to the Employment Security Plan executed by Vince Molinaro (incorporated herein by reference to Exhibit 99.5 to the Company’s Current Report on Form 8-K, filed on November 19, 2007).+ | |
| 21.1* | List of Subsidiaries. | |
| 23.1* | Consent of PricewaterhouseCoopers LLP, Independent Registered Public Accounting Firm. | |
| 31.1* | Rule 13a-14(a)/15d-14(a) Certification, executed James P. DeBlasio, President, Chief Executive Officer and Director the Company. | |
| 31.2* | Rule 13a-14(a)/15d-14(a) Certification, executed by George Kilguss, Vice President and Chief Financial Officer of the Company. | |
| 32.1* | Section 1350 Certification, executed by James P. DeBlasio, President, Chief Executive Officer and Director the Company. | |
| 32.2* | Section 1350 Certification, executed by George Kilguss, Vice President and Chief Financial Officer of the Company. |
| * | Documents filed herewith. |
| + | Management contracts and compensatory plans and arrangements required to be filed as exhibits pursuant to Item 15(c) of this Report. |
84
Pursuant to the requirements of Section 13 or 15(d) of the Securities Exchange Act of 1934, as amended, the Company has duly caused this report to be signed on its behalf by the undersigned, thereunto duly authorized.
| INTERNAP NETWORK SERVICES CORPORATION | ||||
| Date: April 30, 2008 | ||||
| By: | /s/ George Kilguss | |||
George Kilguss Vice President and Chief Financial Officer | ||||
85
Internap Network Services Corporation
Index to Consolidated Financial Statements
| Page | |
| Report of Independent Registered Public Accounting Firm | F-2 |
| Consolidated Statements of Operations | F-3 |
| Consolidated Balance Sheets | F-4 |
| Consolidated Statement of Stockholders' Equity and Comprehensive Loss | F-5 |
| Consolidated Statements of Cash Flows | F-6 |
| Notes to Consolidated Financial Statements | F-8 |
| Financial Statement Schedule | S-1 |
F - 1
Report of Independent Registered Public Accounting Firm
To the Board of Directors and Stockholders of
Internap Network Services Corporation
In our opinion, the consolidated financial statements listed in the index appearing under Item 15(a)(1) present fairly, in all material respects, the financial position of Internap Network Services Corporation and its subsidiaries, at December 31, 2007 and 2006, and the results of their operations and their cash flows for each of the three years in the period ended December 31, 2007 in conformity with accounting principles generally accepted in the United States of America. In addition, in our opinion, the financial statement schedule listed in the index appearing under Item 15(a)(2) presents fairly, in all material respects, the information set forth therein when read in conjunction with the related consolidated financial statements. Also in our opinion, the Company did not maintain, in all material respects, effective internal control over financial reporting as of December 31, 2007, based on criteria established in Internal Control - Integrated Framework issued by the Committee of Sponsoring Organizations of the Treadway Commission (COSO) because a material weakness in internal control over financial reporting related to the completeness, accuracy, valuation and disclosure of sales adjustments existed at that date. A material weakness is a deficiency, or a combination of deficiencies, in internal control over financial reporting, such that there is a reasonable possibility that a material misstatement of the annual or interim financial statements will not be prevented or detected on a timely basis. The material weakness referred to above is described in Management's Report on Internal Control Over Financial Reporting appearing under Item 9A. We considered this material weakness in determining the nature, timing, and extent of audit tests applied in our audit of the 2007 consolidated financial statements, and our opinion regarding the effectiveness of the Company’s internal control over financial reporting does not affect our opinion on those consolidated financial statements. The Company’s management is responsible for these financial statements and financial statement schedule, for maintaining effective internal control over financial reporting and for its assessment of the effectiveness of internal control over financial reporting, included in management's report referred to above. Our responsibility is to express opinions on these financial statements, on the financial statement schedule, and on the Company’s internal control over financial reporting based on our integrated audits. We conducted our audits in accordance with the standards of the Public Company Accounting Oversight Board (United States). Those standards require that we plan and perform the audits to obtain reasonable assurance about whether the financial statements are free of material misstatement and whether effective internal control over financial reporting was maintained in all material respects. Our audits of financial statements included examining, on a test basis, evidence supporting the amounts and disclosures in the financial statements, assessing the accounting principles used and significant estimates made by management, and evaluating the overall financial statement presentation. Our audit of internal control over financial reporting included obtaining an understanding of internal control over financial reporting, assessing the risk that a material weakness exists, and testing and evaluating the design and operating effectiveness of internal control based on the assessed risk. Our audits also included performing such other procedures as we considered necessary in the circumstances. We believe that our audits provide a reasonable basis for our opinions.
As discussed in Note 2 to the consolidated financial statements, the Company changed the manner in which it accounts for share-based compensation in 2006 and the manner in which it accounts for uncertain tax positions in 2007.
Because of its inherent limitations, internal control over financial reporting may not prevent or detect misstatements. Also, projections of any evaluation of effectiveness to future periods are subject to the risk that controls may become inadequate because of changes in conditions, or that the degree of compliance with the policies or procedures may deteriorate.
/s/ PricewaterhouseCoopers LLP
Atlanta, GA
March 28, 2008
F - 2
CONSOLIDATED STATEMENTS OF OPERATIONS
(In thousands, except per share amounts)
| Year Ended December 31, | ||||||||||||
| 2007 | 2006 | 2005 | ||||||||||
| Revenues: | ||||||||||||
| Internet protocol (IP) services | $ | 119,848 | $ | 109,748 | $ | 105,032 | ||||||
| Data center services | 83,058 | 56,152 | 36,996 | |||||||||
| Content delivery network (CDN) services | 17,718 | — | — | |||||||||
| Other | 13,466 | 15,475 | 11,689 | |||||||||
| Total revenues | 234,090 | 181,375 | 153,717 | |||||||||
| Operating costs and expenses: | ||||||||||||
| Direct costs of network, sales and services, exclusive of depreciation and amortization, shown below: | ||||||||||||
| IP services | 43,681 | 39,744 | 38,377 | |||||||||
| Data center services | 59,439 | 46,474 | 35,244 | |||||||||
| CDN services | 6,584 | — | — | |||||||||
| Other | 8,690 | 11,120 | 8,337 | |||||||||
| Direct costs of amortization of acquired technologies | 4,165 | 516 | 577 | |||||||||
| Direct costs of customer support | 16,547 | 11,566 | 10,670 | |||||||||
| Product development | 6,564 | 4,475 | 4,864 | |||||||||
| Sales and marketing | 31,533 | 27,173 | 25,864 | |||||||||
| General and administrative | 32,512 | 22,104 | 20,096 | |||||||||
| Depreciation and amortization | 22,242 | 15,856 | 14,737 | |||||||||
| Gain on disposals of property and equipment | (5 | ) | (113 | ) | (19 | ) | ||||||
| Restructuring and asset impairment | 11,349 | 323 | 44 | |||||||||
| Acquired in-process research and development | 450 | — | — | |||||||||
| Other | 50 | — | — | |||||||||
| Amortization of deferred stock compensation | — | — | 60 | |||||||||
| Total operating costs and expenses | 243,801 | 179,238 | 158,851 | |||||||||
| (Loss) income from operations | (9,711 | ) | 2,137 | (5,134 | ) | |||||||
| Non-operating (income) expense: | ||||||||||||
| Interest income | (3,228 | ) | (2,305 | ) | (1,284 | ) | ||||||
| Interest expense | 1,111 | 883 | 1,373 | |||||||||
| Write-off of investment | 1,178 | — | — | |||||||||
| Other, net | 2 | (129 | ) | (176 | ) | |||||||
| Total non-operating (income) expense | (937 | ) | (1,551 | ) | (87 | ) | ||||||
| (Loss) income before income taxes and equity in earnings of equity-method investment | (8,774 | ) | 3,688 | (5,047 | ) | |||||||
| (Benefit) provision for income taxes | (3,080 | ) | 145 | — | ||||||||
| Equity in earnings of equity-method investment, net of taxes | (139 | ) | (114 | ) | (83 | ) | ||||||
| Net (loss) income | $ | (5,555 | ) | $ | 3,657 | $ | (4,964 | ) | ||||
| Net (loss) income per share: | ||||||||||||
| Basic | $ | (0.12 | ) | $ | 0.11 | $ | (0.15 | ) | ||||
| Diluted | $ | (0.12 | ) | $ | 0.10 | $ | (0.15 | ) | ||||
| Weighted average shares used in per share calculations: | ||||||||||||
| Basic | 46,942 | 34,748 | 33,939 | |||||||||
| Diluted | 46,942 | 35,739 | 33,939 | |||||||||
The accompanying notes are an integral part of these consolidated financial statements.
F - 3
CONSOLIDATED BALANCE SHEETS
(In thousands, except per share amounts)
| December 31, | ||||||||
| 2007 | 2006 | |||||||
| ASSETS | ||||||||
| Current assets: | ||||||||
| Cash and cash equivalents | $ | 52,030 | $ | 45,591 | ||||
| Short-term investments in marketable securities | 19,569 | 13,291 | ||||||
| Accounts receivable, net of allowance of $5,470 and $888, respectively | 36,429 | 20,282 | ||||||
| Inventory | 304 | 474 | ||||||
| Prepaid expenses and other assets | 8,464 | 3,818 | ||||||
| Deferred tax asset, current portion | 479 | — | ||||||
| Total current assets | 117,275 | 83,456 | ||||||
| Property and equipment, net | 65,491 | 47,493 | ||||||
| Investments | 1,138 | 2,135 | ||||||
| Intangible assets, net | 43,008 | 1,785 | ||||||
| Goodwill | 190,677 | 36,314 | ||||||
| Restricted cash | 4,120 | — | ||||||
| Deferred tax asset, non-current | 3,014 | — | ||||||
| Deposits and other assets | 2,287 | 2,519 | ||||||
| Total assets | $ | 427,010 | $ | 173,702 | ||||
| LIABILITIES AND STOCKHOLDERS’ EQUITY | ||||||||
| Current liabilities: | ||||||||
| Notes payable, current portion | $ | 2,413 | $ | 4,375 | ||||
| Accounts payable | 19,624 | 8,776 | ||||||
| Accrued liabilities | 10,159 | 8,689 | ||||||
| Deferred revenue, current portion | 4,807 | 3,260 | ||||||
| Capital lease obligations, current portion | 805 | 347 | ||||||
| Restructuring liability, current portion | 2,396 | 1,400 | ||||||
| Other current liabilities | 108 | 84 | ||||||
| Total current liabilities | 40,312 | 26,931 | ||||||
| Notes payable, less current portion | 17,354 | 3,281 | ||||||
| Deferred revenue, less current portion | 2,275 | 1,080 | ||||||
| Capital lease obligations, less current portion | 452 | 83 | ||||||
| Restructuring liability, less current portion | 7,697 | 3,384 | ||||||
| Deferred rent | 11,011 | 11,432 | ||||||
| Deferred tax liability | 398 | — | ||||||
| Other long-term liabilities | 878 | 986 | ||||||
| Total liabilities | 80,377 | 47,177 | ||||||
| Commitments and contingencies | ||||||||
| Stockholders’ equity: | ||||||||
| Preferred stock, $0.001 par value, 200,000 shares authorized, no shares issued or outstanding | — | — | ||||||
| Common stock, $0.001 par value, 60,000 shares authorized, 49,759 and 35,873 shares issued and outstanding, respectively | 50 | 36 | ||||||
| Additional paid-in capital | 1,208,191 | 982,624 | ||||||
| Accumulated deficit | (862,010 | ) | (856,455 | ) | ||||
| Accumulated items of other comprehensive income | 402 | 320 | ||||||
| Total stockholders’ equity | 346,633 | 126,525 | ||||||
| Total liabilities and stockholders’ equity | $ | 427,010 | $ | 173,702 | ||||
F - 4
CONSOLIDATED STATEMENTS OF STOCKHOLDERS’ EQUITY AND COMPREHENSIVE (LOSS) INCOME
For the Three Years Ended December 31, 2007
(In thousands)
| Common Stock | ||||||||||||||||||||||||||||||||
| Shares | Par Value | Additional Paid-In Capital | Treasury Stock | Deferred Stock Compensation | Accumulated Deficit | Accumulated Items of Comprehensive Income (Loss) | Total Stockholders’ Equity | |||||||||||||||||||||||||
| Balance, December 31, 2004 | 33,815 | $ | 34 | $ | 968,255 | $ | — | $ | — | $ | (855,148 | ) | $ | 597 | $ | 113,738 | ||||||||||||||||
| Net loss | — | — | — | — | — | (4,964 | ) | — | (4,964 | ) | ||||||||||||||||||||||
| Change in unrealized gains and losses on investments, net of taxes | — | — | — | — | — | — | (118 | ) | (118 | ) | ||||||||||||||||||||||
| Foreign currency translation adjustment | — | — | — | — | — | — | (474 | ) | (474 | ) | ||||||||||||||||||||||
| Total comprehensive loss | (5,556 | ) | ||||||||||||||||||||||||||||||
| Deferred stock compensation grant | — | — | 480 | — | (480 | ) | — | — | — | |||||||||||||||||||||||
| Amortization of deferred stock compensation | — | — | — | — | 60 | — | — | 60 | ||||||||||||||||||||||||
| Stock compensation plans activity | 353 | — | 1,486 | — | — | — | — | 1,486 | ||||||||||||||||||||||||
| Balance, December 31, 2005 | 34,168 | 34 | 970,221 | — | (420 | ) | (860,112 | ) | 5 | 109,728 | ||||||||||||||||||||||
| Net income | — | — | — | — | — | 3,657 | — | 3,657 | ||||||||||||||||||||||||
| Change in unrealized gains and losses on investments, net of taxes | — | — | — | — | — | — | 80 | 80 | ||||||||||||||||||||||||
| Foreign currency translation adjustment | — | — | — | — | — | — | 235 | 235 | ||||||||||||||||||||||||
| Total comprehensive income | 3,972 | |||||||||||||||||||||||||||||||
| Reclassification of deferred stock compensation resulting from implementation of SFAS No. 123R | — | — | (420 | ) | — | 420 | — | — | — | |||||||||||||||||||||||
| Stock-based compensation | 578 | 1 | 5,985 | (395 | ) | — | — | — | 5,591 | |||||||||||||||||||||||
| Stock compensation plans activity | 576 | 1 | 3,030 | 395 | — | — | — | 3,426 | ||||||||||||||||||||||||
| Exercise of warrants | 551 | — | 3,808 | — | — | — | — | 3,808 | ||||||||||||||||||||||||
| Balance, December 31, 2006 | 35,873 | 36 | 982,624 | — | — | (856,455 | ) | 320 | 126,525 | |||||||||||||||||||||||
| Net loss | — | — | — | — | — | (5,555 | ) | — | (5,555 | ) | ||||||||||||||||||||||
| Change in unrealized gains and losses on investments, net of taxes | — | — | — | — | — | — | (25 | ) | (25 | ) | ||||||||||||||||||||||
| Foreign currency translation adjustment | — | — | — | — | — | — | 107 | 107 | ||||||||||||||||||||||||
| Total comprehensive loss | (5,473 | ) | ||||||||||||||||||||||||||||||
| Stock issued in connection with VitalStream acquisition | 12,206 | 12 | 208,281 | — | — | — | — | 208,293 | ||||||||||||||||||||||||
| Stock-based compensation | 420 | 1 | 8,705 | — | — | — | — | 8,706 | ||||||||||||||||||||||||
| Stock compensation plans activity | 1,260 | 1 | 8,581 | — | — | — | — | 8,582 | ||||||||||||||||||||||||
| Balance, December 31, 2007 | 49,759 | $ | 50 | $ | 1,208,191 | $ | — | $ | — | $ | (862,010 | ) | $ | 402 | $ | 346,633 | ||||||||||||||||
See note 2 for information on effect of 10-for-1 reverse stock split in July 2006.
The accompanying notes are an integral part of these consolidated financial statements.
F - 5
CONSOLIDATED STATEMENTS OF CASH FLOWS
(In thousands)
| Year Ended December 31, | ||||||||||||
| 2007 | 2006 | 2005 | ||||||||||
| Cash flows from operating activities: | ||||||||||||
| Net (loss) income | $ | (5,555 | ) | $ | 3,657 | $ | (4,964 | ) | ||||
| Adjustments to reconcile net (loss) income to net cash provided by operating activities: | ||||||||||||
| Depreciation and amortization | 26,407 | 16,372 | 15,314 | |||||||||
| Gain on disposal of property and equipment, net | (5 | ) | (113 | ) | (19 | ) | ||||||
| Asset impairment | 2,454 | 319 | — | |||||||||
| Acquired in-process research and development | 450 | — | — | |||||||||
| Stock-based compensation expense | 8,681 | 5,942 | 75 | |||||||||
| Write-off of investment | 1,178 | — | — | |||||||||
| Equity in earnings from equity-method investment | (139 | ) | (114 | ) | (83 | ) | ||||||
| Provision for doubtful accounts | 2,261 | 548 | 1,431 | |||||||||
| Non-cash changes in deferred rent | (421 | ) | 2,247 | 2,690 | ||||||||
| Lease incentives | — | — | 713 | |||||||||
| Deferred income taxes | (3,095 | ) | — | — | ||||||||
| Other, net | (84 | ) | 212 | (397 | ) | |||||||
| Changes in operating assets and liabilities, excluding effects of acquisition: | ||||||||||||
| Accounts receivable | (15,825 | ) | (1,702 | ) | (3,616 | ) | ||||||
| Inventory, prepaid expenses, deposits and other assets | (2,182 | ) | (1,778 | ) | (170 | ) | ||||||
| Accounts payable | 7,920 | 3,010 | (5,433 | ) | ||||||||
| Accrued and other liabilities | (2,466 | ) | 1,422 | 805 | ||||||||
| Deferred revenue | 2,704 | 1,070 | 1,023 | |||||||||
| Accrued restructuring liability | 5,309 | (1,493 | ) | (1,876 | ) | |||||||
| Net cash flows provided by operating activities | 27,592 | 29,599 | 5,493 | |||||||||
| Cash flows from investing activities: | ||||||||||||
| Purchases of short-term investments in marketable securities | (38,508 | ) | (17,427 | ) | (18,710 | ) | ||||||
| Maturities of short-term investments in marketable securities | 32,395 | 20,277 | 19,350 | |||||||||
| Purchases of property and equipment | (30,271 | ) | (13,382 | ) | (10,161 | ) | ||||||
| Proceeds from disposal of property and equipment | 5 | 133 | 17 | |||||||||
| Cash received from acquisition, net of costs incurred for the transaction | 3,203 | — | — | |||||||||
| Change in restricted cash, excluding effects of acquisition | (3,217 | ) | — | 76 | ||||||||
| Net cash flows used in investing activities | (36,393 | ) | (10,399 | ) | (9,428 | ) | ||||||
F - 6
INTERNAP NETWORK SERVICES CORPORATION AND SUBSIDIARIES
CONSOLIDATED STATEMENTS OF CASH FLOWS (Continued)
(In thousands)
| Year Ended December 31, | ||||||||||||
| 2007 | 2006 | 2005 | ||||||||||
| Cash flows from financing activities: | ||||||||||||
| Proceeds from notes payable, net of discount | 19,742 | — | — | |||||||||
| Principal payments on notes payable | (11,318 | ) | (4,375 | ) | (6,483 | ) | ||||||
| Payments on capital lease obligations | (1,617 | ) | (538 | ) | (512 | ) | ||||||
| Debt issuance costs | (65 | ) | — | — | ||||||||
| Proceeds from exercise of stock options and employee stock purchase plan | 8,582 | 3,031 | 1,471 | |||||||||
| Proceeds from exercise of warrants | — | 3,808 | — | |||||||||
| Other, net | (84 | ) | 31 | 70 | ||||||||
| Net cash flows provided by (used in) financing activities | 15,240 | 1,957 | (5,454 | ) | ||||||||
| Net increase (decrease) in cash and cash equivalents | 6,439 | 21,157 | (9,389 | ) | ||||||||
| Cash and cash equivalents at beginning of period | 45,591 | 24,434 | 33,823 | |||||||||
| Cash and cash equivalents at end of period | $ | 52,030 | $ | 45,591 | $ | 24,434 | ||||||
| Supplemental disclosure of cash flow information: | ||||||||||||
| Common stock issued and stock options assumed for acquisition of VitalStream | $ | 208,293 | $ | — | $ | — | ||||||
| Cash paid for interest, net of amounts capitalized | 1,152 | 793 | 1,223 | |||||||||
| Cash paid for income taxes | 103 | 149 | — | |||||||||
| Non-cash acquisition of property and equipment | 148 | 162 | 971 | |||||||||
| Capitalized stock-based compensation | 25 | 44 | — | |||||||||
The accompanying notes are an integral part of these consolidated financial statements.
F - 7
INTERNAP NETWORK SERVICES CORPORATION AND SUBSIDIARIES
NOTES TO CONSOLIDATED FINANCIAL STATEMENTS
| 1. | DESCRIPTION OF THE COMPANY AND NATURE OF OPERATIONS |
Internap Network Services Corporation (“Internap,” “we,” “us,” “our,” or the “Company”) delivers high performance and reliable Internet solutions through a suite of network optimization and delivery products and services. These solutions, combined with progressive and proactive technical support, enable companies to confidently migrate business-critical applications, including audio and video streaming and monetization services, to the Internet. Our suite of products and services support a broad range of Internet applications. We serve both domestic and international customers in the financial services, healthcare, technology, retail, travel, media/entertainment and other markets. Our product and service offerings are complemented by Internet Protocol, or IP, access solutions such as data center services, content delivery networks, or CDN, and managed security. We deliver services through our 50 service points across North America, Europe and the Asia-Pacific region. Our Private Network Access Points, or P-NAPs, feature multiple direct high-speed connections to major Internet networks including AT&T Inc., Sprint Nextel Corporation, Verizon Communications Inc., Savvis Inc., Global Crossing Limited, and Level 3 Communications, Inc. We operate and manage the Company in three business segments: IP services, data center services and CDN services. Prior to 2007 we operated and managed the Company as a single business segment.
The nature of our business subjects us to certain risks and uncertainties frequently encountered by rapidly evolving markets. These risks include the failure to develop or supply technology or services, the ability to obtain adequate financing, competition within the industry and technology trends.
Although we have been in existence since 1996, we have incurred significant operational restructurings in recent years, which have included substantial changes in our senior management team, streamlining our cost structure, consolidating network access points, terminating certain non-strategic real estate leases and license arrangements. We have a history of quarterly and annual period net losses through the year ended December 31, 2005. For the year ended December 31, 2006 we recognized net income in each quarter. For the year ended December 31, 2007 we recognized a year to date net loss $5.6 million. At December 31, 2007, our accumulated deficit was $862.0 million. We continue to analyze our business to control our costs, principally through making process enhancements and renegotiating network contracts for more favorable pricing and terms.
As discussed in note 18, we revised our quarterly statement of operations for the quarter ended September 30, 2007 to appropriately record (1) $0.5 million for sales adjustments, which reduce net accounts receivable and revenue, and (2) $0.1 million for accretion of interest income that we initially included as unrealized gain in accumulated other comprehensive income within stockholders’ equity.
| 2. | SUMMARY OF SIGNIFICANT ACCOUNTING POLICIES |
Accounting principles
The consolidated financial statements and accompanying notes are prepared in accordance with accounting principles generally accepted in the United States of America. The consolidated financial statements include the accounts of Internap and all majority owned subsidiaries. Significant inter-company transactions have been eliminated in consolidation.
Estimates and assumptions
The preparation of these financial statements requires management to make estimates and judgments that affect the reported amounts of assets, liabilities, revenue and expense, and related disclosure of contingent assets and liabilities. On an ongoing basis, we evaluate our estimates, including those related to revenue recognition, doubtful accounts, cost-basis investments, intangible assets, accruals, stock-based compensation, income taxes, restructuring costs, long-term service contracts, contingencies and litigation. We base our estimates on historical experience and on various other assumptions that are believed to be reasonable under the circumstances, the results of which form the basis for making judgments about the carrying values of assets and liabilities that are not readily apparent from other sources. Actual results may differ materially from these estimates.
F - 8
INTERNAP NETWORK SERVICES CORPORATION AND SUBSIDIARIES
NOTES TO CONSOLIDATED FINANCIAL STATEMENTS (Continued)
Cash and cash equivalents
We consider all highly liquid investments purchased with an original maturity of three months or less at the date of purchase and money market mutual funds to be cash equivalents. We invest our cash and cash equivalents with major financial institutions and may at times exceed federally insured limits. We believe that the risk of loss is minimal. To date, we have not experienced any losses related to cash and cash equivalents.
Restricted cash
Restricted cash represents time deposits used to secure letters of credit on certain of our real estate leases and a capital lease for equipment. The letters of credit for the real estate leases were secured by our former credit agreement and are in the process of being secured under our new credit agreement. The letter of credit securing the capital lease for equipment was assumed in the VitalStream acquisition.
Investments in marketable securities
We account for marketable securities in accordance with Statement of Financial Accounting Standards, or SFAS, No. 115, “Accounting for Certain Investments in Debt and Equity Securities.” Management determines the appropriate classification of marketable securities at the time of purchase. At December 31, 2007 and 2006, all marketable securities are classified as available-for-sale. Available-for-sale securities are carried at fair value, with the unrealized gains and losses reported in other comprehensive income. Our marketable securities are reviewed each reporting period for declines in value that are considered to be other-than-temporary and, if appropriate, written down to their estimated fair value. Any realized gains or losses or declines in value judged to be other-than-temporary on available-for-sale securities are included in other non-operating (income) expense in the consolidated statements of operations. The cost of securities sold is based on the specific identification method. Interest on securities classified as available-for-sale is included in interest income in the consolidated statements of operations.
Other investments
We account for investments without readily determinable fair values at historical cost, as determined by our initial investment. The recorded value of cost basis investments is periodically reviewed to determine the propriety of the recorded basis. When a decline in the value that is judged to be other than temporary has occurred based on available data, the cost basis is reduced and an investment loss is recorded.
We incurred a charge during the three months ended June 30, 2007, totaling $1.2 million, representing the write-off of the remaining carrying value of our investment in series D preferred stock of Aventail Corporation, or Aventail. See note 6 for further discussion of this investment and the recorded loss. As of December 31, 2006, the carrying value of the Aventail investment of $1.2 million was recorded in non-current investments in the accompanying consolidated balance sheet.
We account for investments that provide us with the ability to exercise significant influence, but not control, over an investee using the equity method of accounting. Significant influence, but not control, is generally deemed to exist if we have an ownership interest in the voting stock of the investee of between 20% and 50%, although other factors, such as minority interest protections, are considered in determining whether the equity method of accounting is appropriate. As of December 31, 2007, Internap Japan Co. Ltd., or Internap Japan, our joint venture with NTT-ME Corporation and Nippon Telegraph and Telephone Corporation, or NTT Holdings, qualifies for equity method accounting. We record our proportional share of the income and losses of Internap Japan one month in arrears on the consolidated balance sheets as a component of non-current investments and our share of Internap Japan’s income and losses, net of taxes, as separate caption in our consolidated statement of operations.
Fair value of financial instruments
Our short-term financial instruments, including cash and cash equivalents, accounts receivable, accounts payable, note payable, and capital lease obligations are carried at cost. Our investments in marketable securities are recorded at fair value. Our marketable securities are designated as available for sale with changes in fair value reflected in other comprehensive income. The carrying value of our long-term financial instruments, including note payable and capital lease obligations, approximate fair value as the interest rates approximate current market rates of similar debt obligations.
F - 9
INTERNAP NETWORK SERVICES CORPORATION AND SUBSIDIARIES
NOTES TO CONSOLIDATED FINANCIAL STATEMENTS (Continued)
Financial instrument credit risk
Financial instruments that potentially subject us to a concentration of credit risk principally consist of cash, cash equivalents, marketable securities and trade receivables. We currently invest the majority of our cash and cash equivalents in money market funds and maintain them with financial institutions with high credit ratings. We also invest in high credit quality corporate debt securities, auction rate securities whose underlying assets are state-issued student and educational loans which are substantially backed by the federal government, commercial paper, and U.S. Government Agency debt securities pursuant to a formal investment policy. As of December 31, 2007, we have a total of $7.2 million invested in auction rate securities. Uncertainties in the credit markets may affect the liquidity of our holdings in auction rate securities. We did not experience any unsuccessful auction rate resets during the year ended or on the initial rate resets immediately following December 31, 2007, however we have experienced failures on each of our subsequent auction rate resets. Nevertheless, we continue to receive interest every 28-35 days. While our investments are of high credit quality, at this time we are uncertain as to whether or when the liquidity issues relating to these investments will worsen or improve. We do not believe that it is necessary at this time to adjust the fair value of our portfolio of auction rate securities. We also perform periodic evaluations of the relative credit ratings of the financial institutions with whom we invest as part of our cash management process. We have not experienced any credit losses on our cash, cash equivalents or marketable securities.
Inventory
Inventory is carried at the lower of cost or market using the first-in, first-out method. Cost includes materials related to the assembly of our Flow Control Platform, or FCP solutions.
Property and equipment
Property and equipment are carried at original acquisition cost less accumulated depreciation and amortization. Depreciation and amortization are calculated on a straight-line basis over the lesser of the estimated useful lives of the assets or the lease term. Estimated useful lives used for network equipment are generally three years; furniture, equipment and software are three to seven years; and leasehold improvements are seven years or over the lease term, depending on the nature of the improvement, but in no event beyond the expected lease term. The duration of lease obligations and commitments range from 24 months for certain networking equipment to 240 months for certain facility leases. Additions and improvements that increase the value or extend the life of an asset are capitalized. Maintenance and repairs are expensed as incurred. Gains or losses from disposals of property and equipment are charged to operations.
Leases and leasehold improvements
We record leases as capital or operating leases and account for leasehold improvements in accordance with SFAS No. 13, “Accounting for Leases” and related literature. Rent expense for operating leases is recorded in accordance with Financial Accounting Standards Board, or FASB, Technical Bulletin, or FTB, No. 88-1, “Issues Relating to Accounting for Leases.” This FTB requires lease agreements that include periods of free rent or other incentives, specific escalating lease payments, or both, to be recorded on a straight-line or other systematic basis over the initial lease term and those renewal periods that are reasonably assured. The difference between rent expense and rent paid is recorded as deferred rent in non-current liabilities in the consolidated balance sheets.
F - 10
INTERNAP NETWORK SERVICES CORPORATION AND SUBSIDIARIES
NOTES TO CONSOLIDATED FINANCIAL STATEMENTS (Continued)
Costs of computer software development
In accordance with the American Institute of Certified Public Accountants’ Statement of Position 98-1, “Accounting for the Costs of Computer Software Developed or Obtained for Internal Use,” we capitalize certain direct costs incurred developing internal use software. We capitalized $1.6 million and $0.9 million in internal software development costs for the years ended December 31, 2007 and 2006, respectively. We did not capitalize any costs during the year ended December 31, 2005. During the year ended December 31, 2007, we impaired $1.1 million of software development costs capitalized prior to December 31, 2005 related to the implementation of a billing and order entry system initiated during 2004. Subsequent to our acquisition of VitalStream, we determined that we would utilize our legacy billing system and abandon the former project because (1) the developer of our financial software purchased the developer of our legacy billing system, and (2) the legacy billing system would be more flexible in integrating the VitalStream business. During the year ended December 31, 2006, we impaired $0.3 million of software development costs capitalized prior to December 31, 2005 related to the implementation of our financial system software also initiated during 2004. Amortization expense on internally developed software commences when the software project is ready for its intended use.
As of December 31, 2007 and 2006, the balance of unamortized software costs was $2.7 million and $2.5 million, respectively, and for the year ended December 31, 2007, amortization expense was $0.2 million. The software was not ready for its intended use and had not been placed in service as of December 31, 2006; therefore, no amortization expense was recorded for the years ended December 31, 2006 or 2005.
For the year ended December 31, 2005 we capitalized $0.5 million of costs for internally developed software in accordance with SFAS No. 86, “Accounting for the Costs of Computer Software to Be Sold, Leased or Otherwise Marketed.” No amounts were capitalized for the years ended December 31, 2007 or 2006. As of December 31, 2007 and 2006, the balance of unamortized software costs was $0.1 million and $0.2 million, respectively. Amortization expense was $0.2 million, $0.2 million, and $0.4 million for the years ended December 31, 2007, 2006, and 2005, respectively.
Goodwill and other intangible assets
In accordance with SFAS No. 142 "Goodwill and Other Intangible Assets," we review our goodwill for impairment annually, or more frequently, if facts and circumstances warrant a review. The provisions of SFAS No. 142 require that a two-step test be performed to assess goodwill for impairment. First, the fair value of each reporting unit is compared to its carrying value. If the fair value exceeds the carrying value, goodwill is not impaired and no further testing is performed. The second step is performed if the carrying value exceeds the fair value. The implied fair value of the reporting unit's goodwill must be determined and compared to the carrying value of the goodwill. If the carrying value of a reporting unit's goodwill exceeds its implied fair value, an impairment loss equal to the difference will be recorded. We completed our annual goodwill impairment test as of August 1, 2007 and determined that the carrying amount of goodwill was not impaired.
Other acquired intangible assets, including developed technologies and patents, have finite lives and we have recorded these assets at cost less accumulated amortization. Amortization is calculated on a straight-line basis over the estimated economic useful life of the assets, which are three to seven years for developed technologies and fifteen years for patents.
Valuation of long-lived assets
Management periodically evaluates the carrying value of its long-lived assets, including, but not limited to, property and equipment pursuant to the guidance provided by SFAS No. 144, “Accounting for the Impairment and Disposal of Long-Lived Assets.” The carrying value of a long-lived asset is considered impaired when the undiscounted cash flows from such asset is separately identifiable and is estimated to be less than its carrying value. In that event, a loss is recognized based on the amount by which the carrying value exceeds the fair value of the long-lived asset. Fair value is determined primarily using the anticipated cash flows discounted at a rate commensurate with the risk involved. Losses on long-lived assets to be disposed of would be determined in a similar manner, except that fair values would be reduced by the cost of disposal. Losses due to impairment of long-lived assets are charged to operations during the period in which the impairment is identified.
F - 11
INTERNAP NETWORK SERVICES CORPORATION AND SUBSIDIARIES
NOTES TO CONSOLIDATED FINANCIAL STATEMENTS (Continued)
Accruals for disputed telecommunication costs
In delivering our services, we rely on a number of Internet network, telecommunication and other vendors. We work directly with these vendors to provision services such as establishing, modifying or discontinuing services for our customers. Because of the volume of activity, billing disputes inevitably arise. These disputes typically stem from disagreements concerning the starting and ending dates of service, quoted rates, usage, and various other factors. For potential billing errors made in the vendor’s favor, for example a duplicate billing, we initiate a formal dispute with the vendor and record the related cost and liability on a range of 5% to 100% of the disputed amount, depending on our assessment of the likely outcome of the dispute. Conversely, for billing errors in our favor, such as the vendor’s failure to invoice us for new service, we record an estimate for the related cost and liability based on the full amount that we should have been invoiced. Disputed costs, both in the vendors’ favor and our favor, are researched and discussed with vendors on an ongoing basis until ultimately resolved. Estimates are periodically reviewed by management and modified in light of new information or developments, if any. Conversely, any resolved disputes that will result in a credit over the disputed amounts are recognized in the appropriate month when the resolution has been determined. Because estimates regarding disputed costs include assessments of uncertain outcomes, such estimates are inherently vulnerable to changes due to unforeseen circumstances that could materially and adversely affect our consolidated financial condition, results of operations and cash flows.
Accrued liabilities
Similar to accruals for disputed telecommunications costs above, it is necessary for us to estimate other significant costs such as utilities and sales, use, telecommunications, and other taxes. These estimates are often necessary either because invoices for services are not received on a timely basis from our vendors or by virtue of the complexity surrounding the costs. In every instance in which an estimate is necessary, we record the related cost and liability based on all available facts and circumstances, including but not limited to historical trends, related usage, forecasts, and quotes. Management periodically reviews and modifies estimates in light of new information or developments, if any. Because estimates regarding accrued liabilities include assessments of uncertain outcomes, such estimates are inherently vulnerable to changes due to unforeseen circumstances that could materially and adversely affect our results of operations and cash flows.
Restructuring liability
When circumstances warrant, we may elect to exit certain business activities or change the manner in which we conduct ongoing operations. When we make such a change, management will estimate the costs to exit a business or restructure ongoing operations. The components of the estimates may include estimates and assumptions regarding the timing and costs of future events and activities that represent management's best expectations based on known facts and circumstances at the time of estimation. Management periodically reviews its restructuring estimates and assumptions relative to new information, if any, of which it becomes aware. Should circumstances warrant, management will adjust its previous estimates to reflect what it then believes to be a more accurate representation of expected future costs. Because management's estimates and assumptions regarding restructuring costs include probabilities of future events, such estimates are inherently vulnerable to changes due to unforeseen circumstances, changes in market conditions, regulatory changes, changes in existing business practices, and other circumstances that could materially and adversely affect our results of operations.
Taxes
We account for income taxes under the liability method. Deferred tax assets and liabilities are determined based on differences between financial reporting and tax bases of assets and liabilities, and are measured using the enacted tax rates and laws that will be in effect when the differences are expected to reverse. We provide a valuation allowance to reduce our deferred tax assets to their estimated realizable value.
F - 12
INTERNAP NETWORK SERVICES CORPORATION AND SUBSIDIARIES
NOTES TO CONSOLIDATED FINANCIAL STATEMENTS (Continued)
In June 2006, the FASB issued FASB Interpretation No. 48, “Accounting for Uncertainty in Income Taxes—an interpretation of FASB Statement No. 109,” or FIN 48. FIN 48 clarifies the accounting for uncertainty in income taxes recognized under SFAS No.109, “Accounting for Income Taxes .” FIN 48 prescribes a recognition threshold and measurement attribute for financial statement recognition and measurement of a tax position taken or expected to be taken in a tax return and also provides guidance on various related matters such as derecognition, interest and penalties, and disclosure. We adopted FIN 48 on January 1, 2007. As of January 1, 2007, no material tax benefit existed for uncertain tax positions. During 2007, as discussed in Note 12, we recognized a FIN 48 liability of $0.9 million that was netted on the balance sheet with U.K. deferred tax assets.
We classify interest and penalties arising from the underpayment of income taxes in the statement of operations under general and administrative expenses. As of December 31, 2007, we have no accrued interest or penalties related to uncertain tax positions, as a result of substantial U.K. net operating loss carryforwards.
We account for telecommunication, sales and other similar taxes on a net basis in general and administrative expense.
Stock-based compensation
Effective January 1, 2006, we adopted SFAS No. 123 (revised 2004), “Share-Based Payment,” or SFAS No. 123R, and related interpretations. SFAS No. 123R establishes the accounting for equity instruments exchanged for employee services. Under SFAS No. 123R, share-based compensation cost is measured at the grant date based on the calculated fair value of the award. The expense is recognized over the employees’ requisite service period, generally the vesting period of the award. Prior to the adoption of SFAS No. 123R on January 1, 2006, we accounted for stock-based compensation plans under the recognition and measurement provisions of Accounting Principles Board (APB) Opinion No. 25, “Accounting for Stock Issued to Employees” and related interpretations. We also provided disclosures in accordance with SFAS No. 123, “Accounting for Stock-Based Compensation,” as amended by SFAS No. 148, “Accounting for Stock-Based Compensation—Transition and Disclosures—an Amendment of FASB Statement No. 123.” Accordingly, no expense was recognized for options to purchase our common stock that were granted with an exercise price equal to fair market value at the date of grant and no expense was recognized in connection with purchases under our employee stock purchase plans for any periods prior to January 1, 2006.
We elected to adopt SFAS No. 123R using the modified prospective application method. Under this method, compensation cost recognized during the period includes: ( 1) compensation cost for all share-based payments granted prior to, but not yet vested as of January 1, 2006, based on the grant date fair value estimated in accordance with the original provisions of SFAS No. 123 amortized over the awards’ vesting period, and ( 2) compensation cost for all share-based payments granted subsequent to January 1, 2006, based on the grant-date fair value estimated in accordance with the provisions of SFAS No. 123R amortized on a straight-line basis over the awards’ vesting period. The fair value of stock options is estimated at the date of grant using the Black-Scholes option pricing model with weighted average assumptions for the activity under our stock plans. Option pricing model input assumptions such as expected term, expected volatility, and risk-free interest rate, impact the fair value estimate. Further, the forfeiture rate impacts the amount of aggregate compensation. These assumptions are subjective and generally require significant analysis and judgment to develop.
On November 10, 2005, the FASB issued FASB Staff Position No. FAS 123R-3, “Transition Election Related to Accounting for Tax Effects of Share-Based Payment Awards,” that allows for a “short-cut” method to establish the beginning balance of the additional paid-in capital, or APIC, pool related to the tax effects of employee stock-based compensation, and to determine the subsequent impact on the APIC pool and consolidated statements of cash flows of the tax effects of employee stock-based compensation awards that are outstanding upon adoption of SFAS No. 123R. In 2006, we adopted the alternative transition method provided in the FASB Staff Position for calculating the tax effects of stock-based compensation pursuant to SFAS No. 123R. The adoption did not have a material impact on our results of operations and financial condition.
SFAS No. 123R does not allow the recognition of a deferred tax asset for unrealized tax benefits associated with the tax deductions in excess of the compensation recorded (excess tax benefit). At adoption of SFAS No. 123R on January 1, 2006, we elected to utilize the “with and without” approach for utilization of tax attributes upon realization of net operating losses in the future. This method allocates stock compensation benefits last among other tax benefits recognized. In addition, we elected to adopt the “direct only” method of calculating the amount of windfalls or shortfalls.
F - 13
INTERNAP NETWORK SERVICES CORPORATION AND SUBSIDIARIES
NOTES TO CONSOLIDATED FINANCIAL STATEMENTS (Continued)
Treasury stock
As permitted by our stock-based compensation plans, we may, from time to time, acquire shares of treasury stock as payment of taxes due from employees for stock-based compensation. During 2006, shares of treasury stock were acquired as payment of taxes and subsequently reissued as part of our stock-based compensation plans. When shares are reissued, we use the weighted average cost method for determining cost. The difference between the cost of the shares and the issuance price is added or deducted from additional contributed capital.
Reverse stock split
On July 10, 2006, we implemented a one-for-ten reverse stock split on our common stock and amended our Certificate of Incorporation to reduce our authorized shares from 600 million to 60 million. We began trading on a post reverse split basis on July 11, 2006. All share and per share information herein (including shares outstanding, earnings per share and warrant and stock option data) have been retroactively adjusted for all periods presented to reflect this reverse split.
Revenue recognition and concentration of credit risk
The majority of our revenue is derived from high performance IP services, related data center services, CDN services, and other ancillary products and services throughout the United States. Our IP services revenue is derived from the sale of high performance Internet connectivity services at fixed rates or usage-based pricing to our customers that desire a DS-3 or faster connection. Slower T-1 and fractional DS-3 connections are provided at fixed rates. Data center revenue includes both physical space for hosting customers’ network and other equipment plus associated services such as redundant power and network connectivity, environmental controls and security. Data center revenue is based on occupied square feet and both allocated and variable-based usage. CDN revenue includes three components, none of which are sold separately: (1) data storage; (2) streaming/delivery and (3) a user interface/reporting tool. We provide the CDN service components via internally developed and acquired technology that resides on our network. CDN revenue is based on either fixed rates or usage-based pricing. All of the foregoing revenue arrangements have contractual terms and in many instances, include minimum usage commitments. Other ancillary products and services include our Flow Control Platform, or FCP, product, server management and installation, virtual private networking, managed security, data backup, remote storage and restoration.
We recognize revenue in accordance with the Securities and Exchange Commission’s Staff Accounting Bulletin No. 104, Revenue Recognition, or SAB No. 104, and the Financial Accounting Standards Board’s, or FASB, Emerging Issues Task Force Issue No. 00-21, Revenue Arrangements with Multiple Deliverables, or EITF No. 00-21. Revenue is recognized when persuasive evidence of an arrangement exists, the product or service has been delivered, the fees are fixed or determinable and collectibility is probable. For most of our IP, data center and CDN revenue, services are delivered ratably over the contract term. Contracts and sales or purchase orders are used to determine the existence of an arrangement. We test for availability or connectivity to verify delivery of our services. We assess whether the fee is fixed or determinable based on the payment terms associated with the transaction and whether the sales price is subject to refund or adjustment. Because the software component of our FCP is more than incidental to the product as a whole, we recognize associated FCP revenue in accordance with the American Institute of Certified Public Accountants’ (AICPA) Statement of Position 97-2, Software Revenue Recognition, or SOP 97-2.
We derive revenue from the sale of IP services, data center services and CDN services to customers under contracts that generally commit the customer to a minimum monthly level of usage on a calendar month basis and provide the rate at which the customer must pay for actual usage above the monthly minimum. For these services, we recognize the monthly minimum as revenue each month provided that an enforceable contract has been signed by both parties, the service has been delivered to the customer, the fee for the service is fixed or determinable and collection is reasonably assured. Should a customer’s usage of our services exceed the monthly minimum, we recognize revenue for such excess in the period of the usage. We record the installation fees as deferred revenue and recognize as revenue ratably over the estimated life of the customer arrangement. We also derive revenue from services sold as discrete, non-recurring events or based solely on usage. For these services, we recognize revenue after both parties have signed an enforceable contract, the fee is fixed or determinable, the event or usage has occurred and collection is reasonably assured.
F - 14
INTERNAP NETWORK SERVICES CORPORATION AND SUBSIDIARIES
NOTES TO CONSOLIDATED FINANCIAL STATEMENTS (Continued)
We also enter into multiple-element arrangements or bundled services, such as combining IP services with data center and (or) CDN services. When we enter into such arrangements, we account for each element separately over its respective service period or at the time of delivery, provided that there is objective evidence of fair value for the separate elements. Objective evidence of fair value includes the price charged for the element when sold separately. If we cannot objectively determine the fair value of each element, we recognize the total value of the arrangement ratably over the entire service period to the extent that we have begun to provide the services, and other revenue recognition criteria have been satisfied.
Deferred revenue consists of revenue for services to be delivered in the future and consist primarily of advance billings, which are amortized over the respective service period. Revenue associated with billings for installation of customer network equipment are deferred and amortized over the estimated life of the customer relationship, which was two to three years during the three year period ended December 31, 2007. Revenue for installation services is deferred and amortized because the installation service is integral to our primary service offering and does not have value to customers on a stand-alone basis. Deferred post-contract customer support associated with sales of our FCP solution and similar products are amortized ratably over the contract period, which is generally one year.
We routinely review the creditworthiness and payment status of our customers. If we determine that collection of service revenue is uncertain, we do not recognize revenue until collection is probable. Additionally, we maintain allowances for doubtful accounts resulting from the inability of our customers to make required payments on accounts receivable. The allowance for doubtful accounts is based upon specific and general customer information, which also includes estimates based on management's best understanding of our customers' ability to pay and their payment status. Customers' ability to pay takes into consideration payment history, legal status (i.e., bankruptcy), and the status of services we are providing. We assess the payment status of customers by reference to the terms under which services or goods are provided with any payments not made on or before their due date considered past-due. Once all collection efforts have been exhausted, we write the uncollectible balance off against the allowance for doubtful accounts.
We record an amount for sales adjustments, which reduces net accounts receivable and revenue. The amount for sales adjustments is based upon specific customer information, including outstanding promotional credits, customer disputes, credit adjustments not yet processed through the billing system and historical activity. If the financial condition of our customers were to deteriorate, or management becomes aware of new information impacting a customer's credit risk, additional adjustments may be required.
Research and product development costs
Product development costs are primarily related to network engineering costs associated with changes to the functionality of our proprietary services and network architecture. Such costs that do not qualify for capitalization as software development costs are expensed as incurred. Research and development costs, which are included in product development cost and are expensed as incurred, primarily consist of compensation related to our development and enhancement of IP routing technology, progressive download and streaming technology for our CDN, and acceleration technologies. Research and development costs were $3.1 million, $2.4 million and $2.9 million for the years ended December 31, 2007, 2006, and 2005, respectively.
Advertising costs
We expense all advertising costs as incurred. Advertising costs for the years ended December 31, 2007, 2006 and 2005 were $1.2 million, $1.3 million and $0.2 million, respectively.
F - 15
INTERNAP NETWORK SERVICES CORPORATION AND SUBSIDIARIES
NOTES TO CONSOLIDATED FINANCIAL STATEMENTS (Continued)
Net (loss) income per share
Basic and diluted net (loss) income per share has been computed using the weighted average number of shares of common stock outstanding during the period. Diluted net (loss) income per share is computed using the weighted average number of common and potentially dilutive shares outstanding during the period. Potentially dilutive shares consist of the incremental common shares issuable upon the exercise of outstanding stock options and warrants and unvested restricted stock using the treasury stock method. The treasury stock method calculates the dilutive effect for only those stock options and warrants for which the sum of proceeds, including unrecognized compensation and windfall tax benefits, if any, is less than the average stock price during the period presented. Potentially dilutive shares are excluded from the computation of net (loss) income per share if their effect is anti-dilutive.
| Year Ended December 31, | ||||||||||||
| 2007 | 2006 | 2005 | ||||||||||
| Net (loss) income | $ | ( 5,555 | ) | $ | 3,657 | $ | (4,964 | ) | ||||
| Weighted average shares outstanding, basic | 46,942 | 34,748 | 33,939 | |||||||||
| Effect of dilutive securities: | ||||||||||||
| Stock compensation plans | — | 984 | — | |||||||||
| Warrants | — | 7 | — | |||||||||
| Weighted average shares outstanding, diluted | 46,942 | 35,739 | 33,939 | |||||||||
| Net (loss) income per share: | ||||||||||||
| Basic | $ | ( 0.12 | ) | $ | 0.11 | $ | (0.15 | ) | ||||
| Diluted | $ | ( 0.12 | ) | $ | 0.10 | $ | (0.15 | ) | ||||
| Anti-dilutive securities not included in diluted net (loss) income per share calculation: | ||||||||||||
| Stock compensation plans | 3,860 | 1,408 | 3,656 | |||||||||
| Warrants to purchase common stock | 34 | — | 1,500 | |||||||||
| 3,894 | 1,408 | 5,156 | ||||||||||
F - 16
INTERNAP NETWORK SERVICES CORPORATION AND SUBSIDIARIES
NOTES TO CONSOLIDATED FINANCIAL STATEMENTS (Continued)
Reclassifications
Prior to 2007, “Direct costs of amortization of acquired technologies” were included in the caption “Direct costs of network, sales and services, exclusive of depreciation and amortization.” In 2007 we reclassified these costs to a separate caption in the accompanying Consolidated Statements of Operations with the following effect (in thousands):
| Year Ended December 31, | ||||||||
| 2006 | 2005 | |||||||
| Direct costs of network, sales and services, exclusive of depreciation and amortization show below: | ||||||||
| Previously reported | $ | 97,854 | 82,535 | |||||
| Reclassification | (516 | ) | (577 | ) | ||||
| As reclassified | $ | 97,338 | $ | 81,958 | ||||
| A reconciliation of total direct costs of network, sales and services, exclusive of depreciation and amortization to the accompanying consolidated statements of operations is shown below (in thousands): | ||||||||
| Year Ended December 31, | ||||||||
| 2006 | 2005 | |||||||
| IP services | $ | 39,744 | $ | 38,377 | ||||
| Data center services | 46,474 | 35,244 | ||||||
| Other | 11,120 | 8,337 | ||||||
| Total | $ | 97,338 | $ | 81,958 | ||||
Segment information
We use the management approach for determining which, if any, of our services and products, locations, customers or management structures constitute a reportable business segment. The management approach designates the internal organization that is used by management for making operating decisions and assessing performance as the source of any reportable segments. As a result of our acquisition of VitalStream Holdings, Inc., as discussed in note 3, and the information presented to executive management, we classified our operations into three reportable business segments: IP services, data center services and CDN services. In accordance with SFAS No. 131, “Disclosures about Segments of an Enterprise and Related Information,” we have presented the corresponding items of segment information for the years ended December 31, 2006 and 2005.
Recent accounting pronouncements
In September 2006, the FASB issued SFAS No. 157, “Fair Value Measurements.” SFAS No. 157 defines fair value, establishes a framework for measuring fair value under GAAP, and expands disclosures about fair value measurements. SFAS No. 157 is effective for fiscal years beginning after December 15, 2007. In February 2008, the FASB issued Staff Position, or FSP, FAS 157-1, which provides supplemental guidance on the application of SFAS No. 157, and FSP FAS 157-2, which delays the effective date of SFAS No. 157 for nonfinancial assets and nonfinancial liabilities. We are currently in the process of evaluating the impact that the adoption of SFAS No. 157 will have on our financial position, results of operations and cash flows.
In February 2007, the FASB issued SFAS No. 159, “The Fair Value Option for Financial Assets and Financial Liabilities.” SFAS No. 159 permits companies to choose to measure, on an instrument-by-instrument basis, many financial instruments and certain other assets and liabilities at fair value that are not currently required to be measured at fair value. SFAS No. 159 is effective as of the beginning of a fiscal year that begins after November 15, 2007. While we will not elect to adopt fair value accounting to any assets or liabilities allowed by SFAS No. 159, we are currently in the process of evaluating SFAS No. 159 and its potential impact to us.
In December 2007, the FASB issued SFAS No. 141 (revised 2007), “Business Combinations,” or SFAS No. 141R. SFAS No. 141R replaces SFAS No. 141, “Business Combinations.” SFAS No. 141R establishes principles and requirements for how an acquirer recognizes and measures in its financial statements the identifiable assets acquired, the liabilities assumed, any noncontrolling interest in the acquiree and the goodwill acquired or a gain from a bargain purchase. SFAS No. 141R also determines disclosure requirements to enable the evaluation of the nature and financial effects of the business combination. SFAS No. 141R applies prospectively to business combinations for which the acquisition date is on or after the beginning of a fiscal year that begins on or after December 15, 2008 and there are also implications for acquisitions that occur prior to this date. We are currently in the process of evaluating the impact that the adoption of SFAS No. 141R will have on our financial position, results of operations and cash flows.
F - 17
INTERNAP NETWORK SERVICES CORPORATION AND SUBSIDIARIES
NOTES TO CONSOLIDATED FINANCIAL STATEMENTS (Continued)
In December 2007, the FASB issued SFAS No. 160, “Noncontrolling Interests in Consolidated Financial Statements.” SFAS No. 160 amends Accounting Research Bulletin 51, “Consolidated Financial Statements”, or ARB 51, and requires all entities to report noncontrolling (minority) interests in subsidiaries within equity in the consolidated financial statements, but separate from the parent shareholders’ equity. SFAS No. 160 also requires any acquisitions or dispositions of noncontrolling interests that do not result in a change of control to be accounted for as equity transactions. Further, SFAS No. 160 requires that a parent recognize a gain or loss in net income when a subsidiary is deconsolidated. SFAS No. 160 is effective for fiscal years beginning on or after December 15, 2008. We do not expect the adoption of SFAS No. 160 will have a significant, if any, impact on our financial position, results of operations and cash flows.
| 3. | BUSINESS COMBINATION |
On February 20, 2007, we completed the previously announced acquisition of VitalStream Holdings, Inc., or VitalStream, for approximately $214.0 million, whereby VitalStream became a wholly owned subsidiary of Internap. VitalStream provides products and services for storing and delivering digital media to large audiences over the Internet and advertisement insertion and related advertising services to companies that stream digital media over the Internet. VitalStream also enhances our position as a leading provider of high performance route control products and services by adding complementary service offerings in the rapidly growing content delivery and on-line advertising markets. Integrating VitalStream's digital media delivery platform into our portfolio of products and services enables us to provide customers with one of the most complete product lines in content delivery solutions, content monetization and on-line advertising, while supporting the significant long-term growth opportunities in the network services market. We accounted for the transaction using the purchase method of accounting in accordance with SFAS No. 141, “Business Combinations.” Our results of operations include the activities of VitalStream from February 21, 2007 through December 31, 2007.
Purchase Price
Assets acquired and liabilities assumed were recorded at their fair values as of February 20, 2007. The total $214.0 million purchase price is comprised of the following (in thousands):
| Value of Internap stock issued | $ | 197,272 | ||
| Fair value of stock options assumed | 11,021 | |||
| Direct transaction costs | 5,729 | |||
| Total purchase price | $ | 214,022 | ||
As a result of the acquisition, we issued approximately 12.2 million shares of Internap common stock based on an exchange ratio of 0.5132 shares of Internap common stock for each outstanding share of VitalStream common stock as of February 20, 2007. This fixed exchange ratio gave effect to the one-for-ten reverse stock split by Internap implemented on July 11, 2006 and the one-for-four reverse stock split by VitalStream implemented on April 4, 2006. The average market price per share of Internap common stock of $16.16 was based on an average of the closing prices for a range of trading days from October 10, 2006 through October 16, 2006, which range spanned the announcement date of the transaction on October 12, 2006.
Under the terms of the merger agreement, each VitalStream stock option that was outstanding and unexercised was converted into an option to purchase Internap common stock and we assumed that stock option in accordance with the terms of the applicable VitalStream stock option plan and terms of the stock option agreement. Based on VitalStream's stock options outstanding at February 20, 2007, we converted options to purchase approximately 3.0 million shares of VitalStream common stock into options to purchase approximately 1.5 million shares of Internap common stock.
F - 18
INTERNAP NETWORK SERVICES CORPORATION AND SUBSIDIARIES
NOTES TO CONSOLIDATED FINANCIAL STATEMENTS (Continued)
Purchase Price Allocation
Under the purchase method of accounting, we allocated the total estimated purchase price to VitalStream's net tangible and intangible assets based on their estimated fair values as of February 20, 2007. We recorded the excess purchase price over the value of the net tangible and identifiable intangible assets as goodwill. We determined the fair value assigned to identifiable intangible assets acquired using the income approach, which discounts expected future cash flows to present value using estimates and assumptions determined by management. The allocation of the purchase price and the estimated useful lives are as follows (dollars in thousands):
| Estimated | |||||
| Amount | Useful Life | ||||
| Net tangible assets | $ | 12,286 | — | ||
| Identifiable intangible assets: | |||||
| Developed technologies | 36,000 | 8 years | |||
| Customer relationships | 9,000 | 9 years | |||
| Trade name and other | 1,500 | 3-6 years | |||
| Acquired in-process research and development | 450 | — | |||
Goodwill (1) | 154,786 | — | |||
| Total estimated purchase price | $ | 214,022 | |||
(1) Subsequent to the finalization of the purchase price allocation, we recorded a net increase of $0.1 million to goodwill as a result of adjustments to certain pre-acquisition assets and liabilities and decrease of $0.4 million as a result of the utilization of a portion of VitalStream’s net operating loss carryforwards.
Net tangible assets. We recorded VitalStream's tangible assets and liabilities as of February 20, 2007 at their fair value. Net tangible assets included restricted and unrestricted cash of $9.8 million, accounts receivable of $3.2 million, property and equipment of $11.2 million, other assets of $2.2 million, loan and security agreement (including both term loans and an outstanding line of credit) and capital lease obligations of $6.1 million, and accounts payable and other liabilities of $8.0 million. Subsequent to the acquisition of VitalStream, we paid off the term loans and line of credit assumed in the VitalStream acquisition.
Identifiable intangible assets. Developed technologies relate to VitalStream products that have reached technological feasibility and include processes and trade secrets acquired or developed through design and development of their products. Customer relationships represent contracts with existing customers. Trade name primarily relates to the VitalStream and other product names. We valued each of the identifiable intangible assets using various forms of the income approach, detailed financial projections and various assumptions, including, among others, the evolution of the existing technology platforms to future technology, expected net cash flows, customer attrition rates, tax rates, and discount rates. Amortization of identifiable intangibles is on a straight-line basis over their respective useful lives.
In-process research and development. As of the closing date, one project was in development that has not reached technological feasibility and therefore qualifies as in-process research and development. The amount allocated to in-process research and development was charged to the statement of operations as of the date of acquisition.
Goodwill. Goodwill is the residual of the excess of fair value over the book value of the acquired entity's net assets at the date of acquisition. We note that under SFAS No. 141, an assembled workforce shall not be recognized apart from goodwill and therefore is embedded in goodwill. Part of the acquisition included an assembled workforce that is included as a component of goodwill. Another component of goodwill is the estimated fair value of the expected synergies and other benefits from combining ours and VitalStream’s net assets and businesses. Our expected synergies are significant in this acquisition, including synergies in the sales channel, our network costs, general and administrative costs, and capital expenditures. We allocated approximately $154.8 million to goodwill for the CDN services segment. In accordance with SFAS No. 142, we will not amortize goodwill but instead will test it for impairment at least annually, or more frequently if certain indicators are present. A total of $18.3 million of goodwill will be deductible for tax purposes.
F - 19
INTERNAP NETWORK SERVICES CORPORATION AND SUBSIDIARIES
NOTES TO CONSOLIDATED FINANCIAL STATEMENTS (Continued)
Pro Forma Results (Unaudited)
VitalStream provides products and services for storing and delivering digital media to large audiences over the Internet and ad insertion and related advertising services to companies that stream digital media over the Internet. VitalStream also enhances our position as a leading provider of high performance route control products and services by adding complementary service offerings in the rapidly growing content delivery and on-line advertising markets. Integrating VitalStream's digital media delivery platform into our portfolio of products and services enables us to provide customers with one of the most complete product lines in content delivery solutions, content monetization and on-line advertising, while supporting the significant long-term growth opportunities in the network services market.
The following unaudited pro forma consolidated financial information reflects the results of our operations for the year ended December 31, 2007 and 2006, as if the acquisition of VitalStream had occurred at the beginning of each period. Prior to the acquisition, VitalStream was a customer of ours, and for the years ended December 31, 2007 and 2006 we recognized revenues of $0.4 million and $0.2 million, respectively, from VitalStream which has been excluded from pro forma revenues below. The related receivables were settled in the normal course of business. The pro forma results presented below are not necessarily indicative of what our operating results would have been had the acquisition actually taken place at the beginning of each period (in thousands, except per share amounts):
| Year Ended December 31, | ||||||||
| 2007 | 2006 | |||||||
Pro forma revenues | $ | 236,418 | $ | 205,052 | ||||
| Pro forma net loss | ( 14,269 | ) | (16,153 | ) | ||||
| Pro forma net loss per share, basic and diluted | ( 0.25 | ) | (0.34 | ) | ||||
| 4. | ASSET IMPAIRMENT AND RESTRUCTURING COSTS |
During the three months ended March 31, 2007, we incurred a restructuring and impairment charge of $10.3 million. The charge was the result of a review of our business, particularly in light of our acquisition of VitalStream and our plan to finalize the overall integration and implementation plan before the end of the first quarter. The charge to expense included $7.8 million for leased facilities, representing both the costs less anticipated sublease recoveries that will continue to be incurred without economic benefit to us and costs to terminate leases before the end of their term. The charge also included severance payments of $1.1 million for the termination of certain employees and $1.4 million for impairment of assets. Net related expenditures were estimated to be $10.7 million, of which $2.8 million has been paid during the year ended December 31, 2007, and the balance continuing through December 2016, the last date of the longest lease term. These expenditures are expected to be paid out of operating cash flows. The impairment charge of $1.3 million is related to the leases referenced above and less than $0.1 million for other assets. Cost savings from the restructuring were estimated to be approximately $0.8 million per year through 2016, primarily for rent expense.
In 2001, we implemented significant restructuring plans that resulted in substantial charges for real estate and network infrastructure obligations, personnel and other charges. Additional related charges have subsequently been incurred as we continued to evaluate our restructuring reserve. The following table displays the activity and balances for the restructuring and asset impairment activity for the year ended December 31, 2007 (in thousands):
| December 31, 2006 Restructuring Liability | Restructuring and Impairment Charges | Cash Payments | Non-Cash Write- Downs | Non-Cash Plan Adjustments | December 31, 2007 Restructuring Liability | |||||||||||||||||||
| Activity for 2007 restructuring charge: | ||||||||||||||||||||||||
| Real estate obligations | $ | — | $ | 7,755 | $ | (2,248 | ) | $ | — | $ | 805 | $ | 6,312 | |||||||||||
| Employee separations | — | 1,140 | (615 | ) | — | (119 | ) | 406 | ||||||||||||||||
| Total restructuring costs | — | 8,895 | (2,863 | ) | — | 686 | 6,718 | |||||||||||||||||
| Activity for 2007 impairment charge: | ||||||||||||||||||||||||
| Leasehold improvements | — | 897 | — | (897 | ) | — | — | |||||||||||||||||
| Other | — | 471 | — | (471 | ) | — | — | |||||||||||||||||
| Total asset impairments | — | 1,368 | — | (1,368 | ) | — | — | |||||||||||||||||
| Activity for 2001 restructuring charge: | ||||||||||||||||||||||||
| Real estate obligations | 4,784 | — | (1,199 | ) | — | (211 | ) | 3,374 | ||||||||||||||||
| Total | $ | 4,784 | $ | 10,263 | $ | (4,062 | ) | $ | (1,368 | ) | $ | 475 | $ | 10,092 | ||||||||||
The impairment charges referenced in the table above were primarily associated with our data center segment.
We also recorded a $1.1 million impairment during year ended December 31, 2007 for the sales order-through-billing system, described further in Note 2. This impairment charge was not related to any specific segment.
In 2006, we recorded a nominal charge for changes in estimated expenses related to real estate obligations. The following table displays the activity and balances for restructuring activity for the year ended December 31, 2006 (in thousands):
| December 31, 2005 Restructuring Liability | Restructuring Charges | Cash Payments | December 31 2006 Restructuring Liability | |||||||||||||
| Activity for 2001 restructuring charge: | ||||||||||||||||
| Real estate obligations | $ | 6,277 | $ | 4 | $ | (1,497 | ) | $ | 4,784 | |||||||
Also, during the year ended December 31, 2006, we recognized an impairment charge of $0.3 million as a result of the implementation of a new financial system which began in 2004.
| 5. | OPERATING SEGMENTS |
We operate and manage the Company in three business segments: IP services, data center services and CDN services. IP services primarily include our high performance Internet connectivity as well as sales of our FCP products. Data center services primarily include physical space for hosting customers’ network and other equipment plus associated services such as redundant power and network connectivity, environmental controls and security. CDN services primarily include data storage, streaming/delivery and a user interface/reporting tool, none of which are sold separately. Other revenues and direct costs represent non-segmented activities and primarily include reseller and miscellaneous services such as third party CDN services, termination fee revenue, referral fees for other hardware sales, and consulting services. In conjunction with the preparation of our financial statements, we analyzed sales credits activity for the years ended December 31, 2007, 2006 and 2005 and reclassified all of the credits to the related operating segments. The following tables show operating results for our reportable segments, along with reconciliations from segment gross profit to (loss) income before income taxes and equity in earnings of equity-method investment:
F - 20
INTERNAP NETWORK SERVICES CORPORATION AND SUBSIDIARIES
NOTES TO CONSOLIDATED FINANCIAL STATEMENTS (Continued)
Year Ended December 31, 2007 | ||||||||||||||||||||
| IP Services | Data Center Services | CDN Services | Other | Total | ||||||||||||||||
| Revenues | $ | 119,848 | $ | 83,058 | $ | 17,718 | $ | 13,466 | $ | 234,090 | ||||||||||
| Direct costs of network, sales and services, | ||||||||||||||||||||
| exclusive of depreciation and amortization | 43,681 | 59,439 | 6,584 | 8,690 | 118,394 | |||||||||||||||
| Segment profit | $ | 76,167 | $ | 23,619 | $ | 11,134 | $ | 4,776 | 115,696 | |||||||||||
| Other operating expenses | 125,407 | |||||||||||||||||||
| Loss from operations | (9,711 | ) | ||||||||||||||||||
| Non-operating income | 937 | |||||||||||||||||||
| Loss before income taxes and equity in | ||||||||||||||||||||
| earnings of equity-method investment | $ | (8,774 | ) | |||||||||||||||||
Direct costs of network, sales and services, exclusive of depreciation and amortization, includes an allocation of $0.7 million from the IP services segment to the CDN services segment based on the average cost of actual usage by the CDN segment.
| Year Ended December 31, 2006 | ||||||||||||||||||||
| IP Services | Data Center Services | CDN Services | Other | Total | ||||||||||||||||
| Revenues | $ | 109,748 | $ | 56,152 | $ | — | $ | 15,475 | $ | 181,375 | ||||||||||
| Direct costs of network, sales and services, | ||||||||||||||||||||
| exclusive of depreciation and amortization | 39,744 | 46,474 | — | 11,120 | 97,338 | |||||||||||||||
| Segment profit | $ | 70,004 | $ | 9,678 | $ | — | $ | 4,355 | 84,037 | |||||||||||
| Other operating expenses | 81,900 | |||||||||||||||||||
| Income from operations | 2,137 | |||||||||||||||||||
| Non-operating income | 1,551 | |||||||||||||||||||
| Income before income taxes and equity in | ||||||||||||||||||||
| earnings of equity-method investment | $ | 3,688 | ||||||||||||||||||
F - 21
INTERNAP NETWORK SERVICES CORPORATION AND SUBSIDIARIES
NOTES TO CONSOLIDATED FINANCIAL STATEMENTS (Continued)
| Year Ended December 31, 2005 | |||||||||||||||||||||
| IP Services | Data Center Services | CDN Services | Other | Total | |||||||||||||||||
| Revenues | $ | 105,032 | $ | 36,996 | $ | — | $ | 11,689 | $ | 153,717 | |||||||||||
| Direct costs of network, sales and services, exclusive of depreciation and amortization | 38,377 | 35,244 | — | 8,337 | 81,958 | ||||||||||||||||
| Segment profit | $ | 66,655 | 1,752 | $ | — | $ | 3,352 | 71,759 | |||||||||||||
| Other operating expenses | 76,893 | ||||||||||||||||||||
| Loss from operations | (5,134 | ) | |||||||||||||||||||
| Non-operating income | 87 | ||||||||||||||||||||
| Loss before income taxes and equity in earnings of equity-method investment | $ | (5,047 | ) | ||||||||||||||||||
The following table includes selected segment financial information as of December 31, 2007 and 2006, related to goodwill and total assets:
| IP Services | Data Center Services | CDN Services | Other | Total | ||||||||||||||
| December 31, 2007: | ||||||||||||||||||
| Goodwill | $ | 36,314 | $ | — | $ | 154,363 | $ | — | $ | 190,677 | ||||||||
| Total assets | 148,697 | 64,498 | 211,469 | 2,346 | 427,010 | |||||||||||||
| December 31, 2006: | ||||||||||||||||||
| Goodwill | $ | 36,314 | $ | — | $ | — | $ | — | $ | 36,314 | ||||||||
| Total assets | 130,609 | 41,185 | — | 1,908 | 173,702 | |||||||||||||
Through December 31, 2007, neither revenues generated nor long-lived assets located outside the United States were significant (all less than 10%).
| 6. | INVESTMENTS |
Investment in marketable securities
Pursuant to our formal investment policy, investments in marketable securities primarily consist of high credit quality corporate debt securities, auction rate securities whose underlying assets are state-issued student and educational loans which are substantially backed by the federal government, commercial paper and U.S. Government Agency debt securities. Auction rate securities are variable rate bonds tied to short-term interest rates with maturities on the face of the securities in excess of 90 days and have interest rate resets through a modified Dutch auction, at predetermined short-term intervals, usually every 7, 28 or 35 days. Auction rate securities generally trade at par and are callable at par on any interest payment date at the option of the issuer. Interest received during a given period is based upon the interest rate determined through the auction process. Although these securities are issued and rated as long term bonds, they are priced and traded as short-term instruments because of the liquidity provided through the interest rate reset. All short-term marketable securities either (1) have original maturities greater than 90 days but less than one year or (2) are auction rate securities expected to be liquidated within one year, are classified as available-for-sale and are recorded at fair value with changes in fair value reflected in other comprehensive income. All proceeds were from the maturity of the securities or sales of auction rate securities at par value. Accordingly, we have not recognized any realized gains or losses.
F - 22
INTERNAP NETWORK SERVICES CORPORATION AND SUBSIDIARIES
NOTES TO CONSOLIDATED FINANCIAL STATEMENTS (Continued)
Summaries of our investments in marketable securities are as follows (in thousands):
| December 31, 2007 | ||||||||||||
| Cost Basis | Unrealized Gain (Loss) | Carrying Value | ||||||||||
| Corporate debt securities | $ | 7,607 | $ | 3 | $ | 7,610 | ||||||
| Auction rate securities | 7,150 | — | 7,150 | |||||||||
| Commercial paper | 4,787 | 2 | 4,789 | |||||||||
| Other | 24 | (4 | ) | 20 | ||||||||
| Total short-term investments in marketable securities | $ | 19,568 | $ | 1 | $ | 19,569 | ||||||
| December 31, 2006 | ||||||||||||
| Cost Basis | Unrealized Gain (Loss) | Carrying Value | ||||||||||
| Corporate debt securities | $ | 4,826 | $ | 1 | $ | 4,827 | ||||||
| Commercial paper | 4,755 | — | 4,755 | |||||||||
| U.S. government agency debt securities | 3,659 | (1 | ) | 3,658 | ||||||||
| Other | 24 | 27 | 51 | |||||||||
| Total short-term investments in marketable securities | $ | 13,264 | $ | 27 | $ | 13,291 | ||||||
Uncertainties in the credit markets may affect the liquidity of our holdings in auction rate securities. We did not experience any unsuccessful auction rate resets during the year ended or the initial rate resets immediately following December 31, 2007, however we have experienced failures on each of our subsequent auction rate resets. Nevertheless, we continue to receive interest every 28-35 days. While our investments in auction rate securities are of high credit quality with AAA/Aaa ratings as of December 31, 2007, at this time we are uncertain as to whether or when the liquidity issues relating to these investments will worsen or improve. We do not believe that it is necessary at this time to adjust the fair value of our portfolio of auction rate securities and we expect to hold the auction rate securities until liquidity improves or the borrower calls the underlying securities. However, if uncertainties in the credit and capital markets continue, these markets deteriorate further or we experience any rating downgrades on any of the investments in our portfolio, we may incur temporary or other than temporary impairments, which could negatively affect our financial condition, results of operations or cash flows. In addition, a continued deterioration in market conditions that lead us to conclude our marketable securities are not available to fund current operations would result in us classifying our auction rate securities as noncurrent assets. In the meantime, we believe we have sufficient liquidity through our cash balances, other short-term investments and available credit.
Investment in Internap Japan
We maintain a 51% ownership interest in Internap Japan, a joint venture with NTT-ME Corporation and NTT Holdings. We are unable to assert control over the joint venture’s operational and financial policies and practices required to account for the joint venture as a subsidiary whose assets, liabilities, revenue and expense would be consolidated (due to certain minority interest protections afforded to our joint venture partners). We are, however, able to assert significant influence over the joint venture and, therefore, account for our joint venture investment using the equity-method of accounting pursuant to APB Opinion No. 18 “The Equity Method of Accounting for Investments in Common Stock” and consistent with Emerging Issues Task Force No. 96-16 “Investor’s Accounting for an Investee When the Investor Has a Majority of the Voting Interest but the Minority Shareholder or Shareholders Have Certain Approval or Veto Rights.”
F - 23
INTERNAP NETWORK SERVICES CORPORATION AND SUBSIDIARIES
NOTES TO CONSOLIDATED FINANCIAL STATEMENTS (Continued)
| Year Ended December 31, | ||||||||||||
| 2007 | 2006 | 2005 | ||||||||||
| Investment Balance, January 1, | $ | 958 | $ | 823 | $ | 861 | ||||||
| Proportional share of net income | 139 | 114 | 83 | |||||||||
| Unrealized foreign currency translation gain (loss), net | 41 | 21 | (121 | ) | ||||||||
| Investment Balance, December 31, | $ | 1,138 | $ | 958 | $ | 823 | ||||||
Investment in Aventail
We account for investments without readily determinable fair values at cost. Realized gains and losses and declines in value of securities judged to be other-than-temporary are included in other expense. We incurred a charge during the three months ended June 30, 2007, totaling $1.2 million, representing the write-off of the remaining carrying value of our investment in series D preferred stock of Aventail. We made an initial cash investment of $6.0 million in Aventail series D preferred stock pursuant to an investment agreement in February 2000. In connection with a subsequent round of financing by Aventail, we recognized an initial loss on our investment of $4.8 million in 2001. On June 12, 2007, SonicWall, Inc. announced that it entered into an agreement to acquire Aventail for approximately $25.0 million in cash. The transaction closed on July 11, 2007, with all shares of series D preferred stock being cancelled and the holders of series D preferred stock not receiving any consideration for such shares.
| PROPERTY AND EQUIPMENT |
Property and equipment consists of the following (in thousands):
| December 31, | ||||||||
| 2007 | 2006 | |||||||
| Network equipment | $ | 86,496 | $ | 65,430 | ||||
| Network equipment under capital lease | 1,596 | 1,596 | ||||||
| Furniture, equipment and software | 31,726 | 31,712 | ||||||
| Leasehold improvements | 111,216 | 100,024 | ||||||
| Property and equipment, gross | 231,034 | 198,762 | ||||||
| Less: Accumulated depreciation and amortization ($1,596 and $1,375 related | ||||||||
| to capital leases at December 31, 2007 and 2006, respectively) | (165,543 | ) | (151,269 | ) | ||||
| $ | 65,491 | $ | 47,493 | |||||
During 2007 and 2006, $2.7 million and $8.6 million, respectively, of fully depreciated assets were retired.
Depreciation and amortization of property and equipment associated with direct costs of network, sales and services and other depreciation expense is summarized as follows (in thousands):
F - 24
INTERNAP NETWORK SERVICES CORPORATION AND SUBSIDIARIES
NOTES TO CONSOLIDATED FINANCIAL STATEMENTS (Continued)
| Year ended December 31, | ||||||||||||
| 2007 | 2006 | 2005 | ||||||||||
| Direct costs of network, sales and services | $ | 18,313 | $ | 13,250 | $ | 11,804 | ||||||
| Other depreciation and amortization | 3,929 | 2,606 | 2,933 | |||||||||
| Subtotal | 22,242 | 15,856 | 14,737 | |||||||||
| Amortization of acquired technologies | 4,165 | 516 | 577 | |||||||||
| Total depreciation and amortization | $ | 26,407 | $ | 16,372 | $ | 15,314 | ||||||
| 8. | GOODWILL AND OTHER INTANGIBLE ASSETS |
We perform our annual goodwill impairment test as of August 1 of each calendar year and estimated the fair value of our reporting units utilizing a discounted cash flow method. Based on the results of these analyses our goodwill was not impaired as of August 1, 2007.
The assumptions, inputs and judgments used in performing the valuation analysis are inherently subjective and reflect estimates based on known facts and circumstances at the time the valuation is performed. The use of different assumptions, inputs and judgments, or changes in circumstances, could materially affect the results of the valuation. Adverse changes in the value of our reporting units would necessitate an impairment charge of our goodwill. In connection with our acquisition of VitalStream on February 20, 2007, we recorded $154.8 million of additional goodwill based on our allocation of the VitalStream purchase price, as discussed in note 3. In December 2007, a decrease of $0.4 million was recorded to goodwill as a result of the utilization of a portion of VitalStream’s net operating loss carryforwards. The total recorded amount of goodwill was $190.7 million and $36.3 million as of December 31, 2007 and December 31, 2006, respectively.
Generally, any adjustments made as a result of the impairment testing are required to be recognized as operating expense. We will continue to perform our annual impairment testing as of August 1 each year absent any impairment indicators that may cause more frequent analysis, as required by SFAS No. 142.
The components of our amortizing intangible assets are as follows (in thousands):
| December 31, 2007 | December 31, 2006 | |||||||||||||||
| Gross Carrying Amount | Accumulated Amortization | Gross Carrying Amount | Accumulated Amortization | |||||||||||||
| Contract based | $ | 25,018 | $ | (15,403 | ) | $ | 14,518 | $ | (14,291 | ) | ||||||
| Technology based | 41,911 | (8,518 | ) | 5,911 | (4,353 | ) | ||||||||||
| $ | 66,929 | $ | (23,921 | ) | $ | 20,429 | $ | (18,644 | ) | |||||||
Amortization expense for identifiable intangible assets during 2007, 2006 and 2005 was $5.3 million, $0.5 million and $0.6 million, respectively. As of December 31, 2007, estimated amortization expense for the next five years is as follows (in thousands):
| 2008 | $ | 6,243 | ||
| 2009 | 6,243 | |||
| 2010 | 6,056 | |||
| 2011 | 5,728 | |||
| 2012 | 5,728 | |||
| Thereafter | 13,010 | |||
| $ | 43,008 |
F - 25
INTERNAP NETWORK SERVICES CORPORATION AND SUBSIDIARIES
NOTES TO CONSOLIDATED FINANCIAL STATEMENTS (Continued)
| 9. | ACCRUED LIABILITIES |
Accrued liabilities consist of the following (in thousands):
| December 31, | |||||||||
| 2007 | 2006 | ||||||||
| Compensation payable | $ | 4,942 | $ | 4,075 | |||||
| Telecommunications, sales, use and other taxes | 2,317 | 2,005 | |||||||
| Other | 2,900 | 2,609 | |||||||
| $ | 10,159 | $ | 8,689 | ||||||
| 10. | REVOLVING CREDIT FACILITY AND NOTE PAYABLE |
On September 14, 2007, we entered into a $35.0 million credit agreement, or the Credit Agreement, with Bank of America, N.A., as administrative agent, and lenders who may become a party to the Credit Agreement from time to time. VitalStream Holdings, Inc., VitalStream, Inc., PlayStream, Inc., and VitalStream Advertising Services, Inc., four of our subsidiaries, are guarantors of the Credit Agreement.
The Credit Agreement replaced our prior credit agreement, which was evidenced by a Loan and Security Agreement between the Company and Silicon Valley Bank that was last amended on December 27, 2006. We paid off and terminated this prior credit facility concurrently with the execution of the Credit Agreement.
Our obligations under the Credit Agreement are pledged, pursuant to a pledge and security agreement and an intellectual property security agreement, by substantially all of our assets including the capital stock of our domestic subsidiaries and 65% of the capital stock of our foreign subsidiaries.
The Credit Agreement provides for a four-year revolving credit facility, or the Revolving Credit Facility, in the aggregate amount of up to $5.0 million, which includes a $5.0 million sub-limit for letters of credit. With the prior approval of the administrative agent, we may increase the total commitments by up to $15.0 million for a total commitment under the Revolving Credit Facility of $20.0 million. The Revolving Credit Facility is available to finance working capital, capital expenditures and other general corporate purposes. As of December 31, 2007 we had a total of $8.0 million of letters of credit issued (including $3.9 million which are secured by the Revolving Credit Facility and the balance secured by restricted cash) and $1.1 million in borrowing capacity on the Revolving Credit Facility. There were no amounts outstanding on the Revolving Credit Facility as of December 31, 2007.
The Credit Agreement also provides for a four-year term loan, or the Term Loan, in the amount of $30.0 million. We borrowed $20.0 million concurrently with the closing and used a portion of the proceeds from the Term Loan to pay off the prior credit agreement. The Term Loan had $10.0 million in borrowing capacity as of December 31, 2007.
The interest rate on the Revolving Credit Facility and Term Loan is a tiered LIBOR-based rate that depends on our 12-month trailing EBITDA. As of December 31, 2007, the interest rate was 7.075%.
We will only pay interest on the Term Loan during the first 12 months of its four-year term. Commencing on the last day of the first calendar quarter after the first anniversary of the closing, the outstanding amount of the Term Loan will amortize on a straight-line schedule with the payment of 1/16 of the original principal amount of the Term Loan due quarterly. We will pay all unpaid amounts at maturity, which is September 14, 2011.
The Credit Agreement includes customary representations, warranties, negative and affirmative covenants, including certain financial covenants relating to net funded debt to EBITDA ratio and fixed charge coverage ratio, as well as a prohibition against paying dividends, limitations on unfunded capital expenditures of $25.0 million per year, customary events of default and certain default provisions that could result in acceleration of the Credit Agreement.
F - 26
INTERNAP NETWORK SERVICES CORPORATION AND SUBSIDIARIES
NOTES TO CONSOLIDATED FINANCIAL STATEMENTS (Continued)
The net proceeds received from the Term Loan were reduced by $0.3 million for fees paid to Bank of America and its agents. We treated these fees as a debt discount and will amortize the fees to interest expense using the interest method over the term of the loan. We recorded less than $0.1 million of related amortization during the year ended December 31, 2007. As of December 31, 2007, the balance on the Term Loan, net of the discount, was $19.8 million. We incurred other costs of less than $0.1 million in connection with entering into the Credit Agreement, which we recorded as debt issue costs and will amortize over the term of the Credit Agreement.
As a result of the transactions discussed above, we recorded a loss on extinguishment of prior debt of less than $0.1 million during the year ended December 31, 2007. The loss on extinguishment of debt is included in the caption Other, net within the Non-operating (income) expense section of the consolidated statements of operations.
The future maturity of the Term Loan at December 31, 2007, which does not reflect the debt discount, is as follows (in thousands):
| 2008 | $ | 2,500 | ||
| 2009 | 5,000 | |||
| 2010 | 5,000 | |||
| 2011 | 7,500 | |||
| Total maturities and principal payments | 20,000 | |||
| Less: current portion | (2,500 | ) | ||
| $ | 17,500 | |||
Also during the year ended December 31, 2007, we paid off the term loans and line of credit issued pursuant to the loan and security agreement assumed in the VitalStream acquisition, as discussed in note 3.
At December 31, 2006, we had a $5.0 million revolving credit facility and a $17.5 million term loan (note payable) under the former loan and security agreement with Silicon Valley Bank. The note payable had a fixed interest rate of 7.5% and was paid off in connection with the new Credit Agreement discussed above. There were $3.9 million of letters of credit previously outstanding under the former revolving credit facility which have been secured with restricted cash and are in the process of being secured by the new Revolving Credit Facility. There was no outstanding balance under the former revolving credit facility as of December 31, 2006.
| 11. | CAPITAL LEASES |
Capital lease obligations and the leased property and equipment are recorded at acquisition at the present value of future lease payments based upon the terms of the related lease agreement. As of December 31, 2007, our capital leases have expiration dates ranging from May 2009 to March 2010.
Future minimum capital lease payments together with the present value of the minimum lease payments as of December 31, 2007, are as follows (in thousands):
| 2008 | $ | 922 | ||
| 2009 | 456 | |||
| 2010 | 14 | |||
| Remaining capital lease payments | 1,392 | |||
| Less: amounts representing imputed interest | (135 | ) | ||
| Present value of minimum lease payments | 1,257 | |||
| Less: current portion | (805 | ) | ||
| $ | 452 |
One capital lease assumed in the VitalStream acquisition requires us to maintain a restricted cash balance of $0.7 million.
F - 27
INTERNAP NETWORK SERVICES CORPORATION AND SUBSIDIARIES
NOTES TO CONSOLIDATED FINANCIAL STATEMENTS (Continued)
| 12. | INCOME TAXES |
The current and deferred income tax (benefit) provision were as follows for the years ended December 31, 2007 and 2006 (in thousands):
| Year Ended December 31, | |||||||||
| 2007 | 2006 | ||||||||
| Current: | |||||||||
| Federal | $ | 15 | $ | 145 | |||||
| State | — | — | |||||||
| Foreign | 921 | — | |||||||
| Total current provision | 936 | 145 | |||||||
| Deferred: | |||||||||
| Federal | 356 | — | |||||||
| State | 42 | — | |||||||
| Foreign | (4,414 | ) | — | ||||||
| Total deferred benefit | (4,016 | ) | — | ||||||
| Net income tax (benefit) provision | $ | (3,080 | ) | $ | 145 | ||||
We account for income taxes under the liability method. Deferred tax assets and liabilities are determined based on differences between financial reporting and tax bases of assets and liabilities, and are measured using the enacted tax rates and laws that will be in effect when the differences are expected to reverse. We provide a valuation allowance to reduce our deferred tax assets to their estimated realizable value. We had no income tax provision or benefit for the year ended December 31, 2005.
A reconciliation of the effect of applying the federal statutory rate and the effective income tax rate on our income tax provision (benefit) is as follows:
| Year Ending December 31, | ||||||
| 2007 | 2006 | 2005 | ||||
| Federal income tax (benefit) expense at statutory rates | (34 | )% | 34 | % | (34 | )% |
| State income tax (benefit) expense | (4 | ) | 4 | (4 | ) | |
| Stock compensation expense | 6 | 8 | — | |||
| Tax reserves | 11 | — | — | |||
| Other | — | 1 | 1 | |||
| Change in valuation allowance | (14 | ) | (43 | ) | 37 | |
| Effective tax rate | (35 | )% | 4 | % | — | % |
F - 28
INTERNAP NETWORK SERVICES CORPORATION AND SUBSIDIARIES
NOTES TO CONSOLIDATED FINANCIAL STATEMENTS (Continued)
Temporary differences between the financial statement carrying amounts and tax bases of assets and liabilities that give rise to significant portions of deferred taxes relate to the following (in thousands):
| Year Ending December 31, | ||||||||
| 2007 | 2006 | |||||||
| Current deferred income tax assets: | ||||||||
| Provision for doubtful accounts | $ | 593 | $ | 115 | ||||
| Accrued compensation | 233 | 132 | ||||||
| Other accrued expenses | 196 | — | ||||||
| Deferred revenue | 1,648 | 1,225 | ||||||
| Restructuring costs | 910 | 532 | ||||||
| Foreign net operating loss carryforwards – current portion | 479 | — | ||||||
| Other | 77 | 390 | ||||||
| Current deferred income tax assets | 4,136 | 2,394 | ||||||
| Less: valuation allowance | (3,625 | ) | (2,379 | ) | ||||
| 511 | 15 | |||||||
| Non-current deferred income tax assets: | ||||||||
| Property and equipment | 21,488 | 20,315 | ||||||
| Investments | — | 1,824 | ||||||
| Deferred revenue, less current portion | 717 | 386 | ||||||
| Restructuring costs, less current portion | 2,925 | 1,286 | ||||||
| Deferred rent | 4,184 | 4,344 | ||||||
| Stock Compensation | 2,620 | 216 | ||||||
| U. S. net operating loss carryforwards | 136,963 | 128,527 | ||||||
| Foreign net operating loss carryforwards, less current portion | 13,717 | 14,574 | ||||||
| Capital loss carryforwards | 2,271 | — | ||||||
| Tax credit carryforwards | 180 | 165 | ||||||
| Other | 502 | — | ||||||
| Non- current deferred income tax assets | 185,567 | 171,637 | ||||||
| Less: valuation allowance | (180,133 | ) | (170,568 | ) | ||||
| 5,434 | 1,069 | |||||||
| Non-current deferred income tax liabilities: | ||||||||
| Purchased intangibles | (1,531 | ) | (1,084 | ) | ||||
| FIN 48 liability related to net operating loss carryforwards | (921 | ) | — | |||||
| Goodwill | (398 | ) | — | |||||
| Non-current deferred income tax assets (liabilities), net | 2,584 | (15 | ) | |||||
| Net deferred tax assets | $ | 3,095 | $ | — | ||||
As of December 31, 2007, we have U.S. net operating loss carryforwards for federal tax purposes of approximately $589.4 million that will expire through 2026. Of the total U.S. net operating loss carryforwards, $13.3 million of net operating losses relate to the deduction of stock compensation that will be tax-effected and the benefit credited to additional paid in capital when realized. In addition, we have alternative minimum tax credit carryforwards of approximately $0.2 million, which have an indefinite carryforward period, and foreign net operating loss carryforwards of approximately $39.3 million that will begin to expire in 2008.
F - 29
INTERNAP NETWORK SERVICES CORPORATION AND SUBSIDIARIES
NOTES TO CONSOLIDATED FINANCIAL STATEMENTS (Continued)
The future utilization of the U.S. net operating losses is subject to certain limitations imposed by Section 382 of the Internal Revenue Code. Under this provision, we will be precluded from utilizing approximately $215.7 million of our $589.4 million in net operating losses. Also, the occurrence of additional changes in ownership pursuant to Section 382 of the Internal Revenue Code may have the impact of additional limitations on the future utilization of our U.S. net operating losses.
As prescribed under SFAS No. 109, we periodically evaluate the recoverability of the deferred tax assets and the appropriateness of the valuation allowance. For U.S. tax purposes, a valuation allowance of approximately $173.7 million has been established against the U.S. deferred tax assets that we do not believe are more likely than not to be realized. We will continue to assess the requirement for a valuation allowance on a quarterly basis and, at such time when it is determined that it is more likely than not that the deferred tax assets will be realized, the valuation allowance will be reduced accordingly.
During the fourth quarter of 2007, we concluded that it was more likely than not that U.K. deferred tax assets will be realized in future years. The U.K. deferred tax assets primarily consist of net operating loss carryforwards in the amount of $11.6 million as of December 31, 2007. We therefore released $4.4 million of the valuation allowance associated with U.K. deferred tax assets, which resulted in the recognition of a $4.4 million tax benefit. The tax benefit was offset by a liability for uncertain tax positions of $0.9 million, discussed below, for a net recognized tax benefit of $3.5 million. On the accompanying balance sheet, $0.5 million of the tax benefit is reflected as a current deferred tax asset because realization is anticipated to occur within the next 12 months. The resulting non-current deferred tax asset is $3.0 million.
As discussed in note 3 we acquired VitalStream in February 2007, resulting in the addition of $13.5 million in deferred tax assets, primarily consisting of $34.5 million in net operating loss carryforwards. The acquisition of VitalStream was a stock-for-stock transaction treated as a tax-free reorganization. The difference between the tax basis and the net book value of VitalStream assets is treated as a temporary difference and is reported as a deferred tax asset in the table above.
It is our policy to reinvest foreign earnings indefinitely within each country when foreign operations become profitable. Accordingly, no deferred taxes have been recorded for the difference between our financial and tax basis investment in foreign entities. A portion of these earnings were distributed to the U.S. and resulted in U.S. dividend income (eliminated in consolidation for financial statement purposes) and reduced the U.S. net operating loss carryforward. The distribution was not subject to withholding taxes. No other foreign distributions have occurred and no provision or benefit is made for income taxes that would be payable upon the distribution of future foreign earnings. Because it is the intention of management to reinvest future profits within each country, it is not practicable to determine the amount of the unrecognized deferred income tax liability related to future foreign earnings.
Effective January 1, 2007, we adopted the provisions of FIN 48. FIN 48 clarifies the accounting for uncertainty in income taxes recognized in a company’s financial statements in accordance with SFAS No. 109. FIN 48 requires a company to determine whether it is more likely than not that a tax position will be sustained upon examination based upon the technical merits of the position. If the more-likely-than-not threshold is met, a company must measure the tax position to determine the amount to recognize in the financial statements.
Upon the adoption of FIN 48 on January 1, 2007, we recognized no increase in our liability for unrecognized tax benefits. A reconciliation of the beginning and ending amount of unrecognized tax benefits is as follows (in thousands):
| Unrecognized tax benefits balance at January 1, 2007 | $ | — | ||
| Additions for tax positions of prior years | — | |||
| Reductions for tax positions of prior years settlements | — | |||
| Additions for tax positions of current year | 921 | |||
| Lapse of statute of limitations | — | |||
| Unrecognized tax benefits balance at December 31, 2007 | $ | 921 |
F - 30
INTERNAP NETWORK SERVICES CORPORATION AND SUBSIDIARIES
NOTES TO CONSOLIDATED FINANCIAL STATEMENTS (Continued)
All of the $0.9 million addition would impact our effective income tax rate in the respective period of change. We classify interest and penalties arising from the underpayment of income taxes in the statement of operations as a component of general and administrative expenses. As of December 31, 2007, we have no accrued interest or penalties related to uncertain tax positions. Our federal income tax returns remain open to examination for the tax years 2007, 2006 and 2005, as do returns filed in other taxing jurisdictions to which we are also subject to examination for years prior to 2005.
| 13. | EMPLOYEE RETIREMENT PLAN |
We sponsor a defined contribution retirement savings plan that qualifies under Section 401(k) of the Internal Revenue Code. Plan participants may elect to have a portion of their pre-tax compensation contributed to the plan, subject to certain guidelines issued by the Internal Revenue Service. Employer contributions are discretionary and were $0.8 million, $0.7 million and $0.6 million for the years ended December 31, 2007, 2006 and 2005, respectively.
| 14. | COMMITMENTS, CONTINGENCIES, CONCENTRATIONS OF RISK AND LITIGATION |
Operating leases
We, as a lessee, have entered into leasing arrangements relating to office and service point rental space and office equipment that are classified as operating leases. Initial lease terms range from two to 30 years and contain various periods of free rent and renewal options. However, rent expense is recorded on a straight-line basis over the initial lease term and renewal periods that are reasonably assured. Certain leases require that we maintain letters of credit or restricted cash balances to ensure payment. Future minimum lease payments on non-cancelable operating leases are as follows at December 31, 2007 (in thousands):
| 2008 | $ | 28,211 | ||
| 2009 | 25,510 | |||
| 2010 | 25,179 | |||
| 2011 | 26,135 | |||
| 2012 | 27,073 | |||
| Thereafter | 88,786 | |||
| $ | 220,894 |
Rent expense was $15.1 million, $18.8 million and $13.6 million for the years ended December 31, 2007, 2006 and 2005, respectively. Sublease income, recorded as a reduction of rent expense, was $0.5 million, $0.6 million and $0.2 million during the years ended December 31, 2007, 2006 and 2005, respectively.
We have entered into service commitment contracts with Internet network service providers to provide interconnection services and data center providers to provide data center services for our customers. Future minimum payments under these service commitments having terms in excess of one year are as follows at December 31, 2007 (in thousands):
| 2008 | $ | 12,167 | ||
| 2009 | 7,457 | |||
| 2010 | 2,390 | |||
| $ | 22,014 |
F - 31
INTERNAP NETWORK SERVICES CORPORATION AND SUBSIDIARIES
NOTES TO CONSOLIDATED FINANCIAL STATEMENTS (Continued)
Vendor disputes
In delivering our services, we rely on a number of Internet network, telecommunication and other vendors. We work directly with these vendors to provision services such as establishing, modifying or discontinuing services for our customers. Because of the volume of activity, billing disputes inevitably arise. These disputes typically stem from disagreements concerning the starting and ending dates of service, quoted rates, usage and various other factors. Disputed costs, both in the vendors’ favor and our favor, are researched and discussed with vendors on an ongoing basis until ultimately resolved. We record the cost and a liability based on our estimate of the most likely outcome of the dispute. These estimates are periodically reviewed by management and modified in light of new information or developments, if any. Because estimates regarding disputed costs include assessments of uncertain outcomes, such estimates are inherently vulnerable to changes due to unforeseen circumstances that could materially and adversely affect our results of operations and cash flows.
As part of our acquisition of CO Space on June 20, 2000, we assumed a pre-acquisition accounts payable liability of $1.3 million. As disclosed in our 2003 financial statements, we wrote off the $1.3 million liability amount as we believed the obligation no longer existed. In the fourth quarter of 2006, we received an inquiry from the vendor, ADC Telecommunications, Inc., or ADC, regarding the status of the former $1.3 million payable and on March 19, 2007, ADC sued us in Minnesota state court. We settled this suit on June 29, 2007 for less than $0.1 million, which we expensed when we incurred the settlement cost and associated legal costs.
Concentrations of risk
We participate in an industry that is characterized by relatively high volatility and strong competition for market share. We and others in the industry encounter aggressive pricing practices, evolving customer demands and continual technological developments. Our operating results could be negatively affected should we not be able to adequately address pricing strategies, customers’ demands, and technological advancements.
We depend on other companies to supply various key elements of our infrastructure including the network access local loops between our network access points and our Internet network service providers and the local loops between our network access points and our customers’ networks. In addition, the routers and switches used in our network infrastructure are currently supplied by a limited number of vendors. Furthermore, we do not carry significant supply inventories of the products and equipment that we purchase and use, and we have no guaranteed supply arrangements with our vendors. A loss of a significant vendor could delay build-out of our infrastructure and increase our costs. If our limited source of suppliers fails to provide products or services that comply with evolving Internet standards or that interoperate with other products or services we use in our network infrastructure, we may be unable to meet all or a portion of our customer service commitments, which could adversely affect our business, results of operations and financial condition.
We are subject to legal proceedings, claims and litigation arising in the ordinary course of business. Although the outcome of these matters is currently not determinable, we do not expect that the ultimate costs to resolve these matters will have a material adverse effect on our financial condition, results of operations or cash flows.
F - 32
INTERNAP NETWORK SERVICES CORPORATION AND SUBSIDIARIES
NOTES TO CONSOLIDATED FINANCIAL STATEMENTS (Continued)
In July 2004, we received an assessment from the New York State Department of Taxation and Finance for $1.4 million, including interest and penalties, resulting from an audit of our state franchise tax returns for the years 2000-2002. The assessment related to an unpaid license fee due upon our entry into the state for the privilege of doing business in the state. Management recorded its best estimate of the probable liability resulting from the assessment in accrued liabilities and general and administrative expense as of June 30, 2004 and engaged a professional service provider to initiate an appeal. In April 2005, New York State Department of Taxation and Finance reduced the assessment to $0.1 million including interest and waived penalties. The substantial decrease from the original assessment resulted from including the weighted averages of investment capital and subsidiary capital, along with business capital, used in New York in determining the apportionment factor. The original assessment was based solely on an apportionment of business capital, while investment capital and subsidiary capital both have significantly lower apportionment percentages to New York. The adjustment for the revised New York assessment, as well as other tax accruals based on our best estimate of probable liabilities, resulted in a reduction of non-income based tax expenses of approximately $1.7 million as of March 31, 2005. These tax adjustments are reflected in accrued liabilities and general and administrative expense in the accompanying financial statements.
| 15. | CONVERTIBLE PREFERRED STOCK AND STOCKHOLDERS’ EQUITY |
Convertible preferred stock
Effective September 14, 2004, all shares of our outstanding series A convertible preferred stock were mandatorily converted into common stock in accordance with the terms of our Certificate of Incorporation. We have no shares of series A convertible preferred stock outstanding.
Rights agreement
On March 15, 2007, the Board of Directors declared a dividend of one preferred share purchase right, or a Right, for each outstanding share of common stock, par value $0.001 per share, of the Company. The dividend was payable on March 23, 2007 to the stockholders of record on that date. Each Right entitles the registered holder to purchase from the Company 1/1000 of a share of Series B Preferred Stock of the Company, par value $0.001 per share, or the Preferred Shares, at a price of $100.00 per 1/1000 of a Preferred Share, subject to adjustment. Our Certificate of Designation of Rights, Preferences and Privileges of Series B Preferred Stock designates 0.5 million shares of Series B Preferred Stock. The description and terms of the Rights are set forth in a Rights Agreement between the Company and American Stock Transfer & Trust Company, as Rights Agent, dated April 11, 2007.
Common stock
On September 18, 2006, our common stock began trading on the NASDAQ Global Market, under the symbol “INAP.” We voluntarily delisted our common stock from the American Stock Exchange, or AMEX, effective September 17, 2006.
On July 10, 2006, we implemented a one-for-ten reverse stock split of our common stock. Authorization to implement the reverse stock split was approved on June 21, 2006, by our stockholders at our annual stockholders’ meeting. Our common stock began trading on a split-adjusted basis on July 11, 2006. All share and per share information herein (including shares outstanding, earnings per share and warrant and stock option exercise prices) have been retroactively restated for all periods presented to reflect the reverse stock split.
During 2006, shares of treasury stock were acquired as payment of taxes on stock-based compensation from employees and subsequently reissued as part of our stock-based compensation plans.
Warrants to purchase common stock
On October 20, 2003, we issued warrants to purchase less than 0.1 million shares of common stock at an exercise price of $9.50 in connection with a private placement of our common stock. These warrants continue to be outstanding and expire on August 22, 2008.
F - 33
INTERNAP NETWORK SERVICES CORPORATION AND SUBSIDIARIES
NOTES TO CONSOLIDATED FINANCIAL STATEMENTS (Continued)
| 16. | STOCK-BASED COMPENSATION PLANS |
General
We have adopted SFAS No. 123R and related interpretations, using the modified prospective transition method and therefore have not restated prior periods’ results. SFAS No. 123R establishes the accounting for equity instruments exchanged for employee services. Under SFAS No. 123R, share-based compensation cost is measured at the grant date based on the calculated fair value of the award. The expense is recognized over the employee’s requisite service period, generally the vesting period of the award. Prior to the adoption of SFAS No. 123R on January 1, 2006, we accounted for stock-based compensation plans under the recognition and measurement provisions of APB Opinion No. 25 and related interpretations. We also provided disclosures in accordance with SFAS No. 123, “Accounting for Stock-Based Compensation,” as amended by SFAS No. 148, “Accounting for Stock-Based Compensation—Transition and Disclosures—an Amendment of FASB Statement No. 123.” Accordingly, no expense was recognized for options to purchase our common stock that were granted with an exercise price equal to fair market value at the date of grant and no expense was recognized in connection with purchases under our employee stock purchase plans for any periods prior to January 1, 2006. As a result of adopting SFAS No. 123R on January 1, 2006, our income before taxes and net income was $6.5 million and $5.1 million lower, or $0.14 and $0.15 per basic and $0.13 and $0.14 per diluted share, lower for the years ended December 31, 2007 and 2006, respectively, than had we continued to account for stock-based compensation under APB Opinion No. 25.
In June 2006, our stockholders approved a measure to reprice certain outstanding options under our existing equity incentive plans. Options with an exercise price per share greater than or equal to $13.00 were eligible for the repricing. The repricing was implemented through an exchange program under which eligible participants were offered the opportunity to exchange their eligible options for new options to purchase shares. Each new option had substantially the same terms and conditions as the eligible options cancelled except as follows:
| · | The exercise price per share of each replacement option granted in the exchange offer was $14.46, the average of the closing prices of the common stock as reported by the American Stock Exchange and the NASDAQ Global Market, as applicable, for the 15 consecutive trading days ending immediately prior to the grant date of the replacement options; |
| · | For all eligible options with an exercise price per share greater than or equal to $20.00, the exchange ratio was 1-for-2; and |
| · | Each new option has a three-year vesting period, vesting in equal monthly installments over three years, so long as the grantee continues to be a full-time employee of the company and a ten-year term. |
A total of 50 employees eligible to participate in the exchange offer tendered, and we accepted for cancellation, eligible options to purchase an aggregate of 344,987 shares of common stock, representing 49.4% of the total shares of common stock underlying options eligible for exchange in the exchange offer. We issued replacement options to purchase an aggregate of 179,043 shares of common stock in exchange for the cancellation of the tendered eligible options.
In accordance with SFAS No. 123R, we will recognize $0.1 million of incremental compensation cost over the three-year vesting period as a result of the option exchange. The incremental expense was measured as the excess of the fair value of the repriced options over the fair value of the original options immediately before the terms of the original options were modified. The measurement was based on the share price and other pertinent factors at the date of modification.
F - 34
INTERNAP NETWORK SERVICES CORPORATION AND SUBSIDIARIES
NOTES TO CONSOLIDATED FINANCIAL STATEMENTS (Continued)
Stock-based compensation expense
The following table summarizes the amount of stock-based compensation expense, net of estimated forfeitures in accordance with SFAS No. 123R, included in the accompanying consolidated statements of operations for the year ended December 31, 2007 and 2006 (in thousands):
| Year ended December 31, | ||||||||
| 2007 | 2006 | |||||||
| Direct costs of customer support | $ | 1,892 | $ | 1,102 | ||||
| Product development | 856 | 628 | ||||||
| Sales and marketing | 2,135 | 2,145 | ||||||
| General and administrative | 3,798 | 2,067 | ||||||
| Total stock-based compensation expense included in net income | $ | 8,681 | $ | 5,942 | ||||
The following table illustrates the effect on net loss and net loss per share as if we had applied the fair value recognition provisions of SFAS No. 123 to stock-based employee compensation for year ended December 31, 2005 (in thousands except per share amounts):
| Net loss, as reported | $ | (4,964 | ) | |
| Add: stock-based employee compensation expense included in reported net loss | 75 | |||
| Adjust: total stock-based employee compensation expense determined under fair value based method for all awards | (9,678 | ) | ||
| Pro forma net loss | $ | (14,567 | ) | |
| Loss per share: | ||||
| Basic and diluted—as reported | $ | (0.15 | ) | |
| Basic and diluted—pro forma | (0.43 | ) |
Note that the above pro forma disclosure was not presented for the twelve months ended December 31, 2007 and 2006 because stock-based compensation has been accounted for in the statement of operations using the fair value recognition method under SFAS No. 123R for those periods.
The fair values of outstanding stock options have been estimated at the date of grant using a Black-Scholes option pricing model. The significant weighted average assumptions used for estimating the fair value of the activity under our stock option plans for the years ended December 31, 2007, 2006 and 2005, were expected terms of 6.2, 5.7 and 4.0 years, respectively; historical volatilities of 114%, 123% and 118%, respectively; risk free interest rates of 4.44%, 4.63% and 4.22%, respectively and no dividend yield. The weighted average estimated fair value per share of our employee stock options at grant date was $13.71, $7.75 and $3.50 for the years ended December 31, 2007, 2006 and 2005, respectively. The expected term represents the weighted average period of time that granted options are expected to be outstanding, giving consideration to the vesting schedules and our historical exercise patterns. Because our options are not publicly traded, assumed volatility is based on the historical volatility of our stock. The risk-free interest rate is based on the U.S. Treasury yield curve in effect at the time of grant for periods corresponding to the expected life of the options. We have also used historical data to estimate option exercises, employee termination and stock option forfeiture rates.
F - 35
INTERNAP NETWORK SERVICES CORPORATION AND SUBSIDIARIES
NOTES TO CONSOLIDATED FINANCIAL STATEMENTS (Continued)
On June 23, 2005, we adopted the Internap Network Services Corporation 2005 Incentive Stock Plan, or the 2005 Plan, which was amended and restated on March 15, 2006. The 2005 Plan provides for the issuance of stock options, stock appreciation rights, stock grants and stock unit grants to eligible employees and directors and is administered by the compensation committee of the board of directors. A total of 6.8 million shares of stock are reserved for issuance under the 2005 Plan, comprised of 2.0 million shares designated in the 2005 Plan plus 1.0 million shares that remain available for issuance of options and awards and 3.8 million shares of unexercised options under certain pre-existing plans. We will not make any future grants under the specified preexisting plans, but each of the specified pre-existing plans were made a part of the 2005 Plan so that the shares available for issuance under the 2005 Plan may be issued in connection with grants made under those plans. As of December 31, 2007, 3.0 million options were outstanding, 0.7 million shares of non-vested restricted stock awards were outstanding and 2.3 million shares of stock were available for issuance under the 2005 plan.
The 2005 Plan also provides that in any calendar year, no eligible employee or director shall be granted an option to purchase more than 1.4 million shares of stock or a stock appreciation right based on the appreciation with respect to more than 1.4 million shares of stock, and no stock grant or stock unit grant shall be made to any eligible employee or director in any calendar year where the fair market value of the stock subject to such grant on the date of the grant exceeds $3.0 million. Furthermore, no more than 0.7 million non-forfeitable shares of stock shall be issued pursuant to stock grants.
As a result of the acquisition of VitalStream as discussed in note 3, we assumed the VitalStream Stock Option/Stock Issuance Plan, or the VitalStream Plan, and all of the corresponding options to purchase stock. Under the terms of the merger agreement, each VitalStream stock option that was outstanding and unexercised was converted into an option to purchase Internap common stock and we assumed that stock option in accordance with the terms of the applicable VitalStream stock option plan and terms of the stock option agreement. Based on VitalStream's stock options outstanding at February 20, 2007, we converted options to purchase approximately 3.0 million shares of VitalStream common stock into options to purchase approximately 1.5 million shares of Internap common stock. We determined the fair value of the outstanding options using a Black-Scholes valuation model with the following assumptions: volatility of 48.8% to 120.1%; risk-free interest rates ranging from 4.7% to 5.1%; remaining expected lives ranging from 0.18 to 6.25 years; and dividend yield of zero.
The VitalStream Plan provided for the granting of incentive stock options, non-statutory stock options or shares of common stock directly to certain key employees, members of the board of directors, consultants, and independent contractors according to the terms of the plan. There were 5.4 million VitalStream shares, or 2.8 million Internap shares on a post-converted basis, reserved for issuance under the plan and 0.5 million VitalStream shares, or 0.3 million Internap shares on a post-converted basis, available for grant. Generally, the assumed options had exercise prices equal to the stock price on the date of grant and had contractual terms of 5 years. Vesting schedules ranged from quarterly periods over one year to four years with 1/4th vesting after one year and 1/16th vesting each quarter thereafter.
During July 1999, we adopted the 1999 Non-Employee Directors’ Stock Option Plan, or the Director Plan. The Director Plan provides for the grant of non-qualified stock options to non-employee directors. A total of 0.4 million shares of our common stock have been reserved for issuance under the Director Plan. Under the terms of the Director Plan, non-employee directors receive fully-vested and exercisable initial option for 8,000 shares of our common stock on the date such person is first elected or appointed as a non-employee director. The Director Plan provides that on the day after each of our annual stockholder meetings, starting with the annual meeting in 2000, each non-employee director receives a fully vested and exercisable option for 2,000 shares, provided such person has been a non-employee director for at least the prior six months. The options are exercisable as long as the non-employee director continues to serve as a director, employee or consultant of Internap or any of its affiliates. On January 18, 2007, the Board of Directors approved certain changes, effective as of January 1, 2007, to compensation for non-employee Directors. The annual stock option grant to each director is now an option to acquire up to 5,000 shares instead of an option to acquire up to 2,000 shares of our common stock. These options also have an exercise price equal to 100% of the fair market value of our common stock on the date of grant and are fully vested and exercisable as of the date of grant. Each Director also receives an annual grant of 2,500 restricted stock awards , which vest ratably over a three-year period, subject to the terms of the 2005 Plan, under which these restricted stock awards are granted. In addition, new non-employee Directors receive a grant of 12,500 restricted stock awards , which vest ratably over a three-year period, subject to the terms of the 2005 Plan and the stock grant agreement under which the restricted stock awards are granted. As of December 31, 2007, 0.1 million options were outstanding and 0.2 million shares were available for grant pursuant to the Director Plan.
F - 36
INTERNAP NETWORK SERVICES CORPORATION AND SUBSIDIARIES
NOTES TO CONSOLIDATED FINANCIAL STATEMENTS (Continued)
The option price for each share of stock subject to an option shall generally be no less than the fair market value of a share of stock on the date the option is granted. Stock options generally have a maximum term of ten years from the date of grant. Incentive stock options, or ISOs, may be granted only to eligible employees and if granted to a 10% stockholder, the terms of the grant will be more restrictive than for other eligible employees. Terms for stock appreciation rights are similar to those of options. Upon exercise of a stock appreciation right, the compensation committee of the board of directors shall determine the form of payment as cash, shares of stock issued under the 2005 Plan based on the fair market value of a share of stock on the date of exercise, or a combination of cash and shares.
Options and stock appreciation rights become exercisable in whole or in part from time to time as determined at the date of grant by the board of directors or the compensation committee of the board of directors, as applicable. Stock options generally vest 25% after one year and monthly over the following three years, except for non-employee directors who usually receive immediately exercisable options. Similarly, conditions, if any, under which stock will be issued under stock grants or cash will be paid under stock unit grants and the conditions under which the interest in any stock that has been issued will become non-forfeitable are determined at the date of grant by the compensation committee. If the only condition to the forfeiture of a stock grant or stock unit grant is the completion of a period of service, the minimum period of service will generally be three years from the date of grant. Common stock has been reserved under each of the stock compensation plans to satisfy option exercises with newly issued stock. However, we may also use treasury stock to satisfy option exercises
During 2006, we completed an internal review of our prior stock option granting practices. As a result of the review, we determined that approximately $0.2 million of net expense should have been recognized in prior periods in accordance with APB Opinion No. 25, “Accounting for Stock Issued to Employees.” The expense was due to a small number of grants made in 2002 and 2003 that had exercise prices that were lower than our stock price at the date of grant and one grant that should have been accounted for as a variable stock option, in accordance with FIN 28, “Accounting for Stock Appreciation Rights and Other Variable Stock Option or Award Plans, an interpretation of APB Opinions No. 15 and 25.” Substantially all of the net expense should have been recorded between April 1, 2003 and December 31, 2004. We have considered the impact of the error, including the assessment of any potential impact on prior period loan covenants and concluded that the error was not material to our financial statements for any prior period. Based on this evaluation, we recorded the expense in the current period and it is included in general and administrative expense in the accompanying statement of operations.
| Shares | Weighted Average Exercise Price | |||||||
| Balance, December 31, 2004 | 4,395 | $ | 16.96 | |||||
| Granted | 948 | 4.92 | ||||||
| Exercised | (202 | ) | 4.51 | |||||
| Forfeitures and post-vesting cancellations | (1,585 | ) | 19.15 | |||||
| Balance, December 31, 2005 | 3,556 | 13.49 | ||||||
| Granted | 752 | 9.30 | ||||||
| Exercised | (497 | ) | 5.84 | |||||
| Forfeitures and post-vesting cancellations | (1,112 | ) | 19.94 | |||||
| Balance, December 31, 2006 | 2,699 | 11.07 | ||||||
| Granted | 897 | 15.74 | ||||||
| Assumed with the VitalStream Plan | 1,496 | 10.81 | ||||||
| Exercised | (1,241 | ) | 6.74 | |||||
| Forfeitures and post-vesting cancellations | (678 | ) | 14.23 | |||||
| Balance, December 31, 2007 | 3,173 | $ | 13.29 | |||||
The total intrinsic value of options exercised was $11.8 million, $2.6 million and $0.2 million for the years ended December 31, 2007, 2006 and 2005, respectively.
The following table summarizes information about options outstanding at December 31, 2007 (shares in thousands):
| Options Outstanding | Options Exercisable | ||||||||||||||||||
| Exercise Prices | Number of Shares | Weighted Average Remaining Contractual Life (In Years) | Weighted Average Exercise Price | Number of Shares | Weighted Average Remaining Contractual Life (In Years) | Weighted Average Exercise Price | |||||||||||||
| $0.75 - $4.60 | 172 | 4.1 | $ | 4.05 | 169 | 4.00 | $ | 4.04 | |||||||||||
| $4.80 - $4.80 | 608 | 7.5 | 4.80 | 387 | 7.42 | 4.80 | |||||||||||||
| $5.20 - $9.15 | 624 | 8.1 | 7.54 | 191 | 6.67 | 6.56 | |||||||||||||
| $9.40 - $13.64 | 484 | 5.4 | 11.60 | 368 | 4.90 | 11.53 | |||||||||||||
| $14.17 - $18.70 | 518 | 4.3 | 16.55 | 316 | 3.17 | 16.68 | |||||||||||||
| $18.80 - $18.82 | 456 | 9.0 | 18.82 | 4 | 6.16 | 18.80 | |||||||||||||
| $18.83 - $345.00 | 311 | 4.6 | 35.60 | 239 | 4.57 | 40.58 | |||||||||||||
| $0.75 - $345.00 | 3,173 | 6.5 | $ | 13.29 | 1,674 | 5.22 | $ | 13.80 | |||||||||||
The total intrinsic value at December 31, 2007 of all options outstanding and expected to vest was $3.6 million. The total intrinsic value at December 31, 2007 of all options exercisable was $2.4 million.
Restricted stock activity for each of the three years ended December 31, 2007, 2006, and 2005 is as follows (shares in thousands):
| Shares | Weighted-Average Grant Date Fair Value | |||||||
| Non-vested balance, December 31, 2004 | — | $ | — | |||||
| Granted | 104 | 4.78 | ||||||
| Vested | (4 | ) | 4.30 | |||||
| Non-vested balance, December 31, 2005 | 100 | 4.80 | ||||||
| Granted | 568 | 6.18 | ||||||
| Vested | (158 | ) | 5.68 | |||||
| Forfeited | (90 | ) | 5.61 | |||||
| Non-vested balance, December 31, 2006 | 420 | 6.17 | ||||||
| Granted | 657 | 15.66 | ||||||
| Vested | (161 | ) | 10.21 | |||||
| Forfeited | (237 | ) | 9.60 | |||||
| Non-vested balance, December 31, 2007 | 679 | $ | 13.19 | |||||
F - 37
INTERNAP NETWORK SERVICES CORPORATION AND SUBSIDIARIES
NOTES TO CONSOLIDATED FINANCIAL STATEMENTS (Continued)
The total fair value of restricted stock awards vested during the years ended December 31, 2007, 2006, and 2005 was $2.3 million, $2.1 million, and less than $0.1 million, respectively. The cumulative effect of the change in the forfeiture rate for non-vested restricted stock was upon the adoption of SFAS No. 123R was immaterial and recorded as part of operating expense. The total intrinsic value at December 31, 2007 of all non-vested restricted stock awards was $5.7 million.
Total unrecognized compensation costs related to non-vested stock-based compensation as of December 31, 2007 and 2006, is summarized as follows (dollars in thousands):
| December 31, 2007 | ||||||||||||
Stock Options | Restricted Stock | Total | ||||||||||
| Unrecognized compensation | $ | 10,532 | $ | 10,448 | $ | 20,980 | ||||||
| Weighted-average remaining recognition period (in years) | 2.7 | 3.0 | 2.9 | |||||||||
| December 31, 2006 | ||||||||||||
Stock Options | Restricted Stock | Total | ||||||||||
| Unrecognized compensation | $ | 9,309 | $ | 3,088 | $ | 12,397 | ||||||
| Weighted-average remaining recognition period (in years) | 2.7 | 3.0 | 2.8 | |||||||||
Employee stock purchase plans
Effective June 15, 2004, we adopted the 2004 Internap Network Services Corporation Employee Stock Purchase Plan, or the 2004 ESPP. The purpose of the 2004 ESPP is to encourage ownership of our common stock by each of our eligible employees by permitting eligible employees to purchase our common stock at a discount. Eligible employees may elect to participate in the 2004 ESPP for two consecutive calendar quarters, referred to as a “purchase period,” during a designated period immediately preceding the purchase period. Purchase periods have been established as the six-month periods ending June 30 and December 31 of each year. A participation election is in effect until it is amended or revoked by the participating employee, which may be done at any time on or before the last day of the purchase period.
F - 38
INTERNAP NETWORK SERVICES CORPORATION AND SUBSIDIARIES
NOTES TO CONSOLIDATED FINANCIAL STATEMENTS (Continued)
At December 31, 2007, total shares reserved for future awards under all plans were 6.0 million shares. Cash received from all stock-based compensation arrangements was $8.6 million, $3.0 million and $1.5 million for the years ended December 31, 2007, 2006 and 2005, respectively.
| 17. | RELATED PARTY TRANSACTIONS |
As discussed in note 6, we had an investment in Aventail, who was also a customer for data center and connectivity services. We invoiced Aventail $0.2 million during 2007 and $0.3 million during both 2006 and 2005. As of December 31, 2007 and 2006, our outstanding receivable balance with Aventail was less than $0.1 million. As discussed in note 4, we incurred a charge during the period ended June 30, 2007, totaling $1.2 million, representing the write-off of the remaining carrying value of our investment in series D preferred stock of Aventail.
One of our executive officers has a material equity ownership interest in and is a member of the board of directors of a customer of ours, Surfline/Wavetrak, Inc., or Surfline. We invoiced Surfline $0.1 million during 2007, of which $0.1 million was outstanding as of December 31, 2007. Surfline was not a customer prior to 2007.
We have entered into indemnification agreements with our directors and executive officers for the indemnification of and advancement of expense to such persons to the fullest extent permitted by law. We also intend to enter into these agreements with our future directors and executive officers.
| 18. | UNAUDITED QUARTERLY RESULTS |
The following table sets forth selected unaudited quarterly data for the years ended December 31, 2007 and 2006. We have revised our quarterly statement of operations for the quarter ended September 30, 2007 to appropriately record (1) $0.5 million for sales adjustments, which reduce net accounts receivable and revenue, and (2) $0.1 million for accretion of interest income that we initially included as unrealized gain in accumulated other comprehensive income within stockholders’ equity. The effect of these revisions had no impact on our consolidated statement of cash flows. We have determined that these adjustments are not material to our consolidated financial statements for any of the affected quarterly periods. Accordingly, we have not revised the 2007 quarterly financial statements included in our previously filed Form 10-Q for the quarterly periods ended March 31, June 30 and September 30, 2007 for these adjustments. The quarterly operating results below are not necessarily indicative of those in future periods (in thousands, except for share data).
| Quarter Ended | |||||||||||||
| 2007 | March 31 | June 30 | September 30 | December 31 | |||||||||
Revenues (1) | $ | 53,534 | $ | 58,494 | $ | 60,426 | $ | 61,636 | |||||
| Direct costs of network, sales and services, exclusive | |||||||||||||
| of depreciation and amortization | 28,629 | 29,617 | 29,272 | 30,876 | |||||||||
| Direct costs of amortization of acquired technologies | 654 | 1,054 | 1,228 | 1,229 | |||||||||
| Direct costs of customer support | 3,388 | 4,330 | 4,495 | 4,334 | |||||||||
| Restructuring and asset impairment | 11,349 | — | — | — | |||||||||
| Acquired in-process research and development | 450 | — | — | — | |||||||||
| Write-off of investment | — | 1,178 | — | — | |||||||||
Net (loss) income (2) | (10,695 | ) | (1,683 | ) | 1,383 | 5,440 | |||||||
Basic and diluted net (loss) income per share (3) | (0.26 | ) | (0.03 | ) | 0.03 | 0.11 | |||||||
| (1) | Amounts included in this table for the third quarter of 2007 are approximately $0.5 million lower than the amounts previously reported in our Form 10-Q for the quarterly period ended September 30, 2007. |
| (2) | Amounts included in this table for the third quarter of 2007 are approximately $0.4 million lower than the amounts previously reported in our Form 10-Q for the quarterly period ended September 30, 2007. |
| (3) | Amounts included in this table for the third quarter of 2007 are approximately $0.01 lower than the amounts previously reported in our Form 10-Q for the quarterly period ended September 30, 2007. |
| Quarter Ended | ||||||||||||||
| 2006 | March 31 | June 30 | September 30 | December 31 | ||||||||||
| Revenues | $ | 42,625 | $ | 43,905 | $ | 45,874 | $ | 48,971 | ||||||
| Direct costs of network, sales and services, exclusive | ||||||||||||||
| of depreciation and amortization | 22,217 | 23,606 | 25,236 | 26,279 | ||||||||||
| Direct costs of amortization of acquired technologies | 137 | 138 | 137 | 104 | ||||||||||
| Direct costs of customer support | 2,897 | 2,769 | 2,930 | 2,970 | ||||||||||
| Restructuring and asset impairment | — | — | 319 | 4 | ||||||||||
| Net income | 541 | 713 | 195 | 2,208 | ||||||||||
| Basic and diluted net income per share | 0.02 | 0.02 | 0.01 | 0.06 | ||||||||||
F - 39
INTERNAP NETWORK SERVICES CORPORATION
FINANCIAL STATEMENT SCHEDULE
VALUATION AND QUALIFYING ACCOUNTS AND RESERVES (IN THOUSANDS)
Balance at Beginning Of Fiscal Period | Charges to Costs and Expense | Charges to Other Accounts | Deductions | Balance at End of Fiscal Period | ||||||||||||
| Year ended December 31, 2005 | ||||||||||||||||
| Provision for doubtful accounts | $ | 1,124 | $ | 1,431 | $ | — | $ | (1,592 | ) | $ | 963 | |||||
| Tax valuation allowance | 168,982 | — | 16,530 | — | 185,512 | |||||||||||
| Year ended December 31, 2006 | ||||||||||||||||
| Provision for doubtful accounts | 963 | 548 | — | (623 | ) | 888 | ||||||||||
| Tax valuation allowance | 185,512 | — | (12,569 | ) | — | 172,943 | ||||||||||
| Year ended December 31, 2007 | ||||||||||||||||
| Provision for doubtful accounts | 888 | 2,261 | 3,540 | (1,219 | ) | 5,470 | ||||||||||
Tax valuation allowance | 172,943 | (4,414 | ) | 15,228 | — | 183,757 | ||||||||||
S-1