UNITED STATES SECURITIES AND EXCHANGE COMMISSION
WASHINGTON, D.C. 20549
FORM 10-K
(Mark One)
| | | |
| þ | | ANNUAL REPORT PURSUANT TO SECTION 13 OR 15(d) OF THE SECURITIES EXCHANGE ACT OF 1934 |
For the fiscal year ended December 31, 2009
OR
| | | |
| o | | TRANSITION REPORT PURSUANT TO SECTION 13 OR 15(d) OF THE SECURITIES EXCHANGE ACT OF 1934 |
For the transition period from to
Commission File Number: 000-23999
Manhattan Associates, Inc.
(Exact Name of Registrant As Specified in Its Charter)
| | | |
| Georgia | | 58-2373424 |
| (State or Other Jurisdiction of | | (I.R.S. Employer Identification No.) |
| Incorporation or Organization) | | |
| | | |
| 2300 Windy Ridge Parkway, Suite 1000 | | |
| Atlanta, Georgia | | 30339 |
| (Address of Principal Executive Offices) | | (Zip Code) |
Registrant’s telephone number, including area code:(770) 955-7070
Securities registered pursuant to Section 12(b) of the Act:
| | | |
| Title of Each Class | | Name of Each Exchange on Which Registered |
| | | |
| Common Stock, $.01 par value per share | | The Nasdaq Stock Market LLC |
Securities registered pursuant to Section 12(g) of the Act:
None
Indicate by check mark if the Registrant is a well-known seasoned issuer, as defined in Rule 405 of the Securities Act. Yeso Noþ
Indicate by check mark if the Registrant is not required to file reports pursuant to Section 13 or 15(d) of the Act. Yeso Noþ
Note– Checking the box above will not relieve any registrant required to file reports pursuant to Section 13 or 15(d) of the Exchange Act from their obligations under those Sections.
Indicate by check mark whether the Registrant: (1) has filed all reports required to be filed by Section 13 or 15(d) of the Securities Exchange Act of 1934 during the preceding 12 months (or for such shorter period that the Registrant was required to file such reports), and (2) has been subject to such filing requirements for the past 90 days. Yesþ Noo
Indicate by check mark whether the registrant has submitted electronically and posted on its corporate Web site, if any, every Interactive Data File required to be submitted and posted pursuant to Rule 405 of Regulation S-T (§ 232.405 of this chapter) during the preceding 12 months (or for such shorter period that the registrant was required to submit and post such files). Yeso Noo
Indicate by check mark if disclosure of delinquent filers pursuant to Item 405 of Regulation S-K is not contained herein, and will not be contained, to the best of Registrant’s knowledge, in definitive proxy or information statements incorporated by reference in Part III of this Form 10-K or any amendment to this Form 10-K.o
Indicate by check mark whether the registrant is a large accelerated filer, an accelerated filer, a non-accelerated filer, or a smaller reporting company. See the definitions of “large accelerated filer,” “accelerated filer” and “smaller reporting company” in Rule 12b-2 of the Exchange Act. (Check one):
| | | | | | | |
| Large accelerated filero | | Accelerated filerþ | | Non-accelerated filero | | Smaller reporting companyo |
| | | | | (Do not check if a smaller reporting company) | | |
Indicate by check mark whether the Registrant is a shell company (as defined in Rule 12b-2 of the Act). Yeso Noþ
The aggregate market value of the voting and non-voting common equity held by non-affiliates of the Registrant as of June 30, 2009 was $409,955,193, which was calculated based upon a closing sales price of $18.22 per share of the Common Stock as reported by the Nasdaq Global Select Market on the same day. As of February 17, 2010, the Registrant had outstanding 22,612,924 shares of Common Stock.
DOCUMENTS INCORPORATED BY REFERENCE
The Registrant’s definitive Proxy Statement for the Annual Meeting of Shareholders to be held May 28, 2010 is incorporated by reference in Part III of this Form 10-K to the extent stated herein.
MANHATTAN ASSOCIATES, INC.
Annual Report on Form 10-K
For the Fiscal Year Ended December 31, 2009
Table of Contents
1
Forward-Looking Statements
In addition to historical information, this Annual Report may contain “forward-looking statements” relating to Manhattan Associates, Inc. Prospective investors are cautioned that any such forward-looking statements are not guarantees of future performance and involve risks and uncertainties, and that actual results may differ materially from those contemplated by such forward-looking statements. Among the important factors that could cause actual results to differ materially from those indicated by such forward-looking statements are delays in product development, undetected software errors, competitive pressures, technical difficulties, market acceptance, the impact of acquisitions, availability of technical personnel, changes in customer requirements and general economic conditions. Additional factors are set forth in the“Risk Factors”in Part I, Item 1A of this Annual Report. We undertake no obligation to update or revise forward-looking statements to reflect changed assumptions, the occurrence of unanticipated events or changes in future operating results. Our Annual Report on Form 10-K is available through our Website atwww.manh.com.
PART I
Item 1.Business
Overview
We develop, sell, deploy, service and maintain supply chain software solutions that help organizations optimize business advantages gained through those solutions while effectively managing the long-term costs of operating them. Supply chain solutions help organizations ensure that the right products are available to the right customers at the right time and at the right cost, so that organizations can build customer loyalty, differentiate their brands, and calibrate costs and revenues to align with organizational goals. Some key benefits of implementing our solutions include:
| | • | | Mastering channel proliferation by being able to forecast and manage inventory, sales and returns through multiple channels (stores, web sites, catalogs, call centers) independently, yet execute customer interactions as a united entity to deliver consistent brand experiences, optimize revenue, and mitigate unnecessary and duplicative costs. |
| |
| | • | | Coordinating workflows and communication with other participants in a supply chain ecosystem, including suppliers, customers and transportation providers; |
| |
| | • | | Increase visibility across the supply network to improve sales and customer order fill rates while reducing network inventory; |
| |
| | • | | Balancing transportation and inventory costs with desired service levels by channel; |
| |
| | • | | Increasing productivity and asset utilization in distribution centers, transportation networks and delivery channels to improve return on supply chain investments, including storage, labor, inventory and transportation investments; |
| |
| | • | | Improving compliance with customer requirements, including radio frequency identification (RFID) and electronic product code (EPC) requirements; and |
| |
| | • | | Accelerating eco-friendliness through “green” initiatives such as reducing carbon footprints and greenhouse gas emissions and improving reuse and recycling. |

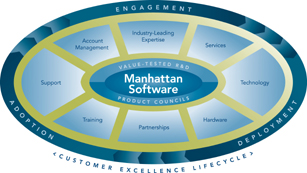
Figure 1: Manhattan MORETMdepicts Manhattan’s Optimized Roadmap to Excellence, our comprehensive methodology for delivering customer value through supply-chain-centered people, principles, products, protocols and processes. We build long-term customer relationships through our Customer Excellence Lifecycle, which leverages our software, expertise and enriched services in a high-touch cycle of engagement, deployment and adoption for continuous supply chain advancement.
2
Our point of view is that a platform-based approach is the best way to optimize supply chains and supply chain ecosystems, meaning all of the interdependent elements both within and external to an organization that interact to impact how effectively, efficiently and economically that organization’s supply chain operates. Supply chain ecosystems encompass disparate functions within an organization that affect its supply chain (such as distribution, transportation, order lifecycle management, inventory optimization, and planning and forecasting) as well as interactions with entities outside the organization but integral to its supply chain, including manufacturers, suppliers, distributors, trading partners, transportation providers, channels (such as catalogers, store retailers, call centers and Web outlets) and consumers.
Platform Thinking™ is the term we use to describe the intelligence that infuses the way we design our software, consult with our customers and deliver our solutions. Our rationale is built on this premise: Making decisions about inventory, orders, transportation, and distribution in isolation without considering data, workflows and inputs from each discipline in the supply chain and from its ecosystem can lead to more costly and suboptimal decisions. This is because each of these areas generates cost and service-level consequences that impact the others directly or indirectly. Platform Thinking gives organizations a unified view of their supply chains by replacing “silo thinking” with Whole Chain Awareness™, a blend of insight and execution capabilities across supply chains and supply chain ecosystems that delivers advanced levels of visibility, agility, responsiveness and economy for organizations that depend on their supply chains for uncommon and strategic advantage.
We deliver these benefits in a market-differentiating way through a comprehensive array of supply-chain-centered people, principles, products, protocols and processes we call Manhattan MORE™: Manhattan’s Optimized Roadmap to Excellence (See Figure 1). These elements work together to coordinate insights, people, workflows, assets, events and tasks holistically across supply chain functions from planning through execution. They also help to coordinate actions, data exchange and communication among participants in supply chain ecosystems.
We are a Georgia corporation formed in February 1998 to acquire all of the assets and liabilities of Manhattan Associates Software, LLC, our predecessor. References in this filing to the “Company,” “Manhattan,” “Manhattan Associates,” “we,” “our,” and “us” refer to Manhattan Associates, Inc., our predecessors, and our wholly-owned and consolidated subsidiaries. Our principal executive offices are located at 2300 Windy Ridge Parkway, Suite 1000, Atlanta, Georgia 30339, and our telephone number is 770-955-7070.
Industry Background
Globalization and technological advances have radically altered competition, service expectations and business operating imperatives for modern organizations. Pressures such as outsourcing, sales and distribution channel proliferation and convergence, growing item diversity and volume to satisfy evolving global consumer demands, fluctuating fuel costs, global labor sourcing, and regulatory and security requirements motivate organizations to closely examine not only their supply chain operations, but also how they interact in supply chain ecosystems that interlink suppliers, trading partners, manufacturers, sellers, distributors, transporters, channels and customers. We believe this is because mastering supply chains and ecosystems in unique ways is necessary to create sustainable competitive advantages in today’s globally interacting commerce environment.
Profitable operations, brand leadership and customer loyalty depend not only on product mix, but also on the blends of services—including availability, channel choice, pricing options, return policies, ease of buying, ease of delivery and technical or operational support—that uniquely surround those products to satisfy targeted customer desires in competitively differentiating ways. Supply chain solutions not only help organizations manage logistics operations, but also enable them to coalesce data, workflows, events and tasks from across the web of suppliers, trading partners, customers and other participants in a supply chain ecosystem to make optimal business decisions.
Organizations apply supply chain technology, software and services to solve identified operational inefficiencies or create operational advantages in ways that can scale as their businesses grow. They also look to easily integrate supply chain solutions with other technology, such as enterprise resource planning (ERP) systems, customer relationship management (CRM) systems, e-business systems, material handling equipment (MHE) and other solutions involved in creating efficient, competitive and profitable operations.
Manhattan Associates’ Software Solution Portfolios
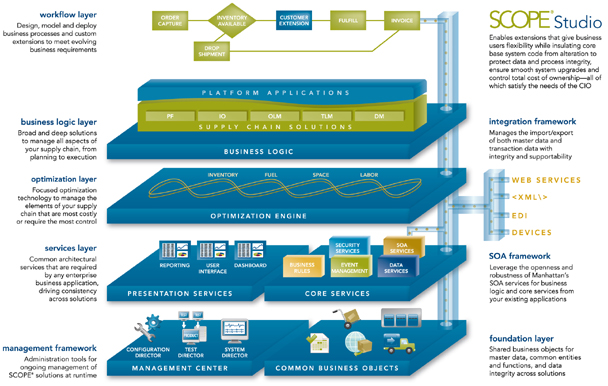
Our platform-based supply chain software solution portfolios – Manhattan SCOPE® and Manhattan SCALETM – are designed with our Platform Thinking approach to deliver both business agility and total cost of ownership advantages to customers. Manhattan SCOPE (Supply Chain Optimization, Planning through Execution, depicted in Figure 2) leverages our Supply Chain Process Platform (SCPP, depicted in Figure 3) to unify the full breadth of the supply chain, while Manhattan SCALE (Supply Chain Architected for Logistics Execution, depicted in Figure 4) leverages Microsoft’s .NET® platform to unify logistics functions.
3
Our solutions operate across Unix, IBM System I, Linux and Microsoft.NET computing platforms, as well as on multiple hardware platforms and systems. Because supply chain solutions necessarily interact with other business operation systems, our solutions are designed to interoperate with software from other providers as well as with a company’s existing legacy systems. This interfacing and open system capability enables customers to continue using existing computer resources and to choose among a wide variety of existing and emerging computer hardware and peripheral technologies. We provide adapters for many ERP systems to enhance system communication and reduce implementation costs, including (but not limited to) Oracle, SAP and Microsoft Dynamics AX. We also offer certain of our solutions in both premise software and hosted Software-as-a-Service (SaaS) models so that customers can select the option that best meets their requirements for control, flexibility, cost of ownership, and time-to-deployment.
Manhattan SCOPE®
SCOPE is ideally suited for companies that consider supply chain software, processes and technology strategic to market leadership. Predictive and algorithmic technology embedded in SCOPE helps organizations refine decisions dynamically as market or operational conditions change. Advantages derived from coordinated real-time visibility, event management, ecosystem collaboration and intelligence across supply chain operational departments and functions avert having decisions in one supply chain area unexpectedly affect another unfavorably. By organizing supply chain optimization holistically, Manhattan enables customers to fine-tune costs, profitability and service levels as their business objectives and market conditions evolve.
4
Figure 2: Manhattan SCOPE®Supply Chain Optimization, Planning through Execution, is a portfolio of supply chain solution suites that leverage our Supply Chain Process Platform to enable high degrees of operational insight, performance, agility and optimization at a tightly-managed and overall lower total cost of ownership. This platform-based architecture also enables combining different elements of different solution suites into X-Suite solutions to address specific supply chain challenges.
Supply Chain Platform Applications
SCOPE Platform Applications span the entire portfolio to provide key visibility, intelligence and adaptive functionality across the enterprise. These solutions offer the broad supply chain insight and analytics that are critical to an executive’s ability to proactively manage the holistic supply chain. Whether deployed with our Solution Suite applications or integrated with other enterprise systems, our Platform Applications provide a comprehensive range of event and schedule tracking; alerts and notifications; inventory, order and shipment visibility; cost monitoring and tracking; leading-edge analytics, and reporting with graphical depictions of critical supply chain performance metrics.
Supply Chain Solution Suites
Each Solution Suite is designed to enable users to proactively plan, monitor and execute against supply chain objectives.
Planning and Forecasting enables organizations to sense and respond to demand, and to support all levels of enterprise merchandise planning, from strategic level planning down to assortment and key item planning. Our Demand Forecasting solution leverages a unique Unified Forecasting MethodTM(UFM) to enable organizations to optimally forecast and manage – by specific channel – challenging planning and forecasting situations, including forecasting buying patterns for seasonal items, intermittently sold items, and items that sell in different patterns and at different paces in different channels.
Inventory Optimization enables enterprises to reduce overall network inventory to release working capital while improving sales and customer order fill rates. Inventory Optimization also provides analytical tools to better balance the financial trade-off between improving customer service levels and overall inventory investments. Our Multi-Echelon solution helps organizations manage distribution networks with more than one type or level of distribution center between the supplier and the end point. Vendor Managed Inventory and Collaboration Gateway solutions help formulate tighter, lasting relationships with key trading partners, such as replenishing products into customers’ locations or sharing key supply chain performance indicators.
Order Lifecycle Management is designed to optimize order fulfillment across a distributed supply chain. By managing orders across all channels from inception to sourcing physical fulfillment—and ultimately through physical returns when applicable —Order Lifecycle Management helps to optimize inventory deployment while reducing overall fulfillment costs.
Transportation Lifecycle Management optimizes all aspects of transporting product through supply chains by improving multiple product delivery dimensions, such as speed, accuracy and cost.
Distribution Management is designed to effectively manage the key assets required to run complex distribution operations, and to move goods and information through a warehouse with precision and velocity. The suite enables (among other processes) knowing what inventory will be arriving at a distribution center; receiving, putting away and shipping inventory, and managing distribution-related labor.
X-Suite Solutions
X-Suite Solutions leverage Manhattan’s SCPP to synthesize capabilities of two or more solutions or solution components to solve a specific supply chain problem.Flow ManagementandExtended Enterprise Managementare X-Suite Solutions. Flow Management synthesizes Demand Forecasting, Replenishment, Supply Chain Visibility, Distributed Order Management and Warehouse Management, while Extended Enterprise Management synthesizes Supplier Enablement, Hub Management, Transportation Enablement, Store / Consumer Gateway, Collaborative Gateway, Supply Chain Visibility and Supply Chain Event Management.
5
Flow Management improves the agility of the supply chain while reducing the volume of inventory required to deliver defined customer service levels. In a flow-through distribution model, goods literally “flow” directly from arriving at a distribution center to being shipped to their destination, without being put away in the interim. Businesses achieve the greatest benefit from a flow-through distribution model only by synchronizing demand management, inventory optimization, purchase order allocations, and the physical distribution of inventory. Flow Management enables organizations to evolve from a facilities-based distribution model to a more holistic, network-based model. Organizations leverage Flow Management to free inventory to drive maximum profitability and customer service across channels; redirect inbound supply directly to customers, alternate stores or distribution centers based on real-time demand signals: and optimize cross-channel inventory by using the same enterprise-wide supply planning and inventory management process
Extended Enterprise Management connects organizations with supply chain ecosystem participants to create insight to supply chain events and improve how goods are ordered and move through supply chains. The solution facilitates quick and fluid interactions with trading partners, optimizes order management, creates compliant case labels and advanced shipment notifications upstream, assures quality inventory and shipments, and senses and responds efficiently to supply chain events to increase on-time delivery rates, improve inventory control and meet demand expectations.
Supply Chain Process Platform
At the foundation of Manhattan SCOPE is our Supply Chain Process Platform (SCPP), which utilizes a service-oriented architecture (SOA), common data model, collaborative gateways and an optimization engine (among other constructs) to facilitate supply chain transformations that help our customers create and sustain competitive advantages. Specific elements of Manhattan’s SCPP, along with related core benefits, are detailed in Figure 3.
Among its overall benefits, our SCPP enables customers using multiple Manhattan SCOPE applications to achieve Cross-Application OptimizationTM. Cross-Application Optimization is our term for the compound benefits derived not only from optimizing multiple functional supply chain elementsindividually, but alsocollectivelyby considering factors across multiple functions in a supply chain (warehouse management, transportation, inventory and labor, for example) simultaneously, so that their individual and related impacts inform each decision to determine the optimal course of action for the organization as a whole. Our SCPP’s common architecture also enables customers to speed implementations, simplify upgrades, and achieve lower total cost of ownership over time.
6
Figure 3: Manhattan’s Supply Chain Process Platformprovides the foundation for Manhattan SCOPE Solution Suites, Platform Applications, and X-Suite Solutions. This common architecture provides agility and business differentiation advantages to operations executives while also simplifying maintenance and upgrade paths and lowering the total cost of ownership over time for information technology and financial executives.
Manhattan SCALETM
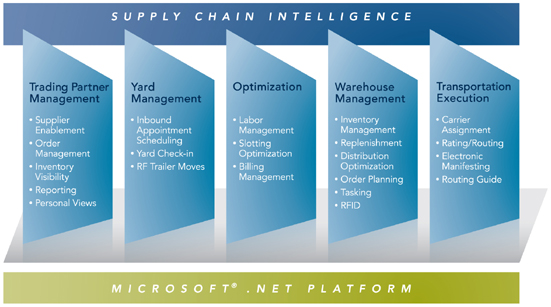
SCALE is our portfolio of logistics execution solutions built on the Microsoft®.NET platform. It is targeted toward companies with execution-focused supply chain needs that require speed-to-value, resource-light system configuration and maintenance, and the ability to quickly scale their logistics operations up or down in response to market fluctuations or business requirement changes. SCALE combines the features of Trading Partner Management, Yard Management, Warehouse Visibility and Optimization, Warehouse Management and Transportation Execution, as shown in Figure 4.
Because SCALE leverages a common platform, solutions share common data elements, and each user can access all applications through a single sign-on. Users also can set up “dashboards” that enable easy access to real-time information most relevant to their jobs. SCALE’s ease of deployment, operation and support make it a popular choice for organizations operating in countries with emerging and developing economies, and where technical support resources are limited.
7
Figure 4: Manhattan’s Supply Chain Architected for Logistics Executionis a portfolio of logistics solutions that leverages the Microsoft®.NET platform and is designed for organizations that want to improve their logistics operations quickly with limited technical resources. SCALE also is a popular solution choice for organizations operating in countries with emerging supply chain ecosystems.
Professional Services
We advise and assist our customers in planning and implementing our solutions through our global Professional Services Organization. To ensure long-term successful customer relationships, consultants assist customers with the initial deployment of our systems, the conversion and transfer of the customer’s historical data onto our systems, and ongoing training, education and system upgrades. We believe our Professional Services teams enable customers to implement our solutions knowledgeably and in the appropriate amount of time; help customers achieve expected results from system investments; continuously identify new opportunities for supply chain advancements; and meaningfully add to our industry-specific knowledge base to inform future implementations and product innovations.
Although our Professional Services are optional, substantially all of our customers use at least some portion of these services to implement and support our software solutions. Professional Services typically are rendered under time and materials-based contracts, with services typically billed by the hour. Professional Services sometimes are rendered under fixed-fee based contracts, with payments due on specific dates or milestones. We believe that increased sales of our software solutions will drive higher demand for our consulting services.
8
We believe our Professional Services team delivers unique supply chain expertise to our customers through industry-specific “best-practices” protocols and processes developed through the collective knowledge we have gained in more than 3,300 installations worldwide. We also extensively train our consulting personnel on supply chain operations and on our solutions.
Business consultants, systems analysts and technical personnel assist customers in all phases of implementing our systems, including planning and design, customer-specific module configuration, on-site implementation or conversion from existing systems, and integration with customer systems such as Enterprise Resource Planning (ERP), Ecommerce Platforms and Material Handling Equipment (MHE) systems. At times, third-party consultants, such as those from major systems integrators, assist our customers with certain implementations.
Customer Support Services and Software Enhancements
We offer a comprehensive program that provides our customers with software upgrades for additional or improved functionality, and technological advances incorporating emerging supply chain and industry initiatives. Over the past three years, our annual renewal rate of customers subscribing to comprehensive support and enhancements has been greater than 90%. We are able to remotely access customer systems to perform diagnostics, provide on-line assistance, and facilitate software upgrades. We offer 24 hour customer support every day of the year, plus software upgrades for an annual fee that is paid in advance and is based on the solutions the customer has and the service level required. Software upgrades are provided under this program on a when-and-if- available basis.
Training
We offer training in a structured environment for new and existing users. Training programs are provided at fixed fees per-person, per-class, and cover topics such as (but not limited to) solution use, configuration, implementation and system administration. Several computer-based training programs can be purchased for a fixed fee for use at client sites.
Hardware Sales
Along with software licenses, and as a convenience for our customers, we sell a variety of hardware developed and manufactured by others, including (but are not limited to) computer hardware, radio frequency terminal networks, RFID chip readers, bar code printers and scanners, and other peripherals. We sell all hardware pursuant to agreements with manufacturers or through distributor-authorized reseller agreements. These agreements entitle us to purchase hardware at discount prices, and to receive technical support during product installations and in the event of any subsequent product malfunctions. We do not maintain significant hardware inventory as we generally purchase hardware from vendors only after receiving a customer order.
Strategy
Our objective is to extend our position as the best global supply chain solutions provider for supply chain leaders, meaning organizations intent on creating and sustaining market advantages by leveraging supply chain solutions. Our solutions help global distributors, wholesalers, retailers, logistics providers and manufacturer successfully manage accelerating and fluctuating market demands, as well as master the increasing complexity and volatility of their local and global supply chains. We believe our solutions are advanced, highly functional and highly scalable. They are designed to enable organizations to: create customer experiences consistent with their brand values; improve relationships with suppliers, customers and logistics providers; leverage investments across supply chain functions; effectively manage costs; and meet dynamically changing customer requirements. We believe our solutions are uniquely positioned to holistically optimize supply chains from planning through execution, and that customers can leverage this holistic approach to create operational and market advantages. Strategies to accomplish our objectives include (but are not limited to) the following:
Develop and Enhance Software Solutions.We intend to continue to focus our research and development resources on enhancing our supply chain solutions. We offer what we believe to be the broadest and most richly-featured software portfolio in the supply chain solutions marketplace. To continuously expand functionality and value, we plan to continue to provide enhancements to existing solutions and to introduce new solutions to address evolving industry standards and market needs. We identify these opportunities through our Product Management, Professional Services, Customer Support and Account Management organizations, through interactions such as ongoing customer consulting engagements and implementations; sessions with our solution user groups; association with leading industry analyst and market research firms; and participation on industry standards and research committees.
9
Our solutions address needs in various vertical markets, including retail, consumer goods, food and grocery, logistics service providers, industrial and wholesale, high technology and electronics, life sciences and government. We intend to continue to enhance our solutions to meet the dynamic requirements of these and new vertical markets as business opportunities dictate.
Expand International Presence.We believe that our solutions offer significant benefits to customers in markets outside the United States, and for organizations with global operations. Approximately 930 Manhattan employees work outside the United States to build international sales, service our international clients, and further develop our solutions. We have offices in Australia, China, France, India, the Netherlands, Shanghai, Singapore and the United Kingdom, as well as representatives in Mexico and Japan, and reseller partnerships in Latin America, Eastern Europe, the Middle East, South Africa and Asia. Our Europe, Middle East, and Africa (EMEA) operations support sales, implementation services and customer support functions for a number of customers across the Middle East, concentrated in countries we consider politically and economically stable, such as Saudi Arabia, United Arab Emirates, Kuwait, Turkey, Israel, and Oman. Our Asia Pacific (APAC) operations service emerging opportunities in China, Southeast Asia and India, as well as more established markets in Australia and New Zealand. Our international strategy includes leveraging the strength of our relationships with current U.S.-based customers that also have significant overseas operations, and pursuing strategic marketing partnerships with international systems integrators and third-party solution providers.
Expand Our Strategic Alliances and Indirect Sales Channels.We currently sell our products primarily through our direct sales personnel, and through partnership agreements with a select number of organizations in emerging markets where we do not currently have a direct sales presence. We have worked on joint projects and joint sales initiatives with industry-leading consultants and software systems implementers, including most of the large consulting firms and other systems consulting firms specializing in our targeted industries, to supplement our direct sales force and professional services organization. We have been expanding our indirect sales channels through reseller agreements, marketing agreements, and agreements with third-party logistics providers. These alliances extend our market coverage and provide us with new business leads and access to trained implementation personnel.
Acquire or Invest in Complementary Businesses.We continuously evaluate strategic acquisition opportunities of technologies, solutions and businesses that are consistent with our platform-based strategy and enable us to enhance and expand our supply chain planning and execution solutions and service offerings. Preferred acquisition targets are those that would: be complementary to our existing solutions and technologies; expand our geographic presence and distribution channels; extend our presence into additional vertical markets with challenges and requirements similar to those we currently serve; and further solidify our leadership position within the primary components of supply chain planning and execution.
Sales and Marketing
We employ multi-disciplinary sales teams that consist of professionals with industry experience in sales and technical sales support. To date, we have generated the majority of our revenue from software sales through our direct sales force. We plan to continue to invest in our sales, services and marketing organizations within the United States, EMEA, and APAC, and to pursue strategic marketing partnerships. We conduct comprehensive global marketing programs that include prospect profiling and targeting, lead generation, public relations, analyst relations, trade show attendance and sponsorships, supply chain conference hosting, online marketing, joint promotion programs with vendors and consultants, and ongoing customer communication programs.
Our sales cycle typically begins with the generation of a sales lead — through in-house telemarketing efforts, targeted promotions, web inquiries, trade show presence, speaking engagements, hosted seminars, or other means of referral — or the receipt of a request for proposal from a prospective customer. Leads are qualified and opportunities are closed through a process that includes telephone-based assessments of requirements; responses to requests for proposals; presentations and product demonstrations; site visits and/or reference calls with organizations already using our supply chain solutions; and contract negotiations. Sales cycles vary substantially from opportunity to opportunity, but typically require six to twelve months.
In addition to new customer sales, we plan to continue to leverage our existing customer base to drive revenue from system upgrades, sales of additional licenses of purchased solutions, and sales of new or add-on solutions. To efficiently penetrate emerging global markets, we leverage indirect sales channels, including sales through reseller agreements, marketing agreements and agreements with third-party logistics providers. To extend our market coverage, generate new business leads and provide access to trained implementation personnel, we leverage strategic alliances with systems integrators skilled at implementing our solutions. Business referrals and leads are positively influenced by systems integrators, which include most of the large consulting firms and other systems consulting firms specializing in our targeted industries.
10
Our Manhattan Value Partner (Manhattan MVP™) and Manhattan GeoPartner™ programs foster joint sales and marketing with other organizations. Manhattan Value Partners are proven software and hardware providers, trusted third-party integrators and consultants who bring added value to customer engagements through vertical industry knowledge or technical specialization. Manhattan MVPs support and complement our supply chain solutions so we can provide customers with a comprehensive approach that is suited to their business requirements. This collaborative program is designed to benefit both Manhattan and our partners through tailored joint marketing, sales and, in some cases, co-development efforts. Among others, Manhattan MVPs include Accenture, Deloitte, IBM, Microsoft and Motorola. Manhattan GeoPartners represent a select group of companies that sell and implement our solutions in specific geographies around the world, each providing valuable localized expertise to meet customer needs in areas such as Western Europe, Eastern Europe, Russia, the Middle East, Latin America, Africa and the Asia Pacific region.
Customers
To date, our customers have been suppliers, manufacturers, distributors, retailers and logistics providers in a variety of industries. The following table sets forth a representative list of customers that contracted to purchase solutions and services from us in 2009.
ACCO Brands Benelux
ACH Food Companies Inc.
American Clubs
American Textile Company, Inc.
Amerisource Bergen
APL Co.
Archbrook Laguna
Avon Products, Inc.
Better Life Commercial Chain Share Co.
Brinkmann Corporation
BUT International SAS
Carolina Logistics Services LLC
CEVA Logistics Singapore
CEVA Logistics U.S., Inc.
Chanel (Australia)
CJSC Proconsim
Complete Entertainment Services LTD
Costa Group Pty
Daqing Qingkelong Chain Commerce & Trade Co.
DHL Logistics Singapore
Dongguan Jiarong Supermarket Co.
ERC LLC
Excell Home Fashions, Inc.
Express Scripts, Inc.
Famous Footwear
Farmacias de Similares
Fasteners for Retail
Fitness Quest, Inc.
Freight Mark Sdn Bhd
Fruit of the Loom
Geba
Genco Distribution Systems, Inc.
Genuine Parts Company
Goya Foods, Inc.
Groveport LLC
Guess?, Inc
Guru Denim, Inc.
Half Price Books
Hayneedle
HoMedics
Houghton Mifflin Company
J&P Cycles, Inc.
J. Knipper and Company, Inc.
Jasco Products Company LLC
Jefferson Smurfit Corporation
Jones Apparel Group
Kem Krest Corporation
Kuehne & Nagel
Kwik Trip, Inc.
Lerentang Medicine Group
LeSaint Logistics
MAN
Marketing Services by Vectra
MARR Russia
Milan Express, Inc.
Mirror Show Management, Inc.
Movianto UK
MTI LLC
Mulberry Group Plc
Nalsani S.A.
New Balance Athletic Shoe, Inc.
Noppies
Orchard Brands, Inc.
O’Reilly Automotive, Inc.
Panalpina Management AG
PepsiCo, Inc.
Perfect 10 Satellite Distribution, Inc.
Performance Team Freight Systems
Performance, Inc.
Propak Development, Inc.
PT Multitrend Indo
Republic National Distributing Company
ResMed Corp.
RGH Enterprises, Inc.
Richline Group, Inc.
River Island Clothing Company
SamsonOpt
Shandong JiaJiaYue Group Co.
Shanghai TingTong Logistics
Sigma-Aldrich
Simplehuman LLC
Southern Wine & Spirits of America, Inc.
SpeedFC, Inc.
Sturm Foods, Inc.
Sulyn Industries, Inc.
Teva Phamaceutical USA
The Bear Factory Limited
The Beistle Company
The Orvis Company
The Travis Association for the Blind
Thermwell Products Co., Inc.
Tractor Supply Company
True Religion
United Natural Foods, Inc.
Vanity Fair Brands Europe
Vie Cosmetics Group
Weldom
Wirtz Corporation
WWRD United Kingdom
Yarrows Family Bakers
Our top five customers in aggregate accounted for 11% of total revenue for each of the years ended December 31, 2009 and 2008 and 13% of total revenue for the year ended December 31, 2007, respectively. No single customer accounted for more than 10% of revenue in 2009, 2008 or 2007.
11
Product Development
We focus our development efforts on adding new functionality to existing solutions; integrating our various solution offerings; enhancing the operability of our solutions across our Supply Chain Process Platform and across distributed and alternative hardware platforms, operating systems and database systems; and developing new solutions. We believe that our future success depends, in part, on our ability to continue to enhance existing solutions, to respond to dynamically changing customer requirements, and to develop new or enhanced solutions that incorporate new technological developments and emerging supply chain and industry standards. To that end, development frequently focuses on base system enhancements and incorporating new user requirements and features into our solutions. As a result, we deliver packaged, highly configurable solutions with increasingly rich functionality rather than custom-developed software. We also deliver interface toolkits for many major ERP systems to enhance communication and improve data flows between our core solutions and our clients’ host systems.
We leverage internal and external scientific advisors to inform our solution strategies and research and development approaches with the most advanced thinking on supply chain opportunities, challenges and technologies. Our internal research team is comprised of Ph.D.-credentialed math and science experts who work on creating and solving algorithms and other constructs that advance the optimization capabilities and other aspects of our solutions. Our external Science Advisory Board unites the thinking of experts from leading educational institutions known for their supply chain disciplines, and practitioners from organizations deploying supply chain technology in innovative and market-advancing ways. Together, our Research Team and Science Advisory Board inform both the practical business approaches and the mathematical and scientific inventiveness of our solutions.
We conduct most development internally in order to retain development knowledge and promote programming standards continuity. However, we may periodically outsource some projects that can be performed separately and/or that require special skills. We also use third-party research and development companies to localize our products into Chinese, French, Japanese, and Spanish. Since 2002 we have operated a development center in Bangalore, India, which houses approximately 450 research and development professionals.
Our research and development expenses for the years ended December 31, 2009, 2008 and 2007 were $36.7 million, $48.4 million and $46.6 million, respectively. We intend to continue to invest significantly in product development.
Competition
Our solutions are solely focused on the supply chain planning and execution markets, which have been consolidating rapidly, are intensely competitive, and are characterized by rapid technological change. The principal competitive factors affecting the markets for our solutions include: industry expertise; company and solution reputation; company viability; compliance with industry standards; solution architecture; solution functionality and features; integration experience, particularly with ERP providers and material handling equipment providers; ease and speed of implementation; proven return on investment; historical and current solution quality and performance; total cost of ownership; solution price; and ongoing solution support structure. We believe that we compete favorably with respect to each of these factors.
Our competitors are diverse and offer a variety of solutions directed at various aspects of the supply chain, as well as at the enterprise as a whole. Our existing competitors include:
| | • | | Corporate information technology departments of current or potential customers capable of internally developing solutions; |
| |
| | • | | Enterprise Resource Planning (ERP) vendors, including Oracle, SAP, and Infor, among others; |
| |
| | • | | Supply chain execution vendors, including RedPrairie Holding, Inc., HighJump Software Inc., CDC Software Corporation and Sterling Commerce, Inc. (an AT&T company), among others; |
| |
| | • | | Supply chain planning vendors, including JDA Software Group, Inc., and SAS Institute Inc., among others; and |
| |
| | • | | Smaller independent companies that have developed or are attempting to develop supply chain execution solutions and/or supply chain planning solutions that apply in specific countries and/or globally. |
We anticipate facing increased competition from ERP and Supply Chain Management (SCM) applications vendors and business application software vendors that may broaden their solution offerings by internally developing or by acquiring or partnering
12
with independent developers of supply chain planning and execution software. For instance, both Oracle and SAP have entered the market for supply chain management applications. Compared with us, these companies and other competitors and potential competitors have longer operating histories; significantly more financial, technical, marketing and other resources; greater name recognition; broader solutions; and larger installed bases of customers. To the extent that ERP and SCM vendors or other large competitors develop or acquire systems with functionality comparable or superior to ours, their larger customer bases, long-standing customer relationships, and ability to offer broader solutions outside the scope of supply chain could create significant competitive advantage for them. It also is possible that new competitors or alliances among current and/or new competitors may emerge to win significant market share. Increased competition could result in price reductions, fewer customer orders, reduced earnings and margins and loss of market share. In turn, this could have a material adverse effect on our business, results of operations, cash flow, and financial condition.
We believe we have established meaningful competitive advantages and have built barriers to market entry through our supply chain expertise; our platform-based solution approach; our track record of continuous supply chain innovation and investment; our strong and endorsing customer relationships; our significant success in deploying and supporting supply chains for market-leading companies; and our ability to out-execute others in identifying sales opportunities and demonstrating expertise throughout the sales cycle. However, to further our market success, we must continue to respond promptly and effectively to technological change and competitors’ innovations. Consequently, we cannot assure that we will not be required to make substantial additional investments in research, development, marketing, sales and customer service efforts in order to meet any competitive threat, or that we will be able to compete successfully in the future.
International Operations: Segments
We have three reporting segments, based on geographic location: the Americas; Europe, Middle East and Africa (“EMEA”); and Asia Pacific (“APAC”). For further information on our segments, see Note 8 to our consolidated financial statements. Our international revenue was approximately $58.0 million, $81.5 million and $68.7 million for the years ended December 31, 2009, 2008 and 2007, respectively, which represents approximately 24%, 24% and 20% of our total revenue for the years ended December 31, 2009, 2008 and 2007, respectively. International revenue includes all revenue derived from sales to customers outside the United States. We now have approximately 930 employees outside the United States.
Proprietary Rights
We rely on a combination of copyright, trade secret, trademark, service mark and trade dress laws, confidentiality procedures and contractual provisions to protect our proprietary rights in our products and technology. We have registered trademarks for Manhattan Associates and the Manhattan Associates logo, as well as Manhattan SCOPE, SCOPE and a number of solutions and features. We also have trademark applications submitted for Manhattan SCALE, SCALE, Manhattan MORE, Transportation Lifecycle Management, Order Lifecycle Management, Distributed Order Management, Extended Enterprise Management and Flow Management. We generally enter into confidentiality and assignment-of-rights agreements with our employees, consultants, clients and potential clients and limit access to, and distribution of, our proprietary information. We license our solutions to our customers and restrict the customer’s use for internal purposes and do not give customers the right to sublicense the solutions. However, we believe that this provides us only limited protection. Despite our efforts to safeguard and maintain our proprietary rights both in the United States and abroad, we cannot ensure that we will successfully deter misappropriation or independent third-party development of our technology, or that we can prevent an unauthorized third party from copying or obtaining and using our products or technology. In addition, policing unauthorized use of our solutions is difficult, and while we are unable to determine the extent to which piracy of our software solutions exists, as is the case with any software company, piracy could become a problem.
As the number of supply chain management solutions increases and solution functionality continues to overlap, companies that develop software may increasingly become subject to claims of infringement or misappropriation of intellectual property rights. Third parties may assert infringement or misappropriation claims against us in the future for current or future products. Any claims or litigation, with or without merit, could be time-consuming, result in costly litigation, divert management’s attention and cause product shipment delays or require us to enter into royalty or licensing arrangements. Any royalty or licensing arrangements, if required, may not be available on terms acceptable to us, if at all, which could have a material adverse effect on our business, financial condition and results of operations. Adverse determinations in such claims or litigation could also have a material adverse effect on our business, financial condition and results of operations.
We may be subject to additional risks as we enter into transactions in countries where intellectual property laws are not well developed or are poorly enforced. Legal protections of our rights may be ineffective in such countries. Litigation to defend and
13
enforce our intellectual property rights could result in substantial costs and diversion of resources, and could have a material adverse effect on our business, financial condition and results of operations, regardless of the final litigation outcome. Despite our efforts to safeguard and maintain our proprietary rights both in the United States and abroad, we cannot assure that we will be successful in doing so, or that the steps we take in this regard will adequately deter misappropriation or independent third party development of our technology, or effectively prevent an unauthorized third party from copying or otherwise obtaining and using our products or technology. Any of these events could have a material adverse effect on our business, financial condition and results of operations.
Employees
As of December 31, 2009, we employed 1,819 full time people, including 146 in sales and marketing, 873 in services, 641 in research and development (“R&D”) and 159 in general and administration. By geography, we have 889 employees based in the Americas, 143 employees in EMEA, and 787 employees in APAC and India.
Available Information
We file annual, quarterly and current reports and other information with the Securities and Exchange Commission (the “SEC” or the “Commission”). These materials can be inspected and copied at the SEC’s Public Reference Room at 100 F Street, N.E., Washington, D.C. 20549. Copies of these materials may also be obtained by mail at prescribed rates from the SEC’s Public Reference Room at the above address. Information about the Public Reference Room can be obtained by calling the SEC at 1-800-SEC-0330. The SEC also maintains an Internet site that contains reports, proxy and information statements, and other information regarding issuers that file electronically with the SEC. The address of the SEC’s Internet site is www.sec.gov.
On our website, www.manh.com, we provide free of charge our Annual Report on Form 10-K, Quarterly Reports on Form 10-Q and Current Reports on Form 8-K, and any amendments thereto, as soon as reasonably practicable after they have been electronically filed or furnished to the SEC. Information contained on our website is not part of this Form 10-K or our other filings with the SEC.
Additionally, our code of business conduct and ethics and the charters of the Audit, Compensation and Nomination and Governance Committees of the Board of Directors are available on our website.
Item 1A.Risk Factors
You should consider the following factors in evaluating our business or an investment in our common stock. If any of the following or other risks actually occurs, our business, results of operations, cash flow and financial condition could be materially adversely affected. In such case, the trading price of our common stock could decline.
Our performance can be negatively impacted by global macroeconomic or other external influences which could have a material adverse effect on our business, results of operations, cash flow and financial condition. We are a technology company selling technology-based solutions with total pricing, including software and services, in many cases, exceeding $1.0 million. Reductions in the capital budgets of our customers and prospective customers could have an adverse impact on our ability to sell our solutions. We believe that the deterioration in the current business climate within the United States and/or other geographic regions in which we operate, continued delays in capital spending, or the timing of deals closed could have a material adverse impact on our business and our ability to compete, and is likely to further intensify in our already intensely competitive markets.
Disruptions in the financial and credit markets and economic downturns may adversely affect our business, results of operations, cash flow and financial condition.Demand for our products depends in large part upon the level of capital and maintenance expenditures by many of our customers. Decreased capital and maintenance spending could have a material adverse effect on the demand for our products and our business, results of operations and financial condition. Disruptions in the financial markets, including the bankruptcy or restructuring of certain financial institutions, such as the events that began in the second half of 2008 and are continuing to some extent presently, may adversely impact the availability of credit already arranged and the availability and cost of credit in the future, which could result in the delay or cancellation of projects or capital programs on which our business depends. Our revenue declined from $337.2 million for the year ended December 31, 2008 to $246.7 million for the year ended December 31, 2009, which we believe was due in large part to disruptions in the financial and credit markets and economic downturns
14
In addition, continuing weakness or further deterioration in regional economies or the world economy could negatively impact the capital and maintenance expenditures of our customers and end users. There can be no assurance that government responses to the disruptions in the financial markets or to weakening economies will restore confidence, stabilize markets or increase liquidity and the availability of credit. These conditions may reduce the willingness or ability of our customers and prospective customers to commit funds to purchase our products and services, or their ability to pay for our products and services after purchase.
We may not be able to continue to successfully compete with other companies. We compete in markets that are intensely competitive and are expected to become more competitive as current competitors expand their product offerings. Our current competitors come from many segments of the software industry and offer a variety of solutions directed at various aspects of the extended supply chain, as well as the enterprise as a whole. We face competition for product sales from:
| | • | | the corporate information technology departments of current or potential customers capable of internally developing solutions; |
| |
| | • | | Enterprise Resource Planning (ERP) vendors, including Oracle, SAP, and Infor, among others; |
| |
| | • | | supply chain execution vendors, including RedPrairie Holding, Inc., HighJump Software Inc., CDC Software Corporation and Sterling Commerce, Inc. (an AT&T company), among others; |
| |
| | • | | supply chain planning vendors, including JDA Software Group, Inc., and SAS Institute Inc., among others; and |
| |
| | • | | smaller independent companies that have developed or are attempting to develop supply chain execution solutions and/or supply chain planning solutions that competes with our Supply Chain Solutions. |
We anticipate facing increased competition in the future from ERP and SCM applications vendors and business application software vendors that may broaden their solution offerings by internally developing or by acquiring or partnering with independent developers of supply chain planning and execution software. For instance, both Oracle and SAP have entered the market for supply chain management applications. These companies, and many of our other competitors and potential competitors, have longer operating histories, significantly greater financial, technical, marketing and other resources, greater name recognition, a broader offering of products and a larger installed base of customers than we do. To the extent such ERP and SCM vendors or other large competitors develop or acquire systems with functionality comparable or superior to our solutions, their significant installed customer bases, long-standing customer relationships and ability to offer a broad solution could provide them a significant competitive advantage over our solutions. In addition, it is possible that new competitors or alliances among current and new competitors may emerge and rapidly gain significant market share. Increased competition could result in price reductions, fewer customer orders, reduced earnings and margins and loss of market share. In turn, this could have a material adverse effect on our business, results of operations, cash flow and financial condition.
We believe that the domain expertise required to continually innovate targeted supply chain technology, effectively and efficiently implement solutions, identify and attracting sales opportunities, and compete successfully in the sales cycle provides us with a competitive advantage and is a significant barrier to market entry. However, in order to be successful in the future, we must continue to respond promptly and effectively to technological change and competitors’ innovations, and consequently we cannot assure you that we will not be required to make substantial additional investments in connection with our research, development, marketing, sales and customer service efforts in order to meet any competitive threat, or that we will be able to compete successfully in the future. Some of our competitors have significant resources at their disposal, and the degree to which we will compete with these new products in the marketplace is still undetermined.
Our operating results are substantially dependent on one line of business. We continue to derive our revenues from sales of our SCM solutions software and related services and hardware. Any factor adversely affecting the markets for SCM solutions could have an adverse effect on our business, results of operations, cash flow and financial condition. Accordingly, our future operating results will depend on the demand for our SCM products and related services and hardware by our customers, including new and enhanced releases that we subsequently introduce. We cannot assure you that the market will continue to demand our current products or that we will be successful in marketing any new or enhanced products. If our competitors release new products that are superior to our products in performance or price, demand for our products may decline. A decline in demand for our products as a result of competition, technological change or other factors would reduce our total revenues and harm our ability to maintain profitability.
Our operating results are difficult to predict and could cause our stock price to fall. Our quarterly revenue and operating results are difficult to predict and may fluctuate significantly from quarter to quarter. If our quarterly revenue or operating results fall below the expectations of investors or public market analysts, the price of our common stock could fall substantially. Our quarterly
15
revenue is difficult to forecast for several reasons, including the following: the varying sales cycle for our products and services from customer to customer, including multiple levels of authorization required by some customers; the varying demand for our products; customers’ budgeting and purchasing cycles; potential deferral of license revenue well after entering into a license agreement due to extended payment terms, significant software modifications, future software functionality deliverables or other negotiated terms that preclude software revenue recognition under U.S. general accepted accounting principles; delays in our implementations at customer sites; timing of hiring new services employees and the rate at which these employees become productive; timing of introduction of new products; development and performance of our distribution channels; market and economic disruptions; and timing of any acquisitions and related costs.
As a result of these and other factors, our license revenue is difficult to predict. Because our revenue from services is largely correlated to our license revenue, a decline in license revenue could also cause a decline in our services revenue in the same quarter or in subsequent quarters. In addition, an increase or decrease in hardware sales, which provide us with lower gross margins than sales of software licenses or services, may cause variations in our quarterly operating results.
Most of our expenses, including employee compensation and rent, are relatively fixed. In addition, our expense levels are based, in part, on our expectations regarding future revenue increases. As a result, any shortfall in revenue in relation to our expectations could cause significant changes in our operating results from quarter to quarter and could result in quarterly losses. As a result of these factors, we believe that period-to-period comparisons of our revenue levels and operating results are not necessarily meaningful. Historical growth rates may not be a good indicator of future operating results. You should not rely on our historical quarterly revenue and operating results to predict our future performance.
Our future revenue is dependent upon continuing license sales which in turn drives sales of post-contract support and professional services.We are dependent on our new customers as well as our large installed customer base to purchase additional software licenses, post-contract support and professional services from us. Our post-contract support agreements are generally for a one-year term and our professional services agreements generally only cover a particular engagement. In future periods customers may not license additional products, and in turn may not renew post-contract support agreements or purchase additional professional services from us. If our customers decide not to license or purchase these products and services from us, or if they reduce the scope of their post-contract support or hosting or professional services agreements, our revenue could decrease, significantly having a material adverse effect on our business, results of operations, cash flow and financial condition.
In addition, many of our customers are using older versions of our products for which we are no longer developing any further upgrades or enhancements. While we intend to migrate our customers who are using these versions to newer versions or products, there can be no assurance that these customers will do so. If customers using older versions of our products decide not to license our current software products, or decide to discontinue the use of our products and associated post-contract support services, our revenue could decrease and our operating results could be materially adversely affected.
We encounter long sales cycles, particularly with our larger customers, which could have an adverse effect on the amount, timing and predictability of our revenue, adversely affecting our business, results of operations, cash flow and financial condition.Our products have lengthy sales cycles, which typically extend from six to twelve months and may take up to several years. Potential and existing customers, particularly larger enterprise customers, often commit significant resources to an evaluation of available solutions and services and require us to expend substantial time and resources in connection with our sales efforts. The length of our sales cycles also varies depending on the type of customer to which we are selling, the product being sold and customer requirements. We may incur substantial sales and marketing expenses and expend significant management effort during this time, regardless of whether we make a sale. Many of the key risks relating to sales processes are beyond our control, including: our customers’ budgetary and scheduling constraints; the timing of our customers’ budget cycles and approval processes; our customers’ willingness to replace their currently deployed software solutions; and general economic conditions.
As a result of these lengthy and uncertain sales cycles of our products and services, it is difficult for us to predict when customers may purchase products or services from us, thereby affecting when we can recognize the associated revenue, and our operating results may vary significantly and may be adversely affected. The length of our sales cycle makes us susceptible to having pending transactions delayed or terminated by our customers if they decide to delay or withdraw funding for IT projects. Our customers may decide to delay or withdraw funding for IT projects for various reasons, including, but not limited to, global economic cycles and capital market fluctuations.
Delays in implementations of our products could adversely impact us. Due to the size of most of our software implementations, our implementation cycle can be lengthy and may result in delays. Our products may require modification or
16
customization and must integrate with many existing computer systems and software programs of our customers. This can be time-consuming and expensive for customers and can result in implementation and deployment delays of our products. Additional delays could result if we fail to attract, train and retain services personnel, or if our alliance companies fail to commit sufficient resources towards implementing our software. These delays and resulting customer dissatisfaction could limit our future sales opportunities, impact revenue and harm our reputation.
Our pricing models may need to be modified due to price competition.The competitive markets in which we operate may oblige us to reduce our prices in order to contend with the pricing models of our competitors. If our competitors discount certain products or services, we may choose to lower prices on certain products or services in order to attract or retain customers. Any such price modifications would likely reduce margins and could adversely affect our business, results of operations, cash flow and financial condition.
Our ability to license our software is highly dependent on the quality of our services offerings, and our failure to offer high quality services could adversely affect our software licensing revenue and results of operations.Most of our customers rely to some extent on our professional services to aid in the implementation of our software solutions. Once our software has been installed and deployed, our customers may depend on us to provide them with ongoing support and resolution of issues relating to our software. Therefore, a high level of service is critical for the continued marketing and sale of our solutions. If we or our partners do not efficiently and effectively install and deploy our software products, or succeed in helping our customers quickly resolve post-deployment issues, our ability to sell software products to these customers would be adversely affected and our reputation in the marketplace and with potential customers could suffer. In turn, our business, results of operations, cash flow and financial condition could be materially adversely affected.
Our failure to manage the growth of our operations may adversely affect our business, results of operations, cash flow and financial condition. We plan to continue to increase the scope of our operations domestically and internationally. This growth may place a significant strain on our management systems and resources. We may further expand domestically or internationally through internal growth or through acquisitions of related companies and technologies. For us to effectively manage our growth, we must continue to: maintain continuity in our executive officers; develop the management skills of our managers and supervisors; attract, retain, train and motivate our employees; improve our operational, financial and management controls; improve our reporting systems and procedures; and enhance management and information control systems.
Our international operations have many associated risks. We continue to expand our international operations, and these efforts require significant management attention and financial resources. We may not be able to successfully penetrate international markets or if we do, there can be no assurance that we will grow our business in these markets at the same rate as in North America. Because of the complex nature of this expansion, it may adversely affect our business, results of operations, cash flow and financial condition.
In the last several years, we opened new international offices in China, France, Australia, India, Japan and Singapore. These openings constituted a substantial expansion of our international presence, which, prior to 2002, consisted principally of offices in the United Kingdom and the Netherlands. We have committed resources to the opening and integration of international sales offices and the expansion of international sales and support channels. Our efforts to develop and expand international sales and support channels may not be successful. International sales are subject to many risks and difficulties, including those arising from the following: building and maintaining a competitive presence in new markets; staffing and managing foreign operations; managing international systems integrators; complying with a variety of foreign laws; producing localized versions of our products; import and export restrictions and tariffs; enforcing contracts and collecting accounts receivable; unexpected changes in regulatory requirements; reduced protection for intellectual property rights in some countries; potential adverse tax treatment; less stringent adherence to ethical and legal standards by prospective customers in some countries; language and cultural barriers; currency fluctuations; political and economic instability abroad; and seasonal fluctuations may arise from the lower sales that typically occur during the summer months in Europe and other parts of the world.
Our operating results may include foreign currency gains and losses.Due to our international operations, we conduct a portion of our business in currencies other than the United States dollar. Our revenues, expenses, operating profit and net income are affected when the dollar weakens or strengthens in relation to other currencies. In addition, we have a large development center in Bangalore, India that does not have a natural in market revenue hedge to mitigate currency risk to our operating expense in India. Fluctuations in the value of other currencies, particularly the Indian rupee on expenses, can significantly affect our revenues, expenses, operating profit and net income.
17
Fluctuations in our hardware sales may adversely affect us.A portion of our revenue in any period is comprised of the resale of a variety of third-party hardware products to purchasers of our software. Our customers may choose to purchase this hardware directly from manufacturers or distributors of these products. We view sales of hardware as non-strategic. We perform this service to our customers seeking a single source for their supply chain execution needs. Hardware sales are difficult to forecast and fluctuate from quarter to quarter, leading to unusual comparisons of total revenue and fluctuations in profits. If we are not able to increase our revenue from software licenses and services or maintain our hardware revenue, our business, results of operations, cash flow and financial condition may be adversely affected.
Our technology must be advanced if we are to remain competitive. The market for our products is characterized by rapid technological change, frequent new product introductions and enhancements, changes in customer demands and evolving industry standards. Our existing products could be rendered obsolete if we fail to continue to advance our technology. We have also found that the technological life cycles of our products are difficult to estimate, partially because of changing demands of other participants in the supply chain. We believe that our future success will depend upon our ability to continue to enhance our current product line while we concurrently develop and introduce new products that keep pace with competitive and technological developments. These developments require us to continue to make substantial product development investments. Although we are presently developing a number of product enhancements to our product sets, we cannot assure you that these enhancements will be completed on a timely basis or gain customer acceptance.
Our research and development activities may not generate significant returns.Developing our products and software is costly, and recovering our investment in product development may take a lengthy amount of time, if it occurs at all. We anticipate continuing to make significant investments in software research and development and related product opportunities because we believe that we must continue to allocate a significant amount of resources to our research and development activities in order to compete successfully. We cannot estimate with any certainty when we will, if ever, receive significant revenues from these investments.
Our liability to clients may be substantial if our systems fail. Our products are often critical to the operations of our customers’ businesses and provide benefits that may be difficult to quantify. If our products fail to function as required, we may be subject to claims for substantial damages. Courts may not enforce provisions in our contracts that would limit our liability or otherwise protect us from liability for damages. Defending a lawsuit, regardless of its merit, could be costly and divert management’s time and attention. Although we maintain general liability insurance coverage, including coverage for errors or omissions, this coverage may not continue to be available on reasonable terms or in sufficient amounts to cover claims against us. In addition, our insurer may disclaim coverage as to any future claim. If claims exceeding the available insurance coverage are successfully asserted against us, or our insurer imposes premium increases, large deductibles or co-insurance requirements on us, our business, results of operations, cash flow and financial condition could be adversely affected.
We incorporate third-party software in our solutions, the failure or unavailability of which could adversely affect our ability to sell, support and service our products.We incorporate and include third-party software into and with certain of our products and solutions and expect to continue to do so. The operation of our products could be impaired if errors occur in the third-party software that we use. It may be more difficult for us to correct any defects in third-party software because the development and maintenance of the software is not within our control. Accordingly, our business could be adversely affected in the event of any errors in this software.
In addition, there can be no assurance that these third parties will continue to make their software available to us on acceptable terms, or at all; not make their products available to our competitors on more favorable terms; invest the appropriate levels of resources in their products and services to maintain and enhance the capabilities of their software; or remain in business. Any impairment in our relationship with these third parties or our ability to license our otherwise use their software could have a material adverse effect on our business, results of operations, cash flow and financial condition.
The use of open source software in our products may expose us to additional risks and harm our intellectual property.Some of our products use or incorporate software that is subject to one or more open source licenses. Open source software is typically freely accessible, usable and modifiable. Certain open source software licenses require a user who intends to distribute the open source software as a component of the user’s software to disclose publicly part or all of the source code to the user’s software. In addition, certain open source software licenses require the user of such software to make any derivative works of the open source code available to others on unfavorable terms or at no cost. This can subject previously proprietary software to open source license terms.
18
While we monitor the use of all open source software in our products, processes and technology and try to ensure that no open source software is used in such a way as to require us to disclose the source code to the related product or solution, such use could inadvertently occur. Additionally, if a third-party software provider has incorporated certain types of open source software into software we license from such third party for our products and solutions, we could, under certain circumstances, be required to disclose the source code to our products and solutions. This could harm our intellectual property position and have a material adverse effect on our business, results of operations, cash flow and financial condition.
If we are unable to develop software applications that interoperate with computing platforms developed by others, our business, results of operations, cash flow and financial condition may be adversely affected.We develop software applications that interoperate with operating systems, database platforms and hardware devices developed by others, which we refer to collectively as computing platforms. If the developers of these computing platforms do not cooperate with us or we are unable to devote the necessary resources so that our applications interoperate with those computing platforms, our software development efforts may be delayed and our business and results of operations may be adversely affected. When new or updated versions of these computing platforms are introduced, it is often necessary for us to develop updated versions of our software applications so that they interoperate properly with these computing platforms. We may not accomplish these development efforts quickly or cost-effectively, and it is difficult to predict what the relative growth rates of adoption of these computing platforms will be. These development efforts require substantial investment, the devotion of substantial employee resources and the cooperation of the developers of the computing platforms. For some computing platforms, we must obtain some proprietary application program interfaces from the owner in order to develop software applications that interoperate with the computing platforms. Computing platform providers have no obligation to assist in these development efforts. If they do not provide us with assistance or the necessary proprietary application program interfaces on a timely basis, we may experience delays or be unable to expand our software applications into other areas.
The computing platforms we use may not continue to be available to us on commercially reasonable terms. Any loss of the right to use any of these systems could result in delays in the provision of our products and services and our results of operations may be adversely affected. Defects in computing platforms could result in errors or a failure of our products which could harm our business.
Our software may contain undetected errors or “bugs,” resulting in harm to our reputation and operating results. Software products as complex as those offered by us might contain undetected errors or failures when first introduced or when new versions are released. We cannot assure you, despite testing by us and by current and prospective customers that errors will not be found in new products or product enhancements after commercial release. Any errors found could cause substantial harm to our reputation, result in additional unplanned expenses to remedy any defects, delay the introduction of new products, result in the loss of existing or potential customers and/or cause a loss in revenue. Further, such errors could subject us to claims from our customers for significant damages, and we cannot assure you that courts would enforce the provisions in our customer agreements that limit our liability for damages. In turn, our business, results of operations, cash flow and financial condition could be materially adversely affected.
Our business may require additional capital. We may require additional capital to finance our growth or to fund acquisitions or investments in complementary businesses, technologies or product lines. Our capital requirements may be impacted by many factors, including: demand for our products; the timing of and extent to which we invest in new technology; the timing of and extent to which we acquire other companies; the level and timing of revenue; the expenses of sales and marketing and new product development; the success and related expense of increasing our brand awareness; the cost of facilities to accommodate a growing workforce; the extent to which competitors are successful in developing new products and increasing their market share; and the costs involved in maintaining and enforcing intellectual property rights.
To the extent that our resources are insufficient to fund our future activities, we may need to raise additional funds through public or private financing. However, additional funding, if needed, may not be available on terms attractive to us, or at all. In addition, since we have historically financed our growth through cash flow from operations and available cash, our relative inexperience in accessing the credit or capital markets may impair our ability to do when if the need arises. Our inability to raise capital when needed could have a material adverse effect on our business, results of operations, cash flow and financial condition. If additional funds are raised through the issuance of equity securities, the percentage ownership of our company by our current shareholders would be diluted.
Our inability to attract, integrate and retain management and other personnel may adversely affect us.Our success greatly depends on the continued service of our executives, as well as our other key senior management, technical and sales personnel. Our success will depend on the ability of our executive officers to work together as a team. The loss of any of our senior management
19
or other key professional services, research and development, sales and marketing personnel—particularly if they are lost to competitors—could impair our ability to grow our business. We do not maintain key man life insurance on any of our executive officers.
Our future success will depend in large part upon our ability to attract, retain and motivate highly skilled employees. We face significant competition for individuals with the skills required to perform the services we offer, and thus we may encounter increased compensation costs that are not offset by increased revenue. We cannot assure you that we will be able to attract and retain sufficient numbers of these highly skilled employees or to motivate them. Because of the complexity of the SCM market, we may experience a significant time lag between the date on which technical and sales personnel are hired and the time at which these persons become fully productive.
Our growth is dependent upon the successful development of our direct and indirect sales channel mix. We believe that our future growth also will depend on developing and maintaining a successful direct sales force and strategic relationships with systems integrators and other technology companies. Our strategy is to continue to increase the proportion of customers served through direct and indirect channels. We are currently investing, and plan to continue to invest, significant resources to develop our sales channels. This investment could adversely affect our operating results if these efforts do not generate license and service revenue necessary to offset this investment. Also, our inability to partner with other technology companies and qualified systems integrators could adversely affect our results of operations. Because lower unit prices are typically charged on sales made through indirect channels, increased indirect sales disproportionate to direct sales could reduce our average selling prices and result in lower gross margins and earnings. In addition, sales of our products through indirect channels will reduce our consulting service revenues, as the third-party systems integrators provide these services. As indirect sales increase, our direct contact with our customer base will decrease, and we may have more difficulty accurately forecasting sales, evaluating customer satisfaction and recognizing emerging customer requirements. In addition, these systems integrators and third-party software providers may develop, acquire or market products competitive with our products.
Our strategy of marketing our products directly to customers and indirectly through systems integrators and other technology companies may result in distribution channel conflicts. Our direct sales efforts may compete with those of our indirect channels and, to the extent different systems integrators target the same customers, systems integrators may also come into conflict with each other. Any channel conflicts that develop may have a material adverse effect on our relationships with systems integrators or harm our ability to attract new systems integrators.
Our employee retention and hiring may be hindered by immigration restrictions.Foreign nationals who are not U.S. citizens or permanent residents constitute a significant part of our professional U.S. workforce. Our ability to hire and retain these workers, and their ability to remain and work in the U.S. are impacted by laws and regulations as well as by processing procedures of various government agencies. Changes in laws, regulations or procedures may adversely affect our ability to hire or retain such workers and may affect our costs of doing business and/or our ability to deliver services.
Our failure to adequately protect our proprietary rights may adversely affect us. Our success and ability to compete is dependent in part upon our proprietary technology. We cannot assure you that we will be able to protect our proprietary rights against unauthorized third-party copying or use. We rely on a combination of copyright, trademark and trade secret laws, as well as confidentiality agreements, licensing arrangements, and contractual commitments, to establish and protect our proprietary rights. Despite our efforts to protect our proprietary rights, existing copyright, trademark and trade secret laws afford only limited protection. In addition, the laws of certain foreign countries do not protect our rights to the same extent, as do the laws of the United States. Attempts may be made to copy or reverse engineer aspects of our products or to obtain and use information that we regard as proprietary. Any infringement of our proprietary rights could negatively impact our future operating results. Furthermore, policing the unauthorized use of our products is difficult, and litigation may be necessary in the future to enforce our intellectual property rights, to protect our trade secrets or to determine the validity and scope of the proprietary rights of others. Litigation could result in substantial costs and diversion of resources. In turn, our business, results of operations, cash flow and financial condition could be materially adversely affected.
Our liability for intellectual property claims can be costly and result in the loss of significant rights. It is possible that third parties will claim that we have infringed their current or future products. We expect that SCM software developers like us will increasingly be subject to infringement claims as the number of products grows. Any claims, with or without merit, could be time-consuming, result in costly litigation, cause product shipment delays or require us to pay monetary damages or to enter into royalty or licensing agreements, any of which could negatively impact our operating results. We cannot assure you that these royalty or licensing agreements, if required, would be available on terms acceptable to us, if at all. We also may be required to indemnify our customers
20
for damages they suffer as a result of such infringement. We cannot assure you that legal action claiming patent infringement will not be commenced against us, or that we would prevail in litigation given the complex technical issues and inherent uncertainties in patent litigation. If a patent claim against us was successful and we could not obtain a license on acceptable terms or license a substitute technology or redesign to avoid infringement, we may be prevented from distributing our software or required to incur significant expense and delay in developing non-infringing software. Any of these events could seriously harm our business, results of operations, cash flow and financial condition.
Mergers or other strategic transactions involving our competitors could weaken our competitive position or reduce our revenue.Our competitors have been consolidating, which may make them more formidable competitors to us. Competing with stronger companies may cause us to experience pricing pressure and loss of market share, either of which could have a material adverse effect on our business, results of operations, cash flow and financial condition. Our competitors may establish or strengthen their cooperative relationships with vendors, systems integrators, third-party consulting firms or other parties. Established companies may not only develop their own products but may also acquire or partner with our current competitors. If any of these events occur, our revenue and profitability could significantly decline.
Our business, results of operations, cash flow and financial condition may be adversely affected if we cannot integrate acquired companies or manage joint ventures.We may from time to time acquire companies with complementary products and services. These acquisitions will expose us to increased risks and costs, including those arising from the following: assimilating new operations and personnel; diverting financial and management resources from existing operations; and integrating acquired technologies. We may not be able to generate sufficient revenue from any of these acquisitions to offset the associated acquisition costs.
We will also be required to maintain uniform standards of quality and service, controls, procedures and policies. Our failure to achieve any of these standards may hurt relationships with customers, employees and new management personnel. In addition, future acquisitions may result in additional issuances of stock that could be dilutive to our shareholders.
Many acquisition candidates have significant intangible assets, and an acquisition of these businesses would likely result in significant amounts of goodwill and other intangible assets. Goodwill and certain other intangible assets are not amortized to income, but are subject to at least annual impairment reviews. If the acquisitions do not perform as planned, future charges to income arising from such impairment reviews could be significant. Likewise, future quarterly and annual earnings could be significantly adversely affected. In addition, these acquisitions could involve acquisition-related charges, such as one-time acquired research and development charges.
We may also evaluate joint venture relationships with complementary businesses. Any joint venture we enter into would involve many of the same risks posed by acquisitions, particularly the following: risks associated with the diversion of resources; the inability to generate sufficient revenue; the management of relationships with third parties; and potential additional expenses.
Our stock price has been highly volatile. The trading price of our common stock has fluctuated significantly since our initial public offering in April 1998. In addition, the trading price of our common stock could be subject to wide fluctuations in response to various factors, including: global macro-economic contraction impacting demand for SCM solutions; quarterly variations in operating results; announcements of technological innovations or new products by us or our competitors; developments with respect to patents or proprietary rights; changes in financial estimates by securities analysts; and mergers, acquisitions and combinations involving our competitors or us.
In addition, the stock market has recently experienced volatility that has particularly affected the market prices of equity securities of many technology companies and that often has been unrelated or disproportionate to the operating performance of these companies. These broad market fluctuations may adversely affect the market price of our common stock.
Our articles of incorporation and bylaws and Georgia law may inhibit a takeover of our company. Our basic corporate documents and Georgia law contain provisions that might enable our management to resist a takeover of our company. These provisions might discourage, delay or prevent a change in the control of our company or a change in our management. These provisions could also discourage proxy contests and make it more difficult for you and other shareholders to elect directors and take other corporate actions. The existence of these provisions could also limit the price that investors might be willing to pay in the future for shares of our common stock.
21
Item 1B.Unresolved Staff Comments
As of December 31, 2009, we do not have any unresolved written comments that we received from the SEC more than 180 days before December 31, 2009.
Item 2.Properties
Our principal administrative, sales, marketing, support and research and development facility is located in approximately 176,000 square feet of modern office space in Atlanta, Georgia. Substantially all of this space is leased to us through September 30, 2018. We have additional offices under multi-year agreements in Indiana. We also occupy facilities outside of the United States under multi-year agreements in the United Kingdom, the Netherlands, France, China, Japan, Singapore, India and Australia. We also occupy offices under short-term agreements in other geographical regions. We believe our office space is adequate to meet our immediate needs; however, we may expand into additional facilities in the future.
Item 3.Legal Proceedings
From time to time, we are party to various legal proceedings arising in the ordinary course of business. The Company is not currently a party to any other legal proceeding the result of which it believes could have a material adverse impact upon its business, financial position or results of operations.
Many of our installations involve products that are critical to the operations of our clients’ businesses. Any failure in our products could result in a claim for substantial damages against us, regardless of our responsibility for such failure. Although we attempt to limit contractually our liability for damages arising from product failures or negligent acts or omissions, there can be no assurance the limitations of liability set forth in our contracts will be enforceable in all instances.
Item 4.Submission of Matters to a Vote of Security Holders
There were no matters submitted to a vote of security holders during the fourth quarter of the fiscal year ended December 31, 2009.
PART II
Item 5.Market for Registrant’s Common Equity, Related Shareholder Matters and Issuer Purchases of Equity Securities
Market for Common Stock
Our common stock is traded on the Nasdaq Global Select Market under the symbol “MANH”. The following table sets forth the high and low closing sales prices of the common stock as reported by the Nasdaq Global Select Market for the periods indicated:
| | | | | | | | | |
| Fiscal Period | | High Price | | Low Price |
2009 | | | | | | | | |
| First Quarter | | $ | 17.32 | | | $ | 13.98 | |
| Second Quarter | | | 19.18 | | | | 14.21 | |
| Third Quarter | | | 20.42 | | | | 15.42 | |
| Fourth Quarter | | | 24.88 | | | | 19.83 | |
2008 | | | | | | | | |
| First Quarter | | $ | 25.75 | | | $ | 21.74 | |
| Second Quarter | | | 26.77 | | | | 21.35 | |
| Third Quarter | | | 25.87 | | | | 21.34 | |
| Fourth Quarter | | | 21.79 | | | | 13.82 | |
22
On February 17, 2010, the last reported sales price of our common stock on the Nasdaq Global Select Market was $24.45 per share. The number of shareholders of record of our common stock as of February 17, 2010 was approximately 30.
We do not intend to declare or pay cash dividends in the foreseeable future. Our management anticipates that all earnings and other cash resources, if any, will be retained for investment in our business.
Equity Compensation Plan Information
The following table provides information regarding our current equity compensation plans as of December 31, 2009:
| | | | | | | | | | | | | |
| | | Number of securities to | | | Weighted-average | | | Number of securities | |
| | | be issued upon exercise | | | exercise price of | | | remaining available for | |
| | | of outstanding options, | | | outstanding options, | | | future issuance under | |
| Plan Category | | warrants and rights | | | warrants and rights | | | equity compensation plans | |
| Equity compensation plans approved by security holders | | | 5,768,961 | | | $ | 25.29 | | | | 2,417,073 | |
| Equity compensation plans not approved by security holders | | | — | | | | — | | | | — | |
| | | | | | | | | | |
| Total | | | 5,768,961 | | | $ | 25.29 | | | | 2,417,073 | |
| | | | | | | | | | |
Additional information regarding our equity compensation plans can be found in Note 2 of the Notes to our Consolidated Financial Statements.
Purchase of Equity Securities
The following table provides information regarding our common stock repurchases under our publicly-announced repurchase program and shares withheld for taxes due upon vesting of restricted stock for the quarter ended December 31, 2009. All repurchases related to the repurchase program were made on the open market.
| | | | | | | | | | | | | | | | | |
| | | | | | | | | | | Total Number of | | | Maximum Number (or | |
| | | | | | | | | | | Shares Purchased as | | | Approximate Dollar Value) | |
| | | Total Number | | | | | | | Part of Publicly | | | of Shares that May Yet Be | |
| | | of Shares | | | Average Price | | | Announced Plans or | | | Purchased Under the Plans | |
| Period | | Purchased(a) | | | Paid per Share | | | Programs | | | or Programs | |
| October 1 - October 31, 2009 | | | 2,653 | | | $ | 20.36 | | | | — | | | $ | 14,985,564 | |
| November 1 - November 30, 2009 | | | — | | | | — | | | | — | | | | 14,985,564 | |
| December 1 - December 31, 2009 | | | 114,932 | | | | 24.28 | | | | 114,932 | | | | 12,195,422 | |
| | | | | | | | | | | | | |
| Total | | | 117,585 | | | $ | 24.19 | | | | 114,932 | | | $ | 12,195,422 | |
| | | | | | | | | | | | | |
| | |
| (a) | | October shares represent shares withheld for taxes due upon vesting of restricted stock. |
During the year ended December 31, 2009, we repurchased a total of 1,371,038 shares at an average price per share of $16.63 under our publicly-announced buy-back program. In January 2010, the Board of Directors approved raising our remaining share repurchase authority from $12.2 million to $25.0 million of Manhattan Associates outstanding common stock.
Item 6.Selected Financial Data
You should read the following selected consolidated financial data in conjunction with our Consolidated Financial Statements and related Notes thereto and with “Management’s Discussion and Analysis of Financial Condition and Results of Operations” included elsewhere in this Form 10-K. The statement of income data for the years ended December 31, 2009, 2008 and 2007, and the balance sheet data as of December 31, 2009 and 2008, are derived from, and are qualified by reference to, the audited
23
financial statements included elsewhere in this Form 10-K. The statement of income data for the years ended December 31, 2006 and 2005 and the balance sheet data as of December 31, 2007, 2006, and 2005 are derived from audited financial statements not included herein. Historical results are not necessarily indicative of results to be expected in the future.
| | | | | | | | | | | | | | | | | | | | | |
| | | Year Ended December 31, |
| | | 2005 | | 2006 | | 2007 | | 2008 | | 2009 |
| | | (in thousands, except per share data) |
Statement of Income Data: | | | | | | | | | | | | | | | | | | | | |
| License revenue | | $ | 57,119 | | | $ | 66,543 | | | $ | 73,031 | | | $ | 65,313 | | | $ | 34,686 | |
| Total revenue | | $ | 246,404 | | | $ | 288,868 | | | $ | 337,401 | | | $ | 337,201 | | | $ | 246,667 | |
| Operating income | | $ | 30,277 | | | $ | 30,755 | | | $ | 43,058 | | | $ | 25,963 | | | $ | 21,142 | |
| Net income | | $ | 18,635 | | | $ | 19,331 | | | $ | 30,751 | | | $ | 22,798 | | | $ | 16,562 | |
| Earnings per diluted share | | $ | 0.64 | | | $ | 0.69 | | | $ | 1.13 | | | $ | 0.94 | | | $ | 0.73 | |
| | | | | | | | | | | | | | | | | | | | | |
| | | December 31, |
| | | 2005 | | 2006 | | 2007 | | 2008 | | 2009 |
| | | (in thousands) |
Balance Sheet Data: | | | | | | | | | | | | | | | | | | | | |
| Cash, cash equivalents and investments | | $ | 93,675 | | | $ | 131,057 | | | $ | 72,772 | | | $ | 88,706 | | | $ | 123,014 | |
| Total assets | | $ | 273,398 | | | $ | 314,893 | | | $ | 271,660 | | | $ | 270,221 | | | $ | 264,711 | |
| Shareholders’ equity | | $ | 205,398 | | | $ | 237,140 | | | $ | 185,705 | | | $ | 179,839 | | | $ | 183,365 | |
Item 7.Management’s Discussion and Analysis of Financial Condition and Results of Operations
All statements, trend analyses and other information contained in the following discussion relative to markets for our products and trends in revenue, gross margins and anticipated expense levels, as well as other statements including words such as “anticipate,” “believe,” “plan,” “estimate,” “expect,” and “intend” and other similar expressions constitute forward-looking statements. These forward-looking statements are subject to business and economic risks and uncertainties, including those discussed under the caption “Risk Factors” in Item 1A of this Form 10-K, and our actual results of operations may differ materially from those contained in the forward-looking statements.
Business Overview
We are a leading developer and implementer of supply chain software solutions that help organizations optimize their supply chain operations from planning through execution. Our platform-based supply chain software solution portfolios – Manhattan SCOPE® and Manhattan SCALETM – are designed to deliver both business agility and total cost of ownership advantages to customers. Manhattan SCOPE (Supply Chain Optimization, Planning through Execution) leverages our Supply Chain Process Platform (SCPP) to unify the full breadth of the supply chain, while Manhattan SCALE (Supply Chain Architected for Logistics Execution) leverages Microsoft’s .NET® platform to unify logistics functions.
Early in the Company’s history, our offerings were heavily focused on warehouse management solutions. As the Company grew in size and scope, its offerings expanded across the entire supply chain. As a result of the Company’s historical beginnings however, we still enjoy significant presence in, and a relatively strong concentration of revenues from, warehouse management solutions, which are a component of our distribution management solution suite. Over time, as our non-warehouse management solutions have proliferated and increased in capability, the Company’s revenue concentration in its management warehouse solutions has correspondingly decreased, a trend we expect to see continue.
Our business model is singularly focused on the development and implementation of complex supply chain software solutions that are designed to optimize supply chain effectiveness and efficiency for our customers. We have three principal sources of revenue:
| | • | | license revenue generated from the sales of our supply chain software; |
24
| | • | | professional services derived from implementing our solutions along with customer support services and software enhancements (services), and |
| |
| | • | | hardware sales and other revenue. |
In 2009, we generated $246.7 million in total revenue with a revenue mix of: license revenues 14%; services 77%; and hardware and other revenue 9%.
We manage our business based on three geographic regions: North America and Latin America (Americas), Europe, Middle East and Africa (EMEA), and Asia Pacific (APAC). Geographic revenue is based on the location of the sale. Our international revenue was approximately $58.0 million, $81.5 million and $68.7 million for the years ended December 31, 2009, 2008 and 2007, respectively, which represents approximately 24%, 24% and 20% of our total revenue for the years ended December 31, 2009, 2008 and 2007, respectively. International revenue includes all revenue derived from sales to customers outside the United States. At December 31, 2009, we employed approximately 1,820 employees worldwide, of which 930 employees are based outside the United States. Of the 930 international employees, approximately 75%, or nearly 720 employees, are located in our India Development Center. We have offices in Australia, China, France, India, Japan, the Netherlands, Singapore and the United Kingdom, as well as representatives in Mexico and reseller partnerships in Latin America.
Global Economic Trends and Industry Factors
Global macro economic trends, technology spending and supply chain management market growth are important barometers for our business. In 2009, approximately 76% of our total revenue is generated in the United States, 11% in EMEA and the balance in APAC, Canada and Latin America. In addition, industry analysts project that approximately two-thirds of every supply chain software solutions dollar invested is spent in the United States; consequently, the health of the U.S. economy has a meaningful impact on our financial results.
We sell technology-based solutions with total pricing, including software and services, in many cases exceeding $1.0 million. Reductions in capital budgets of our customers and prospective customers have had an adverse impact on our ability to sell our solutions, largely we believe as a result of the global economic recession. The deterioration in the current business climate within the United States and geographic regions in which we operate continues to affect customers and prospects decisions regarding timing of strategic capital spend. Timing of deals closed can have a material adverse impact on our business and is likely to further intensify competition in our already highly competitive markets.
In January 2010, the International Monetary Fund (IMF) provided a World Economic Outlook update raising its 2010 world economic growth forecast. The update noted that economic growth solidified and broadened to advanced economies in the second half of 2009. Under the revised outlook, world output is expected to rise by 3.9% in 2010 representing an upward revision of3/4 percentage point from the October 2009 World Economic Outlook. The world economy contracted about 1.0% in 2009. “In most advanced economies, the recovery is expected to remain sluggish by past standards, whereas in many emerging and developing economies, activity is expected to be relatively vigorous, largely driven by buoyant internal demand,” the update observed, and added that advanced economies are not currently expected to recover to pre-crisis levels until 2011. “Moreover, high unemployment rates and public debt, as well as not fully healed financial systems, and in some countries, weak household balance sheets are presenting further challenges to the recovery in these economies,” the update continued. Advanced economies are projected to expand sluggishly through much of 2010 with annual growth of about 2.1%, following a contraction of 3.2% in 2009. The U.S. economy contracted about 2.5% in 2009 and is projected to grow 2.7% in 2010.
Our license revenues in the first half of 2009 totaled $9.0 million down 76% over the first half of 2008 as we closed no license deals greater than $1.0 million. In contrast, we generated $25.6 million in total license revenue in the second half of the year. While this second-half result remains down in a year-over-year comparison, it’s down only 7%. While we saw demand steadily improve in the second half, we believe there continues to be significant uncertainty around the global macro-environment regarding consumer demand, federal government policies and the health of credit markets. We believe companies are continuing to protect their balance sheets by reducing debt and hoarding cash, while continuing to be slower and more cautious regarding strategic capital expenditures.
25
Revenue
License revenue:License revenue, a leading indicator of our business, is primarily derived from software license fees that customers pay for supply chain solutions. In 2009, license revenue totaled $34.7 million, or 14% of total revenue, with gross margins of 86.4%. For the year ended December 31, 2009, Americas, EMEA and APAC recognized $29.6 million, $2.6 million, and $2.4 million in license revenue, respectively. Our annual license revenue percentage mix of new to existing customers was approximately 30% to 70%, and over the past three years has averaged about 40% to 60%. We believe our mix of new customer to existing customer license sales is well balanced, reflecting solid demand from our install base, as well as from new customers in a tough macro-economic environment. License revenue growth is influenced by the strength of general economic and business conditions and the competitive position of our software products. Our license revenue generally has long sales cycles of which the timing of the closing of a few large license transactions can have a material impact on our quarterly license revenues, operating profit, operating margins and earnings per share. For example, $1.0 million of license revenue in 2009 equates to approximately three cents of diluted earnings per share impact.
Our software solutions are singularly focused on the supply chain planning and execution markets, which are intensely competitive, rapidly consolidating and characterized by rapid technological change. We are a market leader in the supply chain management software solutions market as defined by industry analysts such as AMR, ARC and Gartner. Our goal is to extend our position as a leading global supply chain solutions provider by growing our license revenues faster than our competitors. We do anticipate facing increased competition in the future from ERP and SCM applications vendors and business application software vendors that may broaden their solution offerings by internally developing or by acquiring or partnering with independent developers of supply chain planning and execution software. Increased competition could result in price reductions, fewer customer orders, reduced gross margins and loss of market share.
Services revenue:Our services business consists of professional services (consulting and training) and customer support services and software enhancements. In 2009, our services revenue totaled $189.9 million, or 77% of total revenue, with gross margins of 55.6%. The Americas, EMEA and APAC realized $155.8 million, $24.6 million, and $9.5 million, respectively, in services revenue for the year ended December 31, 2009. Professional services accounted for nearly 60% of total services revenue and approximately 45% of total revenue in 2009. When comparing our operating margins to other technology companies, our operating margin profile can be lower due to our large services revenue mix as a percentage of total revenue. While we believe our services margins are very strong, they do lower our overall operating margin as services margins are lower than license revenue margins.
At December 31, 2009, our consulting services business totaled 873 employees, nearly 50% of our total employees worldwide. Our professional services organization provides our customers with expertise and assistance in planning and implementing our solutions. To ensure a successful product implementation, consultants assist customers with the initial installation of a system, the conversion and transfer of the customer’s historical data onto our system, and ongoing training, education and system upgrades. We believe our professional services enable customers to implement our software rapidly, ensure the customer’s success with our solution, strengthen our customer relationships, and add to our industry-specific knowledge base for use in future implementations and product innovations.
Although our consulting services are optional, the majority of our customers use at least some portion of these services for the implementation and ongoing support of our software solutions. Consulting services are typically rendered under time and materials-based contracts with services typically billed on an hourly basis. Professional services are sometimes rendered under fixed-fee based contracts with payments due on specific dates or milestones.
Typically, our consulting services lag license revenue by several quarters, as implementation services are performed after the purchase of the software. Services revenue growth is contingent upon license revenue growth, which is influenced by the strength of general economic and business conditions and the competitive position of our software products. In addition, our consulting services business has competitive exposure to offshore providers and other consulting companies. All of these factors potentially create the risk of pricing pressure, fewer customer orders, reduced gross margins and loss of market share.
For customer support services and software enhancements (CSSE), we offer a comprehensive program that provides our customers with software upgrades when and if available that offer additional or improved functionality and technological advances incorporating emerging supply chain and industry initiatives. We offer 24 hour customer support every day of the year plus software upgrades for an annual fee that is paid in advance.
26
Our CSSE revenues totaled $77.1 million in 2009, representing approximately 40% of services revenue and approximately 30% of total revenue, respectively. The growth of CSSE revenues is influenced by: (1) new license revenue growth; (2) annual renewal of support contracts; (3) increase in customers through acquisitions; and (4) fluctuations in currency rates. Substantially all of our customers renew their annual support contracts. Over the last three years, our annual revenue renewal rate of customers subscribing to comprehensive support and enhancements has been greater than 90%. CSSE revenue is generally paid in advance and recognized ratably over the term of the agreement, typically 12 months. CSSE renewal revenue is not recognized unless payment is received from the customer.
Hardware and other revenue:Our hardware and other revenues totaled $22.1 million in 2009 representing 9% of total revenue with gross margins of 16.9%. During 2009, the Americas, EMEA and APAC were responsible for $21.1 million, $0.8 million, and $0.2 million, respectively, in hardware and other revenues. In conjunction with the licensing of our software, and as a convenience for our customers, we resell a variety of hardware products developed and manufactured by third parties. These products include computer hardware, radio frequency terminal networks, RFID chip readers, bar code printers and scanners, and other peripherals. We resell all third-party hardware products pursuant to agreements with manufacturers or through distributor-authorized reseller agreements pursuant to which we are entitled to purchase hardware products at discount prices and to receive technical support in connection with product installations and any subsequent product malfunctions. We generally purchase hardware from our vendors only after receiving an order from a customer. As a result, we do not maintain significant hardware inventory.
Other revenue represents amounts associated with reimbursements from customers for out-of-pocket expenses. The total amount of expense reimbursement recorded to hardware and other revenue was $7.5 million, $12.7 million and $13.0 million for 2009, 2008 and 2007, respectively.
Product Development
We intend to continue to invest significantly in research and development (R&D), which historically has averaged about 14 cents of every revenue dollar, to provide market leading solutions that help global manufacturers, wholesalers, distributors, retailers and logistics providers successfully manage accelerating and fluctuating demands as well as the increasing complexity and volatility of their local and global supply chains. Our research and development expenses for the years ended December 31, 2009, 2008 and 2007 were $36.7 million, $48.4 million and $46.6 million, respectively. At December 31, 2009, our R&D organization totaled approximately 640 employees, located in the U.S. and India, representing about 35% of our total employees worldwide.
We will continue to focus our R&D resources on the development and enhancement of supply chain software solutions. We offer what we believe to be the broadest solution portfolio in the supply chain solutions marketplace, to address all aspects of planning and forecasting, inventory optimization, order lifecycle management, transportation lifecycle management and distribution management.
We also plan to continue to provide enhancements to existing solutions and to introduce new solutions to address evolving industry standards and market needs. We identify further enhancements to existing solutions and opportunities for new solutions through our customer support organization, as well as through ongoing customer consulting engagements and implementations, interactions with our user groups, association with leading industry analysts and market research firms, and participation on industry standards and research committees. Our solutions address the needs of customers in various vertical markets, including retail, consumer goods, food and grocery, logistics service providers, industrial and wholesale, high technology and electronics, life sciences and government.
Cash Flow and Financial Condition
For 2009, we generated cash flow from operating activities of $58.3 million and have generated a cumulative total of $160.4 million for the three years ended 2007, 2008 and 2009. Our cash and investments at December 31, 2009 totaled $123.0 million, with no debt on our balance sheet. We currently have no credit facilities. During the past three years, our primary uses of cash have been to continue funding of R&D investment and operations to drive earnings growth and to repurchase common stock.
In January 2010, our Board of Directors approved raising our remaining share repurchase authority to $25.0 million. In 2010, we anticipate that our priorities for use of cash will be similar to prior years, with our first priority being continued investment in product development and profitably growing our business to extend our market leadership. We will continue to evaluate acquisition opportunities that are complementary to our product footprint and technology direction. We will also continue to weigh our share
27
repurchase options against cash for acquisitions and investing in the business. We do not anticipate any borrowing requirements in 2010 for general corporate purposes.
Application of Critical Accounting Policies and Estimates
The SEC defines “critical accounting policies” as those that require application of management’s most difficult, subjective or complex judgments, often as a result of the need to make estimates about the effect of matters that are inherently uncertain and may change in subsequent periods.
Our consolidated financial statements are prepared in accordance with U.S. generally accepted accounting principles (GAAP). The preparation of financial statements in conformity with GAAP requires us to make estimates and assumptions in certain circumstances that affect amounts reported in the accompanying consolidated financial statements and related footnotes. We believe that estimates, judgments and assumptions upon which we rely are reasonable based upon information available to us at the time that these estimates, judgments and assumptions are made. To the extent there are material differences between those estimates, judgments or assumptions and actual results, our financial statements will be affected. The accounting policies that reflect our more significant estimates, judgments and assumptions are: Revenue Recognition, Allowance for Doubtful Accounts, Valuation of Goodwill, Accounting for Income Taxes, Stock-based Compensation, and Business Combinations.
Revenue Recognition
Our revenue consists of revenues from the licensing and hosting of software, fees from implementation and training services (collectively, “professional services”), plus customer support services and software enhancements, and sales of hardware and other (other consists of reimbursements of out of pocket expenses incurred by professional services). All revenue is recognized net of any related sales taxes.
We recognize license revenue when the following criteria are met: (1) a signed contract is obtained; (2) delivery of the product has occurred; (3) the license fee is fixed or determinable; and (4) collectibility is probable. Revenue recognition for software with multiple-element arrangements requires recognition of revenue using the “residual method” when (a) there is vendor-specific objective evidence of the fair values of all undelivered elements in a multiple-element arrangement that is not accounted for using long-term contract accounting; (b) vendor-specific objective evidence of fair value does not exist for one or more of the delivered elements in the arrangement; and (c) all other applicable revenue-recognition criteria for software revenue recognition, other than the requirement for vendor-specific objective evidence of the fair value of each delivered element of the arrangement are satisfied. For those contracts that contain significant customization or modifications, license revenue is recognized using contract accounting.
We allocate revenue to customer support and software enhancements and any other undelivered elements of the arrangement based on vendor specific objective evidence, or VSOE, of fair value of each element and such amounts are deferred until the applicable delivery criteria and other revenue recognition criteria have been met. The balance of the revenue, net of any discounts inherent in the arrangement, is recognized at the outset of the arrangement using the residual method as the product licenses are delivered. If we cannot objectively determine the fair value of each undelivered element based on the VSOE of fair value, we defer revenue recognition until all elements are delivered, all services have been performed, or until fair value can be objectively determined. We must apply judgment in determining all elements of the arrangement and in determining the VSOE of fair value for each element, considering the price charged for each product on a stand-alone basis or applicable renewal rates.
The accounting related to license revenue recognition in the software industry is complex and affected by interpretations of the rules which are subject to change. Our judgment is required in assessing the probability of collection, which is generally based on evaluation of customer-specific information, historical collection experience and economic market conditions. If market conditions decline, or if the financial condition of our customers deteriorates, we may be unable to determine that collectibility is probable, and we could be required to defer the recognition of revenue until we receive customer payments.
Our services revenue consists of fees generated from professional services, customer support services and software enhancements related to our software products. Fees from professional services performed by us are generally billed on an hourly basis, and revenue is recognized as the services are performed. Professional services are sometimes rendered under agreements in which billings are limited to contractual maximums or based upon a fixed-fee for portions of or all of the engagement. Revenue related to fixed-fee based contracts is recognized on a proportional performance basis based on the hours incurred on discrete projects within an overall services arrangement. Project losses are provided for in their entirety in the period in which they become known.
28
Revenue related to customer support services and software enhancements is generally paid in advance and recognized ratably over the term of the agreement, typically 12 months.
Hardware and other revenue is generated from the resale of a variety of hardware products, developed and manufactured by third parties that are integrated with and complementary to our software solutions. As part of a complete solution, our customers periodically purchase hardware from us in conjunction with the licensing of software. These products include computer hardware, radio frequency terminal networks, radio frequency identification (“RFID”) chip readers, bar code printers and scanners and other peripherals. Hardware revenue is recognized upon shipment to the customer when title passes. We generally purchase hardware from our vendors only after receiving an order from a customer. As a result, we do not maintain significant hardware inventory.
In accordance with the other presentation matters within the Revenue Recognition Topic of the Financial Accounting Standards Board’s (“FASB”) Accounting Standards Codification, we recognize amounts associated with reimbursements from customers for out-of-pocket expenses as revenue. Such amounts have been included in hardware and other revenue. The total amount of expense reimbursement recorded to revenue was $7.5 million, $12.7 million and $13.0 million for 2009, 2008 and 2007, respectively.
Allowance for Doubtful Accounts
We continuously monitor collections and payments from our customers and maintain an allowance for estimated credits based upon our historical experience and any specific customer collection issues that we have identified. Additions to the allowance for doubtful accounts generally represent a sales allowance on services revenue, which are recorded to operations as a reduction to services revenue. While such losses have historically been within our expectations and the provisions established, we cannot guarantee that we will continue to experience the same loss rates that we have in the past.
Valuation of Goodwill
In accordance with the Goodwill and Other Topic of the FASB Accounting Standards Codification, we do not amortize goodwill and other intangible assets with indefinite lives. Our goodwill is subject to an annual impairment test, which requires us to estimate the fair value of our business compared to the carrying value. The impairment reviews require an analysis of future projections and assumptions about our operating performance. Should such review indicate the assets are impaired, we would record an expense for the impaired assets.
Annual tests or other future events could cause us to conclude that impairment indicators exist and that our goodwill is impaired. For example, if we had reason to believe that our recorded goodwill had become impaired due to decreases in the fair market value of the underlying business, we would have to record a charge to income for that portion of goodwill that we believed was impaired. Any resulting impairment loss could have a material adverse impact on our financial position and results of operations. At December 31, 2009, our goodwill balance was $62.3 million.
Accounting for Income Taxes
We provide for the effect of income taxes on our financial position and results of operations in accordance with the Income Taxes Topic of the FASB Accounting Standards Codification. Under this accounting pronouncement, income tax expense is recognized for the amount of income taxes payable or refundable for the current year and for the change in net deferred tax assets or liabilities resulting from events that are recorded for financial reporting purposes in a different reporting period than recorded in the tax return. Management must make significant assumptions, judgments and estimates to determine our current provision for income taxes and also our deferred tax assets and liabilities and any valuation allowance to be recorded against our net deferred tax asset.
Our judgments, assumptions and estimates relative to the current provision for income tax take into account current tax laws, our interpretation of current tax laws, allowable deductions, projected tax credits and possible outcomes of current and future audits conducted by foreign and domestic tax authorities. We do not recognize a tax benefit unless we conclude that it is more likely than not that the benefit will be sustained on audit by the taxing authority based solely on the technical merits of the associated tax position. If the recognition threshold is met, we recognize a tax benefit measured at the largest amount of the tax benefit that, in our judgment, is greater than 50 percent likely to be realized. Changes in tax law or our interpretation of tax laws and the resolution of current and future tax audits could significantly impact the amounts provided for income taxes in our financial position and results of operations. Our assumptions, judgments and estimates relative to the value of our net deferred tax asset take into account predictions of the
29
amount and category of future taxable income. Actual operating results and the underlying amount and category of income in future years could render our current assumptions, judgments and estimates of recoverable net deferred taxes inaccurate, thus materially impacting our financial position and results of operations.
Stock-Based Compensation
We estimate the fair value of options granted on the date of grant using the Black-Scholes option pricing model. We base our estimate of fair value on certain assumptions, including the expected term of the option, the expected volatility of the price of the underlying share for the expected term of the option, the expected dividends on the underlying share for the expected term, and the risk-free interest rate for the expected term of the option. We base our expected volatilities on a combination of the historical volatility of our stock and the implied volatility of publicly traded options (issued by third party) for our common stock. Due to the limited trading volume of publicly traded options for our common stock, we place a greater emphasis on historical volatility of our common stock. We also use historical data to estimate the term that options are expected to be outstanding and the forfeiture rate of options granted. We base the risk-free interest rate on the rate for U.S. Treasury zero-coupon issues with a term approximating the expected term.
We recognize compensation cost for awards with graded vesting using the straight-line attribution method, with the amount of compensation cost recognized at any date at least equal to the portion of the grant-date value of the award that is vested at that date. Compensation cost recognized in any period is impacted by the number of stock options granted and the vesting period (which generally is four years), as well as the underlying assumptions used in estimating the fair value on the date of grant. This estimate is dependent upon a number of variables such as the number of options awarded, cancelled or exercised and fluctuations in our share price during the year.
In January 2010 our Compensation Committee approved certain changes to our historical equity incentive grant practices, with the objective to optimize its performance and retention strength while managing program share usage to improve long-term equity overhang. The changes eliminate stock option awards in favor of 100% restricted stock grants, which for the 2010 awards contain vesting provisions that are 50% service-based and 50% performance-based. The awards have a four year vesting period, with the performance portion tied to annual revenue and adjusted earnings per share targets.
Business Combinations
In accordance with business combination accounting, we allocate the purchase price of acquired companies to the tangible and intangible assets acquired and liabilities assumed based on their estimated fair values. Such valuations require management to make significant estimates and assumptions, especially with respect to intangible assets.
Management makes estimates of fair value based upon assumptions believed to be reasonable. These estimates are based on historical experience and information obtained from the management of the acquired companies and are inherently uncertain. Critical estimates in valuing certain of the intangible assets include but are not limited to future expected cash flows from customer contracts and acquired developed technologies; the acquired company’s brand awareness and market position, as well as assumptions about the period of time the acquired brand will continue to be used in the combined company’s product portfolio; and discount rates. Unanticipated events and circumstances may occur which may affect the accuracy or validity of such assumptions, estimates or actual results.
In connection with purchase price allocations, we estimate the fair value of the support obligations assumed in connection with acquisitions. The estimated fair value of the support obligations is determined utilizing a cost build-up approach. The cost build-up approach determines fair value by estimating the costs related to fulfilling the obligations plus a normal profit margin. The estimated costs to fulfill the support obligations are based on the historical direct costs related to providing the support services and to correct any errors in the software products acquired. We do not include any costs associated with selling efforts, upgrades, or research and development or the related fulfillment margins on these costs. Profit associated with selling effort is excluded because the acquired entities would have concluded the selling effort on the support contracts prior to the acquisition date. The estimated research and development costs are not included in the fair value determination, as these costs are not deemed to represent a legal obligation at the time of acquisition. The sum of the costs and operating profit approximates, in theory, the amount that we would be required to pay a third party to assume the support obligation.
Accounting Charges
30
Restructuring charge.During 2009, we committed to and initiated plans to reduce our workforce by approximately 140 positions to realign our capacity with demand forecasts. As a result of this action, we recorded employee severance expense and outplacement service fees of $3.8 million pretax ($2.5 million after-tax or $0.11 per fully diluted share). We also recorded additional employee severance expense of $63,000 in the first quarter of 2009 related to the restructuring action taken in 2008.
During 2008, we committed to and initiated plans to reduce our workforce by approximately 170 positions to realign our capacity with demand forecasts. As a result of this action, we recorded employee severance expense and outplacement service fees of approximately $4.7 million pretax ($3.0 million after-tax or $0.13 per fully diluted share) in the fourth quarter of 2008.
Asset Impairment Charges.During 2008, we recorded an other-than-temporary impairment charge of $1.7 million, writing down the remaining balance of a $2.0 million investment in an RFID technology company we made in July 2003. We recorded the additional impairment due to a combination of continued negative financial results reported by this company in a very competitive sector and a “down round” of financing (i.e., a round of financing that was dilutive to our investment) in which our preferred share ownership was converted into common stock, eliminating our preference rights associated with liquidation, thereby substantially impairing our ability to recoup our investment.
In addition, we recorded an other-than-temporary impairment charge of $3.5 million on an investment in an auction rate security. We reduced the carrying value to zero due to a combination of credit downgrades of the underlying issuer and the bond insurer as well as increased publicly reported exposure to bankruptcy risk by the issuer and continued significant deterioration in the credit markets limiting the issuer’s ability to re-finance the underlying bond.
Full Year 2009 Financial Summary
| | • | | Total revenue for the year ended December 31, 2009 was $246.7 million compared to $337.2 million for 2008. License revenue decreased 47% to $34.7 million from $65.3 million in 2008 and services revenue decreased 20% to $189.9 million; |
| |
| | • | | Operating income was $21.1 million for full year 2009, which included a restructuring charge of $3.9 million, compared to $26.0 million in 2008, which included the $9.9 million of unusual adjustments taken in the second half of 2008 described above under “Accounting Charges”; |
| |
| | • | | Operating margins for 2009 were 8.6% up 90 basis points compared to operating margins of 7.7% in 2008; |
| |
| | • | | Diluted earnings per share were $0.73, a decrease of 22%; |
| |
| | • | | Cash flow from operations totaled $58.3 million, a 9% decrease over 2008; |
| |
| | • | | Cash and investments on hand at December 31, 2009 was $123.0 million, increasing $34.3 million over December 31, 2008; |
| |
| | • | | The Company repurchased approximately 1.4 million shares of common stock during the year totaling $22.8 million at an average price of $16.63 under its publicly-announced buy-back program; and |
| |
| | • | | In January 2010, the Board of Directors approved raising the Company’s remaining share repurchase authority from $12.2 million to $25.0 million of Manhattan Associates outstanding common stock. |
31
Results of Operations
The following table summarizes selected Statement of Income data for the years ended December 31, 2009, 2008 and 2007.
| | | | | | | | | | | | | | | | | | | | | |
| | | Year Ended December 31, | |
| | | | | | | | | | | | | | | % Change vs. Prior Year | |
| | | 2009 | | | 2008 | | | 2007 | | | 2009 | | | 2008 | |
| | | (in thousands) | | |
Revenue: | | | | | | | | | | | | | | | | | | | | |
| Software license | | $ | 34,686 | | | $ | 65,313 | | | $ | 73,031 | | | | -47 | % | | | -11 | % |
| Services | | | 189,850 | | | | 235,967 | | | | 226,153 | | | | -20 | % | | | 4 | % |
| Hardware and other | | | 22,131 | | | | 35,921 | | | | 38,217 | | | | -38 | % | | | -6 | % |
| | | | | | | | | | | | | | | | |
| Total revenue | | | 246,667 | | | | 337,201 | | | | 337,401 | | | | -27 | % | | | 0 | % |
Costs and expenses: | | | | | | | | | | | | | | | | | | | | |
| Cost of license | | | 4,726 | | | | 5,961 | | | | 5,334 | | | | -21 | % | | | 12 | % |
| Cost of services | | | 84,349 | | | | 116,707 | | | | 109,758 | | | | -28 | % | | | 6 | % |
| Cost of hardware and other | | | 18,386 | | | | 29,270 | | | | 32,268 | | | | -37 | % | | | -9 | % |
| Research and development | | | 36,681 | | | | 48,407 | | | | 46,594 | | | | -24 | % | | | 4 | % |
| Sales and marketing | | | 36,137 | | | | 51,177 | | | | 53,406 | | | | -29 | % | | | -4 | % |
| General and administrative | | | 29,946 | | | | 37,145 | | | | 33,366 | | | | -19 | % | | | 11 | % |
| Depreciation and amortization | �� | | 11,418 | | | | 12,699 | | | | 13,617 | | | | -10 | % | | | -7 | % |
Restructuring charge(1) | | | 3,882 | | | | 4,667 | | | | — | | | | -17 | % | | | 100 | % |
Asset impairment charges(2) | | | — | | | | 5,205 | | | | — | | | | -100 | % | | | 100 | % |
| | | | | | | | | | | | | | | | |
| Total costs and expenses | | | 225,525 | | | | 311,238 | | | | 294,343 | | | | -28 | % | | | 6 | % |
| | | | | | | | | | | | | | | | |
| Income from operations | | $ | 21,142 | | | $ | 25,963 | | | $ | 43,058 | | | | -19 | % | | | -40 | % |
| | | | | | | | | | | | | | | | |
| Operating margin | | | 8.6 | % | | | 7.7 | % | | | 12.8 | % | | | | | | | | |
| | |
| (1) | | The restructuring charge of $3.9 million and $4.7 million in 2009 and 2008, respectively, mainly represents employee severance and outplacement services resulting from the workforce reduction initiatives executed in the respective year. |
| |
| (2) | | The impairment charge for 2008 includes a $1.7 million charge for writing down the remaining balance of a $2.0 million investment in a RFID technology company we made in July 2003. We recorded the additional impairment due to a down round of financing (i.e., a round of financing that was dilutive to our investment) in which our preferred share ownership was converted into common stock, eliminating our preference rights associated with liquidation, thereby substantially impairing our ability to recoup our investment. In addition, we recorded an impairment charge of $3.5 million on an investment in an auction rate security. We reduced the carrying value to zero due to credit downgrades of the underlying issuer and the bond insurer as well as increasing publicly reported exposure to bankruptcy risk by the issuer. |
We manage our business based on three geographic regions: the Americas, EMEA, and APAC. Geographic revenue information is based on the location of sale. The revenues represented below are from external customers only. The geographical-based expenses include costs of personnel, direct sales and marketing expenses, and general and administrative costs to support the business. There are certain corporate expenses included in the Americas region that are not charged to the other segments including research and development, certain marketing and general and administrative costs that support the global organization and the amortization of acquired developed technology. Included in the Americas costs are all research and development costs, including the costs associated with the Company’s India operations. During 2009, 2008 and 2007, we derived the majority of our revenues from sales to customers within our Americas region. The following table summarizes revenue and operating profit by region:
32
| | | | | | | | | | | | | | | | | | | | | |
| | | Year Ended December 31, | |
| | | | | | | | | | | | | | | % Change vs. Prior Year | |
| | | 2009 | | | 2008 | | | 2007 | | | 2009 | | | 2008 | |
| | | (in thousands) | | |
Revenue: | | | | | | | | | | | | | | | | | | | | |
Software license | | | | | | | | | | | | | | | | | | | | |
| Americas | | $ | 29,629 | | | $ | 51,392 | | | $ | 61,708 | | | | -42 | % | | | -17 | % |
| EMEA | | | 2,617 | | | | 8,885 | | | | 9,311 | | | | -71 | % | | | -5 | % |
| APAC | | | 2,440 | | | | 5,036 | | | | 2,012 | | | | -52 | % | | | 150 | % |
| | | | | | | | | | | | | | | | |
| Total license | | $ | 34,686 | | | $ | 65,313 | | | $ | 73,031 | | | | -47 | % | | | -11 | % |
Services | | | | | | | | | | | | | | | | | | | | |
| Americas | | $ | 155,768 | | | $ | 192,483 | | | $ | 187,019 | | | | -19 | % | | | 3 | % |
| EMEA | | | 24,637 | | | | 32,163 | | | | 25,617 | | | | -23 | % | | | 26 | % |
| APAC | | | 9,445 | | | | 11,321 | | | | 13,517 | | | | -17 | % | | | -16 | % |
| | | | | | | | | | | | | | | | |
| Total services | | $ | 189,850 | | | $ | 235,967 | | | $ | 226,153 | | | | -20 | % | | | 4 | % |
Hardware and Other | | | | | | | | | | | | | | | | | | | | |
| Americas | | $ | 21,161 | | | $ | 33,371 | | | $ | 35,595 | | | | -37 | % | | | -6 | % |
| EMEA | | | 771 | | | | 1,750 | | | | 1,921 | | | | -56 | % | | | -9 | % |
| APAC | | | 199 | | | | 800 | | | | 701 | | | | -75 | % | | | 14 | % |
| | | | | | | | | | | | | | | | |
| Total hardware and other | | $ | 22,131 | | | $ | 35,921 | | | $ | 38,217 | | | | -38 | % | | | -6 | % |
Total Revenue | | | | | | | | | | | | | | | | | | | | |
| Americas | | $ | 206,558 | | | $ | 277,246 | | | $ | 284,322 | | | | -25 | % | | | -2 | % |
| EMEA | | | 28,025 | | | | 42,798 | | | | 36,849 | | | | -35 | % | | | 16 | % |
| APAC | | | 12,084 | | | | 17,157 | | | | 16,230 | | | | -30 | % | | | 6 | % |
| | | | | | | | | | | | | | | | |
| Total revenue | | $ | 246,667 | | | $ | 337,201 | | | $ | 337,401 | | | | -27 | % | | | 0 | % |
| | | | | | | | | | | | | | | | |
Operating income: | | | | | | | | | | | | | | | | | | | | |
| Americas | | $ | 21,448 | | | $ | 18,849 | | | $ | 40,300 | | | | 14 | % | | | -53 | % |
| EMEA | | | 1,093 | | | | 6,640 | | | | 2,422 | | | | -84 | % | | | 174 | % |
| APAC | | | (1,399 | ) | | | 474 | | | | 336 | | | | -395 | % | | | 41 | % |
| | | | | | | | | | | | | | | | |
| Total operating income | | $ | 21,142 | | | $ | 25,963 | | | $ | 43,058 | | | | -19 | % | | | -40 | % |
| | | | | | | | | | | | | | | | |
The results of our operations for year 2009, 2008, and 2007 are discussed below.
Revenue
Our revenue consists of fees generated from the licensing and hosting of software; fees from professional services, customer support services and software enhancements; hardware sales of complementary radio frequency and computer equipment; and other revenue representing amounts associated with reimbursements from customers for out-of-pocket expenses.
| | | | | | | | | | | | | | | | | | | | | | | | | | | | | | | | | |
| | | Year Ended December, 31 | |
| | | | | | | | | | | | | | | % Change vs. Prior Year | | | % of Total Revenue | |
| | | 2009 | | | 2008 | | | 2007 | | | 2009 | | | 2008 | | | 2009 | | | 2008 | | | 2007 | |
| | | (in thousands) | | |
| Software license | | $ | 34,686 | | | $ | 65,313 | | | $ | 73,031 | | | | -47 | % | | | -11 | % | | | 14 | % | | | 19 | % | | | 22 | % |
| Services | | | 189,850 | | | | 235,967 | | | | 226,153 | | | | -20 | % | | | 4 | % | | | 77 | % | | | 70 | % | | | 67 | % |
| Hardware and other | | | 22,131 | | | | 35,921 | | | | 38,217 | | | | -38 | % | | | -6 | % | | | 9 | % | | | 11 | % | | | 11 | % |
| | | | | | | | | | | | | | | | | | | | | | | | | |
| Total revenue | | $ | 246,667 | | | $ | 337,201 | | | $ | 337,401 | | | | -27 | % | | | 0 | % | | | 100 | % | | | 100 | % | | | 100 | % |
| | | | | | | | | | | | | | | | | | | | | | | | | |
33
License revenue
Year 2009 compared with year 2008
License revenue decreased $30.6 million, or 47%, to $34.7 million in 2009 over 2008, primarily, we believe, driven by the current global economic recession, which has decreased sales and lengthened sales cycles in the global market as customers and prospects have constrained capital spending. Our Americas, EMEA and APAC license revenue decreased $21.7 million, $6.3 million, and $2.6 million, respectively, compared to the same period in the prior year.
The license sales percentage mix across our product suite in 2009 was approximately 60% of warehouse management solutions and 40% non-warehouse management solutions. Our warehouse management solutions decreased $15.6 million, or 44%, in 2009 compared to 2008 and non-warehouse management solutions decreased $15.0 million, or 51%, in 2009 over 2008.
Year 2008 compared with year 2007
License revenue decreased 11%, or $7.7 million in 2008 compared to 2007. Americas and EMEA license revenue declined $10.3 million and $0.4 million, respectively, driven, we believe, by the global macro-economic slowdown, which lengthened sales cycles in our markets in the last half of 2008. This decrease was partially offset by an increase in APAC license revenue of $3.0 million.
License sales mix across our product suite was approximately 55% of sales in our warehouse management solutions and 45% in non-warehouse management solutions in 2008. Sales of warehouse management solutions and non-warehouse management solutions declined 7% and 15%, respectively, in 2008 compared to 2007.
Services revenue
Year 2009 compared with year 2008
Services revenue decreased $46.1 million, or 20%, in 2009 compared to 2008 principally due to a $46.2 million, or 29%, decrease in professional services revenue. The Americas, EMEA and APAC segments decreased $36.7 million, $7.5 million, and $1.9 million, respectively, in 2009 compared to 2008. Over the last year, our services revenue decline has primarily been caused by a decline in license revenues and delayed or suspended multiple site implementations and/or upgrades. We believe our revenue decline is principally due to the global economic recession, which in turn has severely impacted our customers’ capital investment levels, prioritization and timing.
Year 2008 compared with year 2007
Services revenue increased 4%, or $9.8 million, in 2008 over 2007 principally due to a 15% or $9.9 million increase of software enhancements revenue. The EMEA and Americas segments led the growth with an increase in services revenue of $6.5 million, or 26%, and $5.5 million, or 3%, respectively, from 2007 to 2008. These increases were partially offset by a decrease in APAC services revenue of $2.2 million, or 16%, from 2007 to 2008 due to the lack of large license sales closed in 2007.
Additionally, over the past several years, our services revenue growth and margins have been affected by some pricing pressures. We believe that the pricing pressures are attributable to deteriorating global macro-economic conditions and competition.
Hardware and other
Sales of hardware decreased $8.6 million, or 37%, in 2009 compared to 2008. Sales of hardware decreased $2.0 million, or 8%, in 2008 compared to 2007. In 2009, our Americas segment accounted for nearly 100% of hardware sales. Sales of hardware are largely dependent upon customer-specific desires, which fluctuate. Other revenue represents reimbursements for out-of-pocket expenses that are required to be classified as revenue and are included in hardware and other revenue. For 2009, 2008 and 2007, reimbursements by customers for out-of-pocket expenses were approximately $7.5 million, $12.7 million and $13.0 million, respectively.
34
Cost of Revenue
| | | | | | | | | | | | | | | | | | | | | |
| | | Year Ended December 31, | |
| | | | | | | | | | | | | | | % Change vs. Prior Year | |
| | | 2009 | | | 2008 | | | 2007 | | | 2009 | | | 2008 | |
| | | (in thousands) | | |
| Cost of license | | $ | 4,726 | | | $ | 5,961 | | | $ | 5,334 | | | | -21 | % | | | 12 | % |
| Cost of services | | | 84,349 | | | | 116,707 | | | | 109,758 | | | | -28 | % | | | 6 | % |
| Cost of hardware and other | | | 18,386 | | | | 29,270 | | | | 32,268 | | | | -37 | % | | | -9 | % |
| | | | | | | | | | | | | | | | |
| Total cost of revenue | | $ | 107,461 | | | $ | 151,938 | | | $ | 147,360 | | | | -29 | % | | | 3 | % |
| | | | | | | | | | | | | | | | |
Cost of License
Cost of license consists of the costs associated with software reproduction; hosting services; media, packaging and delivery, documentation and other related costs; and royalties on third-party software sold with or as part of our products. Cost of licenses decreased $1.2 million, or 21%, in 2009 compared to 2008, primarily due to a 47% decrease in license revenue. Cost of license increased $0.6 million, or 12%, to $6.0 million in 2008 due to an increase in costs associated with our hosting services.
Cost of Services
Year 2009 compared with year 2008
Cost of services consists primarily of salaries and other personnel-related expenses of employees dedicated to professional and technical services and customer support services. Cost of services decreased $32.4 million, or 28%, in 2009 compared to 2008 principally due to (i) a $21.7 million decrease in employee-related costs such as salary, benefits and payroll taxes resulting from a decrease in the number of professional services personnel due to headcount reduction initiatives in the fourth quarter of 2008 and the second quarter of 2009 to align capacity with demand, (ii) a $4.4 million decrease in performance based bonus expense caused by lower year over year revenue performance as well as lower headcount, and (iii) a $3.3 million decrease in travel expenses due to fewer services projects.
Services gross margin increased 5.1 percentage points to 55.6% in 2009 from 50.5% in 2008. The increase in services margin is attributable to the decrease in professional services costs in the current year driven by our expense reduction actions and lower performance based compensation expense.
Year 2008 compared with year 2007
The 6% increase in cost of services in 2008, from $109.8 million to $116.7 million, was primarily due to: (i) a $6.7 million increase in salary-related costs resulting from a 10% increase in the average number of personnel dedicated to the delivery of professional services, prior to our fourth quarter workforce reduction; (ii) an $0.8 million increase in travel expenses, and (iii) a $0.5 million increase in third-party software maintenance, partially offset by a decrease of $1.4 million in bonus expense.
Services gross margin decreased 90 basis points to 50.5% in 2008. The reduction in the services gross margin in 2008 was caused by the more intricate services work required as our sales mix shifted from our heritage System i platform to our Open Systems platform.
Cost of Hardware and other
Cost of hardware was $11.0 million, $17.0 million, and $19.2 million for the year ended December 31, 2009, 2008 and 2007, respectively. Cost of hardware decreased as a direct result of decreased hardware sales. Cost of hardware and other includes out-of-pocket expenses to be reimbursed by customers of approximately $7.4 million, $12.3 million and $13.0 million for 2009, 2008 and 2007, respectively. The decrease in reimbursed out-of-pocket expenses correlates to the decrease in services revenue.
35
Operating Expenses
| | | | | | | | | | | | | | | | | | | | | |
| | | Year Ended December 31, | |
| | | | | | | | | | | | | | | % Change vs. Prior Year | |
| | | 2009 | | | 2008 | | | 2007 | | | 2009 | | | 2008 | |
| | | (in thousands) | | |
| Research and development | | $ | 36,681 | | | $ | 48,407 | | | $ | 46,594 | | | | -24 | % | | | 4 | % |
| Sales and marketing | | | 36,137 | | | | 51,177 | | | | 53,406 | | | | -29 | % | | | -4 | % |
| General and administrative | | | 29,946 | | | | 37,145 | | | | 33,366 | | | | -19 | % | | | 11 | % |
| Depreciation and amortization | | | 11,418 | | | | 12,699 | | | | 13,617 | | | | -10 | % | | | -7 | % |
| Restructuring charge | | | 3,882 | | | | 4,667 | | | | — | | | | -17 | % | | | 100 | % |
| Asset impairment charges | | | — | | | | 5,205 | | | | — | | | | -100 | % | | | 100 | % |
| | | | | | | | | | | | | | | | |
| Operating expenses | | $ | 118,064 | | | $ | 159,300 | | | $ | 146,983 | | | | -26 | % | | | 8 | % |
| | | | | | | | | | | | | | | | |
Research and Development
Our principal research and development activities during 2009, 2008 and 2007 focused on the expansion and integration of new products acquired and new product releases and expanding the product footprint of our supply chain optimization solutions calledSupplyChainOptimization fromPlanning throughExecution. The Manhattan SCOPE Platform provides not only a sophisticated service oriented architecture based application framework, but a platform that facilitates the integration with Enterprise Resource Planning (ERP) and other supply chain solutions.
For the years ended December 31, 2009, 2008, and 2007, we capitalized no research and development costs because the costs incurred following the attainment of technological feasibility for the related software product through the date of general release were insignificant.
Year 2009 compared with year 2008
Research and development expenses primarily consist of salaries and other personnel-related costs for personnel involved in our research and development activities. Consistent with prior years, we typically invest approximately 14% to 15% of total revenue in research and development. In 2009, research and development expenses decreased to $36.7 million primarily due to: (i) a $7.7 million decrease in salary-related costs resulting from a decrease in the number of R&D personnel; (ii) a $1.4 million decrease in bonuses caused by headcount reductions as well as lower achievement of performance based compensation; and (iii) a $1.0 million decrease in travel expenses.
Year 2008 compared with year 2007
Research and development expense increased $1.8 million, or 4%, in 2008 to $48.4 million as compared to $46.6 million in 2007. This increase is principally attributable to a realignment of resources from service projects to research and development activities.
Sales and Marketing
Year 2009 compared with year 2008
Sales and marketing expenses include salaries, commissions, travel and other personnel-related costs and the costs of our marketing and alliance programs and related activities. The $15.0 million, or 29%, decrease in sales and marketing expenses in 2009 compared to 2008 was attributable to lower headcount and license revenue which resulted in: (i) a $7.9 million decrease in employee-related costs such as salary, benefits, payroll taxes and stock compensation expense, (ii) a $4.2 million decrease in bonus and commission expense, and (iii) a $2.7 million decrease in travel expenses.
Year 2008 compared with year 2007
36
Sales and marketing expenses decreased $2.2 million, or 4%, to $51.2 million in 2008 compared to 2007. The decrease in sales and marketing expense in 2008 is principally caused by the decrease of $2.9 million in bonus and commissions due to the year over year decrease in license revenue, partially offset by a $0.7 million increase in stock compensation expense.
General and Administrative
Year 2009 compared with year 2008
General and administrative expenses consist primarily of salaries and other personnel-related costs of executive, financial, human resources, information technology and administrative personnel, as well as facilities, legal, insurance, accounting and other administrative expenses. The net decrease of $7.2 million, or 19%, in general and administrative expenses in 2009 compared to 2008 was primarily attributable to (i) a $2.9 million decrease in employee-related expense such as salary, benefits, payroll taxes related to workforce and expense reduction initiatives, (ii) a $1.5 million decrease in expense for transaction tax exposure reserves, and (iii) a $1.1 million reduction in bonus expense due to the decline in total revenue and earnings per share.
Year 2008 compared with year 2007
The increase in general and administrative expenses from 2007 to 2008 of $3.8 million to $37.1 million was primarily attributable to: (i) a $1.5 million reserve for transaction tax exposure, (ii) a $1.2 million reduction in recoveries of previously expensed sales tax resulting from the expiration of the sales tax audit statutes in certain states in 2007, (iii) $1.3 million of incremental stock compensation expense, and (iv) a $1.0 million increase in salary-related costs resulting from a 7% increase in the average number of personnel, partially offset by a $0.8 million decrease in travel expenses.
Depreciation and Amortization
Depreciation expense amounted to $8.4 million, $9.4 million and $9.0 million, during 2009, 2008, and 2007, respectively, and has decreased due to decreased in capital expenditures. Amortization of intangibles amounted to $3.0 million, $3.3 million and $4.6 million during 2009, 2008, and 2007, respectively. We have recorded goodwill and other acquisition-related intangible assets as part of the purchase accounting associated with various acquisitions. The decreases in amortization expense in 2009 and 2008 of $0.3 million and $1.3 million, respectively, were mainly associated with certain intangible assets related to prior acquisitions, which became fully amortized.
Restructuring charge
During 2009, we committed to and initiated plans to reduce our workforce by approximately 140 positions to realign our capacity with demand forecasts. As a result of this action, we recorded employee severance expense and outplacement service fees of approximately $3.8 million pretax ($2.5 million after-tax or $0.11 per fully diluted share). We also recorded additional employee severance expense of $63,000 in the first quarter of 2009 related to the restructuring action taken in 2008.
During 2008, we committed to and initiated plans to reduce our workforce by approximately 170 positions to realign our capacity with demand forecasts. As a result of this action, we recorded employee severance expense and outplacement service fees of approximately $4.7 million pretax ($3.0 million after-tax or $0.13 per fully diluted share) in the fourth quarter of 2008.
Asset impairment charges
Asset impairment charges of $5.2 million in 2008 consist of a $3.5 million impairment on an investment in an auction-rate security and a $1.7 million impairment on an investment in an RFID technology company. We reduced the carrying value of the auction-rate security investment to zero due to a combination of credit downgrades of the underlying issuer and the bond insurer as well as increased publicly reported exposure to bankruptcy risk by the issuer and continued significant deterioration in the credit markets limiting the issuer’s ability to re-finance the underlying bond. We wrote down the remaining balance of our $2.0 million investment in the company due to a combination of continued negative financial results reported by this company in a very competitive sector and a “down round” of financing (i.e., a round of financing that was dilutive to our investment) in which our preferred share ownership was converted into common stock, eliminating our preference rights associated with liquidation, thereby substantially impairing our ability to recoup our investment.
37
Operating Income
Operating income in 2009 decreased by $4.8 million on the consolidated revenue decline of 27% to $21.1 million compared to $26.0 million in 2008. Operating margins improved to 8.6% in 2009 from 7.7% in 2008 primarily due to the decrease in total costs in the current year driven by our actions to lower headcount to align capacity with demand combined with lower performance based compensation expense. Operating income in the Americas segment increased by $2.6 million while the EMEA and APAC segment decreased by $5.5 million and $1.9 million, respectively in 2009.
Operating income in 2008 decreased by $17.1 million on flat consolidated revenue year over year. Operating margins declined from 12.8% in 2007 to 7.7% in 2008. The decline in profit contribution and margin in 2008 was largely driven by the following factors: (i) lower license revenues in 2008, which have a relatively higher margin compared to services revenues, (ii) $5.2 million of asset write-downs, (iii) a $4.7 million restructuring charge, (iv) a $1.2 million increase in stock option expense, and (v) a $1.8 million increase in research and development investment. Operating income in the Americas segment decreased by $21.5 million, or 53%, due to incremental stock compensation expense of $1.2 million, asset write-downs of $5.2 million and a restructuring charge of $4.4 million. Operating income in EMEA and APAC increased $4.3 million on strong revenue growth.
Other (Expense) Income and Income Taxes
| | | | | | | | | | | | | | | | | | | | | |
| | | Year Ended December 31, |
| | | | | | | | | | | | | | | % Change vs. Prior Year |
| | | 2009 | | 2008 | | 2007 | | 2009 | | 2008 |
| Other (expense) income, net | | $ | (756 | ) | | $ | 5,545 | | | $ | 4,608 | | | | -114 | % | | | 20 | % |
| Income tax provision | | | 3,824 | | | | 8,710 | | | | 16,915 | | | | -56 | % | | | -49 | % |
Other (Expense) Income, net
Other (expense) income, net primarily includes interest income, foreign currency gains and losses, and other non-operating expenses. Interest income was $0.4 million, $1.8 million, and $3.4 million for the years ended December 31, 2009, 2008, and 2007, respectively. The decrease of $1.4 million in interest income in 2009 compared to 2008 was due to a lower weighted-average interest rate earned. The decrease of $1.6 million in interest income in 2008 compared to 2007 was caused by an overall lower average investment balances driven by our share repurchase program. The weighted-average interest rate earned on cash and investment securities was less than 0.5%, 2.3% and 3.3% for the years ended December 31, 2009, 2008 and 2007, respectively. We recorded net foreign currency losses of $1.0 million in 2009 and net foreign currency gains of $3.9 million and $1.2 million in 2008 and 2007, respectively. The foreign currency loss and gains mainly resulted from loss or gains on intercompany transactions denominated in foreign currencies with subsidiaries due to the fluctuation of the U.S. dollar relative to other foreign currencies, primarily the Indian Rupee, the British Pound and the Euro.
Income Tax Provision
Our effective income tax rates were 18.8%, 27.6%, and 35.5% in 2009, 2008 and 2007, respectively. Our effective income tax rate takes into account the source of taxable income, domestically by state and internationally by country, and available income tax credits. The reduction in the effective income tax rate in 2009 compared to 2008 primarily resulted from a release of income tax reserves resulting from expiring tax audit statutes for U.S. federal income tax returns filed for 2005 and prior. The reduction in the effective income tax rate in 2008 compared to 2007 primarily resulted from a release of income tax reserves resulting from expiring tax audit statutes for U.S. federal income tax returns filed for 2004 and prior, partially offset by the asset impairment charges for which no tax benefit was recorded.
Liquidity and Capital Resources
During 2009, 2008, and 2007, we funded our operations through cash generated from operations. As of December 31, 2009, we had $123.0 million in cash, cash equivalents and investments as compared to $88.7 million at December 31, 2008.
38
Our operating activities provided cash of $58.3 million, $63.8 million and $38.3 million in 2009, 2008, and 2007, respectively. Cash from operating activities for 2009 decreased $5.5 million compared to 2008 due to lower revenue partially offset by strong accounts receivable collections. Days sales outstanding (DSO) was 56 days at December 31, 2009 as compared to 78 days at December 31, 2008. Cash from operating activities for 2008 increased by $25.6 million compared to 2007 principally due to strong accounts receivable collections.
The use of cash for investing activities for the year ended December 31, 2009 was for capital expenditures of approximately $2.3 million. During 2008, our investing activities provided cash of approximately $13.9 million from net maturities and sales of investments of $21.6 million, partially offset by payments in connection with purchases of capital equipment of $7.7 million. Our investing activities provided cash of approximately $75.1 million during the year ended December 31, 2007, primarily from the net maturities of investments of $84.5 million, which was used mainly to fund stock repurchases, partially offset by payments of $9.4 million for capital equipment to support our business and infrastructure.
Our financing activities used cash of approximately $21.7 million, $31.8 million and $88.3 million in 2009, 2008 and 2007, respectively. The principal use of cash for financing activities was to repurchase shares of our common stock for approximately $23.4 million, $35.1 million, and $99.9 million in 2009, 2008, and 2007, respectively. These repurchases were partially offset by the proceeds from the issuance of our common stock pursuant to the exercise of stock options of $1.7 million, $3.2 million, and $10.9 million in 2009, 2008, and 2007, respectively. In January 2010, our Board of Directors increased our remaining share repurchase authority of $12.2 million at December 31, 2009 to a total of $25.0 million.
Periodically, opportunities may arise to grow our business through the acquisition of complementary and synergistic companies, products and technologies. Any material acquisition could result in a decrease to our working capital depending on the amount, timing and nature of the consideration to be paid. We believe that existing balances of cash, cash equivalents and short-term investments will be sufficient to meet our working capital and capital expenditure needs at least for the next twelve months, although there can be no assurance that this will be the case. We anticipate that we will be able to continue fund our operations with cash flow from operations in the future. We do not maintain any bank line of credit. However, if the Company should encounter a need to raise additional capital, recent turmoil in the credit and capital markets could make such capital unavailable or available only at unfavorable costs.
New Accounting Pronouncements
In June 2009, the FASB issued the FASB Accounting Standards CodificationTMand a new Hierarchy of Generally Accepted Accounting Principles, which establishes only two levels of U.S. generally accepted accounting principles (“GAAP”): authoritative and nonauthoritative. The FASB Accounting Standards Codification (the “Codification”) is now the source of authoritative U.S. GAAP recognized by the FASB to be applied by nongovernmental entities in the preparation of financial statements in conformity with GAAP, except for rules and interpretive releases of the SEC, which are additional sources of authoritative GAAP for SEC registrants. All other nongrandfathered, non-SEC accounting literature not included in the Codification will become nonauthoritative. The Codification is effective for financial statements for interim or annual reporting periods ending after September 15, 2009. We adopted the new guidelines and numbering system prescribed by the Codification when referring to GAAP in the third quarter of 2009. As the Codification is not intended to change or alter existing GAAP for public companies, it does not have any impact on our consolidated financial statements.
In May 2009, the FASB issued authoritative guidance on subsequent events. This guidance is intended to establish general standards of accounting for and disclosures of events that occur after the balance sheet date but before financial statements are issued or are available to be issued. Specifically, the subsequent events guidance sets forth the period after the balance sheet date during which management of a reporting entity should evaluate events or transactions that may occur for potential recognition or disclosure in the financial statements, the circumstances under which an entity should recognize events or transactions occurring after the balance sheet date in its financial statements, and the disclosures that an entity should make about events or transactions that occurred after the balance sheet date. This guidance is effective for fiscal years and interim periods ended after June 15, 2009. We adopted this standard effective June 15, 2009 and have evaluated any subsequent events through the date of this filing. The adoption of the subsequent events guidance did not have an impact on our consolidated results of operations or consolidated financial position.
In December 2007, the FASB issued authoritative guidance on business combinations. This guidance is significantly changes the accounting for business combinations. Under the business combination guidance, an acquiring entity is required to recognize all the assets acquired and liabilities assumed in a transaction at the acquisition-date fair value with limited exceptions. This guidance changes the accounting treatment for certain specific acquisition-related items, including by requiring the expensing of acquisition-
39
related costs as incurred and expensing of restructuring costs associated with an acquired business. This guidance also includes a substantial number of new disclosure requirements to enable users of the financial statements to evaluate the nature and financial effects of the business combination. The business combination guidance is to be applied prospectively to business combinations for which the acquisition date is on or after January 1, 2009. We expect that this guidance will have an impact on its accounting for future business combinations, but the extent of the impact is dependent upon the number, size, and complexity of acquisitions that we make in the future.
In September 2006, the FASB issued authoritative guidance on fair value measurements, which establishes a framework for reporting fair value and expands disclosures required for fair value measurements. The fair value measurement guidance applies under other accounting pronouncements that require or permit fair value measurements. Accordingly, this guidance does not require any new fair value measurements. This guidance is effective for financial statements issued for fiscal years beginning after November 15, 2007 and interim periods within those fiscal years. However, in February 2008, the FASB delayed for one year the applicability of fair-value measurements to non-financial assets and liabilities recognized or disclosed at fair value on a non-recurring basis. The Company partially adopted the fair value measurement on January 1, 2008 related to all financial assets and liabilities and non-financial assets and liabilities recognized or disclosed at fair value on a recurring basis. We have adopted fair value measurement for non-financial assets and liabilities measured at fair value on a nonrecurring basis at January 1, 2009 and will continue to apply its provisions prospectively from January 1, 2009. The application of fair value measurement for non-financial assets and liabilities did not have a significant impact on our consolidated results of operations nor our financial position in 2009.
Off-Balance Sheet Arrangements and Aggregate Contractual Obligations
Our principal commitments as of December 31, 2009 consist of obligations under operating leases. We expect to fulfill all of the following commitments from our working capital. We have no off-balance sheet arrangements within the meaning of SEC rules.
Lease Commitments
We lease our facilities and some of our equipment under noncancelable operating lease arrangements that expire at various dates through 2018. Rent expense for these leases aggregated $6.1 million, $7.2 million and $6.7 million during 2009, 2008, and 2007, respectively.
The following table summarizes our contractual commitments as of December 31, 2009 (in thousands):
| | | | | | | | | | | | | | | | | | | | | | | | | | | | | | |
| | | Total | | | 2010 | | 2011 | | 2012 | | 2013 | | 2014 | | Thereafter |
| Non-cancelable operating leases | | $ | 46,979 | | | | $ | 6,373 | | | $ | 5,929 | | | $ | 5,221 | | | $ | 5,003 | | | $ | 4,911 | | | $ | 19,542 | |
Indemnifications
Our sales agreements with customers generally contain infringement indemnity provisions. Under these agreements, we agree to indemnify, defend and hold harmless the customer in connection with patent, copyright or trade secret infringement claims made by third parties with respect to the customer’s authorized use of our products and services. The indemnity provisions generally provide for our control of defense and settlement and cover costs and damages finally awarded against the customer, as well as our modification of the product so it is no longer infringing or, if it cannot be corrected, return of the product for a refund. Our sales agreements with customers sometimes also contain indemnity provisions for death, personal injury or property damage caused by our personnel or contractors in the course of performing services to customers. Under these agreements, we agree to indemnify, defend and hold harmless the customer in connection with death, personal injury and property damage claims made by third parties with respect to actions of our personnel or contractors. The indemnity provisions generally provide for our control of defense and settlement and cover costs and damages finally awarded against the customer. The indemnity obligations contained in sales agreements generally have no specified expiration date and no specified monetary limitation on the amount of award covered. We have not previously incurred costs to settle claims or pay awards under these indemnification obligations. We account for these indemnity obligations in accordance with FASB guidance on accounting for contingencies, and record a liability for these obligations when a loss is probable and reasonably estimable. We have not recorded any liabilities for these agreements as of December 31, 2009.
40
Warranties
We warrant to our customers that our software products will perform in all material respects in accordance with our standard published specifications in effect at the time of delivery of the licensed products to the customer for 6 months after first use of the licensed products, but no more than 24 months after execution of the license agreement. Additionally, we warrant to our customers that our services will be performed consistent with generally accepted industry standards or specific service levels through completion of the agreed upon services. If necessary, we would provide for the estimated cost of product and service warranties based on specific warranty claims and claim history. However, we have not incurred significant recurring expense under our product or service warranties. As a result, we believe the estimated fair value of these agreements is nominal. Accordingly, we have no liabilities recorded for these agreements as of December 31, 2009.
Item 7A.Quantitative and Qualitative Disclosures About Market Risk
Foreign Business
Our international business is subject to risks typical of an international business, including, but not limited to: differing economic conditions, changes in political climate, differing tax structures, other regulations and restrictions, and foreign exchange rate volatility. Our international operations currently include business activity out of offices in the United Kingdom, the Netherlands, France, Australia, China, Japan, Singapore and India. When the U.S. dollar strengthens against a foreign currency, the value of our sales and expenses in that currency converted to U.S. dollars decreases. When the U.S. dollar weakens, the value of our sales and expenses in that currency converted to U.S. dollars increases. We recognized a foreign exchange loss of $1.0 million, in 2009 and foreign exchange gains of $3.9 million and $1.2 million in 2008 and 2007, respectively. Foreign exchange rate transaction gains and losses are classified in “Other (expense) income, net” in our Consolidated Statements of Operations. A fluctuation of 10% in the period end exchange rates at December 31, 2009 and 2008 relative to the U.S. dollar would result in changes of approximately $0.2 million and $0.1 million in the reported foreign currency gain or loss, respectively.
Interest Rates
We invest our cash in a variety of financial instruments, including taxable and tax-advantaged floating rate obligations of municipalities, and local, state and national governmental entities and agencies. These investments are denominated in U.S. dollars. Cash balances in foreign currencies overseas are derived from operations. At December 31, 2009, our cash, cash equivalent, and investments balance totaled $123.0 million, of which $120.2 million is 100% liquid. The remaining investments totaling $2.8 million are invested in auction rate securities.
Our cash equivalent balance at December 31, 2009 was $57.3 million. Cash equivalents principally consist of highly liquid money market funds with remaining maturities of less than three months when purchased. These investments are categorized as available-for-sale securities and recorded at fair market value. At December 31, 2009, we hold $6.5 million of investments in auction rate securities, which have original maturities greater than one year, but which have auctions to reset the yield every 7 to 35 days. The fair values of these auction rate securities considered the credit worthiness of the counterparty, estimates of interest rates, expected holding periods, and the timing and value of expected future cash flows. Changes in the assumptions of our valuation could have a significant impact on the value of these securities, which may cause losses and affect our liquidity specifically for these securities potentially requiring us to record an impairment charge on these investments in the future. Certain auctions failed during 2008 and the underlying securities were not redeemed by the issuer. During 2008, we recorded an other-than-temporary impairment charge of $3.5 million on one of these investments reducing the carrying value to zero due to credit downgrades of the underlying issuer and the bond insurer as well as increasing publicly reported exposure to bankruptcy risk by the issuer. During 2009 and 2008, we also recorded temporary impairment charges totaling $0.2 million on the investments, resulting in $2.8 million in total auction rate securities investments on the balance sheet at December 31, 2009. The remaining $2.8 million of auction rate securities held by us at December 31, 2009 were issued by state or regional educational loan authorities and are collateralized by federally insured student loans. These investments have high credit ratings, and we intend and have the ability to hold these securities until maturity or until called. The unrealized loss is included as a separate component of shareholders’ equity and in total comprehensive income. We will continue to evaluate the fair value of our investments in auction rate securities each reporting period for a potential other-than-temporary impairment.
Investments in both fixed rate and floating rate interest-earning instruments carry a degree of interest rate risk. Fixed rate securities may have their fair market value adversely impacted due to a rise in interest rates, while floating rate securities may produce
41
less income than expected if interest rates fall. Due in part to these factors, our future investment income may fall short of expectations due to changes in interest rates, or we may suffer losses in principal if forced to sell securities that have seen a decline in market value due to changes in interest rates. The weighted-average interest rate of return on cash and investment securities is less than 0.5% for the year ended December 31, 2009 as compared to 2.3% for the year ended December 31, 2008. The fair value of cash equivalents and investments held at December 31, 2009 and 2008 was $60.1 million and $49.3 million, respectively. Based on the average investments outstanding during 2009 and 2008, increases or decreases of 25 basis points would result in increases or decreases to interest income of approximately $0.3 million and $0.2 million in 2009 and 2008, respectively, from the reported interest income.
Item 8.Financial Statements and Supplementary Data
Financial Statements
INDEX TO CONSOLIDATED FINANCIAL STATEMENTS
| | | | | |
| | | Page |
| | | 43 | |
| | | 44 | |
| | | 45 | |
| | | 46 | |
| | | 47 | |
| | | 48 | |
| | | 49 | |
| | | 50 | |
| | | 51 | |
42
MANAGEMENT’S ANNUAL REPORT ON INTERNAL CONTROL OVER FINANCIAL REPORTING
Management of Manhattan Associates, Inc. is responsible for establishing and maintaining adequate internal control over financial reporting. The Company’s internal control over financial reporting is a process designed under the supervision of the Company’s principal executive and principal financial officers to provide reasonable assurance regarding the reliability of financial reporting and the preparation of the Company’s financial statements for external purposes in accordance with U.S. generally accepted accounting principles.
The Company’s internal control over financial reporting includes policies and procedures that pertain to the maintenance of records that, in reasonable detail, accurately and fairly reflect transactions and dispositions of assets; provide reasonable assurance that transactions are recorded as necessary to permit preparation of financial statements in accordance with U.S. generally accepted accounting principles, and that receipts and expenditures are being made only in accordance with authorizations of management and the directors of the Company; and provide reasonable assurance regarding prevention or timely detection of unauthorized acquisition, use or disposition of the Company’s assets that could have a material effect on the financial statements.
Because of its inherent limitations, internal control over financial reporting may not prevent or detect misstatements. Also, projections of any evaluation of effectiveness to future periods are subject to the risk that controls may become inadequate because of changes in conditions, or that the degree of compliance with the policies or procedures may deteriorate.
As of the end of the Company’s 2009 fiscal year, management conducted an assessment of the Company’s internal control over financial reporting based on the framework established in Internal Control — Integrated Framework issued by the Committee of Sponsoring Organizations of the Treadway Commission (COSO). Based on this assessment, management has determined that the Company’s internal control over financial reporting as of December 31, 2009 was effective.
Ernst & Young, the independent registered public accounting firm that audited the Company’s financial statements for the year ended December 31, 2009, has audited the Company’s internal control over financial reporting as of December 31, 2009 and has issued a report regarding the Company’s internal control over financial reporting appearing on page 44, which expresses an unqualified opinion on the effectiveness of the Company’s internal control over financial reporting as of December 31, 2009.
| | | | | |
| | | /s/ Peter F. Sinisgalli | | |
| | | | | |
| | | Peter F. Sinisgalli | | |
| | | President and Chief Executive Officer | | |
| | | | | |
| | | /s/ Dennis B. Story | | |
| | | | | |
| | | Dennis B. Story | | |
| | | Senior Vice President and Chief Financial Officer | | |
43
REPORT OF INDEPENDENT REGISTERED PUBLIC ACCOUNTING FIRM
ON INTERNAL CONTROL OVER FINANCIAL REPORTING
The Board of Directors and Shareholders
Manhattan Associates, Inc. and Subsidiaries
We have audited Manhattan Associates, Inc. and subsidiaries’ internal control over financial reporting as of December 31, 2009, based on criteria established in Internal Control—Integrated Framework issued by the Committee of Sponsoring Organizations of the Treadway Commission (the COSO criteria). Manhattan Associates, Inc. and subsidiaries’ management is responsible for maintaining effective internal control over financial reporting, and for its assessment of the effectiveness of internal control over financial reporting included in the accompanying Management’s Annual Report on Internal Control Over Financial Reporting. Our responsibility is to express an opinion on the Company’s internal control over financial reporting based on our audit.
We conducted our audit in accordance with the standards of the Public Company Accounting Oversight Board (United States). Those standards require that we plan and perform the audit to obtain reasonable assurance about whether effective internal control over financial reporting was maintained in all material respects. Our audit included obtaining an understanding of internal control over financial reporting, assessing the risk that a material weakness exists, testing and evaluating the design and operating effectiveness of internal control based on the assessed risk, and performing such other procedures as we considered necessary in the circumstances. We believe that our audit provides a reasonable basis for our opinion.
A company’s internal control over financial reporting is a process designed to provide reasonable assurance regarding the reliability of financial reporting and the preparation of financial statements for external purposes in accordance with generally accepted accounting principles. A company’s internal control over financial reporting includes those policies and procedures that (1) pertain to the maintenance of records that, in reasonable detail, accurately and fairly reflect the transactions and dispositions of the assets of the company; (2) provide reasonable assurance that transactions are recorded as necessary to permit preparation of financial statements in accordance with generally accepted accounting principles, and that receipts and expenditures of the company are being made only in accordance with authorizations of management and directors of the company; and (3) provide reasonable assurance regarding prevention or timely detection of unauthorized acquisition, use, or disposition of the company’s assets that could have a material effect on the financial statements.
Because of its inherent limitations, internal control over financial reporting may not prevent or detect misstatements. Also, projections of any evaluation of effectiveness to future periods are subject to the risk that controls may become inadequate because of changes in conditions, or that the degree of compliance with the policies or procedures may deteriorate.
In our opinion, Manhattan Associates, Inc. and subsidiaries maintained, in all material respects, effective internal control over financial reporting as of December 31, 2009, based on the COSO criteria.
We also have audited, in accordance with the standards of the Public Company Accounting Oversight Board (United States), the consolidated balance sheets of Manhattan Associates, Inc. and subsidiaries as of December 31, 2009 and 2008, and the related consolidated statements of operations, shareholders’ equity, comprehensive income and cash flows for each of the three years in the period ended December 31, 2009 of Manhattan Associates, Inc. and subsidiaries and our report dated February 19, 2010 expressed an unqualified opinion thereon.
Atlanta, Georgia
February 19, 2010
44
REPORT OF INDEPENDENT REGISTERED PUBLIC ACCOUNTING FIRM
ON THE CONSOLIDATED FINANCIAL STATEMENTS
The Board of Directors and Shareholders
Manhattan Associates, Inc. and Subsidiaries
We have audited the accompanying consolidated balance sheets of Manhattan Associates, Inc. and subsidiaries (the “Company”) as of December 31, 2009 and 2008, and the related consolidated statements of operations, shareholders’ equity, comprehensive income and cash flows for each of the three years in the period ended December 31, 2009. Our audits also included the financial statement schedule listed in the Index at Item 15(a). These financial statements and schedule are the responsibility of the Company’s management. Our responsibility is to express an opinion on these financial statements and schedule based on our audits.
We conducted our audits in accordance with the standards of the Public Company Accounting Oversight Board (United States). Those standards require that we plan and perform the audit to obtain reasonable assurance about whether the financial statements are free of material misstatement. An audit includes examining, on a test basis, evidence supporting the amounts and disclosures in the financial statements. An audit also includes assessing the accounting principles used and significant estimates made by management, as well as evaluating the overall financial statement presentation. We believe that our audits provide a reasonable basis for our opinion.
In our opinion, the consolidated financial statements referred to above present fairly, in all material respects, the consolidated financial position of the Company at December 31, 2009 and 2008, and the consolidated results of their operations and their cash flows for each of the three years in the period ended December 31, 2009, in conformity with U.S. generally accepted accounting principles. Also, in our opinion, the related financial statement schedule, when considered in relation to the basic financial statements taken as a whole, presents fairly in all material respects the information set forth therein.
As discussed in Note 3 to the consolidated financial statements, the Company adopted the provisions originally issued in Financial Accounting Standards Board (FASB) Interpretation No. 48,Accounting for Uncertainty in Income Taxes — an Interpretation of FASB Statement No. 109, effective January 1, 2007.
We also have audited, in accordance with the standards of the Public Company Accounting Oversight Board (United States), Manhattan Associates, Inc. and subsidiaries’ internal control over financial reporting as of December 31, 2009, based on criteria established in Internal Control — Integrated Framework issued by the Committee of Sponsoring Organizations of the Treadway Commission and our report dated February 19, 2010 expressed an unqualified opinion thereon.
Atlanta, Georgia
February 19, 2010
45
MANHATTAN ASSOCIATES, INC. AND SUBSIDIARIES
CONSOLIDATED STATEMENTS OF OPERATIONS
(in thousands, except per share amounts)
| | | | | | | | | | | | | |
| | | Year Ended December 31, | |
| | | 2009 | | | 2008 | | | 2007 | |
| Revenue: | | | | | | | | | | | | |
| Software license | | $ | 34,686 | | | $ | 65,313 | | | $ | 73,031 | |
| Services | | | 189,850 | | | | 235,967 | | | | 226,153 | |
| Hardware and other | | | 22,131 | | | | 35,921 | | | | 38,217 | |
| | | | | | | | | | |
| Total revenue | | | 246,667 | | | | 337,201 | | | | 337,401 | |
| Costs and expenses: | | | | | | | | | | | | |
| Cost of license | | | 4,726 | | | | 5,961 | | | | 5,334 | |
| Cost of services | | | 84,349 | | | | 116,707 | | | | 109,758 | |
| Cost of hardware and other | | | 18,386 | | | | 29,270 | | | | 32,268 | |
| Research and development | | | 36,681 | | | | 48,407 | | | | 46,594 | |
| Sales and marketing | | | 36,137 | | | | 51,177 | | | | 53,406 | |
| General and administrative | | | 29,946 | | | | 37,145 | | | | 33,366 | |
| Depreciation and amortization | | | 11,418 | | | | 12,699 | | | | 13,617 | |
| Restructuring charge | | | 3,882 | | | | 4,667 | | | | — | |
| Asset impairment charges | | | — | | | | 5,205 | | | | — | |
| | | | | | | | | | |
| Total costs and expenses | | | 225,525 | | | | 311,238 | | | | 294,343 | |
| | | | | | | | | | |
| Operating income | | | 21,142 | | | | 25,963 | | | | 43,058 | |
| Interest income, net | | | 368 | | | | 1,823 | | | | 3,390 | |
| Other (expense) income, net | | | (1,124 | ) | | | 3,722 | | | | 1,218 | |
| | | | | | | | | | |
| Income before income taxes | | | 20,386 | | | | 31,508 | | | | 47,666 | |
| Income tax provision | | | 3,824 | | | | 8,710 | | | | 16,915 | |
| | | | | | | | | | |
| Net income | | $ | 16,562 | | | $ | 22,798 | | | $ | 30,751 | |
| | | | | | | | | | |
| |
| Basic earnings per share | | $ | 0.74 | | | $ | 0.95 | | | $ | 1.17 | |
| Diluted earnings per share | | $ | 0.73 | | | $ | 0.94 | | | $ | 1.13 | |
| | | | | | | | | | | | | |
| Weighted average number of shares: | | | | | | | | | | | | |
| Basic | | | 22,385 | | | | 24,053 | | | | 26,174 | |
| Diluted | | | 22,558 | | | | 24,328 | | | | 27,329 | |
The accompanying notes are an integral part of these Consolidated Statements of Operations.
46
MANHATTAN ASSOCIATES, INC. AND SUBSIDIARIES
CONSOLIDATED BALANCE SHEETS
(in thousands, except share and per share data)
| | | | | | | | | |
| | | December 31, | |
| | | 2009 | | | 2008 | |
ASSETS | | | | | | | | |
| Current Assets: | | | | | | | | |
| Cash and cash equivalents | | $ | 120,217 | | | $ | 85,739 | |
| Accounts receivable, net of allowance of $4,943 and $5,566 in 2009 and 2008, respectively | | | 37,945 | | | | 63,896 | |
| Deferred income taxes | | | 5,745 | | | | 6,667 | |
| Prepaid expenses | | | 4,240 | | | | 5,410 | |
| Other current assets | | | 607 | | | | 1,569 | |
| | | | | | | |
| Total current assets | | | 168,754 | | | | 163,281 | |
| | | | | | | | | |
| Property and equipment, net | | | 15,759 | | | | 21,721 | |
| Long-term investments | | | 2,797 | | | | 2,967 | |
| Acquisition-related intangible assets, net | | | 3,473 | | | | 6,438 | |
| Goodwill, net | | | 62,280 | | | | 62,276 | |
| Deferred income taxes | | | 9,826 | | | | 10,932 | |
| Other assets | | | 1,822 | | | | 2,606 | |
| | | | | | | |
| Total assets | | $ | 264,711 | | | $ | 270,221 | |
| | | | | | | |
| | | | | | | | | |
LIABILITIES AND SHAREHOLDERS’ EQUITY | | | | | | | | |
| | | | | | | | | |
| Current liabilities: | | | | | | | | |
| Accounts payable | | $ | 4,434 | | | $ | 8,480 | |
| Accrued compensation and benefits | | | 12,855 | | | | 17,429 | |
| Accrued and other liabilities | | | 15,430 | | | | 16,188 | |
| Deferred revenue | | | 37,436 | | | | 32,984 | |
| Income taxes payable | | | 796 | | | | 2,365 | |
| | | | | | | |
| Total current liabilities | | | 70,951 | | | | 77,446 | |
| | | | | | | | | |
| Deferred rent — long-term | | | 7,830 | | | | 8,387 | |
| Other non-current liabilities | | | 2,565 | | | | 4,549 | |
| | | | | | | | | |
| Shareholders’ equity: | | | | | | | | |
| Preferred stock, no par value; 20,000,000 shares authorized, no shares issued or outstanding in 2009 or 2008 | | | — | | | | — | |
| Common stock, $.01 par value; 100,000,000 shares authorized; 22,467,123 and 23,581,109 shares issued and outstanding at December 31, 2009 and 2008, respectively | | | 225 | | | | 234 | |
| Additional paid-in capital | | | 2,892 | | | | — | |
| Retained earnings | | | 182,387 | | | | 182,882 | |
| Accumulated other comprehensive loss | | | (2,139 | ) | | | (3,277 | ) |
| | | | | | | |
| Total shareholders’ equity | | | 183,365 | | | | 179,839 | |
| | | | | | | |
| Total liabilities and shareholders’ equity | | $ | 264,711 | | | $ | 270,221 | |
| | | | | | | |
The accompanying notes are an integral part of these Consolidated Balance Sheets.
47
MANHATTAN ASSOCIATES, INC. AND SUBSIDIARIES
CONSOLIDATED STATEMENTS OF CASH FLOWS
(in thousands)
| | | | | | | | | | | | | |
| | | Year Ended December 31, | |
| | | 2009 | | | 2008 | | | 2007 | |
Operating activities: | | | | | | | | | | | | |
| Net income | | $ | 16,562 | | | $ | 22,798 | | | $ | 30,751 | |
| Adjustments to reconcile net income to net cash provided by operating activities: | | | | | | | | | | | | |
| Depreciation and amortization | | | 11,418 | | | | 12,699 | | | | 13,617 | |
| Asset impairment charge | | | — | | | | 5,205 | | | | — | |
| Stock compensation | | | 8,622 | | | | 8,864 | | | | 6,199 | |
| Loss on disposal of equipment | | | 130 | | | | 156 | | | | 12 | |
| Tax (deficiency) benefit of stock awards exercised/vested | | | (1,023 | ) | | | 202 | | | | 1,835 | |
| Excess tax benefits from stock based compensation | | | (64 | ) | | | (100 | ) | | | (721 | ) |
| Deferred income taxes | | | 2,077 | | | | (1,389 | ) | | | (2,759 | ) |
| Unrealized foreign currency loss (gain) | | | 1,022 | | | | (694 | ) | | | (1,419 | ) |
| Changes in operating assets and liabilities: | | | | | | | | | | | | |
| Accounts receivable, net | | | 26,658 | | | | 7,077 | | | | (10,618 | ) |
| Other assets | | | 3,058 | | | | 2,691 | | | | 3,451 | |
| Accounts payable, accrued and other liabilities | | | (10,453 | ) | | | 5,997 | | | | (5,339 | ) |
| Income taxes | | | (3,502 | ) | | | (1,324 | ) | | | 1,528 | |
| Deferred revenue | | | 3,818 | | | | 1,659 | | | | 1,737 | |
| | | | | | | | | | |
| Net cash provided by operating activities | | | 58,323 | | | | 63,841 | | | | 38,274 | |
| | | | | | | | | | |
| | | | | | | | | | | | | |
Investing activities: | | | | | | | | | | | | |
| Purchase of property and equipment | | | (2,378 | ) | | | (7,708 | ) | | | (9,401 | ) |
| Purchases of available-for-sale investments | | | — | | | | (285,593 | ) | | | (688,172 | ) |
| Maturies of available-for-sale investments | | | 84 | | | | 307,216 | | | | 772,689 | |
| | | | | | | | | | |
| Net cash (used in) provided by investing activities | | | (2,294 | ) | | | 13,915 | | | | 75,116 | |
| | | | | | | | | | |
| | | | | | | | | | | | | |
Financing activities: | | | | | | | | | | | | |
| Purchase of common stock | | | (23,435 | ) | | | (35,107 | ) | | | (99,931 | ) |
| Proceeds from issuance of common stock from options exercised | | | 1,662 | | | | 3,177 | | | | 10,910 | |
| Excess tax benefits from stock based compensation | | | 64 | | | | 100 | | | | 721 | |
| | | | | | | | | | |
| Net cash used in financing activities | | | (21,709 | ) | | | (31,830 | ) | | | (88,300 | ) |
| | | | | | | | | | |
| | | | | | | | | | | | | |
| Foreign currency impact on cash | | | 158 | | | | (4,862 | ) | | | 1,136 | |
| | | | | | | | | | |
| Net change in cash and cash equivalents | | | 34,478 | | | | 41,064 | | | | 26,226 | |
| Cash and cash equivalents at beginning of period | | | 85,739 | | | | 44,675 | | | | 18,449 | |
| | | | | | | | | | |
| Cash and cash equivalents at end of period | | $ | 120,217 | | | $ | 85,739 | | | $ | 44,675 | |
| | | | | | | | | | |
| | | | | | | | | | | | | |
| Supplemental disclosures of cash flow information: | | | | | | | | | | | | |
| Cash paid for taxes | | $ | 6,218 | | | $ | 11,135 | | | $ | 16,261 | |
| | | | | | | | | | |
| | | | | | | | | | | | | |
| Supplemental disclosures of cash flow information- noncash investing activity: | | | | | | | | | | | | |
| Tenant improvements funded by landlord | | $ | — | | | $ | — | | | $ | 7,918 | |
| | | | | | | | | | |
The accompanying notes are an integral part of these Consolidated Statements of Cashflows.
48
MANHATTAN ASSOCIATES, INC. AND SUBSIDIARIES
CONSOLIDATED STATEMENTS OF SHAREHOLDERS’ EQUITY
(In thousands, except share data)
| | | | | | | | | | | | | | | | | | | | | | | | | |
| | | | | | | | | | | | | | | | | | | Accumulated | | | | |
| | | | | | | | | | | Additional | | | | | | | Other | | | Total | |
| | | Common Stock | | | Paid-In | | | Retained | | | Comprehensive | | | Shareholders�� | |
| | | Shares | | | Amount | | | Capital | | | Earnings | | | Income (Loss) | | | Equity | |
| Balance, December 31, 2006 | | | 27,610,105 | | | $ | 276 | | | $ | 98,704 | | | $ | 136,321 | | | $ | 1,839 | | | $ | 237,140 | |
| Repurchase of common stock | | | (3,562,619 | ) | | | (36 | ) | | | (99,895 | ) | | | — | | | | — | | | | (99,931 | ) |
| Stock option exercises | | | 580,433 | | | | 6 | | | | 10,904 | | | | — | | | | — | | | | 10,910 | |
| Stock option expense | | | — | | | | — | | | | 4,274 | | | | — | | | | — | | | | 4,274 | |
| Restricted stock issuance/expense | | | 272,000 | | | | 3 | | | | 1,922 | | | | — | | | | — | | | | 1,925 | |
| Tax effects of stock based compensation | | | — | | | | — | | | | 1,835 | | | | — | | | | — | | | | 1,835 | |
| Foreign currency translation adjustment | | | — | | | | — | | | | — | | | | — | | | | 678 | | | | 678 | |
| Unrealized gain on investments | | | — | | | | — | | | | — | | | | | | | | 6 | | | | 6 | |
| Adoption of uncertainty in income tax | | | — | | | | — | | | | — | | | | (1,883 | ) | | | — | | | | (1,883 | ) |
| Net income | | | — | | | | — | | | | — | | | | 30,751 | | | | — | | | | 30,751 | |
| | | | | | | | | | | | | | | | | | | |
| Balance, December 31, 2007 | | | 24,899,919 | | | | 249 | | | | 17,744 | | | | 165,189 | | | | 2,523 | | | | 185,705 | |
| Repurchase of common stock | | | (1,710,441 | ) | | | (17 | ) | | | (29,985 | ) | | | (5,105 | ) | | | — | | | | (35,107 | ) |
| Stock option exercises | | | 203,275 | | | | 2 | | | | 3,175 | | | | — | | | | — | | | | 3,177 | |
| Stock option expense | | | — | | | | — | | | | 5,458 | | | | — | | | | — | | | | 5,458 | |
| Restricted stock issuance/expense | | | 188,356 | | | | — | | | | 3,406 | | | | — | | | | — | | | | 3,406 | |
| Tax effects of stock based compensation | | | — | | | | — | | | | 202 | | | | — | | | | — | | | | 202 | |
| Foreign currency translation adjustment | | | — | | | | — | | | | — | | | | — | | | | (5,768 | ) | | | (5,768 | ) |
| Unrealized loss on investments | | | — | | | | — | | | | — | | | | — | | | | (32 | ) | | | (32 | ) |
| Net income | | | — | | | | — | | | | — | | | | 22,798 | | | | — | | | | 22,798 | |
| | | | | | | | | | | | | | | | | | | |
| Balance, December 31, 2008 | | | 23,581,109 | | | | 234 | | | | — | | | | 182,882 | | | | (3,277 | ) | | | 179,839 | |
| Repurchase of common stock | | | (1,409,922 | ) | | | (14 | ) | | | (6,364 | ) | | | (17,057 | ) | | | — | | | | (23,435 | ) |
| Stock option exercises | | | 130,650 | | | | 1 | | | | 1,661 | | | | — | | | | — | | | | 1,662 | |
| Stock option expense | | | — | | | | — | | | | 5,153 | | | | — | | | | — | | | | 5,153 | |
| Restricted stock issuance/expense | | | 165,286 | | | | 4 | | | | 3,465 | | | | — | | | | — | | | | 3,469 | |
| Tax effects of stock based compensation | | | — | | | | — | | | | (1,023 | ) | | | — | | | | — | | | | (1,023 | ) |
| Foreign currency translation adjustment | | | — | | | | — | | | | — | | | | — | | | | 1,225 | | | | 1,225 | |
| Unrealized loss on investments | | | — | | | | — | | | | — | | | | — | | | | (87 | ) | | | (87 | ) |
| Net income | | | — | | | | — | | | | — | | | | 16,562 | | | | — | | | | 16,562 | |
| | | | | | | | | | | | | | | | | | | |
Balance, December 31, 2009 | | | 22,467,123 | | | $ | 225 | | | $ | 2,892 | | | $ | 182,387 | | | $ | (2,139 | ) | | $ | 183,365 | |
| | | | | | | | | | | | | | | | | | | |
The accompanying notes are an integral part of these Consolidated Statements of Shareholders’ Equity.
49
MANHATTAN ASSOCIATES, INC. AND SUBSIDIARIES
CONSOLIDATED STATEMENTS OF COMPREHENSIVE INCOME
(In thousands)
| | | | | | | | | | | | | |
| | | Year Ended December 31, | |
| | | 2009 | | | 2008 | | | 2007 | |
| Net income | | $ | 16,562 | | | $ | 22,798 | | | $ | 30,751 | |
| | | | | | | | | | | | | |
| Other comprehensive income (loss), net of tax: | | | | | | | | | | | | |
| Foreign currency translation adjustment | | | 1,225 | | | | (5,768 | ) | | | 678 | |
| Unrealized (loss) gain on investments | | | (87 | ) | | | (32 | ) | | | 6 | |
| | | | | | | | | | |
| Other comprehensive income (loss) | | | 1,138 | | | | (5,800 | ) | | | 684 | |
| | | | | | | | | | |
| | | | | | | | | | | | | |
| Comprehensive income | | $ | 17,700 | | | $ | 16,998 | | | $ | 31,435 | |
| | | | | | | | | | |
The accompanying notes are an integral part of these Consolidated Statements of Comprehensive Income.
50
MANHATTAN ASSOCIATES, INC. AND SUBSIDIARIES
NOTES TO CONSOLIDATED FINANCIAL STATEMENTS
December 31, 2009, 2008 and 2007
1. Organization and Summary of Significant Accounting Policies
Organization and Business
Manhattan Associates, Inc. (“Manhattan” or the “Company”) is a developer and provider of supply chain solutions that help organizations optimize the effectiveness, efficiency, and strategic advantages of their supply chains. The Company’s solutions consist of software, services and hardware, which coordinate people, workflows, assets, events and tasks holistically across the functions linked in a supply chain from planning through execution. These solutions also help coordinate the actions, data exchange and communication of participants in supply chain ecosystems, such as manufacturers, suppliers, distributors, trading partners, transportation providers, channels (such as catalogers, store retailers and Web outlets) and consumers.
The Company’s operations are in North America, Europe and Asia/Pacific. Its European operations are conducted through its wholly-owned subsidiaries, Manhattan Associates Limited, Manhattan Associates Europe B.V., Manhattan France SARL, and Manhattan Associates GmbH, in the United Kingdom, the Netherlands, France, and Germany, respectively. The Company’s Asia/Pacific operations are conducted through its wholly-owned subsidiaries, Manhattan Associates Pty Ltd., Manhattan Associates KK, Manhattan Associates Software (Shanghai), Co. Ltd., Manhattan Associates Software Pte Ltd., and Manhattan Associates (India) Development Centre Private Limited in Australia, Japan, China, Singapore, and India, respectively. The Company occasionally sells its products and services in other countries, such as countries in Latin America, Eastern Europe, Middle East, and Asia, through its direct sales channel as well as various reseller channels.
Principles of Consolidation and Foreign Currency Translation
The accompanying consolidated financial statements include the accounts of the Company and its wholly-owned subsidiaries. All significant intercompany balances and transactions have been eliminated in consolidation.
The financial statements of foreign subsidiaries have been translated into United States dollars in accordance with the foreign currency matters topic in the Financial Accounting Standards Board’s (“FASB”) Accounting Standards Codification (the “Codification”). Revenues and expenses from international operations were denominated in the respective local currencies and translated using the average monthly exchange rates for the year. All balance sheet accounts have been translated using the exchange rates in effect at the balance sheet date and the effect of changes in exchange rates from year to year are disclosed as a separate component of shareholders’ equity and comprehensive income.
Summary of Significant Accounting Policies
Cash and Cash Equivalents
The Company considers all highly liquid investments purchased with original maturities of three months or less to be cash or cash equivalents.
Concentrations of Credit Risk
Financial instruments that potentially subject the Company to significant concentrations of credit risk consist principally of cash and cash equivalents, short- and long-term investments and accounts receivable. The Company maintains cash and cash equivalents and short- and long-term investments with various financial institutions. Amounts held at certain financial institutions are above the federally insured limit. The Company’s sales are primarily to companies located in the United States, Europe and Asia. The Company performs periodic credit evaluations of its customers’ financial condition and does not require collateral. Accounts receivable are due principally from large U.S., European and Asia Pacific companies under stated contract terms. Accounts receivable, net as of December 31, 2009 for the Americas, EMEA and APAC companies were $30.7 million, $4.9 million and $2.3 million, respectively. Accounts receivable, net as of December 31, 2008 for the Americas, EMEA and APAC companies were $52.1 million, $7.2 million and $4.6 million, respectively. The Company’s top five customers in aggregate accounted for 11%, 11% and 13% of total revenue in the period the related sales were recorded for each of the years ended December 31, 2009, 2008 and 2007, respectively. No single customer accounted for more than 10% of revenue in the years ended December 31, 2009, 2008 and 2007 or for more than 10% of accounts receivable as of December 31, 2009 and 2008.
51
MANHATTAN ASSOCIATES, INC. AND SUBSIDIARIES
NOTES TO CONSOLIDATED FINANCIAL STATEMENTS (Continued)
December 31, 2009, 2008 and 2007
Investments
The Company measures its investments based on a fair value hierarchy disclosure framework that prioritizes and ranks the level of market price observability used in measuring assets and liabilities at fair value. Market price observability is impacted by a number of factors, including the type of asset or liability and their characteristics. This hierarchy prioritizes the inputs into three broad levels as follows:
| | • | | Level 1—Quoted prices in active markets for identical instruments. |
| |
| | • | | Level 2—Quoted prices for similar instruments in active markets; quoted prices for identical or similar instruments in markets that are not active; and model-derived valuations in which all significant inputs and significant value drivers are observable in active markets. |
| |
| | • | | Level 3—Valuations derived from valuation techniques in which one or more significant inputs or significant value drivers are unobservable. |
The Company’s investments are categorized as available-for-sale securities and recorded at fair market value. Investments with maturities of 90 days or less from the date of purchase are classified as cash equivalents; investments with maturities of greater than 90 days from the date of purchase but less than one year are generally classified as short-term investments; and investments with maturities of greater than one year from the date of purchase are generally classified as long-term investments. Unrealized holding gains and losses are reflected as a net amount in a separate component of shareholders’ equity until realized. For the purposes of computing realized gains and losses, cost is determined on a specific identification basis.
At December 31, 2009, the Company’s cash balance was $62.9 million and the cash equivalent balance was $57.3 million. Cash equivalents primarily consist of highly liquid money market funds with remaining maturities of less than three months when purchased. The Company’s investments of $2.8 million are invested in auction rate securities with original maturities ranging from 2025 to 2040. Previously, auctions were held for these securities that reset their yield every 7 to 35 days. Beginning in 2008 however, auctions for these securities failed to attract sufficient buyers, resulting in the Company continuing to hold these securities. Accordingly, the Company began classifying these securities as long-term investments in marketable securities in the consolidated balance sheet due to uncertainty surrounding the timing of a market recovery. In determining the fair values of auction rate securities, the Company considered the credit worthiness of the counterparty, estimates of interest rates, expected holding periods, and the timing and value of expected future cash flows. The $2.8 million of auction rate securities held by the Company at December 31, 2009 were issued by state or regional educational loan authorities and are collateralized by federally insured student loans. These investments consequently have high credit ratings, and the Company intends and has the ability to hold these securities until maturity or until redeemed. However, due to liquidity concerns rather than creditworthiness, the Company has recorded an unrealized loss of $0.2 million as of December 31, 2009 for the temporary decline in the fair value of these investments. The unrealized loss is included as a separate component of shareholders’ equity and in total comprehensive income. The Company will continue to evaluate the fair value of its investments in auction rate securities each reporting period for a potential other-than-temporary impairment.
The Company uses quoted prices from active markets which are classified at level 1 as a highest level observable input in the disclosure hierarchy framework for all other available-for-sale securities.
The following table set forth the assets carried at fair value measured on a recurring basis at December 31, 2009 (in thousands):
| | | | | | | | | | | | | | | | | |
| | | Fair Value Measurements at December 31, 2009 Using | | | | |
| | | | | | | Significant Other | | | Significant | | | | |
| | | Quoted Prices | | | Observable Inputs | | | Unobservable Inputs | | | | |
| | | (Level 1) | | | (Level 2) | | | (Level 3) | | | Total | |
| Available-for-sale securities | | $ | 57,309 | | | $ | — | | | $ | 2,797 | | | $ | 60,106 | |
| | | | | | | | | | | | | |
| Total investments | | $ | 57,309 | | | $ | — | | | $ | 2,797 | | | $ | 60,106 | |
| | | | | | | | | | | | | |
In July 2003, the Company invested $2.0 million in an RFID technology company. The investment has been accounted for under the cost method and is included in “Other Assets” on the consolidated balance sheets. In the third quarter of 2006, the Company
52
MANHATTAN ASSOCIATES, INC. AND SUBSIDIARIES
NOTES TO CONSOLIDATED FINANCIAL STATEMENTS (Continued)
December 31, 2009, 2008 and 2007
wrote down its investment by $0.3 million due to uncertainties associated with the fair value of the investment following an unsuccessful public offering. During the third quarter of 2008, the Company wrote down the remaining balance of this investment recording an other-than-temporary impairment charge of $1.7 million. The Company recorded the additional impairment due to a combination of continued negative financial results reported by this company in a very competitive sector and a “down round” of financing (i.e., a round of financing that was dilutive to the Company’s investment) in which the Company’s preferred share ownership was converted into common stock, eliminating the Company’s preference rights associated with liquidation, thereby substantially impairing its ability to recoup its investment. The $1.7 million charge is included in “Asset impairment charges” in the 2008 Consolidated Statements of Operations.
Following is a summary of the Company’s future available-for-sale investment maturities as of December 31, 2009 (in thousands):
| | | | | |
| Less than 1 year | | $ | 57,309 | |
| Over 10 years | | | 2,797 | |
| | | | |
| Total | | $ | 60,106 | |
| | | | |
Use of Estimates
The preparation of financial statements in conformity with U.S. generally accepted accounting principles requires management to make estimates and assumptions that affect the reported amounts of assets and liabilities, disclosure of contingent assets and liabilities at the date of the financial statements and the reported amounts of revenue and expenses during the reporting period. Significant estimates include the allowance for doubtful accounts, which is based upon an evaluation of historical amounts written-off, the customers’ ability to pay and general economic conditions; the useful lives of intangible assets; self insurance accruals; legal accruals; the recoverability or impairment of intangible asset values; stock based compensation, which is based on the expected term of the award and corresponding expected volatility, risk-free interest rate, and dividends; and the Company’s effective income tax rate and deferred tax assets, which are based upon the Company’s expectations of future taxable income, allowable deductions, and projected tax credits. Actual results will differ from these estimates.
Fair Value of Financial Instruments
The carrying values of cash and cash equivalents, accounts receivable, accounts payable, and other financial instruments included in the accompanying Consolidated Balance Sheets approximate their fair values principally due to the short-term maturities of these instruments. Unrealized gains and losses on investments are included as a separate component of “Accumulated other comprehensive loss,” net of any related tax effect, in the Consolidated Balance Sheets.
Risks Associated with Single Business Line, Technological Advances, and Foreign Operations
The Company currently derives a substantial portion of its revenues from sales of its software and related services and hardware. The markets for supply chain execution and supply chain planning solutions are highly competitive, subject to rapid technological change, changing customer needs, frequent new product introductions, and evolving industry standards that may render existing products and services obsolete. As a result, the Company’s position in these markets could be eroded rapidly by unforeseen changes in customer requirements for application features, functions, and technologies. The Company’s growth and future operating results will depend, in part, upon its ability to enhance existing applications and develop and introduce new applications that meet changing customer requirements that respond to competitive products and that achieve market acceptance. Any factor adversely affecting the markets for supply chain execution and supply chain planning solutions could have an adverse effect on the Company’s business, financial condition, and results of operations.
The Company’s international business is subject to risks typical of an international business, including, but not limited to differing economic conditions, changes in political climate, differing tax structures, other regulations and restrictions, and foreign exchange rate volatility. Accordingly, the future results could be materially adversely impacted by changes in these or other factors. The Company recognized a foreign exchange rate loss of $1.0 million in 2009 and foreign exchange rate gains of $3.9 million and $1.2 million in 2008 and 2007, respectively. Foreign exchange rate transaction gains and losses are classified in “Other (expense) income, net” on the Consolidated Statements of Operations.
53
MANHATTAN ASSOCIATES, INC. AND SUBSIDIARIES
NOTES TO CONSOLIDATED FINANCIAL STATEMENTS (Continued)
December 31, 2009, 2008 and 2007
Revenue Recognition
The Company’s revenue consists of revenues from the licensing and hosting of software, fees from implementation and training services (collectively, “professional services”), plus customer support and software enhancements, and sales of hardware and other revenues (other revenues consists of reimbursements of out of pocket expenses incurred in connection with the Company’s professional services). All revenue is recognized net of any related sales taxes.
The Company recognizes license revenue when the following criteria are met: (1) a signed contract is obtained; (2) delivery of the product has occurred; (3) the license fee is fixed or determinable; and (4) collection is probable. Revenue recognition for software with multiple-element arrangements requires recognition of revenue using the “residual method” when (a) there is vendor-specific objective evidence of the fair values of all undelivered elements in a multiple-element arrangement that is not accounted for using long-term contract accounting; (b) vendor-specific objective evidence of fair value does not exist for one or more of the delivered elements in the arrangement; and (c) all other applicable revenue-recognition criteria for software revenue recognition, other than the requirement for vendor-specific objective evidence of the fair value of each delivered element of the arrangement, are satisfied. For those contracts that contain significant customization or modifications, license revenue is recognized using contract accounting.
The Company allocates revenue to customer support and software enhancements and any other undelivered elements of the arrangement based on vendor specific objective evidence, or VSOE, of fair value of each element and such amounts are deferred until the applicable delivery criteria and other revenue recognition criteria have been met. The balance of the revenue, net of any discounts inherent in the arrangement, is recognized at the outset of the arrangement using the residual method as the product licenses are delivered. If the Company cannot objectively determine the fair value of each undelivered element based on the VSOE of fair value, the Company defers revenue recognition until all elements are delivered, all services have been performed, or until fair value can be objectively determined. The Company must apply judgment in determining all elements of the arrangement and in determining the VSOE of fair value for each element, considering the price charged for each product on a stand-alone basis or applicable renewal rates.
The accounting related to license revenue recognition in the software industry is complex and affected by interpretations of the rules which are subject to change. Judgment is required in assessing the probability of collection, which is generally based on evaluation of customer-specific information, historical collection experience and economic market conditions. If market conditions decline, or if the financial condition of customers deteriorate, the Company may be unable to determine that collectibility is probable, and the Company could be required to defer the recognition of revenue until the Company receives customer payments.
The Company’s services revenue consists of fees generated from professional services, customer support services and software enhancements related to the Company’s software products. Fees from professional services performed by the Company are generally billed on an hourly basis, and revenue is recognized as the services are performed. Professional services are sometimes rendered under agreements in which billings are limited to contractual maximums or based upon a fixed-fee for portions of or all of the engagement. Revenue related to fixed-fee based contracts is recognized on a proportional performance basis based on the hours incurred on discrete projects within an overall services arrangement. Project losses are provided for in their entirety in the period in which they become known. Revenue related to customer support services and software enhancements are generally paid in advance and recognized ratably over the term of the agreement, typically 12 months.
Hardware revenue is generated from the resale of a variety of hardware products, developed and manufactured by third parties, that are integrated with and complementary to the Company’s software solutions. As part of a complete solution, the Company’s customers frequently purchase hardware from the Company in conjunction with the licensing of software. These products include computer hardware, radio frequency terminals networks, RFID chip readers, bar code printers and scanners, and other peripherals. Hardware revenue is recognized upon shipment to the customer when title passes. The Company generally purchases hardware from its vendors only after receiving an order from a customer. As a result, the Company does not maintain significant hardware inventory.
In accordance with the other presentation matters within the Revenue Recognition Topic of the FASB Accounting Standards Codification, the Company recognizes amounts associated with reimbursements from customers for out-of-pocket expenses as revenue. Such amounts have been classified to hardware and other revenue. The total amount of expense reimbursement recorded to revenue was $7.5 million, $12.7 million and $13.0 million for 2009, 2008 and 2007, respectively.
54
MANHATTAN ASSOCIATES, INC. AND SUBSIDIARIES
NOTES TO CONSOLIDATED FINANCIAL STATEMENTS (Continued)
December 31, 2009, 2008 and 2007
Deferred Revenue
Deferred revenue represents amounts collected prior to having completed performance of professional services, customer support services and software enhancements and significant remaining obligations under license agreements. The Company generally expects to complete such services or obligations within the next twelve months.
Returns and Allowances
The Company has not experienced significant returns or warranty claims to date and, as a result, has not recorded a provision for the cost of returns and product warranty claims at December 31, 2009 or 2008.
The Company records an allowance for doubtful accounts based on the historical experience of write-offs and a detailed assessment of accounts receivable. Additions to the allowance for doubtful accounts generally represent a sales allowance on services revenue, which are recorded to operations as a reduction to services revenue. The total amounts charged to operations were $3.6 million, $4.9 million and $5.7 million for 2009, 2008 and 2007, respectively. In estimating the allowance for doubtful accounts, management considers the age of the accounts receivable, the Company’s historical write-offs, and the credit worthiness of the customer, among other factors. Should any of these factors change, the estimates made by management will also change accordingly, which could affect the level of the Company’s future allowances. Uncollectible accounts are written off when it is determined that the specific balance is not collectible.
Property and Equipment
Property and equipment is recorded at cost and consists of furniture, computers, other office equipment, internal use software, and leasehold improvements. The Company depreciates the cost of furniture, computers, other office equipment and internal use software on a straight-line basis over their estimated useful lives (three to five years for computer equipment and software, five years for office equipment, seven years for furniture). Leasehold improvements are depreciated over the lesser of their useful lives or the term of the lease. Depreciation and amortization expense for property and equipment, including assets under a capital lease, for the years ended December 31, 2009, 2008 and 2007 was approximately $8.4 million, $9.4 million and $9.0 million, respectively, and was included in “Depreciation and amortization” in the Consolidated Statements of Operations.
Property and equipment, at cost, consist of the following (in thousands):
| | | | | | | | | |
| | | December 31, | |
| | | 2009 | | | 2008 | |
| Computer equipment and software | | $ | 47,151 | | | $ | 47,285 | |
| Furniture and office equipment | | | 7,539 | | | | 7,288 | |
| Leasehold improvement | | | 14,827 | | | | 14,208 | |
| | | | | | | |
| | | | 69,517 | | | | 68,781 | |
| Less accumulated depreciation and amortization | | | (53,758 | ) | | | (47,060 | ) |
| | | | | | | |
| | | $ | 15,759 | | | $ | 21,721 | |
| | | | | | | |
Acquisition-Related Intangible Assets
Acquisition-related intangible assets are stated at historical cost and include acquired software and certain other intangible assets with definite lives. The acquired software is being amortized over the greater of the amount computed using (a) the ratio that current gross revenues bear to the total of current and anticipated future gross revenues for each product or (b) the straight-line method over the remaining estimated economic life of the product including the period being reported on. The weighted average amortization period for acquired software is 4.9 years. The other intangible assets are being amortized on a straight-line basis over a period of two to ten years with a weighted average amortization period of 6.2 years. The weighted average amortization period for all intangible assets is 5.6 years. Total amortization expense related to acquisition-related intangible assets was approximately $3.0 million, $3.3 million and $4.7 million for the years ended December 31, 2009, 2008 and 2007, respectively, and are included in “Depreciation and amortization” in the accompanying Consolidated Statements of Operations.
55
MANHATTAN ASSOCIATES, INC. AND SUBSIDIARIES
NOTES TO CONSOLIDATED FINANCIAL STATEMENTS (Continued)
December 31, 2009, 2008 and 2007
Acquisition-Related Intangible Assets consist of the following (in thousands):
| | | | | | | | | |
| | | December 31, | |
| | | 2009 | | | 2008 | |
| Cost: | | | | | | | | |
| Acquired software | | $ | 15,791 | | | $ | 15,791 | |
| Other intangible assets with definite lives | | | 19,087 | | | | 19,087 | |
| | | | | | | |
| | | | 34,878 | | | | 34,878 | |
| | | | | | | | | |
| Accumulated amortization: | | | | | | | | |
| Acquired software | | | (15,259 | ) | | | (14,460 | ) |
| Other intangible assets with definite lives | | | (16,146 | ) | | | (13,980 | ) |
| | | | | | | |
| | | | (31,405 | ) | | | (28,440 | ) |
| | | | | | | | | |
| Net book value: | | | | | | | | |
| Acquired software | | $ | 532 | | | $ | 1,331 | |
| Other intangible assets with definite lives | | | 2,941 | | | | 5,107 | |
| | | | | | | |
| | | $ | 3,473 | | | $ | 6,438 | |
| | | | | | | |
The Company expects amortization expense for the next five years to be as follows based on intangible assets as of December 31, 2009 (in thousands):
| | | | | |
| Year ending December 31, | | | | |
| 2010 | | $ | 2,287 | |
| 2011 | | | 1,172 | |
| 2012 | | | 7 | |
| 2013 | | | 6 | |
| 2014 | | | 1 | |
| | | | |
| Total amortization expense expected | | $ | 3,473 | |
| | | | |
Goodwill
Goodwill represents the excess of purchase price over fair value of net identified tangible and intangible assets and liabilities acquired. The Company does not amortize goodwill, but instead tests goodwill for impairment on at least an annual basis. Goodwill was $62.3 million at the end of each year ended December 31, 2009 and 2008. Approximately $36.0 million of the gross Goodwill is deductible for income tax purposes. To date, there have been no goodwill impairments. The change in the balance from December 31, 2008 to 2009 is due to foreign exchange fluctuations in EMEA.
Software Development Costs
Research and development expenses are charged to expense as incurred. The Company determines the amount of development costs capitalizable under the provisions of FASB Codification accounting for costs of computer software to be sold, leased, or marketed. Under the accounting for costs of computer software to be sold, leased, or marketed codification, computer software development costs are charged to research and development expense until technological feasibility is established, after which remaining software production costs are capitalized. The Company has defined technological feasibility as the point in time at which the Company has a detailed program design or a working model of the related product, depending on the type of development efforts. For the years ended December 31, 2009, 2008 and 2007, the Company capitalized no internal research and development costs because the costs incurred between the attainment of technological feasibility for the related software product through the date when the product was available for general release to customers has been insignificant.
56
MANHATTAN ASSOCIATES, INC. AND SUBSIDIARIES
NOTES TO CONSOLIDATED FINANCIAL STATEMENTS (Continued)
December 31, 2009, 2008 and 2007
Impairment of Long-Lived and Intangible Assets
The Company reviews the values assigned to long-lived assets, including property and certain intangible assets, to determine whether events and circumstances have occurred which indicate that the remaining estimated useful lives may warrant revision or that the remaining balances may not be recoverable. In such reviews, undiscounted cash flows associated with these assets are compared with their carrying value to determine if a write-down to fair value is required. During 2009, 2008 and 2007, the Company did not recognize any impairment charges associated with its long-lived or intangible assets.
The evaluation of asset impairment requires management to make assumptions about future cash flows over the life of the asset being evaluated. These assumptions require significant judgment, and actual results may differ from assumed and estimated amounts.
Impairment of Goodwill
The Company evaluates the carrying value of goodwill and other intangible assets annually as of December 31 and between annual evaluations if events occur or circumstances change that would more likely than not reduce the fair value of the reporting unit below its carrying amount. Such circumstances could include, but are not limited to, (1) a significant adverse change in legal factors or in business climate, (2) unanticipated competition, or (3) an adverse action or assessment by a regulator. When evaluating whether the goodwill or other intangible asset is impaired, the Company compares the fair value of the reporting unit to which the goodwill or other intangible asset is assigned to its carrying amount, including goodwill and the other intangible assets. If the carrying amount of a reporting unit exceeds its fair value, then the amount of the impairment loss must be measured. The impairment loss would be calculated by comparing the implied fair value of reporting unit goodwill to its carrying amount. In calculating the implied fair value of goodwill or other intangible assets, the fair value of the reporting unit is allocated to all of the other assets and liabilities of that unit based on their fair values. The excess of the fair value of a reporting unit over the amount assigned to its other assets and liabilities is the implied fair value of goodwill. The Company performed its periodic review of its goodwill and other intangible assets for impairment as of December 31, 2009, 2008 and 2007 and did not identify any asset impairment as a result of the review.
Guarantees and Indemnifications
The Company accounts for guarantees in accordance with the guarantee accounting topic in the FASB Codification.The Company’s sales agreements with customers generally contain infringement indemnity provisions. Under these agreements, the Company agrees to indemnify, defend and hold harmless the customer in connection with patent, copyright or trade secret infringement claims made by third parties with respect to the customer’s authorized use of the Company’s products and services. The indemnity provisions generally provide for the Company’s control of defense and settlement and cover costs and damages finally awarded against the customer, as well as the Company’s modification of the product so it is no longer infringing or, if it cannot be corrected, return of the product for a refund. The sales agreements with customers sometimes also contain indemnity provisions for death, personal injury or property damage caused by the Company’s personnel or contractors in the course of performing services to customers. Under these agreements, the Company agrees to indemnify, defend and hold harmless the customer in connection with death, personal injury and property damage claims made by third parties with respect to actions of the Company’s personnel or contractors. The indemnity provisions generally provide for the Company’s control of defense and settlement and cover costs and damages finally awarded against the customer. The indemnity obligations contained in sales agreements generally have no specified expiration date and no specified monetary limitation on the amount of award covered. The Company has not previously incurred costs to settle claims or pay awards under these indemnification obligations. The Company accounts for these indemnity obligations in accordance with the guarantee accounting topic in the Codification, and records a liability for these obligations when a loss is probable and reasonably estimable. The Company has not recorded any liabilities for these agreements as of December 31, 2009 and 2008.
The Company warrants to its customers that its software products will perform in all material respects in accordance with the standard published specifications in effect at the time of delivery of the licensed products to the customer for 6 months after first use of the licensed products, but no more than 24 months after execution of the license agreement. Additionally, the Company warrants to its customers that services will be performed consistent with generally accepted industry standards or specific service levels through completion of the agreed upon services. If necessary, the Company will provide for the estimated cost of product and service warranties based on specific warranty claims and claim history. However, the Company has not incurred significant recurring expense under product or service warranties. As a result, the Company believes the estimated fair value of these agreements is nominal. Accordingly, the Company has no liabilities recorded for these agreements as of December 31, 2009 and 2008.
57
MANHATTAN ASSOCIATES, INC. AND SUBSIDIARIES
NOTES TO CONSOLIDATED FINANCIAL STATEMENTS (Continued)
December 31, 2009, 2008 and 2007
Segment Information
The Company has three reporting segments: Americas, EMEA, and APAC as defined by FASB Codification topic for segment reporting. See Note 8 for discussion of the Company’s reporting segments.
Advertising Costs
Advertising costs are expensed as incurred and totaled approximately $10,000, $100,000 and $300,000 in 2009, 2008 and 2007, respectively. Advertising costs are included in “Sales and marketing” in the Consolidated Statements of Operations.
Basic and Diluted Net Income Per Share
Basic net income per share is computed using net income divided by the weighted average number of shares of common stock outstanding (“Weighted Shares”) for the period presented.
Diluted net income per share is computed using net income divided by Weighted Shares, and the treasury stock method effect of common equivalent shares (“CESs”) outstanding for each period presented. The following is a reconciliation of the shares used in the computation of net income per share for the years ended December 31, 2009, 2008 and 2007 (in thousands, except per share data):
| | | | | | | | | | | | | |
| | | Year Ended December 31, |
| | | 2009 | | | 2008 | | | 2007 | |
| Net income | | $ | 16,562 | | | $ | 22,798 | | | $ | 30,751 | |
Earnings per share: | | | | | | | | | | | | |
| Basic | | $ | 0.74 | | | $ | 0.95 | | | $ | 1.17 | |
| Effect of CESs | | | (0.01 | ) | | | (0.01 | ) | | | (0.04 | ) |
| | | | | | | | | | |
| Diluted | | $ | 0.73 | | | $ | 0.94 | | | $ | 1.13 | |
Weighted average number of shares: | | | | | | | | | | | | |
| Basic | | | 22,385 | | | | 24,053 | | | | 26,174 | |
| Effect of CESs | | | 173 | | | | 275 | | | | 1,155 | |
| | | | | | | | | | |
| Diluted | | | 22,558 | | | | 24,328 | | | | 27,329 | |
Options to purchase 5,199,401 shares, 4,177,687 shares and 1,538,931 shares of common stock were outstanding at December 31, 2009, 2008 and 2007, respectively, but were not included in the computation of diluted earnings per share because the options’ exercise price was greater than the average market price of the common shares during the respective years. See Note 2 for further information on those securities.
Accumulated Other Comprehensive Income
Comprehensive income includes net income, foreign currency translation adjustments and unrealized gains and losses on investments that are excluded from net income and reflected in shareholders’ equity.
The following table sets forth the components of accumulated other comprehensive income (in thousands):
58
MANHATTAN ASSOCIATES, INC. AND SUBSIDIARIES
NOTES TO CONSOLIDATED FINANCIAL STATEMENTS (Continued)
December 31, 2009, 2008 and 2007
| | | | | | | | | |
| | | December 31, | |
| | | 2009 | | | 2008 | |
| Unrealized loss on investments, net of taxes | | $ | (132 | ) | | $ | (45 | ) |
| Foreign currency translation adjustment | | | (2,007 | ) | | | (3,232 | ) |
| | | | | | | |
| Total | | $ | (2,139 | ) | | $ | (3,277 | ) |
| | | | | | | |
New Accounting Pronouncements
In June 2009, the FASB issued the FASB Accounting Standards CodificationTMand a new Hierarchy of Generally Accepted Accounting Principles which establishes only two levels of U.S. generally accepted accounting principles (GAAP): authoritative and nonauthoritative. The Codification is now the source of authoritative U.S. GAAP recognized by the FASB to be applied by nongovernmental entities in the preparation of financial statements in conformity with GAAP, except for rules and interpretive releases of the SEC, which are additional sources of authoritative GAAP for SEC registrants. All other nongrandfathered, non-SEC accounting literature not included in the Codification will become nonauthoritative. The Codification is effective for financial statements for interim or annual reporting periods ending after September 15, 2009. The Company adopted the new guidelines and numbering system prescribed by the Codification when referring to GAAP in the third quarter of 2009. As the Codification is not intended to change or alter existing GAAP for public companies, it does not have any impact on the Company’s consolidated financial statements.
In May 2009, the FASB issued authoritative guidance on subsequent events. This guidance is intended to establish general standards of accounting for and disclosures of events that occur after the balance sheet date but before financial statements are issued or are available to be issued. Specifically, the subsequent events guidance sets forth the period after the balance sheet date during which management of a reporting entity should evaluate events or transactions that may occur for potential recognition or disclosure in the financial statements, the circumstances under which an entity should recognize events or transactions occurring after the balance sheet date in its financial statements, and the disclosures that an entity should make about events or transactions that occurred after the balance sheet date. This guidance is effective for fiscal years and interim periods ended after June 15, 2009. The Company adopted this standard effective June 15, 2009 and has evaluated any subsequent events through the date of this filing. The adoption of the subsequent events guidance did not have an impact on its consolidated results of operations or consolidated financial position.
In December 2007, the FASB issued authoritative guidance on business combinations. This guidance is significantly changes the accounting for business combinations. Under the business combination guidance, an acquiring entity is required to recognize all the assets acquired and liabilities assumed in a transaction at the acquisition-date fair value with limited exceptions. This guidance changes the accounting treatment for certain specific acquisition-related items, including by requiring the expensing of acquisition-related costs as incurred and expensing of restructuring costs associated with an acquired business. This guidance also includes a substantial number of new disclosure requirements to enable users of the financial statements to evaluate the nature and financial effects of the business combination. The business combination guidance is to be applied prospectively to business combinations for which the acquisition date is on or after January 1, 2009. The Company expects that this guidance will have an impact on its accounting for future business combinations, but the extent of the impact is dependent upon the number, size, and complexity of acquisitions that the Company makes in the future.
In September 2006, the FASB issued authoritative guidance on fair value measurements, which establishes a framework for reporting fair value and expands disclosures required for fair value measurements. The fair value measurement guidance applies under other accounting pronouncements that require or permit fair value measurements. Accordingly, this guidance does not require any new fair value measurements. This guidance is effective for financial statements issued for fiscal years beginning after November 15, 2007 and interim periods within those fiscal years. However, in February 2008, the FASB delayed for one year the applicability of fair-value measurements to non-financial assets and liabilities recognized or disclosed at fair value on a non-recurring basis. The Company partially adopted the fair value measurement on January 1, 2008 related to all financial assets and liabilities and non-financial assets and liabilities recognized or disclosed at fair value on a recurring basis. The Company has adopted fair value measurement for non-financial assets and liabilities measured at fair value on a nonrecurring basis at January 1, 2009 and will continue to apply its provisions prospectively from January 1, 2009. The application of fair value measurement for non-financial assets and liabilities did not have an impact on the Company’s consolidated results of operations nor its financial position in 2009.
59
MANHATTAN ASSOCIATES, INC. AND SUBSIDIARIES
NOTES TO CONSOLIDATED FINANCIAL STATEMENTS (Continued)
December 31, 2009, 2008 and 2007
2. Stock-Based Compensation
Stock Based Compensation Plans
The Manhattan Associates, Inc. 1998 Stock Incentive Plan (the “1998 Plan”) was adopted by the Board of Directors and approved by the shareholders in February 1998. Options granted under the 1998 Plan cannot have a term exceeding ten years. Options typically have an annual graded vesting schedule over four years and vest based on service conditions. Following approval of the Manhattan Associates, Inc. 2007 Stock Incentive Plan (the “2007 Plan”) discussed below, the Company may not make any additional awards under the 1998 Plan.
The 2007 Plan was initially approved by the shareholders of the Company in May 2007, and an amendment was approved in May 2009. The 2007 Plan provides for the grant of stock options, restricted stock, restricted stock units and stock appreciation rights. Vesting conditions can be service-based or performance-based, or a combination of both.
As amended, a maximum of 4,700,000 shares are available for grant under the 2007 Plan. Each grant of a stock option or stock appreciation right is counted against the maximum share limitation as one share; and each grant of a restricted stock award or restricted stock unit award (including performance-based shares) count against the maximum share limitation as two shares. Options and stock appreciation rights cannot have a term exceeding seven years. As of December 31, 2009, there were 2,417,073 shares available for issuance under the amended 2007 Plan.
The 1998 and 2007 Plans are administered by the Compensation Committee of the Board of Directors. The committee has the authority to interpret the provisions thereof.
Stock Option Awards
A summary of changes in outstanding options for the year ended December 31, 2009 is as follows:
| | | | | | | | | | | | | | | | | |
| | | | | | | | | | | Weighted | | Average |
| | | | | | | Weighted | | Average | | Intrinsic |
| | | Number of | | Average | | Remaining | | Value (in |
| | | Shares | | Exercise Price | | Contractual Term | | thousands) |
| Outstanding at January 1, 2009 | | | 6,010,909 | | | $ | 26.00 | | | | | | | | | |
| Granted | | | 638,825 | | | | 16.30 | | | | | | | | | |
| Exercised | | | (130,650 | ) | | | 12.73 | | | | | | | | | |
| Forfeited and expired | | | (750,123 | ) | | | 25.51 | | | | | | | | | |
| | | | | | | | | | | | | | | | | |
| Outstanding at December 31, 2009 | | | 5,768,961 | | | $ | 25.29 | | | | 3.9 | | | $ | 9,578 | |
| | | | | | | | | | | | | | | | | |
| | | | | | | | | | | | | | | | | |
| Vested or expected to vest at December 31, 2009 | | | 5,275,817 | | | $ | 25.53 | | | | 3.8 | | | $ | 8,005 | |
| Exercisable at December 31, 2009 | | | 4,474,935 | | | $ | 26.13 | | | | 3.6 | | | $ | 5,127 | |
The fair value of each option award is estimated on the date of grant using the Black-Scholes option pricing model with the following weighted-average assumptions for the years ended December 31, 2009, 2008, and 2007:
| | | | | | | | | | | | | |
| | | 2009 | | 2008 | | 2007 |
| Dividend yield | | | 0 | % | | | 0 | % | | | 0 | % |
| Expected volatility | | | 38 | % | | | 35 | % | | | 38 | % |
| Risk-free interest rate at the date of grant | | | 1.9 | % | | | 2.8 | % | | | 4.4 | % |
| Expected life (in years) | | | 4.0 | | | | 4.0 | | | | 4.3 | |
Expected volatilities are based on a combination of historical volatility of the Company’s stock and implied volatility of the Company’s publicly traded stock options. Due to the limited trading volume of the Company’s publicly traded options, the Company
60
MANHATTAN ASSOCIATES, INC. AND SUBSIDIARIES
NOTES TO CONSOLIDATED FINANCIAL STATEMENTS (Continued)
December 31, 2009, 2008 and 2007
places a greater emphasis on historical volatility. The Company also uses historical data to estimate the term that options are expected to be outstanding and the forfeiture rate of options granted. The risk-free interest rate is based on the U.S. Treasury zero-coupon issues with a term approximating the expected term. Using these assumptions, the weighted average fair values of the stock options granted during the years ended December 31, 2009, 2008 and 2007 are $5.26, $7.96 and $11.16, respectively.
Options with graded vesting are valued as a single award. The total value of the award is expensed on a straight line basis over the vesting period with the amount of compensation cost recognized at any date at least equal to the portion of the grant date value of the award that is vested at that date. The total intrinsic value of options exercised during the years ended December 31, 2009, 2008, and 2007 based on market value at the exercise dates was $0.9 million, $1.6 million, and $5.8 million, respectively. As of December 31, 2009, unrecognized compensation cost related to unvested stock option awards totaled $6.1 million and is expected to be recognized over a weighted average period of 1.3 years.
Restricted Stock Awards
A summary of changes in unvested shares of restricted stock for the year ended December 31, 2009 are as follows:
| | | | | | | | | |
| | | Number of | | Grant Date Fair |
| | | Shares | | Value |
| Outstanding at January 1, 2009 | | | 353,085 | | | $ | 27.57 | |
| Granted | | | 211,164 | | | | 16.21 | |
| Vested | | | (129,811 | ) | | | 25.75 | |
| Forfeited | | | (45,878 | ) | | | 23.55 | |
| | | | | | | | | |
| Outstanding at December 31, 2009 | | | 388,560 | | | $ | 22.48 | |
| | | | | | | | | |
The Company issued 129,811 shares, 213,433 shares and 279,733 shares of restricted stock during 2009, 2008 and 2007, respectively. The total fair value of restricted stock awards vested during the years ended December 31, 2009, 2008, and 2007 based on market value at the vesting dates were $2.2 million, $2.1 million and $0.7 million, respectively. As of December 31, 2009, unrecognized compensation cost related to unvested restricted stock awards totaled $5.8 million and is expected to be recognized over a weighted average period of 1.3 years.
In January 2010 the Compensation Committee approved certain changes to the Company’s historical equity incentive grant practices, with the objective to optimize its performance and retention strength while managing program share usage to improve long-term equity overhang. The changes eliminate stock option awards in favor of 100% restricted stock grants, which for the 2010 awards contain vesting provisions that are 50% service-based and 50% performance-based. The awards have a four year vesting period, with the performance portion tied to annual revenue and earnings per share targets.
3. Income Taxes
The Company is subject to future federal and state income taxes and has recorded net deferred tax assets on the Consolidated Balance Sheets at December 31, 2009 and 2008. Deferred tax assets and liabilities are determined based on the difference between the financial accounting and the tax bases of assets and liabilities. Significant components of the Company’s deferred tax assets and liabilities as of December 31, 2009 and 2008 are as follows (in thousands):
61
MANHATTAN ASSOCIATES, INC. AND SUBSIDIARIES
NOTES TO CONSOLIDATED FINANCIAL STATEMENTS (Continued)
December 31, 2009, 2008 and 2007
| | | | | | | | | |
| | | December 31, | |
| | | 2009 | | | 2008 | |
Deferred tax assets: | | | | | | | | |
| Accounts receivable | | $ | 1,726 | | | $ | 2,063 | |
| Accrued liabilities | | | 2,998 | | | | 3,008 | |
| Stock compensation expense | | | 6,022 | | | | 5,257 | |
| Capitalized costs | | | 7,219 | | | | 9,639 | |
| Accrued sales taxes | | | 1,073 | | | | 1,089 | |
| Deferred rent | | | 3,036 | | | | 3,319 | |
| State tax credits | | | 2,144 | | | | 1,466 | |
| Net operating losses | | | 3,338 | | | | 3,397 | |
| Valuation allowance | | | (7,887 | ) | | | (7,657 | ) |
| Other | | | 386 | | | | 243 | |
| | | | | | | |
| | | $ | 20,055 | | | $ | 21,824 | |
Deferred tax liabilities: | | | | | | | | |
| Intangible assets | | | 2,866 | | | | 2,524 | |
| Depreciation | | | 1,512 | | | | 1,541 | |
| Other | | | 106 | | | | 160 | |
| | | | | | | |
| | | | 4,484 | | | | 4,225 | |
| | | | | | | |
| Net deferred tax assets | | $ | 15,571 | | | $ | 17,599 | |
| | | | | | | |
The components of income from domestic and foreign operations before income tax expense for the years ended December 31, 2009, 2008 and 2007 are as follows (in thousands):
| | | | | | | | | | | | | |
| | | Year Ended December 31, | |
| | | 2009 | | | 2008 | | | 2007 | |
| Domestic | | $ | 19,709 | | | $ | 23,942 | | | $ | 43,770 | |
| Foreign | | | 677 | | | | 7,566 | | | | 3,896 | |
| | | | | | | | | | |
| Total | | $ | 20,386 | | | $ | 31,508 | | | $ | 47,666 | |
| | | | | | | | | | |
The components of the income tax provision for the years ended December 31, 2009, 2008 and 2007 are as follows (in thousands):
| | | | | | | | | | | | | |
| | | Year Ended December 31, | |
| | | 2009 | | | 2008 | | | 2007 | |
Current: | | | | | | | | | | | | |
| Federal | | $ | 1,079 | | | $ | 7,240 | | | $ | 16,034 | |
| State | | | (277 | ) | | | 520 | | | | 1,965 | |
| Foreign | | | 1,132 | | | | 2,565 | | | | 961 | |
| | | | | | | | | | |
| | | | 1,934 | | | | 10,325 | | | | 18,960 | |
Deferred: | | | | | | | | | | | | |
| Federal | | | 1,713 | | | | (2,059 | ) | | | (1,652 | ) |
| State | | | 274 | | | | 113 | | | | (214 | ) |
| Foreign | | | (97 | ) | | | 331 | | | | (179 | ) |
| | | | | | | | | | |
| | | | 1,890 | | | | (1,615 | ) | | | (2,045 | ) |
| | | | | | | | | | |
| Total | | $ | 3,824 | | | $ | 8,710 | | | $ | 16,915 | |
| | | | | | | | | | |
62
MANHATTAN ASSOCIATES, INC. AND SUBSIDIARIES
NOTES TO CONSOLIDATED FINANCIAL STATEMENTS (Continued)
December 31, 2009, 2008 and 2007
The income tax benefits related to the exercise of stock options were approximately $1.0 million, $0.2 million, and $1.8 million, for the years ended December 31, 2009, 2008 and 2007, respectively.
As a result of losses in foreign locations, the Company has net operating loss carry-forwards (“NOLs”) of approximately $12.0 million available to offset future income. Approximately $10.0 million of the NOLs expire in 2011 to 2016, and the remainder does not expire. The Company has established a valuation allowance for these NOLs because the ability to utilize them is uncertain.
The Company currently has a tax holiday in India under the Software Technology Park of India Plan through March 2011. As a result of this holiday, the Company had pre-tax income of approximately $2.4 million, $3.8 million, and $3.4 million, for the years ended December 31, 2009, 2008 and 2007, respectively, that was not subject to tax. Separately, the Company is subject to India’s Minimum Alternative Tax (“MAT”) and accordingly, incurred income tax expense of approximately $0.4 million and $0.3 million in 2009 and 2008, respectively. The impact on diluted earnings per share if the income had been fully taxable would have been decreases of $0.02, $0.03, and $0.05 per share in 2009, 2008, and 2007, respectively.
Deferred taxes are not provided for temporary differences of approximately $17.5 million, $17.7 million, and $20.0 million as of December 31, 2009, 2008, and 2007, respectively, representing earnings of non-U.S. subsidiaries that are intended to be permanently reinvested. Those earnings are considered to be indefinitely reinvested; accordingly, no provision for U.S. Federal and state income taxes has been provided thereon. Upon repatriation of those earnings, in the form of dividends or otherwise, the Company would be subject to both U.S. income taxes (subject to adjustment for foreign tax credits) and withholding taxes payable to various foreign countries. It is impractical to calculate the tax impact until that occurs.
The following is a summary of the items that cause recorded income taxes to differ from taxes computed using the statutory federal income tax rate for the years ended December 31, 2009, 2008 and 2007:
| | | | | | | | | | | | | |
| | | Year Ended December 31, |
| | | 2009 | | 2008 | | 2007 |
| Statutory federal income tax rate | | | 35.0 | % | | | 35.0 | % | | | 35.0 | % |
| Effect of: | | | | | | | | | | | | |
| State income tax, net of federal benefit | | | 1.1 | | | | 1.4 | | | | 2.5 | |
| State credit carry forward | | | (3.3 | ) | | | (4.7 | ) | | | — | |
| Incentive stock options | | | 1.0 | | | | 0.1 | | | | — | |
| Foreign operations | | | 2.4 | | | | (0.9 | ) | | | (2.2 | ) |
| Tax exempt income | | | (0.2 | ) | | | (1.2 | ) | | | (2.1 | ) |
| Tax contingencies | | | (10.8 | ) | | | (11.9 | ) | | | 1.6 | |
| Other permanent differences | | | (5.1 | ) | | | (3.2 | ) | | | (2.0 | ) |
| Foreign distributions | | | (1.6 | ) | | | 2.0 | | | | 3.1 | |
| Change in valuation allowance | | | 0.3 | | | | 11.0 | | | | (0.4 | ) |
| | | | | | | | | | | | | |
| Income taxes | | | 18.8 | % | | | 27.6 | % | | | 35.5 | % |
| | | | | | | | | | | | | |
On January 1, 2007, the Company adopted the provisions of income taxes topic under the FASB Codification. The following table is a summary of the changes in the Company’s unrecognized tax benefits at the beginning and end of the period (in thousands):
63
MANHATTAN ASSOCIATES, INC. AND SUBSIDIARIES
NOTES TO CONSOLIDATED FINANCIAL STATEMENTS (Continued)
December 31, 2009, 2008 and 2007
| | | | | | | | | |
| | | 2009 | | | 2008 | |
| Unrecognized tax benefits at January 1, | | $ | (3,250 | ) | | $ | (5,195 | ) |
| | | | | | | | | |
| Gross amount of increases and decreases in unrecognized tax benefits as a result of tax positions taken during a prior period | | | (185 | ) | | | — | |
| Gross amount of increases and decreases in unrecognized tax benefits as a result of tax positions taken during the current period | | | (1,048 | ) | | | (327 | ) |
| Amounts of decreases in the unrecognized tax benefits relating to settlements with taxing authorities | | | — | | | | 55 | |
| Reductions to unrecognized tax benefits as a result of a lapse of the applicable statute of limitations | | | 2,152 | | | | 2,217 | |
| | | | | | | |
| | | | | | | | | |
| Unrecognized tax benefits at December 31, | | $ | (2,331 | ) | | $ | (3,250 | ) |
| | | | | | | |
The Company’s unrecognized tax benefits totaled $2.3 million, of which substantially all, if recognized, would affect the effective tax rate.
The Company recognizes potential accrued interest and penalties to unrecognized tax benefits within its global operations in income tax expense. The Company recognized approximately $0.2 million for the potential payment of interest and penalties at December 31, 2009, and included approximately $0.1 million in the 2009 income tax expense.
The Company conducts business globally and, as a result, files income tax returns in the United State Federal jurisdiction and in many state and foreign jurisdictions. The Company is generally no longer subject to U.S. Federal, state and local, or non-US income tax examinations for the years before 2006. Due to the expiration of statutes of limitations in multiple jurisdictions globally during 2010, the Company anticipates it is reasonably possible that unrecognized tax benefits may decrease by $0.2 million related primarily to subsidiary operations and jurisdictional taxable income amounts.
The Company currently is under audit in limited state and foreign jurisdictions. No significant audits are ongoing.
4. Shareholders’ Equity
During 2009, 2008, and 2007, the Company purchased 1,371,038 shares, 1,705,614 shares and 3,562,619 shares of the Company’s common stock for approximately $22.8 million, $35.0 million and $99.9 million, respectively, through open market transactions as part of a publicly-announced buy-back program. In January 2010, the Board of Directors increased the remaining share repurchase authority to $25.0 million.
5. Commitments and Contingencies
Leases
Rents charged to expense were approximately $6.1 million, $7.2 million, and $6.7 million for the years ended December 31, 2009, 2008 and 2007, respectively. During the first quarter of 2007, the Company extended its Atlanta Headquarters’ lease, which was set to expire in March 2008, to September 30, 2018. The landlord funded leasehold improvements of $7.9 million in conjunction with the new lease which was recorded as an increase in leasehold improvements and deferred rent. Additionally, the Company had a rent holiday from April to September 2008. The entire cash rent obligation is being amortized to expense on a straight line basis over the lease term. The Company assumed a facility lease through its 2005 acquisition of Evant, Inc. with rates in excess of market value. The Company recorded the fair value of this unfavorable lease obligation in deferred rent and amortized the amount over the remaining lease term through April 2008. In December 2008, the Company entered into an agreement to sublease its office space in Massachusetts. Under the agreement, the Company will be receiving sublease payments of approximately $0.3 million in 2010.
Aggregate future minimum lease payments under the noncancellable operating leases as of December 31, 2009 are as follows (in thousands):
64
MANHATTAN ASSOCIATES, INC. AND SUBSIDIARIES
NOTES TO CONSOLIDATED FINANCIAL STATEMENTS (Continued)
December 31, 2009, 2008 and 2007
| | | | | |
| Year Ending December 31, | | | | |
| 2010 | | $ | 6,373 | |
| 2011 | | | 5,929 | |
| 2012 | | | 5,221 | |
| 2013 | | | 5,003 | |
| 2014 | | | 4,911 | |
| Thereafter | | | 19,542 | |
| | | | |
Total minimum payments required (a) | | $ | 46,979 | |
| | | | |
| | |
| (a) | | Minimum payments have not been reduced by the minimum sublease rental of approximately $0.3 million due in the future under a noncancelable sublease. |
There are no future minimum lease payments under capital leases as of December 31, 2009.
Employment Agreements
The Company has entered into employment contracts with certain executives and other key employees. The agreements provide for total severance payments of up to approximately $2.7 million for termination of employment for any reason other than cause. Payments will be made in equal monthly installments over a period of not more than 18 months. No amounts have been accrued because the payments are not probable and cannot be reasonably estimated.
Legal and Other Matters
From time to time, the Company may be involved in litigation relating to claims arising out of its ordinary course of business. Many of the Company’s installations involve products that are critical to the operations of its clients’ businesses. Any failure in a Company product could result in a claim for substantial damages against the Company, regardless of the Company’s responsibility for such failure. Although the Company attempts to limit contractually its liability for damages arising from product failures or negligent acts or omissions, there can be no assurance the limitations of liability set forth in its contracts will be enforceable in all instances. The Company is not presently involved in any material litigation. However, it is involved in various legal proceedings. The Company believes that any liability that may arise as a result of these proceedings will not have a material adverse effect on its financial condition, results of operations, or cash flows. The Company expenses legal costs associated with loss contingencies as such legal costs are incurred.
6. Employee Benefit Plan
The Company sponsors the Manhattan Associates 401(k) Plan and Trust (the “401(k) Plan”), a qualified profit sharing plan with a 401(k) feature covering substantially all employees of the Company. Under the 401(k) Plan’s deferred compensation arrangement, eligible employees who elect to participate in the 401(k) Plan may contribute up to 60% of eligible compensation up to $16,500, as defined, to the 401(k) Plan. On January 1, 2008, the Internal Revenue Service raised the eligible compensation limit to $245,000. The Company provides for a 50% matching contribution up to 6% of eligible compensation being contributed after the participant’s first year of employment. During the second quarter of 2009, the Company suspended its 401(k) matching contribution for the remainder of 2009 and full year 2010. During the years ended December 31, 2009, 2008 and 2007, the Company made matching contributions to the 401(k) Plan of $0.8 million, $2.3 million, and $2.2 million, respectively.
7. Restructuring charge
In the second quarter of 2009, the Company committed to and initiated plans to reduce its workforce by approximately 140 positions along with other expense reduction initiatives to realign its capacity. This action was based on continued deterioration of the global macro-economic environment in the first quarter as reflected by downward revisions by most economists of global GDP growth rates, which resulted in lower than planned first quarter 2009 license revenue results and a revised revenue outlook for the remainder of 2009. As a result of this initiative, the Company recorded a pre-tax restructuring charge of $3.8 million ($2.5 million after-tax or $0.11 per fully diluted share) in 2009. In addition, in the first quarter of 2009, the Company recorded additional employee severance
65
MANHATTAN ASSOCIATES, INC. AND SUBSIDIARIES
NOTES TO CONSOLIDATED FINANCIAL STATEMENTS (Continued)
December 31, 2009, 2008 and 2007
expense of $63,000 pre-tax, or $42,000 after-tax, related to the restructuring action taken in the fourth quarter of 2008, as discussed below.
During the quarter ended December 31, 2008, the Company committed to and initiated plans to reduce our workforce by approximately 170 positions to realign our capacity with demand forecasts. As a result of this action, we recorded employee severance expense and outplacement service fees of approximately $4.7 million pretax ($3.0 million after-tax or $0.13 per fully diluted share) in the fourth quarter of 2008. The restructuring charge is classified in “Restructuring charge” in the Company’s Consolidated Statements of Operations.
The following table summarizes the segment activity in the restructuring accrual for the year ended December 31, 2009:
| | | | | | | | | | | | | | | | | |
| | | Americas | | | EMEA | | | APAC | | | Consolidated | |
| | | (in thousands) | |
| Restructuring accrual balance at December 31, 2008 | | $ | 1,724 | | | $ | — | | | $ | 63 | | | $ | 1,787 | |
| Restructuring charge | | | 3,019 | | | | 20 | | | | 843 | | | | 3,882 | |
| Cash payments | | | (4,488 | ) | | | (20 | ) | | | (906 | ) | | | (5,414 | ) |
| | | | | | | | | | | | | |
| Restructuring accrual balance at December 31, 2009 | | $ | 255 | | | $ | — | | | $ | — | | | $ | 255 | |
| | | | | | | | | | | | | |
The balance at December 31, 2009 is included in “Accrued compensation and benefits” in the Company’s Consolidated Balance Sheets. The remaining balance is expected to be paid during 2010.
8. Reporting Segments
The Company manages the business by geographic segment. The Company has identified three geographic reporting segments: the Americas, EMEA and APAC segment. All segments derive revenue from the sale and implementation of the Company’s supply chain execution and planning solutions, of which the individual products are similar in nature and help companies manage the effectiveness and efficiency of their supply chain. The Company uses the same accounting policies for each reporting segment. The chief executive officer and chief financial officer evaluate performance based on revenue and operating results for each region.
The Americas segment charges royalty fees to the other segments based on software licenses sold by those reporting segments. The royalties, which totaled $1.3 million, $3.5 million and $2.8 million in 2009, 2008 and 2007, respectively, are included in cost of revenue for each segment with a corresponding reduction in America’s cost of revenue. The revenues represented below are from external customers only. The geographical-based costs consist of costs of professional services personnel, direct sales and marketing expenses, cost of infrastructure to support the employees and customer base, billing and financial systems and management and support team. There are certain corporate expenses included in the Americas region that are not charged to the other segments including research and development, certain marketing and general and administrative costs that support the global organization and the amortization of acquired developed technology. Included in the America’s costs are all research and development costs including the costs associated with the Company’s India operations.
The operating expenses for the Americas segment include $3.0 million, $3.3 million, and $4.7 million of amortization expense on intangible assets in 2009, 2008 and 2007, respectively.
In accordance with the segment reporting topic of the FASB Codification, the Company has included a summary of the financial information by reporting segment. The following table presents the revenues, expenses and operating income (loss) by reporting segment for the years ended December 31, 2009, 2008 and 2007 (in thousands):
66
MANHATTAN ASSOCIATES, INC. AND SUBSIDIARIES
NOTES TO CONSOLIDATED FINANCIAL STATEMENTS (Continued)
December 31, 2009, 2008 and 2007
| | | | | | | | | | | | | | | | | | | | | | | | | | | | | | | | | |
| | | Year Ended December 31, | |
| | | 2009 | | | 2008 | |
| | | Americas | | | EMEA | | | APAC | | | Consolidated | | | Americas | | | EMEA | | | APAC | | | Consolidated | |
Revenue: | | | | | | | | | | | | | | | | | | | | | | | | | | | | | | | | |
| Software license | | $ | 29,629 | | | $ | 2,617 | | | $ | 2,440 | | | $ | 34,686 | | | $ | 51,392 | | | $ | 8,885 | | | $ | 5,036 | | | $ | 65,313 | |
| Services | | | 155,768 | | | | 24,637 | | | | 9,445 | | | | 189,850 | | | | 192,483 | | | | 32,163 | | | | 11,321 | | | | 235,967 | |
| Hardware and other | | | 21,161 | | | | 771 | | | | 199 | | | | 22,131 | | | | 33,371 | | | | 1,750 | | | | 800 | | | | 35,921 | |
| | | | | | | | | | | | | | | | | | | | | | | | | |
| Total revenue | | | 206,558 | | | | 28,025 | | | | 12,084 | | | | 246,667 | | | | 277,246 | | | | 42,798 | | | | 17,157 | | | | 337,201 | |
| | | | | | | | | | | | | | | | | | | | | | | | | | | | | | | | | |
Costs and Expenses: | | | | | | | | | | | | | | | | | | | | | | | | | | | | | | | | |
| Cost of revenue | | | 82,849 | | | | 16,641 | | | | 7,971 | | | | 107,461 | | | | 118,003 | | | | 23,163 | | | | 10,772 | | | | 151,938 | |
| Operating expenses | | | 88,844 | | | | 9,511 | | | | 4,409 | | | | 102,764 | | | | 118,908 | | | | 12,200 | | | | 5,621 | | | | 136,729 | |
| Depreciation and amortization | | | 10,398 | | | | 760 | | | | 260 | | | | 11,418 | | | | 11,912 | | | | 591 | | | | 196 | | | | 12,699 | |
| Restructuring charge | | | 3,019 | | | | 20 | | | | 843 | | | | 3,882 | | | | 4,369 | | | | 204 | | | | 94 | | | | 4,667 | |
| Asset impairment charges | | | — | | | | — | | | | — | | | | — | | | | 5,205 | | | | — | | | | — | | | | 5,205 | |
| | | | | | | | | | | | | | | | | | | | | | | | | |
| Total costs and expenses | | | 185,110 | | | | 26,932 | | | | 13,483 | | | | 225,525 | | | | 258,397 | | | | 36,158 | | | | 16,683 | | | | 311,238 | |
| | | | | | | | | | | | | | | | | | | | | | | | | |
| Operating income (loss) | | $ | 21,448 | | | $ | 1,093 | | | $ | (1,399 | ) | | $ | 21,142 | | | $ | 18,849 | | | $ | 6,640 | | | $ | 474 | | | $ | 25,963 | |
| | | | | | | | | | | | | | | | | | | | | | | | | |
| | | | | | | | | | | | | | | | | |
| | | Year Ended December 31, 2007 | |
| | | Americas | | | EMEA | | | APAC | | | Total | |
Revenue: | | | | | | | | | | | | | | | | |
| Software license | | $ | 61,708 | | | $ | 9,311 | | | $ | 2,012 | | | $ | 73,031 | |
| Services | | | 187,019 | | | | 25,617 | | | | 13,517 | | | | 226,153 | |
| Hardware and other | | | 35,595 | | | | 1,921 | | | | 701 | | | | 38,217 | |
| | | | | | | | | | | | | |
| Total revenue | | | 284,322 | | | | 36,849 | | | | 16,230 | | | | 337,401 | |
| | | | | | | | | | | | | | | | | |
Costs and Expenses: | | | | | | | | | | | | | | | | |
| Cost of revenue | | | 115,227 | | | | 21,057 | | | | 11,076 | | | | 147,360 | |
| Operating expenses | | | 116,381 | | | | 12,423 | | | | 4,562 | | | | 133,366 | |
| Depreciation and amortization | | | 12,414 | | | | 947 | | | | 256 | | | | 13,617 | |
| | | | | | | | | | | | | |
| Total costs and expenses | | | 244,022 | | | | 34,427 | | | | 15,894 | | | | 294,343 | |
| | | | | | | | | | | | | |
| Operating income | | $ | 40,300 | | | $ | 2,422 | | | $ | 336 | | | $ | 43,058 | |
| | | | | | | | | | | | | |
The following table presents the goodwill, long-lived assets and total assets by reporting segment for the years ended December 31, 2009 and 2008 (in thousands):
| | | | | | | | | | | | | | | | | | | | | | | | | | | | | | | | | |
| | | As of December 31, 2009 | | As of December 31, 2008 |
| | | Americas | | EMEA | | APAC | | Total | | Americas | | EMEA | | APAC | | Total |
| Goodwill, net | | $ | 54,766 | | | $ | 5,551 | | | $ | 1,963 | | | $ | 62,280 | | | $ | 54,766 | | | $ | 5,547 | | | $ | 1,963 | | | $ | 62,276 | |
| Long lived assets | | | 16,236 | | | | 746 | | | | 599 | | | | 17,581 | | | | 22,494 | | | | 1,045 | | | | 788 | | | | 24,327 | |
| Total assets | | | 249,049 | | | | 10,746 | | | | 4,916 | | | | 264,711 | | | | 254,653 | | | | 9,544 | | | | 6,024 | | | | 270,221 | |
For the years ended December 31, 2009, 2008, and 2007, we derived revenue from sales to customers outside the United State of approximately $58.0 million, $81.5 million, and $68.7 million, respectively. Our remaining revenue was derived from domestic sales.
67
MANHATTAN ASSOCIATES, INC. AND SUBSIDIARIES
NOTES TO CONSOLIDATED FINANCIAL STATEMENTS (Continued)
December 31, 2009, 2008 and 2007
Our services revenue consists of fees generated from professional services and customer support and software enhancements related to our software products as follows (in thousands):
| | | | | | | | | | | | | |
| | | Year ended December 31, | |
| | | 2009 | | | 2008 | | | 2007 | |
| Professional services | | $ | 112,770 | | | $ | 159,005 | | | $ | 159,130 | |
| Customer support and software enhancements | | | 77,080 | | | | 76,962 | | | | 67,023 | |
| | | | | | | | | | |
| Total services revenue | | $ | 189,850 | | | $ | 235,967 | | | $ | 226,153 | |
| | | | | | | | | | |
License revenues related to our warehouse and non-warehouse product groups are as follows (in thousands):
| | | | | | | | | | | | | |
| | | Year ended December 31, | |
| | | 2009 | | | 2008 | | | 2007 | |
| Warehouse | | $ | 20,145 | | | $ | 35,709 | | | $ | 38,313 | |
| Non-Warehouse | | | 14,541 | | | | 29,604 | | | | 34,718 | |
| | | | | | | | | | |
| Total license revenue | | $ | 34,686 | | | $ | 65,313 | | | $ | 73,031 | |
| | | | | | | | | | |
9. Related Party Transactions
During the years ended December 31, 2009 and 2007 the Company purchased software and services for approximately $50 thousand and $60 thousand, respectively from a company whose former President and Chief Executive Officer is a member of Manhattan’s Board of Directors. There was no purchase from this customer during 2008. As of December 31, 2009, there was no accounts payable outstanding.
10. Subsequent Events
In February 2010, the Company extended the building lease on its facility in the United Kingdom to November 2014 with an optional extension to February 2018. Annual rent due under the lease is approximately $0.5 million. The Company has a rent holiday from February 2010 to August 2011. The entire cash rent obligation will be amortized to expense on a straight line basis over the lease term.
68
MANHATTAN ASSOCIATES, INC. AND SUBSIDIARIES
NOTES TO CONSOLIDATED FINANCIAL STATEMENTS (Continued)
December 31, 2009, 2008 and 2007
11. Quarterly Results of Operations (Unaudited)
Following is the quarterly results of operations of the Company for the year ended December 31, 2009 and 2008. The unaudited quarterly results have been prepared on substantially the same basis as the audited Consolidated Financial Statements.
| | | | | | | | | | | | | | | | | | | | | | | | | | | | | | | | | |
| | | Quarter Ended | |
| | | March 31, 2008 | | | June 30, 2008 | | | Sept 30, 2008 | | | Dec 31, 2008 | | | March 31, 2009 | | | June 30, 2009 | | | Sept 30, 2009 | | | Dec 31, 2009 | |
| | | (In thousands, except per share data) | |
Statement of Income Data: | | | | | | | | | | | | | | | | | | | | | | | | | | | | | | | | |
| Revenue: | | | | | | | | | | | | | | | | | | | | | | | | | | | | | | | | |
| Software license | | $ | 18,312 | | | $ | 19,365 | | | $ | 13,802 | | | $ | 13,834 | | | $ | 4,922 | | | $ | 4,126 | | | $ | 11,360 | | | $ | 14,278 | |
| Services | | | 59,837 | | | | 62,289 | | | | 60,023 | | | | 53,818 | | | | 50,843 | | | | 49,422 | | | | 46,917 | | | | 42,668 | |
| Hardware and other | | | 10,175 | | | | 8,836 | | | | 8,911 | | | | 7,999 | | | | 5,060 | | | | 4,861 | | | | 7,017 | | | | 5,193 | |
| | | | | | | | | | | | | | | | | | | | | | | | | |
| Total revenue | | | 88,324 | | | | 90,490 | | | | 82,736 | | | | 75,651 | | | | 60,825 | | | | 58,409 | | | | 65,294 | | | | 62,139 | |
| Costs and expenses: | | | | | | | | | | | | | | | | | | | | | | | | | | | | | | | | |
| Cost of license | | | 1,144 | | | | 1,641 | | | | 1,528 | | | | 1,648 | | | | 1,424 | | | | 1,035 | | | | 1,162 | | | | 1,105 | |
| Cost of services | | | 31,280 | | | | 29,856 | | | | 29,376 | | | | 26,195 | | | | 23,157 | | | | 21,319 | | | | 19,697 | | | | 20,176 | |
| Cost of hardware and other | | | 8,266 | | | | 7,317 | | | | 7,036 | | | | 6,651 | | | | 4,121 | | | | 4,177 | | | | 5,846 | | | | 4,242 | |
| Research and development | | | 12,654 | | | | 11,711 | | | | 12,546 | | | | 11,496 | | | | 10,227 | | | | 9,188 | | | | 8,781 | | | | 8,485 | |
| Sales and marketing | | | 13,572 | | | | 14,676 | | | | 11,579 | | | | 11,350 | | | | 10,079 | | | | 9,026 | | | | 8,626 | | | | 8,406 | |
| General and administrative | | | 9,071 | | | | 8,867 | | | | 9,099 | | | | 10,108 | | | | 7,962 | | | | 7,251 | | | | 7,462 | | | | 7,271 | |
| Depreciation and amortization | | | 3,248 | | | | 3,158 | | | | 3,125 | | | | 3,168 | | | | 3,165 | | | | 3,010 | | | | 2,665 | | | | 2,578 | |
| Restructuring charge | | | — | | | | — | | | | — | | | | 4,667 | | | | 63 | | | | 3,829 | | | | — | | | | (10 | ) |
| Asset impairment charges | | | — | | | | — | | | | 5,205 | | | | — | | | | — | | | | — | | | | — | | | | - | |
| | | | | | | | | | | | | | | | | | | | | | | | | |
| Total costs and expenses | | | 79,235 | | | | 77,226 | | | | 79,494 | | | | 75,283 | | | | 60,198 | | | | 58,835 | | | | 54,239 | | | | 52,253 | |
| | | | | | | | | | | | | | | | | | | | | | | | | |
| Operating income (loss) | | | 9,089 | | | | 13,264 | | | | 3,242 | | | | 368 | | | | 627 | | | | (426 | ) | | | 11,055 | | | | 9,886 | |
| Other income (expense), net | | | 2,301 | | | | 650 | | | | 927 | | | | 1,667 | | | | (233 | ) | | | (404 | ) | | | 255 | | | | (374 | ) |
| | | | | | | | | | | | | | | | | | | | | | | | | |
| Income (loss) before income taxes | | | 11,390 | | | | 13,914 | | | | 4,169 | | | | 2,035 | | | | 394 | | | | (830 | ) | | | 11,310 | | | | 9,512 | |
| Income tax provision (benefit) | | | 3,958 | | | | 4,835 | | | | (140 | ) | | | 57 | | | | 132 | | | | (274 | ) | | | 327 | | | | 3,639 | |
| | | | | | | | | | | | | | | | | | | | | | | | | |
| Net income (loss) | | $ | 7,432 | | | $ | 9,079 | | | $ | 4,309 | | | $ | 1,978 | | | $ | 262 | | | $ | (556 | ) | | $ | 10,983 | | | $ | 5,873 | |
| | | | | | | | | | | | | | | | | | | | | | | | | |
| Basic earnings (loss) per share | | $ | 0.30 | | | $ | 0.37 | | | $ | 0.18 | | | $ | 0.08 | | | $ | 0.01 | | | $ | (0.02 | ) | | $ | 0.50 | | | $ | 0.27 | |
| Diluted earnings (loss) per share | | $ | 0.30 | | | $ | 0.37 | | | $ | 0.18 | | | $ | 0.08 | | | $ | 0.01 | | | $ | (0.02 | ) | | $ | 0.50 | | | $ | 0.26 | |
| Shares used in computing basic earnings per share | | | 24,433 | | | | 24,259 | | | | 24,069 | | | | 23,500 | | | | 23,017 | | | | 22,391 | | | | 22,116 | | | | 22,128 | |
| | | | | | | | | | | | | | | | | | | | | | | | | |
| Shares used in computing diluted earnings per share | | | 24,889 | | | | 24,826 | | | | 24,568 | | | | 23,549 | | | | 23,058 | | | | 22,391 | | | | 22,175 | | | | 22,667 | |
| | | | | | | | | | | | | | | | | | | | | | | | | |
69
Item 9.Changes in and Disagreements with Accountants on Accounting and Financial Disclosure
None.
Item 9A.Controls and Procedures
Evaluation of Disclosure Controls and Procedures
We maintain disclosure controls and procedures designed to ensure that information required to be disclosed in reports filed under the Securities Exchange Act of 1934, as amended, is recorded, processed, summarized and reported within the time periods specified in the SEC’s rules and forms, and that such information is accumulated and communicated to our management, including our Chief Executive Officer and our Chief Financial Officer, as appropriate, to allow timely decisions regarding required disclosure.
No system of controls, no matter how well designed and operated, can provide absolute assurance that the objectives of the system of controls are met, and no evaluation of controls can provide absolute assurance that the system of controls has operated effectively in all cases. Our disclosure controls and procedures however are designed to provide reasonable assurance that the objectives of disclosure controls and procedures are met.
As of the end of the period covered by this report, our Chief Executive Officer and Chief Financial Officer evaluated, with the participation of management, the effectiveness of our disclosure controls and procedures. Based on the evaluation, our Chief Executive Officer and Chief Financial Officer concluded that, as of the end of the period covered by this report, our disclosure controls and procedures were effective to provide reasonable assurance that the objectives of disclosure controls and procedures are met.
Management’s Report on Internal Control over Financial Reporting
Management’s assessment of the effectiveness of the Company’s internal control over financial reporting as of December 31, 2009 and the report of Ernst & Young LLP on the effectiveness of the Company’s internal control over financial reporting are contained on pages 43 and 44 of this report.
Change in Internal Control over Financial Reporting
During the fourth quarter of 2009, there were no changes in our internal control over financial reporting that have materially affected, or are reasonably likely to materially affect, our internal control over financial reporting, including any corrective actions with regard to material weaknesses.
Item 9B.Other Information
None.
PART III
Item 10.Directors, Executive Officers and Corporate Governance
The information required by this item is incorporated by reference from the information contained in our Proxy Statement for the Annual Meeting of Shareholders expected to be filed with the SEC on or prior to April 30, 2010 under the captions “Election of Directors,” “Executive Officers,” “Section 16(a) Beneficial Ownership Reporting Compliance,” “Code of Ethics” and “Board Committees.”
Item 11.Executive Compensation
The information required by this item is incorporated by reference from the relevant information contained in our Proxy Statement for the Annual Meeting of Shareholders expected to be filed with the SEC on or prior to April 30, 2010 under the captions “Director Compensation,” “Executive Compensation,” “Compensation Committee Interlocks and Insider Participation” and “Compensation Committee Report.”
70
Item 12.Security Ownership of Certain Beneficial Owners and Management and Related Shareholder Matters
The information required by this item is incorporated by reference from the relevant information contained in our Proxy Statement for the Annual Meeting of Shareholders expected to be filed with the SEC on or prior to April 30, 2010 under the caption “Security Ownership of Certain Beneficial Owners and Management.” The information required by this item with respect to the Company’s securities authorized for issuance under equity compensation plans is included in Part II, Item 5 of this Annual Report on Form 10-K and is incorporated by reference herein.
Item 13.Certain Relationships and Related Transactions, and Director Independence
The information required by this item is incorporated by reference from the relevant information contained in our Proxy Statement for the Annual Meeting of Shareholders expected to be filed with the SEC on or prior to April 30, 2010 under the captions “Related Party Transactions” and “Election of Directors.”
Item 14.Principal Accountant Fees and Services
The information required by this item is incorporated by reference from the relevant information contained in our Proxy Statement for the Annual Meeting of Shareholders expected to be filed with the SEC on or prior to April 30, 2010 under the caption “Ratification of Appointment of Independent Registered Public Accounting Firm.”
PART IV
Item 15.Exhibits and Financial Statement Schedules
| | | | | | | |
| (a) | | | 1. | | | Financial Statements. |
| |
| | | | | | | The response to this item is submitted as a separate section of this Form 10-K. See Item 8. |
| |
| | | | 2. | | | Financial Statement Schedule. |
The following financial statement schedule is filed as a part of this report:
SCHEDULE II
MANHATTAN ASSOCIATES, INC. AND SUBSIDIARIES
VALUATION AND QUALIFYING ACCOUNTS
| | | | | | | | | | | | | | | | | |
| | | Balance at | | Additions | | | | | | Balance at |
| | | Beginning of | | Charged to | | Net | | End of |
| Classification: | | Period | | Operations | | Deductions | | Period |
Allowance for Doubtful Accounts | | | | | | | | | | | | | | | | |
| For the year ended: | | | | | | | | | | | | | | | | |
| December 31, 2007 | | $ | 4,901,000 | | | $ | 5,695,000 | | | $ | 3,978,000 | | | $ | 6,618,000 | |
| December 31, 2008 | | $ | 6,618,000 | | | $ | 4,907,000 | | | $ | 5,959,000 | | | $ | 5,566,000 | |
| December 31, 2009 | | $ | 5,566,000 | | | $ | 3,593,000 | | | $ | 4,216,000 | | | $ | 4,943,000 | |
| | | | | | | | | | | | | | | | | |
Deferred Tax Asset Valuation Allowance | | | | | | | | | | | | | | | | |
| For the year ended: | | | | | | | | | | | | | | | | |
| December 31, 2007 | | $ | 4,677,000 | | | $ | — | | | $ | 346,000 | | | $ | 4,331,000 | |
| December 31, 2008 | | $ | 4,331,000 | | | $ | 3,326,000 | | | $ | — | | | $ | 7,657,000 | |
| December 31, 2009 | | $ | 7,657,000 | | | $ | 230,000 | | | $ | — | | | $ | 7,887,000 | |
| | | | | | | | | | | | | | | | | |
Restructuring Charge | | | | | | | | | | | | | | | | |
| For the year ended: | | | | | | | | | | | | | | | | |
| December 31, 2008 | | $ | — | | | $ | 4,667,000 | | | $ | 2,880,000 | | | $ | 1,787,000 | |
| December 31, 2009 | | $ | 1,787,000 | | | $ | 3,882,000 | | | $ | 5,414,000 | | | $ | 255,000 | |
71
All other schedules are omitted because they are not required or the required information is shown in the consolidated financial statements or notes thereto.
3. Exhibits.
The following exhibits are filed as part of, or are incorporated by reference into, this report on Form 10-K:
| | | | | |
| Exhibit | | |
| Number | | Description |
| | | | | |
| | 2.1 | | | Agreement and Plan of Merger, by and among the Registrant, Madison Acquisition Corp., Evant, Inc. and Ted Schlein, as Shareholder Representative, dated August 10, 2005 (Incorporated by reference to Exhibit 2.1 to the Company’s Form 8-K (File No. 000-23999), filed on August 16, 2005). |
| | | | | |
| | 2.2 | | | Voting Agreement, by and between the Registrant and the shareholders of Evant, Inc., dated August 10, 2005 (Incorporated by reference to Exhibit 2.2 to the Company’s Form 8-K (File No. 000-23999), filed on August 16, 2005). |
| | | | | |
| | 2.3 | | | Amendment Number 1 to Agreement and Plan of Merger, by and among Evant, Inc., the Registrant, Madison Acquisition Corp. and Ted Schlein, as Shareholder Representative, dated as of August 15, 2005 (Incorporated by reference to Exhibit 2.3 to the Company’s Form 8-K (File No. 000-23999), filed on August 16, 2005). |
| | | | | |
| | 3.1 | | | Articles of Incorporation of the Registrant (Incorporated by reference to Exhibit 3.1 to the Company’s Registration Statement on Form S-1 (File No. 333-47095), filed on February 27, 1998). |
| | | | | |
| | 3.2 | | | Amended Bylaws of the Registrant (Incorporated by reference to Exhibit 3.2 to the Company’s Form 8-K (File No. 000-23999), filed on October 23, 2007). |
| | | | | |
| | 4.1 | | | Provisions of the Articles of Incorporation and Bylaws of the Registrant defining rights of the holders of common stock of the Registrant (Incorporated by reference to Exhibit 4.1 to the Company’s Registration Statement on Form S-1 (File No. 333-47095), filed on February 27, 1998). |
| | | | | |
| | 4.2 | | | Specimen Stock Certificate (Incorporated by reference to Exhibit 4.2 to the Company’s Pre-Effective Amendment No. 1 to its Registration Statement on Form S-1 (File No. 333-47095), filed on April 2, 1998). |
| | | | | |
| | 10.1 | | | Lease Agreement by and between Wildwood Associates, a Georgia general partnership, and the Registrant dated September 24, 1997 (Incorporated by reference to Exhibit 10.1 to the Company’s Registration Statement on Form S-1 (File No. 333-47095), filed on February 27, 1998). |
| | | | | |
| | 10.2 | | | First Amendment to Lease between Wildwood Associates, a Georgia general partnership, and the Registrant dated October 31, 1997 (Incorporated by reference to Exhibit 10.2 to the Company’s Registration Statement on Form S-1 (File No. 333-47095), filed on February 27, 1998). |
| | | | | |
| | 10.3 | | | Second Amendment to Lease Agreement between Wildwood Associates, a Georgia general partnership, and the Registrant, dated February 27, 1998 (Incorporated by reference to Exhibit 10.8 to the Company’s Pre-Effective Amendment No. 1 to its Registration Statement on Form S-1 (File No. 333-47095), filed on April 2, 1998). |
| | | | | |
| | 10.4 | | | Third Amendment to Lease Agreement between Wildwood Associates and the Registrant, dated October 24, 2000 (Incorporated by reference to Exhibit 10.9 to the Company’s Annual Report for the period ended December 31, 2000 (File No. 000-23999), filed on April 2, 2001). |
72
| | | | | |
| Exhibit | | |
| Number | | Description |
| | | | | |
| | 10.5 | | | Lease Agreement by and between Wildwood Associates, a Georgia general partnership, and the Registrant, dated June 25, 2001 (Incorporated by reference to Exhibit 10.1 to the Company’s Quarterly Report for the period ended June 30, 2001 (File No. 000-23999), filed August 14, 2001). |
| | | | | |
| | 10.6 | | | First Amendment to Lease Agreement between Wildwood Associates, and the Registrant, dated June 10, 2002 (Incorporated by reference to Exhibit 10.6 to the Company’s Annual Report for the period ended December 31, 2006 (File No. 000-23999), filed on March 14, 2007). |
| | | | | |
| | 10.7 | | | Second Amendment to Lease Agreement between 2300 Windy Ridge Parkway Investors LLC, and the Registrant, dated February 27, 2007 (Incorporated by reference to Exhibit 10.7 to the Company’s Annual Report for the period ended December 31, 2006 (File No. 000-23999), filed on March 14, 2007). |
| | | | | |
| | 10.8 | | | Lease Agreement by and between Tektronix UK Limited, Manhattan Associates Limited and Manhattan Associates, Inc., dated October 21, 1999 (Incorporated by reference to Exhibit 10.27 to the Company’s Annual Report for the period ended December 31, 1999 (File No. 000-23999), filed on March 30, 2000). |
| | | | | |
| | 10.9 | | | Lease (Burlington Business Center) by and between Gateway Rosewood, Inc. and Manhattan Associates, Inc., dated August 23, 2004 (Incorporated by reference to Exhibit 10.7 to the Company’s Annual Report for the period ended December 31, 2004 (File No. 000-23999), filed on March 16, 2005). |
| | | | | |
| | 10.10 | | | Agreement to Build and Lease between Orchid Apartments Private Limited and Manhattan Associates India Development Centre Private Limited, executed on November 19, 2004 (Incorporated by reference to Exhibit 10.8 to the Company’s Annual Report for the period ended December 31, 2004 (File No. 000-23999), filed on March 16, 2005). |
| | | | | |
| | 10.11 | | | Lease Agreement between IGE Energy Services (UK) Limited, Manhattan Associates Limited and Manhattan Associates, Inc., dated February 1, 2005 (Incorporated by reference to Exhibit 10.9 to the Company’s Annual Report for the period ended December 31, 2004 (File No. 000-23999), filed on March 16, 2005). |
| | | | | |
| | 10.12 | | | Sub-Sublease Agreement between Scientific Research Corporation, a Georgia corporation, and the Registrant, dated July 2, 1998 (Incorporated by reference to Exhibit 10.19 to the Company’s Annual Report for the period ended December 31, 1998 (File No. 000-23999), filed on March 31, 1999). |
| | | | | |
| | 10.13 | | | Sub-Sublease Agreement between The Profit Recovery Group International 1, Inc., a Georgia corporation, and the Registrant, dated August 19, 1998 (Incorporated by reference to Exhibit 10.20 to the Company’s Annual Report for the period ended December 31, 1998 (File No. 000-23999), filed on March 31, 1999). |
| | | | | |
| | 10.14 | | | Standard Sublease Agreement between Life Office Management Association, Inc. and the Registrant, dated October 20, 2000 (Incorporated by reference to Exhibit 10.17 to the Company’s Annual Report for the period ended December 31, 2000 (File No. 000-23999), filed on April 2, 2001). |
| | | | | |
| | 10.15 | | | Standard Sublease Agreement between Chevron USA Inc. and the Registrant, dated November 20, 2000 (Incorporated by reference to Exhibit 10.18 to the Company’s Annual Report for the period ended December 31, 2000 (File No. 000-23999), filed on April 2, 2001). |
| | | | | |
| | 10.16 | | | Form of Indemnification Agreement with certain directors and officers of the Registrant (Incorporated by reference to Exhibit 10.2 to the Company’s Quarterly Report for the period ended June 30, 2004 (File No. 000-23999), filed on August 9, 2004). |
| | | | | |
| | 10.17 | | | Form of Tax Indemnification Agreement for direct and indirect shareholders of Manhattan Associates Software, LLC (Incorporated by reference to Exhibit 10.7 to the Company’s Registration Statement on Form S-1 (File No. 333-47095), filed on February 27, 1998). |
73
| | | | | |
| Exhibit | | |
| Number | | Description |
| |
| | 10.18 | | | Summary Plan Description of the Registrant’s Money Purchase Plan & Trust, effective January 1, 1997 (Incorporated by reference to Exhibit 10.3 to the Company’s Registration Statement on Form S-1 (File No. 333-47095), filed on February 27, 1998). |
| | | | | |
| | 10.19 | | | Summary Plan Description of the Registrant’s 401(k) Plan and Trust, effective January 1, 1995 (Incorporated by reference to Exhibit 10.4 to the Company’s Registration Statement on Form S-1 (File No. 333-47095), filed on February 27, 1998). |
| | | | | |
| | 10.20 | * | | Manhattan Associates, Inc. 1998 Stock Incentive Plan (Incorporated by reference to Exhibit 10.10 to the Company’s Registration Statement on Form S-1 (File No. 333-47095), filed on February 27, 1998). |
| | | | | |
| | 10.21 | * | | First Amendment to the Manhattan Associates, Inc. 1998 Stock Incentive Plan (Incorporated by reference to Exhibit 10.22 to the Company’s Annual Report for the period ended December 31, 1998 (File No. 000-23999), filed on March 31, 1999). |
| | | | | |
| | 10.22 | * | | Second Amendment to the Manhattan Associates, Inc. 1998 Stock Incentive Plan (Incorporated by reference to Exhibit 10.23 to the Company’s Annual Report for the period ended December 31, 1998 (File No. 000-23999), filed on March 31, 1999). |
| | | | | |
| | 10.23 | * | | Third Amendment to the Manhattan Associates, Inc. 1998 Stock Incentive Plan (Incorporated by reference to Exhibit 10.24 to the Company’s Annual Report for the period ended December 31, 1998 (File No. 000-23999), filed on March 31, 1999). |
| | | | | |
| | 10.24 | * | | Fourth Amendment to the Manhattan Associates, Inc. 1998 Stock Incentive Plan (Incorporated by reference to Exhibit 10.25 to the Company’s Annual Report for the period ended December 31, 1999 (File No. 000-23999), filed on March 30, 2000). |
| | | | | |
| | 10.25 | * | | Fifth Amendment to the Manhattan Associates, Inc. 1998 Stock Incentive Plan (Incorporated by reference to Exhibit 4.8 to the Company’s Form S-8 (File No. 333-68968), filed on September 5, 2001). |
| | | | | |
| | 10.26 | * | | Sixth Amendment to the Manhattan Associates, Inc. 1998 Stock Incentive Plan (Incorporated by reference to Annex A to the Company’s Proxy Statement for its Annual Meeting held May 17, 2002 (File No. 000-23999), filed on April 24, 2002). |
| | | | | |
| | 10.27 | * | | Amendment No. 7 to the Manhattan Associates, Inc. 1998 Stock Incentive Plan (Incorporated by reference to Exhibit 4.10 to the Company’s Form S-8 (File No. 333-105913), filed on June 6, 2003). |
| | | | | |
| | 10.28 | * | | Form of Composite Stock Option Agreement (Incorporated by reference to Exhibit 10.1 to the Company’s Quarterly Report for the period ended March 31, 2006 (File No. 000-23999), filed on May 4, 2006). |
| | | | | |
| | 10.30 | (a)* | | Executive Employment Agreement by and between the Registrant and Peter F. Sinisgalli, effective as of February 25, 2004 (Incorporated by reference to Exhibit 10.28 to the Company’s Annual Report for the period ended December 31, 2003 (File No. 000-23999), filed on March 15, 2004). |
| | | | | |
| | | (b)* | | Modification dated July 19, 2007 by and between the Company and Peter F. Sinisgalli to the Executive Employment Agreement dated February 25, 2004 (Incorporated by reference to Exhibit 10.1 to the Company’s Form 8-K (File No. 000-23999), filed on July 24, 2007). |
| | | | | |
| | 10.31 | * | | Separation and Non-Competition Agreement by and between the Registrant and Peter F. Sinisgalli, effective as of February 25, 2004 (Incorporated by reference to Exhibit 10.29 to the Company’s Annual Report for the period ended December 31, 2003 (File No. 000-23999), filed on March 15, 2004). |
74
| | | | | |
| Exhibit | | |
| Number | | Description |
| | | | | |
| | 10.32 | * | | Executive Employment Agreement by and between the Registrant and Jeffrey Mitchell, effective as of September 3, 1999 (Incorporated by reference to Exhibit 10.32 to the Company’s Annual Report for the period ended December 31, 2003 (File No. 000-23999), filed on March 15, 2004). |
| | | | | |
| | 10.33 | * | | Executive Non-Competition and Severance Agreement by and between the Registrant and Jeffrey S. Mitchell, dated June 22, 2004 (Incorporated by reference to Exhibit 10.1 to the Company’s Quarterly Report for the period ended June 30, 2004 (File No. 000-23999), filed on August 9, 2004). |
| | | | | |
| | 10.34 | * | | Executive Employment Agreement by and between the Registrant and Jeffry Baum, effective as of October 30, 2000 (Incorporated by reference to Exhibit 10.36 to the Company’s Annual Report for the period ended December 31, 2003 (File No. 000-23999), filed on March 15, 2004). |
| | | | | |
| | 10.35 | * | | Executive Employment Agreement by and between the Registrant and Dennis B. Story, effective as of February 18, 2006 (Incorporated by reference to Exhibit 10.1 to the Company’s Form 8-K (File No. 000-23999), filed on February 22, 2006). |
| | | | | |
| | 10.36 | * | | Severance and Non-Competition Agreement by and between the Registrant and Dennis B. Story, effective as of February 18, 2006 (Incorporated by reference to Exhibit 10.2 to the Company’s Form 8-K (File No. 000-23999), filed on February 22, 2006). |
| | | | | |
| | 10.37 | * | | Executive Employment Agreement by and between the Registrant and Pervinder Johar, effective as of March 30, 2006. (Incorporated by reference to Exhibit 10.1 to the Company’s Form 8-K (File No. 000-23999), filed on January 2, 2009). |
| | | | | |
| | 10.38 | * | | Severance and Non-Competition Agreement by and between the Registrant and Pervinder Johar, effective as March 30, 2006. (Incorporated by reference to Exhibit 10.2 to the Company’s Form 8-K (File No. 000-23999), filed on January 2, 2009). |
| | | | | |
| | 10.39 | * | | Separation Agreement and Release by and between the Registrant and Pervinder Johar, dated December 31, 2008. (Incorporated by reference to Exhibit 10.1 to the Company’s Form 8-K (File No. 000-23999), filed on January 7, 2009). |
| | | | | |
| | 10.40 | * | | Form of Modification Agreement for Terms and Conditions for Stock Options. (Incorporated by reference to Exhibit 10.3 to the Company’s Form 8-K (File No. 000-23999), filed on January 2, 2009). |
| | | | | |
| | 10.41 | * | | Severance and Non-Competition Agreement by and between the Registrant and David Dabbiere, effective as of September 29, 2008. (Incorporated by reference to Exhibit 10.4 to the Company’s Form 8-K (File No. 000-23999), filed on January 2, 2009). |
| | | | | |
| | 10.42 | | | Form of License Agreement, Software Maintenance Agreement and Consulting Agreement (Incorporated by reference to Exhibit 10.18 to the Company’s Pre-Effective Amendment No. 1 to its Registration Statement on Form S-1 (File No. 333-47095), filed on April 2, 1998). |
| | | | | |
| | 10.43 | | | Form of Software License, Services and Maintenance Agreement (Incorporated by reference to Exhibit 10.21 to the Company’s Annual Report for the period ended December 31, 1998 (File No. 000-23999), filed on March 31, 1999). |
| | | | | |
| | 10.44 | * | | 2007 Stock Incentive Plan, as amended by the First Amendment thereto (Incorporated by reference to Annex A to the Company’s Definitive Proxy Statement related to its 2009 Annual Meeting of Shareholders (File No. 000-23999) filed on April 20, 2009). |
75
| | | | | |
| Exhibit | | |
| Number | | Description |
| | | | | |
| | 10.45 | * | | Written Summary of Manhattan Associates, Inc. 2009 Annual Cash Incentive Plan (Incorporated by reference to Exhibit 10.1 to the Company’s Form 8-K (File No. 000-23999), filed on June 19, 2009). |
| | | | | |
| | 10.46 | * | | Written Summary of Manhattan Associates, Inc. 2009 Supplemental Cash Incentive Plan (Incorporated by reference to Exhibit 10.2 to the Company’s Form 8-K (File No. 000-23999), filed on June 19, 2009). |
| | | | | |
| | 10.47 | * | | Written Summary of Manhattan Associates, Inc. Annual Cash Incentive Plan |
| | | | | |
| | 10.48 | * | | Form of Manhattan Associates, Inc. Restricted Stock Award Agreement for Employees |
| | | | | |
| | 10.49 | * | | Form of Manhattan Associates, Inc. Restricted Stock Award Agreement for Non-Employee Directors |
| | | | | |
| | 21.1 | | | List of Subsidiaries. |
| | | | | |
| | 23.1 | | | Consent of Ernst & Young LLP, Independent Registered Public Accounting Firm. |
| | | | | |
| | 31.1 | | | Certificate of Principal Executive Officer pursuant to Section 302 of the Sarbanes-Oxley Act of 2002. |
| | | | | |
| | 31.2 | | | Certificate of Principal Financial Officer pursuant to Section 302 of the Sarbanes-Oxley Act of 2002. |
| | | | | |
| | 32.1 | | | Certificate of Chief Executive Officer and Chief Financial Officer. |
| | |
| * | | Management contract or compensatory plan or arrangement. |
| |
| (b) | | The registrant hereby files the exhibits set forth in Item 15(a)(3). |
| |
| (c) | | See Item 15(a)(2). |
76
SIGNATURES
Pursuant to the requirements of Section 13 or 15(d) of the Securities Exchange Act of 1934, the Registrant has duly caused this report to be signed on its behalf by the undersigned, thereunto duly authorized.
| | | | | |
| | MANHATTAN ASSOCIATES, INC.
| |
| | By: | /s/ Peter F. Sinisgalli | |
| | | Peter F. Sinisgalli | |
| | | Chief Executive Officer, President and Director | |
| |
Date: February 19, 2010
Pursuant to the requirements of the Securities Exchange Act of 1934, this report has been signed below by the following persons on behalf of the Registrant in the capacities and on the dates indicated.
| | | | | |
| Signature | | Title | | Date |
| | | | | |
| /s/ John J. Huntz, Jr. | | Chairman of the Board | | February 19, 2010 |
| | | | | |
| John J. Huntz, Jr. | | | | |
| | | | | |
| /s/ Peter F. Sinisgalli | | Chief Executive Officer, President and Director (Principal Executive Officer) | | February 19, 2010 |
| | | | | |
| Peter F. Sinisgalli | | | | |
| | | | | |
| /s/ Dennis B. Story | | Senior Vice President, Chief Financial Officer and Treasurer (Principal Financial and Accounting Officer) | | February 19, 2010 |
| | | | | |
| Dennis B. Story | | | | |
| | | | | |
| /s/ Brian J. Cassidy | | Director | | February 19, 2010 |
| | | | | |
| Brian J. Cassidy | | | | |
| | | | | |
| /s/ Paul R. Goodwin | | Director | | February 19, 2010 |
| | | | | |
| Paul R. Goodwin | | | | |
| | | | | |
| /s/ Thomas E. Noonan | | Director | | February 19, 2010 |
| | | | | |
| Thomas E. Noonan | | | | |
| | | | | |
| /s/ Deepak Raghavan | | Director | | February 19, 2010 |
| | | | | |
| Deepak Raghavan | | | | |
| | | | | |
| /s/ Pete Kight | | Director | | February 19, 2010 |
| | | | | |
| Pete Kight | | | | |
| | | | | |
| /s/ Dan J. Lautenbach | | Director | | February 19, 2010 |
| | | | | |
| Dan J. Lautenbach | | | | |
77
EXHIBIT INDEX
| | | | | |
| Exhibit | | |
| Number | | Description |
| | | | | |
| | 2.1 | | | Agreement and Plan of Merger, by and among the Registrant, Madison Acquisition Corp., Evant, Inc. and Ted Schlein, as Shareholder Representative, dated August 10, 2005 (Incorporated by reference to Exhibit 2.1 to the Company’s Form 8-K (File No. 000-23999), filed on August 16, 2005). |
| | | | | |
| | 2.2 | | | Voting Agreement, by and between the Registrant and the shareholders of Evant, Inc., dated August 10, 2005 (Incorporated by reference to Exhibit 2.2 to the Company’s Form 8-K (File No. 000-23999), filed on August 16, 2005). |
| | | | | |
| | 2.3 | | | Amendment Number 1 to Agreement and Plan of Merger, by and among Evant, Inc., the Registrant, Madison Acquisition Corp. and Ted Schlein, as Shareholder Representative, dated as of August 15, 2005 (Incorporated by reference to Exhibit 2.3 to the Company’s Form 8-K (File No. 000-23999), filed on August 16, 2005). |
| | | | | |
| | 3.1 | | | Articles of Incorporation of the Registrant (Incorporated by reference to Exhibit 3.1 to the Company’s Registration Statement on Form S-1 (File No. 333-47095), filed on February 27, 1998). |
| | | | | |
| | 3.2 | | | Amended Bylaws of the Registrant (Incorporated by reference to Exhibit 3.2 to the Company’s Form 8-K (File No. 000-23999), filed on October 23, 2007). |
| | | | | |
| | 4.1 | | | Provisions of the Articles of Incorporation and Bylaws of the Registrant defining rights of the holders of common stock of the Registrant (Incorporated by reference to Exhibit 4.1 to the Company’s Registration Statement on Form S-1 (File No. 333-47095), filed on February 27, 1998). |
| | | | | |
| | 4.2 | | | Specimen Stock Certificate (Incorporated by reference to Exhibit 4.2 to the Company’s Pre-Effective Amendment No. 1 to its Registration Statement on Form S-1 (File No. 333-47095), filed on April 2, 1998). |
| | | | | |
| | 10.1 | | | Lease Agreement by and between Wildwood Associates, a Georgia general partnership, and the Registrant dated September 24, 1997 (Incorporated by reference to Exhibit 10.1 to the Company’s Registration Statement on Form S-1 (File No. 333-47095), filed on February 27, 1998). |
| | | | | |
| | 10.2 | | | First Amendment to Lease between Wildwood Associates, a Georgia general partnership, and the Registrant dated October 31, 1997 (Incorporated by reference to Exhibit 10.2 to the Company’s Registration Statement on Form S-1 (File No. 333-47095), filed on February 27, 1998). |
| | | | | |
| | 10.3 | | | Second Amendment to Lease Agreement between Wildwood Associates, a Georgia general partnership, and the Registrant, dated February 27, 1998 (Incorporated by reference to Exhibit 10.8 to the Company’s Pre-Effective Amendment No. 1 to its Registration Statement on Form S-1 (File No. 333-47095), filed on April 2, 1998). |
| | | | | |
| | 10.4 | | | Third Amendment to Lease Agreement between Wildwood Associates and the Registrant, dated October 24, 2000 (Incorporated by reference to Exhibit 10.9 to the Company’s Annual Report for the period ended December 31, 2000 (File No. 000-23999), filed on April 2, 2001). |
| | | | | |
| | 10.5 | | | Lease Agreement by and between Wildwood Associates, a Georgia general partnership, and the Registrant, dated June 25, 2001 (Incorporated by reference to Exhibit 10.1 to the Company’s Quarterly Report for the period ended June 30, 2001 (File No. 000-23999), filed August 14, 2001). |
78
| | | | | |
| Exhibit | | |
| Number | | Description |
| | | | | |
| | 10.6 | | | First Amendment to Lease Agreement between Wildwood Associates, and the Registrant, dated June 10, 2002 (Incorporated by reference to Exhibit 10.6 to the Company’s Annual Report for the period ended December 31, 2006 (File No. 000-23999), filed on March 14, 2007). |
| | | | | |
| | 10.7 | | | Second Amendment to Lease Agreement between 2300 Windy Ridge Parkway Investors LLC, and the Registrant, dated February 27, 2007 (Incorporated by reference to Exhibit 10.7 to the Company’s Annual Report for the period ended December 31, 2006 (File No. 000-23999), filed on March 14, 2007). |
| | | | | |
| | 10.8 | | | Lease Agreement by and between Tektronix UK Limited, Manhattan Associates Limited and Manhattan Associates, Inc., dated October 21, 1999 (Incorporated by reference to Exhibit 10.27 to the Company’s Annual Report for the period ended December 31, 1999 (File No. 000-23999), filed on March 30, 2000). |
| | | | | |
| | 10.9 | | | Lease (Burlington Business Center) by and between Gateway Rosewood, Inc. and Manhattan Associates, Inc., dated August 23, 2004 (Incorporated by reference to Exhibit 10.7 to the Company’s Annual Report for the period ended December 31, 2004 (File No. 000-23999), filed on March 16, 2005). |
| | 10.10 | | | Agreement to Build and Lease between Orchid Apartments Private Limited and Manhattan Associates India Development Centre Private Limited, executed on November 19, 2004 (Incorporated by reference to Exhibit 10.8 to the Company’s Annual Report for the period ended December 31, 2004 (File No. 000-23999), filed on March 16, 2005). |
| | | | | |
| | 10.11 | | | Lease Agreement between IGE Energy Services (UK) Limited, Manhattan Associates Limited and Manhattan Associates, Inc., dated February 1, 2005 (Incorporated by reference to Exhibit 10.9 to the Company’s Annual Report for the period ended December 31, 2004 (File No. 000-23999), filed on March 16, 2005). |
| | | | | |
| | 10.12 | | | Sub-Sublease Agreement between Scientific Research Corporation, a Georgia corporation, and the Registrant, dated July 2, 1998 (Incorporated by reference to Exhibit 10.19 to the Company’s Annual Report for the period ended December 31, 1998 (File No. 000-23999), filed on March 31, 1999). |
| | | | | |
| | 10.13 | | | Sub-Sublease Agreement between The Profit Recovery Group International 1, Inc., a Georgia corporation, and the Registrant, dated August 19, 1998 (Incorporated by reference to Exhibit 10.20 to the Company’s Annual Report for the period ended December 31, 1998 (File No. 000-23999), filed on March 31, 1999). |
| | | | | |
| | 10.14 | | | Standard Sublease Agreement between Life Office Management Association, Inc. and the Registrant, dated October 20, 2000 (Incorporated by reference to Exhibit 10.17 to the Company’s Annual Report for the period ended December 31, 2000 (File No. 000-23999), filed on April 2, 2001). |
| | | | | |
| | 10.15 | | | Standard Sublease Agreement between Chevron USA Inc. and the Registrant, dated November 20, 2000 (Incorporated by reference to Exhibit 10.18 to the Company’s Annual Report for the period ended December 31, 2000 (File No. 000-23999), filed on April 2, 2001). |
| | | | | |
| | 10.16 | | | Form of Indemnification Agreement with certain directors and officers of the Registrant (Incorporated by reference to Exhibit 10.2 to the Company’s Quarterly Report for the period ended June 30, 2004 (File No. 000-23999), filed on August 9, 2004). |
| | | | | |
| | 10.17 | | | Form of Tax Indemnification Agreement for direct and indirect shareholders of Manhattan Associates Software, LLC (Incorporated by reference to Exhibit 10.7 to the Company’s Registration Statement on Form S-1 (File No. 333-47095), filed on February 27, 1998). |
| | | | | |
| | 10.18 | | | Summary Plan Description of the Registrant’s Money Purchase Plan & Trust, effective January 1, 1997 (Incorporated by reference to Exhibit 10.3 to the Company’s Registration Statement on Form S-1 (File No. 333-47095), filed on February 27, 1998). |
79
| | | | | |
| Exhibit | | |
| Number | | Description |
| | | | | |
| | 10.19 | | | Summary Plan Description of the Registrant’s 401(k) Plan and Trust, effective January 1, 1995 (Incorporated by reference to Exhibit 10.4 to the Company’s Registration Statement on Form S-1 (File No. 333-47095), filed on February 27, 1998). |
| | | | | |
| | 10.20 | * | | Manhattan Associates, Inc. 1998 Stock Incentive Plan (Incorporated by reference to Exhibit 10.10 to the Company’s Registration Statement on Form S-1 (File No. 333-47095), filed on February 27, 1998). |
| | | | | |
| | 10.21 | * | | First Amendment to the Manhattan Associates, Inc. 1998 Stock Incentive Plan (Incorporated by reference to Exhibit 10.22 to the Company’s Annual Report for the period ended December 31, 1998 (File No. 000-23999), filed on March 31, 1999). |
| | | | | |
| | 10.22 | * | | Second Amendment to the Manhattan Associates, Inc. 1998 Stock Incentive Plan (Incorporated by reference to Exhibit 10.23 to the Company’s Annual Report for the period ended December 31, 1998 (File No. 000-23999), filed on March 31, 1999). |
| | | | | |
| | 10.23 | * | | Third Amendment to the Manhattan Associates, Inc. 1998 Stock Incentive Plan (Incorporated by reference to Exhibit 10.24 to the Company’s Annual Report for the period ended December 31, 1998 (File No. 000-23999), filed on March 31, 1999). |
| | | | | |
| | 10.24 | * | | Fourth Amendment to the Manhattan Associates, Inc. 1998 Stock Incentive Plan (Incorporated by reference to Exhibit 10.25 to the Company’s Annual Report for the period ended December 31, 1999 (File No. 000-23999), filed on March 30, 2000). |
| | | | | |
| | 10.25 | * | | Fifth Amendment to the Manhattan Associates, Inc. 1998 Stock Incentive Plan (Incorporated by reference to Exhibit 4.8 to the Company’s Form S-8 (File No. 333-68968), filed on September 5, 2001). |
| | | | | |
| | 10.26 | * | | Sixth Amendment to the Manhattan Associates, Inc. 1998 Stock Incentive Plan (Incorporated by reference to Annex A to the Company’s Proxy Statement for its Annual Meeting held May 17, 2002 (File No. 000-23999), filed on April 24, 2002). |
| | | | | |
| | 10.27 | * | | Amendment No. 7 to the Manhattan Associates, Inc. 1998 Stock Incentive Plan (Incorporated by reference to Exhibit 4.10 to the Company’s Form S-8 (File No. 333-105913), filed on June 6, 2003). |
| | | | | |
| | 10.28 | * | | Form of Composite Stock Option Agreement (Incorporated by reference to Exhibit 10.1 to the Company’s Quarterly Report for the period ended March 31, 2006 (File No. 000-23999), filed on May 4, 2006). |
| | | | | |
| | 10.30 | (a)* | | Executive Employment Agreement by and between the Registrant and Peter F. Sinisgalli, effective as of February 25, 2004 (Incorporated by reference to Exhibit 10.28 to the Company’s Annual Report for the period ended December 31, 2003 (File No. 000-23999), filed on March 15, 2004). |
| | | | | |
| | | (b )* | | Modification dated July 19, 2007 by and between the Company and Peter F. Sinisgalli to the Executive Employment Agreement dated February 25, 2004 (Incorporated by reference to Exhibit 10.1 to the Company’s Form 8-K (File No. 000-23999), filed on July 24, 2007). |
| | | | | |
| | 10.31 | * | | Separation and Non-Competition Agreement by and between the Registrant and Peter F. Sinisgalli, effective as of February 25, 2004 (Incorporated by reference to Exhibit 10.29 to the Company’s Annual Report for the period ended December 31, 2003 (File No. 000-23999), filed on March 15, 2004). |
| | | | | |
| | 10.32 | * | | Executive Employment Agreement by and between the Registrant and Jeffrey Mitchell, effective as of September 3, 1999 (Incorporated by reference to Exhibit 10.32 to the Company’s Annual Report for the period ended December 31, 2003 (File No. 000-23999), filed on March 15, 2004). |
80
| | | | | |
| Exhibit | | |
| Number | | Description |
| | | | | |
| | 10.33 | * | | Executive Non-Competition and Severance Agreement by and between the Registrant and Jeffrey S. Mitchell, dated June 22, 2004 (Incorporated by reference to Exhibit 10.1 to the Company’s Quarterly Report for the period ended June 30, 2004 (File No. 000-23999), filed on August 9, 2004). |
| | | | | |
| | 10.34 | * | | Executive Employment Agreement by and between the Registrant and Jeffry Baum, effective as of October 30, 2000 (Incorporated by reference to Exhibit 10.36 to the Company’s Annual Report for the period ended December 31, 2003 (File No. 000-23999), filed on March 15, 2004). |
| | | | | |
| | 10.35 | * | | Executive Employment Agreement by and between the Registrant and Dennis B. Story, effective as of February 18, 2006 (Incorporated by reference to Exhibit 10.1 to the Company’s Form 8-K (File No. 000-23999), filed on February 22, 2006). |
| | | | | |
| | 10.36 | * | | Severance and Non-Competition Agreement by and between the Registrant and Dennis B. Story, effective as of February 18, 2006 (Incorporated by reference to Exhibit 10.2 to the Company’s Form 8-K (File No. 000-23999), filed on February 22, 2006). |
| | | | | |
| | 10.37 | * | | Executive Employment Agreement by and between the Registrant and Pervinder Johar, effective as of March 30, 2006. (Incorporated by reference to Exhibit 10.1 to the Company’s Form 8-K (File No. 000-23999), filed on January 2, 2009). |
| | | | | |
| | 10.38 | * | | Severance and Non-Competition Agreement by and between the Registrant and Pervinder Johar, effective as March 30, 2006. (Incorporated by reference to Exhibit 10.2 to the Company’s Form 8-K (File No. 000-23999), filed on January 2, 2009). |
| | | | | |
| | 10.39 | * | | Separation Agreement and Release by and between the Registrant and Pervinder Johar, dated December 31, 2008. (Incorporated by reference to Exhibit 10.1 to the Company’s Form 8-K (File No. 000-23999), filed on January 7, 2009). |
| | | | | |
| | 10.40 | * | | Form of Modification Agreement for Terms and Conditions for Stock Options. (Incorporated by reference to Exhibit 10.3 to the Company’s Form 8-K (File No. 000-23999), filed on January 2, 2009). |
| | | | | |
| | 10.41 | * | | Severance and Non-Competition Agreement by and between the Registrant and David Dabbiere, effective as of September 29, 2008. (Incorporated by reference to Exhibit 10.4 to the Company’s Form 8-K (File No. 000-23999), filed on January 2, 2009). |
| | | | | |
| | 10.42 | | | Form of License Agreement, Software Maintenance Agreement and Consulting Agreement (Incorporated by reference to Exhibit 10.18 to the Company’s Pre-Effective Amendment No. 1 to its Registration Statement on Form S-1 (File No. 333-47095), filed on April 2, 1998). |
| | | | | |
| | 10.43 | | | Form of Software License, Services and Maintenance Agreement (Incorporated by reference to Exhibit 10.21 to the Company’s Annual Report for the period ended December 31, 1998 (File No. 000-23999), filed on March 31, 1999). |
| | | | | |
| | 10.44 | * | | 2007 Stock Incentive Plan, as amended by the First Amendment thereto (Incorporated by reference to Annex A to the Company’s Definitive Proxy Statement related to its 2009 Annual Meeting of Shareholders (File No. 000-23999) filed on April 20, 2009). |
| | | | | |
| | 10.45 | * | | Written Summary of Manhattan Associates, Inc. 2009 Annual Cash Incentive Plan (Incorporated by reference to Exhibit 10.1 to the Company’s Form 8-K (File No. 000-23999), filed on June 19, 2009). |
81
| | | | | |
| Exhibit | | |
| Number | | Description |
| | | | | |
| | 10.46 | * | | Written Summary of Manhattan Associates, Inc. 2009 Supplemental Cash Incentive Plan (Incorporated by reference to Exhibit 10.2 to the Company’s Form 8-K (File No. 000-23999), filed on June 19, 2009). |
| | | | | |
| | 10.47 | * | | Written Summary of Manhattan Associates, Inc. Annual Cash Incentive Plan |
| | | | | |
| | 10.48 | * | | Form of Manhattan Associates, Inc. Restricted Stock Award Agreement for Employees |
| | | | | |
| | 10.49 | * | | Form of Manhattan Associates, Inc. Restricted Stock Award Agreement for Non-Employee Directors |
| | | | | |
| | 21.1 | | | List of Subsidiaries. |
| | | | | |
| | 23.1 | | | Consent of Ernst & Young LLP, Independent Registered Public Accounting Firm. |
| | | | | |
| | 31.1 | | | Certificate of Principal Executive Officer pursuant to Section 302 of the Sarbanes-Oxley Act of 2002. |
| | | | | |
| | 31.2 | | | Certificate of Principal Financial Officer pursuant to Section 302 of the Sarbanes-Oxley Act of 2002. |
| | | | | |
| | 32.1 | | | Certificate of Chief Executive Officer and Chief Financial Officer. |
82