Exhibit (c)(9)
APPRAISAL OF REAL PROPERTY
The Montana II
380 Union Street Pasadena, Los Angeles County, CA 91101
Latitude: 34.146596 Longitude: -118.142479
IN A SELF-CONTAINED APPRAISAL REPORT
As of December 10, 2010
Prepared For:
Special Committee of the Board of Directors of Wesco Financial Corporation c/o
Skadden, Arps, Slate, Meagher & Flom LLP 300 South Grand Avenue, Suite 3200 Los Angeles, CA 90071
PHOTOGRAPH OF SUBJECT PROPERTY
Prepared By: Cushman & Wakefield Western, Inc.
Valuation & Advisory
601 South Figueroa Street, 47th Floor
Los Angeles, CA 90017-5752
C&W File ID: 10-38021-9027-3
CUSHMAN & WAKEFIELD® Global Real Estate Solution SM
As a matter of environmental responsibility. C&W has adopted a corporate-wide program to print our appraisal reports double-sided.
CUSHMAN & WAKEFIELD®
CUSHMAN & WAKEFIELD WESTERN, INC.
601 SOUTH FIGUEROA STREET, 47TH FLOOR
LOS ANGELES, CA 90017-5752
December 10, 2010
Special Committee of the Board of Directors of Wesco Financial Corporation c/o Brian McCarthy
Skadden, Arps, Slate, Meagher & Flom LLP
300 South Grand Avenue, Suite 3200 Los Angeles, CA 90071
Re: Appraisal of Real Property In a Self-Contained Report
The Montana II
380 Union Street Pasadena, Los Angeles County, CA 91101
C&W File ID: 10-38021-9027-3
Dear Mr. McCarthy:
In fulfillment of our agreement as outlined in the Letter of Engagement, we are pleased to transmit our appraisal presented in a self-contained report on the property referenced above. The date of the report is December 10, 2010. The effective date of value is December 10, 2010.
This report is addressed to Special Committee of the Board of Directors of Wesco Financial Corporation c/o Skadden, Arps, Slate, Meagher & Flom LLP and its affiliates. In conformance with your request, we have completed an appraisal of the above referenced property. The appraisal states our opinion of the property’s Market Value subject to various Assumptions and Limiting Conditions set forth in the accompanying report. The physical inspection and analysis that form the basis of the report have been conducted by Michele Kauffman and Michele Kauffman.
The accompanying report includes pertinent data secured in our investigation, exhibits and the details of the process used to arrive at our conclusion of value. The appraisal conforms to the Standards of Professional Practice and Code of Professional Ethics of Appraisal Institute, which incorporates the Uniform Standards of Professional Appraisal Practice (USPAP), of the Appraisal Foundation.
BRIAN MCCARTHY CUSHMAN & WAKEFIELD WESTERN, INC.
SKADDEN, ARPS, SLATE, MEAGHER & FLOM LLP DECEMBER 10, 2010 PAGE 2
MARKET VALUE AS IS
Based on the agreed to Scope of Work, and as outlined in the report, we developed an opinion that the Market Value of the Fee Simple estate of the above property, subject to the assumptions and limiting conditions, certifications, and extraordinary assumptions, if any, and definitions, “As-Is” on December 10, 2010, was:
FIVE MILLION DOLLARS
$5,000,000
The value opinion in this report is qualified by certain assumptions, limiting conditions, certifications, and definitions. We particularly call your attention to the extraordinary assumption(s) listed below.
EXTRAORDINARY ASSUMPTIONS
For a definition of Extraordinary Assumptions please see the Glossary of Terms & Definitions.
The date of value is December 10, 2010 which is subsequent to our November 19, 2010 date of inspection. It is assumed that the condition of the property was the same on December 10, 2010 as it was on the date of our inspection.
This letter is invalid as an opinion of value if detached from the report, which contains the text, exhibits, and Addenda.
Respectfully submitted,
CUSHMAN & WAKEFIELD WESTERN, INC.
Michele Kauffman
Senior Director
CA Certified General Appraiser
License No. AG042324
michele.kauffman@cushwake.com
(213) 955-6495 Office Direct
(213) 627-4044 Fax
James W. Myers, MAI Executive Managing Director CA Certified General Appraiser License No. AG002662 jim.myers@cushwake.com
(213) 955-6493 Office Direct
(213) 627-4044 Fax
THE MONTANA II SITE EXECUTIVE SUMMARY III
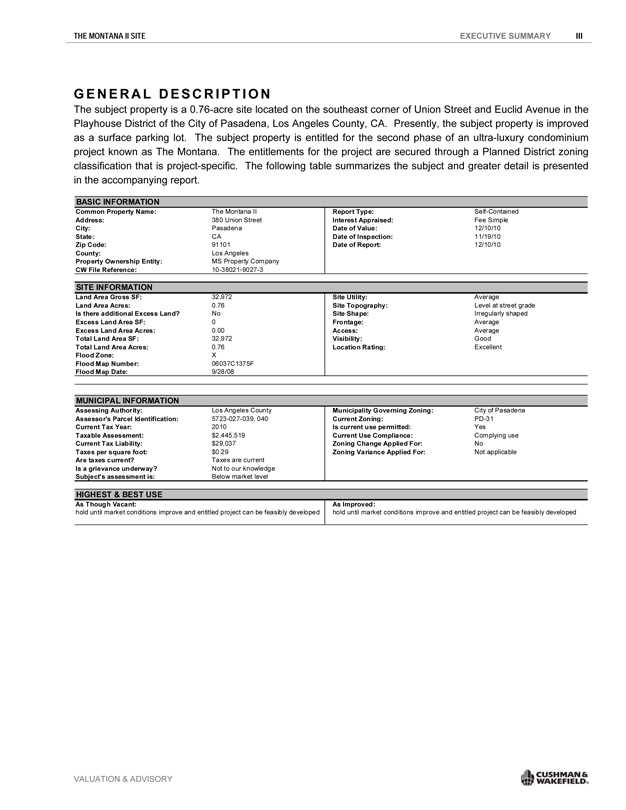
GENERAL DESCRIPTION
The subject property is a 0.76-acre site located on the southeast corner of Union Street and Euclid Avenue in the Playhouse District of the City of Pasadena, Los Angeles County, CA. Presently, the subject property is improved as a surface parking lot. The subject property is entitled for the second phase of an ultra-luxury condominium project known as The Montana. The entitlements for the project are secured through a Planned District zoning classification that is project-specific. The following table summarizes the subject and greater detail is presented in the accompanying report.
BASIC INFORMATION
Common Property Name: The Montana II Report Type: Self-Contained
Address: 380 Union Street Interest Appraised: Fee Simple
City: Pasadena Date of Value: 12/10/10
State: CA Date of Inspection: 11/19/10
Zip Code: 91101 Date of Report: 12/10/10
County: Los Angeles
Property Ownership Entity: MS Property Company
CW File Reference: 10-38021-9027-3
SITE INFORMATION
Land Area Gross SF: Land Area Acres: Is there additional Excess Land? Excess Land Area SF: Excess Land Area Acres: Total Land Area SF: Total Land Area Acres: Flood Zone: Flood Map Number: Flood Map Date: 32,972 0.76 No 0 0.00 32,972 0.76 X 06037C1375F 9/28/08 Site Utility: Site Topography: Site Shape: Frontage: Access: Visibility: Location Rating: Average Level at street grade Irregularly shaped Average Average Good Excellent
MUNICIPAL INFORMATION
Assessing Authority: Assessor’s Parcel Identification: Current Tax Year: Taxable Assessment: Current Tax Liability: Taxes per square foot: Are taxes current? Is a grievance underway? Subject’s assessment is: Los Angeles County 5723-027-039, 040 2010 $2,445,519 $29,037 $0.29 Taxes are current Not to our knowledge Below market level Municipality Governing Zoning: Current Zoning: Is current use permitted: Current Use Compliance: Zoning Change Applied For: Zoning Variance Applied For: City of Pasadena PD-31 Yes Complying use No Not applicable
HIGHEST & BEST USE
As Though Vacant: As Improved:
hold until market conditions improve and entitled project can be feasibly developed hold until market conditions improve and entitled project can be feasibly developed
VALUATION & ADVISORY CUSHMAN & WAKEFIELD®
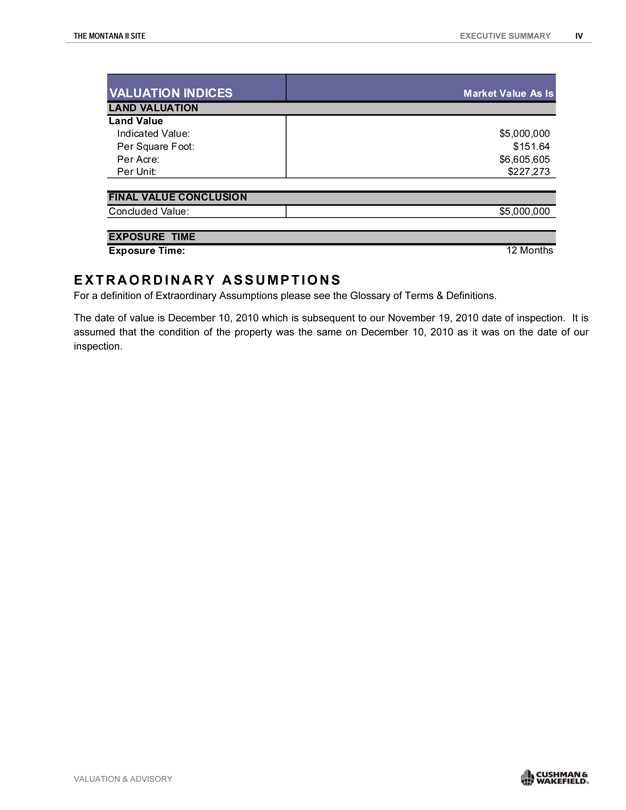
THE MONTANA II SITE EXECUTIVE SUMMARY IV
VALUATION INDICES Market Value As Is
LAND VALUATION
Land Value Indicated Value: Per Square Foot: Per Acre: Per Unit: $5,000,000
$151.64
$6,605,605
$227,273
FINAL VALUE CONCLUSION
Concluded Value: $5,000,000
EXPOSURE TIME
Exposure Time: 12 Months
EXTRAORDINARY ASSUMPTIONS
For a definition of Extraordinary Assumptions please see the Glossary of Terms & Definitions.
The date of value is December 10, 2010 which is subsequent to our November 19, 2010 date of inspection. It is assumed that the condition of the property was the same on December 10, 2010 as it was on the date of our inspection.
VALUATION & ADVISORY CUSHMAN & WAKEFIELD®
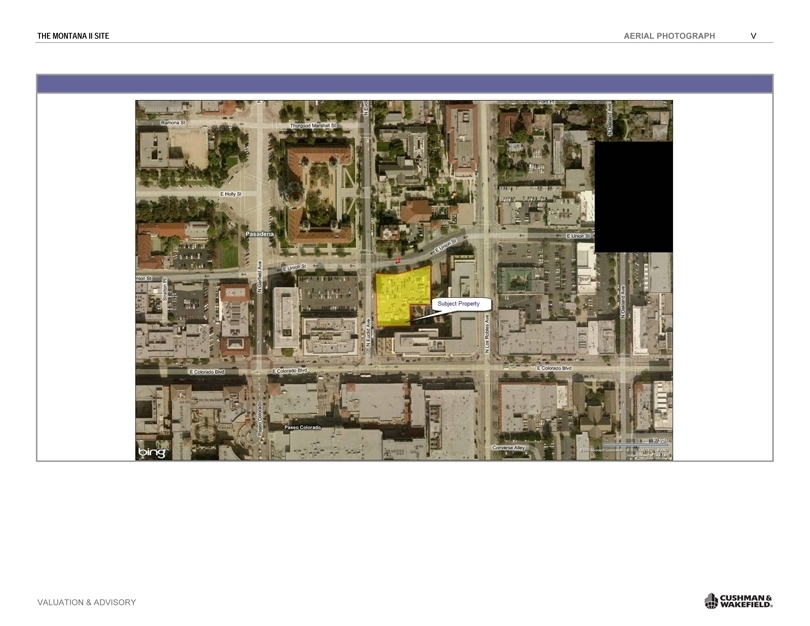 |
THE MONTANA II SITE AERIAL PHOTOGRAPH V
VALUATION & ADVISORY CUSHMAN & WAKEFIELD®
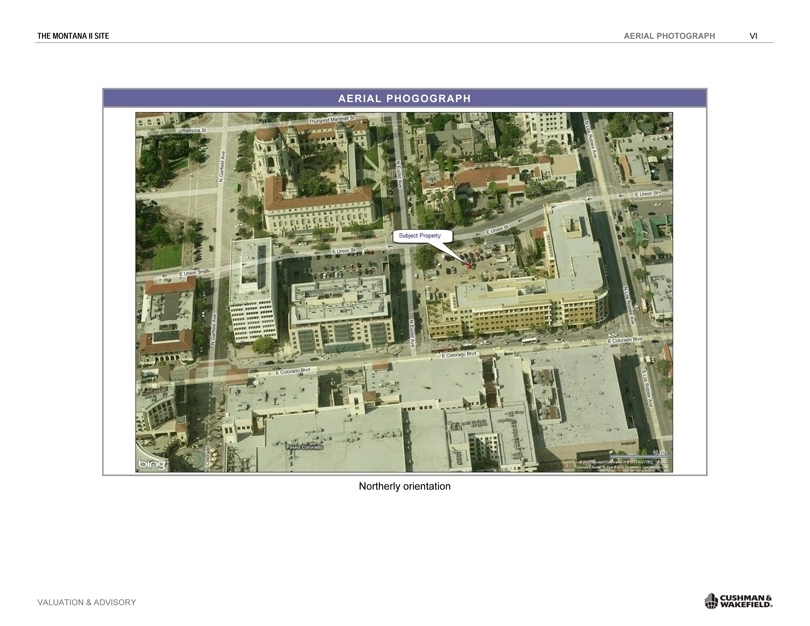 |
THE MONTANA II SITE AERIAL PHOTOGRAPH VI
AERIAL PHOGOGRAPH
Northerly orientation
VALUATION & ADVISORY CUSHMAN & WAKEFIELD®
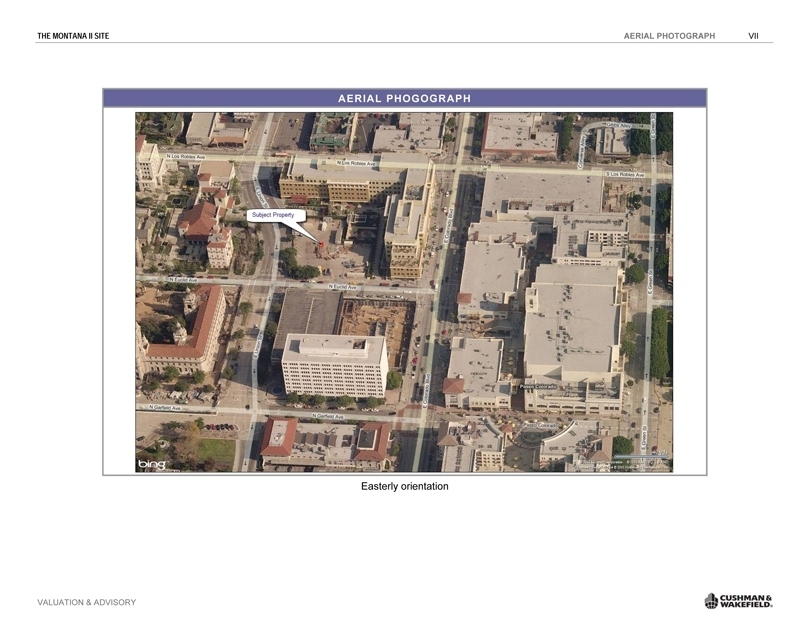 |
THE MONTANA II SITE AERIAL PHOTOGRAPH VII
AERIAL PHOGOGRAPH
Easterly orientation
VALUATION & ADVISORY CUSHMAN & WAKEFIELD®
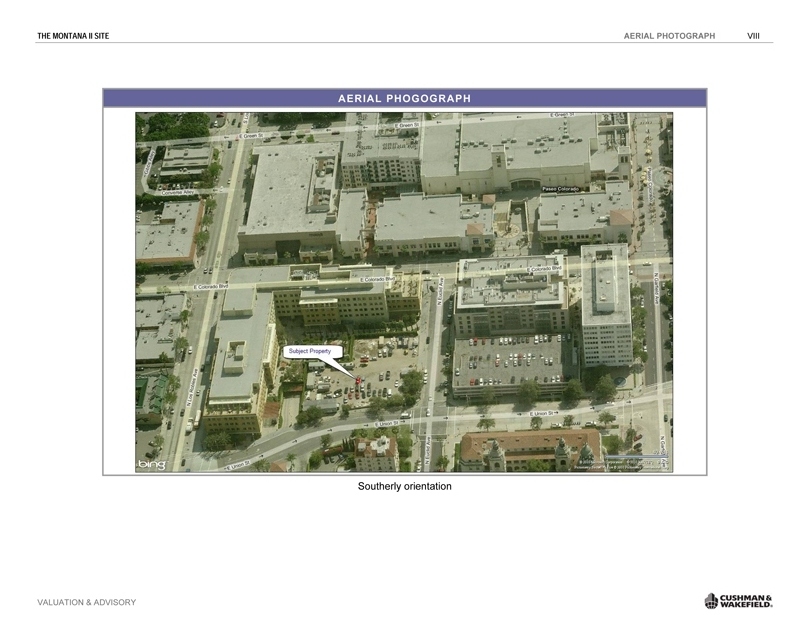 |
THE MONTANA II SITE AERIAL PHOTOGRAPH VIII
AERIAL PHOGOGRAPH
Southerly orientation
VALUATION & ADVISORY CUSHMAN & WAKEFIELD®
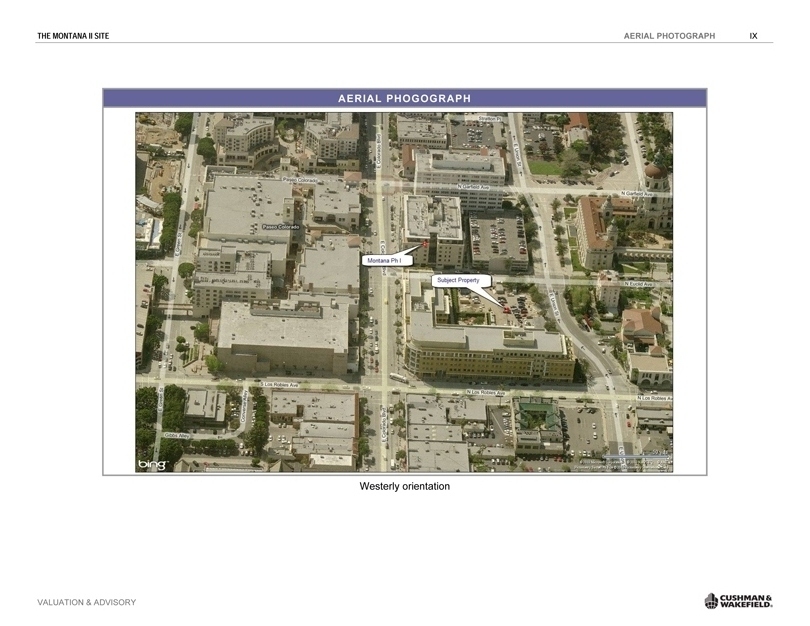 |
THE MONTANA II SITE AERIAL PHOTOGRAPH IX
AERIAL PHOGOGRAPH
Westerly orientation
VALUATION & ADVISORY CUSHMAN & WAKEFIELD®
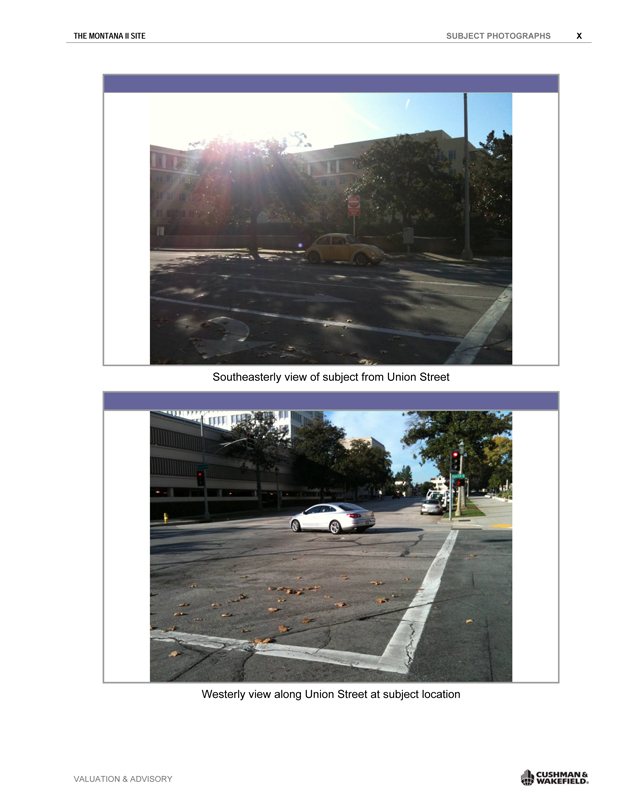
THE MONTANA II SITE SUBJECT PHOTOGRAPHS X
Southeasterly view of subject from Union Street
Westerly view along Union Street at subject location
VALUATION & ADVISORY CUSHMAN & WAKEFIELD®
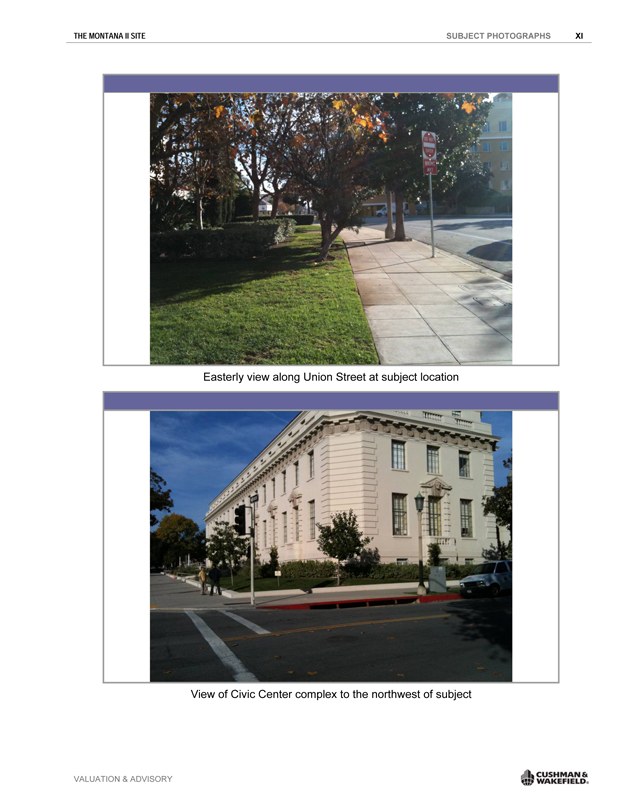
THE MONTANA II SITE SUBJECT PHOTOGRAPHS XI
Easterly view along Union Street at subject location
View of Civic Center complex to the northwest of subject
VALUATION & ADVISORY CUSHMAN & WAKEFIELD®
THE MONTANA II SITE TABLE OF CONTENTS
TABLE OF CONTENTS
INTRODUCTION 1
REGIONAL MAP 4
LOS ANGELES REGIONAL ANALYSIS 5
LOCAL AREA MAP 16
LOCAL AREA ANALYSIS17
SITE DESCRIPTION 26
REAL PROPERTY TAXES AND ASSESSMENTS 29
ZONING30
HIGHEST AND BEST USE 32
VALUATION PROCESS 33
LAND VALUATION 34
RECONCILIATION AND FINAL VALUE OPINION 41
ASSUMPTIONS AND LIMITING CONDITIONS 42
CERTIFICATION OF APPRAISAL 44
GLOSSARY OF TERMS & DEFINITIONS 45
ADDENDA CONTENTS 48
VALUATION & ADVISORY CUSHMAN & WAKEFIELD®
THE MONTANA II SITE INTRODUCTION 1
INTRODUCTION
SCOPE OF WORK
This appraisal, presented in a self-contained report, is intended to comply with the reporting requirements outlined under the USPAP for a self-contained appraisal report. The report was also prepared to comply with the requirements of the Code of Professional Ethics of the Appraisal Institute.
Cushman & Wakefield Western, Inc. has an internal Quality Control Oversight Program. This Program mandates a “second read” of all appraisals. Assignments prepared and signed solely by designated members (MAIs) are read by another MAI who is not participating in the assignment. Assignments prepared, in whole or in part, by non-designated appraisers require MAI participation, Quality Control Oversight, and signature.
For this assignment, Quality Control Oversight was provided by James W. Myers, MAI. In addition to a qualitative assessment of the appraisal report, James W. Myers, MAI is a signatory to the appraisal report and concurs in the value estimate(s) set forth herein.
The scope of this appraisal required collecting primary and secondary data relevant to the subject property. Vacant land and improved sales were researched in the subject’s market, rental data was analyzed, and the input of buyers, sellers, brokers, property developers and public officials was considered. A physical inspection of the property was made. In addition, the general regional economy as well as the specifics of the subject’s local area was investigated.
The data have been thoroughly analyzed and confirmed with sources believed to be reliable, leading to the value conclusions in this report. The valuation process used generally accepted market-derived methods and procedures appropriate to the assignment.
This appraisal employs only the Sales Comparison Approach. Based on our analysis and knowledge of the subject property type and relevant investor profiles, it is our opinion that this approach would be considered necessary and applicable for market participants. Typical purchasers for a property like the subject, which has entitlements in place for a luxury residential condominium development, will also employ a developmental approach in order to estimate land value. However, market conditions for luxury condominiums do not support development of the proposed project entitled for the subject, and the developmental approach would not result in market-based land value indication at the present time. The Cost Approach is not relevant for estimating land value. Therefore, we have only employed the Sales Comparison Approach in our analysis.
VALUATION & ADVISORY CUSHMAN & WAKEFIELD®
THE MONTANA II SITE INTRODUCTION 2
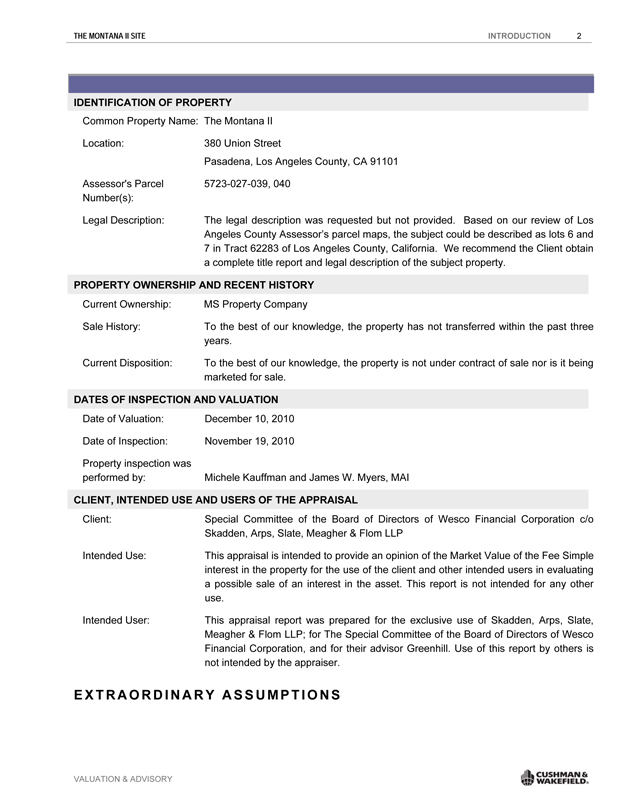
IDENTIFICATION OF PROPERTY
Common Property Name: The Montana II
Location: 380 Union Street
Pasadena, Los Angeles County, CA 91101
Assessor’s Parcel Number(s): 5723-027-039, 040
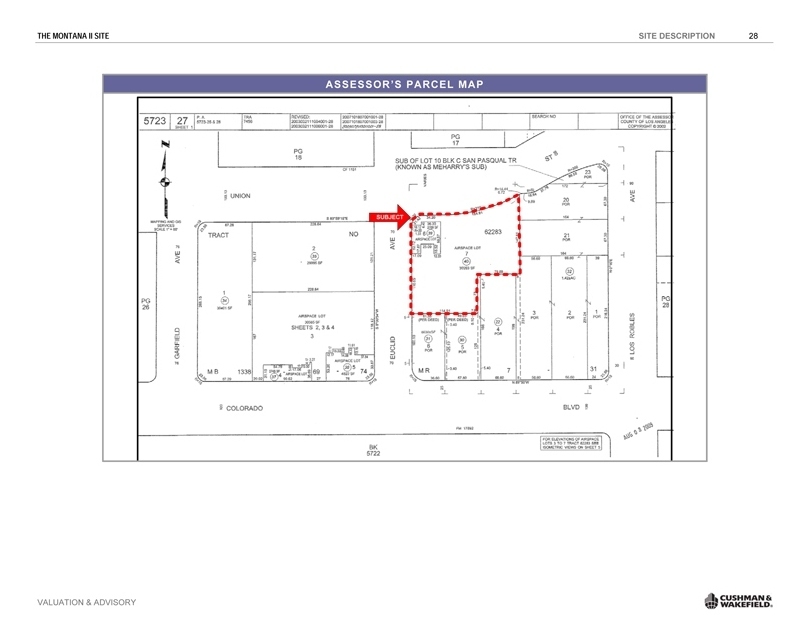
Legal Description: The legal description was requested but not provided. Based on our review of Los Angeles County Assessor’s parcel maps, the subject could be described as lots 6 and 7 in Tract 62283 of Los Angeles County, California. We recommend the Client obtain a complete title report and legal description of the subject property.
PROPERTY OWNERSHIP AND RECENT HISTORY
Current Ownership: MS Property Company
Sale History: To the best of our knowledge, the property has not transferred within the past three years.
Current Disposition: To the best of our knowledge, the property is not under contract of sale nor is it being marketed for sale.
DATES OF INSPECTION AND VALUATION
Date of Valuation: December 10, 2010
Date of Inspection: November 19, 2010
Property inspection was
performed by: Michele Kauffman and James W. Myers, MAI
CLIENT, INTENDED USE AND USERS OF THE APPRAISAL
Client: Special Committee of the Board of Directors of Wesco Financial Corporation c/o Skadden, Arps, Slate, Meagher & Flom LLP
Intended Use: This appraisal is intended to provide an opinion of the Market Value of the Fee Simple interest in the property for the use of the client and other intended users in evaluating a possible sale of an interest in the asset. This report is not intended for any other
use.
Intended User: This appraisal report was prepared for the exclusive use of Skadden, Arps, Slate, Meagher & Flom LLP; for The Special Committee of the Board of Directors of Wesco Financial Corporation, and for their advisor Greenhill. Use of this report by others is not intended by the appraiser.
EXTRAORDINARY ASSUMPTIONS
VALUATION & ADVISORY CUSHMAN & WAKEFIELD®

THE MONTANA II SITE INTRODUCTION 3
The date of value is December 10, 2010 which is subsequent to our November 19, 2010 date of inspection. It is assumed that the condition of the property was the same on December 10, 2010 as it was on the date of our inspection.
VALUATION & ADVISORY CUSHMAN & WAKEFIELD®
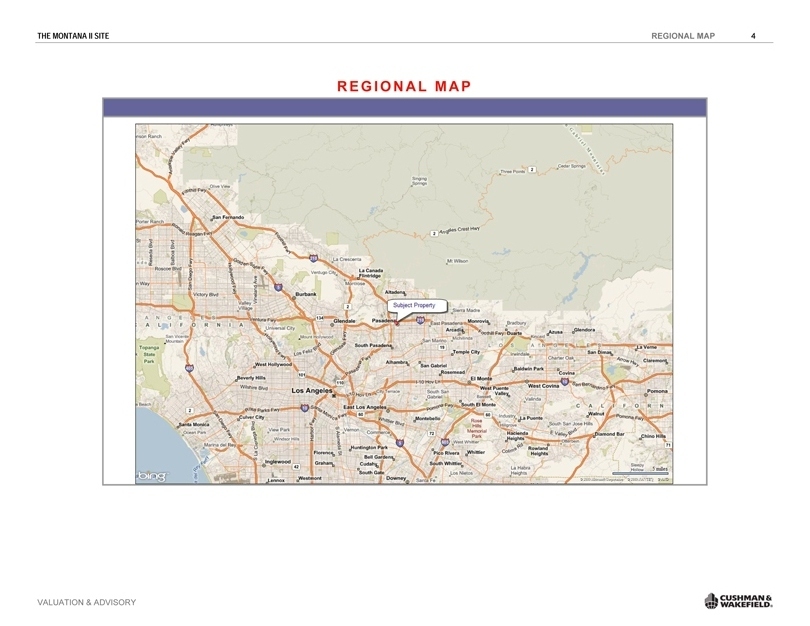 |
THE MONTANA II SITE REGIONAL MAP 4
REGIONAL MAP
VALUATION & ADVISORY CUSHMAN & WAKEFIELD®
THE MONTANA II SITE REGIONAL ANALYSIS 5
LOS ANGELES REGIONAL ANALYSIS
INTRODUCTION
MARKET DEFINITION
Los Angeles County ranks 18th on the list of the world’s largest economies and is the largest county in the nation in terms of population, totaling an estimated 9.9 million residents, or about 27.0 percent of the State of California’s population. The majority of Los Angeles County is heavily urbanized averaging roughly 2,450 residents per square mile. Geographically, the county encompasses 4,061 square miles with 70 miles of coast on the Pacific Ocean. Neighboring regions include Orange County to the south, San Bernardino County to the east, Ventura County to the west and Kern County to the north.
The Los Angeles-Long Beach-Santa Ana Metropolitan Statistical Area (Los Angeles-Long Beach-Santa Ana MSA) in Southern California is the largest of the three MSAs that comprise the Los Angeles Combined Statistical Area (Los Angeles CSA), which also includes the Riverside-San Bernardino-Ontario and Oxnard-Thousand Oaks-Ventura Metropolitan Statistical Areas. The Los Angeles-Long Beach-Santa Ana MSA is further divided into two metropolitan divisions—Los Angeles-Long Beach-Glendale and Santa Ana-Anaheim-Irvine. The Los Angeles-Long Beach-Glendale Metropolitan Division (Los Angeles MD), which is the focus of the following demographic and economic overview, is synonymous with Los Angeles County. The City of Los Angeles is the largest incorporated area in the county.
Some key points to consider are:
. International trade and commerce are major drivers of the area’s economy because of its strategic location and the size and scope of its economy. The Los Angeles Customs District – which includes the ports of Long Beach and Los Angeles, Port Hueneme, and Los Angeles International Airport – is the nation’s largest.
. The Los Angeles region has an extensive transportation network. Adding to the infrastructural strength of the ports and LAX airport, there are two other active commercial airports – Bob Hope in Burbank and Long Beach. Due to the size of its geographic footprint, Los Angeles freeway system is one of the most advanced in the country. In addition, there are mass transit options to service the public need and rail freight services linking the region to the rest of the state and the nation.
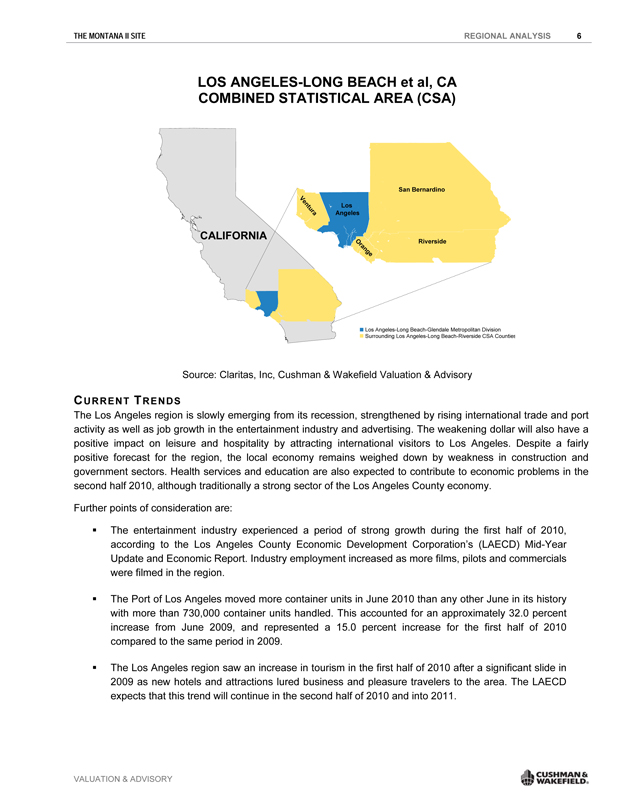
The map on the following page depicts Los Angeles County in relation to the adjacent Orange County and Inland Empire regions:
VALUATION & ADVISORY CUSHMAN & WAKEFIELD®
THE MONTANA II SITE REGIONAL ANALYSIS 6
LOS ANGELES-LONG BEACH et al, CACOMBINED STATISTICAL AREA (CSA)
CALIFORNIA
San San Bernardino Bernardino
Los Los Angeles Angeles
Ventura
Los Angeles-Long Beach-Glendale Metropolitan Division Surrounding Los Angeles-Long Beach-Riverside CSA Counties
Source: Claritas, Inc, Cushman & Wakefield Valuation & Advisory
CURRENT TRENDS
The Los Angeles region is slowly emerging from its recession, strengthened by rising international trade and port activity as well as job growth in the entertainment industry and advertising. The weakening dollar will also have a positive impact on leisure and hospitality by attracting international visitors to Los Angeles. Despite a fairly positive forecast for the region, the local economy remains weighed down by weakness in construction and government sectors. Health services and education are also expected to contribute to economic problems in the second half 2010, although traditionally a strong sector of the Los Angeles County economy.
Further points of consideration are:
. The entertainment industry experienced a period of strong growth during the first half of 2010, according to the Los Angeles County Economic Development Corporation’s (LAECD) Mid-Year Update and Economic Report. Industry employment increased as more films, pilots and commercials were filmed in the region.
. The Port of Los Angeles moved more container units in June 2010 than any other June in its history with more than 730,000 container units handled. This accounted for an approximately 32.0 percent increase from June 2009, and represented a 15.0 percent increase for the first half of 2010 compared to the same period in 2009.
. The Los Angeles region saw an increase in tourism in the first half of 2010 after a significant slide in 2009 as new hotels and attractions lured business and pleasure travelers to the area. The LAECD expects that this trend will continue in the second half of 2010 and into 2011.
VALUATION & ADVISORY CUSHMAN & WAKEFIELD®
THE MONTANA II SITE REGIONAL ANALYSIS 7
DEMOGRAPHIC TRENDS
DEMOGRAPHICS CHARACTERISTICS
Los Angeles’ median age is relatively young at 34.9 years, considerably lower than the median age of the U.S. at
36.8 years. The percentage of the population in Los Angeles with bachelor and advanced degrees is 24.4 percent, which is slightly below the U.S. share of 24.7 percent. Despite similarities in their respective education breakdowns, however, the Los Angeles region exceeds the national levels for average and median household income. Additionally, 23.4 percent of regional households have annual incomes of $100,000 or more compared to the national level of 19.3 percent.
Some interesting points to consider regarding the similarities and differences in demographic trends between Los Angeles and the U.S. include:
. There is a demand in the Los Angeles region for a large population of workers with highly developed skill sets in sectors like finance, education, and information technology that require postsecondary degrees. Firms in those sectors are forced to pay employees more for the same type of work in this region than in other regions of the country due to the higher cost of living in the Los Angeles region.
. The variance in the national and regional levels of education suggests that there is still a demand for large population of workers with highly developed skill sets in sectors like transportation, manufacturing and construction in Los Angeles County that do not require a postsecondary degree.
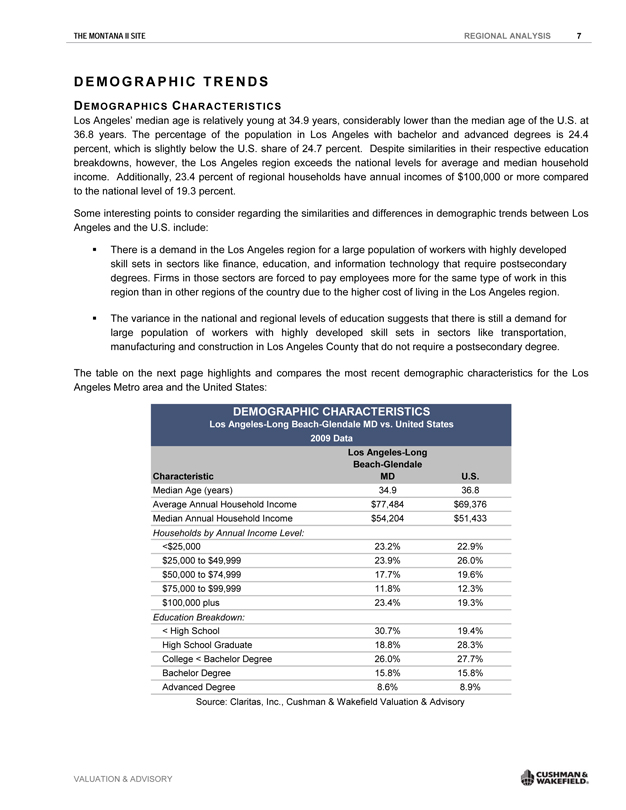
The table on the next page highlights and compares the most recent demographic characteristics for the Los Angeles Metro area and the United States:
DEMOGRAPHIC CHARACTERISTICS
Los Angeles-Long Beach-Glendale MD vs. United States
2009 Data
Los Angeles-Long
Beach-Glendale
Characteristic MD U.S.
Median Age (years) 34.9 36.8
Average Annual Household Income $77,484 $69,376
Median Annual Household Income $54,204 $51,433
Households by Annual Income Level:
<$25,000 23.2% 22.9%
$25,000 to $49,999 23.9% 26.0%
$50,000 to $74,999 17.7% 19.6%
$75,000 to $99,999 11.8% 12.3%
$100,000 plus 23.4% 19.3%
Education Breakdown:
< High School 30.7% 19.4%
High School Graduate 18.8% 28.3%
College < Bachelor Degree 26.0% 27.7%
Bachelor Degree 15.8% 15.8%
Advanced Degree 8.6% 8.9%
Source: Claritas, Inc., Cushman & Wakefield Valuation & Advisory
VALUATION & ADVISORY CUSHMAN & WAKEFIELD®
THE MONTANA II SITE REGIONAL ANALYSIS 8
POPULATION
Population growth for the greater Los Angeles region historically outpaced that of the national average as the favorable climate and a diverse economy make Southern California a prime location for individuals, families, and businesses. During the most recent period of economic expansion from 2002 to mid-2007, however, skyrocketing home values and the high cost of living deterred, to some degree, existing and prospective low- to middle-income residents from the region, thus weakening population growth.
Notable points include:
. The Los Angeles region’s annual population growth averaged only 0.4 percent between 2005 and 2009, compared to the 1.0 percent average rate of growth for the nation.
. Los Angeles County’s population is expected to grow, on average, at 1.0 percent annually, matching the nation’s projected average growth rate between 2010 and 2014 as the region’s economy begins to grow and recover from the residual effects of the recession.
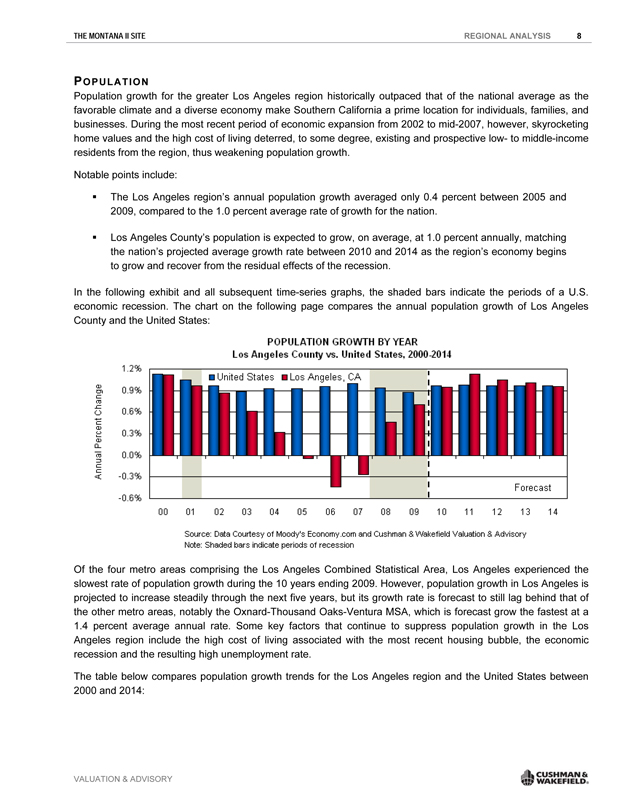
In the following exhibit and all subsequent time-series graphs, the shaded bars indicate the periods of a U.S. economic recession. The chart on the following page compares the annual population growth of Los Angeles County and the United States:
POPULATION GROWTH BY YEAR
Los Angeles County vs. United States, 2000-2014
Annual Percent Change
1.2% 0.9% 0.6% 0.3% 0.0% -0.3% -0.6%
United States
Los Angeles, CA
00 01 02 03 04 05 06 04 08 09 10 11 12 13 14
Forecast
Source: Data Courtesy of Moody’s Economy.com and Cushman & Wakefield Valuation & Advisory
Note: Shaded bars indicate periods of recession
Of the four metro areas comprising the Los Angeles Combined Statistical Area, Los Angeles experienced the slowest rate of population growth during the 10 years ending 2009. However, population growth in Los Angeles is projected to increase steadily through the next five years, but its growth rate is forecast to still lag behind that of the other metro areas, notably the Oxnard-Thousand Oaks-Ventura MSA, which is forecast grow the fastest at a
1.4 percent average annual rate. Some key factors that continue to suppress population growth in the Los Angeles region include the high cost of living associated with the most recent housing bubble, the economic recession and the resulting high unemployment rate.
The table below compares population growth trends for the Los Angeles region and the United States between 2000 and 2014:
VALUATION & ADVISORY CUSHMAN & WAKEFIELD®
THE MONTANA II SITE REGIONAL ANALYSIS 9
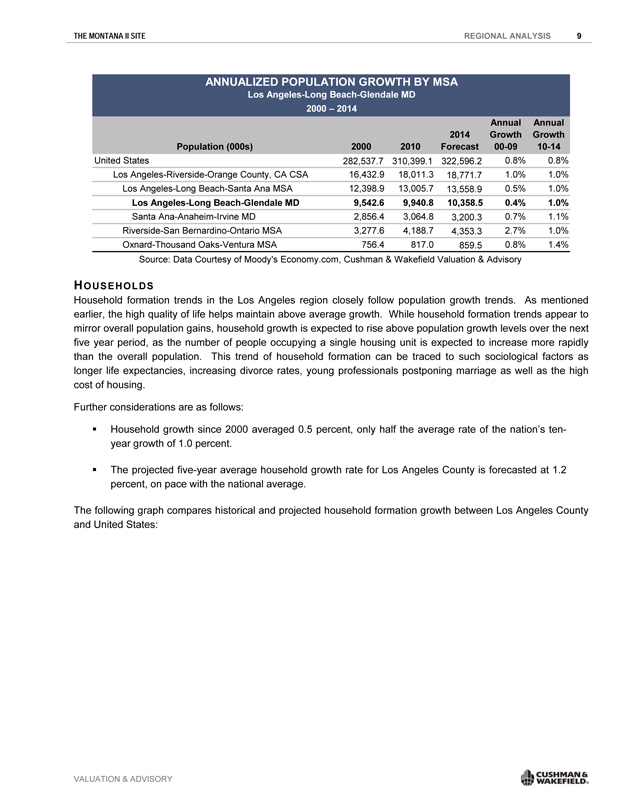
ANNUALIZED POPULATION GROWTH BY MSA
Los Angeles- Long Beach-Glendale MD
2000 – 2014
Annual Annual
2014 Growth Growth
Population (000s) 2000 2010 Forecast 00-09 10-14
United States 282,537.7 310,399.1 322,596.2 0.8% 0.8%
Los Angeles-Riverside-Orange County, CA CSA 16,432.9 18,011.3 18,771.7 1.0% 1.0%
Los Angeles-Long Beach-Santa Ana MSA 12,398.9 13,005.7 13,558.9 0.5% 1.0%
Los Angeles-Long Beach-Glendale MD 9,542.6 9,940.8 10,358.5 0.4% 1.0%
Santa Ana-Anaheim-Irvine MD 2,856.4 3,064.8 3,200.3 0.7% 1.1%
Riverside-San Bernardino-Ontario MSA 3,277.6 4,188.7 4,353.3 2.7% 1.0%
Oxnard-Thousand Oaks-Ventura MSA 756.4 817.0 859.5 0.8% 1.4%
Source: Data Courtesy of Moody’s Economy.com, Cushman & Wakefield Valuation & Advisory
HOUSEHOLDS
Household formation trends in the Los Angeles region closely follow population growth trends. As mentioned earlier, the high quality of life helps maintain above average growth. While household formation trends appear to mirror overall population gains, household growth is expected to rise above population growth levels over the next five year period, as the number of people occupying a single housing unit is expected to increase more rapidly than the overall population. This trend of household formation can be traced to such sociological factors as longer life expectancies, increasing divorce rates, young professionals postponing marriage as well as the high cost of housing.
Further considerations are as follows:
. Household growth since 2000 averaged 0.5 percent, only half the average rate of the nation’s ten-
year growth of 1.0 percent.
. The projected five-year average household growth rate for Los Angeles County is forecasted at 1.2
percent, on pace with the national average.
The following graph compares historical and projected household formation growth between Los Angeles County and United States:
VALUATION & ADVISORY CUSHMAN & WAKEFIELD®
THE MONTANA II SITE REGIONAL ANALYSIS 10
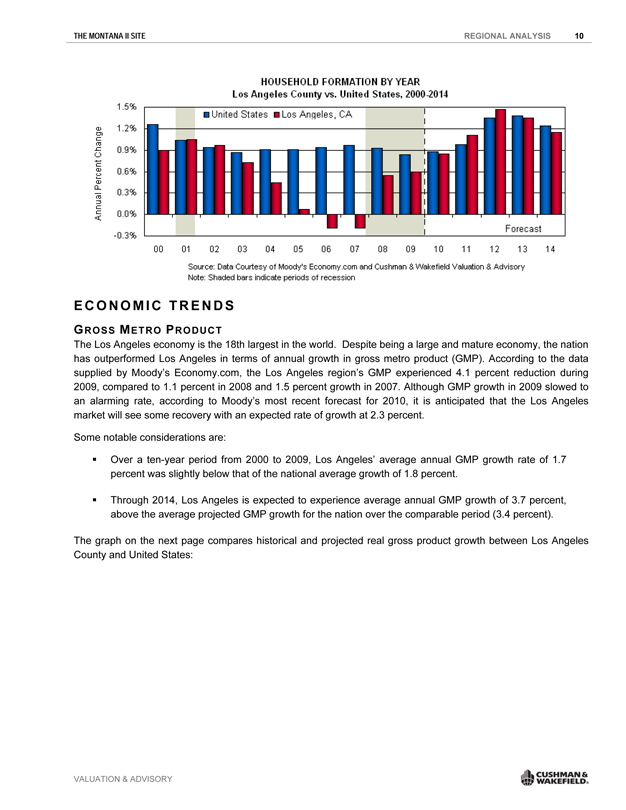
HOUSEHOLD FORMATION BY YEAR
Los Angeles County vs. United States, 2000-2014
Annual Percent Change
1.5% 1.2% 0.9% 0.6% 0.3% 0.0% -0.3%
United States
Los Angeles, CA
00 01 02 03 04 05 06 04 08 09 10 11 12 13 14
Forecast
Source: Data Courtesy of Moody’s Economy.com and Cushman & Wakefield Valuation & Advisory
Note: Shaded bars indicate periods of recession
ECONOMIC TRENDS
GROSS METRO PRODUCT
The Los Angeles economy is the 18th largest in the world. Despite being a large and mature economy, the nation has outperformed Los Angeles in terms of annual growth in gross metro product (GMP). According to the data supplied by Moody’s Economy.com, the Los Angeles region’s GMP experienced 4.1 percent reduction during 2009, compared to 1.1 percent in 2008 and 1.5 percent growth in 2007. Although GMP growth in 2009 slowed to an alarming rate, according to Moody’s most recent forecast for 2010, it is anticipated that the Los Angeles market will see some recovery with an expected rate of growth at 2.3 percent.
Some notable considerations are:
. Over a ten-year period from 2000 to 2009, Los Angeles’ average annual GMP growth rate of 1.7 percent was slightly below that of the national average growth of 1.8 percent.
. Through 2014, Los Angeles is expected to experience average annual GMP growth of 3.7 percent, above the average projected GMP growth for the nation over the comparable period (3.4 percent).
The graph on the next page compares historical and projected real gross product growth between Los Angeles County and United States:
VALUATION & ADVISORY CUSHMAN & WAKEFIELD®
THE MONTANA II SITE REGIONAL ANALYSIS 11
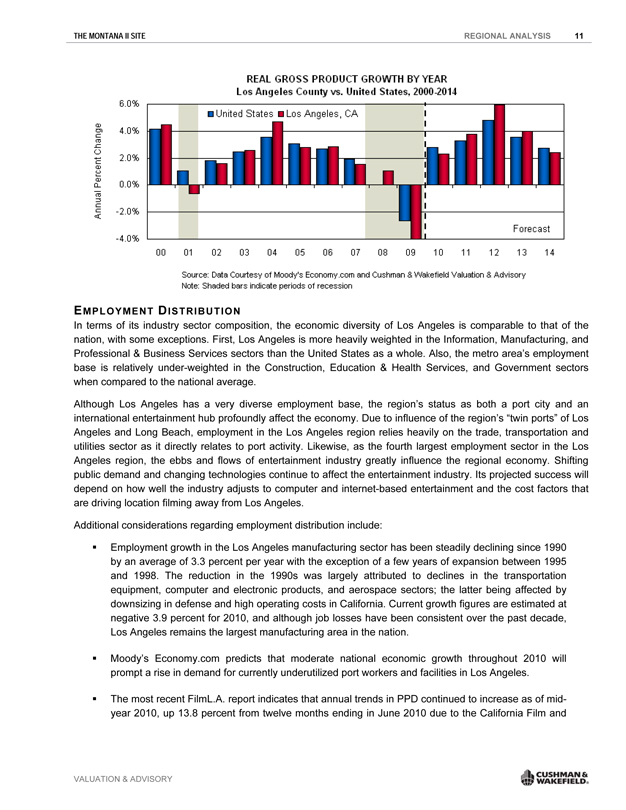
REAL GROSS PRODUCT GROWTH BY YEAR
Los Angeles County vs. United States, 2000-2014
Annual Percent Change
6.0% 4.0% 2.0% 0.0% -2.0% -4.0%
United States
Los Angeles, CA
00 01 02 03 04 05 06 04 08 09 10 11 12 13 14
Forecast
Source: Data Courtesy of Moody’s Economy.com and Cushman & Wakefield Valuation & Advisory
Note: Shaded bars indicate periods of recession
EMPLOYMENT DISTRIBUTION
In terms of its industry sector composition, the economic diversity of Los Angeles is comparable to that of the nation, with some exceptions. First, Los Angeles is more heavily weighted in the Information, Manufacturing, and Professional & Business Services sectors than the United States as a whole. Also, the metro area’s employment base is relatively under-weighted in the Construction, Education & Health Services, and Government sectors when compared to the national average.
Although Los Angeles has a very diverse employment base, the region’s status as both a port city and an international entertainment hub profoundly affect the economy. Due to influence of the region’s “twin ports” of Los Angeles and Long Beach, employment in the Los Angeles region relies heavily on the trade, transportation and utilities sector as it directly relates to port activity. Likewise, as the fourth largest employment sector in the Los Angeles region, the ebbs and flows of entertainment industry greatly influence the regional economy. Shifting public demand and changing technologies continue to affect the entertainment industry. Its projected success will depend on how well the industry adjusts to computer and internet-based entertainment and the cost factors that are driving location filming away from Los Angeles.
Additional considerations regarding employment distribution include:
. Employment growth in the Los Angeles manufacturing sector has been steadily declining since 1990 by an average of 3.3 percent per year with the exception of a few years of expansion between 1995 and 1998. The reduction in the 1990s was largely attributed to declines in the transportation equipment, computer and electronic products, and aerospace sectors; the latter being affected by downsizing in defense and high operating costs in California. Current growth figures are estimated at negative 3.9 percent for 2010, and although job losses have been consistent over the past decade, Los Angeles remains the largest manufacturing area in the nation.
. Moody’s Economy.com predicts that moderate national economic growth throughout 2010 will prompt a rise in demand for currently underutilized port workers and facilities in Los Angeles.
. The most recent FilmL.A. report indicates that annual trends in PPD continued to increase as of mid-year 2010, up 13.8 percent from twelve months ending in June 2010 due to the California Film and
VALUATION & ADVISORY CUSHMAN & WAKEFIELD®
THE MONTANA II SITE REGIONAL ANALYSIS 12
Television Tax Credit administered by the California Film Commission. Increases in filming led to the hiring of 21,600 employees in the motion picture and sound recording sector in June 2010.
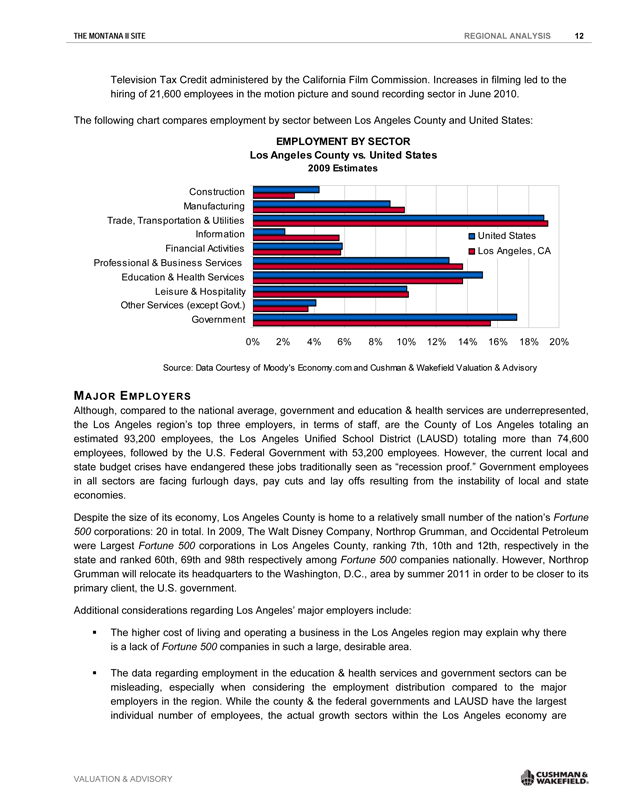
The following chart compares employment by sector between Los Angeles County and United States:
EMPLOYMENT BY SECTOR Los Angeles County vs. United States 2009 Estimates
Construction
Manufacturing
Trade, Transportation & Utilities
Information
Financial Activities
Professional & Business Services
Education & Health Services
Leisure & Hospitality
Other Services (except Govt.)
Government
United States Los Angeles, CA
0% 2% 4% 6% 8% 10% 12% 14% 16% 18% 20%
Source: Data Courtesy of Moody’s Economy.com and Cushman & Wakefield Valuation & Advisory
MAJOR EMPLOYERS
Although, compared to the national average, government and education & health services are underrepresented, the Los Angeles region’s top three employers, in terms of staff, are the County of Los Angeles totaling an estimated 93,200 employees, the Los Angeles Unified School District (LAUSD) totaling more than 74,600 employees, followed by the U.S. Federal Government with 53,200 employees. However, the current local and state budget crises have endangered these jobs traditionally seen as “recession proof.” Government employees in all sectors are facing furlough days, pay cuts and lay offs resulting from the instability of local and state economies.
Despite the size of its economy, Los Angeles County is home to a relatively small number of the nation’s Fortune 500 corporations: 20 in total. In 2009, The Walt Disney Company, Northrop Grumman, and Occidental Petroleum were Largest Fortune 500 corporations in Los Angeles County, ranking 7th, 10th and 12th, respectively in the state and ranked 60th, 69th and 98th respectively among Fortune 500 companies nationally. However, Northrop Grumman will relocate its headquarters to the Washington, D.C., area by summer 2011 in order to be closer to its primary client, the U.S. government.
Additional considerations regarding Los Angeles’ major employers include:
. The higher cost of living and operating a business in the Los Angeles region may explain why there is a lack of Fortune 500 companies in such a large, desirable area.
. The data regarding employment in the education & health services and government sectors can be misleading, especially when considering the employment distribution compared to the major employers in the region. While the county & the federal governments and LAUSD have the largest individual number of employees, the actual growth sectors within the Los Angeles economy are
VALUATION & ADVISORY CUSHMAN & WAKEFIELD®
THE MONTANA II SITE REGIONAL ANALYSIS 13
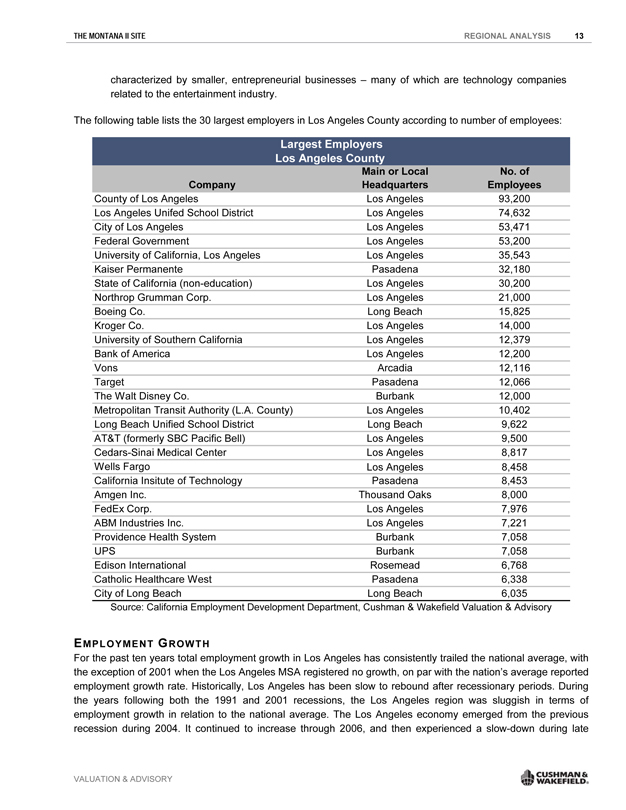
characterized by smaller, entrepreneurial businesses – many of which are technology companies related to the entertainment industry.
The following table lists the 30 largest employers in Los Angeles County according to number of employees:
Largest Employers Los Angeles County
Main or Local No. of
Company Headquarters Employees
County of Los Angeles Los Angeles 93,200
Los Angeles Unifed School District Los Angeles 74,632
City of Los Angeles Los Angeles 53,471
Federal Government Los Angeles 53,200
University of California, Los Angeles Los Angeles 35,543
Kaiser Permanente Pasadena 32,180
State of California (non-education) Los Angeles 30,200
Northrop Grumman Corp. Los Angeles 21,000
Boeing Co. Long Beach 15,825
Kroger Co. Los Angeles 14,000
University of Southern California Los Angeles 12,379
Bank of America Los Angeles 12,200
Vons Arcadia 12,116
Target Pasadena 12,066
The Walt Disney Co. Burbank 12,000
Metropolitan Transit Authority (L.A. County) Los Angeles 10,402
Long Beach Unified School District Long Beach 9,622
AT&T (formerly SBC Pacific Bell) Los Angeles 9,500
Cedars-Sinai Medical Center Los Angeles 8,817
Wells Fargo Los Angeles 8,458
California Insitute of Technology Pasadena 8,453
Amgen Inc. Thousand Oaks 8,000
FedEx Corp. Los Angeles 7,976
ABM Industries Inc. Los Angeles 7,221
Providence Health System Burbank 7,058
UPS Burbank 7,058
Edison International Rosemead 6,768
Catholic Healthcare West Pasadena 6,338
City of Long Beach Long Beach 6,035
Source: California Employment Development Department, Cushman & Wakefield Valuation & Advisory
EMPLOYMENT GROWTH
For the past ten years total employment growth in Los Angeles has consistently trailed the national average, with the exception of 2001 when the Los Angeles MSA registered no growth, on par with the nation’s average reported employment growth rate. Historically, Los Angeles has been slow to rebound after recessionary periods. During the years following both the 1991 and 2001 recessions, the Los Angeles region was sluggish in terms of employment growth in relation to the national average. The Los Angeles economy emerged from the previous recession during 2004. It continued to increase through 2006, and then experienced a slow-down during late
VALUATION & ADVISORY CUSHMAN & WAKEFIELD®
THE MONTANA II SITE REGIONAL ANALYSIS 14
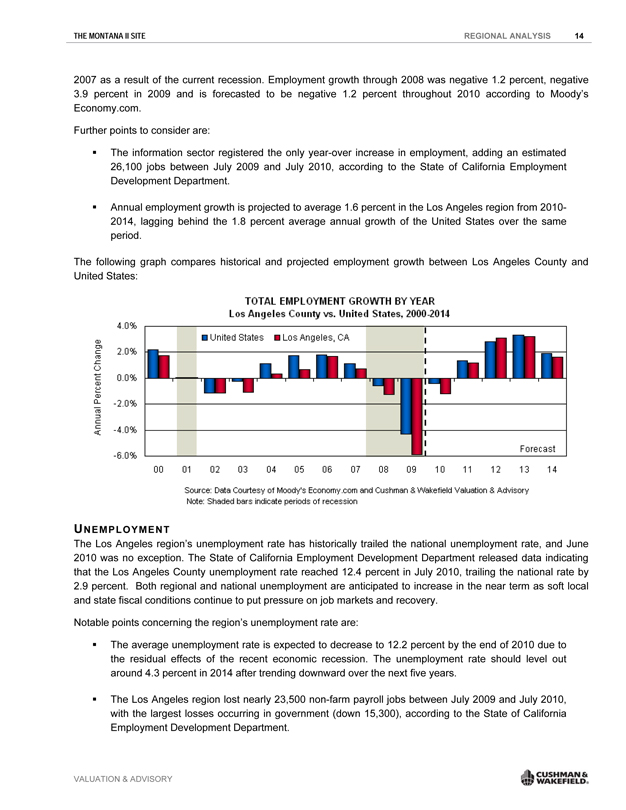
2007 as a result of the current recession. Employment growth through 2008 was negative 1.2 percent, negative
3.9 percent in 2009 and is forecasted to be negative 1.2 percent throughout 2010 according to Moody’s Economy.com.
Further points to consider are:
. The information sector registered the only year-over increase in employment, adding an estimated 26,100 jobs between July 2009 and July 2010, according to the State of California Employment Development Department.
. Annual employment growth is projected to average 1.6 percent in the Los Angeles region from 2010-2014, lagging behind the 1.8 percent average annual growth of the United States over the same period.
The following graph compares historical and projected employment growth between Los Angeles County and United States:
TOTAL EXPLOYMENT GROWTH BY YEAR
Los Angeles County vs. United States, 2000-2014
Annual Percent Change
4.0% 2.0% 0.0% -2.0% -4.0% -6.0%
United States
Los Angeles, CA
00 01 02 03 04 05 06 04 08 09 10 11 12 13 14
Forecast
Source: Data Courtesy of Moody’s Economy.com and Cushman & Wakefield Valuation & Advisory
Note: Shaded bars indicate periods of recession
UNEMPLOYMENT
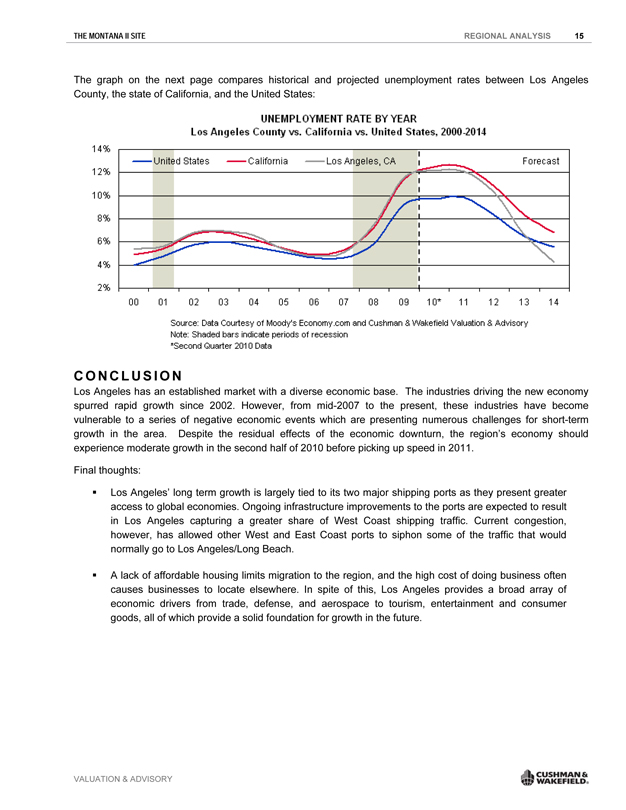
The Los Angeles region’s unemployment rate has historically trailed the national unemployment rate, and June 2010 was no exception. The State of California Employment Development Department released data indicating that the Los Angeles County unemployment rate reached 12.4 percent in July 2010, trailing the national rate by
2.9 percent. Both regional and national unemployment are anticipated to increase in the near term as soft local and state fiscal conditions continue to put pressure on job markets and recovery.
Notable points concerning the region’s unemployment rate are:
. The average unemployment rate is expected to decrease to 12.2 percent by the end of 2010 due to the residual effects of the recent economic recession. The unemployment rate should level out around 4.3 percent in 2014 after trending downward over the next five years.
. The Los Angeles region lost nearly 23,500 non-farm payroll jobs between July 2009 and July 2010, with the largest losses occurring in government (down 15,300), according to the State of California Employment Development Department.
VALUATION & ADVISORY CUSHMAN & WAKEFIELD®
THE MONTANA II SITE REGIONAL ANALYSIS 15
The graph on the next page compares historical and projected unemployment rates between Los Angeles County, the state of California, and the United States:
UNEMPLOYMENT RATE BY YEAR
Los Angeles County vs. California vs. United States, 2000-2014
14% 12% 10% 8% 6% 4% 2%
United States
California
Los Angeles, CA
Forecast
00 01 02 03 04 05 06 04 08 09 10* 11 12 13 14
Source: Data Courtesy of Moody’s Economy.com and Cushman & Wakefield Valuation & Advisory
Note: Shaded bars indicate periods of recession
*Second Quarter 2010 Data
CONCLUSION
Los Angeles has an established market with a diverse economic base. The industries driving the new economy spurred rapid growth since 2002. However, from mid-2007 to the present, these industries have become vulnerable to a series of negative economic events which are presenting numerous challenges for short-term growth in the area. Despite the residual effects of the economic downturn, the region’s economy should experience moderate growth in the second half of 2010 before picking up speed in 2011.
Final thoughts:
. Los Angeles’ long term growth is largely tied to its two major shipping ports as they present greater access to global economies. Ongoing infrastructure improvements to the ports are expected to result in Los Angeles capturing a greater share of West Coast shipping traffic. Current congestion, however, has allowed other West and East Coast ports to siphon some of the traffic that would normally go to Los Angeles/Long Beach.
. A lack of affordable housing limits migration to the region, and the high cost of doing business often causes businesses to locate elsewhere. In spite of this, Los Angeles provides a broad array of economic drivers from trade, defense, and aerospace to tourism, entertainment and consumer goods, all of which provide a solid foundation for growth in the future.
VALUATION & ADVISORY CUSHMAN & WAKEFIELD®
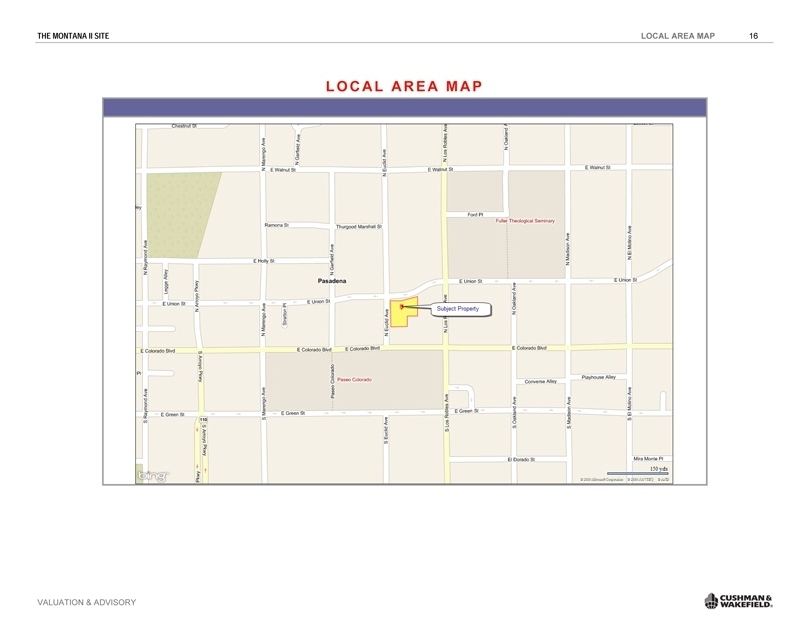 |
THE MONTANA II SITE LOCAL AREA MAP 16
LOCAL AREA MAP VALUATION & ADVISORY CUSHMAN & WAKEFIELD®
THE MONTANA II SITE LOCAL AREA ANALYSIS 17
VALUATION & ADVISORY
LOCAL AREA ANALYSIS
The subject property is located on the southeast corner of Euclid Avenue and Union Street, in the City of Pasadena, California. The City of Pasadena is located in the northern central portion of Los Angeles County at the western end of the San Gabriel Valley. Pasadena is situated approximately ten miles northeast of downtown Los Angeles and approximately 25 miles inland from the Pacific Ocean. Pasadena is generally bordered by the City of Glendale to the west, the community of Altadena to the north, the Cities of Sierra Madre and Arcadia to the east, and the Cities of South Pasadena and San Marino to the south. Pasadena was incorporated as a city in 1886 and today comprises an established mix of residential communities with significant commercial development. Pasadena is widely recognized as the home of the Rose Bowl, the Jet Propulsion Laboratory, California Institute of Technology and host of the annual Tournament of Roses’ parade since January 1, 1890. The city also received additional international exposure during 1994, as the Rose Bowl was the official site for the 1994 World Cup Soccer matches.
ACCESS AND TRANSPORTATION
Air transportation in the region is excellent, due to the access of the Burbank-Glendale-Pasadena Airport (BUR), situated approximately 20 minutes north of downtown Pasadena. It provides general aviation service linking Pasadena to more than 32 cities nationwide, with one-half of the nation’s population located within a 2-1/2 hour flight. Currently, Alaska, American, Delta Connection, JetBlue, Southwest, United Express and US Airways offer domestic service from BUR. BUR currently consists of two terminals, with 14 gates and approximately 250,000 square feet.
Los Angeles International Airport (LAX) offers full domestic and international air service and is one of the five largest airports in the world in terms of passenger volume. LAX is a thirty-minute drive from Pasadena.
The Metropolitan Transportation Authority (“MTA”) operates 16 public bus lines in Pasadena that provide access throughout the San Gabriel Valley and Los Angeles areas. These bus lines link Pasadena to downtown Los Angeles and other adjacent communities. Other bus services that serve Pasadena are Foothill Transit, providing regular and express bus service in the San Gabriel and Pomona Valleys, and the Los Angeles City Department of Transportation (“LADOT”), operating commuter express lines from Encino to Pasadena with stops in Burbank and Glendale.
VALUATION & ADVISORY CUSHMAN & WAKEFIELD®
THE MONTANA II SITE LOCAL AREA ANALYSIS 18
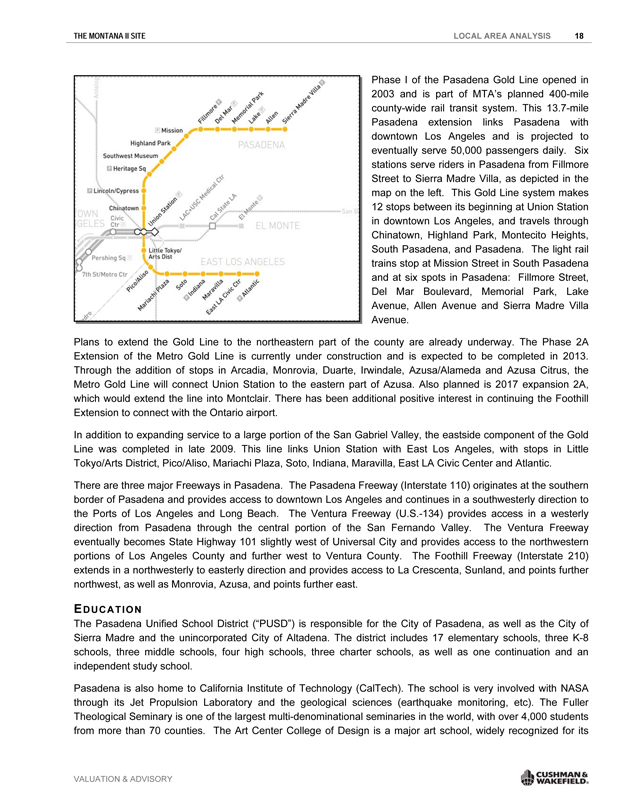
Phase I of the Pasadena Gold Line opened in 2003 and is part of MTA’s planned 400-mile county-wide rail transit system. This 13.7-mile Pasadena extension links Pasadena with downtown Los Angeles and is projected to eventually serve 50,000 passengers daily. Six stations serve riders in Pasadena from Fillmore Street to Sierra Madre Villa, as depicted in the map on the left. This Gold Line system makes 12 stops between its beginning at Union Station in downtown Los Angeles, and travels through Chinatown, Highland Park, Montecito Heights, South Pasadena, and Pasadena. The light rail trains stop at Mission Street in South Pasadena and at six spots in Pasadena: Fillmore Street, Del Mar Boulevard, Memorial Park, Lake Avenue, Allen Avenue and Sierra Madre Villa Avenue.
Plans to extend the Gold Line to the northeastern part of the county are already underway. The Phase 2A Extension of the Metro Gold Line is currently under construction and is expected to be completed in 2013. Through the addition of stops in Arcadia, Monrovia, Duarte, Irwindale, Azusa/Alameda and Azusa Citrus, the Metro Gold Line will connect Union Station to the eastern part of Azusa. Also planned is 2017 expansion 2A, which would extend the line into Montclair. There has been additional positive interest in continuing the Foothill Extension to connect with the Ontario airport.
In addition to expanding service to a large portion of the San Gabriel Valley, the eastside component of the Gold Line was completed in late 2009. This line links Union Station with East Los Angeles, with stops in Little Tokyo/Arts District, Pico/Aliso, Mariachi Plaza, Soto, Indiana, Maravilla, East LA Civic Center and Atlantic.
There are three major Freeways in Pasadena. The Pasadena Freeway (Interstate 110) originates at the southern border of Pasadena and provides access to downtown Los Angeles and continues in a southwesterly direction to the Ports of Los Angeles and Long Beach. The Ventura Freeway (U.S.-134) provides access in a westerly direction from Pasadena through the central portion of the San Fernando Valley. The Ventura Freeway eventually becomes State Highway 101 slightly west of Universal City and provides access to the northwestern portions of Los Angeles County and further west to Ventura County. The Foothill Freeway (Interstate 210) extends in a northwesterly to easterly direction and provides access to La Crescenta, Sunland, and points further northwest, as well as Monrovia, Azusa, and points further east.
EDUCATION
The Pasadena Unified School District (“PUSD”) is responsible for the City of Pasadena, as well as the City of Sierra Madre and the unincorporated City of Altadena. The district includes 17 elementary schools, three K-8 schools, three middle schools, four high schools, three charter schools, as well as one continuation and an independent study school.
Pasadena is also home to California Institute of Technology (CalTech). The school is very involved with NASA through its Jet Propulsion Laboratory and the geological sciences (earthquake monitoring, etc). The Fuller Theological Seminary is one of the largest multi-denominational seminaries in the world, with over 4,000 students from more than 70 counties. The Art Center College of Design is a major art school, widely recognized for its
VALUATION & ADVISORY CUSHMAN & WAKEFIELD®
THE MONTANA II SITE LOCAL AREA ANALYSIS 19
design programs. Pasadena City College (PCC) with over 40,000 students is the third largest community college in the United States.
DEMOGRAPHIC PROFILE
POPULATION
Having established the subject’s trade area, our analysis focuses on the trade area’s population. Claritas, Inc. provides historical, current and forecasted population estimates for the total area. Patterns of development density and migration are reflected in the current levels of population estimates.
Between 2000 and 2009, Claritas, Inc., reports that the population within the primary trade area (3-mile radius) increased at a compound annual rate of 0.9 percent. This is characteristic of suburban areas in this market. This trend is expected to continue into the near future albeit at a slightly slower pace. Expanding to the total trade area (5-mile radius), population is expected to increase 0.97 percent per annum over the next five years.
The following page contains a graphic representation of the current population distribution within the subject’s region.
The graphic on the second following page illustrates projected population growth within the trade area over the next five years (2009—2014). The trade area is clearly characterized by various levels of growth.
VALUATION & ADVISORY CUSHMAN & WAKEFIELD®
THE MONTANA II SITE LOCAL AREA ANALYSIS 20
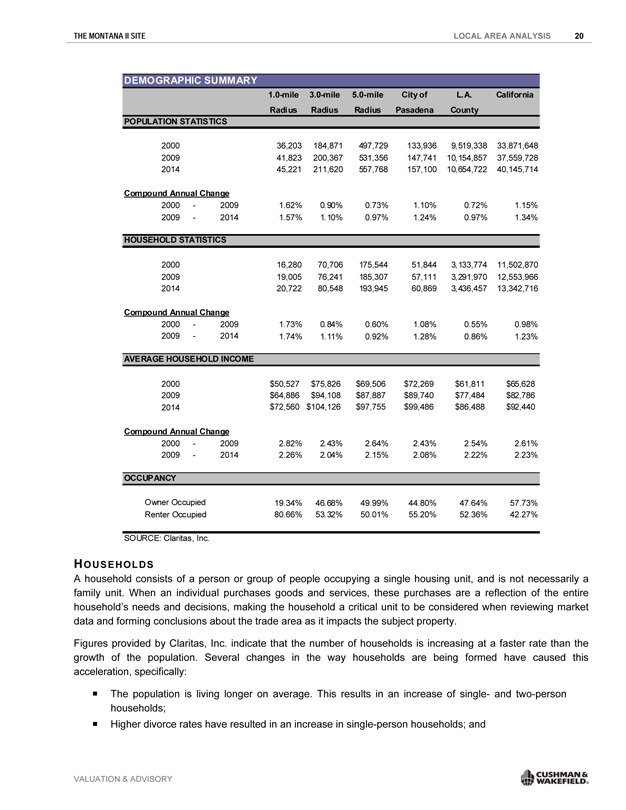
DEMOGRAPHIC SUMMARY
1.0-mile 3.0-mile 5.0-mile City of L.A. California
Radius Radius Radius Pasadena County
POPULATION STATISTICS
2000 36,203 184,871 497,729 133,936 9,519,338 33,871,648
2009 41,823 200,367 531,356 147,741 10,154,857 37,559,728
2014 45,221 211,620 557,768 157,100 10,654,722 40,145,714
Compound Annual Change
2000—2009 1.62% 0. 90% 0.73% 1.10% 0.72% 1.15%
2009—2014 1.57% 1. 10% 0.97% 1.24% 0.97% 1.34%
HOUSEHOLD STATISTICS
2000 16,280 70,706 175,544 51,844 3,133,774 11,502,870
2009 19,005 76,241 185,307 57,111 3,291,970 12,553,966
2014 20,722 80,548 193,945 60,869 3,436,457 13,342,716
Compound Annual Change
2000—2009 1.73% 0. 84% 0.60% 1.08% 0.55% 0.98%
2009—2014 1.74% 1. 11% 0.92% 1.28% 0.86% 1.23%
AVERAGE HOUSEHOLD INCOME
2000 $50,527 $75,826 $69,506 $72,269 $61,811 $65,628
2009 $64,886 $94,108 $87,887 $89,740 $77,484 $82,786
2014 $72,560 $104,126 $97,755 $99,486 $86,488 $92,440
Compound Annual Change
2000—2009 2.82% 2. 43% 2.64% 2.43% 2.54% 2.61%
2009—2014 2.26% 2. 04% 2.15% 2.08% 2.22% 2.23%
OCCUPANCY
Owner Occupied 19.34% 46. 68% 49.99% 44.80% 47.64% 57.73%
Renter Occupied 80.66% 53. 32% 50.01% 55.20% 52.36% 42.27%
SOURCE: Claritas, Inc.
HOUSEHOLDS
A household consists of a person or group of people occupying a single housing unit, and is not necessarily a family unit. When an individual purchases goods and services, these purchases are a reflection of the entire household’s needs and decisions, making the household a critical unit to be considered when reviewing market data and forming conclusions about the trade area as it impacts the subject property.
Figures provided by Claritas, Inc. indicate that the number of households is increasing at a faster rate than the growth of the population. Several changes in the way households are being formed have caused this acceleration, specifically:
. The population is living longer on average. This results in an increase of single- and two-person households;
. Higher divorce rates have resulted in an increase in single-person households; and
VALUATION & ADVISORY CUSHMAN & WAKEFIELD®
THE MONTANA II SITE LOCAL AREA ANALYSIS 21
. Many individuals have postponed marriage, also resulting in more single-person households. According to Claritas, Inc., the Primary Trade Area grew at a compound annual rate of 0.84 percent between 2000 and 2009. Consistent with national trends the trade area is experiencing household changes at a rate that
varies from population changes. That pace is expected to continue through 2014, and is estimated at 1.11 percent.
Correspondingly, a greater number of smaller households with fewer children generally indicates more disposable income. In 2000, there were 2.56 persons per household in the Primary Trade Area and by 2009, this number is estimated to have increased to 2.57 persons. Through 2014, the average number of persons per household is forecasted to increase to 2.57 persons.
AVERAGE HOUSEHOLD INCOME
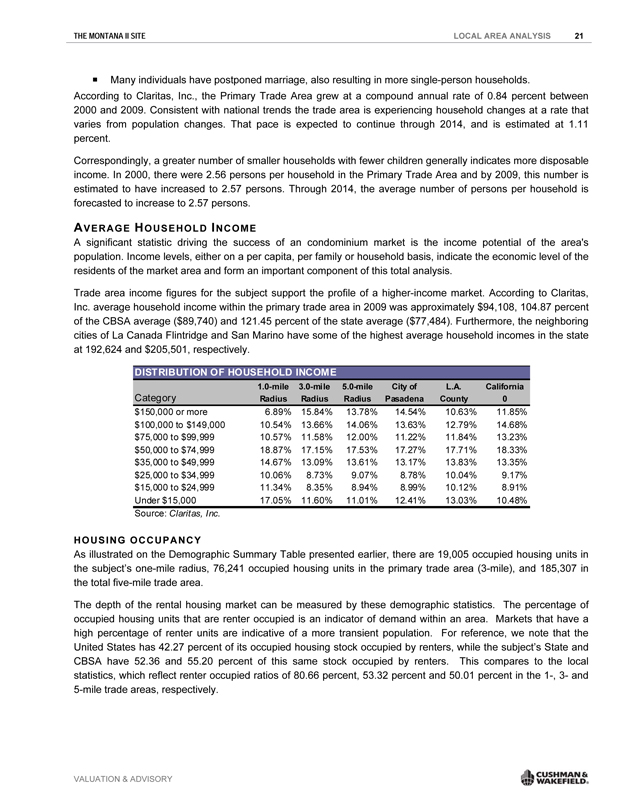
A significant statistic driving the success of an condominium market is the income potential of the area’s population. Income levels, either on a per capita, per family or household basis, indicate the economic level of the residents of the market area and form an important component of this total analysis.
Trade area income figures for the subject support the profile of a higher-income market. According to Claritas, Inc. average household income within the primary trade area in 2009 was approximately $94,108, 104.87 percent of the CBSA average ($89,740) and 121.45 percent of the state average ($77,484). Furthermore, the neighboring cities of La Canada Flintridge and San Marino have some of the highest average household incomes in the state at 192,624 and $205,501, respectively.
DISTRIBUTION OF HOUSEHOLD INCOME
1.0-mile 3.0-mile 5.0-mile City of L.A. California
Category Radius Radius Radius Pasadena County 0
$150,000 or more 6.89% 15.84% 13.78% 14.54% 10.63% 11.85%
$100,000 to $149,000 10.54% 13.66% 14.06% 13.63% 12.79% 14.68%
$75,000 to $99,999 10.57% 11.58% 12.00% 11.22% 11.84% 13.23%
$50,000 to $74,999 18.87% 17.15% 17.53% 17.27% 17.71% 18.33%
$35,000 to $49,999 14.67% 13.09% 13.61% 13.17% 13.83% 13.35%
$25,000 to $34,999 10.06% 8.73% 9.07% 8.78% 10.04% 9.17%
$15,000 to $24,999 11.34% 8.35% 8.94% 8.99% 10.12% 8.91%
Under $15,000 17.05% 11.60% 11.01% 12.41% 13.03% 10.48%
Source: Claritas, Inc.
HOUSING OCCUPANCY
As illustrated on the Demographic Summary Table presented earlier, there are 19,005 occupied housing units in the subject’s one-mile radius, 76,241 occupied housing units in the primary trade area (3-mile), and 185,307 in the total five-mile trade area.
The depth of the rental housing market can be measured by these demographic statistics. The percentage of occupied housing units that are renter occupied is an indicator of demand within an area. Markets that have a high percentage of renter units are indicative of a more transient population. For reference, we note that the United States has 42.27 percent of its occupied housing stock occupied by renters, while the subject’s State and CBSA have 52.36 and 55.20 percent of this same stock occupied by renters. This compares to the local statistics, which reflect renter occupied ratios of 80.66 percent, 53.32 percent and 50.01 percent in the 1-, 3- and 5-mile trade areas, respectively.
VALUATION & ADVISORY CUSHMAN & WAKEFIELD®
THE MONTANA II SITE LOCAL AREA ANALYSIS 22
EMPLOYMENT
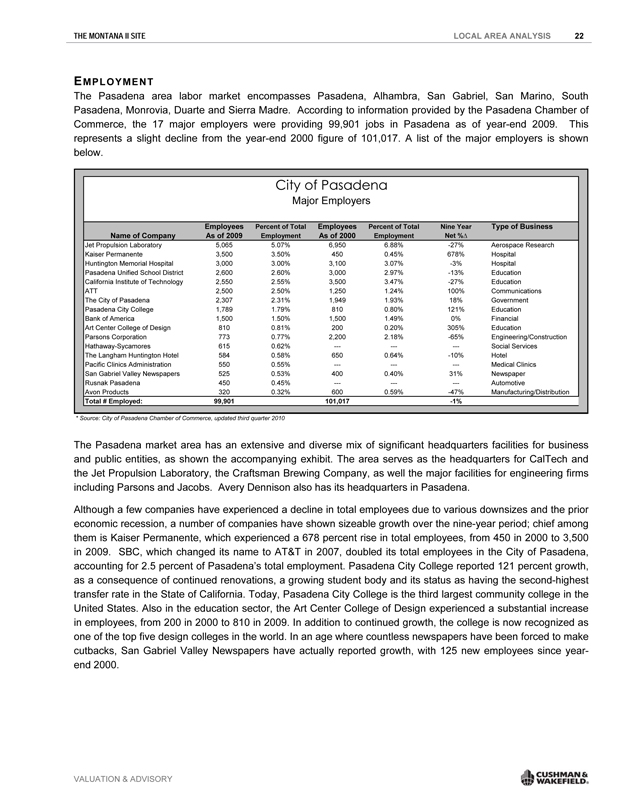
The Pasadena area labor market encompasses Pasadena, Alhambra, San Gabriel, San Marino, South Pasadena, Monrovia, Duarte and Sierra Madre. According to information provided by the Pasadena Chamber of Commerce, the 17 major employers were providing 99,901 jobs in Pasadena as of year-end 2009. This represents a slight decline from the year-end 2000 figure of 101,017. A list of the major employers is shown below.
City of Pasadena
Major Employers
Employees Percent of Total Employees Percent of Total Nine Year Type of Business
Name of Company As of 2009 Employment As of 2000 Employment Net %
Jet Propulsion Laboratory 5,065 5.07% 6,950 6.88% -27% Aerospace Research
Kaiser Permanente 3,500 3.50% 450 0.45% 678% Hospital
Huntington Memorial Hospital 3,000 3.00% 3,100 3.07% -3% Hospital
Pasadena Unified School District 2,600 2.60% 3,000 2.97% -13% Education
California Institute of Technology 2,550 2.55% 3,500 3.47% -27% Education
ATT 2,500 2.50% 1,250 1.24% 100% Communications
The City of Pasadena 2,307 2.31% 1,949 1.93% 18% Government
Pasadena City College 1,789 1.79% 810 0.80% 121% Education
Bank of America 1,500 1.50% 1,500 1.49% 0% Financial
Art Center College of Design 810 0.81% 200 0.20% 305% Education
Parsons Corporation 773 0.77% 2,200 2.18% -65% Engineering/Construction
Hathaway-Sycamores 615 0.62% -— -— -— Social Services
The Langham Huntington Hotel 584 0.58% 650 0.64% -10% Hotel
Pacific Clinics Administration 550 0.55% -— -— -— Medical Clinics
San Gabriel Valley Newspapers 525 0.53% 400 0.40% 31% Newspaper
Rusnak Pasadena 450 0.45% -— -— -— Automotive
Avon Products 320 0.32% 600 0.59% -47% Manufacturing/Distribution
Total # Employed: 99,901 101,017 -1%
* Source: City of Pasadena Chamber of Commerce, updated third quarter 2010
The Pasadena market area has an extensive and diverse mix of significant headquarters facilities for business and public entities, as shown the accompanying exhibit. The area serves as the headquarters for CalTech and the Jet Propulsion Laboratory, the Craftsman Brewing Company, as well the major facilities for engineering firms including Parsons and Jacobs. Avery Dennison also has its headquarters in Pasadena.
Although a few companies have experienced a decline in total employees due to various downsizes and the prior economic recession, a number of companies have shown sizeable growth over the nine-year period; chief among them is Kaiser Permanente, which experienced a 678 percent rise in total employees, from 450 in 2000 to 3,500 in 2009. SBC, which changed its name to AT&T in 2007, doubled its total employees in the City of Pasadena, accounting for 2.5 percent of Pasadena’s total employment. Pasadena City College reported 121 percent growth, as a consequence of continued renovations, a growing student body and its status as having the second-highest transfer rate in the State of California. Today, Pasadena City College is the third largest community college in the United States. Also in the education sector, the Art Center College of Design experienced a substantial increase in employees, from 200 in 2000 to 810 in 2009. In addition to continued growth, the college is now recognized as one of the top five design colleges in the world. In an age where countless newspapers have been forced to make cutbacks, San Gabriel Valley Newspapers have actually reported growth, with 125 new employees since year-end 2000.
VALUATION & ADVISORY CUSHMAN & WAKEFIELD®
THE MONTANA II SITE LOCAL AREA ANALYSIS 23
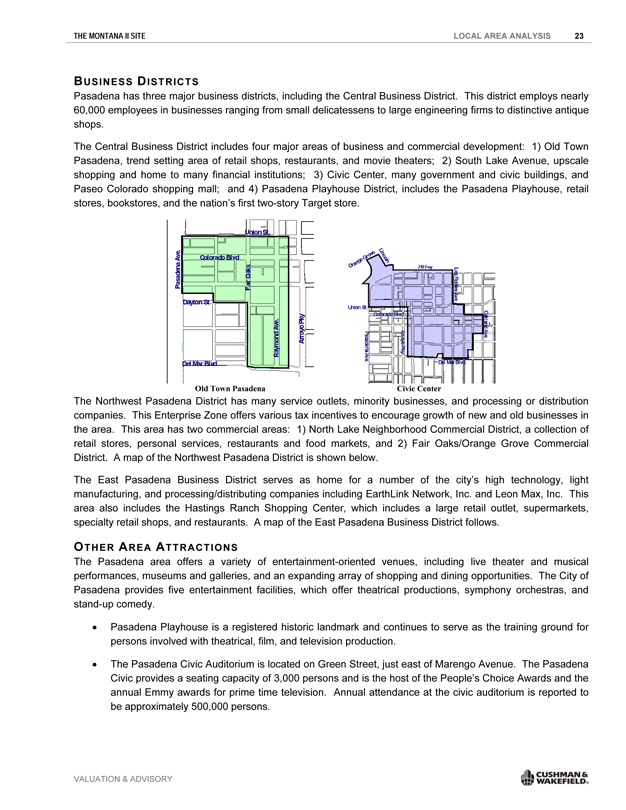
BUSINESS DISTRICTS
Pasadena has three major business districts, including the Central Business District. This district employs nearly 60,000 employees in businesses ranging from small delicatessens to large engineering firms to distinctive antique shops.
The Central Business District includes four major areas of business and commercial development: 1) Old Town Pasadena, trend setting area of retail shops, restaurants, and movie theaters; 2) South Lake Avenue, upscale shopping and home to many financial institutions; 3) Civic Center, many government and civic buildings, and Paseo Colorado shopping mall; and 4) Pasadena Playhouse District, includes the Pasadena Playhouse, retail stores, bookstores, and the nation’s first two-story Target store.
Old Town Pasadena Civic Center
The Northwest Pasadena District has many service outlets, minority businesses, and processing or distribution companies. This Enterprise Zone offers various tax incentives to encourage growth of new and old businesses in the area. This area has two commercial areas: 1) North Lake Neighborhood Commercial District, a collection of retail stores, personal services, restaurants and food markets, and 2) Fair Oaks/Orange Grove Commercial District. A map of the Northwest Pasadena District is shown below.
The East Pasadena Business District serves as home for a number of the city’s high technology, light manufacturing, and processing/distributing companies including EarthLink Network, Inc. and Leon Max, Inc. This area also includes the Hastings Ranch Shopping Center, which includes a large retail outlet, supermarkets, specialty retail shops, and restaurants. A map of the East Pasadena Business District follows.
OTHER AREA ATTRACTIONS
The Pasadena area offers a variety of entertainment-oriented venues, including live theater and musical performances, museums and galleries, and an expanding array of shopping and dining opportunities. The City of Pasadena provides five entertainment facilities, which offer theatrical productions, symphony orchestras, and stand-up comedy.
Pasadena Playhouse is a registered historic landmark and continues to serve as the training ground for persons involved with theatrical, film, and television production.
The Pasadena Civic Auditorium is located on Green Street, just east of Marengo Avenue. The Pasadena Civic provides a seating capacity of 3,000 persons and is the host of the People’s Choice Awards and the annual Emmy awards for prime time television. Annual attendance at the civic auditorium is reported to be approximately 500,000 persons.
VALUATION & ADVISORY CUSHMAN & WAKEFIELD®
THE MONTANA II SITE LOCAL AREA ANALYSIS 24
The Ambassador Auditorium is a 1,262-seat concert hall and serves as the host of approximately 115 concerts each season. Annual attendance at the Ambassador is reported to be in the range of 130,000 to 140,000 persons per year.
The Norton Simon Museum is located on Colorado Boulevard near the junction of the Ventura Freeway and the Foothill Freeway. The museum features European art, sculpture gardens, tours, and an extensive library. Annual attendance at the museum is reported at 130,000 persons.
The Huntington Library, Art Gallery & Botanical Gardens is a research and educational center serving scholars and the general public. The botanical gardens cover 150 acres of the property’s total land area of 207 acres, and feature 14,000 varieties of plants. The art gallery contains one of the most extensive collections of British and French 18th Century art of any gallery in the country.
OLD TOWN PASADENA
One of the more popular visitor attractions in Pasadena is the Old Pasadena Historic District. The Old Town Pasadena district is an area of approximately 20 square blocks, providing a diverse blend of retail, dining and entertainment opportunities. The Old Pasadena area is listed on the National Register of Historic Places and is a redevelopment project of the City of Pasadena. Old Pasadena is centered along Colorado Boulevard between Pasadena Avenue (to the west) and Arroyo Parkway (to the east). The northern boundary of Old Pasadena is Corson Avenue and the southern boundary is Del Mar Avenue. The primary contribution from the city in the redevelopment of the area has been the construction of several new parking structures, which have provided an additional incentive for retailers and restaurateurs to renovate many of the existing commercial buildings in the area. Most of the shops in the area are open late at night to accommodate dinner and theater patrons of the local restaurants and theatres. The attractiveness of this location is evidenced by the number of high profile retailers which have opened for business in the area, which includes Tiffany’s & Co., Forever XXI, Crate & Barrel, The Gap, Banana Republic, Il Fornaio, Apple, Cheesecake Factory, Restoration Hardware, Urban Outfitters, Barnes & Noble, Diesel, Guess, Chico’s, J. Crew, Armani Exchange, and Victoria Secret. Along with these high profile retail vendors, Old Town Pasadena is now home to the newly opened Gold Class Cinemas at One Colorado. The result of a complete renovation of the old Laemmle’s theater, Gold Class Cinemas features first run movies and theaters equipped with oversized reclining seats and a full-service bar and restaurant, where patrons can order a wide array of dishes and alcoholic beverages.
ROSE BOWL
Perhaps the most widely recognized Pasadena landmark is the Rose Bowl. The Rose Bowl is located in the northwestern portion of Pasadena, approximately one mile north of the Ventura Freeway and one half mile west of Orange Grove Boulevard. The facility is the home field for the UCLA football team during the fall season, and is the site of the annual Rose Bowl Game on New Year’s Day.
PASEO COLORADO
Paseo Colorado is a mixed-use retail “destination” center which combines residential uses with retail and entertainment uses. The retail component consists of a pedestrian-oriented, two-level shopping center with an open-air layout. The center includes a cinema, and an upscale supermarket and a health club, as well as a major department store (Macy’s). Other significant tenants include national retailers Eddie Bauer, BCBG, Sephora and Ann Taylor Loft, Kay-Bee Toys, and several restaurants.
Other world-class institutions in Pasadena include Pacific Asia Museum, California Institute of Technology, the Jet Propulsion Laboratory, Tournament House (Wrigley Mansion and Gardens) and the Annual Tournament of Roses Parade.
VALUATION & ADVISORY CUSHMAN & WAKEFIELD®
THE MONTANA II SITE LOCAL AREA ANALYSIS 25
SURROUNDING LAND USES
The subject property is located on the southeast corner of Union Street and Euclid Avenue just south of the Pasadena Civic Center and north of Paseo Colorado. This location is less than one-half mile east of Old Town Pasadena, one block north of Colorado Boulevard, and three blocks south of the I-210 Freeway. Western Asset Plaza – a professional office building with ground floor retail tenants including Morton’s Steakhouse—is located directly east and south of the subject. The subject has a very dynamic location with various amenities including restaurants, shopping, government facilities and good quality multi-family residential uses.
CONCLUSION
The subject location in the northern/central portion of Los Angeles County provides for good access to outlying areas in the greater Los Angeles area by way of the extensive southern California freeway system. The subject property is within close proximity to several visitor draws into the Pasadena area, including entertainment, shopping, hotels, and dining opportunities. The overall outlook for the subject property over the long-term is positive.
VALUATION & ADVISORY CUSHMAN & WAKEFIELD®
THE MONTANA II SITE SITE DESCRIPTION 26
SITE DESCRIPTION
Location: 380 Union Street
Pasadena, Los Angeles County, CA 91101 The subject property is located on the southeast corner of Union Street and Euclid Avenue
Shape: Irregularly shaped
Topography: Level at street grade
Land Area: 0.76 acres / 32,972 square feet
Frontage: The subject property has average frontage. The frontage dimensions are listed below:
Union Street Euclid Avenue 310 feet 194 feet
Access: The subject property has average access.
Visibility: The subject property has good visibility.
Soil Conditions: We were not given a soil report to review. However, we assume that the soil’s load-bearing capacity is sufficient to support existing and proposed structures. We did not observe any evidence to the contrary during our physical inspection of the property. Drainage appears to be adequate.
Utilities: Utility providers for the subject property are as follows:
Water Sewer Electricity Gas Telephone City of Pasadena
City of Pasadena
City of Pasadena
Southern California Gas
Verizon
Site Improvements: The site improvements include an asphalt paved parking area with concrete block perimeter wall, concrete curbing and sidewalks, pole lighting and drainage.
Land Use Restrictions: We were not given a title report to review. We do not know of any easements, encroachments, or restrictions that would adversely affect the site’s use. However, we recommend a title search to determine whether any adverse conditions exist.
Flood Zone Description: The subject property is located in flood zone X (Areas determined to be outside the 500 year flood plain) as indicated by FEMA Map 06037C1375F, dated September 28, 2008.
VALUATION & ADVISORY CUSHMAN & WAKEFIELD®
THE MONTANA II SITE SITE DESCRIPTION 27
Wetlands: We were not given a wetlands survey to review. If subsequent engineering data reveal the presence of regulated wetlands, it could materially affect property value. We recommend a wetlands survey by a professional engineer with expertise in this field.
Seismic Hazard: The site is not located in a Special Study Zone as established by California’s Alquist-Priolo Geological Hazards Act.
Hazardous Substances: We observed no evidence of toxic or hazardous substances during our inspection of the site. However, we are not trained to perform technical environmental inspections and recommend the hiring of a professional engineer with expertise in this field.
Overall Site Utility: The subject site is functional for its current use.
Location Rating: Excellent
VALUATION & ADVISORY CUSHMAN & WAKEFIELD®
 |
THE MONTANA II SITE SITE DESCRIPTION 28
ASSESSOR’S PARCEL MAP
VALUATION & ADVISORY CUSHMAN & WAKEFIELD®
THE MONTANA II SITE REAL PROPERTY TAXES AND ASSESSMENTS 29
REAL PROPERTY TAXES AND ASSESSMENTS
CURRENT PROPERTY TAXES
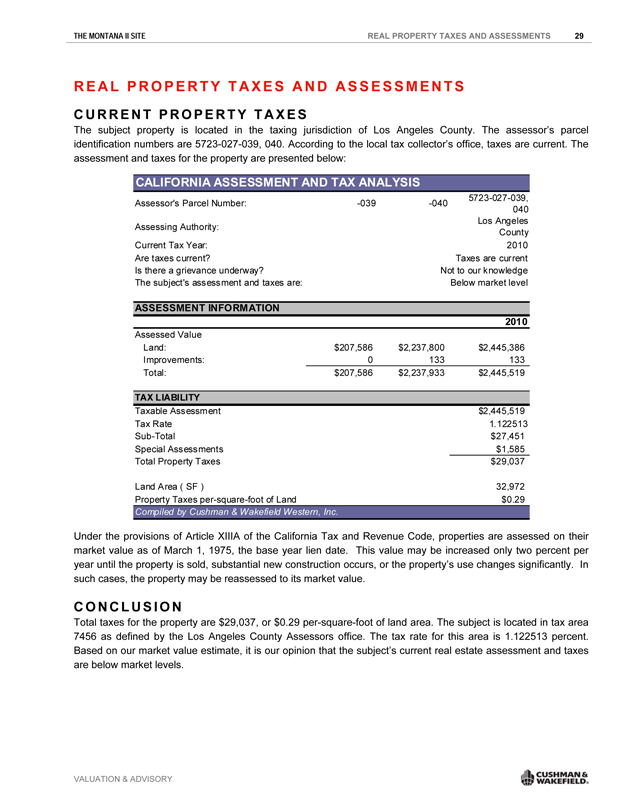
The subject property is located in the taxing jurisdiction of Los Angeles County. The assessor’s parcel identification numbers are 5723-027-039, 040. According to the local tax collector’s office, taxes are current. The assessment and taxes for the property are presented below:
CALIFORNIA ASSESSMENT AND TAX ANALYSIS
Assessor’s Parcel Number: -039 -040 5723-027-039, 040
Assessing Authority: Los Angeles County
Current Tax Year: 2010
Are taxes current? Taxes are current
Is there a grievance underway? Not to our knowledge
The subject’s assessment and taxes are: Below market level
ASSESSMENT INFORMATION
Assessed Value
Land: $207,586 $2,237,800 $2,445,386
Improvements: 0 133 133
Total: $207,586 $2,237,933 $2,445,519
TAX LIABILITY
Tax Rate 1.122513
Sub-Total $27,451
Special Assessments $1,585
Total Property Taxes $29,037
Land Area ( SF ) 32,972
Property Taxes per-square-foot of Land $0.29
Compiled by Cushman & Wakefield Western, Inc.
Under the provisions of Article XIIIA of the California Tax and Revenue Code, properties are assessed on their market value as of March 1, 1975, the base year lien date. This value may be increased only two percent per year until the property is sold, substantial new construction occurs, or the property’s use changes significantly. In such cases, the property may be reassessed to its market value.
CONCLUSION
Total taxes for the property are $29,037, or $0.29 per-square-foot of land area. The subject is located in tax area 7456 as defined by the Los Angeles County Assessors office. The tax rate for this area is 1.122513 percent. Based on our market value estimate, it is our opinion that the subject’s current real estate assessment and taxes are below market levels.
VALUATION & ADVISORY CUSHMAN & WAKEFIELD®
THE MONTANA II SITE ZONING 30
ZONING
GENERAL INFORMATION
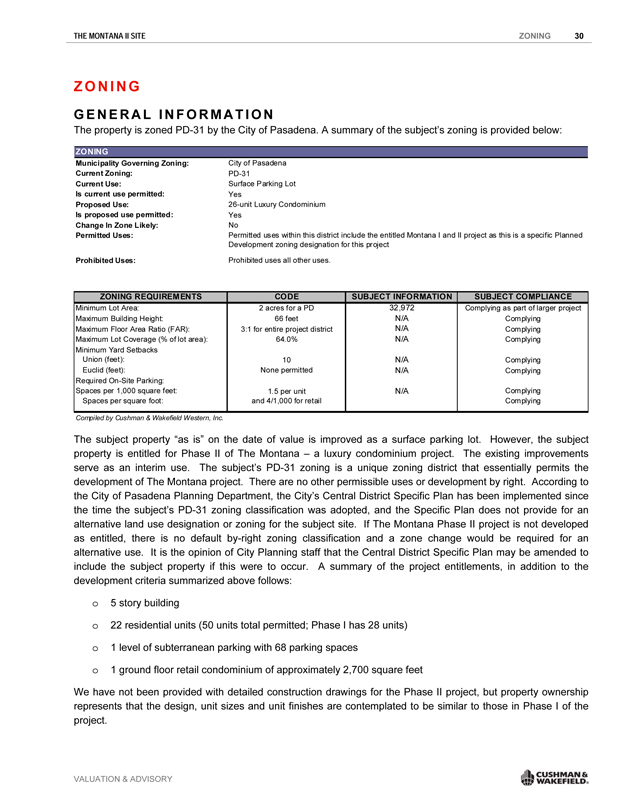
The property is zoned PD-31 by the City of Pasadena. A summary of the subject’s zoning is provided below:
ZONING
ZONING
Municipality Governing Zoning: City of Pasadena
Current Zoning: PD-31
Current Use: Surface Parking Lot
Is current use permitted: Yes
Proposed Use: 26-unit Luxury Condominium
Is proposed use permitted: Yes
Change In Zone Likely: No
Permitted Uses: Permitted uses within this district include the entitled Montana I and II project as this is a specific Planned
Development zoning designation for this project
Prohibited Uses: Prohibited uses all other uses.
ZONING REQUIREMENTS CODE SUBJECT INFORMATION SUBJECT COMPLIANCE
Minimum Lot Area: Maximum Building Height: Maximum Floor Area Ratio (FAR): Maximum Lot Coverage (% of lot area): Minimum Yard Setbacks Union (feet): Euclid (feet): Required On-Site Parking: Spaces per 1,000 square feet: Spaces per square foot: 2 acres for a PD
66 feet
3:1 for entire project district
64.0%
10
None permitted
1.5 per unit
and 4/1,000 for retail 32,972
N/A
N/A
N/A
N/A
N/A
N/A Complying as part of larger project Complying Complying
Complying
Complying
Complying
Complying
Complying
Compiled by Cushman & Wakefield Western, Inc.
The subject property “as is” on the date of value is improved as a surface parking lot. However, the subject property is entitled for Phase II of The Montana – a luxury condominium project. The existing improvements serve as an interim use. The subject’s PD-31 zoning is a unique zoning district that essentially permits the development of The Montana project. There are no other permissible uses or development by right. According to the City of Pasadena Planning Department, the City’s Central District Specific Plan has been implemented since the time the subject’s PD-31 zoning classification was adopted, and the Specific Plan does not provide for an alternative land use designation or zoning for the subject site. If The Montana Phase II project is not developed as entitled, there is no default by-right zoning classification and a zone change would be required for an alternative use. It is the opinion of City Planning staff that the Central District Specific Plan may be amended to include the subject property if this were to occur. A summary of the project entitlements, in addition to the development criteria summarized above follows:
o 5 story building
o 22 residential units (50 units total permitted; Phase I has 28 units)
o 1 level of subterranean parking with 68 parking spaces
o 1 ground floor retail condominium of approximately 2,700 square feet
We have not been provided with detailed construction drawings for the Phase II project, but property ownership represents that the design, unit sizes and unit finishes are contemplated to be similar to those in Phase I of the project.
VALUATION & ADVISORY CUSHMAN & WAKEFIELD®
THE MONTANA II SITE ZONING 31
CONCLUSION
We analyzed the zoning requirements in relation to the subject property, and considered the compliance of the existing and proposed use. We are not experts in the interpretation of complex zoning ordinances but based on our review of public information, the subject property as proposed appears to be a complying use.
Detailed zoning studies are typically performed by a zoning or land use expert, including attorneys, land use planners, or architects. The depth of our study correlates directly with the scope of this assignment, and it considers all pertinent issues that have been discovered through our due diligence.
We note that this appraisal is not intended to be a detailed determination of compliance, as that determination is beyond the scope of this real estate appraisal assignment.
VALUATION & ADVISORY CUSHMAN & WAKEFIELD®
THE MONTANA II SITE HIGHEST AND BEST USE 32
HIGHEST AND BEST USE
HIGHEST AND BEST USE DEFINITION
The Dictionary of Real Estate Appraisal, Fifth Edition (2010), a publication of the Appraisal Institute, defines the highest and best use as:
The most probable use of a property which is physically possible, appropriately justified, legally permissible, financially feasible, and which results in the highest value of the property being valued.
To determine the highest and best use we typically evaluate the subject site under two scenarios: as vacant land and as presently improved. In both cases, the property’s highest and best use must meet the four criteria described above. Since this property is land only, evaluating it as presently improved is not applicable.
HIGHEST AND BEST USE OF PROPERTY AS VACANT
We considered the legal issues related to zoning and legal restrictions. We also analyzed the physical characteristics of the site to determine what legal uses would be possible, and considered the financial feasibility of these uses to determine the use that is maximally productive.
Financially feasible uses are those uses that can generate a profit over and above the cost of acquiring the site, and constructing the improvements. Determining the value of a property upon completion of new construction requires an in-depth analysis of the condition of the local market, the location of the subject property, the proposed use of the property, its market position, level of pre-sale, an estimate for absorption, leasing/sale costs, operating expenses, market vacancy and sales prices or rental rates.
Our analysis indicates that under current market conditions, the legally permissible use of the site under zoning (proposed project) is not a viable development due to the lack of available construction financing, the achievable sale prices, slow absorption and oversupply for ultra-luxury units relative to demand. These factors, when combined, essentially eliminate the entrepreneurial incentive necessary to attract investment. In today’s market, a prudent investor would hold the site until market conditions improve to the point where the entitled project is financially feasible. Therefore, considering the subject site’s physical characteristics and location, as well as the state of the local market, it is our opinion that the Highest and Best Use of the subject site as though vacant is hold until market conditions improve and entitled project can be feasibly developed
HIGHEST AND BEST USE OF PROPERTY AS IMPROVED
The Dictionary of Real Estate Appraisal defines highest and best use of the property as improved as:
The use that should be made of a property as it exists. An existing improvement should be renovated or retained as is so long as it continues to contribute to the total market value of the property, or until the return from a new improvement would more than offset the cost of demolishing the existing building and constructing a new one.
In analyzing the Highest and Best Use of a property as improved, it is recognized that the improvements should continue to be used until it is financially advantageous to alter physical elements of the structure or to demolish it and build a new one.
It is our opinion that the existing surface parking lot use is an interim use. It is our opinion that the Highest and Best Use of the subject property as improved is hold until market conditions improve and entitled project can be feasibly developed.
VALUATION & ADVISORY CUSHMAN & WAKEFIELD®
THE MONTANA II SITE VALUATION PROCESS 33
VALUATION PROCESS
METHODOLOGY
There are three generally accepted approaches to developing an opinion of value: Cost, Sales Comparison and Income Capitalization. We considered each in this appraisal to develop an opinion of the market value of the subject property. In appraisal practice, an approach to value is included or eliminated based on its applicability to the property type being valued and the quality of information available. The reliability of each approach depends on the availability and comparability of market data as well as the motivation and thinking of purchasers.
The valuation process is concluded by analyzing each approach to value used in the appraisal. When more than one approach is used, each approach is judged based on its applicability, reliability, and the quantity and quality of its data. A final value opinion is chosen that either corresponds to one of the approaches to value, or is a correlation of all the approaches used in the appraisal.
We considered each approach in developing our opinion of the market value of the subject property. We discuss each approach below and conclude with a summary of their applicability to the subject property.
SUMMARY
This appraisal employs only the Sales Comparison Approach. Based on our analysis and knowledge of the subject property type and relevant investor profiles, it is our opinion that this approach would be considered necessary and applicable for market participants. Typical purchasers for a property like the subject, which has entitlements in place for a luxury residential condominium development, will also employ a developmental approach in order to estimate land value. However, market conditions for luxury condominiums do not support development of the proposed project entitled for the subject, and the developmental approach would not result in market-based land value indication at the present time. The Cost Approach is not relevant for estimating land value. Therefore, we have only employed the Sales Comparison Approach in our analysis.
VALUATION & ADVISORY CUSHMAN & WAKEFIELD®
THE MONTANA II SITE LAND VALUATION 34
LAND VALUATION
The Direct Sales Comparison Approach is used to estimate land value. The methodology includes an analysis of the prices paid for comparable sites or under-improved (essentially vacant) sites. Comparisons between the data and the subject are made based on an evaluation of the comparable property’s date of sale, location, size, density and development potential, as well as access, plottage and other considerations. The most widely-used and market-oriented unit of comparison for properties such as the subject is the sales price per unit. All comparable sales were analyzed on this basis.
As shown on the comparable sales spreadsheet presented subsequently, we analyzed five comparable development sites that have occurred over the past two years. With one exception, all of the sales are located in the subject’s San Gabriel Valley area. The subject has an excellent location in Pasadena and is superior to all of the comparables in location.
The land sales we considered are summarized on the following table. The adjustments are indicated on the subsequent adjustment grid and discussed subsequently.
VALUATION & ADVISORY CUSHMAN & WAKEFIELD®
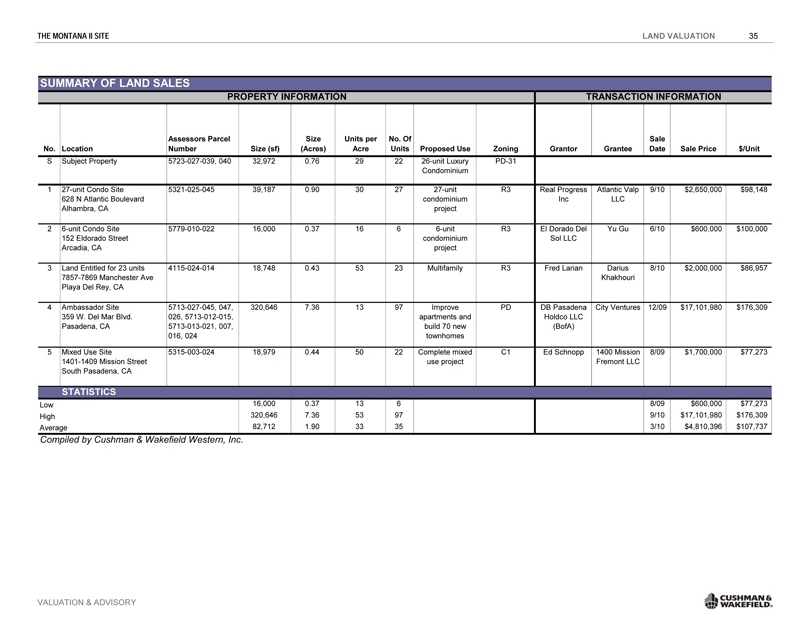 |
THE MONTANA II SITE LAND VALUATION 35
SUMMARY OF LAND SALES
PROPERTY INFORMATION TRANSACTION INFORMATION
Assessors Parcel Size Units per No. Of Units Sale
No. Location Number Size (sf)(Acres) Acre Proposed Use Zoning Grantor Grantee Date Sale Price $/Unit
S Subject Property 5723-027-039, 040 32,972 0.76 29 22 26-unit Luxury PD-31
Condominium
1 27-unit Condo Site 5321-025-045 39,187 0.90 30 27 27-unit R3 Real Progress Atlantic Valp 9/10 $2,650,000 $98,148
628 N Atlantic Boulevard condominium Inc LLC
Alhambra, CA project
2 6-unit Condo Site 5779-010-022 16,000 0.37 16 6 6-unit R3 El Dorado Del Yu Gu 6/10 $600,000 $100,000
152 Eldorado Street condominium Sol LLC
Arcadia, CA project
3 Land Entitled for 23 units 4115-024-014 18,748 0.43 53 23 Multifamily R3 Fred Larian Darius 8/10 $2,000,000 $86,957
7857-7869 Manchester Ave Khakhouri
Playa Del Rey, CA
4 Ambassador Site 5713-027-045, 047, 320,646 7.36 13 97 Improve PD DB Pasadena City Ventures 12/09 $17,101,980 $176,309
359 W. Del Mar Blvd. 026, 5713-012-015, apartments and Holdco LLC
Pasadena, CA 5713-013-021, 007, build 70 new(BofA)
016, 024 townhomes
5 Mixed Use Site 5315-003-024 18,979 0.44 50 22 Complete mixed C1 Ed Schnopp 1400 Mission 8/09 $1,700,000 $77,273
1401-1409 Mission Street use project Fremont LLC
South Pasadena, CA
STATISTICS
Low 16,000 0.37 13 6 8/09 $600,000 $77,273
High 320,646 7.36 53 97 9/10 $17,101,980 $176,309
Average 82,712 1.90 33 35 3/10 $4,810,396 $107,737
Compiled by Cushman & Wakefield Western, Inc.
VALUATION & ADVISORY CUSHMAN & WAKEFIELD®
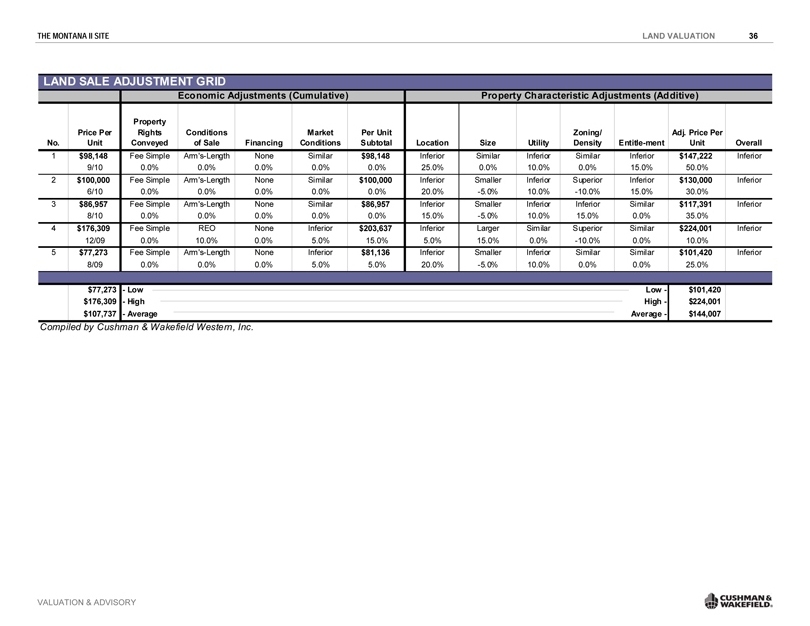 |
THE MONTANA II SITE LAND VALUATION 36
LAND SALE ADJUSTMENT GRID
Economic Adjustments (Cumulative) Property Characteristic Adjustments (Additive)
Property
Price Per Rights Conditions Market Per Unit Zoning/ Adj. Price Per
No. Unit Conveyed of Sale Financing Conditions Subtotal Location Size Utility Density Entitle-ment Unit Overall
1 $98,148 Fee Simple Arm’s-Length None Similar $98,148 Inferior Similar Inferior Similar Inferior $147,222 Inferior
9/10 0.0% 0.0% 0.0% 0.0% 0.0% 25.0% 0.0% 10.0% 0.0% 15.0% 50.0%
2 $100,000 Fee Simple Arm’s-Length None Similar $100,000 Inferior Smaller Inferior Superior Inferior $130,000 Inferior
6/10 0.0% 0.0% 0.0% 0.0% 0.0% 20.0% -5. 0% 10.0% -10.0% 15.0% 30.0%
3 $86,957 Fee Simple Arm’s-Length None Similar $86,957 Inferior Smaller Inferior Inferior Similar $117,391 Inferior
8/10 0.0% 0.0% 0.0% 0.0% 0.0% 15.0% -5. 0% 10.0% 15.0% 0.0% 35.0%
4 $176,309 Fee Simple REO None Inferior $203,637 Inferior Larger Similar Superior Similar $224,001 Inferior
12/09 0.0% 10.0% 0.0% 5.0% 15.0% 5.0% 15.0% 0.0% -10.0% 0.0% 10.0%
5 $77,273 Fee Simple Arm’s-Length None Inferior $81,136 Inferior Smaller Inferior Similar Similar $101,420 Inferior
8/09 0.0% 0.0% 0.0% 5.0% 5.0% 20.0% -5. 0% 10.0% 0.0% 0.0% 25.0%
$77,273—Low Low—$101,420
$176,309—High High—$224,001
$107,737—Average Average—$144,007
Compiled by Cushman & Wakefield Western, Inc.
VALUATION & ADVISORY CUSHMAN & WAKEFIELD®
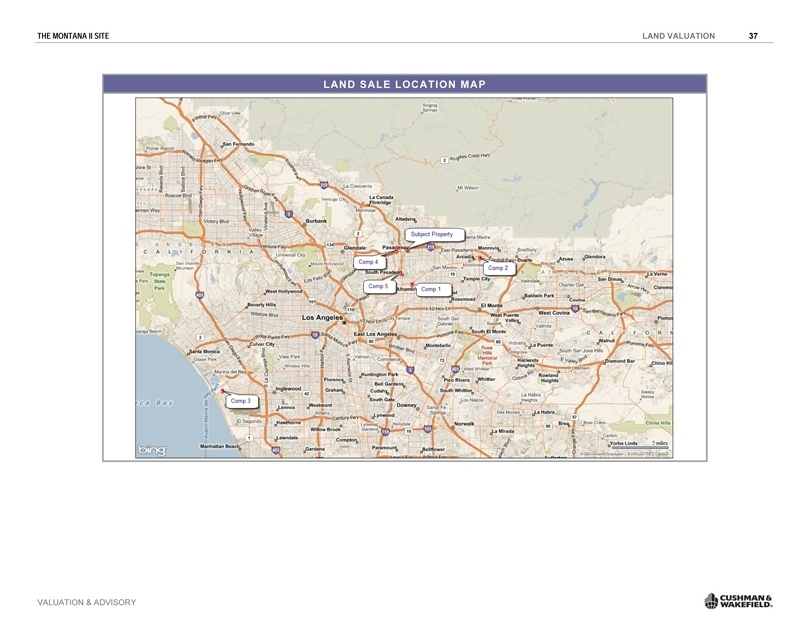 |
THE MONTANA II SITE LAND VALUATION 37
LAND SALE LOCATION MAP
VALUATION & ADVISORY CUSHMAN & WAKEFIELD®
THE MONTANA II SITE LAND VALUATION 38
IN Comparable 1 corresponds to the September 2010 sale of a 0.9-acre site located on the east side of Atlantic Boulevard sough of Mclean Street in Alhambra. The property was purchased by a local investor for future development of residential condominiums. The property was not entitled at sale. The purchase price of $2,650,000 is equal to $98,148 per unit.
Comparable 2 corresponds to the June 2010 sale of a 0.37-acre site located along the south side of Eldorado Street in the City of Arcadia, easterly of the Santa Anita racetrack and park. The property was purchased by a local buyer for $600,000 or $100,000 per unit based on the maximum permissible units under zoning. The property was unentitled at sale.
Comparable 3 summarizes the August 2010 sale of a 0.43-acre site located on the north side of Manchester Avenue, east of Gulana Avenue in Playa Del Rey. The corresponding street address is 7857-7869 Manchester Avenue. The site is zoned R3 and was purchased by Darius Khakshouri. The property is entitled for a 23-unit multifamily development. The property was purchased for $2,000,000 or $107 per-square-foot of land area or $89,957 per developable unit.
Comparable 4 corresponds to the December 2009 sale of portions of the former Ambassador College Campus located generally along the east side of Orange Gove Avenue between Colorado and Del Mar Boulevards in Pasadena. The property was entitled for 70 new condominium townhome units and had 19 apartment units, an historic mansion, and vacant academic buildings on the property at the time of sale. The property was purchased for its redevelopment and the buyer anticipated substantially renovating the existing apartment units and turning the mansion into a community amenity or selling it to a private individuals. The property was purchased from the lender subsequent to a foreclosure. The purchase price of $17,101,980 is equal to $176,309 per unit inclusive of the 19 apartment units.
Comparable 5 is the August 2009 purchased of a mixed use project site located at the southeast corner of Mission Street and Freemont Avenue in South Pasadena. The property was entitled for 6 commercial retail units, 5 live/work units and 11 townhome units targeted for live/work occupancy. At the time of sale, excavation and shoring had been completed. The property was purchased by a local developer who anticipated finishing the project. The purchase price of $1.7 million is equal to $77,273 per unit, inclusive of the commercial units.
DISCUSSION OF ADJUSTMENTS
PROPERTY RIGHTS CONVEYED
Since we are valuing the fee simple interest as reflected by each of the comparables, an adjustment for property rights is not required.
CONDITIONS OF SALE
Adjustments for conditions of sale usually reflect the motivations of the buyer and the seller. In many situations the conditions of sale may significantly affect transaction prices. Comparable 4 involves an REO and an upward adjustment was applied.
FINANCIAL TERMS
The financial terms of a transaction can have an impact on the sale price of a property. A buyer who purchases an asset with favorable financing might pay a higher price, as the reduced cost of debt creates a favorable debt coverage ratio. A transaction involving above-market debt will typically involve a lower purchase price tied to the lower equity returns after debt service. We analyzed all of the transactions to account for atypical financing terms. To the best of our knowledge, all of the sales used in this analysis were accomplished with cash or market-oriented financing. Therefore, no adjustments were required.
VALUATION & ADVISORY CUSHMAN & WAKEFIELD®
THE MONTANA II SITE LAND VALUATION 39
MARKET CONDITIONS
The sales that are included in this analysis occurred between August 2009 and September 2010. The land investment market has improved slightly in good locations in 2010 as evidenced by a greater level of land sale activity an more offers for available offerings. A modest upward adjustment was applied to the 2009 sales.
LOCATION
An adjustment for location is required when the locational characteristics of a comparable property differ from those of the subject property. The subject property has an excellent location in downtown Pasadena. Only Comparable 4 is located in Pasadena, which is the premier city in the San Gabriel Valley. Comparable 4’s micro location is somewhat inferior to the subject’s and a slight upward adjustment was applied. All of the other comparables are rated inferior to quite inferior to the subject. We have applied upward adjustments to the comparables as noted in the adjustment grid.
SIZE
The adjustment for size generally reflects the inverse relationship between unit price and lot size. Smaller lots tend to sell for higher unit prices than larger lots, and vice versa. Significantly larger parcels may sell for lower per-square-foot prices prior to other considerations because of more extended absorption periods and higher carrying costs. The subject site, at 0.76 acres, is bracketed by the comparables, which range from 0.37 to 7.36 acres. We applied size adjustments as indicated in the adjustment grid.
UTILITY
The adjustment for utility considers the site characteristics for the data relative to the subject, including whether the comparable properties are interior parcels with limited frontage (for example) and the overall shape of the site. The subject property is comprised of a generally rectangular site with a corner location that has very good overall utility. Most of the comparables are mid-block sites with less frontage than the subject and were adjusted upward for utility.
ZONING/DENSITY
The zoning for a property dictates permissible uses. The subject is zoned PD-31, which as noted in the Zoning section, is a project-specific zoning classification that essentially permits only The Montana II project or a very similar development to be constructed on the subject site. Most of the comparables have residential or commercial designations that permit residential use by right and no adjustments were required for permissible uses.
Incorporated into this adjustment is the unit yield per acre, which has a substantial impact on the price per unit paid for a site. Generally speaking, the lower the density the higher the price paid per unit, but the lower the price paid per-square-foot. The subject’s zoning/entitlements permit a unit yield of 29 units per acre, which is bracketed by the data which ranges from a yield of 13 to 53 units per acre. Since we are utilizing a per unit basis of comparison, lower density sites were adjusted downward and higher density sites were adjusted upward as indicated in the accompanying adjustment grid.
ENTITLEMENTS
The status of a property as being entitled for a particular development (that is, there are governmental approvals in place that will allow for a particular development) is superior to an unentitled status due to the time and expense associated with obtaining such approvals. Even in the case of a by-right development, considerable time and capital is expended to obtain approvals, particularly if an Environmental Impact Report is required. The subject property is entitled for the proposed project. The subject ownership spent several years obtaining the approvals in place. Based on discussions with City of Pasadena Planning staff, one could anticipate a possible 3
VALUATION & ADVISORY CUSHMAN & WAKEFIELD®
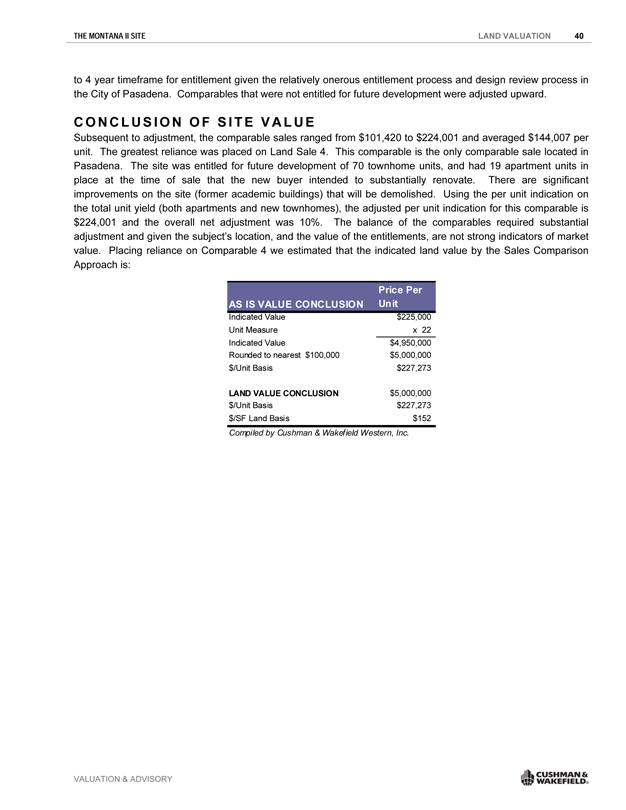
THE MONTANA II SITE LAND VALUATION 40
to 4 year timeframe for entitlement given the relatively onerous entitlement process and design review process in the City of Pasadena. Comparables that were not entitled for future development were adjusted upward.
CONCLUSION OF SITE VALUE
Subsequent to adjustment, the comparable sales ranged from $101,420 to $224,001 and averaged $144,007 per unit. The greatest reliance was placed on Land Sale 4. This comparable is the only comparable sale located in Pasadena. The site was entitled for future development of 70 townhome units, and had 19 apartment units in place at the time of sale that the new buyer intended to substantially renovate. There are significant improvements on the site (former academic buildings) that will be demolished. Using the per unit indication on the total unit yield (both apartments and new townhomes), the adjusted per unit indication for this comparable is $224,001 and the overall net adjustment was 10%. The balance of the comparables required substantial adjustment and given the subject’s location, and the value of the entitlements, are not strong indicators of market value. Placing reliance on Comparable 4 we estimated that the indicated land value by the Sales Comparison Approach is:
Price Per
AS IS VALUE CONCLUSION Unit
Indicated Value $225,000
Unit Measure x 22
Indicated Value $4,950,000
Rounded to nearest $100,000 $5,000,000
$/Unit Basis $227,273
LAND VALUE CONCLUSION $5,000,000
$/Unit Basis $227,273
$/SF Land Basis $152
Compiled by Cushman & Wakefield Western, Inc.
VALUATION & ADVISORY CUSHMAN & WAKEFIELD®
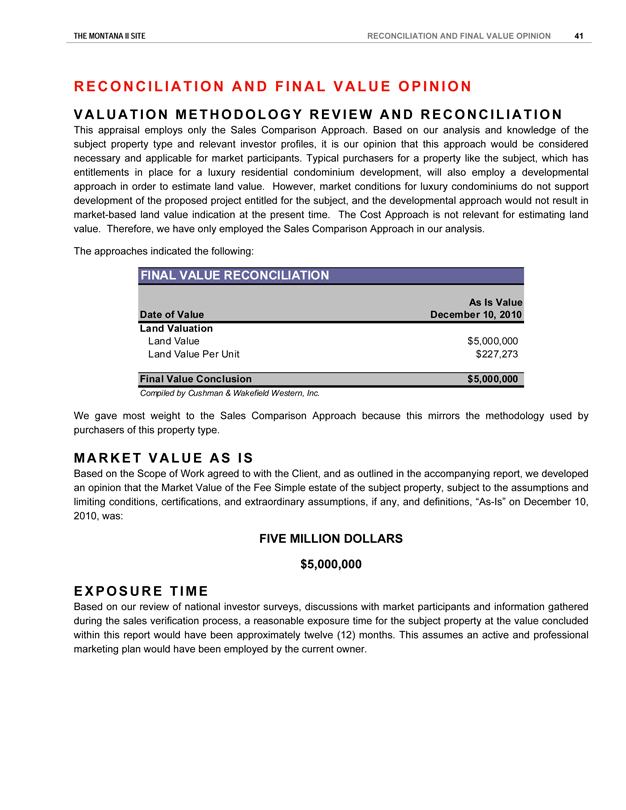
THE MONTANA II SITE RECONCILIATION AND FINAL VALUE OPINION 41
RECONCILIATION AND FINAL VALUE OPINION
VALUATION METHODOLOGY REVIEW AND RECONCILIATION
This appraisal employs only the Sales Comparison Approach. Based on our analysis and knowledge of the subject property type and relevant investor profiles, it is our opinion that this approach would be considered necessary and applicable for market participants. Typical purchasers for a property like the subject, which has entitlements in place for a luxury residential condominium development, will also employ a developmental approach in order to estimate land value. However, market conditions for luxury condominiums do not support development of the proposed project entitled for the subject, and the developmental approach would not result in market-based land value indication at the present time. The Cost Approach is not relevant for estimating land value. Therefore, we have only employed the Sales Comparison Approach in our analysis.
The approaches indicated the following:
FINAL VALUE RECONCILIATION
As Is Value
Date of Value December 10, 2010
Land Valuation
Land Value $5,000,000
Land Value Per Unit $227,273
Final Value Conclusion $5,000,000
Compiled by Cushman & Wakefield Western, Inc.
We gave most weight to the Sales Comparison Approach because this mirrors the methodology used by purchasers of this property type.
MARKET VALUE AS IS
Based on the Scope of Work agreed to with the Client, and as outlined in the accompanying report, we developed an opinion that the Market Value of the Fee Simple estate of the subject property, subject to the assumptions and limiting conditions, certifications, and extraordinary assumptions, if any, and definitions, “As-Is” on December 10, 2010, was:
FIVE MILLION DOLLARS
$5,000,000
EXPOSURE TIME
Based on our review of national investor surveys, discussions with market participants and information gathered during the sales verification process, a reasonable exposure time for the subject property at the value concluded within this report would have been approximately twelve (12) months. This assumes an active and professional marketing plan would have been employed by the current owner.
VALUATION & ADVISORY CUSHMAN & WAKEFIELD®
THE MONTANA II SITE ASSUMPTIONS AND LIMITING CONDITIONS 42
ASSUMPTIONS AND LIMITING CONDITIONS
“Report” means the appraisal or consulting report and conclusions stated therein, to which these Assumptions and Limiting Conditions are annexed. “Property” means the subject of the Report. “C&W” means Cushman & Wakefield, Inc. or its subsidiary that issued the Report. “Appraiser(s)” means the employee(s) of C&W who prepared and signed the Report. The Report has been made subject to the following assumptions and limiting conditions:
. No opinion is intended to be expressed and no responsibility is assumed for the legal description or for any matters that are legal in nature or require legal expertise or specialized knowledge beyond that of a real estate appraiser. Title to the Property is assumed to be good and marketable and the Property is assumed to be free and clear of all liens unless otherwise stated. No survey of the Property was undertaken.
. The information contained in the Report or upon which the Report is based has been gathered from sources the Appraiser assumes to be reliable and accurate. The owner of the Property may have provided some of such information. Neither the Appraiser nor C&W shall be responsible for the accuracy or completeness of such information, including the correctness of estimates, opinions, dimensions, sketches, exhibits and factual matters. Any authorized user of the Report is obligated to bring to the attention of C&W any inaccuracies or errors that it believes are contained in the Report.
. The opinions are only as of the date stated in the Report. Changes since that date in external and market factors or in the Property itself can significantly affect the conclusions in the Report.
. The Report is to be used in whole and not in part. No part of the Report shall be used in conjunction with any other analyses. Publication of the Report or any portion thereof without the prior written consent of C&W is prohibited. Reference to the Appraisal Institute or to the MAI designation is prohibited. Except as may be otherwise stated in the letter of engagement, the Report may not be used by any person(s) other than the party(ies) to whom it is addressed or for purposes other than that for which it was prepared. No part of the Report shall be conveyed to the public through advertising, or used in any sales, promotion, offering or SEC material without C&W’s prior written consent. Any authorized user(s) of this Report who provides a copy to, or permits reliance thereon by, any person or entity not authorized by C&W in writing to use or rely thereon, hereby agrees to indemnify and hold C&W, its affiliates and their respective shareholders, directors, officers and employees, harmless from and against all damages, expenses, claims and costs, including attorneys’ fees, incurred in investigating and defending any claim arising from or in any way connected to the use of, or reliance upon, the Report by any such unauthorized person(s) or entity(ies).
. Except as may be otherwise stated in the letter of engagement, the Appraiser shall not be required to give testimony in any court or administrative proceeding relating to the Property or the Appraisal.
. The Report assumes (a) responsible ownership and competent management of the Property; (b) there are no hidden or unapparent conditions of the Property, subsoil or structures that render the Property more or less valuable (no responsibility is assumed for such conditions or for arranging for engineering studies that may be required to discover them); (c) full compliance with all applicable federal, state and local zoning and environmental regulations and laws, unless noncompliance is stated, defined and considered in the Report; and (d) all required licenses, certificates of occupancy and other governmental consents have been or can be obtained and renewed for any use on which the value opinion contained in the Report is based.
. The physical condition of the improvements considered by the Report is based on visual inspection by the Appraiser or other person identified in the Report. C&W assumes no responsibility for the soundness of structural components or for the condition of mechanical equipment, plumbing or electrical components.
. The forecasted potential gross income referred to in the Report may be based on lease summaries provided by the owner or third parties. The Report assumes no responsibility for the authenticity or completeness of lease information provided by others. C&W recommends that legal advice be obtained regarding the interpretation of lease provisions and the contractual rights of parties.
VALUATION & ADVISORY CUSHMAN & WAKEFIELD®
THE MONTANA II SITE ASSUMPTIONS AND LIMITING CONDITIONS 43
. The forecasts of income and expenses are not predictions of the future. Rather, they are the Appraiser’s best opinions of current market thinking on future income and expenses. The Appraiser and C&W make no warranty or representation that these forecasts will materialize. The real estate market is constantly fluctuating and changing. It is not the Appraiser’s task to predict or in any way warrant the conditions of a future real estate market; the Appraiser can only reflect what the investment community, as of the date of the Report, envisages for the future in terms of rental rates, expenses, and supply and demand.
. Unless otherwise stated in the Report, the existence of potentially hazardous or toxic materials that may have been used in the construction or maintenance of the improvements or may be located at or about the Property was not considered in arriving at the opinion of value. These materials (such as formaldehyde foam insulation, asbestos insulation and other potentially hazardous materials) may adversely affect the value of the Property. The Appraisers are not qualified to detect such substances. C&W recommends that an environmental expert be employed to determine the impact of these matters on the opinion of value.
. Unless otherwise stated in the Report, compliance with the requirements of the Americans with Disabilities Act of 1990 (ADA) has not been considered in arriving at the opinion of value. Failure to comply with the requirements of the ADA may adversely affect the value of the Property. C&W recommends that an expert in this field be employed to determine the compliance of the Property with the requirements of the ADA and the impact of these matters on the opinion of value.
. If the Report is submitted to a lender or investor with the prior approval of C&W, such party should consider this Report as only one factor, together with its independent investment considerations and underwriting criteria, in its overall investment decision. Such lender or investor is specifically cautioned to understand all Extraordinary Assumptions and Hypothetical Conditions and the Assumptions and Limiting Conditions incorporated in this Report.
. In the event of a claim against C&W or its affiliates or their respective officers or employees or the Appraisers in connection with or in any way relating to this Report or this engagement, the maximum damages recoverable shall be the amount of the monies actually collected by C&W or its affiliates for this Report and under no circumstances shall any claim for consequential damages be made.
. If the Report is referred to or included in any offering material or prospectus, the Report shall be deemed referred to or included for informational purposes only and C&W, its employees and the Appraiser have no liability to such recipients. C&W disclaims any and all liability to any party other than the party that retained C&W to prepare the Report.
. Any estimate of insurable value, if included within the agreed upon scope of work and presented within this report, is based upon figures derived from a national cost estimating service and is developed consistent with industry practices. However, actual local and regional construction costs may vary significantly from our estimate and individual insurance policies and underwriters have varied specifications, exclusions, and non-insurable items. As such, we strongly recommend that the Client obtain estimates from professionals experienced in establishing insurance coverage for replacing any structure. This analysis should not be relied upon to determine insurance coverage. Furthermore, we make no warranties regarding the accuracy of this estimate.
. By use of this Report each party that uses this Report agrees to be bound by all of the Assumptions and Limiting Conditions, Hypothetical Conditions and Extraordinary Assumptions stated herein.
VALUATION & ADVISORY CUSHMAN & WAKEFIELD®
THE MONTANA II SITE CERTIFICATION OF APPRAISAL 44
CERTIFICATION OF APPRAISAL
We certify that, to the best of our knowledge and belief:
. The statements of fact contained in this report are true and correct.
. The reported analyses, opinions, and conclusions are limited only by the reported assumptions and limiting conditions, and are our personal, impartial, and unbiased professional analyses, opinions, and conclusions.
. We have no present or prospective interest in the property that is the subject of this report, and no personal interest with respect to the parties involved.
. We have no bias with respect to the property that is the subject of this report or to the parties involved with this assignment.
. Our engagement in this assignment was not contingent upon developing or reporting predetermined results.
. Our compensation for completing this assignment is not contingent upon the development or reporting of a predetermined value or direction in value that favors the cause of the client, the amount of the value opinion, the attainment of a stipulated result, or the occurrence of a subsequent event directly related to the intended use of this appraisal.
. The reported analyses, opinions, and conclusions were developed, and this report has been prepared, in conformity with the requirements of the Code of Professional Ethics & Standards of Professional Appraisal Practice of the Appraisal Institute, which include the Uniform Standards of Professional Appraisal Practice.
. The use of this report is subject to the requirements of the Appraisal Institute relating to review by its duly authorized representatives.
. Michele Kauffman and James W. Myers, MAI did make a personal inspection of the property that is the subject of this report.
. The signatories have not performed a previous appraisal of the subject property within the three years prior to this assignment.
. No one provided significant real property appraisal assistance to the persons signing this report.
. As of the date of this report, James W. Myers, MAI has completed the continuing education program of the Appraisal Institute.
. As of the date of this report, Michele Kauffman has completed the Standards and Ethics Education Requirement of the Appraisal Institute for Associate Members.
Michele Kauffman
Senior Director
CA Certified General Appraiser
License No. AG042324
michele.kauffman@cushwake.com
(213) 955-6495 Office Direct
(213) 627-4044 Fax
James W. Myers, MAI
Executive Managing Director
CA Certified General Appraiser
License No. AG002662
jim.myers@cushwake.com
(213) 955-6493 Office Direct
(213) 627-4044 Fax
VALUATION & ADVISORY CUSHMAN & WAKEFIELD®
THE MONTANA II SITE GLOSSARY OF TERMS & DEFINITIONS 45
GLOSSARY OF TERMS & DEFINITIONS
The following definitions of pertinent terms are taken from The Dictionary of Real Estate Appraisal, Fifth Edition (2010), published by the Appraisal Institute, Chicago, IL, as well as other sources.
AS IS MARKET VALUE
The estimate of the market value of real property in its current physical condition, use, and zoning as of the appraisal date. (Proposed Interagency Appraisal and Evaluation Guidelines, OCC-4810-33-P 20%)
BAND OF INVESTMENT
A technique in which the capitalization rates attributable to components of a capital investment are weighted and combined to derive a weighted-average rate attributable to the total investment.
CASH EQUIVALENCY
An analytical process in which the sale price of a transaction with nonmarket financing or financing with unusual conditions or incentives is converted into a price expressed in terms of cash.
DEPRECIATION
1. In appraising, a loss in property value from any cause; the difference between the cost of an improvement on the effective date of the appraisal and the market value of the improvement on the same date. 2. In accounting, an allowance made against the loss in value of an asset for a defined purpose and computed using a specified method.
ELLWOOD FORMULA
A yield capitalization method that provides a formulaic solution for developing a capitalization rate for various combinations of equity yields and mortgage terms. The formula is applicable only to properties with stable or stabilized income streams and properties with income streams expected to change according to the J- or K-factor pattern. The formula is RO = [YE – M (YE + P 1/Sn¬ – RM) – ?O 1/S n¬] / [1 + ?I J] where RO = Overall Capitalization Rate YE = Equity Yield Rate M = Loan-to-Value Ratio P = Percentage of Loan Paid Off 1/S n¬ = Sinking Fund Factor at the Equity Yield Rate RM =Mortgage Capitalization Rate ?O = Change in Total Property Value ?I = Total Ratio Change in Income J = J Factor Also called mortgage-equity formula.
EXPOSURE TIME
1. The time a property remains on the market. 2. The estimated length of time the property interest being appraised would have been offered on the market prior to the hypothetical consummation of a sale at market value on the effective date of the appraisal; a retrospective estimate based on an analysis of past events assuming a competitive and open market. See also marketing time.
FEE SIMPLE ESTATE
Absolute ownership unencumbered by any other interest or estate, subject only to the limitations imposed by the governmental powers of taxation, eminent domain, police power, and escheat.
HYPOTHETICAL CONDITIONS
A hypothetical condition is “that which is contrary to what exists but is supposed for the purpose of analysis. Hypothetical conditions assume conditions contrary to known facts about physical, legal, or economic characteristics of the subject property; or about conditions external to the property, such as market conditions or trends; or about the integrity of data used in an analysis.”
INSURABLE VALUE
A type of value for insurance purposes.
LEASED FEE INTEREST
A freehold (ownership interest) where the possessory interest has been granted to another party by creation of a contractual landlord-tenant relationship (i.e., a lease).
LEASEHOLD INTEREST
The tenant’s possessory interest created by a lease. See also negative leasehold; positive leasehold.
MARKET RENT
The most probable rent that a property should bring in a competitive and open market reflecting all conditions and restrictions of the lease agreement, including permitted uses, use restrictions, expense obligations, term, concessions, renewal and purchase options, and tenant improvements (TIs).
VALUATION & ADVISORY CUSHMAN & WAKEFIELD®
THE MONTANA II SITE GLOSSARY OF TERMS & DEFINITIONS 46
MARKET VALUE
The major focus of most real property appraisal assignments. Both economic and legal definitions of market value have been developed and refined.* 1. The most widely accepted components of market value are incorporated in the following definition: The most probable price that the specified property interest should sell for in a competitive market after a reasonable exposure time, as of a specified date, in cash, or in terms equivalent to cash, under all conditions requisite to a fair sale, with the buyer and seller each acting prudently, knowledgeably, for self-interest, and assuming that neither is under duress. 2. Market value is described in the Uniform Standards of Professional Appraisal Practice (USPAP) as follows: A type of value, stated as an opinion, that presumes the transfer of a property (i.e., a right of ownership or a bundle of such rights), as of a certain date, under specific conditions set forth in the definition of the term identified by the appraiser as applicable in an appraisal. (USPAP, 2010-2011 ed.) USPAP also requires that certain items be included in every appraisal report. Among these items, the following are directly related to the definition of market value:
. Identification of the specific property rights to be appraised.
. Statement of the effective date of the value opinion.
. Specification as to whether cash, terms equivalent to cash, or other precisely described financing terms are assumed as the basis of the appraisal.
. If the appraisal is conditioned upon financing or other terms, specification as to whether the financing or terms are at, below, or above market interest rates and/or contain unusual conditions or incentives. The terms of above- or below-market interest rates and/or other special incentives must be clearly set forth; their contribution to, or negative influence on, value must be described and estimated; and the market data supporting the opinion of value must be described and explained. 3. The following definition of market value is used by agencies that regulate federally insured financial institutions in the United States: The most probable price that a property should bring in a competitive and open market under all conditions requisite to a fair sale, the buyer and seller each acting prudently and knowledgeably, and assuming the price is not affected by undue stimulus. Implicit in this definition is the consummation of a sale as of a specified date and the passing of title from seller to buyer under conditions whereby:
. Buyer and seller are typically motivated;
. Both parties are well informed or well advised, and acting in what they consider their own best interests;
. A reasonable time is allowed for exposure in the open market;
. Payment is made in terms of cash in U.S. dollars or in terms of financial arrangements comparable thereto; and
. The price represents the normal consideration for the property sold unaffected by special or creative financing or sales concessions granted by anyone associated with the sale. (12 C.F.R. Part 34.42(g); 55 Federal Register 34696, August 24, 1990, as amended at 57 Federal Register 12202, April 9, 1992; 59 Federal Register 29499, June 7, 1994) 4. The International Valuation Standards Council defines market value for the purpose of international standards as follows: The estimated amount for which a property should exchange on the date of valuation between a willing buyer and a willing seller in an arm’s-length transaction after proper marketing wherein the parties had each acted knowledgeably, prudently, and without compulsion. (International Valuation Standards, 8th ed., 2007) 5. Market value is the amount in cash, or on terms reasonably equivalent to cash, for which in all probability the property would have sold on the effective date of the appraisal, after a reasonable exposure time on the open competitive market, from a willing and reasonably knowledgeable seller to a willing and reasonably knowledgeable buyer, with neither acting under any compulsion to buy or sell, giving due consideration to all available economic uses of the property at the time of the appraisal. (Uniform Standards for Federal Land Acquisitions)
MORTGAGE-EQUITY ANALYSIS
Capitalization and investment analysis procedures that recognize how mortgage terms and equity requirements affect the value of income-producing property.
OPERATING EXPENSES
Other Taxes, Fees & Permits—Personal property taxes, sales taxes, utility taxes, fees and permit expenses.
Property Insurance – Coverage for loss or damage to the property caused by the perils of fire, lightning, extended coverage perils, vandalism and malicious mischief, and additional perils.
Management Fees—The sum paid for management services. Management services may be contracted for or provided by the property owner. Management expenses may include supervision, on-site offices or apartments for resident managers, telephone service, clerical help, legal or accounting services, printing and postage, and advertising. Management fees may occasionally be included among recoverable operating expenses
Total Administrative Fees – Depending on the nature of the real estate, these usually include professional fees and other general administrative expenses, such as rent of offices and the services needed to operate the property. Administrative expenses can be provided either in the following expense subcategories or in a bulk total. 1) Professional Fees – Fees paid for any professional services contracted for or incurred in property operation; or 2) Other Administrative – Any other general administrative expenses incurred in property operation.
Heating Fuel—The cost of heating fuel purchased from outside producers. The cost of heat is generally a tenant expense in single-tenant, industrial or retail properties, and apartment projects with individual heating units. It is a major expense item shown in operating statements for office buildings and many apartment properties. The fuel consumed may be coal, oil, or public steam. Heating supplies, maintenance, and workers’ wages are included in this expense category under certain accounting methods.
Electricity -The cost of electricity purchased from outside producers. Although the cost of electricity for leased space is frequently a tenant expense, and therefore not included in the operating expense statement, the owner may be responsible for lighting public areas and for the power needed to run elevators and other building equipment.
Gas—The cost of gas purchased from outside producers. When used for heating and air conditioning, gas can be a major expense item that is either paid by the tenant or reflected in the rent.
Water & Sewer—The cost of water consumed, including water specially treated for the circulating ice water system, or purchased for drinking purposes. The cost of water is a major consideration for industrial plants that use processes depending on water and for multifamily projects, in which the cost of sewer service usually ties to the amount of water used. It is also an important consideration for laundries, restaurants, taverns, hotels, and similar operations.
VALUATION & ADVISORY CUSHMAN & WAKEFIELD®
THE MONTANA II SITE GLOSSARY OF TERMS & DEFINITIONS 47
Other Utilities—The cost of other utilities purchased from outside producers.
Total Utilities—The cost of utilities net of energy sales to stores and others. Utilities are services rendered by public and private utility companies (e.g., electricity, gas, heating fuel, water/sewer and other utilities providers). Utility expenses can be provided either in expense subcategories or in a bulk total. Repairs & Maintenance—All expenses incurred for the general repairs and maintenance of the building, including common areas and general upkeep.
Repairs and maintenance expenses include elevator, HVAC, electrical and plumbing, structural/roof, and other repairs and maintenance expense items. Repairs and Maintenance expenses can be provided either in the following expense subcategories or in a bulk total. 1) Elevator—The expense of the contract and any additional expenses for elevator repairs and maintenance. This expense item may also include escalator repairs and maintenance. 2) HVAC – The expense of the contract and any additional expenses for heating, ventilation and air-conditioning systems. 3) Electrical & Plumbing—Theexpense of all repairs and maintenance associated with the property’s electrical and plumbing systems. 4) Structural/Roof—The expense of all repairs and maintenance associated with the property’s building structure and roof. 5) Pest Control – The expense of insect and rodent control. 6). Other Repairs &Maintenance—The cost of any other repairs and maintenance items not specifically included in other expense categories.
Common Area Maintenance—The common area is the total area within a property that is not designed for sale or rental, but is available for common use by all owners, tenants, or their invitees, e.g., parking and its appurtenances, malls, sidewalks, landscaped areas, recreation areas, public toilets, truck and service facilities. Common Area Maintenance (CAM) expenses can be entered in bulk or through the sub-categories. 1) Utilities – Cost of utilities that are included in CAM charges and passed through to tenants. 2) Repair & Maintenance – Cost of repair and maintenance items that are included in CAM charges and passed through to tenants. 3) Parking Lot Maintenance – Cost of parking lot maintenance items that are included in CAM charges and passed through to tenants. 4) Snow Removal – Cost of snow removal that are included in CAM charges and passed through to tenants. 5) Grounds Maintenance – Cost of ground maintenance items that are included in CAM charges and passed through to tenants. 6) Other CAM expenses are items that are included in CAM charges and passed through to tenants.
Painting & Decorating—This expense category is relevant to residential properties where the landlord is required to prepare a dwelling unit for occupancy in between tenancies.
Cleaning & Janitorial—The expenses for building cleaning and janitorial services, for both daytime and night-time cleaning and janitorial service for tenant spaces, public areas, atriums, elevators, restrooms, windows, etc. Cleaning and Janitorial expenses can be provided either in the following subcategories or entered in a bulk total. 1) Contract Services—The expense of cleaning and janitorial services contracted for with outside service providers. 2) Supplies, Materials & Misc.—The cost any cleaning materials and any other janitorial supplies required for property cleaning and janitorial services and not covered else where. 3) Trash Removal—The expense of property trash and rubbish removal and related services. Sometimes this expense item includes the cost of pest control and/or snow removal .4) Other Cleaning/Janitorial—Any other cleaning and janitorial related expenses not included in other specific expense categories.
Advertising & Promotion—Expenses related to advertising, promotion, sales, and publicity and all related printing, stationary, artwork, magazine space, broadcasting, and postage related to marketing.
Professional Fees—All professional fees associated with property leasing activities including legal, accounting, data processing, and auditing costs to the extent necessary to satisfy tenant lease requirements and permanent lender requirements.
Total Payroll—The payroll expenses for all employees involved in the ongoing operation of the property, but whose salaries and wages are not included in other expense categories. Payroll expenses can be provided either in the following subcategories or entered in a bulk total. 1) Administrative Payroll – The payroll expenses for all employees involved in on-going property administration. 2) Repair & Maintenance Payroll—The expense of all employees involved inon-going repairs and maintenance of the property. 3) Cleaning Payroll—The expense of all employees involved in providing on-going cleaning and janitorial services to the property 4) Other Payroll—The expense of any other employees involved in providing services to the property not covered in other specific categories.
Security—Expenses related to the security of the Lessees and the Property. This expense item includes payroll, contract services and other security expenses not covered in other expense categories. This item also includes the expense of maintenance of security systems such as alarms and closed circuit television (CCTV), and ordinary supplies necessary to operate a security program, including batteries, control forms, access cards, and security uniforms.
Roads & Grounds—The cost of maintaining the grounds and parking areas of the property. This expense can vary widely depending on the type of property and its total area. Landscaping improvements can range from none to extensive beds,
gardens and trees. In addition, hard-surfaced public parking areas with drains, lights, and marked car spaces are subject to intensive wear and can be costly to maintain.
Other Operating Expenses—Any other expenses incurred in the operation of the property not specifically covered elsewhere.
Real Estate Taxes—The tax levied on real estate (i.e., on the land, appurtenances, improvements, structures and buildings); typically by the state, county and/or municipality in which the property is located.
PROSPECTIVE OPINION OF VALUE
A value opinion effective as of a specified future date. The term does not define a type of value. Instead, it identifies a value opinion as being effective at some specific future date. An opinion of value as of a prospective date is frequently sought in connection with projects that are proposed, under construction, or under conversion to a new use, or those that have not yet achieved sellout or a stabilized level of long-term occupancy.
PROSPECTIVE VALUE UPON REACHING STABILIZED OCCUPANCY
The value of a property as of a point in time when all improvements have been physically constructed and the property has been leased to its optimum level of long-term occupancy. At such point, all capital outlays for tenant improvements, leasing commissions, marketing costs and other carrying charges are assumed to have been incurred.
SPECIAL, UNUSUAL, OR EXTRAORDINARY ASSUMPTIONS
Before completing the acquisition of a property, a prudent purchaser in the market typically exercises due diligence by making customary enquiries about the property. It is normal for a Valuer to make assumptions as to the most likely outcome of this due diligence process and to rely on actual information regarding such matters as provided by the client. Special, unusual, or extraordinary assumptions may be any additional assumptions relating to matters covered in the due diligence process, or may relate to other issues, such as the identity of the purchaser, the physical state of the property, the presence of environmental pollutants (e.g., ground water contamination), or the ability to redevelop the property.
VALUATION & ADVISORY CUSHMAN & WAKEFIELD®

THE MONTANA II SITE ADDENDA CONTENTS
ADDENDA CONTENTS
ADDENDUM A: QUALIFICATIONS OF THE APPRAISERS
VALUATION & ADVISORY CUSHMAN & WAKEFIELD®
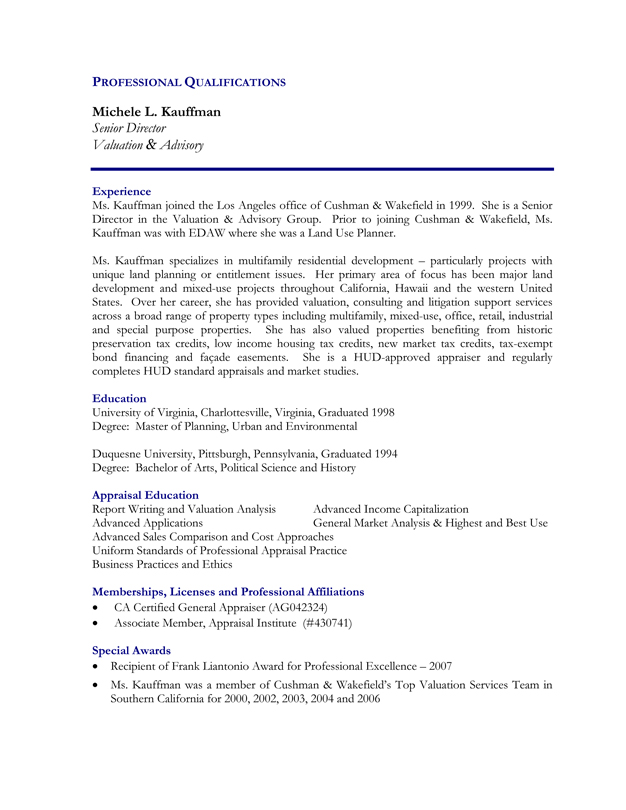
PROFESSIONAL QUALIFICATIONS
Michele L. Kauffman
Senior Director
Valuation & Advisory
Experience
Ms. Kauffman joined the Los Angeles office of Cushman & Wakefield in 1999. She is a Senior Director in the Valuation & Advisory Group. Prior to joining Cushman & Wakefield, Ms. Kauffman was with EDAW where she was a Land Use Planner.
Ms. Kauffman specializes in multifamily residential development – particularly projects with unique land planning or entitlement issues. Her primary area of focus has been major land development and mixed-use projects throughout California, Hawaii and the western United States. Over her career, she has provided valuation, consulting and litigation support services across a broad range of property types including multifamily, mixed-use, office, retail, industrial and special purpose properties. She has also valued properties benefiting from historic preservation tax credits, low income housing tax credits, new market tax credits, tax-exempt bond financing and façade easements. She is a HUD-approved appraiser and regularly completes HUD standard appraisals and market studies.
Education
University of Virginia, Charlottesville, Virginia, Graduated 1998 Degree: Master of Planning, Urban and Environmental
Duquesne University, Pittsburgh, Pennsylvania, Graduated 1994 Degree: Bachelor of Arts, Political Science and History
Appraisal Education
Report Writing and Valuation Analysis Advanced Income Capitalization
Advanced Applications General Market Analysis & Highest and Best Use
Advanced Sales Comparison and Cost Approaches
Uniform Standards of Professional Appraisal Practice
Business Practices and Ethics
Memberships, Licenses and Professional Affiliations
CA Certified General Appraiser (AG042324)
Associate Member, Appraisal Institute (#430741)
Special Awards
Recipient of Frank Liantonio Award for Professional Excellence – 2007
Ms. Kauffman was a member of Cushman & Wakefield’s Top Valuation Services Team in Southern California for 2000, 2002, 2003, 2004 and 2006
VALUATION & ADVISORY CUSHMAN & WAKEFIELD®
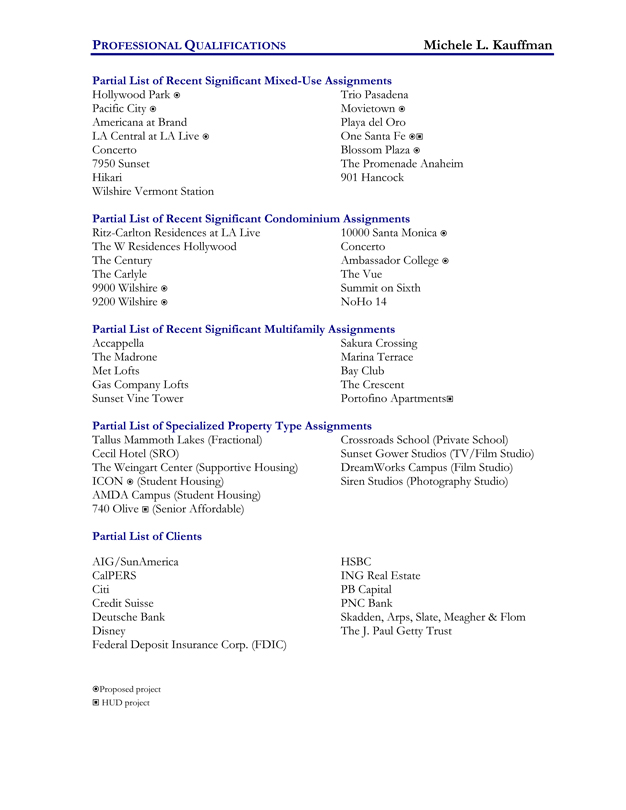
PROFESSIONAL QUALIFICATIONS Michele L. Kauffman
Partial List of Recent Significant Mixed-Use Assignments
Hollywood Park € Trio Pasadena
Pacific City € Movietown €
Americana at Brand Playa del Oro
LA Central at LA Live € One Santa Fe €
Concerto Blossom Plaza €
7950 Sunset The Promenade Anaheim
Hikari 901 Hancock
Wilshire Vermont Station
Partial List of Recent Significant Condominium Assignments
Ritz-Carlton Residences at LA Live 10000 Santa Monica €
The W Residences Hollywood Concerto
The Century Ambassador College €
The Carlyle The Vue
9900 Wilshire € Summit on Sixth
9200 Wilshire € NoHo 14
Partial List of Recent Significant Multifamily Assignments
Accappella Sakura Crossing
The Madrone Marina Terrace
Met Lofts Bay Club
Gas Company Lofts The Crescent
Sunset Vine Tower Portofino Apartments
Partial List of Specialized Property Type Assignments
Tallus Mammoth Lakes (Fractional) Crossroads School (Private School)
Cecil Hotel (SRO) Sunset Gower Studios (TV/Film Studio)
The Weingart Center (Supportive Housing) DreamWorks Campus (Film Studio)
ICON € (Student Housing) Siren Studios (Photography Studio)
AMDA Campus (Student Housing)
740 Olive (Senior Affordable)
Partial List of Clients
AIG/SunAmerica HSBC
CalPERS ING Real Estate
Citi PB Capital
Credit Suisse PNC Bank
Deutsche Bank Skadden, Arps, Slate, Meagher & Flom
Disney The J. Paul Getty Trust
Federal Deposit Insurance Corp. (FDIC)
€Proposed project
HUD project
 |
STATE OF CALIFORNIA
Business, Transportation & Housing Agency
OFFICE OF REAL ESTATE APPRAISERS
REAL ESTATE APPRAISER LICENSE
OREA APPRAISER IDENTIFACATION NUMBER AG042324
MICHELE L. KAUFFMAN
Has successfully met the requirements for a license as a general real estate appraiser in the State of California and is, therefore, entitled to use the title “ Certified General Real Estate Appraiser”.
This license has been issued in accordance with the provisions of the Real Estate Appraisers’ Licensing and Certification Law.
OFFICE OF REAL ESTATE APPRAISERS
Date Issued: April 4, 2009
Date Expires: April 3, 2011
Audit No: 115540
THIS DOCUMENT CONTAINS A TRUE WATERMARK – HOLD UP TO LIGHT TO SEE “ SAFE” AND “VERIFY FIRST”
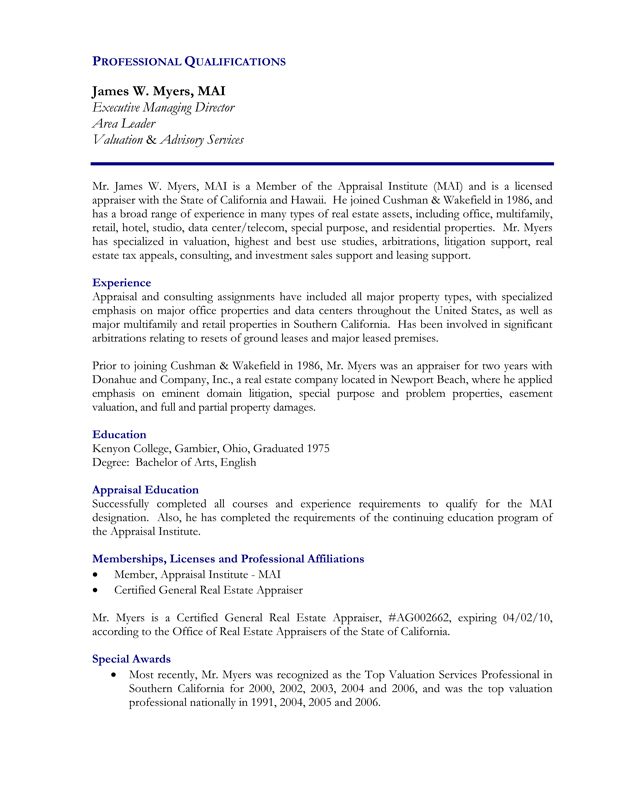
PROFESSIONAL QUALIFICATIONS
James W. Myers, MAI
Executive Managing Director
Area Leader
Valuation & Advisory Services
Mr. James W. Myers, MAI is a Member of the Appraisal Institute (MAI) and is a licensed appraiser with the State of California and Hawaii. He joined Cushman & Wakefield in 1986, and has a broad range of experience in many types of real estate assets, including office, multifamily, retail, hotel, studio, data center/telecom, special purpose, and residential properties. Mr. Myers has specialized in valuation, highest and best use studies, arbitrations, litigation support, real estate tax appeals, consulting, and investment sales support and leasing support.
Experience
Appraisal and consulting assignments have included all major property types, with specialized emphasis on major office properties and data centers throughout the United States, as well as major multifamily and retail properties in Southern California. Has been involved in significant arbitrations relating to resets of ground leases and major leased premises.
Prior to joining Cushman & Wakefield in 1986, Mr. Myers was an appraiser for two years with Donahue and Company, Inc., a real estate company located in Newport Beach, where he applied emphasis on eminent domain litigation, special purpose and problem properties, easement valuation, and full and partial property damages.
Education
Kenyon College, Gambier, Ohio, Graduated 1975 Degree: Bachelor of Arts, English
Appraisal Education
Successfully completed all courses and experience requirements to qualify for the MAI designation. Also, he has completed the requirements of the continuing education program of the Appraisal Institute.
Memberships, Licenses and Professional Affiliations
Member, Appraisal Institute—MAI
Certified General Real Estate Appraiser
Mr. Myers is a Certified General Real Estate Appraiser, #AG002662, expiring 04/02/10, according to the Office of Real Estate Appraisers of the State of California.
Special Awards
• Most recently, Mr. Myers was recognized as the Top Valuation Services Professional in Southern California for 2000, 2002, 2003, 2004 and 2006, and was the top valuation professional nationally in 1991, 2004, 2005 and 2006.
 |
STATE OF CALIFORNIA
Business, Transportation & Housing Agency
OFFICE OF REAL ESTATE APPRAISERS
REAL ESTATE APPRAISER LICENSE
OREA APPRAISER IDENTIFACATION NUMBER AG002662
JAMES W. MYERS
Has successfully met the requirements for a license as a general real estate appraiser in the State of California and is, therefore, entitled to use the title “ Certified General Real Estate Appraiser”.
This license has been issued in accordance with the provisions of the Real Estate Appraisers’ Licensing and Certification Law.
OFFICE OF REAL ESTATE APPRAISERS
Date Issued: April 3, 2009
Date Expires: April 2, 2011
Audit No: 125476
THIS DOCUMENT CONTAINS A TRUE WATERMARK – HOLD UP TO LIGHT TO SEE “ SAFE” AND “VERIFY FIRST”

THE MONTANA II SITE ADDENDA CONTENTS
ADDENDUM A: QUALIFICATIONS OF THE APPRAISERS
VALUATION & ADVISORY CUSHMAN & WAKEFIELD®