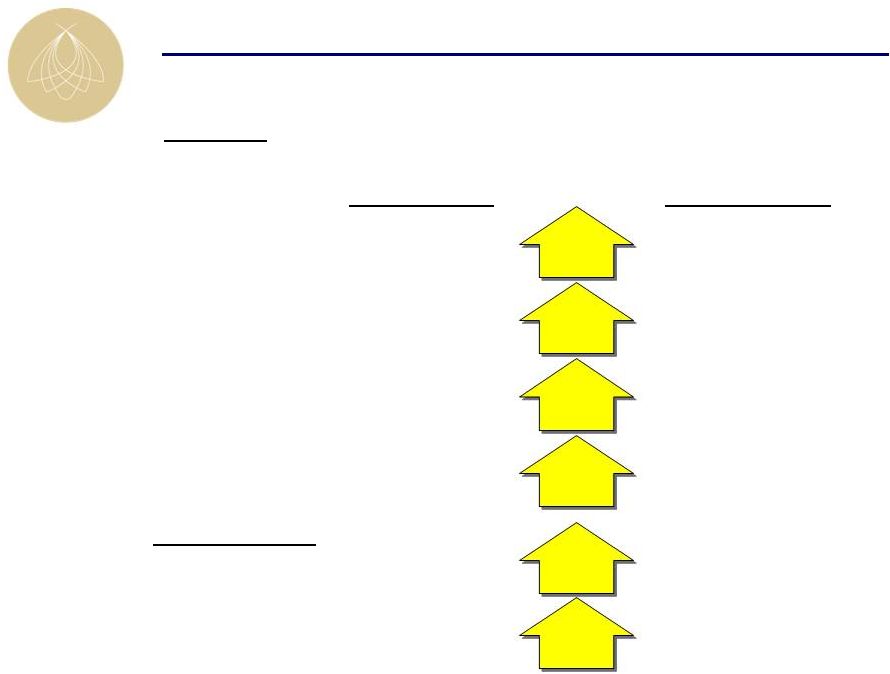
57 Non-GAAP to GAAP Reconciliations Reconciliation of Net Debt / EBITDA ($ in 000s) YE 2009 (a) July 2011 (b) Consolidated Debt $1,658,745 $1,004,284 Pro rata share of unconsolidated debt 282,825 212,275 Pro rata share of consolidated debt (107,065) (45,548) Cash and cash equivalents (116,310) (85,000) Net Debt $1,718,195 $1,086,011 Comparable EBITDA $119,953 $150,000 Net Debt / EBITDA 14.3x 7.2x (a) All figures taken from year-end 2009 financial statements. (b) Balance sheet metrics updated to reflect closing of debt refinancings Comparable EBITDA reflects mid-point of guidance range as of Q2 2011. Reconciliation of Net Debt / TEV ($ in 000s) YE 2009 (a) Current (b) Consolidated Debt $1,658,745 $1,004,284 Pro rata share of unconsolidated debt 282,825 212,275 Pro rata share of consolidated debt (107,065) (45,548) Cash and cash equivalents (116,310) (85,000) Net Debt $1,718,195 $1,086,011 Market Capitalization $144,966 $811,530 Total Debt 1,834,505 1,171,011 Preferred Equity 370,236 370,236 Cash and cash equivalents (116,310) (85,000) Total Enterprise Value $2,233,397 $2,267,777 Net Debt / EBITDA 76.9% 47.9% (a) All figures taken from year-end 2009 financial statements. (b) Balance sheet metrics updated to reflect closing of debt refinancings Comparable EBITDA reflects mid-point of guidance range as of Q2 2011. Reconciliation of Woodbridge Transaction EBITDA Multiple ($ in 000s) 2011 Net Income Attributable to Common Shareholders $5,203 Depreciation & Amortization 3,417 Comparable EBITDA $8,620 Implied Purchase Price $95,000 2011 EBITDA Multiple 11.0x Note: Depreciation and amortization estimate based on preliminary purchase price allocation at the time of closing. Reconciliation of InterContinental Chicago EBITDA Multiple ($ in 000s) 2011 Net Income Attributable to Common Shareholders $5,934 Depreciation & Amortization 7,980 Interest Expense 5,413 Income Tax Expense 1,070 Comparable EBITDA $20,397 Implied Purchase Price $288,250 2011 EBITDA Multiple 14.1x Note: Interest Expense estimate based on the LIBOR curve and refinancing estimates at time of closing. All figures represent 100% ownership |


