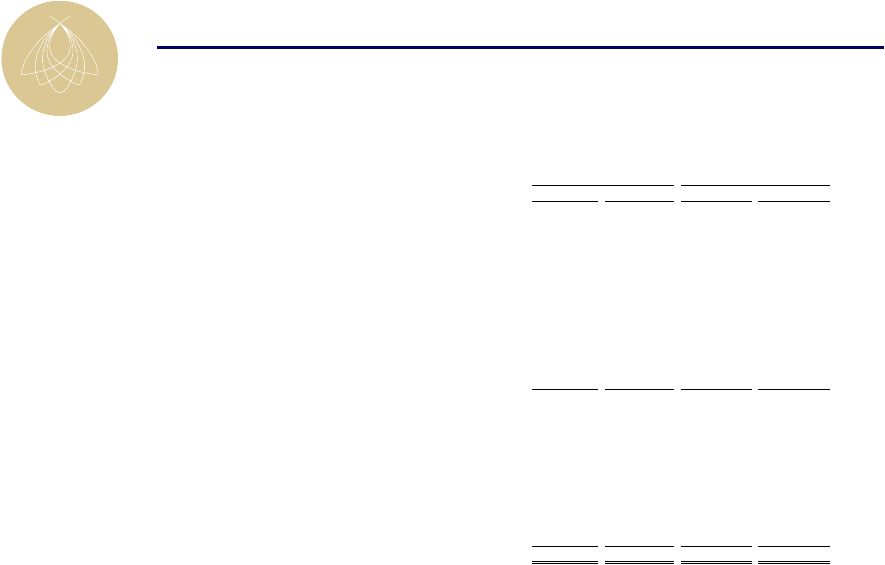
24 Non-GAAP to GAAP Reconciliations Reconciliation of Net Debt + Preferred Equity / EBITDA ($ in 000s) YE 2009 (a) 3Q 2011 (b)(c) Preferred equity capitalization $370,236 $289,102 Consolidated debt 1,658,745 1,000,706 Pro rata share of unconsolidated debt 282,825 212,275 Pro rata share of consolidated debt (107,065) (45,548) Cash and cash equivalents (116,310) (10,000) Net Debt + Preferreds $2,088,431 $1,446,535 Comparable EBITDA $119,953 $153,000 Net Debt + Preferreds / EBITDA 17.4x 9.5x (a) All figures taken from year-end 2009 financial statements. (b) Comparable EBITDA reflects mid-point of guidance range as of Q3 2011. (c) Updated to reflect the successful closing of preferred equity tender Reconciliation of Net Debt / TEV ($ in 000s) YE 2009 (a) 3Q 2011 (b)(c) Consolidated Debt $1,658,745 $1,000,706 Pro rata share of unconsolidated debt 282,825 212,275 Pro rata share of consolidated debt (107,065) (45,548) Cash and cash equivalents (116,310) (10,000) Net Debt $1,718,195 $1,157,433 Market Capitalization $144,966 $812,405 Total Debt 1,834,505 1,167,433 Preferred Equity 370,236 289,102 Cash and cash equivalents (116,310) (10,000) Total Enterprise Value $2,233,397 $2,258,940 Net Debt / Enterprise Value 76.9% 51.2% (a) All figures taken from year-end 2009 financial statements. (b) Comparable EBITDA reflects mid-point of guidance range as of Q3 2011. (c) Updated to reflect the successful closing of preferred equity tender Reconciliation of Net Debt / EBITDA ($ in 000s) YE 2009 (a) 3Q 2011 (b)(c) Consolidated debt $1,658,745 $1,000,706 Pro rata share of unconsolidated debt 282,825 212,275 Pro rata share of consolidated debt (107,065) (45,548) Cash and cash equivalents (116,310) (10,000) Net Debt $1,718,195 $1,157,433 Comparable EBITDA $119,953 $153,000 Net Debt / EBITDA 14.3x 7.6x (a) All figures taken from year-end 2009 financial statements. (b) Comparable EBITDA reflects mid-point of guidance range as of Q3 2011. (c) Updated to reflect the successful closing of preferred equity tender |