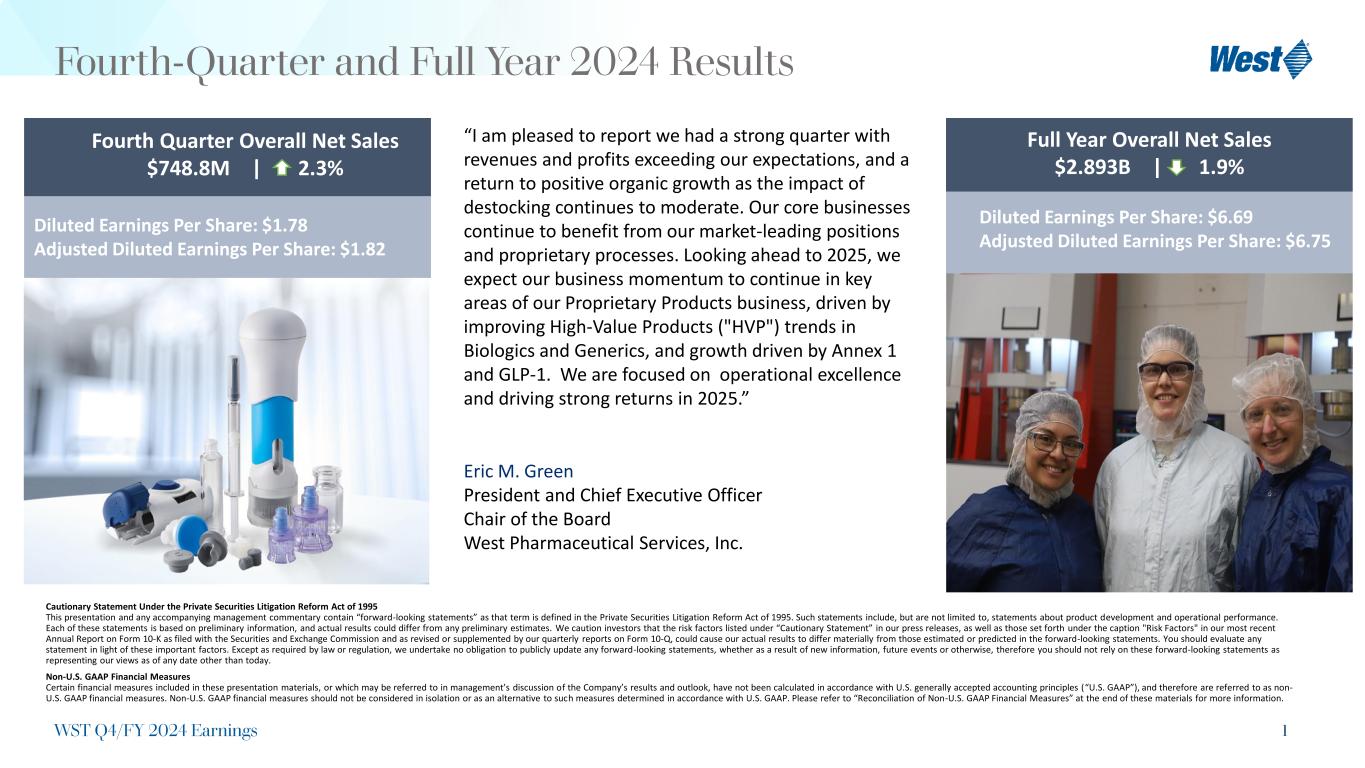
1 Fourth-Quarter and Full Year 2024 Results Fourth Quarter Overall Net Sales $748.8M | 2.3% Diluted Earnings Per Share: $1.78 Adjusted Diluted Earnings Per Share: $1.82 Eric M. Green President and Chief Executive Officer Chair of the Board West Pharmaceutical Services, Inc. WST Q4/FY 2024 Earnings “I am pleased to report we had a strong quarter with revenues and profits exceeding our expectations, and a return to positive organic growth as the impact of destocking continues to moderate. Our core businesses continue to benefit from our market-leading positions and proprietary processes. Looking ahead to 2025, we expect our business momentum to continue in key areas of our Proprietary Products business, driven by improving High-Value Products ("HVP") trends in Biologics and Generics, and growth driven by Annex 1 and GLP-1. We are focused on operational excellence and driving strong returns in 2025.” Full Year Overall Net Sales $2.893B | 1.9% Diluted Earnings Per Share: $6.69 Adjusted Diluted Earnings Per Share: $6.75 Cautionary Statement Under the Private Securities Litigation Reform Act of 1995 This presentation and any accompanying management commentary contain “forward-looking statements” as that term is defined in the Private Securities Litigation Reform Act of 1995. Such statements include, but are not limited to, statements about product development and operational performance. Each of these statements is based on preliminary information, and actual results could differ from any preliminary estimates. We caution investors that the risk factors listed under “Cautionary Statement” in our press releases, as well as those set forth under the caption "Risk Factors" in our most recent Annual Report on Form 10-K as filed with the Securities and Exchange Commission and as revised or supplemented by our quarterly reports on Form 10-Q, could cause our actual results to differ materially from those estimated or predicted in the forward-looking statements. You should evaluate any statement in light of these important factors. Except as required by law or regulation, we undertake no obligation to publicly update any forward-looking statements, whether as a result of new information, future events or otherwise, therefore you should not rely on these forward-looking statements as representing our views as of any date other than today. Non-U.S. GAAP Financial Measures Certain financial measures included in these presentation materials, or which may be referred to in management’s discussion of the Company’s results and outlook, have not been calculated in accordance with U.S. generally accepted accounting principles (“U.S. GAAP”), and therefore are referred to as non- U.S. GAAP financial measures. Non-U.S. GAAP financial measures should not be considered in isolation or as an alternative to such measures determined in accordance with U.S. GAAP. Please refer to “Reconciliation of Non-U.S. GAAP Financial Measures” at the end of these materials for more information.
West Pharmaceutical Services, Inc. Eric M. Green President & CEO, Chair of the Board Bernard J. Birkett Senior VP & Chief Financial Officer Fourth-Quarter and Full Year Results 2024 Analyst Conference Call 9 a.m. Eastern Time | February 13, 2025
3 West Analyst Conference Call 9 a.m. Eastern Time February 13, 2025 A webcast of today’s call can be accessed in the “Investors” section of the Company’s website: www.westpharma.com To participate on the call by asking questions to Management, please register in advance at: https://register.vevent.com/register/BI3c9092338ee2475fae7b7 b53e70973e6 Upon registration, all telephone participants will receive the dial-in number along with a unique PIN number that will be used to access the call. A replay of the conference call and webcast will be available on the Company’s website for 30 days. These presentation materials are intended to accompany today’s press release announcing the Company’s results for the fourth quarter 2024 and full year 2024 and management’s discussion of those results during today’s conference call. WST Q4/FY 2024 Earnings
4 Safe Harbor Statement This presentation and any accompanying management commentary contain “forward-looking statements” as that term is defined in the Private Securities Litigation Reform Act of 1995. Such statements include, but are not limited to, statements about product development, operational performance and expectations regarding future events. Each of these statements is based on preliminary information, and actual results could differ from any preliminary estimates. We caution investors that the risk factors listed under our “Forward Looking Statements” in our press releases, as well as those set forth under the caption "Risk Factors" in our most recent Annual Report on Form 10-K as filed with the Securities and Exchange Commission and as revised or supplemented by our quarterly reports on Form 10-Q, could cause our actual results to differ materially from those estimated or predicted in the forward-looking statements. You should evaluate any statement in light of these important factors. Except as required by law or regulation, we undertake no obligation to publicly update any forward-looking statements, whether as a result of new information, future events or otherwise, therefore you should not rely on these forward-looking statements as representing our views as of any date other than today. Certain financial measures included in these presentation materials, or which may be referred to in management’s discussion of the Company’s results and outlook, have not been calculated in accordance with U.S. generally accepted accounting principles (“U.S. GAAP”), and therefore are referred to as non-U.S. GAAP financial measures. Non-U.S. GAAP financial measures should not be considered in isolation or as an alternative to such measures determined in accordance with U.S. GAAP. Please refer to “Reconciliation of Non-U.S. GAAP Financial Measures” at the end of these materials for more information. Cautionary Statement Under the Private Securities Litigation Reform Act of 1995 Non-U.S. GAAP Financial Measures Trademarks and registered trademarks used in this report are the property of West Pharmaceutical Services, Inc. or its subsidiaries, in the United States and other jurisdictions, unless noted otherwise. Daikyo Crystal Zenith® and Daikyo CZ® are registered trademarks of Daikyo Seiko, Ltd. Daikyo Crystal Zenith technologies are licensed from Daikyo Seiko, Ltd. Trademarks WST Q4/FY 2024 Earnings
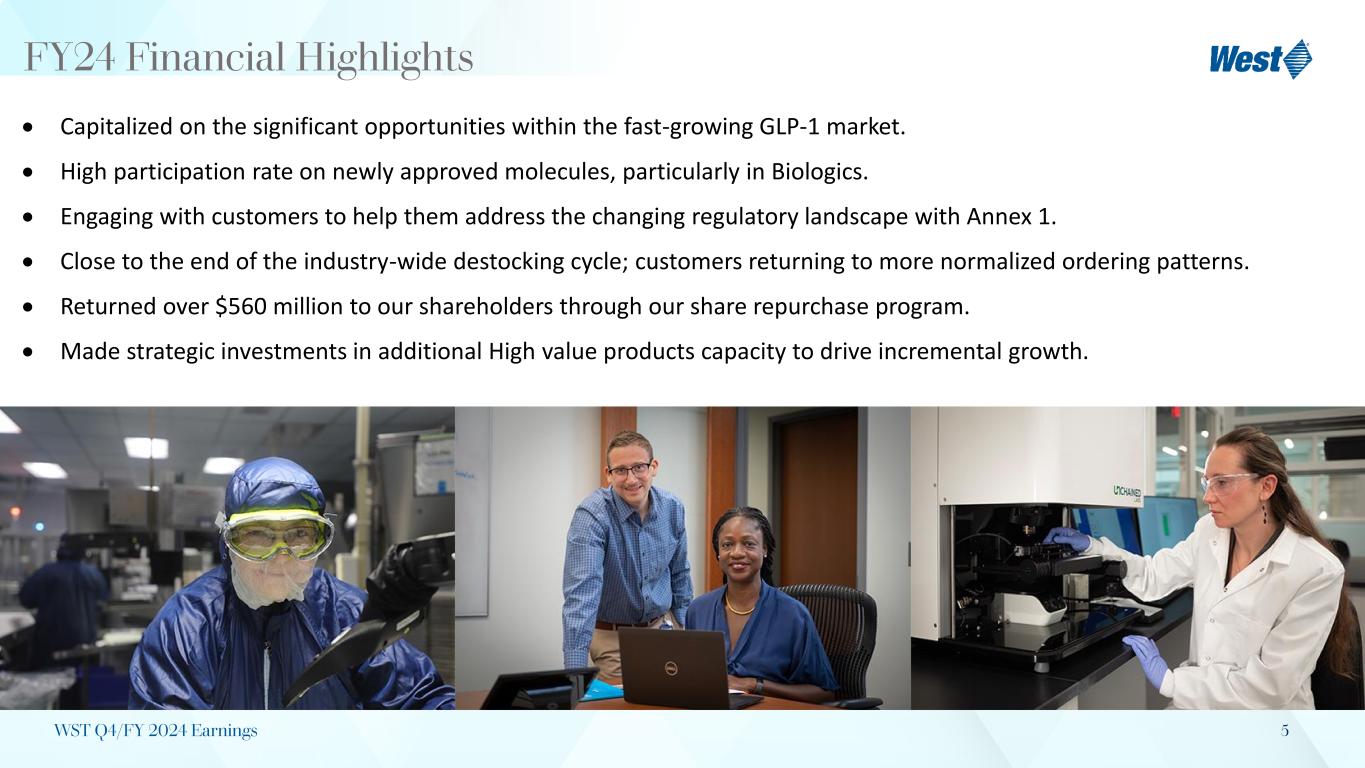
5 FY24 Financial Highlights WST Q4/FY 2024 Earnings • Capitalized on the significant opportunities within the fast-growing GLP-1 market. • High participation rate on newly approved molecules, particularly in Biologics. • Engaging with customers to help them address the changing regulatory landscape with Annex 1. • Close to the end of the industry-wide destocking cycle; customers returning to more normalized ordering patterns. • Returned over $560 million to our shareholders through our share repurchase program. • Made strategic investments in additional High value products capacity to drive incremental growth.
6 Q424 Financial Highlights WST Q4/FY 2024 Earnings • Q4 2024 came in above our expectations. • Revenues increased 3.3% on an organic basis. Q4 marked a return to revenue growth. • Proprietary Products organic revenues increased 4.5%. Continued improving trend, as Proprietary Products organic revenues declined in each of the first three quarters of 2024 compared to the same period in prior year, largely due to destocking. • Adjusted Operating Profit margin was 21.7%, in-line with Prior Year.
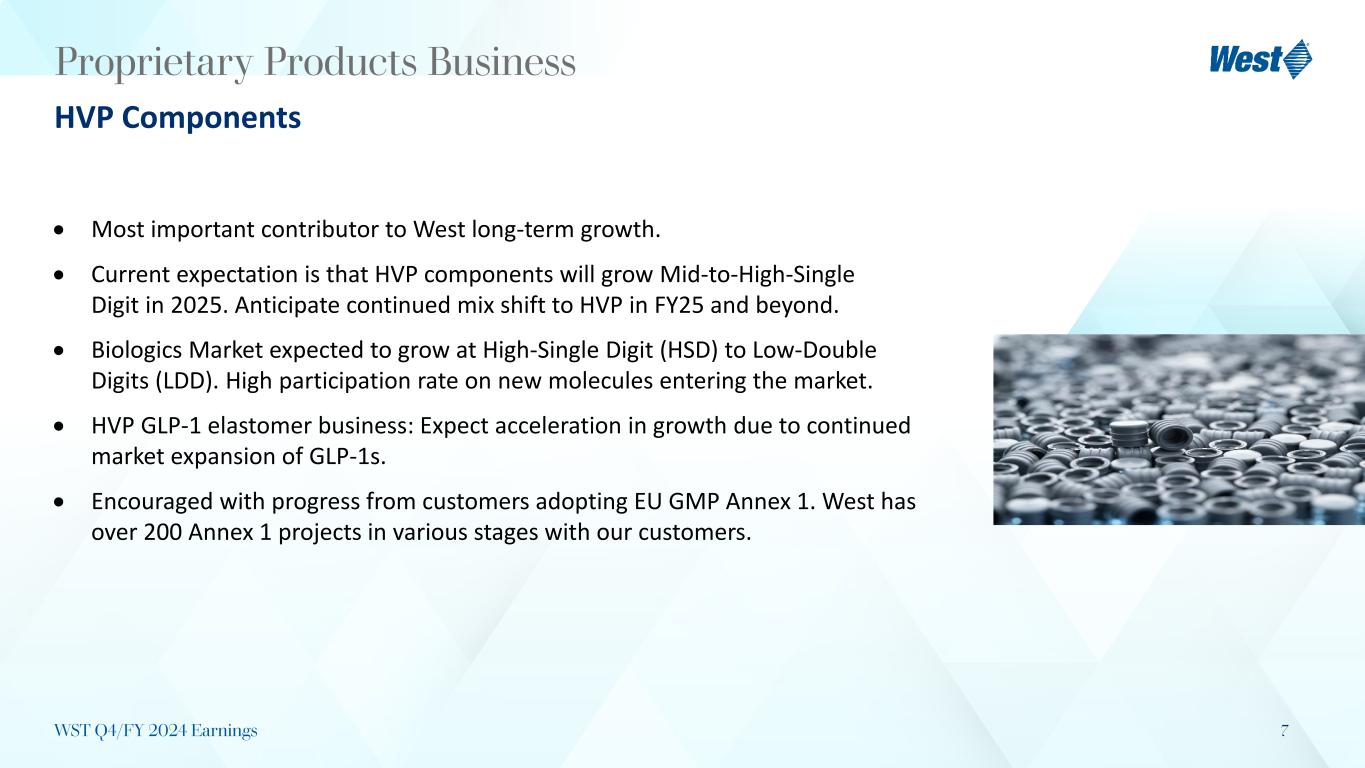
7 • Most important contributor to West long-term growth. • Current expectation is that HVP components will grow Mid-to-High-Single Digit in 2025. Anticipate continued mix shift to HVP in FY25 and beyond. • Biologics Market expected to grow at High-Single Digit (HSD) to Low-Double Digits (LDD). High participation rate on new molecules entering the market. • HVP GLP-1 elastomer business: Expect acceleration in growth due to continued market expansion of GLP-1s. • Encouraged with progress from customers adopting EU GMP Annex 1. West has over 200 Annex 1 projects in various stages with our customers. Proprietary Products Business HVP Components WST Q4/FY 2024 Earnings
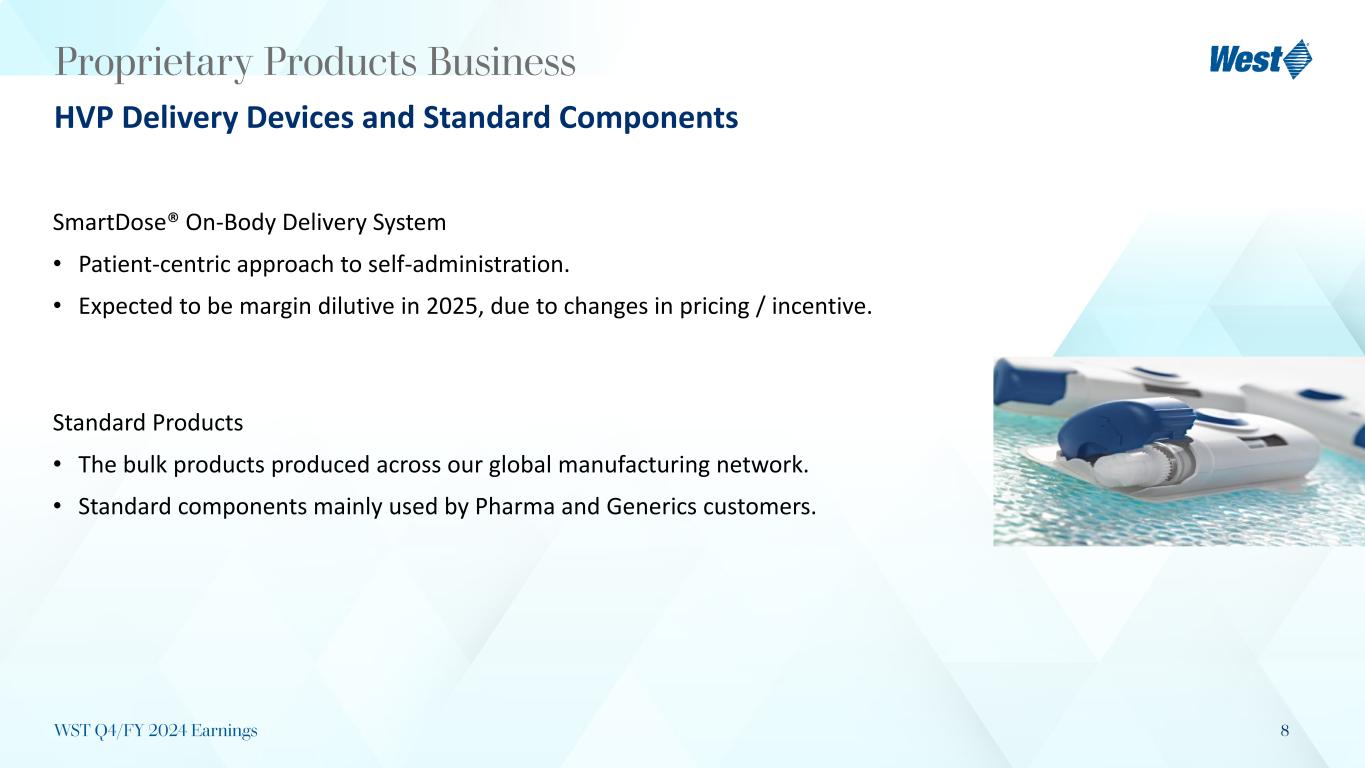
8 Proprietary Products Business HVP Delivery Devices and Standard Components SmartDose® On-Body Delivery System • Patient-centric approach to self-administration. • Expected to be margin dilutive in 2025, due to changes in pricing / incentive. Standard Products • The bulk products produced across our global manufacturing network. • Standard components mainly used by Pharma and Generics customers. WST Q4/FY 2024 Earnings
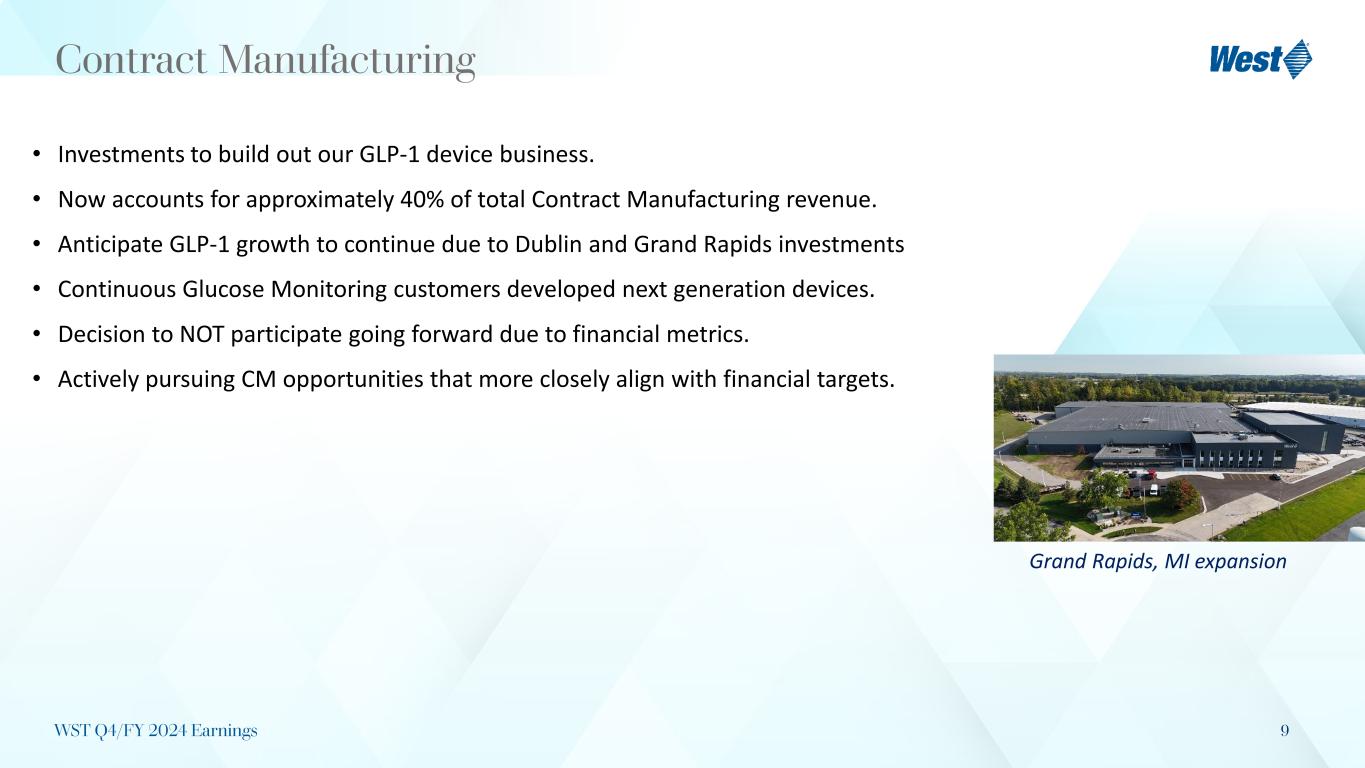
9 Contract Manufacturing • Investments to build out our GLP-1 device business. • Now accounts for approximately 40% of total Contract Manufacturing revenue. • Anticipate GLP-1 growth to continue due to Dublin and Grand Rapids investments • Continuous Glucose Monitoring customers developed next generation devices. • Decision to NOT participate going forward due to financial metrics. • Actively pursuing CM opportunities that more closely align with financial targets. Grand Rapids, MI expansion WST Q4/FY 2024 Earnings
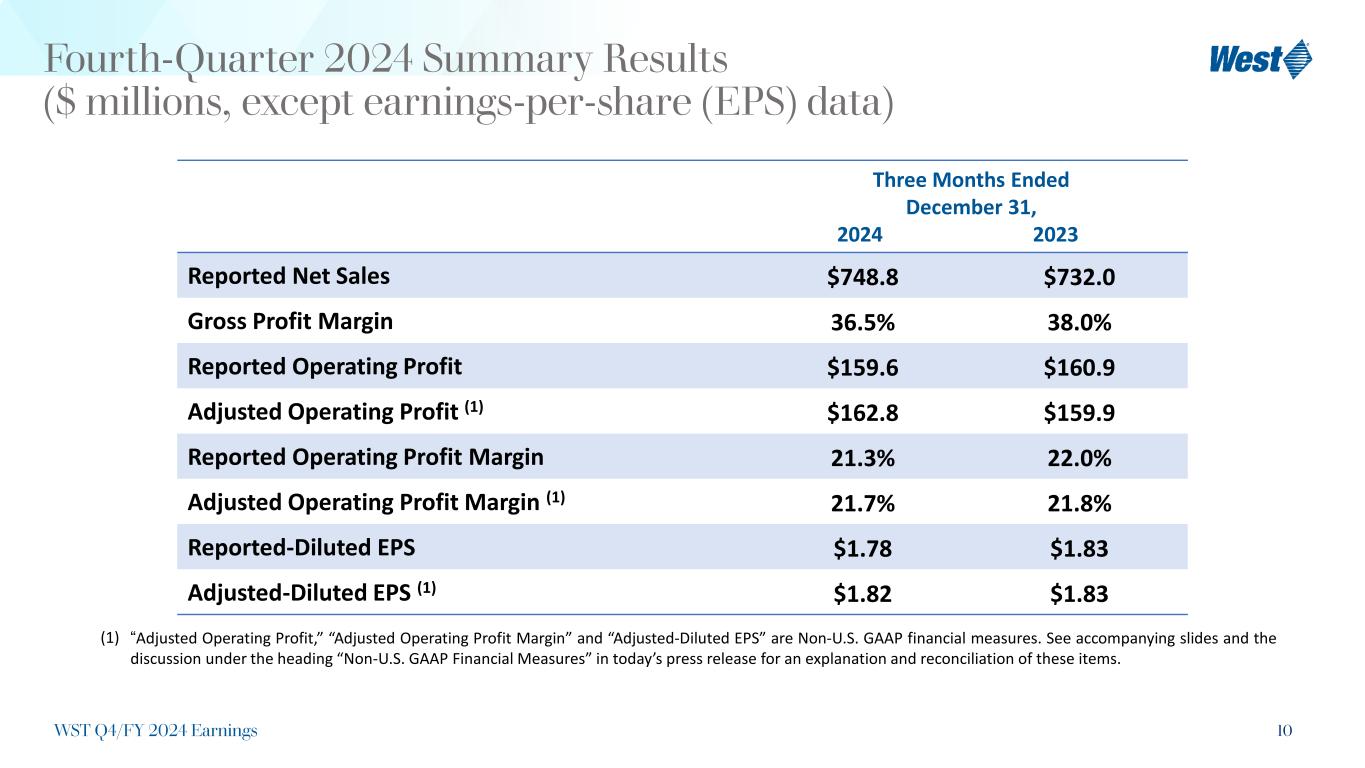
10 Fourth-Quarter 2024 Summary Results ($ millions, except earnings-per-share (EPS) data) Three Months Ended December 31, 2024 2023 Reported Net Sales $748.8 $732.0 Gross Profit Margin 36.5% 38.0% Reported Operating Profit $159.6 $160.9 Adjusted Operating Profit (1) $162.8 $159.9 Reported Operating Profit Margin 21.3% 22.0% Adjusted Operating Profit Margin (1) 21.7% 21.8% Reported-Diluted EPS $1.78 $1.83 Adjusted-Diluted EPS (1) $1.82 $1.83 “Adjusted Operating Profit,” “Adjusted Operating Profit Margin” and “Adjusted-Diluted EPS” are Non-U.S. GAAP financial measures. See accompanying slides and the discussion under the heading “Non-U.S. GAAP Financial Measures” in today’s press release for an explanation and reconciliation of these items. (1) WST Q4/FY 2024 Earnings
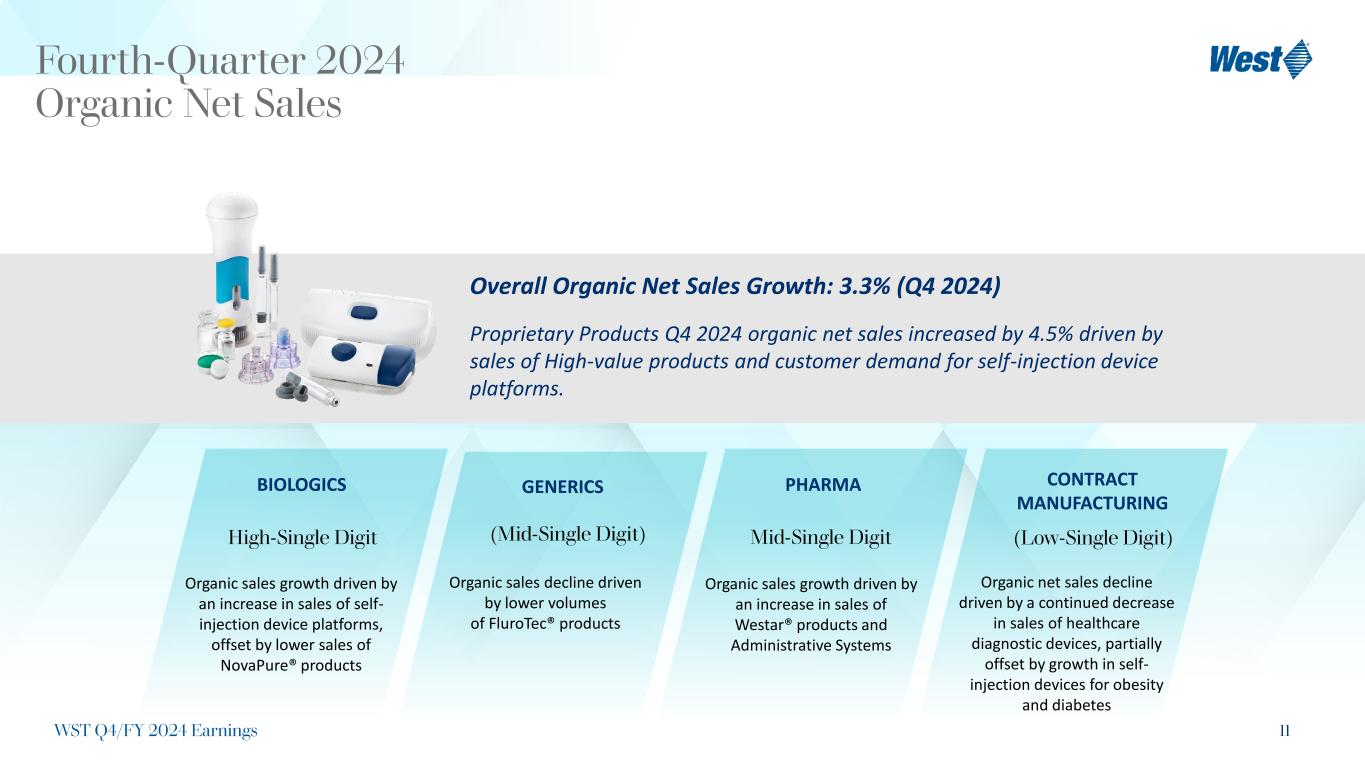
11 Overall Organic Net Sales Growth: 3.3% (Q4 2024) Proprietary Products Q4 2024 organic net sales increased by 4.5% driven by sales of High-value products and customer demand for self-injection device platforms. BIOLOGICS GENERICS PHARMA Organic sales growth driven by an increase in sales of self- injection device platforms, offset by lower sales of NovaPure® products Organic sales decline driven by lower volumes of FluroTec® products Organic sales growth driven by an increase in sales of Westar® products and Administrative Systems CONTRACT MANUFACTURING Organic net sales decline driven by a continued decrease in sales of healthcare diagnostic devices, partially offset by growth in self- injection devices for obesity and diabetes High-Single Digit (Mid-Single Digit) (Low-Single Digit)Mid-Single Digit Fourth-Quarter 2024 Organic Net Sales WST Q4/FY 2024 Earnings
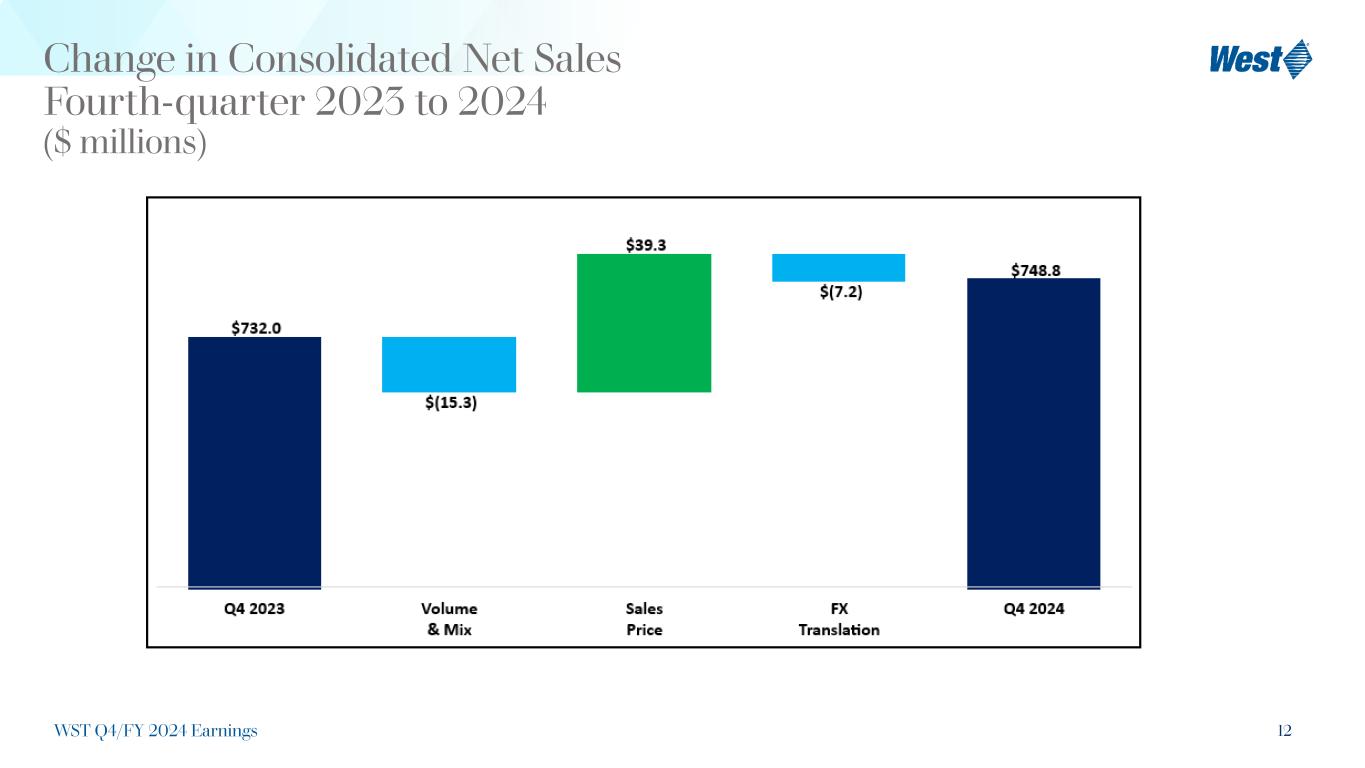
12 Change in Consolidated Net Sales Fourth-quarter 2023 to 2024 ($ millions) WST Q4/FY 2024 Earnings
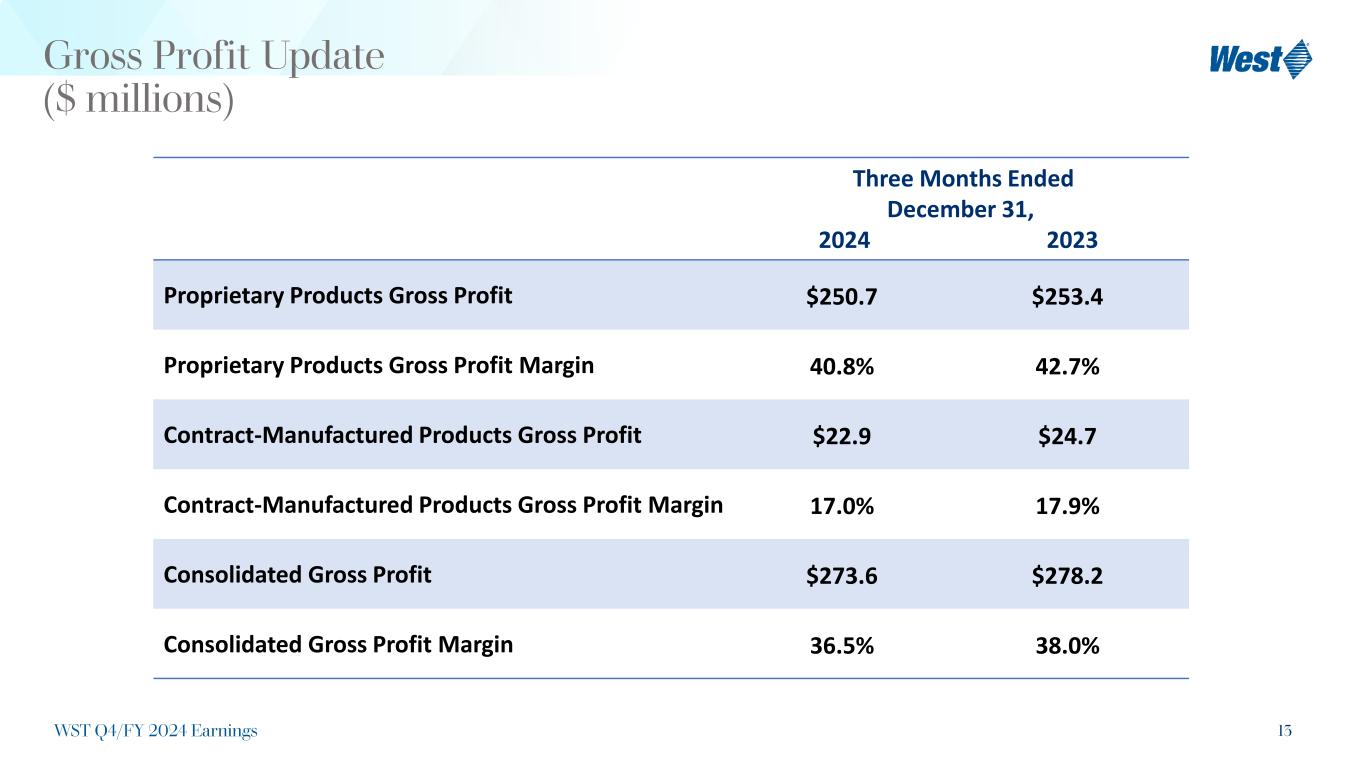
13 Gross Profit Update ($ millions) Three Months Ended December 31, 2024 2023 Proprietary Products Gross Profit $250.7 $253.4 Proprietary Products Gross Profit Margin 40.8% 42.7% Contract-Manufactured Products Gross Profit $22.9 $24.7 Contract-Manufactured Products Gross Profit Margin 17.0% 17.9% Consolidated Gross Profit $273.6 $278.2 Consolidated Gross Profit Margin 36.5% 38.0% WST Q4/FY 2024 Earnings
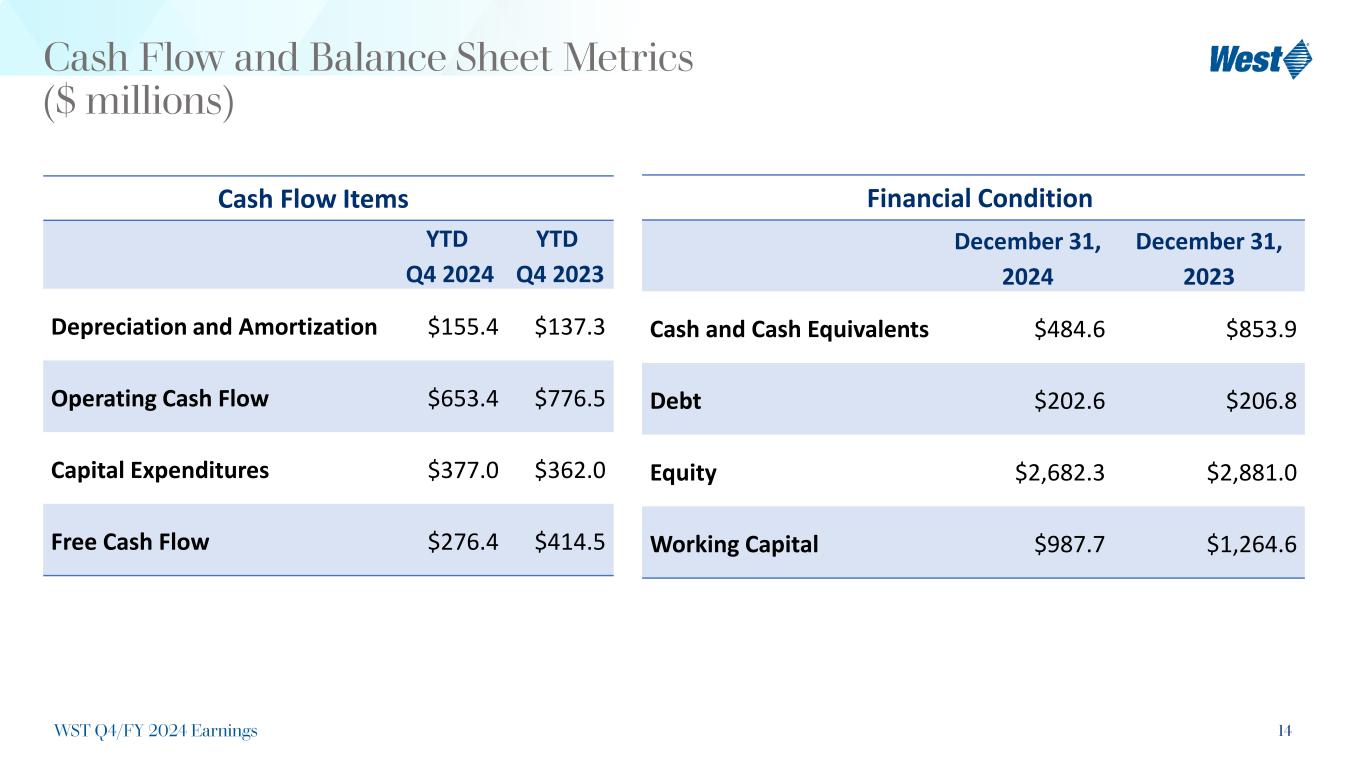
14 Cash Flow and Balance Sheet Metrics ($ millions) Cash Flow Items YTD Q4 2024 YTD Q4 2023 Depreciation and Amortization $155.4 $137.3 Operating Cash Flow $653.4 $776.5 Capital Expenditures $377.0 $362.0 Free Cash Flow $276.4 $414.5 Financial Condition December 31, 2024 December 31, 2023 Cash and Cash Equivalents $484.6 $853.9 Debt $202.6 $206.8 Equity $2,682.3 $2,881.0 Working Capital $987.7 $1,264.6 WST Q4/FY 2024 Earnings
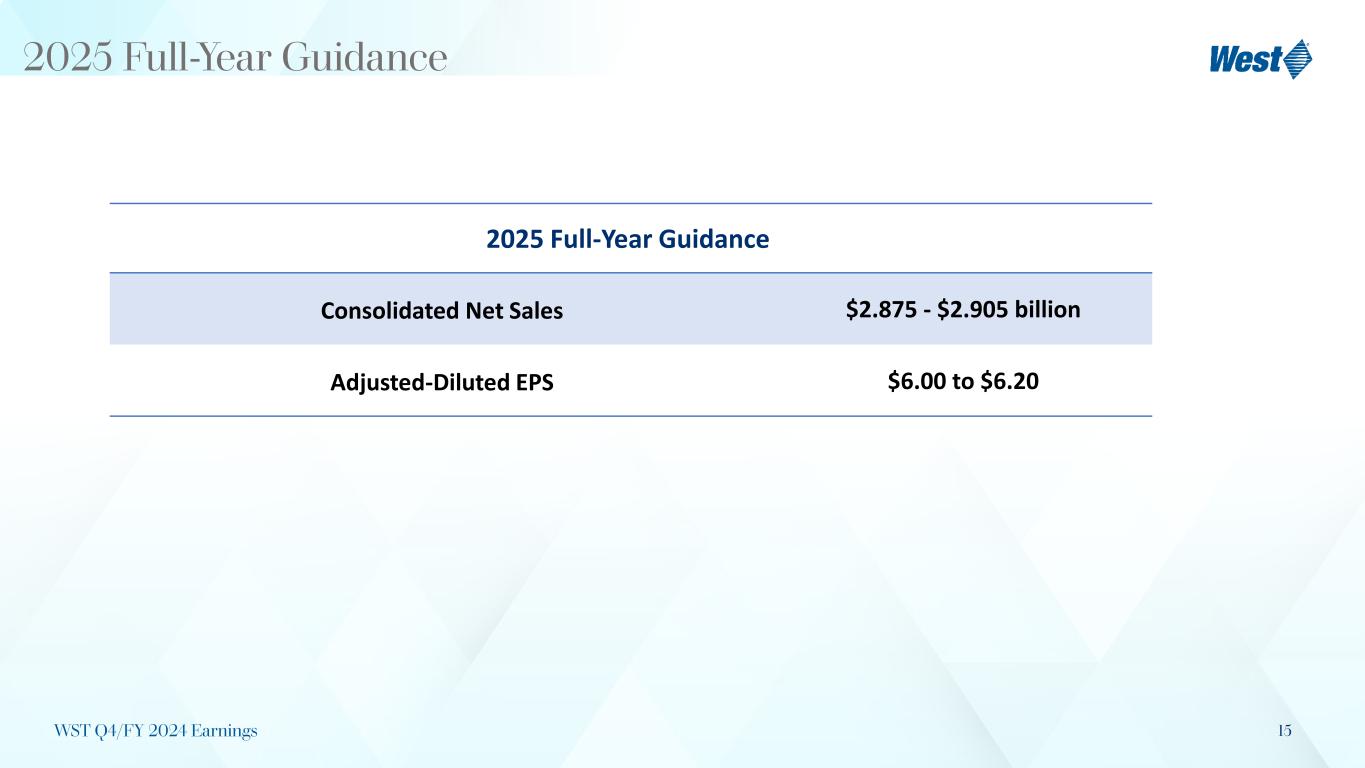
15 2025 Full-Year Guidance WST Q4/FY 2024 Earnings 2025 Full-Year Guidance Consolidated Net Sales $2.875 - $2.905 billion Adjusted-Diluted EPS $6.00 to $6.20
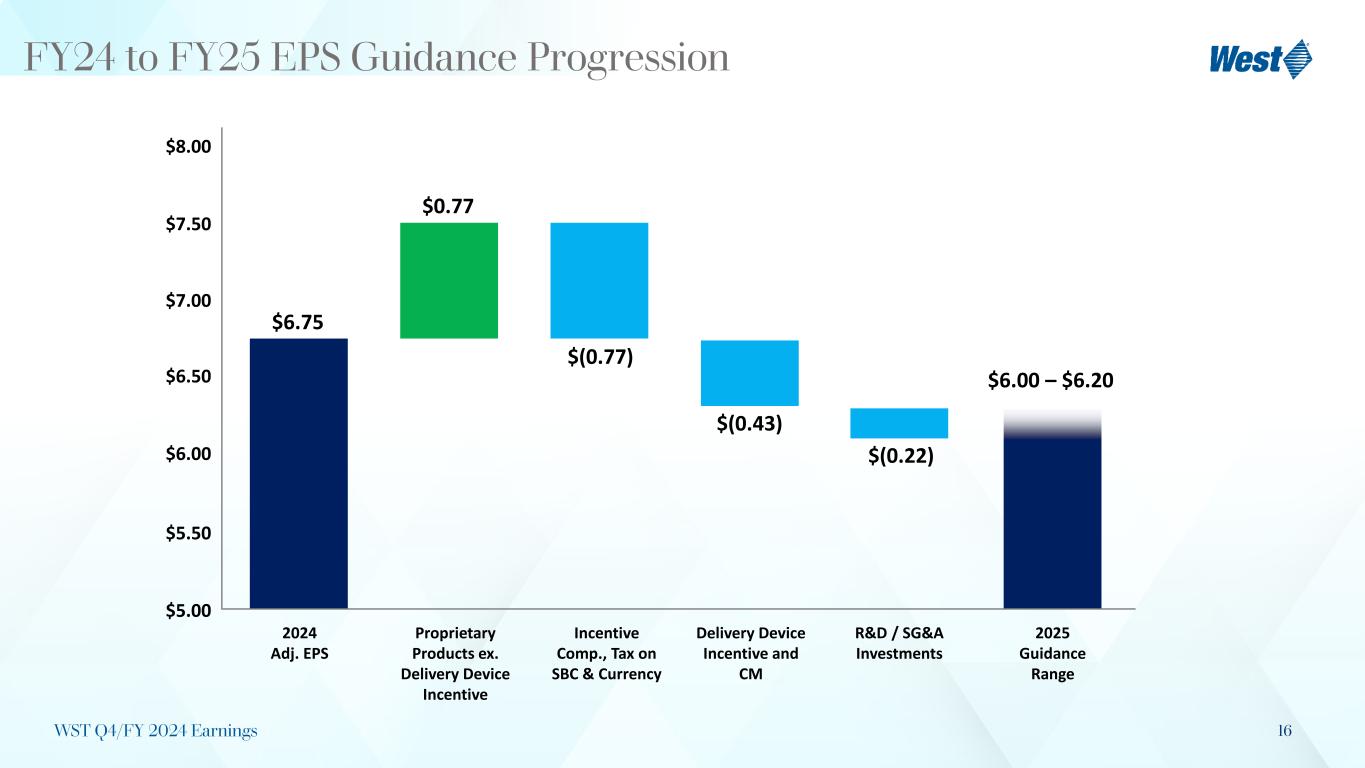
16 FY24 to FY25 EPS Guidance Progression WST Q4/FY 2024 Earnings $6.75 $0.77 $(0.77) $(0.43) $(0.22) $6.00 – $6.20 $5.00 $5.50 $6.00 $6.50 $7.00 $7.50 $8.00 2024 Adj. EPS Proprietary Products ex. Delivery Device Incentive Incentive Comp., Tax on SBC & Currency Delivery Device Incentive and CM R&D / SG&A Investments 2025 Guidance Range
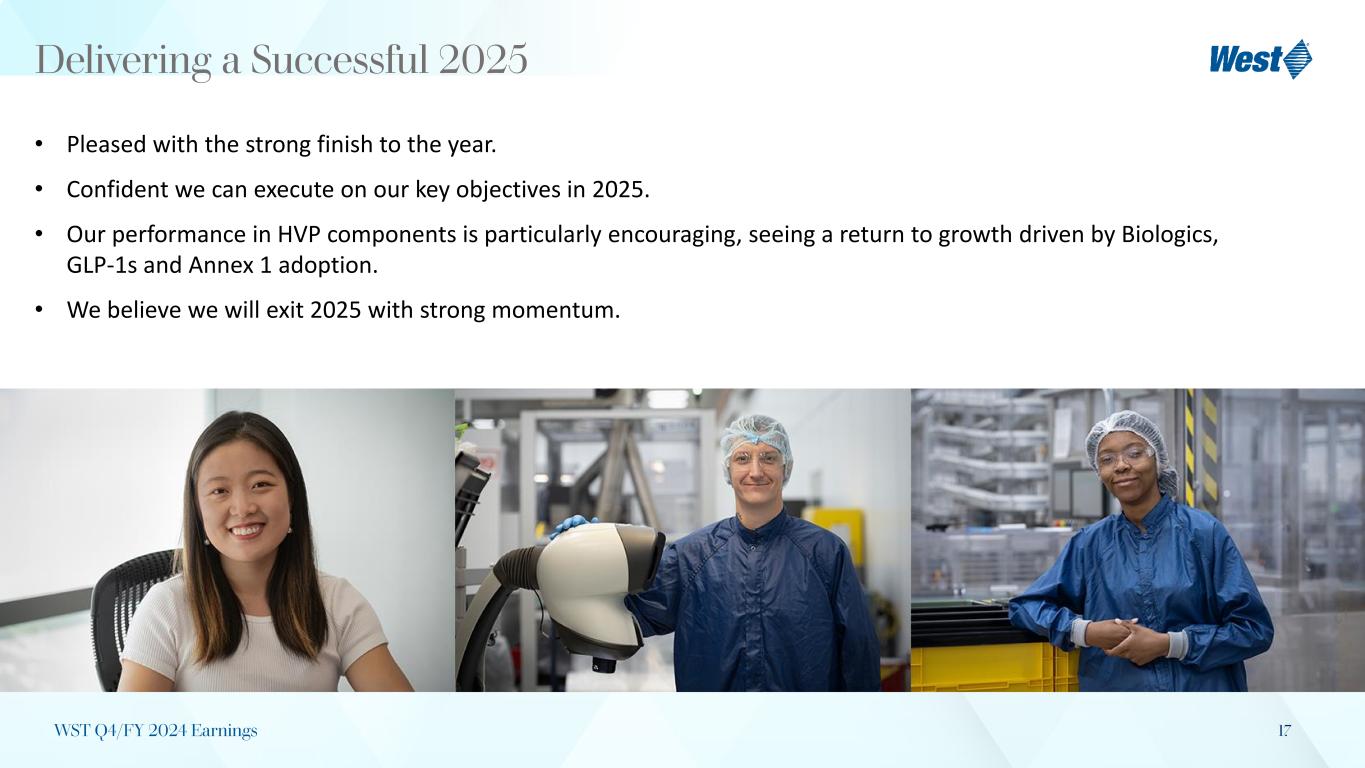
17 • Pleased with the strong finish to the year. • Confident we can execute on our key objectives in 2025. • Our performance in HVP components is particularly encouraging, seeing a return to growth driven by Biologics, GLP-1s and Annex 1 adoption. • We believe we will exit 2025 with strong momentum. Delivering a Successful 2025 WST Q4/FY 2024 Earnings
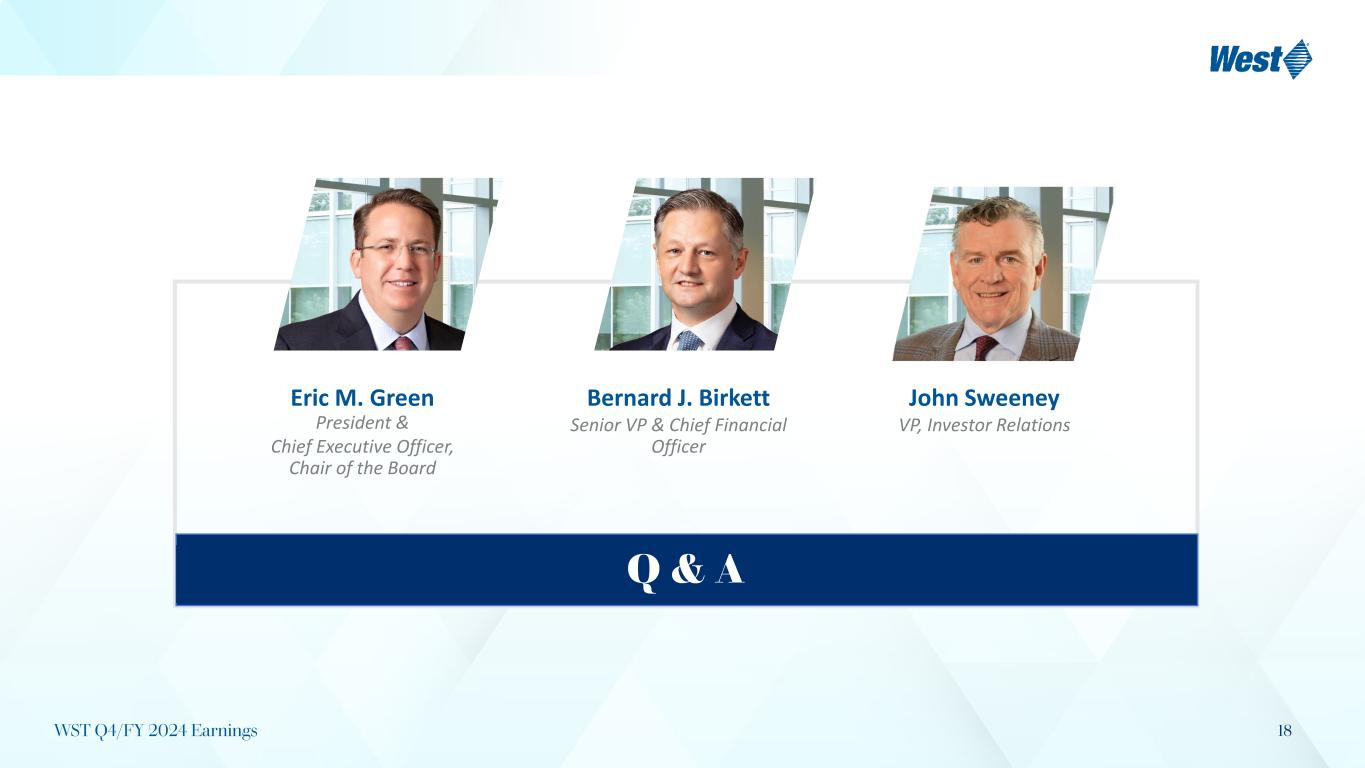
18 Eric M. Green President & Chief Executive Officer, Chair of the Board Bernard J. Birkett Senior VP & Chief Financial Officer John Sweeney VP, Investor Relations Q & A WST Q4/FY 2024 Earnings
19 Notes to Non-U.S. GAAP Financial Measures The Non-U.S. GAAP financial measures are incorporated into our discussion and analysis as management uses them in evaluating our results of operations and believes that this information provides users a valuable insight into our overall performance and financial position. A reconciliation of these adjusted Non-U.S. GAAP financial measures to the comparable U.S. GAAP financial measures is included in the accompanying tables. For the purpose of aiding the comparison of our year-over-year results, we may refer to net sales and other financial results excluding the effects of changes in foreign currency exchange rates. Organic net sales exclude the impact from acquisitions and/or divestitures and translate the current-period reported sales of subsidiaries whose functional currency is other than the U.S. Dollar at the applicable foreign exchange rates in effect during the comparable prior-year period. We may also refer to financial results excluding the effects of unallocated items. The re-measured results excluding effects from currency translation, the impact from acquisitions and/or divestitures, and the effects of unallocated items are not in conformity with U.S. GAAP and should not be used as a substitute for the comparable U.S. GAAP financial measures. WST Q4/FY 2024 Earnings
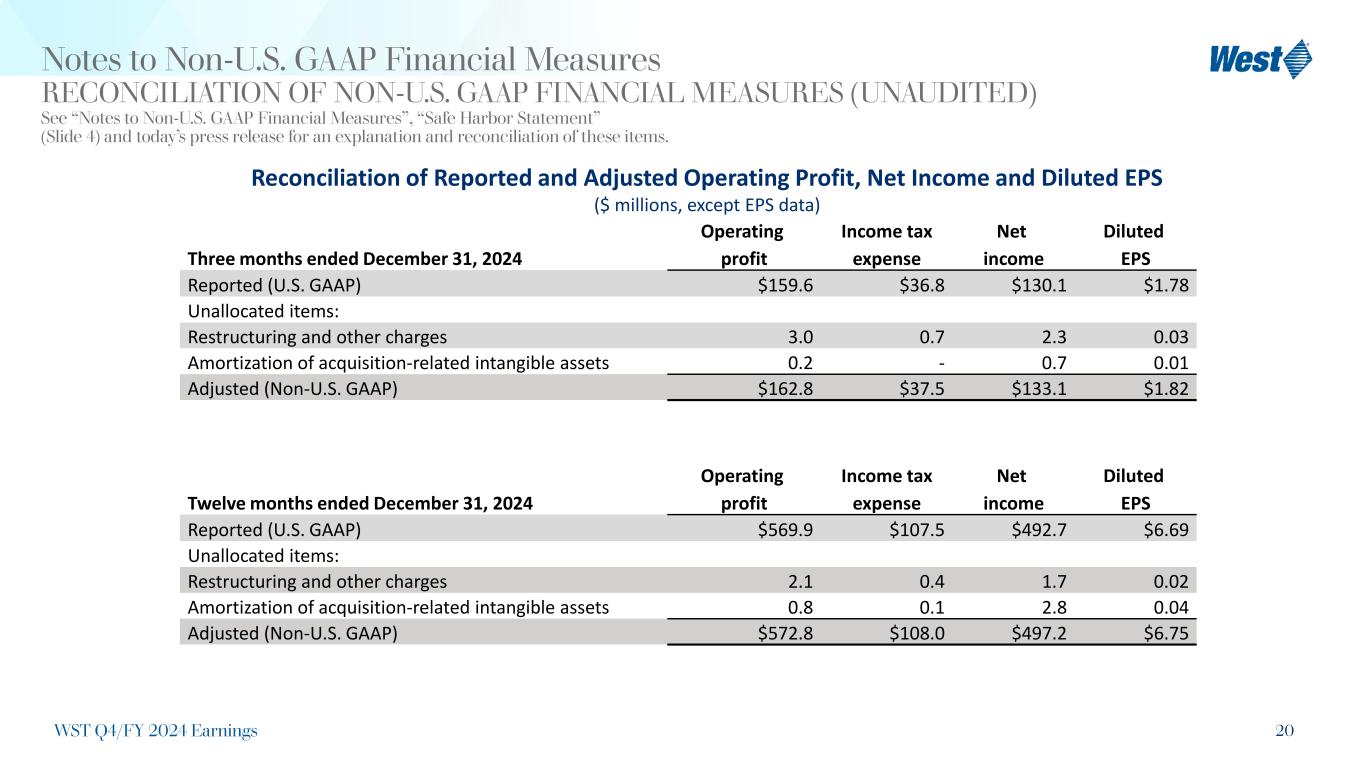
20 Notes to Non-U.S. GAAP Financial Measures RECONCILIATION OF NON-U.S. GAAP FINANCIAL MEASURES (UNAUDITED) See “Notes to Non-U.S. GAAP Financial Measures”, “Safe Harbor Statement” (Slide 4) and today’s press release for an explanation and reconciliation of these items. Reconciliation of Reported and Adjusted Operating Profit, Net Income and Diluted EPS ($ millions, except EPS data) Three months ended December 31, 2024 Operating profit Income tax expense Net income Diluted EPS Reported (U.S. GAAP) $159.6 $36.8 $130.1 $1.78 Unallocated items: Restructuring and other charges 3.0 0.7 2.3 0.03 Amortization of acquisition-related intangible assets 0.2 - 0.7 0.01 Adjusted (Non-U.S. GAAP) $162.8 $37.5 $133.1 $1.82 Twelve months ended December 31, 2024 Operating profit Income tax expense Net income Diluted EPS Reported (U.S. GAAP) $569.9 $107.5 $492.7 $6.69 Unallocated items: Restructuring and other charges 2.1 0.4 1.7 0.02 Amortization of acquisition-related intangible assets 0.8 0.1 2.8 0.04 Adjusted (Non-U.S. GAAP) $572.8 $108.0 $497.2 $6.75 WST Q4/FY 2024 Earnings
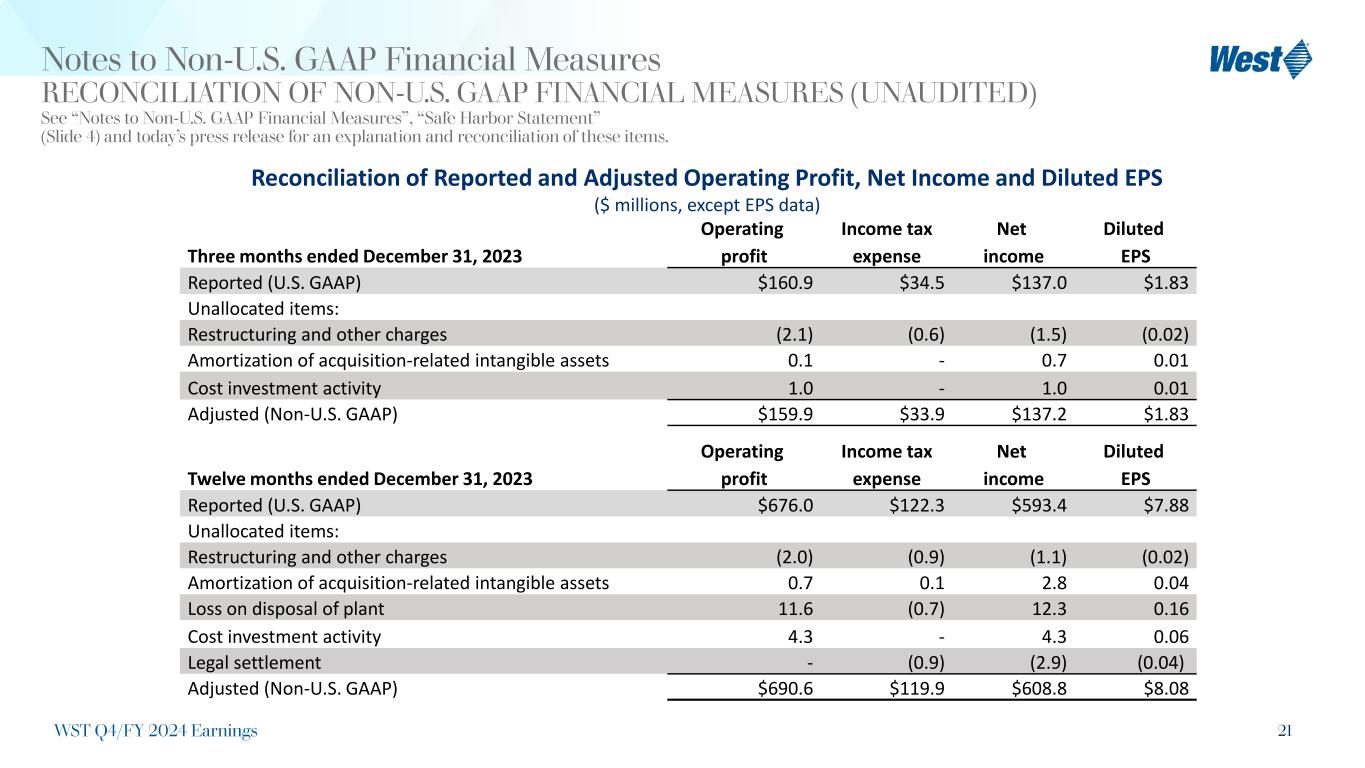
21 Notes to Non-U.S. GAAP Financial Measures RECONCILIATION OF NON-U.S. GAAP FINANCIAL MEASURES (UNAUDITED) See “Notes to Non-U.S. GAAP Financial Measures”, “Safe Harbor Statement” (Slide 4) and today’s press release for an explanation and reconciliation of these items. Reconciliation of Reported and Adjusted Operating Profit, Net Income and Diluted EPS ($ millions, except EPS data) Three months ended December 31, 2023 Operating profit Income tax expense Net income Diluted EPS Reported (U.S. GAAP) $160.9 $34.5 $137.0 $1.83 Unallocated items: Restructuring and other charges (2.1) (0.6) (1.5) (0.02) Amortization of acquisition-related intangible assets 0.1 - 0.7 0.01 Cost investment activity 1.0 - 1.0 0.01 Adjusted (Non-U.S. GAAP) $159.9 $33.9 $137.2 $1.83 Twelve months ended December 31, 2023 Operating profit Income tax expense Net income Diluted EPS Reported (U.S. GAAP) $676.0 $122.3 $593.4 $7.88 Unallocated items: Restructuring and other charges (2.0) (0.9) (1.1) (0.02) Amortization of acquisition-related intangible assets 0.7 0.1 2.8 0.04 Loss on disposal of plant 11.6 (0.7) 12.3 0.16 Cost investment activity 4.3 - 4.3 0.06 Legal settlement - (0.9) (2.9) (0.04) Adjusted (Non-U.S. GAAP) $690.6 $119.9 $608.8 $8.08 WST Q4/FY 2024 Earnings
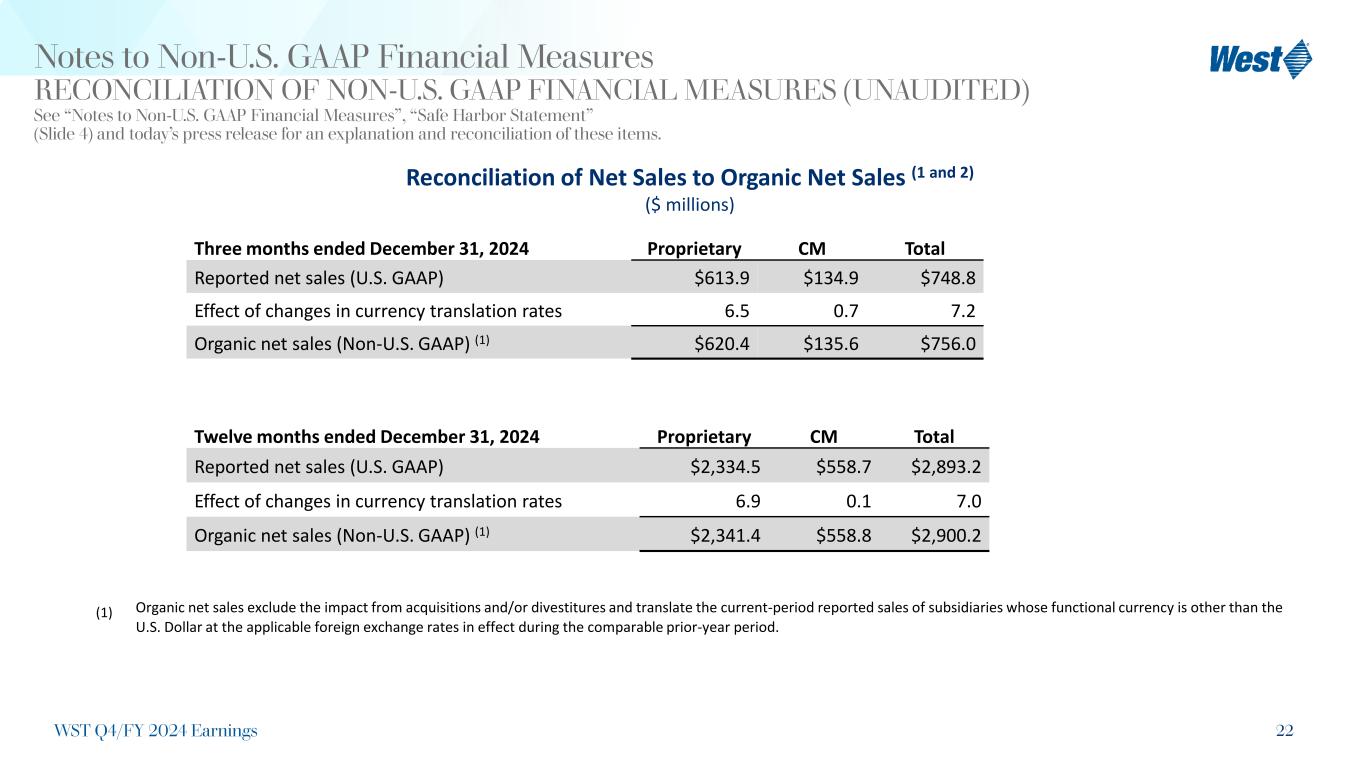
22 Notes to Non-U.S. GAAP Financial Measures RECONCILIATION OF NON-U.S. GAAP FINANCIAL MEASURES (UNAUDITED) See “Notes to Non-U.S. GAAP Financial Measures”, “Safe Harbor Statement” (Slide 4) and today’s press release for an explanation and reconciliation of these items. Reconciliation of Net Sales to Organic Net Sales (1 and 2) ($ millions) Organic net sales exclude the impact from acquisitions and/or divestitures and translate the current-period reported sales of subsidiaries whose functional currency is other than the U.S. Dollar at the applicable foreign exchange rates in effect during the comparable prior-year period. (1) Three months ended December 31, 2024 Proprietary CM Total Reported net sales (U.S. GAAP) $613.9 $134.9 $748.8 Effect of changes in currency translation rates 6.5 0.7 7.2 Organic net sales (Non-U.S. GAAP) (1) $620.4 $135.6 $756.0 Twelve months ended December 31, 2024 Proprietary CM Total Reported net sales (U.S. GAAP) $2,334.5 $558.7 $2,893.2 Effect of changes in currency translation rates 6.9 0.1 7.0 Organic net sales (Non-U.S. GAAP) (1) $2,341.4 $558.8 $2,900.2 WST Q4/FY 2024 Earnings
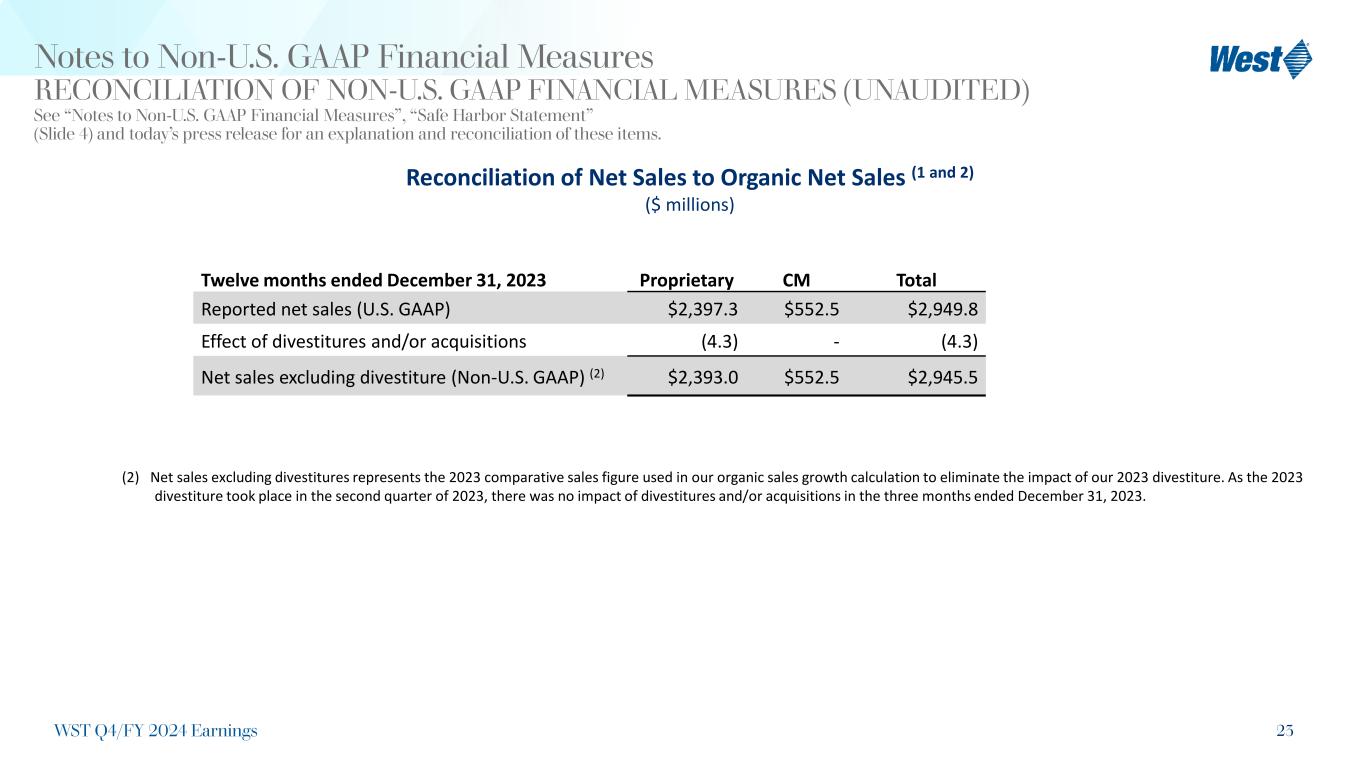
23 Notes to Non-U.S. GAAP Financial Measures RECONCILIATION OF NON-U.S. GAAP FINANCIAL MEASURES (UNAUDITED) See “Notes to Non-U.S. GAAP Financial Measures”, “Safe Harbor Statement” (Slide 4) and today’s press release for an explanation and reconciliation of these items. Reconciliation of Net Sales to Organic Net Sales (1 and 2) ($ millions) (2) Net sales excluding divestitures represents the 2023 comparative sales figure used in our organic sales growth calculation to eliminate the impact of our 2023 divestiture. As the 2023 divestiture took place in the second quarter of 2023, there was no impact of divestitures and/or acquisitions in the three months ended December 31, 2023. Twelve months ended December 31, 2023 Proprietary CM Total Reported net sales (U.S. GAAP) $2,397.3 $552.5 $2,949.8 Effect of divestitures and/or acquisitions (4.3) - (4.3) Net sales excluding divestiture (Non-U.S. GAAP) (2) $2,393.0 $552.5 $2,945.5 WST Q4/FY 2024 Earnings
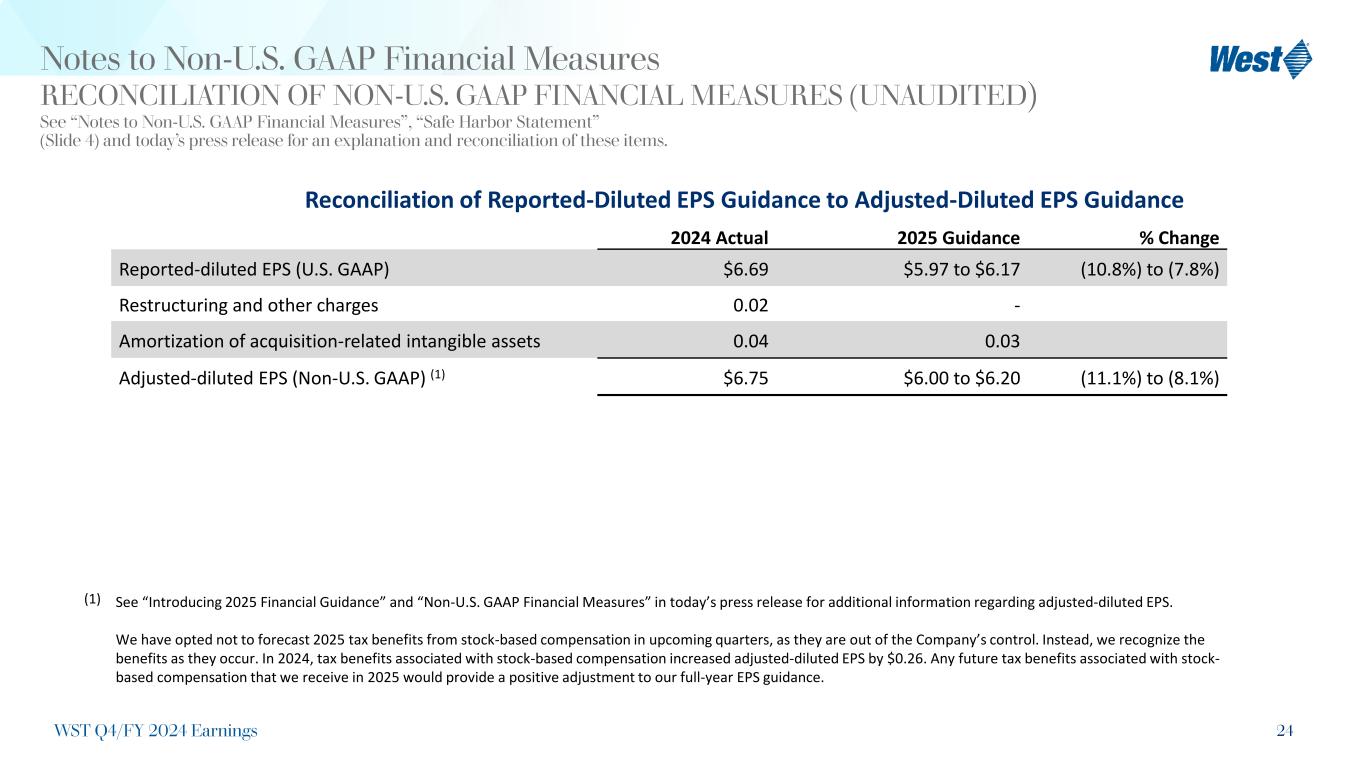
24 Notes to Non-U.S. GAAP Financial Measures RECONCILIATION OF NON-U.S. GAAP FINANCIAL MEASURES (UNAUDITED) See “Notes to Non-U.S. GAAP Financial Measures”, “Safe Harbor Statement” (Slide 4) and today’s press release for an explanation and reconciliation of these items. Reconciliation of Reported-Diluted EPS Guidance to Adjusted-Diluted EPS Guidance 2024 Actual 2025 Guidance % Change Reported-diluted EPS (U.S. GAAP) $6.69 $5.97 to $6.17 (10.8%) to (7.8%) Restructuring and other charges 0.02 - Amortization of acquisition-related intangible assets 0.04 0.03 Adjusted-diluted EPS (Non-U.S. GAAP) (1) $6.75 $6.00 to $6.20 (11.1%) to (8.1%) (1) See “Introducing 2025 Financial Guidance” and “Non-U.S. GAAP Financial Measures” in today’s press release for additional information regarding adjusted-diluted EPS. We have opted not to forecast 2025 tax benefits from stock-based compensation in upcoming quarters, as they are out of the Company’s control. Instead, we recognize the benefits as they occur. In 2024, tax benefits associated with stock-based compensation increased adjusted-diluted EPS by $0.26. Any future tax benefits associated with stock- based compensation that we receive in 2025 would provide a positive adjustment to our full-year EPS guidance. WST Q4/FY 2024 Earnings


