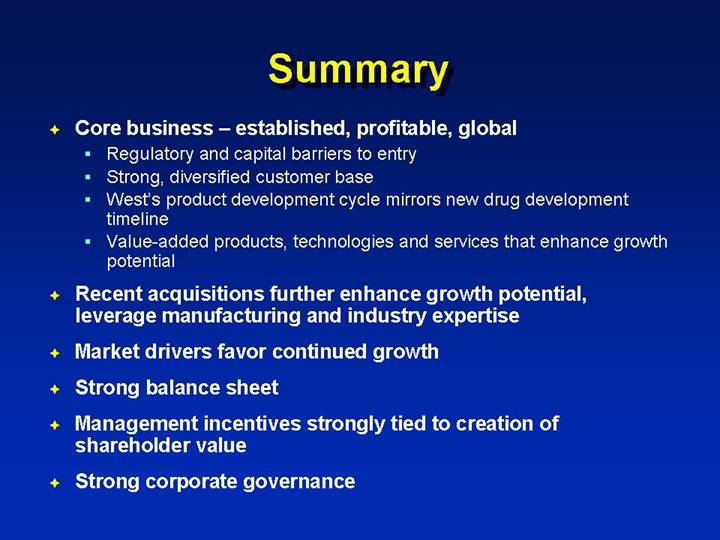
Searchable text section of graphics shown above
[LOGO]
Corporate Overview
Donald E. Morel, Jr., Ph.D.
Chairman and Chief Executive Officer
CJS Securities Conference
January 12, 2006
NYSE: WST
www.westpharma.com
Safe Harbor Statement
Certain statements contained in this presentation and certain statements that may be made by management of the Company orally during this presentation may contain forward-looking statements as defined in the Private Securities Litigation Reform Act of 1995. These statements can be identified by the fact that they do not relate strictly to historic or current facts. They use words such as “estimate,” “expect,” “intend,” “believe,” “plan,” “anticipate” and other words and terms of similar meaning in connection with any discussion of future operating or financial performance or condition. In particular, these include statements concerning future actions, future performance or results of current and anticipated products, sales efforts, expenses, the outcome of contingencies such as legal proceedings and financial results. Because actual results are affected by risks and uncertainties, the Company cautions investors that actual results may differ materially from those expressed or implied in any forward-looking statement.
It is not possible to predict or identify all such risks and uncertainties, but factors that could cause the actual results to differ materially from expected and historical results include, but are not limited to: sales demand; the timing and commercial success of customers’ products incorporating the Company’s products and services, including specifically, the Nektar inhaled insulin product; changes in medical and pharmaceutical technologies that alter the demand for injectable drug products; the Company’s ability to pass recent raw material cost increases on to customers through price increases; regulatory changes affecting the marketing, use or competitiveness of Company and customer products, the use and availability of raw materials used in the Company’s products, or the operation of the Company’s facilities; maintaining or improving production efficiencies and overhead absorption; competition from other providers; the Company’s ability to develop and market value-added products; the successful integration of acquired businesses; the average profitability, or mix, of products sold in a reporting period; financial performance of unconsolidated affiliates; the potential impact of the Medicare Prescription Drug, Improvement and Modernization Act of 2003; strength of the US dollar in relation to other currencies, particularly the Euro, UK pound, Danish Krone, Japanese Yen and Singapore Dollar; inflation; US and international interest rates and the availability of debt financing; returns on pension assets in relation to the expected returns employed in preparing the Company’s financial statements; raw material price escalation, particularly petroleum-based raw materials and energy costs; disruption in the supply of raw materials, particularly petroleum based raw materials, the production of which has been affected by recent hurricane damage in the US Gulf Coast region; exposure to product quality and safety claims; availability and pricing of materials that may be affected by vendor concerns with exposure to product-related liability.
The Company assumes no obligation to update forward-looking statements as circumstances change. Investors are advised, however, to consult any further disclosures the Company makes on related subjects in the Company’s 10-K, 10-Q and 8-K reports.
Who are we?
[GRAPHIC]
Each and every day
millions of West
products are used to
enhance healthcare
around the world.
Corporate Profile
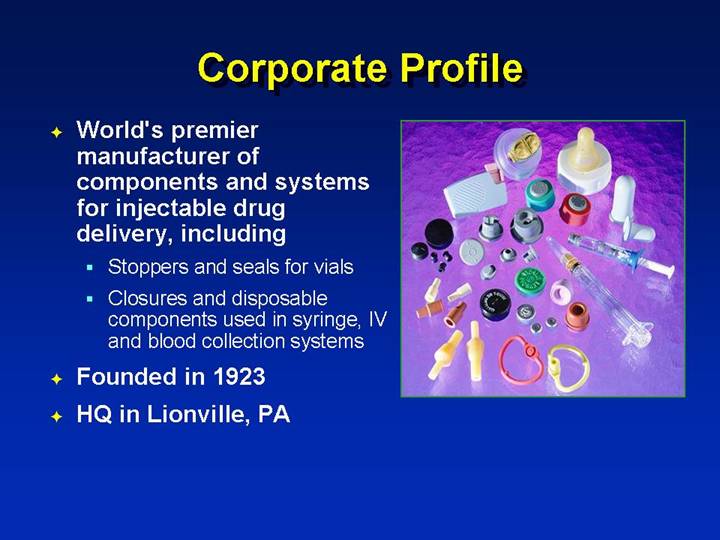
• World’s premier manufacturer of components and systems for injectable drug delivery, including
• Stoppers and seals for vials
• Closures and disposable components used in syringe, IV and blood collection systems
• Founded in 1923
• HQ in Lionville, PA
[GRAPHIC]
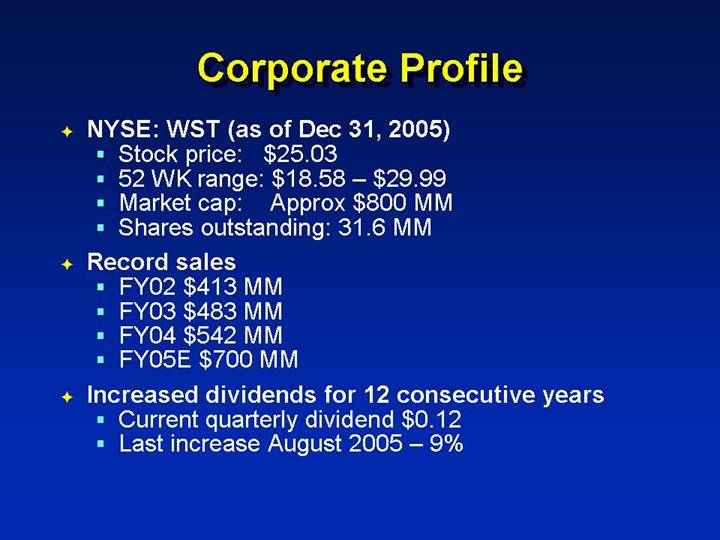
• NYSE: WST (as of Dec 31, 2005)
• Stock price: $25.03
• 52 WK range: $18.58 – $29.99
• Market cap: Approx $800 MM
• Shares outstanding: 31.6 MM
• Record sales
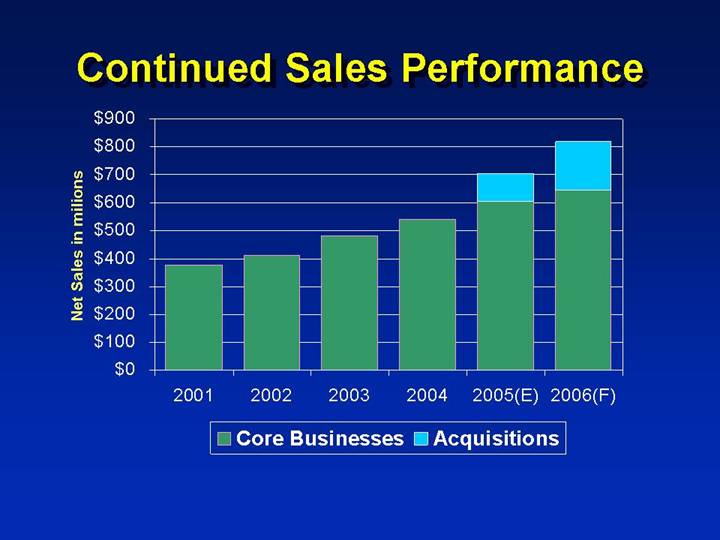
• FY02 $413 MM
• FY03 $483 MM
• FY04 $542 MM
• FY05E $700 MM
• Increased dividends for 12 consecutive years
• Current quarterly dividend $0.12
• Last increase August 2005 – 9%
Guidance Update
January 12, 2006
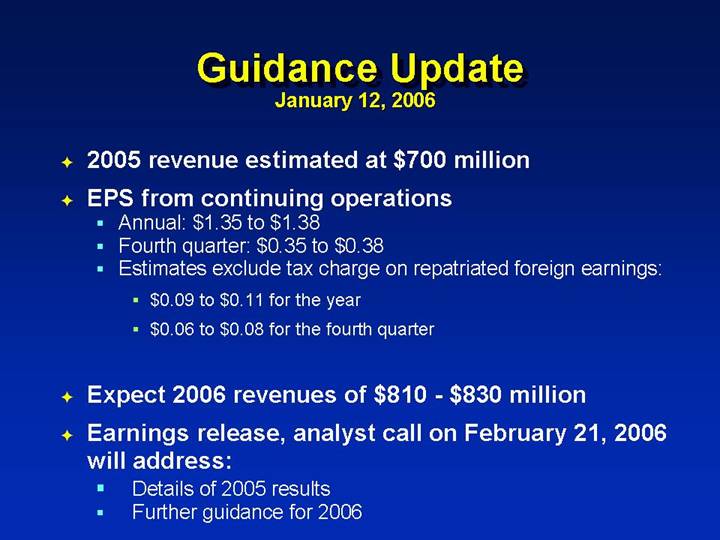
• 2005 revenue estimated at $700 million
• EPS from continuing operations
• Annual: $1.35 to $1.38
• Fourth quarter: $0.35 to $0.38
• Estimates exclude tax charge on repatriated foreign earnings:
• $0.09 to $0.11 for the year
• $0.06 to $0.08 for the fourth quarter
• Expect 2006 revenues of $810 - $830 million
• Earnings release, analyst call on February 21, 2006 will address:
• Details of 2005 results
• Further guidance for 2006
Global Presence
[GRAPHIC]
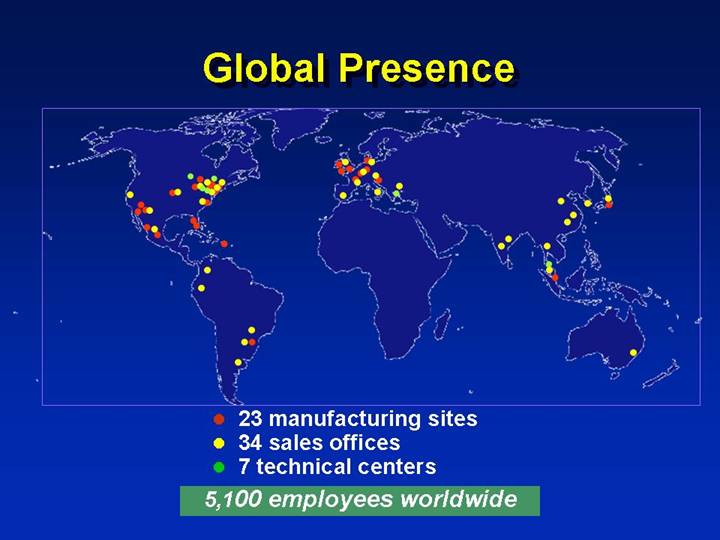
• 23 manufacturing sites
• 34 sales offices
• 7 technical centers
5,100 employees worldwide
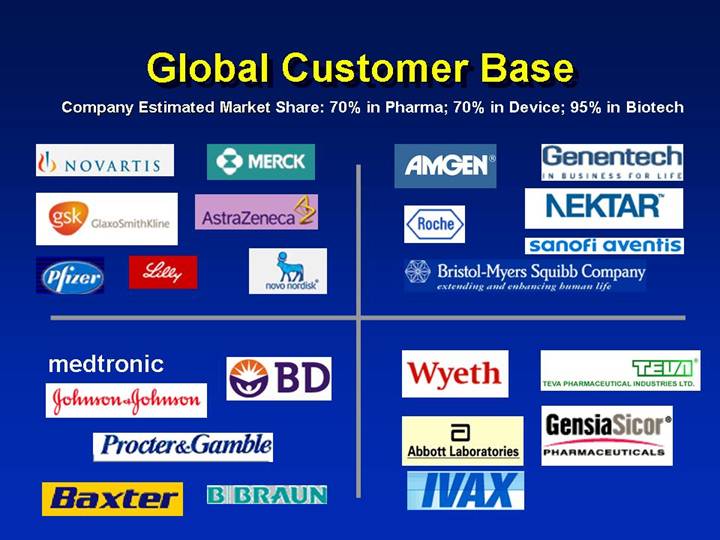
Global Customer Base
Company Estimated Market Share: 70% in Pharma; 70% in Device; 95% in Biotech
[LOGO] | | [LOGO] |
| | |
[LOGO] | | [LOGO] |
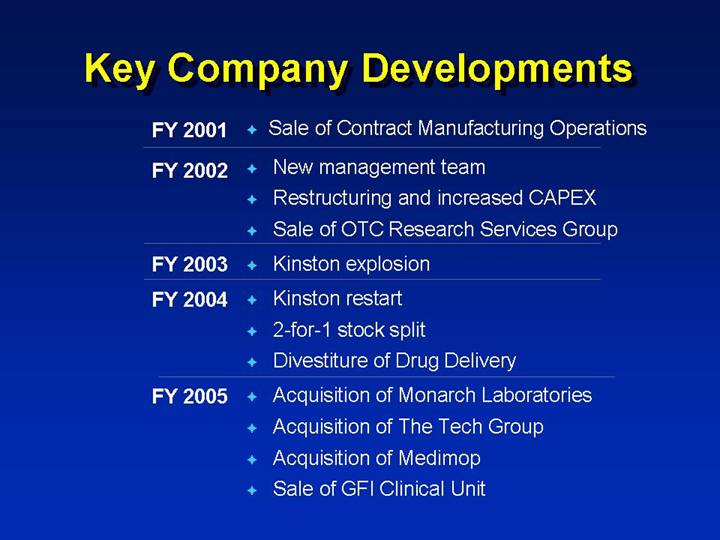
Key Company Developments
FY 2001 | • | Sale of Contract Manufacturing Operations |
| | |
FY 2002 | • | New management team |
| | |
| • | Restructuring and increased CAPEX |
| | |
| • | Sale of OTC Research Services Group |
| | |
FY 2003 | • | Kinston explosion |
| | |
FY 2004 | • | Kinston restart |
| | |
| • | 2-for-1 stock split |
| | |
| • | Divestiture of Drug Delivery |
| | |
FY 2005 | • | Acquisition of Monarch Laboratories |
| | |
| • | Acquisition of The Tech Group |
| | |
| • | Acquisition of Medimop |
| | |
| • | Sale of GFI Clinical Unit |
Continued Sales Performance
[CHART]
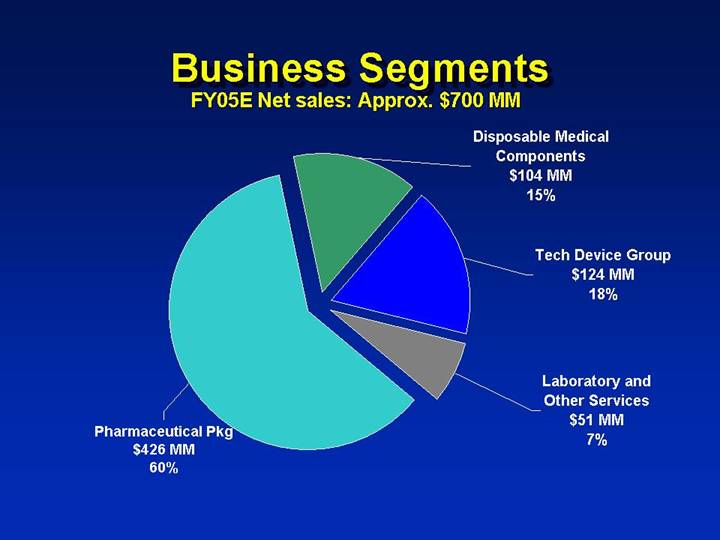
Business Segments
FY05E Net sales: Approx. $700 MM
[CHART]
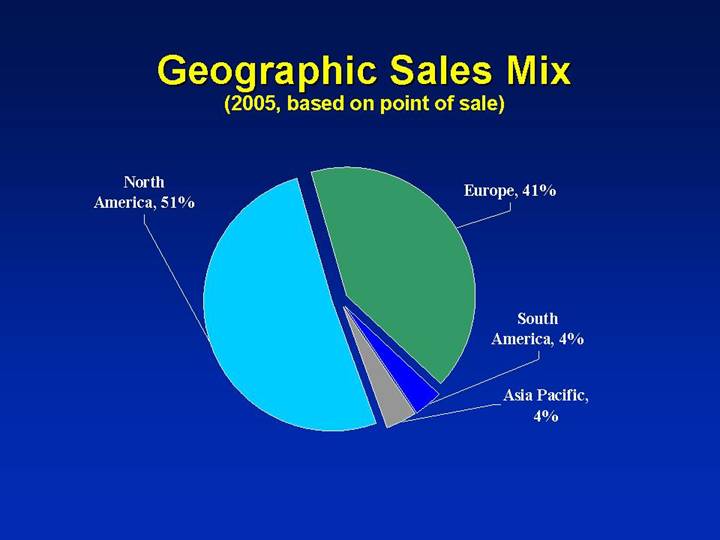
Geographic Sales Mix
(2005, based on point of sale)
[CHART]
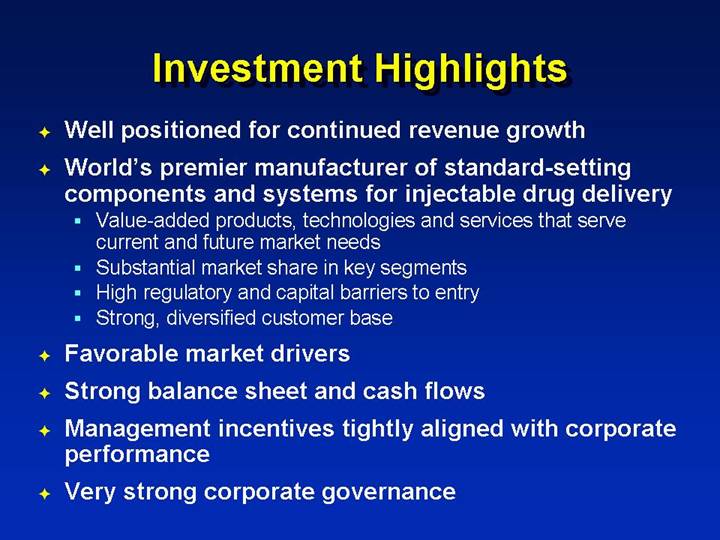
Investment Highlights
• Well positioned for continued revenue growth
• World’s premier manufacturer of standard-setting components and systems for injectable drug delivery
• Value-added products, technologies and services that serve current and future market needs
• Substantial market share in key segments
• High regulatory and capital barriers to entry
• Strong, diversified customer base
• Favorable market drivers
• Strong balance sheet and cash flows
• Management incentives tightly aligned with corporate performance
• Very strong corporate governance
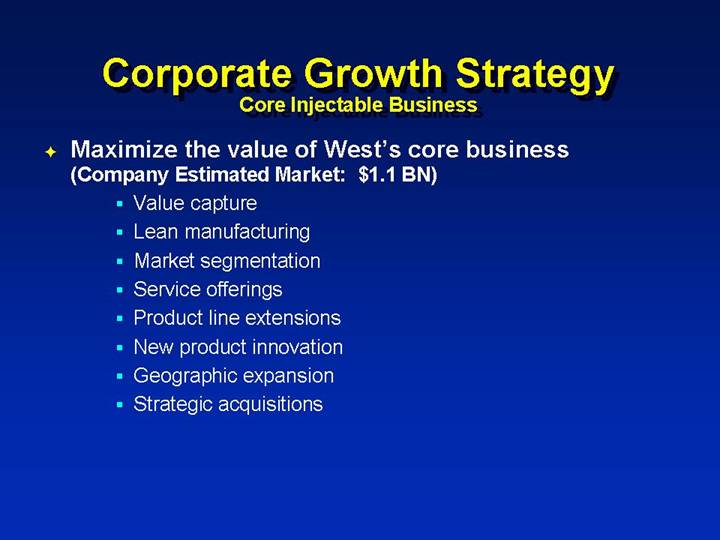
Corporate Growth Strategy
Core Injectable Business
• Maximize the value of West’s core business
(Company Estimated Market: $1.1 BN)
• Value capture
• Lean manufacturing
• Market segmentation
• Service offerings
• Product line extensions
• New product innovation
• Geographic expansion
• Strategic acquisitions
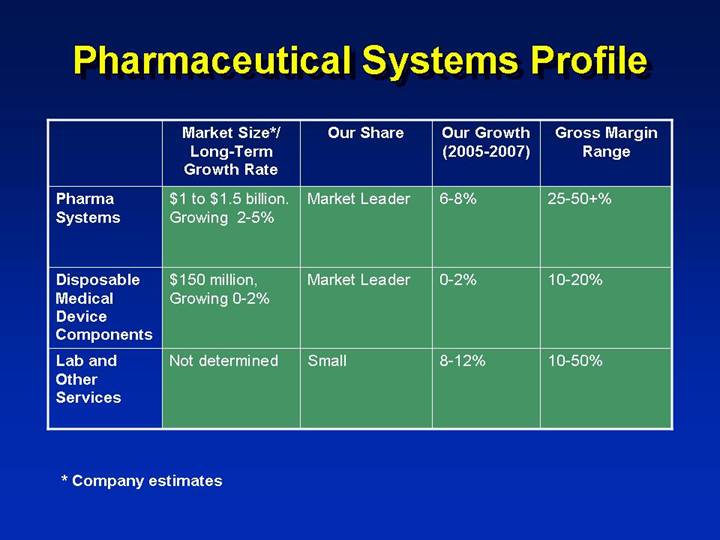
Pharmaceutical Systems Profile
| | Market Size*/
Long-Term
Growth Rate | | Our Share | | Our Growth
(2005-2007) | | Gross Margin
Range | |
Pharma Systems | | $1 to $1.5 billion.
Growing 2-5% | | Market Leader | | 6-8% | | 25-50+% | |
| | | | | | | | | |
Disposable Medical Device Components | | $150 million,
Growing 0-2% | | Market Leader | | 0-2% | | 10-20% | |
| | | | | | | | | |
Lab and Other Services | | Not determined | | Small | | 8-12% | | 10-50% | |
* Company estimates
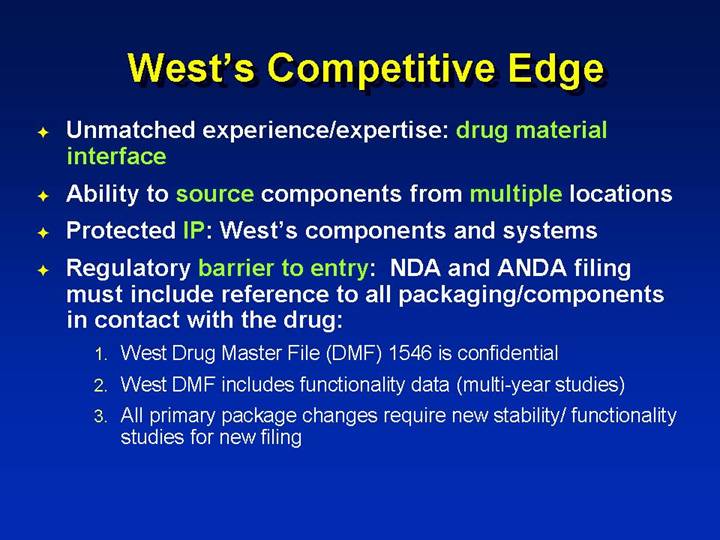
West’s Competitive Edge
• Unmatched experience/expertise: drug material interface
• Ability to source components from multiple locations
• Protected IP: West’s components and systems
• Regulatory barrier to entry: NDA and ANDA filing must include reference to all packaging/components in contact with the drug:
1. West Drug Master File (DMF) 1546 is confidential
2. West DMF includes functionality data (multi-year studies)
3. All primary package changes require new stability/ functionality studies for new filing
Growth Drivers
• Global demographics
• Diabetes
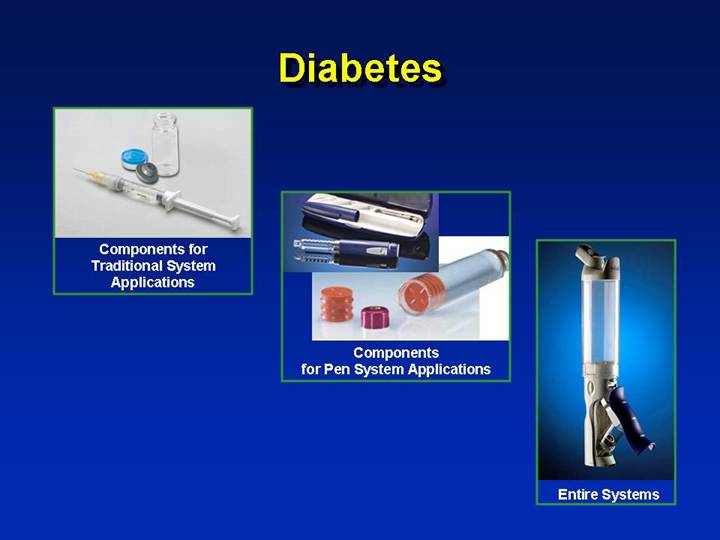
Diabetes
[GRAPHIC] | | | | |
Components for Traditional System Applications | | [GRAPHIC] | | |
| | Components for Pen System Applications | | [GRAPHIC] |
| | | | Entire Systems |
Growth Drivers
• Global demographics
• Diabetes
• Growth in biotechnology drugs
• Oncology
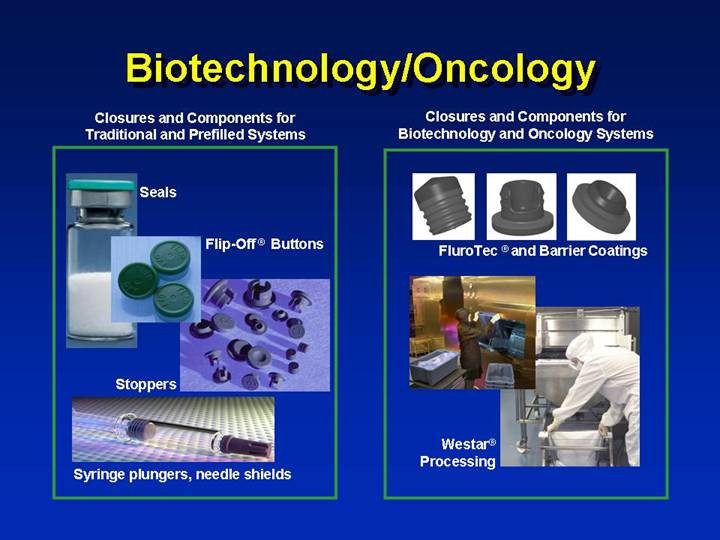
Biotechnology/Oncology
Closures and Components for
Traditional and Prefilled Systems | | Closures and Components for
Biotechnology and Oncology Systems |
| | |
[GRAPHIC] | | |
Seals | | [GRAPHIC] |
| | FluroTec ® and Barrier Coatings |
[GRAPHIC] | | |
Flip-Off ® Buttons | | |
| | |
[GRAPHIC] | | |
Stoppers | | [GRAPHIC] |
| | Westar® Processing |
[GRAPHIC] | | |
Syringe plungers, needle shields | | |
Reconstitution Aides
[GRAPHIC]
Growth Drivers
• Global demographics
• Diabetes
• Growth in biotechnology drugs
• Oncology
• Anti-counterfeiting needs
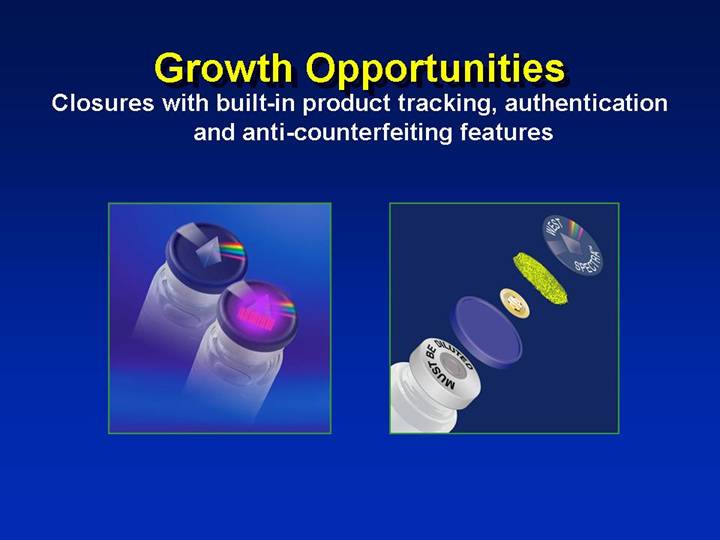
Growth Opportunities
Closures with built-in product tracking, authentication and anti-counterfeiting features
[GRAPHIC]
Corporate Growth Strategy
Device Business
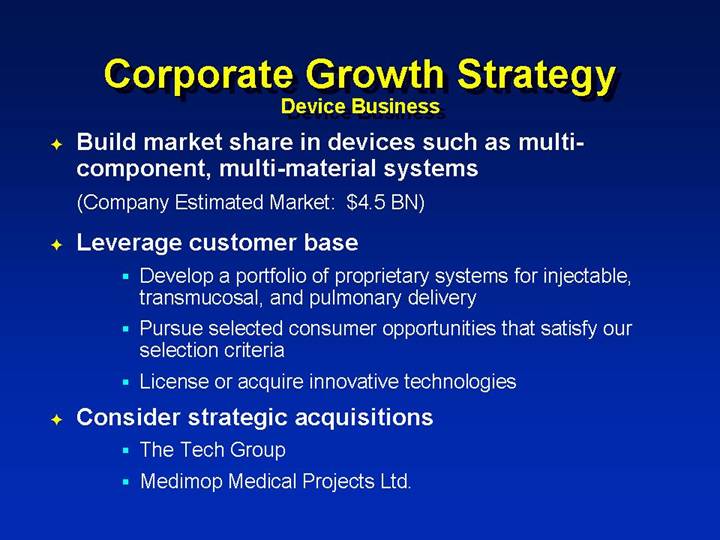
• Build market share in devices such as multi-component, multi-material systems
(Company Estimated Market: $4.5 BN)
• Leverage customer base
• Develop a portfolio of proprietary systems for injectable, transmucosal, and pulmonary delivery
• Pursue selected consumer opportunities that satisfy our selection criteria
• License or acquire innovative technologies
• Consider strategic acquisitions
• The Tech Group
• Medimop Medical Projects Ltd.
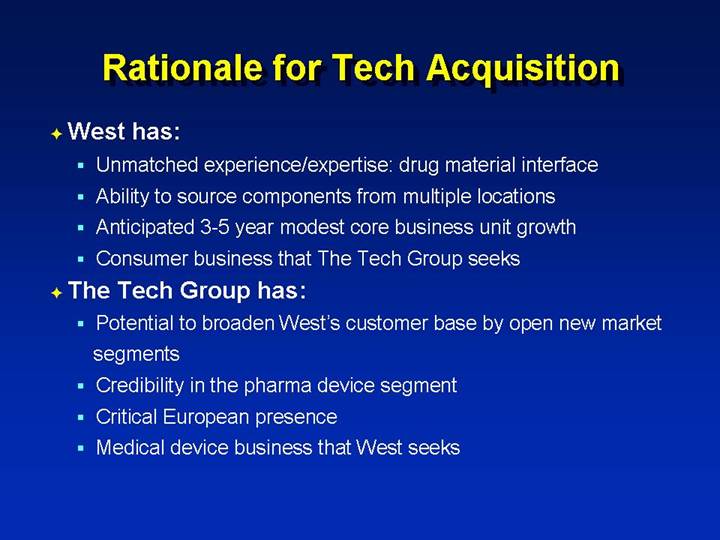
Rationale for Tech Acquisition
• West has:
• Unmatched experience/expertise: drug material interface
• Ability to source components from multiple locations
• Anticipated 3-5 year modest core business unit growth
• Consumer business that The Tech Group seeks
• The Tech Group has:
• Potential to broaden West’s customer base by open new market segments
• Credibility in the pharma device segment
• Critical European presence
• Medical device business that West seeks
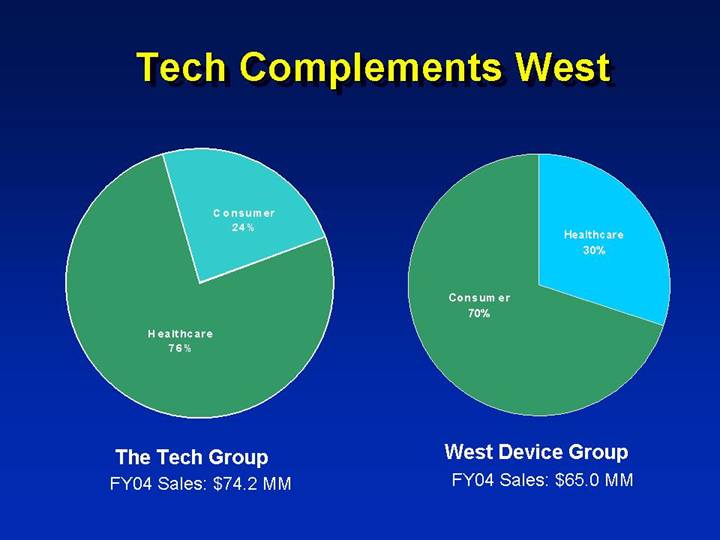
Tech Complements West
[CHART] | | [CHART] |
| | |
The Tech Group | | West Device Group |
FY04 Sales: $74.2 MM | | FY04 Sales: $65.0 MM |
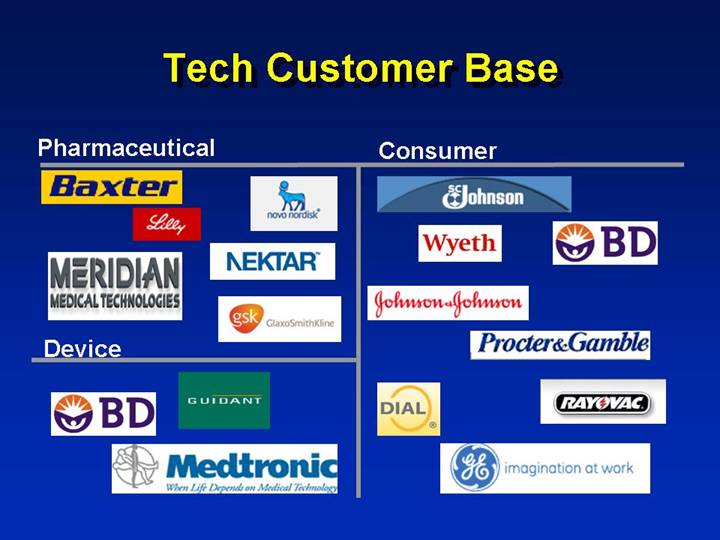
Tech Customer Base
Pharmaceutical | | Consumer |
[LOGO] | | [LOGO] |
| | |
Device | | |
[LOGO] | | |
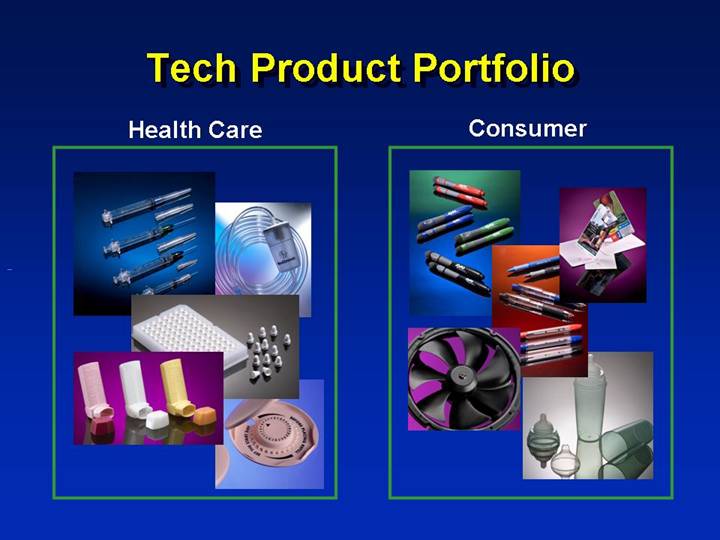
Tech Product Portfolio
Health Care | | Consumer |
[GRAPHIC] | | [GRAPHIC] |
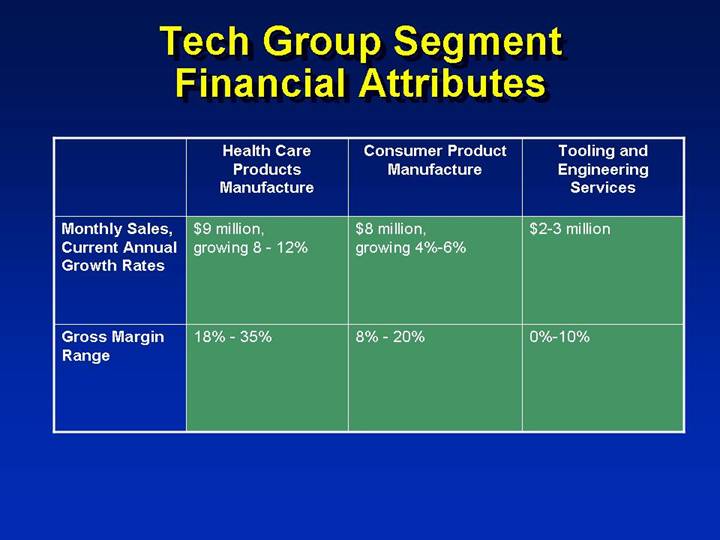
Tech Group Segment Financial Attributes
| | Health Care | | | | Tooling and |
| | Products | | Consumer Product | | Engineering |
| | Manufacture | | Manufacture | | Services |
| | | | | | |
Monthly Sales, Current Annual Growth Rates | | $9 million, growing 8 - 12% | | $8 million, growing 4%-6% | | $2-3 million |
| | | | | | |
Gross Margin Range | | 18% - 35% | | 8% - 20% | | 0%-10% |
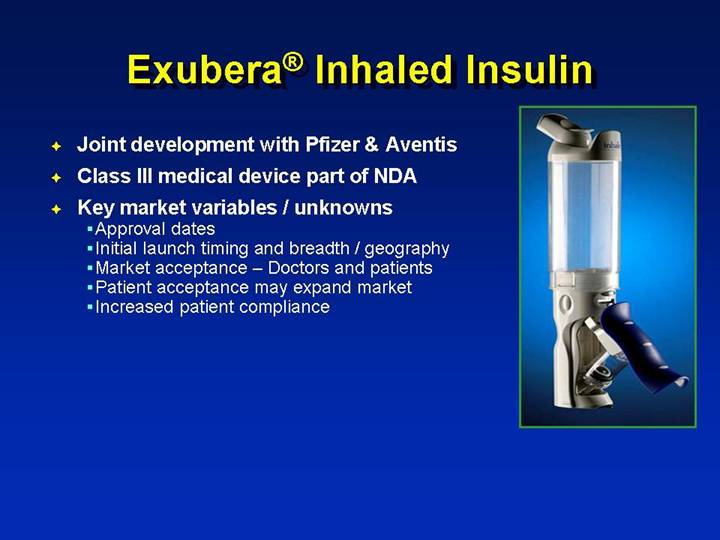
Exubera® Inhaled Insulin
• Joint development with Pfizer & Aventis
• Class III medical device part of NDA
• Key market variables / unknowns
• Approval dates
• Initial launch timing and breadth / geography
• Market acceptance – Doctors and patients
• Patient acceptance may expand market
• Increased patient compliance
[GRAPHIC]
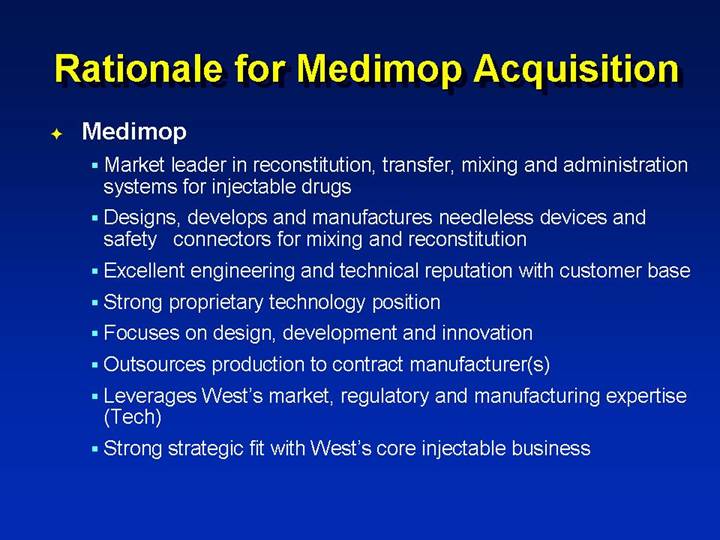
Rationale for Medimop Acquisition
• Medimop
• Market leader in reconstitution, transfer, mixing and administration systems for injectable drugs
• Designs, develops and manufactures needleless devices and safety connectors for mixing and reconstitution
• Excellent engineering and technical reputation with customer base
• Strong proprietary technology position
• Focuses on design, development and innovation
• Outsources production to contract manufacturer(s)
• Leverages West’s market, regulatory and manufacturing expertise (Tech)
• Strong strategic fit with West’s core injectable business
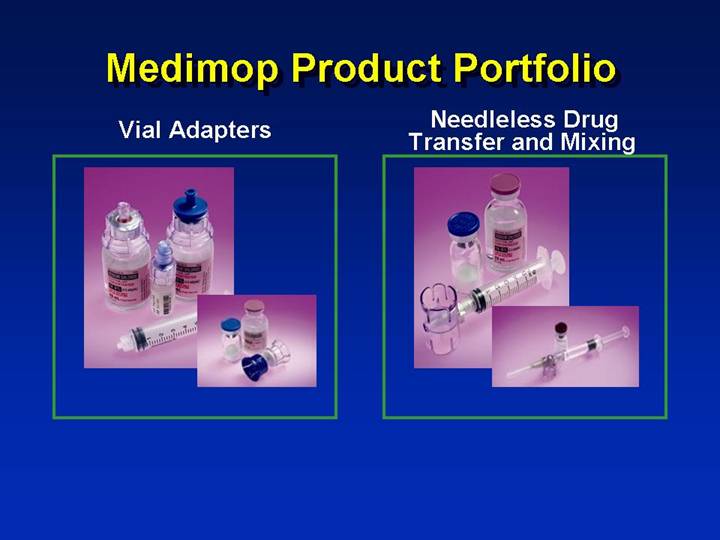
Medimop Product Portfolio
Vial Adapters | Needleless Drug
Transfer and Mixing |
| |
[GRAPHIC] | [GRAPHIC] |
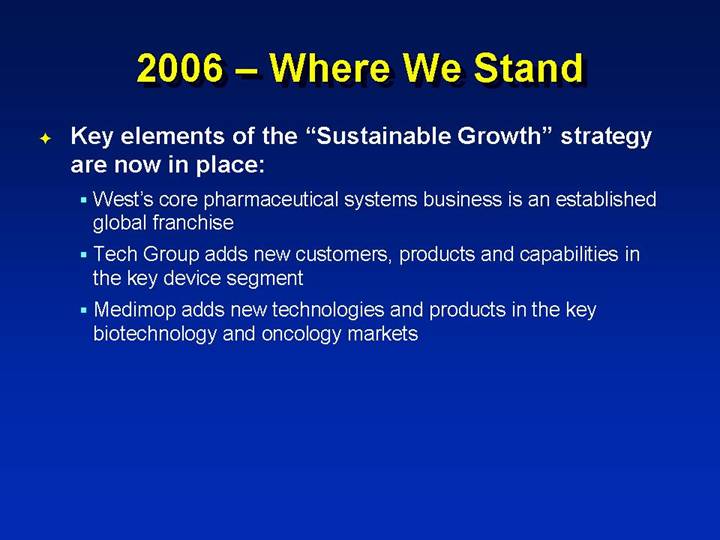
2006 – Where We Stand
• Key elements of the “Sustainable Growth” strategy are now in place:
• West’s core pharmaceutical systems business is an established global franchise
• Tech Group adds new customers, products and capabilities in the key device segment
• Medimop adds new technologies and products in the key biotechnology and oncology markets
Operating Priorities
• Execute business plan and strategy
• Retain focus on growth of core injectable business
• Capitalize on Tech and Medimop programs and opportunities
• Institutionalize “lean thinking”
• Assess expansion opportunities
• China – India – Brazil – Russia/Eastern Europe
• Continue to innovate, develop and acquire technologies
• “Adaptable” integration (e.g. TagSys – RFID)
• Product line expansion (e.g. Tech, Medimop)
• Next-generation systems (e.g. Silicone Free CZ PFS)
[LOGO]
Financial Considerations
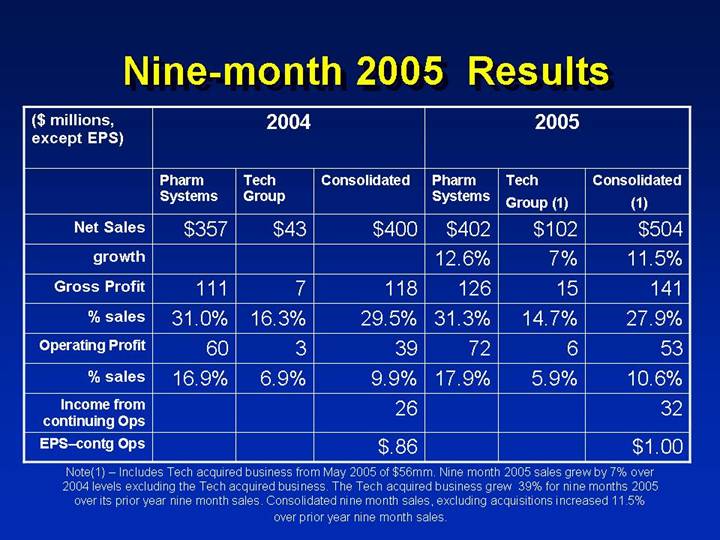
Nine-month 2005 Results
| | 2004 | | 2005 | |
($ millions,
except EPS) | | Pharm
Systems | | Tech
Group | | Consolidated | | Pharm
Systems | | Tech
Group (1) | | Consolidated
(1) | |
Net Sales | | $ | 357 | | $ | 43 | | $ | 400 | | $ | 402 | | $ | 102 | | $ | 504 | |
growth | | | | | | | | 12.6 | % | 7 | % | 11.5 | % |
Gross Profit | | 111 | | 7 | | 118 | | 126 | | 15 | | 141 | |
% sales | | 31.0 | % | 16.3 | % | 29.5 | % | 31.3 | % | 14.7 | % | 27.9 | % |
Operating Profit | | 60 | | 3 | | 39 | | 72 | | 6 | | 53 | |
% sales | | 16.9 | % | 6.9 | % | 9.9 | % | 17.9 | % | 5.9 | % | 10.6 | % |
Income from continuing Ops | | | | | | 26 | | | | | | 32 | |
EPS-contgOps | | | | | | $ | .86 | | | | | | $ | 1.00 | |
| | | | | | | | | | | | | | | | | | | |
Note(1) – Includes Tech acquired business from May 2005 of $56mm. Nine month 2005 sales grew by 7% over 2004 levels excluding the Tech acquired business. The Tech acquired business grew 39% for nine months 2005 over its prior year nine month sales. Consolidated nine month sales, excluding acquisitions increased 11.5% over prior year nine month sales.
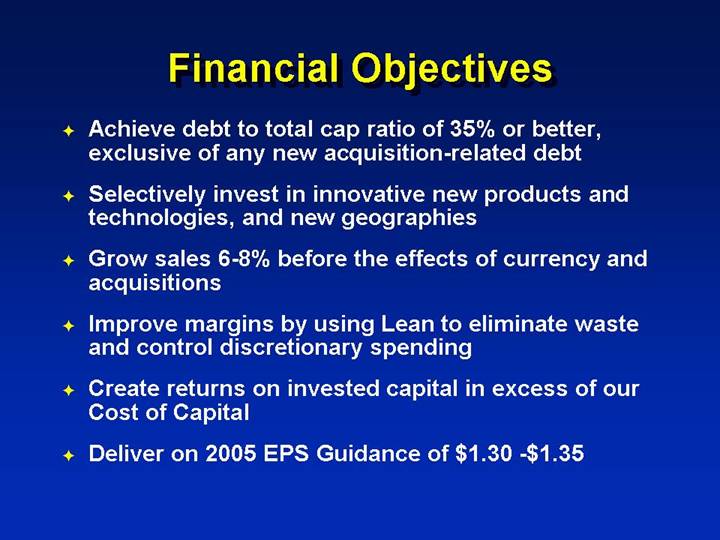
Financial Objectives
• Achieve debt to total cap ratio of 35% or better, exclusive of any new acquisition-related debt
• Selectively invest in innovative new products and technologies, and new geographies
• Grow sales 6-8% before the effects of currency and acquisitions
• Improve margins by using Lean to eliminate waste and control discretionary spending
• Create returns on invested capital in excess of our Cost of Capital
• Deliver on 2005 EPS Guidance of $1.30 -$1.35
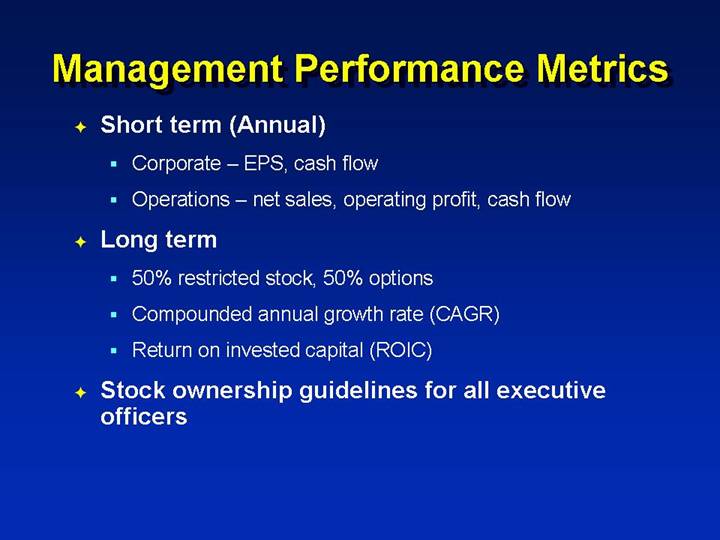
Management Performance Metrics
• Short term (Annual)
• Corporate – EPS, cash flow
• Operations – net sales, operating profit, cash flow
• Long term
• 50% restricted stock, 50% options
• Compounded annual growth rate (CAGR)
• Return on invested capital (ROIC)
• Stock ownership guidelines for all executive officers
Summary
• Core business – established, profitable, global
• Regulatory and capital barriers to entry
• Strong, diversified customer base
• West’s product development cycle mirrors new drug development timeline
• Value-added products, technologies and services that enhance growth potential
• Recent acquisitions further enhance growth potential, leverage manufacturing and industry expertise
• Market drivers favor continued growth
• Strong balance sheet
• Management incentives strongly tied to creation of shareholder value
• Strong corporate governance


