Exhibit 99.2 |

Financial Results2Q 2019
2 Forward-Looking Statements This presentation may contain “forward-looking statements” concerning the Corporation’s future economic, operational and financial performance. The words or phrases “expect,” “anticipate,” “intend,” “look forward,” “should,” “would,” “believes” and similar expressions are meant to identify “forward-looking statements” within the meaning of Section 27A of the Securities Act of 1933, as amended, and Section 21E of the Securities Exchange Act of 1934, as amended, and are subject to the safe harbor created by such sections. The Corporation cautions readers not to place undue reliance on any such “forward-looking statements,” which speak only as of the date made, and advises readers that various factors, including, but not limited to, the following could cause actual results to differ materially from those expressed in, or implied by such forward-looking statements: the actual pace and magnitude of economic recovery in the regions impacted by the two hurricanes that affected the Corporation’s service areas during the third quarter of 2017 compared to management's current views on the economic recovery; uncertainties about how and when rebuilding will take place in the regions affected by the recent storms, including the rebuilding of the public infrastructure, such as Puerto Rico’s power grid, what level of government, private or philanthropic funds will be invested in the affected communities, how many dislocated individuals will return to their homes in both the short- and long-term, and what other demographic changes will take place; uncertainty as to the ultimate outcomes of actions taken, or those that may have to be taken, by the Puerto Rico government, or the oversight board established by the Puerto Rico Oversight, Management, and Economic Stability Act (PROMESA) to address Puerto Rico’s financial problems, including the filing of a form of bankruptcy under Title III of PROMESA that provides a court debt restructuring process similar to U.S. bankruptcy protection; the ability of the Puerto Rico government or any of its public corporations or other instrumentalities to repay its respective debt obligations, including the effect of payment defaults on the Puerto Rico government general obligations, bonds of the Government Development Bank for Puerto Rico and certain bonds of government public corporations, and recent and any future downgrades of the long-term and short-term debt ratings of the Puerto Rico government, which could exacerbate Puerto Rico’s adverse economic conditions and, in turn, further adversely impact the Corporation; uncertainty about whether approvals by the New York FED will be provided for future payments of dividends to stockholders or for receiving dividends from FirstBank, or for making payments on trust preferred securities or subordinated debt, incurring, increasing or guaranteeing debt or repurchasing any capital securities, despite the consents that have enabled the Corporation to pay quarterly interest payments on the Corporation’s subordinated debentures associated with its trust preferred securities since the second quarter of 2016, and for future monthly dividends on the non-cumulative perpetual preferred stock, despite the consents that have enabled the Corporation to pay monthly dividends on its non-cumulative perpetual preferred stock since December 2016; a decrease in demand for the Corporation’s products and services and lower revenues and earnings because of the continued recession in Puerto Rico; uncertainty as to the availability of certain funding sources, such as brokered CDs; the Corporation’s reliance on brokered CDs to fund operations and provide liquidity; the risk of not being able to fulfill the Corporation’s cash obligations or resume paying dividends to the Corporation’s common stockholders in the future due to the Corporation’s need to receive regulatory approvals to declare or pay any dividends and to take dividends or any other form of payment representing a reduction in capital from FirstBank or FirstBank’s failure to generate sufficient cash flow to make a dividend payment to the Corporation; the weakness of the real estate markets and of the consumer and commercial sectors and their impact on the credit quality of the Corporation’s loans and other assets, which have contributed and may continue to contribute to, among other things, high levels of non-performing assets, charge-offs and provisions for loan and lease losses, and may subject the Corporation to further risk from loan defaults and foreclosures; the ability of FirstBank to realize the benefits of its deferred tax assets subject to the remaining valuation allowance; adverse changes in general economic conditions in Puerto Rico, the U.S., and the U.S. Virgin Islands and British Virgin Islands, including the interest rate environment, market liquidity, housing absorption rates, real estate prices, and disruptions in the U.S. capital markets, which reduced interest margins and affected funding sources, and has affected demand for all of the Corporation’s products and services and reduced the Corporation’s revenues and earnings, and the value of the Corporation’s assets, and may continue to have these effects; an adverse change in the Corporation’s ability to attract new clients and retain existing ones; the risk that additional portions of the unrealized losses in the Corporation’s investment portfolio are determined to be other-than-temporary, including additional impairments on the Puerto Rico government’s obligations; uncertainty about regulatory and legislative changes for financial services companies in Puerto Rico, the U.S., and the U.S. and British Virgin Islands, which could affect the Corporation’s financial condition or performance and could cause the Corporation’s actual results for future periods to differ materially from prior results and anticipated or projected results; changes in the fiscal and monetary policies and regulations of the U.S. federal government and the Puerto Rico and other governments, including those determined by the Federal Reserve Board, the New York Fed, the Federal Deposit Insurance Corporation (“FDIC”), government-sponsored housing agencies, and regulators in Puerto Rico and the U.S. and British Virgin Islands; the risk of possible failure or circumvention of controls and procedures and the risk that the Corporation’s risk management policies may not be adequate; the risk that the FDIC may increase the deposit insurance premium and/or require special assessments to replenish its insurance fund, causing an additional increase in the Corporation’s non-interest expenses; the impact on the Corporation’s results of operations and financial condition of acquisitions and dispositions; a need to recognize additional impairments on the Corporation’s financial instruments, goodwill or other intangible assets relating to acquisitions; the risk that downgrades in the credit ratings of the Corporation’s long-term senior debt will adversely affect the Corporation’s ability to access necessary external funds; the impact on the Corporation’s businesses, business practices and results of operations of a potential higher interest rate environment; uncertainty as to whether FirstBank will be able to satisfy its regulators regarding, among other things, its asset quality, liquidity plans, maintenance of capital levels and compliance with applicable laws, regulations and related requirements; and general competitive factors and industry consolidation. The Corporation does not undertake, and specifically disclaims any obligation, to update any “forward-looking statements” to reflect occurrences or unanticipated events or circumstances after the date of such statements, except as required by the federal securities laws.

Agenda Second Quarter 2019 Highlights Aurelio Alemán, President & Chief Executive OfficerSecond Quarter 2019 Results of Operations Orlando Berges, Executive Vice President & Chief Financial OfficerQuestions & Answers 3
Key Highlights 4 Second Quarter 2019 Highlights
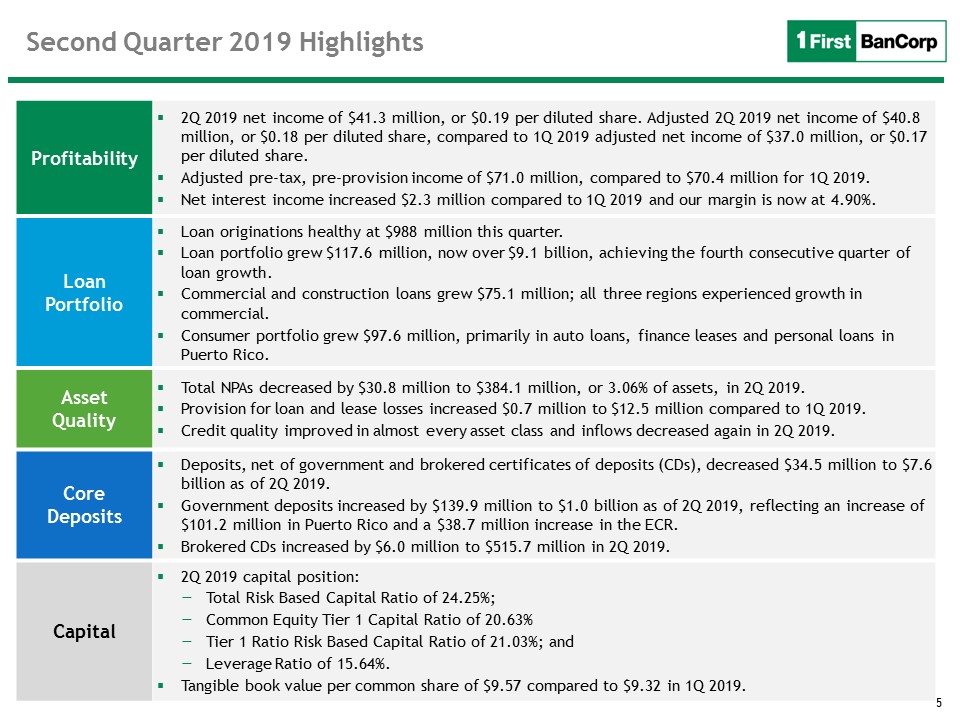
Profitability 2Q 2019 net income of $41.3 million, or $0.19 per diluted share. Adjusted 2Q 2019 net income of $40.8 million, or $0.18 per diluted share, compared to 1Q 2019 adjusted net income of $37.0 million, or $0.17 per diluted share.Adjusted pre-tax, pre-provision income of $71.0 million, compared to $70.4 million for 1Q 2019. Net interest income increased $2.3 million compared to 1Q 2019 and our margin is now at 4.90%. Loan Portfolio Loan originations healthy at $988 million this quarter.Loan portfolio grew $117.6 million, now over $9.1 billion, achieving the fourth consecutive quarter of loan growth.Commercial and construction loans grew $75.1 million; all three regions experienced growth in commercial.Consumer portfolio grew $97.6 million, primarily in auto loans, finance leases and personal loans in Puerto Rico. Asset Quality Total NPAs decreased by $30.8 million to $384.1 million, or 3.06% of assets, in 2Q 2019.Provision for loan and lease losses increased $0.7 million to $12.5 million compared to 1Q 2019. Credit quality improved in almost every asset class and inflows decreased again in 2Q 2019. Core Deposits Deposits, net of government and brokered certificates of deposits (CDs), decreased $34.5 million to $7.6 billion as of 2Q 2019.Government deposits increased by $139.9 million to $1.0 billion as of 2Q 2019, reflecting an increase of $101.2 million in Puerto Rico and a $38.7 million increase in the ECR.Brokered CDs increased by $6.0 million to $515.7 million in 2Q 2019. Capital 2Q 2019 capital position: Total Risk Based Capital Ratio of 24.25%;Common Equity Tier 1 Capital Ratio of 20.63%Tier 1 Ratio Risk Based Capital Ratio of 21.03%; andLeverage Ratio of 15.64%.Tangible book value per common share of $9.57 compared to $9.32 in 1Q 2019. 5 Second Quarter 2019 Highlights
6 Results of Operations Second Quarter 2019 Results
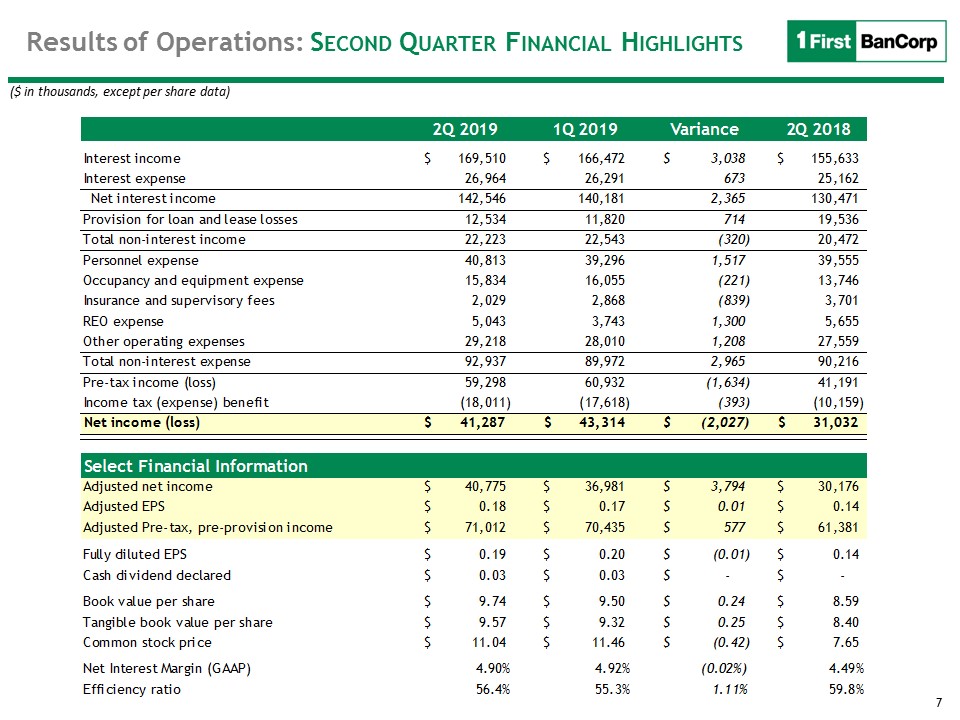
7 Results of Operations: Second Quarter Financial Highlights ($ in thousands, except per share data) Select Financial Information
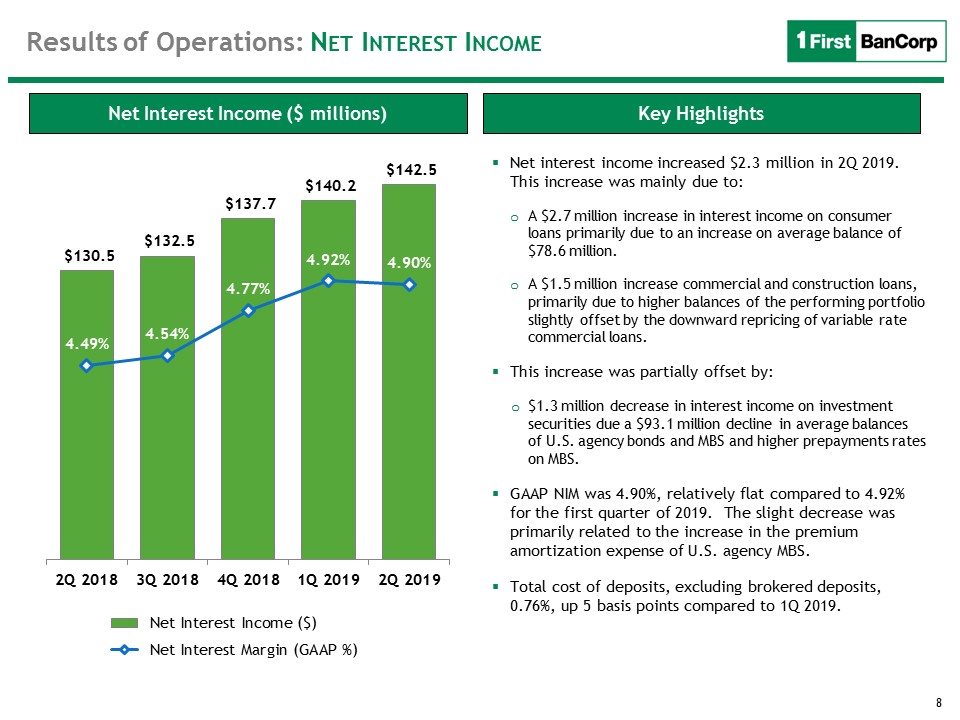
8 Key Highlights Net Interest Income ($ millions) Net interest income increased $2.3 million in 2Q 2019. This increase was mainly due to:A $2.7 million increase in interest income on consumer loans primarily due to an increase on average balance of $78.6 million. A $1.5 million increase commercial and construction loans, primarily due to higher balances of the performing portfolio slightly offset by the downward repricing of variable rate commercial loans.This increase was partially offset by:$1.3 million decrease in interest income on investment securities due a $93.1 million decline in average balances of U.S. agency bonds and MBS and higher prepayments rates on MBS.GAAP NIM was 4.90%, relatively flat compared to 4.92% for the first quarter of 2019. The slight decrease was primarily related to the increase in the premium amortization expense of U.S. agency MBS. Total cost of deposits, excluding brokered deposits, 0.76%, up 5 basis points compared to 1Q 2019. Results of Operations: Net Interest Income
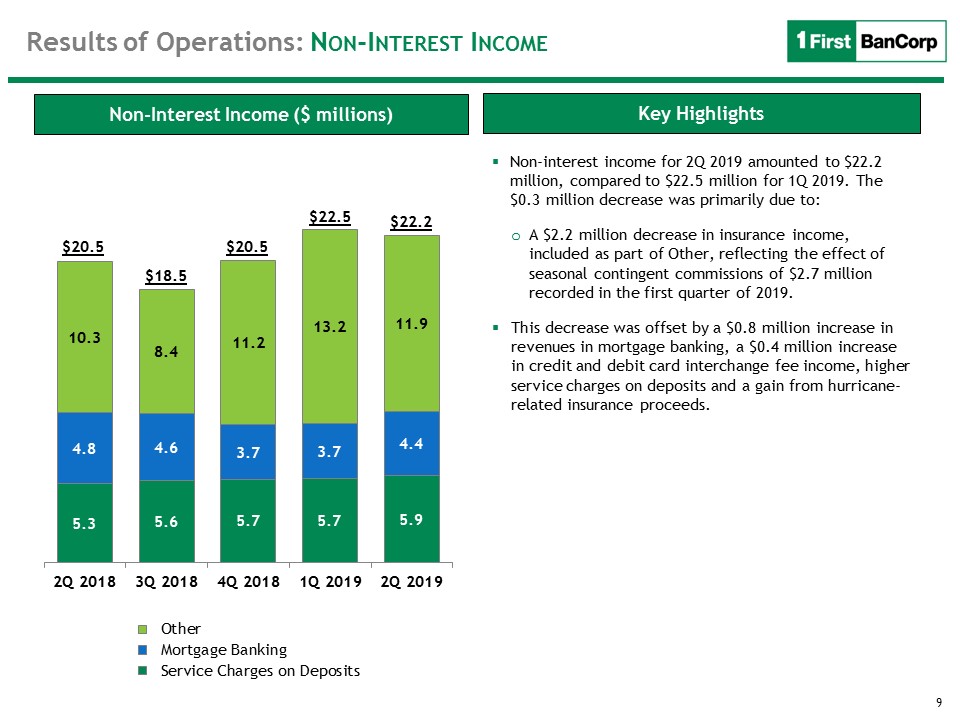
9 Non-interest income for 2Q 2019 amounted to $22.2 million, compared to $22.5 million for 1Q 2019. The $0.3 million decrease was primarily due to: A $2.2 million decrease in insurance income, included as part of Other, reflecting the effect of seasonal contingent commissions of $2.7 million recorded in the first quarter of 2019. This decrease was offset by a $0.8 million increase in revenues in mortgage banking, a $0.4 million increase in credit and debit card interchange fee income, higher service charges on deposits and a gain from hurricane-related insurance proceeds. Results of Operations: Non-Interest Income Non-Interest Income ($ millions) $22.5 $18.5 $20.5 $22.2 $20.5 Key Highlights
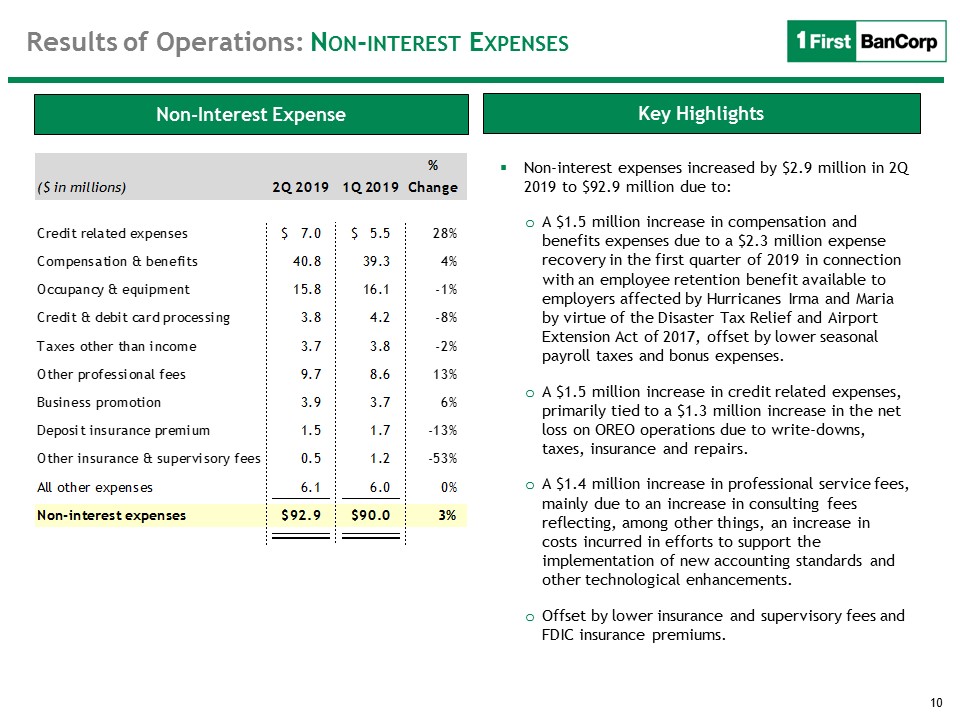
10 Results of Operations: Non-interest Expenses Non-interest expenses increased by $2.9 million in 2Q 2019 to $92.9 million due to:A $1.5 million increase in compensation and benefits expenses due to a $2.3 million expense recovery in the first quarter of 2019 in connection with an employee retention benefit available to employers affected by Hurricanes Irma and Maria by virtue of the Disaster Tax Relief and Airport Extension Act of 2017, offset by lower seasonal payroll taxes and bonus expenses. A $1.5 million increase in credit related expenses, primarily tied to a $1.3 million increase in the net loss on OREO operations due to write-downs, taxes, insurance and repairs.A $1.4 million increase in professional service fees, mainly due to an increase in consulting fees reflecting, among other things, an increase in costs incurred in efforts to support the implementation of new accounting standards and other technological enhancements.Offset by lower insurance and supervisory fees and FDIC insurance premiums. Non-Interest Expense Key Highlights
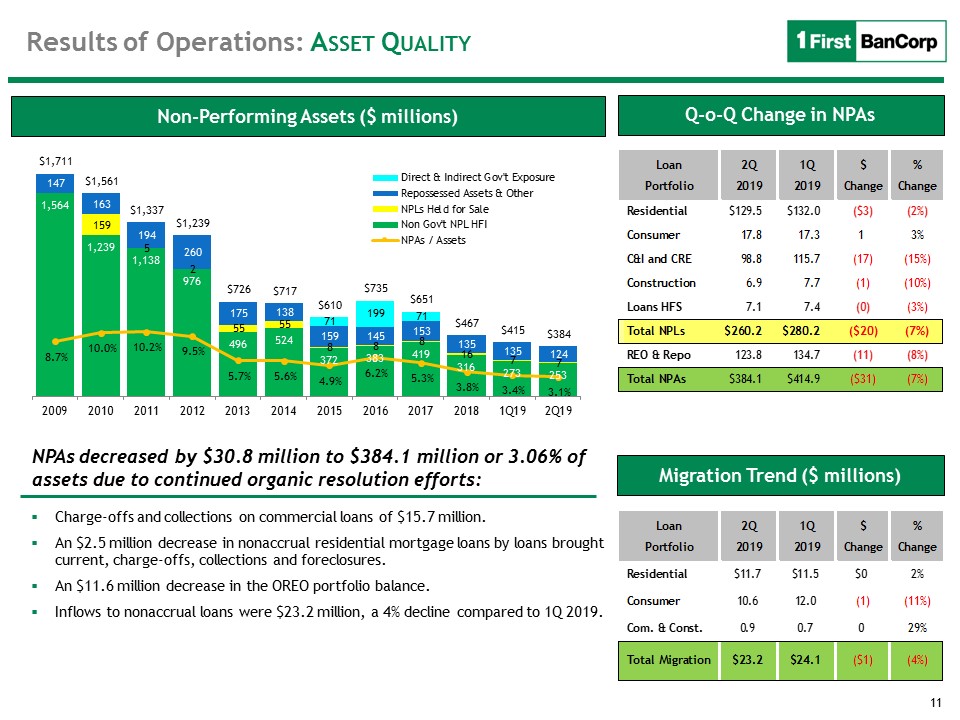
11 Non-Performing Assets ($ millions) Charge-offs and collections on commercial loans of $15.7 million.An $2.5 million decrease in nonaccrual residential mortgage loans by loans brought current, charge-offs, collections and foreclosures.An $11.6 million decrease in the OREO portfolio balance. Inflows to nonaccrual loans were $23.2 million, a 4% decline compared to 1Q 2019. NPAs decreased by $30.8 million to $384.1 million or 3.06% of assets due to continued organic resolution efforts: Results of Operations: Asset Quality Q-o-Q Change in NPAs Migration Trend ($ millions)
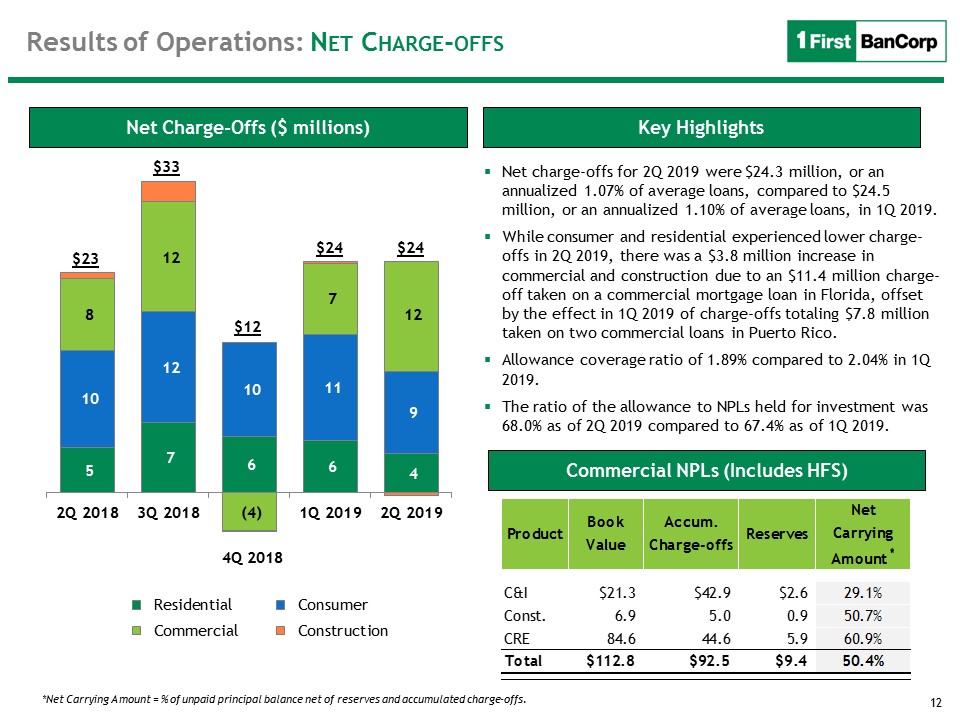
12 Key Highlights Net Charge-Offs ($ millions) Net charge-offs for 2Q 2019 were $24.3 million, or an annualized 1.07% of average loans, compared to $24.5 million, or an annualized 1.10% of average loans, in 1Q 2019. While consumer and residential experienced lower charge-offs in 2Q 2019, there was a $3.8 million increase in commercial and construction due to an $11.4 million charge-off taken on a commercial mortgage loan in Florida, offset by the effect in 1Q 2019 of charge-offs totaling $7.8 million taken on two commercial loans in Puerto Rico. Allowance coverage ratio of 1.89% compared to 2.04% in 1Q 2019. The ratio of the allowance to NPLs held for investment was 68.0% as of 2Q 2019 compared to 67.4% as of 1Q 2019. Commercial NPLs (Includes HFS) *Net Carrying Amount = % of unpaid principal balance net of reserves and accumulated charge-offs. Results of Operations: Net Charge-offs $24 $12 $33 $24 $23 4Q 2018

13 Second Quarter 2019 Results Q & A

14 Second Quarter 2019 Results Exhibits
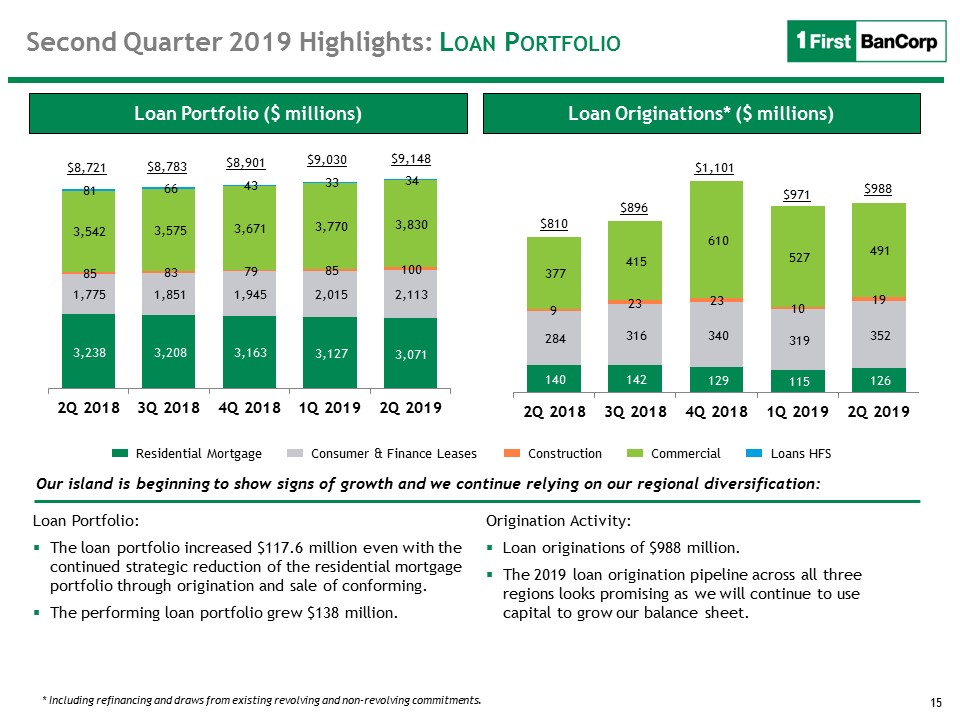
15 Loan Originations* ($ millions) Loan Portfolio ($ millions) Residential Mortgage Consumer & Finance Leases Construction Commercial Loans HFS Our island is beginning to show signs of growth and we continue relying on our regional diversification: * Including refinancing and draws from existing revolving and non-revolving commitments. Second Quarter 2019 Highlights: Loan Portfolio $8,783 $9,030 $1,101 $9,148 $8,721 $810 Loan Portfolio:The loan portfolio increased $117.6 million even with the continued strategic reduction of the residential mortgage portfolio through origination and sale of conforming.The performing loan portfolio grew $138 million. Origination Activity:Loan originations of $988 million.The 2019 loan origination pipeline across all three regions looks promising as we will continue to use capital to grow our balance sheet. $8,901 $988 $971 $896
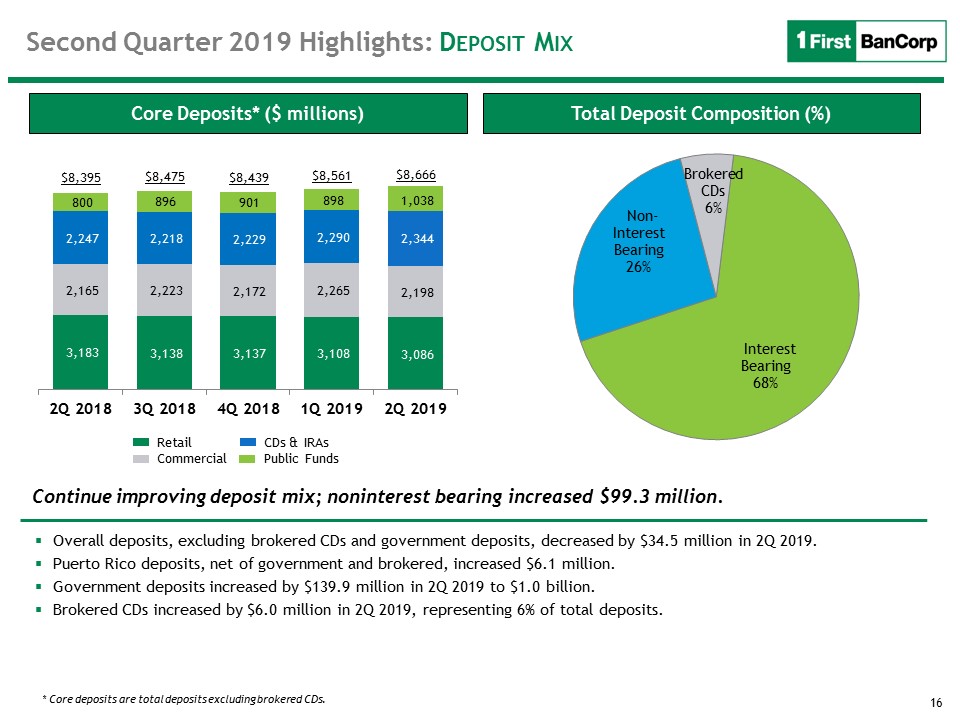
16 Total Deposit Composition (%) Core Deposits* ($ millions) * Core deposits are total deposits excluding brokered CDs. Continue improving deposit mix; noninterest bearing increased $99.3 million. Second Quarter 2019 Highlights: Deposit Mix Retail Commercial CDs & IRAs Public Funds $8,439 $8,666 Overall deposits, excluding brokered CDs and government deposits, decreased by $34.5 million in 2Q 2019. Puerto Rico deposits, net of government and brokered, increased $6.1 million.Government deposits increased by $139.9 million in 2Q 2019 to $1.0 billion.Brokered CDs increased by $6.0 million in 2Q 2019, representing 6% of total deposits. $8,395 $8,561 $8,475
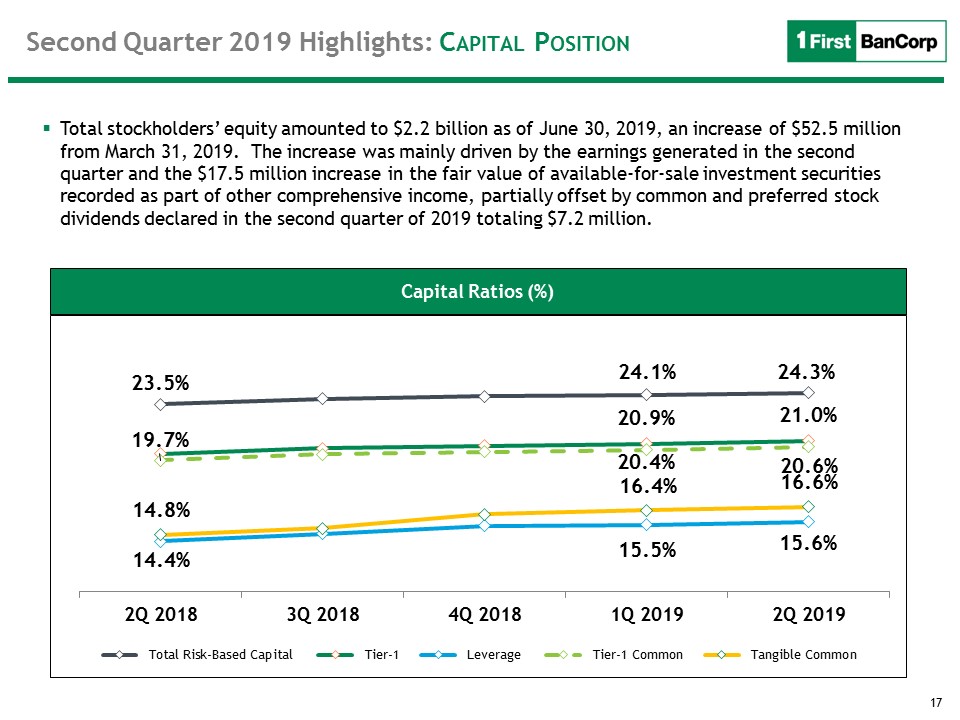
17 Second Quarter 2019 Highlights: Capital Position Capital Ratios (%) Total stockholders’ equity amounted to $2.2 billion as of June 30, 2019, an increase of $52.5 million from March 31, 2019. The increase was mainly driven by the earnings generated in the second quarter and the $17.5 million increase in the fair value of available-for-sale investment securities recorded as part of other comprehensive income, partially offset by common and preferred stock dividends declared in the second quarter of 2019 totaling $7.2 million. Capital Ratios (%)
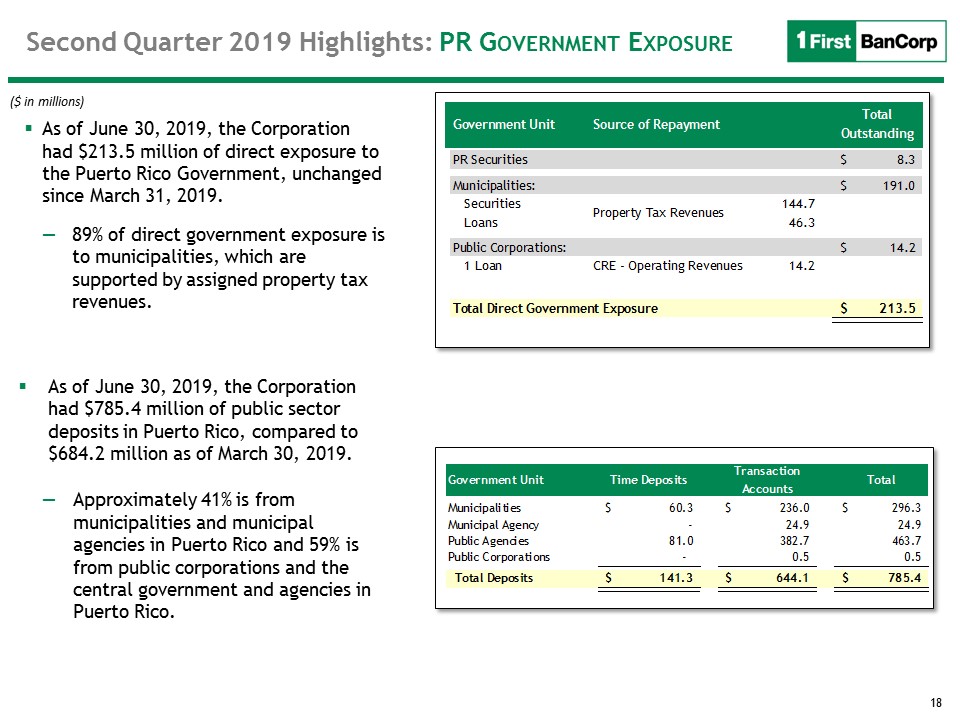
18 Second Quarter 2019 Highlights: PR Government Exposure ($ in millions) As of June 30, 2019, the Corporation had $213.5 million of direct exposure to the Puerto Rico Government, unchanged since March 31, 2019. 89% of direct government exposure is to municipalities, which are supported by assigned property tax revenues. As of June 30, 2019, the Corporation had $785.4 million of public sector deposits in Puerto Rico, compared to $684.2 million as of March 30, 2019. Approximately 41% is from municipalities and municipal agencies in Puerto Rico and 59% is from public corporations and the central government and agencies in Puerto Rico.
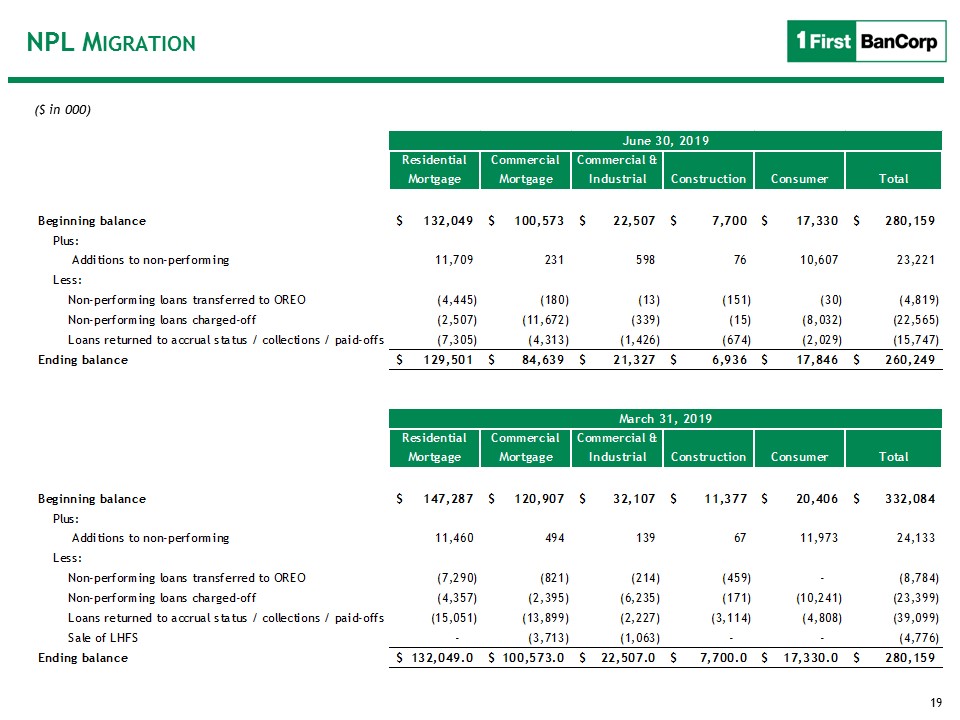
19 NPL Migration ($ in 000)
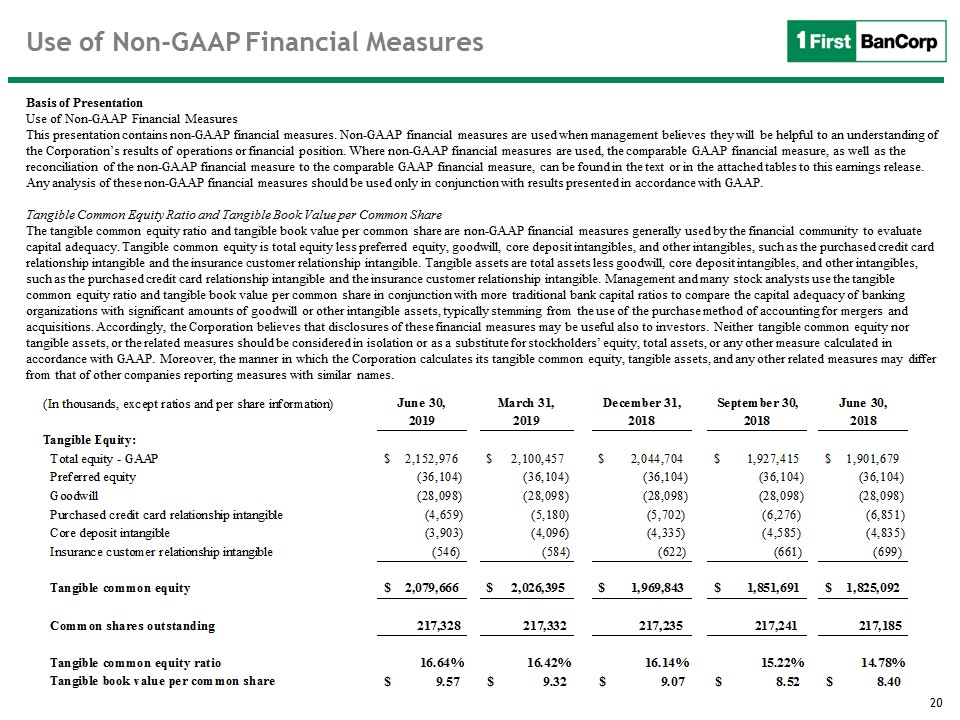
20 Use of Non-GAAP Financial Measures Basis of PresentationUse of Non-GAAP Financial Measures This presentation contains non-GAAP financial measures. Non-GAAP financial measures are used when management believes they will be helpful to an understanding of the Corporation’s results of operations or financial position. Where non-GAAP financial measures are used, the comparable GAAP financial measure, as well as the reconciliation of the non-GAAP financial measure to the comparable GAAP financial measure, can be found in the text or in the attached tables to this earnings release. Any analysis of these non-GAAP financial measures should be used only in conjunction with results presented in accordance with GAAP. Tangible Common Equity Ratio and Tangible Book Value per Common Share The tangible common equity ratio and tangible book value per common share are non-GAAP financial measures generally used by the financial community to evaluate capital adequacy. Tangible common equity is total equity less preferred equity, goodwill, core deposit intangibles, and other intangibles, such as the purchased credit card relationship intangible and the insurance customer relationship intangible. Tangible assets are total assets less goodwill, core deposit intangibles, and other intangibles, such as the purchased credit card relationship intangible and the insurance customer relationship intangible. Management and many stock analysts use the tangible common equity ratio and tangible book value per common share in conjunction with more traditional bank capital ratios to compare the capital adequacy of banking organizations with significant amounts of goodwill or other intangible assets, typically stemming from the use of the purchase method of accounting for mergers and acquisitions. Accordingly, the Corporation believes that disclosures of these financial measures may be useful also to investors. Neither tangible common equity nor tangible assets, or the related measures should be considered in isolation or as a substitute for stockholders’ equity, total assets, or any other measure calculated in accordance with GAAP. Moreover, the manner in which the Corporation calculates its tangible common equity, tangible assets, and any other related measures may differ from that of other companies reporting measures with similar names.
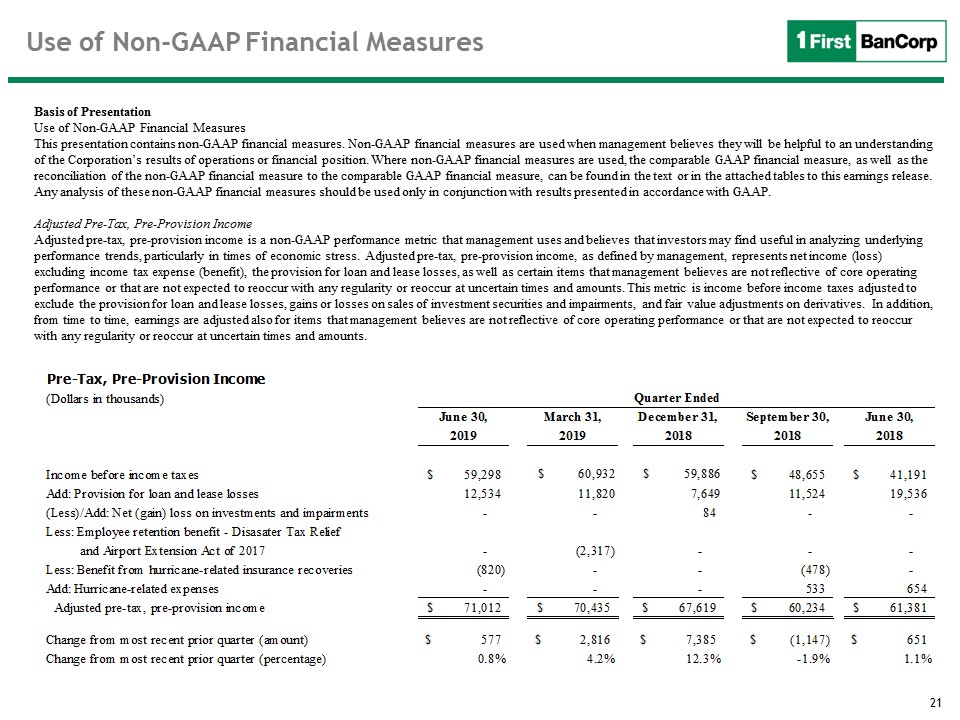
21 Use of Non-GAAP Financial Measures Basis of PresentationUse of Non-GAAP Financial Measures This presentation contains non-GAAP financial measures. Non-GAAP financial measures are used when management believes they will be helpful to an understanding of the Corporation’s results of operations or financial position. Where non-GAAP financial measures are used, the comparable GAAP financial measure, as well as the reconciliation of the non-GAAP financial measure to the comparable GAAP financial measure, can be found in the text or in the attached tables to this earnings release. Any analysis of these non-GAAP financial measures should be used only in conjunction with results presented in accordance with GAAP. Adjusted Pre-Tax, Pre-Provision IncomeAdjusted pre-tax, pre-provision income is a non-GAAP performance metric that management uses and believes that investors may find useful in analyzing underlying performance trends, particularly in times of economic stress. Adjusted pre-tax, pre-provision income, as defined by management, represents net income (loss) excluding income tax expense (benefit), the provision for loan and lease losses, as well as certain items that management believes are not reflective of core operating performance or that are not expected to reoccur with any regularity or reoccur at uncertain times and amounts. This metric is income before income taxes adjusted to exclude the provision for loan and lease losses, gains or losses on sales of investment securities and impairments, and fair value adjustments on derivatives. In addition, from time to time, earnings are adjusted also for items that management believes are not reflective of core operating performance or that are not expected to reoccur with any regularity or reoccur at uncertain times and amounts.
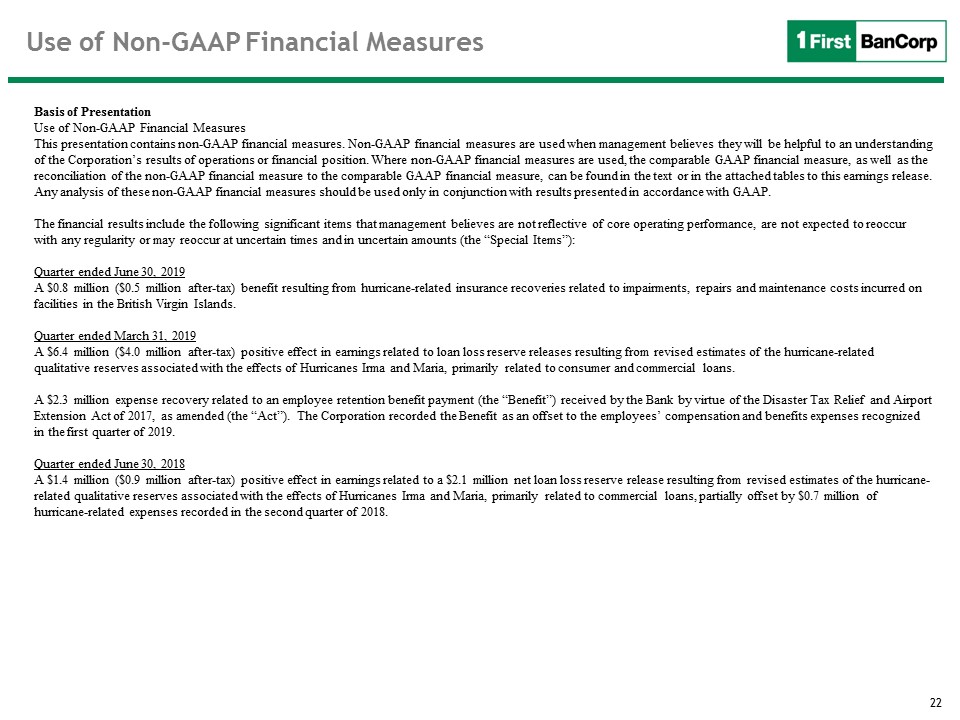
22 Use of Non-GAAP Financial Measures Basis of PresentationUse of Non-GAAP Financial Measures This presentation contains non-GAAP financial measures. Non-GAAP financial measures are used when management believes they will be helpful to an understanding of the Corporation’s results of operations or financial position. Where non-GAAP financial measures are used, the comparable GAAP financial measure, as well as the reconciliation of the non-GAAP financial measure to the comparable GAAP financial measure, can be found in the text or in the attached tables to this earnings release. Any analysis of these non-GAAP financial measures should be used only in conjunction with results presented in accordance with GAAP. The financial results include the following significant items that management believes are not reflective of core operating performance, are not expected to reoccur with any regularity or may reoccur at uncertain times and in uncertain amounts (the “Special Items”):Quarter ended June 30, 2019A $0.8 million ($0.5 million after-tax) benefit resulting from hurricane-related insurance recoveries related to impairments, repairs and maintenance costs incurred on facilities in the British Virgin Islands.Quarter ended March 31, 2019A $6.4 million ($4.0 million after-tax) positive effect in earnings related to loan loss reserve releases resulting from revised estimates of the hurricane-related qualitative reserves associated with the effects of Hurricanes Irma and Maria, primarily related to consumer and commercial loans.A $2.3 million expense recovery related to an employee retention benefit payment (the “Benefit”) received by the Bank by virtue of the Disaster Tax Relief and Airport Extension Act of 2017, as amended (the “Act”). The Corporation recorded the Benefit as an offset to the employees’ compensation and benefits expenses recognized in the first quarter of 2019. Quarter ended June 30, 2018A $1.4 million ($0.9 million after-tax) positive effect in earnings related to a $2.1 million net loan loss reserve release resulting from revised estimates of the hurricane-related qualitative reserves associated with the effects of Hurricanes Irma and Maria, primarily related to commercial loans, partially offset by $0.7 million of hurricane-related expenses recorded in the second quarter of 2018.

23 Use of Non-GAAP Financial Measures Basis of PresentationUse of Non-GAAP Financial Measures This presentation contains non-GAAP financial measures. Non-GAAP financial measures are used when management believes they will be helpful to an understanding of the Corporation’s results of operations or financial position. Where non-GAAP financial measures are used, the comparable GAAP financial measure, as well as the reconciliation of the non-GAAP financial measure to the comparable GAAP financial measure, can be found in the text or in the attached tables to this earnings release. Any analysis of these non-GAAP financial measures should be used only in conjunction with results presented in accordance with GAAP. The following table the reported net income to adjusted net income, a non-GAAP financial measure that excludes the Special Items identified on page 22 as well as gains or losses on sales of investment securities and impairments:Adjusted net income (Non-GAAP)