Exhibit 99.1
|

Exhibit 99.1
Third Quarter 2011
Investor Presentation
December 1st, 2011
|
Disclaimer
This presentation may contain “forward-looking statements” concerning the Corporation’s future economic performance. The words or phrases “expect,” “anticipate,” “look forward,” “should,” “believes” and similar expressions are meant to identify “forward-looking statements” within the meaning of Section 27A of the Private Securities Litigation Reform Act of 1995, and are subject to the safe harbor created by such section. The Corporation wishes to caution readers not to place undue reliance on any such “forward-looking statements,” which speak only as of the date made, and to advise readers that various factors, including, but not limited to, uncertainty about whether the Corporation will be able to fully comply with the written agreement dated June 3, 2010 that the Corporation entered into with the Federal Reserve Bank of New York (“FED”) and the order dated June 2, 2010 (the “Order”) that FirstBank Puerto Rico entered into with the FDIC and the Office of the Commissioner of Financial Institutions of Puerto Rico that, among other things, require FirstBank to maintain certain capital levels and reduce its special mention, classified, delinquent and non-performing assets; uncertainty as to the availability of certain funding sources, such as retail brokered CDs; the Corporation’s reliance on brokered CDs and its ability to obtain, on a periodic basis, approval from the FDIC to issue brokered CDs to fund operations and provide liquidity in accordance with the terms of the Order; the risk of not being able to fulfill the Corporation’s cash obligations or resume paying dividends to its stockholders in the future due to its inability to receive approval from the FED to receive dividends from FirstBank Puerto Rico; the risk of being subject to possible additional regulatory actions; the strength or weakness of the real estate markets and of the consumer and commercial credit sectors and their impact on the credit quality of the Corporation’s loans and other assets, including the Corporation’s construction and commercial real estate loan portfolios, which have contributed and may continue to contribute to, among other things, the high levels of non-performing assets, charge-offs and the provision expense and may subject the Corporation to further risk from loan defaults and foreclosures; adverse changes in general economic conditions in the United States and in Puerto Rico, including the interest rate scenario, market liquidity, housing absorption rates, real estate prices and disruptions in the U.S. capital markets, which may reduce interest margins, impact funding sources and affect demand for all of the Corporation’s products and services and the value of the Corporation’s assets; an adverse change in the Corporation’s ability to attract new clients and retain existing ones; a decrease in demand for the Corporation’s products and services and lower revenues and earnings because of the continued recession in Puerto Rico and the current fiscal problems and budget deficit of the Puerto Rico government; uncertainty about regulatory and legislative changes for financial services companies in Puerto Rico, the United States and the U.S. and British Virgin Islands, which could affect the Corporation’s financial performance and could cause the Corporation’s actual results for future periods to differ materially from prior results and anticipated or projected results; uncertainty about the effectiveness of the various actions undertaken to stimulate the United States economy and stabilize the United States’ financial markets, and the impact such actions may have on the Corporation’s business, financial condition and results of operations; changes in the fiscal and monetary policies and regulations of the federal government, including those determined by the Federal Reserve System, the FDIC, government-sponsored housing agencies and local regulators in Puerto Rico and the U.S. and British Virgin Islands; the risk of possible failure or circumvention of controls and procedures and the risk that the Corporation’s risk management policies may not be adequate; the risk that the FDIC may further increase the deposit insurance premium and/or require special assessments to replenish its insurance fund, causing an additional increase in the Corporation’s non-interest expense; risks of not being able to recover the assets pledged to Lehman Brothers Special Financing, Inc.; the impact to the Corporation’s results of operations and financial condition associated with acquisitions and dispositions; a need to recognize additional impairments on financial instruments or goodwill relating to acquisitions; risks that downgrades in the credit ratings of the Corporation’s long-term senior debt will adversely affect the Corporation’s ability to make future borrowings; the impact of the Dodd-Frank Wall Street Reform and Consumer Protection Act on the Corporation’s businesses, business practices and cost of operations; and general competitive factors and industry consolidation. The Corporation does not undertake, and specifically disclaims any obligation, to update any “forward-looking statements” to reflect occurrences or unanticipated events or circumstances after the date of such statements except as required by the federal securities laws.
2 |
|
|
Corporate Profile
Well Diversified Franchise with Significant Competitive Strengths
As of September 30, 2011
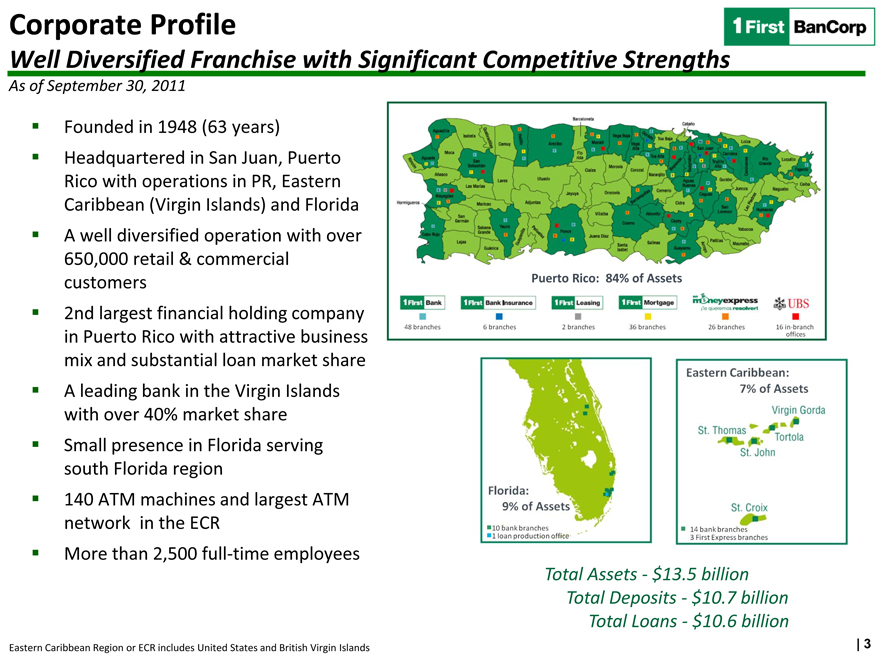
Founded in 1948 (63 years)
Headquartered in San Juan, Puerto Rico with operations in PR, Eastern Caribbean (Virgin Islands) and Florida
A well diversified operation with over 650,000 retail & commercial customers
2nd largest financial holding company in Puerto Rico with attractive business mix and substantial loan market share
A leading bank in the Virgin Islands with over 40% market share
Small presence in Florida serving south Florida region
140 ATM machines and largest ATM network in the ECR
More than 2,500 full-time employees
Puerto Rico: 84% of Assets
Florida 9% of Assets
Eastern Caribbean: 7% of Assets
Total Assets—$13.5 billion
Total Deposits—$10.7 billion
Total Loans—$10.6 billion
Eastern Caribbean Region or ECR includes United States and British Virgin Islands
3
|
Corporate Profile
Strong Market Share with Diversified Products & Services Offering
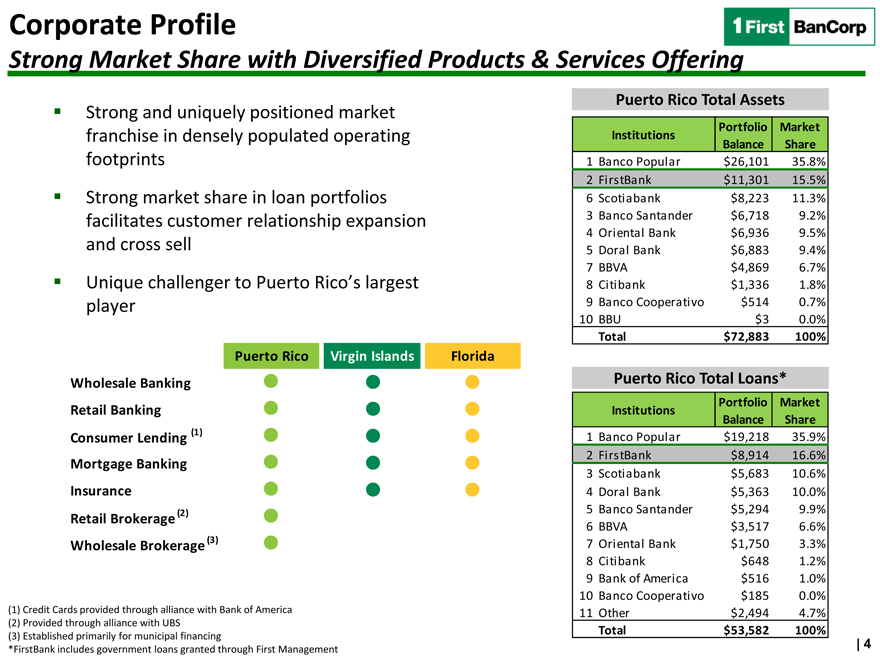
Strong and uniquely positioned market franchise in densely populated operating footprints
Strong market share in loan portfolios facilitates customer relationship expansion and cross sell
Unique challenger to Puerto Rico’s largest player
Puerto Rico
Virgin Islands
Florida
Wholesale Banking
Retail Banking
Consumer Lending (1)
Mortgage Banking
Insurance
Retail Brokerage (2)
Wholesale Brokerage (3)
(1) Credit Cards provided through alliance with Bank of America
(2) Provided through alliance with UBS
(3) Established primarily for municipal financing
*FirstBank includes government loans granted through First Management
Puerto Rico Total Assets
Institutions Portfolio Balance Market Share
1 Banco Popular $26,101 35.8%
2 FirstBank $11,301 15.5%
6 Scotiabank $8,223 11.3%
3 Banco Santander $6,718 9.2%
4 Oriental Bank $6,936 9.5%
5 Doral Bank $6,883 9.4%
7 BBVA $4,869 6.7%
8 Citibank $1,336 1.8%
9 Banco Cooperativo $514 0.7%
10 BBU $3 0.0%
Total $72,883 100%
Puerto Rico Total Loans*
Institutions Portfolio Balance Market Share
1 Banco Popular $19,218 35.9%
2 FirstBank $8,914 16.6%
3 Scoti a bank $5,683 10.6%
4 Doral Bank $5,363 10.0%
5 Banco Santander $5,294 9.9%
6 BBVA $3,517 6.6%
7 Oriental Bank $1,750 3.3%
8 Citibank $648 1.2%
9 Bank of America $516 1.0%
10 Banco Cooperativo $185 0.0%
11 Other $2,494 4.7%
Total $53,582 100%
4
|

Delivered on Strategic Commitments
Strategic Plan Directives for Past 21 Months
Strengthening Governance & Risk Management
Strengthened management team and governance structure; culture change
Reviewed and tightened underwriting credit policies Expanded Special Assets Group (SAG) role Implemented regulatory compliance changes
Complied with Regulatory Agreements
Executing Capital Plan
Repositioned balance sheet and restructured capital
Preferred stock conversion
TARP conversion
Completed $525 million capital raise and rights offering
Stabilized migration to NPL
Reduced NPA by $413 million since peak in 1Q 2010 Continued to reduce risks in the balance sheet
Significantly reduced exposure to construction by 67% since 1Q 2010
Enhancing Franchise Value
Increased core deposits (including Public Funds) by $1.1 billion and reduced reliance on brokered deposits by $3.1 billion since December 2009 Launched new deposit and transaction banking products Achieved efficiency improvements (new Service Center, tech infrastructure, internet banking) Tightened controllable expenses management
During the current cycle (consolidations, capital raise, economic challenges), Management focused on strengthening the franchise and succeeded in solidifying its strong #2 position in PR
5 |
|
|
Stronger Capital Ratios
Strengthening the Franchise for Execution of Our Strategic Plan
1 first BanCorp
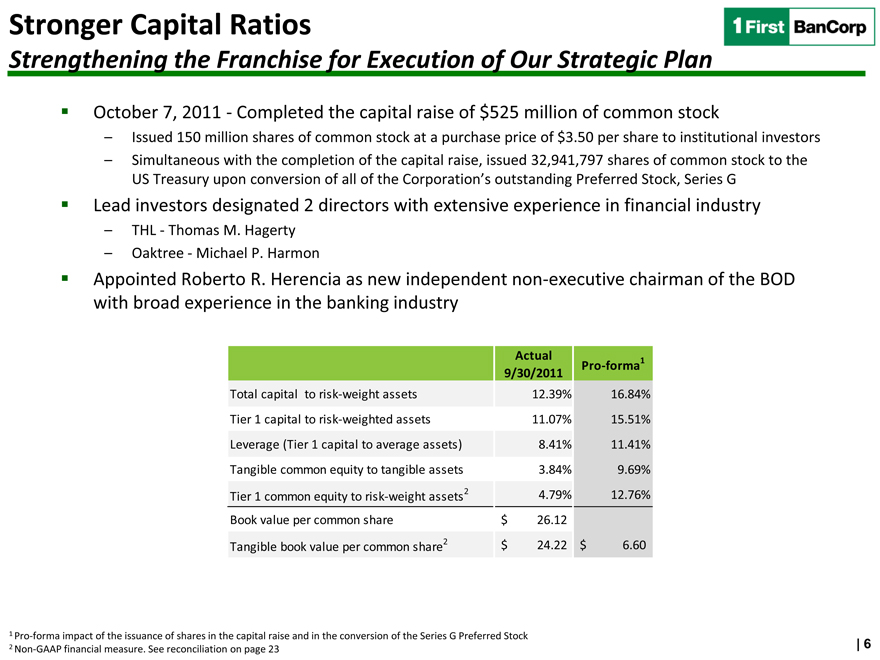
October 7, 2011—Completed the capital raise of $525 million of common stock
– Issued 150 million shares of common stock at a purchase price of $3.50 per share to institutional investors
– Simultaneous with the completion of the capital raise, issued 32,941,797 shares of common stock to the US Treasury upon conversion of all of the Corporation’s outstanding Preferred Stock, Series G
Lead investors designated 2 directors with extensive experience in financial industry
– THL—Thomas M. Hagerty
– Oaktree—Michael P. Harmon
Appointed Roberto R. Herencia as new independent non-executive chairman of the BOD with broad experience in the banking industry
Actual Pro-forma1
9/30/2011
Total capital to risk-weight assets 12.39% 16.84%
Tier 1 capital to risk-weighted assets 11.07% 15.51%
Leverage (Tier 1 capital to average assets) 8.41% 11.41%
Tangible common equity to tangible assets 3.84% 9.69%
Tier 1 common equity to risk-weight assets2 4.79% 12.76%
Book value per common share $ 26.12
Tangible book value per common share2 $ 24.22 $ 6.60
1 Pro-forma impact of the issuance of shares in the capital raise and in the conversion of the Series G Preferred Stock
2 Non-GAAP financial measure. See reconciliation on page 23
6
|
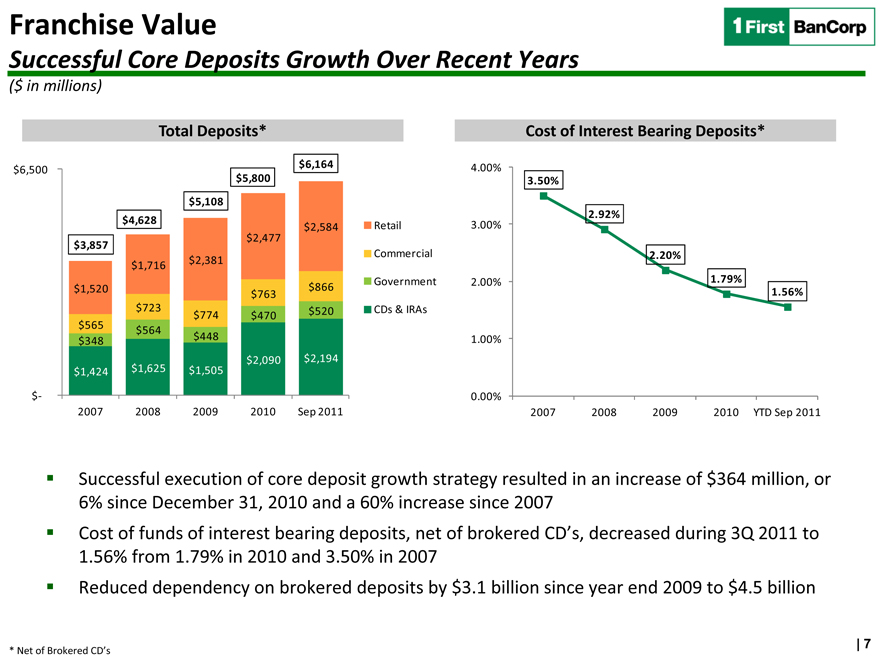
Franchise Value
Successful Core Deposits Growth Over Recent Years
($ in millions)
Total Deposits*
$6,500 $6,164
$5,800
$5,108
$4,628 $2,584 Retail
$3,857 $2,477
Commercial
$1,716 $2,381
$1,520 $866 Government
$763
$723 $774 $470 $520 CDs & IRAs
$565 $564
$348 $448
$2,090 $2,194
$1,424 $1,625 $1,505
$-
2007 2008 2009 2010 Sep 2011
Cost of Interest Bearing Deposits*
4.00%
3.50%
2.92%
3.00%
2.20%
2.00% 1.79%
1.56%
1.00%
0.00%
2007 2008 2009 2010 YTD Sep 2011
Successful execution of core deposit growth strategy resulted in an increase of $364 million, or 6% since December 31, 2010 and a 60% increase since 2007 Cost of funds of interest bearing deposits, net of brokered CD’s, decreased during 3Q 2011 to 1.56% from 1.79% in 2010 and 3.50% in 2007 Reduced dependency on brokered deposits by $3.1 billion since year end 2009 to $4.5 billion
* Net of Brokered CD’s
7
|
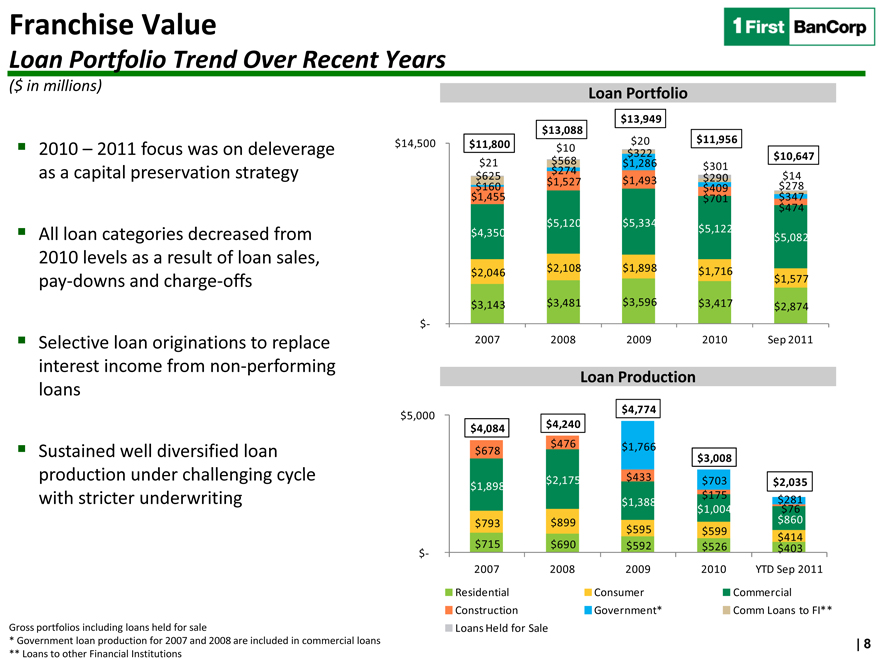
Franchise Value
Loan Portfolio Trend Over Recent Years
($ in millions)
2010 – 2011 focus was on deleverage as a capital preservation strategy
All loan categories decreased from 2010 levels as a result of loan sales, pay-downs and charge-offs
Selective loan originations to replace interest income from non-performing loans
Sustained well diversified loan production under challenging cycle with stricter underwriting
Gross portfolios including loans held for sale
* Government loan production for 2007 and 2008 are included in commercial loans
** Loans to other Financial Institutions
Loan Portfolio
$13,949
$13,088
$14,500 $11,800 $10 $20 $11,956
$322 $10,647
$21 $568 $274 $1,286 $301
$625 $1,527 $1,493 $290 $14
$160 $409 $278
$1,455 $701 $347
$474
$5,120 $5,334
$4,350 $5,122 $5,082
$2,046 $2,108 $1,898 $1,716
$1,577
$3,143 $3,481 $3,596 $3,417 $2,874
$-
2007 2008 2009 2010 Sep 2011
Loan Production
$5,000 $4,774
$4,084 $4,240
$678 $476 $1,766
$3,008
$1,898 $2,175 $433 $703 $2,035
$1,388 $175 $281
$1,004 $76
$793 $899 $860
$595 $599 $414
$- $715 $690 $592 $526 $403
2007 2008 2009 2010 YTD Sep 2011
Residential Consumer Commercial
Construction Government* Comm Loans to FI**
Loans Held for Sale
8
|
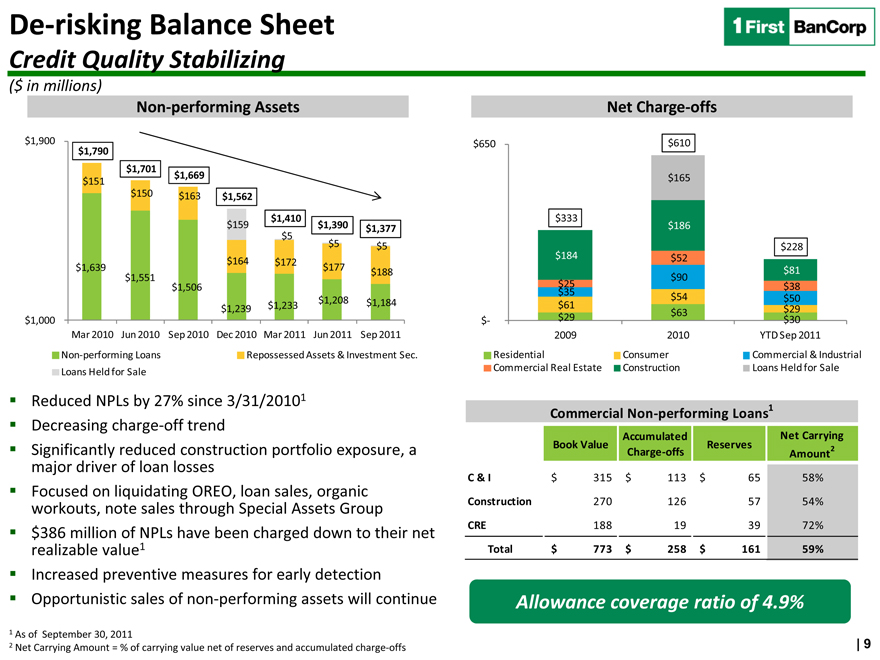
De-risking Balance Sheet
Credit Quality Stabilizing
($ in millions)
Non-performing Assets
$1,900
$1,790
$1,701
$151 $1,669
$150 $163 $1,562
$1,410
$159 $1,390 $1,377
$5
$5 $5
$164 $172
$1,639 $177 $188
$1,551
$1,506
$1,239 $1,233 $1,208 $1,184
$1,000
Mar 2010 Jun 2010 Sep 2010 Dec 2010 Mar 2011 Jun 2011 Sep 2011
Non-performing Loans Repossessed Assets & Investment Sec.
Loans Held for Sale
Net Charge-offs
$650 $610
$165
$333 $186
$228
$184 $52
$90 $81
$25 $38
$35 $54 $50
$61
$- $29 $63 $30 $29
2009 2010 YTD Sep 2011
Residential Consumer Commercial & Industrial
Commercial Real Estate Construction Loans Held for Sale
Commercial Non-performing Loans1
Accumulated Net Carrying
Book Value Reserves
Charge-offs Amount2
C & I $ 315 $ 113 $ 65 58%
Construction 270 126 57 54%
CRE 188 19 39 72%
Total $ 773 $ 258 $ 161 59%
Allowance coverage ratio of 4.9%
Reduced NPLs by 27% since 3/31/20101 Decreasing charge-off trend
Significantly reduced construction portfolio exposure, a major driver of loan losses
Focused on liquidating OREO, loan sales, organic workouts, note sales through Special Assets Group $386 million of NPLs have been charged down to their net realizable value1 Increased preventive measures for early detection Opportunistic sales of non-performing assets will continue
1 As of September 30, 2011
2 Net Carrying Amount = % of carrying value net of reserves and accumulated charge-offs
| 9
|
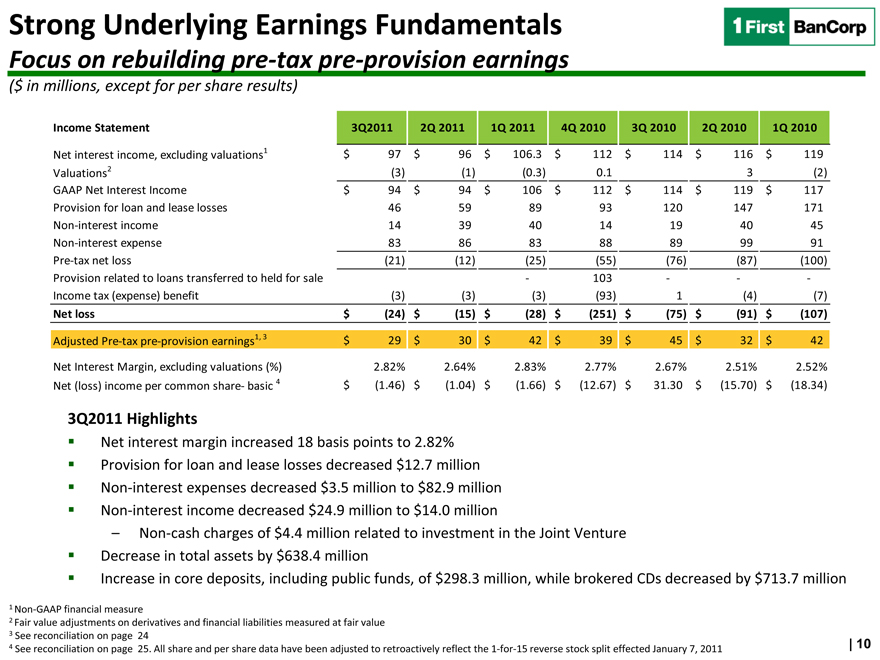
Strong Underlying Earnings Fundamentals
Focus on rebuilding pre-tax pre-provision earnings
($ in millions, except for per share results)
Income Statement 3Q2011 2Q 2011 1Q 2011 4Q 2010 3Q 2010 2Q 2010 1Q 2010
Net interest income, excluding valuations1 $ 97 $ 96 $ 106.3 $ 112 $ 114 $ 116 $ 119
Valuations2 (3) (1) (0.3) 0.1 3 (2)
GAAP Net Interest Income $ 94 $ 94 $ 106 $ 112 $ 114 $ 119 $ 117
Provision for loan and lease losses 46 59 89 93 120 147 171
Non-interest income 14 39 40 14 19 40 45
Non-interest expense 83 86 83 88 89 99 91
Pre-tax net loss (21) (12) (25) (55) (76) (87) (100)
Provision related to loans transferred to held for sale 103
Income tax (expense) benefit (3) (3) (3) (93) 1 (4) (7)
Net loss $ (24) $ (15) $ (28) $ (251) $ (75) $ (91) $ (107)
Adjusted Pre-tax pre-provision earnings1, 3 $ 29 $ 30 $ 42 $ 39 $ 45 $ 32 $ 42
Net Interest Margin, excluding valuations (%) 2.82% 2.64% 2.83% 2.77% 2.67% 2.51% 2.52%
Net (loss) income per common share- basic 4 $ (1.46) $ (1.04) $ (1.66) $ (12.67) $ 31.30 $ (15.70) $ (18.34)
3Q2011 Highlights
Net interest margin increased 18 basis points to 2.82% Provision for loan and lease losses decreased $12.7 million Non-interest expenses decreased $3.5 million to $82.9 million Non-interest income decreased $24.9 million to $14.0 million
– Non-cash charges of $4.4 million related to investment in the Joint Venture Decrease in total assets by $638.4 million
Increase in core deposits, including public funds, of $298.3 million, while brokered CDs decreased by $713.7 million
1 Non-GAAP financial measure
2 Fair value adjustments on derivatives and financial liabilities measured at fair value
3 See reconciliation on page 24
4 See reconciliation on page 25. All share and per share data have been adjusted to retroactively reflect the 1-for-15 reverse stock split effected January 7, 2011
10
|
Executing on Our Strategic Plan
Targeted Strategies for Growth
As of September 30, 2011
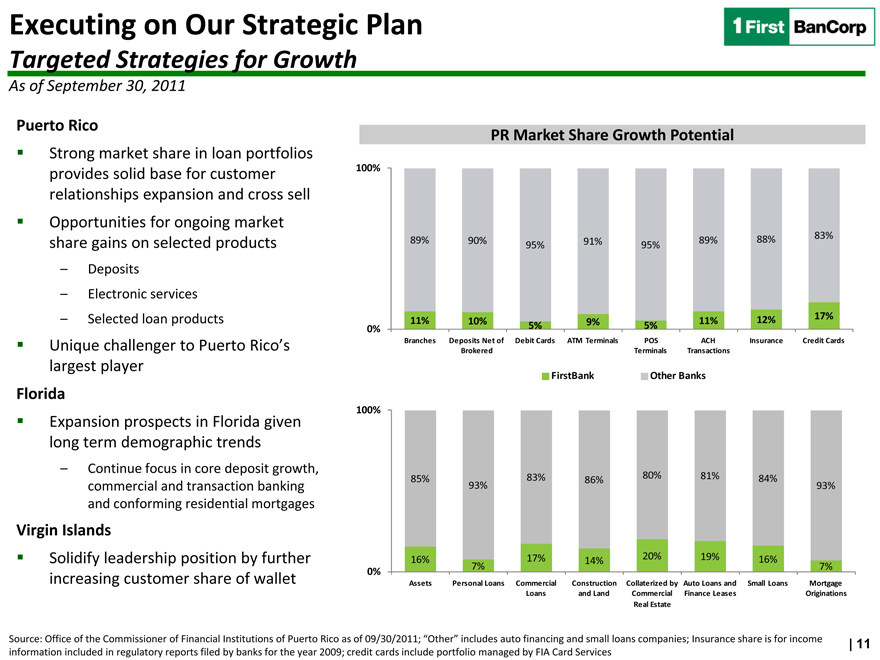
Puerto Rico
Strong market share in loan portfolios provides solid base for customer relationships expansion and cross sell Opportunities for ongoing market share gains on selected products
– Deposits
– Electronic services
– Selected loan products
Unique challenger to Puerto Rico’s largest player
Florida
Expansion prospects in Florida given long term demographic trends
– Continue focus in core deposit growth, commercial and transaction banking and conforming residential mortgages
Virgin Islands
Solidify leadership position by further increasing customer share of wallet
PR Market Share Growth Potential
100%
89% 90% 91% 89% 88% 83%
95% 95%
11% 10% 9% 11% 12% 17%
0% 5% 5%
Branches Deposits Net of Debit Cards ATM Terminals POS ACH Insurance Credit Cards
Brokered Terminals Transactions
FirstBank Other Banks
100%
85% 83% 86% 80% 81% 84%
93% 93%
16% 17% 14% 20% 19% 16%
0% 7% 7%
Assets Personal Loans Commercial Construction Collaterized by Auto Loans and Small Loans Mortgage
Loans and Land Commercial Finance Leases Originations
Real Estate
Source: Office of the Commissioner of Financial Institutions of Puerto Rico as of 09/30/2011; “Other” includes auto financing and small loans companies; Insurance share is for income information included in regulatory reports filed by banks for the year 2009; credit cards include portfolio managed by FIA Card Services
11
|
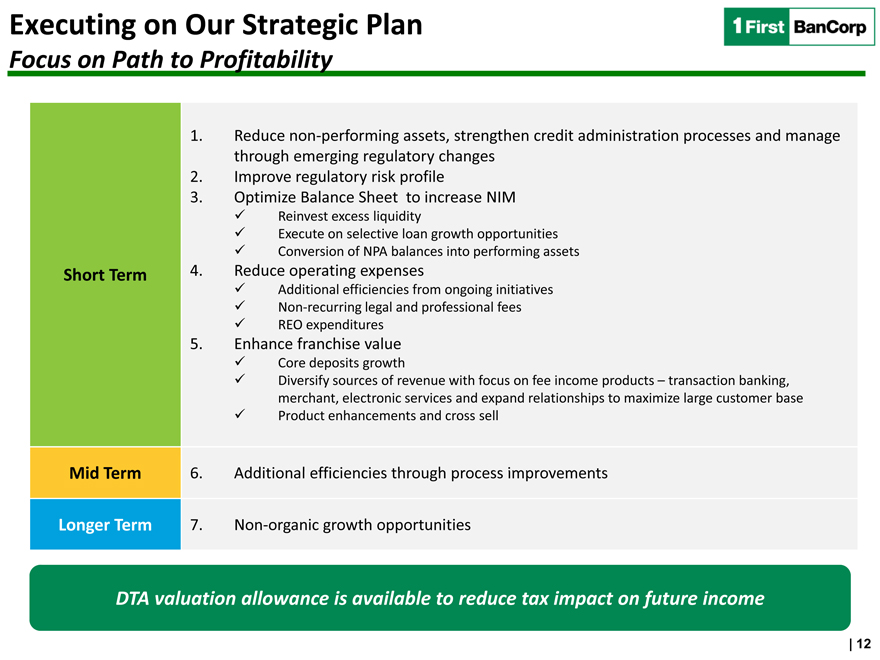
Executing on Our Strategic Plan
Focus on Path to Profitability
Short Term
Mid Term
Longer Term
1. Reduce non-performing assets, strengthen credit administration processes and manage through emerging regulatory changes
2. Improve regulatory risk profile
3. Optimize Balance Sheet to increase NIM
Reinvest excess liquidity
Execute on selective loan growth opportunities
Conversion of NPA balances into performing assets
4 Reduce operating expenses
Additional efficiencies from ongoing initiatives
Non-recurring legal and professional fees
REO expenditures
5. Enhance franchise value
Core deposits growth
Diversify sources of revenue with focus on fee income products – transaction banking, merchant, electronic services and expand relationships to maximize large customer base
Product enhancements and cross sell
6. Additional efficiencies through process improvements
7. Non-organic growth opportunities
DTA valuation allowance is available to reduce tax impact on future income
12
|
In Summary…
1. Strong and uniquely positioned franchise with strengthened capital
2. Stable pre-tax, pre-provision earnings with realizable opportunities for improvement
3. Potential opportunities for consolidation and/or ongoing market share gains
4. Attractive valuation on a pro-forma tangible book value basis
5. Committed management team with proven execution skills
13
|

Exhibits
|
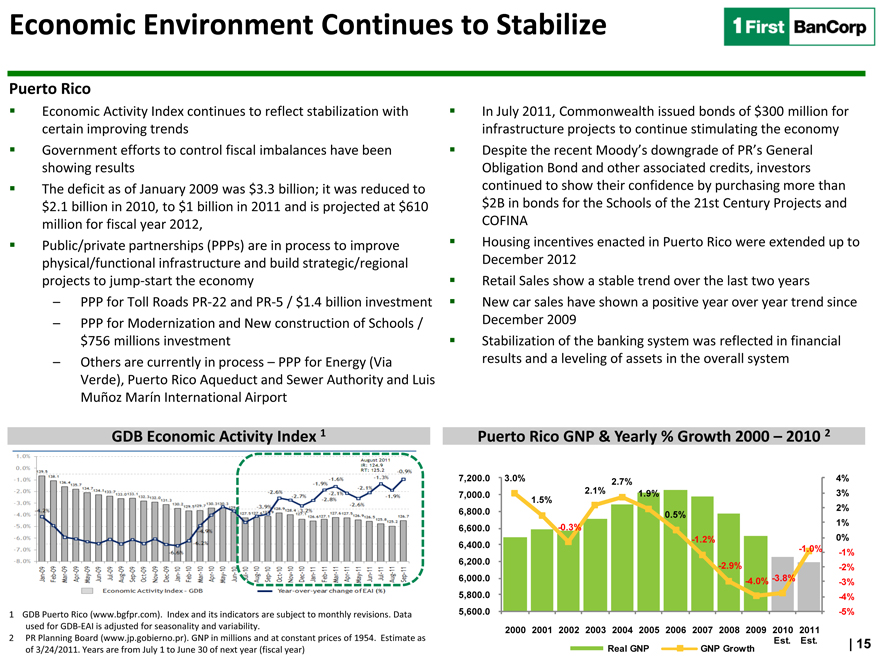
Economic Environment Continues to Stabilize
Puerto Rico
Economic Activity Index continues to reflect stabilization with certain improving trends
Government efforts to control fiscal imbalances have been showing results
The deficit as of January 2009 was $3.3 billion; it was reduced to $2.1 billion in 2010, to $1 billion in 2011 and is projected at $610 million for fiscal year 2012,
Public/private partnerships (PPPs) are in process to improve physical/functional infrastructure and build strategic/regional projects to jump-start the economy
– PPP for Toll Roads PR-22 and PR-5 / $1.4 billion investment
– PPP for Modernization and New construction of Schools / $756 millions investment
– Others are currently in process – PPP for Energy (Via Verde), Puerto Rico Aqueduct and Sewer Authority and Luis Muñoz Marín International Airport
In July 2011, Commonwealth issued bonds of $300 million for infrastructure projects to continue stimulating the economy
Despite the recent Moody’s downgrade of PR’s General Obligation Bond and other associated credits, investors continued to show their confidence by purchasing more than $2B in bonds for the Schools of the 21st Century Projects and COFINA
Housing incentives enacted in Puerto Rico were extended up to December 2012
Retail Sales show a stable trend over the last two years
New car sales have shown a positive year over year trend since December 2009
Stabilization of the banking system was reflected in financial results and a leveling of assets in the overall system
GDB Economic Activity Index 1
Puerto Rico GNP & Yearly % Growth 2000 – 2010 2
7,200.0 3.0% 2.7% 4%
7,000.0 2.1% 1.9% 3%
1.5%
2%
6,800.0 0.5%
6,600.0 -0.3% 1%
-1.2% 0%
6,400.0 -1.0% -1%
6,200.0 -2.9% -2%
6,000.0 -4.0% -3.8% -3%
5,800.0 -4%
5,600.0 -5%
2000 2001 2002 2003 2004 2005 2006 2007 2008 2009 2010 2011
Real GNP GNP Growth Est. Est.
1 GDB Puerto Rico (www.bgfpr.com). Index and its indicators are subject to monthly revisions. Data used for GDB-EAI is adjusted for seasonality and variability.
2 PR Planning Board (www.jp.gobierno.pr). GNP in millions and at constant prices of 1954. Estimate as of 3/24/2011. Years are from July 1 to June 30 of next year (fiscal year)
15
|
Economic Environment Continues to Stabilize
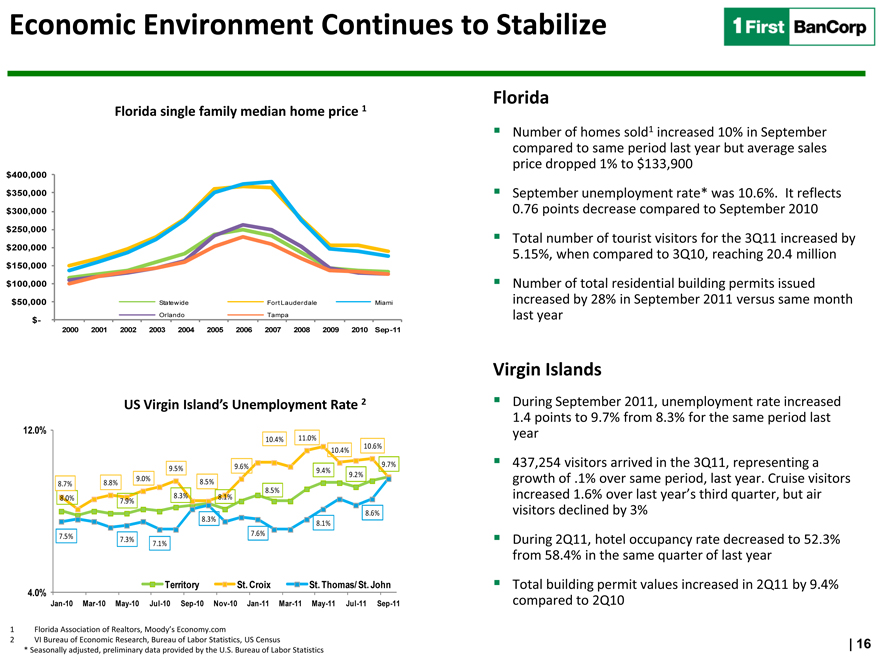
Florida single family median home price 1
$400,000 $350,000 $300,000 $250,000 $200,000 $150,000 $100,000 $50,000 $-
Statewide
Orlando
Fort Lauderdale
Tampa
Miami
2000 2001 2002 2003 2004 2005 2006 2007 2008 2009 2010 Sep-11
US Virgin Island’s Unemployment Rate 2
12.0%
4.0%
10.4% 11.0%
10.6%
10.4%
9.6% 9.7%
9.5% 9.4%
9.2%
9.0% 8.5%
8.7% 8.8% 8.5%
8.0% 8.3% 8.1%
7.9%
8.6%
8.3%
8.1%
7.5% 7.6%
7.3%
7.1%
Territory St. Croix St. Thomas/ St. John
Jan-10 Mar-10 May-10 Jul-10 Sep-10 Nov-10 Jan-11 Mar-11 May-11 Jul-11 Sep-11
1 Florida Association of Realtors, Moody’s Economy.com
2 VI Bureau of Economic Research, Bureau of Labor Statistics, US Census
* Seasonally adjusted, preliminary data provided by the U.S. Bureau of Labor Statistics
Florida
Number of homes sold1 increased 10% in September compared to same period last year but average sales price dropped 1% to $133,900
September unemployment rate* was 10.6%. It reflects 0.76 points decrease compared to September 2010
Virgin Islands
During September 2011, unemployment rate increased 1.4 points to 9.7% from 8.3% for the same period last year
437,254 visitors arrived in the 3Q11, representing a growth of .1% over same period, last year. Cruise visitors increased 1.6% over last year’s third quarter, but air visitors declined by 3%
During 2Q11, hotel occupancy rate decreased to 52.3% from 58.4% in the same quarter of last year
Total building permit values increased in 2Q11 by 9.4% compared to 2Q10
Total number of tourist visitors for the 3Q11 increased by 5.15%, when compared to 3Q10, reaching 20.4 million
Number of total residential building permits issued increased by 28% in September 2011 versus same month last year
16
|
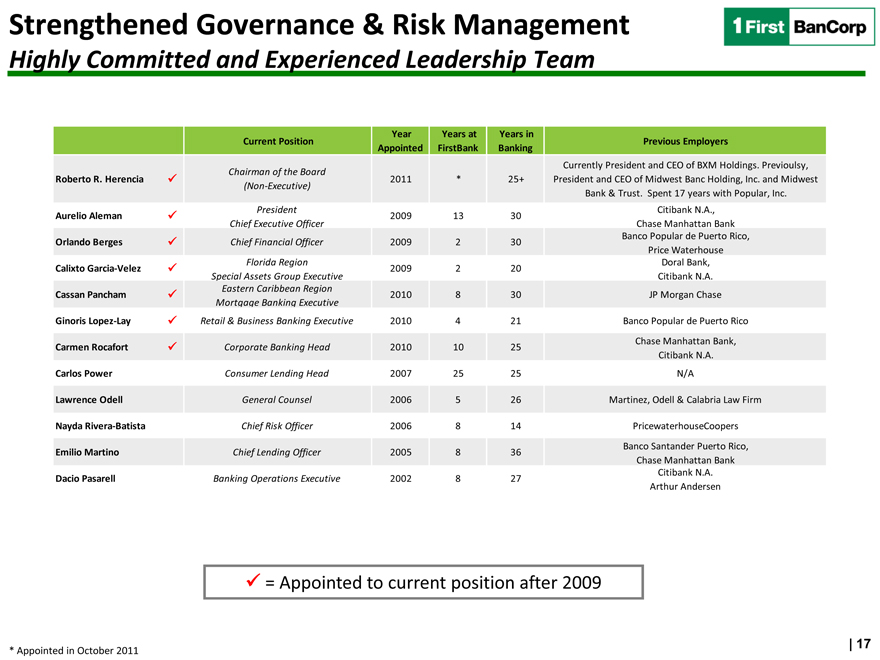
Strengthened Governance & Risk Management
Highly Committed and Experienced Leadership Team
Year Years at Years in
Current Position Previous Employers
Appointed FirstBank Banking
Chairman of the Board Currently President and CEO of BXM Holdings. Previoulsy,
Roberto R. Herencia 2011 * 25+ President and CEO of Midwest Banc Holding, Inc. and Midwest
(Non-Executive)
Bank & Trust. Spent 17 years with Popular, Inc.
President Citibank N.A.,
Aurelio Aleman 2009 13 30
Chief Executive Officer Chase Manhattan Bank
Orlando Berges Chief Financial Officer 2009 2 30 Banco Popular de Puerto Rico,
Price Waterhouse
Florida Region Doral Bank,
Calixto Garcia-Velez 2009 2 20
Special Assets Group Executive Citibank N.A.
Eastern Caribbean Region
Cassan Pancham 2010 8 30 JP Morgan Chase
Mortgage Banking Executive
Ginoris Lopez-Lay Retail & Business Banking Executive 2010 4 21 Banco Popular de Puerto Rico
Carmen Rocafort Corporate Banking Head 2010 10 25 Chase Manhattan Bank,
Citibank N.A.
Carlos Power Consumer Lending Head 2007 25 25 N/A
Lawrence Odell General Counsel 2006 5 26 Martinez, Odell & Calabria Law Firm
Nayda Rivera-Batista Chief Risk Officer 2006 8 14 PricewaterhouseCoopers
Emilio Martino Chief Lending Officer 2005 8 36 Banco Santander Puerto Rico,
Chase Manhattan Bank
Dacio Pasarell Banking Operations Executive 2002 8 27 Citibank N.A.
Arthur Andersen
= Appointed to current position after 2009
* Appointed in October 2011
17
|
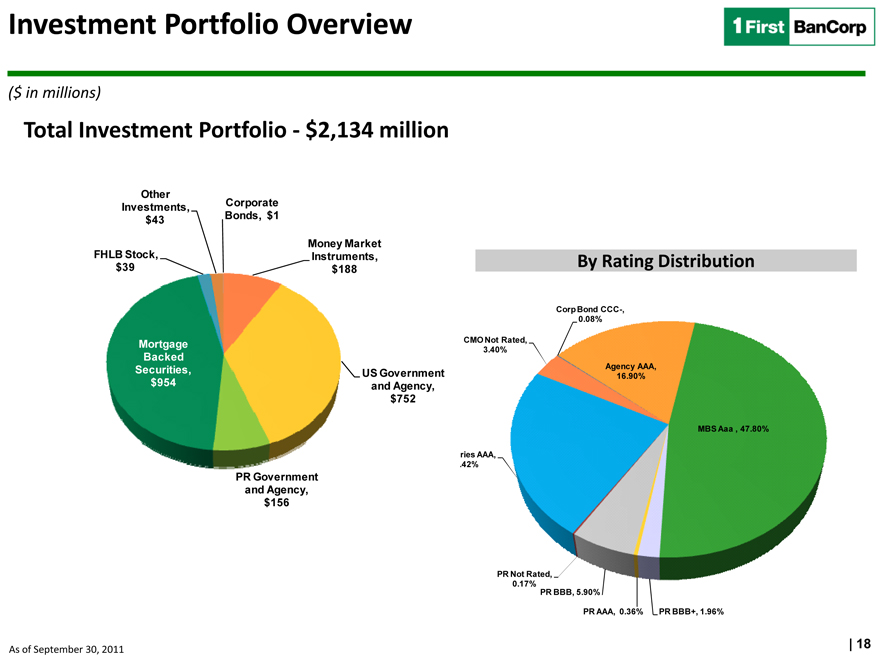
Investment Portfolio Overview
($ in millions)
Total Investment Portfolio—$2,134 million
FHLB Stock, $39
Other Investments, $43
Corporate Bonds, $1
Money Market Instruments, $188
US Government and Agency, $752
PR Government and Agency, $156
Mortgage Backed Securities, $954
By Rating Distribution
CMO Not Rated, 3.40%
Corp Bond CCC-, 0.08%
Agency
AAA,
23.42%
PR Not Rated, 0.17%
PR BBB, 5.90%
PR AAA, 0.36% PR BBB+, 1.96%
Agency AAA, 16.90%
MBS Aaa , 47.80%
As of September 30, 2011
18
|
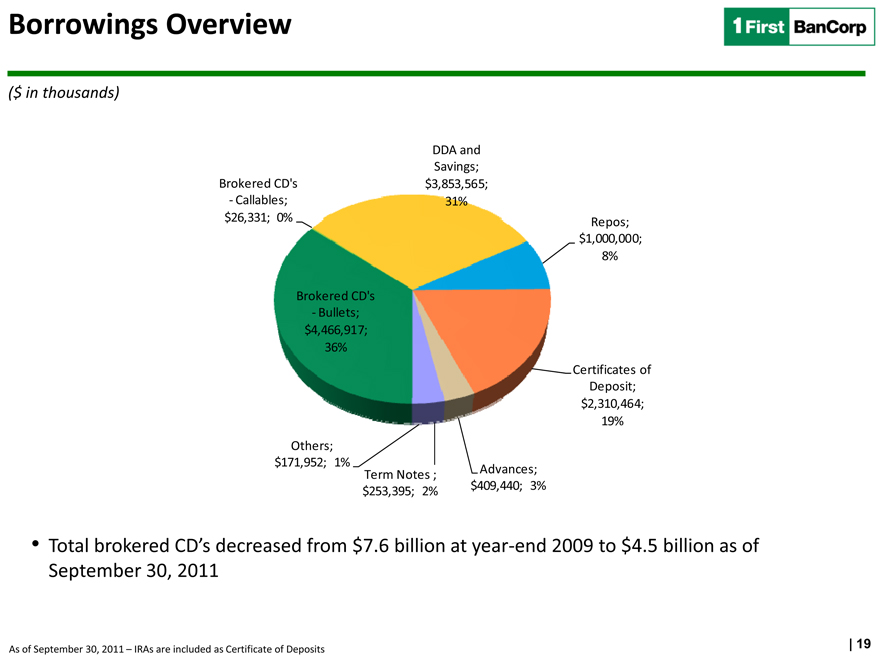
Borrowings Overview
($ in thousands)
Brokered CD’s—Callables; $26,331; 0%
DDA and Savings; $3,853,565; 31%
Brokered CD’s—Bullets; $4,466,917; 36%
Repos; $1,000,000; 8%
Others; $171,952; 1%
Term Notes ; $253,395; 2%
Advances; $409,440; 3%
Certificates of Deposit; $2,310,464; 19%
Total brokered CD’s decreased from $7.6 billion at year-end 2009 to $4.5 billion as of September 30, 2011
As of September 30, 2011 – IRAs are included as Certificate of Deposits
19
|
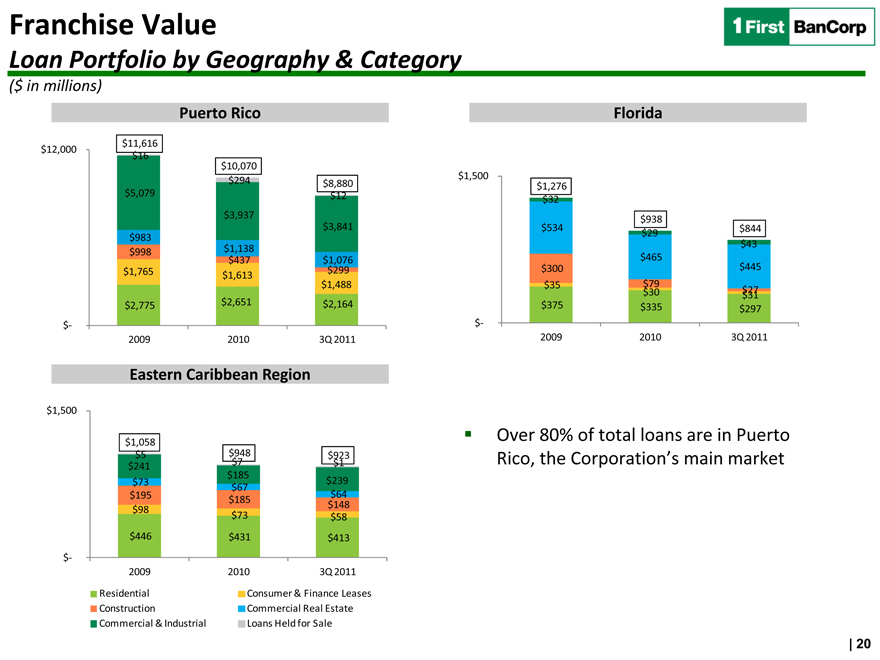
Franchise Value
Loan Portfolio by Geography & Category
($ in millions)
Puerto Rico
$12,000
$-
$11,616 $16
$5,079
$983 $998 $1,765
$2,775
$10,070 $294
$3,937
$1,138 $437 $1,613
$2,651
$8,880 $12
$3,841
$$ 1,076 299
$1,488 $2,164
2009
2010
3Q 2011
Eastern Caribbean Region
$1,500
$-
$1,058 $5 $241 $73 $195 $98
$446
$948 $7 $185 $67 $185 $73 $431
$923 $1 $239 $ $ 148 64 $58 $413
2009
2010
3Q 2011
Residential Construction
Commercial & Industrial
Consumer & Finance Leases Commercial Real Estate Loans Held for Sale
Florida
$1,500
$-
$1,276 $32
$534
$300 $35 $375
$938 $29
$465
$79 $30 $335
$844 $43
$445
$27 $31 $297
2009
2010
3Q 2011
Over 80% of total loans are in Puerto Rico, the Corporation’s main market
20
|
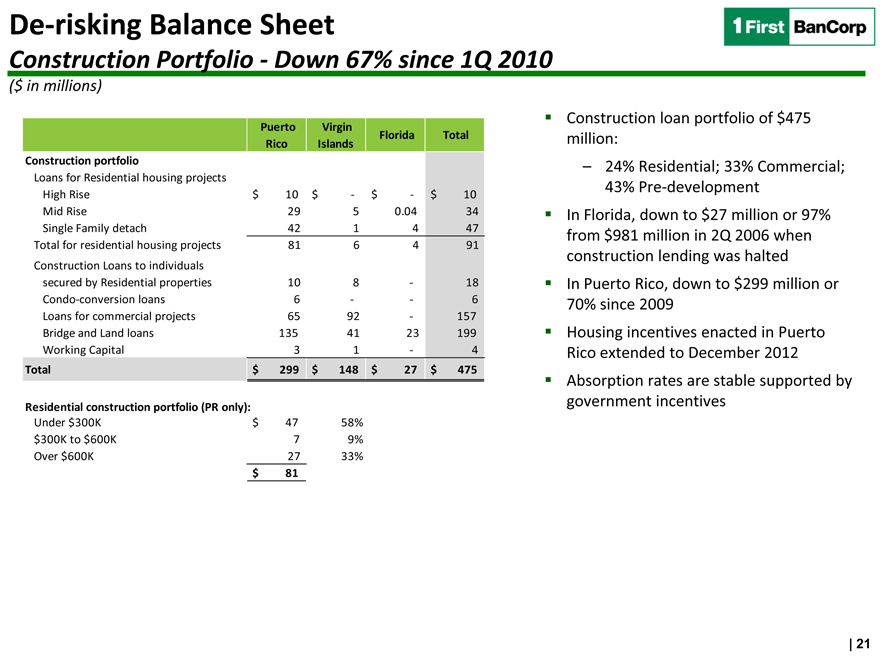
De-risking Balance Sheet
Construction Portfolio—Down 67% since 1Q 2010
($ in millions)
Puerto Rico
Virgin Islands
Florida
Total
Construction portfolio
Loans for Residential housing projects High Rise Mid Rise Single Family detach Total for residential housing projects
Construction Loans to individuals secured by Residential properties Condo-conversion loans Loans for commercial projects Bridge and Land loans Working Capital
Total
Residential construction portfolio (PR only):
Under $300K $300K to $600K Over $600K
$ 10 $ — $ — $ 10 29 5 0.04 34 42 1 4 47 81 6 4 91 10 8 — 18 6 — — 6 65 92 — 157 135 41 23 199 3 1 — 4 $ 299 $ 148 $ 27 $ 475 $ 47 58% 7 9% 27 33% $ 81
Construction loan portfolio of $475 million:
– 24% Residential; 33% Commercial; 43% Pre-development In Florida, down to $27 million or 97% from $981 million in 2Q 2006 when construction lending was halted
In Puerto Rico, down to $299 million or 70% since 2009 Housing incentives enacted in Puerto Rico extended to December 2012 Absorption rates are stable supported by government incentives
21
|
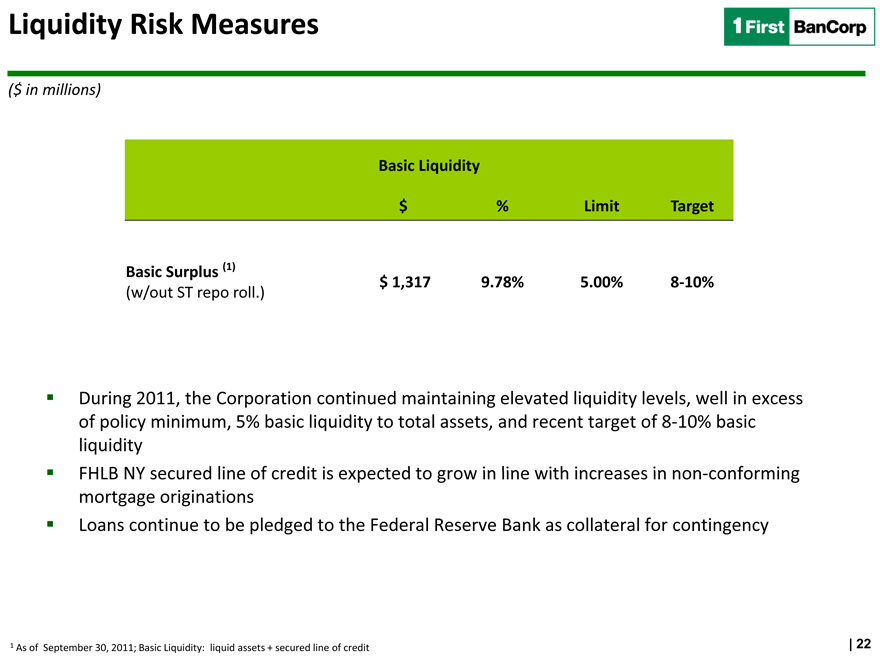
Liquidity Risk Measures
($ in millions)
Basic Liquidity
$ % Limit Target
Basic Surplus (1) $ 1,317 9.78% 5.00% 8-10%
(w/out ST repo roll.)
During 2011, the Corporation continued maintaining elevated liquidity levels, well in excess of policy minimum, 5% basic liquidity to total assets, and recent target of 8-10% basic liquidity
FHLB NY secured line of credit is expected to grow in line with increases in non-conforming mortgage originations
Loans continue to be pledged to the Federal Reserve Bank as collateral for contingency
1 As of September 30, 2011; Basic Liquidity: liquid assets + secured line of credit
| 22
|
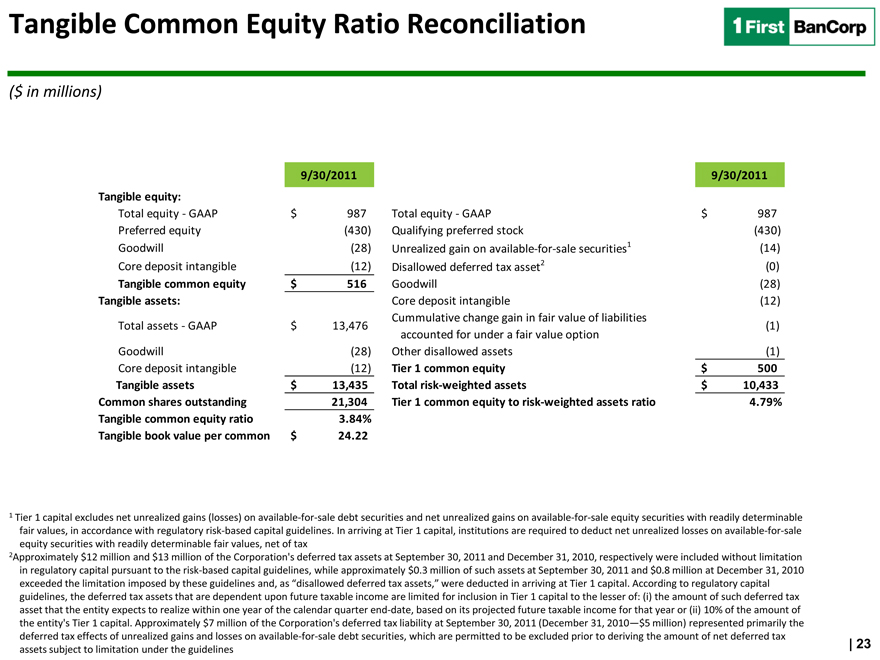
Tangible Common Equity Ratio Reconciliation
1 First BanCorp
($ in millions)
9/30/2011 9/30/2011
Tangible equity:
Total equity—GAAP $ 987 Total equity—GAAP $ 987
Preferred equity (430) Qualifying preferred stock (430)
Goodwill (28) Unrealized gain on available-for-sale securities1 (14)
Core deposit intangible (12) Disallowed deferred tax asset2 (0)
Tangible common equity $ 516 Goodwill (28)
Tangible assets: Core deposit intangible (12)
Cummulative change gain in fair value of liabilities
Total assets—GAAP $ 13,476 (1)
accounted for under a fair value option
Goodwill (28) Other disallowed assets (1)
Core deposit intangible (12) Tier 1 common equity $ 500
Tangible assets $ 13,435 Total risk-weighted assets $ 10,433
Common shares outstanding 21,304 Tier 1 common equity to risk-weighted assets ratio 4.79%
Tangible common equity ratio 3.84%
Tangible book value per common $ 24.22
1 Tier 1 capital excludes net unrealized gains (losses) on available-for-sale debt securities and net unrealized gains on available-for-sale equity securities with readily determinable fair values, in accordance with regulatory risk-based capital guidelines. In arriving at Tier 1 capital, institutions are required to deduct net unrealized losses on available-for-sale equity securities with readily determinable fair values, net of tax
2 Approximately $12 million and $13 million of the Corporation’s deferred tax assets at September 30, 2011 and December 31, 2010, respectively were included without limitation in regulatory capital pursuant to the risk-based capital guidelines, while approximately $0.3 million of such assets at September 30, 2011 and $0.8 million at December 31, 2010 exceeded the limitation imposed by these guidelines and, as “disallowed deferred tax assets,” were deducted in arriving at Tier 1 capital. According to regulatory capital guidelines, the deferred tax assets that are dependent upon future taxable income are limited for inclusion in Tier 1 capital to the lesser of: (i) the amount of such deferred tax asset that the entity expects to realize within one year of the calendar quarter end-date, based on its projected future taxable income for that year or (ii) 10% of the amount of the entity’s Tier 1 capital. Approximately $7 million of the Corporation’s deferred tax liability at September 30, 2011 (December 31, 2010—$5 million) represented primarily the deferred tax effects of unrealized gains and losses on available-for-sale debt securities, which are permitted to be excluded prior to deriving the amount of net deferred tax assets subject to limitation under the guidelines
23
|
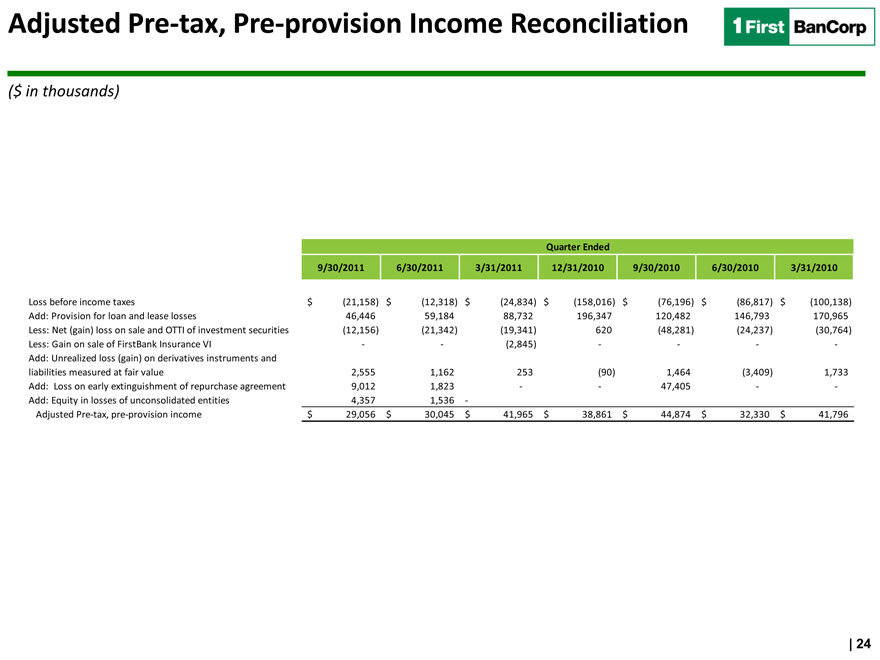
Adjusted Pre-tax, Pre-provision Income Reconciliation
($ in thousands)
Quarter Ended
9/30/2011 6/30/2011 3/31/2011 12/31/2010 9/30/2010 6/30/2010 3/31/2010
Loss before income taxes $ (21,158) $ (12,318) $ (24,834) $ (158,016) $ (76,196) $ (86,817) $ (100,138)
Add: Provision for loan and lease losses 46,446 59,184 88,732 196,347 120,482 146,793 170,965
Less: Net (gain) loss on sale and OTTI of investment securities (12,156) (21,342) (19,341) 620 (48,281) (24,237) (30,764)
Less: Gain on sale of FirstBank Insurance VI — — (2,845) — — — -
Add: Unrealized loss (gain) on derivatives instruments and
liabilities measured at fair value 2,555 1,162 253 (90) 1,464 (3,409) 1,733
Add: Loss on early extinguishment of repurchase agreement 9,012 1,823—- 47,405 — -
Add: Equity in losses of unconsolidated entities 4,357 1,536—
Adjusted Pre-tax, pre-provision income $ 29,056 $ 30,045 $ 41,965 $ 38,861 $ 44,874 $ 32,330 $ 41,796
| 24
|
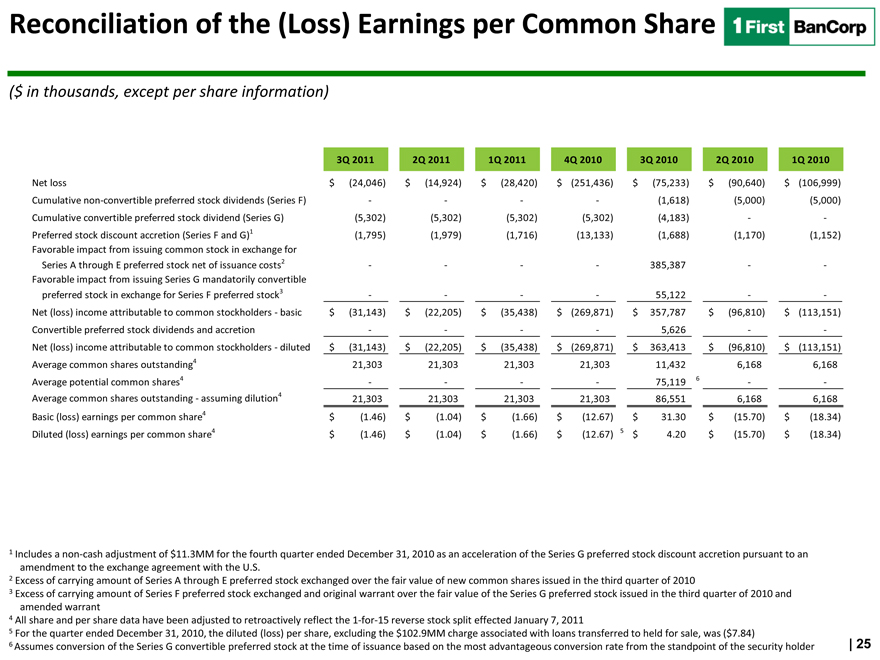
Reconciliation of the (Loss) Earnings per Common Share
($ in thousands, except per share information)
3Q 2011 2Q 2011 1Q 2011 4Q 2010 3Q 2010 2Q 2010 1Q 2010
Net loss $ (24,046) $ (14,924) $ (28,420) $ (251,436) $ (75,233) $ (90,640) $ (106,999)
Cumulative non-convertible preferred stock dividends (Series F) ———— (1,618) (5,000) (5,000)
Cumulative convertible preferred stock dividend (Series G) (5,302) (5,302) (5,302) (5,302) (4,183) — -
Preferred stock discount accretion (Series F and G)1 (1,795) (1,979) (1,716) (13,133) (1,688) (1,170) (1,152)
Favorable impact from issuing common stock in exchange for
Series A through E preferred stock net of issuance costs2 ———— 385,387 — -
Favorable impact from issuing Series G mandatorily convertible
preferred stock in exchange for Series F preferred stock3 ———— 55,122 — -
Net (loss) income attributable to common stockholders—basic $ (31,143) $ (22,205) $ (35,438) $ (269,871) $ 357,787 $ (96,810) $ (113,151)
Convertible preferred stock dividends and accretion ———— 5,626 — -
Net (loss) income attributable to common stockholders—diluted $ (31,143) $ (22,205) $ (35,438) $ (269,871) $ 363,413 $ (96,810) $ (113,151)
Average common shares outstanding4 21,303 21,303 21,303 21,303 11,432 6,168 6,168
Average potential common shares4 ———— 75,119 6 — -
Average common shares outstanding—assuming dilution4 21,303 21,303 21,303 21,303 86,551 6,168 6,168
Basic (loss) earnings per common share4 $ (1.46) $ (1.04) $ (1.66) $ (12.67) $ 31.30 $ (15.70) $ (18.34)
Diluted (loss) earnings per common share4 $ (1.46) $ (1.04) $ (1.66) $ (12.67) 5 $ 4.20 $ (15.70) $ (18.34)
1 Includes a non-cash adjustment of $11.3MM for the fourth quarter ended December 31, 2010 as an acceleration of the Series G preferred stock discount accretion pursuant to an amendment to the exchange agreement with the U.S.
2 Excess of carrying amount of Series A through E preferred stock exchanged over the fair value of new common shares issued in the third quarter of 2010
3 Excess of carrying amount of Series F preferred stock exchanged and original warrant over the fair value of the Series G preferred stock issued in the third quarter of 2010 and amended warrant
4 All share and per share data have been adjusted to retroactively reflect the 1-for-15 reverse stock split effected January 7, 2011
5 For the quarter ended December 31, 2010, the diluted (loss) per share, excluding the $102.9MM charge associated with loans transferred to held for sale, was ($7.84)
6 Assumes conversion of the Series G convertible preferred stock at the time of issuance based on the most advantageous conversion rate from the standpoint of the security holder
25