Exhibit 99.2
Exhibit 99.2
Financial Results
Fourth Quarter & Fiscal Year 2012
Forward-Looking Statements
This presentation contains “forward-looking statements” concerning First BanCorp’s (the “Corporation”) future economic performance. The words or phrases “would be,” “will allow,” “intends to,” “will likely result,” “are expected to,” “expect,” “anticipate,” “look forward,” “should,” “believes” and similar expressions are meant to identify “forward-looking statements” within the meaning of Section 27A of the Private Securities Litigation Reform Act of 1995, and are subject to the safe harbor created by such section. The Corporation wishes to caution readers not to place undue reliance on any such “forward-looking statements,” which speak only as of the date made, and to advise readers that various factors, including, but not limited to, uncertainty about whether the Corporation and FirstBank Puerto Rico (“FirstBank” or “the Bank”) will be able to fully comply with the written agreement dated June 3, 2010 that the Corporation entered into with the Federal Reserve Bank of New York (the “FED”) and the order dated June 2, 2010 (the “Order”)that FirstBank entered into with the FDIC and the Office of the Commissioner of Financial Institutions of Puerto Rico that, among other things, require FirstBank to maintain certain capital levels and reduce its special mention, classified, delinquent and non-performing assets; the risk of being subject to possible additional regulatory actions; uncertainty as to the availability of certain funding sources, such as retail brokered CDs; the Corporation’s reliance on brokered CDs and its ability to obtain, on a periodic basis, approval from the FDIC to issue brokered CDs to fund operations and provide liquidity in accordance with the terms of the Order; the risk of not being able to fulfill the Corporation’s cash obligations or resume paying dividends to the Corporation’s stockholders in the future due to the Corporation’s inability to receive approval from the FED to receive dividends from FirstBank or FirstBank’s failure to generate sufficient cash flow to make a dividend payment to the Corporation; the strength or weakness of the real estate markets and of the consumer and commercial credit sectors and their impact on the credit quality of the Corporation’s loans and other assets, including the Corporation’s construction and commercial real estate loan portfolios, which have contributed and may continue to contribute to, among other things, the high levelsof non-performing assets, charge-offsand theprovision expense and may subject the Corporation to further risk from loan defaultsand foreclosures; adverse changes in general economic conditions in the United States and in Puerto Rico, including the interest rate scenario, market liquidity, housing absorption rates, real estate prices and disruptions in the U.S. capital markets, which may reduce interest margins, impact funding sources and affect demand for all of the Corporation’s products and services and the value of the Corporation’s assets; an adverse change in the Corporation’s ability to attract new clients and retain existing ones; a decrease in demand for the Corporation’s products and services and lower revenues and earnings because of the continued recession in Puerto Rico and the current fiscal problems and budget deficit of the Puerto Rico government; uncertainty about regulatory and legislative changes for financial services companies in Puerto Rico, the United States and the U.S. and British Virgin Islands, which could affect the Corporation’s financial performance and could cause the Corporation’s actual results for future periods to differ materially from prior results and anticipated or projected results; uncertainty about the effectiveness of the various actions undertaken to stimulate the United States economy and stabilize the United States financial markets, and the impact such actions may have on the Corporation’s business, financial condition and results of operations; changes in the fiscal and monetary policies and regulations of the federal government, including those determined by the Federal Reserve System, the FDIC, government-sponsored housing agencies and regulators in Puerto Rico and the U.S. and British Virgin Islands; the risk of possible failure or circumvention of controls and procedures and the risk that the Corporation’s risk management policies may not be adequate; the risk that the FDIC may further increase the deposit insurance premium and/or require special assessments to replenish its insurance fund, causing an additional increase in the Corporation’s non-interest expense; risks of not being able to recover the assets pledged to Lehman Brothers Special Financing, Inc.; the impact on the Corporation’s results of operations and financial condition associated with acquisitions and dispositions; a need to recognize additional impairments on financial instruments or goodwill relating to acquisitions; risks that downgrades in the credit ratings of the Corporation’s long-term senior debt will adversely affect the Corporation’s ability to access necessary external funds; the impact of the Dodd-Frank Wall Street Reform and Consumer Protection Act on the Corporation’s businesses, business practices and cost of operations; and general competitive factors and industry consolidation. The Corporation does not undertake, and specifically disclaims any obligation, to update any “forward-looking statements” to reflect occurrences or unanticipated events or circumstances after the date of such statements except as required by the federal securities laws. Investors should refer to the Corporation’s Annual Report on Form 10-K for the year ended December 31, 2011 for a discussion of such factors and certain risks and uncertainties to which the Corporation is subject.
2

Agenda
Fourth Quarter and Fiscal Year 2012 Highlights: Aurelio Alemán, President & Chief Executive Officer Fourth Quarter and Fiscal Year 2012 Results of Operations: Orlando Berges, Executive Vice President & Chief Financial Officer
Summary
Questions & Answers
3

FOURTH QUARTER &
FISCAL YEAR 2012
Highlights
Fourth Quarter 2012 Highlights: CORE FRANCHISE STRONG
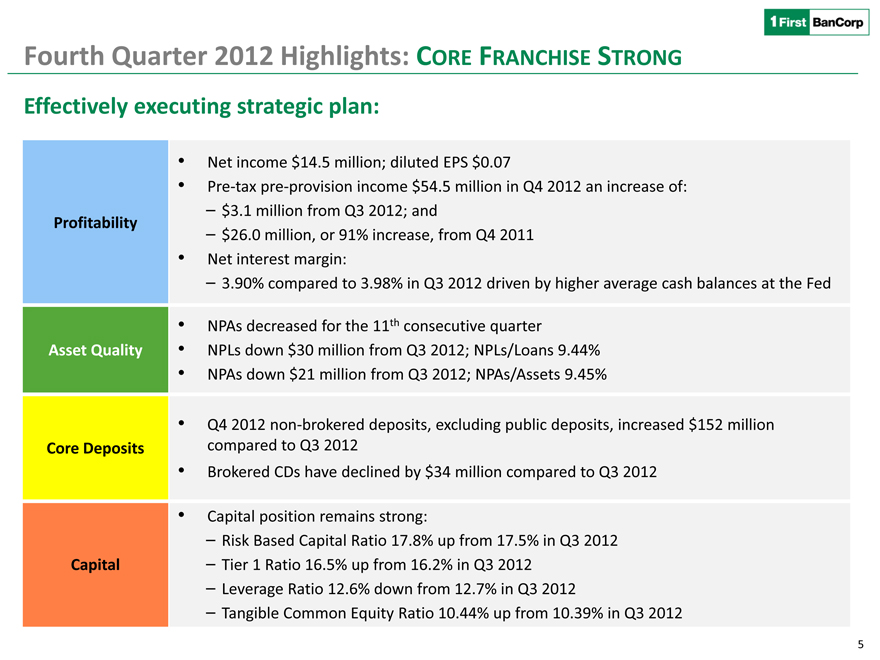
Effectively executing strategic plan:
Net income $14.5 million; diluted EPS $0.07
Pre-tax pre-provision income $54.5 million in Q4 2012 an increase of:
$3.1 million from Q3 2012; and
Profitability
$26.0 million, or 91% increase, from Q4 2011
Net interest margin:
3.90% compared to 3.98% in Q3 2012 driven by higher average cash balances at the Fed
NPAs decreased for the 11th consecutive quarter
Asset Quality NPLs down $30 million from Q3 2012; NPLs/Loans 9.44%
NPAs down $21 million from Q3 2012; NPAs/Assets 9.45%
Q4 2012 non-brokered deposits, excluding public deposits, increased $152 million Core Deposits compared to Q3 2012
Brokered CDs have declined by $34 million compared to Q3 2012
Capital position remains strong:
Risk Based Capital Ratio 17.8% up from 17.5% in Q3 2012 Capital ‒ Tier 1 Ratio 16.5% up from 16.2% in Q3 2012
Leverage Ratio 12.6% down from 12.7% in Q3 2012
Tangible Common Equity Ratio 10.44% up from 10.39% in Q3 2012
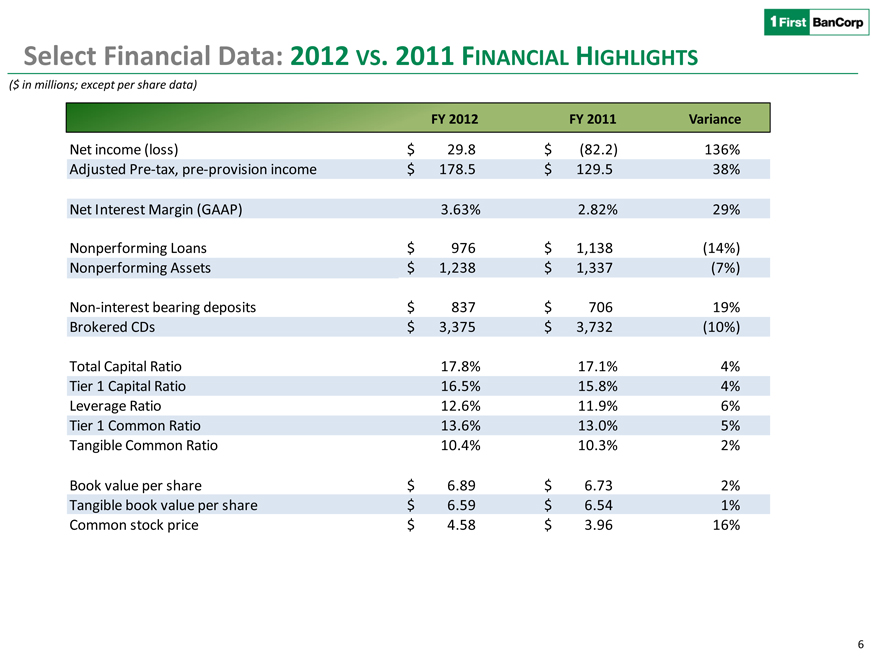
Select Financial Data: 2012 VS. 2011 FINANCIAL HIGHLIGHTS
($ in millions; except per share data)
FY 2012 FY 2011 Variance
Net income (loss) $ 29.8 $ (82.2) 136%
Adjusted Pre-tax, pre-provision income $ 178.5 $ 129.5 38%
Net Interest Margin (GAAP) 3.63% 2.82% 29%
Nonperforming Loans $ 976 $ 1,138 (14%)
Nonperforming Assets $ 1,238 $ 1,337 (7%)
Non-interest bearing deposits $ 837 $ 706 19%
Brokered CDs $ 3,375 $ 3,732 (10%)
Total Capital Ratio 17.8% 17.1% 4%
Tier 1 Capital Ratio 16.5% 15.8% 4%
Leverage Ratio 12.6% 11.9% 6%
Tier 1 Common Ratio 13.6% 13.0% 5%
Tangible Common Ratio 10.4% 10.3% 2%
Book value per share $ 6.89 $ 6.73 2%
Tangible book value per share $ 6.59 $ 6.54 1%
Common stock price $ 4.58 $ 3.96 16%
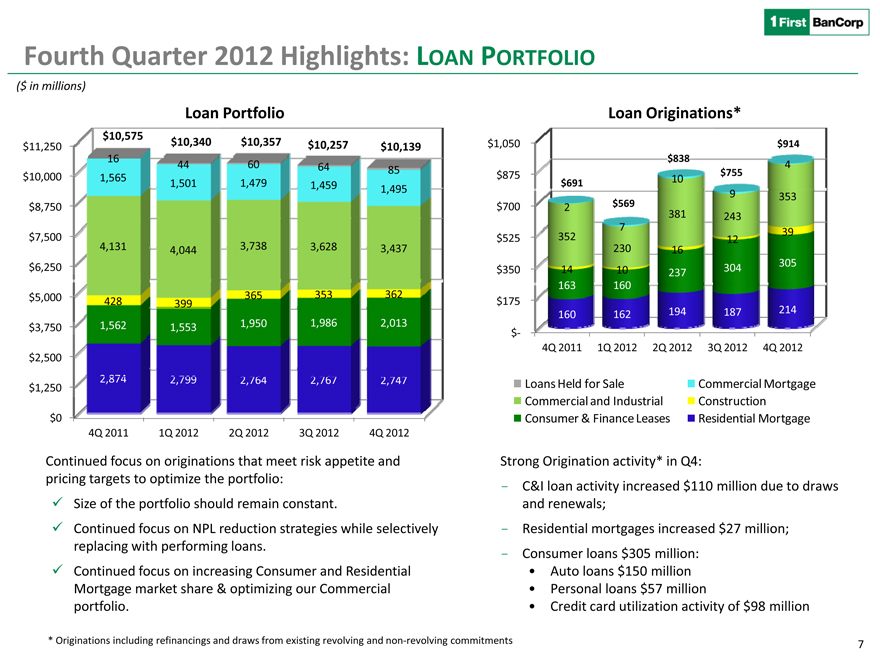
Fourth Quarter 2012 Highlights: LOAN PORTFOLIO
($ in millions)
$11,250
16
44
60
64
85
$10,000
1,565
1,501
1,479
1,459
,
$8,750
$7,500
4,131
4,044
3,738
3,628
3,437
$6,250
$5,000
365
353
362
428
399
$3,750
1,562
1,553
1,950
1,986
2,013
$2,500
2,874
2,799
2,764
2,767
2,747
$1,250
$0
4Q 2011
1Q 2012
2Q 2012
3Q 2012
4Q 2012
Loan Originations*
$1,050
$914
$838
4
$875
10
$755
$691
9
353
$700
2
$569
381
243
7
$525
352
12
39
230
16
$350
14
10
237
304
305
163
160
$175
160
162
194
187
214
$-
4Q 2011
1Q 2012
2Q 2012
3Q 2012
4Q 2012
Loans Held for Sale
Commercial Mortgage
Commercial and Industrial
Construction
Consumer & Finance Leases
Residential Mortgage
Continued focus on originations that meet risk appetite and pricing targets to optimize the portfolio:
Size of the portfolio should remain constant.
Continued focus on NPL reduction strategies while selectively replacing with performing loans.
Continued focus on increasing Consumer and Residential Mortgage market share & optimizing our Commercial portfolio.
Strong Origination activity* in Q4:
- C&I loan activity increased $110 million due to draws and renewals;
- Residential mortgages increased $27 million;
- Consumer loans $305 million:
Auto loans $150 million
Personal loans $57 million
Credit card utilization activity of $98 million
* Originations including refinancings and draws from existing revolving and non-revolving commitments 7
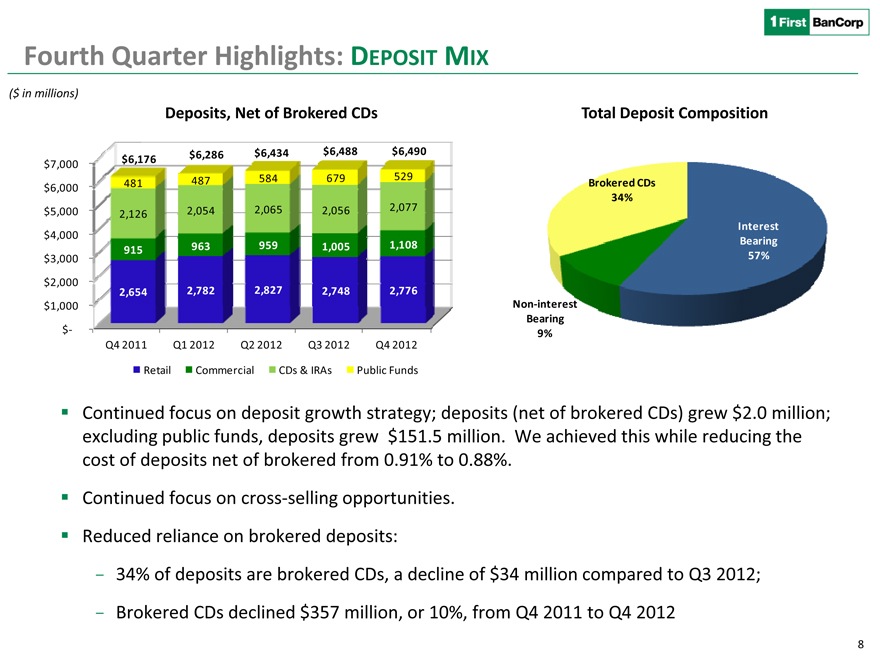
Fourth Quarter Highlights: DEPOSIT MIX
($ in millions)
Deposits, Net of Brokered CDs Total Deposit Composition
$6,286 $6,434 $6,488 $6,490 $6,176 $7,000 487 584 679 529 481 $6,000 $5,000 2,054 2,065 2,056 2,077 2,126
$4,000
963 959 1,005 1,108 $3,000 915 $2,000
2,654 2,782 2,827 2,748 2,776 $1,000
$- Q4 2011 Q1 2012 Q2 2012 Q3 2012 Q4 2012
Retail Commercial CDs & IRAs Public Funds
Brokered CDs 34%
Interest Bearing 57%
Non-interest Bearing 9%
Continued focus on deposit growth strategy; deposits (net of brokered CDs) grew $2.0 million; excluding public funds, deposits grew $151.5 million. We achieved this while reducing the cost of deposits net of brokered from 0.91% to 0.88%.
Continued focus on cross-selling opportunities.
Reduced reliance on brokered deposits:
- 34% of deposits are brokered CDs, a decline of $34 million compared to Q3 2012;
- Brokered CDs declined $357 million, or 10%, from Q4 2011 to Q4 2012 8
FOURTH QUARTER & FISCAL YEAR 2012
Results of Operations
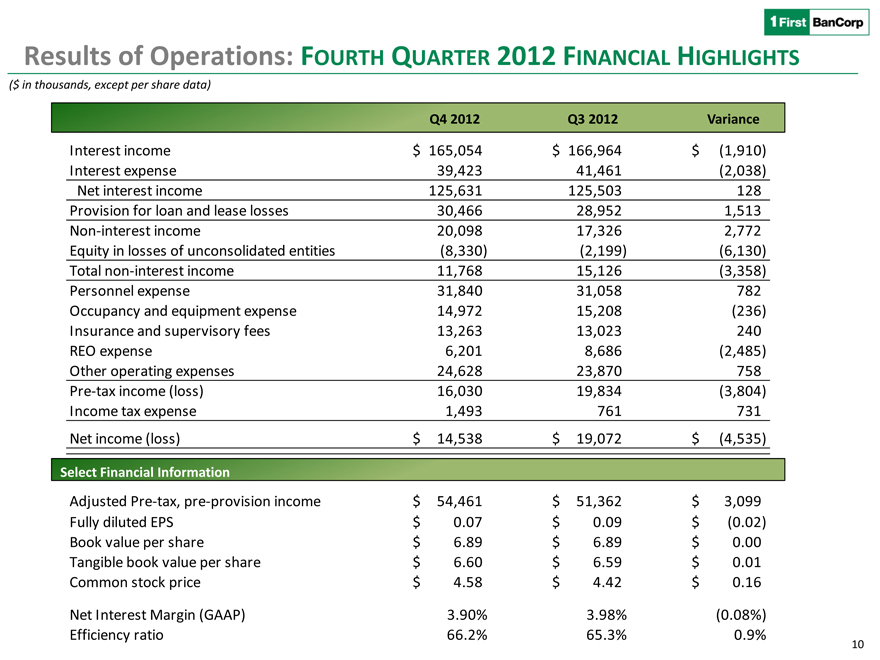
Results of Operations: FOURTH QUARTER 2012 FINANCIAL HIGHLIGHTS
($ in thousands, except per share data)
Q4 2012 Q3 2012 Variance
Interest income $ 165,054 $ 166,964 $ (1,910)
Interest expense 39,423 41,461 (2,038)
Net interest income 125,631 125,503 128
Provision for loan and lease losses 30,466 28,952 1,513
Non-interest income 20,098 17,326 2,772
Equity in losses of unconsolidated entities (8,330) (2,199) (6,130)
Total non-interest income 11,768 15,126 (3,358)
Personnel expense 31,840 31,058 782
Occupancy and equipment expense 14,972 15,208 (236)
Insurance and supervisory fees 13,263 13,023 240
REO expense 6,201 8,686 (2,485)
Other operating expenses 24,628 23,870 758
Pre-tax income (loss) 16,030 19,834 (3,804)
Income tax expense 1,493 761 731
Net income (loss) $ 14,538 $ 19,072 $ (4,535)
Select Financial Information
Adjusted Pre-tax, pre-provision income $ 54,461 $ 51,362 $ 3,099
Fully diluted EPS $ 0.07 $ 0.09 $ (0.02)
Book value per share $ 6.89 $ 6.89 $ 0.00
Tangible book value per share $ 6.60 $ 6.59 $ 0.01
Common stock price $ 4.58 $ 4.42 $ 0.16
Net Interest Margin (GAAP) 3.90% 3.98% (0.08%)
Efficiency ratio 66.2% 65.3% 0.9%
10
Results of Operations: REVENUE GROWTH & MARGIN
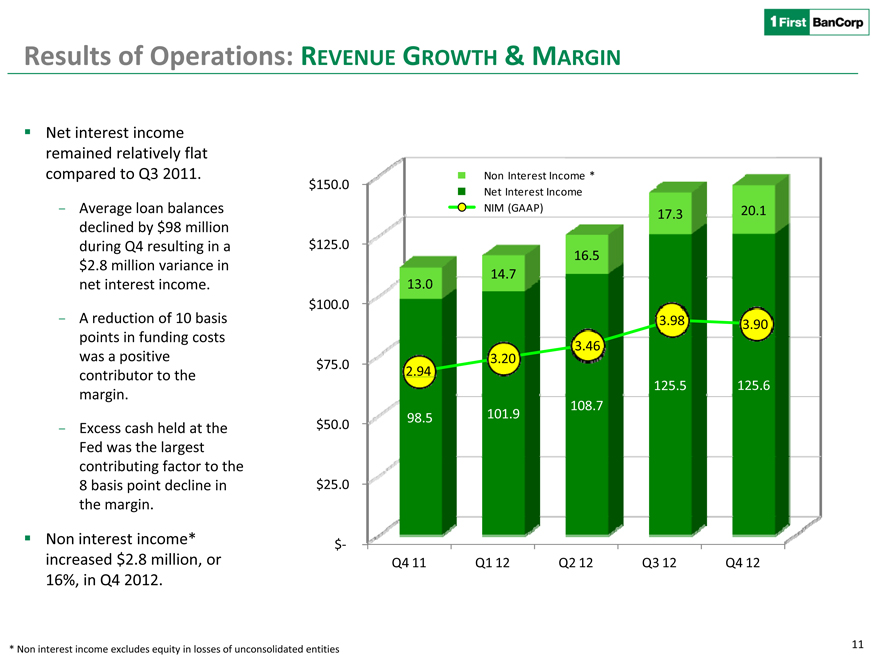
Net interest income remained relatively flat compared to Q3 2011.
Average loan balances declined by $98 million during Q4 resulting in a $2.8 million variance in net interest income.
A reduction of 10 basis points in funding costs was a positive contributor to the margin.
Excess cash held at the Fed was the largest contributing factor to the 8 basis point decline in the margin.
Non interest income* increased $2.8 million, or 16%, in Q4 2012.
Non Interest Income *
$150.0 Net Interest Income
NIM (GAAP) 17.3 20.1
$125.0
16.5
14.7
13.0
$100.0
3.98 3.90
3.46
$75.0 3.20
2.94
125.5 125.6
108.7
$50.0 98.5 101.9
$25.0
$-
Q4 11 Q1 12 Q2 12 Q3 12 Q4 12
11
Results
of
Operations:
COST
OF
FUNDS
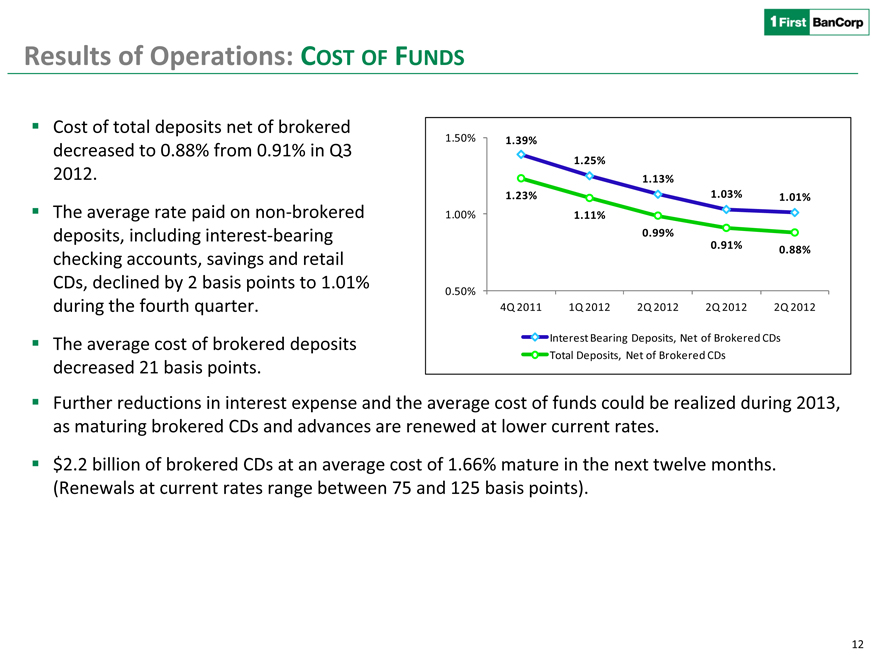
Cost of total deposits net of brokered decreased to 0.88% from 0.91% in Q3 2012.
The average rate paid on non-brokered deposits, including interest-bearing checking accounts, savings and retail CDs, declined by 2 basis points to 1.01% during the fourth quarter.
The average cost of brokered deposits decreased 21 basis points.
Further reductions in interest expense and the average cost of funds could be realized during 2013, as maturing brokered CDs and advances are renewed at lower current rates.
$2.2 billion of brokered CDs at an average cost of 1.66% mature in the next twelve months.
(Renewals at current rates range between 75 and 125 basis points).
1.50% 1.39%
1.25%
1.13%
1.23% 1.03% 1.01%
1.00% 1.11%
0.99%
0.91% 0.88%
0.50%
4Q 2011 1Q 2012 2Q 2012 2Q 2012 2Q 2012
Interest Bearing Deposits, Net of Brokered CDs
Total Deposits, Net of Brokered CDs
12
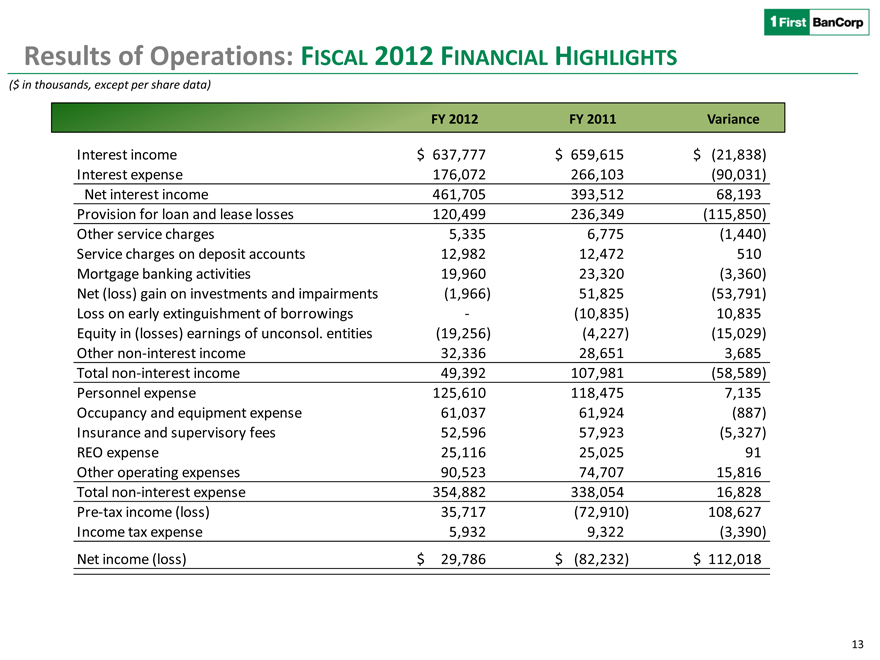
Results of Operations: FISCAL 2012 FINANCIAL HIGHLIGHTS
($ in thousands, except per share data)
FY 2012 FY 2011 Variance
Interest income $ 637,777 $ 659,615 $ (21,838)
Interest expense 176,072 266,103 (90,031)
Net interest income 461,705 393,512 68,193
Provision for loan and lease losses 120,499 236,349 (115,850)
Other service charges 5,335 6,775 (1,440)
Service charges on deposit accounts 12,982 12,472 510
Mortgage banking activities 19,960 23,320 (3,360)
Net (loss) gain on investments and impairments (1,966) 51,825 (53,791)
Loss on early extinguishment of borrowings - (10,835) 10,835
Equity in (losses) earnings of unconsol. entities (19,256) (4,227) (15,029)
Other non-interest income 32,336 28,651 3,685
Total non-interest income 49,392 107,981 (58,589)
Personnel expense 125,610 118,475 7,135
Occupancy and equipment expense 61,037 61,924 (887)
Insurance and supervisory fees 52,596 57,923 (5,327)
REO expense 25,116 25,025 91
Otherhe operatingpe ng expensespens 90,523 74,707 15,816
Total non-interest expense 354,882 338,054 16,828
Pre-tax income (loss) 35,717 (72,910) 108,627
Income tax expense 5,932 9,322 (3,390)
Net income (loss) $ 29,786 $ (82,232) $ 112,018
13
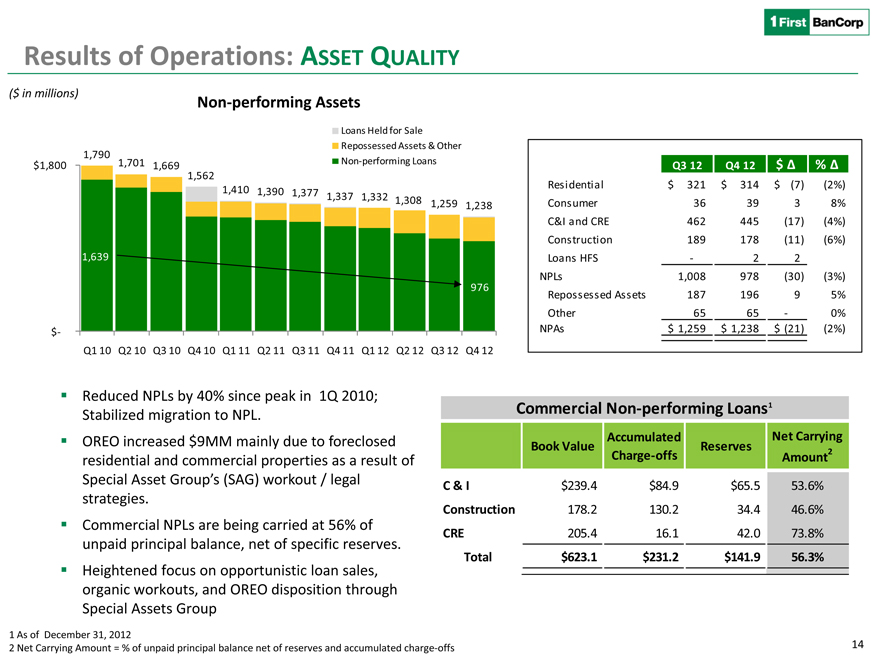
Results of Operations: ASSET QUALITY
($ in millions)
Non-performing Assets
Loans Held for Sale
Repossessed Assets & Other
$1,800 1,790 1,701 1,669 Non-performing Loans
1,562
1,410 1,390 1,377
1,337 1,332 1,308 1,259 1,238
1,639
976
$-
Q1 10 Q2 10 Q3 10 Q4 10 Q1 11 Q2 11 Q3 11 Q4 11 Q1 12 Q2 12 Q3 12 Q4 12
Q3 12
Q4 12
$
%
Residential
$
321
$
314
$
(7)
(2%)
Consumer
36
39
3
8%
C&I and CRE
462
445
(17)
(4%)
Construction
189
178
(11)
(6%)
Loans HFS
-
2
2
NPLs
1,008
978
(30)
(3%)
Repossessed Assets
187
196
9
5%
Other
65
65
-
0%
NPAs
$
1,259
$
1,238
$
(21)
(2%)
Commercial Non-performing Loans1
Accumulated
Net Carrying
Book Value
Reserves
Charge-offs
Amount2
C & I
$
239.4
$84.9
$65.5
53.6%
Construction
178.2
130.2
34.4
46.6%
CRE
205.4
16.1
42.0
73.8%
Total
$623.1
$231.2
$141.9
56.3%
Reduced NPLs by 40% since peak in 1Q 2010; Stabilized migration to NPL.
OREO increased $9MM mainly due to foreclosed residential and commercial properties as a result of Special Asset Group’s (SAG) workout / legal strategies.
Commercial NPLs are being carried at 56% of unpaid principal balance, net of specific reserves.
Heightened focus on opportunistic loan sales, organic workouts, and OREO disposition through Special Assets Group
1 As of December 31, 2012
2 Net Carrying Amount = % of unpaid principal balance net of reserves and accumulated charge-offs
14
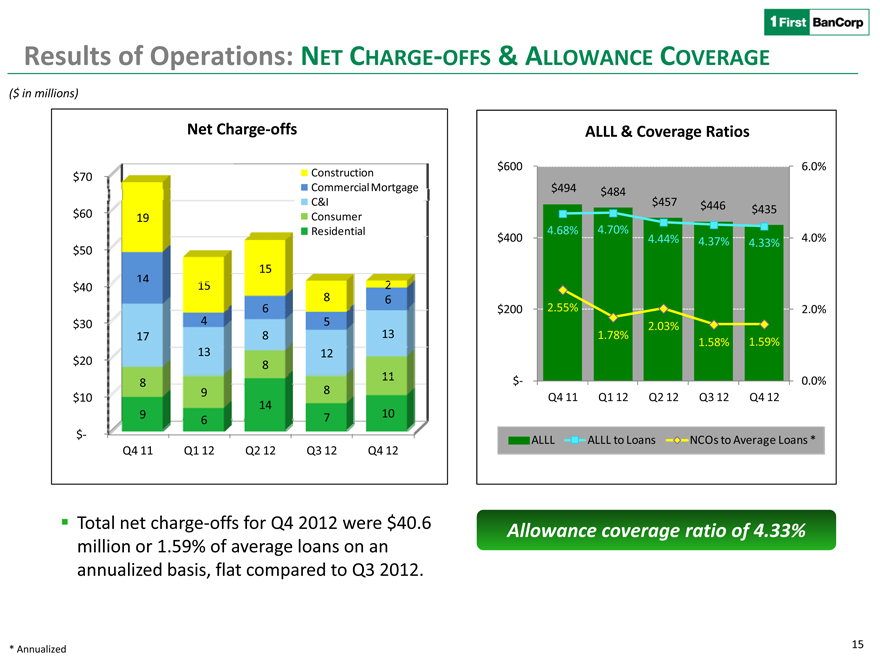
Results of Operations: NET CHARGE-OFFS & ALLOWANCE COVERAGE
($ in millions)
($ in millions)
Net Charge-offs ALLL & Coverage Ratios
$600 6.0%
$70 Construction
CommercialMortgage $494 $484
C&I $457 $446
$60 Consumer $435
19
Residential 4.68% 4.70%
$400 4.44% 4.37% 4.33% 4.0%
$50
15
14
$40 15 2
8 6
6 $200 2.55% 2.0%
$30 4 5 2.03%
17 8 13 1.78% 1.58% 1.59%
13 12
$20 8
8 $- 0.0%
9 8
$10 Q4 11 Q1 12 Q2 12 Q3 12 Q4 12
14
9 6 7 10
$- ALLL ALLL to Loans NCOs to Average Loans *
Q4 11 Q1 12 Q2 12 Q3 12 Q4 12
Total net charge-offs for Q4 2012 were $40.6
Allowance coverage ratio of 4.33% million or 1.59% of average loans on an annualized basis, flat compared to Q3 2012.
15
* Annualized
15
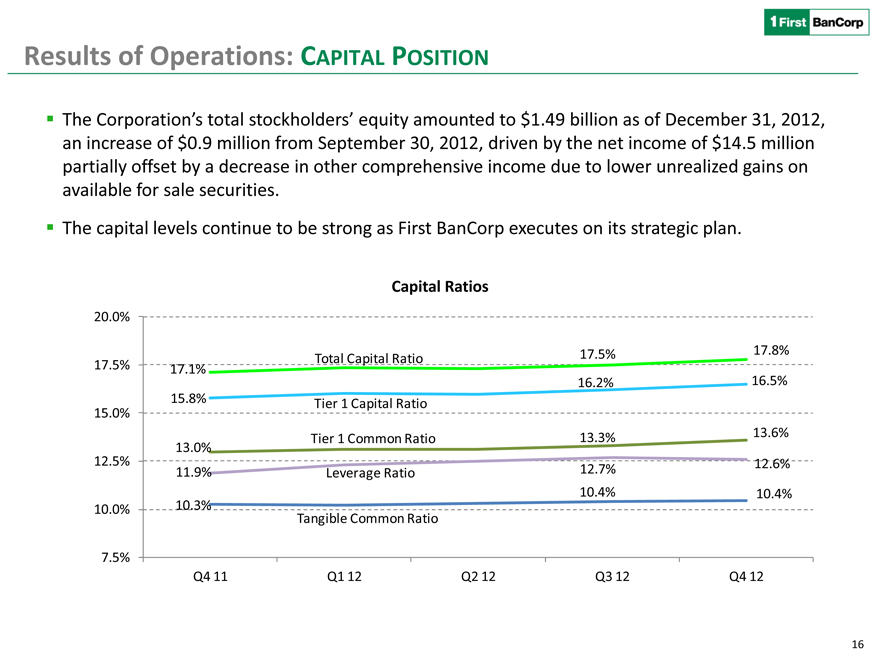
Results of Operations: CAPITAL POSITION
The Corporation’s total stockholders’ equity amounted to $1.49 billion as of December 31, 2012, an increase of $0.9 million from September 30, 2012, driven by the net income of $14.5 million partially offset by a decrease in other comprehensive income due to lower unrealized gains on available fo or sale securities.
The capital levels continue to be strong as First BanCorp executes on its strategic plan.
Capital Ratios
20.0% 17.5% 15.0% 12.5% 10.0% 7.5%
17.5% 17.8%
17.1% Total Capital Ratio
16.2% 16.5%
15.8% Tier 1 Capital Ratio
13.3% 13.6% Tier 1 Common Ratio
13.0%
12.7% 12.6%
11.9% Leverage Ratio
10.4% 10.4%
10.3%
Tangible Common Ratio
Q4 11 Q1 12 Q2 12 Q3 12 Q4 12
16
FOURTH QUARTER & FISCAL 2012
Summary
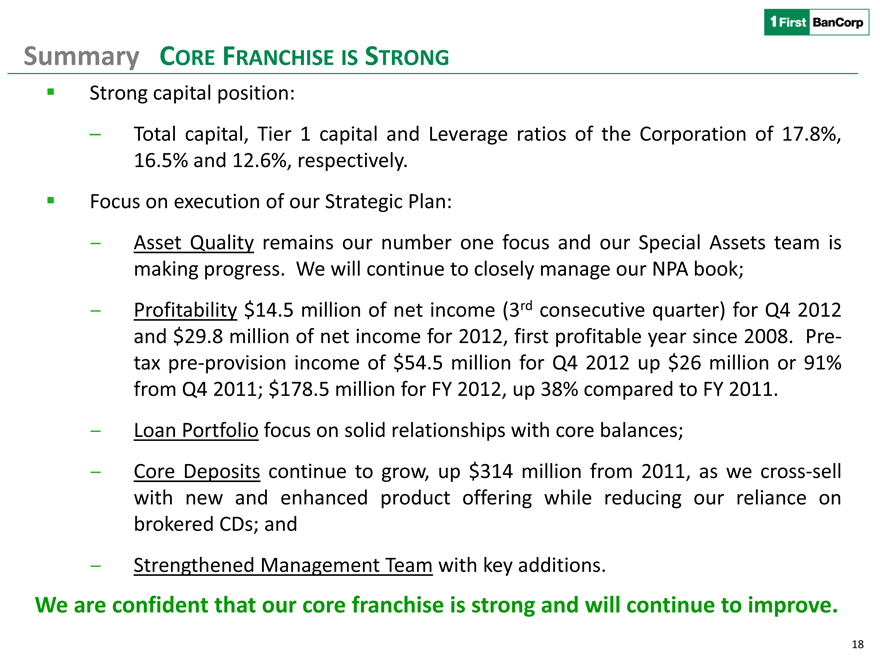
Summary CORE FRANCHISE IS STRONG
ƒ Strong capital position:
Total capital, Tier 1 capital and Leverage ratios of the Corporation of 17.8%, 16.5% and 12.6%, respectively.
ƒ Focus on execution of our Strategic Plan:
Asset Quality remains our number one focus and our Special Assets team is making progress. We will continue to closely manage our NPA book;
Profitability $14.5 million of net income (3rd consecutive quarter) for Q4 2012 and $29.8 million of net income for 2012, first profitable year since 2008. Pre-tax pre-provision income of $54.5 million for Q4 2012 up $26 million or 91% from Q4 2011; $178.5 million for FY 2012, up 38% compared to FY 2011.
Loan Portfolio focus on solid relationships with core balances;
Core Deposits continue to grow, up $314 million from 2011, as we cross-sell with new and enhanced product offering while reducing our reliance on brokered CDs; and
Strengthened Management Team with key additions.
We are confident that our core franchise is strong and will continue to improve.
18

FOURTH QUARTER & FISCAL 2012
Q&A

EXHIBITS
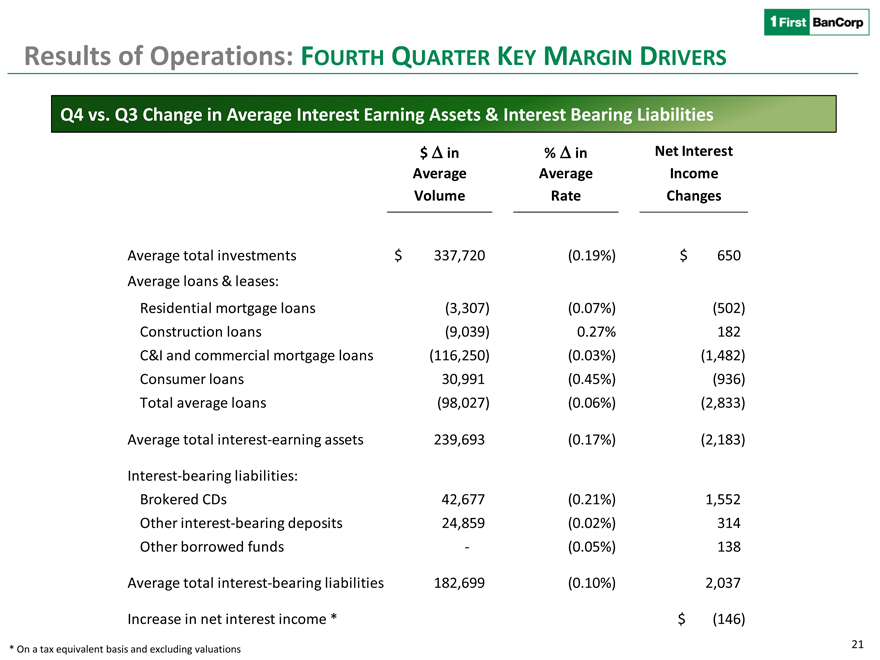
Results of Operations: FOURTH QUARTER KEY MARGIN DRIVERS
Q4 vs. Q3 Change in Average Interest Earning Assets & Interest Bearing Liabilities
$ Ä in
% Ä in
Net Interest
Average
Average
Income
Volume
Rate
Changes
Average total investments
$ 337,720
(0.19%)
$
650
Average loans & leases:
Residential mortgage loans
(3,307)
(0.07%)
(502)
Construction loans
(9,039)
0.27%
182
C&I and commercial mortgage loans
(116,250)
(0.03%)
(1,482)
Consumer loans
30,991
(0.45%)
(936)
Total average loans
(98,027)
(0.06%)
(2,833)
Average total interest-earning assets
239,693
(0.17%)
(2,183)
Interest-bearing liabilities:
Brokered CDs
42,677
(0.21%) 1,552 Other interest-bearing deposits 24,859
(0.02%)
314
Other borrowed funds -
(0.05%)
138 Average total interest-bearing liabilities
182,699 (0.10%)
2,037 Increase in net interest income * $ (146)
* On a tax equivalent basis and excluding valuations
21
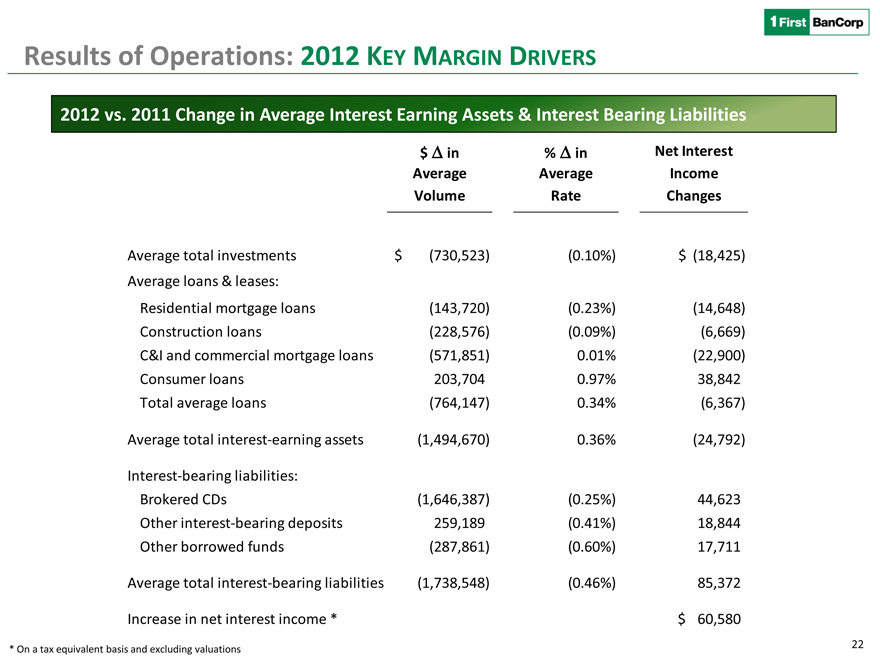
Results of Operations: 2012 KEY MARGIN DRIVERS
2012 vs. 2011 Change in Average Interest Earning Assets & Interest Bearing Liabilities
$ Ä in
% Ä in
Net Interest
Average
Average
Income
Volume
Rate
Changes
Average total investments
$ (730,523)
(0.10%) $
(18,425) Average loans & leases:
Residential mortgage loans
(143,720)
(0.23%) (14,648) Construction loans
(228,576)
(0.09%) (6,669) C&I and commercial mortgage loans
(571,851)
0.01% (22,900) Consumer loans
203,704
0.97%
38,842
Total average loans
(764,147)
0.34%
(6,367)
Average total interest-earning assets
(1,494,670)
0.36%
(24,792)
Interest-bearing liabilities:
Brokered CDs
(1,646,387)
(0.25%) 44,623 Other interest-bearing deposits
259,189
(0.41%)
18,844 Other borrowed funds
(287,861)
(0.60%)
17,711 Average total interest-bearing liabilities
(1,738,548)
(0.46%) 85,372 Increase in net interest income *
$
60,580
* On a tax equivalent basis and excluding valuations
22
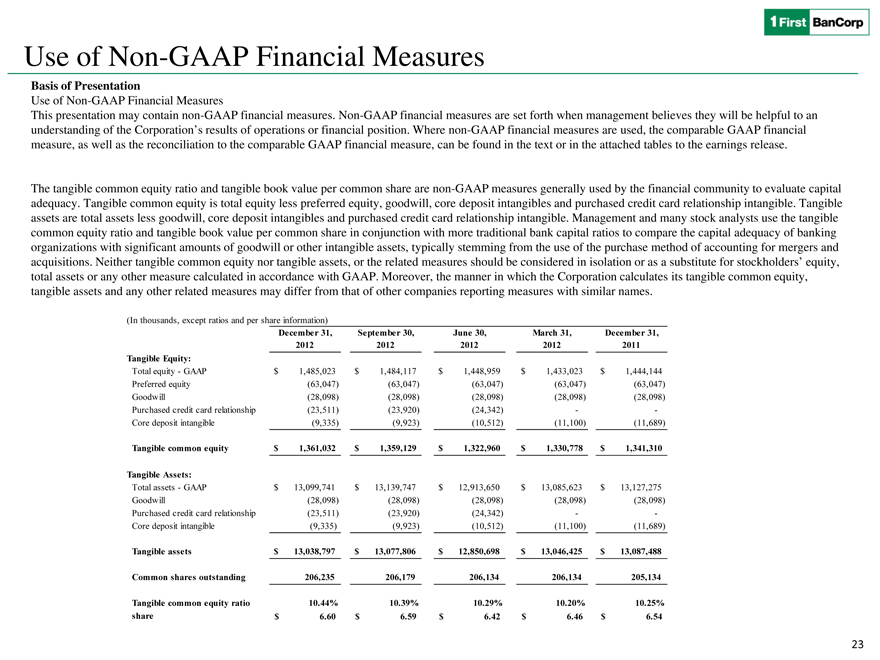
Use of Non-GAAP Financial Measures
Basis of Presentation
Use of Non-GAAP Financial Measures
This presentation may contain non-GAAP financial measures. Non-GAAP financial measures are set forth when management believes they will be helpful to an understanding of the Corporation’s results of operations or financial position. Where non-GAAP financial measures are used, the comparable GAAP financial measure, as well as the reconciliation to the comparable GAAP financial measure, can be found in the text or in the attached tables to the earnings release.
The tangible common equity ratio and tangible book value per common share are non-GAAP measures generally used by the financial community to evaluate capital adequacy. Tangible common equity is total equity less preferred equity, goodwill, core deposit intangibles and purchased credit card relationship intangible. Tangible assets are total assets less goodwill, core deposit intangibles and purchased credit card relationship intangible. Management and many stock analysts use the tangible common equity ratio and tangible book value per common share in conjunction with more traditional bank capital ratios to compare the capital adequacy of banking organizations with significant amounts of goodwill or other intangible assets, typically stemming from the use of the purchase method of accounting for mergers and acquisitions. Neither tangible common equity nor tangible assets, or the related measures should be considered in isolation or as a substitute for stockholders’ equity, total assets or any other measure calculated in accordance with GAAP. Moreover, the manner in which the Corporation calculates its tangible common equity, tangible assets and any other related measures may differ from that of other companies reporting measures with similar names.
(In thousands, except ratios and per share information)
December 31,
September 30,
June 30,
March 31,
December 31, 2012 2012 2012 2012 2011 Tangible Equity:
Total equity - GAAP
$ 1,485,023 $ 1,484,117
$ 1,448,959 $ 1,433,023
$ 1,444,144 Preferred equity
(63,047) (63,047) (63,047) (63,047) (63,047)
Goodwill
(28,098) (28,098) (28,098) (28,098) (28,098)
Purchased credit card relationship
(23,511)
(23,920)
(24,342) -
-Core deposit intangible
(9,335) (9,923) (10,512) (11,100) (11,689)
Tangible common equity
$ 1,361,032 $ 1,359,129
$ 1,322,960 $ 1,330,778 $ 1,341,310
Tangible Assets:
Total assets - GAAP
$ 13,099,741 $ 13,139,747 $ 12,913,650 $ 13,085,623 $ 13,127,275
Goodwill
(28,098)
28,098) (28,098) (28,098) (28,098)
Purchased credit card relationship
(23,511)
(23,920)
(24,342)
-
-
Core deposit intangible
(9,335)
(9,923)
(10,512)
(11,100)
(11,689)
Tangible assets
$ 13,038,797
$ 13,077,806
$ 12,850,698
$ 13,046,425
$ 13,087,488
Common shares outstanding
206,235
206,179
206,134
206,134
205,134
Tangible common equity ratio
10.44%
10.39%
10.29%
10.20%
10.25%
share
$
6.60
$
6.59
$
6.42
$
6.46
$
6.54
23
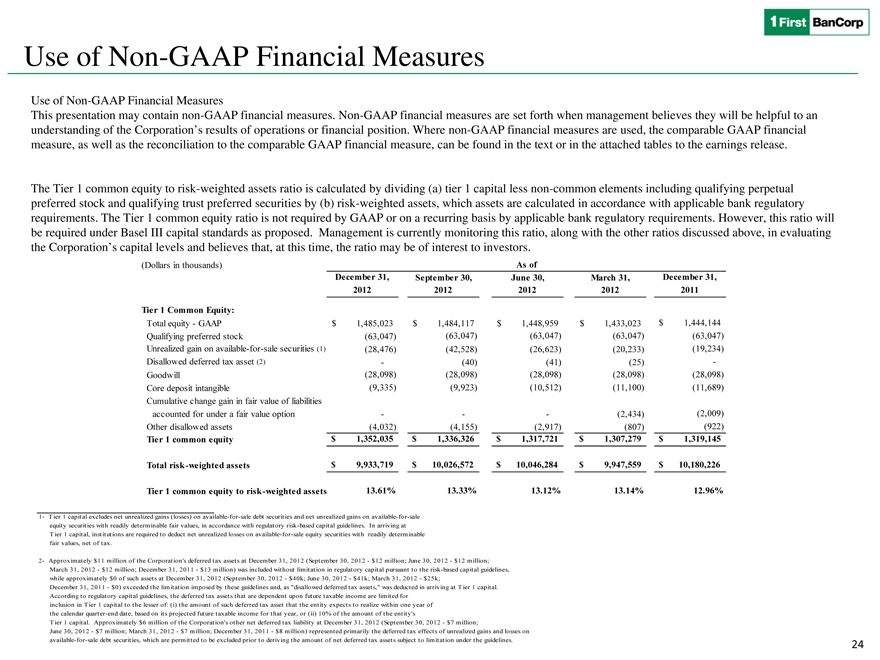
Use of Non-GAAP Financial Measures
Use of Non-GAAP Financial Measures
This presentation may contain non-GAAP financial measures. Non-GAAP financial measures are set forth when management believes they will be helpful to an understanding of the Corporation’s results of operations or financial position. Where non-GAAP financial measures are used, the comparable GAAP financial measure, as well as the reconciliation to the comparable GAAP financial measure, can be found in the text or in the attached tables to the earnings release.
The Tier 1 common equity to risk-weighted assets ratio is calculated by dividing (a) tier 1 capital less non-common elements including qualifying perpetual preferred stock and qualifying trust preferred securities by (b) risk-weighted assets, which assets are calculated in accordance with applicable bank regulatory requirements. The Tier 1 common equity ratio is not required by GAAP or on a recurring basis by applicable bank regulatory requirements. However, this ratio will be required under Basel III capital standards as proposed. Management is currently monitoring this ratio, along with the other ratios discussed above, in evaluating the Corporation’s capital levels and believes that, at this time, the ratio may be of interest to investors.
(Dollars in thousands)
As of
December 31,
September 30,
June 30,
March 31,
December 31,
2012
2012
2012
2012
2011
Tier 1 Common Equity:
Total equity - GAAP
$ 1,485,023
$ 1,484,117
$ 1,448,959
$ 1,433,023
$ 1,444,144
Qualifying preferred stock
(63,047)
(63,047)
(63,047)
(63,047)
(63,047)
Unrealized gain on available-for-sale securities (1)
(28,476)
(42,528)
(26,623)
(20,233)
(19,234)
Disallowed deferred tax asset (2)
-
(40)
(41)
(25)
-
Goodwill
(28,098)
(28,098)
(28,098)
(28,098)
(28,098)
Core deposit intangible
(9,335)
(9,923)
(10,512)
(11,100)
(11,689)
Cumulative change gain in fair value of liabilities
accounted for under a fair value option
(2,434)
(2,009)
Other disallowed assets
(4,032)
(4,155)
(2,917)
(807)
(922)
Tier 1 common equity
$ 1,352,035
$ 1,336,326
$ 1,317,721
$ 1,307,279
$ 1,319,145
Total risk -weighted assets
$ 9,933,719
$ 10,026,572
$ 10,046,284p
$ 9,947,559
$ 10,180,226
Tier 1 common equity to risk -weighted assets
13.61%
13.33%
13.12%
13.14%
12.96%
1-
Tier 1 capital excludes net unrealized gains (losses) on available-for-sale debt securities and net unrealized gains on available-for-sale
equity securities with readily determinable fair values, in accordance with regulatory risk-based capital guidelines. In arriving at
Tier 1 capital, institutions are required to deduct net unrealized losses on available-for-sale equity securities with readily determinable
fair values, net of tax.
2-
Approximately $11 million of the Corporation’s deferred tax assets at December 31, 2012 (September 30, 2012 - $12 million; June 30, 2012 - $12 million;
March 31, 2012 - $12 million; December 31, 2011 - $13 million) was included without limitation in regulatory capital pursuant to the risk-based capital guidelines,
while approximately $0 of such assets at December 31, 2012 (September 30, 2012 - $40k; June 30, 2012 - $41k; March 31, 2012 - $25k;
December 31, 2011 - $0) exceeded the limitation imposed by these guidelines and, as “disallowed deferred tax assets,” was deducted in arriving at Tier 1 capital.
According to regulatory capital guidelines, the deferred tax assets that are dependent upon future taxable income are limited for
inclusion in Tier 1 capital to the lesser of: (i) the amount of such deferred tax asset that the entity expects to realize within one year of
the calendar quarter-end date, based on its projected future taxable income for that year, or (ii) 10% of the amount of the entity’s
Tier 1 capital. Approximately $6 million of the Corporation’s other net deferred tax liability at December 31, 2012 (September 30, 2012 - $7 million;
June 30, 2012 - $7 million; March 31, 2012 - $7 million; December 31, 2011 - $8 million) represented primarily the deferred tax effects of unrealized gains and losses on
available-for-sale debt securities, which are permitted to be excluded prior to deriving the amount of net deferred tax assets subject to limitation under the guidelines.
Use of Non-GAAP Financial Measures
Use of Non-GAAP Financial Measures
This presentation may contain non-GAAP financial measures. Non-GAAP financial measures are set forth when management believes they will be helpful to an understanding of the Corporation’s results of operations or financial position. Where non-GAAP financial measures are used, the comparable GAAP financial measure, as well as the reconciliation to the comparable GAAP financial measure, can be found in the text or in the attached tables to the earnings release.
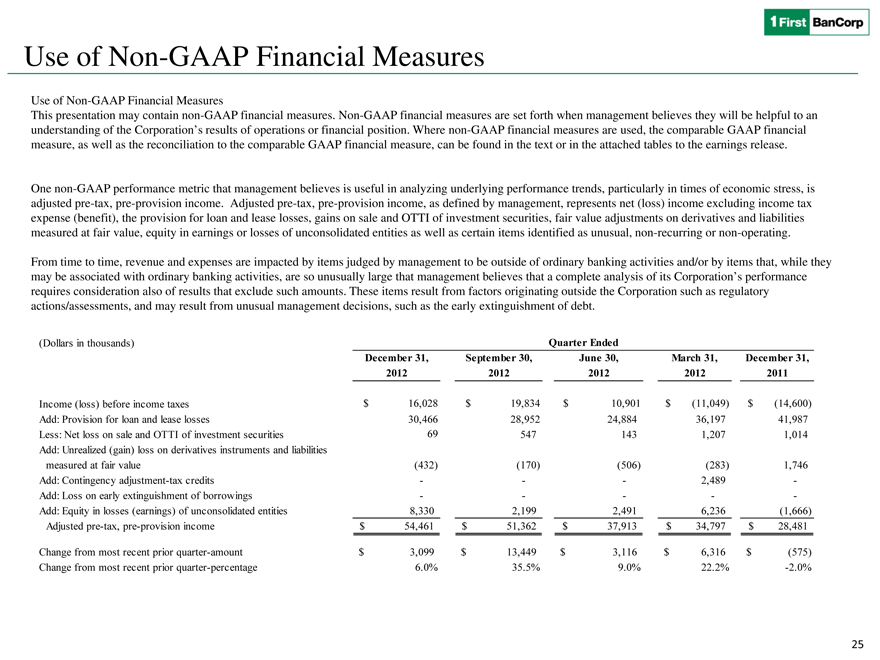
One non-GAAP performance metric that management believes is useful in analyzing underlying performance trends, particularly in times of economic stress, is adjusted pre-tax, pre-provision income. Adjusted pre-tax, pre-provision income, as defined by management, represents net (loss) income excluding income tax expense (benefit), the provision for loan and lease losses, gains on sale and OTTI of investment securities, fair value adjustments on derivatives and liabilities measured at fair value, equity in earnings or losses of unconsolidated entities as well as certain items identified as unusual, non-recurring or non-operating.
From time to time, revenue and expenses are impacted by items judged by management to be outside of ordinary banking activities and/or by items that, while they may be associated with ordinary banking activities, are so unusually large that management believes that a complete analysis of its Corporation’s performance requires consideration also of results that exclude such amounts. These items result from factors originating outside the Corporation such as regulatory actions/assessments, and may result from unusual management decisions, such as the early extinguishment of debt.
(Dollars in thousands)
Quarter Ended
December 31,
September 30,
June 30,
March 31,
December 31,
2012
2012
2012
2012
2011
Income (loss) before income taxes
$
16,028
$
19,834
$
10,901
$ (11,049)
$
(14,600)
Add: Provision for loan and lease losses
30,466
28,952
24,884
36,197
41,987
Less: Net loss on sale and OTTI of investment securities
69
547
143
1,207
1,014
Add: Unrealized (gain) loss on derivatives instruments and liabilities
measured at fair value
(432)
(170)
(506)
(283)
1,746
Add: Contingency adjustment-tax credits
-
-
-
2,489
-
Add: Loss on early extinguishment of borrowings
-
-
-
-
-
Add: Equity in losses (earnings) of unconsolidated entities
8,330
2,199
2,491
6,236
(1,666)
Adjusted pre-tax, pre-provision income
$
54,461
$
51,362
$
37,913
$ 34,797
$
28,481
Change from most recent prior quarter-amount
$
3,099
$
13,449
$
3,116
$ 6,316
$
(575)
Change from most recent prior quarter-percentage
6.0%
35.5%
9.0%
22.2%
-2.0%
25