Investor Presentation Investor Presentation July 2013 July 2013 Exhibit 99.1 |
Disclaimer 2 This presentation contains “forward-looking statements” concerning First BanCorp’s (the “Corporation”) future economic performance. The words or phrases “would be,” “will allow,” “intends to,” “will likely result,” “are expected to,” “expect,” “anticipate,” “look forward,” “should,” “believes” and similar expressions are meant to identify “forward-looking statements” within the meaning of Section 27A of the Private Securities Litigation Reform Act of 1995, and are subject to the safe harbor created by such section. The Corporation wishes to caution readers not to place undue reliance on any such “forward-looking statements,” which speak only as of the date made, and to advise readers that various factors, including, but not limited to, uncertainty about whether the Corporation and FirstBank Puerto Rico (“FirstBank” or “the Bank”) will be able to fully comply with the written agreement dated June 3, 2010 that the Corporation entered into with the Federal Reserve Bank of New York (the “FED”) and the order dated June 2, 2010 (the “Order”) that FirstBank entered into with the FDIC and the Office of the Commissioner of Financial Institutions of Puerto Rico that, among other things, require FirstBank to maintain certain capital levels and reduce its special mention, classified, delinquent and non-performing assets; the risk of being subject to possible additional regulatory actions; uncertainty as to the availability of certain funding sources, such as retail brokered CDs; the Corporation’s reliance on brokered CDs and its ability to obtain, on a periodic basis, approval from the FDIC to issue brokered CDs to fund operations and provide liquidity in accordance with the terms of the Order; the risk of not being able to fulfill the Corporation’s cash obligations or resume paying dividends to the Corporation’s stockholders in the future due to the Corporation’s inability to receive approval from the FED to receive dividends from FirstBank or FirstBank’s failure to generate sufficient cash flow to make a dividend payment to the Corporation; the strength or weakness of the real estate markets and of the consumer and commercial credit sectors and their impact on the credit quality of the Corporation’s loans and other assets, including the Corporation’s construction and commercial real estate loan portfolios, which have contributed and may continue to contribute to, among other things, the high levels of non-performing assets, charge-offs and the provision expense and may subject the Corporation to further risk from loan defaults and foreclosures; adverse changes in general economic conditions in the United States and in Puerto Rico, including the interest rate scenario, market liquidity, housing absorption rates, real estate prices and disruptions in the U.S. capital markets, which may reduce interest margins, impact funding sources and affect demand for all of the Corporation’s products and services and the value of the Corporation’s assets; an adverse change in the Corporation’s ability to attract new clients and retain existing ones; a decrease in demand for the Corporation’s products and services and lower revenues and earnings because of the continued recession in Puerto Rico and the current fiscal problems and budget deficit of the Puerto Rico government; uncertainty about regulatory and legislative changes for financial services companies in Puerto Rico, the United States and the U.S. and British Virgin Islands, which could affect the Corporation’s financial performance and could cause the Corporation’s actual results for future periods to differ materially from prior results and anticipated or projected results; uncertainty about the effectiveness of the various actions undertaken to stimulate the United States economy and stabilize the United States’ financial markets, and the impact such actions may have on the Corporation’s business, financial condition and results of operations; changes in the fiscal and monetary policies and regulations of the federal government, including those determined by the Federal Reserve System, the FDIC, government-sponsored housing agencies and regulators in Puerto Rico and the U.S. and British Virgin Islands; the risk of possible failure or circumvention of controls and procedures and the risk that the Corporation’s risk management policies may not be adequate; the risk that the FDIC may further increase the deposit insurance premium and/or require special assessments to replenish its insurance fund, causing an additional increase in the Corporation’s non-interest expense; risks of not being able to recover the assets pledged to Lehman Brothers Special Financing, Inc.; the impact on the Corporation’s results of operations and financial condition associated with acquisitions and dispositions; a need to recognize additional impairments on financial instruments or goodwill relating to acquisitions; risks that downgrades in the credit ratings of the Corporation’s long-term senior debt will adversely affect the Corporation’s ability to access necessary external funds; the impact of the Dodd-Frank Wall Street Reform and Consumer Protection Act on the Corporation’s businesses, business practices and cost of operations; and general competitive factors and industry consolidation. The Corporation does not undertake, and specifically disclaims any obligation, to update any “forward-looking statements” to reflect occurrences or unanticipated events or circumstances after the date of such statements except as required by the federal securities laws. Investors should refer to the Corporation’s Annual Report on Form 10-K for the year ended December 31, 2012 for a discussion of such factors and certain risks and uncertainties to which the Corporation is subject. |
Franchise Overview Founded in 1948 (65 years) Headquartered in San Juan, Puerto Rico with operations in PR, Eastern Caribbean (Virgin Islands) and Florida A well diversified operation with over 650,000 retail & commercial customers 2nd largest financial holding company in Puerto Rico with attractive business mix and substantial loan market share The largest bank in the Virgin Islands with over 40% market share Small presence in Florida serving south Florida region 151 ATM machines and largest ATM network in the Eastern Caribbean Region ~2,500 FTE employees As of June 30, 2013 Eastern Caribbean Region or ECR includes United States and British Virgin Islands FTE = Full Time Equivalent Well diversified with significant competitive strengths 3 Total Assets - $12.8B Total Loans - $9.7B Total Deposits - $10.0B 13 bank branches 1 Loan Production Office Florida: 7% of Assets 14 bank branches 3 First Express branches Eastern Caribbean: 7% of Assets |
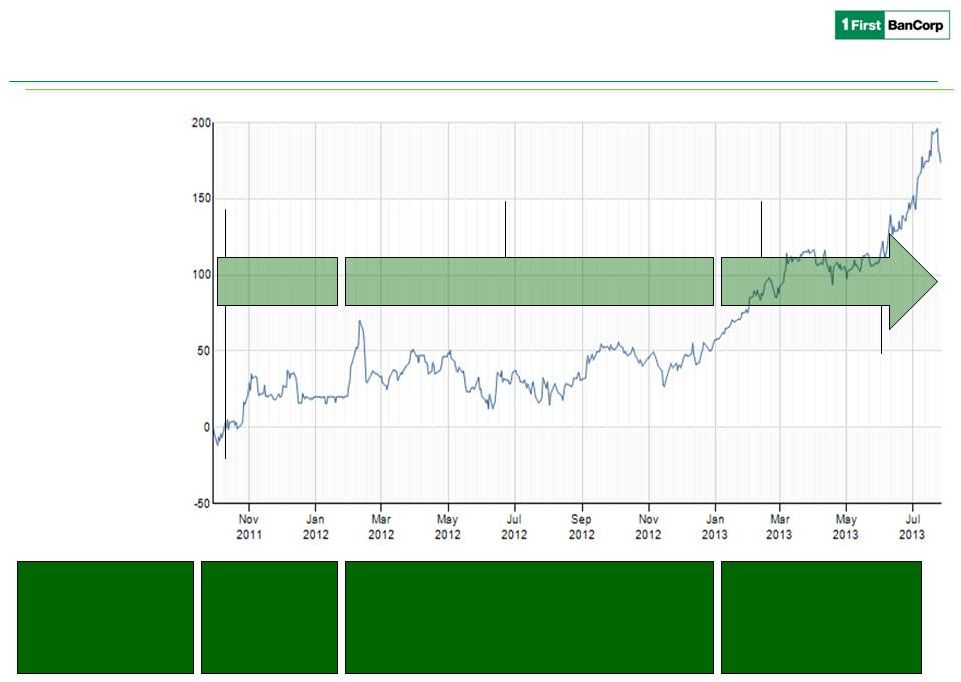
Franchise Overview Our Turnaround Story 2H 2011 2012 1H 2013 June 3, 2010, First BanCorp entered into the Written Agreement with the FED July 20, 2010, the U.S. Treasury exchanged TARP for preferred, which the FBP could compel conversion upon completion of capital raise August 30, 2010, completed exchange of 89% Series A-E Noncumulative Perpetual Preferred Stock for Common During 2010 & 2011, the Company initiated Strategic Plan focused on the following initiatives: org. restructuring, increasing capital, de-risking balance sheet, enhancing franchise value and the strength governance & risk mgmt January 7, 2011, one-for- fifteen reverse stock split of all outstanding shares of its common stock February 16, 2011, the Corporation sold loans with a book value of $270 million to a joint venture with Goldman & CPG On March 7, 2011, FBP continued de-risking and de-leveraging and sold approximately $330 million of MBS intended to be held to maturity. Compelled the conversion of the 424,174 shares of the Corporation’s Series G Preferred Stock, held by the U.S. Treasury, into 32.9 million shares of common stock During 2H 2011, continued deleveraging and de-risking strategies. October 2011, completed a $525 million capital raise and converted the UST to common stock. May 30, 2012, the Corporation reentered the credit card business with the acquisition of an approximate $406 million portfolio of FirstBank-branded credit cards from FIA. Post capital raise, the Company shifted from a defensive to offensive posture. The Company returned to profitability in 2012 and generated $179 million in pre-provision pre-tax income, a 38% increase compared to 2011. Through organic workouts the Company reduced NPAs by $99mm & NPLs by $165mm. During the first quarter of 2013, the Corporation entered into three separate agreements to sell classified and non-performing loans with an aggregate carrying value of approximately $309.7 million. June 2013, announced the write-off of $66.6 million collateral pledged to Lehman , the bulk sale of a non- performing pool of residential loans with book value of $203.8 million, as well as $19.2 million of OREO for $128.3 million in an all cash transaction. 2013 NPAs are down over $1 billion, or 58%, since the peak in Q1 10. Capital ratios strong: Total RBC Ratio 16.6%; Tier 1 Capital Ratio 15.3%; and Leverage Ratio 11.3%. DTA of $523 million. On October 7, 2011, the Corporation successfully completed a private placement of $525 million in shares of common stock - Lead investors include funds affiliated with Thomas H. Lee Partners & Oaktree Capital Management. 4 During 2011, as part of de- leveraging sold $518 million of performing residential mortgages. |
5 Core Franchise is Strong Effectively executing Strategic Plan towards Profitability Management focused on continued strengthening of the franchise and executing on profitability levers Franchise Value Pre-tax pre-provision income $86.4 million YTD 2013 up 19% from 1H 2012 Stable Net Interest Margin 4.06% in 6 months ended 2013 compared to 3.37% for the six months ended June 30, 2012 Expanding products mix and maximizing cross-selling opportunities Growing core deposits up $205 million in 2013 Reenergized loan production $1.8 billion originations 1H13 vs. $1.4 billion 1H12 Optimizing expenses; continued focus on operational excellence Capital Strong capital base, growing through earnings generation, to support continued execution of Strategic Plan. $523 million Deferred Tax Asset Valuation Allowance. Risk Management Proactive approach to risk management In compliance with Regulatory Agreements Enhanced BOD talent with additional financial and risk management expertise Balance Sheet Improving risk profile; focusing on reducing NPAs • Completed two bulk sales of adversely classified loans and OREO properties with total book value of $441 million in first half of 2013 • NPAs decreased for the 13 consecutive quarter • NPAs down 39% or $486 million YTD 2013 Executing on opportunities to reduce cost of funds • $1.8 billion brokered CDs maturing in twelve months at average rate of 1.28% th |
Franchise Overview Source: PR Market Share Report prepared with data provided by the Commissioner of Financial Institutions of Puerto Rico as of 3/31/13. Unique challenger to Puerto Rico’s largest player 6 Puerto Rico Total Assets Puerto Rico Total Loans Puerto Rico Deposits, Net of Brokered ($ in millions) Strong and uniquely positioned market franchise in densely populated operating footprints Strong market share in loan portfolios facilitates customer relationship expansion and cross sell to increase deposit share Banking Branches Wholesale Banking Retail Banking Consumer Lending 2 Mortgage Banking Insurance Retail Brokerage 3 Wholesale Brokerage 4 1 Puerto Rico only; 2 FirstBank acquired the FirstBank-branded credit card portfolio of $391MM book balance as of June 30, 2012; 3 Provided through alliance with UBS; 4 Established primarily for municipal financing 1 1 1 Puerto Rico ECR Florida 47 14 13 Portfolio Balance Market Share Portfolio Balance Market Share Portfolio Balance Market Share 1 Banco Popular $ 26,171 39.4% 1 Banco Popular $ 19,586 38.1% 1 Banco Popular $ 17,460 43.6% 2 FirstBank 9,879 14.9% 2 FirstBank 8,313 16.2% 2 Banco Santander 5,672 14.2% 3 Oriental Bank 7,489 11.3% 3 Scotiabank 5,481 10.7% 3 Oriental Bank 4,733 11.8% 4 Banco Santander 7,091 10.7% 4 Oriental Bank 5,302 10.3% 4 FirstBank 3,752 9.4% 5 Scotiabank 7,060 10.6% 5 Banco Santander 5,207 10.1% 5 Scotiabank 3,358 8.4% 6 Doral Bank 5,470 8.2% 6 Doral Bank 3,928 7.6% 6 Citibank 2,702 6.7% 7 Citibank 2,705 4.1% 7 Other 2,667 5.2% 7 Doral Bank 1,951 4.9% 8 Banco Cooperativo 514 0.8% 8 Citibank 746 1.5% 8 Banco Cooperativo 435 1.1% 9 BBU 9 0.0% 9 Banco Cooperativo 203 0.4% 9 BBU 21 0.1% Total 66,390 $ 100% Total 51,433 $ 100% Total 40,084 $ 100% Institutions Institutions Institutions |
Dec-09 Mar-13 Rank 18% 2 9% 4 21% 2 17% 3 22% 2 16% 2 6% 4 20% 2 2% 6 3% 3 8% 4 5% 4 10% 4 10% 4 15% 8% 20% 14% 19% 20% 14% 19% 10% 11% 10% 7% 9% 12% 85% 92% 80% 86% 81% 80% 86% 81% 90% 89% 90% 93% 91% 88% Assets Personal Loans Commercial Loans Construction Auto/Leasing Small Personal Loans Mortgage Originations Credit Cards ACH Transactions POS Terminals ATM Terminals Debit Cards Deposits Branches FirstBank Building Franchise Value Targeted strategies for growth 7 Puerto Rico Opportunities for ongoing market share gains on selected products based on fair share of market Largest opportunity on deposit products, electronic banking & transaction services Selected loan products growth for balanced risk/return to manage risk concentration and diversify income sources Acquired FirstBank-branded credit card portfolio from FIA Card Services, N.A. Diversifies revenue stream and loan portfolio composition Opportunity to broaden and deepen relationships Florida Expansion prospects in Florida given long term demographic trends Continue focus in core deposit growth, commercial and transaction banking and conforming residential mortgages Virgin Islands Solidify leadership position by further increasing customer share of wallet 1 Puerto Rico only Source: Office of the Commissioner of Financial Institutions of Puerto Rico as of 3/31/13 and internal reports; commercial loans include loans collateralized by real estate Market Share in Main Market 1 |
1 Total Deposits excluding Brokered CDs Building Franchise Value Successful deposits growth over recent years 8 ($ in millions) Core Deposits Total Deposit Composition Cost of Deposits Core deposit growth strategy continues providing positive results; $1.5B since 2009 Focus remains on cross-selling opportunities Cost of interest bearing deposits, net of brokered CDs, decreased to 0.93% Reduced reliance on brokered CDs – 33% of deposits are brokered CDs, down from 60% in 2009 $1.8 billion brokered CDs maturing in twelve months at average rate of 1.28% 1 1 |
Well Diversified Loan Portfolio Continued focus on revenue generation through growth in Consumer and Residential Mortgage market share & rebuilding Commercial portfolio. Strong origination activity at $1 billion for Q2 13: Residential mortgages originations increased $33 million Consumer loans originations increased $33 million • Auto loan originations increased $11 million • Personal loan originations increased $13 million • Credit card utilization activity of $96 million Strong Origination Capabilities 9 ($ in millions) Loan Portfolio Asset Composition Loan Originations Loans Held for Sale Commercial Construction Consumer & Finance Leases Residential Mortgage 1 Originations including refinancings and draws from existing revolving and non-revolving commitments 1 |
Focus on Strategic Plan Rebuild earnings and de-risk Balance Sheet 10 ($ in millions, except per share results) 2Q 2013 Highlights Net loss of $122.6 million, or $0.60 per diluted share, including a $72.9 million loss related to the bulk sale of assets and $66.6 million loss related to the write-off of assets pledged as collateral with Lehman. Adjusted net income of $16.8 million, or $0.08 per diluted share, excluding the aforementioned items. Net interest margin increased by 8 basis points to 4.04%; 58 basis point increase YoY driven by further reductions in funding costs. Completed the bulk sale of a nonperforming pool of residential loans with book value of $203.8 million, as well as $19.2 million of OREO for $128.3 million in an all cash transaction. Completed sale of $40.8 million non-performing commercial mortgage loan (one of two transactions moved to held for sale status in Q1) without incurring in additional losses. Capital remains strong with total capital ratio, tier 1 and leverage of 16.6%, 15.3% and 11.3%, respectively Expect credit related expenses for the second half of 2013 to be lower than the first half by approximately $10 million Income Statement 2Q 2012 3Q 2012 4Q 2012 1Q 2013 2Q 2013 GAAP Net Interest Income 108.7 $ 125.5 $ 125.6 $ 124.5 $ 126.9 $ Provision for loan and lease losses 24.9 29.0 30.5 111.1 87.5 Non-interest income 16.5 17.3 20.1 19.1 14.3 Impairment of collateral pledged to Lehman (66.6) Equity in (losses) gains of unconsolidated entities (2.5) (2.2) (8.3) (5.5) 0.6 Non-interest expense 86.9 91.8 90.9 98.0 111.3 Pre-tax net income (loss) 10.9 19.8 16.0 (71.0) (123.6) Income tax (expense) benefit (1.5) (0.8) (1.5) (1.6) 1.0 Net income (loss) 9.4 $ 19.1 $ 14.5 $ (72.6) $ (122.6) $ Adjusted Pre-tax pre-provision earnings 37.9 $ 51.4 $ 54.5 $ 50.5 $ 35.9 $ Net Interest Margin, (GAAP) (%) 3.46% 3.98% 3.91% 3.96% 4.04% Net income (loss) per common share-basic 0.05 $ 0.09 $ 0.07 $ (0.35) $ �� (0.60) $ |
1,639 506 1,790 1,087 752 $- $1,800 1Q 2Q 3Q 4Q 1Q 2Q 3Q 4Q 1Q 2Q 3Q 4Q 1Q 2Q Loans Held for Sale Repossessed Assets & Other NPLs Held for Investment Improving Risk Profile 11 ($ in millions) Net Charge-offs Non-performing Assets 1) In 2010 there were $165 million of net charge-offs associated with the bulk sale to CPG. Excluding the bulk sale net charge-offs for 2010 were $444 million. 2) June 30, 2013. 3) Net Carrying Amount = % of carrying value net of reserves and accumulated charge-offs NPAs are down over $1 billion, or 58%, since the peak in Q1 10. Total NPLs are also down over $1 billion, or 73%, since the peak in Q1 10. 1 st Half of 12013: Completed a bulk sale of adversely classified loans and OREO properties with a book value of $217.7 million, including $185.0 million of non-performing assets, for $120.2 million in a cash transaction. Resulting net charge- offs $98.5 million. Transferred $181.6 million of loans to held for sale resulting in net charge-offs of $36.0 million. Completed sale of a $40.8 million loan held for sale. Completed a bulk sale of nonperforming residential loans with book value of $203.8 million, as well as $19.2 million of OREO, for $128.3 million in a cash transaction. Resulting net charge-offs $98.0 million. Recorded a non-cash charge of $66.6 million associated with the write-off of the carrying value and accrued interest for securities pledged to Lehman. 2010 2011 2012 2013 Excl. Bulk Sales Product Book Value Accumulated Charge-offs Reserves Net Carrying Amount 3 C & I $129.1 $45.1 $28.2 57.9% CRE 177.6 42.9 29.7 67.1% Construction 125.1 104.5 15.6 47.7% Total $431.8 $192.5 $73.5 57.4% Commercial Non-performing Loans (includes HFS) 2 Proactively Managing Asset Quality |
12 Capital Position and Asset Quality Asset quality remains our number one focus, while preserving and growing capital. Strong capital position: Total capital, Tier 1 capital and Leverage ratios of the Corporation of 16.6%, 15.3% and 11.3%, respectively. $523 million Deferred Tax Asset Valuation Allowance. Core Franchise is Strong 9.5% NPAs / Assets 8.4% 5.9% 13.3% Total Capital Ratio 17.4% 16.6% 12.0% Tier 1 Capital Ratio 16.2% 15.3% 8.4% Leverage Ratio 12.1% 11.3% 0.0% 6.0% 12.0% 18.0% Q1 10 Q2 10 Q3 10 Q4 10 Q1 11 Q2 11 Q3 11 Q4 11 Q1 12 Q2 12 Q3 12 Q4 12 Q1 13 Q2 13 |
13 We are confident in the strength of our core franchise and in our ability to successfully execute on our strategic plan. Investment Opportunity Focus on execution of our Strategic Plan & Drivers for Improved Profitability: Asset Quality remains our number one focus and our Special Assets group continues to make progress. We will continue to closely manage our NPA book. As NPAs continue to roll-off, we will re-deploy thorough growth in higher yielding consumer, residential and commercial loan portfolio. Profitability $86.4 million of pre-tax pre-provision income for YTD 2013 compared to $72.7 million same period 2012; Stable Net Interest Margin of 4.06% YTD 2013. Continued focus on reduction in funding costs, optimization of expense base and growth in noninterest income. Loan Portfolio focus on solid relationships with core balances toward achieving loan portfolio growth. Origination activity over $1.8 billion YTD 2013. Core Deposits continue to grow, up $205 million YTD 2013, as we cross-sell with new and enhanced product offering while reducing our reliance on brokered CDs. – – – – Core Franchise is Strong |
Exhibits Exhibits Investor Presentation Investor Presentation July 2013 July 2013 |
15 Stock Profile Trading Symbol: • FBP Exchange: • NYSE Share Price (7/26/13): • $7.96 Shares Outstanding: • 206,982,105 Market Capitalization (7/26/13): • $1.65 Billion 1 Yr. Average Daily Volume: • 374,127 Price (7/26/13) to Tangible Book (6/30/13): • 1.50x Beneficial Owner Amount Percent of Class Entities affiliated with Thomas H. Lee Partners, L.P. 50,684,485 24.59% Entities affiliated with Oaktree Capital Management, L.P. 50,684,485 24.59% Wellington Management Company, LLP. 20,336,087 9.87% United States Department of the Treasury¹ 34,227,696 16.50% 5% or more Beneficial Ownership 1 Includes the U.S. Treasury warrant that entitles it to purchase up to 1,285,899 shares of Common Stock at an exercise price of $3.29 per share, as adjusted as a result of the issuance of shares of Common Stock in the Corporation’s recently completed $525MMprivate placement of Common Stock (the “Capital Raise”). The exercise price and the number of shares issuable upon exercise of the warrant are subject to further adjustments under certain circumstances to prevent dilution. The warrant has a 10-year term from its issue date and is exercisable in whole or in part at any time. |
16 Economic Activity Adopted Fiscal Measures Puerto Rico’s Planning Board most recent economic growth projections of -0.4% and 0.2% for FY 2013 and FY 2014, respectively. The Government Development Bank’s Economic Activity Index (EAI) for the month of May 2013 reflected a 3.4% decline compared to May 2012. EAI fiscal year-to-date as of May 2013 reflected a reduction of 0.5% compared to the same period during previous fiscal year. Employment • June 2013 unemployment rate of 13.2% compared to June 2012 of 14.1% • Average unemployment rate for FY 2013 was 14.1% compared to 15.2% during the same period for FY 2014. Tourism • Recent tourism activity showing marked improvement as hotel registrations were up 6.7% for the first eight months of FY 2013 compared to same period on previous year. • Hotel occupancy rate of 69.9% for the first eight months of FY 2013 up compared to average occupancy rate of 68.6% during previous three fiscal years. Public Private Partnerships (PPPs) On June 26, 2013, the Board of Directors of the Puerto Rico Public-Private Partnerships Authority (PPPA) announced plans to move forward with the evaluation of strategic infrastructure projects including a commuter train from San Juan to Caguas, new correctional facilities, and key natural gas conversion projects at PREPA’s main generating plants. Critical measures adopted by government to safeguard Puerto Rico’s general obligations credit rating: • Extension of excise tax on multinational foreign corporations (Act 154 of 2010) for five year period – significant source of revenue for General Fund. • Enacted meaningful Pension Reform to address unfunded liability of major public pension system. • Adopted revenue enhancement measures to curtail operational deficits at major public corporations and utilities (i.e. Aqueduct and Sewer Authority and Highways and Transportation Authority) to address continued needed financial support from GDB. Adopted FY 2014 Budget and General Fund Structural Deficit On June 30, 2013, the Puerto Rico Government approved Act No. 40, which amended the Puerto Rico Internal Revenue Code of 2011, and Act No. 46 bringing several changes, among others: • Modification to sales and use tax regime (business-to-business) • New national gross receipts tax • Higher AMT rate Adopted budget reduces projected general fund deficit to $820 million, or 8.6% of projected revenues, down from estimated $1.3 billion deficit as of end of FY 2013 and lowest projected deficit compared to previous five fiscal years. Budgeted revenue base for FY 2014 is expected to increase $1.380 billion as a result of adopted legislation to address structural deficit. Puerto Rico Market |
Non-performing Assets 1 Collateral pledged with Lehman Brothers Special Financing, Inc. 17 ($ in millions) 2009 2010 2011 2012 6/30/2013 Non-performing loans held for investment: Residential mortgage 441,642 $ 392,134 $ 338,208 $ 313,626 $ 133,937 $ Commercial mortgage 196,535 217,165 240,414 214,780 136,737 Commercial & industrial 241,316 317,243 270,171 230,090 131,906 Construction 634,329 263,056 250,022 178,190 68,204 Consumer & finance leases 50,041 49,391 39,547 38,875 35,416 Total non-performing loans held for investment 1,563,863 1,238,989 1,138,362 975,561 506,200 OREO 69,304 84,897 114,292 185,764 139,257 Other repossessed property 12,898 14,023 15,392 10,107 11,503 Other assets (1) 64,543 64,543 64,543 64,543 - Total non-performing assets, excluding loans held for sale 1,710,608 1,402,452 1,332,589 1,235,975 656,960 Non-performing loans held for sale - 159,321 4,764 2,243 94,951 Total non-performing assets 1,710,608 $ 1,561,773 $ 1,337,353 $ 1,238,218 $ 751,911 $ |
18 Adjusted Pre-tax, Pre-provision Income Reconciliation ($ in thousands) 2Q 2012 3Q 2012 4Q 2012 1Q 2013 2Q 2013 Income (loss) before income taxes 10,901 $ 19,834 $ 16,028 $ (71,011) $ (123,562) $ Add: Provision for loan and lease losses 24,884 28,952 30,466 111,123 87,464 Add: Net loss on investments and impairments 143 547 69 117 42 Less: Unrealized gain (loss) on derivatives instruments and liabilities measured at fair value (506) (170) (432) (400) (708) Add: Bulk sales related expenses and other professional fees related to the terminated preferred stock exchange offer - - - 5,096 3,198 Add: Loss on certain OREO properties sold as part of the bulk sale of non-performing residential mortgage assets - - - - 1,879 Add: National gross tax receipts tax corresponding to Q1 2013 recorded during Q2 2013 after enactment - - - - 1,656 Add: write-off of collateral pledged to Lehman - - - - 66,574 Add: Equity in losses (earnings) of unconsolidated entities 2,491 2,199 8,330 5,538 (648) Adjusted Pre-tax, pre-provision income 37,913 $ 51,362 $ 54,461 $ 50,463 $ 35,895 $ Quarter Ended |
19 Increase of $8.1 million in credit related expenses: – $1.9 million loss on OREO sales as part of the bulk sale transaction – $5.3 million in fair value adjustment of almost all commercial OREOs in the VI $3.2 million impact of new tax on gross revenues enacted by the PR tax authorities. Includes $1.7 million retroactive impact from Q1 13. Increase of $2.7 million in outsourcing technology services to FIS, partially offset by savings of $1.8 million in compensation expense and computer applications maintenance fees through the relationship with FIS. ($ in millions) Q1 13 Q2 13 Credit related expenses 9.2 $ 17.3 $ Bulk sale professional fees 3.9 3.1 Terminated preferred stock exchange 1.1 0.1 Outsourcing technology services 1.3 4.3 Taxes other than income tax 3.0 6.2 All other expenses 79.5 80.3 Total 98.0 $ 111.3 $ Results of Operations – Operating Expenses |