Exhibit 99.1
|

First BanCorp Investor Presentation
May 2014
|
Disclaimer
This presentation may contain “forward-looking statements” concerning the Corporation’s future economic performance. The words or phrases “expect,” “anticipate,” “look forward,” “should,” “believes” and similar expressions are meant to identify “forward-looking statements” within the meaning of Section 27A of the Securities Act of 1933, as amended, and Section 21E of the Securities Exchange Act of 1934, as amended, and are subject to the safe harbor created by such sections. The Corporation wishes to caution readers not to place undue reliance on any such “forward-looking statements,” which speak only as of the date made, and to advise readers that various factors, including, but not limited to, the following could cause actual results to differ materially from those expressed in, or implied by such forward-looking statements: uncertainty about whether the Corporation and FirstBank will be able to fully comply with the written agreement dated June 3, 2010 that the Corporation entered into with the Federal Reserve Bank of New York (the “New York Fed”) and the consent order dated June 2, 2010 that FirstBank entered into with the FDIC and the Office of the Commissioner of Financial Institutions of the Commonwealth of Puerto Rico (the “FDIC Order”) that, among other things, require FirstBank to maintain certain capital levels and reduce its special mention, classified, delinquent, and non-performing assets; the risk of being subject to possible additional regulatory actions; uncertainty as to the availability of certain funding sources, such as brokered CDs; the Corporation’s reliance on brokered CDs and its ability to obtain, on a periodic basis, approval from the FDIC to issue brokered CDs to fund operations and provide liquidity in accordance with the terms of the FDIC Order; the risk of not being able to fulfill the Corporation’s cash obligations or resume paying dividends to the Corporation’s stockholders in the future due to the Corporation’s inability to receive approval from the New York Fed or the Board of Governors of the Federal Reserve System (“Federal Reserve Board”) to receive dividends from FirstBank or FirstBank’s failure to generate sufficient cash flow to make a dividend payment to the Corporation; the strength or weakness of the real estate markets and of the consumer and commercial credit sectors and their impact on the credit quality of the Corporation’s loans and other assets, which has contributed and may continue to contribute to, among other things, the high levels of non-performing assets, charge-offs, and provisions and may subject the Corporation to further risk from loan defaults and foreclosures; the ability of FirstBank to realize the benefit of the deferred tax asset; adverse changes in general economic conditions in Puerto Rico, the U.S., and the U.S. Virgin Islands and British Virgin Islands, including the interest rate environment, market liquidity, housing absorption rates, real estate prices, and disruptions in the U.S. capital markets, which may reduce interest margins, impact funding sources, and affect demand for all of the Corporation’s products and services and reduce the Corporation’s revenues, earnings, and the value of the Corporation’s assets; an adverse change in the Corporation’s ability to attract new clients and retain existing ones; a decrease in demand for the Corporation’s products and services and lower revenues and earnings because of the continued recession in Puerto Rico, the current fiscal problems and budget deficit of the Puerto Rico government and recent credit downgrades of the Puerto Rico government; a credit default by the Puerto Rico government or any of its public corporations or other instrumentalities, and recent and/or future downgrades of the long-term debt ratings of the Puerto Rico government, which could adversely affect economic conditions in Puerto Rico; the risk that any portion of the unrealized losses in the Corporation’s investment portfolio is determined to be other-than-temporary, including unrealized losses on Puerto Rico government obligations; uncertainty about regulatory and legislative changes for financial services companies in Puerto Rico, the U.S., and the U.S. Virgin Islands and British Virgin Islands, which could affect the Corporation’s financial condition or performance and could cause the Corporation’s actual results for future periods to differ materially from prior results and anticipated or projected results; changes in the fiscal and monetary policies and regulations of the federal government, including those determined by the Federal Reserve Board, the New York Fed, the FDIC, government-sponsored housing agencies, and regulators in Puerto Rico and the U.S. and British Virgin Islands; the risk of possible failure or circumvention of controls and procedures and the risk that the Corporation’s risk management policies may not be adequate; the risk that the FDIC may further increase the deposit insurance premium and/or require special assessments to replenish its insurance fund, causing an additional increase in the Corporation’s non-interest expenses; the impact on the Corporation’s results of operations and financial condition of acquisitions and dispositions; a need to recognize additional impairments on financial instruments, goodwill, or other intangible assets relating to acquisitions; the risks that downgrades in the credit ratings of the Corporation’s long-term senior debt will adversely affect the Corporation’s ability to access necessary external funds; the impact of the Dodd-Frank Wall Street Reform and Consumer Protection Act on the Corporation’s businesses, business practices, and cost of operations; the risk of losses in the value of investments in unconsolidated entities that the Corporation does not control; and general competitive factors and industry consolidation. The Corporation does not undertake, and specifically disclaims any obligation, to update any “forward-looking statements” to reflect occurrences or unanticipated events or circumstances after the date of such statements except as required by the federal securities laws.
1
|
Franchise Overview
Well diversified with significant competitive strengths
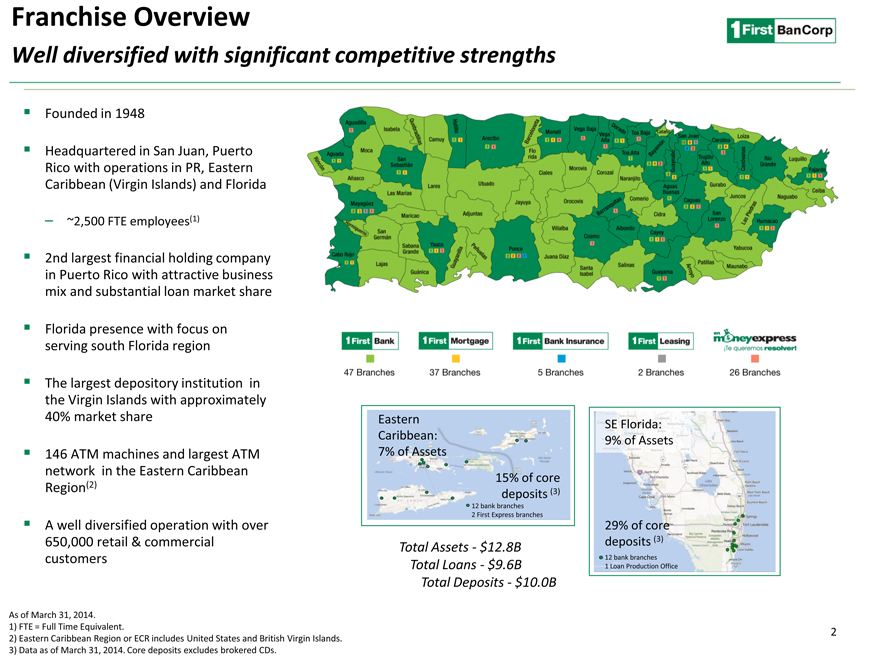
Founded in 1948
Headquartered in San Juan, Puerto Rico with operations in PR, Eastern Caribbean (Virgin Islands) and Florida
– ~2,500 FTE employees(1)
2nd largest financial holding company in Puerto Rico with attractive business mix and substantial loan market share
Florida presence with focus on serving south Florida region
The largest depository institution in the Virgin Islands with approximately 40% market share
146 ATM machines and largest ATM network in the Eastern Caribbean Region(2)
A well diversified operation with over 650,000 retail & commercial customers
Eastern SE Florida: Caribbean: 9% of Assets 7% of Assets
15% of core deposits (3)
12 bank branches 2 First Express branches
29% of core deposits (3)
Total Assets—$12.8B
12 bank branches Total Loans—$9.6B 1 Loan Production Office
Total Deposits—$10.0B
As of March 31, 2014.
1) FTE = Full Time Equivalent. 2
2) Eastern Caribbean Region or ECR includes United States and British Virgin Islands.
3) Data as of March 31, 2014. Core deposits excludes brokered CDs.
Franchise Overview
Well positioned Puerto Rico institution in a consolidating market
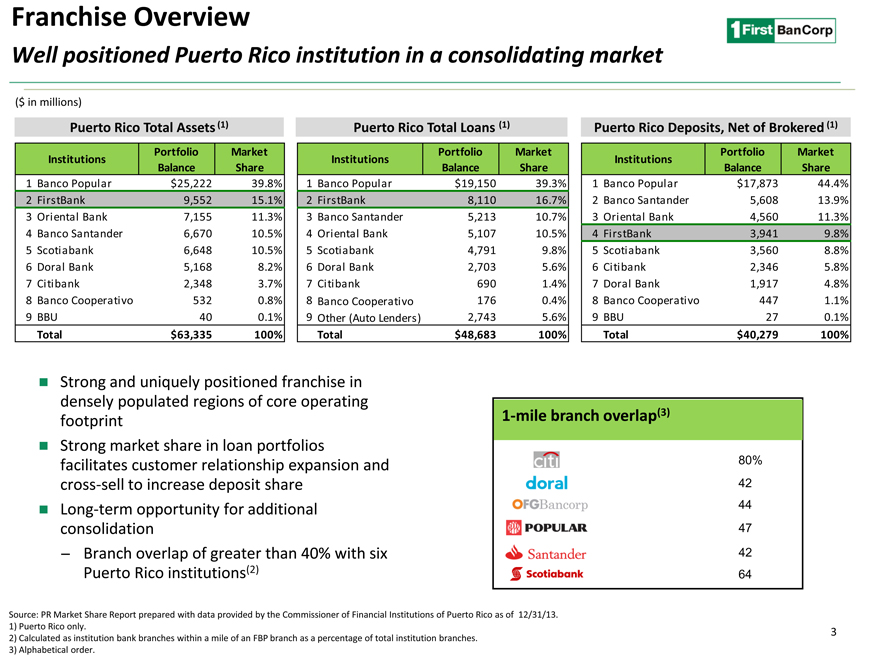
($ in millions)
Puerto Rico Total Assets (1) Puerto Rico Total Loans (1) Puerto Rico Deposits, Net of Brokered (1)
Portfolio Market Portfolio Market Portfolio Market
Institutions Institutions Institutions
Balance Share Balance Share Balance Share
1 Banco Popular $ 25,222 39.8% 1 Banco Popular $ 19,150 39.3% 1 Banco Popular $ 17,873 44.4%
2 FirstBank 9,552 15.1% 2 FirstBank 8,110 16.7% 2 Banco Santander 5,608 13.9%
3 Oriental Bank 7,155 11.3% 3 Banco Santander 5,213 10.7% 3 Oriental Bank 4,560 11.3%
4 Banco Santander 6,670 10.5% 4 Oriental Bank 5,107 10.5% 4 FirstBank 3,941 9.8%
5 Scotiabank 6,648 10.5% 5 Scotiabank 4,791 9.8% 5 Scotiabank 3,560 8.8%
6 Doral Bank 5,168 8.2% 6 Doral Bank 2,703 5.6% 6 Citibank 2,346 5.8%
7 Citibank 2,348 3.7% 7 Citibank 690 1.4% 7 Doral Bank 1,917 4.8%
8 Banco Cooperativo 532 0.8% 8 Banco Cooperativo 176 0.4% 8 Banco Cooperativo 447 1.1%
9 BBU 40 0.1% 9 Other (Auto Lenders) 2,743 5.6% 9 BBU 27 0.1%
Total $ 63,335 100% Total $ 48,683 100% Total $ 40,279 100%
Strong and uniquely positioned franchise in densely populated regions of core operating footprint
Strong market share in loan portfolios facilitates customer relationship expansion and cross-sell to increase deposit share
Long-term opportunity for additional consolidation
Branch overlap of greater than 40% with six Puerto Rico institutions(2)
(5)
1-mile branch overlap(3)
80%
42
44
47
42
64
prepared with data provided by the Commissioner of Financial Institutions of Puerto Rico as of 12/31/13.
3 anches within a mile of an FBP branch as a percentage of total institution branches.
Franchise Overview
Our turnaround story
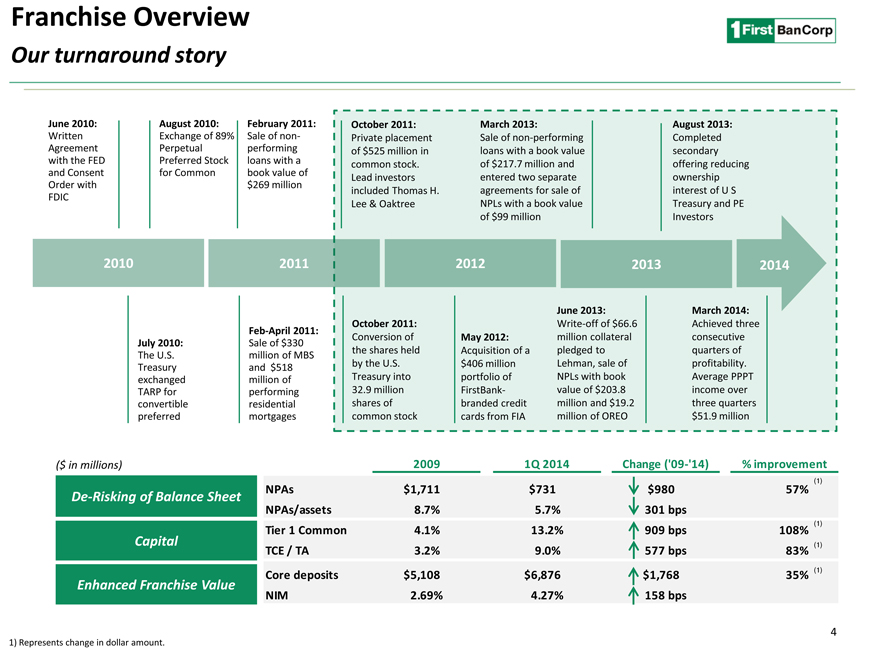
June 2010: August 2010: February 2011: October 2011: March 2013: August 2013:
Written Exchange of 89% Sale of non- Private placement Sale of non-performing Completed
Agreement Perpetual performing of $525 million in loans with a book value secondary
with the FED Preferred Stock loans with a common stock. of $217.7 million and offering reducing
and Consent for Common book value of Lead investors entered two separate ownership
Order with $269 million included Thomas H. agreements for sale of interest of U S
FDIC
Lee & Oaktree NPLs with a book value Treasury and PE
of $99 million Investors
2010 2011 2012 2013 2014
June 2013: March 2014:
October 2011: Write-off of $66.6 Achieved three
Feb-April 2011:
July 2010: Sale of $330 Conversion of May 2012: million collateral consecutive
The U.S. million of MBS the shares held Acquisition of a pledged to quarters of
Treasury and $518 by the U.S. $406 million Lehman, sale of profitability.
exchanged million of Treasury into portfolio of NPLs with book Average PPPT
TARP for performing 32.9 million FirstBank- value of $203.8 income over
convertible residential shares of branded credit million and $19.2 three quarters
preferred mortgages common stock cards from FIA million of OREO $51.9 million
($ in millions) 2009 1Q 2014 Change (‘09-‘14) % improvement
(1)
NPAs $1,711 $731 $980 57%
De-Risking of Balance Sheet
NPAs/assets 8.7% 5.7% 301 bps
(1)
Capital Tier 1 Common 4.1% 13.2% 909 bps 108%
(1)
TCE / TA 3.2% 9.0% 577 bps 83%
(1)
Enhanced Franchise Value Core deposits $5,108 $6,876 $1,768 35% NIM 2.69% 4.27% 158 bps
4
1) Represents change in dollar amount.
|
First Quarter 2014
Improved Profitability; Focus Remains on Credit
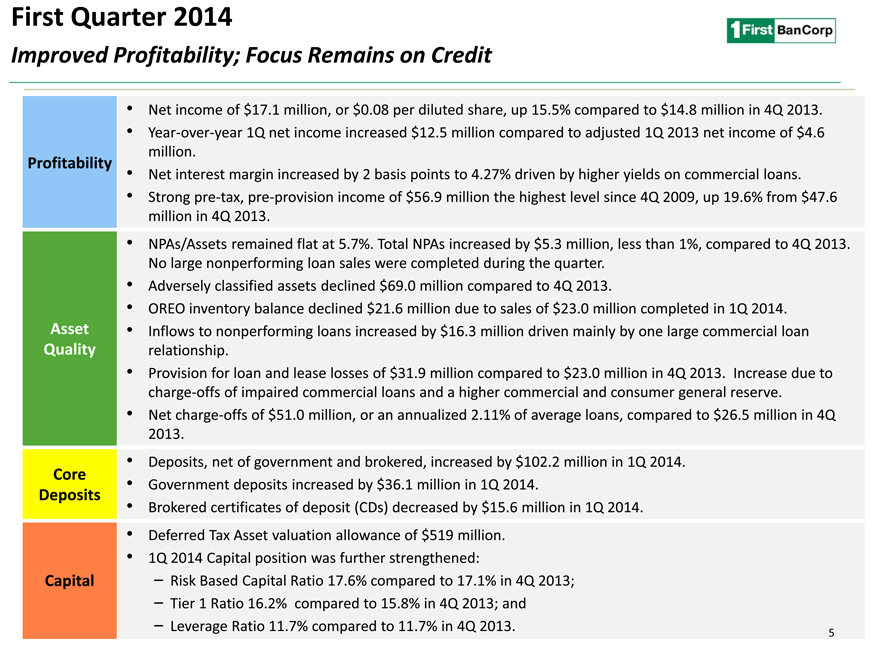
• Net income of $17.1 million, or $0.08 per diluted share, up 15.5% compared to $14.8 million in 4Q 2013.
• Year-over-year 1Q net income increased $12.5 million compared to adjusted 1Q 2013 net income of $4.6
million.
Profitability • Net interest margin increased by 2 basis points to 4.27% driven by higher yields on commercial loans.
• Strong pre-tax, pre-provision income of $56.9 million the highest level since 4Q 2009, up 19.6% from $47.6
million in 4Q 2013.
• NPAs/Assets remained flat at 5.7%. Total NPAs increased by $5.3 million, less than 1%, compared to 4Q 2013.
No large nonperforming loan sales were completed during the quarter.
• Adversely classified assets declined $69.0 million compared to 4Q 2013.
• OREO inventory balance declined $21.6 million due to sales of $23.0 million completed in 1Q 2014.
Asset • Inflows to nonperforming loans increased by $16.3 million driven mainly by one large commercial loan
Quality relationship.
• Provision for loan and lease losses of $31.9 million compared to $23.0 million in 4Q 2013. Increase due to
charge-offs of impaired commercial loans and a higher commercial and consumer general reserve.
• Net charge-offs of $51.0 million, or an annualized 2.11% of average loans, compared to $26.5 million in 4Q
2013.
• Deposits, net of government and brokered, increased by $102.2 million in 1Q 2014.
Core • Government deposits increased by $36.1 million in 1Q 2014.
Deposits • Brokered certificates of deposit (CDs) decreased by $15.6 million in 1Q 2014.
• Deferred Tax Asset valuation allowance of $519 million.
• 1Q 2014 Capital position was further strengthened:
Capital Risk Based Capital Ratio 17.6% compared to 17.1% in 4Q 2013;
Tier 1 Ratio 16.2% compared to 15.8% in 4Q 2013; and
Leverage Ratio 11.7% compared to 11.7% in 4Q 2013. 5
|
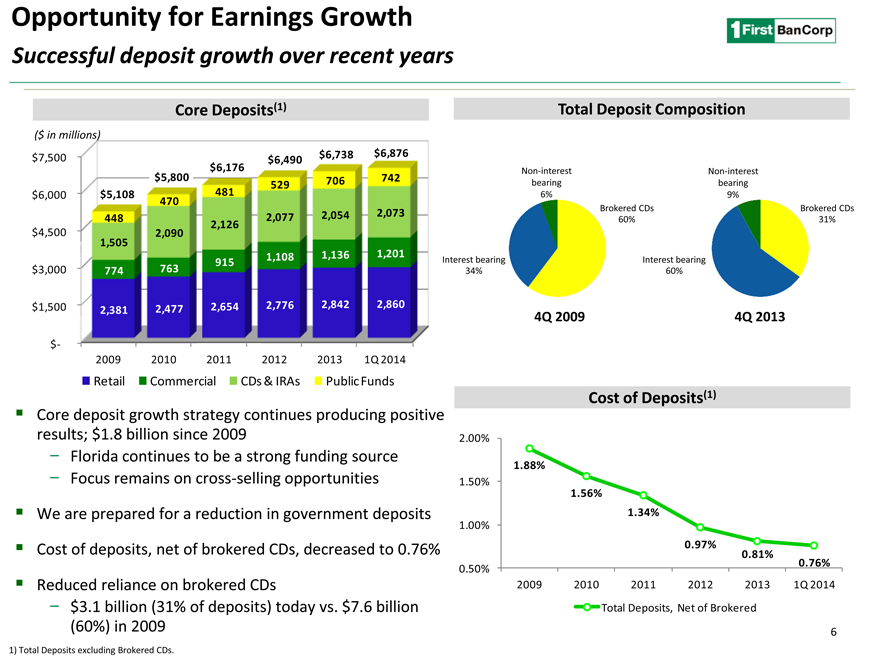
Opportunity for Earnings Growth
Successful deposit growth over recent years
Core Deposits(1) Total Deposit Composition
($ in millions) $6,738 $6,876 $7,500 $6,490 $6,176 Non-interest Non-interest $5,800 706 742 529 bearing bearing $6,000 $5,108 470 481 6% 9%
Brokered CDs Brokered CDs
2,077 2,054 2,073
448 60% 31%
2,126 $4,500 2,090
1,505
1,108 1,136 1,201
915 Interest bearing Interest bearing $3,000 774 763 34% 60%
$1,500 2,654 2,776 2,842 2,860 2,381 2,477
4Q 2009 4Q 2013
$-
2009 2010 2011 2012 2013 1Q 2014
Retail Commercial CDs & IRAs Public Funds
Cost of Deposits(1)
Cor itive result 2.00%
-
1.88%
- 1.50%
1.56%
We its 1.34%
1.00%
Cos 76% 0.97%
0.81% 0.76%
0.50%
Red 2009 2010 2011 2012 2013 1Q 2014
- Total Deposits, Net of Brokered
(60%) in 2009 6
1) Total Deposits excluding Brokered CDs.
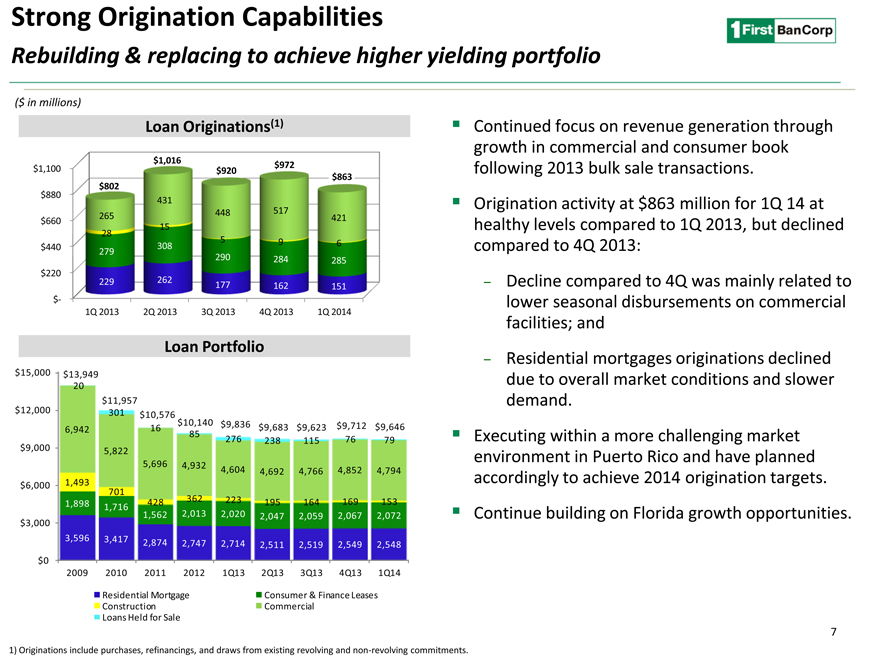
Strong Origination Capabilities
Rebuilding & replacing to achieve higher yielding portfolio
($ in millions)
Loan Originations(1) Continued focus on revenue generation through
growth in commercial and consumer book
$1,016
$1,100 $920 $972 following 2013 bulk sale transactions.
$863
$802
$880 431 Origination activity at $863 million for 1Q 14 at
448 517
265 421
$660 15 healthy levels compared to 1Q 2013, but declined
28
$440 308 5 9 6 compared to 4Q 2013:
279
290 284 285
$220
229 262 177 162 151 Decline compared to 4Q was mainly related to
$- lower seasonal disbursements on commercial
1Q 2013 2Q 2013 3Q 2013 4Q 2013 1Q 2014
facilities; and
Loan Portfolio
Residential mortgages originations declined
$15,000 $13,949 due to overall market conditions and slower
20
$11,957 demand.
$12,000
6,94 ng within a more challenging market
$9,000
ment in Puerto Rico and have planned
$6,000 1,49 gly to achieve 2014 origination targets.
1,89
e building on Florida growth opportunities.
$3,000
3,59
$0
2009
7
1) Originations include purchases, refinancings, and draws from existing revolving and non-revolving commitments.
|
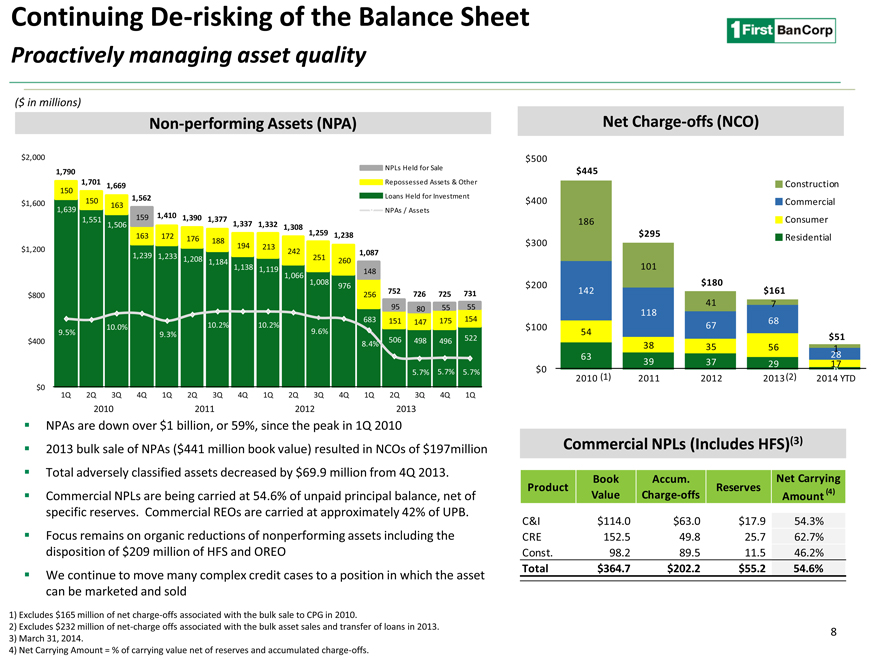
Continuing De-risking of the Balance Sheet
Proactively managing asset quality
($ in millions)
Non-performing Assets (NPA) Net Charge-offs (NCO)
$2,000 $500
NPLs Held for Sale $445
1,790
1,701 Repossessed Assets & Other Construction
1,669
150 Loans Held for Investment
150 1,562 $400 Commercial $1,600 1,639 163
NPAs / Assets
159 1,410 1,390
1,551 186 Consumer
1,506 1,377 1,337 1,332
163 1,308 1,259 1,238 $295
172 176 Residential 188 $300
194 213 $1,200 242
1,239 1,087 1,233 1,208 251 1,184 260
1,138 1,119 101 148
1,066 1,008 $180
976 $200
752 726 725 731 142 $161 $800 256
41 7
95 80 55 55
683 154 118
151 147 175 68 10.0% 10.2% 10.2% 9.6% $100 67 9.5% 9.3% 54
506 522 $51 $400 8.4% 498 496
38 35 56 1
63 39 37 28
29 17
5.7% 5.7% $0 6 5.7%
2010 (1) 2011 2012 2013(2) 2014 YTD $0
1Q 2Q 3Q 4Q 1Q 2Q 3Q 4Q 1Q 2Q 3Q 4Q 1Q 2Q 3Q 4Q 1Q
2010 2011 2012 2013
NPAs are down over $1 billion, or 59%, since the peak in 1Q 2010
Commercial NPLs (Includes HFS)(3)
2013 bulk sale of NPAs ($441 million book value) resulted in NCOs of $197million Total adversely classified assets decreased by $69.9 million from 4Q 2013.
Product Book Accum. Reserves Net Carrying
Commercial NPLs are being carried at 54.6% of unpaid principal balance, net of Value Charge-offs Amount (4) specific reserves. Commercial REOs are carried at approximately 42% of UPB. C&I $114.0 $63.0 $17.9 54.3% Focus remains on organic reductions of nonperforming assets including the CRE 152.5 49.8 25.7 62.7% disposition of $209 million of HFS and OREO Const. 98.2 89.5 11.5 46.2%
Total $364.7 $202.2 $55.2 54.6%
We continue to move many complex credit cases to a position in which the asset can be marketed and sold
1) Excludes $165 million of net charge-offs associated with the bulk sale to CPG in 2010.
2) Excludes $232 million of net-charge offs associated with the bulk asset sales and transfer of loans in 2013.
8 |
|
3) March 31, 2014.
4) Net Carrying Amount = % of carrying value net of reserves and accumulated charge-offs.
|
Focus on Strategic Plan
Rebuild earnings and de-risk balance sheet
($ in millions, except per share results)
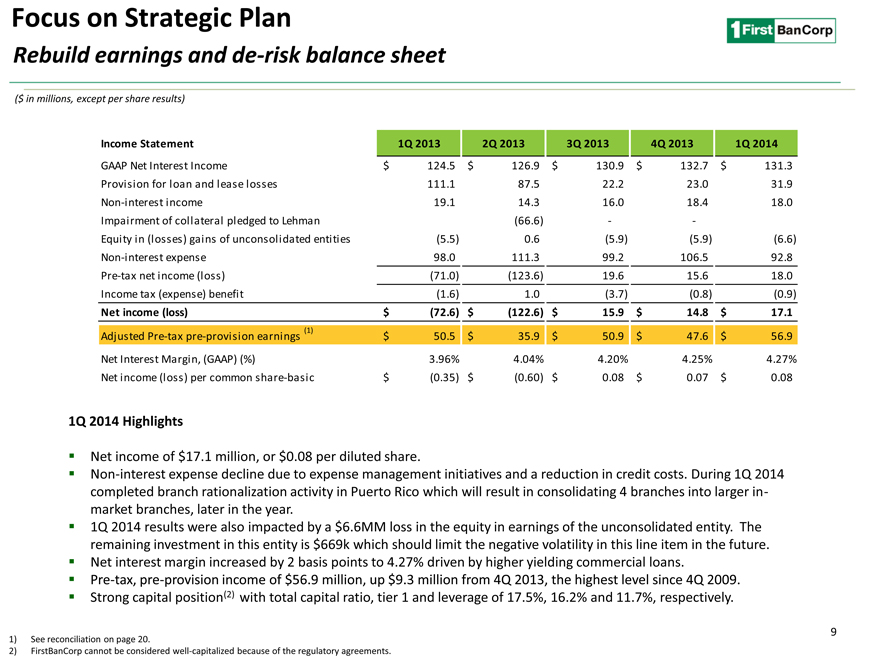
Income Statement 1Q 2013 2Q 2013 3Q 2013 4Q 2013 1Q 2014
GAAP Net Interest Income $ 124.5 $ 126.9 $ 130.9 $ 132.7 $ 131.3
Provision for loan and lease losses 111.1 87.5 22.2 23.0 31.9
Non-interest income 19.1 14.3 16.0 18.4 18.0
Impairment of collateral pledged to Lehman(66.6) —
Equity in (losses) gains of unconsolidated entities(5.5) 0.6(5.9)(5.9)(6.6)
Non-interest expense 98.0 111.3 99.2 106.5 92.8
Pre-tax net income (loss)(71.0)(123.6) 19.6 15.6 18.0
Income tax (expense) benefit(1.6) 1.0(3.7)(0.8)(0.9)
Net income (loss) $(72.6) $(122.6) $ 15.9 $ 14.8 $ 17.1
Adjusted Pre-tax pre-provision earnings (1) $ 50.5 $ 35.9 $ 50.9 $ 47.6 $ 56.9
Net Interest Margin, (GAAP) (%) 3.96% 4.04% 4.20% 4.25% 4.27%
Net income (loss) per common share-basic $(0.35) $(0.60) $ 0.08 $ 0.07 $ 0.08
1Q 2014 Highlights
Net income of $17.1 million, or $0.08 per diluted share.
Non-interest expense decline due to expense management initiatives and a reduction in credit costs. During 1Q 2014 completed branch rationalization activity in Puerto Rico which will result in consolidating 4 branches into larger in- market branches, later in the year.
1Q 2014 results were also impacted by a $6.6MM loss in the equity in earnings of the unconsolidated entity. The remaining investment in this entity is $669k which should limit the negative volatility in this line item in the future.
Net interest margin increased by 2 basis points to 4.27% driven by higher yielding commercial loans.
Pre-tax, pre-provision income of $56.9 million, up $9.3 million from 4Q 2013, the highest level since 4Q 2009.
Strong capital position(2) with total capital ratio, tier 1 and leverage of 17.5%, 16.2% and 11.7%, respectively.
See reconciliation on page 20.
FirstBanCorp cannot be considered well-capitalized because of the regulatory agreements.
9
|
Opportunity for Earnings Growth
Targeted strategies for growth
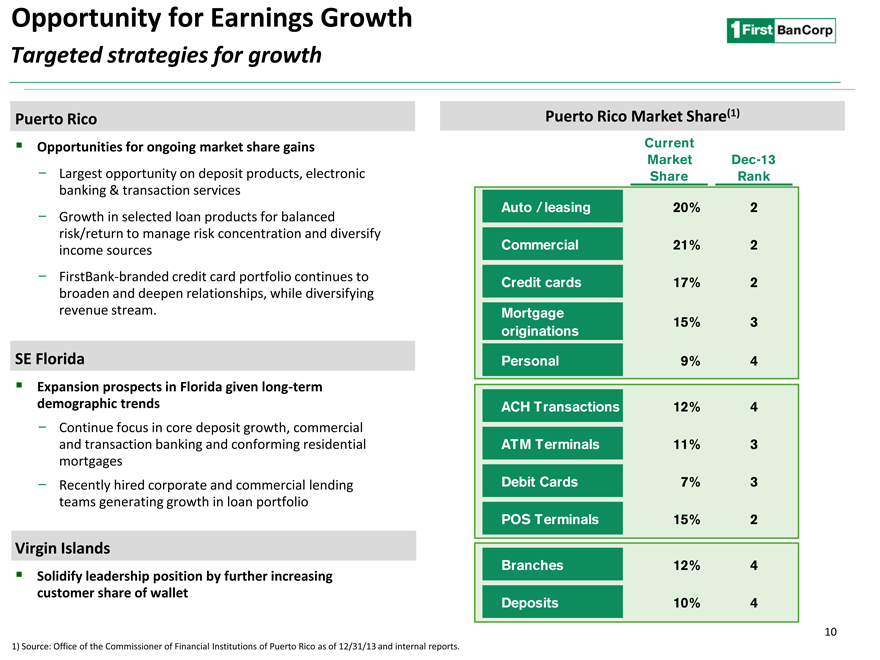
Puerto Rico Puerto Rico Market Share(1)
Opportunities for ongoing market share gains Current
Market Dec-13
- Largest opportunity on deposit products, electronic Share Rank
banking & transaction services
—Growth in selected loan products for balanced Auto / leasing 20% 2
risk/return to manage risk concentration and diversify
income sources Commercial 21% 2
- FirstBank-branded credit card portfolio continues to Credit cards 17% 2
broaden and deepen relationships, while diversifying
revenue stream. Mortgage
15% 3
originations
SE Florida Personal 9% 4
Expansion prospects in Florida given long-term
demographic trends ACH Transactions 12% 4
- Continue focus in core deposit growth, commercial
and transaction banking and conforming residential ATM Terminals 11% 3
mortgages
—Recently hired corporate and commercial lending Debit Cards 7% 3
teams generating growth in loan portfolio
POS Terminals 15% 2
Virgin Islands
Solidify leadership position by further increasing Branches 12% 4
customer share of wallet
Deposits 10% 4
10
1) Source: Office of the Commissioner of Financial Institutions of Puerto Rico as of 12/31/13 and internal reports.
|
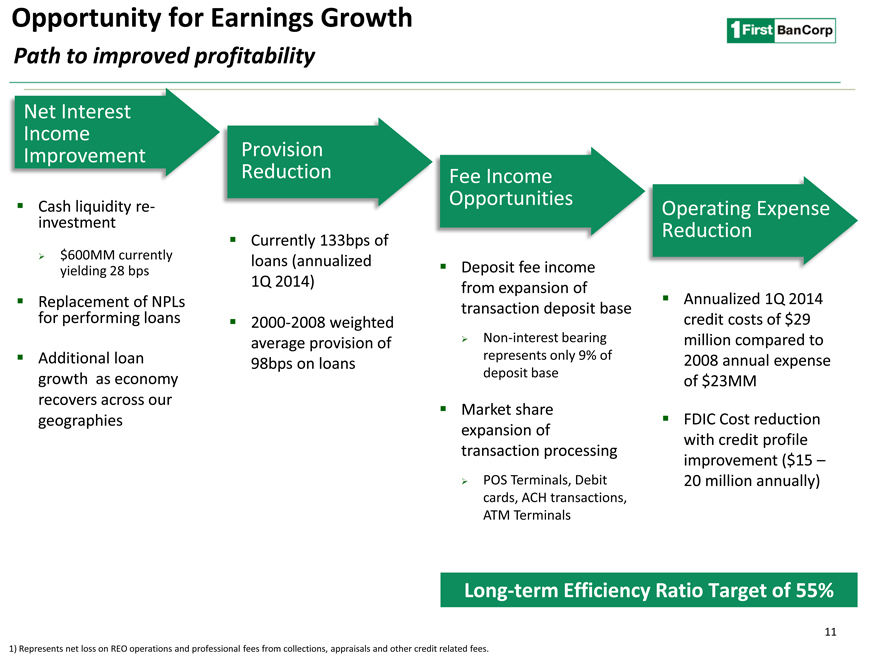
Opportunity for Earnings Growth
Path to improved profitability
Net Interest
Income
Improvement
Cash liquidity re-investment
$600MM currently yielding 28 bps
Replacement of NPLs for performing loans
Additional loan growth as economy recovers across our geographies
Provision Reduction
Currently 133bps of loans (annualized 1Q 2014)
2000-2008 weighted average provision of 98bps on loans
Fee Income Opportunities
Deposit fee income from expansion of transaction deposit base
Non-interest bearing represents only 9% of deposit base
Market share expansion of transaction processing
POS Terminals, Debit cards, ACH transactions, ATM Terminals
Operating Expense Reduction
Annualized 1Q 2014 credit costs of $29 million compared to 2008 annual expense of $23MM
FDIC Cost reduction with credit profile improvement ($15 – 20 million annually)
Long-term Efficiency Ratio Target of 55%
11
1) Represents net loss on REO operations and professional fees from collections, appraisals and other credit related fees.
|
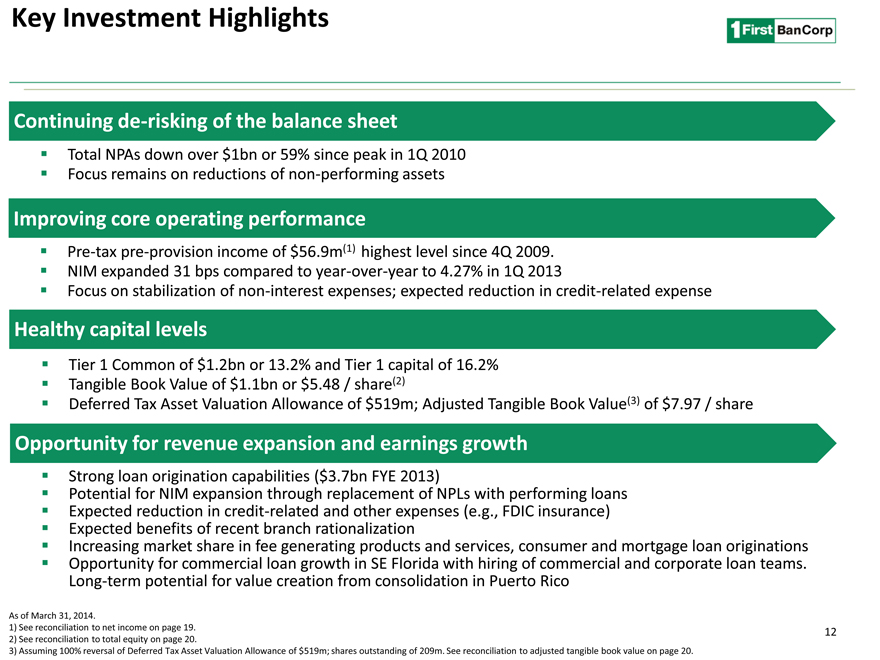
Key Investment Highlights
Total NPAs down over $1bn or 59% since peak in 1Q 2010
Focus remains on reductions of non-performing assets
Pre-tax pre-provision income of $56.9m(1) highest level since 4Q 2009.
NIM expanded 31 bps compared to year-over-year to 4.27% in 1Q 2013
Focus on stabilization of non-interest expenses; expected reduction in credit-related expense
Tier 1 Common of $1.2bn or 13.2% and Tier 1 capital of 16.2%
Tangible Book Value of $1.1bn or $5.48 / share(2)
Deferred Tax Asset Valuation Allowance of $519m; Adjusted Tangible Book Value(3) of $7.97 / share
Opportunity for revenue expansion and earnings growth
Strong loan origination capabilities ($3.7bn FYE 2013)
Potential for NIM expansion through replacement of NPLs with performing loans
Expected reduction in credit-related and other expenses (e.g., FDIC insurance)
Expected benefits of recent branch rationalization
Increasing market share in fee generating products and services, consumer and mortgage loan originations
Opportunity for commercial loan growth in SE Florida with hiring of commercial and corporate loan teams. Long-term potential for value creation from consolidation in Puerto Rico
As of March 31, 2014.
1) See reconciliation to net income on page 19.
2) See reconciliation to total equity on page 20.
3) Assuming 100% reversal of Deferred Tax Asset Valuation Allowance of $519m; shares outstanding of 209m. See reconciliation to adjusted tangible book value on page 20.
12
|

Appendix
|
Puerto Rico Government Exposure
As of March 31, 2014
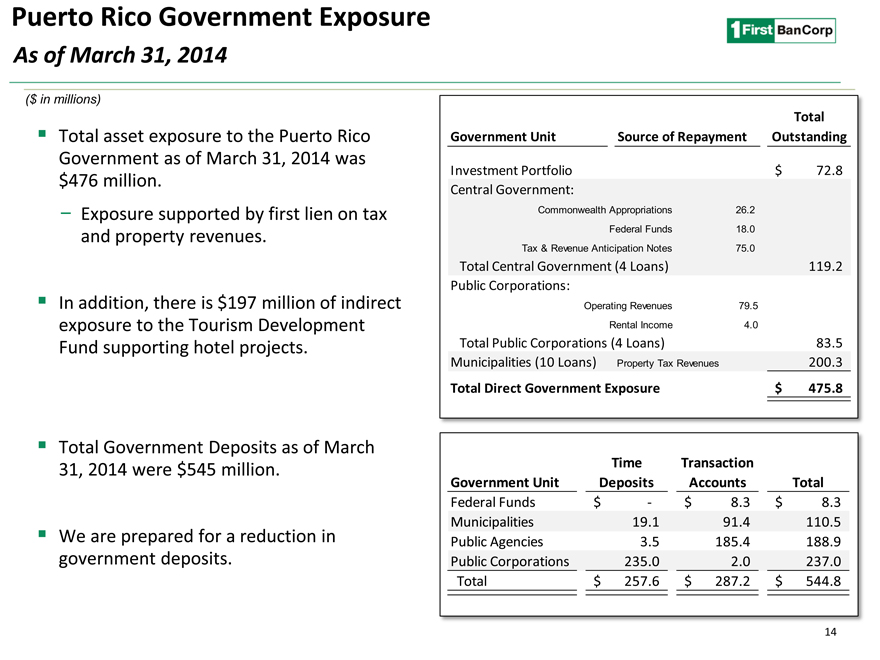
($ in millions)
Total asset exposure to the Puerto Rico Government as of March 31, 2014 was $476 million.
Exposure supported by first lien on tax and property revenues.
In addition, there is $197 million of indirect exposure to the Tourism Development Fund supporting hotel projects.
Total Government Deposits as of March 31, 2014 were $545 million.
We are prepared for a reduction in government deposits.
Total
Government Unit Source of Repayment Outstanding
Investment Portfolio $ 72.8
Central Government:
Commonwealth Appropriations 26.2
Federal Funds 18.0
Tax & Revenue Anticipation Notes 75.0
Total Central Government (4 Loans) 119.2
Public Corporations:
Operating Revenues 79.5
Rental Income 4.0
Total Public Corporations (4 Loans) 83.5
Municipalities (10 Loans) Property Tax Revenues 200.3
Total Direct Government Exposure $ 475.8
Time Transaction
Government Unit Deposits Accounts Total
Federal Funds $— $ 8.3 $ 8.3
Municipalities 19.1 91.4 110.5
Public Agencies 3.5 185.4 188.9
Public Corporations 235.0 2.0 237.0
Total $ 257.6 $ 287.2 $ 544.8
14
|
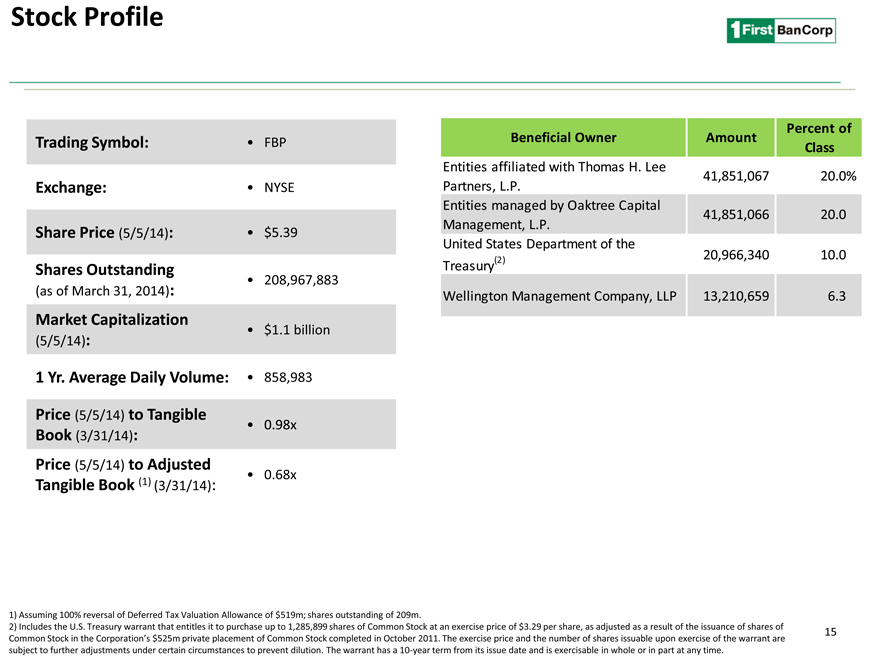
Stock Profile
Trading Symbol: • FBP
Exchange: • NYSE
Share Price (5/5/14): • $5.39
Shares Outstanding
• 208,967,883
(as of March 31, 2014):
Market Capitalization
• $1.1 billion
(5/5/14):
1 Yr. Average Daily Volume: • 858,983
Price (5/5/14) to Tangible
• 0.98x
Book (3/31/14):
Price (5/5/14) to Adjusted
• 0.68x
Tangible Book (1) (3/31/14):
Beneficial Owner
Entities affiliated with Thomas H. Lee Partners, L.P.
Entities managed by Oaktree Capital Management, L.P.
United States Department of the
(2)
Treasury
Wellington Management Company, LLP
Percent of
Amount
Class
41,851,067 20.0%
41,851,066 20.0
20,966,340 10.0
13,210,659 6.3
1) Assuming 100% reversal of Deferred Tax Valuation Allowance of $519m; shares outstanding of 209m.
2) Includes the U.S. Treasury warrant that entitles it to purchase up to 1,285,899 shares of Common Stock at an exercise price of $3.29 per share, as adjusted as a result of the issuance of shares of 15
Common Stock in the Corporation’s $525m private placement of Common Stock completed in October 2011. The exercise price and the number of shares issuable upon exercise of the warrant are
subject to further adjustments under certain circumstances to prevent dilution. The warrant has a 10-year term from its issue date and is exercisable in whole or in part at any time.
|
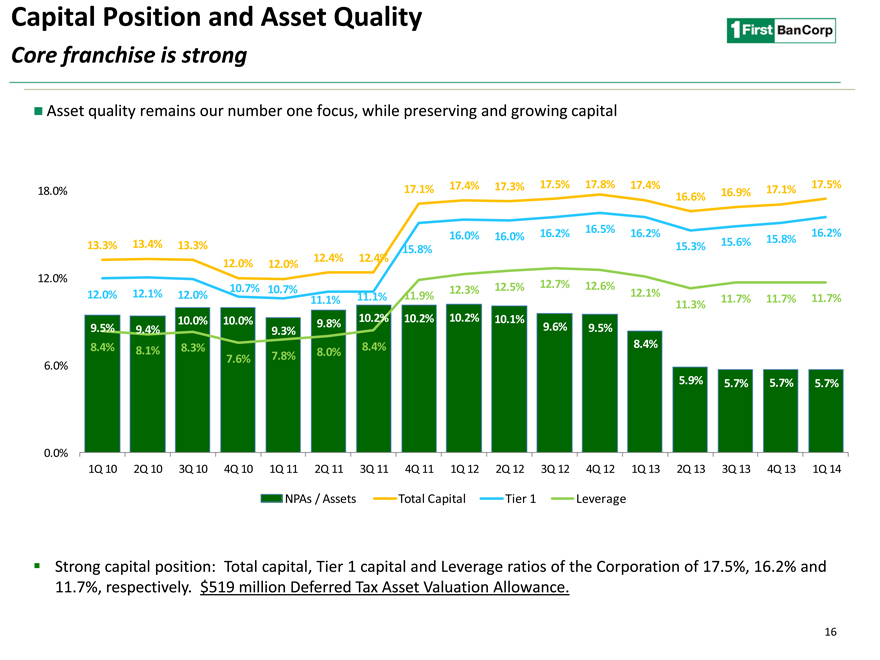
Capital Position and Asset Quality
Core franchise is strong
Asset quality remains our number one focus, while preserving and growing capital
17.4% 17.3% 17.5% 17.8% 17.4% 17.5% 18.0% 17.1% 16.9% 17.1% 16.6%
16.2% 16.5% 16.2% 16.2% 16.0% 16.0% 15.8% 13.3% 13.4% 13.3% 15.3% 15.6% 15.8% 12.4% 12.4% 12.0% 12.0%
12.0%
10.7% 12.5% 12.7% 12.6% 12.1% 10.7% 12.3% 12.1%
12.0% 12.0% 11.1% 11.9% 11.7% 11.7% 11.7% 11.1% 11.3% 10.0% 10.0% 10.2% 10.2% 10.2% 10.1% 9.5% 9.8% 9.6% 9.5% 9.4% 9.3% 8.4% 8.3% 8.4% 8.4% 8.1% 8.0% 6.0% 7.6% 7.8% 5.9% 5.7% 5.7% 5.7%
0.0%
1Q 10 2Q 10 3Q 10 4Q 10 1Q 11 2Q 11 3Q 11 4Q 11 1Q 12 2Q 12 3Q 12 4Q 12 1Q 13 2Q 13 3Q 13 4Q 13 1Q 14
NPAs / Assets Total Capital Tier 1 Leverage
Strong capital position: Total capital, Tier 1 capital and Leverage ratios of the Corporation of 17.5%, 16.2% and 11.7%, respectively. $519 million Deferred Tax Asset Valuation Allowance.
16
|
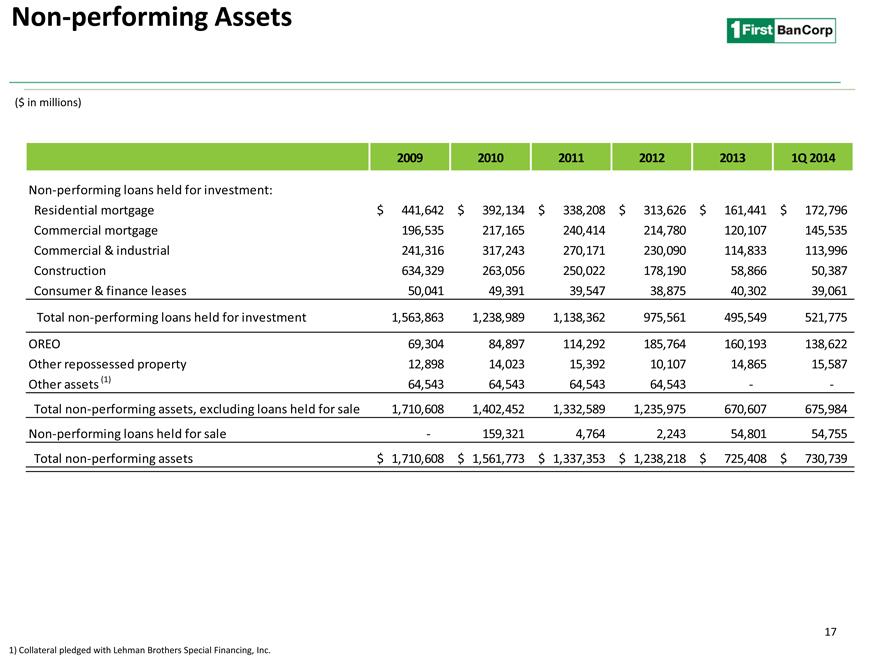
Non-performing Assets
($ in millions)
2009 2010 2011 2012 2013 1Q 2014
Non-performing loans held for investment:
Residential mortgage $ 441,642 $ 392,134 $ 338,208 $ 313,626 $ 161,441 $ 172,796
Commercial mortgage 196,535 217,165 240,414 214,780 120,107 145,535
Commercial & industrial 241,316 317,243 270,171 230,090 114,833 113,996
Construction 634,329 263,056 250,022 178,190 58,866 50,387
Consumer & finance leases 50,041 49,391 39,547 38,875 40,302 39,061
Total non-performing loans held for investment 1,563,863 1,238,989 1,138,362 975,561 495,549 521,775
OREO 69,304 84,897 114,292 185,764 160,193 138,622
Other repossessed property 12,898 14,023 15,392 10,107 14,865 15,587
Other assets (1) 64,543 64,543 64,543 64,543 —
Total non-performing assets, excluding loans held for sale 1,710,608 1,402,452 1,332,589 1,235,975 670,607 675,984
Non-performing loans held for sale—159,321 4,764 2,243 54,801 54,755
Total non-performing assets $ 1,710,608 $ 1,561,773 $ 1,337,353 $ 1,238,218 $ 725,408 $ 730,739
17
1) Collateral pledged with Lehman Brothers Special Financing, Inc.
|
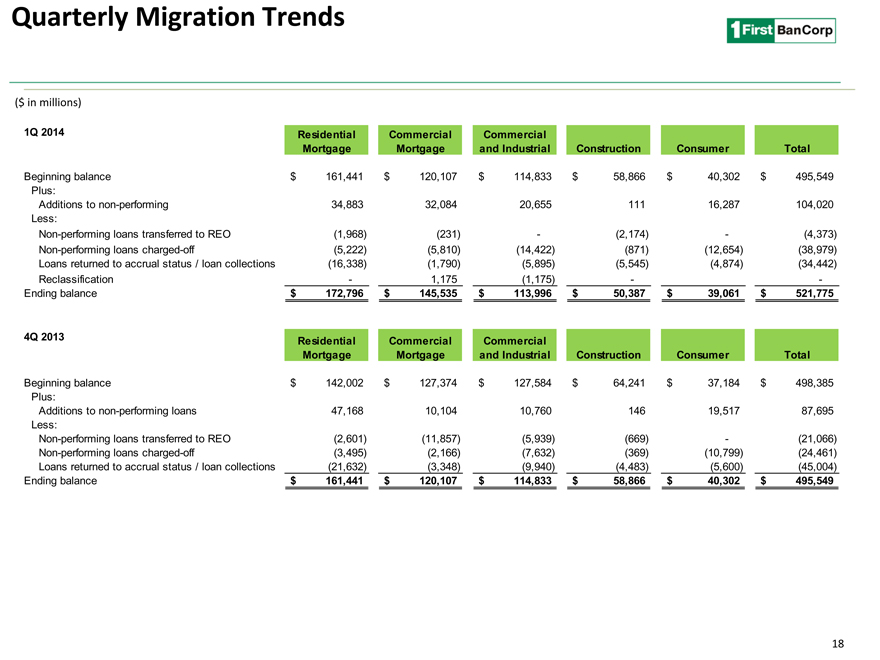
Quarterly Migration Trends
($ in millions)
1Q 2014 Residential Commercial Commercial
Mortgage Mortgage and Industrial Construction Consumer Total
Beginning balance $ 161,441 $ 120,107 $ 114,833 $ 58,866 $ 40,302 $ 495,549
Plus:
Additions to non-performing 34,883 32,084 20,655 111 16,287 104,020
Less:
Non-performing loans transferred to REO(1,968)(231) -(2,174) -(4,373)
Non-performing loans charged-off(5,222)(5,810)(14,422)(871)(12,654)(38,979)
Loans returned to accrual status / loan collections(16,338)(1,790)(5,895)(5,545)(4,874)(34,442)
Reclassification—1,175(1,175) —
Ending balance $ 172,796 $ 145,535 $ 113,996 $ 50,387 $ 39,061 $ 521,775
4Q 2013 Residential Commercial Commercial
Mortgage Mortgage and Industrial Construction Consumer Total
Beginning balance $ 142,002 $ 127,374 $ 127,584 $ 64,241 $ 37,184 $ 498,385
Plus:
Additions to non-performing loans 47,168 10,104 10,760 146 19,517 87,695
Less:
Non-performing loans transferred to REO(2,601)(11,857)(5,939)(669) -(21,066)
Non-performing loans charged-off(3,495)(2,166)(7,632)(369)(10,799)(24,461)
Loans returned to accrual status / loan collections(21,632)(3,348)(9,940)(4,483)(5,600)(45,004)
Ending balance $ 161,441 $ 120,107 $ 114,833 $ 58,866 $ 40,302 $ 495,549
18
|
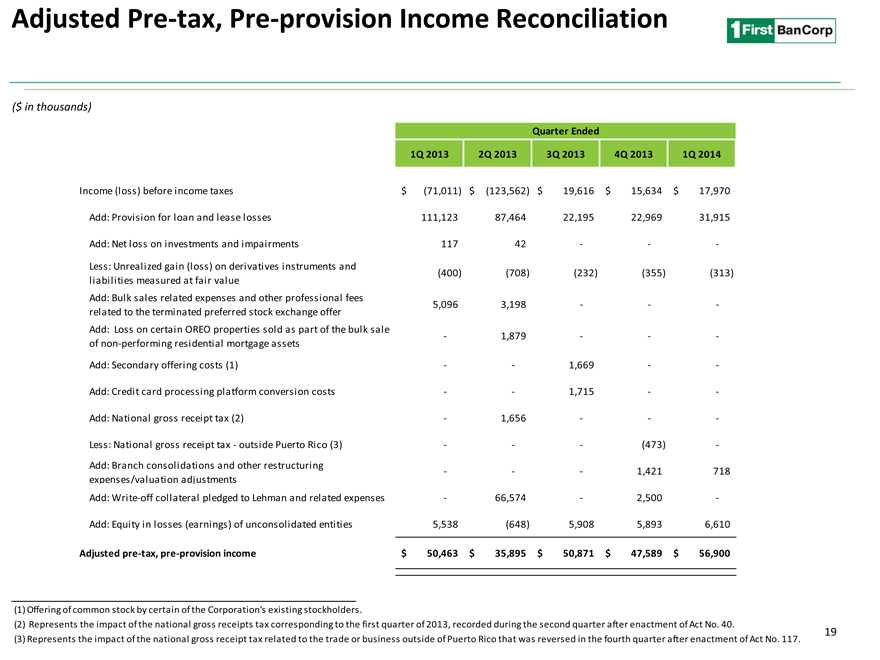
Adjusted Pre-tax, Pre-provision Income Reconciliation
($ in thousands)
Quarter Ended
1Q 2013 2Q 2013 3Q 2013 4Q 2013 1Q 2014
Income (loss) before income taxes $(71,011) $ (123,562) $ 19,616 $ 15,634 $ 17,970
Add: Provision for loan and lease losses 111,123 87,464 22,195 22,969 31,915
Add: Net loss on investments and impairments 117 42 — -
Less: Unrealized gain (loss) on derivatives instruments and
(400)(708)(232)(355)(313)
liabilities measured at fair value
Add: Bulk sales related expenses and other professional fees
5,096 3,198 — -
related to the terminated preferred stock exchange offer
Add: Loss on certain OREO properties sold as part of the bulk sale
—1,879 — -
of non-performing residential mortgage assets
Add: Secondary offering costs (1) — 1,669 —
Add: Credit card processing platform conversion costs — 1,715 —
Add: National gross receipt tax (2)—1,656 — -
Less: National gross receipt tax—outside Puerto Rico (3) — -(473) -
Add: Branch consolidations and other restructuring ——1,421 718
expenses/valuation adjustments
Add: Write-off collateral pledged to Lehman and related expenses—66,574—2,500 -
Add: Equity in losses (earnings) of unconsolidated entities 5,538(648) 5,908 5,893 6,610
Adjusted pre-tax, pre-provision income $ 50,463 $ 35,895 $ 50,871 $ 47,589 $ 56,900
(1) Offering of common stock by certain of the Corporation’s existing stockholders.
(2) Represents the impact of the national gross receipts tax corresponding to the first quarter of 2013, recorded during the second quarter after enactment of Act No. 40.
19
(3) Represents the impact of the national gross receipt tax related to the trade or business outside of Puerto Rico that was reversed in the fourth quarter after enactment of Act No. 117.
|
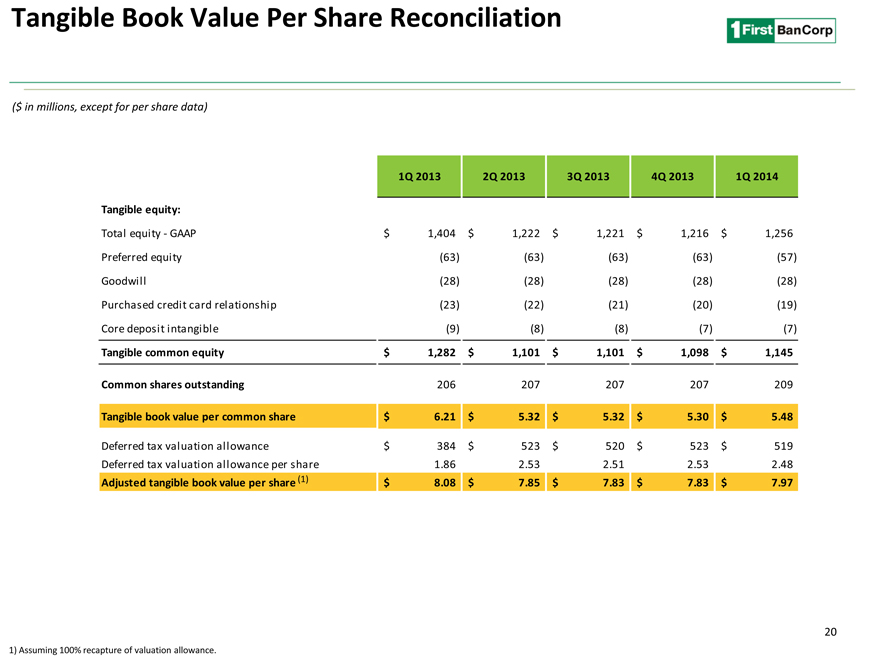
Tangible Book Value Per Share Reconciliation
($ in millions, except for per share data)
1Q 2013 2Q 2013 3Q 2013 4Q 2013 1Q 2014
Tangible equity:
Total equity—GAAP $ 1,404 $ 1,222 $ 1,221 $ 1,216 $ 1,256
Preferred equity(63)(63)(63)(63)(57)
Goodwill(28)(28)(28)(28)(28)
Purchased credit card relationship(23)(22)(21)(20)(19)
Core deposit intangible(9)(8)(8)(7)(7)
Tangible common equity $ 1,282 $ 1,101 $ 1,101 $ 1,098 $ 1,145
Common shares outstanding 206 207 207 207 209
Tangible book value per common share $ 6.21 $ 5.32 $ 5.32 $ 5.30 $ 5.48
Deferred tax valuation allowance $ 384 $ 523 $ 520 $ 523 $ 519
Deferred tax valuation allowance per share 1.86 2.53 2.51 2.53 2.48
Adjusted tangible book value per share (1) $ 8.08 $ 7.85 $ 7.83 $ 7.83 $ 7.97
20
1) Assuming 100% recapture of valuation allowance.
|

Puerto Rico Economic Overview
|

Economic Growth
After a prolonged period of economic contraction, Puerto Rico’s economy returned to a moderate positive growth in 2012 and 2013. The Puerto Rico Planning Board projects a period of slight economic growth for 2014 and 2015.
Real GNP Growth
(Revised as of April 2014)
1.9% Projection 0.9% 0.5% 0.3% 0.2% 0.1%
-1.2%
-1.7%
-2.9%
-3.6% -3.8%
2005 2006 2007 2008 2009 2010 2011 2012 2013p 2014 2015
22
Source: Puerto Rico Planning Board, P = Preliminary
|
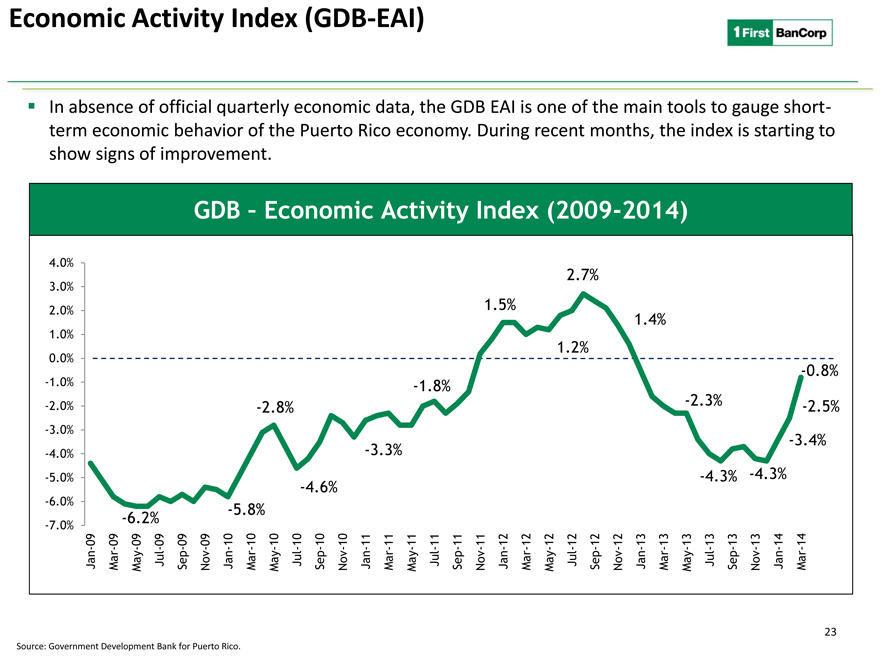
Economic Activity Index (GDB-EAI)
In absence of official quarterly economic data, the GDB EAI is one of the main tools to gauge short- term economic behavior of the Puerto Rico economy. During recent months, the index is starting to show signs of improvement.
GDB – Economic Activity Index (2009-2014)
4.0%
2.7%
3.0%
2.0% 1.5% 1.4%
1.0%
1.2%
0.0%
-0.8%
-1.0% -1.8%
-2.0% -2.8% -2.3% -2.5%
-3.0%
-3.4%
-4.0% -3.3%
-5.0% -4.3% -4.3% -4.6%
-6.0%
-5.8% -6.2%
-7.0%
Jan-09 Mar-09 May-09 Jul-09 Sep-09 Nov-09 Jan-10 Mar-10 May-10 Jul-10 Sep-10 Nov-10 Jan-11 Mar-11 May-11 Jul-11 Sep-11 Nov-11 Jan-12 Mar-12 May-12 Jul-12 Sep-12 Nov-12 Jan-13 Mar-13 May-13 Jul-13 Sep-13 Nov-13 Jan-14 Mar-14
23
Source: Government Development Bank for Puerto Rico.
|
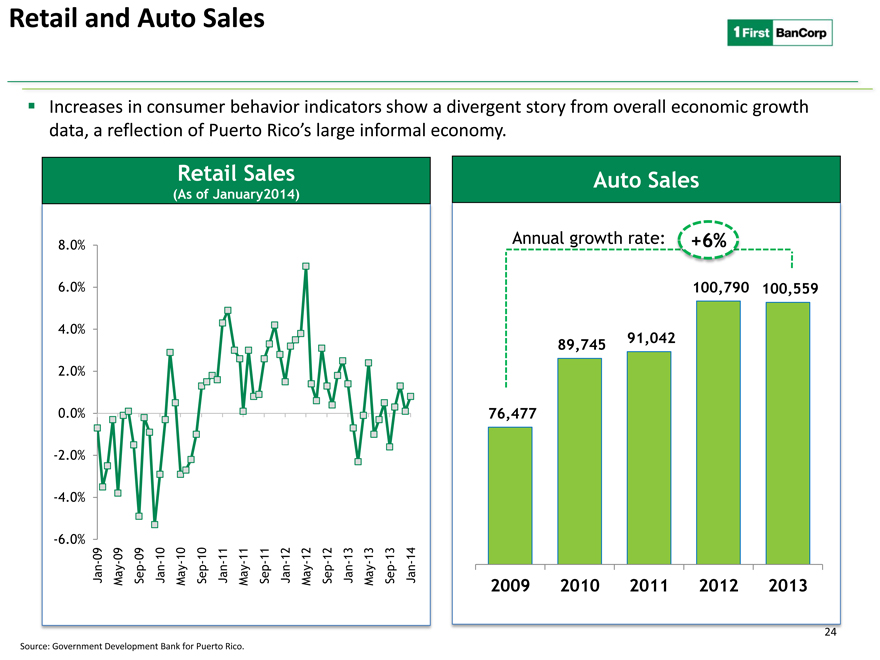
Retail and Auto Sales
Increases in consumer behavior indicators show a divergent story from overall economic growth data, a reflection of Puerto Rico’s large informal economy.
Retail Sales Auto Sales
(As of January2014)
8.0% Annual growth rate: +6%
6.0% 100,790 100,559
4.0%
89,745 91,042
2.0%
0.0% 76,477
-2.0%
-4.0%
-6.0%
Jan-09 May-09 Sep-09 Jan-10 May-10 Sep-10 Jan-11 May-11 Sep-11 Jan-12 May-12 Sep-12 Jan-13 May-13 Sep-13 Jan-14 2009 2010 2011 2012 2013
24
Source: Government Development Bank for Puerto Rico.
|
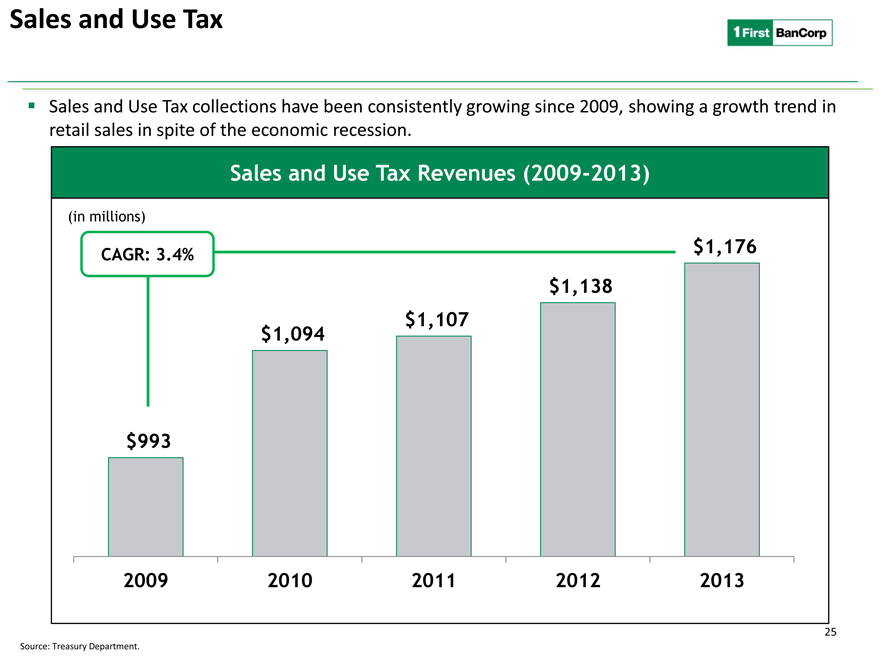
Sales and Use Tax
Sales and Use Tax collections have been consistently growing since 2009, showing a growth trend in retail sales in spite of the economic recession.
Sales and Use Tax Revenues (2009-2013)
(in millions)
CAGR: 3.4% $1,176 $1,138 $1,107 $1,094
$993
2009 2010 2011 2012 2013
25
Source: Treasury Department.
|
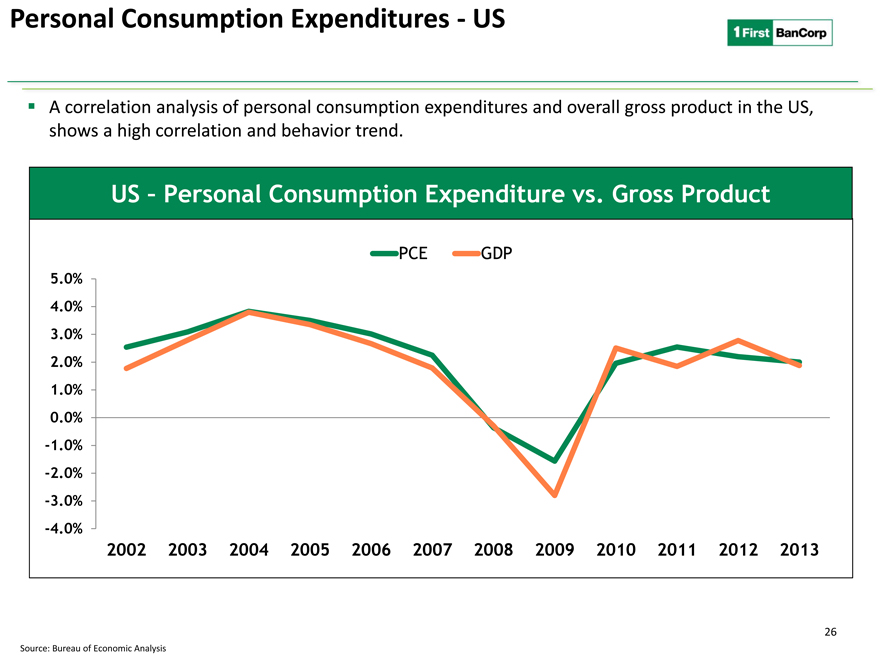
Personal Consumption Expenditures—US
A correlation analysis of personal consumption expenditures and overall gross product in the US, shows a high correlation and behavior trend.
US – Personal Consumption Expenditure vs. Gross Product
PCE GDP
5.0% 4.0% 3.0% 2.0% 1.0% 0.0% -1.0% -2.0% -3.0% -4.0%
2002 2003 2004 2005 2006 2007 2008 2009 2010 2011 2012 2013
26
Source: Bureau of Economic Analysis
|
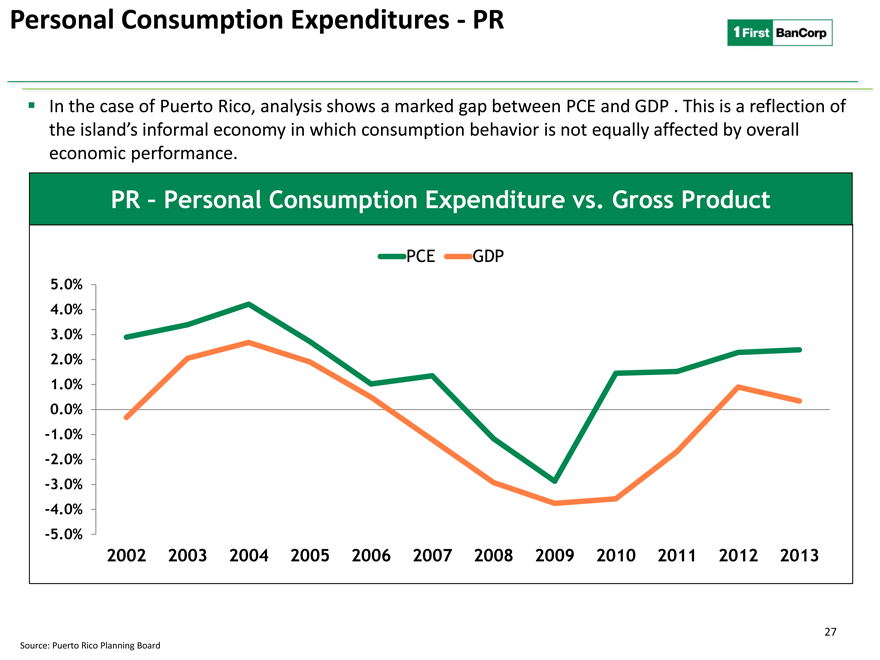
Personal Consumption Expenditures—PR
In the case of Puerto Rico, analysis shows a marked gap between PCE and GDP . This is a reflection of the island’s informal economy in which consumption behavior is not equally affected by overall economic performance.
PR – Personal Consumption Expenditure vs. Gross Product
PCE GDP
5.0% 4.0% 3.0% 2.0% 1.0% 0.0% -1.0% -2.0% -3.0% -4.0% -5.0%
2002 2003 2004 2005 2006 2007 2008 2009 2010 2011 2012 2013
27
Source: Puerto Rico Planning Board
|
Tourism
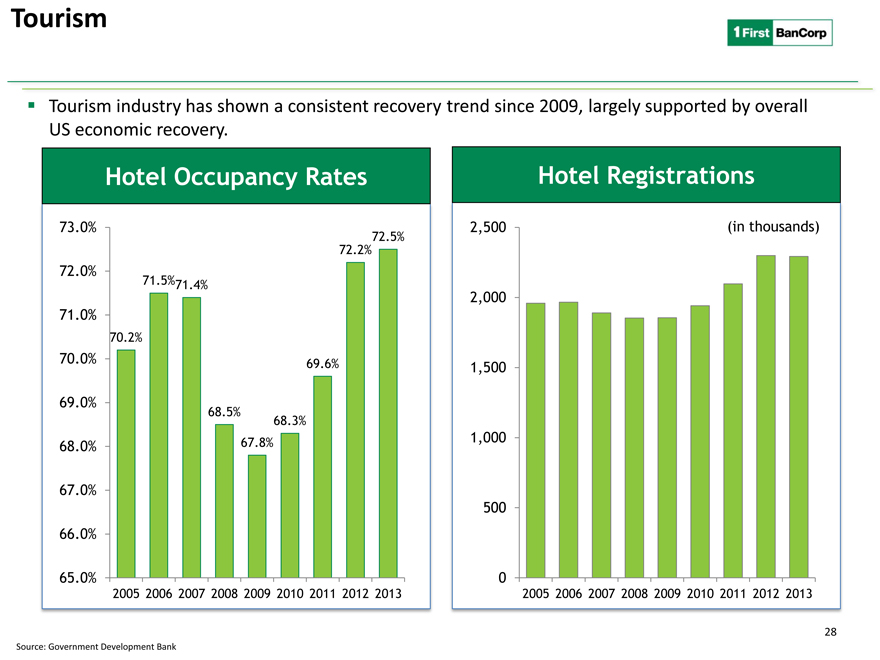
Tourism industry has shown a consistent recovery trend since 2009, largely supported by overall US economic recovery.
Hotel Occupancy Rates Hotel Registrations
73.0% 2,500 (in thousands)
72.5% 72.2%
72.0%
71.5%71.4%
2,000 71.0%
70.2%
70.0% 69.6%
1,500
69.0%
68.5%
68.3%
67.8% 1,000 68.0%
67.0%
500 66.0%
65.0% 0
2005 2006 2007 2008 2009 2010 2011 2012 2013 2005 2006 2007 2008 2009 2010 2011 2012 2013
28
Source: Government Development Bank
|
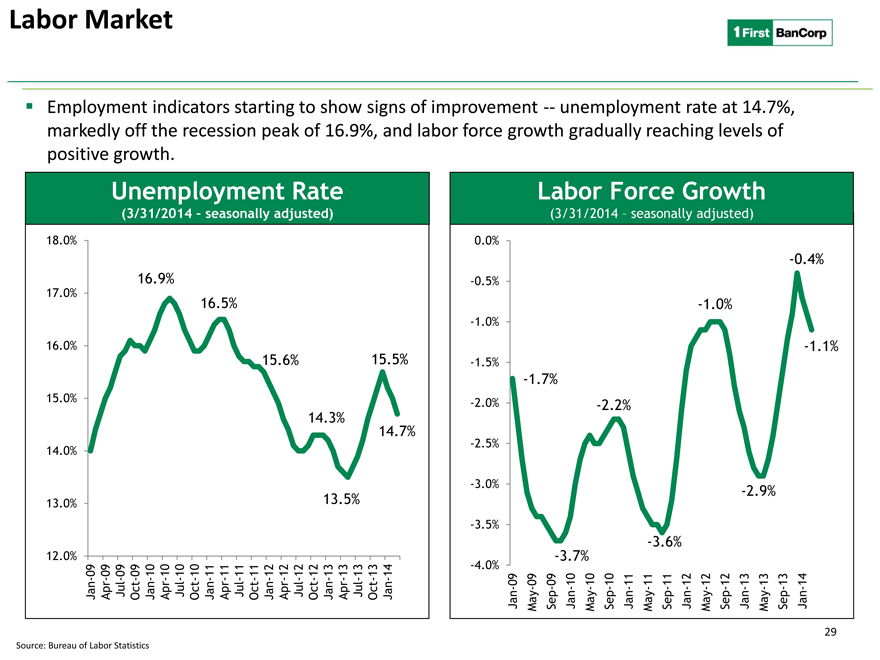
Labor Market
Employment indicators starting to show signs of improvement — unemployment rate at 14.7%, markedly off the recession peak of 16.9%, and labor force growth gradually reaching levels of positive growth.
Unemployment Rate Labor Force Growth
(3/31/2014 – seasonally adjusted) (3/31/2014 – seasonally adjusted)
18.0% 0.0%
-0.4% 16.9% -0.5%
17.0%
16.5% -1.0%
-1.0%
16.0% -1.1%
15.6% 15.5% -1.5%
-1.7%
15.0% -2.0% -2.2%
14.3% 14.7%
-2.5% 14.0%
-3.0% -2.9% 13.0% 13.5% -3.5%
-3.6%
12.0% -3.7% -4.0%
Jan-09 Apr-09 Jul-09 Oct-09 Jan-10 Apr-10 Jul-10 Oct-10 Jan-11 Apr-11 Jul-11 Oct-11 Jan-12 Apr-12 Jul-12 Oct-12 Jan-13 Apr-13 Jul-13 Oct-13 Jan-14 Jan-09 May-09 Sep-09 Jan-10 May-10 Sep-10 Jan-11 May-11 Sep-11 Jan-12 May-12 Sep-12 Jan-13 May-13 Sep-13 Jan-14
29
Source: Bureau of Labor Statistics
|

Historical Unemployment Rate
Puerto Rico’s unemployment rate has been historically above average rates in the US, averaging 14.6% since 1963. At current level of 14.1% (not seasonally adjusted), unemployment rate is close to recent average of 13.1%.
Unemployment Rate since 1963
(not seasonally adjusted)
30.0% Actual 14.1%
Average since1963: 14.6% 5 year average: 15.2% 25.0%
10 year average: 13.1%
20 year average: 13.1%
20.0%
15.0%
10.0%
5.0%
0.0%
Jan-63 Sep-64 May-66 Jan-68 Sep-69 May-71 Jan-73 Sep-74 May-76 Jan-78 Sep-79 May-81 Jan-83 Sep-84 May-86 Jan-88 Sep-89 May-91 Jan-93 Sep-94 May-96 Jan-98 Sep-99 May-01 Jan-03 Sep-04 May-06 Jan-08 Sep-09 May-11 Jan-13
30
Source: Government Development Bank
|
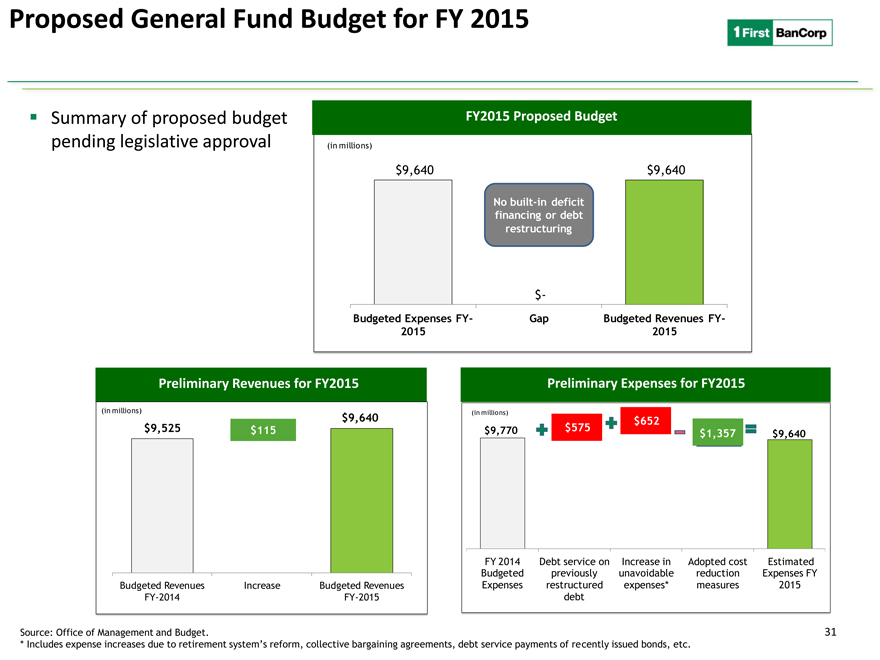
Proposed General Fund Budget for FY 2015
Summary of proposed budget pending legislative approval
FY2015 Proposed Budget
(in millions)
$9,640 $9,640
No built-in deficit financing or debt restructuring
$-
Budgeted Expenses FY- Gap Budgeted Revenues FY-2015 2015
$652 $115 $575 $1,357 ,640
imated nses FY 2015
31