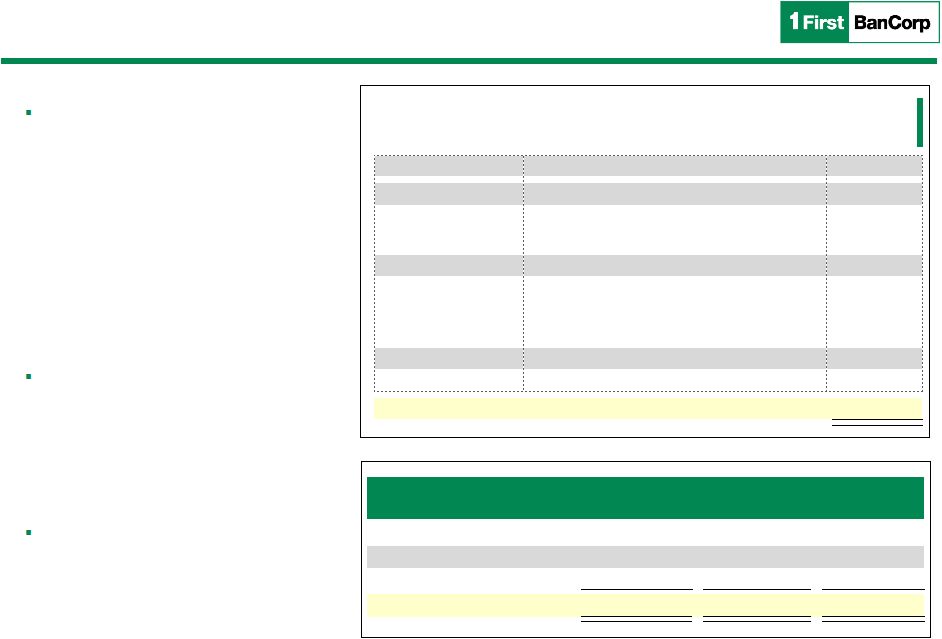
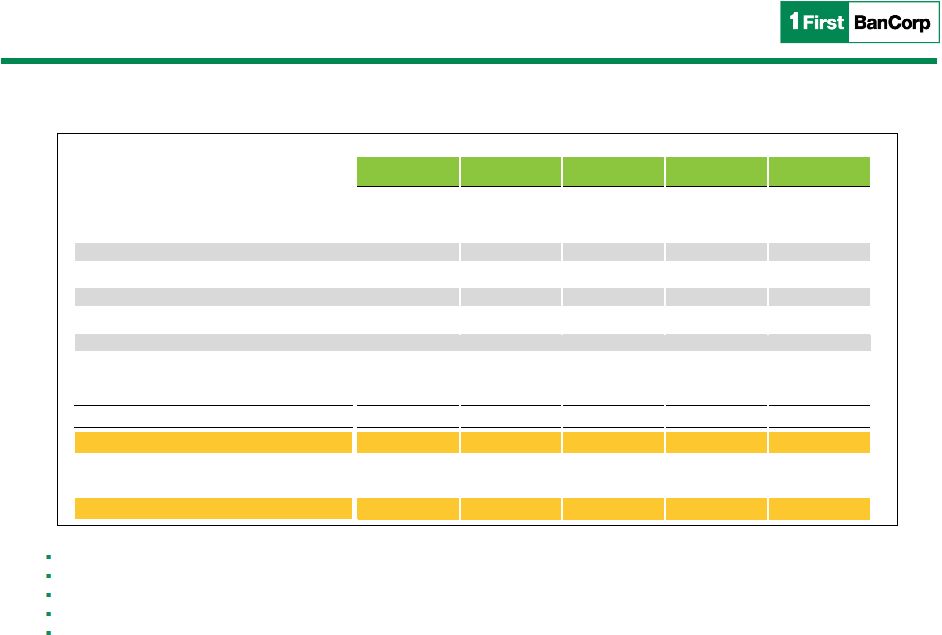
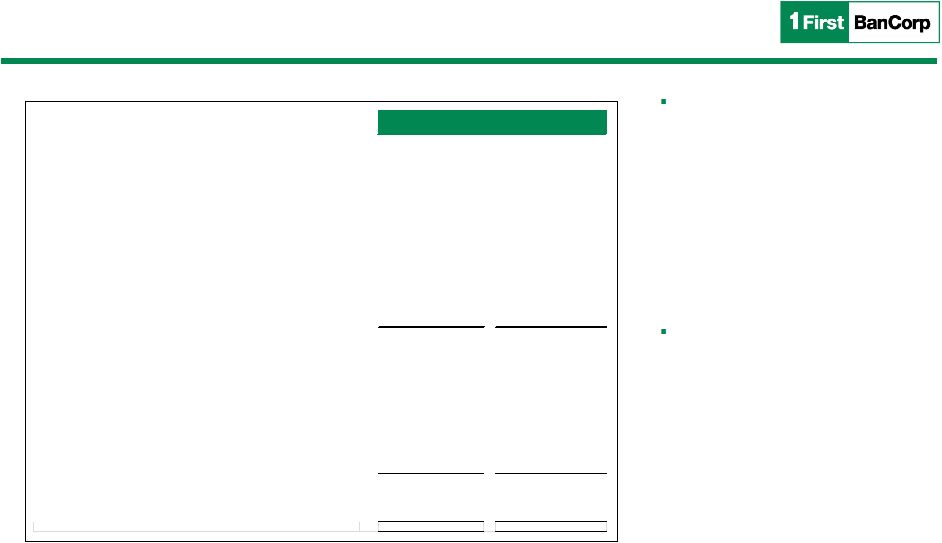
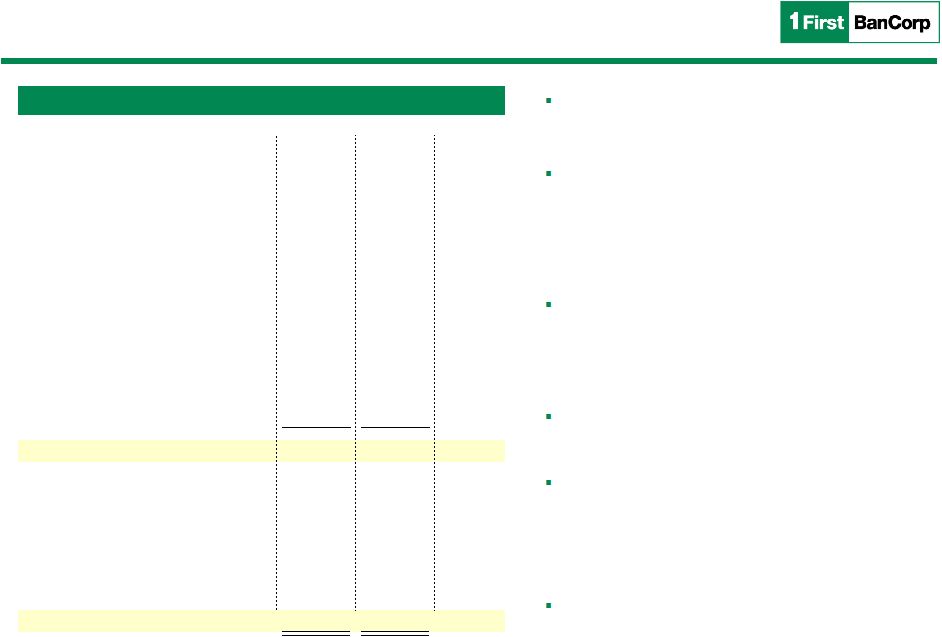
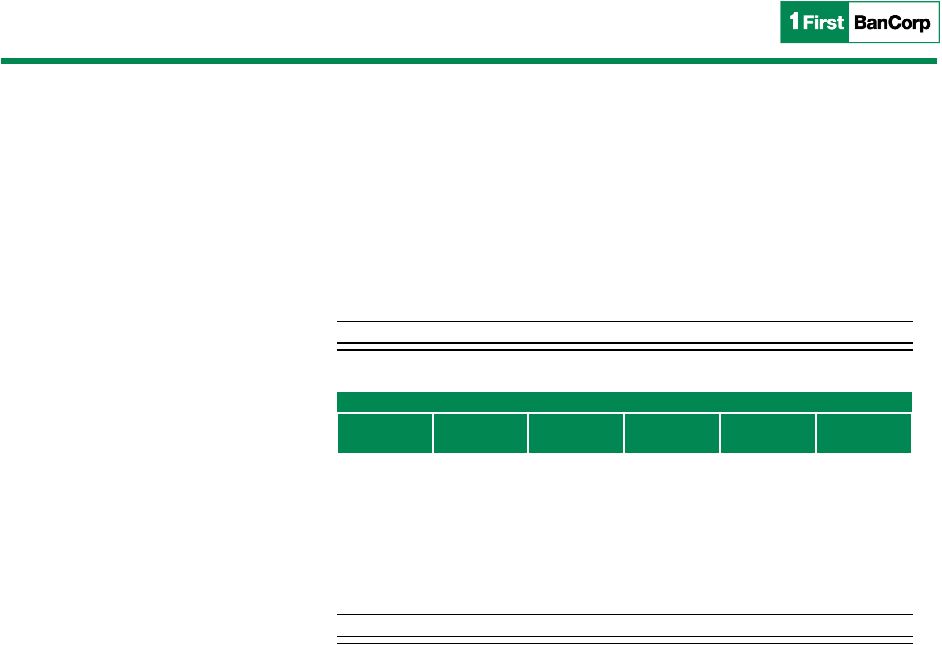
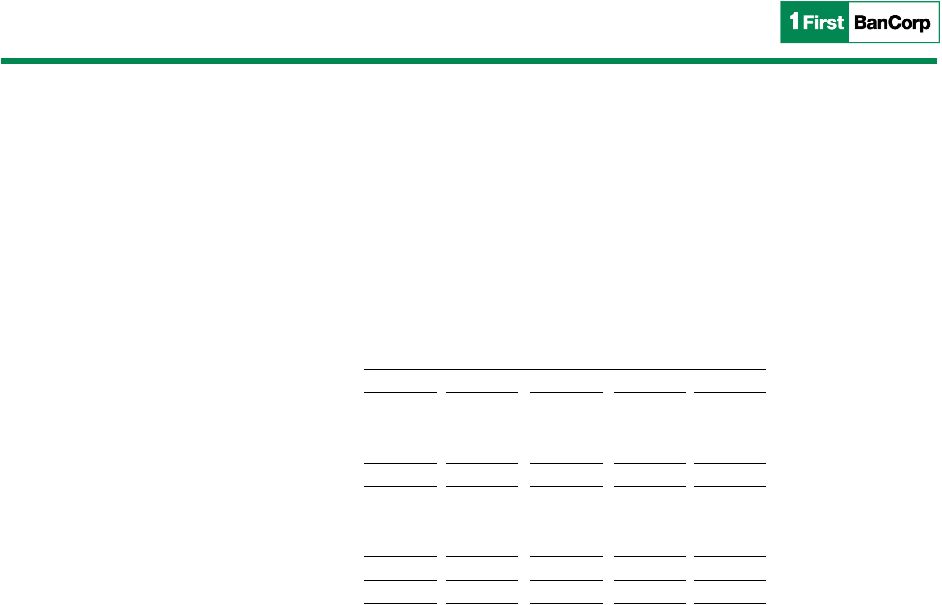
28 Use of Non-GAAP Financial Measures Basis of Presentation Use of Non-GAAP Financial Measures This presentation may contain non-GAAP financial measures. Non-GAAP financial measures are set forth when management believes they will be helpful to an understanding of the Corporation’s results of operations or financial position. Where non-GAAP financial measures are used, the comparable GAAP financial measure, as well as the reconciliation to the comparable GAAP financial measure, can be found in the text or in the attached tables to the earnings release. Tangible Common Equity Ratio and Tangible Book Value per Common Share The tangible common equity ratio and tangible book value per common share are non-GAAP financial measures generally used by the financial community to evaluate capital adequacy. Tangible common equity is total equity less preferred equity, goodwill, core deposit intangibles, and other intangibles, such as the purchased credit card relationship intangible. Tangible assets are total assets less goodwill, core deposit intangibles, and other intangibles, such as the purchased credit card relationship intangible. Management and many stock analysts use the tangible common equity ratio and tangible book value per common share in conjunction with more traditional bank capital ratios to compare the capital adequacy of banking organizations with significant amounts of goodwill or other intangible assets, typically stemming from the use of the purchase method of accounting for mergers and acquisitions. Neither tangible common equity nor tangible assets, or the related measures should be considered in isolation or as a substitute for stockholders’ equity, total assets, or any other measure calculated in accordance with GAAP. Moreover, the manner in which the Corporation calculates its tangible common equity, tangible assets, and any other related measures may differ from that of other companies reporting measures with similar names. (In thousands, except ratios and per share information) June 30, March 31, December 31, September 30, June 30, 2015 2015 2014 2014 2014 Total equity - GAAP $ 1,668,220 $ 1,705,750 $ 1,671,743 $ 1,324,157 $ 1,306,001 Preferred equity (36,104) (36,104) (36,104) (36,104) (36,104) Goodwill (28,098) (28,098) (28,098) (28,098) (28,098) Purchased credit card relationship (14,854) (15,622) (16,389) (17,235) (18,080) Core deposit intangible (10,283) (10,914) (5,420) (5,810) (6,200) Tangible common equity $ 1,578,881 $ 1,615,012 $ 1,585,732 $ 1,236,910 $ 1,217,519 Total assets - GAAP $ 12,578,813 $ 13,147,919 $ 12,727,835 $ 12,643,280 $ 12,523,251 Goodwill (28,098) (28,098) (28,098) (28,098) (28,098) Purchased credit card relationship (14,854) (15,622) (16,389) (17,235) (18,080) Core deposit intangible (10,283) (10,914) (5,420) (5,810) (6,200) Tangible assets $ 12,525,578 $ 13,093,285 $ 12,677,928 $ 12,592,137 $ 12,470,873 Common shares outstanding 214,694 213,827 212,985 212,978 212,760 Tangible common equity ratio 12.61% 12.33% 12.51% 9.82% 9.76% Tangible book value per common share 7.35 $ 7.55 $ 7.45 $ 5.81 $ 5.72 $ Tangible Equity: Tangible Assets: |