Exhibit 99.1

First BanCorp
2017 AnnualCompany-Run Stress Test Results
Severely Adverse Scenario
Dodd-Frank Act Stress Test (DFAST)
Required Disclosure
October 31, 2017
Forward-Looking Statements
This presentation may contain “forward-looking statements” concerning the Corporation’s future economic, operating and financial performance. The words or phrases “expect,” “anticipate,” “intend,” “look forward,” “should,” “would,” “believes,” “estimates” and similar expressions are meant to identify “forward-looking statements” within the meaning of Section 27A of the Securities Act of 1933, as amended, and Section 21E of the Securities Exchange Act of 1934, as amended, and are subject to the safe harbor created by such sections. These forward-looking statements are based on management’s current expectations and are subject to risks and uncertainties. Please refer to our Annual Report on Form10-K for the year ended December 31, 2016, the Quarterly Reports on Form10-Q for the quarters ended March 31, 2017 and June 30, 2017, and our other filings with the SEC for a discussion of factors that may cause the Corporation’s actual results to differ materially from any future results expressed or implied by such forward-looking statements. Those filings are available on the Corporation’s website (www.1firstbank.com) and on the Securities and Exchange Commission website (www.sec.gov). The Corporation does not undertake, and specifically disclaims any obligation, to update any “forward-looking statements” to reflect occurrences or unanticipated events or circumstances after the date of such statements, except as required by the federal securities laws.
2
Table of Contents
| Page | ||||
1. Overview of FirstBanCorp and Adopted Stress Testing Framework | 4 | |||
2. Summary Results for the Severely Adverse Scenario | 5 | |||
3. Description of Risks included in the Stress Test | 7 | |||
4. Supervisory Severely Adverse Scenario | 10 | |||
5. Summary Description of the Methodologies used in the Stress Test | 11 | |||
6. Most Significant Causes for Changes in Regulatory Capital Ratios | 12 | |||
3
1. Overview of First BanCorp and Adopted Stress Testing Framework
First BanCorp (the “Corporation”) is a publicly traded financial holding corporation (FBP: NYSE) subject to regulation, supervision and examination by the Federal Reserve Board. The Corporation was incorporated under the laws of the Commonwealth of Puerto Rico to serve as the bank holding corporation for FirstBank Puerto Rico (FirstBank or the “Bank”). FirstBank is subject to the supervision, examination and regulation of the Office of the Commissioner of Financial Institutions of the Commonwealth of Puerto Rico (“OCIF”, as its Spanish acronym), the Federal Deposit Insurance Corporation (“FDIC”), and the Consumer Financial Protection Bureau. Deposits are insured through the FDIC Deposit Insurance Fund.
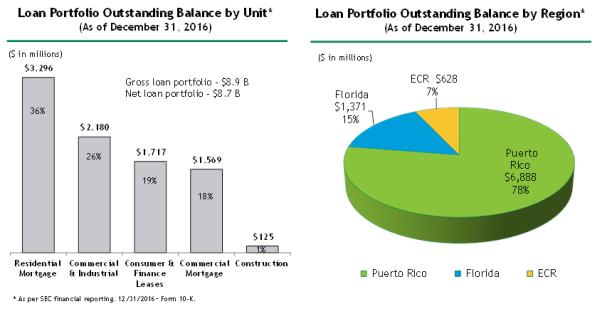
The Corporation is a full service provider of financial services and products with operations in Puerto Rico, the State of Florida and the U.S. and British Virgin Islands. As of December 31, 2016, the Corporation had total assets of $11.9 billion, total deposits of $8.8 billion and total stockholders’ equity of $1.8 billion. The Corporation provides a wide range of financial services for retail, commercial and institutional clients. As of December 31, 2016, the Corporation controlled two wholly-owned subsidiaries: FirstBank and FirstBank Insurance Agency, Inc. (“FirstBank Insurance Agency”). FirstBank is a Puerto Rico-chartered commercial bank and FirstBank Insurance Agency is a Puerto Rico-chartered insurance agency.
Dodd-Frank Act Stress Testing
In compliance with the Dodd-Frank Wall Street Reform and Consumer Protection Act (“Dodd-Frank Act” or “DFA”), the Corporation conducted a stress test to evaluate its capital sufficiency to absorb potential losses resulting from stressful economic and financial market conditions. This stress testing exercise is intended to provide management, the Corporation’s Board of Directors, shareholders, and supervisors with a forward looking analysis to gauge the potential effect of a hypothetical severely adverse scenario, encompassing variables such as changes in capital markets or real estate prices, or unanticipated deterioration of borrowers’ repayment capacity.
In the case of the Corporation, management believed it was critical to adapt the stress testing exercise to include regional macroeconomic variables when projecting losses under a severely adverse scenario. Moreover, the Corporation is complying with regulatory guidance by following the same directional path as national economic activity variables across the entire projection period. In doing so, the Corporation is adopting a set of macroeconomic scenarios that are highly severe in nature, in some cases deviating significantly from Puerto Rico’s historical experience. For example, the Bank is assuming unemployment rate in Puerto Rico reaches 18.6% under the severely adverse scenario, an increase of approximately 600 bps over the official level as of December 2016, while real GDP growth deteriorates to a quarterly reading of 10.0%. However, it is important to note that these scenarios are not intended to reflect Management’s expectations with regards to Puerto Rico’s current fiscal and economic situation.
Also, the Corporation opted to apply main regional economic activity variables (such as GDP growth, unemployment rate, inflation rate, etc.) for Florida and the Eastern Caribbean Region (“ECR” or “VI”), when available. Remaining stress testing variables, ranging from asset prices to interest rates, were modeled based on supervisory guidance.
Adopted Stress Testing Framework
The stress test projections are based on exposures as of December 31, 2016 and extend over a nine-quarter projection period that begins on January 1, 2017 and ends on March 31, 2019 (“planning horizon” or “projection period”). As of December 31, 2016, the Corporation had an outstanding total loan portfolio of $8.9 billion distributed among three geographic regions.
4
The effect of the stress scenarios on the capital levels of the Corporation was estimated by projecting the balance sheet, risk-weighted assets and net income over the projection period. These critical components were projected using the following targeted models:
| • | Credit risk models to project losses on loans; |
| • | Models to project the components ofpre-provision net revenues (“PPNR”); |
| • | Models to project balance sheets items and risk-weighted assets (“RWAs”); and |
| • | Models to project capital ratios. |
Third party models were engaged and utilized for certain projections, as well as internally-developed models.
Stress Test Results
The results that are detailed in the following section show that the Corporation has sufficient capital to withstand a severely adverse scenario taking into consideration Basel III minimum requirements that have been in effect since 2015. This capital adequacy assessment reflects the Corporation’s improved capital position and risk profile resulting from key strategic initiatives adopted by management since 2009 to strengthen the Corporation’s financial condition and solidify its franchise position in Puerto Rico and its other operating regions.
2. Summary Results for the Severely Adverse Scenario
The following results reflectpro formacapital ratios for First BanCorp under the severely adverse scenario. Under these scenarios, capital ratios decline over the nine-quarter planning horizon as credit losses exceed PPNR generation.
5
Projected Stressed Capital Ratios through Q1 2019 in the Severely Adverse Scenario
| Actual | StressedPro-Forma Capital | Minimum Capital Ratios¹ | ||||||||||||||||||||||
Capital Ratio | Q4 2016 | Q1 2019 | 9-qtr Minimum | Minimum Quarter | Adequately Capitalized | Well Capitalized | ||||||||||||||||||
Total Risk-Based Capital | 21.34 | % | 17.51 | % | 17.51 | % | Q1 2019 | 8.0 | % | 10.0 | % | |||||||||||||
Tier-1 Risk-Based Capital | 17.74 | % | 13.62 | % | 13.62 | % | Q1 2019 | 6.0 | % | 8.0 | % | |||||||||||||
Common EquityTier-12 | 17.74 | % | 13.17 | % | 13.17 | % | Q1 2019 | 4.5 | % | 6.5 | % | |||||||||||||
Tier-1 Leverage | 13.70 | % | 11.17 | % | 11.17 | % | Q1 2019 | 4.0 | % | 5.0 | % | |||||||||||||
| 1 | As defined by regulatory agencies and Basel III Minimum Capital Requirements. |
| 2 | Common EquityTier-1 calculated under Basel III is anon-GAAP measure. |
It is important to note that the reduction in capital ratios was partially due to the implementation of Basel III requirements. For example,Tier-1 Risk-Based Capital ratio decreases by approximately 412 bps (from 17.74% inQ4-2016 to 13.62% inQ1-2019) under the severely adverse scenario. Of this 412 bps reduction, 147 bps are related to the implementation of Basel III rules.
Projected Net Income (Loss) and PPNR through Q1 2019 in the Severely Adverse Scenario
| Severely Adverse Scenario – Pro Forma | ||||
Item (in $ thousands) | 9-Quarter Cumulative | |||
Net Income (Loss) | ($ | 522,082 | ) | |
Provision for Loan Losses | $ | 724,404 | ||
|
| |||
Pre-Provision Net Revenue | $ | 202,322 | ||
|
| |||
Projected Loan Losses by Type of Loan, Q1 2017 – Q1 2019 in the Severely Adverse Scenario
| Severely Adverse Scenario –Pro Forma | ||||||||
Loan Type | 9-Quarter Cumulative Losses ($millions) | 9-Quarter Cumulative Loss Rates (%)1 | ||||||
Residential Mortgage | $ | 126.6 | 4.2 | % | ||||
Commercial and Industrial2 | $ | 168.3 | 9.0 | % | ||||
Commercial Mortgage | $ | 138.4 | 10.3 | % | ||||
Construction | $ | 17.4 | 14.0 | % | ||||
Consumer and Finance Leases3 | $ | 193.9 | 12.6 | % | ||||
|
|
|
| |||||
Total | $ | 644.7 | 8.2 | % | ||||
|
|
|
| |||||
| 1 | The portfolio loss rate is calculated by dividing the nine quarter cumulative losses by the average loan balances over the same period. |
| 2 | Commercial and Industrial loans include public sector loans. |
| 3 | Consumer and Finance leases include all consumer loans, credit cards, finance leases, and auto loans. |
6
3. Description of Types of Risks included in the Stress Test
From the perspective of the Corporation, risk can be defined as the potential that events, either expected or unexpected, may have an adverse impact on the Corporation’s earnings, capital, and/or enterprise value. In the Risk Management Policy, the Corporation has identified the following types of risks as the most significant. The stress test process acts as one component of a comprehensive risk management strategy to measure, monitor, and control these risks. The Corporation’s core risk exposures include the following:
Credit Risk
Credit risk is the risk to earnings or capital arising from a borrower’s or a counterparty’s failure to meet the terms of a contract with the Corporation or otherwise perform as agreed. The adopted stress testing framework assesses credit risk through the loan level modeling of probabilities of default and estimations of expected losses across all asset classes.
Market / Interest Rate Risk
Market risk is the risk to earnings or capital arising from adverse movements in market rates or prices, such as interest rates, foreign exchange rates, or equity prices. Interest rate risk arises from an adverse movement in interest rates.
Liquidity Risk
Liquidity risk is the risk to earnings or capital arising from the possibility that the Corporation will not have sufficient cash to meet the short-term liquidity demands from deposit redemptions or loan commitments.
Operational Risk
Operational risk is the risk to earnings or capital arising from problems with services’ or products’ delivery. This risk is a function of internal controls, information systems, employee integrity, and operating processes. It also includes risks associated with the Corporation’s preparedness for the occurrence of an unforeseen event. This risk is inherent across all functions, products and services of the Corporation.
Legal and Regulatory Risk
Legal and regulatory is the risk to earnings or capital arising from the Corporation’s failure to comply with laws or regulations that can adversely affect the Corporation’s reputation and/or increase its exposure to litigation or penalties.
Reputational Risk
Reputational risk is the risk to earnings and capital arising from an adverse impact to the Corporation’s market value, capital or earnings arising from negative public opinion, whether true or not. This risk affects the Corporation’s ability to establish new relationships or services, or to continue servicing existing relationships.
Model Risk
Model risk is the potential for adverse consequences from decisions based on incorrect or misused model outputs and reports. The use of models exposes the Corporation to some level of model risk. Model errors can contribute to incorrect valuations and lead to operational errors, inappropriate business decisions or incorrect financial entries. Model risk can be reduced substantially through rigorous model identification and validation.
7
Capital Risk
Capital risk is the risk that the Corporation may lose value on its capital or has an inadequate capital plan, which results in insufficient capital resources to:
| • | Meet minimum regulatory requirements – The Corporation’s authority to operate as a bank is dependent upon the maintenance of adequate capital resources |
| • | Support its credit rating – A weaker credit rating would increase the Corporation’s cost of funds |
| • | Support its growth and strategic options |
Strategic Risk
Strategic risk refers to the risk to current or anticipated earnings, capital, or franchise or enterprise value arising from adverse business decisions, poor implementation of business decisions, or lack of responsiveness to changes in the banking industry and operating environment.
The following chart describes how each of these risks are addressed within the stress testing framework:
8
Risk Category | Exposure | Stress | Description of Stress Test Implementation | |||
| Credit | High | Yes | • Loan level modeling was developed to account for credit losses for C&I, CRE, construction, residential mortgage, auto, credit card and other consumer portfolios.
• In addition,top-down benchmark models were developed to serve as an additional challenge to the results of the main models.
| |||
| Market & Interest Rate | High | Yes | • Scenario specific interest rates were derived fromFed-provided interest rate projections. The effect of changing interest rate curves is incorporated in the PPNR modeling under each scenario.
• Effect of market prices, such as the Dow Jones Industrial Average Index and House Price Index, on overall portfolio was also modeled.
• Other than Temporary Impairments (OTTI) on Available for Sale andHeld-to-Maturity securities were forecasted. This primarily affects the Corporation’s exposure to Puerto Rico government securities.
| |||
| Liquidity | High | Yes | • Balance projections for deposits and loans were developed based on regression analysis of market data and macroeconomic scenarios.
• Stress modeling of the Corporation’s main funding sources was completed to assess liquidity risk (i.e. core and brokered deposits, FHLB advances, etc.)
• Resulting core liquidity ratio remained at adequate levels under each scenario and complied with internal liquidity guidelines.
| |||
| Operational | Medium | Partial | • OREO balances modeled through regression analysis to determine adequate level of expenses throughout different scenarios.
• Although no particular extraordinary event was modeled in terms of operational risk (i.e. major fraud, cyber-security breach, natural disasters and vendor management), given the Bank’s historical loss experience, as well as current insurance policies in place to address these potential issues, this risk was determined by management to be of low significance.
| |||
| Model | High | Yes | • Extensive validation procedures (e.g. sensitivity and back testing analysis, etc.) were performed.
• Independent third party reviewed and validated each modeling approach.
| |||
| Capital | High | Yes | • The Corporation conducted a stress test to evaluate its capital sufficiency to absorb potential losses resulting from stressful economic and financial market conditions. The 2017 DFAST exercise is intended to provide management, its board of directors, shareholders, and supervisors with forward looking analysis to gauge the potential effect of hypothetical stress scenarios per regulatory guidance adjusted as deemed necessary to consider regional macroeconomic variables.
• The stress test process links capital planning and adequacy with risk management by providing a framework through which the Corporation can assess the sustainability and feasibility of its business strategy and align them with appropriate capital requirements and threshold, and a risk appetites.
|
9
| Legal & Regulatory | Low | Yes | • It is the Corporation’s philosophy to promote compliance with legal and regulatory matters, and there is no tolerance fornon-compliance.
• In compliance with Dodd-Frank Wall Street Reform and Consumer Protection Act, the Corporation conducted the 2017 DFAST exercise and has planned to comply with all applicable regulatory requirements.
| |||
| Strategic | Medium | Partial | • Baseline scenario projections are partially based on the Corporation’s budgeting process which accounts for Management’s expectations with regards to strategic initiatives in each business unit.
| |||
| Reputational | Low | No | • Not specifically covered
|
4. Supervisory Severely Adverse Scenario
The 2017 DFAST regulatory exercise requires the use of national-level macroeconomic variables and the projections of those variables into the future under a distressed economic environment. Regulatory agencies provided a severely adverse scenario template, which the Corporation then used to forecast its balance sheet and income statement components under this economic scenario. Moreover, the Corporation developed market-based modeling assumptions specifically for DFAST balance sheet volume forecasts with the objective of designing a robust methodology to forecast loan and deposit volumes under a severely adverse economic scenario. Also, the Corporation developed these models for its three operating regions (Puerto Rico, Florida, and Eastern Caribbean Region) using regional economic activity variables, while following the same projected trend in variables shown in the national supervisory scenarios.
The severely adverse scenario is characterized by a severe global recession that is accompanied by a period of heightened stress in corporate loan markets and commercial real estate markets. In this scenario, the level of U.S. real GDP begins to decline in the first quarter of 2017 and reaches a trough in the second quarter of 2018 that is about 6 1⁄2 percent below thepre-recession peak. The unemployment rate increases by about 5 1⁄4 percentage points, to 10 percent, by the third quarter of 2018. Headline consumer price inflation falls to about 1 1⁄4 percent at an annual rate by the second quarter of 2017 and then rises to about 1 3⁄4 percent at an annual rate by the middle of 2018.
As a result of the severe decline in real activity, short-term Treasury rates fall and remain near zero through the end of the scenario period. The10-year Treasury yield drops to 3⁄4 percent in the first quarter of 2017, rising gradually thereafter to around 1 1⁄2 percent by the first quarter of 2019. Financial conditions in corporate and real estate lending markets are stressed severely. The spread between yields on investment-grade corporate bonds and yields on long-term Treasury securities widens to about 5 3⁄4 percentage points by the end of 2017, an increase of 3 1⁄2 percentage points relative to the fourth quarter of 2016. The spread between mortgage rates and10-year Treasury yields widens to over 3 1⁄2 percentage points over the same time period.
Asset prices drop sharply in this scenario. Equity prices fall by 50 percent through the end of 2017, accompanied by a surge in equity market volatility, which approaches the levels attained in 2008. House prices and commercial real estate prices also experience large declines, with house prices and commercial real estate prices falling by 25 percent and 35 percent, respectively, through the first quarter of 2019.
10
This year’s severely adverse scenario features a slightly more severe downturn in the U.S. economy as compared to last year’s scenario. Furthermore, this year’s scenario does not feature a path of negative short-term U.S. Treasury rates that was featured in last year’s scenario. In addition, this year’s severely adverse scenario features a larger decline in commercial real estate prices.
Regional Severely Adverse Scenario
Regional macroeconomic variable forecasts for Puerto Rico, Florida and USVI were indexed to national variable forecasts as required by supervisory guidelines. As such, variables projected path assumes same directionality as the national variables, with the directional trend being adjusted by the ratio of historical volatility between each of the regional and national variables. The chart below outlines all DFAST supervisory variables and their regional counterparts.
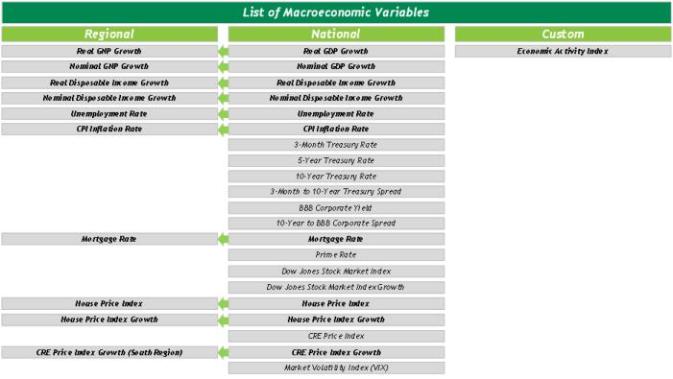
Forecasts were developed for main economic indicators across all operating regions. Given that each credit risk model used varied by asset class, different economic activity variables were used for each model. The chart below outlines the9-quarter average of four of the most important variables that went into the models:
| Real GDP Growth * | Unemployment Rate | Inflation Rate | House Price Index Growth | |||||||||||||||||||||||||||||||||||||||||||||
Period | Puerto Rico | Florida | USVI | Puerto Rico | Florida | USVI | Puerto Rico | Florida | USVI | Puerto Rico | Florida | USVI | ||||||||||||||||||||||||||||||||||||
9Q Avg. | -6.35 | % | -2.21 | % | -6.35 | % | 17.02 | % | 8.72 | % | 17.61 | % | -1.00 | % | 0.19 | % | -1.00 | % | -20.13 | % | -12.74 | % | -20.13 | % | ||||||||||||||||||||||||
| * | GNP has historically been a more representative proxy of Puerto Rico output and was used in place of GDP for Puerto Rico / USVI. |
5. Summary Description of the Methodologies used in the Stress Test
The Corporation followed atwo-pronged methodology to calculatepre-tax net income under the severely adverse scenario. First, credit risk models were used to project expected losses across a9-quarter period. Loss projections were then applied to PPNR model in order to producepre-tax net income (including the provision for loan and lease losses, “PLLL”). The main underlying assumptions that went through the projected loss modeling process included:
11
| 1. | Credit risk modeling was conducted under a static portfolio assumption (as of December 31, 2016) that includes no additional new business; credit impact on projected new loan originations and changes in volume were adjusted during the PPNR modeling phase. |
| 2. | Expected losses were calculated quarterly for the subsequent nine (9) quarters beginning Q1 2017. |
| 3. | Allowance for loan losses (“ALLL”) at the end of the projection period was computed using net charge-offs projections from Q2 2019 through Q1 2020. |
After netcharge-off rates were calculated, the PPNR model was used to project the PLLL and other income statement items following these modeling methodologies:
| 1. | Interest rate projections were based on supervisory guidance under the Severely Adverse scenario. Libor swap curve was derived from US Treasury yield curve for each tenor. |
| 2. | New business originations and end of period balance for loans and deposits were projected using a market-based volume forecast model. The model was built by performing a regression analysis of the historical behavior for loan and deposit balances of the Corporation’s main operating markets and key macroeconomic variables. Through a mix of quantitative analytics and qualitative adjustments based on current and projected market share, the Corporation developed scenario growth (or contraction) assumptions for assets (loans and securities) and liabilities (deposits). These assumptions consider the different volatilities and characteristics of the Corporation’s major geographical market areas. |
| 3. | Prepayments speeds were forecasted using an external Implied Prepayments model for MBS and mortgage loans. |
| 4. | Continued reduction in brokered deposits (55% renewal for Severely Adverse scenario). |
| 5. | Non-performing assets (NPAs) were projected based on a regression analysis of historical NPAs and several macroeconomic variables, applying the resulting determination factor to the severely adverse scenario. The resulting ratio was applied to the total projected asset volumes to get the accrual andnon-accrual volumes for balance sheet simulation. |
| 6. | The appropriate level of ALLL at the end of each month is assumed to be at least the amount needed to cover projected losses over the next four quarters. |
| 7. | The projection fornon-interest income and expense accounts for Severely Adverse scenario was based on: internal historical experience, historical relationship betweennon-interest income and expense accounts and macroeconomic variables, and, relevant ratio of correspondingnon-interest income andnon-interest expense accounts to a relevant balance sheet measure. |
| 6. | Most Significant Causes for Changes in Regulatory Capital Ratios |
Changes in the capital ratios derive from both the changes in the numerator (namely,Tier-1 capital,Tier-1 common equity capital, and total risk-based capital) and the changes in the denominator (namely, the Risk Weighted Assets “RWA” and total average assets).
The stress test exercise resulted in a reduction in available capital under the severely adverse scenario, which overall reduces the projected capital ratios. Concurrently, a projected decrease in the RWA and total average assets was reflected as a result of reduced loan origination activity and increased net charge offs due to deteriorating macroeconomic conditions, which partially offsets the reduction in available
12
capital. These reductions in both RWA and average assets are based on an extensive regression modeling exercise which shows that the entire local banking industry significantly deleveraged during the most recent period of economic stress. As a result, the Corporation’s balance sheet experiences a reduction across the 9 quarter projection period under the Severely Adverse scenario, with RWAs decreasing by approximately 10.8% and total liabilities decreasing by 14.8%.
The following chart illustrates the main components affecting the capital ratios and their impact (positive/negative) on the Corporation’s ending capital ratios:
| Actual | FBP – Changes in Capital Ratios | Projected | ||||||||||||||||||||||
Capital Ratio | Q4 2016 | Basel III Impact | PPNR | PLLL | Other1 | Q1 2019 | ||||||||||||||||||
Total Risk-Based Capital | 21.34 | % | (1.89 | %) | 2.25 | % | (8.05 | %) | 3.86 | % | 17.51 | % | ||||||||||||
Tier-1 Risk-Based Capital | 17.74 | % | (1.47 | %) | 2.25 | % | (8.05 | %) | 3.15 | % | 13.62 | % | ||||||||||||
Common EquityTier-1 | 17.74 | % | (1.49 | %) | 2.25 | % | (8.05 | %) | 2.72 | % | 13.17 | % | ||||||||||||
Tier-1 Leverage | 13.70 | % | (0.01 | %) | 1.74 | % | (6.21 | %) | 1.94 | % | 11.17 | % | ||||||||||||
| 1 | Increase is mainly due to the effect of the overall reduction in balance sheet items throughout the projection period. |
It is important to note that the projected changes in capital ratios across the projection period are slightly different for the Bank given that they contemplate the declaration of certain dividends made by the Bank to the Corporation in order to provide it with the necessary liquidity to pay all accrued and unpaid interest on the Corporation’s Trust Preferred securities. Furthermore, the projected results reflect in each quarter the assumption that interest payments will continue to be made to Trust Preferred holders throughout the projection period and that the corresponding amount will be up streamed from the Bank to the Corporation in the form of a dividend. The following chart illustrates the main components affecting the Bank’s capital ratios and their impact (positive/negative) on the Bank’s ending capital ratios:
| Actual | Bank Level – Changes in Capital Ratios | Projected | ||||||||||||||||||||||
Capital Ratio | Q4 2016 | Basel III Impact | PPNR | PLLL | Other1 | Q1 2019 | ||||||||||||||||||
Total Risk-Based Capital | 20.80 | % | (1.84 | %) | 2.37 | % | (8.05 | %) | 3.76 | % | 17.04 | % | ||||||||||||
Tier-1 Risk-Based Capital | 19.53 | % | (1.70 | %) | 2.37 | % | (8.05 | %) | 3.61 | % | 15.76 | % | ||||||||||||
Common EquityTier-1 | 16.92 | % | (2.10 | %) | 2.37 | % | (8.05 | %) | 2.78 | % | 11.92 | % | ||||||||||||
Tier-1 Leverage | 15.10 | % | (0.02 | %) | 1.83 | % | (6.21 | %) | 2.22 | % | 12.93 | % | ||||||||||||
| 1 | Increase is mainly due to the effect of the overall reduction in balance sheet items throughout the projection period. |
13