UNITED STATES
SECURITIES AND EXCHANGE COMMISSION
Washington, D.C. 20549
FORM 10-Q
| x | QUARTERLY REPORT PURSUANT TO SECTION 13 OR 15(d) OF THE SECURITIES EXCHANGE ACT OF 1934 |
For the quarterly period ended September 30, 2003
OR
| ¨ | TRANSITION REPORT PURSUANT TO SECTION 13 OR 15(d) OF THE SECURITIES EXCHANGE ACT OF 1934 |
For the transition period from to
Commission File Number 0-30218
TIME WARNER TELECOM INC.
(Exact name of Registrant as specified in its charter)
| State of Delaware | | 84-1500624 |
(State or other jurisdiction of incorporation or organization) | | (I.R.S. Employer Identification Number) |
| |
10475 Park Meadows Drive Littleton, Colorado | | 80124 |
| (Address of principal executive offices) | | (Zip Code) |
Registrant’s telephone number, including area code: (303) 566-1000
Indicate by check mark whether the Registrant (1) has filed all reports required to be filed by Section 13 or 15(d) of the Securities Exchange Act of 1934 during the preceding 12 months (or for such shorter period that the registrant was required to file such reports) and (2) has been subject to such filing requirements for the past 90 days. Yes x No ¨
Indicate by check mark whether the Registrant is an accelerated filer (as defined in Rule 12b-2 of the Exchange Act). Yes x No ¨
The number of shares outstanding of Time Warner Telecom Inc.’s common stock as of October 31, 2003 was:
Time Warner Telecom Inc. Class A common stock—49,217,476 shares
Time Warner Telecom Inc. Class B common stock—65,936,658 shares
TIME WARNER TELECOM INC.
INDEX TO FORM 10-Q
TIME WARNER TELECOM INC.
CONSOLIDATED AND CONDENSED BALANCE SHEETS
| | | September 30,
2003
| | | December 31,
2002
| |
| | | (unaudited) | | | | |
| | | (amounts in thousands, except
share amounts) | |
| ASSETS | | | | | | | |
Current assets: | | | | | | | |
Cash and cash equivalents | | $ | 404,501 | | | 506,460 | |
Marketable debt securities | | | 60,031 | | | — | |
Receivables, less allowances of $17,084 and $21,946, respectively (a) | | | 48,081 | | | 59,989 | |
Prepaid expenses | | | 12,675 | | | 11,056 | |
Deferred income taxes | | | 24,808 | | | 21,961 | |
| | |
|
|
| |
|
|
Total current assets | | | 550,096 | | | 599,466 | |
| | |
|
|
| |
|
|
Property, plant, and equipment | | | 2,181,240 | | | 2,103,717 | |
Less accumulated depreciation | | | (803,825 | ) | | (647,826 | ) |
| | |
|
|
| |
|
|
| | | | 1,377,415 | | | 1,455,891 | |
| | |
|
|
| |
|
|
Deferred income taxes | | | 33,067 | | | 36,880 | |
Goodwill, net of accumulated amortization | | | 26,773 | | | 26,773 | |
Other assets, net of accumulated amortization (note 1) | | | 29,179 | | | 30,246 | |
| | |
|
|
| |
|
|
Total assets | | $ | 2,016,530 | | | 2,149,256 | |
| | |
|
|
| |
|
|
| | |
| LIABILITIES AND STOCKHOLDERS’ EQUITY | | | | | | | |
Current liabilities: | | | | | | | |
Accounts payable (b) | | $ | 36,973 | | | 39,194 | |
Deferred revenue | | | 33,228 | | | 42,659 | |
Current portion debt and capital lease obligations (note 2) | | | 34,076 | | | 26,005 | |
Accrued franchise, tax, and other fees | | | 75,583 | | | 72,018 | |
Other current liabilities | | | 133,119 | | | 178,115 | |
| | |
|
|
| |
|
|
Total current liabilities | | | 312,979 | | | 357,991 | |
| | |
|
|
| |
|
|
Long-term debt and capital lease obligations, less current portion (note 2) | | | 1,176,845 | | | 1,206,030 | |
Other long-term liabilities (note 1) | | | 6,346 | | | — | |
Stockholders’ equity (note 1): | | | | | | | |
Preferred stock, $0.01 par value, 20,000,000 shares authorized, no shares issued and outstanding | | | — | | | — | |
Class A common stock, $0.01 par value, 277,300,000 shares authorized, 49,169,096 and 48,990,768 shares issued and outstanding as of September 30, 2003 and as of December 31, 2002, respectively | | | 491 | | | 489 | |
Class B common stock, $0.01 par value, 162,500,000 shares authorized, 65,936,658 shares issued and outstanding as of September 30, 2003 and December 31, 2002 | | | 659 | | | 659 | |
Additional paid-in capital | | | 1,169,380 | | | 1,167,765 | |
Accumulated other comprehensive income, net of taxes | | | 1,905 | | | 389 | |
Accumulated deficit | | | (652,075 | ) | | (584,067 | ) |
| | |
|
|
| |
|
|
Total stockholders’ equity | | | 520,360 | | | 585,235 | |
| | |
|
|
| |
|
|
Total liabilities and stockholders’ equity | | $ | 2,016,530 | | | 2,149,256 | |
| | |
|
|
| |
|
|
| | |
(a) Includes receivables resulting from transactions with affiliates (note 3) | | $ | 4,127 | | | 5,840 | |
| | |
|
|
| |
|
|
(b) Includes payables resulting from transactions with affiliates (note 3) | | $ | 5,733 | | | 5,599 | |
| | |
|
|
| |
|
|
See accompanying notes.
1
TIME WARNER TELECOM INC.
CONSOLIDATED STATEMENTS OF OPERATIONS
(Unaudited)
| | | Three Months Ended
September 30,
| | | Nine Months Ended
September 30,
| |
| | | 2003
| | | 2002
| | | 2003
| | | 2002
| |
| | | (amounts in thousands, except share amounts) | |
| | | | |
Revenue (a): | | | | | | | | | | | | | | |
Dedicated transport services | | $ | 94,066 | | | 92,556 | | | $ | 269,420 | | | 280,170 | |
Switched services | | | 38,957 | | | 36,078 | | | | 115,281 | | | 110,007 | |
Data and Internet services | | | 25,700 | | | 23,410 | | | | 74,135 | | | 65,758 | |
Intercarrier compensation | | | 13,705 | | | 15,121 | | | | 41,377 | | | 64,525 | |
| | |
|
|
| |
|
| |
|
|
| |
|
|
Total revenue | | | 172,428 | | | 167,165 | | | | 500,213 | | | 520,460 | |
| | |
|
|
| |
|
| |
|
|
| |
|
|
Costs and expenses (a): | | | | | | | | | | | | | | |
Operating (exclusive of depreciation, amortization, and accretion shown separately below) | | | 66,631 | | | 70,799 | | | | 198,461 | | | 216,966 | |
Selling, general, and administrative | | | 31,162 | | | 56,293 | | | | 128,294 | | | 171,710 | |
Depreciation, amortization, and accretion | | | 56,408 | | | 61,763 | | | | 164,876 | | | 176,269 | |
| | |
|
|
| |
|
| |
|
|
| |
|
|
Total costs and expenses | | | 154,201 | | | 188,855 | | | | 491,631 | | | 564,945 | |
| | |
|
|
| |
|
| |
|
|
| |
|
|
Operating income (loss) | | | 18,227 | | | (21,690 | ) | | | 8,582 | | | (44,485 | ) |
Interest expense | | | (25,908 | ) | | (26,760 | ) | | | (78,520 | ) | | (78,435 | ) |
Interest income | | | 1,326 | | | 1,517 | | | | 4,648 | | | 4,317 | |
Investment gains (losses), net | | | 922 | | | (1,283 | ) | | | 922 | | | (3,240 | ) |
| | |
|
|
| |
|
| |
|
|
| |
|
|
Net loss before income taxes and cumulative effect of change in accounting principle | | | (5,433 | ) | | (48,216 | ) | | | (64,368 | ) | | (121,843 | ) |
Income tax expense | | | 225 | | | 150 | | | | 675 | | | 450 | |
| | |
|
|
| |
|
| |
|
|
| |
|
|
Net loss before cumulative effect of change in accounting principle | | | (5,658 | ) | | (48,366 | ) | | | (65,043 | ) | | (122,293 | ) |
Cumulative effect of change in accounting principle (note 1) | | | — | | | — | | | | 2,965 | | | — | |
| | |
|
|
| |
|
| |
|
|
| |
|
|
Net loss | | $ | (5,658 | ) | | (48,366 | ) | | $ | (68,008 | ) | | (122,293 | ) |
| | |
|
|
| |
|
| |
|
|
| |
|
|
Amounts per common share, basic and diluted: | | | | | | | | | | | | | | |
Loss before cumulative effect of change in accounting principle | | $ | (0.05 | ) | | (0.42 | ) | | $ | (0.57 | ) | | (1.07 | ) |
Cumulative effect of change in accounting principle (note 1) | | | — | | | — | | | | (0.02 | ) | | — | |
| | |
|
|
| |
|
| |
|
|
| |
|
|
Net loss | | $ | (0.05 | ) | | (0.42 | ) | | $ | (0.59 | ) | | (1.07 | ) |
| | |
|
|
| |
|
| |
|
|
| |
|
|
Weighted average shares outstanding, basic and diluted | | | 114,936 | | | 114,827 | | | | 114,931 | | | 114,772 | |
| | |
|
|
| |
|
| |
|
|
| |
|
|
| | | | |
(a) Includes revenue and expenses resulting from transactions with affiliates (note 3): | | | | | | | | | | | | | | |
Revenue | | $ | 9,404 | | | 5,966 | | | $ | 24,758 | | | 21,828 | |
| | |
|
|
| |
|
| |
|
|
| |
|
|
Operating expenses | | $ | 975 | | | 754 | | | $ | 2,755 | | | 2,239 | |
| | |
|
|
| |
|
| |
|
|
| |
|
|
Selling, general, and administrative | | $ | 482 | | | 403 | | | $ | 1,397 | | | 1,197 | |
| | |
|
|
| |
|
| |
|
|
| |
|
|
See accompanying notes.
2
TIME WARNER TELECOM INC.
CONSOLIDATED STATEMENTS OF CASH FLOWS
(Unaudited)
| | | Nine Months Ended
September 30,
| |
| | | 2003
| | | 2002
| |
| | | (amounts in thousands) | |
Cash flows from operating activities: | | | | | | | |
Net loss | | $ | (68,008 | ) | | (122,293 | ) |
Adjustments to reconcile net loss to net cash provided by operating activities: | | | | | | | |
Depreciation, amortization, and accretion | | | 164,876 | | | 176,269 | |
Cumulative effect of change in accounting principle | | | 2,965 | | | — | |
Investment (gains) losses, net | | | (922 | ) | | 3,240 | |
Stock-based compensation | | | 1,178 | | | 1,201 | |
Amortization of deferred debt issue costs | | | 3,386 | | | 3,440 | |
Changes in operating assets and liabilities: | | | | | | | |
Receivables and prepaid expenses | | | 10,219 | | | 8,804 | |
Accounts payable, deferred revenue, and other current liabilities | | | (52,503 | ) | | (50,571 | ) |
| | |
|
|
| |
|
|
Net cash provided by operating activities | | | 61,191 | | | 20,090 | |
| | |
|
|
| |
|
|
Cash flows from investing activities: | | | | | | | |
Capital expenditures | | | (84,787 | ) | | (92,096 | ) |
Purchases of marketable securities | | | (168,988 | ) | | (8,566 | ) |
Proceeds from maturity of marketable securities | | | 108,957 | | | 23,000 | |
Proceeds from sale of investment | | | 1,262 | | | — | |
Other investing activities | | | 111 | | | — | |
| | |
|
|
| |
|
|
Net cash used in investing activities | | | (143,445 | ) | | (77,662 | ) |
| | |
|
|
| |
|
|
Cash flows from financing activities: | | | | | | | |
Net proceeds from issuance of common stock upon exercise of stock options | | | 155 | | | 145 | |
Net proceeds from issuance of common stock in connection with employee stock purchase plan | | | 284 | | | 90 | |
Payment of capital lease obligations | | | (2,144 | ) | | (3,237 | ) |
Payment of debt obligations | | | (18,000 | ) | | — | |
| | |
|
|
| |
|
|
Net cash used in financing activities | | | (19,705 | ) | | (3,002 | ) |
| | |
|
|
| |
|
|
Decrease in cash and cash equivalents | | | (101,959 | ) | | (60,574 | ) |
Cash and cash equivalents at beginning of period | | | 506,460 | | | 365,600 | |
| | |
|
|
| |
|
|
Cash and cash equivalents at end of period | | $ | 404,501 | | | 305,026 | |
| | |
|
|
| |
|
|
| | |
Supplemental disclosures of cash flow information: | | | | | | | |
Cash paid for interest | | $ | 96,717 | | | 98,240 | |
| | |
|
|
| |
|
|
Cash paid for income taxes | | $ | 1,189 | | | 477 | |
| | |
|
|
| |
|
|
Cancellation of a capital lease obligation | | $ | 3,669 | | | — | |
| | |
|
|
| |
|
|
Addition of capital lease obligation | | $ | 1,729 | | | — | |
| | |
|
|
| |
|
|
See accompanying notes.
3
TIME WARNER TELECOM INC.
CONSOLIDATED STATEMENTS OF CHANGES IN STOCKHOLDERS’ EQUITY
Nine Months Ended September 30, 2003
(Unaudited)
| | | Common Stock
| | Additional
paid-in
capital
| | Accumulated
other
comprehensive
income,
net of taxes
| | Accumulated
deficit
| | | Total
stockholders’
equity
| |
| | | Class A
| | Class B
| | | | |
| | | Shares
| | Amount
| | Shares
| | Amount
| | | | |
| | | (amounts in thousands) | |
| | | | | | | | |
Balance at January 1, 2003 | | 48,991 | | $ | 489 | | 65,937 | | $ | 659 | | 1,167,765 | | 389 | | (584,067 | ) | | 585,235 | |
Change in unrealized holding gain for available-for-sale securities, net of taxes | | — | | | — | | — | | | — | | — | | 1,516 | | — | | | 1,516 | |
Net loss | | — | | | — | | — | | | — | | — | | — | | (68,008 | ) | | (68,008 | ) |
| | | | | | | | | | | | | | | | | | | |
|
|
Comprehensive loss | | | | | | | | | | | | | | | | | | | (66,492 | ) |
| | | | | | | | | | | | | | | | | | | |
|
|
Shares issued for cash in connection with the exercise of stock options | | 28 | | | 1 | | — | | | — | | 154 | | — | | — | | | 155 | |
Shares issued for cash in connection with the Employee Stock Purchase Plan | | 150 | | | 1 | | | | | | | 283 | | | | | | | 284 | |
Stock based compensation | | — | | | — | | — | | | — | | 1,178 | | — | | — | | | 1,178 | |
| | |
| |
|
| |
| |
|
| |
| |
| |
|
| |
|
|
Balance at September 30, 2003 | | 49,169 | | $ | 491 | | 65,937 | | $ | 659 | | 1,169,380 | | 1,905 | | (652,075 | ) | | 520,360 | |
| | |
| |
|
| |
| |
|
| |
| |
| |
|
| |
|
|
See accompanying notes.
4
TIME WARNER TELECOM INC.
NOTES TO CONSOLIDATED AND CONDENSED FINANCIAL STATEMENTS
September 30, 2003
(unaudited)
| 1. | Organization and Summary of Significant Accounting Policies |
Description of Business and Capital Structure
Time Warner Telecom Inc. (the “Company”), a Delaware corporation, is a fiber facilities-based provider of metropolitan and regional optical broadband networks and services to business customers in 44 metropolitan markets in the United States. The Company delivers broadband data, dedicated Internet access, and local and long distance voice services. The Company’s customers are principally telecommunications-intensive businesses, long distance carriers, Internet service providers (“ISPs”), wireless communications companies, incumbent local exchange carriers (“ILECs”), competitive local exchange carriers (“CLECs”), educational institutions, and governmental entities.
The Company has two classes of common stock outstanding, Class A common stock and Class B common stock. Holders of Class A common stock have one vote per share and holders of Class B common stock have ten votes per share. Each share of Class B common stock is convertible, at the option of the holder, into one share of Class A common stock. The Class B common stock is collectively owned by subsidiaries of Time Warner Inc. (“Time Warner”) and Advance Telecom Holdings Corporation and Newhouse Telecom Holdings Corporation (“Advance/Newhouse”). Holders of Class A common stock and Class B common stock generally vote together as a single class. However, some matters require the approval of 100% of the holders of the Class B common stock voting separately as a class, and some matters require the approval of a majority of the holders of the Class A common stock, voting separately as a class. As of September 30, 2003, the Class B stockholders held approximately 93% of the combined voting power of the outstanding common stock.
Basis of Presentation
The accompanying interim consolidated and condensed financial statements are unaudited, but in the opinion of management, reflect all adjustments necessary for a fair presentation of the results for the periods indicated. The results of operations for any interim period are not necessarily indicative of results for the full year. The accompanying financial statements should be read in conjunction with the audited consolidated financial statements and notes thereto for the year ended December 31, 2002.
The preparation of financial statements in conformity with accounting principles generally accepted in the United States requires management to make estimates and assumptions that affect the reported amounts of assets and liabilities at the date of the financial statements and the reported amounts of revenue and expenses during the reporting period. Actual results could differ from those estimates.
Basis of Consolidation
The consolidated and condensed financial statements include the accounts of the Company and all entities in which the Company has a controlling voting interest (“subsidiaries”). Significant intercompany accounts and transactions have been eliminated. Significant accounts and transactions with Time Warner and Advance/Newhouse and their affiliates are disclosed as related party transactions.
5
TIME WARNER TELECOM INC.
NOTES TO CONSOLIDATED AND CONDENSED FINANCIAL STATEMENTS - continued
Investments
Marketable equity securities held by the Company are classified as available-for-sale. Accordingly, these securities are included in other assets at fair value. Unrealized holding gains and losses on securities classified as available-for-sale are carried, net of taxes, as a component of accumulated other comprehensive income in stockholders’ equity. Other equity investments that are not considered marketable securities and in which the Company’s ownership interest is less than 20% are generally carried at the lower of cost or net realizable value. Realized gains and losses are determined on a specific identification basis.
At September 30, 2003, the fair value of the Company’s available-for-sale securities totaled $3.5 million, and the aggregate unrealized holding gain, net of tax, on these securities was $1.9 million. The increase in the unrealized holding gain for available-for-sale securities was $1.5 million for the nine months ended September 30, 2003.
During the nine months ended September 30, 2002, the Company recognized a net loss of $3.2 million on investments. The net loss included a $2.6 million loss related to a marketable security whose decline in value was not temporary in nature and a $1.0 million impairment on an equity investment in a non-public company that is not considered a marketable security. These losses were partially offset by a $400,000 gain on the exchange of shares in a privately held company for shares in a publicly held company. During the nine months ended September 30, 2003, the Company recognized a net gain on the sale of securities of $922,000.
At September 30, 2003, the Company held $60.0 million of marketable debt securities which are classified as held to maturity investments and are carried at amortized cost. These securities primarily consist of discount notes and commercial paper that have a holding period of greater than 90 days. The estimated fair value of these securities is not materially different from the amortized cost.
Revenue
The Company’s revenue is derived primarily from business communications services, including dedicated transport, local switched voice, long distance, data and high-speed Internet access services, and intercarrier compensation, which is comprised of reciprocal compensation and switched access services. The Company’s customers are principally telecommunications-intensive businesses, long distance carriers, ISPs, wireless communications companies, ILECs, CLECs, educational institutions, and governmental entities.
Revenue for dedicated transport, data, Internet, and the majority of switched services is generally billed a month in advance on a fixed rate basis and recognized over the period the services are provided. Revenue for the majority of switched access services and long distance is generally billed on a transactional basis determined by customer usage with some fixed rate elements. The transactional elements of switched services are billed in arrears, and estimates are used to recognize revenue in the period earned.
The Company evaluates whether receivables are reasonably assured of collection based on certain factors, including the likelihood of billings being disputed by customers. In situations where a dispute is likely, revenue is not recognized until cash is collected. Reciprocal compensation is a component of intercarrier compensation revenue that represents compensation from local exchange carriers (“LECs”) for local exchange traffic originated by other LECs and terminated on the Company’s facilities. The Company recognizes reciprocal compensation revenue primarily on a cash basis except in those cases where the revenue is under dispute or at risk, in which case the Company defers recognition of the revenue until the outstanding issues are resolved. As of September 30, 2003 and December 31, 2002, the Company had deferred recognition of $10.4 million
6
TIME WARNER TELECOM INC.
NOTES TO CONSOLIDATED AND CONDENSED FINANCIAL STATEMENTS - continued
and $12.8 million, respectively, in reciprocal compensation revenue for payments received associated with the pending disputes.
Receivables
The Company performs ongoing credit evaluations of significant customers’ financial conditions and has established an allowance for doubtful accounts based on the expected collectability of all receivables. In certain cases, the Company requires deposits from customers that it deems to represent a higher credit risk. A higher risk of collectability is assigned to certain customers with deteriorating financial conditions and customers in bankruptcy that continue service subsequent to filing bankruptcy, resulting in a greater allowance for doubtful accounts. Considerable management judgment is required in evaluating the collectability of receivables and establishing the related allowance for doubtful accounts. If the financial condition of the Company’s customers deteriorates, the Company’s bad debt expense and cash collections will be negatively impacted. The allowance for doubtful accounts was $17.1 million, or 26% of gross receivables at September 30, 2003, down from $21.9 million or 27% of gross receivables at December 31, 2002.
Significant Customers
The Company has substantial business relationships with a few large customers, including major long distance carriers. The Company’s top 10 customers accounted for 39% and 46% of the Company’s consolidated revenue for the nine months ended September 30, 2003 and 2002, respectively. WorldCom, Inc. (“WorldCom”), which filed for Chapter 11 bankruptcy protection in July 2002, accounted for 8% and 12% of the Company’s total revenue for the nine months ended September 30, 2003 and 2002, respectively. In September 2003, as part of the WorldCom bankruptcy proceedings, the bankruptcy court approved the terms of a settlement with the Company that resolved a number of open disputes and claims through June 30, 2003, including amounts payable to and from each party. As a result of the settlement, the Company recognized $5.2 million of previously deferred revenue and relieved $15.1 million in expenses in the third quarter of 2003. No customer accounted for 10% or more of total revenue in the nine months ended September 30, 2003, and WorldCom was the only customer that accounted for 8% or more of total revenue for the nine months ended September 30, 2002.
Income Taxes
As of September 30, 2003, the Company has recorded a deferred tax asset of $57.9 million, net of a valuation allowance of $165.6 million. The Company has concluded that it is more likely than not that the net deferred tax asset of $57.9 million will be realized because the Company could utilize tax-planning strategies to realize this amount. However, the Company believes there may be risks in realizing amounts in excess of the $57.9 million through utilization of available tax planning strategies. Accordingly, the Company has established a valuation allowance for amounts in excess of $57.9 million.
Asset Retirement Obligations
Effective January 1, 2003, the Company adopted the provisions of Financial Accounting Standards Board Statement No. 143,Accounting for Asset Retirement Obligations (“SFAS 143”). SFAS 143 requires that the estimated fair value of an asset retirement obligation be recorded when incurred. The associated asset retirement costs are capitalized as part of the carrying amount of the long-lived asset and depreciated over the asset’s estimated useful life. The Company has asset retirement obligations related to decommissioning of electronics in leased facilities and the removal of certain fiber and conduit systems. Considerable management judgment is required in estimating these obligations. Important assumptions include estimates of retirement costs, the timing of the
7
TIME WARNER TELECOM INC.
NOTES TO CONSOLIDATED AND CONDENSED FINANCIAL STATEMENTS - continued
future retirement activities, and the likelihood of retirement provisions being enforced. Changes in these assumptions based on future information could result in adjustments to estimated liabilities.
In conjunction with the adoption of SFAS 143, the Company recorded a $5.9 million liability, an asset of $2.9 million in property, plant, and equipment, and a $3.0 million charge to earnings to account for the cumulative effect of the depreciation and accretion expense that would have been recorded had SFAS 143 been in effect in earlier periods. The asset retirement obligation increased from $5.9 million as of January 1, 2003 to $6.3 million as of September 30, 2003 due to the accretion of the liability. The pro forma effects of the application of SFAS 143 as if the statement had been in effect in earlier periods are presented below:
| | | Nine Months Ended
September 30,
| |
| | | 2003
| | | 2002
| |
| | | (amounts in thousands) | |
| | |
Actual loss, as reported | | $ | (68,008 | ) | | (122,293 | ) |
Add back cumulative effect of change in accounting principle | | $ | 2,965 | | | — | |
Less depreciation and accretion expense | | $ | — | | | (385 | ) |
| | |
|
|
| |
|
|
Pro forma loss | | $ | (65,043 | ) | | (122,678 | ) |
| | |
|
|
| |
|
|
Pro forma loss per share | | $ | (0.57 | ) | | (1.07 | ) |
| | |
|
|
| |
|
|
The pro forma asset retirement obligation as if SFAS 143 had been in effect in earlier periods is $5.4 million as of December 31, 2001 and $5.8 million as of September 30, 2002.
Segment Reporting
As of September 30, 2003, the Company operated in 44 metropolitan markets. The Company’s management makes decisions on resource allocation and assesses performance based on total revenue, EBITDA, which is operating income (loss) before depreciation, amortization and accretion, and capital spending of these operating locations. Each of the service areas offers similar products and services, has similar customers and networks, is subject to the same type of regulation, and is managed directly by the Company’s executives. As such, the Company has aggregated its service areas into one line of business for financial reporting purposes.
Loss Per Common Share and Potential Common Share
Basic loss per share for all periods presented herein was computed by dividing the net loss by the weighted average shares outstanding for the period.
The diluted loss per common share for all periods presented was computed by dividing the net loss attributable to common shares by the weighted average outstanding common shares for the period. Potential common shares related to stock options were not included in the computation of weighted average shares outstanding because their inclusion would be anti-dilutive.
Stock Option Accounting
The Company has elected to follow Accounting Principles Board Opinion No. 25,Accounting for Stock Issued to Employees (“APB 25”), and related interpretations in accounting for its employee stock options. Under APB 25, because the exercise price of the Company’s employee stock options is generally equal to the market price of the underlying stock on the date of the grant, no compensation expense is recognized. Financial Accounting Standards Board Statement No. 123,Accounting and Disclosure of Stock-Based Compensation (“SFAS 123”), establishes an alternative method of expense recognition for stock-based compensation awards to employees based on
8
TIME WARNER TELECOM INC.
NOTES TO CONSOLIDATED AND CONDENSED FINANCIAL STATEMENTS - continued
estimated fair values. The Company elected not to adopt SFAS 123 for expense recognition purposes.
Pro forma information regarding net income and earnings per share is required by SFAS 123 and has been determined as if the Company had accounted for its employee stock options under the fair value method of SFAS 123. The fair value for these options was estimated at the date of grant using a Black-Scholes option pricing model with the following weighted-average assumptions: risk-free interest rate of 3.0% in each of the nine months ended September 30, 2003 and 2002; dividend yield of 0.0% during each period; volatility factor of the expected market price of the Company’s common stock of 1.22 and 1.26 for the nine months ended September 30, 2003 and 2002, respectively; and a weighted-average expected life of the options of five years during each period.
The Black-Scholes option valuation model was developed for use in estimating the fair value of traded options, which have no vesting restrictions and are fully transferable. In addition, option valuation models require the input of highly subjective assumptions including expected stock price characteristics significantly different from those of traded options. Because changes in the subjective input assumptions can materially affect the fair value estimate, in management’s opinion, the existing models do not necessarily provide a reliable single measure of the fair value of the Company’s employee stock options.
The weighted-average fair value of options granted for the nine months ended September 30, 2003 and 2002 was $4.80 and $3.31, respectively. For purposes of pro forma disclosures, the estimated fair value of the options is amortized to expense over the options’ vesting period. The Company’s pro forma net loss and pro forma net loss per share, as if the Company had used the fair value accounting provisions of SFAS 123, are shown below:
| | | Three months ended
September 30,
| | | Nine months ended
September 30,
| |
| | | 2003
| | | 2002
| | | 2003
| | | 2002
| |
| | | (amounts in thousands, except per share amounts) | |
| | | | |
Net loss | | $ | (5,658 | ) | | (48,366 | ) | | $ | (68,008 | ) | | (122,293 | ) |
Add back expense calculated under APB 25 | | | 132 | | | 132 | | | | 395 | | | 395 | |
Less expense calculated under SFAS 123 | | | (14,509 | ) | | (15,718 | ) | | | (44,956 | ) | | (52,843 | ) |
| | |
|
|
| |
|
| |
|
|
| |
|
|
Pro forma net loss | | | (20,035 | ) | | (63,952 | ) | | | (112,569 | ) | | (174,741 | ) |
| | |
|
|
| |
|
| |
|
|
| |
|
|
Pro forma basic and diluted loss per share | | $ | (0.17 | ) | | (0.56 | ) | | $ | (0.98 | ) | | (1.52 | ) |
| | |
|
|
| |
|
| |
|
|
| |
|
|
| 2. | Long-Term Debt and Capital Lease Obligations |
Long-term debt and capital lease obligations are summarized as follows:
| | | September 30,
2003
| | | December 31,
2002
| |
| | | (amounts in thousands) | |
| | |
9 3/4% Senior Notes | | $ | 400,000 | | | 400,000 | |
10 1/8% Senior Notes | | | 400,000 | | | 400,000 | |
Credit facility | | | 402,000 | | | 420,000 | |
Capital lease obligations | | | 8,921 | | | 12,035 | |
| | |
|
|
| |
|
|
| | | $ | 1,210,921 | | | 1,232,035 | |
Less current portion of debt and capital lease obligations | | | (34,076 | ) | | (26,005 | ) |
| | |
|
|
| |
|
|
| | | $ | 1,176,845 | | | 1,206,030 | |
| | |
|
|
| |
|
|
9
TIME WARNER TELECOM INC.
NOTES TO CONSOLIDATED AND CONDENSED FINANCIAL STATEMENTS - continued
The $400 million 9 3/4% Senior Notes due July 2008 (the “9 3/4% Senior Notes”) are unsecured, unsubordinated obligations of the Company. Interest on the 9 3/4% Senior Notes is payable semi-annually on January 15 and July 15. Interest expense, including amortization of deferred debt issue costs, relating to the 9¾% Senior Notes totaled approximately $30 million in each of the nine-month periods ended September 30, 2003 and 2002. At September 30, 2003, the estimated fair market value of the $400 million of 9¾% Senior Notes was approximately $396 million.
The $400 million 10 1/8% Senior Notes due February 2011 (the “10 1/8% Senior Notes”) are unsecured, unsubordinated obligations of the Company. Interest on the 10 1/8% Senior Notes is payable semi-annually on February 1 and August 1. Interest expense, including amortization of deferred debt issue costs, relating to the 10 1/8% Senior Notes totaled approximately $31 million in each of the nine-month periods ended September 30, 2003 and 2002. At September 30, 2003, the estimated fair market value of the $400 million of 10 1/8% Senior Notes was at par.
Neither the 9 3/4% Notes nor the 10 1/8% Notes have been listed on any securities exchange or inter-dealer automated quotation system, and the estimated market value is based on indicative pricing published by investment banks. While the Company believes these approximations to be reasonably accurate at the time published, indicative pricing can vary widely depending on the volume traded by any given investment bank.
The 9 3/4% Senior Notes and the 10 1/8% Senior Notes are governed by indentures that contain certain restrictive covenants. These restrictions affect, and in many respects significantly limit or prohibit, among other things, the ability of the Company to incur indebtedness, make prepayments of certain indebtedness, pay dividends, make investments, engage in transactions with stockholders and affiliates, issue capital stock of subsidiaries, create liens, sell assets, and engage in mergers and consolidations.
In December 2000, the Company entered into an amended and restated credit facility (the “Credit Facility”) providing for an aggregate $1 billion in borrowings. In October 2002, the Company and its lenders further amended the Credit Facility and reduced the total commitments of the lenders from $1 billion to $800 million. The amended Credit Facility consists of the following components:
| | • | | A $380 million senior secured revolving credit facility. This facility decreases to $361 million on December 31, 2004, $304 million on December 31, 2005, and $190 million on December 31, 2006, with a final maturity of December 31, 2007. Interest is calculated based on a specified Eurodollar rate plus a margin of 1.75 to 2.75%. As of September 30, 2003, no amounts were outstanding under this facility. |
| | • | | A $200 million term loan. Amortization of principal began March 31, 2003 and continues quarterly until March 31, 2008. Through September 30, 2003, principal payments on this facility totaled $1.5 million. Interest is computed utilizing a specified Eurodollar rate plus 4.0%, which totaled 5.1% on September 30, 2003, and is payable at least quarterly. As of September 30, 2003, $198.5 million was outstanding under this facility. |
| | • | | A $220 million senior delayed draw loan facility. Amortization of principal began March 31, 2003 and continues quarterly until December 31, 2007. Through September 30, 2003, principal payments on this facility totaled $16.5 million. Interest is computed based on a specified Eurodollar rate plus a margin of 1.75 to 2.75%, which totaled 2.9% on September 30, 2003 and is payable at least quarterly. As of September 30, 2003, $203.5 million was outstanding under this facility. |
10
TIME WARNER TELECOM INC.
NOTES TO CONSOLIDATED AND CONDENSED FINANCIAL STATEMENTS - continued
The Company is required to pay commitment fees on a quarterly basis ranging from 0.5% to 1.0% per annum on the undrawn available commitment of the Credit Facility. Commitment fee expense was $2.2 million for the nine months ended September 30, 2003 and has been classified as a component of interest expense in the accompanying consolidated and condensed statements of operations.
Borrowings under the Credit Facility are secured by substantially all of the assets of the Company, except for certain assets with respect to which the grant of a security interest is prohibited by governing agreements. The Credit Facility requires the Company to prepay outstanding loans when its cash flow exceeds certain levels and with the proceeds received from a number of specified events or transactions, including certain asset sales and insurance recoveries for assets not replaced. In addition, obligations under the Credit Facility are subject to various covenants that limit the Company’s ability to borrow and incur liens on its property, pay dividends or make other distributions, and make capital expenditures.
The Credit Facility also contains financial covenants, including a leverage ratio, an interest coverage ratio, and a debt service coverage ratio, as well as cross default provisions. Under the cross default provisions, the Company is deemed to be in default under the Credit Facility if the Company has defaulted under any of the other material outstanding obligations, including the 9 3/4% Senior Notes or the 10 1/8% Senior Notes. As of September 30, 2003, the Company was in compliance with all covenants under the Credit Facility and other debt agreements.
| 3. | Related Party Transactions |
In the normal course of business, the Company engages in various transactions with Time Warner and its affiliates, including Time Warner Cable and affiliates of Advance/Newhouse, generally on negotiated terms among the affected units that, in management’s opinion, result in reasonable allocations of joint costs between the parties.
The Company benefits from its relationship with Time Warner Cable, both through access to local rights-of-way and construction cost sharing. The Company has similar arrangements with a subsidiary (“TWE-A/N Subsidiary”) of the Time Warner Entertainment-Advance/Newhouse partnership (“TWE-A/N”), a partnership owned by affiliates of the Company’s Class B Stockholders that owns certain cable systems in Florida and Indiana and is managed by affiliates of Advance/Newhouse. Twenty-three of the Company’s 44 markets use fiber optic capacity licensed from Time Warner Cable or TWE-A/N Subsidiary. Under the terms of those agreements, if the Company wishes to license fiber optic capacity in addition to the capacity initially licensed in 1998, the Company must pay Time Warner Cable or TWE-A/N Subsidiary an amount equal to the Company’s allocable share of the total cost of constructing the route in question, plus permitting and supervision fees as a license fee. Under those agreements, the Company licenses discrete fibers and attaches its own electronics so that the Company’s networks are functionally separate from the licensor’s. Pursuant to the licensing arrangements, the Company paid Time Warner Cable $1.6 million and $2.0 million for the nine months ended September 30, 2003 and 2002, respectively, and TWE-A/N Subsidiary $46,000 for the nine months ended September 30, 2003. The Company pays the license fee at the time the network is constructed. These fees are capitalized to property, plant, and equipment and amortized over their useful lives as depreciation and amortization expense. As of September 30, 2003, the Company’s property, plant, and equipment included $183.4 million in licenses of fiber optic capacity pursuant to the agreements.
Under the licensing arrangements, the Company reimburses Time Warner Cable and TWE-A/N Subsidiary for facility maintenance and pole and conduit rental costs. The reimbursements to Time Warner Cable aggregated $2.4 and $2.2 million for the nine month periods ended September 30, 2003 and 2002, respectively, and to TWE-A/N Subsidiary aggregated $385,000 for the nine
11
TIME WARNER TELECOM INC.
NOTES TO CONSOLIDATED AND CONDENSED FINANCIAL STATEMENTS - continued
months ended September 30, 2003, and are a component of operating expenses in the consolidated statements of operations. In certain cases the Company’s operations are co-located with Time Warner Cable’s or TWE-A/N Subsidiary’s facilities and are allocated a charge for various overhead expenses. Under the terms of leases and subleases for these facilities, allocations for rent payable to Time Warner Cable or TWE-A/N Subsidiary are typically based on square footage and allocations for utility charges are based on actual usage. Such charges from Time Warner Cable aggregated $1.4 and $1.2 million for the nine months ended September 30, 2003 and 2002, respectively, and from TWE-A/N Subsidiary aggregated $7,000 for the nine months ended September 30, 2003, and are a component of selling, general, and administrative expenses in the consolidated and condensed statements of operations. The rates charged by these affiliates for rent and utilities do not differ materially from charges the Company incurs in locations where the Company is not co-located with Time Warner Cable or TWE-A/N Subsidiary.
Time Warner and its affiliates and TWE-A/N Subsidiary also purchase services from the Company. Revenue from Time Warner and its affiliates, including dedicated transport services, switched services, and data and Internet services, aggregated $24.6 million and $21.8 million for the nine months ended September 30, 2003 and 2002, respectively. Revenue from TWE-A/N Subsidiary totaled $150,000 for the nine months ended September 30, 2003.
| 4. | Commitments and Contingencies |
Pending legal proceedings are substantially limited to litigation incidental to the business of the Company. In the opinion of management, the ultimate resolution of these matters will not have a material adverse effect on the Company’s financial statements.
Management routinely reviews the Company’s exposure to liabilities incurred in the normal course of its business operations. Where a probable contingency exists and the amount can be reasonably estimated, the Company records the estimated liability. Considerable judgment is required in analyzing and recording such liabilities, and actual results could vary from the estimates.
12
TIME WARNER TELECOM INC.
Management’s Discussion and Analysis of Financial Condition and
Results of Operations
The following discussion and analysis provides information concerning the results of operations and financial condition of Time Warner Telecom Inc. and should be read in conjunction with the accompanying financial statements and notes thereto. Additionally, the following discussion and analysis should be read in conjunction withManagement’s Discussion and Analysis of Financial Condition and Results of Operations and the consolidated financial statements included in Part II of our Annual Report on Form 10-K for the year ended December 31, 2002.
Cautions Concerning Forward Looking Statements
This document contains certain “forward-looking statements,” within the meaning of the Private Securities Litigation Reform Act of 1995, including statements regarding, among other items, our expected financial position, business, and financing plans. These forward-looking statements are based on management’s current expectations and are naturally subject to risks, uncertainties, and changes in circumstances, certain of which are beyond our control. Actual results may differ materially from those expressed or implied by such forward-looking statements.
The words “believe,” “plan,” “target,” “expect,” “intend,” and “anticipate,” and expressions of similar substance identify forward-looking statements. Although we believe that the expectations reflected in such forward-looking statements are reasonable, those expectations may not prove to be correct. Important factors that could cause actual results to differ materially from the expectations described in this report are set forth under “Risk Factors” in Item 1 and elsewhere in our Annual Report on Form 10-K for the year ended December 31, 2002 and elsewhere in this report. Readers are cautioned not to place undue reliance on these forward-looking statements, which speak only as of their dates. We undertake no obligation to publicly update or revise any forward-looking statements, whether as a result of new information, future events, or otherwise.
Overview
We are a leading fiber facilities-based provider of metropolitan and regional optical broadband networks and services to business customers. We deliver broadband data, dedicated Internet access, and local and long distance voice services. As of September 30, 2003, we served customers in 44 metropolitan areas in 22 states in the United States.
Time Warner Cable began our business in 1993. In May 1999, our predecessor limited liability company was reconstituted as a Delaware corporation under the name Time Warner Telecom Inc. and the outstanding limited liability company interests were converted into common stock of the newly formed corporation. In May 1999, we completed our initial public offering of 20,700,000 shares of Class A common stock at a price of $14 per share.
We have two classes of common stock outstanding, Class A common stock and Class B common stock. Holders of Class A common stock have one vote per share, and holders of Class B common stock have ten votes per share. Each share of Class B common stock is convertible, at the option of the holder, into one share of Class A common stock. The Class B common stock is collectively owned by subsidiaries of Time Warner Inc., Advance Telecom Holdings Corporation, and Newhouse Telecom Holdings Corporation. Holders of Class A common stock and Class B common stock generally vote together as a single class. However, some matters require the approval of 100% of the holders of the Class B common stock voting separately as a class, and some matters require the approval of a majority of the holders of the Class A common stock, voting separately as a class. As of September 30, 2003, the Class B stockholders held approximately 93% of the combined voting power of the outstanding common stock.
13
TIME WARNER TELECOM INC.
Since 1997, we have focused exclusively on business customers, including carriers and governmental entities, and expanded into switched and data services as well as geographic areas beyond the Time Warner Cable footprint. From our inception through 2001, we constructed networks in 29 markets. In January 2001, we expanded our geographic coverage by acquiring substantially all of the assets of GST Telecommunications, Inc. (“GST”), which added networks in 15 western markets. We operate in metropolitan areas that have high concentrations of medium- and large-sized businesses. Our customers are principally telecommunications-intensive businesses, long distance carriers, Internet service providers (“ISPs”), wireless communications companies, incumbent local exchange carriers (“ILECs”), competitive local exchange carriers (“CLECs”), educational institutions, and governmental agencies. Our revenue is derived primarily from business communications services, including dedicated transport, local switched voice, long distance, data, and high-speed Internet access services.
As of September 30, 2003, our networks spanned 18,039 route miles and contained 889,401 fiber miles. We offered service to 14,516 buildings served entirely by our facilities (on-net) or through the use of another carrier’s facilities to provide a portion of the link (off-net) in 22 states. We continue to expand our footprint within our existing markets by connecting our network into additional buildings. We have also selectively interconnected existing service areas within regional clusters with fiber optic facilities that we own or lease and we provide on-net inter-city switched services that provide customers a virtual presence in a remote city.
Our annual revenue increased from $55.4 million in 1997 to $737.7 million in 2001. In early 2001, general economic conditions and the downturn in the telecommunications sector began to negatively impact our revenue. Our revenue decreased 6% in 2002, to $695.6 million from 2001 and dropped 4% in the first nine months of 2003, to $500.2 million as compared to the first nine months of 2002. The decline in revenue resulted from customer disconnects, including service disconnections by WorldCom, Inc., (“WorldCom”) and from a decrease in intercarrier compensation, as more fully explained later in this section.
Revenue from our largest customer, WorldCom, which filed for Chapter 11 bankruptcy protection in July 2002, totaled $19.3 million and $60.9 million for the three and nine months ended September 30, 2002, respectively, and declined to $13.1 million and $39.8 million for the three and nine months ended September 30, 2003, respectively. Revenue for the three and nine months ended September 30, 2003 includes $5.2 million resulting from a settlement with WorldCom that is discussed below. As of September 30, 2003, we believe that we have already received all significant service disconnections relating to WorldCom’s bankruptcy proceedings; however, changes in their future business operations may result in further loss of revenue to us. In September 2003, as part of the WorldCom bankruptcy proceedings, the bankruptcy court approved the terms of a settlement with us that resolved a number of open disputes and claims (the “WorldCom Settlement”), including amounts payable to and from each party. The settlement provides for the continued effectiveness of the Master Capacity Agreement under which WorldCom purchases services from us. WorldCom agreed to make a payment of $2 million to cure previous defaults under that contract. The settlement terms include a general release of all claims and causes of action between the parties and settles all disputes through June 30, 2003. As a result of the settlement, we recognized $5.2 million in deferred revenue and relieved $15.1 million in expenses in the third quarter of 2003 that had previously been recorded because of uncertainties created by the bankruptcy process. The settlement also provided us an allowed damage claim against WorldCom for contract rejections that would have been payable after the confirmation of WorldCom’s bankruptcy plan. Subsequent to September 30, 2003, we sold this allowed damage claim to a third party for approximately $7 million in cash and, as a result, expect to recognize this amount in revenue in the fourth quarter of 2003.
We continue to experience high levels of customer disconnects. Throughout 2002, we lost monthly revenue of approximately $14 million due to customer disconnects and bankruptcies; however, we were able to replace most of this revenue with new sales. Disconnects in the first nine months of 2003 resulted in the loss of $10.3 million in monthly revenue, including $3.5 million related to WorldCom, as compared to disconnects of $10.2 million in monthly revenue in the first nine months of 2002, including approximately $500,000 from WorldCom. We anticipate that customers will continue to disconnect services due to network
14
TIME WARNER TELECOM INC.
optimization, cost cutting, business contractions, and additional customer bankruptcies or other customer financial difficulties, but we cannot predict the total impact on revenue from these disconnects.
Our revenue and margins may also be reduced as a result of price-cutting by other CLECs and telecommunications service providers. In particular, CLECs that are in bankruptcy or are emerging from Chapter 11 bankruptcy under a plan of reorganization have reduced debt levels and may reduce prices in order to increase their short-term revenue. Revenue growth and margins may also be adversely impacted by pricing pressure on our more mature products, especially as existing contracts expire, and we negotiate renewals.
Customers that have filed for bankruptcy or have experienced other financial difficulties have impacted our bad debt expense over the past two years. Bad debt expense as a percentage of revenue increased from 3% in 2000 to 5% in 2002. Due to successful collection efforts and a reduction in receivable write-offs, our bad debt expense, excluding the impact of the WorldCom Settlement of $15.1 million, decreased to 2% of revenue for the first nine months of 2003 compared to 5% in the first nine months of 2002. The improved collections and reduced receivable write-offs experienced in 2003 were the result of added controls, including more stringent credit reviews on new and existing customers, collecting deposits on higher risk accounts, more aggressive collection efforts, and a reduction in bankruptcy-related write-offs. Although we have experienced an improvement in bad debt expense in the first nine months of 2003, there is no assurance that this trend will continue.
In response to the impact of the downturn in the telecommunications sector and revenue performance that began in 2001, we have undertaken several cost reduction measures. These measures include increased focus on collection of receivables, as discussed above, and network grooming activities to reduce costs paid to other carriers. Additionally, in October 2001 we consolidated our network operations centers, resulting in the elimination of approximately 200 positions, and we implemented further workforce reductions in April and August 2002 that eliminated approximately 360 positions. Our combined operating and selling, general, and administrative costs, excluding the impact of the WorldCom Settlement of $15.1 million, decreased $46.8 million for the nine months ended September 30, 2003, as compared to the same period of 2002.
Although our cost containment efforts have been successful in improving our margins, we are also focusing on expanding our reach in existing markets and further leveraging our fiber networks. We plan to expand our revenue base by increasing customer and building penetration and using available network capacity in our existing markets rather than through geographic expansion into additional markets. In an effort to diversify our revenue base and become less reliant on carrier customers, we are focusing our expanded sales efforts and our suite of data and Internet products on enterprise (non-carrier) customers. To further this strategy, in early 2003, we launched several initiatives including increasing our sales force, launching new data and Internet protocol (“IP”) products, and expanding our networks in existing markets. New products include a broad array of data transmission services that enable customers to create their own internal networks and access external networks using Internet and Ethernet protocols. We have increased the size of our sales force by 28% in the first nine months of 2003 to a total of 289 account executives from 225 at December 31, 2002. By adding buildings to our fiber network our sales force will have access to a growing base of potential customers. Revenue from data and Internet services for the nine months ended September 30, 2003 grew 13% compared to the same period in 2002, and excluding WorldCom disconnects and the WorldCom Settlement, grew 41% over the comparable period in 2002. Enterprise customer revenue, a component of our total revenue, represented approximately 45% of our total revenue for the nine months ended September 30, 2003 compared to approximately 35% for the comparable period in 2002. Revenue from carrier customers represented 46% and 52% of our total revenue for the nine months ended September 30, 2003 and 2002, respectively.
15
TIME WARNER TELECOM INC.
Intercarrier Compensation Revenue and Expense
Intercarrier compensation revenue consists of reciprocal compensation and switched access. Reciprocal compensation represents compensation from a local exchange carrier (“LEC”) for local exchange traffic originated on their facilities and terminated on our facilities. Reciprocal compensation rates are established by interconnection agreements between the parties based on federal and state regulatory and judicial rulings. A 2001 Federal Communications Commission (“FCC”) ruling reduced rates and capped the number of minutes for which ISP-bound traffic can be compensated. This ruling further reduced rates in late June 2003. As a result, and because of reduced traffic terminating to our ISP customers, we have experienced a decline in our reciprocal compensation revenue. Reciprocal compensation represented 4% and 5% of revenue for the nine months ended September 30, 2003 and 2002, respectively.
Switched access represents the connection between a long distance carrier’s point of presence and an end user’s premises provided through our switching facilities. Historically, the FCC has regulated the access rates imposed by the ILECs, while the access rates of CLECs have been less regulated. In June 2001, the FCC began regulating CLECs’ interstate switched access charges. Our rates were reduced pursuant to that order and will continue to decline through June 2004 to parity with the rates of the ILEC in each of our service areas. In addition, when a CLEC enters a new market, its access charges may be no higher than the ILEC’s. The order does not affect the rates stipulated in our contracts with certain long distance carriers, although certain contracts provide for access rate reductions in relation to volume commitments. We experienced mandatory rate decreases in June 2003 and expect that switched access revenue will continue to decline as a percentage of revenue due to future mandated and contractual rate reductions. Switched access revenue represented 4% and 5% of total revenue for the nine months ended September 30, 2003 and 2002, respectively.
Regulatory uncertainty surrounds the appropriate intercarrier compensation rates applicable to voice-over-IP traffic that originates and terminates in different local service areas. The FCC is expected to open a proceeding to resolve the uncertainty. In the interim, the uncertainty may incent carriers to hand off voice traffic to us or other carriers as IP traffic which could contribute to incrementally higher intercarrier compensation expense to us.
Related Parties
In the normal course of business, we engage in various transactions with affiliates of our Class B Stockholders, generally on negotiated terms among the numerous affected operating units that, in management’s view, result in reasonable arms-length terms. We benefit from our relationship with Time Warner Cable both through access to local rights-of-way and construction cost sharing. We have similar arrangements with TWE-A/N Subsidiary. TWE-A/N Subsidiary owns certain cable systems in Florida and Indiana that were previously owned by a partnership owned by affiliates of our Class B Stockholders and is currently managed by affiliates of Advance Telecom Holdings Corporation and Newhouse Telecom Holding Corporation. We have constructed 23 of our 44 metropolitan networks substantially through the use of fiber capacity licensed from Time Warner Cable or TWE-A/N Subsidiary. As of September 30, 2003, our property, plant, and equipment included $183.4 million in licenses of fiber capacity pursuant to the capacity license agreements. We pay the license fee at the time the network is constructed and capitalize the cost of fiber under the license agreements to property, plant, and equipment. These costs are amortized over the useful life as depreciation and amortization expense. We reimburse Time Warner Cable and TWE-A/N Subsidiary for facility maintenance and pole rental costs on an ongoing basis. These maintenance and pole rental costs are included in our operating expenses. We believe that certain regulatory decisions regarding the pole rental rates that are passed through to us under the capacity license agreements pose a risk that our expense for these items could increase over time. Our selling, general, and administrative expenses include charges from affiliates of Time Warner Inc. and from TWE-A/N Subsidiary for office rent, and from Time Warner Cable for overhead charges for limited administrative functions it performs for us. We also benefit from discounts available to Time Warner Inc. and its affiliates by aggregating our purchases of long distance services, car rental services, overnight delivery services, and wireless usage with those of Time Warner Inc. Revenue for services we provide to Time Warner Inc. and its affiliates and TWE-A/N Subsidiary was $24.8 million for the nine months ended September 30, 2003. Operating and selling, general, and administrative expenses for expenses paid to Time Warner Cable and TWE-A/N Subsidiary totaled $4.2 million for the nine months ended September 30, 2003.
16
TIME WARNER TELECOM INC.
Critical Accounting Policies
We prepare our financial statements in accordance with accounting principles generally accepted in the United States, which require us to make estimates and assumptions. We believe that, of our significant accounting policies described in Note 1 to the consolidated and condensed financial statements included herein, the following involve a higher degree of judgment and complexity and are therefore considered critical.
Revenue Recognition. We generally bill our customers in advance for dedicated transport, data, Internet, and the majority of switched services on a fixed rate basis and recognize the revenue over the period the services are provided. We generally bill intercarrier compensation and long distance on a transactional basis determined by customer usage with some fixed rate elements. We bill the transactional elements of switched services in arrears and use estimates to recognize revenue in the period earned.
As part of the revenue recognition process, we evaluate whether receivables are reasonably assured of collection based on certain factors, including the likelihood of billings being disputed by customers. In situations where a dispute is likely, we generally defer recognition until cash is collected. We recognize reciprocal compensation revenue primarily on a cash basis, except in those cases where the payment is under dispute or at risk, in which case we defer recognition until the outstanding issues are resolved. We utilize the cash basis because changes in, and interpretations of, regulatory rulings create disputes and often result in significant delays in payment. As of September 30, 2003 and December 31, 2002, we had deferred recognition of $10.4 million and $12.8 million, respectively, in reciprocal compensation revenue for payments received associated with pending disputes. We recognized $3.9 million and $13.9 million of revenue resulting from the settlement of reciprocal compensation disputes in the nine months ended September 30, 2003 and 2002, respectively.
Receivables. We estimate the collectability of our receivables by performing ongoing credit evaluations of our customers’ financial conditions, and provide an allowance for doubtful accounts based on the expected collectability of all receivables. We assign a higher risk of collectability to certain customers with deteriorating financial conditions and customers in bankruptcy that continue service subsequent to filing bankruptcy, resulting in a greater allowance for doubtful accounts. Our policy is to write off receivables from bankrupt customers for services provided prior to their bankruptcy filing, to file pre-petition claims with the bankruptcy courts and to reserve a portion of prior collections which could be challenged as preferential payments under bankruptcy laws. We continue to carry post-filing receivable balances when these customers continue purchasing services following their bankruptcy filings, but we assign a higher risk of collectability to these accounts and provide a correspondingly greater allowance for doubtful accounts. Evaluating the collectability of receivables and establishing the related allowance for doubtful accounts requires considerable management judgment. Our allowance for doubtful accounts is based on the best information available to us and is re-evaluated and adjusted when additional information becomes available. If the financial condition of our customers deteriorates, our bad debt expense and cash collections will be negatively impacted. Our provision for bad debts, excluding the impact of the WorldCom Settlement, totaled $10.6 million and $23.8 million for the nine months ended September 30, 2003 and 2002, respectively. The allowance for doubtful accounts was $17.1 million and $21.9 million at September 30, 2003 and December 31, 2002, respectively.
Impairment of Long-Lived Assets. We periodically review the carrying amounts of property, plant and equipment and intangible assets to determine whether current events or circumstances warrant adjustments to the carrying amounts. As part of this review, we analyze the projected undiscounted cash flows associated with our property, plant, and equipment and intangible assets. Considerable management judgment is necessary in establishing the assumptions required to complete these projections. Although we believe these estimates to be reasonable, actual results could vary significantly from these estimates and our estimates could change based on market conditions. Variances in results or estimates could result in changes to the carrying value of our assets including, but not limited to, incurring additional impairment charges for some of these assets in future periods. In the fourth quarter of 2002, we incurred a $213 million impairment charge primarily related to the long haul network acquired from GST, and, to a lesser extent, certain local network assets. No additional charges have been recorded subsequent to December 31, 2002.
17
TIME WARNER TELECOM INC.
Deferred Taxes. Significant management judgment is required in determining our provision for income taxes and in determining whether deferred tax assets will be realized in full or in part. The deferred tax asset primarily represents the tax benefit of net operating loss carryforwards and timing differences between book and tax recognition of certain revenue and expense items. When it is more likely than not that all or some portion of deferred tax assets will not be realized, we are required to establish a valuation allowance for the amount of the deferred tax assets that we determine not to be realizable. As of September 30, 2003, our deferred tax asset is $57.9 million, net of a valuation allowance of $165.6 million. We have concluded that it is more likely than not that the net deferred tax asset of $57.9 million will be realized because we could utilize tax-planning strategies to realize this amount. However, we believe there may be risks in realizing amounts in excess of the $57.9 million through utilization of available tax planning strategies. Accordingly, we have established a valuation allowance for amounts in excess of $57.9 million. Our treatment of deferred taxes and our tax planning strategies are based on certain assumptions that we believe are reasonable. However, actual results could vary significantly from current assumptions and could result in changes to the accounting treatment of these items, including, but not limited to, the necessity to record a greater valuation allowance.
Regulatory and Other Contingencies. We are subject to regulatory proceedings, lawsuits, and other claims, including proceedings under laws and government regulations related to rights-of-way, employment, customer agreements, and other matters. We are required to assess the likelihood of any adverse judgments or outcomes to these matters, as well as potential ranges of probable losses. A determination of the amount of reserves required, if any, for these contingencies is based on a careful analysis of individual issues with the assistance of legal and regulatory counsel. These determinations are often made early in the course of a proceeding when we do not know all of the relevant facts and involve difficult predictions of probable outcomes. Since these matters are inherently unpredictable, the reserves we establish may prove to be either too high or too low. Also, the required reserves may change in the future due to new developments or changes in regulatory rulings.
Stock Options. We have elected to follow Accounting Principles Board Opinion No. 25,Accounting for Stock Issued to Employees (“APB 25”), and related interpretations in accounting for our employee stock options. Under APB 25, because the exercise price of our employee stock options is generally equal to the market price of the underlying stock on the date of the grant, no compensation expense is recognized. Financial Accounting Standards Board (“FASB”) Statement No. 123,Accounting and Disclosure of Stock-Based Compensation (“SFAS 123”), establishes an alternative method of expense recognition for stock-based compensation awards to employees based on estimated fair values. We have not elected to adopt SFAS 123 for expense recognition purposes. The FASB has announced that it plans to require fair value accounting for stock options in the future, likely beginning in 2005. However, the methodology to establish fair value for this purpose has not yet been finalized. While the impact of adopting the expense provisions of SFAS 123 would be material to our results of operations, we cannot predict the impact that a new standard would have on our results of operations. We do not anticipate that a new accounting standard would have an impact on our cash flows.
18
TIME WARNER TELECOM INC.
Results of Operations
The following table sets forth certain data from our unaudited consolidated and condensed financial statements presented in thousands of dollars and expressed as a percentage of total revenue. You should read this table together with our consolidated and condensed financial statements, including the notes thereto, appearing elsewhere in this report:
| | | Three Months Ended September 30,
| | | Nine Months Ended September 30,
| |
| | | 2003
| | | 2002
| | | 2003
| | | 2002
| |
| | | (amounts in thousands, except per share amounts) | |
Statements of Operations Data: | | | | | | | | | | | | | | | | | | | | | | | | | | | | |
Revenue(1): | | | | | | | | | | | | | | | | | | | | | | | | | | | | |
Dedicated transport services | | $ | 94,066 | | | 55 | % | | | 92,556 | | | 55 | % | | $ | 269,420 | | | 54 | % | | | 280,170 | | | 54 | % |
Switched services | | | 38,957 | | | 22 | % | | | 36,078 | | | 22 | % | | | 115,281 | | | 23 | % | | | 110,007 | | | 21 | % |
Data and Internet services | | | 25,700 | | | 15 | % | | | 23,410 | | | 14 | % | | | 74,135 | | | 15 | % | | | 65,758 | | | 13 | % |
Intercarrier compensation | | | 13,705 | | | 8 | % | | | 15,121 | | | 9 | % | | | 41,377 | | | 8 | % | | | 64,525 | | | 12 | % |
| | |
|
|
| |
|
| |
|
|
| |
|
| |
|
|
| |
|
| |
|
|
| |
|
|
Total Revenue | | | 172,428 | | | 100 | % | | | 167,165 | | | 100 | % | | | 500,213 | | | 100 | % | | | 520,460 | | | 100 | % |
| | |
|
|
| |
|
| |
|
|
| |
|
| |
|
|
| |
|
| |
|
|
| |
|
|
Costs and expenses(2): | | | | | | | | | | | | | | | | | | | | | | | | | | | | |
Operating (exclusive of depreciation, amortization, and accretion shown separately below) | | | 66,631 | | | 39 | % | | | 70,799 | | | 40 | % | | | 198,461 | | | 39 | % | | | 216,966 | | | 42 | % |
Selling, general, and administrative | | | 31,162 | | | 18 | % | | | 56,293 | | | 34 | % | | | 128,294 | | | 26 | % | | | 171,710 | | | 33 | % |
Depreciation, amortization, and accretion | | | 56,408 | | | 33 | % | | | 61,763 | | | 37 | % | | | 164,876 | | | 33 | % | | | 176,269 | | | 34 | % |
| | |
|
|
| |
|
| |
|
|
| |
|
| |
|
|
| |
|
| |
|
|
| |
|
|
Total costs and expenses | | | 154,201 | | | 89 | % | | | 188,855 | | | 113 | % | | | 491,631 | | | 98 | % | | | 564,945 | | | 109 | % |
| | |
|
|
| |
|
| |
|
|
| |
|
| |
|
|
| |
|
| |
|
|
| |
|
|
Operating Income (Loss) | | | 18,227 | | | 11 | % | | | (21,690 | ) | | (13 | )% | | | 8,582 | | | 2 | % | | | (44,485 | ) | | (9 | )% |
Interest expense | | | (25,908 | ) | | 8 | % | | | (26,760 | ) | | (16 | )% | | | (78,520 | ) | | (16 | )% | | | (78,435 | ) | | (15 | )% |
Interest income | | | 1,326 | | | (15 | )% | | | 1,517 | | | 1 | % | | | 4,648 | | | 1 | % | | | 4,317 | | | 1 | % |
Investment gains, (losses) net | | | 922 | | | 1 | % | | | (1,283 | ) | | (1 | )% | | | 922 | | | — | % | | | (3,240 | ) | | (1 | )% |
| | |
|
|
| |
|
| |
|
|
| |
|
| |
|
|
| |
|
| |
|
|
| |
|
|
Net loss before income taxes and cumulative effect of change in accounting principle | | | (5,433 | ) | | (3 | )% | | | (48,216 | ) | | (29 | )% | | | (64,368 | ) | | (13 | )% | | | (121,843 | ) | | (23 | )% |
Income tax expense | | | 225 | | | — | | | | 150 | | | — | | | | 675 | | | — | | | | 450 | | | — | |
| | |
|
|
| |
|
| |
|
|
| |
|
| |
|
|
| |
|
| |
|
|
| |
|
|
Loss before cumulative effect of change in accounting principle | | | (5,658 | ) | | (3 | )% | | | (48,366 | ) | | (29 | )% | | | (65,043 | ) | | (13 | )% | | | (122,293 | ) | | (23 | )% |
Cumulative effect of change in accounting principle | | | — | | | — | | | | — | | | — | | | | 2,965 | | | 1 | % | | | — | | | — | |
| | |
|
|
| |
|
| |
|
|
| |
|
| |
|
|
| |
|
| |
|
|
| |
|
|
Net loss | | $ | (5,658 | ) | | (3 | )% | | | (48,366 | ) | | (29 | )% | | $ | (68,008 | ) | | (14 | )% | | | (122,293 | ) | | (23 | )% |
| | |
|
|
| |
|
| |
|
|
| |
|
| |
|
|
| |
|
| |
|
|
| |
|
|
Basic and diluted loss per share | | $ | (0.05 | ) | | | | | $ | (0.42 | ) | | | | | $ | (0.59 | ) | | | | | $ | (1.07 | ) | | | |
| | |
|
|
| | | | |
|
|
| | | | |
|
|
| | | | |
|
|
| | | |
Weighted average shares outstanding, basic and diluted | | | 114,936 | | | | | | | 114,827 | | | | | | | 114,931 | | | | | | | 114,772 | | | | |
| | | | | | | | |
EBITDA(1),(2),(3) | | $ | 74,635 | | | 43 | % | | | 40,073 | | | 24 | % | | $ | 173,458 | | | 35 | % | | | 131,784 | | | 25 | % |
Net cash provided by (used in) operating activities | | | (1,093 | ) | | | | | | 11,554 | | | | | | | 61,192 | | | | | | | 20,090 | | | | |
Net cash used in investing activities | | | (25,896 | ) | | | | | | (22,559 | ) | | | | | | (143,445 | ) | | | | | | (77,662 | ) | | | |
Net cash used in financing activities | | | (6,456 | ) | | | | | | (1,046 | ) | | | | | | (19,706 | ) | | | | | | (3,002 | ) | | | |
| (1) | Includes revenue resulting from transactions with affiliates of $9.4 million and $6.0 million for the three months ended September 30, 2003 and 2002, respectively, and $24.8 million and $21.8 million for the nine months ended September 30, 2003 and 2002, respectively. |
| (2) | Includes expenses resulting from transactions with affiliates of $1.5 million and $1.2 million for the three months ended September 30, 2003 and 2002, respectively, and $4.2 million and $3.4 million for the nine months ended September 30, 2003 and 2002, respectively. |
19
TIME WARNER TELECOM INC.
| (3) | “EBITDA” is defined as operating income (loss) before depreciation, amortization, and accretion expense. The reconciliation between net loss and EBITDA is as follows: |
| | | Three Months Ended
September 30,
| | | Nine Months Ended
September 30,
| |
| | | 2003
| | | 2002
| | | 2003
| | | 2002
| |
| | | (amounts in thousands) | | | (amounts in thousands) | |
| | | | |
Net loss | | $ | (5,658 | ) | | (48,366 | ) | | $ | (68,008 | ) | | (122,293 | ) |
Cumulative effect of change in accounting principle | | | — | | | — | | | | 2,965 | | | — | |
Income tax expense | | | 225 | | | 150 | | | | 675 | | | 450 | |
Interest expense | | | 25,908 | | | 26,760 | | | | 78,520 | | | 78,435 | |
Interest income | | | (1,326 | ) | | (1,517 | ) | | | (4,648 | ) | | (4,317 | ) |
Investment (gain) loss | | | (922 | ) | | 1,283 | | | | (922 | ) | | 3,240 | |
Depreciation, amortization, and accretion | | | 56,408 | | | 61,763 | | | | 164,876 | | | 176,269 | |
| | |
|
|
| |
|
| |
|
|
| |
|
|
EBITDA | | $ | 74,635 | | | 40,073 | | | $ | 173,458 | | | 131,784 | |
| | |
|
|
| |
|
| |
|
|
| |
|
|
EBITDA is not intended to replace operating income (loss), net income (loss), cash flow, and other measures of financial performance and liquidity reported in accordance with generally accepted accounting principles (“GAAP”) in the United States. Rather, EBITDA is a measure of operating performance and liquidity that investors may consider in addition to such measures. Our management believes that EBITDA is a standard measure of operating performance and liquidity that is commonly reported and widely used by analysts, investors, and other interested parties in the telecommunications industry because it eliminates many differences in financial, capitalization, and tax structures, as well as non-cash and non-operating charges to earnings. We believe EBITDA trends are a valuable indication of whether our operations are able to produce cash flows to fund working capital needs, service debt obligations, and fund capital expenditures. We currently use the funds depicted by EBITDA for these purposes. EBITDA is used internally by our management to assess on-going operations and is a measure used to test compliance with certain covenants of the 9 3/4% Senior Notes, the 10 1/8% Senior Notes, and our secured credit facility. The definition of EBITDA under our credit facility differs from the definition of EBITDA used in this table because the credit facility definition also eliminates certain non-cash losses within certain limits and certain extraordinary gains. The actual calculated amounts of EBITDA were the same for both purposes during the periods presented in the table. See “Liquidity and Capital Resources – Financing.” EBITDA as used in this report may not be comparable to similarly titled measures reported by other companies due to differences in accounting policies.
Three Months Ended September 30, 2003 Compared to Three Months Ended September 30, 2002
During the three months ended September 2003, we recognized the benefits of the WorldCom Settlement, which is discussed in “Overview” above. We are separately presenting certain data in the table below to aid investors in understanding the impact of the WorldCom Settlement on our results, to better illustrate our ongoing operations, and to enhance comparability between periods.
| | | Three Months Ended
September 30, 2003
| |
| | | As
Reported
| | | WorldCom
Settlement
| | | Net of
Settlement
| |
Dedicated transport services | | $ | 94,066 | | | 2,824 | | | 91,242 | |
Switched services | | | 38,957 | | | 95 | | | 38,862 | |
Data and Internet services | | | 25,700 | | | 2,245 | | | 23,455 | |
Intercarrier compensation | | | 13,705 | | | — | | | 13,705 | |
| | |
|
|
| |
|
| |
|
|
Total revenue | | | 172,428 | | | 5,164 | | | 167,264 | |
Operating costs | | | 66,631 | | | — | | | 66,631 | |
Selling, general, and administrative | | | 31,162 | | | 15,128 | | | 46,290 | |
Depreciation, amortization, and accretion | | | 56,408 | | | — | | | 56,408 | |
| | |
|
|
| |
|
| |
|
|
Operating income (loss) | | | 18,227 | | | (20,292 | ) | | (2,065 | ) |
| | |
|
|
| |
|
| |
|
|
Net loss | | $ | (5,658 | ) | | (20,292 | ) | | (25,950 | ) |
| | |
|
|
| |
|
| |
|
|
20
TIME WARNER TELECOM INC.
Revenue. Total revenue increased $5.2 million, or 3%, to $172.4 million for the three months ended September 30, 2003, from $167.2 million for the comparable period in 2002. Revenue from the provision of dedicated transport services increased $1.5 million, or 2%, to $94.1 million for the three months ended September 30, 2003, from $92.6 million for the comparable period of 2002. The increase included the impact of the WorldCom Settlement of $2.8 million, partially offset by customer disconnections, including disconnection of services provided to WorldCom.
Switched services revenue increased $2.9 million, or 8%, to $39.0 million for the three months ended September 30, 2003, from $36.1 million for the comparable period in 2002. The increase in switched services revenue is primarily due to growth in services provided to customers and an increase in contract termination revenue, somewhat offset by customer disconnections, including disconnection of services provided to WorldCom.
Data and Internet services revenue increased $2.3 million, or 10%, to $25.7 million for the three months ended September 30, 2003, from $23.4 million for the comparable period in 2002. Excluding the impact of the WorldCom Settlement of $2.2 million and of service disconnection by WorldCom of $7.1 million, data and Internet services revenue grew by 44%. The increase primarily resulted from growth in enterprise customers, and their demand for Internet services and new IP and Ethernet based products.
Revenue from WorldCom in the third quarter of 2003 was $13.1 million including $5.2 million of revenue from the WorldCom Settlement, as compared to $19.3 million in the third quarter of last year. Excluding the impact of revenue from the WorldCom Settlement, the $11.4 million reduction in revenue from WorldCom as compared to the third quarter of 2002 impacted dedicated transport services, switched services, and data and Internet revenue by $1.3 million, $2.8 million, and $7.1 million, respectively, with a minor impact on intercarrier compensation.
Intercarrier compensation revenue, including reciprocal compensation and switched access, decreased $1.4 million, or 9%, to $13.7 million for the three months ended September 30, 2003, from $15.1 million for the comparable period in 2002. We reached a settlement of outstanding disputes with a carrier in the third quarter of 2003, resulting in the recognition of $3.9 million in reciprocal compensation revenue. Excluding the impact of the settlement, intercarrier compensation decreased 35% to $9.8 million as compared to the third quarter of 2002. This decrease is primarily due to mandated rate reductions and fewer minutes of use terminating on our network. We provide the calculation of intercarrier compensation revenue excluding the impact of settlements to isolate the intercarrier compensation related to our ongoing operations and to enhance comparability between periods.
Operating Expenses. Our operating expenses consist of costs related to the operation and maintenance of our networks and the provision of services. These costs include salaries and related expenses of operations and engineering personnel, as well as costs paid to the ILECs and other carriers for facility leases and interconnection. We carry a significant portion of our traffic on our own fiber infrastructure, which enhances our ability to control costs. Operating expenses decreased $4.2 million, or 6%, to $66.6 million for the three months ended September 30, 2003, from $70.8 million for the comparable period in 2002. The decrease in operating expenses is primarily due to a reduction in costs paid to other carriers resulting from efforts to optimize our networks and lower per circuit costs, lower maintenance costs due to lower contractual terms with certain vendors, and a decrease in employee costs due to a workforce reduction in August 2002. Operating expenses represented 39% and 42% of total revenue for the three months ended September 30, 2003 and 2002, respectively.
Selling, General, and Administrative Expenses. Selling, general, and administrative expenses include costs related to sales and marketing, information technology, billing, regulatory, accounting, finance, and legal functions. Selling, general, and administrative expenses decreased $25.1 million, or 45%, to $31.2 million for the three months ended September 30, 2003, from $56.3 million for the comparable period in 2002. The decrease includes a $15.1 million relief of expenses related to the WorldCom Settlement and a reduction in bad debt expense, which decreased to 2% of revenue for the three months ended September 30, 2003 from 5% in the comparable period of 2002, reflecting improved collection of receivables and a decrease in the number of customers filing bankruptcy or experiencing other financial difficulties. To a lesser extent,
21
TIME WARNER TELECOM INC.
the decrease in selling, general, and administrative costs results from a decrease in property tax expense in several states, and a decrease in legal costs due to the favorable settlement of legal proceedings.
Depreciation, Amortization, and Accretion. Depreciation, amortization, and accretion decreased $5.4 million, to $56.4 million for the three months ended September 30, 2003, from $61.8 million for the comparable period in 2002. The decrease is primarily the result of a $213 million asset impairment we incurred in the fourth quarter of 2002. This impairment charge reduced the book value of our property, plant, and equipment, thereby reducing our ongoing depreciation expense.
Operating Income (Loss) and EBITDA. Operating loss improved from $21.7 million for the three months ended September 30, 2002 to operating income of $18.2 million for the three months ended September 30, 2003. This improvement reflects the impact of the WorldCom Settlement, cost-reduction efforts, and decreased depreciation expense, somewhat offset by the decrease in intercarrier compensation revenue. EBITDA was $74.6 million for the three months ended September 30, 2003. Net of the favorable impacts of the WorldCom Settlement of $20.3 million, EBITDA was $54.3 million, or 32% of revenue, for the three months ended September 30, 2003, compared to $40.1 million, or 24% of revenue, for the comparable period of 2002. The improvement in EBITDA margins also reflects our efforts to reduce costs, somewhat offset by the decrease in intercarrier compensation revenue. Our EBITDA is calculated by excluding the non-cash impacts of depreciation, amortization, and accretion from operating income or loss, and is reconciled to net loss in Note 3 of the table under “Results of Operations” above. We believe that EBITDA trends are a useful indication of whether our operations are able to produce operating cash flows to fund working capital needs, service debt obligations, and fund capital expenditures. The funds depicted by EBITDA are currently used for these purposes. EBITDA is not a measure of performance under GAAP and should not be considered a substitute for financial results prepared in accordance with GAAP.
Interest Expense.Interest expense decreased to $25.9 million for the three months ended September 30, 2003, from $26.8 million for the comparable period in 2002. The amounts outstanding under our credit facility increased from $250 million at September 30, 2002 to $402 million at September 30, 2003. However, a decrease in weighted average interest rates on indebtedness to 8.0% for the three months ended September 30, 2003 from 9.5% for the comparable period in 2002 more than offset the impact of the increased credit facility borrowings.
Interest Income. Interest income decreased to $1.3 million for the three months ended September 30, 2003, from $1.5 million for the comparable period in 2002. The decrease is related to a decrease in rates earned on our liquid investments, offset by an increase in cash, cash equivalent and marketable securities resulting from additional funding of $170 million drawn pursuant to our credit facility during the fourth quarter of 2002.
Net Loss. Net loss decreased $42.7 million to a loss of $5.7 million for the three months ended September 30, 2003, from a net loss of $48.4 million for the comparable period in 2002. The change is primarily attributable to the favorable impacts of the WorldCom Settlement, cost containment efforts resulting in lower operating expenses and selling, general, and administrative expenses, and the decrease in depreciation and amortization expense.
22
TIME WARNER TELECOM INC.
Nine Months Ended September 30, 2003 Compared to Nine Months Ended September 30, 2002
During the nine months ended September 2003, we recognized the benefits of the WorldCom Settlement, which is discussed in “Overview” above. We are separately presenting certain data in the table below to aid investors in understanding the impact of the WorldCom Settlement on our results, to better illustrate our ongoing operations, and to enhance comparability between periods.
| | | Nine Months Ended
September 30, 2003
| |
| | | As
Reported
| | | WorldCom
Settlement
| | | Net of
Settlement
| |
Dedicated transport services | | $ | 269,420 | | | 2,824 | | | 266,596 | |
Switched services | | | 115,281 | | | 95 | | | 115,186 | |
Data and Internet services | | | 74,135 | | | 2,245 | | | 71,890 | |
Intercarrier compensation | | | 41,377 | | | — | | | 41,377 | |
| | |
|
|
| |
|
| |
|
|
Total revenue | | | 500,213 | | | 5,164 | | | 495,049 | |
Operating costs | | | 198,461 | | | — | | | 198,461 | |
Selling, general, and administrative | | | 128,294 | | | 15,128 | | | 143,422 | |
Depreciation, amortization, and accretion | | | 164,876 | | | — | | | 164,876 | |
| | |
|
|
| |
|
| |
|
|
Operating income (loss) | | | 8,582 | | | (20,292 | ) | | 11,710 | |
| | |
|
|
| |
|
| |
|
|
Net loss | | $ | (68,008 | ) | | (20,292 | ) | | (88,300 | ) |
| | |
|
|
| |
|
| |
|
|
Revenue. Total revenue decreased $20.3 million, or 4%, to $500.2 million for the nine months ended September 30, 2003, from $520.5 million for the comparable period in 2002. Dedicated transport services revenue decreased $10.8 million, or 4%, to $269.4 million for the nine months ended September 30, 2003, from $280.2 million for the comparable period of 2002. The decrease in dedicated transport revenue resulted primarily from customer disconnections, including disconnection of services provided to WorldCom.
Switched services revenue increased $5.3 million, or 5%, to $115.3 million for the nine months ended September 30, 2003, from $110.0 million for the comparable period in 2002. The increase primarily resulted from growth in services provided to customers and the settlement of a customer dispute, somewhat offset by customer disconnections, predominately those by WorldCom.
Data and Internet services revenue increased $8.3 million, or 13%, to $74.1 million for the nine months ended September 30, 2003, from $65.8 million for the comparable period in 2002. Excluding the impact of the WorldCom Settlement of $2.2 million and service disconnections by WorldCom of $14.8 million, data and Internet services revenue grew by 41%. The increase primarily resulted from growth in enterprise customers, and their demand for Internet services and new IP and Ethernet based products.
Approximately $39.8 million of revenue in the first nine months of 2003 was from WorldCom, as compared to $60.9 million in the first nine months of 2002. Excluding the impact of the WorldCom Settlement, the $26.3 million reduction in revenue from WorldCom impacted dedicated transport services, switched services, and data and Internet revenue by $4.2 million, $7.3 million, and $14.8 million, respectively, with minor impacts to intercarrier compensation.
Intercarrier compensation revenue, including reciprocal compensation and switched access, decreased $23.1 million, or 36%, to $41.4 million for the nine months ended September 30, 2003, from $64.5 million for the comparable period in 2002. The decrease includes a reduction in reciprocal compensation settlement revenue from $13.9 million in the first nine months of 2002 to $3.9 million in the first nine months of 2003, and a 26% decrease in intercarrier compensation year-over-year resulting from rate reductions and fewer minutes of use terminating on our network. We expect that intercarrier compensation revenue will continue to decline as mandated rate decreases are phased in through June 2004.
Operating Expenses. Operating expenses decreased $18.5 million, or 9%, to $198.5 million for the nine months ended September 30, 2003, from $217.0 million for the comparable period in 2002. The
23
TIME WARNER TELECOM INC.
decrease in operating expenses is primarily due to a reduction in costs paid to other carriers resulting from efforts to optimize our networks. To a lesser extent, the improvement in operating costs results from a decrease in employee costs resulting from workforce reductions in April and August 2002. Operating expenses represented 40% and 42% of total revenue for the nine months ended September 30, 2003 and 2002, respectively.
Selling, General, and Administrative Expenses. Selling, general, and administrative expenses decreased $43.4 million, or 25%, to $128.3 million for the nine months ended September 30, 2003, from $171.7 million for the comparable period in 2002. This improvement reflects the favorable impacts of the WorldCom Settlement and a reduction in bad debt expense from 5% of revenue for the nine months ended September 30, 2002 to 2% of revenue for the comparable 2003 period. The reduction in bad debt expense reflects improved collection of receivables and a decrease in the number of customers filing for bankruptcy or experiencing other financial difficulties. To a lesser extent, the decrease in selling, general, and administrative expense resulted from a decrease in employee costs related to workforce reductions in April and August 2002, reduced property tax expense in several states, and a decrease in legal costs due to the favorable settlement of legal proceedings.
Depreciation, Amortization, and Accretion. Depreciation, amortization, and accretion decreased $11.4 million, to $164.9 million for the nine months ended September 30, 2003, from $176.3 million for the comparable period in 2002. The decrease is primarily the result of a $213 million asset impairment we recorded in the fourth quarter of 2002. This impairment charge reduced the book value of our property, plant, and equipment, thereby reducing our ongoing depreciation.
Operating Income (Loss) and EBITDA. Operating loss improved from $44.5 million for the nine months ended September 30, 2002 to an operating income of $8.6 million for the nine months ended September 30, 2003. This improvement includes the favorable impact of the WorldCom Settlement and also reflects cost containment efforts, and lower depreciation and amortization expense, somewhat offset by the decrease in intercarrier compensation revenue. EBITDA was $173.5 million for the nine months ended September 30, 2003 compared to $131.8 million in the same period of 2002. Excluding the impact of the WorldCom Settlement of $20.3 million, EBITDA was $153.2 million, or 31% of revenue, for the nine months ended September 30, 2003 compared to 25% of revenue in the comparable period of 2002. The improvement in EBITDA margin also reflects our cost reduction efforts, somewhat offset by the reduction in intercarrier compensation revenue. Our EBITDA is calculated by excluding the non-cash impacts of depreciation, amortization, and accretion from operating income or loss and is reconciled to net loss in Note 3 of the table under “Results of Operations” above. We believe that EBITDA trends are a valuable indication of whether our operations are able to produce operating cash flows to fund working capital needs, to service debt obligations, and to fund capital expenditures. The funds depicted by EBITDA are currently used for these purposes. EBITDA is not a measure of performance under GAAP and should not be considered a substitute for financial results prepared in accordance with GAAP.
Interest Expense.Interest expense increased slightly to $78.5 million for the nine months ended September 30, 2003, from $78.4 million for the comparable period in 2002. The increase in interest expense reflects the increase in the amounts outstanding under our credit facility from $250 million at September 30, 2002 to $402 million at September 30, 2003 offset by a decrease in the weighted average interest rate on indebtedness to 8.2% for the nine months ended September 30, 2003 from 9.6% for the comparable period in 2002.
Interest Income. Interest income increased to $4.6 million for the nine months ended September 30, 2003, from $4.3 million for the comparable period in 2002. The increase is related to the increase in cash, cash equivalents, and marketable securities resulting from the additional funding of $170 million drawn pursuant to our credit facility during the fourth quarter of 2002, somewhat offset by a decrease in rates earned on investments.
24
TIME WARNER TELECOM INC.
Cumulative Effect of Change in Accounting Principle. Effective January 1, 2003, we adopted the provisions of FASB Statement No. 143,Accounting for Asset Retirement Obligations (“SFAS 143”). SFAS 143 requires that the estimated fair value of an asset retirement obligation be recorded when incurred. The associated asset retirement costs are capitalized as part of the carrying amount of the long-lived asset and depreciated over the asset’s estimated useful life. We have asset retirement obligations related to decommissioning of electronics in leased facilities and the removal of certain fiber and conduit systems. Estimating these obligations requires considerable management judgment to project retirement costs, the timing of the future retirement activities, and the likelihood of retirement provisions being enforced. Changes in the assumptions underlying these estimates based on future information could result in adjustments to estimated liabilities. In conjunction with the adoption of SFAS 143, we recorded a $5.9 million liability, an asset of $2.9 million in property, plant, and equipment, and a $3.0 million charge to earnings to account for the cumulative effect of the depreciation and accretion expense that would have been recorded had SFAS 143 been in effect in earlier periods.
Net Loss. Net loss decreased $54.3 million to a loss of $68.0 million for the nine months ended September 30, 2003, from a net loss of $122.3 million for the comparable period in 2002. The change primarily resulted from the favorable impacts of the WorldCom Settlement, cost saving initiatives, improved collections of receivables, and lower depreciation expense, somewhat offset by a decrease in intercarrier compensation revenue.
Liquidity and Capital Resources
Historically, we have generated cash flow from operations consisting primarily of payments received from customers for the provision of business communications services, offset by payments to other telecommunications carriers, payments to employees, and payments for other operating, selling, general, and administrative costs. We have also generated cash from debt and equity financing activities and have used funds to service our debt obligations, fund acquisitions, and make capital expenditures to expand our networks.
Operations. Cash provided by operating activities was $61.2 million for the nine months ended September 30, 2003, compared to $20.1 million for the comparable period in 2002. The improvement in cash from operations primarily result from the improvements in operating income (loss) and in EBITDA due to cost reduction initiatives, improved collection of receivables, and the benefits of the WorldCom Settlement.
Investing. Cash used in investing activities was $143.4 million for the nine months ended September 30, 2003 compared to $77.7 million for the comparable period in 2002. The increase in cash used in investing activities primarily relates to an increase in the purchase of marketable debt securities. In 2003, we purchased securities with longer maturities to improve yields on our liquid investments. Capital expenditures for the nine months ended September 30, 2003, totaled $84.8 million, compared to $92.1 million for the comparable period in 2002. In fiscal year 2002, our capital expenditures totaled $104.8 million and were limited to building entries, electronics, and distribution rings based on specific revenue opportunities in existing markets, capital items related to infrastructure maintenance, and upgrades and enhancements to our back office systems. In early 2003, we implemented plans to expand our networks into additional buildings in our existing markets more aggressively. While we initially anticipated we would spend $200 million in 2003, the physical logistics of adding buildings to our network has delayed a portion of that spending into 2004. The delay results from factors including identification of desirable buildings, landlord approvals, right-of-way acquisition, and permitting and physical construction.
25
TIME WARNER TELECOM INC.
Financing. Net cash used in financing activities for the nine months ended September 30, 2003 was $19.7 million, and was primarily related to the scheduled payment of principal under our credit facility. For the nine months ended September 30, 2002, net cash used in financing activities of $3.0 million was primarily related to the payment of capital lease obligations.
In December 2000, we entered into a $1 billion amended and restated senior secured revolving credit facility (the “Credit Facility”). In October 2002, we and our lenders further amended the Credit Facility and reduced the total commitments of the lenders from $1 billion to $800 million. The amended Credit Facility includes the following components:
| | • | | A $380 million senior secured revolving credit facility. This credit facility decreases to $361 million on December 31, 2004, $304 million on December 31, 2005, and $190 million on December 31, 2006, with a final maturity of December 31, 2007. Interest is calculated based on a specified Eurodollar rate plus a margin of 1.75 to 2.75%. As of September 30, 2003, no amounts were outstanding under this facility. |
| | • | | A $200 million term loan. Amortization of principal began March 31, 2003 and continues quarterly until March 31, 2008. Through September 30, 2003, we made principal payments of $1.5 million related to this facility. Interest is computed utilizing a specified Eurodollar rate plus 4.0%, which totaled 5.1% on September 30, 2003, and is payable at least quarterly. As of September 30, 2003, $198.5 million was outstanding under this facility. |
| | • | | A $220 million senior delayed draw loan facility. Amortization of principal began March 31, 2003 and continues quarterly until December 31, 2007. Through September 30, 2003, we made principal payments of $16.5 million related to this facility. Interest is computed based on a specified Eurodollar rate plus a margin, which totaled 2.9% on September 30, 2003, and is payable at least quarterly. As of September 30, 2003, $203.5 million was outstanding under this facility. |
The $400 million principal amount of 9 3/4% Senior Notes that we issued in July 1998 are unsecured, unsubordinated obligations. Interest on the 9 3/4% Senior Notes is payable semiannually on January 15 and July 15. Aggregate annual interest payments on the 9 3/4% Senior Notes are $39 million. The 9 3/4% Senior Notes are due on July 15, 2008.
The $400 million principal amount of 10 1/8% Senior Notes that we issued in the January 2001 are also unsecured, unsubordinated obligations. Interest on the 10 1/8% Senior Notes is payable semiannually on February 1 and August 1. Aggregate annual interest payments on the 10 1/8% Senior Notes are $40.5 million. The 10 1/8% Senior Notes are due on February 1, 2011.
The 9 3/4% Senior Notes and the 10 1/8% Senior Notes are governed by indentures that contain certain restrictive covenants. These restrictions affect, and in many respects significantly limit or prohibit, among other things, our ability to incur indebtedness, make prepayments of certain indebtedness, pay dividends, make investments, engage in transactions with shareholders and affiliates, issue capital stock of subsidiaries, create liens, sell assets, and engage in mergers and consolidations.
The following diagram summarizes our corporate structure in relation to our outstanding indebtedness and Credit Facility as of September 30, 2003. The diagram does not depict all aspects of ownership structure among the operating and holding entities, but rather summarizes the significant elements relative to our debt in order to provide the reader a basic overview.
26
TIME WARNER TELECOM INC.
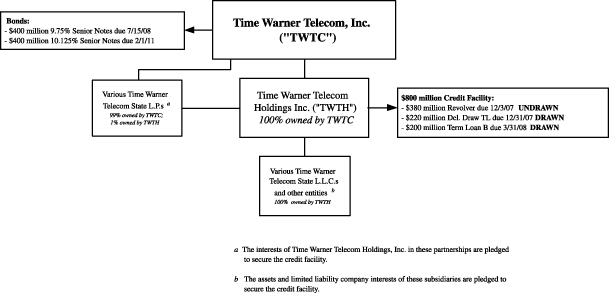
We agreed in the amendment to the Credit Facility not to access the revolving facility before January 2004. For the 12 months thereafter, we agreed to limit borrowings under the revolving facility to $200 million and to limit such borrowings in that 12 months to no more than $100 million in any three-month period. We do not anticipate that those limitations will adversely affect our liquidity. Our ability to draw down upon the available commitments under our Credit Facility is subject to compliance with all of the financial and other covenants contained in the credit agreement and our continued ability to make certain representations and warranties. These representations include the absence of liens on our properties other than certain permitted liens, the absence of litigation or other developments that have or could reasonably be expected to have a material adverse effect on us, and continued effectiveness of the documents granting security for the loans. Although we believe that we presently meet all of the conditions to making further draws under the Credit Facility, factors beyond our control could cause us to fail to meet these conditions in the future.
Our Credit Facility contains certain financial covenants, including the leverage and interest coverage ratios depicted in the following table. These ratios are primarily derived from EBITDA and debt levels and are summarized in the table below. As of September 30, 2003, we were in compliance with all of the covenants under the Credit Facility and our other debt agreements.
27
TIME WARNER TELECOM INC.
| Credit Facility Financial Ratio Summary |
| | | | | Performance Requirements
| | Actual
Ratio at
September 30,
2003
|
Ratio(1)
| | Calculation(2)
| | Period(3)
| | Ratio
| |
| | | | | | | less than: | | |
Senior Leverage Ratio | | Consolidated total debt less senior notes and cash in excess of $50 million, divided by annualized EBITDA (4) for the most recent quarter | | 01/01/03 - thereafter | | 3.00 to 1.0 | | less than 0 |
| | | | |
| | | | | | | less than: | | |
Consolidated Leverage Ratio | | Consolidated total debt less cash in excess of $50 million, divided by annualized EBITDA for the most recent quarter | | 04/01/03 - 09/30/03 | | 6.75 to 1.0 | | 2.7 |
| | | 10/01/03 - 12/31/03 | | 6.50 to 1.0 | | |
| | | | 01/01/04 - 03/31/04 | | 6.25 to 1.0 | | |
| | | | 04/01/04 - 06/30/04 | | 6.00 to 1.0 | | |
| | | | 07/01/04 - 09/30/04 | | 5.75 to 1.0 | | |
| | | | 10/01/04 - 03/31/05 | | 5.50 to 1.0 | | |
| | | | 04/01/05 - 06/30/05 | | 5.25 to 1.0 | | |
| | | | 07/01/05 - thereafter | | 5.00 to 1.0 | | |
| | | | |
| | | | | | | greater than: | | |
Consolidated Interest Coverage Ratio | | Consolidated EBITDA for the most recent four quarters divided by consolidated interest expense for the most recent four quarters | | 07/01/03 - 03/31/04 | | 1.25 to 1.0 | | 2.4 |
| | | 04/01/04 - 03/31/05 | | 1.50 to 1.0 | | |
| | | | 04/01/05 - 09/30/05 | | 1.75 to 1.0 | | |
| | | | 10/01/05 - thereafter | | 2.00 to 1.0 | | |
| | | | |
| | | | | | | greater than: | | |
Consolidated Debt Service Coverage Ratio | | Consolidated EBITDA for the most recent four quarters divided by the sum of consolidated interest expense for the most recent four quarters plus scheduled principal payments on debt and capital leases for the following four quarters | | 10/01/04 - 12/31/04 01/01/05 - thereafter | | 1.40 to 1.0 1.50 to 1.0 | | n/a |
| (1) | As defined in the credit agreement governing our Credit Facility. The credit agreement is filed as Exhibit 10.18 to our Annual Report on Form 10-K for the year ended December 31, 2000 and the amendment is filed as Exhibit 10.1 to our current report on Form 8-K dated October 29, 2002. |
| (2) | The descriptions of the calculations provide general information regarding the referenced ratio. Other factors, as defined in the credit agreement, may impact the actual calculation. |
| (3) | As measured on the last day of a fiscal quarter. |
| (4) | EBITDA is defined in our amended credit agreement as consolidated net income for the period plus income tax expense, interest expense, depreciation and amortization expense, and non-recurring non-cash losses and non-cash impairment charges (subject to certain limits) minus interest income and any extraordinary gains. This definition may result in a different calculation of EBITDA during quarters where there are non-recurring gains and losses than our definition of EBITDA appearing under “Results of Operations” and discussed elsewhere in this report. |
A lack of revenue growth could negatively impact EBITDA performance and cause us to fail to meet the required minimum ratios, since the ratios require higher EBITDA over time. An inability to control costs could also negatively affect EBITDA and result in our failure to meet the required ratios. Although we currently believe that we will continue to be in compliance with these covenants, factors outside our control, including deterioration of the economy, an acceleration of customer disconnects, or a significant reduction in demand for, or prices of, our services without adequate reductions in capital expenditures and operating expenses, could cause us to fail to meet these covenants. If our revenue growth is not sufficient to sustain the EBITDA performance required to meet the debt covenants described above without adequate reductions in capital expenditures, we would have to consider cost-cutting measures to maintain required EBITDA levels or to enhance liquidity. These
28
TIME WARNER TELECOM INC.
measures could include reductions in certain discretionary expenditures such as training, travel, and employee benefits, reductions in headcount, or shutting down less profitable operations.
The Credit Facility also limits our ability to declare dividends, incur indebtedness, incur liens on property, and make capital expenditures. In addition, the Credit Facility includes cross default provisions under which we are deemed to be in default under that facility if we default under any of the other material outstanding obligations, such as the 9 3/4% Senior Notes or the 10 1/8% Senior Notes. Failure to meet these covenants would preclude us from drawing funds under the Credit Facility unless the lenders agree to further modify the covenants, and could potentially cause an acceleration of the repayment schedule. Although we believe our relationships with our lenders are good, we may not be able to obtain the necessary modifications on acceptable terms. In the event that our plans or assumptions change or prove to be inaccurate, or the foregoing sources of funds prove to be insufficient to fund our growth and operations, or if we consummate acquisitions, joint ventures, or additional market expansion, we would be required to seek additional capital sooner than currently anticipated. Our revenue and costs are partially dependent upon factors that are outside our control, such as general economic conditions, regulatory changes, adverse changes in customers’ financial condition, changes in technology, and increased competition. Due to the uncertainty of these and other factors, actual revenue and costs may vary from expected amounts, possibly to a material degree, and these variations would likely affect the level of our future capital expenditures and expansion plans. Any additional sources of financing may include public or private debt, equity financing by us or our subsidiaries, or other financing arrangements. Our Class B stockholders are under no obligation to make any additional investments in us or to provide guaranties for debt financing by banks or other financing sources.
We expect that the $465 million in cash, cash equivalents, and marketable debt securities at September 30, 2003, and borrowings under the Credit Facility, along with internally generated funds, will provide us sufficient funds to meet our operating requirements. However, we may be required to refinance existing debt, seek additional capital funding, or both, depending upon the level of our cash flow from operations. From time to time we may execute financing transactions to enhance our liquidity. Such transactions could involve the issuance of debt, repurchase or redemption of existing debt, the issuance of equity, or some combination of available financing options. Our evaluation of any such transaction would be done in light of market conditions, contractual constraints, and the financial impact on us of such a financing.
Commitments. Our long-term commitments have not materially changed from those disclosed in our filing on Form 10-K for the year ended December 31, 2002.
Effects of Inflation
Historically, inflation has not had a material effect on us.
| Item 3. | | Quantitative and Qualitative Disclosures About Market Risk |
Our interest income is sensitive to changes in the general level of interest rates. In this regard, changes in interest rates can affect the interest earned on our cash equivalents and marketable debt securities. To mitigate the impact of fluctuations in interest rates, we generally enter into fixed rate investing arrangements.
The following table provides information at September 30, 2003 about our investments that are sensitive to changes in interest rates. For these securities, the table presents related weighted-average interest rates expected by the maturity dates. These investment securities will mature within one year.
| | | 2003 Maturities
| |
| | | (dollar amounts
in thousands) | |
Assets | | | | |
Marketable debt securities and cash equivalents: | | | | |
Shares of money market mutual funds | | $ | 22,411 | |
Weighted average interest rate | | | 1.1 | % |
Corporate and municipal debt securities | | $ | 404,017 | |
Weighted average interest rate | | | 1.0 | % |
29
TIME WARNER TELECOM INC.
At September 30, 2003, the fair value of our fixed rate 9 3/4% Senior Notes due 2008 was approximately $396 million and the fair value of our fixed rate 10 1/8% Senior Notes due 2011 was at par, as compared to a carrying value of $400 million each on the same date. These notes have not been listed on any securities exchange or inter-dealer automated quotation system, so the estimated market value is based on indicative pricing published by investment banks. While we believe these approximations to be reasonably accurate at the time published, indicative pricing can vary widely depending on volume traded by any given investment bank.
Interest payable on amounts drawn under the Credit Facility varies based on a specific Eurodollar rate. Based on the $402 million outstanding balance as of September 30, 2003, a one-percent change in the applicable rate would change the amount of annual interest paid by approximately $4 million.
| Item 4. | | Controls and Procedures |
As of September 30, 2003, the Company conducted an evaluation, under the supervision and with the participation of the Chief Executive Officer and Chief Financial Officer, of the effectiveness of the design and operation of our disclosure controls and procedures. Based on that evaluation, the Chief Executive Officer and Chief Financial Officer concluded that our disclosure controls and procedures are effective to ensure that information required to be disclosed by the Company in reports that we file or submit under the Exchange Act is recorded, processed, summarized, and reported within the time periods specified in Securities and Exchange Commission rules and forms as of September 30, 2003. There was no change in our internal control over financial reporting during the fiscal quarter ended September 30, 2003 that has materially affected, or is reasonably likely to materially affect, the Company’s internal control over financial reporting.
30
TIME WARNER TELECOM INC.
Part II
Other Information
| Item 1. | | Legal Proceedings |
We have no material legal proceedings pending.
| Item 5. | | Other Information |
Bruce Claflin, one of our independent directors, has tendered his resignation from our board of directors, effective December 1, 2003. Our board of directors has elected Mary Agnes Wilderotter, Senior Vice President, Business Strategy for Microsoft Corporation, who previously served on our board in 2002, as an independent director effective January 2, 2004 to fill the vacancy that will be created by Mr. Claflin’s resignation.
Members of our senior management, including Larissa Herda, Chairman, CEO, and President, have adopted prearranged plans to trade specific amounts of Time Warner Telecom stock and exercise options to purchase our stock over varying time periods beginning in November 2003. These plans are in accordance with our insider trading policy and Securities and Exchange Commission Rule 10b5-1. Rule 10b5-1 permits the implementation of written, prearranged plans when insiders are not in possession of material non-public information, and allows the insiders to trade on a regularly scheduled basis, regardless of any subsequent material non-public information they receive. Plans under Rule 10b5-1 allow members of management to diversify their investment holdings and generate cash to satisfy tax liabilities while avoiding concerns about initiating stock transactions. Upon completion of this plan, Ms. Herda and other members of management implementing such plans will continue to retain a significant portion of their existing investments in Time Warner Telecom, including both stock and options.
| Item 6. | | Exhibits and Reports on Form 8-K. |
The exhibits listed on the accompanying Exhibit Index are filed or incorporated by reference as part of this report and the Exhibit Index is incorporated herein by reference.
| | (i) | Form 8-K dated July 28, 2003 furnished the Company’s second quarter 2003 press release |
| | (ii) | Form 8-K dated August 7, 2003 regarding the Time Warner brand name license agreement extension. |
| | (iii) | Form 8-K dated September 3, 2003 regarding Time Warner Telecom Inc. investor presentation at Kaufman Bros. 6th Annual Communications, Media & Technology Conference. |
31
Signature
Pursuant to the requirements of the Securities Exchange Act of 1934, the Registrant has duly caused this report to be signed on its behalf by the undersigned thereunto duly authorized.
| | | | | | | TIME WARNER TELECOM INC. |
| | | |
Date: November 14, 2003 | | | | By: | | /s/ Jill R. Stuart |
| | | | | |
|
| | | | | | | | | Jill R. Stuart Vice President, Accounting and Finance and Chief Accounting Officer |
32
TIME WARNER TELECOM INC.
EXHIBIT INDEX
Exhibit
Number
| | | | Description of Exhibit
|
| | |
| 10.1 | | - | | Amendment No. 2 to Trade Name License Agreement with Time Warner Inc. |
| 31.1 | | - | | Certification of Chief Executive Officer pursuant to Item 601(b)(31) of Regulation S-K, as adopted pursuant to Section 302 of the Sarbanes-Oxley Act of 2002. |
| 31.2 | | - | | Certification of Chief Financial Officer pursuant to Item 601(b)(31) of Regulations S-K, as adopted pursuant to Section 302 of the Sarbanes-Oxley Act of 2002. |
| 32.1 | | - | | Certification of Chief Executive Officer pursuant to 18 U.S.C. Section 1350, as adopted pursuant to Section 906 of the Sarbanes-Oxley Act of 2002. |
| 32.2 | | - | | Certification of Chief Financial Officer pursuant to 18 U.S.C. Section 1350, as adopted pursuant to Section 906 of the Sarbanes-Oxley Act of 2002. |
33