Exhibit 99.1
Investor Presentation March, 2005
Safe Harbor Statement . . .
Statements made during today’s presentation may include certain forward-looking statements within the meaning of the Private Securities Litigation Reform Act of 1995. These statements are based on management’s current expectations and are subject to risks and uncertainties. These risks include the risks summarized in the Company’s filings with the SEC, including the section entitled “Risk Factors” in its Annual Report on Form 10-K and those set forth in Item 8.01 of its Current Report on Form 8-K dated February 3, 2005.
Time Warner Telecom Inc. is under no obligation, and expressly disclaims any obligation, to update or alter its forward-looking statements whether as a result of new information, future events or otherwise.
Comments and discussions related to financial performance and trends are based on the information from our fourth quarter 2004 earnings call and press release. Please see our Q4 2004 earnings release at www.twtelecom.com.
2
Company Overview
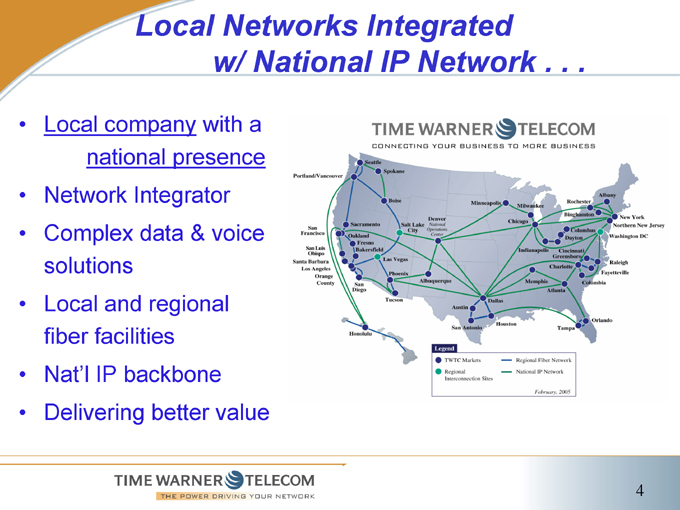
Local Networks Integrated w/ National IP Network . . .
Local company with a national presence Network Integrator Complex data & voice solutions Local and regional fiber facilities Nat’l IP backbone Delivering better value
4
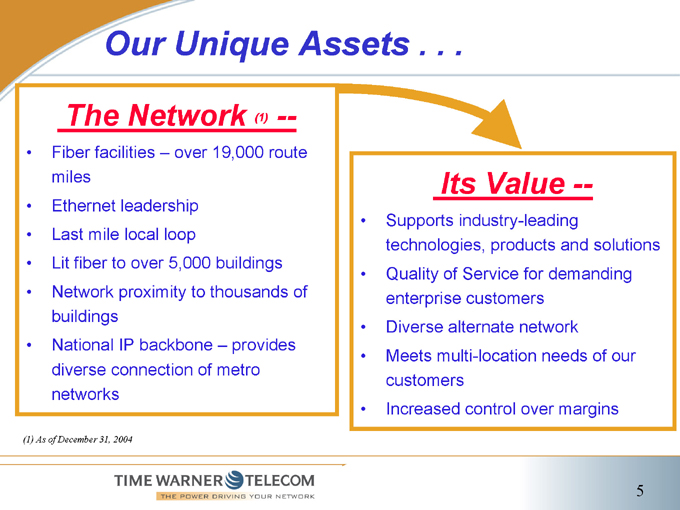
Our Unique Assets . .. .
The Network (1) —
Fiber facilities – over 19,000 route miles Ethernet leadership Last mile local loop Lit fiber to over 5,000 buildings Network proximity to thousands of buildings National IP backbone – provides diverse connection of metro networks
(1) As of December 31, 2004
Its Value —
Supports industry-leading technologies, products and solutions Quality of Service for demanding enterprise customers Diverse alternate network Meets multi-location needs of our customers Increased control over margins
5
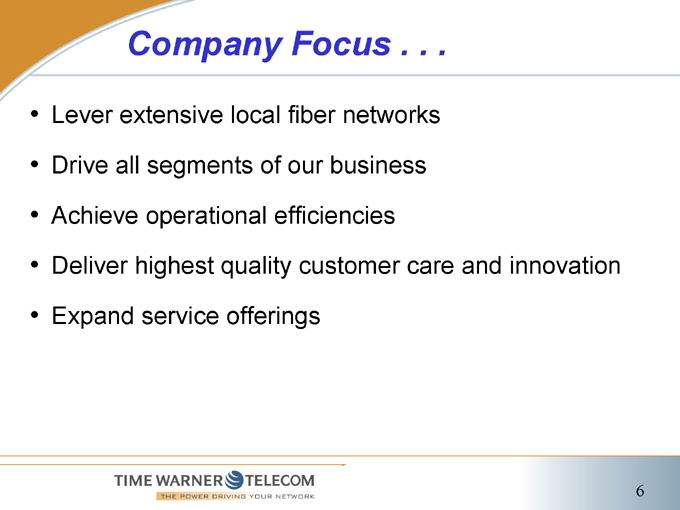
Company Focus . . .
Lever extensive local fiber networks Drive all segments of our business Achieve operational efficiencies
Deliver highest quality customer care and innovation
Expand service offerings
6
Product Overview
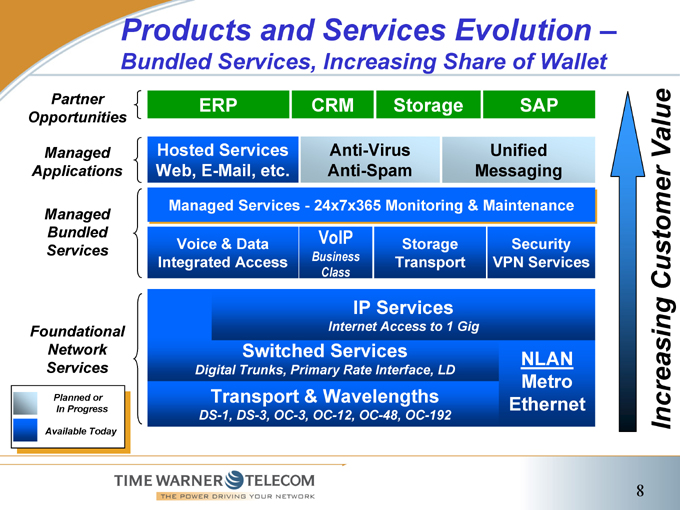
Products and Services Evolution –
Bundled Services, Increasing Share of Wallet
Partner Opportunities
Managed Applications
Managed Bundled Services
Foundational Network Services
ERP
CRM
Storage
SAP
Hosted Services Web, E-Mail, etc.
Anti-Virus Anti-Spam
Unified Messaging
Managed Services—24x7x365 Monitoring & Maintenance
Voice & Data Integrated Access
VoIP
Business Class
Storage Transport
Security VPN Services
IP Services
Internet Access to 1 Gig
Switched Services
Digital Trunks, Primary Rate Interface, LD
Transport & Wavelengths
DS-1, DS-3, OC-3, OC-12, OC-48, OC-192
NLAN Metro Ethernet
Increasing Customer Value
Planned or In Progress
Available Today
8
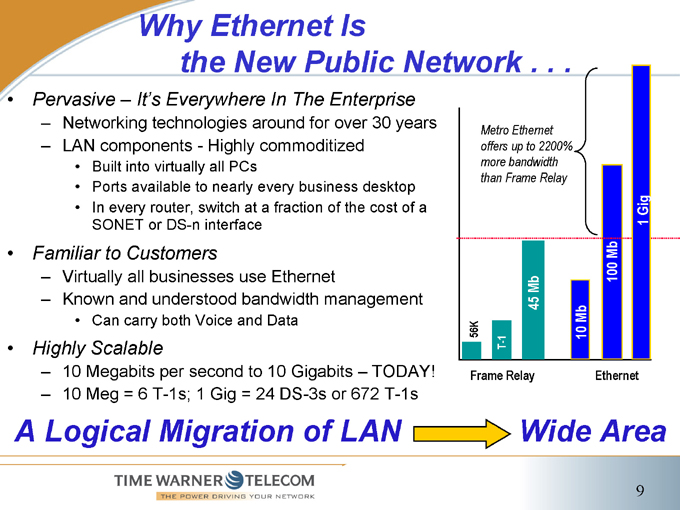
Why Ethernet Is the New Public Network . . .
Pervasive – It’s Everywhere In The Enterprise
Networking technologies around for over 30 years LAN components - Highly commoditized
Built into virtually all PCs
Ports available to nearly every business desktop In every router, switch at a fraction of the cost of a SONET or DS-n interface
Familiar to Customers
Virtually all businesses use Ethernet
Known and understood bandwidth management
Can carry both Voice and Data
Highly Scalable
10 Megabits per second to 10 Gigabits – TODAY! 10 Meg = 6 T-1s; 1 Gig = 24 DS-3s or 672 T-1s
Metro Ethernet offers up to 2200% more bandwidth than Frame Relay
56K
T-1
45 Mb
10 Mb
100 Mb
1 Gig
Frame Relay
Ethernet
A Logical Migration of LAN
Wide Area
9
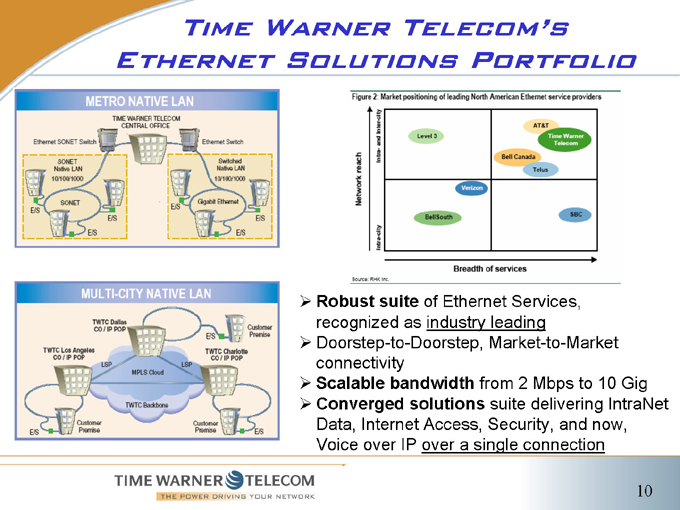
Time Warner Telecom’s Ethernet Solutions Portfolio
Robust suite of Ethernet Services, recognized as industry leading Doorstep-to-Doorstep, Market-to-Market connectivity Scalable bandwidth from 2 Mbps to 10 Gig Converged solutions suite delivering IntraNet Data, Internet Access, Security, and now, Voice over IP over a single connection
10
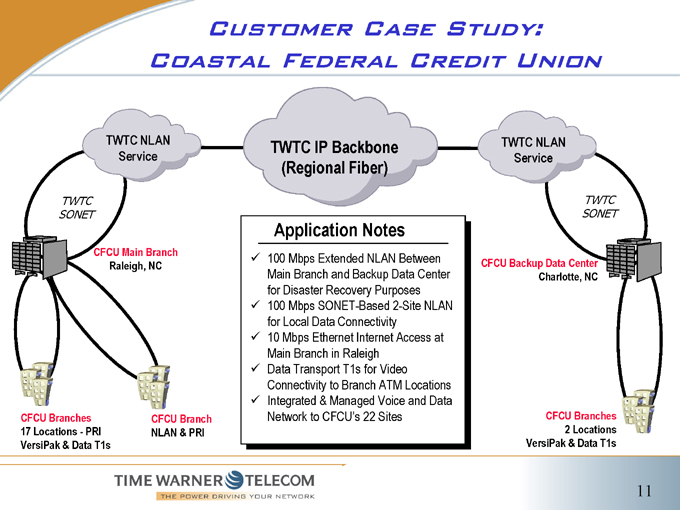
Customer Case Study: Coastal Federal Credit Union
TWTC NLAN
Service
TWTC IP Backbone (Regional Fiber)
TWTC NLAN
Service
TWTC SONET
CFCU Main Branch Raleigh, NC
CFCU Branches 17 Locations - PRI VersiPak & Data T1s
CFCU Branch NLAN & PRI
Application Notes
100 Mbps Extended NLAN Between Main Branch and Backup Data Center for Disaster Recovery Purposes
100 Mbps SONET-Based 2-Site NLAN for Local Data Connectivity
10 Mbps Ethernet Internet Access at Main Branch in Raleigh
Data Transport T1s for Video Connectivity to Branch ATM Locations
Integrated & Managed Voice and Data Network to CFCU’s 22 Sites
TWTC SONET
CFCU Backup Data Center Charlotte, NC
CFCU Branches 2 Locations VersiPak & Data T1s
11
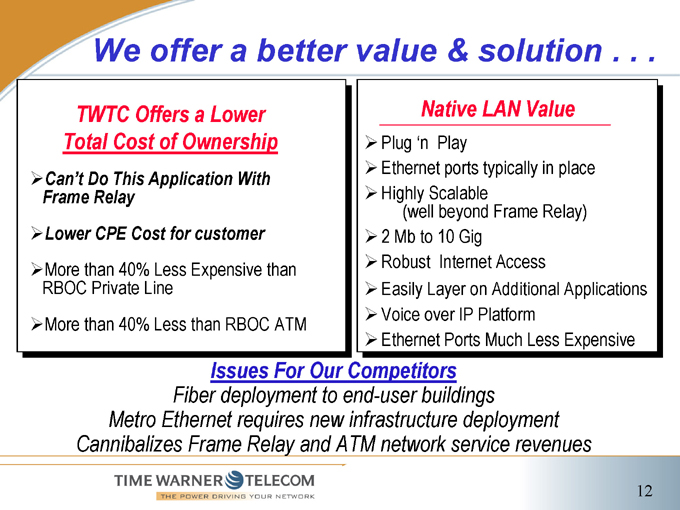
We offer a better value & solution . . .
TWTC Offers a Lower Total Cost of Ownership
Can’t Do This Application With Frame Relay
Lower CPE Cost for customer
More than 40% Less Expensive than RBOC Private Line
More than 40% Less than RBOC ATM
Native LAN Value
Plug ‘n Play
Ethernet ports typically in place
Highly Scalable
(well beyond Frame Relay)
2 Mb to 10 Gig
Robust Internet Access
Easily Layer on Additional Applications
Voice over IP Platform
Ethernet Ports Much Less Expensive
Issues For Our Competitors
Fiber deployment to end-user buildings Metro Ethernet requires new infrastructure deployment Cannibalizes Frame Relay and ATM network service revenues
12
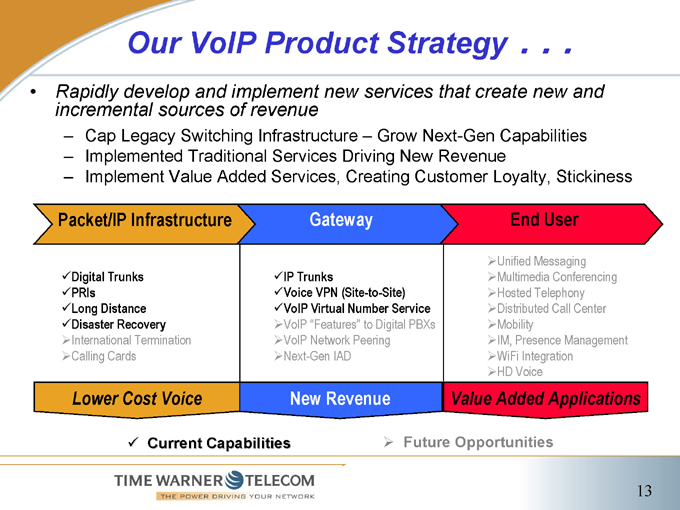
Our VoIP Product Strategy . . .
Rapidly develop and implement new services that create new and incremental sources of revenue
Cap Legacy Switching Infrastructure – Grow Next-Gen Capabilities Implemented Traditional Services Driving New Revenue Implement Value Added Services, Creating Customer Loyalty, Stickiness
Packet/IP Infrastructure
Gateway
End User
Digital Trunks PRIs Long Distance Disaster Recovery
International Termination Calling Cards
IP Trunks
Voice VPN (Site-to-Site) VoIP Virtual Number Service
VoIP “Features” to Digital PBXs VoIP Network Peering Next-Gen IAD
Unified Messaging Multimedia Conferencing Hosted Telephony Distributed Call Center Mobility IM, Presence Management WiFi Integration HD Voice
Lower Cost Voice
New Revenue
Value Added Applications
Current Capabilities
Future Opportunities
13
Financial Overview
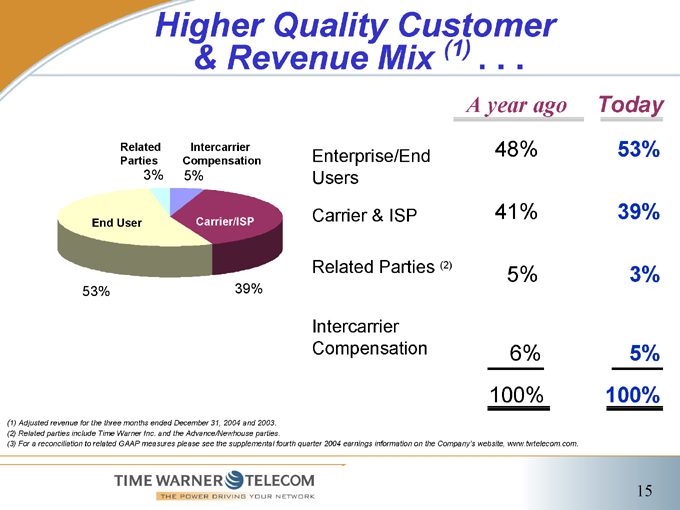
Higher Quality Customer & Revenue Mix (1) . . .
Related Intercarrier Parties Compensation
3% 5%
End User
Carrier/ISP
53%
39%
A year ago Today
Enterprise/
End 48% 53%
Users
Carrier & ISP 41% 39%
Related Parties (2) 5% 3%
Intercarrier
Compensation 6% 5%
100% 100%
(1) Adjusted revenue for the three months ended December 31, 2004 and 2003. (2) Related parties include Time Warner Inc. and the Advance/Newhouse parties.
(3) For a reconciliation to related GAAP measures please see the supplemental fourth quarter 2004 earnings information on the Company’s website, www.twtelecom.com.
15
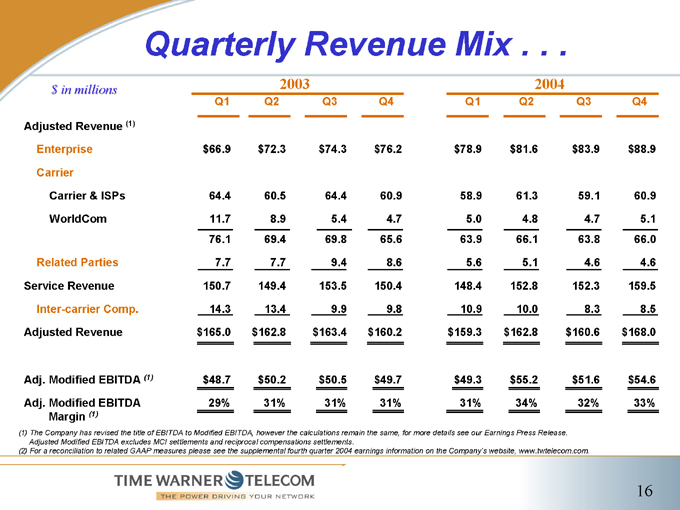
Quarterly Revenue Mix . . .
$ in millions 2003 2004
Q1 Q2 Q3 Q4 Q1 Q2 Q3 Q4
Adjusted Revenue (1)
Enterprise $ 66.9 $ 72.3 $ 74.3 $ 76.2 $ 78.9 $ 81.6 $ 83.9 $ 88.9
Carrier
Carrier & ISPs 64.4 60.5 64.4 60.9 58.9 61.3 59.1 60.9
WorldCom 11.7 8.9 5.4 4.7 5.0 4.8 4.7 5.1
76.1 69.4 69.8 65.6 63.9 66.1 63.8 66.0
Related Parties 7.7 7.7 9.4 8.6 5.6 5.1 4.6 4.6
Service Revenue 150.7 149.4 153.5 150.4 148.4 152.8 152.3 159.5
Inter-carrier Comp. 14.3 13.4 9.9 9.8 10.9 10.0 8.3 8.5
Adjusted Revenue $ 165.0 $ 162.8 $ 163.4 $ 160.2 $ 159.3 $ 162.8 $ 160.6 $ 168.0
Adj. Modified EBITDA (1) $ 48.7 $ 50.2 $ 50.5 $ 49.7 $ 49.3 $ 55.2 $ 51.6 $ 54.6
Adj. Modified EBITDA 29% 31% 31% 31% 31% 34% 32% 33%
Margin (1)
(1) The Company has revised the title of EBITDA to Modified EBITDA, however the calculations remain the same, for more details see our Earnings Press Release.
Adjusted Modified EBITDA excludes MCI settlements and reciprocal compensations settlements.
(2) For a reconciliation to related GAAP measures please see the supplemental fourth quarter 2004 earnings information on the Company’s website, www.twtelecom.com.
16
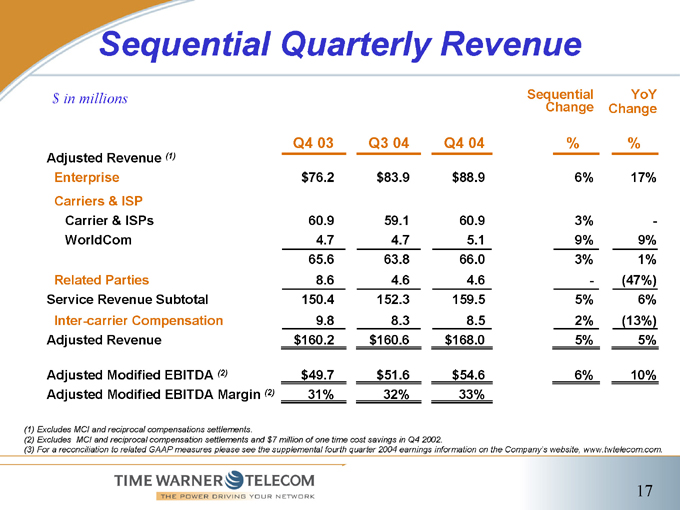
Sequential Quarterly Revenue
$ in millions Sequential YoY
Change Change
Q4 03 Q3 04 Q4 04 % %
Adjusted Revenue (1)
Enterprise $ 76.2 $ 83.9 $ 88.9 6% 17%
Carriers & ISP
Carrier & ISPs 60.9 59.1 60.9 3% -
WorldCom 4.7 4.7 5.1 9% 9%
65.6 63.8 66.0 3% 1%
Related Parties 8.6 4.6 4.6 - (47%)
Service Revenue Subtotal 150.4 152.3 159.5 5% 6%
Inter-carrier Compensation 9.8 8.3 8.5 2% (13%)
Adjusted Revenue $ 160.2 $ 160.6 $ 168.0 5% 5%
Adjusted Modified EBITDA (2) $ 49.7 $ 51.6 $ 54.6 6% 10%
Adjusted Modified EBITDA Margin (2) 31% 32% 33%
(1) Excludes MCI and reciprocal compensations settlements.
(2) Excludes MCI and reciprocal compensation settlements and $7 million of one time cost savings in Q4 2002.
(3) For a reconciliation to related GAAP measures please see the supplemental fourth quarter 2004 earnings information on the Company’s website, www.twtelecom.com.
17
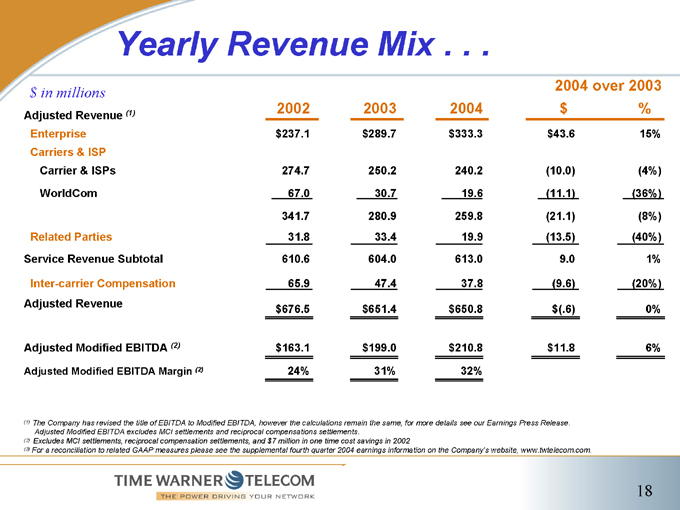
Yearly Revenue Mix . .. .
2004 over 2003
$ in millions
2002 2003 2004 $ %
Adjusted Revenue (1)
Enterprise $ 237.1 $ 289.7 $ 333.3 $ 43.6 15%
Carriers & ISP
Carrier & ISPs 274.7 250.2 240.2 (10.0) (4%)
WorldCom 67.0 30.7 19.6 (11.1) (36%)
341.7 280.9 259.8 (21.1) (8%)
Related Parties 31.8 33.4 19.9 (13.5) (40%)
Service Revenue Subtotal 610.6 604.0 613.0 9.0 1%
Inter-carrier Compensation 65.9 47.4 37.8 (9.6) (20%)
Adjusted Revenue
$ 676.5 $ 651.4 $ 650.8 $ (.6) 0%
Adjusted Modified EBITDA (2) $ 163.1 $ 199.0 $ 210.8 $ 11.8 6%
Adjusted Modified EBITDA Margin (2) 24% 31% 32%
(1) The Company has revised the title of EBITDA to Modified EBITDA, however the calculations remain the same, for more details see our Earnings Press Release.
Adjusted Modified EBITDA excludes MCI settlements and reciprocal compensations settlements.
(2) Excludes MCI settlements, reciprocal compensation settlements, and $7 million in one time cost savings in 2002
(3) For a reconciliation to related GAAP measures please see the supplemental fourth quarter 2004 earnings information on the Company’s website, www.twtelecom.com.
18
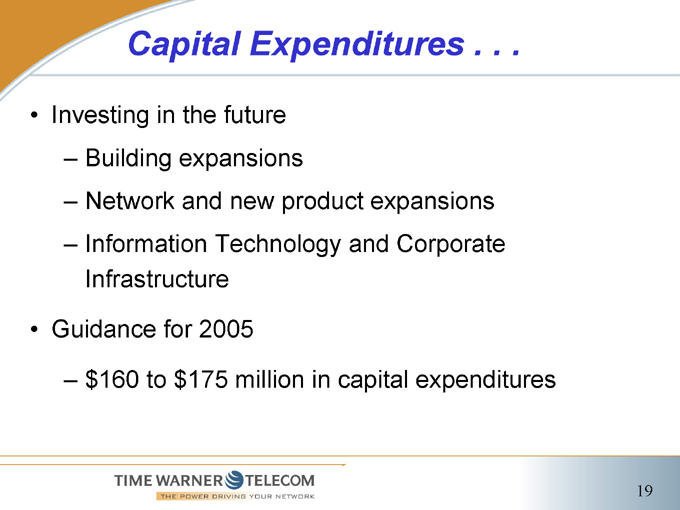
Capital Expenditures .. . .
Investing in the future
Building expansions
Network and new product expansions Information Technology and Corporate Infrastructure
Guidance for 2005 $160 to $175 million in capital expenditures
19
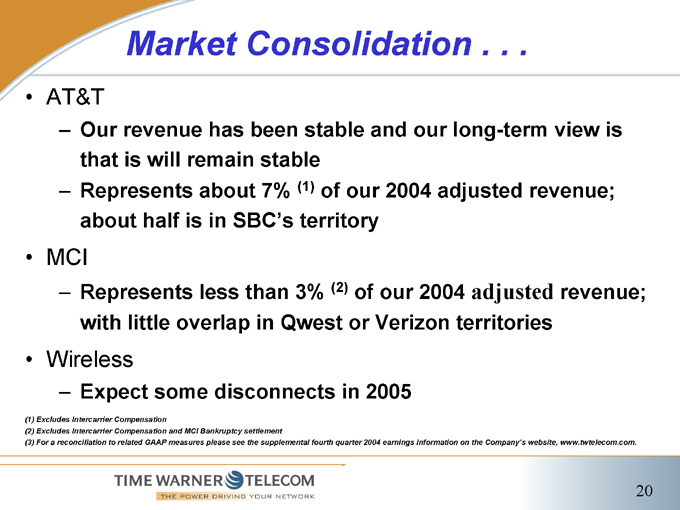
Market Consolidation . . .
AT&T
Our revenue has been stable and our long-term view is that is will remain stable Represents about 7%(1) of our 2004 adjusted revenue; about half is in SBC’s territory
MCI
Represents less than 3%(2) of our 2004 adjusted revenue; with little overlap in Qwest or Verizon territories
Wireless
Expect some disconnects in 2005
(1) Excludes Intercarrier Compensation
(2) Excludes Intercarrier Compensation and MCI Bankruptcy settlement
(3) For a reconciliation to related GAAP measures please see the supplemental fourth quarter 2004 earnings information on the Company’s website, www.twtelecom.com.
20
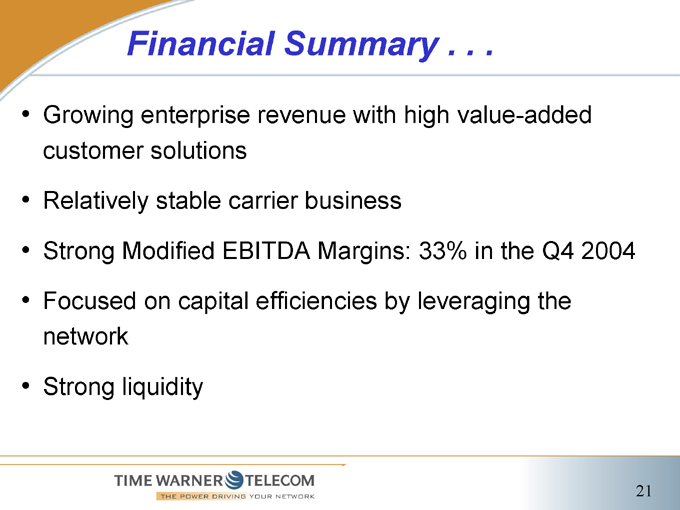
Financial Summary . .. .
Growing enterprise revenue with high value-added customer solutions
Relatively stable carrier business
Strong Modified EBITDA Margins: 33% in the Q4 2004
Focused on capital efficiencies by leveraging the network
Strong liquidity
21

Questions & Answers