Earnings Conference Call 4th Quarter & Year-End 2024 February 20, 2025 Exhibit 99.2
Forward-Looking Statements This presentation (and oral statements relating to this presentation) contains forward-looking statements within the meaning of the Private Securities Litigation Reform Act of 1995. Any statements, other than statements of historical facts, that express or involve discussions of expectations, beliefs, plans, objectives, outlooks, assumptions, or future events or performance are forward-looking. Forward-looking statements are not guarantees of future performance, involve estimates, assumptions, risks, and uncertainties, and may differ materially from actual results, performance, or outcomes. Factors that may cause actual results or outcomes to differ materially from those contained in forward-looking statements include those listed in IDACORP, Inc.'s and Idaho Power Company's most recently filed periodic reports on Form 10-K and Form 10-Q, including (but not limited to) the “Risk Factors” and “Management's Discussion and Analysis of Financial Condition and Results of Operations” sections, and in other reports the companies file with the U.S. Securities and Exchange Commission. Those factors also include the following, among others: • Decisions or actions by state and federal regulators affecting Idaho Power's ability to recover costs and earn a return on investment; • Changes to or elimination of Idaho Power’s regulatory cost recovery mechanisms; • Ability to timely obtain permits and construct, and expenses and risks of capital expenditures and contractual obligations for, utility infrastructure, including the impacts of inflation, price volatility (including due to tariffs), supply chain constraints, and supplier and contractor delays and failure to satisfy project quality and performance standards; • Impacts of economic conditions, including an inflationary or recessionary environment and interest rates, on items such as operations and capital investments and changes in customer demand; • The rapid addition of new industrial and commercial customer load and the volatility of such new load demand, resulting in increased risks and costs of power demand potentially exceeding available supply; • The potential financial impacts of industrial customers not meeting forecasted power usage ramp rates or amounts; • Risks of operating an electric utility system, including compliance with regulatory obligations and potential liability for fires, outages, and personal injury or property damage; • Acts or threats of terrorism, cyber or physical security attacks, and other acts seeking to disrupt Idaho Power's operations or the electric power grid or compromise data; • Abnormal or severe weather conditions, wildfires, droughts, earthquakes, and other natural phenomena and natural disasters; • Ability to acquire equipment, materials, fuel, power, and transmission capacity on reasonable terms and prices; • Impacts of current and future governmental regulation and ability to timely obtain, and the cost of obtaining and complying with, government permits and approvals, licenses, and rights-of-way and siting for transmission and generation projects; • Ability to obtain debt and equity financing when necessary and on satisfactory terms; • Ability to continue to pay dividends and achieve target dividend-payout ratios, and contractual and regulatory restrictions on those dividends; and • Changing market dynamics due to the emergence of day ahead or other energy and transmission markets in the western United States and surrounding regions. New factors emerge from time to time, and it is not possible for the companies to predict all such factors, nor can they assess the impact of any such factor on the business or the extent to which any factor, or combination of factors, may cause results to differ materially from those contained in any forward-looking statement. IDACORP and Idaho Power disclaim any obligation to update publicly any forward-looking information, whether in response to new information, future events, or otherwise, except as required by applicable law. 2

Presenting Today Amy Shaw IDACORP Vice President of Finance, Compliance & Risk Brian Buckham IDACORP Senior Vice President, Chief Financial Officer & Treasurer Lisa Grow IDACORP President & Chief Executive Officer John Wonderlich IDACORP Investor Relations Manager 3
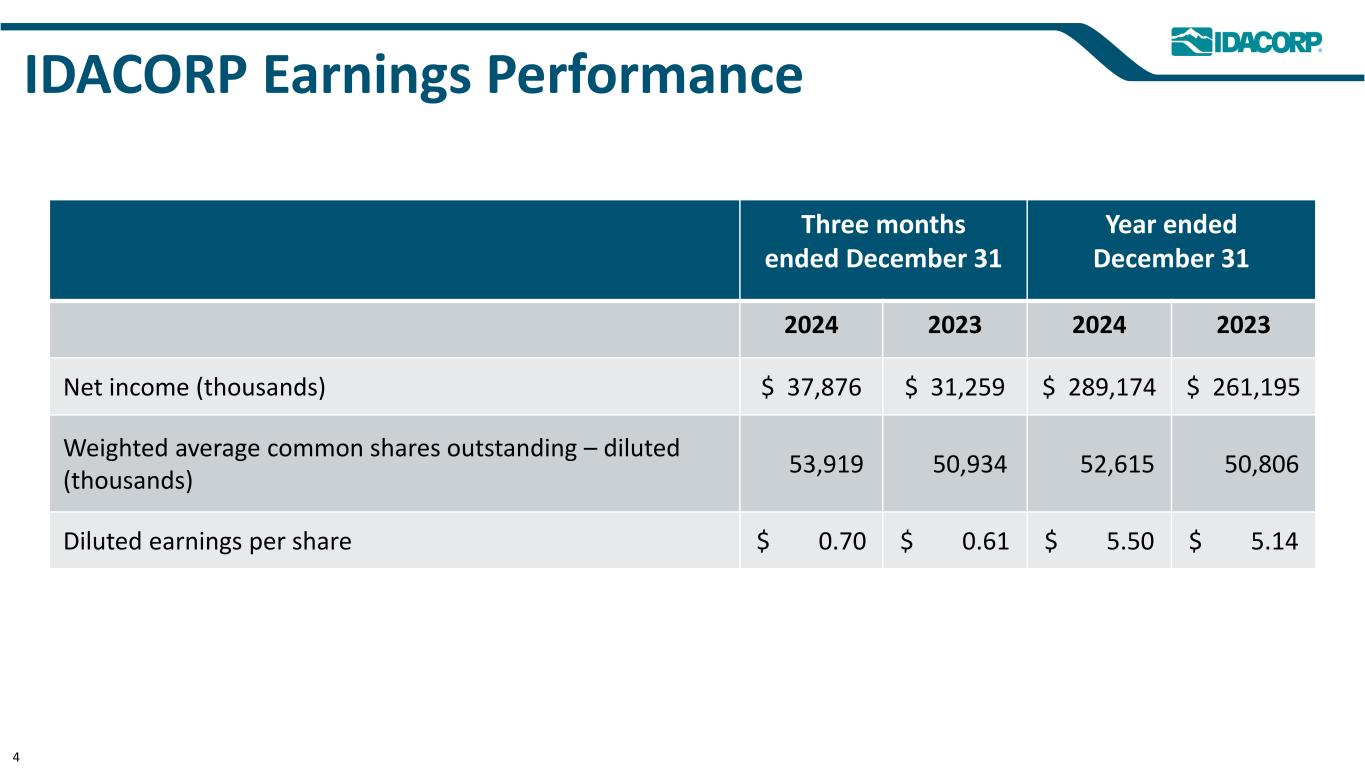
IDACORP Earnings Performance Three months ended December 31 Year ended December 31 2024 2023 2024 2023 Net income (thousands) $ 37,876 $ 31,259 $ 289,174 $ 261,195 Weighted average common shares outstanding – diluted (thousands) 53,919 50,934 52,615 50,806 Diluted earnings per share $ 0.70 $ 0.61 $ 5.50 $ 5.14 4
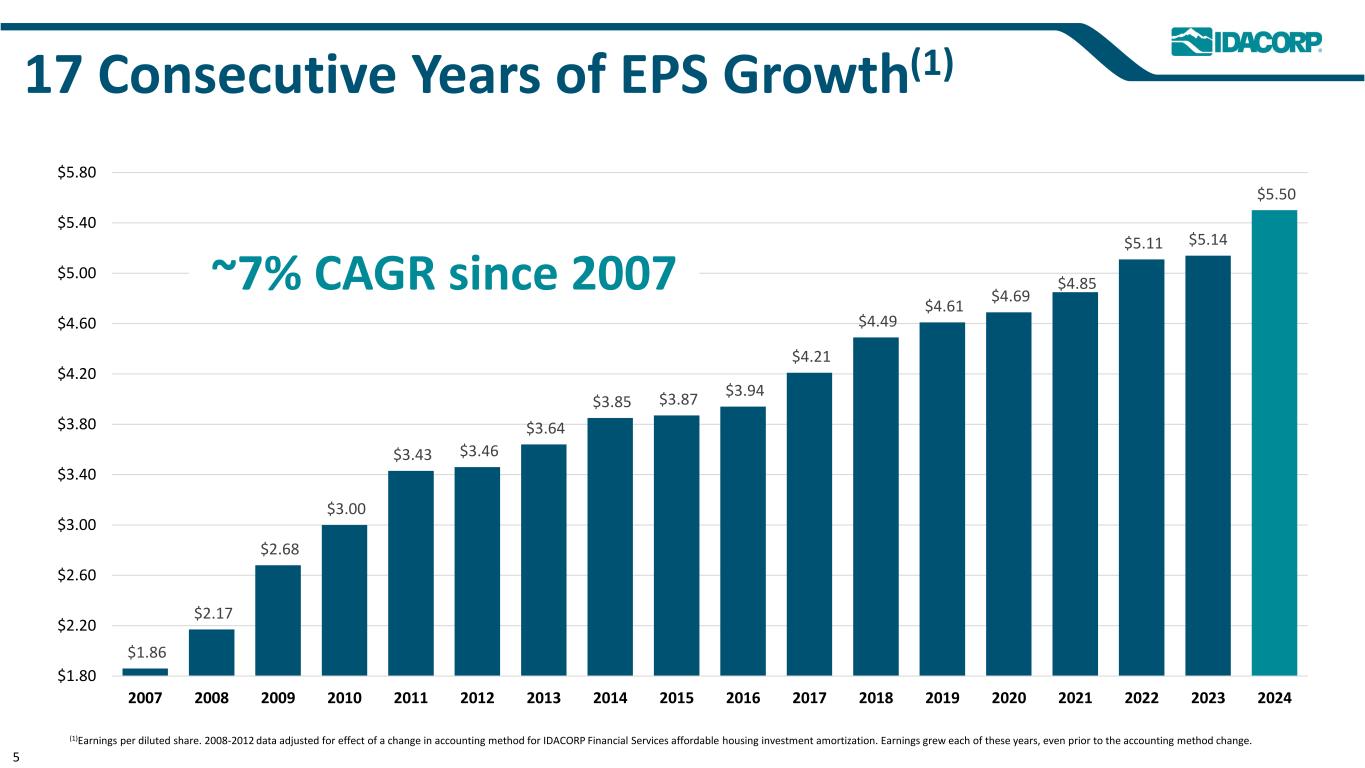
17 Consecutive Years of EPS Growth(1) (1)Earnings per diluted share. 2008-2012 data adjusted for effect of a change in accounting method for IDACORP Financial Services affordable housing investment amortization. Earnings grew each of these years, even prior to the accounting method change. $1.86 $2.17 $2.68 $3.00 $3.43 $3.46 $3.64 $3.85 $3.87 $3.94 $4.21 $4.49 $4.61 $4.69 $4.85 $5.11 $5.14 $5.50 $1.80 $2.20 $2.60 $3.00 $3.40 $3.80 $4.20 $4.60 $5.00 $5.40 $5.80 2007 2008 2009 2010 2011 2012 2013 2014 2015 2016 2017 2018 2019 2020 2021 2022 2023 2024 ~7% CAGR since 2007 5
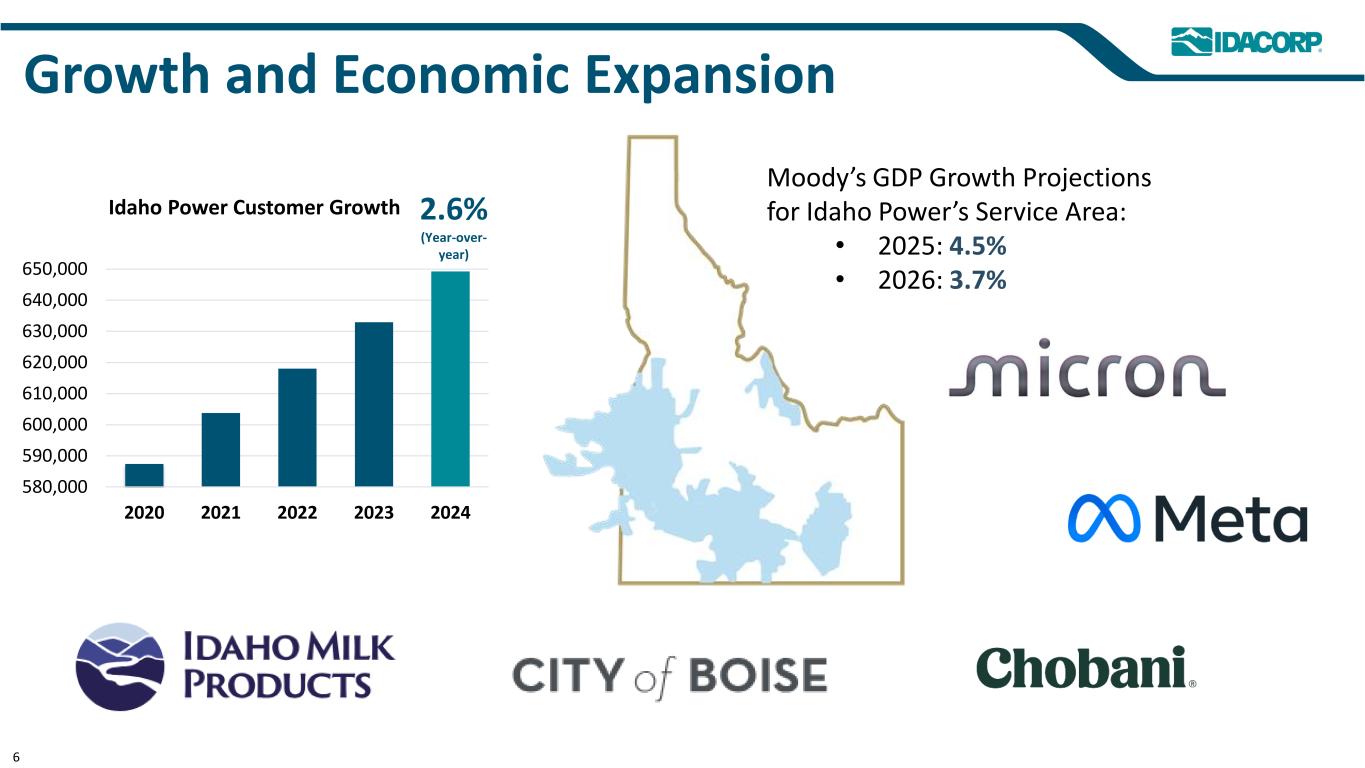
Growth and Economic Expansion Moody’s GDP Growth Projections for Idaho Power’s Service Area: • 2025: 4.5% • 2026: 3.7% 2.6% (Year-over- year) Idaho Power Customer Growth 580,000 590,000 600,000 610,000 620,000 630,000 640,000 650,000 2020 2021 2022 2023 2024 6

Oregon General Rate Case • Filed with the OPUC in December 2023 • In September 2024, the OPUC issued an order approving settlement stipulations • Rates became effective October 15, 2024 – Increase of $6.7 million, or 12.14%, in total Oregon jurisdictional revenue – 9.5% Oregon-jurisdiction ROE – 7.302% Oregon-jurisdiction overall rate of return • Settlement stipulations do not preclude Idaho Power from filing another general rate case or other limited issue proceeding in Oregon at any time in the future Idaho and Oregon Rate Case Activity Idaho Limited-Issue Rate Case • Filed with the IPUC in May 2024 • In December 2024, the IPUC issued an order approving a rate increase • Rates became effective January 1, 2025 – Increase of $50.1 million, or 3.7%, in total Idaho jurisdictional revenue – No change to Idaho-jurisdiction ROE (9.6% from 2023 general rate case) • The limited-issue request focused on revenue requirements for 2024 incremental plant additions and incremental ongoing labor costs 7
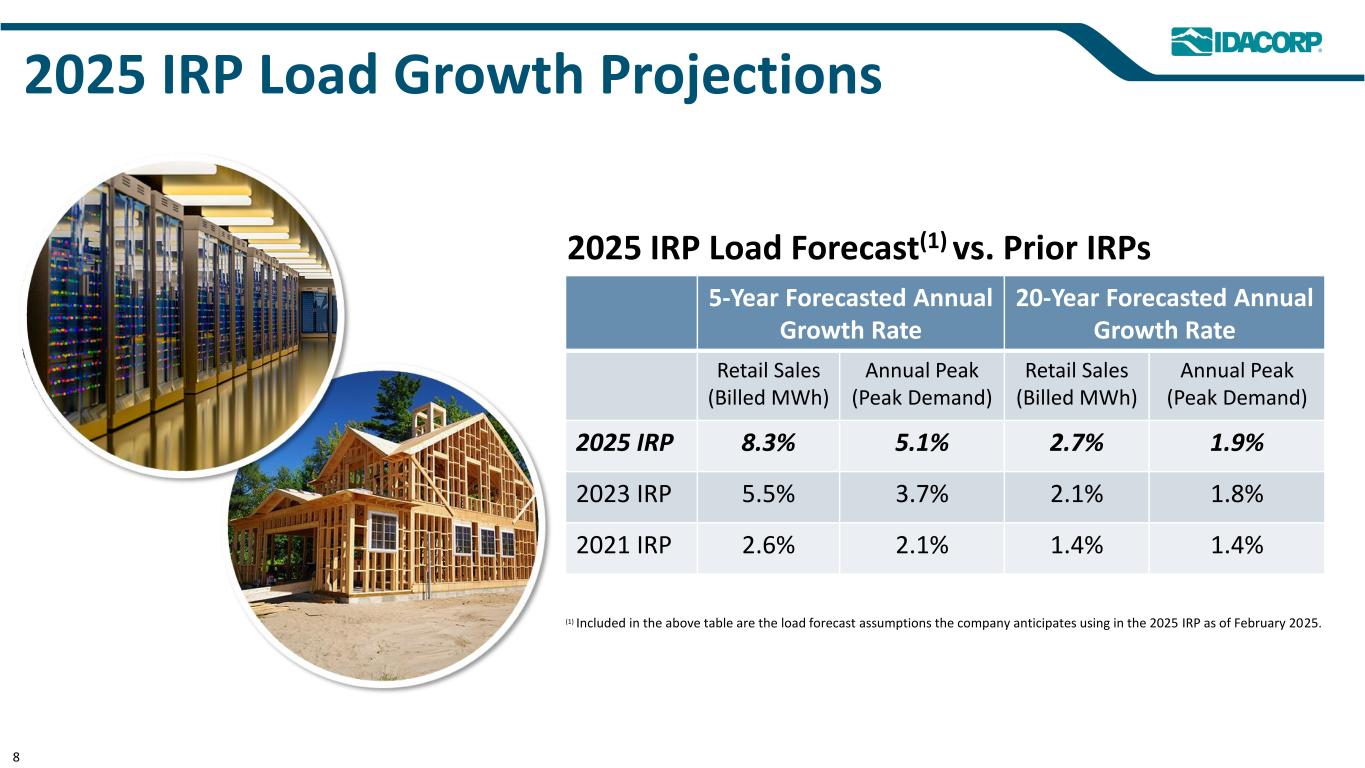
2025 IRP Load Growth Projections 5-Year Forecasted Annual Growth Rate 20-Year Forecasted Annual Growth Rate Retail Sales (Billed MWh) Annual Peak (Peak Demand) Retail Sales (Billed MWh) Annual Peak (Peak Demand) 2025 IRP 8.3% 5.1% 2.7% 1.9% 2023 IRP 5.5% 3.7% 2.1% 1.8% 2021 IRP 2.6% 2.1% 1.4% 1.4% 2025 IRP Load Forecast(1) vs. Prior IRPs 8 (1) Included in the above table are the load forecast assumptions the company anticipates using in the 2025 IRP as of February 2025.
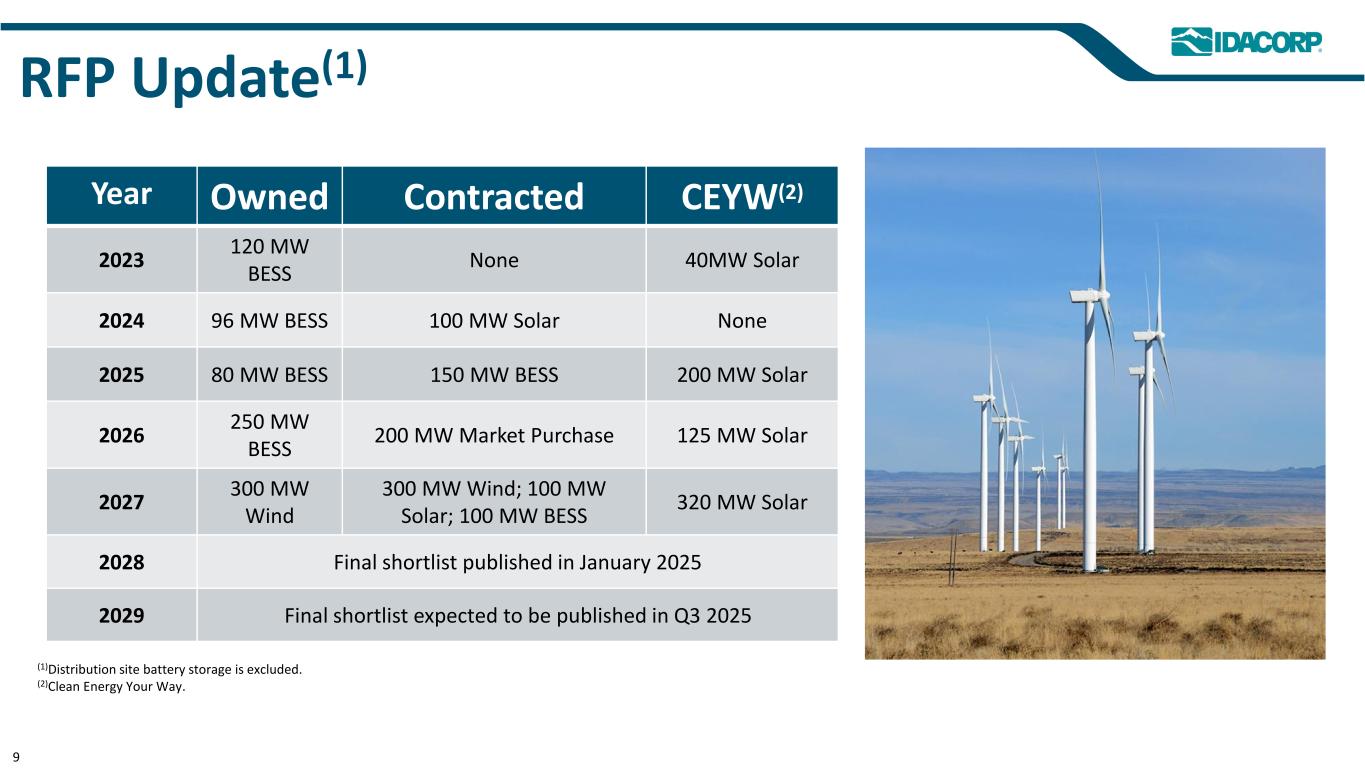
RFP Update(1) Year Owned Contracted CEYW(2) 2023 120 MW BESS None 40MW Solar 2024 96 MW BESS 100 MW Solar None 2025 80 MW BESS 150 MW BESS 200 MW Solar 2026 250 MW BESS 200 MW Market Purchase 125 MW Solar 2027 300 MW Wind 300 MW Wind; 100 MW Solar; 100 MW BESS 320 MW Solar 2028 Final shortlist published in January 2025 2029 Final shortlist expected to be published in Q3 2025 (1)Distribution site battery storage is excluded. (2)Clean Energy Your Way. 9

High-Voltage Transmission Project Updates • Boardman-to-Hemingway – Expected to break ground in the summer of 2025 – OPUC, IPUC, and WPSC granted respective certificates of public convenience and necessity – Idaho Power’s interest in Boardman-to-Hemingway is ~45% – Long-term transmission service commitment to Bonneville Power Administration’s customers across southern Idaho included in agreement – In-service date expected no earlier than 2027 • Gateway West – Included in 2023 IRP – Idaho Power and PacifiCorp are coordinating construction and segment allocations • Southwest Intertie Project – North – Construction expected to begin as early as 2025 and take approximately two years to complete – IPC agreed to purchase ~11% of the line upon the in-service date – IPC entered into a capacity entitlement agreement for an additional ~11% of the capacity commencing upon the in-service date 10
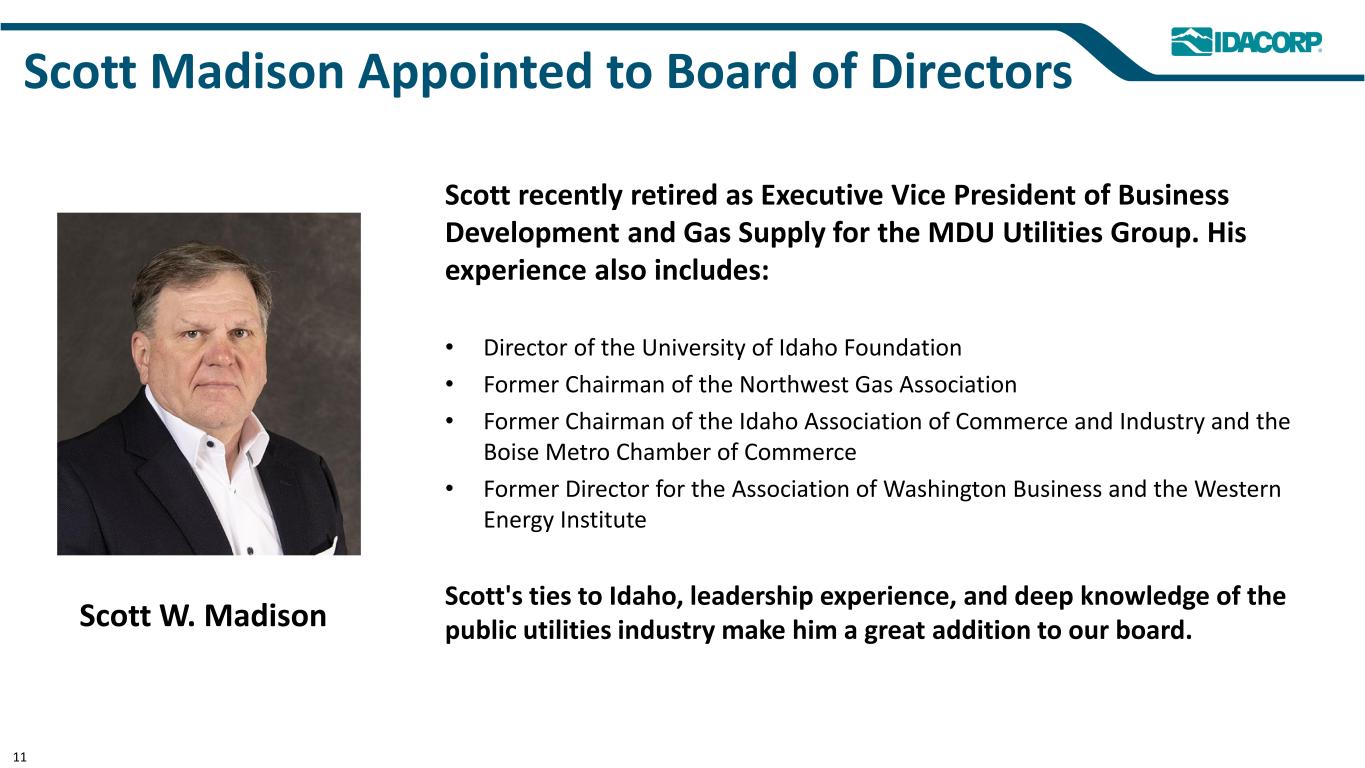
Scott Madison Appointed to Board of Directors Scott recently retired as Executive Vice President of Business Development and Gas Supply for the MDU Utilities Group. His experience also includes: • Director of the University of Idaho Foundation • Former Chairman of the Northwest Gas Association • Former Chairman of the Idaho Association of Commerce and Industry and the Boise Metro Chamber of Commerce • Former Director for the Association of Washington Business and the Western Energy Institute Scott's ties to Idaho, leadership experience, and deep knowledge of the public utilities industry make him a great addition to our board.Scott W. Madison 11
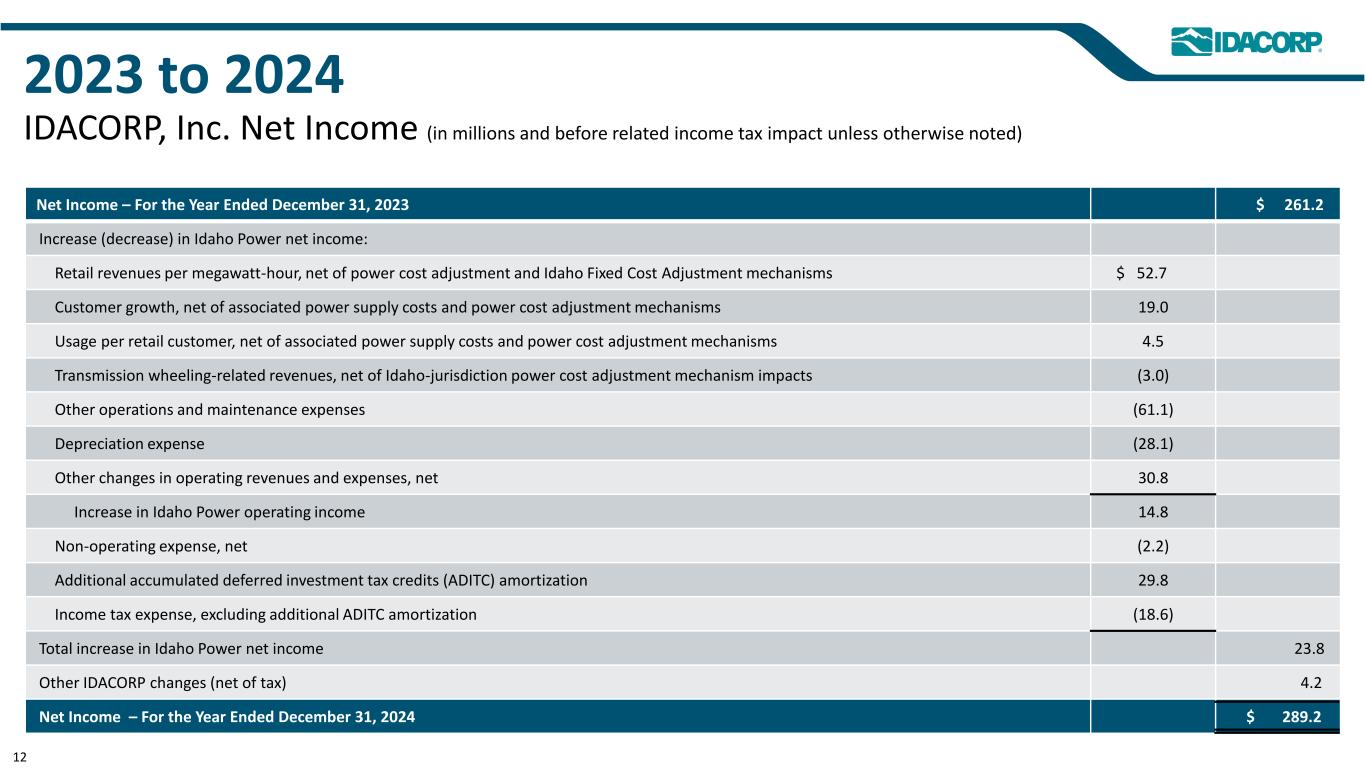
2023 to 2024 IDACORP, Inc. Net Income (in millions and before related income tax impact unless otherwise noted) Net Income – For the Year Ended December 31, 2023 $ 261.2 Increase (decrease) in Idaho Power net income: Retail revenues per megawatt-hour, net of power cost adjustment and Idaho Fixed Cost Adjustment mechanisms $ 52.7 Customer growth, net of associated power supply costs and power cost adjustment mechanisms 19.0 Usage per retail customer, net of associated power supply costs and power cost adjustment mechanisms 4.5 Transmission wheeling-related revenues, net of Idaho-jurisdiction power cost adjustment mechanism impacts (3.0) Other operations and maintenance expenses (61.1) Depreciation expense (28.1) Other changes in operating revenues and expenses, net 30.8 Increase in Idaho Power operating income 14.8 Non-operating expense, net (2.2) Additional accumulated deferred investment tax credits (ADITC) amortization 29.8 Income tax expense, excluding additional ADITC amortization (18.6) Total increase in Idaho Power net income 23.8 Other IDACORP changes (net of tax) 4.2 Net Income – For the Year Ended December 31, 2024 $ 289.2 12
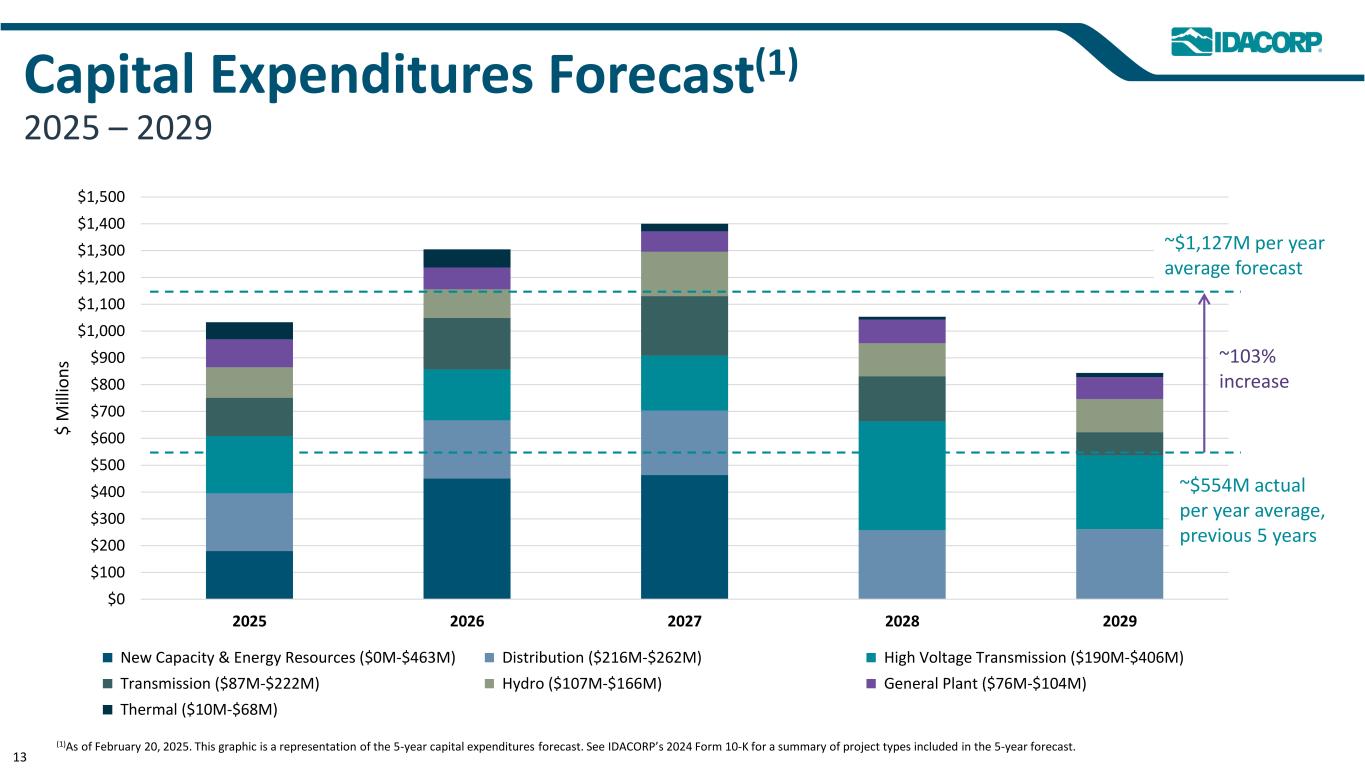
Capital Expenditures Forecast(1) 2025 – 2029 $0 $100 $200 $300 $400 $500 $600 $700 $800 $900 $1,000 $1,100 $1,200 $1,300 $1,400 $1,500 2025 2026 2027 2028 2029 $ M ill io n s New Capacity & Energy Resources ($0M-$463M) Distribution ($216M-$262M) High Voltage Transmission ($190M-$406M) Transmission ($87M-$222M) Hydro ($107M-$166M) General Plant ($76M-$104M) Thermal ($10M-$68M) (1)As of February 20, 2025. This graphic is a representation of the 5-year capital expenditures forecast. See IDACORP’s 2024 Form 10-K for a summary of project types included in the 5-year forecast. ~$554M actual per year average, previous 5 years ~103% increase ~$1,127M per year average forecast 13
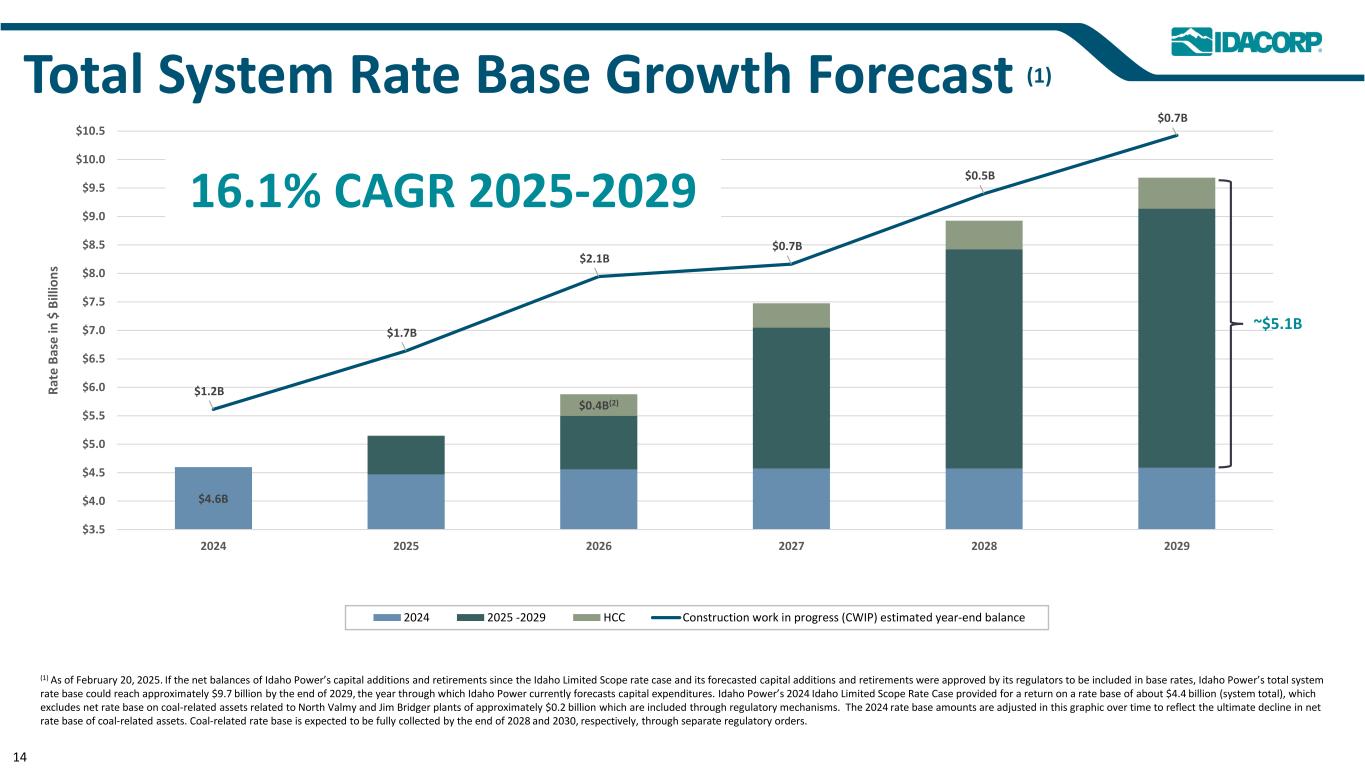
$4.6B $0.4B(2) $1.2B $1.7B $2.1B $0.7B $0.5B $0.7B $3.5 $4.0 $4.5 $5.0 $5.5 $6.0 $6.5 $7.0 $7.5 $8.0 $8.5 $9.0 $9.5 $10.0 $10.5 2024 2025 2026 2027 2028 2029 R at e B as e in $ B ill io n s 2024 2025 -2029 HCC Construction work in progress (CWIP) estimated year-end balance Total System Rate Base Growth Forecast (1) (1) As of February 20, 2025. If the net balances of Idaho Power’s capital additions and retirements since the Idaho Limited Scope rate case and its forecasted capital additions and retirements were approved by its regulators to be included in base rates, Idaho Power’s total system rate base could reach approximately $9.7 billion by the end of 2029, the year through which Idaho Power currently forecasts capital expenditures. Idaho Power’s 2024 Idaho Limited Scope Rate Case provided for a return on a rate base of about $4.4 billion (system total), which excludes net rate base on coal-related assets related to North Valmy and Jim Bridger plants of approximately $0.2 billion which are included through regulatory mechanisms. The 2024 rate base amounts are adjusted in this graphic over time to reflect the ultimate decline in net rate base of coal-related assets. Coal-related rate base is expected to be fully collected by the end of 2028 and 2030, respectively, through separate regulatory orders. 16.1% CAGR 2025-2029 ~$5.1B 14

Net Cash from Operations Issued Repaid Capital Expenditures(2) Dividends ----------------------Debt ---------------------- Equity Content ------------------------Equity ------------------------ $ M ill io n s (1) As of February 20, 2025. Financings plans are for illustrative purposes only and are subject to change. (2) Forecast capital expenditures include allowance for borrowed funds used during construction. (3) Difference between cash inflow versus cash outflow is managed through cash balance as of 12/31/24. Financing Plan Forecast (1) (3) 2025 – 2029 15

Liquidity (millions) As of December 31, 2024 IDACORP(1) Idaho Power Net balance available(2) $ 100.0 $ 380.1 Operating Cash Flows and Liquidity (1) Holding company only. (2) IDACORP’s and Idaho Power’s respective $100 million and $400 million revolving credit facilities, expiring in December 2029, net of commercial paper outstanding and amounts identified for other use. As of December 31, 2024, there was no commercial paper outstanding. Idaho Power repaid the $19.8 million of American Falls Bonds on February 3, 2025. (3) IDACORP fully settled its 2023 FSAs with 3.2 million shares of its common stock in exchange for cash of $292.2 million in 2024. (4) IDACORP entered into an Equity Distribution Agreement (EDA) on May 20, 2024, pursuant to which it may issue, offer, and sell, from time to time, up to an aggregate gross sales price of $300 million of shares of its common stock through an at-the-market offering program, which includes the ability to enter into FSAs. In November and December 2024, IDACORP executed FSAs under its ATM offering program with various counterparties, at an aggregate gross sales price of $92.4 million. IDACORP has a remaining aggregate gross sales price of up to $207.6 million in shares of its common stock available for issuance through the ATM offering program. IDACORP Cash Flows (millions) Twelve Months Ended December 31 2024 2023 Net Cash Provided by Operating Activities $ 594.4 $ 267.0 IDACORP Equity Financing (millions) Remaining as of December 31, 2024 Executed To-Date Settled To-Date Forward Sale Agreements(3) – – $ 292.2 At-the-Market Offering Program(4) $ 207.6 $ 92.4 – 16
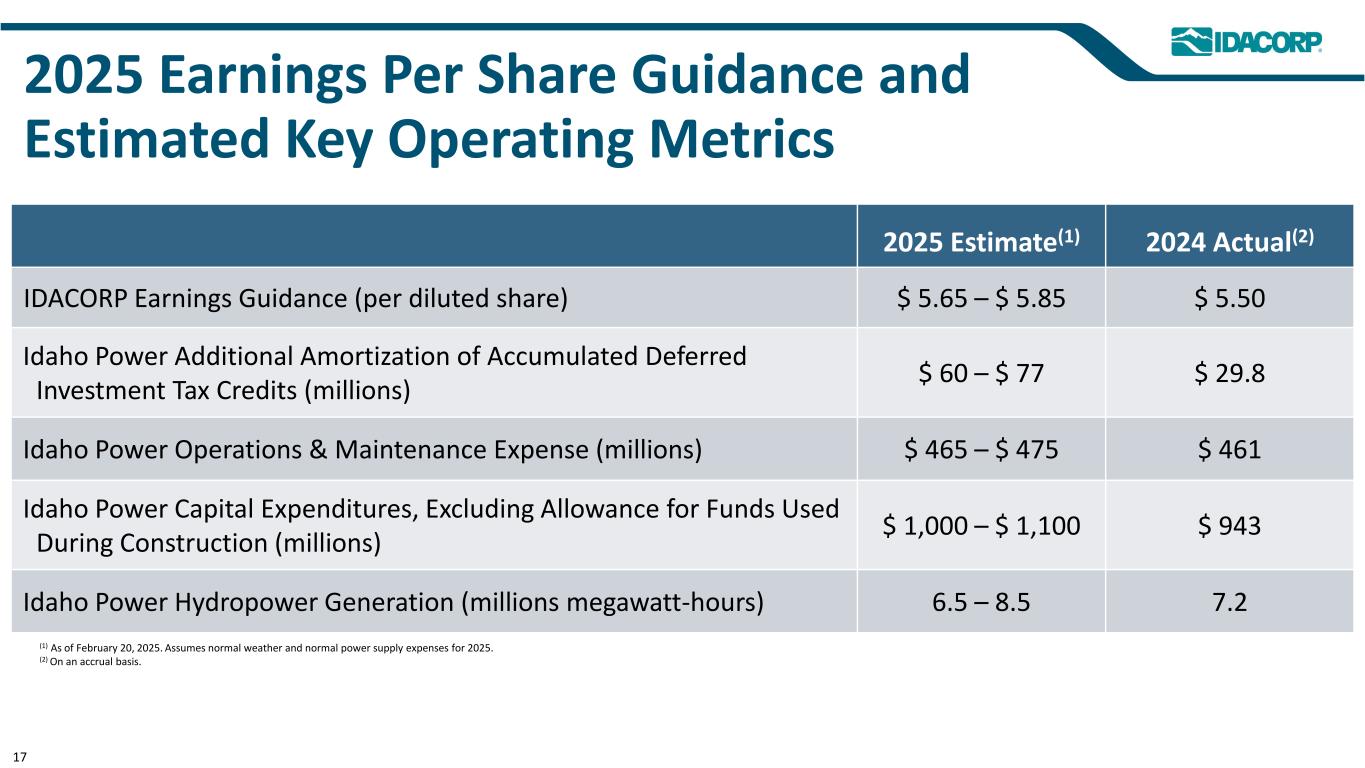
2025 Earnings Per Share Guidance and Estimated Key Operating Metrics 2025 Estimate(1) 2024 Actual(2) IDACORP Earnings Guidance (per diluted share) $ 5.65 – $ 5.85 $ 5.50 Idaho Power Additional Amortization of Accumulated Deferred Investment Tax Credits (millions) $ 60 – $ 77 $ 29.8 Idaho Power Operations & Maintenance Expense (millions) $ 465 – $ 475 $ 461 Idaho Power Capital Expenditures, Excluding Allowance for Funds Used During Construction (millions) $ 1,000 – $ 1,100 $ 943 Idaho Power Hydropower Generation (millions megawatt-hours) 6.5 – 8.5 7.2 (1) As of February 20, 2025. Assumes normal weather and normal power supply expenses for 2025. (2) On an accrual basis. 17
Contact Information John R. Wonderlich Investor Relations Manager (208) 388-5413 JWonderlich@idahopower.com Investors & Analysts Jordan Rodriguez Corporate Communications (208) 388-2460 JRodriguez@idahopower.com Media


