Exhibit 99.2
| PCA Workshop |

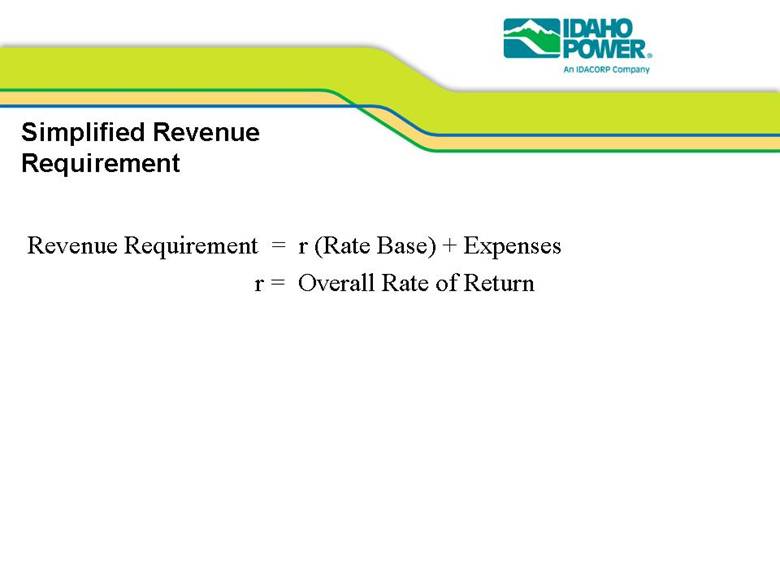
| Simplified Revenue Requirement Revenue Requirement = r (Rate Base) + Expenses r = Overall Rate of Return |
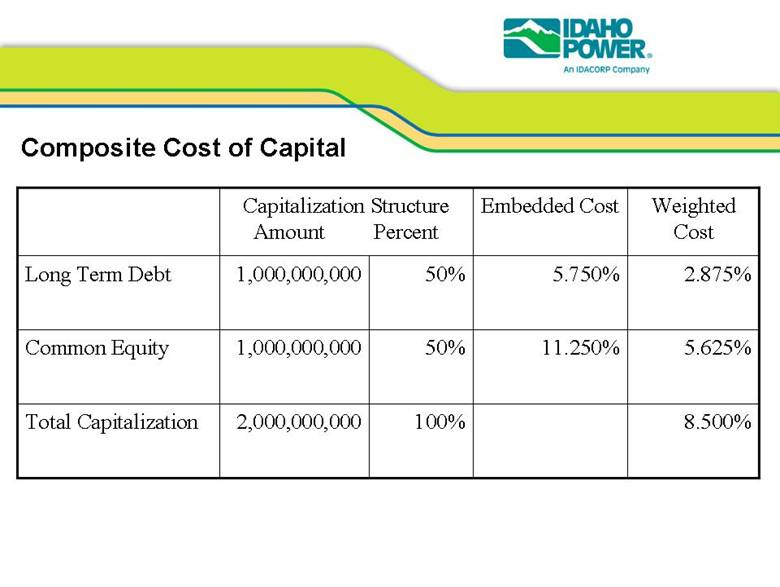
| Composite Cost of Capital 8.500% 100% 2,000,000,000 Total Capitalization 5.625% 11.250% 50% 1,000,000,000 Common Equity 2.875% 5.750% 50% 1,000,000,000 Long Term Debt Weighted Cost Embedded Cost Capitalization Structure Amount Percent |
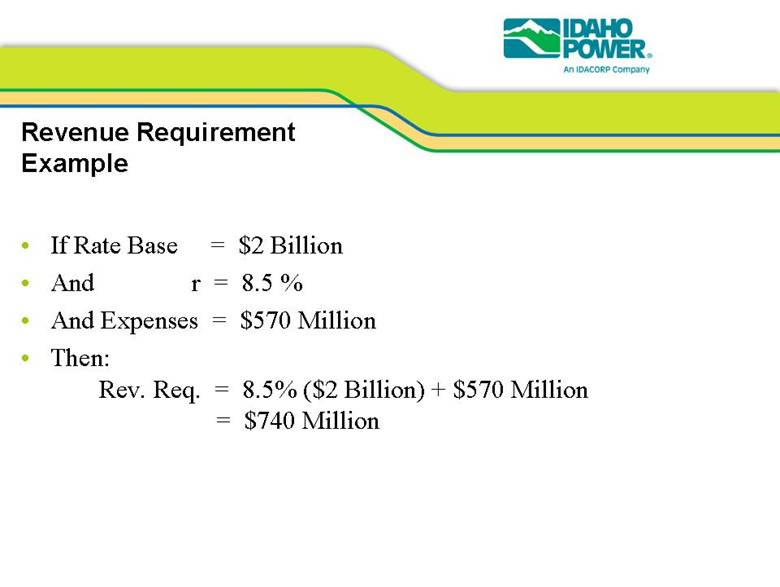
| Revenue Requirement Example • If Rate Base = $2 Billion • And r = 8.5% • And Expenses = $570 Million • Then: Rev. Req. = 8.5% ($2 Billion) + $570 Million = $740 Million |
| In This Example: • Return = r (Rate Base) = 8.5% ($2 Billion) = $170 Million • Expense = $570 Million |

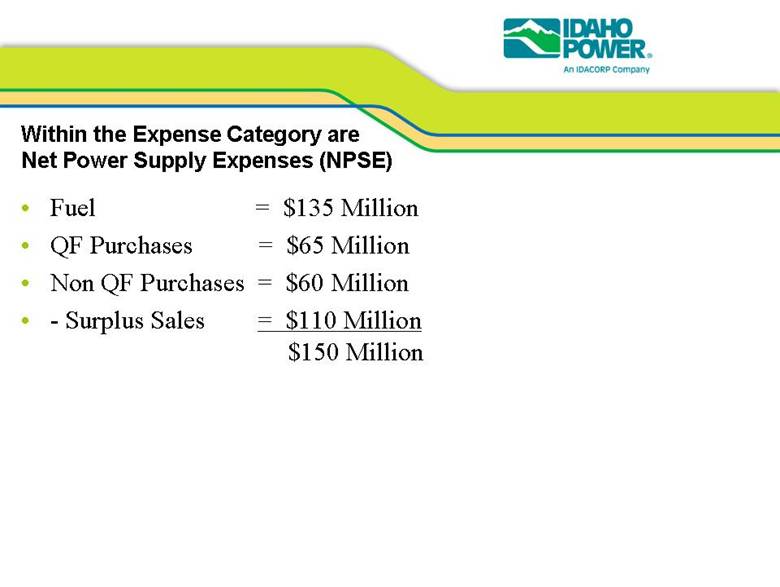
| Within the Expense Category are Net Power Supply Expenses (NPSE) • Fuel = $135 Million • QF Purchases = $65 Million • Non QF Purchases = $60 Million • - Surplus Sales = $110 Million $150 Million |
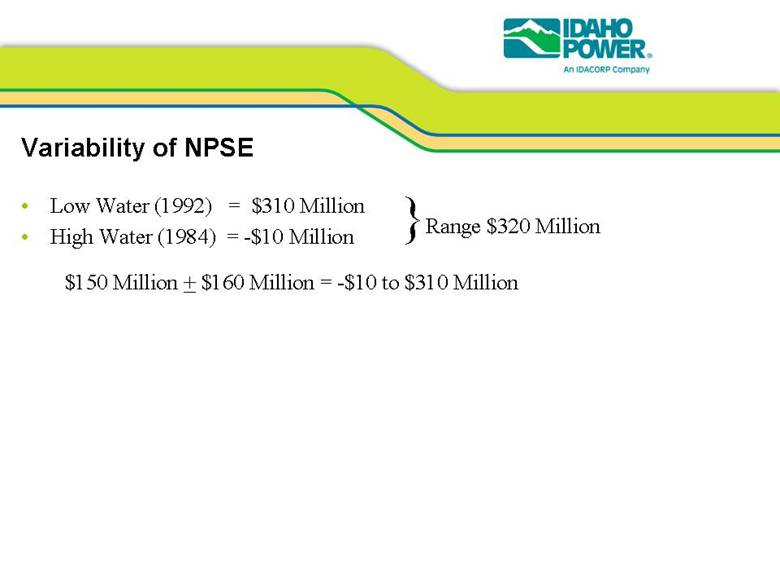
| Variability of NPSE • Low Water (1992) = $310 Million • High Water (1984) = -$10 Million }Range $320 Million $150 Million ± $160 Million = -$10 to $310 Million |
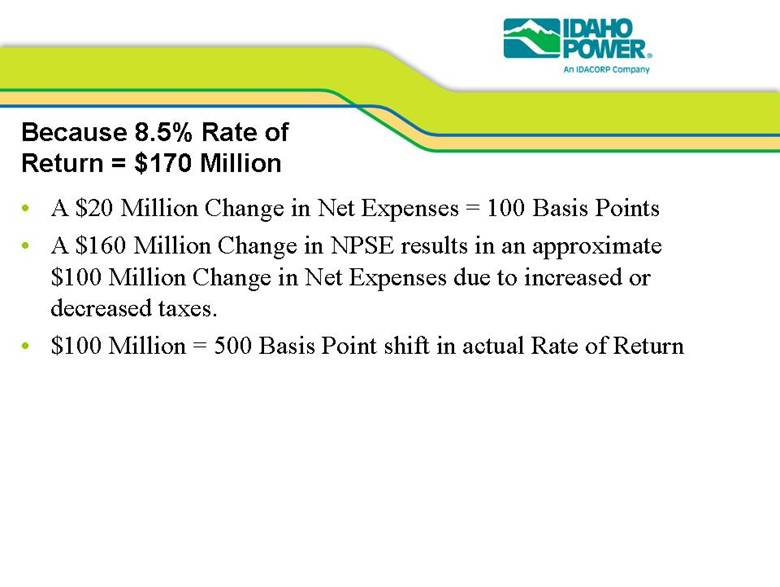
| Because 8.5% Rate of Return = $170 Million • A $20 Million Change in Net Expenses = 100 Basis Points • A $160 Million Change in NPSE results in an approximate $100 Million Change in Net Expenses due to increased or decreased taxes. • $100 Million = 500 Basis Point shift in actual Rate of Return |
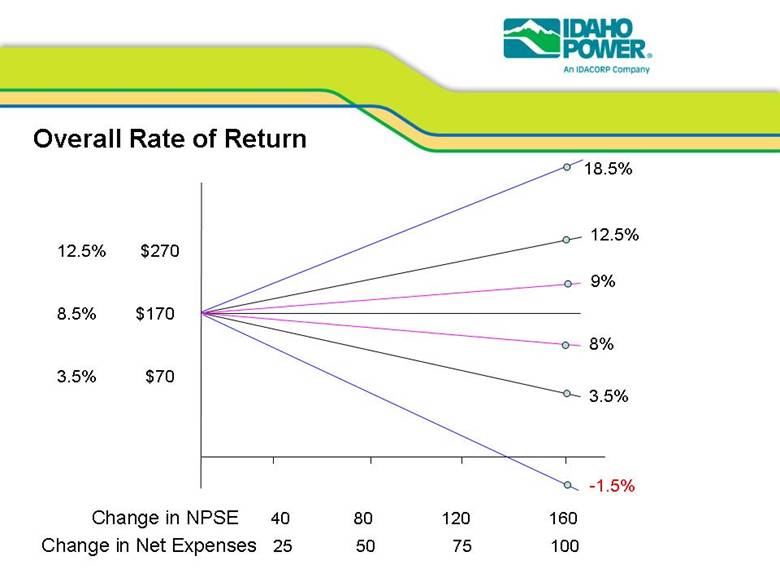
| 12.5% $270 8.5% $170 3.5% $70 Change in NPSE 40 80 120 160 Change in Net Expenses 25 50 75 100 3.5% 9% 8% Overall Rate of Return 12.5% -1.5% 18.5% |
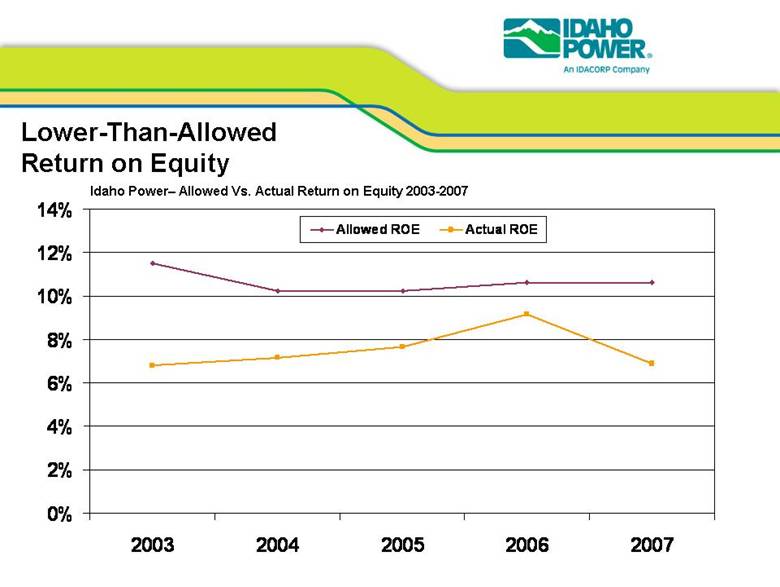
| Lower-Than-Allowed Return on Equity Idaho Power– Allowed Vs. Actual Return on Equity 2003-2007 0% 2% 4% 6% 8% 10% 12% 14% 2003 2004 2005 2006 2007 Allowed ROE Actual ROE |
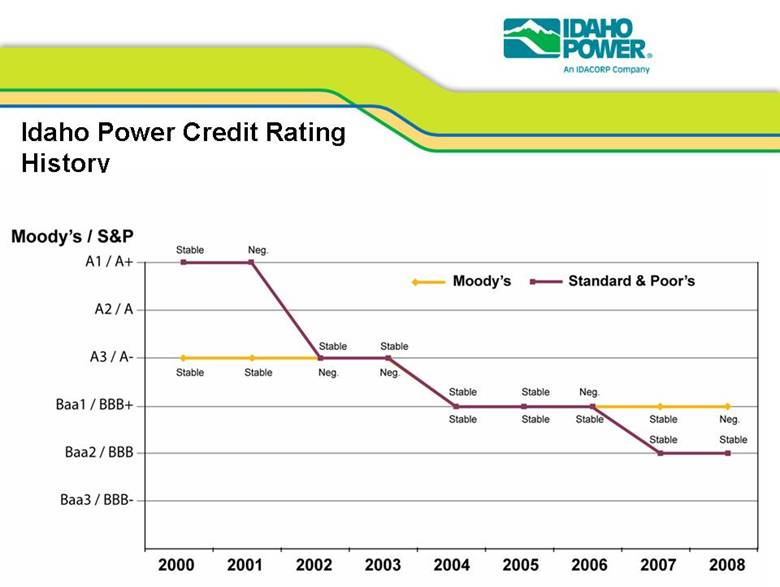
| Idaho Power Credit Rating History Moody’s / S&P A1 / A+ Stable Neg. Moody’s Standard & Poor’s A2 / A A3 / A- Stable Stable Stable Stable Neg. Neg. Stable Stable Neg. Stable Stable Stable Stable Stable Neg. Stable Baa1 / BBB+ Baa2 / BBB Baa3 / BBB- 2000 2001 2002 2003 2004 2005 2006 2007 2008 |
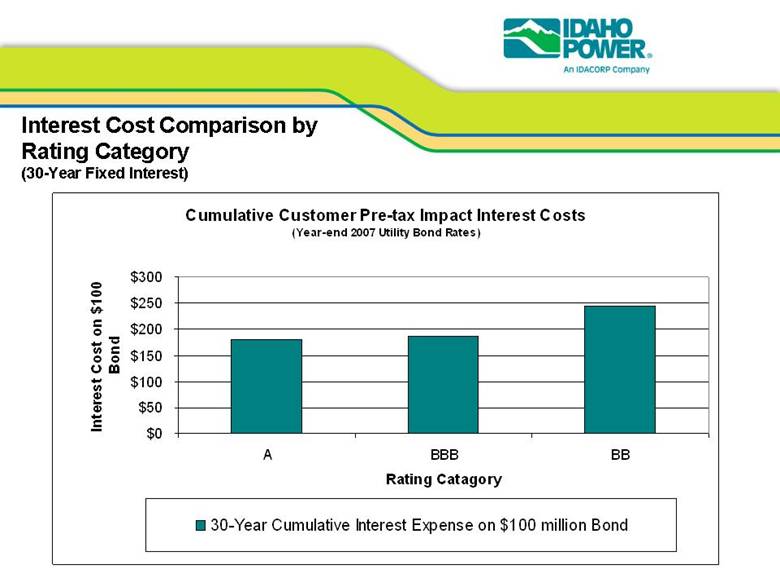
| Interest Cost Comparison by Rating Category (30-Year Fixed Interest) Cumulative Customer Pre-tax Impact Interest Costs (Year-end 2007 Utility Bond Rates) $0 $50 $100 $150 $200 $250 $300 A BBB BB Rating Catagory Interest Cost on $100 Bond 30-Year Cumulative Interest Expense on $100 million Bond |
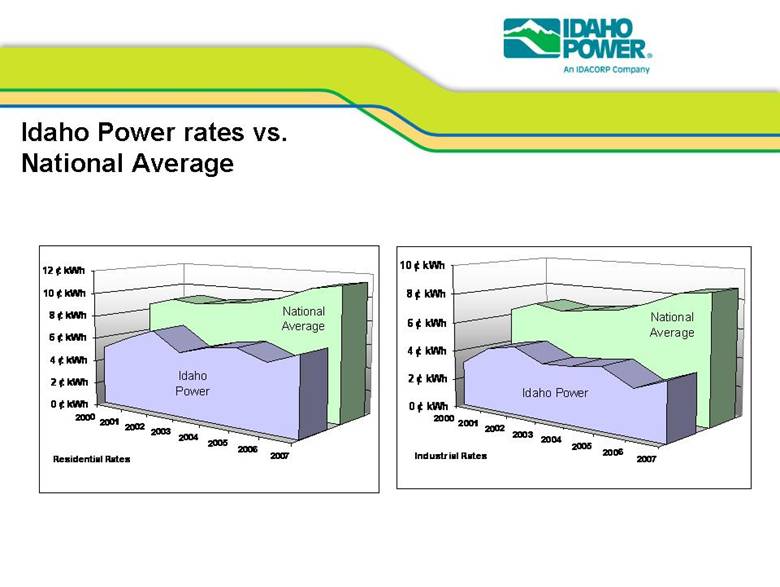
| Idaho Power rates vs. National Average 2000 2001 2002 2003 2004 2005 2006 2007 National Average Idaho Power 0 ¢ kWh 2 ¢ kWh 4 ¢ kWh 6 ¢ kWh 8 ¢ kWh 10 ¢ kWh 12 ¢ kWh Residential Rates 2000 2001 2002 2003 2004 2005 2006 2007 National Average Idaho Power 0 ¢ kWh 2 ¢ kWh 4 ¢ kWh 6 ¢ kWh 8 ¢ kWh 10 ¢ kWh Industrial Rates |
| Issues • LGAR • Risk 90/10 Sharing • Forecast Methodology • Base Line Shape for Deferrals • 3rd Party Transmission Expense } SYMMETRY |

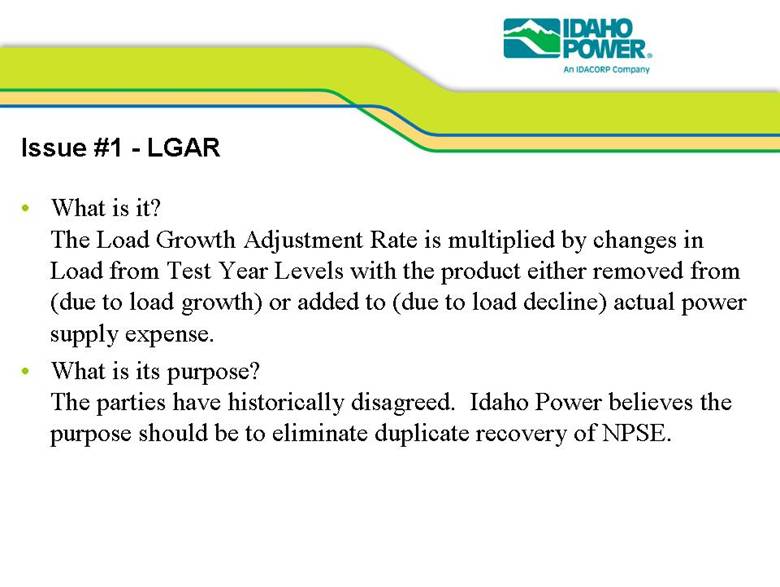
| Issue #1 - LGAR • What is it? The Load Growth Adjustment Rate is multiplied by changes in Load from Test Year Levels with the product either removed from (due to load growth) or added to (due to load decline) actual power supply expense. • What is its purpose? The parties have historically disagreed. Idaho Power believes the purpose should be to eliminate duplicate recovery of NPSE. |
| Example • Say the Current Rate is 5.4 cents/kWh This is equivalent to $54/MWh • The $54/MWh is based upon a snapshot in time (i.e. Test Year) • The Regulatory Compact suggests that based upon the Test Year, it is reasonable to assume that the ongoing cost to serve customers will be the same as reflected in the Test Year. |

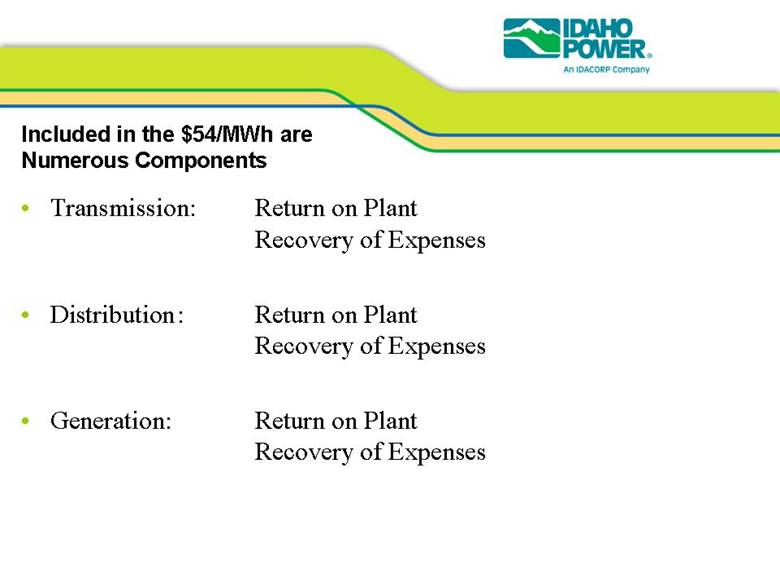
| Included in the $54/MWh are Numerous Components • Transmission: Return on Plant Recovery of Expenses • Distribution: Return on Plant Recovery of Expenses • Generation: Return on Plant Recovery of Expenses |
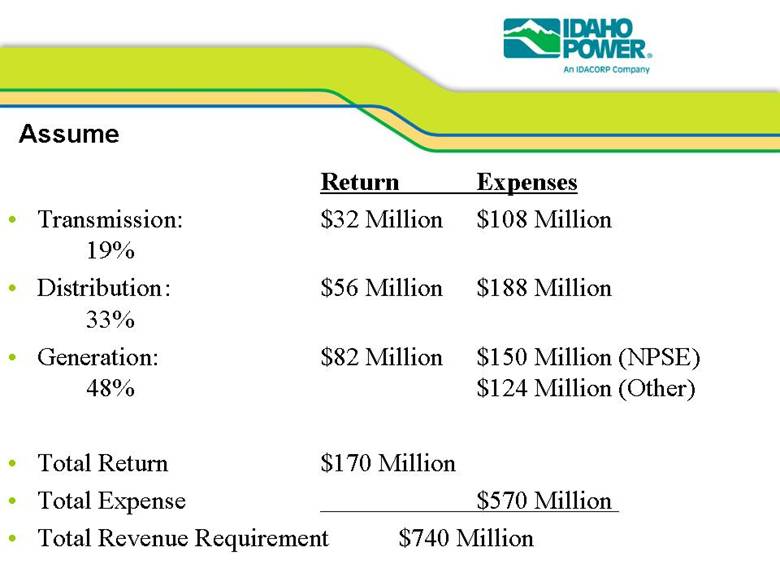
| Assume Return Expenses • Transmission: $32 Million $108 Million 19% • Distribution: $56 Million $188 Million 33% • Generation: $82 Million $150 Million (NPSE) 48% $124 Million (Other) • Total Return $170 Million • Total Expense $570 Million • Total Revenue Requirement $740 Million |
| Example of Unbundled Rate Components Return Expenses • Transmission: $2.34/MWh $7.88/MWh • Distribution: $4.09/MWh $13.72/MWh • Generation: $5.98/MWh $10.95/MWh (NPSE) $9.05/MWh (Other) • Total Return $12.41/MWh • Total Expense $41.60/MWh • Total Revenue Requirement $54.01/MWh |

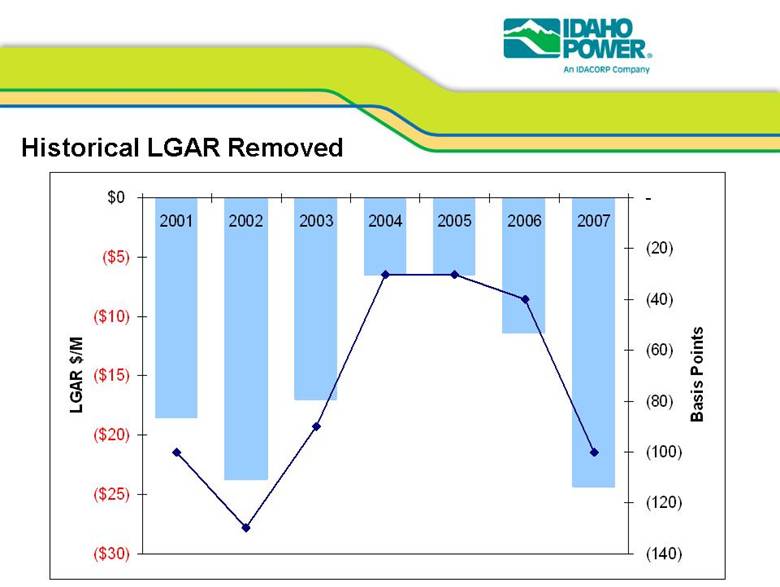
| Historical LGAR Removed ($30) ($25) ($20) ($15) ($10) ($5) $0 2001 2002 2003 2004 2005 2006 2007 LGAR $/M (140) (120) (100) (80) (60) (40) (20) - Basis Points |
| ISSUE #2: RISK 90/10 SHARING |

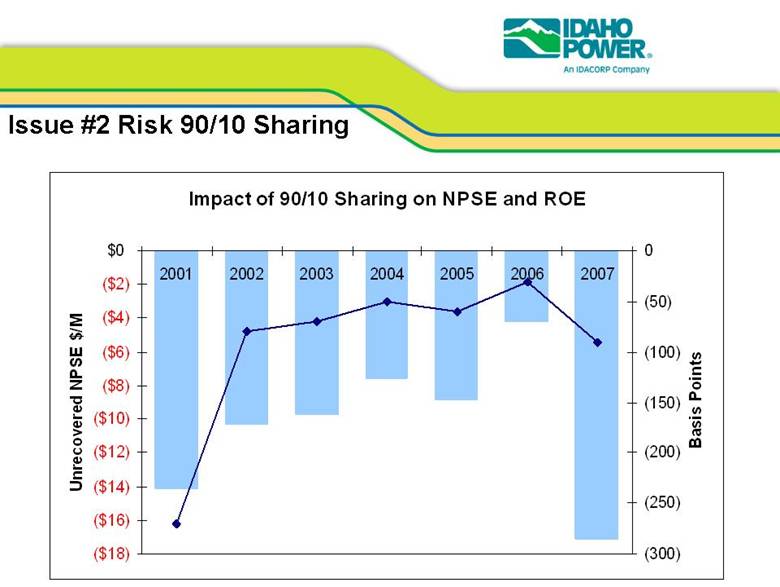
| Issue #2 Risk 90/10 Sharing Impact of 90/10 Sharing on NPSE and ROE ($18) ($16) ($14) ($12) ($10) ($8) ($6) ($4) ($2) $0 2001 2002 2003 2004 2005 2006 2007 Unrecovered NPSE $/M (300) (250) (200) (150) (100) (50) 0 Basis Points |
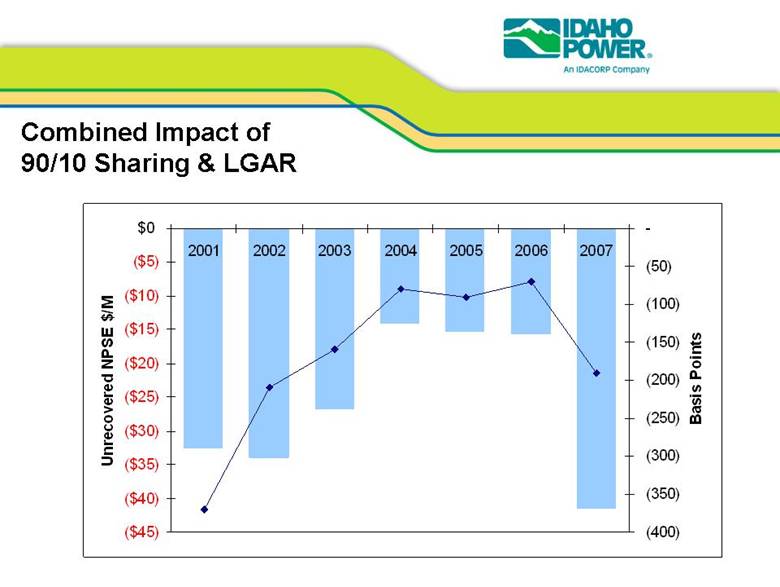
| Combined Impact of 90/10 Sharing & LGAR ($45) ($40) ($35) ($30) ($25) ($20) ($15) ($10) ($5) $0 2001 2002 2003 2004 2005 2006 2007 Unrecovered NPSE $/M (400) (350) (300) (250) (200) (150) (100) (50) - Basis Points |
| ISSUE #3: FORECAST |

| PCA Forecast What are the issues associated with the PCA Forecast? 1. Cash flow 2. Sending appropriate pricing signals to our customers The current forecast methodology worked well in the 90’s; however fundamental changes in the market have occurred since the PCA was implemented. Net Power Supply costs are currently driven by many factors: • Market based prices • Regional supply & demand balance • Marginal costs are being set more frequently by natural gas-fired resources • Natural gas price volatility • Energy Risk Management Policy We believe we can do better . . . |

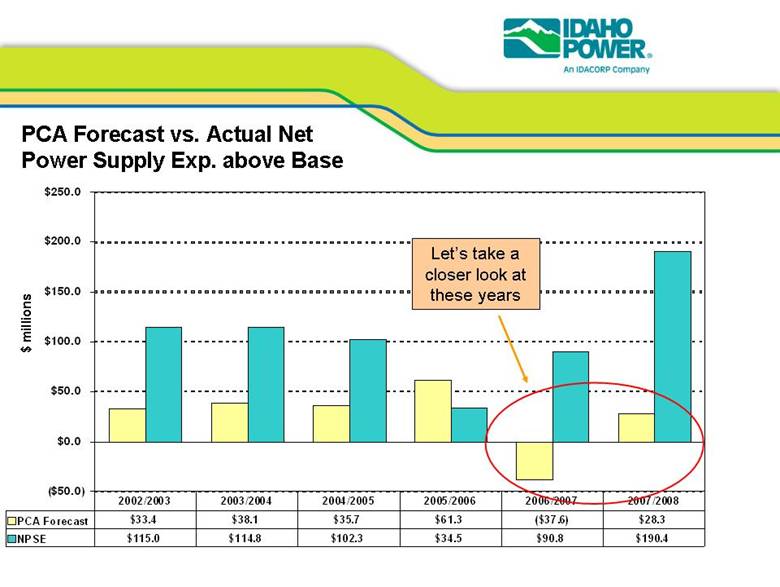
| PCA Forecast vs. Actual Net Power Supply Exp. above Base ($50.0) $0.0 $50.0 $100.0 $150.0 $200.0 $250.0 PCA Forecast $33.4 $38.1 $35.7 $61.3 ($37.6) $28.3 NPSE $115.0 $114.8 $102.3 $34.5 $90.8 $190.4 2002/2003 2003/2004 2004/2005 2005/2006 2006/2007 2007/2008 $ millions Let’s take a closer look at these years |
| PCA Forecast vs. Actual Net Power Supply Expense above Base – Add Op Plan ($50.0) $0.0 $50.0 $100.0 $150.0 $200.0 $250.0 PCA Forecast ($37.6) $28.3 NPSE $90.8 $190.4 Op Plan Forecast 39.3 75.2 2006/2007 2007/2008 Improvement of ~$77 Million Improvement of ~$47 Million $ millions |
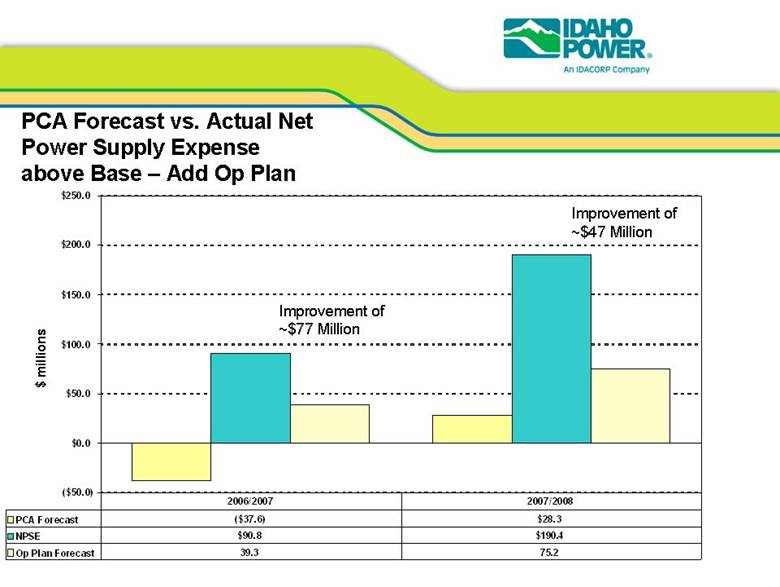
| PCA Forecast Idaho Power’s Operating Plan, which is produced at least monthly, as a part of Idaho Power’s risk management process, is an example of another alternative for forecasting PCA costs. The Op Plan considers: – Forward market prices – Forecast PURPA resource production – Actual hedge transactions – Operating condition of generating units – planned or forced outages & deratings – Most recent load, stream flow, and weather forecasts Considering the 2006/07 and 2007/08 PCA years, the forecast NPSE developed for the March 2006 and March 2007 Op Plans was much closer than the forecast produced by the regression using the NWRFC April-July Stream flow forecast. The Op Plan forecasts would have reduced the mismatch between forecast and actual costs by more than $124 million! |

| ISSUE #4: BASE LINE SHAPE FOR DEFERRALS |
| Preview Background • Base Net Power Supply Expense • Relevance to the PCA “true-up” mechanism • Present the various Base NPSE shapes used or considered The Problem • Defined • Examples and demonstration |
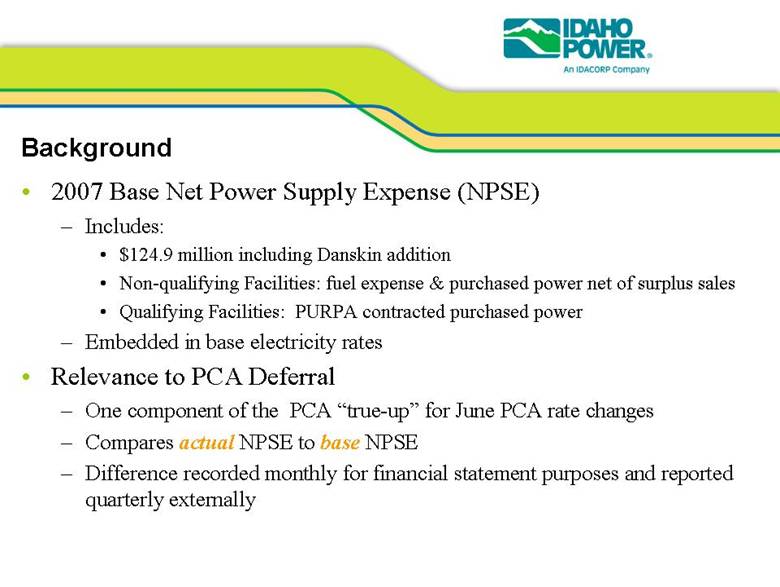
| Background • 2007 Base Net Power Supply Expense (NPSE) – Includes: • $124.9 million including Danskin addition • Non-qualifying Facilities: fuel expense & purchased power net of surplus sales • Qualifying Facilities: PURPA contracted purchased power – Embedded in base electricity rates • Relevance to PCA Deferral – One component of the PCA “true-up” for June PCA rate changes – Compares actual NPSE to base NPSE – Difference recorded monthly for financial statement purposes and reported quarterly externally |
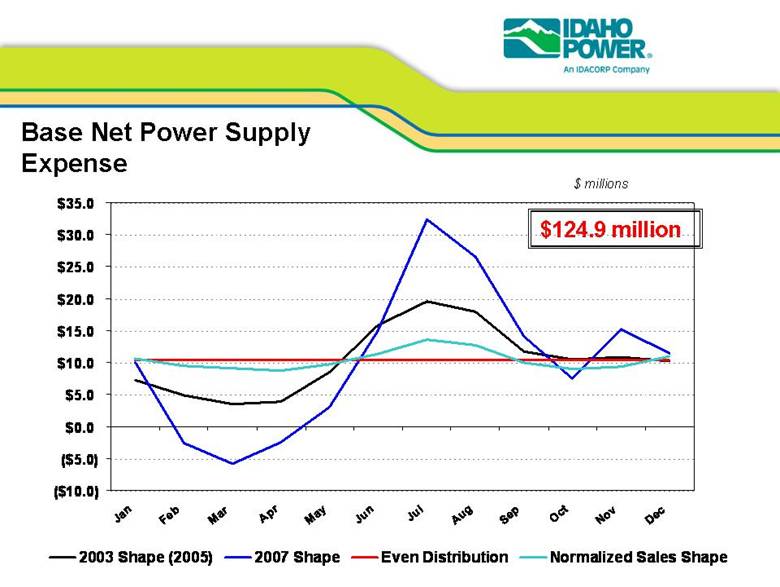
| Base Net Power Supply Expense $124.9 million $ millions ($10.0) ($5.0) $0.0 $5.0 $10.0 $15.0 $20.0 $25.0 $30.0 $35.0 Jan Feb Mar Apr May Jun Jul Aug Sep Oct Nov Dec 2003 Shape (2005) 2007 Shape Even Distribution Normalized Sales Shape |
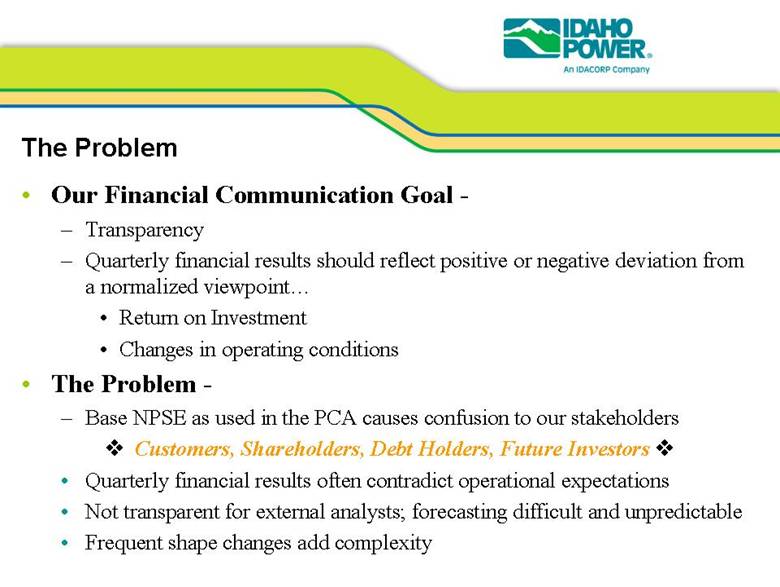
| The Problem • Our Financial Communication Goal - – Transparency – Quarterly financial results should reflect positive or negative deviation from a normalized viewpoint... • Return on Investment • Changes in operating conditions • The Problem - – Base NPSE as used in the PCA causes confusion to our stakeholders Customers, Shareholders, Debt Holders, Future Investors • Quarterly financial results often contradict operational expectations • Not transparent for external analysts; forecasting difficult and unpredictable • Frequent shape changes add complexity |
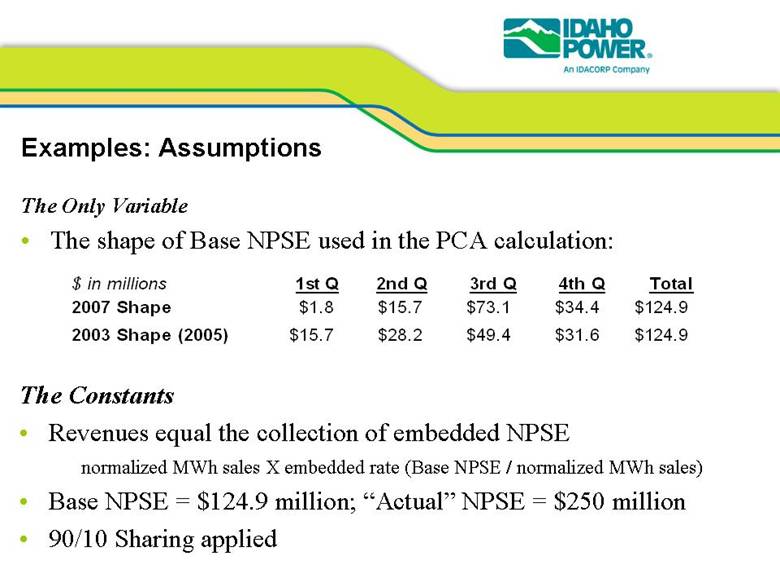
| Examples: Assumptions The Only Variable • The shape of Base NPSE used in the PCA calculation: The Constants • Revenues equal the collection of embedded NPSE normalized MWh sales X embedded rate (Base NPSE / normalized MWh sales) • Base NPSE = $124.9 million; “Actual” NPSE = $250 million • 90/10 Sharing applied $ in millions 1st Q 2nd Q 3rd Q 4th Q Total 2007 Shape $1.8 $15.7 $73.1 $34.4 $124.9 2003 Shape (2005) $15.7 $28.2 $49.4 $31.6 $124.9 |
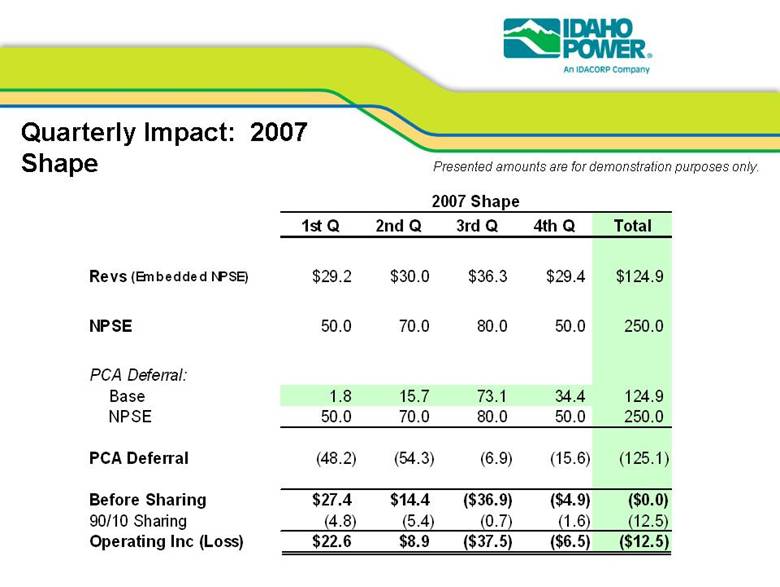
| Quarterly Impact: 2007 Shape Presented amounts are for demonstration purposes only. 1st Q 2nd Q 3rd Q 4th Q Total Revs (Embedded NPSE) $29.2 $30.0 $36.3 $29.4 $124.9 NPSE 50.0 70.0 80.0 50.0 250.0 PCA Deferral: Base 1.8 15.7 73.1 34.4 124.9 NPSE 50.0 70.0 80.0 50.0 250.0 PCA Deferral (48.2) (54.3) (6.9) (15.6) (125.1) Before Sharing $27.4 $14.4 ($36.9) ($4.9) ($0.0) 90/10 Sharing (4.8) (5.4) (0.7) (1.6) (12.5) Operating Inc (Loss) $22.6 $8.9 ($37.5) ($6.5) ($12.5) 2007 Shape |
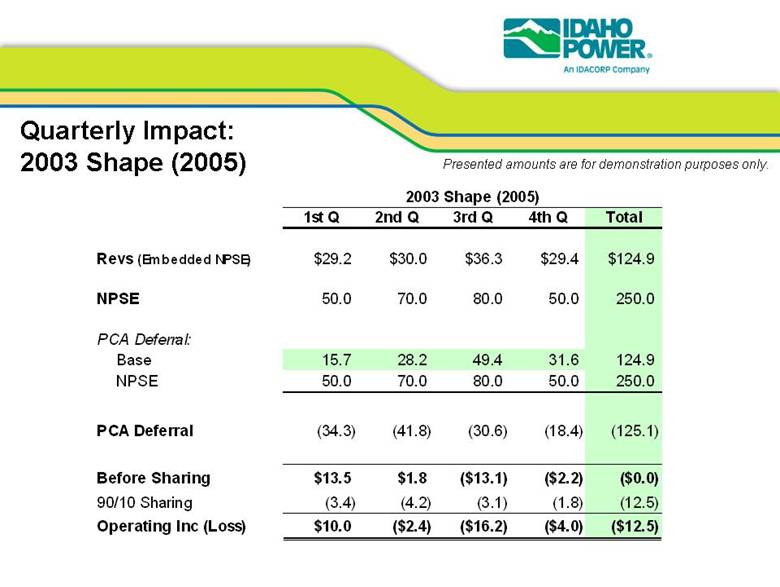
| Quarterly Impact: 2003 Shape (2005) Presented amounts are for demonstration purposes only. 1st Q 2nd Q 3rd Q 4th Q Total Revs (Embedded NPSE) $29.2 $30.0 $36.3 $29.4 $124.9 NPSE 50.0 70.0 80.0 50.0 250.0 PCA Deferral: Base 15.7 28.2 49.4 31.6 124.9 NPSE 50.0 70.0 80.0 50.0 250.0 PCA Deferral (34.3) (41.8) (30.6) (18.4) (125.1) Before Sharing $13.5 $1.8 ($13.1) ($2.2) ($0.0) 90/10 Sharing (3.4) (4.2) (3.1) (1.8) (12.5) Operating Inc (Loss) $10.0 ($2.4) ($16.2) ($4.0) ($12.5) 2003 Shape (2005) |
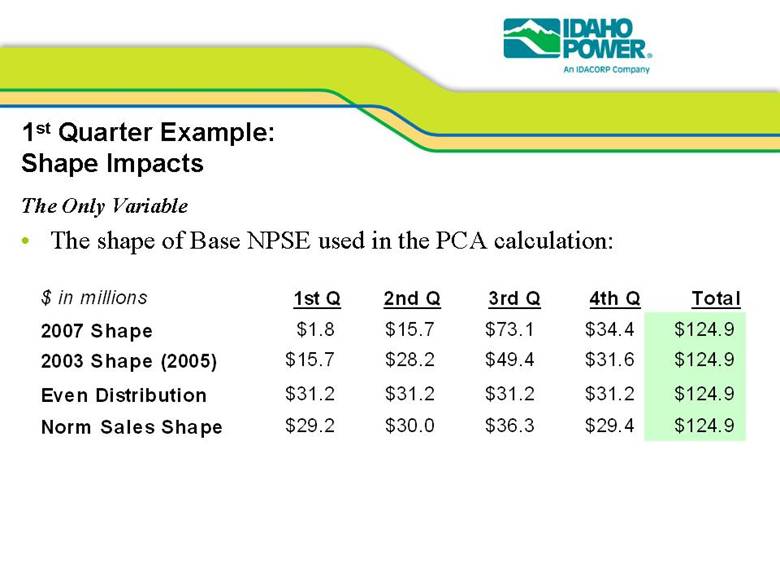
| 1st Quarter Example: Shape Impacts The Only Variable • The shape of Base NPSE used in the PCA calculation: $ in millions 1st Q 2nd Q 3rd Q 4th Q Total 2007 Shape $1.8 $15.7 $73.1 $34.4 $124.9 2003 Shape (2005) $15.7 $28.2 $49.4 $31.6 $124.9 Even Distribution $31.2 $31.2 $31.2 $31.2 $124.9 Norm Sales Shape $29.2 $30.0 $36.3 $29.4 $124.9 |
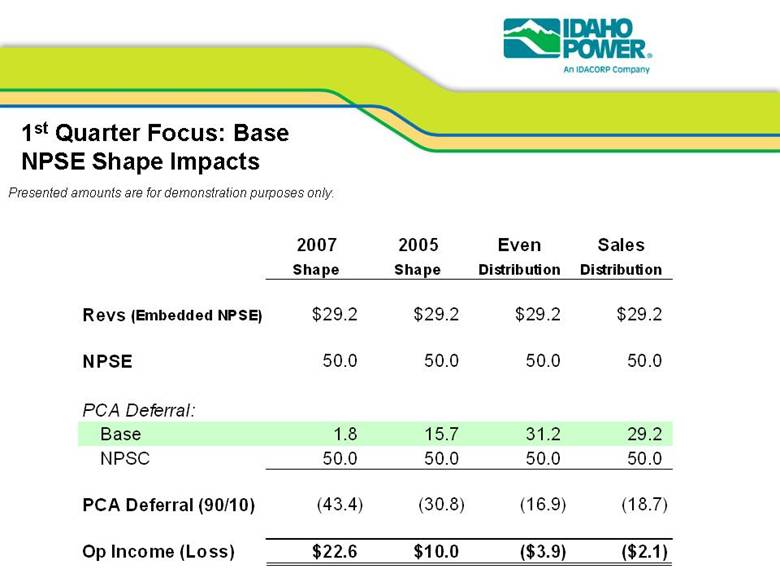
| 1st Quarter Focus: Base NPSE Shape Impacts 2007 2005 Even Sales Shape Shape Distribution Distribution Revs (Embedded NPSE) $29.2 $29.2 $29.2 $29.2 NPSE 50.0 50.0 50.0 50.0 PCA Deferral: Base 1.8 15.7 31.2 29.2 NPSC 50.0 50.0 50.0 50.0 PCA Deferral (90/10) (43.4) (30.8) (16.9) (18.7) Op Income (Loss) $22.6 $10.0 ($3.9) ($2.1) Presented amounts are for demonstration purposes only. |
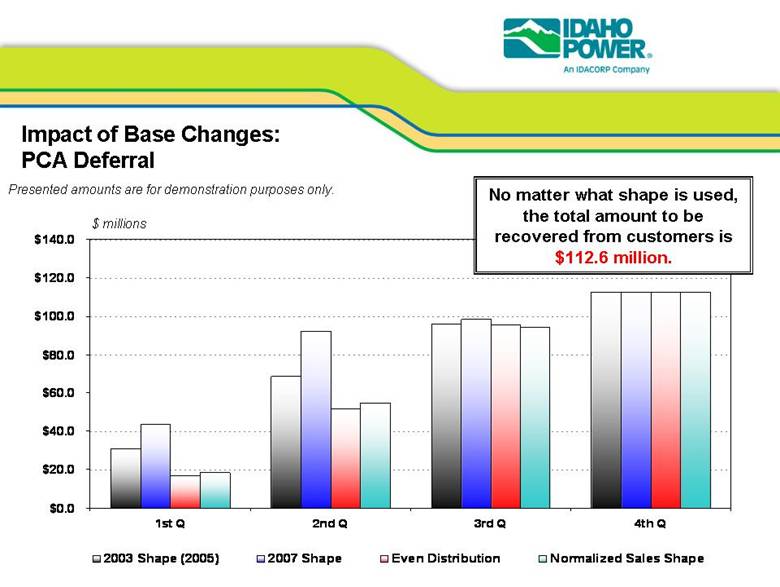
| Impact of Base Changes: PCA Deferral $ millions Presented amounts are for demonstration purposes only. $0.0 $20.0 $40.0 $60.0 $80.0 $100.0 $120.0 $140.0 1st Q 2nd Q 3rd Q 4th Q 2003 Shape (2005) 2007 Shape Even Distribution Normalized Sales Shape No matter what shape is used, the total amount to be recovered from customers is $112.6 million. |
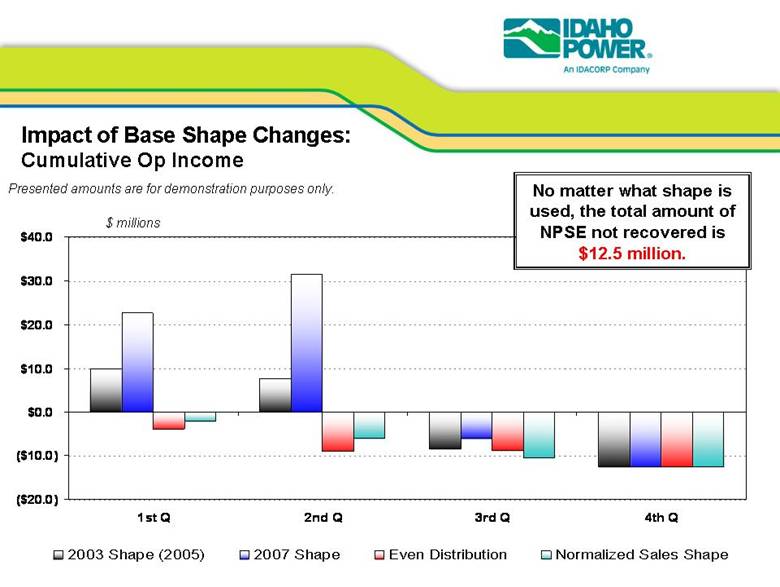
| Impact of Base Shape Changes: Cumulative Op Income $ millions Presented amounts are for demonstration purposes only. ($20.0) ($10.0) $0.0 $10.0 $20.0 $30.0 $40.0 1st Q 2nd Q 3rd Q 4th Q 2003 Shape (2005) 2007 Shape Even Distribution Normalized Sales Shape No matter what shape is used, the total amount of NPSE not recovered is $12.5 million. |
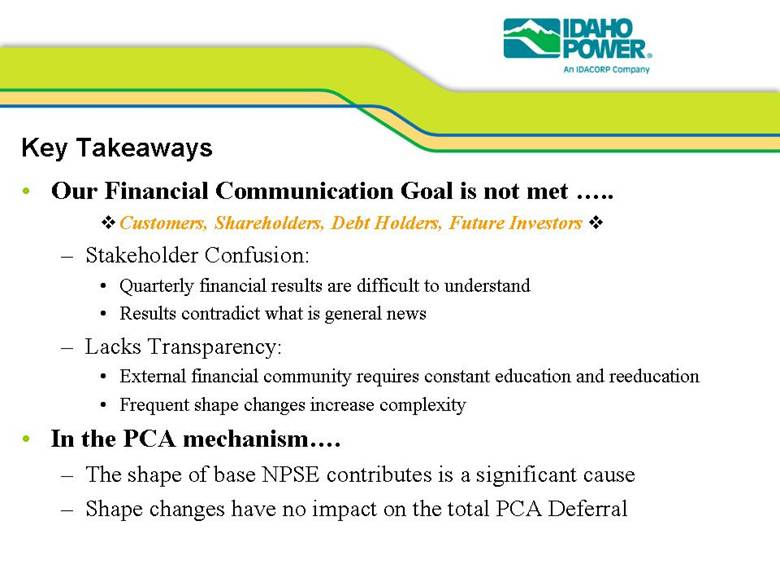
| Key Takeaways • Our Financial Communication Goal is not met.... Customers, Shareholders, Debt Holders, Future Investors – Stakeholder Confusion: • Quarterly financial results are difficult to understand • Results contradict what is general news – Lacks Transparency: • External financial community requires constant education and reeducation • Frequent shape changes increase complexity • In the PCA mechanism..... – The shape of base NPSE contributes is a significant cause – Shape changes have no impact on the total PCA Deferral |
| ISSUE #5: 3rd PARTY TRANSMISSION |

| 3rd Party Transmission • 3rd Party Transmission expenses and losses are directly related to the power supply expenses (purchases and sales) incurred to balance and optimize Idaho Power’s system. • There can be a high degree of variability in 3rd Party Transmission expense from year-to-year. • The PCA addresses year-to-year variability in power supply expenses. • 3rd Party Transmission expenses, and losses, are not currently included in the PCA. |
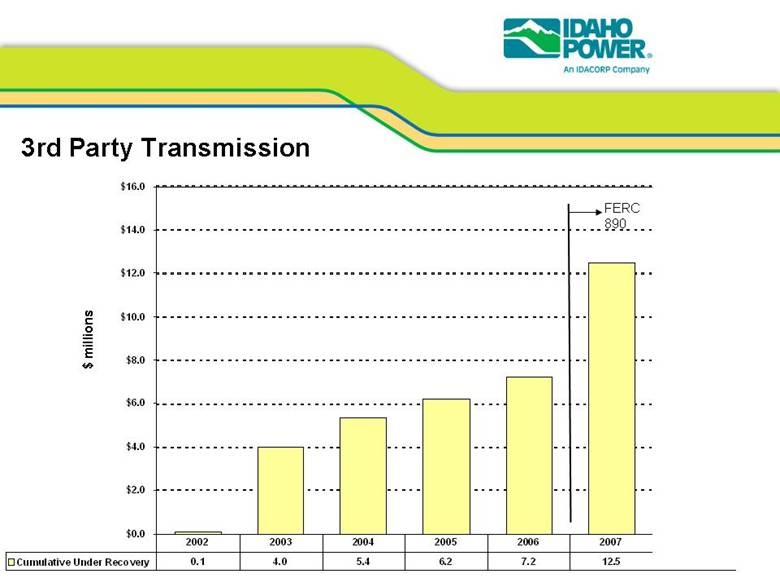
| 3rd Party Transmission • 3rd Party Transmission expenses, and losses, can be a big number! • Idaho Power has not fully recovered 3rd Party Transmission expenses in any year since 2001. • From 2002 through 2007, the cumulative amount of under recovery is approximately $12.5 million. |
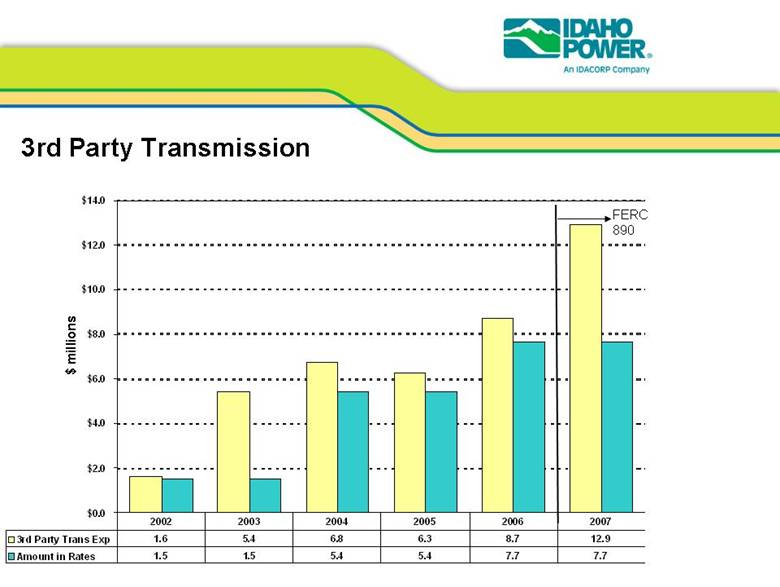
| 3rd Party Transmission $0.0 $2.0 $4.0 $6.0 $8.0 $10.0 $12.0 $14.0 3rd Party Trans Exp 1.6 5.4 6.8 6.3 8.7 12.9 8.4 Amount in Rates 1.5 1.5 5.4 5.4 7.7 7.7 7.2 2002 2003 2004 2005 2006 2007 2008 Estimated $ millions FERC 890 |
| 3rd Party Transmission $0.0 $2.0 $4.0 $6.0 $8.0 $10.0 $12.0 $14.0 $16.0 Cumulative Under Recovery 0.1 4.0 5.4 6.2 7.2 12.5 13.7 2002 2003 2004 2005 2006 2007 2008 FERC 890 Estimated $ millions |
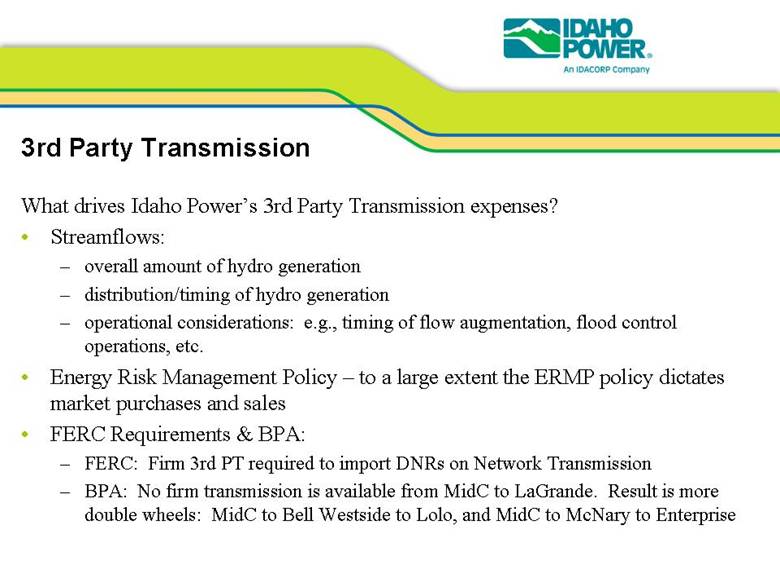
| 3rd Party Transmission What drives Idaho Power’s 3rd Party Transmission expenses? • Streamflows: – overall amount of hydro generation – distribution/timing of hydro generation – operational considerations: e.g., timing of flow augmentation, flood control operations, etc. • Energy Risk Management Policy – to a large extent the ERMP policy dictates market purchases and sales • FERC Requirements & BPA: – FERC: Firm 3rd PT required to import DNRs on Network Transmission – BPA: No firm transmission is available from MidC to LaGrande. Result is more double wheels: MidC to Bell Westside to Lolo, and MidC to McNary to Enterprise |
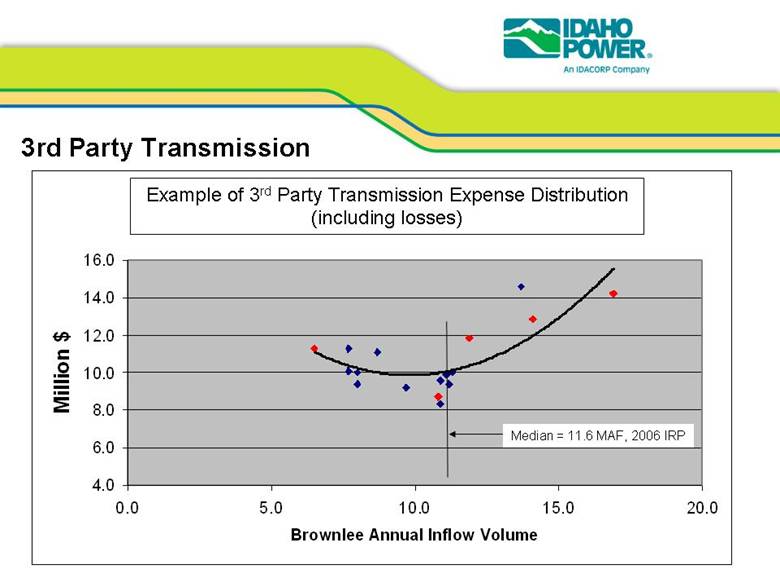
| 3rd Party Transmission Estimated Example 3rd Party Transmission Expense Distribution (including losses) 4.0 6.0 8.0 10.0 12.0 14.0 16.0 0.0 5.0 10.0 15.0 20.0 Brownlee Annual Inflow Volume Million $ Median = 11.6 MAF, 2006 IRP 3rd Party Transmission Expense Distribution (2008 & 2009) (including losses) |
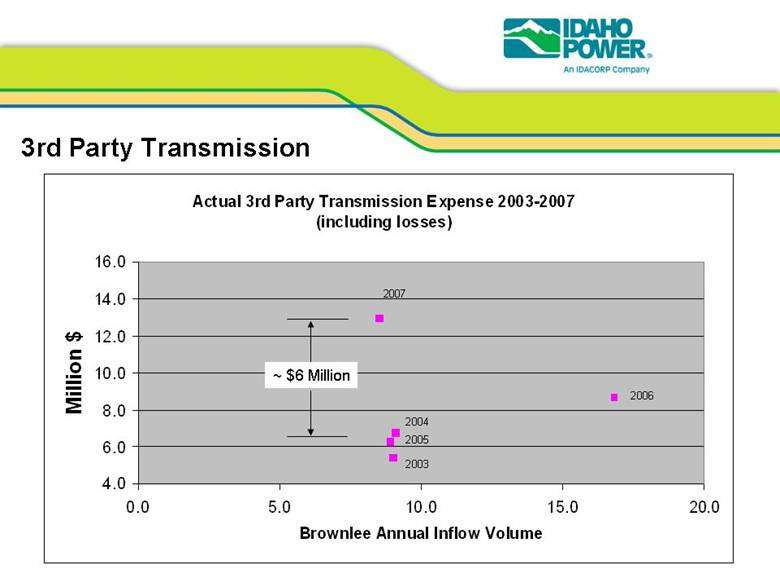
| 3rd Party Transmission Actual 3rd Party Transmission Expense 2003-2007 (including losses) 4.0 6.0 8.0 10.0 12.0 14.0 16.0 0.0 5.0 10.0 15.0 20.0 Brownlee Annual Inflow Volume Million $ 2007 2004 2003 2005 2006 ~ $6 Million |
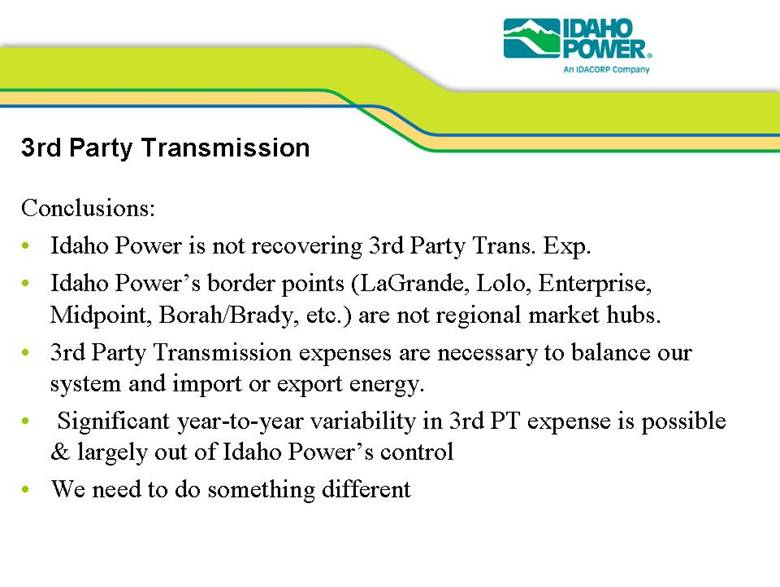
| 3rd Party Transmission Conclusions: • Idaho Power is not recovering 3rd Party Trans. Exp. • Idaho Power’s border points (LaGrande, Lolo, Enterprise, Midpoint, Borah/Brady, etc.) are not regional market hubs. • 3rd Party Transmission expenses are necessary to balance our system and import or export energy. • Significant year-to-year variability in 3rd PT expense is possible & largely out of Idaho Power’s control • We need to do something different |