
Exhibit 99.2 THIRD QUARTER 2019 Financial Results and Highlights October 30, 2019 © 2019 Cognizant
Forward-Looking Statements This earnings supplement includes statements which may constitute forward-looking statements made pursuant to the safe harbor provisions of the Private Securities Litigation Reform Act of 1995, the accuracy of which are necessarily subject to risks, uncertainties, and assumptions as to future events that may not prove to be accurate. These statements include, but are not limited to, express or implied forward-looking statements relating to our expectations regarding opportunities in the marketplace, our cost structure, investment in and growth of our business, our realignment plans, the timing, costs and impact of the Fit for Growth Plan, our shift to digital solutions and services, our anticipated financial performance, our capital deployment plan and clarification, if any, by the Indian government as to the application of the Supreme Court's ruling related to the India Defined Contribution Obligation. These statements are neither promises nor guarantees, but are subject to a variety of risks and uncertainties, many of which are beyond our control, which could cause actual results to differ materially from those contemplated in these forward-looking statements. Existing and prospective investors are cautioned not to place undue reliance on these forward-looking statements, which speak only as of the date hereof. Factors that could cause actual results to differ materially from those expressed or implied include general economic conditions, changes in the regulatory environment, including with respect to immigration and taxes, and the other factors discussed in our most recent Annual Report on Form 10-K and other filings with the Securities and Exchange Commission. Cognizant undertakes no obligation to update or revise any forward-looking statements, whether as a result of new information, future events, or otherwise, except as may be required under applicable securities law. Adoption of New Accounting Standard On January 1, 2018, the Company adopted Accounting Standards Codification Topic 606, “Revenue from Contracts with Customers,” or the New Revenue Standard, using the modified retrospective method. Results for reporting periods beginning after January 1, 2018 are presented under the New Revenue Standard, while prior period amounts are not adjusted and continue to be reported in accordance with the Company’s historic accounting policies. 2

Third Quarter Summary REVENUE • $4.25B, increased 4.2% (5.1% CC1) Y/Y • GAAP Operating Margin of 15.7%, declined 260bps Y/Y OPERATING MARGIN • Adjusted Operating Margin1 of 17.3%, declined 120bps Y/Y NET INCOME • $497M, increased 4.2% Y/Y DILUTED EARNINGS • GAAP diluted EPS of $0.90, increased 9.5% Y/Y PER SHARE • Adjusted Diluted EPS1 of $1.08, increased 2.7% Y/Y • Free cash flow1 of $620M represented ~125% of net income FREE CASH FLOW & • Repurchased 3.6M shares; $519M remaining under Board-authorized repurchase program CAPITAL RETURN • $111M in dividends paid • Revenue: 4.6-4.9% growth in constant currency FY2019 GUIDANCE • Adjusted operating margin: ~16.5-17.0% • Adjusted diluted EPS: $3.95-$3.98 1 Constant currency revenue growth, Adjusted Operating Margin, Free Cash Flow and Adjusted Diluted Earnings Per Share (“Adjusted Diluted EPS”) are not measurements of financial performance prepared in accordance with GAAP. See “About Non-GAAP Financial Measures” at the end of this earnings supplement for more information and reconciliations to the most directly comparable GAAP financial measures. 3
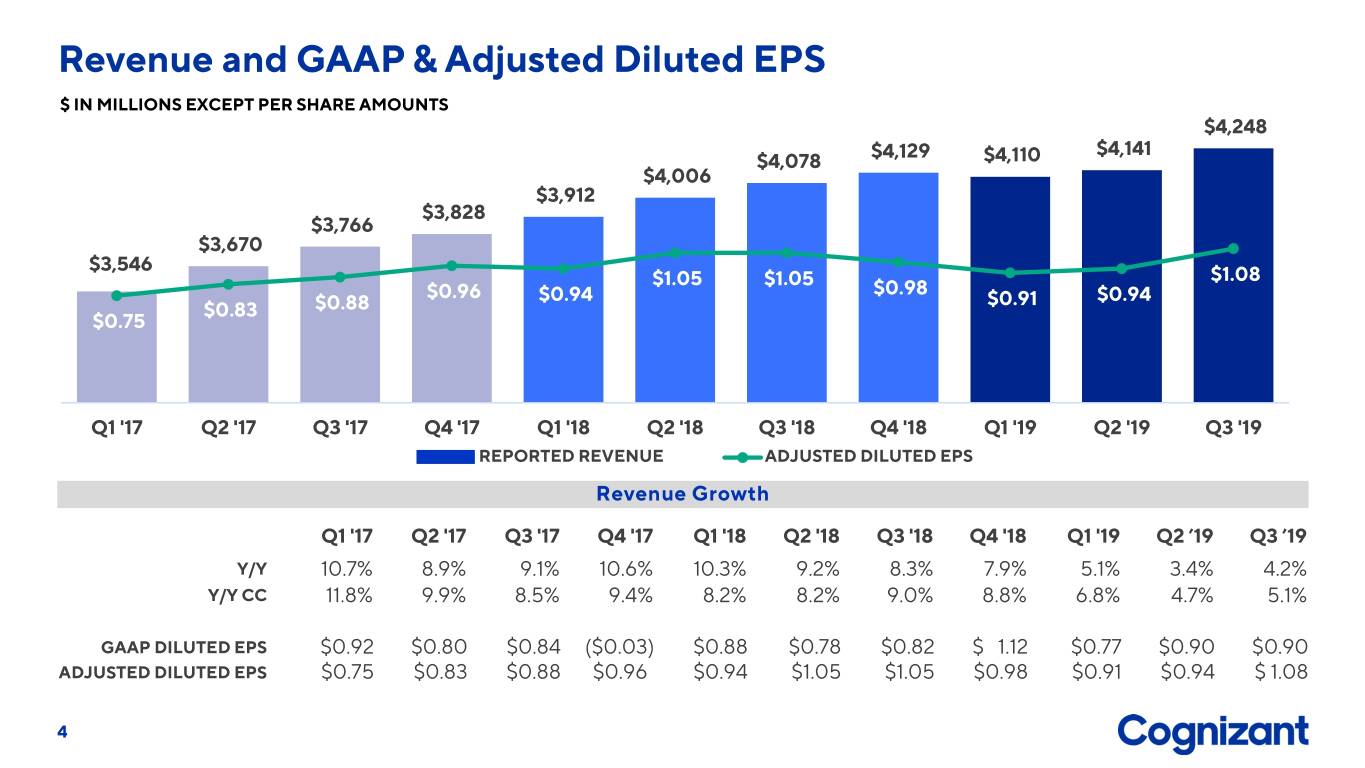
Revenue and GAAP & Adjusted Diluted EPS $ IN MILLIONS EXCEPT PER SHARE AMOUNTS $4,248 $4,129 $4,141 $4,078 $4,110 $4,006 $3,912 $3,828 $3,766 $3,670 $3,546 $1.08 $1.05 $1.05 $0.98 $0.96 $0.94 $0.91 $0.94 $0.83 $0.88 $0.75 Q1 '17 Q2 '17 Q3 '17 Q4 '17 Q1 '18 Q2 '18 Q3 '18 Q4 '18 Q1 '19 Q2 '19 Q3 '19 REPORTED REVENUE ADJUSTED DILUTED EPS Revenue Growth Q1 '17 Q2 '17 Q3 '17 Q4 '17 Q1 '18 Q2 '18 Q3 '18 Q4 '18 Q1 '19 Q2 ’19 Q3 ’19 Y/Y 10.7% 8.9% 9.1% 10.6% 10.3% 9.2% 8.3% 7.9% 5.1% 3.4% 4.2% Y/Y CC 11.8% 9.9% 8.5% 9.4% 8.2% 8.2% 9.0% 8.8% 6.8% 4.7% 5.1% GAAP DILUTED EPS $0.92 $0.80 $0.84 ($0.03) $0.88 $0.78 $0.82 $01.12 $0.77 $0.90 $0.90 ADJUSTED DILUTED EPS $0.75 $0.83 $0.88 $0.96) $0.94 $1.05 $1.05 $0.98 $0.91 $0.94 $ 1.08 4
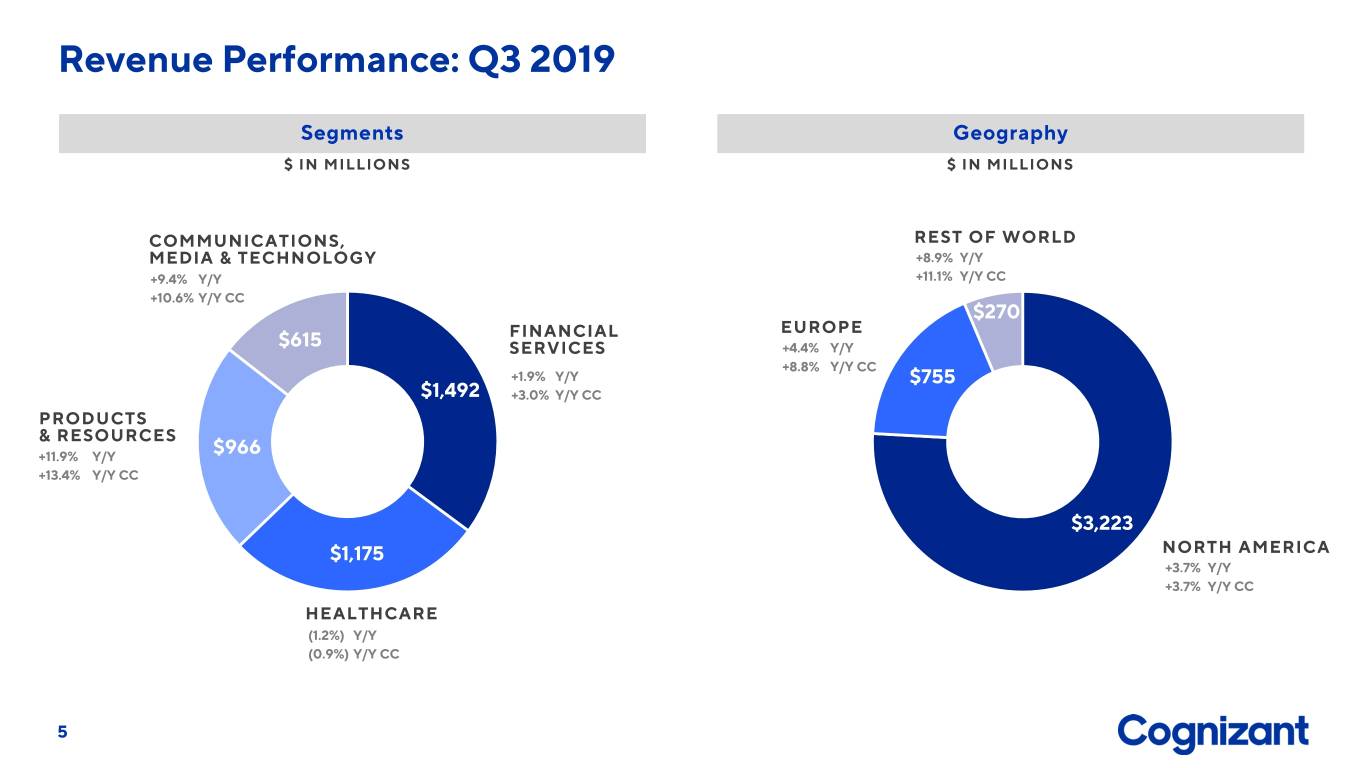
Revenue Performance: Q3 2019 Segments Geography $ IN MILLIONS $ IN MILLIONS COMMUNICATIONS, REST OF WORLD MEDIA & TECHNOLOGY +8.9% Y/Y +9.4% Y/Y +11.1% Y/Y CC +10.6% Y/Y CC $270 FINANCIAL EUROPE $615 SERVICES +4.4% Y/Y +8.8% Y/Y CC +1.9% Y/Y $755 $1,492 +3.0% Y/Y CC PRODUCTS & RESOURCES +11.9% Y/Y $966 +13.4% Y/Y CC $3,223 $1,175 NORTH AMERICA +3.7% Y/Y +3.7% Y/Y CC HEALTHCARE (1.2%) Y/Y (0.9%) Y/Y CC 5

GAAP & Adjusted Operating Margin 19.2% 18.3% 18.5% 17.6% 17.2% 17.7% 17.2% 17.3% 17.7% 17.7% 17.3% 16.4% 16.5% 16.7% 16.8% 17.0% 16.1% 16.0% 16.1% 15.7% 14.9% 13.1% Q1'17 Q2'17 Q3'17 Q4'17 Q1'18 Q2'18 Q3'18 Q4'18 Q1'19 Q2'19 Q3'19 GAAP OPERATING MARGIN ADJUSTED OPERATING MARGIN 6

Financial Services Revenue Geography $ IN MILLIONS $ IN MILLIONS REST OF WORLD $1,492 (2.2%) Y/Y $1,469 $1,464 $1,473 $1,461 $1,451 +0.2% Y/Y CC $1,427 $1,427 $1,436 $1,406 $131 $1,376 EUROPE +4.0% Y/Y +8.1% Y/Y CC $309 Q1 '17 Q2 '17 Q3 '17 Q4 '17 Q1 '18 Q2 '18 Q3 '18 Q4 '18 Q1 '19 Q2 '19 Q3 '19 $1,052 Revenue Growth NORTH AMERICA Y/Y 7.0% 4.1% 3.8% 5.4% 6.2% 4.5% 2.6% 1.7% (1.7%) 0.3% 1.9% +1.8% Y/Y +1.8% Y/Y CC Y/Y CC 8.1% 5.2% 3.1% 4.2% 3.9% 3.5% 3.5% 2.8% 0.2% 1.7% 3.0% BANKING | Consistent performance with the second quarter driven by the partnership with three Finnish financial institutions to transform and operate a shared core banking platform INSURANCE | Benefitted from the ramp-up of project-based work 7
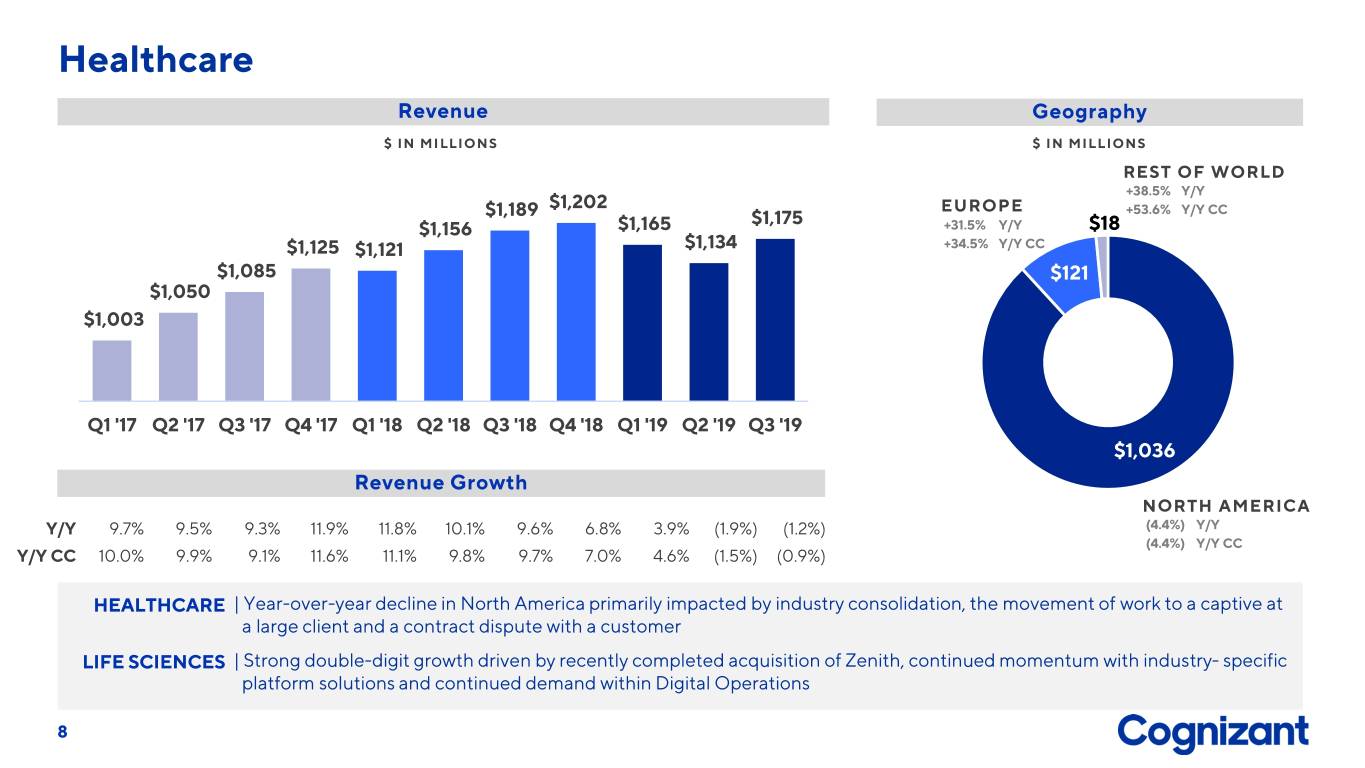
Healthcare Revenue Geography $ IN MILLIONS $ IN MILLIONS REST OF WORLD +38.5% Y/Y $1,202 EUROPE $1,189 $1,175 +53.6% Y/Y CC $1,156 $1,165 +31.5% Y/Y $18 $1,125 $1,121 $1,134 +34.5% Y/Y CC $1,085 $121 $1,050 $1,003 Q1 '17 Q2 '17 Q3 '17 Q4 '17 Q1 '18 Q2 '18 Q3 '18 Q4 '18 Q1 '19 Q2 '19 Q3 '19 $1,036 Revenue Growth NORTH AMERICA Y/Y 9.7% 9.5% 9.3% 11.9% 11.8% 10.1% 9.6% 6.8% 3.9% (1.9%) (1.2%) (4.4%) Y/Y (4.4%) Y/Y CC Y/Y CC 10.0% 9.9% 9.1% 11.6% 11.1% 9.8% 9.7% 7.0% 4.6% (1.5%) (0.9%) HEALTHCARE | Year-over-year decline in North America primarily impacted by industry consolidation, the movement of work to a captive at a large client and a contract dispute with a customer LIFE SCIENCES | Strong double-digit growth driven by recently completed acquisition of Zenith, continued momentum with industry- specific platform solutions and continued demand within Digital Operations 8
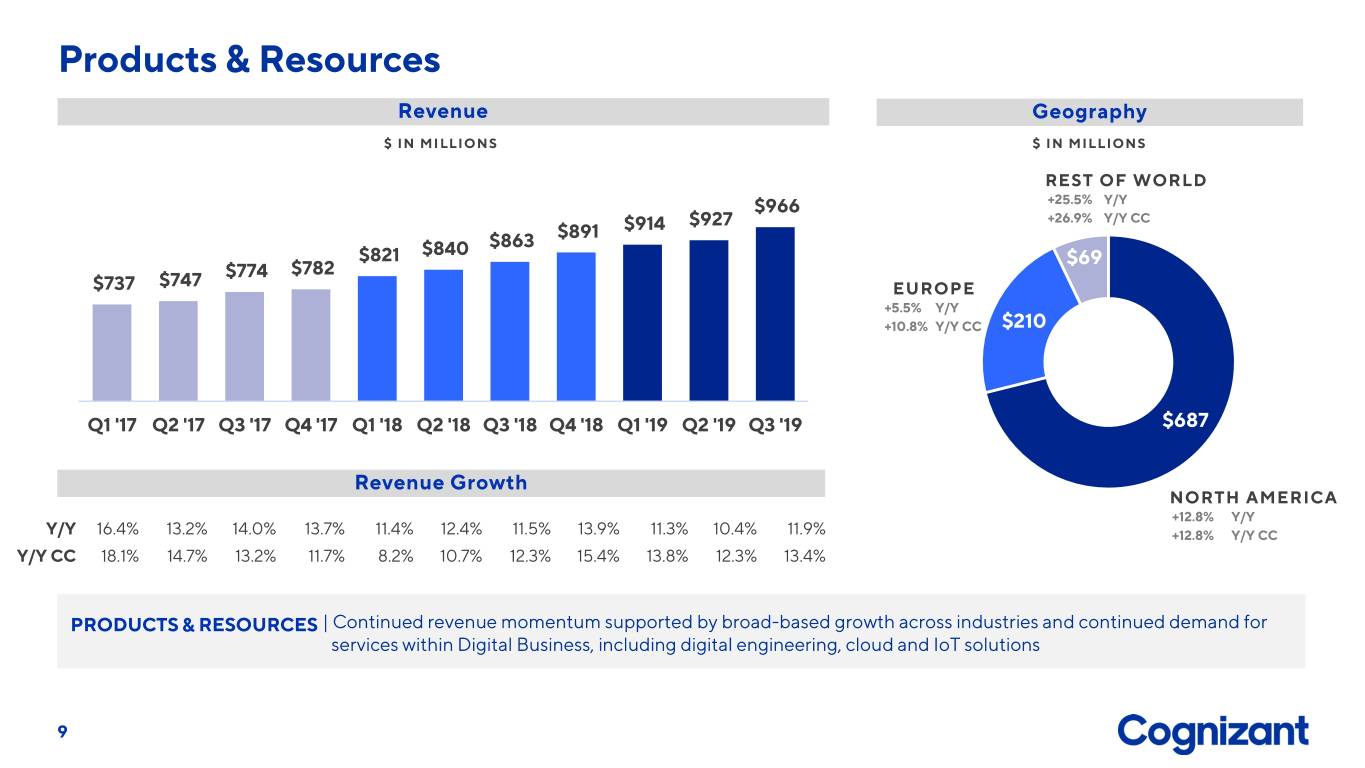
Products & Resources Revenue Geography $ IN MILLIONS $ IN MILLIONS REST OF WORLD $966 +25.5% Y/Y $914 $927 +26.9% Y/Y CC $863 $891 $821 $840 $69 $774 $782 $737 $747 EUROPE +5.5% Y/Y +10.8% Y/Y CC $210 Q1 '17 Q2 '17 Q3 '17 Q4 '17 Q1 '18 Q2 '18 Q3 '18 Q4 '18 Q1 '19 Q2 '19 Q3 '19 $687 Revenue Growth NORTH AMERICA +12.8% Y/Y Y/Y 16.4% 13.2% 14.0% 13.7% 11.4% 12.4% 11.5% 13.9% 11.3% 10.4% 11.9% +12.8% Y/Y CC Y/Y CC 18.1% 14.7% 13.2% 11.7% 8.2% 10.7% 12.3% 15.4% 13.8% 12.3% 13.4% PRODUCTS & RESOURCES | Continued revenue momentum supported by broad-based growth across industries and continued demand for services within Digital Business, including digital engineering, cloud and IoT solutions 9
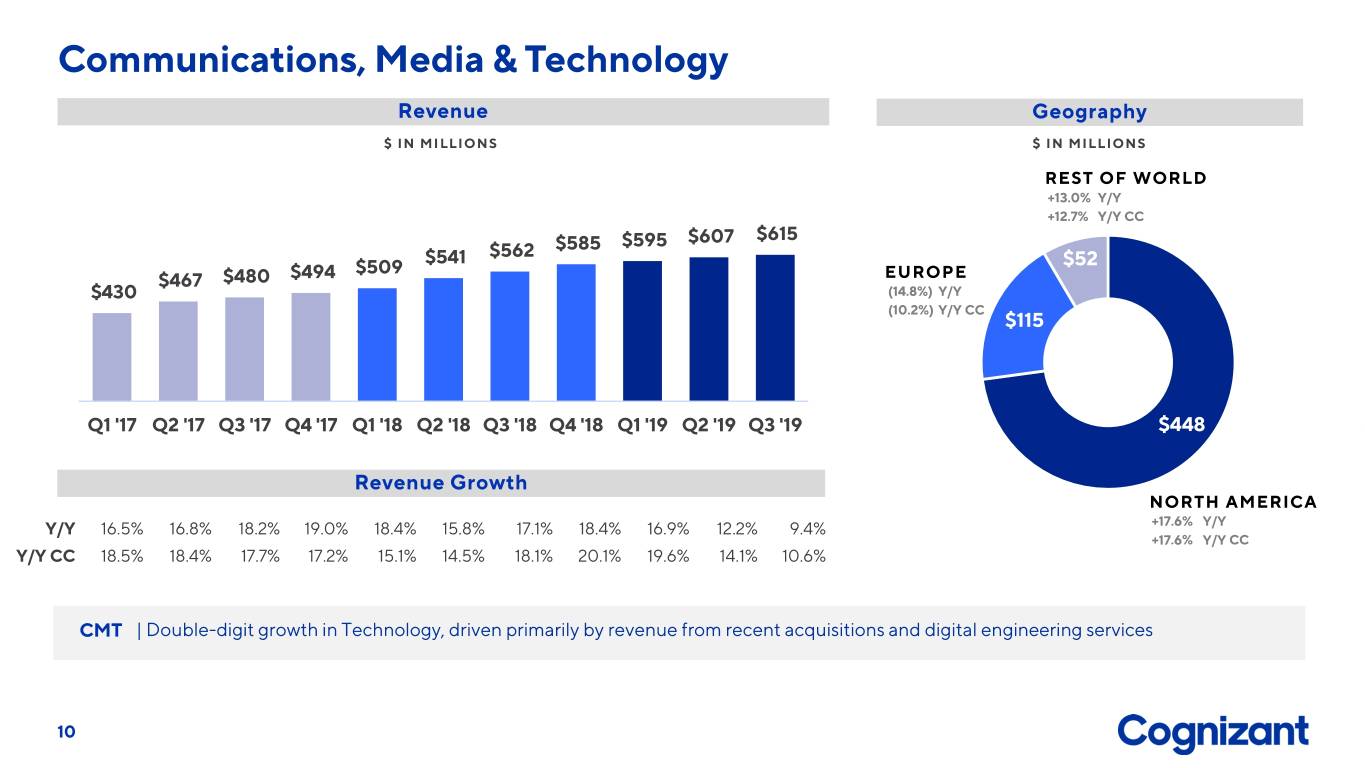
Communications, Media & Technology Revenue Geography $ IN MILLIONS $ IN MILLIONS REST OF WORLD +13.0% Y/Y +12.7% Y/Y CC $585 $595 $607 $615 $541 $562 $509 $52 $467 $480 $494 EUROPE $430 (14.8%) Y/Y (10.2%) Y/Y CC $115 Q1 '17 Q2 '17 Q3 '17 Q4 '17 Q1 '18 Q2 '18 Q3 '18 Q4 '18 Q1 '19 Q2 '19 Q3 '19 $448 Revenue Growth NORTH AMERICA Y/Y 16.5% 16.8% 18.2% 19.0% 18.4% 15.8% 17.1% 18.4% 16.9% 12.2% 9.4% +17.6% Y/Y +17.6% Y/Y CC Y/Y CC 18.5% 18.4% 17.7% 17.2% 15.1% 14.5% 18.1% 20.1% 19.6% 14.1% 10.6% CMT | Double-digit growth in Technology, driven primarily by revenue from recent acquisitions and digital engineering services 10

Employee Metrics Headcount and Attrition NUMBER OF EMPLOYEES IN THOUSANDS 24% 24% 23% 23% 22% 23% 20% 19% 18% 19% 289.9 15% 288.2 281.6 285.8 274.2 268.9 261.2 260.0 261.4 256.8 256.1 Q1 '17 Q2 '17 Q3 '17 Q4 '17 Q1 '18 Q2 '18 Q3 '18 Q4 '18 Q1 '19 Q2 '19 Q3 '19 HEADCOUNT QUARTERLY ANNUALIZED ATTRITION Utilization 93% 93% 93% 93% 91% 92% 92% 92% 91% 92% 92% 84% 82% 83% 83% 83% 83% 83% 83% 83% 79% 80% Q1 '17 Q2 '17 Q3 '17 Q4 '17 Q1 '18 Q2 '18 Q3 '18 Q4 '18 Q1 '19 Q2 '19 Q3 '19 OFFSHORE EXCLUDING TRAINEES % ONSITE UTILIZATION % 11
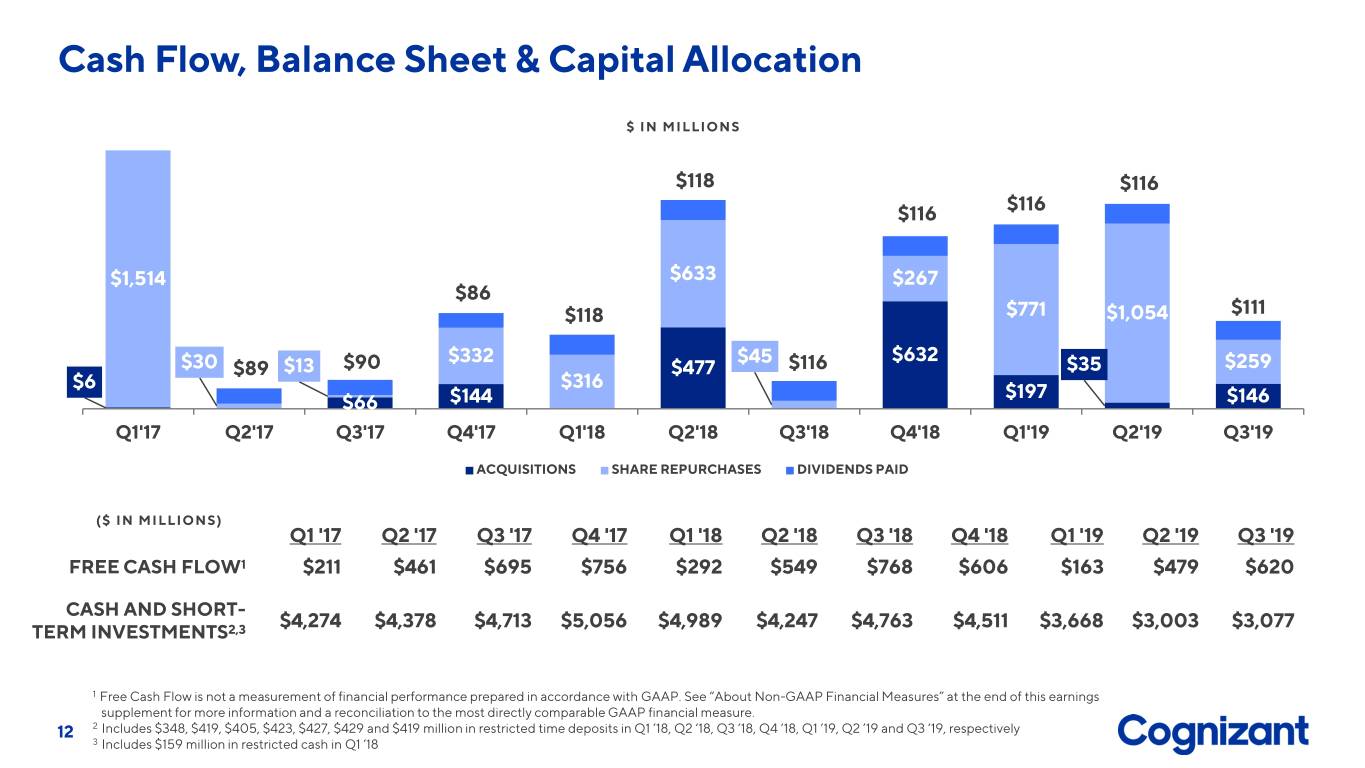
Cash Flow, Balance Sheet & Capital Allocation $ IN MILLIONS $118 $116 $116 $116 $1,514 $633 $267 $86 $118 $771 $1,054 $111 $332 $45 $632 $30 $89 $13 $90 $477 $116 $35 $259 $316 $6 $197 $66 $144 $146 Q1'17 Q2'17 Q3'17 Q4'17 Q1'18 Q2'18 Q3'18 Q4'18 Q1'19 Q2'19 Q3'19 ACQUISITIONS SHARE REPURCHASES DIVIDENDS PAID ($ IN MILLIONS) Q1 '17 Q2 '17 Q3 '17 Q4 '17 Q1 '18 Q2 '18 Q3 '18 Q4 '18 Q1 '19 Q2 '19 Q3 '19 FREE CASH FLOW1 $211 $461 $695 $756 $292 $549 $768 $606 $163 $479 $620 CASH AND SHORT- $4,274 $4,378 $4,713 $5,056 $4,989 $4,247 $4,763 $4,511 $3,668 $3,003 $3,077 TERM INVESTMENTS2,3 1 Free Cash Flow is not a measurement of financial performance prepared in accordance with GAAP. See “About Non-GAAP Financial Measures” at the end of this earnings supplement for more information and a reconciliation to the most directly comparable GAAP financial measure. 12 2 Includes $348, $419, $405, $423, $427, $429 and $419 million in restricted time deposits in Q1 ‘18, Q2 ‘18, Q3 ‘18, Q4 ‘18, Q1 ’19, Q2 ’19 and Q3 ‘19, respectively 3 Includes $159 million in restricted cash in Q1 ‘18

Revenue & Operating Metrics REVENUE BY… Q1'18 Q2'18 Q3'18 Q4'18 Q1'19 Q2'19 Q3'19 SERVICE LINE OUTSOURCING 42.0% 42.9% 42.3% 41.8% 41.4% 41.1% 40.4% CONSULTING & TECH SERVICES 58.0% 57.1% 57.7% 58.2% 58.6% 58.9% 59.6% CONTRACT TYPE FIXED BID 38.9% 36.2% 36.4% 36.6% 35.7% 35.7% 36.3% TIME & MATERIAL 52.6% 52.9% 52.6% 52.0% 52.4% 51.7% 51.8% TRANSACTION BASED 8.5% 10.9% 11.0% 11.4% 11.9% 12.5% 11.9% CUSTOMER CONCENTRATION TOP 5 9.0% 8.6% 8.7% 8.9% 8.8% 8.0% 7.9% TOP 10 15.9% 15.4% 15.5% 15.6% 15.7% 14.5% 14.4% OPERATING METRICS DAYS SALES OUTSTANDING 75 76 76 75 78 79 78 13
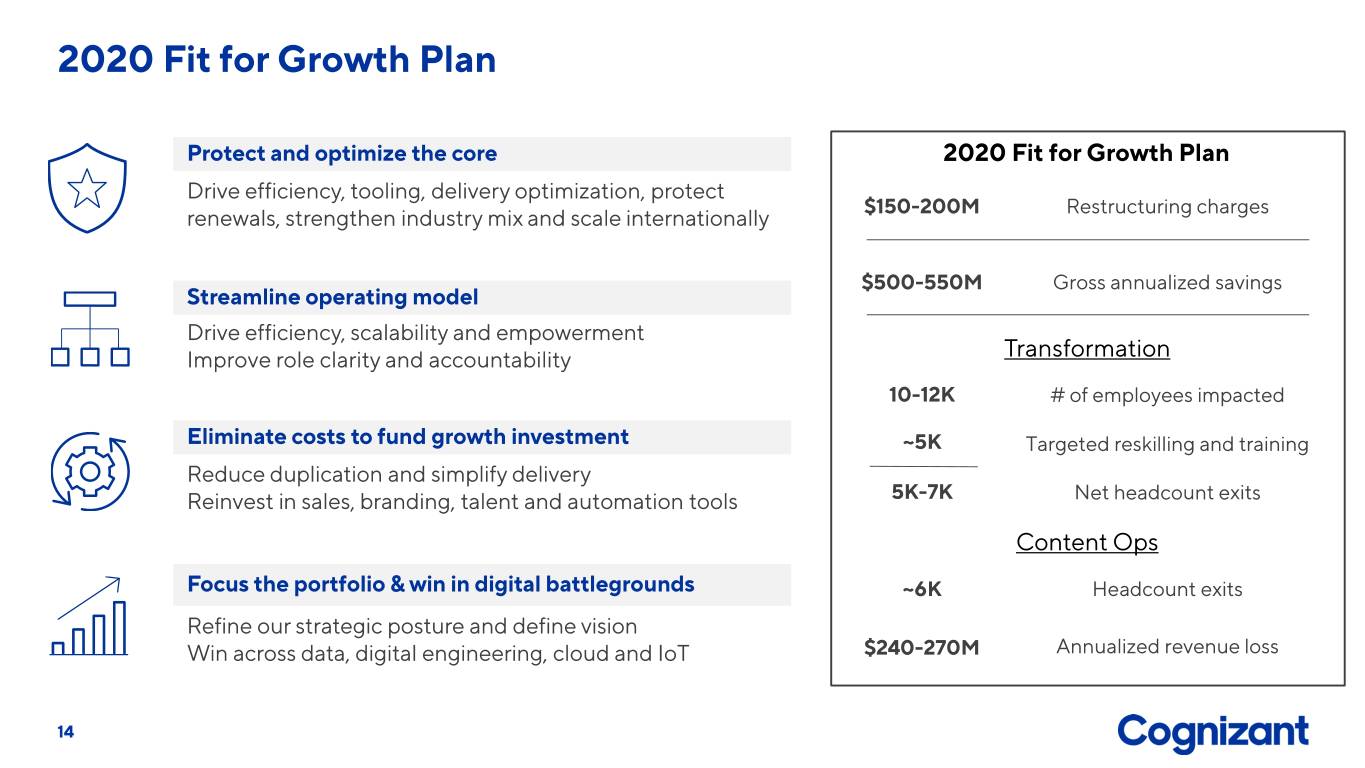
2020 Fit for Growth Plan Protect and optimize the core 2020 Fit for Growth Plan Drive efficiency, tooling, delivery optimization, protect $150-200M Restructuring charges renewals, strengthen industry mix and scale internationally $500-550M Gross annualized savings Streamline operating model Drive efficiency, scalability and empowerment Improve role clarity and accountability Transformation 10-12K # of employees impacted Eliminate costs to fund growth investment ~5K Targeted reskilling and training Reduce duplication and simplify delivery Reinvest in sales, branding, talent and automation tools 5K-7K Net headcount exits Content Ops Focus the portfolio & win in digital battlegrounds ~6K Headcount exits Refine our strategic posture and define vision Win across data, digital engineering, cloud and IoT $240-270M Annualized revenue loss 14
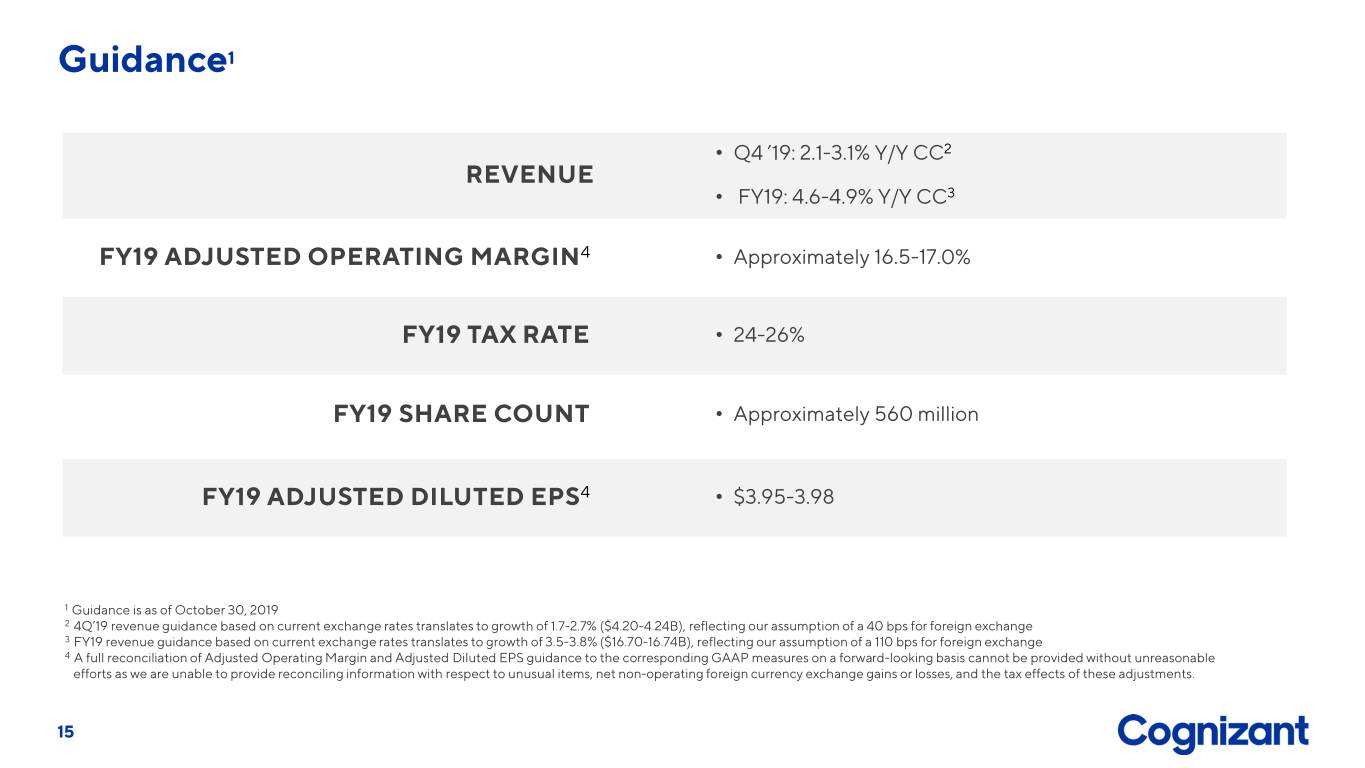
Guidance1 • Q4 ’19: 2.1-3.1% Y/Y CC2 REVENUE • FY19: 4.6-4.9% Y/Y CC3 FY19 ADJUSTED OPERATING MARGIN4 • Approximately 16.5-17.0% FY19 TAX RATE • 24-26% FY19 SHARE COUNT • Approximately 560 million FY19 ADJUSTED DILUTED EPS4 • $3.95-3.98 1 Guidance is as of October 30, 2019 2 4Q’19 revenue guidance based on current exchange rates translates to growth of 1.7-2.7% ($4.20-4.24B), reflecting our assumption of a 40 bps for foreign exchange 3 FY19 revenue guidance based on current exchange rates translates to growth of 3.5-3.8% ($16.70-16.74B), reflecting our assumption of a 110 bps for foreign exchange 4 A full reconciliation of Adjusted Operating Margin and Adjusted Diluted EPS guidance to the corresponding GAAP measures on a forward-looking basis cannot be provided without unreasonable efforts as we are unable to provide reconciling information with respect to unusual items, net non-operating foreign currency exchange gains or losses, and the tax effects of these adjustments. 15
APPENDIX: About Non-GAAP Financial Measures
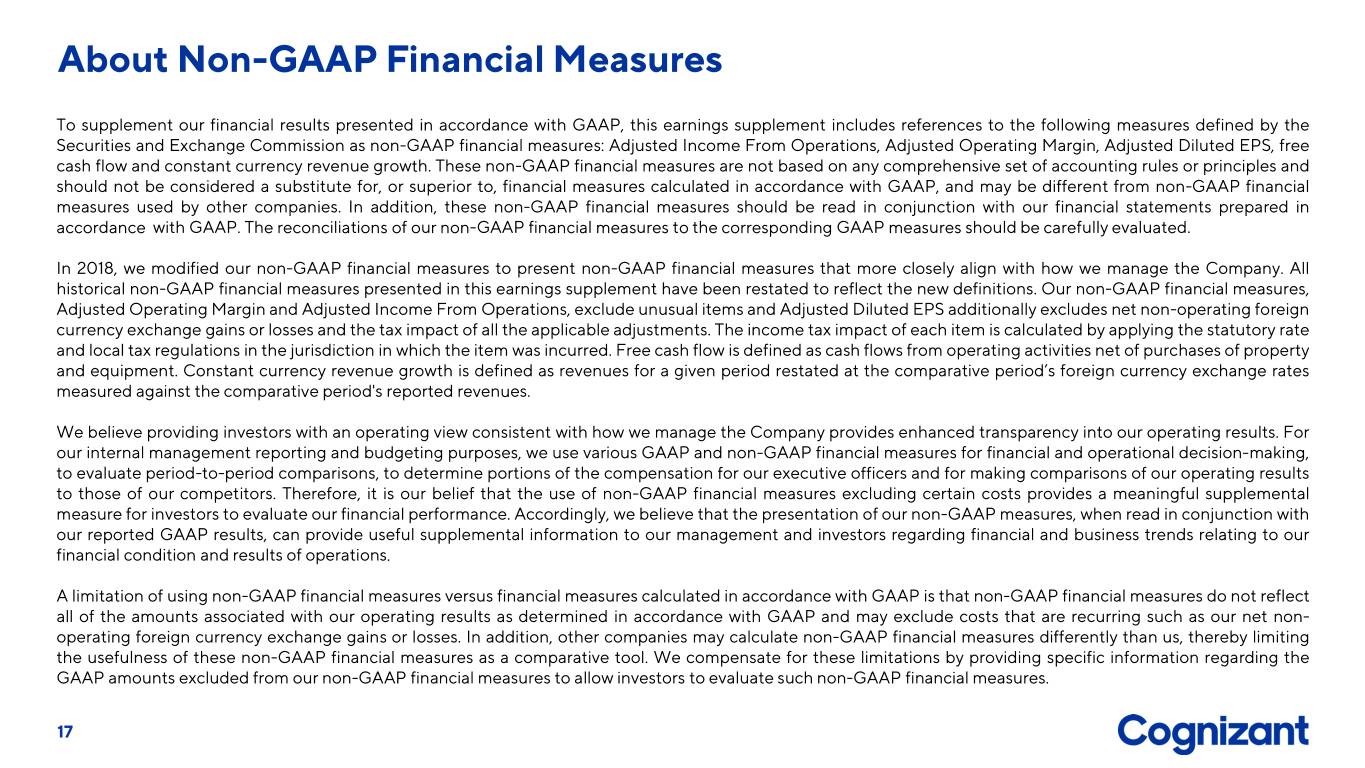
About Non-GAAP Financial Measures To supplement our financial results presented in accordance with GAAP, this earnings supplement includes references to the following measures defined by the Securities and Exchange Commission as non-GAAP financial measures: Adjusted Income From Operations, Adjusted Operating Margin, Adjusted Diluted EPS, free cash flow and constant currency revenue growth. These non-GAAP financial measures are not based on any comprehensive set of accounting rules or principles and should not be considered a substitute for, or superior to, financial measures calculated in accordance with GAAP, and may be different from non-GAAP financial measures used by other companies. In addition, these non-GAAP financial measures should be read in conjunction with our financial statements prepared in accordance with GAAP. The reconciliations of our non-GAAP financial measures to the corresponding GAAP measures should be carefully evaluated. In 2018, we modified our non-GAAP financial measures to present non-GAAP financial measures that more closely align with how we manage the Company. All historical non-GAAP financial measures presented in this earnings supplement have been restated to reflect the new definitions. Our non-GAAP financial measures, Adjusted Operating Margin and Adjusted Income From Operations, exclude unusual items and Adjusted Diluted EPS additionally excludes net non-operating foreign currency exchange gains or losses and the tax impact of all the applicable adjustments. The income tax impact of each item is calculated by applying the statutory rate and local tax regulations in the jurisdiction in which the item was incurred. Free cash flow is defined as cash flows from operating activities net of purchases of property and equipment. Constant currency revenue growth is defined as revenues for a given period restated at the comparative period’s foreign currency exchange rates measured against the comparative period's reported revenues. We believe providing investors with an operating view consistent with how we manage the Company provides enhanced transparency into our operating results. For our internal management reporting and budgeting purposes, we use various GAAP and non-GAAP financial measures for financial and operational decision-making, to evaluate period-to-period comparisons, to determine portions of the compensation for our executive officers and for making comparisons of our operating results to those of our competitors. Therefore, it is our belief that the use of non-GAAP financial measures excluding certain costs provides a meaningful supplemental measure for investors to evaluate our financial performance. Accordingly, we believe that the presentation of our non-GAAP measures, when read in conjunction with our reported GAAP results, can provide useful supplemental information to our management and investors regarding financial and business trends relating to our financial condition and results of operations. A limitation of using non-GAAP financial measures versus financial measures calculated in accordance with GAAP is that non-GAAP financial measures do not reflect all of the amounts associated with our operating results as determined in accordance with GAAP and may exclude costs that are recurring such as our net non- operating foreign currency exchange gains or losses. In addition, other companies may calculate non-GAAP financial measures differently than us, thereby limiting the usefulness of these non-GAAP financial measures as a comparative tool. We compensate for these limitations by providing specific information regarding the GAAP amounts excluded from our non-GAAP financial measures to allow investors to evaluate such non-GAAP financial measures. 17
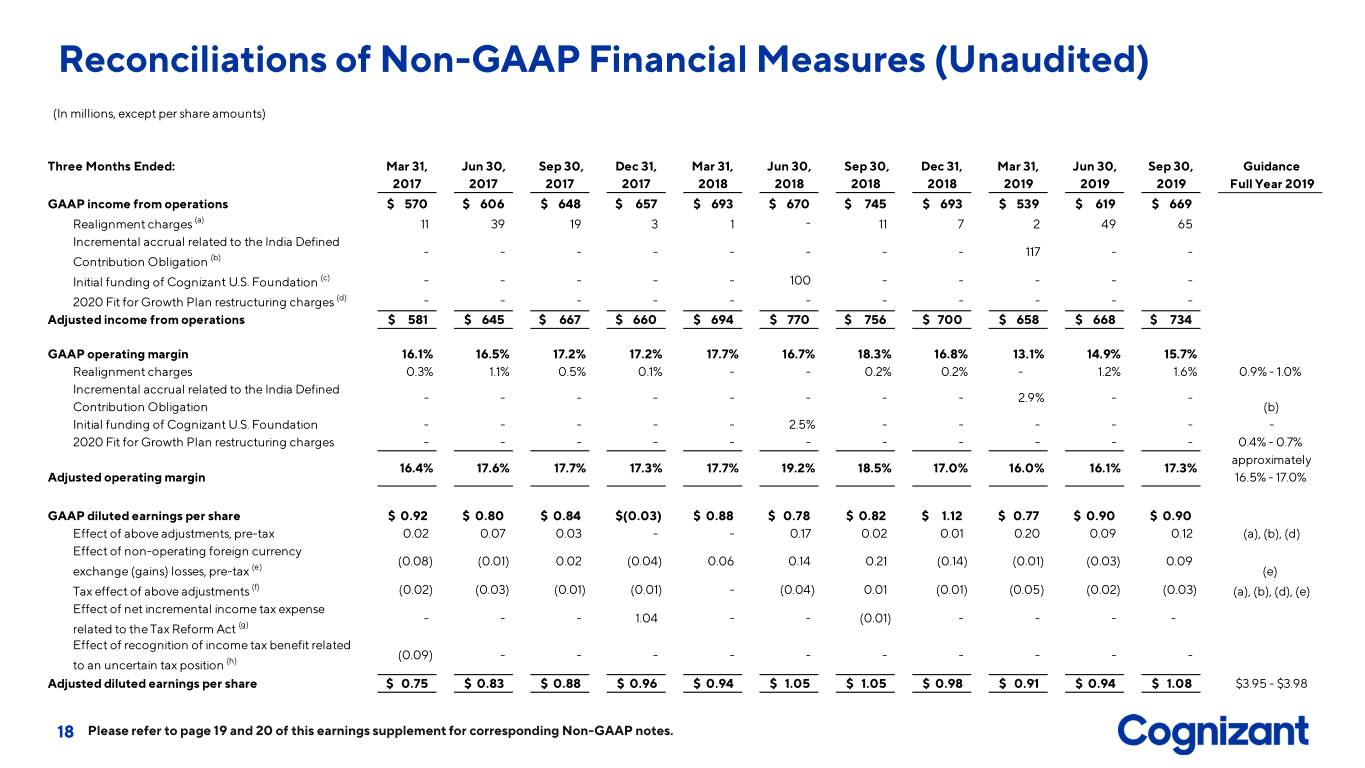
Reconciliations of Non-GAAP Financial Measures (Unaudited) (In millions, except per share amounts) Three Months Ended: Mar 31, Jun 30, Sep 30, Dec 31, Mar 31, Jun 30, Sep 30, Dec 31, Mar 31, Jun 30, Sep 30, Guidance 2017 2017 2017 2017 2018 2018 2018 2018 2019 2019 2019 Full Year 2019 GAAP income from operations $ 570 $ 606 $ 648 $ 657 $ 693 $ 670 $ 745 $ 693 $ 539 $ 619 $ 669 Realignment charges (a) 11 39 19 3 1 - 11 7 2 49 65 Incremental accrual related to the India Defined - - - - - - - - 117 - - Contribution Obligation (b) Initial funding of Cognizant U.S. Foundation (c) - - - - - 100 - - - - - 2020 Fit for Growth Plan restructuring charges (d) - - - - - - - - - - - Adjusted income from operations $ 581 $ 645 $ 667 $ 660 $ 694 $ 770 $ 756 $ 700 $ 658 $ 668 $ 734 GAAP operating margin 16.1% 16.5% 17.2% 17.2% 17.7% 16.7% 18.3% 16.8% 13.1% 14.9% 15.7% Realignment charges 0.3% 1.1% 0.5% 0.1% - - 0.2% 0.2% - 1.2% 1.6% 0.9% - 1.0% Incremental accrual related to the India Defined - - - - - - - - 2.9% - - Contribution Obligation (b) Initial funding of Cognizant U.S. Foundation - - - - - 2.5% - - - - - - 2020 Fit for Growth Plan restructuring charges - - - - - - - - - - - 0.4% - 0.7% approximately 16.4% 17.6% 17.7% 17.3% 17.7% 19.2% 18.5% 17.0% 16.0% 16.1% 17.3% Adjusted operating margin 16.5% - 17.0% GAAP diluted earnings per share $ 0.92 $ 0.80 $ 0.84 $(0.03) $ 0.88 $ 0.78 $ 0.82 $ 1.12 $ 0.77 $ 0.90 $ 0.90 Effect of above adjustments, pre-tax 0.02 0.07 0.03 - - 0.17 0.02 0.01 0.20 0.09 0.12 (a), (b), (d) Effect of non-operating foreign currency (0.08) (0.01) 0.02 (0.04) 0.06 0.14 0.21 (0.14) (0.01) (0.03) 0.09 exchange (gains) losses, pre-tax (e) (e) Tax effect of above adjustments (f) (0.02) (0.03) (0.01) (0.01) - (0.04) 0.01 (0.01) (0.05) (0.02) (0.03) (a), (b), (d), (e) Effect of net incremental income tax expense - - - 1.04 - - (0.01) - - - - related to the Tax Reform Act (g) Effect of recognition of income tax benefit related (0.09) - - - - - - - - - - to an uncertain tax position (h) Adjusted diluted earnings per share $ 0.75 $ 0.83 $ 0.88 $ 0.96 $ 0.94 $ 1.05 $ 1.05 $ 0.98 $ 0.91 $ 0.94 $ 1.08 $3.95 - $3.98 18 Please refer to page 19 and 20 of this earnings supplement for corresponding Non-GAAP notes.

Reconciliations of Non-GAAP Financial Measures (Unaudited) (a) During the three months ended September 30, 2019, we incurred $65 million in realignment charges that include $33 million in employee separation costs, $18 million in employee retention costs and $14 million in third party realignment costs. During the nine months ended September 30, 2019, we incurred $116 million of realignment charges that include $60 million of employee separation costs, $22 million of costs associated with our CEO transition and the departure of our president, $18 million of employee retention costs and $16 million in third party realignment costs. The total costs related to the realignment are reported in "Selling, general and administrative expenses" in our unaudited consolidated statements of operations. Our guidance anticipates pre-tax realignment charges in the range of $0.27 to $0.30 per diluted share for the full year 2019. The tax effect of these realignment charges is expected to be in the range of $0.07 to $0.08 per diluted share for the full year 2019. (b) In the first quarter of 2019, a ruling of the Supreme Court of India interpreting certain statutory defined contribution obligations of employees and employers (the “India Defined Contribution Obligation”) altered historical understandings of such obligations, extending them to cover additional portions of the employee’s income. As a result, the contributions of our employees and the Company in future periods are required to be increased. In the first quarter of 2019, we accrued $117 million with respect to prior periods, assuming retroactive application of the Supreme Court’s ruling. There is significant uncertainty as to how the liability should be calculated as it is impacted by multiple variables, including the period of assessment, the application with respect to certain current and former employees and whether interest and penalties may be assessed. Since the ruling, a variety of trade associations and industry groups have advocated to the Indian government, highlighting the harm to the information technology sector, other industries and job growth in India that would result from a retroactive application of the ruling. We anticipate the Indian government will review the matter and believe there is a substantial question as to whether the Indian government will apply the Supreme Court’s ruling on a retroactive basis. As such, the ultimate amount of our obligation may be materially different from the amount accrued. The incremental accrual related to the India Defined Contribution Obligation is reported in "Selling, general and administrative expenses" in our unaudited consolidated statement of operations. (c) In the second quarter of 2018, we provided $100 million of initial funding to Cognizant U.S. Foundation. This cost is reported in "Selling, general and administrative expenses" in our unaudited consolidated statement of operations. (d) Over the next two years, we intend to implement our 2020 Fit for Growth Plan, which will involve significant investments in technology, sales and marketing, talent reskilling, acquisitions, and partnerships to further sharpen our strategic positioning in key digital areas. The 2020 Fit for Growth Plan will also involve certain measures commencing in the fourth quarter of 2019 to optimize our cost structure in order to partially fund these investments and advance our growth agenda. In the fourth quarter of 2019 and in 2020, the optimization measures that are part of the 2020 Fit for Growth Plan are expected to result in total restructuring charges in the range of $150 million to $200 million, primarily related to severance and facility exit costs. Our guidance anticipates pre-tax Fit for Growth restructuring charges in the range of $0.13 to $0.20 per diluted share for the full year 2019. The tax effect of these charges is expected to be in the range of $0.04 to $0.05 per diluted share for the full year 2019. (e) Non-operating foreign currency exchange gains and losses, inclusive of gains and losses on related foreign exchange forward contracts not designated as hedging instruments for accounting purposes, are reported in "Foreign currency exchange gains (losses), net" in our unaudited consolidated statements of operations. Non-operating foreign currency exchange gains and losses are subject to high variability and low visibility and therefore cannot be provided on a forward-looking basis without unreasonable efforts. 19
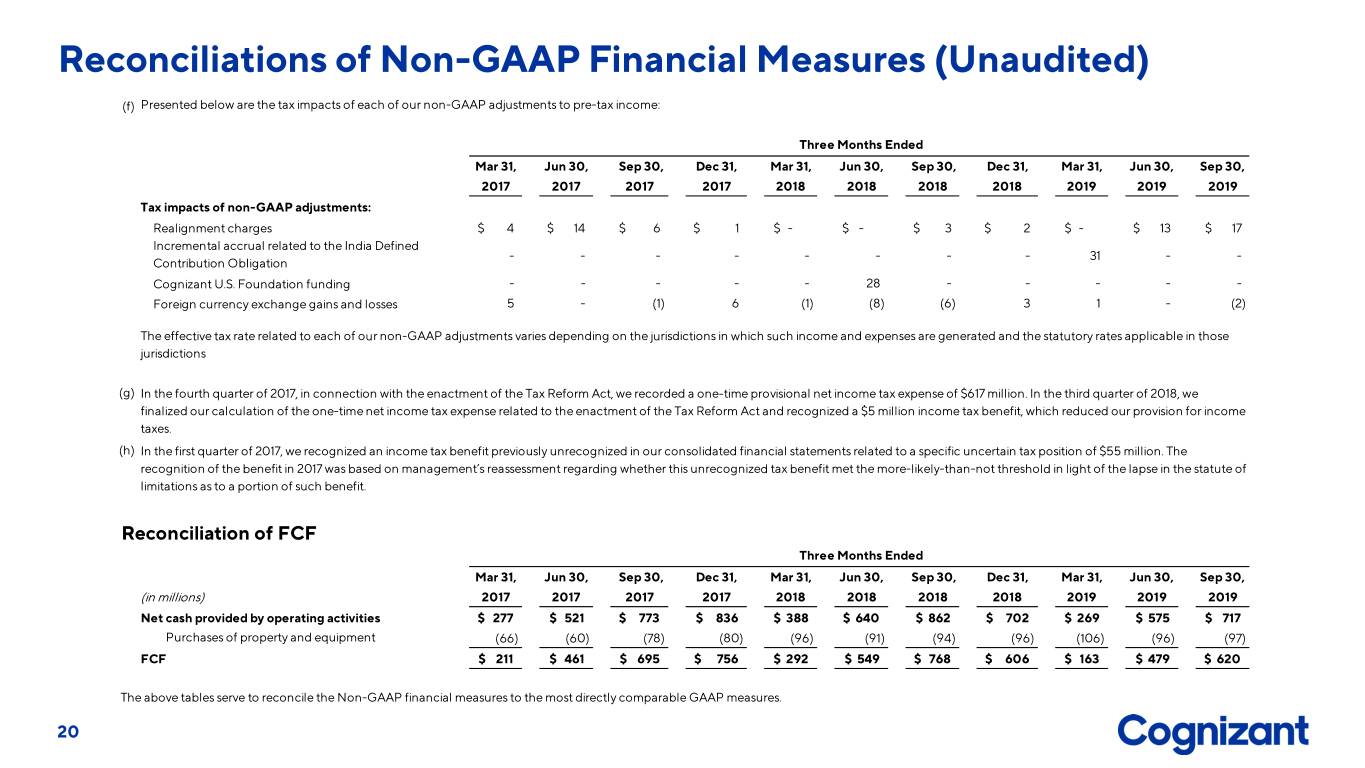
Reconciliations of Non-GAAP Financial Measures (Unaudited) (f) Presented below are the tax impacts of each of our non-GAAP adjustments to pre-tax income: Three Months Ended Mar 31, Jun 30, Sep 30, Dec 31, Mar 31, Jun 30, Sep 30, Dec 31, Mar 31, Jun 30, Sep 30, 2017 2017 2017 2017 2018 2018 2018 2018 2019 2019 2019 Tax impacts of non-GAAP adjustments: Realignment charges $ 4 $ 14 $ 6 $ 1 $ - $ - $ 3 $ 2 $ - $ 13 $ 17 Incremental accrual related to the India Defined - - - - - - - - 31 - - Contribution Obligation Cognizant U.S. Foundation funding - - - - - 28 - - - - - Foreign currency exchange gains and losses 5 - (1) 6 (1) (8) (6) 3 1 - (2) The effective tax rate related to each of our non-GAAP adjustments varies depending on the jurisdictions in which such income and expenses are generated and the statutory rates applicable in those jurisdictions (g) In the fourth quarter of 2017, in connection with the enactment of the Tax Reform Act, we recorded a one-time provisional net income tax expense of $617 million. In the third quarter of 2018, we finalized our calculation of the one-time net income tax expense related to the enactment of the Tax Reform Act and recognized a $5 million income tax benefit, which reduced our provision for income taxes. (h) In the first quarter of 2017, we recognized an income tax benefit previously unrecognized in our consolidated financial statements related to a specific uncertain tax position of $55 million. The recognition of the benefit in 2017 was based on management’s reassessment regarding whether this unrecognized tax benefit met the more-likely-than-not threshold in light of the lapse in the statute of limitations as to a portion of such benefit. Reconciliation of FCF Three Months Ended Mar 31, Jun 30, Sep 30, Dec 31, Mar 31, Jun 30, Sep 30, Dec 31, Mar 31, Jun 30, Sep 30, (in millions) 2017 2017 2017 2017 2018 2018 2018 2018 2019 2019 2019 Net cash provided by operating activities $ 277 $ 521 $ 773 $ 836 $ 388 $ 640 $ 862 $ 702 $ 269 $ 575 $ 717 Purchases of property and equipment (66) (60) (78) (80) (96) (91) (94) (96) (106) (96) (97) FCF $ 211 $ 461 $ 695 $ 756 $ 292 $ 549 $ 768 $ 606 $ 163 $ 479 $ 620 The above tables serve to reconcile the Non-GAAP financial measures to the most directly comparable GAAP measures. 20


