
Q1 2022 Earnings Update May 2022
SAFE HARBOR STATEMENTS Forward-Looking Statements: Certain statements in this presentation may constitute “forward-looking” statements within the meaning of the Private Securities Litigation Reform Act of 1995 and other federal securities laws. Such statements are statements other than historical fact and relate to our intent, belief or current expectations, primarily with respect to our future operating, financial and strategic performance. These statements generally are accompanied by words such as “intend,” “anticipate,” “believe,” “estimate,” “project,” “target,” “plan,” “expect,” “will,” “should,” “would” or similar statements. Any such forward-looking statements are not guarantees of future performance and involve risks and uncertainties. Actual results may differ from those contained in or implied by the forward-looking statements as a result of various factors including, but not limited to, risks and uncertainties relating to the impact of the COVID-19 global pandemic and related measures taken by governmental or regulatory authorities to combat the global pandemic, including the impact of the global pandemic on our results of operations, financial condition and liquidity; our achievement of certain expected revenue results, including as a result of factors or events that are unexpected or otherwise outside of our control; our ability to generate sufficient cash flows to service our debt and other obligations and our ability to access capital, including debt or equity; general economic or business conditions affecting the radio broadcasting industry which may be less favorable than expected, decreasing spending by advertisers; changes in market conditions which could impair our intangible assets and the effects of any material impairment of our intangible assets; our ability to execute our business plan and strategy; our ability to attract, motivate and/or retain key executives and associates; increased competition in the radio broadcasting industry and our ability to respond to changes in technology in order to remain competitive; shift in population, demographics, audience tastes and listening preferences; disruptions or security breaches of our information technology infrastructure; the impact of current, pending or future legislation and regulations, antitrust considerations, and pending or future litigation or claims; changes in regulatory or legislative policies or actions or in regulatory bodies; changes in uncertain tax positions and tax rates; changes in the financial markets; changes in capital expenditure requirements; changes in interest rates; the possibility that we may be unable to achieve any expected cost-saving or operational synergies in connection with any acquisitions or business improvement initiatives, or achieve them within the expected time periods or other risks identified from time to time in our filings with the Securities and Exchange Commission, including our Annual Report on Form 10-K for the year ended December 31, 2021, and any subsequent filings. Many of these risks and uncertainties are beyond our control, and the unexpected occurrence or failure to occur of any such events or matter could significantly alter our actual results or our operations or financial condition. Cumulus Media Inc. assumes no responsibility to update any forward-looking statement as a result of new information, future events or otherwise. Non-GAAP Measures: In addition to U.S. GAAP financial measures, this presentation includes certain non-GAAP financial measures. These non-GAAP financial measures are in addition to, and not a substitute for or superior to, measures of financial performance prepared in accordance with U.S. GAAP and may differ from non-GAAP measures used by other companies in our industry. The Company considers these non-GAAP financial measures to be important because they provide useful measures of the operating performance of the Company, exclusive of unusual events, as well as factors that do not directly affect what we consider to be our core operating performance. Non-GAAP results are presented for supplemental informational purposes only for understanding the Company’s operating results and should not be considered in isolation or as a substitute for financial information presented in accordance with GAAP and may differ from similar measures presented by other companies. With respect to our forward-looking guidance, no reconciliation between a non-GAAP measure to the closest corresponding GAAP measure is included because we are unable to quantify certain amounts that would be required to be included in the GAAP measure without unreasonable efforts, and we believe such reconciliations would imply a degree of precision that would be confusing or misleading to investors. In particular, a reconciliation of forward-looking EBITDA to the closest corresponding GAAP measure is not available without unreasonable efforts on a forward-looking basis due to the high variability, complexity and low visibility with respect to the amounts required to reconcile such measure. The unavailable information could have a significant impact on the company's future financial results. All reconciliations of non-GAAP financial measures to the most directly comparable GAAP measure are set forth in the Appendix to this presentation. 2
Q1 2022 EARNINGS KEY HIGHLIGHTS CONTINUED SUCCESS OF AUDIO-FIRST STRATEGY REFLECTED IN FINANCIAL RESULTS POSITIVE OUTLOOK & STRONG BALANCE SHEET SUPPORT INITIATION OF CAPITAL RETURN PROGRAM +15% YoY Total Revenue Growth (5th straight quarter of improvement vs. comparable 2019 quarter) +18% YoY Digital Revenue Growth (with digital now representing 14% of revenue, up from 7% in 2019) +250% YoY EBITDA Growth (from $8.9 mm to $31.2 mm) $50M New Share Repurchase Program (to commence in near-term) $175-200M Reiterating 2022 EBITDA Guidance ($157 mm of LTM EBITDA as of 3/31/22) <3.5x Net Leverage Target (by end of 2022) $24M Cash from Operations (in addition to $69 mm in 2021 and $33 mm in 2020) ~900bps YoY EBITDA Margin Improvement 3.9x Net Leverage Ratio (down from 4.7x at 12/31/21, lowest in a decade and best among peers) 3
2020 2021 LTM Q1 2022 $815 $916 $947 STRATEGY EXECUTION & POST-PANDEMIC RECOVERY DRIVING STRONG FINANCIAL MOMENTUM TOTAL REVENUE ($ MM) $82 $135 $157 2020 2021 LTM Q1 2022 2022 Guidance EBITDA ($ MM) +16% Growth +19% (ex-political) +91% Growth +160% (ex-political) Margin 10.1% Margin 14.7% Margin 16.6% Range: $175-200 4
8.7x 4.7x 3.9x <3.5x $711 $629 $612 YE 2020 YE 2021 Q1 2022 YE 2022E CONTINUED FOCUS ON DE-LEVERAGING PROVIDING SIGNIFICANT CAPITAL ALLOCATION FLEXIBILITY Target Net Leverage Ratio Cash $272 $177 $181 NET DEBT AND NET LEVERAGE ($ MM) DELIVERY OF SUBSTANTIAL & ONGOING DE-LEVERAGING INITIATION OF PLAN TO RETURN CAPITAL TO SHAREHOLDERS SIGNIFICANT ADDITIONAL LIQUIDITY Achieved net debt reduction of more than $650 mm (>50% of outstanding amount) since June 2018 On track to achieve net leverage target of <3.5x by year end 2022 Announced $50 mm share buyback program Planning to initiate repurchases in the near-term Maintaining ability to execute accretive M&A to drive incremental growth 5
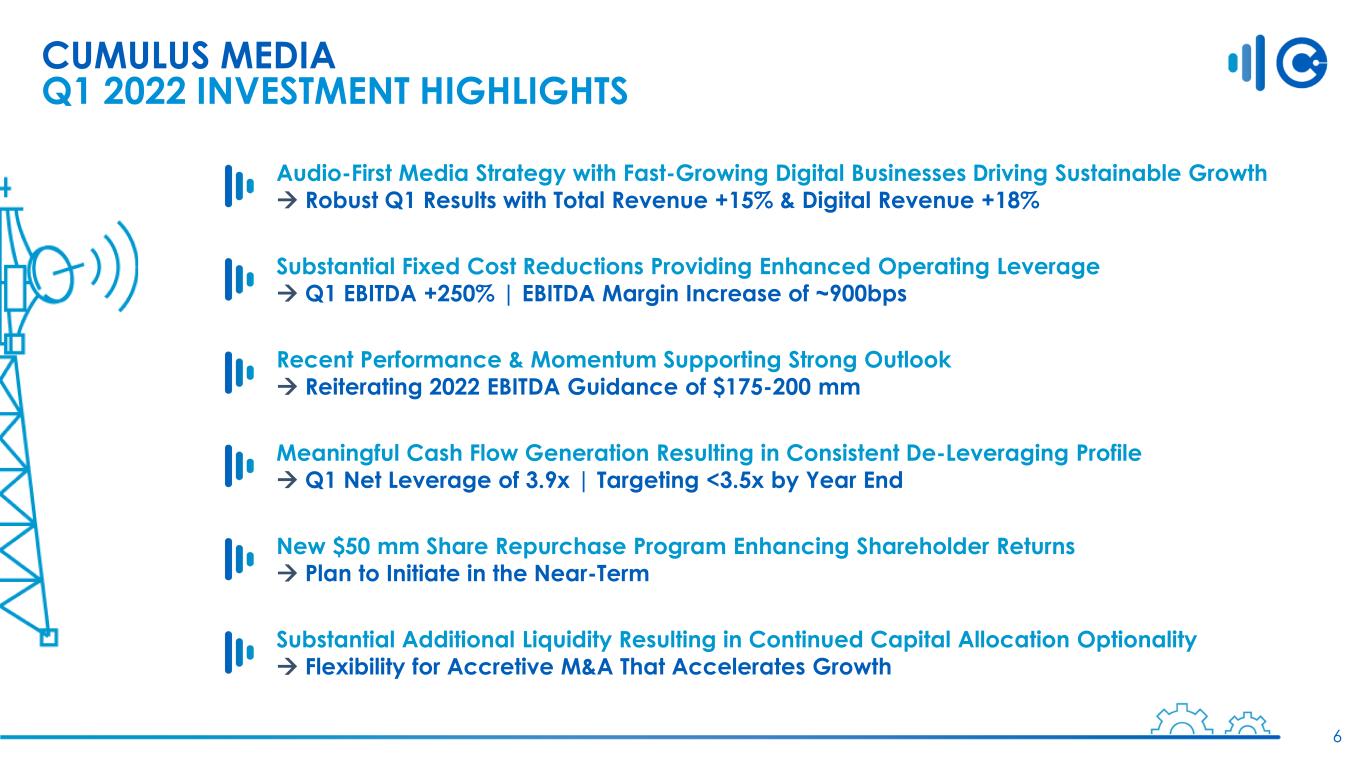
New $50 mm Share Repurchase Program Enhancing Shareholder Returns Plan to Initiate in the Near-Term Substantial Fixed Cost Reductions Providing Enhanced Operating Leverage Q1 EBITDA +250% | EBITDA Margin Increase of ~900bps Recent Performance & Momentum Supporting Strong Outlook Reiterating 2022 EBITDA Guidance of $175-200 mm Substantial Additional Liquidity Resulting in Continued Capital Allocation Optionality Flexibility for Accretive M&A That Accelerates Growth Audio-First Media Strategy with Fast-Growing Digital Businesses Driving Sustainable Growth Robust Q1 Results with Total Revenue +15% & Digital Revenue +18% Meaningful Cash Flow Generation Resulting in Consistent De-Leveraging Profile Q1 Net Leverage of 3.9x | Targeting <3.5x by Year End CUMULUS MEDIA Q1 2022 INVESTMENT HIGHLIGHTS 6

Appendix: Company Overview

AN AUDIO-FIRST MEDIA COMPANY and delivering highly efficient TRADITIONAL + DIGITAL advertising & marketing SOLUTIONS… connecting tens of thousands of BUSINESSES… Captivating LISTENERS with engaging, multi-platform audio content in every community in the U.S…. with 250+ million potential CUSTOMERS 8
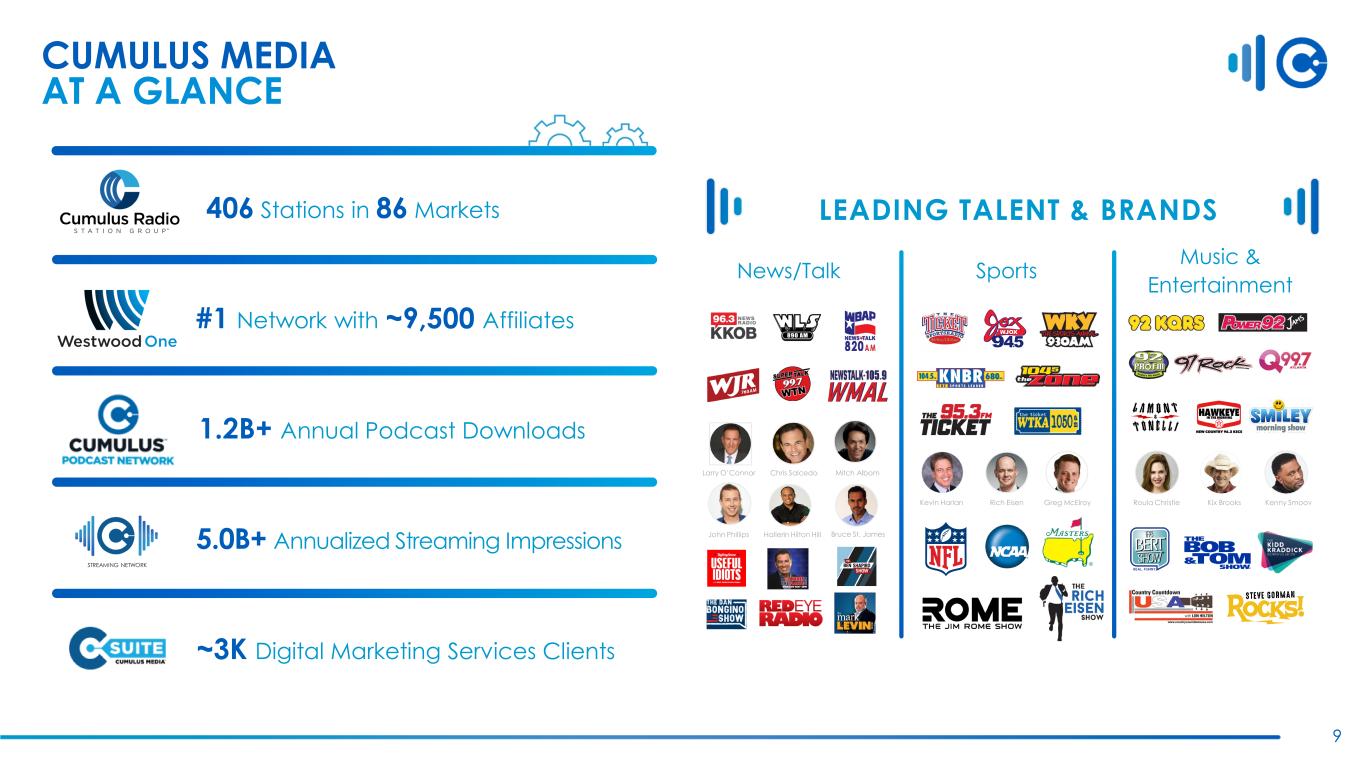
CUMULUS MEDIA AT A GLANCE 406 Stations in 86 Markets #1 Network with ~9,500 Affiliates 1.2B+ Annual Podcast Downloads 5.0B+ Annualized Streaming Impressions ~3K Digital Marketing Services Clients STREAMING NETWORK LEADING TALENT & BRANDS News/Talk Sports Music & Entertainment Kevin Harlan Larry O’Connor Chris Salcedo Mitch Albom John Phillips Hallerin Hilton Hill Bruce St. James Kix BrooksRoula Christie Kenny SmoovGreg McElroyRich Eisen 9

Appendix: Non-GAAP Reconciliations 10
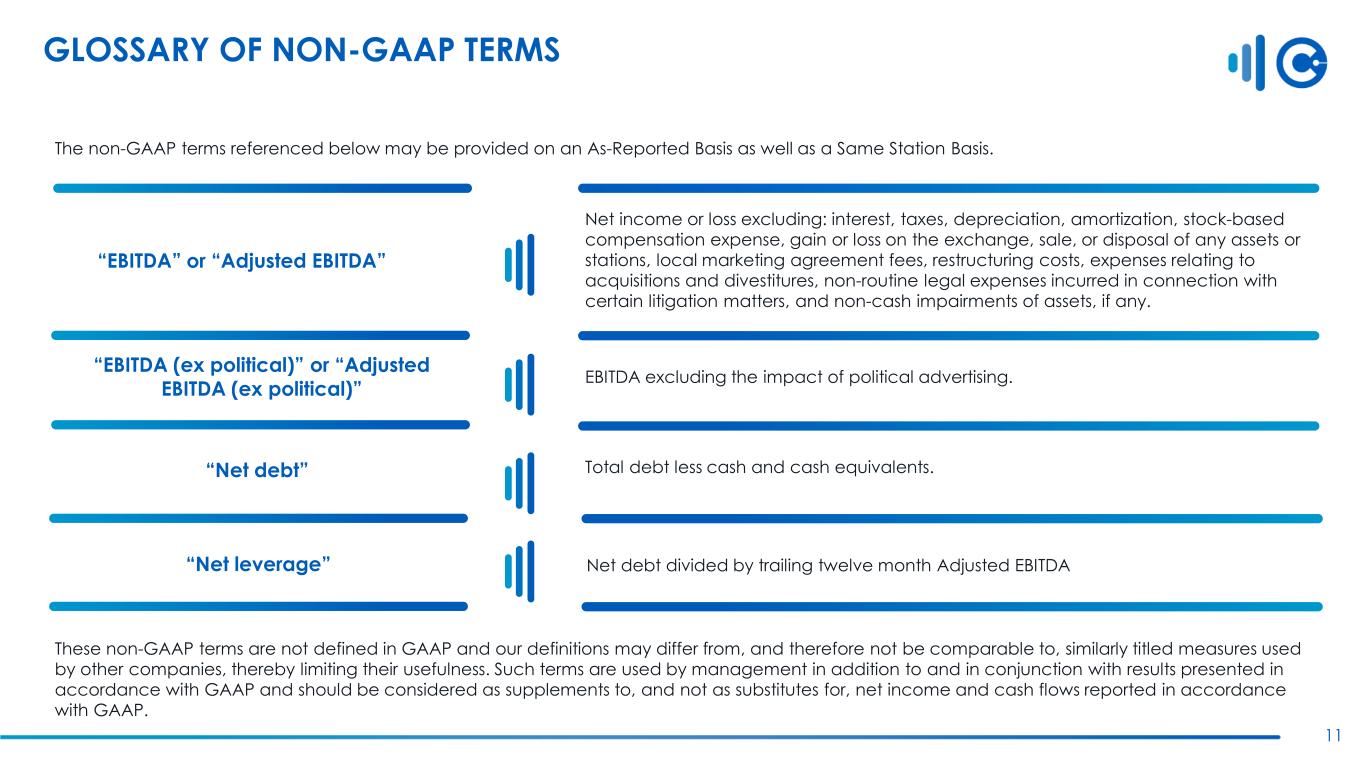
GLOSSARY OF NON-GAAP TERMS 11 The non-GAAP terms referenced below may be provided on an As-Reported Basis as well as a Same Station Basis. “EBITDA” or “Adjusted EBITDA” Net income or loss excluding: interest, taxes, depreciation, amortization, stock-based compensation expense, gain or loss on the exchange, sale, or disposal of any assets or stations, local marketing agreement fees, restructuring costs, expenses relating to acquisitions and divestitures, non-routine legal expenses incurred in connection with certain litigation matters, and non-cash impairments of assets, if any. “EBITDA (ex political)” or “Adjusted EBITDA (ex political)” EBITDA excluding the impact of political advertising. “Net debt” “Net leverage” These non-GAAP terms are not defined in GAAP and our definitions may differ from, and therefore not be comparable to, similarly titled measures used by other companies, thereby limiting their usefulness. Such terms are used by management in addition to and in conjunction with results presented in accordance with GAAP and should be considered as supplements to, and not as substitutes for, net income and cash flows reported in accordance with GAAP. Total debt less cash and cash equivalents. Net debt divided by trailing twelve month Adjusted EBITDA
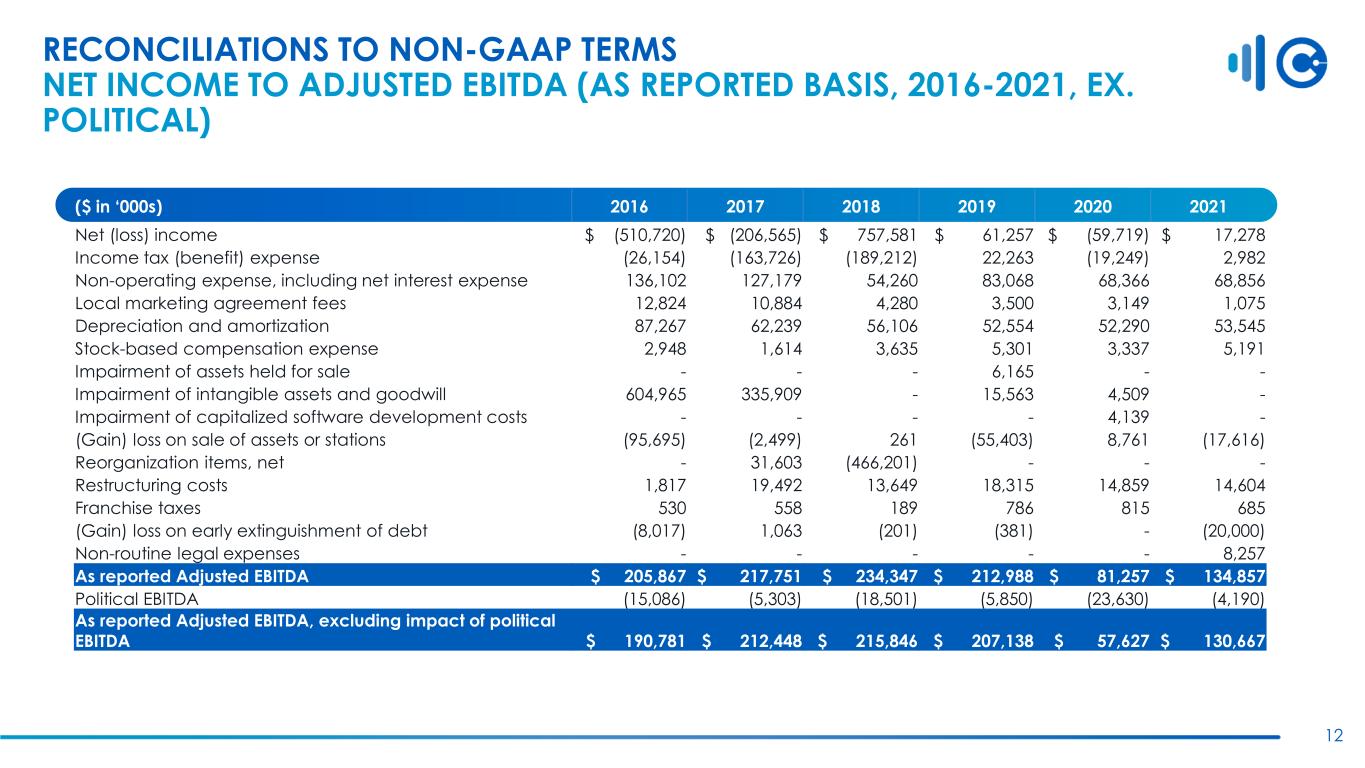
RECONCILIATIONS TO NON-GAAP TERMS NET INCOME TO ADJUSTED EBITDA (AS REPORTED BASIS, 2016-2021, EX. POLITICAL) 12 ($ in ‘000s) 2016 2017 2018 2019 2020 2021 Net (loss) income $ (510,720) $ (206,565) $ 757,581 $ 61,257 $ (59,719) $ 17,278 Income tax (benefit) expense (26,154) (163,726) (189,212) 22,263 (19,249) 2,982 Non-operating expense, including net interest expense 136,102 127,179 54,260 83,068 68,366 68,856 Local marketing agreement fees 12,824 10,884 4,280 3,500 3,149 1,075 Depreciation and amortization 87,267 62,239 56,106 52,554 52,290 53,545 Stock-based compensation expense 2,948 1,614 3,635 5,301 3,337 5,191 Impairment of assets held for sale - - - 6,165 - - Impairment of intangible assets and goodwill 604,965 335,909 - 15,563 4,509 - Impairment of capitalized software development costs - - - - 4,139 - (Gain) loss on sale of assets or stations (95,695) (2,499) 261 (55,403) 8,761 (17,616) Reorganization items, net - 31,603 (466,201) - - - Restructuring costs 1,817 19,492 13,649 18,315 14,859 14,604 Franchise taxes 530 558 189 786 815 685 (Gain) loss on early extinguishment of debt (8,017) 1,063 (201) (381) - (20,000) Non-routine legal expenses - - - - - 8,257 As reported Adjusted EBITDA $ 205,867 $ 217,751 $ 234,347 $ 212,988 $ 81,257 $ 134,857 Political EBITDA (15,086) (5,303) (18,501) (5,850) (23,630) (4,190) As reported Adjusted EBITDA, excluding impact of political EBITDA $ 190,781 $ 212,448 $ 215,846 $ 207,138 $ 57,627 $ 130,667
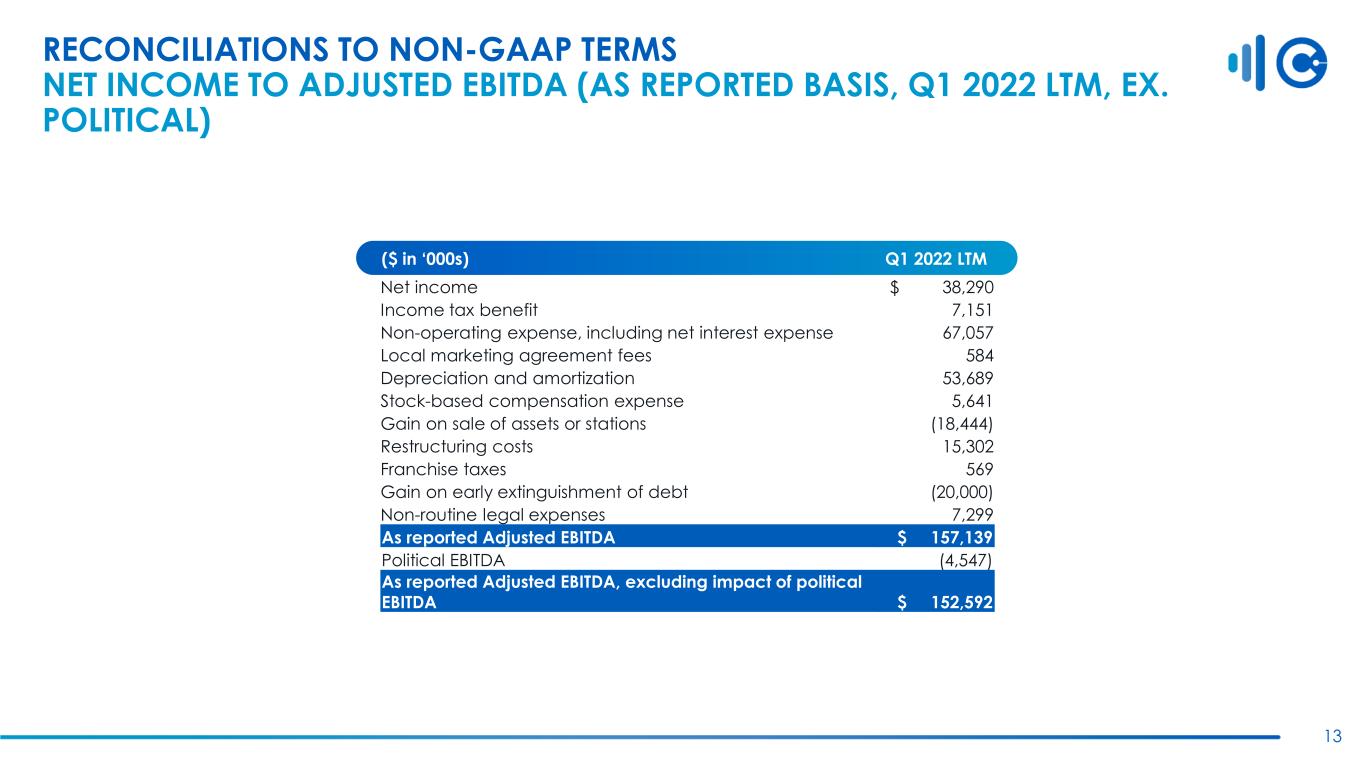
13 RECONCILIATIONS TO NON-GAAP TERMS NET INCOME TO ADJUSTED EBITDA (AS REPORTED BASIS, Q1 2022 LTM, EX. POLITICAL) ($ in ‘000s) Q1 2022 LTM Net income $ 38,290 Income tax benefit 7,151 Non-operating expense, including net interest expense 67,057 Local marketing agreement fees 584 Depreciation and amortization 53,689 Stock-based compensation expense 5,641 Gain on sale of assets or stations (18,444) Restructuring costs 15,302 Franchise taxes 569 Gain on early extinguishment of debt (20,000) Non-routine legal expenses 7,299 As reported Adjusted EBITDA $ 157,139 Political EBITDA (4,547) As reported Adjusted EBITDA, excluding impact of political EBITDA $ 152,592
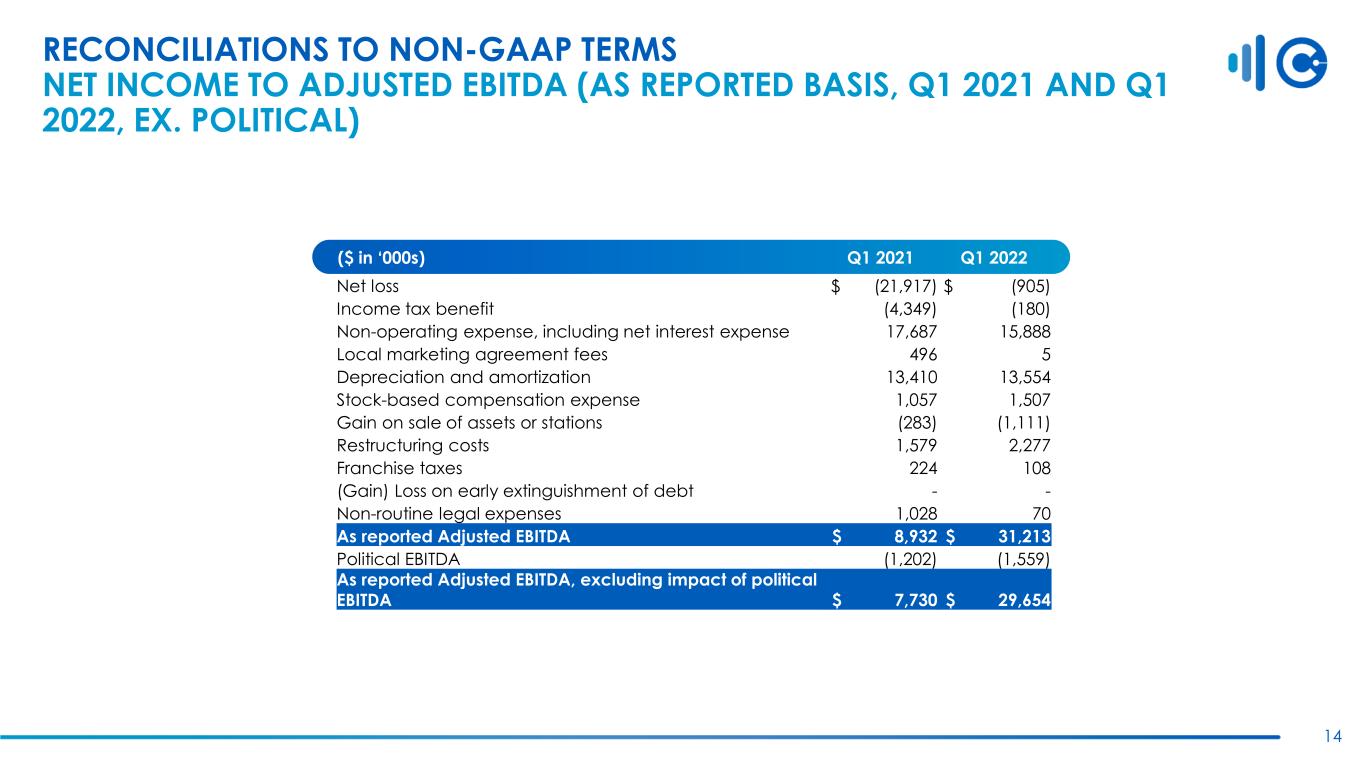
14 RECONCILIATIONS TO NON-GAAP TERMS NET INCOME TO ADJUSTED EBITDA (AS REPORTED BASIS, Q1 2021 AND Q1 2022, EX. POLITICAL) ($ in ‘000s) Q1 2021 Q1 2022 Net loss $ (21,917) $ (905) Income tax benefit (4,349) (180) Non-operating expense, including net interest expense 17,687 15,888 Local marketing agreement fees 496 5 Depreciation and amortization 13,410 13,554 Stock-based compensation expense 1,057 1,507 Gain on sale of assets or stations (283) (1,111) Restructuring costs 1,579 2,277 Franchise taxes 224 108 (Gain) Loss on early extinguishment of debt - - Non-routine legal expenses 1,028 70 As reported Adjusted EBITDA $ 8,932 $ 31,213 Political EBITDA (1,202) (1,559) As reported Adjusted EBITDA, excluding impact of political EBITDA $ 7,730 $ 29,654
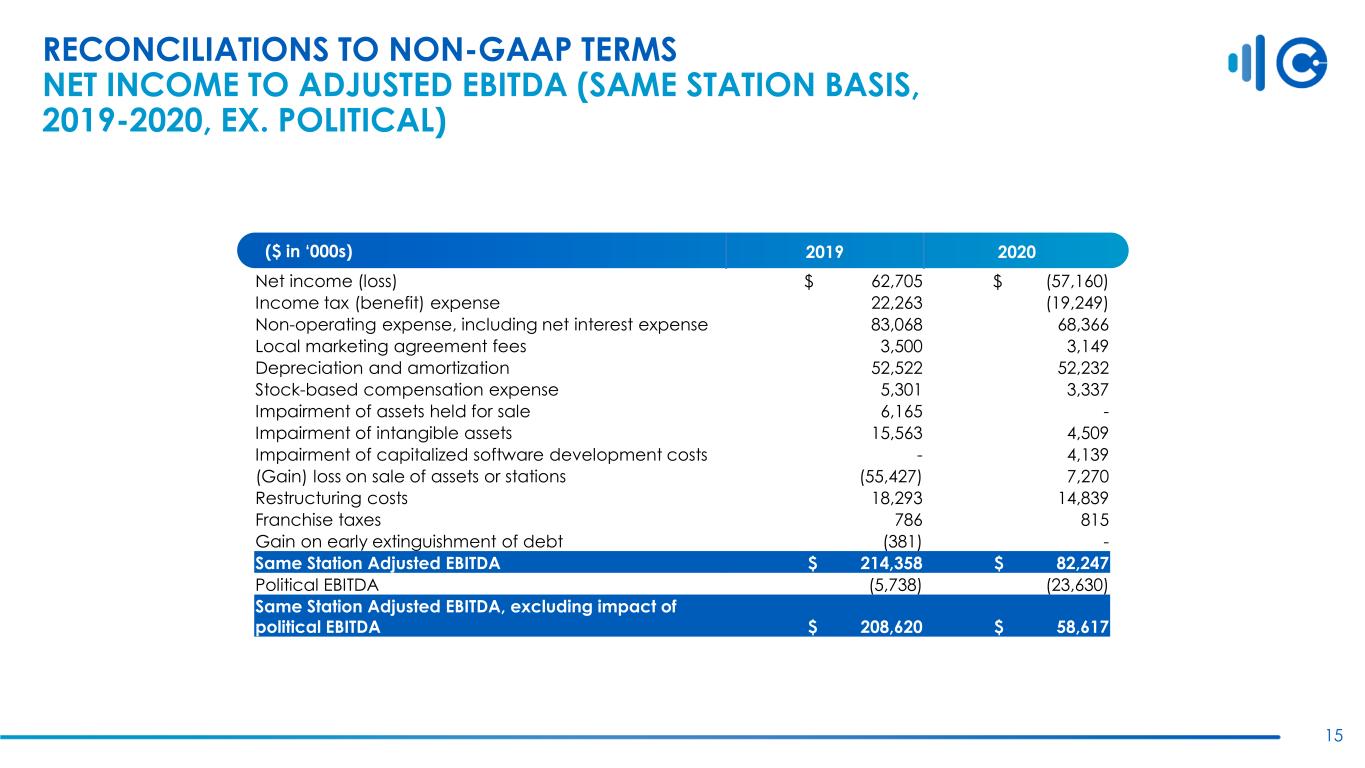
RECONCILIATIONS TO NON-GAAP TERMS NET INCOME TO ADJUSTED EBITDA (SAME STATION BASIS, 2019-2020, EX. POLITICAL) 15 2019 2020 Net income (loss) $ 62,705 $ (57,160) Income tax (benefit) expense 22,263 (19,249) Non-operating expense, including net interest expense 83,068 68,366 Local marketing agreement fees 3,500 3,149 Depreciation and amortization 52,522 52,232 Stock-based compensation expense 5,301 3,337 Impairment of assets held for sale 6,165 - Impairment of intangible assets 15,563 4,509 Impairment of capitalized software development costs - 4,139 (Gain) loss on sale of assets or stations (55,427) 7,270 Restructuring costs 18,293 14,839 Franchise taxes 786 815 Gain on early extinguishment of debt (381) - Same Station Adjusted EBITDA $ 214,358 $ 82,247 Political EBITDA (5,738) (23,630) Same Station Adjusted EBITDA, excluding impact of political EBITDA $ 208,620 $ 58,617 ($ in ‘000s)

16 RECONCILIATIONS TO NON-GAAP TERMS TOTAL DEBT TO NET DEBT ($ in '000s) Q2 2018 2018 2019 2020 Q2 2021 Q3 2021 Q4 2021 Q1 2022 Total debt 1,300,000$ 1,243,299$ 1,023,688$ 982,247$ 825,935$ 825,935$ 805,935$ 793,426$ Cash and cash equivalents 37,444 27,584 15,142 271,761 124,978 152,917 177,028 181,095 Net Debt 1,262,556$ 1,215,715$ 1,008,546$ 710,486$ 700,957$ 673,018$ 628,907$ 612,331$ LTM EBITDA 218,245 234,347 212,988 81,257 105,696 131,193 134,857 157,139 Net Leverage Ratio 5.8x 5.2x 4.7x 8.7x 6.6x 5.1x 4.7x 3.9x


